DOI: https://doi.org/10.1186/s41256-024-00393-8
PMID: https://pubmed.ncbi.nlm.nih.gov/39810282
تاريخ النشر: 2025-01-14
آثار شيخوخة السكان على جودة الحياة وعبء الأمراض: دراسة قائمة على السكان
الملخص
الخلفية مع intensification شيخوخة السكان، يصبح من المهم بشكل متزايد توضيح العلاقة السببية بين الشيخوخة والتغيرات في صحة السكان. لذلك، اقترحت دراستنا تطوير إطار عمل منهجي لتقييم شامل لتأثيرات صحة الشيخوخة السكانية. الطرق استخدمنا متوسط العمر المتوقع المعدل للصحة (HALE) لقياس جودة الحياة وسنوات الحياة المعدلة بالإعاقة (DALY) لت quantifying عبء المرض لسكان غوانغتشو. تم توليد توقعات HALE و DALY باستخدام كل من نماذج بايزيان العمر-الفترة-الجيل ونماذج توقع السكان. تم تحليل التغيرات في HALE و DALY بين 2010-2020 و 2020-2030 لفصل تأثيرات شيخوخة السكان. تم تحليل ثلاثة سيناريوهات لفحص العلاقة النسبية بين عبء المرض وشيخوخة السكان. في السيناريوهات 1 و 2، تم افتراض أن معدلات عبء المرض في 2030 ستبقى إما عند مستويات 2020 أو تتبع الاتجاهات التاريخية. في السيناريو 3، تم افتراض أن الأعداد المطلقة لسنوات الحياة المفقودة (YLL) وسنوات الحياة مع الإعاقة (YLD) في 2030 ستبقى دون تغيير عن مستويات 2020. النتائج بين 2010 و 2020، كان 56.24% [69.73%] من الزيادة في HALE للذكور [الإناث، القيم بين الأقواس] تعود إلى تأثيرات الوفيات في السكان الذين تبلغ أعمارهم 60 عامًا أو أكثر، بينما
تحليل النسبة، عبء المرض، التحلل التفاضلي، شيخوخة السكان، التنبؤ، جودة الحياة
الخلفية
إن نسبة التأثيرات الصحية الناتجة عن شيخوخة السكان أمر حاسم لمواجهة التحديات التي تطرحها هذه الظاهرة. مع تقدم السكان في العمر، تتغير أنماط انتشار الأمراض والإصابات بشكل كبير. وقد أظهرت الدراسات السابقة أن العقبات الرئيسية التي تعيق التصدي الفعال لهذا النمط من التغيرات في سياق شيخوخة السكان تشمل عدم توافق الأولويات الصحية العالمية وعدم استعداد أنظمة الصحة لتقديم الرعاية المناسبة للعمر.
الأمراض المزمنة [9]. لذلك، فإن الفهم الكامل والتنبؤ بهذه التغيرات يمكن أن يوفر دعمًا مهمًا في اتخاذ القرارات لصياغة السياسات العامة للاستجابة بنشاط لشيخوخة السكان. متوسط العمر المتوقع المعدل بالصحة (HALE) وسنوات الحياة المعدلة بالإعاقة (DALY) هما مؤشرين شاملين يستخدمان لقياس صحة السكان من خلال الأخذ في الاعتبار كل من الوفيات والمراضة. يقوم HALE بتعديل متوسط العمر المتوقع من خلال احتساب السنوات التي تُعاش مع الإعاقة الناتجة عن جميع الأمراض والإصابات، مما يوفر مقياسًا شاملًا لكل من جودة وطول الحياة [1]. في المقابل، يقوم DALY بت quantifying العدد الإجمالي لسنوات الحياة الصحية المفقودة بسبب المرض أو الإصابة، بما في ذلك سنوات الحياة المفقودة (YLL) وسنوات الحياة التي تُعاش مع الإعاقة (YLD)، مما يعكس العبء العام للمرض [10]. بينما يقيم كلا المؤشرين صحة السكان بشكل شامل، تختلف وجهات نظرهما. يركز HALE على النتائج الصحية الإيجابية، مع التركيز على مدة الحياة التي تُقضى في صحة كاملة. تشير قيم HALE الأعلى إلى صحة أفضل للسكان. من ناحية أخرى، يبرز DALY التأثيرات الصحية السلبية، حيث يقيس العبء الوبائي والاجتماعي والاقتصادي للمرض والإعاقة. تشير قيم DALY الأعلى إلى صحة أسوأ للسكان.
لذلك، يحتاج التقييم الشامل لتأثير الصحة الناتج عن شيخوخة السكان إلى دمج البعدين: جودة الحياة وعبء المرض. ومع ذلك، لا يزال يتعين تطوير استراتيجية فعالة لتحديد الأثر لتحليل تأثيرات شيخوخة السكان على الصحة. الغرض من هذه الدراسة هو تطوير إطار عمل لتحديد الأثر لتقييم شامل لتأثير الصحة الناتج عن شيخوخة السكان من منظور طيف الأمراض والإصابات، مع دمج البعدين: جودة الحياة وعبء المرض باستخدام بيانات من مقاطعة قوانغدونغ في الصين كدراسة حالة.
طرق
تصميم الدراسة
مصدر البيانات
وتوزيع معدل الهجرة حسب الفئة العمرية. تم الحصول على هذه البيانات من التعداد الوطني السابع للسكان،
قياس جودة الحياة وعبء المرض
لتوقع HALE و DALY في عام 2030، كانت هناك حاجة إلى مؤشرات وبائية (معدلات الوفيات، ومعدلات سنوات الحياة المفقودة، ومعدلات سنوات الحياة مع الإعاقة) وتوقعات سكانية. تم تقدير المؤشرات الوبائية لعام 2030 باستخدام نموذج بايزي للفترة العمرية-الولادة (BAPC)، بينما تم الحصول على توزيع السكان لعام 2030 من خلال نموذج توقع سكاني يعتمد على طريقة مكونات الفوج. يفحص نموذج BAPC التأثيرات الرئيسية لثلاثة عوامل – العمر، والفترة، وفوج الولادة – على الاتجاهات المتغيرة في المعدلات ويتوقع التغيرات المستقبلية. في دراستنا، استخدم نموذج BAPC نموذج مشي عشوائي من الدرجة الثانية، والذي يفترض أن تأثيرات الفترة تتطور تدريجياً مع مرور الوقت بدلاً من أن تكون مدفوعة بتأثيرات عشوائية. يقسم نموذج التوقع السكاني القائم على طريقة مكونات الفوج السكان إلى أفواج حسب العمر ويتوقع بشكل تكراري عدد الأفراد في كل فوج وفقًا لأنماط التغير الديموغرافي ودورة التوقع. أخذت هذه الدراسة في الاعتبار الاتجاه السياسي للصين، وسياق التنمية الحالي في غوانغتشو، ورؤى من دراسات سابقة لتحديد معلمات التغير السكاني، بما في ذلك ثلاثة سيناريوهات للتوقعات: تطوير سكاني مرتفع، ومتوسط، ومنخفض. توفر النصوص المرفقة عبر الإنترنت S3 و S4 تفاصيل منهجية حول توقعات المؤشرات الوبائية والسكان.
تحليل النسبة المئوية لتأثير شيخوخة السكان على جودة الحياة
تحليل النسبة المئوية لتأثير شيخوخة السكان على عبء المرض
تحليل السيناريو
تحليل عدم اليقين
النتائج
خصائص شيخوخة السكان من 2010 إلى 2030
تحليل التغيرات في متوسط العمر المتوقع المعدل حسب الصحة من 2010 إلى 2030
نُسبت إلى آثار الإعاقة. (الشكل 3 والشكل S2 في الملحق الإلكتروني).
تظهر الشكل 4 الآثار المحددة للسبب على الوفيات والإعاقة، والتي نتج عنها فقدان أكثر من 0.1 سنة من متوسط العمر الصحي بين السكان الذين تزيد أعمارهم عن 60 عامًا. بين عامي 2010 و2020، شملت آثار الوفيات لدى الذكور الأمراض التنفسية المزمنة (-3.44 سنة)، وإيذاء النفس والعنف بين الأشخاص (-0.18 سنة)، وأمراض الجلد والأنسجة تحت الجلد (-0.15 سنة)، والعدوى التنفسية والسل (-0.10 سنة). شملت آثار الإعاقة لدى الذكور الاضطرابات العضلية الهيكلية (-0.19 سنة)، والإصابات غير المتعمدة (-0.13 سنة)، ونقص التغذية (-0.11 سنة). شملت آثار الوفيات لدى الإناث الأمراض التنفسية المزمنة (-6.20 سنة)، والعدوى التنفسية والسل (-0.61 سنة)، وأمراض السكري والكلى (-0.24 سنة). شملت آثار الإعاقة لدى الإناث الإصابات غير المتعمدة (-0.25 سنة). من 2020 إلى 2030، تشمل آثار الإعاقة لدى الذكور الأمراض الجلدية والأنسجة تحت الجلد (-0.99 سنة)، والاضطرابات العضلية الهيكلية (-0.95 سنة). تشمل آثار الوفيات لدى الإناث نقص التغذية (-0.41 سنة)، وأمراض السكري والكلى (-0.27 سنة). تشمل آثار الإعاقة لدى الإناث نقص التغذية (-1.88 سنة)، والاضطرابات العضلية الهيكلية (-0.30 سنة)، والاضطرابات العصبية (-0.11 سنة). توفر الجداول S5A وS5B في الملحق الإلكتروني نتائج مفصلة حول تحليل متوسط العمر الصحي، بما في ذلك نسبة الآثار المحددة للسبب في التغير الكلي لمتوسط العمر الصحي.
تحليل التغيرات في سنوات الحياة المعدلة حسب الإعاقة من 2010 إلى 2030
تحليل السيناريو
(
تظهر الشكل 6 نتائج السيناريو 3. من المتوقع أن تكون معدلات سنوات الحياة المفقودة (YLL) وسنوات الحياة مع الإعاقة (YLD) للذكور في عام 2030
| 0.01 | -0.01 | 0.01 | -0.01 | 0.01 | 0.01 | -0.01 | 0.01 | فيروس نقص المناعة البشرية/الإيدز والعدوى المنقولة جنسياً | ٦ |
| -0.10 | 0.01 | -0.61 | 0.01 | 0.09 | 0.02 | 0.14 | 0.01 | العدوى التنفسية والسل | ٤ |
| 0.05 | -0.03 | 0.03 | -0.03 | -0.01 | -0.03 | -0.01 | 0.01 | العدوى المعوية | 2 |
| 0.01 | -0.02 | -0.01 | -0.03 | -0.01 | 0.02 | -0.01 | 0.05 | الأمراض المدارية المهملة والملاريا | 0 |
| 0.00 | -0.01 | 0.00 | -0.01 | -0.01 | 0.01 | -0.01 | 0.02 | اضطرابات الأمومة والوليد | |
| 0.70 | -0.11 | 1.61 | -0.03 | 0.01 | -0.01 | -0.41 | -1.88 | نقص التغذية | |
| -0.05 | 0.01 | 0.01 | 0.01 | 0.01 | 0.01 | -0.01 | 0.01 | أمراض معدية أخرى | |
| 1.09 | 0.01 | 0.37 | 0.01 | 0.17 | 0.08 | 0.33 | 0.04 | الأورام | |
| 1.63 | 0.02 | ٤.٤٥ | -0.07 | 1.06 | 0.30 | 2.09 | 0.58 | أمراض القلب والأوعية الدموية | |
| -3.44 | 0.08 | -6.20 | 0.18 | 0.11 | 0.20 | -0.04 | 0.08 | الأمراض التنفسية المزمنة | |
| 0.66 | -0.01 | 0.33 | -0.01 | 0.09 | 0.07 | 0.20 | 0.10 | أمراض الجهاز الهضمي | |
| 0.37 | -0.01 | 0.36 | -0.02 | -0.01 | 0.02 | -0.08 | -0.11 | اضطرابات عصبية | |
| 0.04 | 0.04 | -0.01 | 0.07 | -0.01 | 0.29 | 0.01 | 0.39 | الاضطرابات النفسية | |
| -0.03 | 0.02 | 0.00 | 0.00 | 0.01 | 0.01 | -0.01 | -0.01 | اضطرابات استخدام المواد | |
| 0.05 | 0.10 | -0.24 | 0.14 | 0.01 | 0.24 | -0.27 | 0.15 | مرض السكري وأمراض الكلى | |
| -0.15 | 0.11 | -0.01 | -0.02 | -0.01 | -0.99 | -0.01 | -0.09 | أمراض الجلد والأنسجة تحت الجلد | |
| -0.02 | -0.19 | -0.01 | -0.08 | -0.01 | -0.95 | -0.01 | -0.30 | اضطرابات الجهاز العضلي الهيكلي | |
| 0.06 | 0.01 | 0.19 | -0.05 | 0.04 | 0.38 | 0.05 | 0.84 | أمراض غير معدية أخرى | |
| 0.08 | 0.01 | -0.03 | -0.01 | 0.02 | 0.05 | 0.02 | 0.03 | إصابات النقل | |
| -0.18 | -0.01 | 0.01 | 0.01 | 0.01 | 0.01 | -0.01 | 0.01 | الإصابات غير المقصودة | |
| 0.92 | -0.13 | 1.29 | -0.25 | 0.07 | 0.15 | 0.04 | 0.23 | إيذاء النفس والعنف بين الأفراد | |
| آثار الوفيات للذكور، 2010 إلى 2020 | آثار الإعاقة على الذكور، من 2010 إلى 2020 | آثار الوفيات على الإناث، 2010 إلى 2020 | آثار الإعاقة على الإناث، من 2010 إلى 2020 | آثار الوفيات للذكور، من 2020 إلى 2030 | آثار الإعاقة على الذكور، من 2020 إلى 2030 | آثار الوفيات على الإناث، من 2020 إلى 2030 | آثار الإعاقة على الإناث، من 2020 إلى 2030 |
نقاش
تحليل شامل لتأثيرات الصحة الناتجة عن شيخوخة السكان من منظورين. إلى أفضل معرفتنا، هذه هي الدراسة الأولى التي تنسب وتنبئ بشكل كمي بالتغيرات في أنماط الأوبئة للأمراض والإصابات بسبب شيخوخة السكان. الإطار المقترح لدينا يعمل كتصميم رئيسي مهم لتوجيه الممارسة، مما يسمح بإجراء مقارنات لتأثيرات الصحة الناتجة عن شيخوخة السكان عبر فترات زمنية ومناطق مختلفة.
آثار شيخوخة السكان على جودة الحياة
| -170.20 | -3.90 | ١١٠.١٠ | 64.20 |
|
|
|||||
| ١٩٣٤.٣٠ | ١١٢٩.٧٠ | ٢٤٨٩.١٠ | ١٣٦٩.٨٠ | ٤٠٠٠٠ | ||||||
| 653.50 | ٥٥٤.٤٠ | ٢٠٥٨.٥٠ | ١٢٥١.٦٠ | ٣٠٠٠٠ | ||||||
| 434.70 | ٤٧٧٫٠٠ | 624.40 | ١٠٢٧.٠٠ | الأمراض المدارية المهملة والملاريا | ٢٠٠٠٠ | |||||
| ١٤٣٦.٥٠ | ١٩٨٤.٩٠ | -210.70 | -626.10 | اضطرابات الأمومة والوليد | 10000 | |||||
| 1553.90 | -94.80 | ٨٣٣٠.٧٠ | 57582.20 | نقص التغذية | ||||||
| ٢٦٩.٨٠ | ٢٠٠.٨٠ | 1.20 | ١١٣.٠٠ | أمراض معدية أخرى | ||||||
| 31430.30 | 14568.20 | 41833.80 | 26708.40 | الأورام | ||||||
| 38408.50 | ٢٧٩٨٤.٩٠ | 63532.60 | 64800.50 | أمراض القلب والأوعية الدموية | ||||||
| ١٥٩٣٨.٩٠ | 6126.70 | ٢٨٤٣٦.٣٠ | ١٤٦٨٩.٤٠ | أمراض الجهاز التنفسي المزمنة | ||||||
| ٣٨٥٨.٣٠ | ٢٧٤٨٫٧٠ | 5347.90 | ٥١٩٠.٧٠ | أمراض الجهاز الهضمي | ||||||
| -642.70 | -٣٢٣٧.٤٠ | ١٣٦٥.٢٠ | ٥٠٨٥.٢٠ | اضطرابات عصبية | ||||||
| ٣٤٢٧.٢٠ | ٣٧١١.٢٠ | ١٧٣٤٫٧٠ | ٢٩٥٣.٨٠ | الاضطرابات النفسية | ||||||
| -894.50 | -510.70 | -٥٠٢.٥٠ | ٥.٦٠ | اضطرابات استخدام المواد | ||||||
| ٥٩٣٧.٨٠ | ٤٤٨٢.٣٠ | 9433.80 | ١٣١٠٣.٠٠ | مرض السكري وأمراض الكلى | ||||||
| ٣١٥٥.٤٠ | ٤٨٩٧.٣٠ | ٣٣٦٢٨.٤٠ | ١٥٢٥٣.٧٠ | أمراض الجلد والأنسجة تحت الجلد | ||||||
| ٢٠٩٩.٢٠ | 9724.40 | 47634.70 | 41738.80 | اضطرابات الجهاز العضلي الهيكلي | ||||||
| 6202.70 | ٤٠٧٧.٣٠ | ٥٤٧١.٢٠ | ١٠١٧٠.١٠ | أمراض غير معدية أخرى | ||||||
| -2445.30 | 371.30 | ١١٤٥.٤٠ | 889.10 | إصابات النقل | ||||||
| -1480.00 | -819.50 | 297.20 | ٣٦٤.٧٠ | الإصابات غير المقصودة | ||||||
| ٣٤٢٥.٣٠ | ٣٢٠٣.٦٠ | 6701.90 | ١٠٤٨١.٥٠ | الضرر الذاتي والعنف بين الأفراد | ||||||
| الذكور، 2010 إلى 2020 | الإناث، 2010 إلى 2020 | الذكور، 2020 إلى 2030 | الإناث، 2020 إلى 2030 |
ومع ذلك، كانت وتيرة الانخفاض أبطأ من المستوى الوطني، مما يشير إلى أن الأسباب المستقبلية لصحة السكان في المناطق المتقدمة قد تتحول تدريجياً من الوفاة إلى الإعاقة.
تشير توقعات المستقبل لمؤشر الصحة الجيدة المتوقعة (HALE) إلى زيادة مستمرة في HALE لكلا الجنسين خلال الفترة من 2020 إلى 2030. خلال هذه الفترة، من المتوقع أن يصبح تقليل الوفيات المبكرة بين الأشخاص الذين تبلغ أعمارهم 85 عامًا وما فوق المساهم الرئيسي في تأثير الوفيات بين جميع الأعمار. ومع ذلك، فإن الانخفاض النسبي في الوفيات المبكرة بين الفئات العمرية الأخرى سيحد من تأثير الوفيات بين جميع الأعمار، مما يمنعها من تجاوز الاتجاهات التاريخية. قد يتماشى هذا الظاهرة مع العلاقة بين متوسط العمر المتوقع والوفيات، والتي تتبع منحنى لوجستي. مع تحسن متوسط العمر المتوقع، يتباطأ معدل الزيادة تدريجياً ويقترب في النهاية من الصفر، مستقرًا عند ثابت ثابت. استنادًا إلى هذه المبدأ، اقترح بعض الباحثين أن هناك حدًا فسيولوجيًا طبيعيًا للبشر في غياب عوامل الخطر الخارجية. ومع ذلك، يمكن تأخير أو حتى منع ظهور الأمراض المزمنة من خلال اعتماد خيارات نمط حياة صحية مثل تقليل استهلاك التبغ.
في التأثير العام سيزداد. ومن الجدير بالذكر أن مساهمة تحسين الإعاقة بين النساء المسنات في نمو متوسط العمر الصحي تتحول من سلبية إلى إيجابية، مما يشير إلى اتجاه مستقبلي لضغط الأمراض في المناطق المتقدمة، حيث من المحتمل أن تتحسن جودة الحياة للسكان الأكبر سناً.
آثار شيخوخة السكان على عبء المرض
تشير توقعات سنوات الحياة المعدلة بالإعاقة المستقبلية إلى أن الزيادة الصافية في سنوات الحياة المعدلة بالإعاقة لكلا الجنسين في الفترة من 2020 إلى 2030 ستتجاوز الاتجاهات التاريخية، مع استمرار تراكم إجمالي سنوات الحياة المعدلة بالإعاقة مع مرور الوقت. على عكس متوسط العمر الصحي (HALE)، فإن تراكم سنوات الحياة المعدلة بالإعاقة يتأثر بتغيرات السكان وشدة انتشار الأسباب المختلفة، مما يعني أنه لا يوجد حد أعلى لتراكم سنوات الحياة المعدلة بالإعاقة. وبالتالي، سيواجه نظام الرعاية الصحية عبئًا متزايدًا من الأمراض. بالإضافة إلى ذلك، ستتجاوز سنوات الحياة المعدلة بالإعاقة الناتجة عن تغيرات هيكل العمر ليس فقط آثار نمو السكان ولكن أيضًا جميع الأسباب الأخرى، مما يشير إلى أن تغير هيكل العمر قد انتقل من كونه محركًا ثانويًا إلى محرك رئيسي لتراكم سنوات الحياة المعدلة بالإعاقة.
ترجمة الأدلة إلى السياسات والممارسات الصحية
إنه مقياس لتوقعات الصحة يتم حسابه من خلال تطبيق شدة انتشار الأسباب في العالم الحقيقي، معبرًا عنها كنسبة مئوية من طيف الأمراض، على مجموعة افتراضية ضمن جدول الحياة. وبالتالي، يبرز متوسط العمر الصحي المنسوب أن تحسين صحة السكان المسنين يمكن أن يمدد بشكل فعال متوسط العمر الصحي. يفحص متوسط سنوات الحياة المعدلة بالإعاقة المنسوبة الفقدان التراكمي للصحة في السكان الحقيقيين، والذي يتراكم مع تحول هيكل العمر نحو ديموغرافيا أكبر سنًا. وبالتالي، يمثل متوسط سنوات الحياة المعدلة بالإعاقة المنسوبة عبء المرض الزائد الذي يجب إدارته والسيطرة عليه من قبل نظام الرعاية الصحية خلال هذه الفترة. يحدد متوسط العمر الصحي المنسوب شدة انتشار أسباب معينة وآثارها الصحية من منظور السكان المسنين، بينما يحدد متوسط سنوات الحياة المعدلة بالإعاقة المنسوبة آثار تغييرات هيكل العمر للسكان على عبء المرض من منظور التنمية المجتمعية.
تشير الأدلة التجريبية إلى أن الأسباب الخمسة الرئيسية لعبء المرض الناتج عن تغييرات هيكل العمر هي جميعها أمراض غير معدية (NCDs). من المتوقع أن يستمر هذا الاتجاه في المستقبل. تتطلب الوقاية الأولية من الأمراض غير المعدية تحسين معرفة الصحة السكانية وخلق بيئة تعزز الصحة [33، 34]. تعتمد فعالية الوقاية الأولية على استعداد السكان للمشاركة في التدابير الوقائية [35]. بالنسبة لكبار السن، فإن التدخلات والدعم الصحي غير المتصل بالإنترنت أكثر ملاءمة [36]. يمكن أن يحسن نمط الحياة المعزز للصحة أيضًا حالة الأفراد المسنين الذين يعانون من الأمراض غير المعدية ويؤخر ظهور المضاعفات [37]. يمثل إنشاء سجلات صحية وتقديم خدمات المتابعة الطبية من قبل مراكز الصحة المجتمعية تدخلات فعالة لتعزيز نمط الحياة الصحي [38]. بالإضافة إلى ذلك، من المتوقع أن يزداد عبء العديد من الأمراض المترابطة بشكل كبير، ويجب أخذ تزامن هذه الأمراض (تعدد الأمراض) مثل نقص التغذية واضطرابات الجهاز العضلي الهيكلي في الاعتبار [39]. يمكن أن تؤدي شيخوخة وتدهور الجهاز الهضمي إلى تقليل تناول أو استخدام العناصر الغذائية، مما يزيد من خطر اضطرابات الجهاز العضلي الهيكلي [40، 41]. يعد دمج النصائح الغذائية المستهدفة والدعم الغذائي في برنامج علاج الجهاز العضلي الهيكلي وسيلة فعالة لتقليل التعدد المرضي بين هذين المرضين [42]. عادة ما ينطوي التعدد المرضي على تركيبات مختلفة من عوامل الخطر أو الآليات المرضية الحيوية، والتي قد تغير الفوائد وفعالية التدخلات الصحية [43، 44]. إن إعادة هيكلة التدخلات للأشخاص المسنين الذين يعانون من التعدد المرضي بناءً على الأدلة أمر ضروري لضمان تكاملهم الكامل في ممارسات الشيخوخة النشطة [45].
القيود
الاستنتاجات
| HALE | متوسط العمر الصحي المعدل |
| DALY | سنوات الحياة المعدلة بالإعاقة |
| YLL | سنوات الحياة المفقودة |
| YLD | سنوات الحياة مع الإعاقة |
| GBD | دراسة العبء العالمي للأمراض |
| BAPC | نموذج بايزي لفترة العمر-الفترة-الجيل |
| UI | فترات عدم اليقين |
معلومات إضافية
الشكر والتقدير
مساهمات المؤلفين
التمويل
توفر البيانات والمواد
الإعلانات
موافقة الأخلاقيات والموافقة على المشاركة
الموافقة على النشر
المصالح المتنافسة
تفاصيل المؤلف
تم النشر عبر الإنترنت: 14 يناير 2025
References
- Wang H, Abbas KM, Abbasifard M, et al. Global age-sex-specific fertility, mortality, healthy life expectancy (HALE), and population estimates in 204 countries and territories, 1950-2019: a comprehensive demographic analysis for the Global Burden of Disease Study 2019. Lancet. 2020;396(10258):1160-203.
- World Health Organization. Ageing and health. Available: https:// www.who.int/zh/news-room/fact-sheets/detail/ageing-and-health. 2024/03/30
- Fang EF, Xie C, Schenkel JA, et al. A research agenda for ageing in China in the 21st century (2nd edition): Focusing on basic and translational research, long-term care, policy and social networks. Ageing Res Rev.; 64101174 (2020)
- United Nations. Department Of Economic And Social Affairs, Population Division. World Population Prospects 2022. Available: https://population. un.org/wpp/. 2024/03/30
- Mitra S, Brucker DL. Disability and aging: from successful aging to wellbeing through the capability and human development lens. Disabil Health J. 2020;13(4): 100924.
- Fong JH. Disability incidence and functional decline among older adults with major chronic diseases. BMC Geriatr. 2019;19(1):323.
- Zeng Y. Toward deeper research and better policy for healthy aging using the unique data of Chinese longitudinal healthy longevity survey. China Econ J. 2012;5(2-3):131-49.
- Araujo De Carvalho I, Epping-Jordan J, Pot AM, et al. Organizing integrated health-care services to meet older people’s needs. B World Health Organ. 2017;95(11):756-63.
- Prince MJ, Wu F, Guo Y, et al. The burden of disease in older people and implications for health policy and practice. Lancet. 2015;385(9967):549-62.
- Vos T, Lim SS, Abbafati C, et al. Global burden of 369 diseases and injuries in 204 countries and territories, 1990-2019: a systematic analysis for the Global Burden of Disease Study 2019. Lancet. 2020;396(10258):1204-22.
- Hui ECM, Li X, Chen T, Lang W. Deciphering the spatial structure of China’s megacity region: a new bay area-the Guangdong-Hong Kong-Macao greater bay area in the making. Cities. 2020;105:102168.
- Zhang L , Wu P, Niu M, et al. A systematic assessment of city-level climate change mitigation and air quality improvement in China. Sci Total Environ. 2022;839:156274.
- Xi JY, Chen YY, Zhang YQ, et al. Key social determinants to narrow the gap between health-adjusted life expectancy and life expectancy in megacities. Biomed Environ Sci. 2022;35(9):773-81.
- Zheng
, Liu , et al. Age-standardized mortality, disability-adjusted life-years and healthy life expectancy in different cultural regions of Guangdong, China: a population-based study of 2005-2015. BMC Public Health. 2020;20(1):858. - University Of Washington. Institute For Health Metrics And Evaluation. Global Burden of Disease Study 2019 (GBD 2019) Data Resources. Available: https://ghdx.healthdata.org/gbd-2019. 2024/03/30
- World Health Organization. WHO methods and data sources for global burden of disease estimates 2000-2019. Available: https://cdn.who.int/ media/docs/default-source/gho-documents/global-health-estimates/ ghe2019_daly-methods.pdf?sfvrsn=31b25009_7. 2024/03/30
- Riebler A, Held L. Projecting the future burden of cancer: Bayesian age-period-cohort analysis with integrated nested Laplace approximations. Biometrical J. 2017;59(3):531-49.
- Sevcikova H, Raftery AE. bayesPop: Probabilistic Population Projections. J Stat Softw. 2016. https://doi.org/10.18637/jss.v075.i05.
- Chen H, Chen G, Zheng X, Guo Y. Contribution of specific diseases and injuries to changes in health adjusted life expectancy in 187 countries from 1990 to 2013: retrospective observational study. Bmj-Brit Med J. 2019;364:1969.
- Cheng X, Tan L, Gao Y, Yang Y, Schwebel DC, Hu G. A new method to attribute differences in total deaths between groups to population size, age structure and age-specific mortality rate. PLoS ONE. 2019;14(5): e216613.
- Xi J, Zhang W, Chen Z, et al. Potential gains in health-adjusted life expectancy by reducing burden of noncommunicable diseases in 188 countries: a population-based study. VALUE HEALTH. 2023;26(6):802-9.
- Foreman KJ, Marquez N, Dolgert A, et al. Forecasting life expectancy, years of life lost, and all-cause and cause-specific mortality for 250 causes
of death: reference and alternative scenarios for 2016-40 for 195 countries and territories. Lancet. 2018;392(10159):2052-90. - Partridge L, Deelen J, Slagboom PE. Facing up to the global challenges of ageing. Nature. 2018;561(7721):45-56.
- Michel J, Sadana R. “Healthy aging” concepts and measures. J Am Med Dir Assoc. 2017;18(6):460-4.
- Defo BK. Beyond the ‘transition’ frameworks: the cross-continuum of health, disease and mortality framework. Glob Health Action. 2014;7(1):24804.
- Gao Y, Li J, Yuan X. Forecasting the Health Transition and Medical Expenditure of the Future Elderly in China: A Longitudinal Study Based on Markov Chain and Two Part Model. Front Public Health. 2022;9:774140.
- Santosa A, Wall S, Fottrell E, Högberg U, Byass P. The development and experience of epidemiological transition theory over four decades: a systematic review. Glob Health Action. 2014;7(1):23574.
- Geyer S, Eberhard S. Compression and expansion of morbidity. Dtsch Arztebl Int. 2022;119(47):810-5.
- Chang AY, Skirbekk VF, Tyrovolas S, Kassebaum NJ, Dieleman JL. Measuring population ageing: an analysis of the global burden of disease study 2017. Lancet Public Health. 2019;4(3):e159-67.
- Xi J, Lin X, Hao Y. Measurement and projection of the burden of disease attributable to population aging in 188 countries, 1990-2050: a popula-tion-based study. J Glob Health. 2022;12:4093.
- Olshansky SJ, Ault AB. The fourth stage of the epidemiologic transition: the age of delayed degenerative diseases. Milbank Q. 1986;64(3):355-91.
- Wenjuan Z , Min F . The health status of the Chinese elderly population and Its trends in 2010-2020: evidence from the population census and sampling data. Chin J Popul Sci. 2022;05:17-31.
- Osborne RH, Elmer S, Hawkins M, et al. Health literacy development is central to the prevention and control of non-communicable diseases. BMJ Glob Health. 2022;7(12): e10362.
- McKee M, Haines A, Ebrahim S, et al. Towards a comprehensive global approach to prevention and control of NCDs. Glob Health. 2014;10(1):74.
- Chen X, Giles J, Yao Y, et al. The path to healthy ageing in China: a peking university-lancet commission. Lancet. 2022;400(10367):1967-2006.
- Matthew-Maich N, Harris L, Ploeg J, et al. Designing, implementing, and evaluating mobile health technologies for managing chronic conditions in older adults: a scoping review. JMIR Mhealth Uhealth. 2016;4(2): e29.
- Wang J, Chen C, Zhou J, et al. Healthy lifestyle in late-life, longevity genes, and life expectancy among older adults: a 20-year, population-based, prospective cohort study. Lancet Healthy longev. 2023;4(10):e535-43.
- Wu Y, Zhang Z, Zhao N, et al. Primary health care in China: a decade of development after the 2009 health care reform. Health Care Sci. 2022;1(3):146-59.
- Skou ST, Mair FS, Fortin M, et al. Multimorbidity. Nat Rev Dis Primers. 2022;8(1):48.
- Cristina NM, Lucia D. Nutrition and healthy aging: prevention and treatment of gastrointestinal diseases. Nutrients. 2021;13(12):4337.
- Papadopoulou SK, Papadimitriou K, Voulgaridou G, et al. Exercise and nutrition impact on osteoporosis and sarcopenia-the incidence of osteosarcopenia: a narrative review. Nutrients. 2021;13(12):4499.
- Orsso CE, Montes Ibarra M, Findlay M, et al. Mapping ongoing nutrition intervention trials in muscle, sarcopenia, and cachexia: a scoping review of future research. J Cachex Sarcopenia Muscle. 2022;13(3):1442-59.
- Fabbri LM, Celli BR, Agustí A, et al. COPD and multimorbidity: recognising and addressing a syndemic occurrence. Lancet Respir Med. 2023;11(11):1020-34.
- Kivimäki M, Strandberg T, Pentti J, et al. Body-mass index and risk of obesity-related complex multimorbidity: an observational multicohort study. Lancet Diabetes Endocrinol. 2022;10(4):253-63.
- Weiss CO, Varadhan R, Puhan MA, et al. Multimorbidity and evidence generation. J Gen Intern Med. 2014;29(4):653-60.
- Beard JR, Officer A, de Carvalho IA, et al. The world report on ageing and health: a policy framework for healthy ageing. Lancet. 2016;387(10033):2145-54.
Jun-Yan Xi and Bo-Heng Liang contributed equally to this work.
*Correspondence:
Xiao Lin
linx87@mail.sysu.edu.cn
Jing Gu
gujing5@mail.sysu.edu.cn
Yuan-Tao Hao
haoyt@bjmu.edu.cn
Full list of author information is available at the end of the article- Additional file 1.
DOI: https://doi.org/10.1186/s41256-024-00393-8
PMID: https://pubmed.ncbi.nlm.nih.gov/39810282
Publication Date: 2025-01-14
Effects of population aging on quality of life and disease burden: a population-based study
Abstract
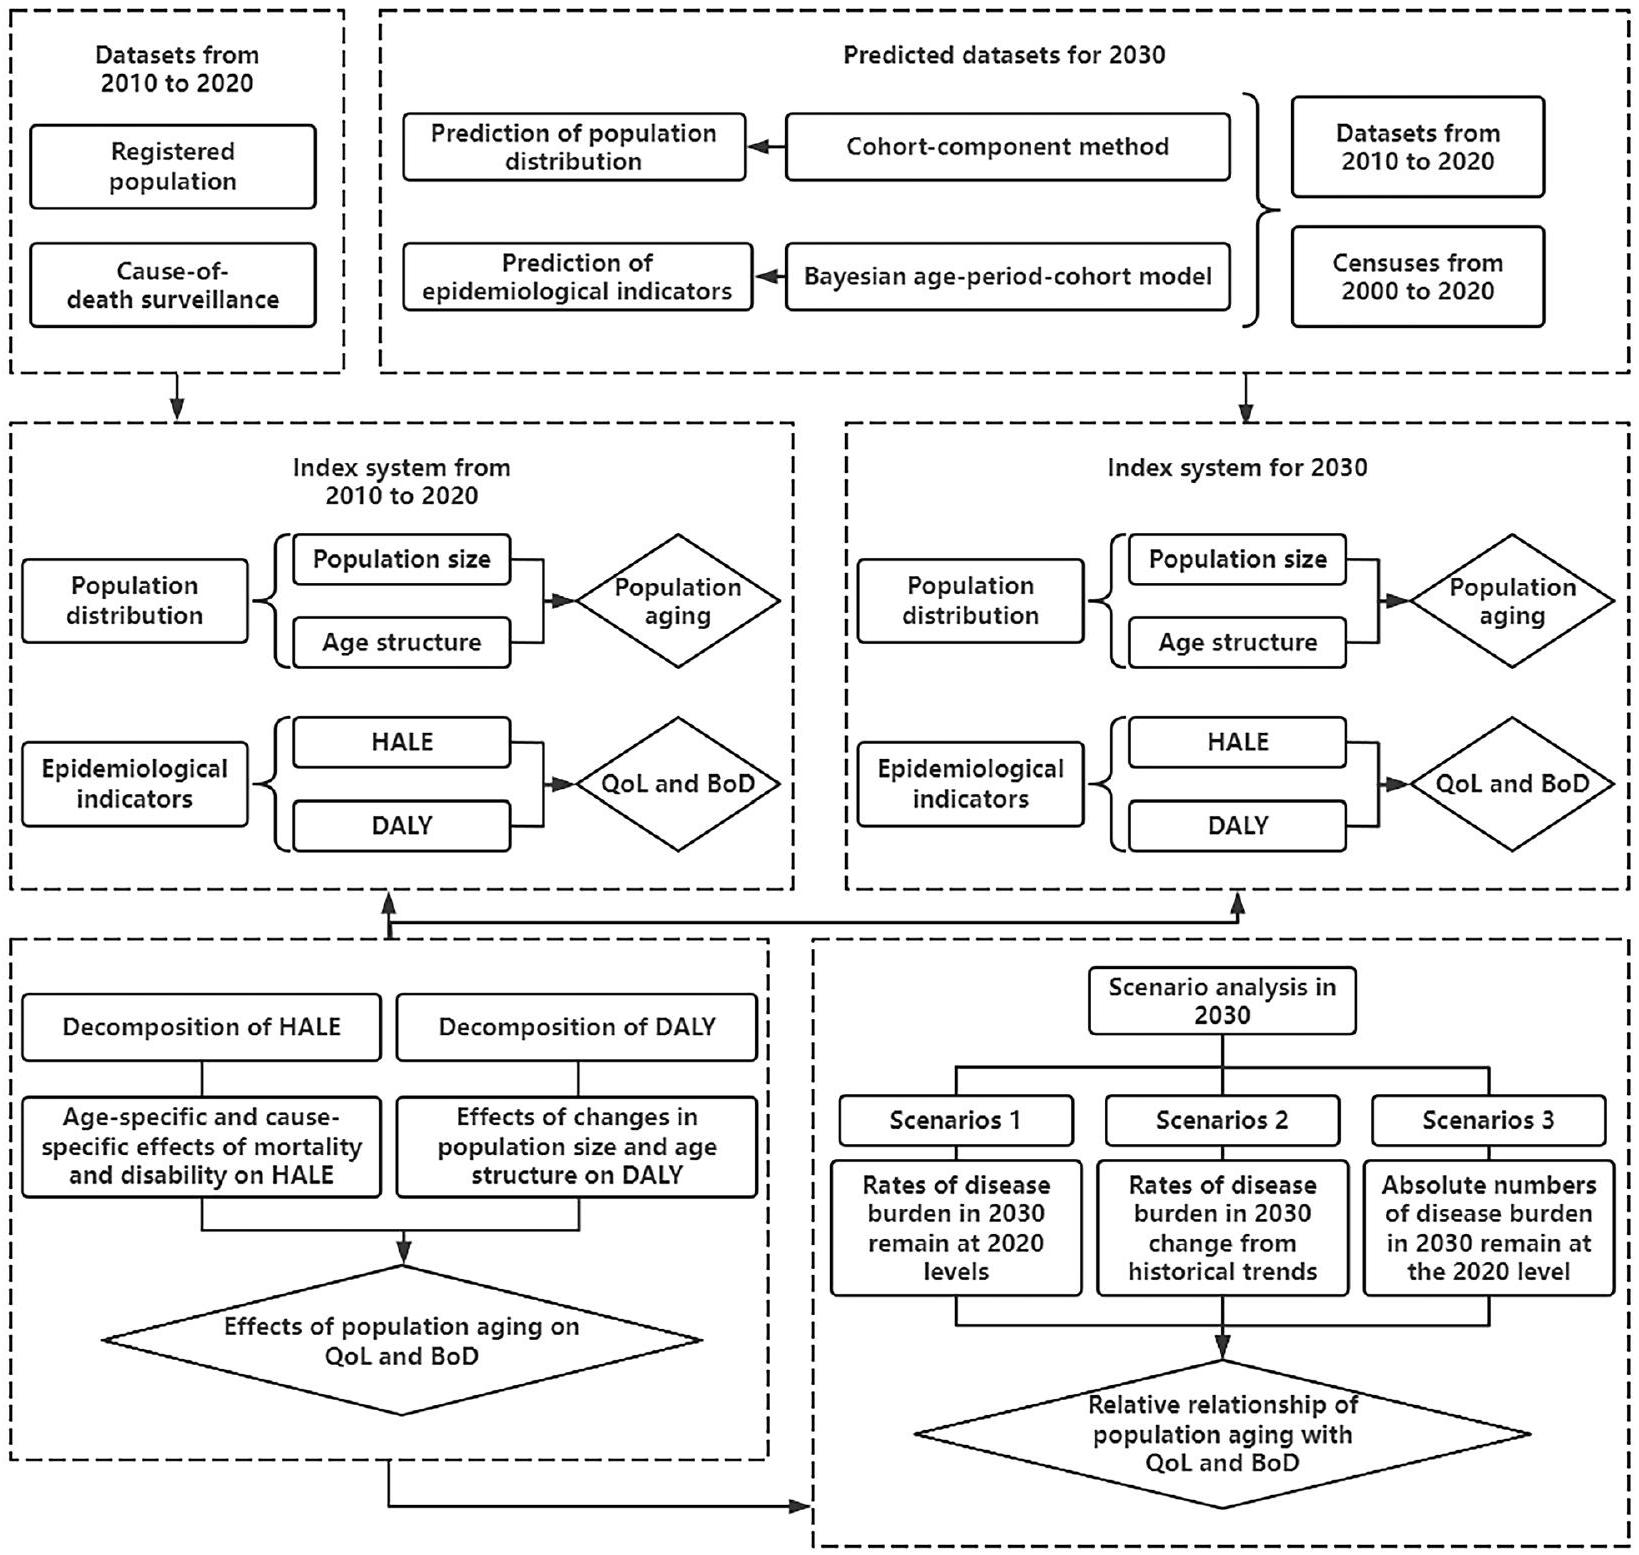
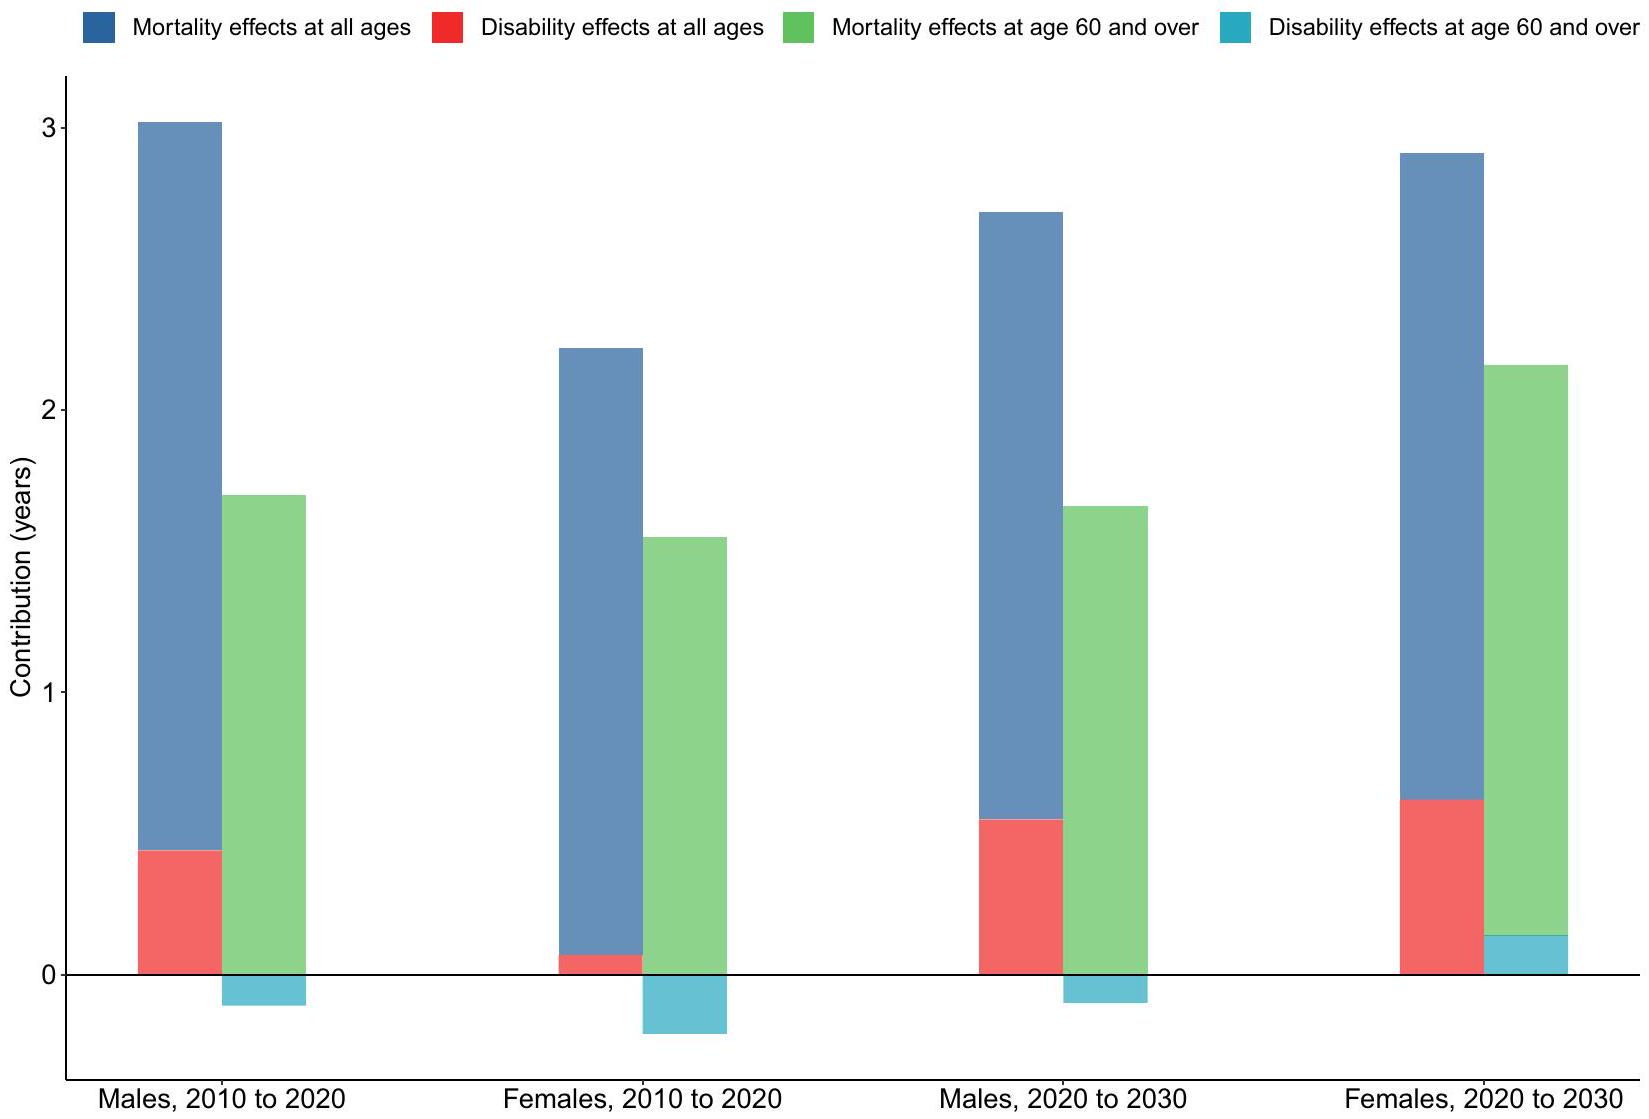
Background As population aging intensifies, it becomes increasingly important to elucidate the casual relationship between aging and changes in population health. Therefore, our study proposed to develop a systematic attribution framework to comprehensively evaluate the health impacts of population aging. Methods We used health-adjusted life expectancy (HALE) to measure quality of life and disability-adjusted life years (DALY) to quantify the burden of disease for the population of Guangzhou. The HALE and DALY projections were generated using both the Bayesian age-period-cohort models and the population prediction models. Changes in HALE and DALY between 2010-2020 and 2020-2030 were decomposed to isolate the effects of population aging. Three scenarios were analyzed to examine the relative relationship between disease burden and population aging. In Scenarios 1 and 2, the disease burden rates in 2030 were assumed to either remain at 2020 levels or follow historical trends. In Scenario 3, it was assumed that the absolute numbers of years of life lost (YLL) and years lived with disability (YLD) in 2030 would remain unchanged from the 2020 levels. Results Between 2010 and 2020, 56.24% [69.73%] of the increase in male [female, values in brackets] HALE was attributable to the mortality effects in the population aged 60 and over, while
Keywords Attribution analysis, Burden of disease, Differential decomposition, Population aging, Prediction, Quality of life
Background
Quantitatively attributing the health effects of population aging is crucial to addressing the challenges posed by an aging population. As populations age, the prevalence patterns of disease and injury shift significantly. Previous studies have demonstrated that the primary obstacles to effectively addressing this pattern of changes in the context of population aging, including misaligned global health priorities and the inadequate preparedeness of health systems to provide age-appropriate care for
chronic disease [9]. Therefore, fully understanding and predicting these changes can provide important decision support for formulating public policies to actively respond to population aging. Health-adjusted life expectancy (HALE) and Disability-adjusted life years (DALY) are both comprehensive indicators used to measure population health by considering both mortality and morbidity. HALE adjusts life expectancy by accounting for year lived with disability from all diseases and injuries, offering a holistic measure of both quality and length of life [1]. In contrast, DALY quantifies the total number of healthy life years lost due to disease or injury, including years of life lost (YLL) and years lived with disability (YLD), thereby reflecting the overall disease burden [10]. While both indicators assess population health comprehensively, their perspectives differ. HALE emphasizes positive health outcomes, focusing on the duration of life spent in full health. Higher HALE values indicate better population health. DALY, on the other hand, highlights negative health impacts, measuring the epidemiological and socio-economic burden of disease and disability. Higher DALY values signify poorer population health.
Therefore, a comprehensive assessment of the health impact of population aging needs to combine the two dimensions: quality of life and burden of disease. However, an effective attribution strategy for analyzing the health impacts of population aging remains to be developed. The purpose of this study is to develop an attribution framework for a comprehensive assessment of the health impact of population aging from the perspective of the disease and injury spectrum, combining the two dimensions: quality of life and burden of disease using data from Guangdong Province of China as a case study.
Methods
Study design
Data source
and the age-specific migration rate distribution. These data were sourced from the Seventh National Population Census, the
Quality of life and disease burden measurement
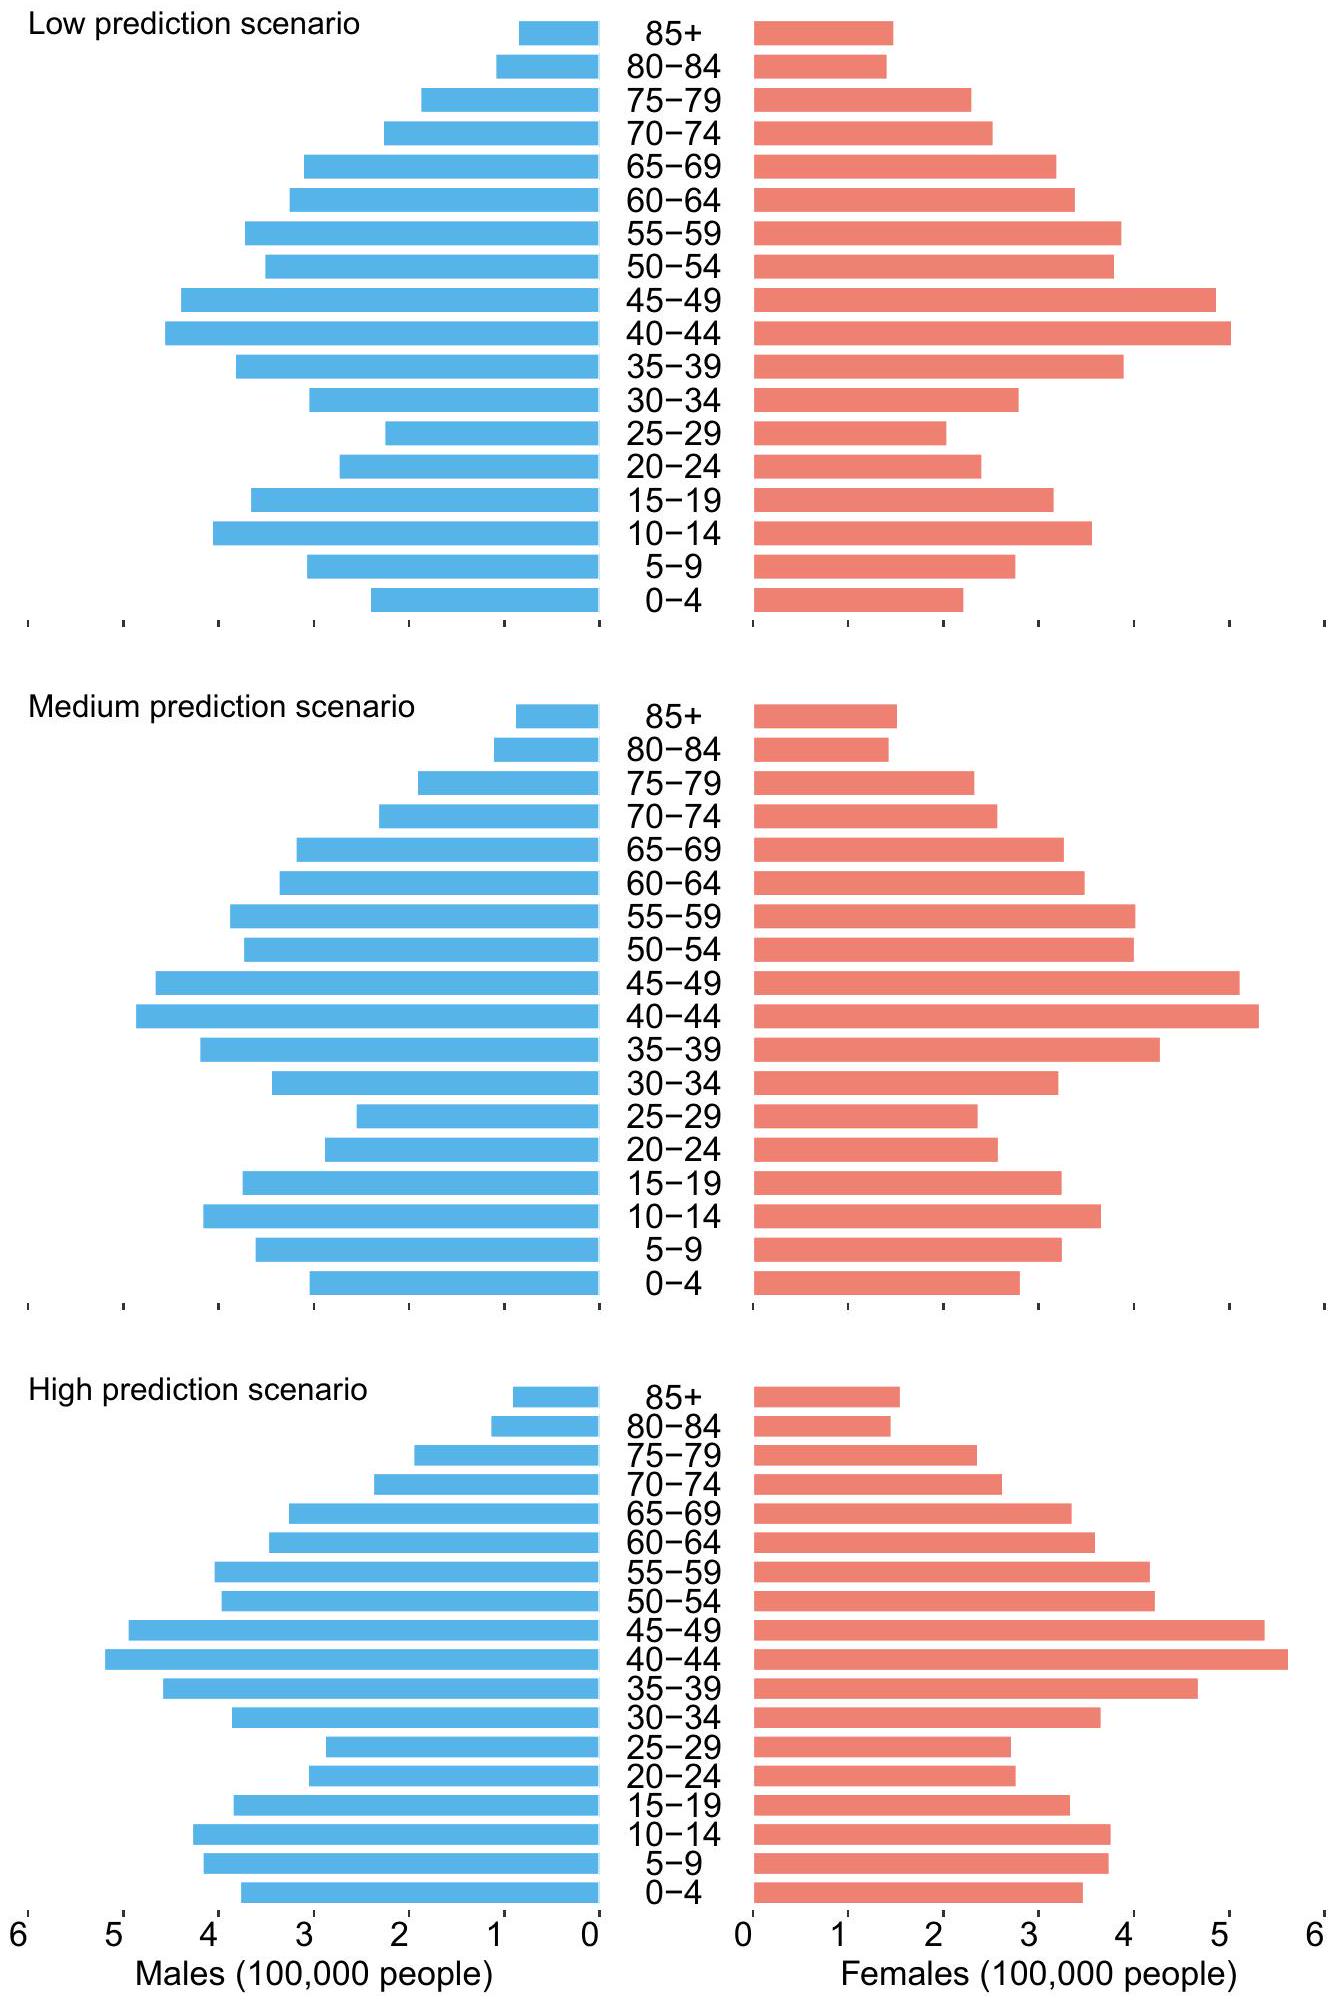
To predict HALE and DALY in 2030, epidemiological indicators (mortality, YLL rates, and YLD rates) and population projections were required. Epidemiological indicators for 2030 were estimated using the Bayesian age-period-cohort (BAPC) model, while population distribution for 2030 was obtained through a population prediction model based on the cohort-component method. The BAPC model examines the main effects of three factors-age, period, and birth cohort-on changing trends in rates and predicts future changes. In our study, the BAPC model used a second-order random walk prior, which assumes that period effects evolve gradually over time rather than being driven by random effects [17]. The population prediction model based on the cohort-component method divides the population into cohorts by age and iteratively forecasts the number of individuals in each cohort according to demographic change patterns and the forecast cycle [4, 18]. This study took into account the policy direction of China, the current development context of Guangzhou, and insights from previous studies to set the parameters of population change, including three projections scenarios: high, medium, and low population development. The online Appendix Texts S3 and S4 provide methodological details on the projections of epidemiological indicators and population.
Attribution analysis of the impact of population aging on quality of life
Attribution analysis of the impact of population aging on disease burden
Scenario analysis
Uncertainty analysis
Results
Characteristics of population aging from 2010 to 2030
Decomposition of changes in health-adjusted life expectancy from 2010 to 2030
attributed to the disability effects. (Fig. 3 and online Appendix Figure S2).
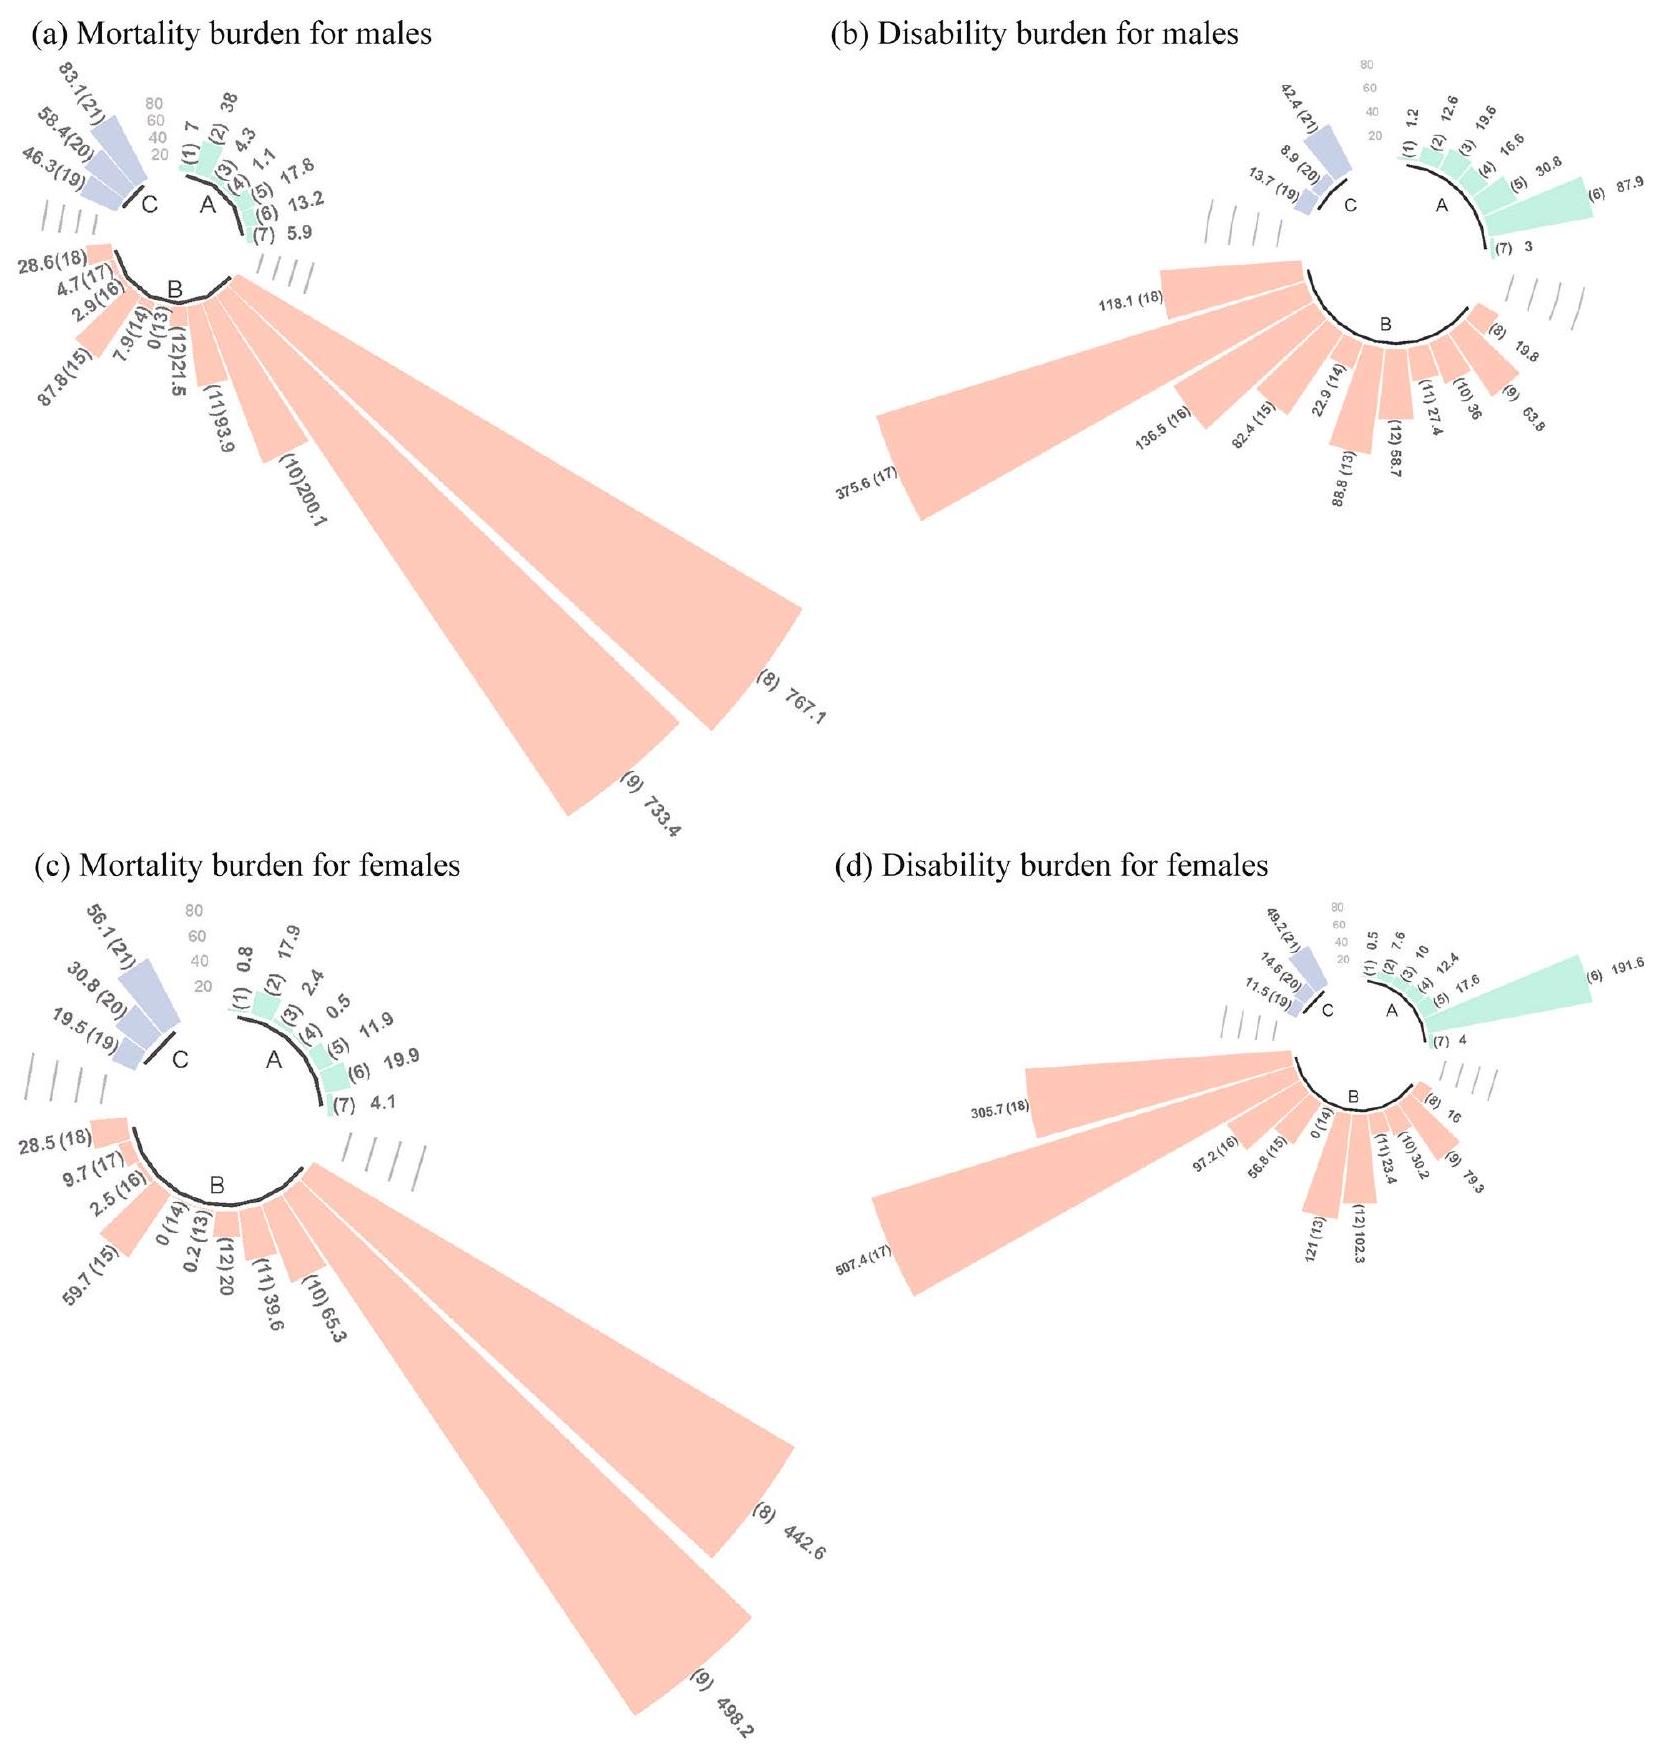
Figure 4 shows the cause-specific effects on mortality and disability, some of which resulted in a loss of more than 0.1 years of HALE among the population aged over 60 years. Between 2010 and 2020, the mortality effects for males included chronic respiratory diseases ( -3.44 years), self-harm and interpersonal violence ( -0.18 years), skin and subcutaneous diseases ( -0.15 years), and respiratory infections and tuberculosis ( -0.10 years). The disability effects for males included musculoskeletal disorders ( -0.19 years), unintentional injuries ( -0.13 years), and nutritional deficiencies ( -0.11 years). The mortality effects for females included chronic respiratory diseases ( -6.20 years), respiratory infections and tuberculosis ( -0.61 years), and diabetes and kidney diseases ( -0.24 years). The disability effects for females included unintentional injuries ( -0.25 years). From 2020 to 2030, the disability effects for males include skin and subcutaneous diseases ( -0.99 years), and musculoskeletal disorders ( -0.95 years). The mortality effects for females include nutritional deficiencies ( -0.41 years), and diabetes and kidney diseases ( -0.27 years). The disability effects for females include nutritional deficiencies ( -1.88 years), musculoskeletal disorders ( -0.30 years), and neurological disorders ( -0.11 years). The online Appendix Tables S5A and S5B provide detailed results on the decomposition of HALE, including the proportion of cause-specific effects in the total HALE change.
Decomposition of changes in disability-adjusted life years from 2010 to 2030
Scenario analysis
(
Figure 6 shows the results of Scenario 3. The expected male YLL and YLD rates in 2030 are projected to be
| 0.01 | -0.01 | 0.01 | -0.01 | 0.01 | 0.01 | -0.01 | 0.01 | HIV/AIDS and sexually transmitted infections | 6 |
| -0.10 | 0.01 | -0.61 | 0.01 | 0.09 | 0.02 | 0.14 | 0.01 | Respiratory infections and tuberculosis | 4 |
| 0.05 | -0.03 | 0.03 | -0.03 | -0.01 | -0.03 | -0.01 | 0.01 | Enteric infections | 2 |
| 0.01 | -0.02 | -0.01 | -0.03 | -0.01 | 0.02 | -0.01 | 0.05 | Neglected tropical diseases and malaria | 0 |
| 0.00 | -0.01 | 0.00 | -0.01 | -0.01 | 0.01 | -0.01 | 0.02 | Maternal and neonatal disorders | |
| 0.70 | -0.11 | 1.61 | -0.03 | 0.01 | -0.01 | -0.41 | -1.88 | Nutritional deficiencies | |
| -0.05 | 0.01 | 0.01 | 0.01 | 0.01 | 0.01 | -0.01 | 0.01 | Other infectious diseases | |
| 1.09 | 0.01 | 0.37 | 0.01 | 0.17 | 0.08 | 0.33 | 0.04 | Neoplasms | |
| 1.63 | 0.02 | 4.45 | -0.07 | 1.06 | 0.30 | 2.09 | 0.58 | Cardiovascular diseases | |
| -3.44 | 0.08 | -6.20 | 0.18 | 0.11 | 0.20 | -0.04 | 0.08 | Chronic respiratory diseases | |
| 0.66 | -0.01 | 0.33 | -0.01 | 0.09 | 0.07 | 0.20 | 0.10 | Digestive diseases | |
| 0.37 | -0.01 | 0.36 | -0.02 | -0.01 | 0.02 | -0.08 | -0.11 | Neurological disorders | |
| 0.04 | 0.04 | -0.01 | 0.07 | -0.01 | 0.29 | 0.01 | 0.39 | Mental disorders | |
| -0.03 | 0.02 | 0.00 | 0.00 | 0.01 | 0.01 | -0.01 | -0.01 | Substance use disorders | |
| 0.05 | 0.10 | -0.24 | 0.14 | 0.01 | 0.24 | -0.27 | 0.15 | Diabetes and kidney diseases | |
| -0.15 | 0.11 | -0.01 | -0.02 | -0.01 | -0.99 | -0.01 | -0.09 | Skin and subcutaneous diseases | |
| -0.02 | -0.19 | -0.01 | -0.08 | -0.01 | -0.95 | -0.01 | -0.30 | Musculoskeletal disorders | |
| 0.06 | 0.01 | 0.19 | -0.05 | 0.04 | 0.38 | 0.05 | 0.84 | Other non-communicable diseases | |
| 0.08 | 0.01 | -0.03 | -0.01 | 0.02 | 0.05 | 0.02 | 0.03 | Transport injuries | |
| -0.18 | -0.01 | 0.01 | 0.01 | 0.01 | 0.01 | -0.01 | 0.01 | Unintentional injuries | |
| 0.92 | -0.13 | 1.29 | -0.25 | 0.07 | 0.15 | 0.04 | 0.23 | Self-harm and interpersonal violence | |
| Mortality effects for males, 2010 to 2020 | Disability effects for males, 2010 to 2020 | Mortality effects for females, 2010 to 2020 | Disability effects for females, 2010 to 2020 | Mortality effects for males, 2020 to 2030 | Disability effects for males, 2020 to 2030 | Mortality effects for females, 2020 to 2030 | Disability effects for females, 2020 to 2030 |
Discussion
comprehensively analyze the health impacts of population aging from two perspectives. To the best of our knowledge, this is the first study to quantitatively attribute and predict shifts in epidemic patterns of disease and injury due to population aging. Our proposed framework serves as an important top-level design to guide practice, allowing comparisons of the health effects of population aging across different time periods and regions.
Impacts of population aging on quality of life
| -170.20 | -3.90 | 110.10 | 64.20 |
|
|
|||||
| 1934.30 | 1129.70 | 2489.10 | 1369.80 | 40000 | ||||||
| 653.50 | 554.40 | 2058.50 | 1251.60 | 30000 | ||||||
| 434.70 | 477.00 | 624.40 | 1027.00 | Neglected tropical diseases and malaria | 20000 | |||||
| 1436.50 | 1984.90 | -210.70 | -626.10 | Maternal and neonatal disorders | 10000 | |||||
| 1553.90 | -94.80 | 8330.70 | 57582.20 | Nutritional deficiencies | ||||||
| 269.80 | 200.80 | 1.20 | 113.00 | Other infectious diseases | ||||||
| 31430.30 | 14568.20 | 41833.80 | 26708.40 | Neoplasms | ||||||
| 38408.50 | 27984.90 | 63532.60 | 64800.50 | Cardiovascular diseases | ||||||
| 15938.90 | 6126.70 | 28436.30 | 14689.40 | Chronic respiratory diseases | ||||||
| 3858.30 | 2748.70 | 5347.90 | 5190.70 | Digestive diseases | ||||||
| -642.70 | -3237.40 | 1365.20 | 5085.20 | Neurological disorders | ||||||
| 3427.20 | 3711.20 | 1734.70 | 2953.80 | Mental disorders | ||||||
| -894.50 | -510.70 | -502.50 | 5.60 | Substance use disorders | ||||||
| 5937.80 | 4482.30 | 9433.80 | 13103.00 | Diabetes and kidney diseases | ||||||
| 3155.40 | 4897.30 | 33628.40 | 15253.70 | Skin and subcutaneous diseases | ||||||
| 2099.20 | 9724.40 | 47634.70 | 41738.80 | Musculoskeletal disorders | ||||||
| 6202.70 | 4077.30 | 5471.20 | 10170.10 | Other non-communicable diseases | ||||||
| -2445.30 | 371.30 | 1145.40 | 889.10 | Transport injuries | ||||||
| -1480.00 | -819.50 | 297.20 | 364.70 | Unintentional injuries | ||||||
| 3425.30 | 3203.60 | 6701.90 | 10481.50 | Self-harm and interpersonal violence | ||||||
| Males, 2010 to 2020 | Females, 2010 to 2020 | Males, 2020 to 2030 | Females, 2020 to 2030 |
study period. However, the rate of decline was also slower than the national level, suggesting that the future causes of population health in advanced regions may gradually shift from death to disability.
The projection of future HALE indicates a steady increase in HALE for both sexes over the period 2020 to 2030. During this period, the reduction in premature deaths among people aged 85 years and over is expected to become the main contributor to the all-age mortality effect. However, the relative reduction in premature deaths among other age groups will limit the all-age mortality effect, preventing it from exceeding historical trends. This phenomenon may align with the relationship between life expectancy and mortality, which follows a logistic curve. As life expectancy improves, the rate of increase gradually slows and eventually approaches zero, stablizing at a fixed constant. Based on this principle, some researchers have proposed that there is a natural physiological limit for human beings in the absence of external risk factors. However, the onset of chronic diseases can be delayed or even prevented by adopting health lifestyle choices such as reducing tobacco
in the overall effect will increase. Notably, the contribution of disability improvement among elderly women to the growth of HALE shifts from negative to positive, suggesting that a future trend of morbidity compression in advanced regions, where the quality of life for older populations is likely to improve.
Impacts of population aging on burden of disease
The projection of future DALY suggests that the net increase in DALY for both sexes in the period 20202030 will exceed the historical trends, with total DALY continuing to accumulate over time. Unlike HALE, the accumulation of DALY is influenced by both population changes and the prevalence intensity of different causes, meaning there is no upper limit to DALY accumulation. Consequently, the healthcare system will face an increasing burden of disease. In addition, the DALY attributable to age structure changes will surpass not only the effects of population growth but also all other causes, suggesting that age structure change has transitioned from being a secondary to a primary driver of DALY accumulation.
Translating evidence into health policy and practice
population. It is a health expectancy measure calculated by applying the real-world prevalence intensity of causes, expressed as a percentage of the disease spectrum, to a hypothetical cohort within the life table. The attributed HALE, therefore, highlights that improving the health of the older population can effectively extend the average healthy lifespan. The attributed DALY examines the cumulative loss of health in the real population, which accrues as the age structure shifts toward an older demographic. Attributive DALY, thus, represents the excess burden of disease that must be managed and controlled by the healthcare system during the period. The attributed HALE identifies the prevalence intensity of specific causes and their health effects from the perspective of the elderly population, while the attributed DALY identifies the impacts of changes in age structure of the population on the burden of disease from the perspective of societal development.
Empirical evidence indicates that the five leading causes of disease burden attributable to changes in age structure are all non-communicable diseases (NCDs). This trend is projected to persist in the future. The primary prevention of NCDs requires the improvement in population health literacy and the creation of a health-promoting environment [33, 34]. The efficacy of primary prevention is contingent upon the willingness of the population to engage in preventive measures [35]. For the elderly, offline intervention and health support tools are more suitable [36]. A health-promoting lifestyle can also improve the condition of elderly individuals with NCDs and delay the onset of complications [37]. The establishment of health records and the provision of medical follow-up services by community health centers represent effective healthpromoting lifestyle interventions [38]. In addition, the burden of several interrelated diseases is projected to increase substantially, and the co-occurrence of these diseases (multimorbidity), such as nutritional deficiencies and musculoskeletal disorders, must be taken into account [39]. Aging and degeneration of the digestive system can lead to reduced nutrient intake or utilization, which in turn increases the risk of musculoskeletal disorders [40, 41]. Integrating targeted dietary advice and nutritional support into the musculoskeletal treatment program is an effective way to reduce the comorbidity of these two diseases [42]. Multimorbidity usually involves different combinations of risk factors or pathobiological mechanisms, which may alter the benefits and effectiveness of health interventions [43, 44]. An evidence-based, fundamental restructuring of interventions for older people with multimorbidity is essential to ensure their full integration into active aging practices [45].
Limitations
Conclusions
| HALE | Health-adjusted life expectancy |
| DALY | Disability-adjusted life years |
| YLL | Years of life lost |
| YLD | Years lived with disability |
| GBD | Global Burden of Disease Study |
| BAPC | Bayesian age-period-cohort model |
| UI | Uncertainty intervals |
Supplementary Information
Acknowledgements
Author contributions
Funding
Availability of data and materials
Declarations
Ethics approval and consent to participate
Consent for publication
Competing interests
Author details
Published online: 14 January 2025
References
- Wang H, Abbas KM, Abbasifard M, et al. Global age-sex-specific fertility, mortality, healthy life expectancy (HALE), and population estimates in 204 countries and territories, 1950-2019: a comprehensive demographic analysis for the Global Burden of Disease Study 2019. Lancet. 2020;396(10258):1160-203.
- World Health Organization. Ageing and health. Available: https:// www.who.int/zh/news-room/fact-sheets/detail/ageing-and-health. 2024/03/30
- Fang EF, Xie C, Schenkel JA, et al. A research agenda for ageing in China in the 21st century (2nd edition): Focusing on basic and translational research, long-term care, policy and social networks. Ageing Res Rev.; 64101174 (2020)
- United Nations. Department Of Economic And Social Affairs, Population Division. World Population Prospects 2022. Available: https://population. un.org/wpp/. 2024/03/30
- Mitra S, Brucker DL. Disability and aging: from successful aging to wellbeing through the capability and human development lens. Disabil Health J. 2020;13(4): 100924.
- Fong JH. Disability incidence and functional decline among older adults with major chronic diseases. BMC Geriatr. 2019;19(1):323.
- Zeng Y. Toward deeper research and better policy for healthy aging using the unique data of Chinese longitudinal healthy longevity survey. China Econ J. 2012;5(2-3):131-49.
- Araujo De Carvalho I, Epping-Jordan J, Pot AM, et al. Organizing integrated health-care services to meet older people’s needs. B World Health Organ. 2017;95(11):756-63.
- Prince MJ, Wu F, Guo Y, et al. The burden of disease in older people and implications for health policy and practice. Lancet. 2015;385(9967):549-62.
- Vos T, Lim SS, Abbafati C, et al. Global burden of 369 diseases and injuries in 204 countries and territories, 1990-2019: a systematic analysis for the Global Burden of Disease Study 2019. Lancet. 2020;396(10258):1204-22.
- Hui ECM, Li X, Chen T, Lang W. Deciphering the spatial structure of China’s megacity region: a new bay area-the Guangdong-Hong Kong-Macao greater bay area in the making. Cities. 2020;105:102168.
- Zhang L , Wu P, Niu M, et al. A systematic assessment of city-level climate change mitigation and air quality improvement in China. Sci Total Environ. 2022;839:156274.
- Xi JY, Chen YY, Zhang YQ, et al. Key social determinants to narrow the gap between health-adjusted life expectancy and life expectancy in megacities. Biomed Environ Sci. 2022;35(9):773-81.
- Zheng
, Liu , et al. Age-standardized mortality, disability-adjusted life-years and healthy life expectancy in different cultural regions of Guangdong, China: a population-based study of 2005-2015. BMC Public Health. 2020;20(1):858. - University Of Washington. Institute For Health Metrics And Evaluation. Global Burden of Disease Study 2019 (GBD 2019) Data Resources. Available: https://ghdx.healthdata.org/gbd-2019. 2024/03/30
- World Health Organization. WHO methods and data sources for global burden of disease estimates 2000-2019. Available: https://cdn.who.int/ media/docs/default-source/gho-documents/global-health-estimates/ ghe2019_daly-methods.pdf?sfvrsn=31b25009_7. 2024/03/30
- Riebler A, Held L. Projecting the future burden of cancer: Bayesian age-period-cohort analysis with integrated nested Laplace approximations. Biometrical J. 2017;59(3):531-49.
- Sevcikova H, Raftery AE. bayesPop: Probabilistic Population Projections. J Stat Softw. 2016. https://doi.org/10.18637/jss.v075.i05.
- Chen H, Chen G, Zheng X, Guo Y. Contribution of specific diseases and injuries to changes in health adjusted life expectancy in 187 countries from 1990 to 2013: retrospective observational study. Bmj-Brit Med J. 2019;364:1969.
- Cheng X, Tan L, Gao Y, Yang Y, Schwebel DC, Hu G. A new method to attribute differences in total deaths between groups to population size, age structure and age-specific mortality rate. PLoS ONE. 2019;14(5): e216613.
- Xi J, Zhang W, Chen Z, et al. Potential gains in health-adjusted life expectancy by reducing burden of noncommunicable diseases in 188 countries: a population-based study. VALUE HEALTH. 2023;26(6):802-9.
- Foreman KJ, Marquez N, Dolgert A, et al. Forecasting life expectancy, years of life lost, and all-cause and cause-specific mortality for 250 causes
of death: reference and alternative scenarios for 2016-40 for 195 countries and territories. Lancet. 2018;392(10159):2052-90. - Partridge L, Deelen J, Slagboom PE. Facing up to the global challenges of ageing. Nature. 2018;561(7721):45-56.
- Michel J, Sadana R. “Healthy aging” concepts and measures. J Am Med Dir Assoc. 2017;18(6):460-4.
- Defo BK. Beyond the ‘transition’ frameworks: the cross-continuum of health, disease and mortality framework. Glob Health Action. 2014;7(1):24804.
- Gao Y, Li J, Yuan X. Forecasting the Health Transition and Medical Expenditure of the Future Elderly in China: A Longitudinal Study Based on Markov Chain and Two Part Model. Front Public Health. 2022;9:774140.
- Santosa A, Wall S, Fottrell E, Högberg U, Byass P. The development and experience of epidemiological transition theory over four decades: a systematic review. Glob Health Action. 2014;7(1):23574.
- Geyer S, Eberhard S. Compression and expansion of morbidity. Dtsch Arztebl Int. 2022;119(47):810-5.
- Chang AY, Skirbekk VF, Tyrovolas S, Kassebaum NJ, Dieleman JL. Measuring population ageing: an analysis of the global burden of disease study 2017. Lancet Public Health. 2019;4(3):e159-67.
- Xi J, Lin X, Hao Y. Measurement and projection of the burden of disease attributable to population aging in 188 countries, 1990-2050: a popula-tion-based study. J Glob Health. 2022;12:4093.
- Olshansky SJ, Ault AB. The fourth stage of the epidemiologic transition: the age of delayed degenerative diseases. Milbank Q. 1986;64(3):355-91.
- Wenjuan Z , Min F . The health status of the Chinese elderly population and Its trends in 2010-2020: evidence from the population census and sampling data. Chin J Popul Sci. 2022;05:17-31.
- Osborne RH, Elmer S, Hawkins M, et al. Health literacy development is central to the prevention and control of non-communicable diseases. BMJ Glob Health. 2022;7(12): e10362.
- McKee M, Haines A, Ebrahim S, et al. Towards a comprehensive global approach to prevention and control of NCDs. Glob Health. 2014;10(1):74.
- Chen X, Giles J, Yao Y, et al. The path to healthy ageing in China: a peking university-lancet commission. Lancet. 2022;400(10367):1967-2006.
- Matthew-Maich N, Harris L, Ploeg J, et al. Designing, implementing, and evaluating mobile health technologies for managing chronic conditions in older adults: a scoping review. JMIR Mhealth Uhealth. 2016;4(2): e29.
- Wang J, Chen C, Zhou J, et al. Healthy lifestyle in late-life, longevity genes, and life expectancy among older adults: a 20-year, population-based, prospective cohort study. Lancet Healthy longev. 2023;4(10):e535-43.
- Wu Y, Zhang Z, Zhao N, et al. Primary health care in China: a decade of development after the 2009 health care reform. Health Care Sci. 2022;1(3):146-59.
- Skou ST, Mair FS, Fortin M, et al. Multimorbidity. Nat Rev Dis Primers. 2022;8(1):48.
- Cristina NM, Lucia D. Nutrition and healthy aging: prevention and treatment of gastrointestinal diseases. Nutrients. 2021;13(12):4337.
- Papadopoulou SK, Papadimitriou K, Voulgaridou G, et al. Exercise and nutrition impact on osteoporosis and sarcopenia-the incidence of osteosarcopenia: a narrative review. Nutrients. 2021;13(12):4499.
- Orsso CE, Montes Ibarra M, Findlay M, et al. Mapping ongoing nutrition intervention trials in muscle, sarcopenia, and cachexia: a scoping review of future research. J Cachex Sarcopenia Muscle. 2022;13(3):1442-59.
- Fabbri LM, Celli BR, Agustí A, et al. COPD and multimorbidity: recognising and addressing a syndemic occurrence. Lancet Respir Med. 2023;11(11):1020-34.
- Kivimäki M, Strandberg T, Pentti J, et al. Body-mass index and risk of obesity-related complex multimorbidity: an observational multicohort study. Lancet Diabetes Endocrinol. 2022;10(4):253-63.
- Weiss CO, Varadhan R, Puhan MA, et al. Multimorbidity and evidence generation. J Gen Intern Med. 2014;29(4):653-60.
- Beard JR, Officer A, de Carvalho IA, et al. The world report on ageing and health: a policy framework for healthy ageing. Lancet. 2016;387(10033):2145-54.
Jun-Yan Xi and Bo-Heng Liang contributed equally to this work.
*Correspondence:
Xiao Lin
linx87@mail.sysu.edu.cn
Jing Gu
gujing5@mail.sysu.edu.cn
Yuan-Tao Hao
haoyt@bjmu.edu.cn
Full list of author information is available at the end of the article- Additional file 1.