DOI: https://doi.org/10.1038/s41598-025-98721-6
PMID: https://pubmed.ncbi.nlm.nih.gov/40274987
تاريخ النشر: 2025-04-24
افتح
آلية تعلم آلي محسّنة لنظام الرعاية الصحية للبيانات الضخمة للتنبؤ بعوامل خطر الأمراض
الملخص
أصبح مرض القلب شائعًا بشكل متزايد في المجتمع الحديث بسبب عوامل مثل التوتر، والنظم الغذائية غير الكافية، وما إلى ذلك. إن التعرف المبكر على عوامل خطر مرض القلب أمر ضروري لأنه يسمح بخطط علاج قد تقلل من خطر العواقب الوخيمة وتحسن نتائج المرضى. تم استخدام طرق تنبؤية لتقدير عامل الخطر، لكنها غالبًا ما تحتوي على عيوب مثل اختيار الميزات غير المناسب، والتكيف المفرط، وما إلى ذلك. للتغلب على ذلك، تم تقديم وتنفيذ نظام تنبؤ معتقدات الثعلب الأحمر العميق (DRFBPS) في برنامج بايثون. في البداية، تم جمع البيانات ومعالجتها مسبقًا لتحسين جودتها، وتم اختيار الميزات ذات الصلة باستخدام تحسين الثعلب الأحمر. تقوم الميزات المختارة بتحليل عوامل الخطر، ويقوم DRFBPS بإجراء التنبؤ. يتم التحقق من فعالية نموذج DRFBPS باستخدام الدقة، ودرجة F، والدقة، وAUC، والاسترجاع، ومعدل الخطأ. تظهر النتائج استخدام DRFBPS كأداة عملية في تحليلات الرعاية الصحية من خلال إظهار المعدل الذي ينتج به تنبؤات دقيقة وموثوقة. بالإضافة إلى ذلك، فإن تطبيقه في أنظمة الرعاية الصحية، بما في ذلك القرارات السريرية ومراقبة المرضى عن بُعد، يثبت قابليته للتطبيق في العالم الحقيقي في تعزيز التشخيص المبكر وتدابير الرعاية الوقائية. تثبت النتائج أن DRFBPS هو أداة محتملة في تحليلات الرعاية الصحية، حيث يوفر إطارًا قويًا لنمذجة التنبؤ في توقع خطر مرض القلب.
نظام الرعاية الصحية (HCS) هو أحد أكبر الأنظمة في الدول النامية، مع نمو سنوي في كل من التوظيف والدخل
- تم تقديم نظام تنبؤ معتقدات الثعلب الأحمر العميق (DRFBPS) كطريقة تنبؤية مع الميزات اللازمة للتنبؤ.
- تمت معالجة البيانات المجمعة مسبقًا لإزالة الضوضاء، وتم إجراء تحليل الميزات باستخدام تحسين الثعلب الأحمر لاختيار الميزات المطلوبة من البيانات الضخمة.
- باستخدام هذه الميزات المختارة، يقوم DRFBPS بتحليل وتنبؤ عوامل خطر مرض القلب.
- يتم تقييم فعالية النموذج باستخدام مقاييس تشمل الدقة، ودرجة F، والدقة، وAUC، والاسترجاع، ومعدل الخطأ، وقيمة p، وفترات الثقة.
- تحتوي هذه الورقة على الأعمال ذات الصلة الحديثة في الجزء الثاني، ويتم وصف مشكلة النموذج في الجزء الثالث، ويتم تطوير العقبات في الجزء الرابع، ويتم مناقشة دراسة الحالة والتحقق من الأداء للإطار المطور في الجزء الخامس. في الجزء السادس، يتم أخيرًا إنهاء العمل.
بعض من أحدث الدراسات في هذا المجال تشمل؛
قد درسوا معظم حالات COVID-19 التي كانت لديها أعراض تشبه أعراض الإنفلونزا، وفقًا للتحقيق الذي تم في إيران من مارس إلى أبريل 2020. شارك 319 شخصًا في البحث. كانت المؤشرات والأعراض الرئيسية هي العمر المتقدم، والحمى، والتعرق، وضيق التنفس، والارتباك، والضعف، وفقدان حاسة التذوق، والقشعريرة، وفقدان حاسة الشم، وفقدان الشهية، والإرهاق، والسعال الجاف. لم يكن هناك ارتباط ملحوظ بين COVID-19 والمتغيرات التالية: السعال المنتج للبلغم، والإكزيما، والتهاب الملتحمة، والسفر، والربو، والكورتيكوستيرويدات، وأمراض الكبد، وأمراض الروماتيزم، وألم الصدر. القيد هو أن فترة المتابعة القصيرة جدًا (شهرين) قد لا تكون قد التقطت التأثيرات طويلة الأمد للمرض على الوفاة.
نموذج تعزيز التدرج يتفوق على كل من نموذج الغابة العشوائية ونموذج بايز الساذج. ومع ذلك، فإنه يواجه مشاكل في التعقيد الحسابي.
فجوة البحث
نموذج النظام مع المشكلة
المنهجية المقترحة
عملية نظام إدارة تدفق البيانات المقترح
المعالجة المسبقة
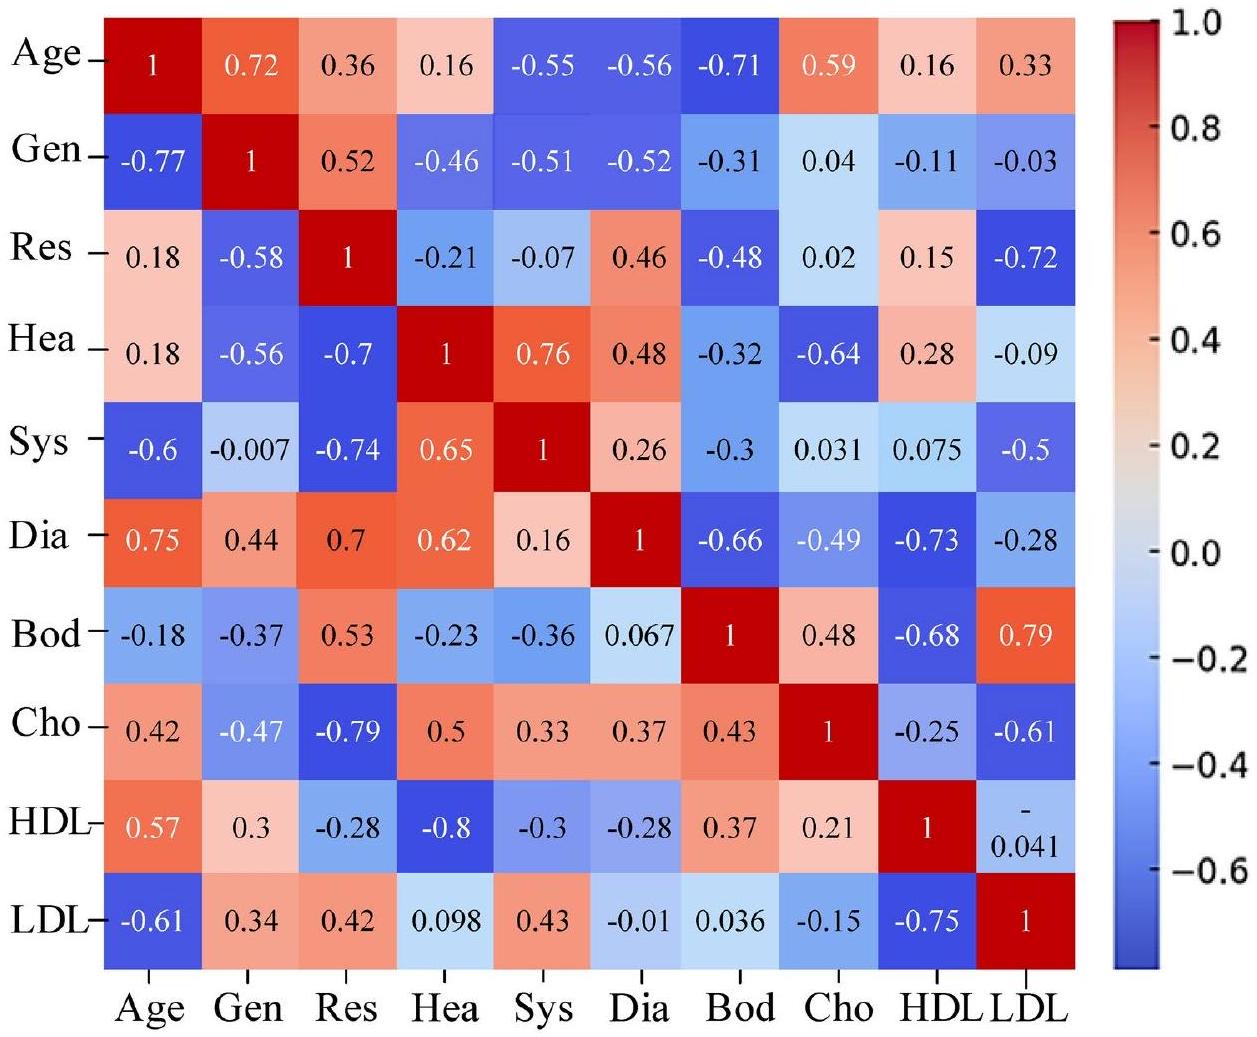
اختيار الميزات
ابدأ
$operatorname{int} T, H_{d}, n ;$
//dataset initialization
Preprocessing()
${$
    $operatorname{int} P, lambda, e ;$
    // Initializing the error removing variables
    $P rightarrow mid H_{d}$-error contents $mid$
    //error constraints are removed from the dataset
}

Feature selection()
${$
    $operatorname{int} F, t, alpha$, best
    // initializing the feature selecting variables
    $F rightarrow mid alpha($ features selected $) mid$
    // Required features are selected from the dataset
}
Prediction()
${$
    $operatorname{int} D, R, H, E$;
//Initializing the risk prediction elements
//يتم التنبؤ بعوامل خطر المرض
التصنيف ()
//تهيئة عناصر التصنيف
خطر مرتفع
خطر منخفض
توقف
التنبؤ
النتائج والمناقشة
| المقاييس | المواصفات |
| نظام التشغيل | ويندوز 10 |
| منصة البرنامج | بايثون |
| الإصدار | 3.7 .14 |
| الشبكة | شبكة عصبية عميقة |
| تحسين | الثعلب الأحمر |
| التدريب والاختبار |
|
| رقم س. | عوامل الخطر | الرموز والنطاق |
| 1 | العمر | (0) ذكر (1) أنثى |
| 2 | الجنس | (1) 15-35؛ (2) 36-55؛ (3) 56-75؛ (4) >76 |
| 3 | معدل التنفس | طبيعي (1): 12-18 نفس/دقيقة مرتفع (2): <12-18 نفس/دقيقة منخفض (3):
|
| 4 | معدل ضربات القلب | طبيعي (1): 60-100 نبضة/دقيقة مرتفع (2):
|
| 5 | ضغط الدم الانقباضي | طبيعي (1):
|
| 6 | ضغط الدم الانبساطي | طبيعي (1):
|
| 7 | درجة حرارة الجسم | منخفض (0):
|
| 8 | مستوى الكوليسترول الكلي | منخفض (0):
|
| 9 | كوليسترول HDL | منخفض (0):
|
| 10 | كوليسترول LDL | منخفض (0):
|
دراسة حالة
تحليل الأداء
الدقة
الدقة
| الطبقات | العملية | الخلايا العصبية | التفعيل |
| طبقة الإدخال | إدخال البيانات | 256 | – |
| طبقة مخفية RBM 1 | المعالجة المسبقة | 128 | سيغمويد |
| طبقة مخفية RBM 2 | اختيار الميزات | 64 | سيغمويد |
| طبقة مخفية RBM 3 | التنبؤ | 32 | Relu |
| طبقة الإخراج | التصنيف | 2 | Softmax |
الاسترجاع
معدل الخطأ
الجامعة الأمريكية في القاهرة
| دقة | دقة | استدعاء | درجة F | معدل الخطأ | الجامعة الأمريكية في القاهرة | قيمة P | فترة الثقة | |
| MLVC | 80.1 | 80.4 | 80.1 | ٨٠.١ | 0.199 | ٨٨.٤ | 0.058 | 81 |
| MLSC | 90.9 | 96.7 | 87.6 | 92.15 | 0.091 | ٩٦.١ | 0.023 | 89 |
| LGBC | ٧٧.٨٤ | ٧٤.٦١ | 73.26 | 73.93 | 0.2216 | 72.27 | 0.131 | 76 |
| EGBRF | 75.63 | 73.13 | 68.25 | 70.61 | 0.2437 | ٧٤.٧١ | 0.115 | 74 |
| CNNSA | ٨٣.٥٦ | 85.2 | 82.9 | 84.05 | 0.1644 | 90.3 | 0.011 | 82 |
| LSVM | ٨٦.٤٣ | 87.5 | ٨٥.٩ | ٨٦.٧ | 0.1357 | 92.1 | 0.026 | 85 |
| DRFBPS | 98.6 | 97.4 | 97.9 | 97.7 | 0.014 | 98.2 | 0.001 | 97 |
| دقة | دقة | استدعاء | درجة F | معدل الخطأ | الجامعة الأمريكية في القاهرة | قيمة P | فترة الثقة | |
| DBN+GA | 98.6 | 97.0 | 97.4 | 97.7 | 0.014 | 97.8 | 0.002 | 96.5 |
| DBN + PS | 95.3 | 95.9 | 96.2 | ٩٦.١ | 0.032 | 97.1 | 0.004 | 96 |
| DBN + BO | 94.3 | 92.8 | 93.1 | 92.9 | 0.057 | 95.4 | 0.005 | 93 |
| DBN + RFO مقترح | 98.6 | 97.4 | 97.9 | 97.7 | 0.014 | 98.2 | 0.001 | 97 |
نقاش
تم الحصول على بيانات البحث الحالي من كاجل، مما قد يعرض النموذج لتحيزات محتملة ويجعل التعميم تحديًا. تم استخدام RFO لمعالجة التحيزات في بيانات كاجل خلال عملية المعالجة الناجحة. كانت هذه الطريقة أداة للمعالجة المسبقة واختيار الميزات من خلال تصفية الضوضاء والاحتفاظ فقط بأكثر الميزات إفادة، مما يقلل من تأثير البيانات المبالغ فيها أو الممثلة تمثيلًا ناقصًا. تضمن دالة لياقة الثعلب الأحمر تضمين المتغيرات الأكثر تنبؤًا وفائدة، مما يقلل من الأبعاد ويعزز أداء النموذج. كما يضمن أن DRFBPS يقدم تنبؤات دقيقة وموثوقة في مجموعة واسعة من السكان المرضى، مما يعزز قابليته للتعميم وفائدته السريرية. يحدد هذا الإطار القوي بدقة الأفراد المعرضين لخطر الإصابة بأمراض القلب، مما قد يساعد في جهود التشخيص المبكر والتدخل. بالإضافة إلى ذلك، لإثبات قابلية التعميم، يتم التحقق من صحة النموذج المطور باستخدام مجموعة بيانات كليفلاند، وتعرض النتائج في الجدول 6.
- تثبت الدراسة أن DRFBPS يتفوق على توقع مخاطر مرض القلب من خلال التغلب على صعوبات اختيار الميزات غير المناسبة والتكيف الزائد.
- من خلال تطبيق تحسين الثعلب الأحمر، يختار النموذج الميزات القابلة للتطبيق بكفاءة، مما يحسن دقة التنبؤ.
- تم تقييم النموذج بشكل موسع باستخدام الدقة، ودرجة F، والدقة، ومنطقة تحت المنحنى، والاسترجاع، ومعدل الخطأ، وقيمة P، وفترات الثقة، مما يظهر أداءً متسقًا وأعلى من الأساليب الحالية.
- تؤكد النتائج أن DRFBPS يقدم توقعات دقيقة ومستقرة لمخاطر الأمراض مع تطبيقات محتملة في التشخيص المبكر، وتخطيط العلاج الشخصي، وتحسين نتائج المرضى في بيئات الرعاية الصحية العملية.
الخاتمة
| التدابير | مجموعة بيانات HARP | مجموعة بيانات كليفلاند |
| الدقة (%) | 98.6 | 98.2 |
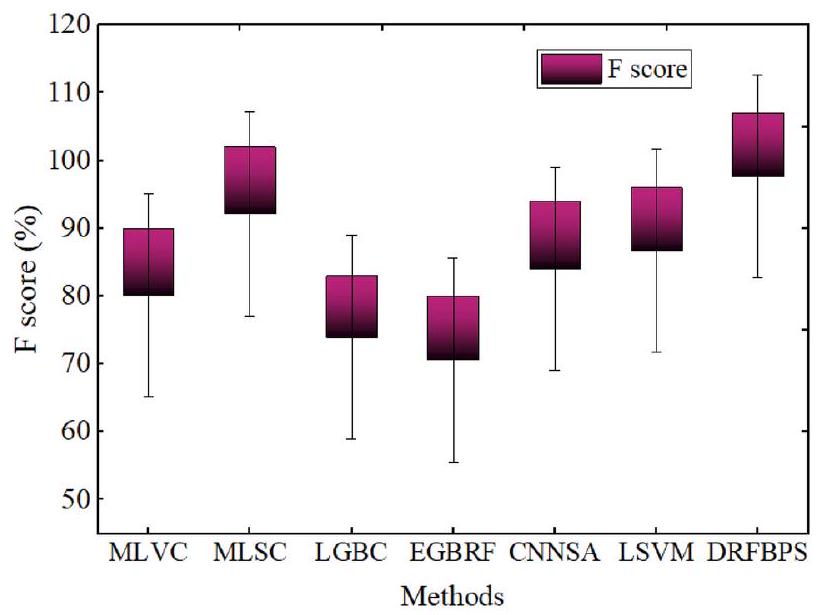
| درجة F (%) | 97.7 | 97.3 |
| الدقة (%) | 97.4% | 97 |
| AUC (%) | 98.2 | 97.8 |
| استرجاع (%) | 97.9 | 97.5 |
| معدل الخطأ | 0.014 | 0.017 |
| قيمة P | 0.001 | 0.003 |
| فترة الثقة | 97 | 95 |
توفر البيانات
تم النشر عبر الإنترنت: 24 أبريل 2025
References
- Tadesse, T., Abuye, H. & Tilahun, G. Availability and affordability of children essential medicines in health facilities of southern nations, nationalities, and people region, Ethiopia: Key determinants for access. BMC Public Health 21, 1-2 (2021).
- Ros, F., Kush, R., Friedman, C., Gil Zorzo, E., Rivero Corte, P., Rubin, J.C., Sanchez, B., Stocco, P., Van Houweling, D. Addressing the COVID-19 pandemic and future public health challenges through global collaboration and a data-driven systems approach. (2021).
- Aminizadeh, S. et al. Opportunities and challenges of artificial intelligence and distributed systems to improve the quality of healthcare service. Artif. Intell. Med. 1(149), 102779 (2024).
- Cusi, K. et al. American Association of Clinical Endocrinology clinical practice guideline for the diagnosis and management of nonalcoholic fatty liver disease in primary care and endocrinology clinical settings: Co-sponsored by the American Association for the Study of Liver Diseases (AASLD). Endocr. Pract. 28(5), 528-562 (2022).
- Masoumian Hosseini, M., Masoumian Hosseini, S. T., Qayumi, K., Hosseinzadeh, S. & Sajadi Tabar, S. S. Smartwatches in healthcare medicine: Assistance and monitoring; a scoping review. BMC Med. Inform. Decis. Mak. 23(1), 248 (2023).
- Mbunge, E. et al. Framework for ethical and acceptable use of social distancing tools and smart devices during COVID-19 pandemic in Zimbabwe. Sustain. Operations Comput. 1(2), 190-199 (2021).
- Palozzi, G., Ranalli, F. Telemedicine implementation between innovation and sustainability: An operating model for designing patient-centered healthcare. in Human-Centered Service Design for Healthcare Transformation: Development, Innovation, Change, pp. 375-399. (Springer International Publishing, 2023).
- Chatrati, S. P. et al. Smart home health monitoring system for predicting type 2 diabetes and hypertension. J. King Saud Univ.Comput. Inform. Sci. 34(3), 862-870 (2022).
- Philip, N. Y., Rodrigues, J. J., Wang, H., Fong, S. J. & Chen, J. Internet of Things for in-home health monitoring systems: Current advances, challenges and future directions. IEEE J. Sel. Areas Commun. 39(2), 300-310 (2021).
- Ye, Y. et al. Management of medical and health big data based on integrated learning-based health care system: A review and comparative analysis. Comput. Methods Programs Biomed. 1(209), 106293 (2021).
- Niu, Y., Ying, L., Yang, J., Bao, M. & Sivaparthipan, C. B. Organizational business intelligence and decision making using big data analytics. Inf. Process. Manage. 58(6), 102725 (2021).
- Rehman, A., Naz, S. & Razzak, I. Leveraging big data analytics in healthcare enhancement: Trends, challenges and opportunities. Multimed. Syst. 28(4), 1339-1371 (2022).
- Cappa, F., Oriani, R., Peruffo, E. & McCarthy, I. Big data for creating and capturing Value in the digitalized environment: Unpacking the effects of volume, Variety, and Veracity on firm performance. J. Prod. Innov. Manag. 38(1), 49-67 (2021).
- Sandhu, A. K. Big data with cloud computing: Discussions and challenges. Big Data Mining Analytics. 5(1), 32-40 (2021).
- Attaallah, A., Alsuhabi, H., Shukla, S., Kumar, R., Gupta, B.K., Khan, R.A. Analyzing the big data security through a unified decision-making approach. Intell. Automat. Soft Comput. 32(2) (2022).
- Chang, V. An ethical framework for big data and smart cities. Technol. Forecast. Soc. Chang. 1(165), 120559 (2021).
- Mathrani, S. & Lai, X. Big data analytic framework for organizational leverage. Appl. Sci. 11(5), 2340 (2021).
- Chen, J., Ramanathan, L. & Alazab, M. Holistic big data integrated artificial intelligent modeling to improve privacy and security in data management of smart cities. Microprocess. Microsyst. 1(81), 103722 (2021).
- Zarour, M. et al. Ensuring data integrity of healthcare information in the era of digital health. Healthc. Technol. Lett. 8(3), 66-77 (2021).
- Upadhyay, R.K. Chronic non-communicable diseases: Risk factors, disease burden, mortalities and control. Acta Scientific MEDICAL SCIENCES (ISSN: 2582-0931). 6(4) (2022).
- Teo, K. K. & Rafiq, T. Cardiovascular risk factors and prevention: A perspective from developing countries. Can. J. Cardiol. 37(5), 733-743 (2021).
- Sekar, J., Aruchamy, P., Sulaima Lebbe Abdul, H., Mohammed, A. S. & Khamuruddeen, S. An efficient clinical support system for heart disease prediction using TANFIS classifier. Comput. Intell. 38(2), 610-640 (2022).
- Kaul, D., Raju, H., Tripathy, B.K. Deep learning in healthcare. Deep learning in data analytics: Recent techniques, practices and applications. 97-115 (2022).
- Khanna, A. et al. Internet of things and deep learning enabled healthcare disease diagnosis using biomedical electrocardiogram signals. Expert. Syst. 40(4), e12864 (2023).
- Alizadehsani, R. et al. Risk factors prediction, clinical outcomes, and mortality in COVID-19 patients. J. Med. Virol. 93(4), 23072320 (2021).
- Dritsas, E. & Trigka, M. Stroke risk prediction with machine learning techniques. Sensors. 22(13), 4670 (2022).
- Reddy, K. V. et al. Heart disease risk prediction using machine learning classifiers with attribute evaluators. Appl. Sci. 11(18), 8352 (2021).
- Mahmud, N. et al. Risk prediction models for postoperative mortality in patients with cirrhosis. Hepatology 73(1), 204-218 (2021).
- Yang, H. et al. Risk prediction of diabetes: Big data mining with fusion of multifarious physical examination indicators. Inform. Fusion. 1(75), 140-149 (2021).
- Alkhammash, E. H. et al. Application of machine learning to predict COVID-19 spread via an optimized BPSO model. Biomimetics. 8(6), 457 (2023).
- Elshewey, A. M., Tawfeek, S. M., Alhussan, A. A., Radwan, M. & Abed, A. H. Optimized deep learning for potato blight detection using the waterwheel plant algorithm and sine cosine algorithm. Potato Res. 28, 1-25 (2024).
- Elshewey, A. M. et al. Optimizing HCV disease prediction in Egypt: The hyOPTGB framework. Diagnostics. 13(22), 3439 (2023).
- Alkhammash, E. H., Kamel, A. F., Al-Fattah, S. M. & Elshewey, A. M. Optimized multivariate adaptive regression splines for predicting crude oil demand in Saudi arabia. Discret. Dyn. Nat. Soc. 2022(1), 8412895 (2022).
- Alzakari, S. A., Alhussan, A. A., Qenawy, A. S. & Elshewey, A. M. Early detection of Potato Disease using an enhanced convolutional neural network-long short-term memory Deep Learning Model. Potato Res. 8, 1-9 (2024).
- Javeed, M., Gochoo, M., Jalal, A. & Kim, K. HF-SPHR: Hybrid features for sustainable physical healthcare pattern recognition using deep belief networks. Sustainability. 13(4), 1699 (2021).
- Połap, D. & Woźniak, M. Red fox optimization algorithm. Expert Syst. Appl. 15(166), 114107 (2021).
- Srikanth, B. et al. An optimized generalized adversarial system for predicting specific substructures in brainstem. Multimed. Tools Appl. 82(5), 7181-7205. https://doi.org/10.1007/s11042-022-13663-9 (2023).
- Dritsas, E. & Trigka, M. Supervised machine learning models for liver disease risk prediction. Computers. 12(1), 19 (2023).
- Trigka, M. & Dritsas, E. Long-term coronary artery disease risk prediction with machine learning models. Sensors. 23(3), 1193 (2023).
- Guarneros-Nolasco, L. R., Cruz-Ramos, N. A., Alor-Hernández, G., Rodríguez-Mazahua, L. & Sánchez-Cervantes, J. L. Identifying the main risk factors for cardiovascular diseases prediction using machine learning algorithms. Mathematics. 9(20), 2537 (2021).
- García-Ordás, M. T., Bayón-Gutiérrez, M., Benavides, C., Aveleira-Mata, J. & Benítez-Andrades, J. A. Heart disease risk prediction using deep learning techniques with feature augmentation. Multimed. Tools Appl. 82(20), 31759-31773 (2023).
- Rojek, I., Kotlarz, P., Kozielski, M., Jagodziński, M. & Królikowski, Z. Development of AI-based prediction of heart attack risk as an element of preventive medicine. Electronics 13(2), 272 (2024).
مساهمات المؤلفين
التمويل
الإعلانات
المصالح المتنافسة
موافقة الأخلاقيات
معلومات إضافية
معلومات إعادة الطبع والتصاريح متاحة على www.nature.com/reprints.
ملاحظة الناشر تظل Springer Nature محايدة فيما يتعلق بالمطالبات القضائية في الخرائط المنشورة والانتماءات المؤسسية.
© المؤلفون 2025
قسم تكنولوجيا المعلومات، معهد MLR للتكنولوجيا، حيدر أباد، الهند. قسم الذكاء الاصطناعي وعلوم البيانات، مدرسة GITAM للتكنولوجيا، جامعة GITAM – حرم بنغالور، بنغالور، الهند. قسم علوم الحاسوب والهندسة، مدرسة الهندسة والعلوم، جامعة SRM، أمارافاتي، AP، الهند. قسم علوم الحاسوب والهندسة، مؤسسة كونيرو لاكشمايا التعليمية، غونتور، الهند. قسم علوم الحاسوب والهندسة (AI & ML)، كلية فيديافارداكا للهندسة، ميسور، الهند. قسم علوم الحاسوب والهندسة، كلية SRKR للهندسة، بيمفارام 534204، الهند. قسم علوم الحاسوب والهندسة، كلية السير C R ريدي للهندسة، إيلور، الهند. مدرسة علوم الحاسوب والهندسة، جامعة VIT-AP، فيجايوادا 522237، الهند. البريد الإلكتروني: v2ramesh634@gmail.com
DOI: https://doi.org/10.1038/s41598-025-98721-6
PMID: https://pubmed.ncbi.nlm.nih.gov/40274987
Publication Date: 2025-04-24
OPEN
Optimized machine learning mechanism for big data healthcare system to predict disease risk factor
Abstract
Heart disease is becoming more and more common in modern society because of factors like stress, inadequate diets, etc. Early identification of heart disease risk factors is essential as it allows for treatment plans that may reduce the risk of severe consequences and enhance patient outcomes. Predictive methods have been used to estimate the risk factor, but they often have drawbacks such as improper feature selection, overfitting, etc. To overcome this, a novel Deep Red Fox belief prediction system (DRFBPS) has been introduced and implemented in Python software. Initially, the data was collected and preprocessed to enhance its quality, and the relevant features were selected using red fox optimization. The selected features analyze the risk factors, and DRFBPS makes the prediction. The effectiveness of the DRFBPS model is validated using Accuracy, F score, Precision, AUC, Recall, and error rate. The findings demonstrate the use of DRFBPS as a practical tool in healthcare analytics by showing the rate at which it produces accurate and reliable predictions. Additionally, its application in healthcare systems, including clinical decisions and remote patient monitoring, proves its real-world applicability in enhancing early diagnosis and preventive care measures. The results prove DRFBPS to be a potential tool in healthcare analytics, providing a strong framework for predictive modeling in heart disease risk prediction.
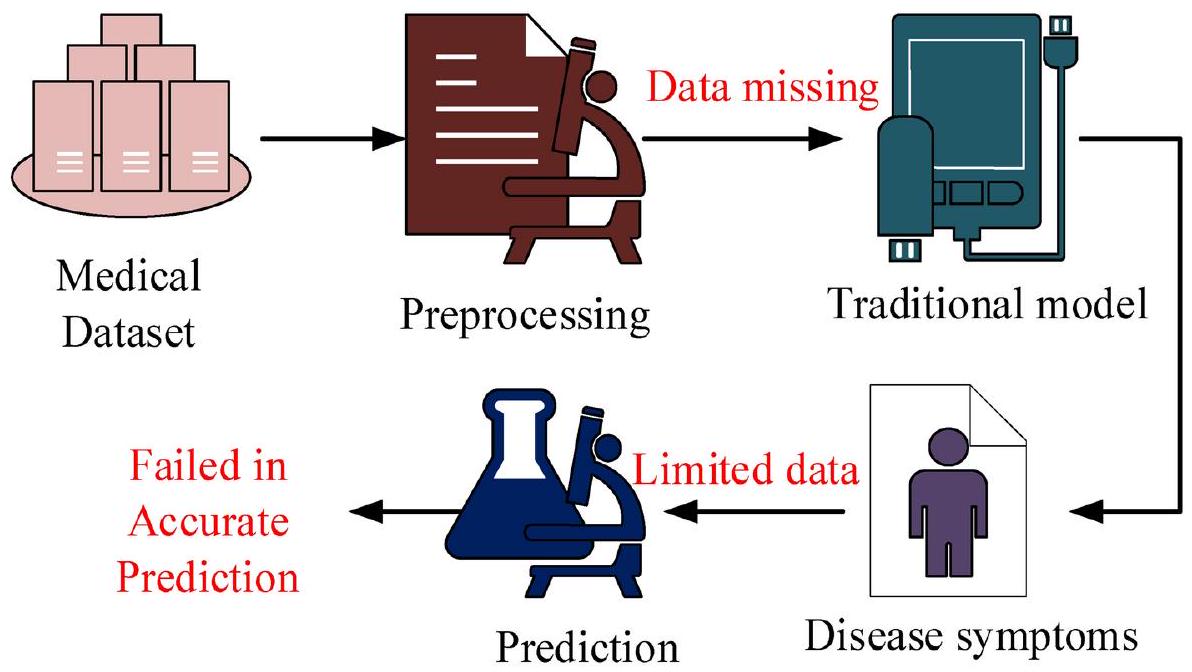
The healthcare system (HCS) is one of the biggest in emerging nations, with yearly growth in both employment and income
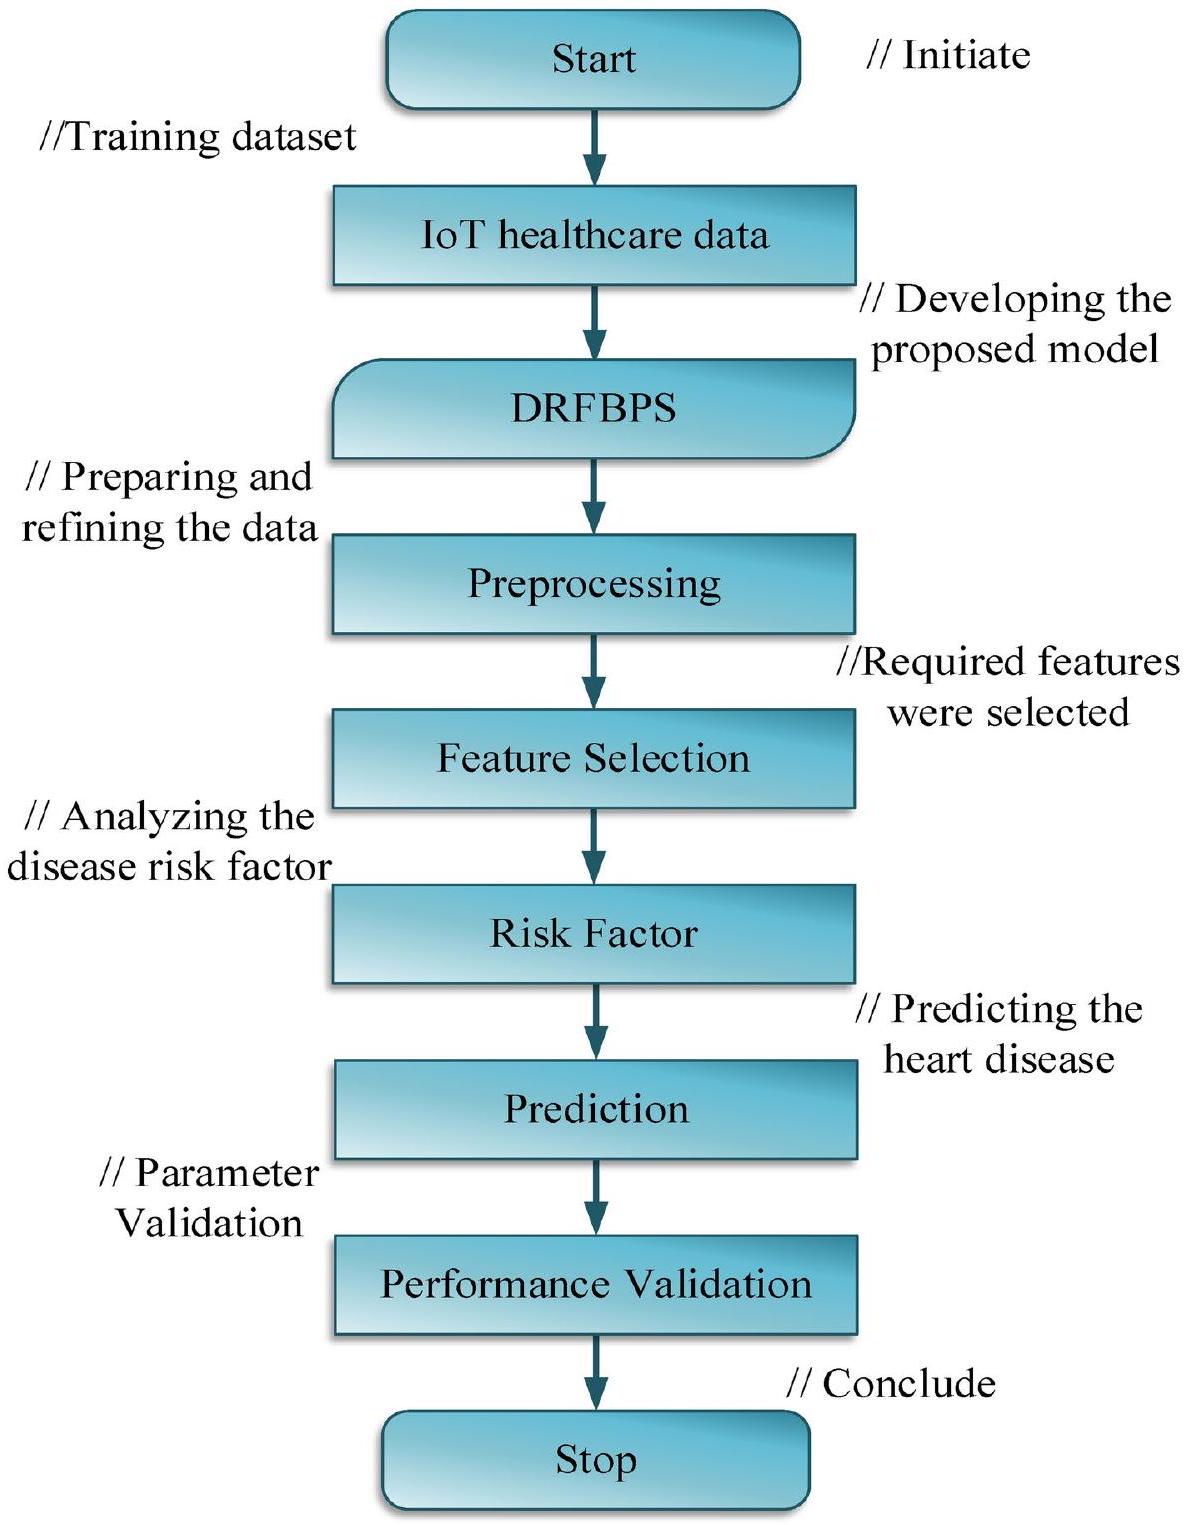
- Initially, the IoT healthcare dataset was gathered and trained using the Python system.
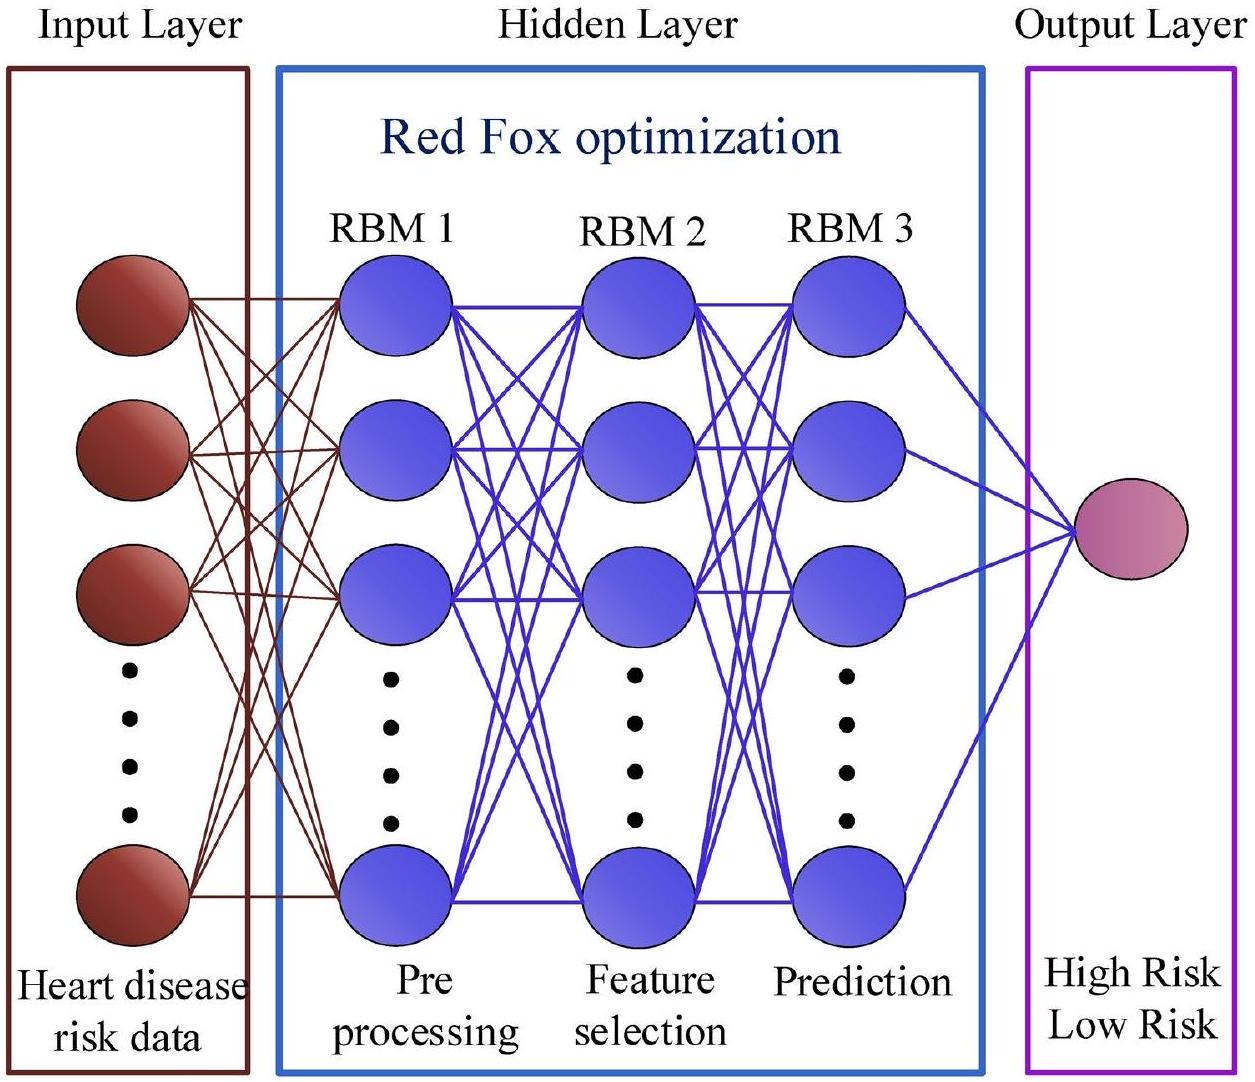
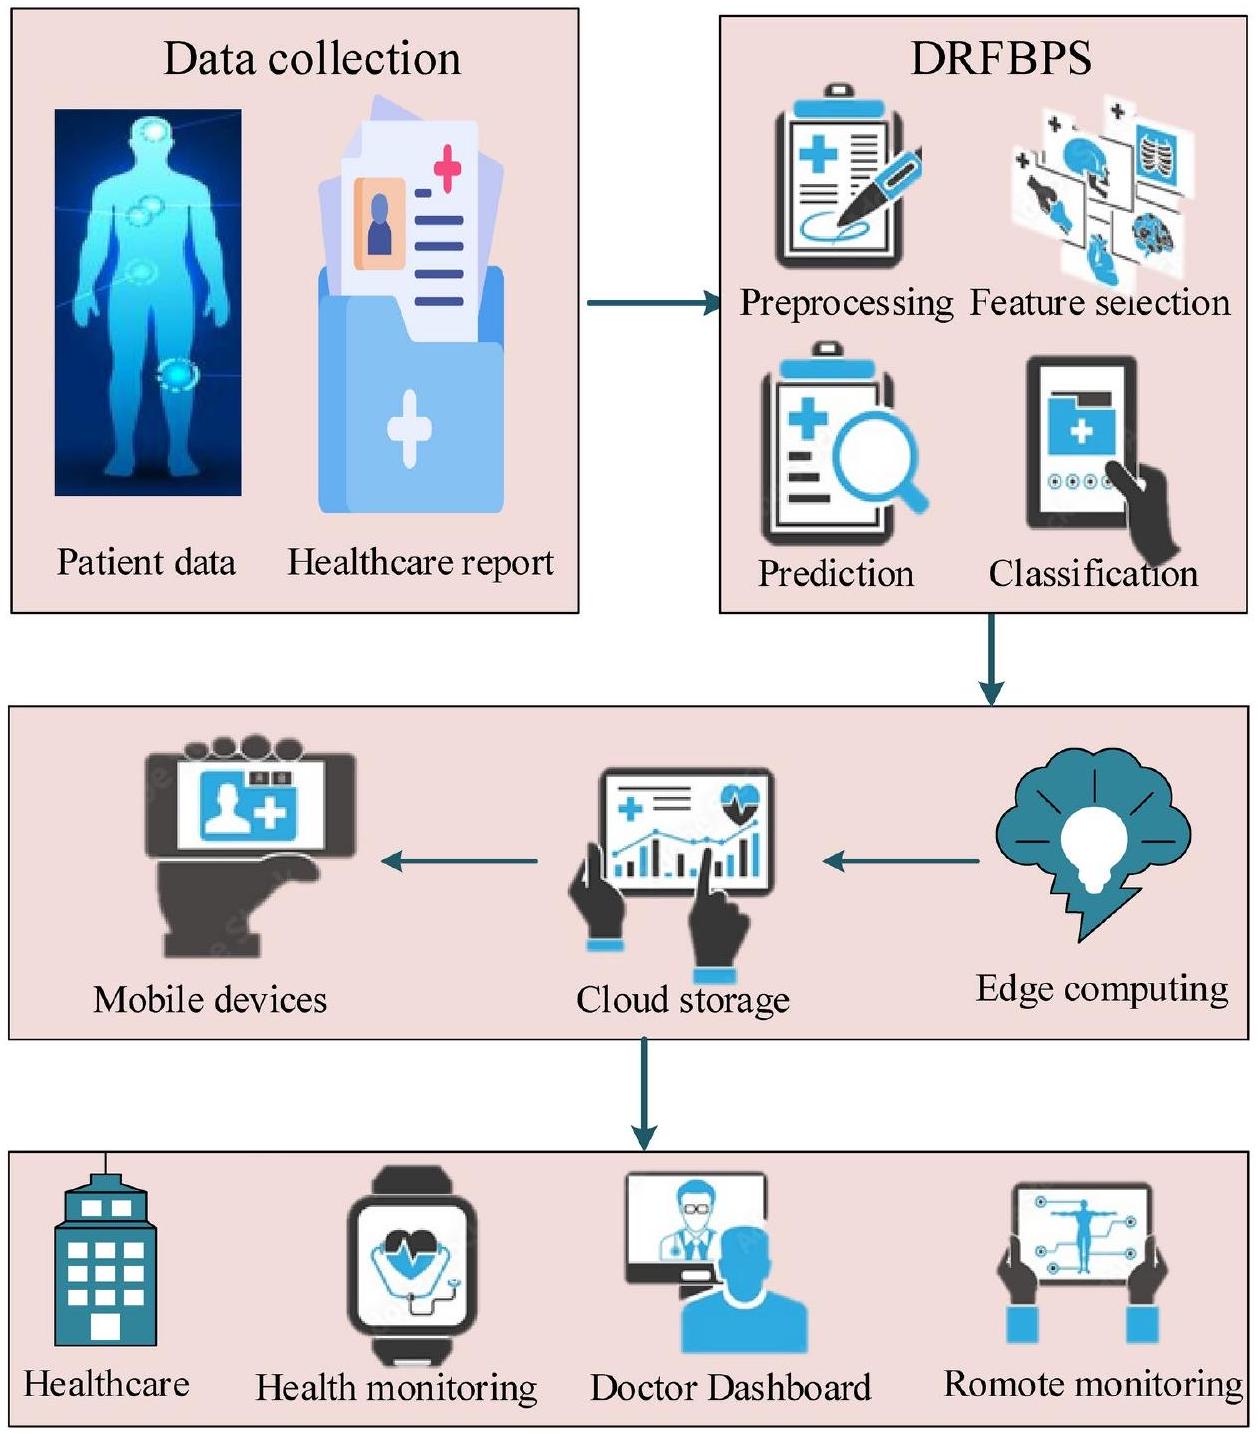
- A novel Deep Red Fox Belief Prediction System (DRFBPS) is introduced as a predictive method with the necessary features for prediction.
- The collected data is preprocessed to remove noise, and feature analysis is performed using Red Fox optimization to select the required features from the vast data.
- Using these selected features, the DRFBPS analyzes and predicts heart disease risk factors.
- The model’s effectiveness is assessed using measures including accuracy, F-score, Precision, AUC, Recall, error rate, p -value, and confidence intervals.
Related work
Alizadehsani et al.
gradient boosting model outperforms both the random forest and naive Bayes models. However, it has problems with computational complexity.
Research gap
System model with problem
Proposed methodology
Process of proposed DRFBPS
Preprocessing
Feature selection
Start
$operatorname{int} T, H_{d}, n ;$
//dataset initialization
Preprocessing()
${$
    $operatorname{int} P, lambda, e ;$
    // Initializing the error removing variables
    $P rightarrow mid H_{d}$-error contents $mid$
    //error constraints are removed from the dataset
}

Feature selection()
${$
    $operatorname{int} F, t, alpha$, best
    // initializing the feature selecting variables
    $F rightarrow mid alpha($ features selected $) mid$
    // Required features are selected from the dataset
}
Prediction()
${$
    $operatorname{int} D, R, H, E$;
//Initializing the risk prediction elements
//Disease risk factor is predicted
Classification ()
//Initializing the classification elements
High risk
Low risk
Stop
Prediction
Results and discussion
| Metrics | Specification |
| Operating system | Windows 10 |
| Program platform | Python |
| Version | 3.7 .14 |
| Network | Deep belief neural network |
| Optimization | Red Fox |
| Training and testing |
|
| S. No. | Risk factors | Codes and range |
| 1 | Age | (0) Male (1) Female |
| 2 | Gender | (1) 15-35; (2) 36-55; (3) 56-75; (4) >76 |
| 3 | Respiratory rate | Normal (1): 12-18 breaths/min high (2): <12-18 breaths/min low (3):
|
| 4 | Heart rate | Normal (1): 60-100 beats/min high (2):
|
| 5 | Systolic blood pressure | Normal (1):
|
| 6 | Diastolic blood pressure | Normal (1):
|
| 7 | Body temperature | Low (0):
|
| 8 | Total cholesterol | Low (0):
|
| 9 | HDL cholesterol | Low (0):
|
| 10 | LDL cholesterol | Low (0):
|
Case study
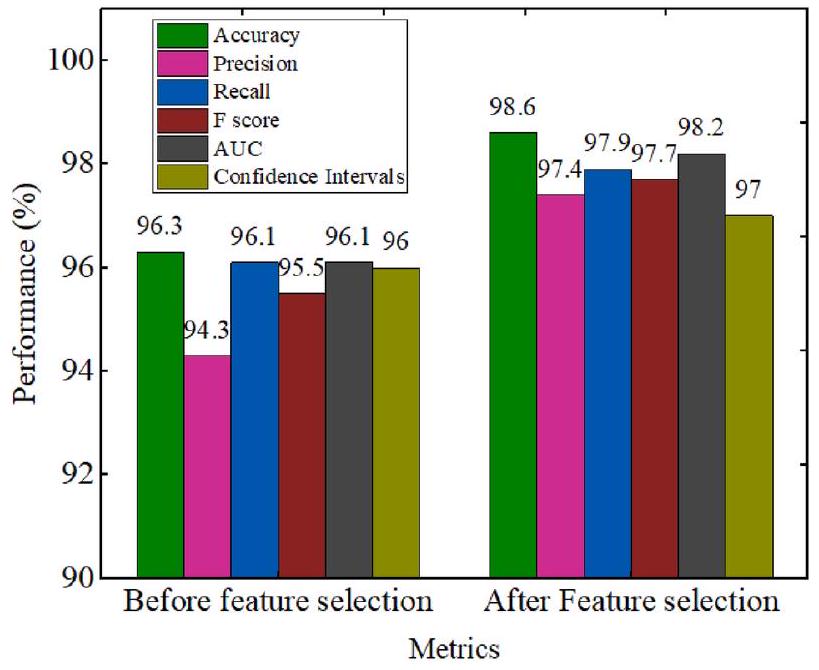
Performance analysis
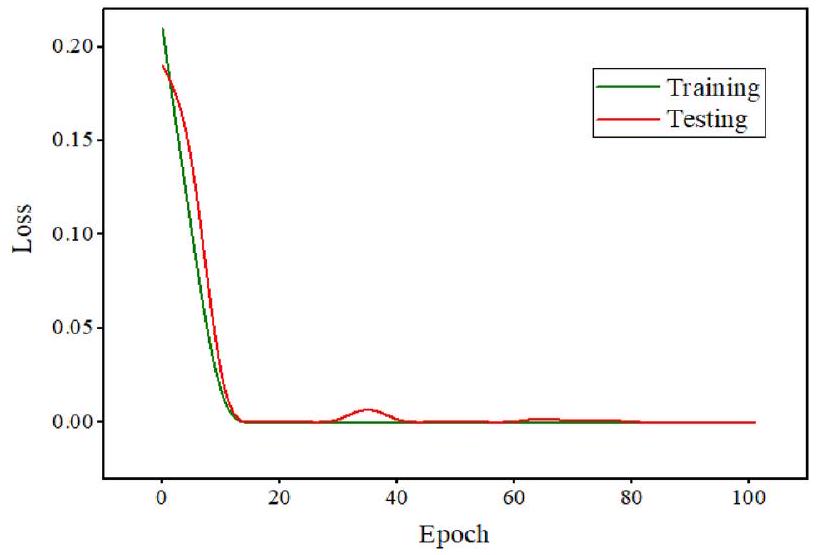
Accuracy
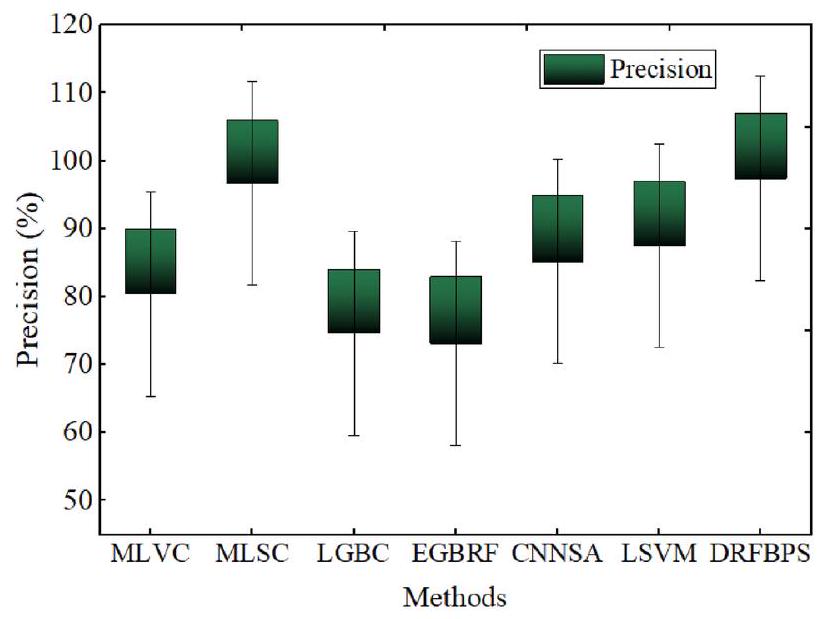
Precision
| Layers | Process | Neurons | Activation |
| Input layer | Data input | 256 | – |
| Hidden layer RBM 1 | Preprocessing | 128 | Sigmoid |
| Hidden layer RBM 2 | Feature selection | 64 | Sigmoid |
| Hidden Layer RBM 3 | Prediction | 32 | Relu |
| Output layer | Classification | 2 | Softmax |
Recall
Error rate
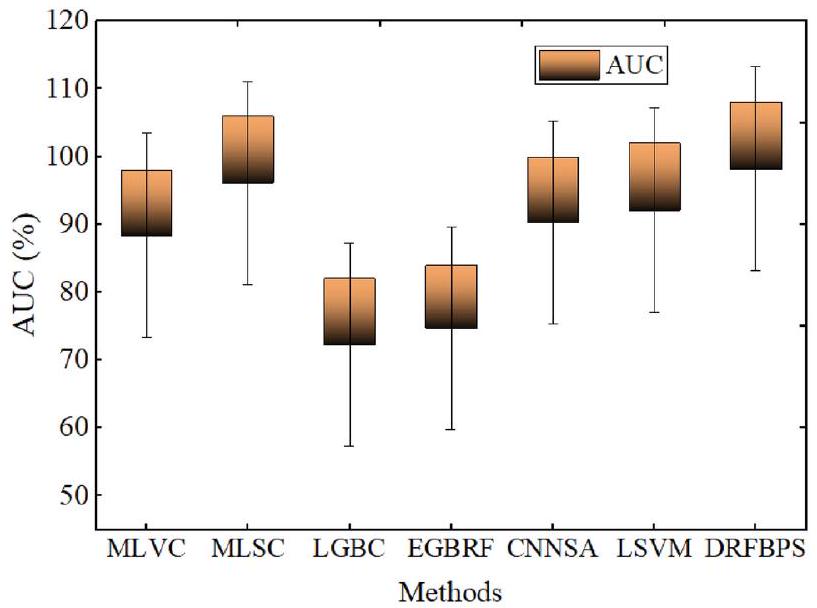
AUC
| Accuracy | Precision | Recall | F score | Error rate | AUC | P value | Confidence interval | |
| MLVC | 80.1 | 80.4 | 80.1 | 80.1 | 0.199 | 88.4 | 0.058 | 81 |
| MLSC | 90.9 | 96.7 | 87.6 | 92.15 | 0.091 | 96.1 | 0.023 | 89 |
| LGBC | 77.84 | 74.61 | 73.26 | 73.93 | 0.2216 | 72.27 | 0.131 | 76 |
| EGBRF | 75.63 | 73.13 | 68.25 | 70.61 | 0.2437 | 74.71 | 0.115 | 74 |
| CNNSA | 83.56 | 85.2 | 82.9 | 84.05 | 0.1644 | 90.3 | 0.011 | 82 |
| LSVM | 86.43 | 87.5 | 85.9 | 86.7 | 0.1357 | 92.1 | 0.026 | 85 |
| DRFBPS | 98.6 | 97.4 | 97.9 | 97.7 | 0.014 | 98.2 | 0.001 | 97 |
| Accuracy | Precision | Recall | F score | Error rate | AUC | P value | Confidence interval | |
| DBN+GA | 98.6 | 97.0 | 97.4 | 97.7 | 0.014 | 97.8 | 0.002 | 96.5 |
| DBN + PS | 95.3 | 95.9 | 96.2 | 96.1 | 0.032 | 97.1 | 0.004 | 96 |
| DBN + BO | 94.3 | 92.8 | 93.1 | 92.9 | 0.057 | 95.4 | 0.005 | 93 |
| DBN + RFO proposed | 98.6 | 97.4 | 97.9 | 97.7 | 0.014 | 98.2 | 0.001 | 97 |
Discussion
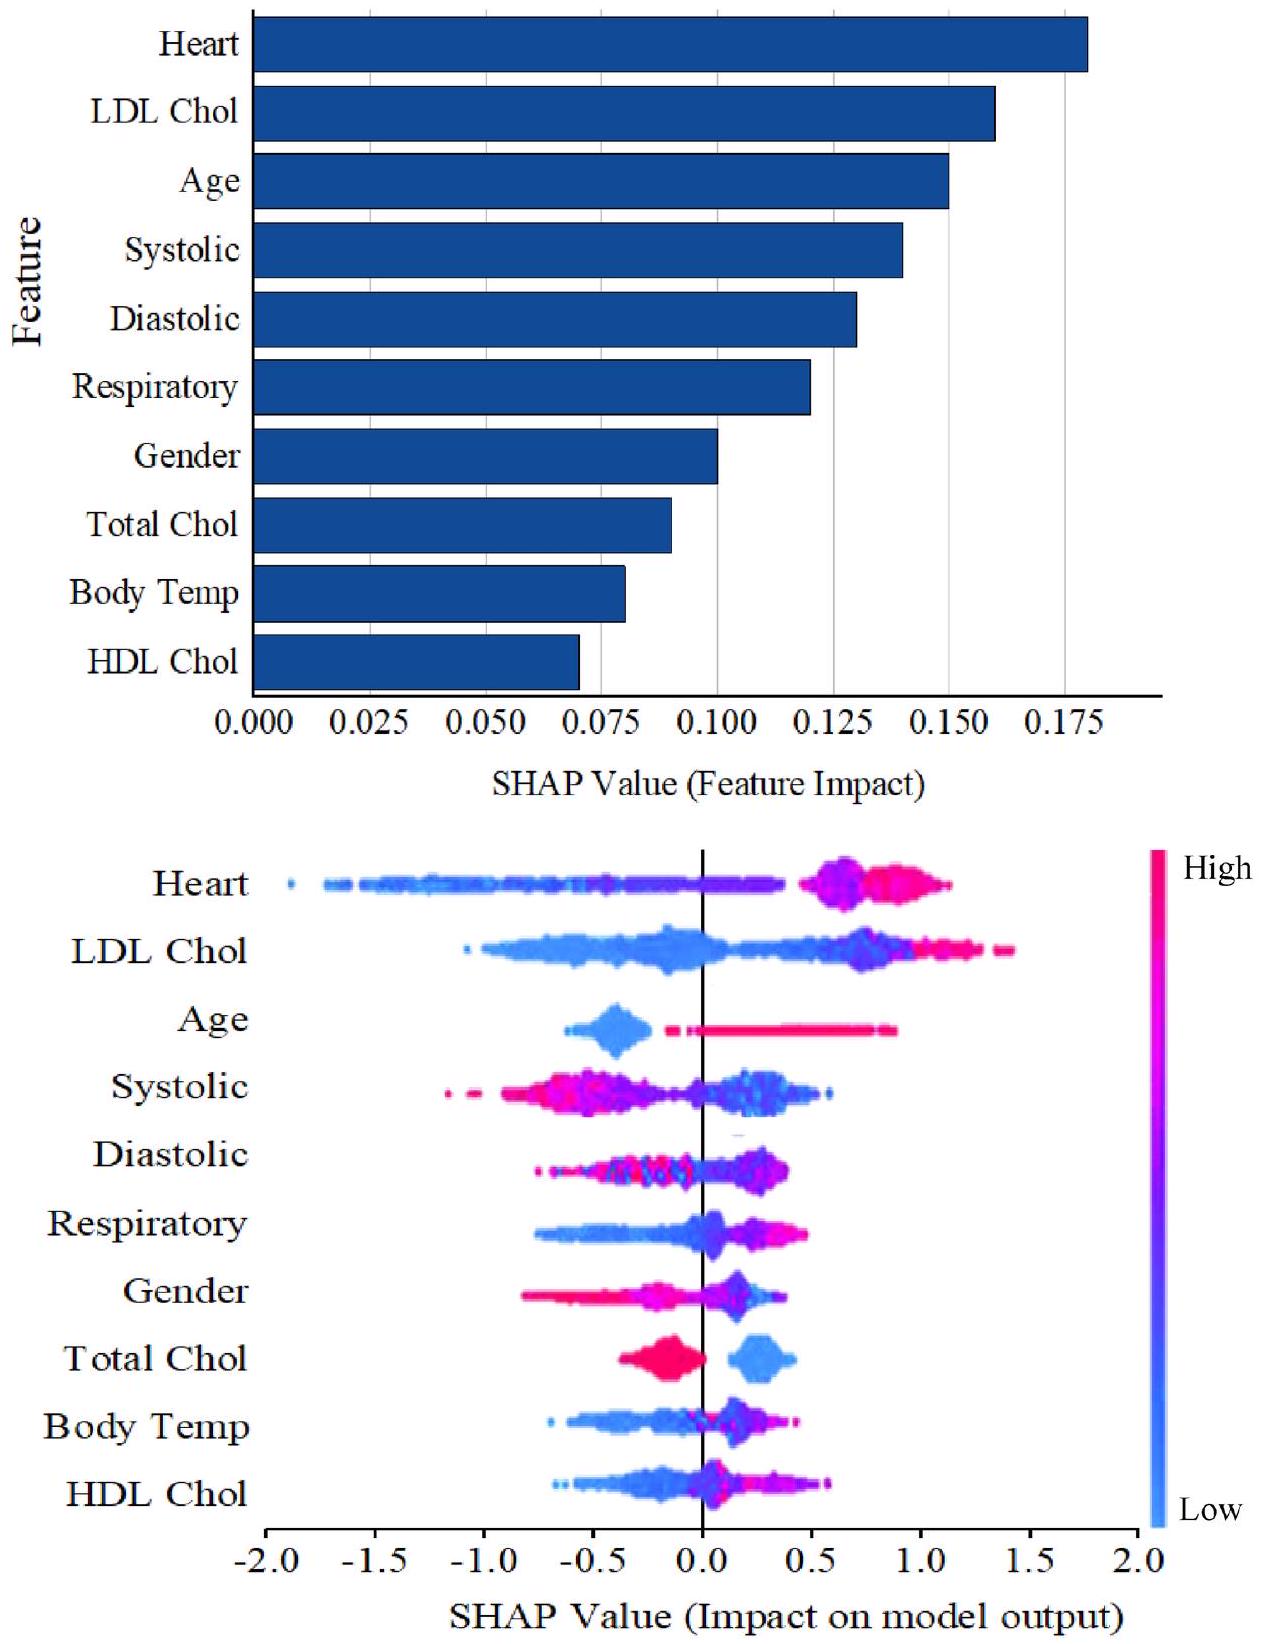
data for the current research were obtained from Kaggle, which might expose the model to potential biases and make generalization a challenge. The RFO was used to address the biases in the Kaggle data during successful processing. This approach served as a tool for preprocessing and feature selection by filtering noise and retaining only the most informative features, reducing the impact of data that is either overrepresented or underrepresented. The red fox fitness function ensures the most predictive and useful variables are included, minimizing dimensionality and boosting model performance. It ensures that the DRFBPS makes accurate and reliable predictions in a wide range of patient populations, enhancing its generalizability and clinical utility. This robust Framework accurately identifies individuals at risk of heart disease, potentially assisting in early diagnosis and intervention efforts. Additionally, to prove the generalizability, the developed model is validated with the Cleveland dataset, and the results are displayed in Table 6.
- The study proves that DRFBPS outperforms the prediction of heart disease risk by overcoming difficulties of inappropriate feature selection and overfitting.
- Applying Red Fox Optimization, the model efficiently chooses applicable features, thereby improving predictive Precision.
- The model is extensively evaluated using Accuracy, F-score, Precision, AUC, Recall, error rate, P value, and confidence intervals, depicting consistent and higher performance than existing approaches.
- The findings verify that DRFBPS makes accurate and stable disease risk predictions with probable applications in early diagnosis, personal treatment planning, and enhanced patient outcomes in practical healthcare environments.
Conclusion
| Measures | HARP dataset | Cleveland dataset |
| Accuracy (%) | 98.6 | 98.2 |
| F score (%) | 97.7 | 97.3 |
| Precision (%) | 97.4% | 97 |
| AUC (%) | 98.2 | 97.8 |
| Recall (%) | 97.9 | 97.5 |
| Error rate | 0.014 | 0.017 |
| P value | 0.001 | 0.003 |
| Confidence interval | 97 | 95 |
Data availability
Published online: 24 April 2025
References
- Tadesse, T., Abuye, H. & Tilahun, G. Availability and affordability of children essential medicines in health facilities of southern nations, nationalities, and people region, Ethiopia: Key determinants for access. BMC Public Health 21, 1-2 (2021).
- Ros, F., Kush, R., Friedman, C., Gil Zorzo, E., Rivero Corte, P., Rubin, J.C., Sanchez, B., Stocco, P., Van Houweling, D. Addressing the COVID-19 pandemic and future public health challenges through global collaboration and a data-driven systems approach. (2021).
- Aminizadeh, S. et al. Opportunities and challenges of artificial intelligence and distributed systems to improve the quality of healthcare service. Artif. Intell. Med. 1(149), 102779 (2024).
- Cusi, K. et al. American Association of Clinical Endocrinology clinical practice guideline for the diagnosis and management of nonalcoholic fatty liver disease in primary care and endocrinology clinical settings: Co-sponsored by the American Association for the Study of Liver Diseases (AASLD). Endocr. Pract. 28(5), 528-562 (2022).
- Masoumian Hosseini, M., Masoumian Hosseini, S. T., Qayumi, K., Hosseinzadeh, S. & Sajadi Tabar, S. S. Smartwatches in healthcare medicine: Assistance and monitoring; a scoping review. BMC Med. Inform. Decis. Mak. 23(1), 248 (2023).
- Mbunge, E. et al. Framework for ethical and acceptable use of social distancing tools and smart devices during COVID-19 pandemic in Zimbabwe. Sustain. Operations Comput. 1(2), 190-199 (2021).
- Palozzi, G., Ranalli, F. Telemedicine implementation between innovation and sustainability: An operating model for designing patient-centered healthcare. in Human-Centered Service Design for Healthcare Transformation: Development, Innovation, Change, pp. 375-399. (Springer International Publishing, 2023).
- Chatrati, S. P. et al. Smart home health monitoring system for predicting type 2 diabetes and hypertension. J. King Saud Univ.Comput. Inform. Sci. 34(3), 862-870 (2022).
- Philip, N. Y., Rodrigues, J. J., Wang, H., Fong, S. J. & Chen, J. Internet of Things for in-home health monitoring systems: Current advances, challenges and future directions. IEEE J. Sel. Areas Commun. 39(2), 300-310 (2021).
- Ye, Y. et al. Management of medical and health big data based on integrated learning-based health care system: A review and comparative analysis. Comput. Methods Programs Biomed. 1(209), 106293 (2021).
- Niu, Y., Ying, L., Yang, J., Bao, M. & Sivaparthipan, C. B. Organizational business intelligence and decision making using big data analytics. Inf. Process. Manage. 58(6), 102725 (2021).
- Rehman, A., Naz, S. & Razzak, I. Leveraging big data analytics in healthcare enhancement: Trends, challenges and opportunities. Multimed. Syst. 28(4), 1339-1371 (2022).
- Cappa, F., Oriani, R., Peruffo, E. & McCarthy, I. Big data for creating and capturing Value in the digitalized environment: Unpacking the effects of volume, Variety, and Veracity on firm performance. J. Prod. Innov. Manag. 38(1), 49-67 (2021).
- Sandhu, A. K. Big data with cloud computing: Discussions and challenges. Big Data Mining Analytics. 5(1), 32-40 (2021).
- Attaallah, A., Alsuhabi, H., Shukla, S., Kumar, R., Gupta, B.K., Khan, R.A. Analyzing the big data security through a unified decision-making approach. Intell. Automat. Soft Comput. 32(2) (2022).
- Chang, V. An ethical framework for big data and smart cities. Technol. Forecast. Soc. Chang. 1(165), 120559 (2021).
- Mathrani, S. & Lai, X. Big data analytic framework for organizational leverage. Appl. Sci. 11(5), 2340 (2021).
- Chen, J., Ramanathan, L. & Alazab, M. Holistic big data integrated artificial intelligent modeling to improve privacy and security in data management of smart cities. Microprocess. Microsyst. 1(81), 103722 (2021).
- Zarour, M. et al. Ensuring data integrity of healthcare information in the era of digital health. Healthc. Technol. Lett. 8(3), 66-77 (2021).
- Upadhyay, R.K. Chronic non-communicable diseases: Risk factors, disease burden, mortalities and control. Acta Scientific MEDICAL SCIENCES (ISSN: 2582-0931). 6(4) (2022).
- Teo, K. K. & Rafiq, T. Cardiovascular risk factors and prevention: A perspective from developing countries. Can. J. Cardiol. 37(5), 733-743 (2021).
- Sekar, J., Aruchamy, P., Sulaima Lebbe Abdul, H., Mohammed, A. S. & Khamuruddeen, S. An efficient clinical support system for heart disease prediction using TANFIS classifier. Comput. Intell. 38(2), 610-640 (2022).
- Kaul, D., Raju, H., Tripathy, B.K. Deep learning in healthcare. Deep learning in data analytics: Recent techniques, practices and applications. 97-115 (2022).
- Khanna, A. et al. Internet of things and deep learning enabled healthcare disease diagnosis using biomedical electrocardiogram signals. Expert. Syst. 40(4), e12864 (2023).
- Alizadehsani, R. et al. Risk factors prediction, clinical outcomes, and mortality in COVID-19 patients. J. Med. Virol. 93(4), 23072320 (2021).
- Dritsas, E. & Trigka, M. Stroke risk prediction with machine learning techniques. Sensors. 22(13), 4670 (2022).
- Reddy, K. V. et al. Heart disease risk prediction using machine learning classifiers with attribute evaluators. Appl. Sci. 11(18), 8352 (2021).
- Mahmud, N. et al. Risk prediction models for postoperative mortality in patients with cirrhosis. Hepatology 73(1), 204-218 (2021).
- Yang, H. et al. Risk prediction of diabetes: Big data mining with fusion of multifarious physical examination indicators. Inform. Fusion. 1(75), 140-149 (2021).
- Alkhammash, E. H. et al. Application of machine learning to predict COVID-19 spread via an optimized BPSO model. Biomimetics. 8(6), 457 (2023).
- Elshewey, A. M., Tawfeek, S. M., Alhussan, A. A., Radwan, M. & Abed, A. H. Optimized deep learning for potato blight detection using the waterwheel plant algorithm and sine cosine algorithm. Potato Res. 28, 1-25 (2024).
- Elshewey, A. M. et al. Optimizing HCV disease prediction in Egypt: The hyOPTGB framework. Diagnostics. 13(22), 3439 (2023).
- Alkhammash, E. H., Kamel, A. F., Al-Fattah, S. M. & Elshewey, A. M. Optimized multivariate adaptive regression splines for predicting crude oil demand in Saudi arabia. Discret. Dyn. Nat. Soc. 2022(1), 8412895 (2022).
- Alzakari, S. A., Alhussan, A. A., Qenawy, A. S. & Elshewey, A. M. Early detection of Potato Disease using an enhanced convolutional neural network-long short-term memory Deep Learning Model. Potato Res. 8, 1-9 (2024).
- Javeed, M., Gochoo, M., Jalal, A. & Kim, K. HF-SPHR: Hybrid features for sustainable physical healthcare pattern recognition using deep belief networks. Sustainability. 13(4), 1699 (2021).
- Połap, D. & Woźniak, M. Red fox optimization algorithm. Expert Syst. Appl. 15(166), 114107 (2021).
- Srikanth, B. et al. An optimized generalized adversarial system for predicting specific substructures in brainstem. Multimed. Tools Appl. 82(5), 7181-7205. https://doi.org/10.1007/s11042-022-13663-9 (2023).
- Dritsas, E. & Trigka, M. Supervised machine learning models for liver disease risk prediction. Computers. 12(1), 19 (2023).
- Trigka, M. & Dritsas, E. Long-term coronary artery disease risk prediction with machine learning models. Sensors. 23(3), 1193 (2023).
- Guarneros-Nolasco, L. R., Cruz-Ramos, N. A., Alor-Hernández, G., Rodríguez-Mazahua, L. & Sánchez-Cervantes, J. L. Identifying the main risk factors for cardiovascular diseases prediction using machine learning algorithms. Mathematics. 9(20), 2537 (2021).
- García-Ordás, M. T., Bayón-Gutiérrez, M., Benavides, C., Aveleira-Mata, J. & Benítez-Andrades, J. A. Heart disease risk prediction using deep learning techniques with feature augmentation. Multimed. Tools Appl. 82(20), 31759-31773 (2023).
- Rojek, I., Kotlarz, P., Kozielski, M., Jagodziński, M. & Królikowski, Z. Development of AI-based prediction of heart attack risk as an element of preventive medicine. Electronics 13(2), 272 (2024).
Author contributions
Funding
Declarations
Competing interests
Ethics approval
Additional information
Reprints and permissions information is available at www.nature.com/reprints.
Publisher’s note Springer Nature remains neutral with regard to jurisdictional claims in published maps and institutional affiliations.
© The Author(s) 2025
Department of Information Technology, MLR Institute of Technology, Hyderabad, India. Department of Artificial Intelligence and Data Science, GITAM School of Technology, GITAM University-Bengaluru Campus, Bengaluru, India. Department of Computer Science and Engineering, School of Engineering and Sciences, SRM University, Amaravati, AP, India. Department of Computer Science and Engineering, Koneru Lakshmaiah Education Foundation, Guntur, India. Department of Computer Science and Engineering (AI & ML), Vidyavardhaka College of Engineering, Mysore, India. Department of Computer Science and Engineering, SRKR Engineering College, Bhimavaram 534204, India. Department of Computer Science and Engineering, Sir C R Reddy College of Engineering, Eluru, India. School of Computer Science and Engineering, VIT-AP University, Vijayawada 522237, India. email: v2ramesh634@gmail.com