أطلس خلية واحدة لمبيض الفأر المتقدم في السن A single-cell atlas of the aging mouse ovary

المجلة: Nature Aging، المجلد: 4، العدد: 1
DOI: https://doi.org/10.1038/s43587-023-00552-5
PMID: https://pubmed.ncbi.nlm.nih.gov/38200272
تاريخ النشر: 2024-01-10

أطلس خلية واحدة لمبيض الفأر المتقدم في السن

تاريخ الاستلام: 12 مايو 2023
تاريخ القبول: 1 ديسمبر 2023
تاريخ النشر على الإنترنت: 10 يناير 2024
(4) تحقق من التحديثات

خوسيه ف. ف. إيزولا , سارة ر. أوكاناس , تشيس ر. هوبارت , سونغوان كو , سميم علي موندال , جيسيكا د. هينس , هانا ن. سي. كارتر , أوغستو شنايدر , سوزان كوفاتس , خوسيه ألبيرولا-إيلا © , ويليارد م. فريمان (1) & مايكل ب. ستاوت (ب)

الملخص

يؤدي تقدم المبيض في السن إلى انخفاض الخصوبة، واضطراب الإشارات الهرمونية وزيادة عبء الأمراض المزمنة. تبدأ هذه التأثيرات في الظهور قبل فترة طويلة من استنفاد الجريبات. تعاني النساء من انخفاض حاد في الخصوبة حوالي 35 عامًا، وهو ما يتوافق مع انخفاض جودة البويضات. على الرغم من وجود مجموعة متزايدة من الأعمال، إلا أن هذا المجال يفتقر إلى خريطة خلوية شاملة للتغيرات النسخية في مبيض الفأر المتقدم في السن لتحديد المحركات المبكرة لانخفاض المبيض. لسد هذه الفجوة، قمنا بإجراء تسلسل RNA على مستوى الخلية الواحدة على أنسجة المبيض من الفئران الشابة (3 أشهر) والفئران المتقدمة في السن (9 أشهر). كشفت تحليلاتنا عن تضاعف عدد الخلايا المناعية في المبيض المتقدم في السن، مع زيادة أكبر في نسب اللمفاويات، وهو ما تم تأكيده بواسطة قياس التدفق. كما وجدنا أيضًا انخفاضًا مرتبطًا بالعمر في مسارات الكولاجيناز في الخلايا الليفية السدوية، وهو ما يتوافق مع زيادة تليف المبيض. أظهرت خلايا الجريبات استجابة للضغط، وإشارات مناعية وإشارات تليفية مع تقدم العمر. يوفر هذا التقرير رؤى حاسمة حول الآليات المسؤولة عن أنماط تقدم المبيض في السن. يمكن استكشاف البيانات بشكل تفاعلي عبر تطبيق ويب قائم على Shiny.

لقد حظي تقدم المبيض في السن باهتمام كبير في السنوات الأخيرة بسبب نسبة كبيرة من النساء اللاتي يختارن تأخير الإنجاب , مما يسبب غالبًا صعوبة في الحمل واستمرار الحمل حتى النهاية . مع تقدم المبيض في السن، يتغير البيئة المحلية بطرق تقلل من جودة البويضات وتزيد من معدل استنفاد الجريبات، مما يؤدي في النهاية إلى انقطاع الطمث. يرتبط انقطاع الطمث بتسارع الشيخوخة النظامية , وزيادة عبء الأمراض المزمنة وزيادة خطر الوفاة بسبب جميع الأسباب . لذلك، فإن فهم أعمق للآليات التي تكمن وراء تقدم المبيض في السن أمر بالغ الأهمية لتمديد خصوبة النساء وتقليل بداية الأمراض المزمنة المرتبطة بالعمر.
من المعروف جيدًا أن استنفاد الجريبات المرتبط بالعمر يرتبط بزيادة خلل الميتوكوندريا , وإنتاج أنواع الأكسجين التفاعلية , والالتهاب والتليف . ومع ذلك، فإن القليل جدًا
من المعروف عن أنواع الخلايا التي تطور هذه الأنماط أولاً و/أو تساهم بشكل رئيسي في تغيير البيئة المحلية. علاوة على ذلك، لا يزال غير واضح ما إذا كانت الخلايا في الجريبات، أو السدى أو كليهما تلعب أدوارًا آلية في تعزيز استنفاد الجريبات وفشل المبيض. سعت الأعمال الأخيرة إلى فك رموز الدور المحتمل الذي تلعبه خلايا السدى المبيضية في صحة المبيض والمرض . لقد أبلغنا نحن وآخرون أن علامات الشيخوخة الخلوية وتكوين الأنسجة تزداد داخل السدى المبيضي مع تقدم العمر , على الرغم من أن أنواع الخلايا المحددة التي تصبح شيخوخة و/أو تليفية لا تزال غير معروفة. بالإضافة إلى زيادة علامات الشيخوخة والتليف، يتراكم السدى المبيضي أيضًا خلايا عملاقة متعددة النوى (MNGCs) مع تقدم العمر، والتي قد تكون مرتبطة بالآليات التي تعزز الأنماط المذكورة أعلاه .
نظرًا للطبيعة المعقدة لوظيفة المبيض، التي تتغير ديناميكيًا خلال الشيخوخة، كان من الصعب تاريخيًا توضيح الآليات المحددة لنوع الخلية التي تعزز استنفاد الجريبات وفشل المبيض. البيانات التي تظهر التغيرات المرتبطة بالعمر في البرامج النسخية المبيضية داخل الأنواع الفرعية الخلوية محدودة، خاصة تلك المتعلقة بالفئران. حددت التحليلات على مستوى الخلية الواحدة لتقدم المبيض في الرئيسيات غير البشرية انخفاضًا في برامج مضادات الأكسدة في البويضات المتقدمة في السن وزيادة في موت الخلايا المبرمج في خلايا الجرانولوزا المتقدمة في السن (GCs) . بالإضافة إلى ذلك، فإن التحليلات على مستوى الخلية الواحدة لأنسجة المبيض البشرية جارية حاليًا . ومع ذلك، تمثل الفئران الكائن النموذجي الأكثر استخدامًا لدراسات تقدم المبيض بسبب عمرها القصير وسهولة التلاعب الجيني للدراسات الآلية. حققت إحدى التحليلات المكانية المحللة لمبايض الفئران تقدمًا في تحديد التغيرات المرتبطة بالعمر في تجمعات خلايا المبيض . ومع ذلك، استخدمت هذه الدراسة فئرانًا متقدمة في السن (15 شهرًا) وافتقرت إلى الدقة لتحديد الأنواع الفرعية الخلوية المحددة والتجمعات المناعية المهمة. لإضافة إلى هذا الجسم المتزايد من العمل، قمنا بإجراء تسلسل RNA على مستوى الخلية الواحدة (scRNA-seq) لتحديد التغيرات النسخية المرتبطة بالعمر بطريقة محددة لنوع الخلية داخل مبيض الفأر في عمر 3 و9 أشهر. اخترنا تحليل الفئران التي تبلغ من العمر 3 و9 أشهر لأنها تظل نشطة إنجابيًا في كلا العمرين، ومع ذلك، يمثل هذا الفاصل العمري فترة عندما ينخفض كثافة الجريبات بشكل ملحوظ بالتزامن مع ظهور علامات الشيخوخة المرتبطة بالعمر . سمح لنا هذا التصميم والنهج بتحديد كيف يؤثر التقدم في السن على الخلوية والأنماط الخلوية داخل المبيض قبل الشيخوخة الإنجابية، وهو أمر حيوي لتطوير أساليب دوائية لتمديد العمر الإنجابي لدى النساء.

النتائج

scRNA-seq لمبيض الفأر البالغ عبر الأعمار الإنجابية

لتقييم التغيرات المرتبطة بالعمر في المبيض، جمعنا مبايض من فئران إناث تبلغ من العمر 3 و9 أشهر ( لكل مجموعة) وأجرينا scRNA-seq. تمثل الفترة من 3 إلى 9 أشهر الوقت الذي يحدث فيه أكبر انخفاض في احتياطي الجريبات وتبدأ علامات الشيخوخة الأخرى في الظهور . بعد تحليلات مراقبة الجودة، والترشيح وإزالة الخلايا المزدوجة، تبقى 14,504 خلية للتوصيف. تظهر توزيعات الخلايا لعدد الجينات المكتشفة، وعدد الجزيئات ونسبة الحمض النووي الميتوكوندري قبل وبعد الترشيح في الشكل التوضيحي 1a. تم استخدام معلمة ترشيح الحمض النووي الميتوكوندري لضمان تضمين البويضات، لأن هذه معروفة بوجود المزيد من الميتوكوندريا مقارنة بالخلايا الجسدية . بالإضافة إلى ذلك، فإن موت الخلايا المبرمج المعتمد على الميتوكوندريا مرتبط باستنفاد الجريبات وبالتالي قد يؤدي عتبة الترشيح المنخفضة إلى فقدان البويضات وخلايا الجريبات. في الواقع، أظهرت هذه المجموعات (CLUs) أعلى نسب mtDNA بين جميع CLUs المحددة (الشكل التوضيحي 1b). كشفت التحليلات غير المتحيزة والتقريب والتوقع الموحد (UMAP) عن 15 CLUs خلوية متميزة (الشكل 1a). كانت هناك مجموعة واحدة من CLU موجودة في عينة واحدة فقط وتم التعرف عليها لاحقًا على أنها تلوث من قناة البيض (الشكل التوضيحي 1c) وبالتالي تمت إزالة هذه الخلايا من التحليلات اللاحقة، مما ترك 14,349 خلية للتحليلات اللاحقة. لتعيين هوية نوع الخلية، استخدمنا علامات محددة لنوع الخلية تم الإبلاغ عنها سابقًا في الأدبيات.
بشكل جماعي، وُجد أن أكثر أنواع الخلايا شيوعًا هي الخلايا السدوية ( ), التي انقسمت إلى ثلاث CLUs. تم تمييز مجموعة سدوية واحدة، تُعرف باسم Stroma A، بوجود توقيع نسخي رئيسي لـ Col1a1 بالإضافة إلى علامات سدوية أخرى. تم تحديد CLU الثاني، Stroma B، من خلال تعبير عدة علامات سدوية (Bgn، Ogn، Dcn، Lum، Col1a1 (المرجع 26)). ومع ذلك، لم يكن لدى هذه المجموعة أي علامات حصرية كانت غنية بشكل كبير. تم تمييز مجموعة سدوية ثالثة، Stroma C، من خلال تعبير Notch3 (الشكل 1b)، والذي يُعتبر تقليديًا علامة على الخلايا المحيطية . وُجد أن ثاني أكثر أنواع الخلايا شيوعًا هي خلايا GCs ( ), التي انقسمت إلى مجموعتين متميزتين، كلاهما يظهر تعبيرًا عاليًا عن (الشكل 1b). تم تحديد مجموعات أخرى على أنها خلايا ثيكا (TCs؛ ; Srd5a1(المرجع 29))، البلعميات (مجموعتان متميزتان؛ ; C1qa(المرجع 30))
, الخلايا البطانية ( ; Cd34 (المرجع 31))، خلايا T اللمفاوية ( ; Cd3g (المرجع 32))، الخلايا الظهارية (مجموعتان متميزتان؛ ; Upk1b (المرجع 33) أو Gpm6a (المرجع 26))، البويضات ( ; Zp3 (المرجع 18))، خلايا الجسم الأصفر ( ; Ptgfr ) وخلايا B اللمفاوية ( ; Cd79a (المرجع 35)) (الشكل 1ب). تظهر الرسوم البيانية للميزات خصوصية هذه العلامات لكل CLU في الشكل التوضيحي 1د. جميع العلامات لكل CLU مدرجة في البيانات التكميلية 1.
تغيرت الخلوية المبيضية مع تقدم العمر في تحليلاتنا (الشكل 2أ، ب والشكل التكميلي 1هـ). كانت نسبة خلايا جراف أقل في المبايض التي تبلغ من العمر 9 أشهر، وهو ما يمكن تفسيره بانخفاض عدد الجريبات الأولية والثانوية، وانخفاض ملحوظ في الجريبات الثانوية التي لوحظت في الفئران المسنّة (الشكل 2ج-هـ). كان التغيير الأكثر وضوحًا في الخلوية المبيضية مع تقدم العمر هو الزيادة التي تزيد عن الضعف في خلايا المناعة (الشكل 2أ، ب والشكل التكميلي 1هـ).
في هذه الدراسة، على الرغم من عدم إجراء تصنيف دورة الشبق، استخدمنا نهجًا معلوماتيًا لتحديد مرحلة دورة الشبق لكل فأر في وقت القتل الرحيم. للقيام بذلك، قمنا في البداية بدمج بياناتنا مع بيانات النسخ الجيني أحادي الخلية من الفئران المصنفة حسب مرحلة دورة الشبق. أظهر هذا التقرير اختلافات كبيرة في النتائج النسخية على مستوى الخلية الواحدة داخل خلايا جريب المبيض عبر مراحل دورة الشبق، مع ملاحظة ميزات فريدة خلال كل من المرحلة السابقة للشبق ومرحلة الشبق. بعد الدمج، قمنا بعد ذلك بإنشاء مخططات UMAP لخلايا جريب المبيض من الفئران في كل مرحلة من مراحل دورة الشبق ولاحظنا تجمعات فريدة خلال كل من مرحلة الشبق والمرحلة السابقة للشبق، والتي أعادت تأكيد النتائج من موريس وآخرين. ثم أنشأنا مخططات UMAP للـ GCs من كل تكرار بيولوجي في دراستنا لتحديد ما إذا كانوا في مرحلة البروستروس أو الإستروس، والتي قد تؤثر على تفسير الأنماط التعبيرية المرتبطة بالعمر (الشكل التوضيحي 2a-d). وجدنا أن جميع الفئران الأربعة الصغيرة، وثلاثة من الفئران القديمة، كانوا في مرحلة الديستروس أو الميتستروس، والتي لا يمكن تمييزها من الناحية التعبيرية. تم العثور على فأر قديم واحد، العينة 5، في مرحلة البروستروس. ثم استخدمنا قائمة النسخ، كما أبلغ عنها موريس وآخرون. (البيانات التكميلية 1) لتكون مرتفعة خلال مرحلة البروستروس داخل خلايا جراف، لتوليد درجة وحدة لكل عينة، مما مكننا من تأكيد أن العينة 5 كانت في مرحلة البروستروس. يتم تقديم هذه البيانات في مخططات الكمان في الشكل التكميلية 2e. كما قمنا بإجراء تحليل المكونات الرئيسية للجينات المعبر عنها بشكل مختلف مع العمر في عيناتنا ولاحظنا أن التجميع القابل للتفريق الوحيد كان وفقًا للعمر (الشكل التكميلية 2f). يتم مناقشة تقييم التأثير المحتمل لعينة البروستروس على التغيرات الظاهرية المرتبطة بالعمر في خلايا جراف لاحقًا في المخطوطة بعد تحليلات تحت المجموعة (SCL)، على الرغم من عدم ملاحظة تغييرات كبيرة.
لإجراء تقييم لشبكات الإشارات بين الخلايا، تم إجراء تحليلات CellChat. حدثت التغيرات الأكثر بروزًا في إشارات الخلايا بين خلايا الجرانولوزا، والستروما A، والظهارة، مع زيادة عامة في عدد التفاعلات (الشكل التكميلي 3a) وأوزان التفاعلات (الشكل التكميلي 3b) من 3 إلى 9 أشهر من العمر. ومع ذلك، لم يكن هناك انهيار كامل في التواصل بين الخلايا مع التقدم في العمر.

تغيرات خلايا المناعة المبيضية مع التقدم في العمر

بعد ملاحظة الزيادة في نسبة خلايا المناعة داخل المبيض المسن، قمنا بإجراء تقسيم فرعي لخلايا المناعة لتحديد أي الفئات المحددة قد تغيرت مع التقدم في العمر (الشكل 3أ). بعد إعادة التجميع، انفصلت مجموعات خلايا المناعة الأصلية إلى 13 مجموعة فرعية (الشكل 3ب). تم تحديد نوع الخلايا لكل مجموعة فرعية بناءً على ملفات التعبير الجيني المعروفة، وبمساعدة قواعد البيانات Cellmarker2.0 (المرجع 36) وImmGen. ، مع الجينات التمثيلية الموضحة في الشكل 3c. جميع العلامات الخاصة بـ SCLs المناعية مدرجة في البيانات التكميلية 1. نظرًا لأن النسبة الإجمالية لخلايا المناعة تضاعفت من 3 إلى 9 أشهر من العمر، تم تقييم النسب المئوية للخلايا الكلية في كل SCL ومقارنتها حسب العمر. ومن المثير للاهتمام أن أنواع الخلايا التي أظهرت أكبر زيادة مع تقدم العمر كانت الخلايا اللمفاوية، بما في ذلك خلايا B، وخلايا T التقليدية، وخلايا T الشبيهة بالفطرية. كانت أكبر اختلاف في
الشكل 1| تسلسل RNA أحادي الخلية لمبيض الفأر. تم جمع نسيج المبيض الكامل من فئران C57BL/6 J بعمر 3 و9 أشهر ومعالجته لتسلسل RNA أحادي الخلية 3′ باستخدام تقنية 10X Genomics. أ، رسم UMAP لخلايا المبيض المجمعة حسب العمر. تحليل التجميع
كشفت عن 15 مجموعة خلوية مميزة من المبيض. ب، مخططات الكمان لجينات العلامة المحددة لكل نوع من خلايا المبيض. تم إجراء تسلسل RNA أحادي الخلية في المبايض حسب الفئة العمرية.
الشكل 2 | التغيرات المرتبطة بالعمر في تجمعات خلايا المبيض. أ، أعداد ونسب الخلايا في فئات واسعة من هوية نوع الخلية، حسب العمر. ب، رسم بياني UMAP لخلايا المبيض، حسب العمر (ترميز الألوان كما في أ). ج، صور تمثيلية لمبايض ملونة بصبغة H&E. تم تكرار صبغ H&E وعدّ الجريبات لكل تكرار بيولوجي. شريط القياس، . د، الأعداد المقدرة للجريبات في المبايض التي تبلغ من العمر 3 و9 أشهر. هـ، صور تمثيلية للجريبات الملونة بصبغة H&E. الأسهم
الوفرة مع العمر كانت في SCL تحتوي على خلايا لمفاوية من النوع 1، كما هو محدد من خلال التعبير عن (مرجع 38) و Ifng. من المحتمل أن تشمل هذه الخلايا، بالإضافة إلى أنواع أخرى من خلايا T الشبيهة بالفطر من النوع 1 مثل خلايا T القاتلة الطبيعية (خلايا NKT) وخلايا T المرتبطة بالغشاء المخاطي (خلايا MAIT) و/أو خلايا T الخلايا التائية). كان هناك نوع آخر من الخلايا اللمفاوية (SCL) الذي زاد بشكل ملحوظ مع التقدم في العمر يحتوي على خلايا لمفاوية من النوع 17، كما تم تعريفه من خلال تعبير Rorc. ، والتي تمثل عادة السلالة الفطرية والتعبير عن Zbtb16 (المراجع 40، 41). على الرغم من أن البيانات النسخية لا يمكن أن تميز بشكل أكبر داخل هذا SCL، إلا أنها تشمل على الأرجح خلايا NKT من النوع 17، وخلايا MAIT، خلايا T و/أو خلايا اللمفويات الفطرية من النوع 3 (ILC3)، والتي تم تأكيدها لاحقًا بواسطة تحليل تدفق الخلايا. أخيرًا، نسبة تم أيضًا زيادة الخلايا داخل المبيض المسن (الشكل 3d). يجب ملاحظة أنه، بسبب قيود النسخ الجيني على مستوى الخلية الواحدة، قد تحتوي أيضًا على خلايا T تقليدية أخرى ضمن SCL. على العكس من ذلك، لم تتغير خلايا القاتل الطبيعي (NK) أو خلايا ILC2 بشكل ملحوظ مع التقدم في العمر. كانت هناك اتجاهات نحو زيادة نسبة البلعميات النسيجية والوحيدات في المبيض المسن، لكنها لم تصل إلى دلالة إحصائية (الشكل 3d). تم تحديد SCL واحد، الذي كان موجودًا فقط في المبايض المسنّة، على أنه وحيدات تعبر عن CD300e، الذي ينظم سلبًا تنشيط خلايا T. . هذه CD300e قد تمثل الخلايا الوحيدة آلية تعويضية للتعامل مع تراكم خلايا T. ومع ذلك، قد تمثل هذه SCL أيضًا تلوثًا من الخلايا الوحيدة في الدم بسبب عدم اكتمال التروية. هناك حاجة لمزيد من التحقيق في هذه المجموعة الخلوية الفريدة. ومن المثير للاهتمام، أنه على الرغم من وجود ملف تعبير يشبه المناعة، لم تُظهر اثنتان من SCLs المناعية أي تعبير عن Ptprc، الجين الذي يشفر CD45 – الأكثر.
علامة خلوية مناعية راسخة. تم تحديد هذين SCLs على أنهما
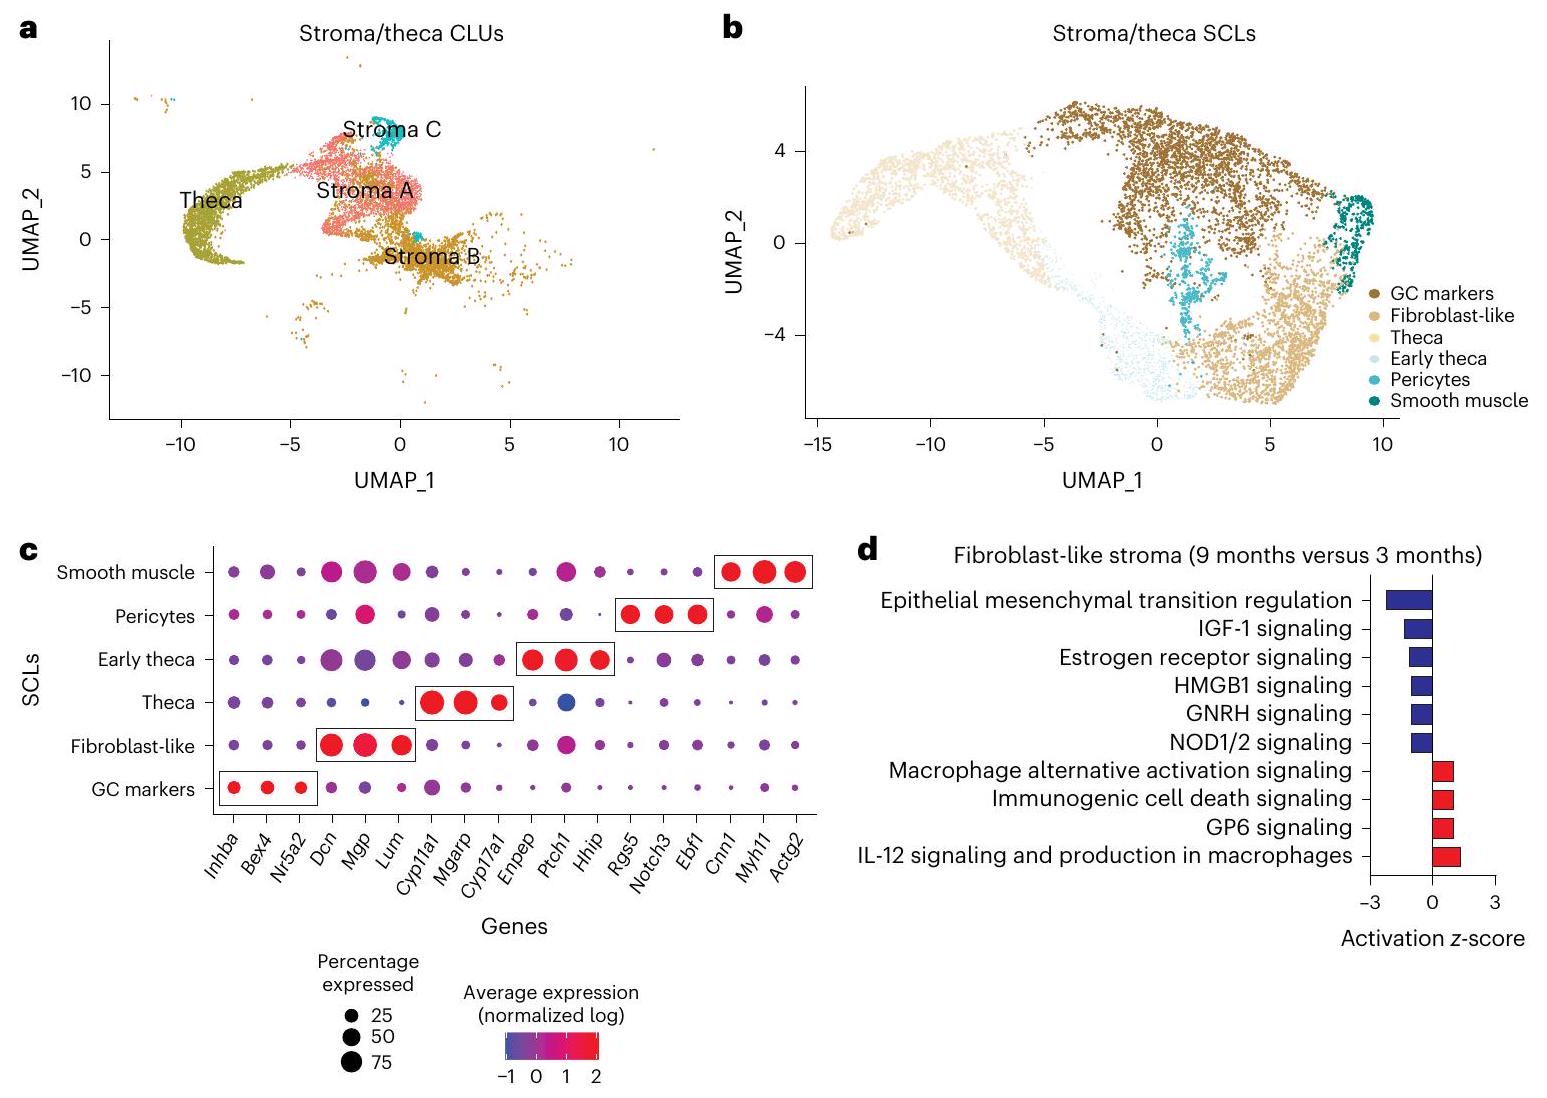
 خلايا شبيهة بالمناعة A و B.
لتأكيد نتائجنا المتعلقة بتراكم خلايا المناعة في المبيض، قمنا بإجراء تحليل تدفق خلوي عالي الأبعاد لتحديد الفروقات المرتبطة بالعمر في نسبة أنواع خلايا المناعة المتميزة داخل المبيض. قمنا أولاً بتقييم النسبة والعدد الإجمالي لأنواع خلايا المناعة المحددة بشكل عام، بما في ذلك خلايا B (CD19 الخلايا التائية والخلايا اللمفاوية الفطرية ) وخلايا النخاع الشوكي ( ). لقد لاحظنا نسبة وعدد أعلى من الخلايا (خلايا T والخلايا اللمفاوية الفطرية) في المبايض المسنّة (الشكل 3e، f والشكل التكميلي 4a)، وهو ما يتماشى مع نتائج تسلسل RNA أحادي الخلية. ومع ذلك، لم نلاحظ تغييرات في النسبة أو عدد الخلايا النخاعية أو خلايا B (الشكل 3e، f والشكل التكميلي 4a). على الرغم من أن عدم وجود تغيير في الخلايا النخاعية كان متسقًا مع بيانات تسلسل RNA أحادي الخلية، إلا أن خلايا B كانت غير متوافقة. نسبة تم العثور على زيادة في الخلايا مع التقدم في العمر من خلال تحليلات scRNA-seq، على الرغم من أن هذا لم يتم تأكيده بواسطة قياس التدفق الخلوي. أظهرت تصور UMAP لبيانات قياس التدفق الخلوي تغييرات كبيرة في تحت مجموعات خلايا المناعة داخل المبيض المتقدم في العمر (الشكل 4a). ثم قمنا بمزيد من التوصيف لـ السكان ولاحظت زيادة في نسبة الخلايا، ‘سلبي مزدوج خلايا T (DNs)، خلايا MAIT، خلايا NKT و تس وانخفاض في خلايا T والخلايا اللمفاوية الفطرية في المبايض المسنّة (الشكل 4ب والشكل التكميلي 4ب). لمقارنة هذه النتائج مع تجميع scRNA-seq، قمنا بتحليل الخلايا بناءً على تعبير عوامل النسخ المحددة لنوع الفاعل لخلايا اللمفوية من النوع 17 (ROR ) وخلايا النوع 1 (T-BET) (الشكل التكميلي
الشكل 4ج). تم تأكيد الزيادة في خلايا اللمفوية من النوع 1 التي لوحظت مع scRNAseq بواسطة قياس التدفق، وتم تحديد أن الزيادة كانت مدفوعة بخلايا NKT من النوع 1، بينما انخفضت نسب خلايا 1DN و T مع التقدم في العمر (الشكل 4ج، د). زادت جميع الفئات الفرعية ROR T بشكل متناسب مع التقدم في العمر (DN، NKT، ) على الرغم من أن أكبر حجم للتغيير حدث في نوع Ts (الشكل 4ج، د). على الرغم من أن بيانات scRNA-seq اقترحت وجود فئات فرعية ILC2 – ولكن ليس ILC1، فإن بيانات قياس التدفق حددت كل من ILC1s (T-BET ) وILC2s (GATA3 ). أشارت بيانات قياس التدفق إلى انخفاض في نسب ILC1 مع تقدم العمر (الشكل 4هـ، و). لتحديد التأثير المحتمل لمرحلة دورة الشبق على التغيرات المرتبطة بالعمر في تجمعات خلايا المناعة في المبايض، قمنا بإجراء علم الخلايا المهبلية على الفئران قبل القتل الرحيم وتحليلات قياس التدفق في المبايض. ثم قمنا برسم متوسط شدة الفلورسنت لجميع العلامات التي تم تقييمها في كل عينة مبيض، بالإضافة إلى تحديد مرحلة دورة الشبق للفئران. وجدنا أن العينات تجمعت حسب العمر، بغض النظر عن مرحلة دورة الشبق (الشكل التكميلي 4د)، مما يشير إلى أن مرحلة دورة الشبق ليست مساهمًا رئيسيًا في التغيرات المرتبطة بالعمر في تراكم خلايا المناعة.
بالإضافة إلى الزيادة العامة في خلايا المناعة داخل المبيض المسن، لاحظت التقارير السابقة أيضًا تراكم MNGCs كعلامة بارزة لشيخوخة المبايض . على الرغم من أنه تم بالتأكيد إزالة MNGCs من تعليقاتنا الخلوية الفردية أثناء الترشيح، إلا أننا تمكنا من ملاحظتها في المبايض التي تبلغ من العمر 9 أشهر من خلال التقييم النسيجي. مشابهة للتقارير السابقة ، لاحظنا MNGCs في المبيض المسن (الشكل التكميلي 5أ)، حيث يتوافق وجودها مع زيادة في إيجابية الليبوفوسين (الشكل التكميلي 5ب)، والتي تم الإبلاغ عنها كعلامة للشيخوخة الخلوية . ومع ذلك، يجب ملاحظة أن إيجابية الليبوفوسين ترتبط ارتباطًا وثيقًا بزيادة الأعداد وحجم MNGCs، والتي قد لا تكون في الواقع شيخوخة خلوية كما تم تعريفها تقليديًا. نظرًا لزيادة عدد خلايا المناعة في المبيض المسن التي تعبر بشكل طبيعي عن الجينات المرتبطة بالشيخوخة (الشكل التكميلي 6أ، ب)، يبدو من المحتمل أن ‘شيخوخة الخلايا المبيضية’ قبل انقطاع الطمث قد تمثل زيادة في تراكم خلايا المناعة. ومع ذلك، يجب ملاحظة أن تعبير Cdkn1a وCdkn2d زاد في خلايا اللمفوية من النوع 17 (الشكل التكميلي 6ب-د) مع تقدم العمر، مما قد يمثل فئة فرعية صغيرة من الخلايا التي تدخل في الشيخوخة الخلوية في المبيض.
تمت ملاحظة عدة تغييرات في الستروما مع شيخوخة المبايض وتظهر قبل استنفاد الجريبات، بما في ذلك توقيعات الشيخوخة الخلوية وترسب الكولاجين . لتحديد الوسائط الخلوية والجزيئية المحتملة لهذه الأنماط، قمنا بإجراء التجميع الفرعي للستروما وTC CLUs (الشكل 5أ، ب). تم تضمين TCs مع الستروما لأنها تتمايز ديناميكيًا من خلايا الستروما الليفية خلال نضوج الجريبات وبالتالي تشترك في أوجه التشابه مع خلايا الستروما . أدى هذا التجميع الفرعي إلى ستة SCLs متميزة (الشكل 5ب). تم استخدام العلامات الغنية في كل SCL لاستنتاج نوع الخلايا المحددة (الشكل 5ج). من الجدير بالذكر أن هناك SCL تعبر عن Inhba ، وهو علامة لـ GCs، كانت متميزة وبالتالي يمكن فصلها بسهولة عن الستروما الأخرى وSCLs TC. تم تحديد SCL العضلات الملساء من خلال تعبير Myh11 (المراجع 46، 47)، Actg2 (المراجع 26) وCnn1 (المراجع 48). كانت SCL الخلايا المحيطية غنية بـ Notch3 وRgs5 وEbf1 (المراجع 26). كانت SCL الشبيهة بالخلايا الليفية غنية بـ Dcn وMgp وLum بينما أظهرت SCL TC تعبيرًا عاليًا عن الجينات الستيرويدية (Cyp11a1 وCyp17a1 (المراجع 36) وMgarp ). أظهرت SCL TC المبكرة أيضًا مستويات عالية
من الجينات الستيرويدية بما في ذلك Ptch1 وHhip ، بالإضافة إلى تعبير عالي عن جين ليفي (Enpp2 (المراجع 42))، مما يشير إلى أن هذه الخلايا في انتقال من خلايا ليفية شبيهة بالستروما إلى TCs. جميع العلامات لكل SCL ستروما مدرجة في البيانات التكملية 1.
بعد تحديد SCL، تم استيراد قائمة الجينات المعبر عنها بشكل مختلف حسب الأعمار في كل SCL إلى برنامج تحليل مسار الإبداع (IPA) لاستنتاج الوظيفة البيولوجية. أظهرت خلايا الستروما الشبيهة بالخلايا الليفية زيادة مرتبطة بالعمر في تنظيم المسارات المتعلقة بإعادة تشكيل الأنسجة (الشكل 5د). تحدث إعادة تشكيل الأنسجة بعد الإباضة وفي حالات استنفاد الجريبات والجسم الأصفر . لدهشتنا، لم يتغير تعبير الكولاجين مع تقدم العمر في SCL الشبيهة بالخلايا الليفية في المبايض (الشكل 6أ) على الرغم من زيادة ترسب الكولاجين بحلول 9 أشهر من العمر (الشكل 6ب). من المثير للاهتمام، تم تقليل مسار الكولاجيناز في SCL الشبيهة بالخلايا الليفية (الشكل 6ج). كشفت التحليلات الإضافية أن تعبير ميتالوبروتيناز المصفوفة 2 (Mmp2)، وهو إنزيم رئيسي يشارك في تحلل الكولاجين ، قد انخفض في SCL الشبيهة بالخلايا الليفية مع تقدم العمر (الشكل 6د). كما لاحظنا انخفاضًا مرتبطًا بالعمر في بروتين MMP2 في الستروما المبيضية بواسطة المناعية الفلورية (الشكل 6هـ، و). تشير هذه النتائج إلى أن تراكم الكولاجين في المبايض يتم على الأقل جزئيًا من خلال تقليل تحلل الكولاجين، مما يدعم نتائجنا النسخية. كما أظهرت الخلايا الشبيهة بالخلايا الليفية انخفاضًا في الإشارات الهرمونية (مستقبلات الاستروجين وهرمون الإفراز الجونادي؛ الشكل 5د)، وهو أمر مفاجئ بعض الشيء نظرًا لأن مستويات الهرمونات، ودورات الشبق، والخصوبة عادة ما تكون مستقرة عند 9 أشهر من العمر . تشير هذه النتائج إلى أن التغيرات في البيئة الدقيقة المحلية قد تساهم في خلل الغدد الصماء في الستروما المبيضية بشكل مستقل عن التغيرات داخل الجريبات. ومع ذلك، أظهرت الخلايا الشبيهة بالخلايا الليفية انخفاضًا في المنظمين العلويين المرتبطين بالالتهاب والتليف (الشكل 6ج)، مما قد يكون استجابة تعويضية لزيادة الإشارات المؤيدة للالتهاب والتليف من أنواع خلايا أخرى، فضلاً عن تراكم خلايا المناعة. في أنسجة أخرى، من المعروف أن الخلايا الليفية تلعب أدوارًا مثبطة للمناعة في تنظيم الالتهاب المزمن . على النقيض من الخلايا الشبيهة بالخلايا الليفية، أظهرت TCs زيادة ملحوظة في عدة منظمين علويين لتكوين الألياف بما في ذلك TGFB1 وTGFB2 وSMAD3 (الشكل 6ج)، مما يشير إلى أن هذه قد تكون واحدة من أولى أنواع الخلايا المشاركة في توليد سلسلة الإشارات لإنتاج الكولاجين وترسبه.
على النقيض من الخلايا الشبيهة بالخلايا الليفية، أظهرت TCs زيادة ملحوظة في عدة منظمين علويين لتكوين الألياف بما في ذلك TGFB1 وTGFB2 وSMAD3 (الشكل 6ج)، مما يشير إلى أن هذه قد تكون واحدة من أولى أنواع الخلايا المشاركة في توليد سلسلة الإشارات لإنتاج الكولاجين وترسبه. عند النظر إلى TGF التواصل بين الخلايا بين CLUs الأصلية، نلاحظ أن TCs تشير إلى عدة أنواع من الخلايا في المبيض الشاب (الشكل 6ز)، وهو ما كان متوقعًا، نظرًا لدورها المهم في التواصل بين الخلايا داخل الجريبات . على النقيض من ذلك، أصبح إشارات TGF في TCs من المبايض المسنّة حصريًا لخلايا المناعة (الشكل 6ح). تم ربط إشارات TGF سابقًا بتنظيم الكيمياء، والتفعيل، وبقاء اللمفاويات ، مما قد يفسر اكتشافنا لزيادة تراكم اللمفاويات في المبيض المسن. بالإضافة إلى ذلك، أظهر CLU Granulosa B إشارات TGF فقط في المبيض القديم (الشكل 6ز، ح). تشير هذه البيانات إلى أن التفاعلات بين خلايا الجريبات المبيضية وخلايا المناعة ربما تكون مهمة لاستمرار إشارات التليف مع التقدم في العمر. كما أظهرت TCs زيادة معتدلة مرتبطة بالعمر في الالتهاب ومسارات استجابة الإجهاد الخلوي (الشكل 6ط)، والتي تم عكسها بواسطة المنظمين العلويين المشاركين في تكاثر الخلايا بما في ذلك MTOR وYAP1 وRB1 (الشكل 6ي).
الشكل 4 | تتغير تجمعات اللمفاويات في المبيض المسن. أ، UMAP لجدول تدفق السيتومتر للخلايا اللمفاوية، موضح باستخدام استراتيجيات تصنيف تقليدية. تم تطبيع عدد الخلايا المرسومة لملاحظة الفروق في توزيع التجمعات بشكل أفضل. ب، نسبة تحت تجمعات خلايا T من خلايا الدم النخاعية في الأنسجة. ج، نسبة خلايا T من النوعين 1 و 17 من خلايا الدم النخاعية في الأنسجة. د، تصنيف تمثيلي لخلايا اللمفاويات من النوعين 1 و 17 في المبايض الشابة والمسنّة. هـ، نسب ICL1 و ILC2 من الأنسجة.
خلايا الدم الجذعية. تمثيل البوابات الخلوية للخلايا اللمفاوية الفطرية في المبايض الشابة والقديمة. بالنسبة لتقنية تحليل التدفق الخلوي، تم تجميع ستة مبايض من الفئران في مرحلة دورة الشبق. حسب الفئة العمرية). البيانات مقدمة كمتوسط س.م. *FDR < 0.05، **FDR = 0.01، ***FDR = 0.005 بواسطة اختبار ثنائي الطرف المتعدد -اختبار مع تصحيح بنجاميني وكريجر ويكوتيلي للمقارنات المتعددة. دقيق القيم موضحة في بيانات المصدر.

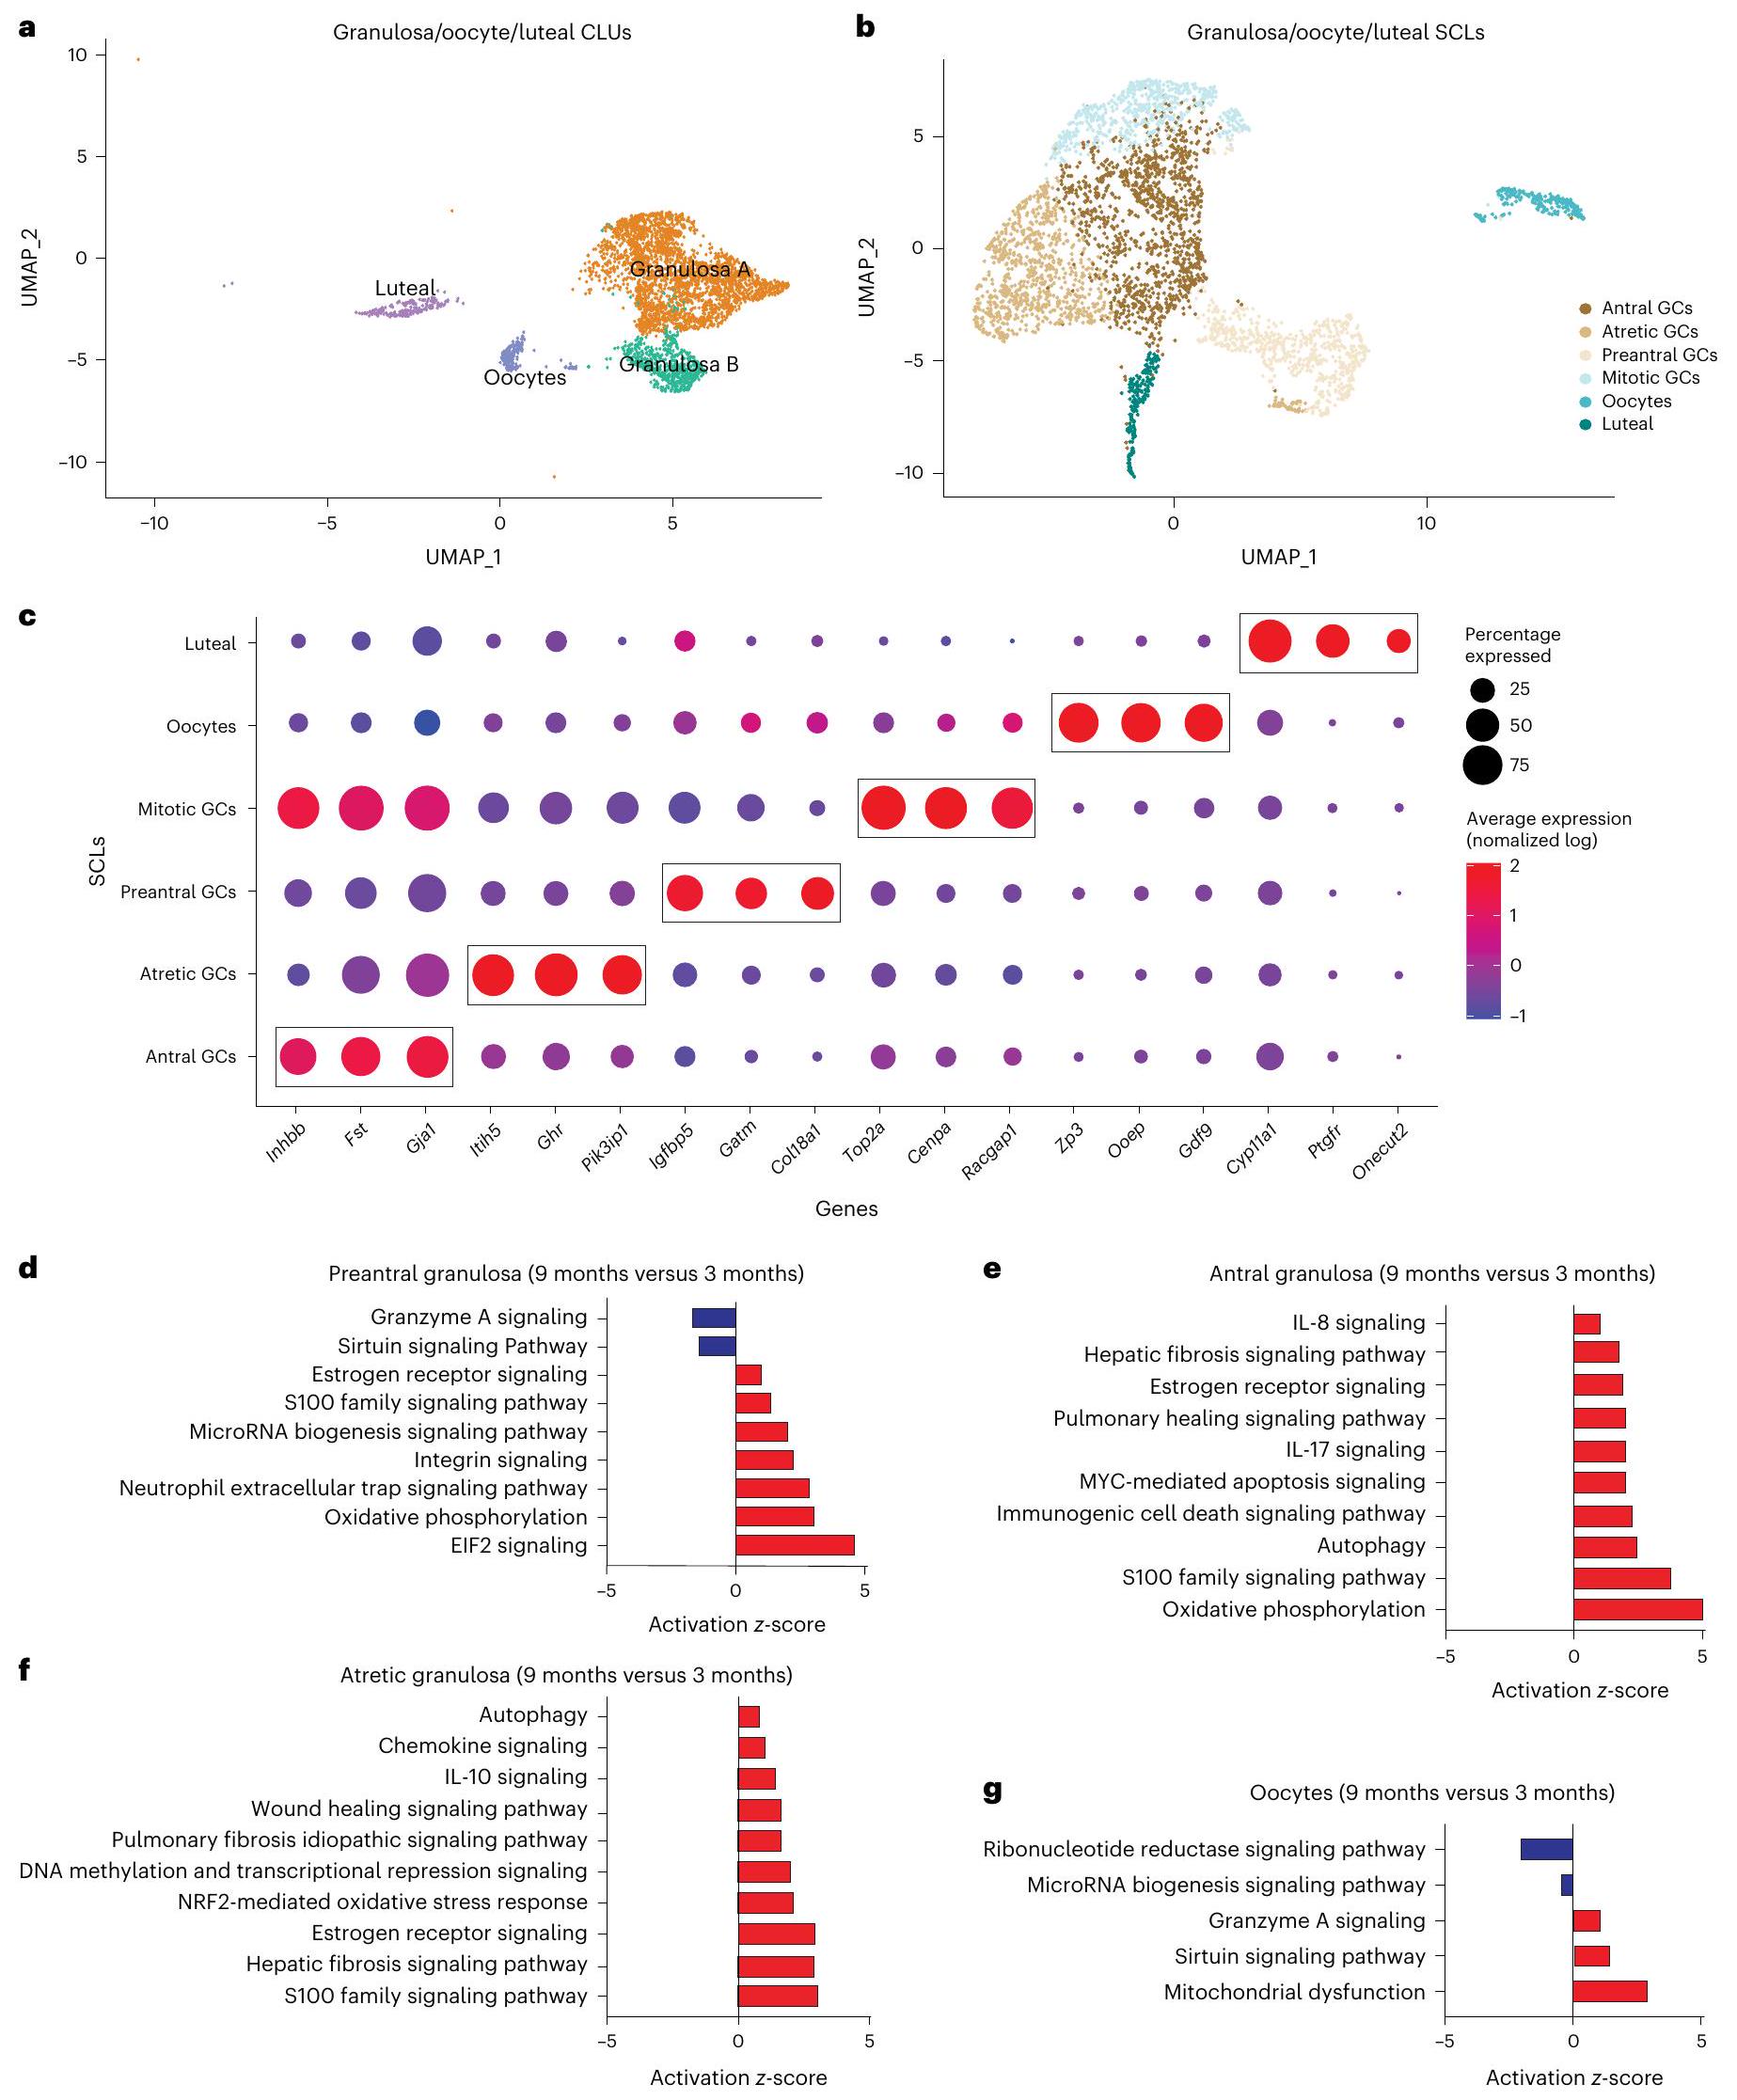
يؤثر الشيخوخة على خلايا SCL في الخلايا الحبيبية، البويضات، والخلايا اللوتينية

تم تقسيم تجمعات الخلايا من خلايا جراف، البويضات، والخلايا الجسم الأصفر إلى ستة مجموعات فرعية متميزة (الشكل 7 أ-ج). تم فصل خلايا جراف بشكل أكبر إلى
أربعة أنواع متميزة من خلايا سكل (SCLs) تم تحديدها كجزء من الجريبات في مراحل مختلفة من التطور. شملت هذه الخلايا سكل ما قبل الأنيترال، الأنيترال، الانقسام، والجريبات المتراجعة. تقوم خلايا الجريبات بإرسال إشارات إلى البويضات لتوفير إشارات.
الشكل 5 | تقسيم فرعي للستروما والخلايا التائية. أ، UMAP للستروما وCLUs للخلايا التائية المستخدمة في التقسيم الفرعي. ب، UMAP للستروما وSCLs للخلايا التائية. ج، رسم نقطي للعلامات المستخدمة لتحديد نوع خلايا SCL. د، مسارات IPA الكلاسيكية التي تشير إلى تنشيط أو تثبيط مسارات معينة بسبب الشيخوخة في خلايا الفيبروبلاست الشبيهة بالستروما. تم إجراء تسلسل RNA أحادي الخلية في المبايض حسب الفئة العمرية.
مرتبط بالبيئة الميكروية المبيضية المحلية، بالإضافة إلى تحويل الأندروجينات إلى استروجينات، التي يتم إطلاقها في الدورة الدموية النظامية للإشارة الراجعة في الدماغ. تُعرف خلايا جرانولوزا من الجريبات غير الناضجة التي لم تتطور بعد إلى تجويف بأنها خلايا جرانولوزا ما قبل التجويف وتم التعرف عليها من خلال الزيادة في Igfbp5 (المرجع 58) وGatm. التعبير. تم تحديد خلايا جرانولوزا من الجريبات الجانبية (خلايا جرانولوزا الجانبية) من خلال زيادة Inhbb GC SCL منفصل، الذي نشير إليه باسم GCs الانقسامية، تم التعبير عنه بالمثل مع خلايا جريب الأنيب، ولكن أظهرت تعبيرًا غنيًا بعلامات انقسام الخلايا Top2a (المرجع 62) و Racgap1 (المرجع 63). أخيرًا، وُجد أن خلايا الجريب من الجريبات التي تمر بعملية الانحلال كانت غنية بـ Pik31p1 (المراجع 26، 64) و Itih5 (المرجع 26) و Ghr. تم التعرف على البويضات بسهولة من خلال التعبير عن العلامات الكلاسيكية Gdf9 وOoep وZp3 (المرجع 18). تتكون خلايا الجسم الأصفر من بقايا خلايا جراف وخلايا ثانوية بعد الإباضة وتشكل الجسم الأصفر. تم التعرف عليهم من خلال تعبير Ptgfr يمكن العثور على جميع العلامات لكل GCSCL في البيانات التكميلية 1.
كما تم الإشارة إليه أعلاه، تم فحص الجينات المعبر عنها بشكل مختلف من كل SCL باستخدام برنامج IPA لاستنتاج الوظيفة البيولوجية. ومن المثير للاهتمام أن خلايا جرانولوزا قبل الجريب، والجريب، والجريب المتراجع أظهرت جميعها زيادة مرتبطة بالعمر في المسارات المتعلقة بالإجهاد الالتهابي والبروتينات الليفية. تتوافق هذه الملاحظات مع زيادة كبيرة في مسار خلل الميتوكوندريا داخل البويضات. تم العثور على منظمات علوية مرتبطة بالإجهاد الالتهابي والتي زادت في GCSCL بما في ذلك IFNG وTNF وIL15 وIL1A. بالإضافة إلى ذلك، تم العثور على منظمات علوية مرتبطة بالبروتينات الليفية التي زادت في GC SCL بما في ذلك TGFB1 وTGF-beta وSMAD3. كما هو متوقع، كانت GCSCL المتراجعة غنية بالتغيرات في مسارات الإجهاد الالتهابي والتليف، حيث كانت الفئران التي تبلغ من العمر 9 أشهر تظهر تنشيطًا أكبر لهذه المسارات مقارنة بالفئران التي تبلغ من العمر 3 أشهر. لذلك، يبدو أن الشيخوخة تفاقم الاستجابات الالتهابية والتليفية المطلوبة لإعادة تشكيل المبيض بعد الإباضة وتراجع الجريبات.
قمنا أيضًا بدراسة إشارات كيموكين ligand (CCL) بين الخلايا بسبب دورها في هجرة الخلايا المناعية والكيميائية. وجدنا أنه بحلول 9 أشهر من العمر، كانت خلايا CLU الحبيبية تعبر عن جزيئات إشارات CCL، وهو ما لم يُلاحظ في الفئران التي تبلغ من العمر 3 أشهر (الشكل التوضيحي 7b، c). في عمر 9 أشهر، كانت إشارات GCCCL حصرية لخلية A CLU البلعومية. وهذا يشير إلى أن الإشارات الالتهابية من الجريب قد تساهم في التغيرات في أنماط خلايا المناعة كوظيفة للعمر. ومن المثير للاهتمام، أنه كان هناك انهيار في مسار إشارات هرمون مضاد المولر بين البويضات وخلايا الجريب الأخرى بحلول 9 أشهر من العمر (الشكل التوضيحي 7d، e). يعتبر مسار هرمون مضاد المولر حاسمًا لتنظيم نضوج الجريب. وغالبًا ما يُستخدم كعلامة على احتياطي الجريبات لذا فإن هذا الانهيار في الإشارات يدل على تغييرات مبكرة قد تؤثر على النتائج الإنجابية.
نظرًا لأنه تم الإبلاغ عن تغييرات في التعبير الجيني خلال مرحلة البروستروس، بالإضافة إلى أن أحد الفئران البالغة من العمر 9 أشهر (العينة 5) التي تم تحليلها هنا كانت في مرحلة البروستروس، قمنا بإجراء تحليلات إضافية للتأكد من أن مرحلة دورة الشبق لم تؤثر على تفسيراتنا المتعلقة بالعمر. في هذا التحليل، قمنا بإزالة تلك الجينات التي وُجد أنها معبرة بشكل مختلف في كل من البروستروس. وتقدم الشيخوخة في خلايا جرانولوزا SCLs، وأعدنا تحليل المسارات. لم يؤثر إزالة هذه الجينات على التغيرات المرتبطة بالعمر في خلايا GCs. كتحقق ثانوي، قمنا بعد ذلك بإزالة العينة 5 تمامًا، وأعدنا تحليل المسار ووجدنا أن النتائج المرتبطة بالعمر لم تتغير (الشكل التوضيحي 7f). توفر هذه الملاحظات دليلًا إضافيًا على أن تفسيراتنا المتعلقة بالآليات التي تعزز شيخوخة المبيض غير متأثرة بمرحلة دورة الشبق.

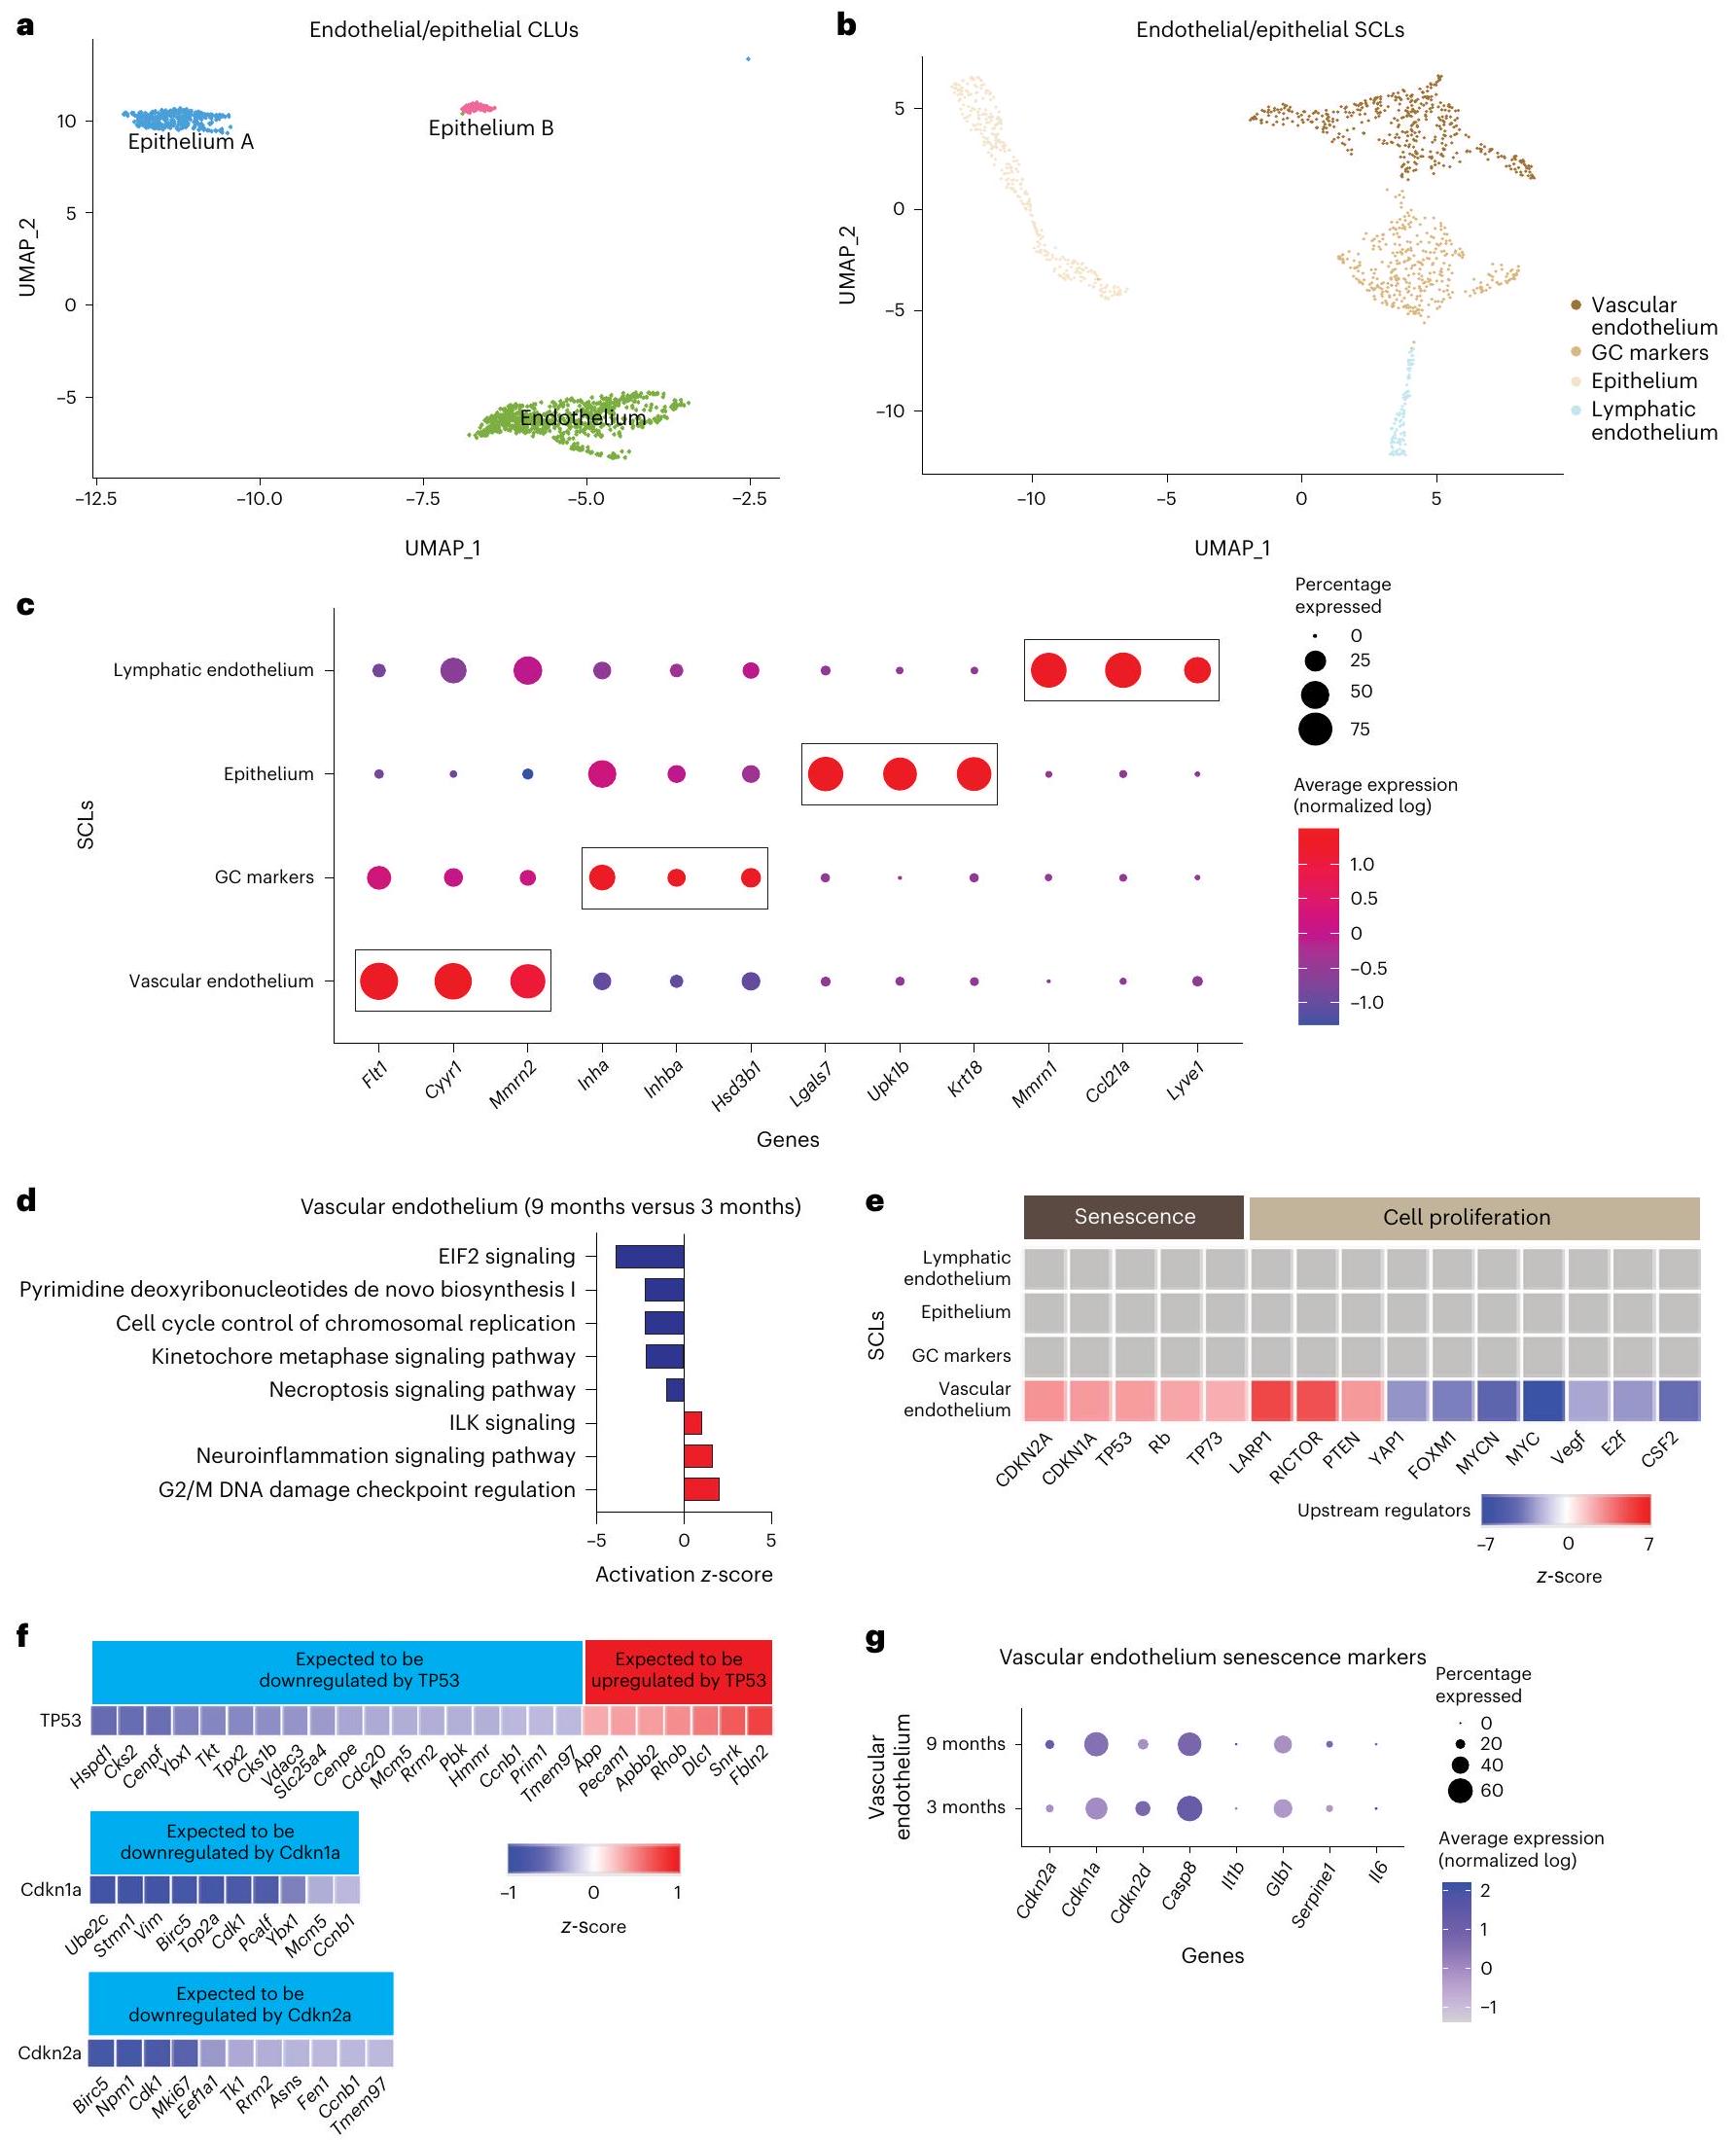
تتأثر خلايا البطانية والظهارية بشكل طفيف بالعمر

الخلايا البطانية هي مكونات أساسية في الأوعية الدموية واللمفاوية. المبيض هو عضو ذو تروية دموية عالية، حيث تسير الأوعية الدموية عبر الأنسجة الضامة للمساعدة في الهرمونات/المغذيات.
الاتجار وإزالة النفايات المبيض يحتوي أيضًا على شبكة ليمفاوية غنية، مرتبطة ارتباطًا وثيقًا بالأوعية الدموية، والتي تشارك في نقل خلايا المناعة. تتكون الخلايا الظهارية من سطح المبيض، وتساعد في الإصلاح بعد الإباضة وتتوسع وتنكمش ديناميكيًا خلال التغيرات الدورية في المبيض. بالإضافة إلى ذلك، تشترك الخلايا الظهارية في سلف مشترك مع خلايا غرانولوزا. تم تقسيم وحدات الخلايا الظهارية والبطانية إلى مجموعات فرعية (الشكل 8أ)، مما أسفر عن أربعة مجموعات فرعية متميزة (الشكل 8ب). تم فصل وتحديد الأوعية الدموية واللمفاوية من خلال إثراء علامات خلوية محددة (الشكل 8ج). أظهرت خلايا الأوعية الدموية البطانية إثراءً في Flt1 (المرجع 72) وMmrn2 (المرجع 73) بينما كانت خلايا الأوعية اللمفاوية البطانية غنية بتعبير Lyve1 (المرجع 74). جميع العلامات لكل مجموعة فرعية من الخلايا البطانية/الظهارية مدرجة في البيانات التكميلية 1.
مماثل للنتائج في SCLs السدى/التيكا، وُجد أن أحد SCLs البطانية/الظهارية كان غنيًا بعلامات GC وتم إزالته من التحليلات اللاحقة؛ لم تُلاحظ أي اختلافات في العمر في هذا SCL GC. SCL الوحيد البطاني/الظهاري الذي أظهر تغييرات مرتبطة بالعمر في تحليلات المسار كان البطانة الوعائية؛ وُجد أن هذا SCL قد زاد بشكل معتدل في تنظيم تلف الحمض النووي (الشكل 8d). كانت ملاحظة أخرى مثيرة للاهتمام هي أن المنظمات العليا للشيخوخة الخلوية (TP53، CDKN1A وCDKN2A) وُجد أنها زادت مع التقدم في العمر في خلايا البطانة الوعائية (الشكل 8e). أظهرت التحليلات الإضافية للجينات التي تتبع TP53 وCDKN1A وCDKN2A أنها تغيرت في الاتجاه، بما يتماشى مع تنشيط هذه المنظمات العليا (الشكل 8f). هذا يتماشى مع الدراسات التي تشير إلى أن خلايا البطانة الوعائية عرضة للغاية لأن تصبح شيخوخة. في المبيض، تتطلب الدورة التغير المستمر في الأوعية الدموية. , والتي نعتقد أنها قد تعزز الشيخوخة في خلايا البطانة الوعائية. ومع ذلك، على الرغم من ملاحظة زيادة نشاط المنظمين العلويين TP53 وCDKN1A وCDKN2A في البطانة الوعائية SCL، لم يتأثر تعبير Cdkn1a وCdkn2a بالتقدم في العمر (الشكل 8g) بينما لم يتم الكشف عن Tp53 في تحليل scRNA-seq الخاص بنا. لذلك، لا يزال غير واضح ما إذا كانت البطانة الوعائية هي مصدر للخلايا الشيخوخة في المبيض المسن.

نقاش

في هذا التقرير، قمنا بتقييم التغيرات المرتبطة بالعمر في النسخ الجيني للمبيض في الفئران بدقة خلوية فردية. خلال الشيخوخة، تنخفض احتياطات الجريبات المبيضية ويحدث تدهور متزامن في البيئة المبيضية كما يتضح من زيادة الالتهاب والتليف. من المهم أن تحدث هذه التغيرات قبل استنفاد الجريبات ومن المحتمل أن تسهم في انخفاض جودة البويضات وانخفاض النجاح الإنجابي حتى يحدث نقص المبيض. ومع ذلك، لم يتم توضيح المساهمات الخلوية المحددة في أنماط الشيخوخة المبيضية بعد، مما يحد من تطوير أساليب تدخلية لتمديد خصوبة الإناث. يمكن أن توفر تقييمات النسخ الجيني الكلي للمبيض نتائج يصعب تفسيرها بسبب التغيرات المحتملة في تباين الخلايا التي تحدث خلال الشيخوخة. يمكن أن تتغلب فرز الخلايا على هذه القيود ولكنها تعتمد على أجسام مضادة محددة أو أنظمة Crereporter لاستهداف أنواع خلايا معينة. من ناحية أخرى، يعد scRNA-seq أداة مفيدة لقياس التغيرات النسخية في جميع أنواع خلايا المبيض خلال عملية الشيخوخة. وقد حددت تحليلات scRNA-seq السابقة للمبيض التوقيعات الجزيئية لأنواع خلايا معينة والتغيرات في تجمعات الخلايا الفردية .
في الفئران، دورة الشبق وتجميع الجريبات الأولية تؤدي إلى تغييرات ديناميكية في تجمعات خلايا المبيض المحددة. ومع ذلك، لا تزال التغيرات الخلوية المحددة التي تحدث خلال الشيخوخة المبيضية قيد التوضيح، خاصة فيما يتعلق بالفترة الحرجة من انخفاض الخصوبة التي تحدث قبل استنفاد الجريبات بفترة طويلة. لأن الفئران هي الكائنات النموذجية الرئيسية المستخدمة في تجارب الشيخوخة المبيضية , فإن الأطلس الخلوي للشيخوخة المبيضية المقدم هنا يعد موردًا حيويًا للمجال. في الرئيسيات غير البشرية، قدمت scRNA-seq رؤى آلية حول التغيرات المرتبطة بشيخوخة المبيض . ومع ذلك، تم إجراء هذه الدراسة مع الحيوانات في حالة ما حول انقطاع الطمث عندما تتعطل التغيرات في الدورية ومستويات الهرمونات. كان هدفنا الرئيسي هو تحديد التغيرات المبكرة التي تحدث في الفئران المسنّة إنجابيًا قبل فترة ما حول انقطاع الطمث. عند 9 أشهر من العمر، تعاني الفئران من انخفاض احتياطي المبيض لكنها تبقى خصبة , مما يمثل عمرًا حرجًا عندما تسعى النساء البشر لإنجاب الأطفال وتواجه صعوبة في الحمل . في البشر، لوحظت زيادة ملحوظة في عدم تطابق الكروموسومات في الأجنة من المتبرعين، بدءًا من حوالي 35 عامًا من العمر , مما يشير إلى فقدان في جودة البويضات. باستخدام نهجنا، قمنا بتمييز جميع أنواع الخلايا الرئيسية المتوقعة في المبيض وقمنا بتقسيمها بشكل أكبر لتحديد تجمعات خلوية محددة تأثرت بعملية الشيخوخة.
تظهر نتائج scRNA-seq لدينا أن نسبة الخلايا المناعية في المبيض تتضاعف بين 3 و9 أشهر من العمر. كانت الزيادة الأكثر وضوحًا في الخلايا المناعية داخل المبايض المسنّة تحدث في أنواع 1 و17 من الخلايا اللمفاوية. أفاد تقييم حديث لـ scRNA-seq لخلايا المناعة المبيضية بزيادة في الخلايا، التي تعتبر خلايا T سلبية مزدوجة، في المبايض المسنّة . العديد من أنواع 1 و17 من الخلايا اللمفاوية الموصوفة في الدراسة الحالية، بما في ذلك DNs، نوع 17 NKTs، MAITs، Ts ونسبة كبيرة من نوع 1 NKTs، هي CD4 وبالتالي ستدرج ضمن مجموعة خلايا T السلبية المزدوجة الواسعة الموصوفة في الدراسة السابقة. يتفق بياناتنا مع التقرير السابق، حيث تشير بياناتنا إلى أن العديد من هذه التجمعات تزداد مع التقدم في العمر. ومع ذلك، توفر بياناتنا تفاصيل أفضل وكشفت عن تغييرات في المبيض المسن في تجمعات محددة من أنواع 1 و17 من الخلايا اللمفاوية التي لم يتم تقييمها سابقًا.
على وجه التحديد، حددنا أن التجمعات الفرعية المناعية التي زادت بشكل متسق في المبيض المسن كانت نوع 1 NKTs ونوع Ts، وكلاهما خلايا T فطرية. تثير بياناتنا بالتالي أسئلة مثيرة حول الأدوار الوظيفية للخلايا اللمفاوية T الفطرية في كل من المبيض الشاب والقديم. تعتبر خلايا T الفطرية خلايا مقيمة في الأنسجة يُعتقد أنها تسهم في الحفاظ على توازن الأنسجة وتعمل كخلايا رصد في اكتشاف العوامل المعدية أو الخلايا النيوبلزمية أو الأضرار الخلوية الشاذة . في الجهاز التناسلي الأنثوي، تظهر الخلايا اللمفاوية الفطرية تنوعًا وظيفيًا عاليًا مع تأثيرات مفيدة وضارة . ومع ذلك، فإن دور الخلايا اللمفاوية الفطرية في المبيض هو موضوع غير مستكشف. تلعب نوع 17 Ts أدوارًا حاسمة خلال التليف في مجموعة متنوعة من الأعضاء، بما في ذلك الكبد ، الكلى ، الرئة والقلب . ومع ذلك، يبدو أن ما إذا كانت هذه الخلايا واقية أو ضارة في التليف يعتمد على كل من الأنسجة والسياق . على سبيل المثال، تساهم تراكمات نوع Ts المرتبطة بالعمر في الالتهاب المزمن في الأنسجة الدهنية . في المبيض، يمكن أن يؤدي توسع نوع Ts إما إلى تعزيز التليف أو أن يكون محاولة تعويضية لتخفيف البيئة التليفية. لا يُعرف الكثير عن دور نوع 1 NKTs في المبيض. بشكل عام،
الشكل 6 | الأهمية البيولوجية للمسارات المتغيرة في سدى المبيض وSCLs. أ، تعبير جينات الكولاجين في سدى شبيه الخلايا الليفية لا يتغير مع التقدم في العمر. , صبغة بيكروسيرياس الحمراء (PSR) لتلوين ترسب الكولاجين في المبايض التي تبلغ من العمر 3 و9 أشهر. شريط القياس، . ج، تحليلات المنظمين العلويين IPA للتغيرات المرتبطة بالعمر في السدى وTCSCLs (9 مقابل 3 أشهر، -score) المتعلقة بالالتهاب والتليف. د، تعبير جين Mmp2 في السدى شبيه الخلايا الليفية ينخفض مع التقدم في العمر. هـ، بروتين MMP2 ينخفض في سدى المبيض المسن، كما يتضح من التألق المناعي. , صور التألق المناعي التمثيلية لـ MMP2 (أخضر)، DAPI (أزرق) والتألق الذاتي (أحمر). تمثل المناطق ذات الحدود الصفراء المناطق السدوية التي تم تحليلها، متجنبة
توفر NKTs استجابات مناعية مهمة خلال الإصابة والإصلاح والالتهاب والتليف في الكبد والرئة . هناك حاجة إلى دراسات آلية إضافية لتقييم أدوار هذه الخلايا في تليف المبيض والالتهاب.
في الظروف الطبيعية، يتم الحفاظ على الخلايا اللمفاوية المقيمة في الأنسجة من خلال التكاثر البطيء المنزلي , على عكس
الخلايا T التكيفية التي يتم تجنيدها عمومًا من الدورة الدموية . قد تكون الآليات الكامنة وراء زيادة أعداد الخلايا اللمفاوية الفطرية في المبيض المسن نتيجة لزيادة التكاثر استجابةً لإعادة تشكيل الأنسجة و/أو إنتاج السيتوكينات الالتهابية المحلية. هذه الفرضية تتماشى مع زيادة نشاط المنظمين العلويين IFNG وTNF وIL15 وIL1A في GC SCLs. بدلاً من ذلك،
الشكل 7 | تقسيم GCs، البويضات وخلايا الجسم الأصفر. أ، UMAP من CLUs للخلايا الحبيبية، البويضات وخلايا الجسم الأصفر المستخدمة للتقسيم الفرعي. ب، UMAP من SCLs للخلايا الحبيبية، البويضات وخلايا الجسم الأصفر. ج، رسم نقطي للعلامات المستخدمة لتحديد نوع خلايا SCL.
-scores تشير إلى تنشيط أو تثبيط المسارات خلال الشيخوخة من خلال تحليل IPA في GCs ما قبل الجريبات (د)، GCs الجريبات (هـ)، GCs المتآكلة (و) والبويضات (ز). تم إجراء scRNA-seq في المبايض لكل مجموعة عمرية.
الشكل 8 | تقسيم فرعي للخلايا البطانية والظهارية. أ، UMAP من CLUs للخلايا البطانية والظهارية المستخدمة للتقسيم الفرعي. ب، UMAP من SCLs للخلايا البطانية والظهارية. ج، رسم نقطي للعلامات المستخدمة لتحديد نوع خلايا SCL. -scores تشير إلى تنشيط أو تثبيط المسارات المتغيرة مع الشيخوخة، كما يتضح من تحليل IPA، في خلايا البطانة الوعائية. هـ، -scores تشير إلى
تنشيط أو تثبيط المنظمين العلويين خلال الشيخوخة، كما يتضح من تحليل IPA، في SCLs البطانية والظهارية. -scores تشير إلى زيادة أو انخفاض تنظيم الجينات بواسطة الجينات TP35 وCdkn1a وCdkn2a. ز، رسم نقطي يظهر تعبير علامات شيخوخة الخلايا في خلايا البطانة الوعائية في المبايض التي تبلغ من العمر 3 و9 أشهر. تم إجراء scRNA-seq في المبايض لكل مجموعة عمرية.
يمكن تجنيد اللمفاويات المتداولة إلى الأنسجة استجابةً لإشارات التهابية مشابهة . الالتهاب المبيضي المزمن الناتج عن الأمراض المناعية الذاتية يعزز أيضًا تراكم اللمفاويات , وغالبًا ما تعاني النساء من البشر المصابات بأمراض مناعية ذاتية من قصور مبيضي . وهذا يشير إلى وجود ارتباط بين تراكم اللمفاويات والانخفاضات الجريبية المرتبطة بالعمر، مما يستدعي التحقيق في المستقبل.
على الرغم من أننا اكتشفنا زيادة في نسبة خلايا B ضمن بيانات scRNA-seq عند 9 أشهر من العمر، إلا أن ذلك لم يتم تأكيده بواسطة قياس التدفق. أظهرت تقارير سابقة أن نسبة خلايا B المبيضية زادت قليلاً من 2 إلى 6 أشهر من العمر لكنها عادت إلى مستوياتها الأساسية بحلول 12 شهرًا من العمر . وهذا يشير إلى أن أعداد الخلايا متغيرة للغاية في المبيض المتقدم في العمر. ضمن بيانات scRNA-seq الخاصة بنا، اكتشفنا أيضًا زيادة في الخلايا في المبيض الذي يبلغ من العمر 9 أشهر. على الرغم من أن نسبة الخلايا انخفضت بين 3 و 9 أشهر من العمر وفقًا لقياس التدفق، إلا أن العدد المطلق لهذه الخلايا زاد مع تقدم العمر. تم الإبلاغ عن تراكم الخلايا سابقًا في المبيض المتقدم في العمر , على الرغم من أن هذه التغيرات لم تُلاحظ حتى 12 شهرًا من العمر. وهذا يشير إلى أن تراكم الخلايا قد يبدأ في الحدوث عند 9 أشهر من العمر.
الأدبيات التي تتناول التغيرات المرتبطة بالعمر في خلايا المايلويد المبيضية متضاربة , مما قد يكون بسبب اختلافات في الطرق المستخدمة والأعمار التي تم تقييمها. لم نجد تغييرات كبيرة في تراكم خلايا المايلويد المبيضية بحلول 9 أشهر من العمر من خلال تحليلات scRNAseq أو قياس التدفق. في هذه المرحلة، لا يزال غير واضح ما إذا كانت خلايا المايلويد تزيد فعليًا في المبيض مع تقدم العمر، ولكن اندماج الخلايا الوحيدة والبلاعم إلى MNGCs يمكن أن يربك هذه التفسيرات. كما تم الإشارة إليه سابقًا، فإن تراكم MNGC هو سمة من سمات المبيض المتقدم في العمر . تشير التقارير السابقة إلى أن MNGCs قد تساهم في تدهور الميكروبيئة المبيضية المرتبطة بالعمر . ومع ذلك، لا تزال الآليات التي تعزز تشكيل MNGC وعواقبها الفسيولوجية في المبيض غير محلولة. أفضل MNGCs الموصوفة هي الخلايا العظمية، التي تشارك في إعادة تشكيل العظام من خلال البلعمة للخلايا الميتة وقطع الكولاجين . في المبيض، قد تؤدي MNGCs أيضًا وظائف مماثلة لأن العمليات البلعومية تتحكم في إعادة تشكيل الأنسجة خلال ضمور الجريبات، وتراجع الجسم الأصفر والتبويض. من المثير للاهتمام، لأن الاستروجين يحفز موت الخلايا العظمية، فإن فقدان تأثير الاستروجين المرتبط بانقطاع الطمث يسرع من فقدان العظام في البشر . وبالمثل، قد يعزز انخفاض إشارات الاستروجين في المبيض المتقدم في العمر تراكم MNGC. تساهم اللمفاويات، التي تزداد في المبيض المتقدم في العمر، أيضًا في تشكيل MNGC من خلال آليات متوسطة السيتوكين . على سبيل المثال، يرتبط Il17a (السيتوكين الرئيسي الذي تنتجه خلايا اللمف من النوع 17) بتشكيل الخلايا العظمية , مما يشير إلى أن خلايا اللمف من النوع 17 قد تساهم في تشكيل MNGC في المبيض المتقدم في العمر. وبالمثل، من المعروف أن IFNG يحفز تشكيل MNGC . تظهر بياناتنا أن المصدر الرئيسي لإنتاج Ifng في المبيض هو خلايا اللمف من النوع 1، التي تتراكم في المبيض مع تقدم العمر. ستكون الدراسات الإضافية مطلوبة لتوضيح الآليات الكامنة وراء تشكيل MNGC في المبيض والدور الذي تلعبه في وظيفة المبيض وعمليات الشيخوخة.
إن تراكم خلايا اللمف وMNGCs المذكور أعلاه يساهم تقريبًا بالتأكيد في التغيرات المرضية التي تحدث في المبيض المتقدم في العمر. نحن نتكهن أنهم يتواصلون مع خلايا الجريبات لتحفيز استجابات مناعية تؤثر سلبًا على الميكروبيئة المحلية. على سبيل المثال، تظهر GCs نشاط مسار IL-17 وIFNG المرتفع مع تقدم العمر، على الرغم من أن هذه الجينات تُعبر بشكل رئيسي في اللمفاويات. يدعم هذا الفكرة القائلة بأن خلايا اللمف تنتج لقمات التهابية تؤثر على الشبكات النسخية لـ GC. وجدنا أيضًا أن GCs تزيد من مسارات الإجهاد التأكسدي، والتي نفترض أنها قد تحدث استجابةً للبيئة الالتهابية. تدعم هذه النتيجة تحليل scRNA-seq لمبايض الرئيسيات غير البشرية المتقدمة في العمر التي تظهر أيضًا انخفاضات في نشاط مسار الأكسيدوريدوكتاز في GCs . تم ملاحظة هذه التشابهات على الرغم من أن
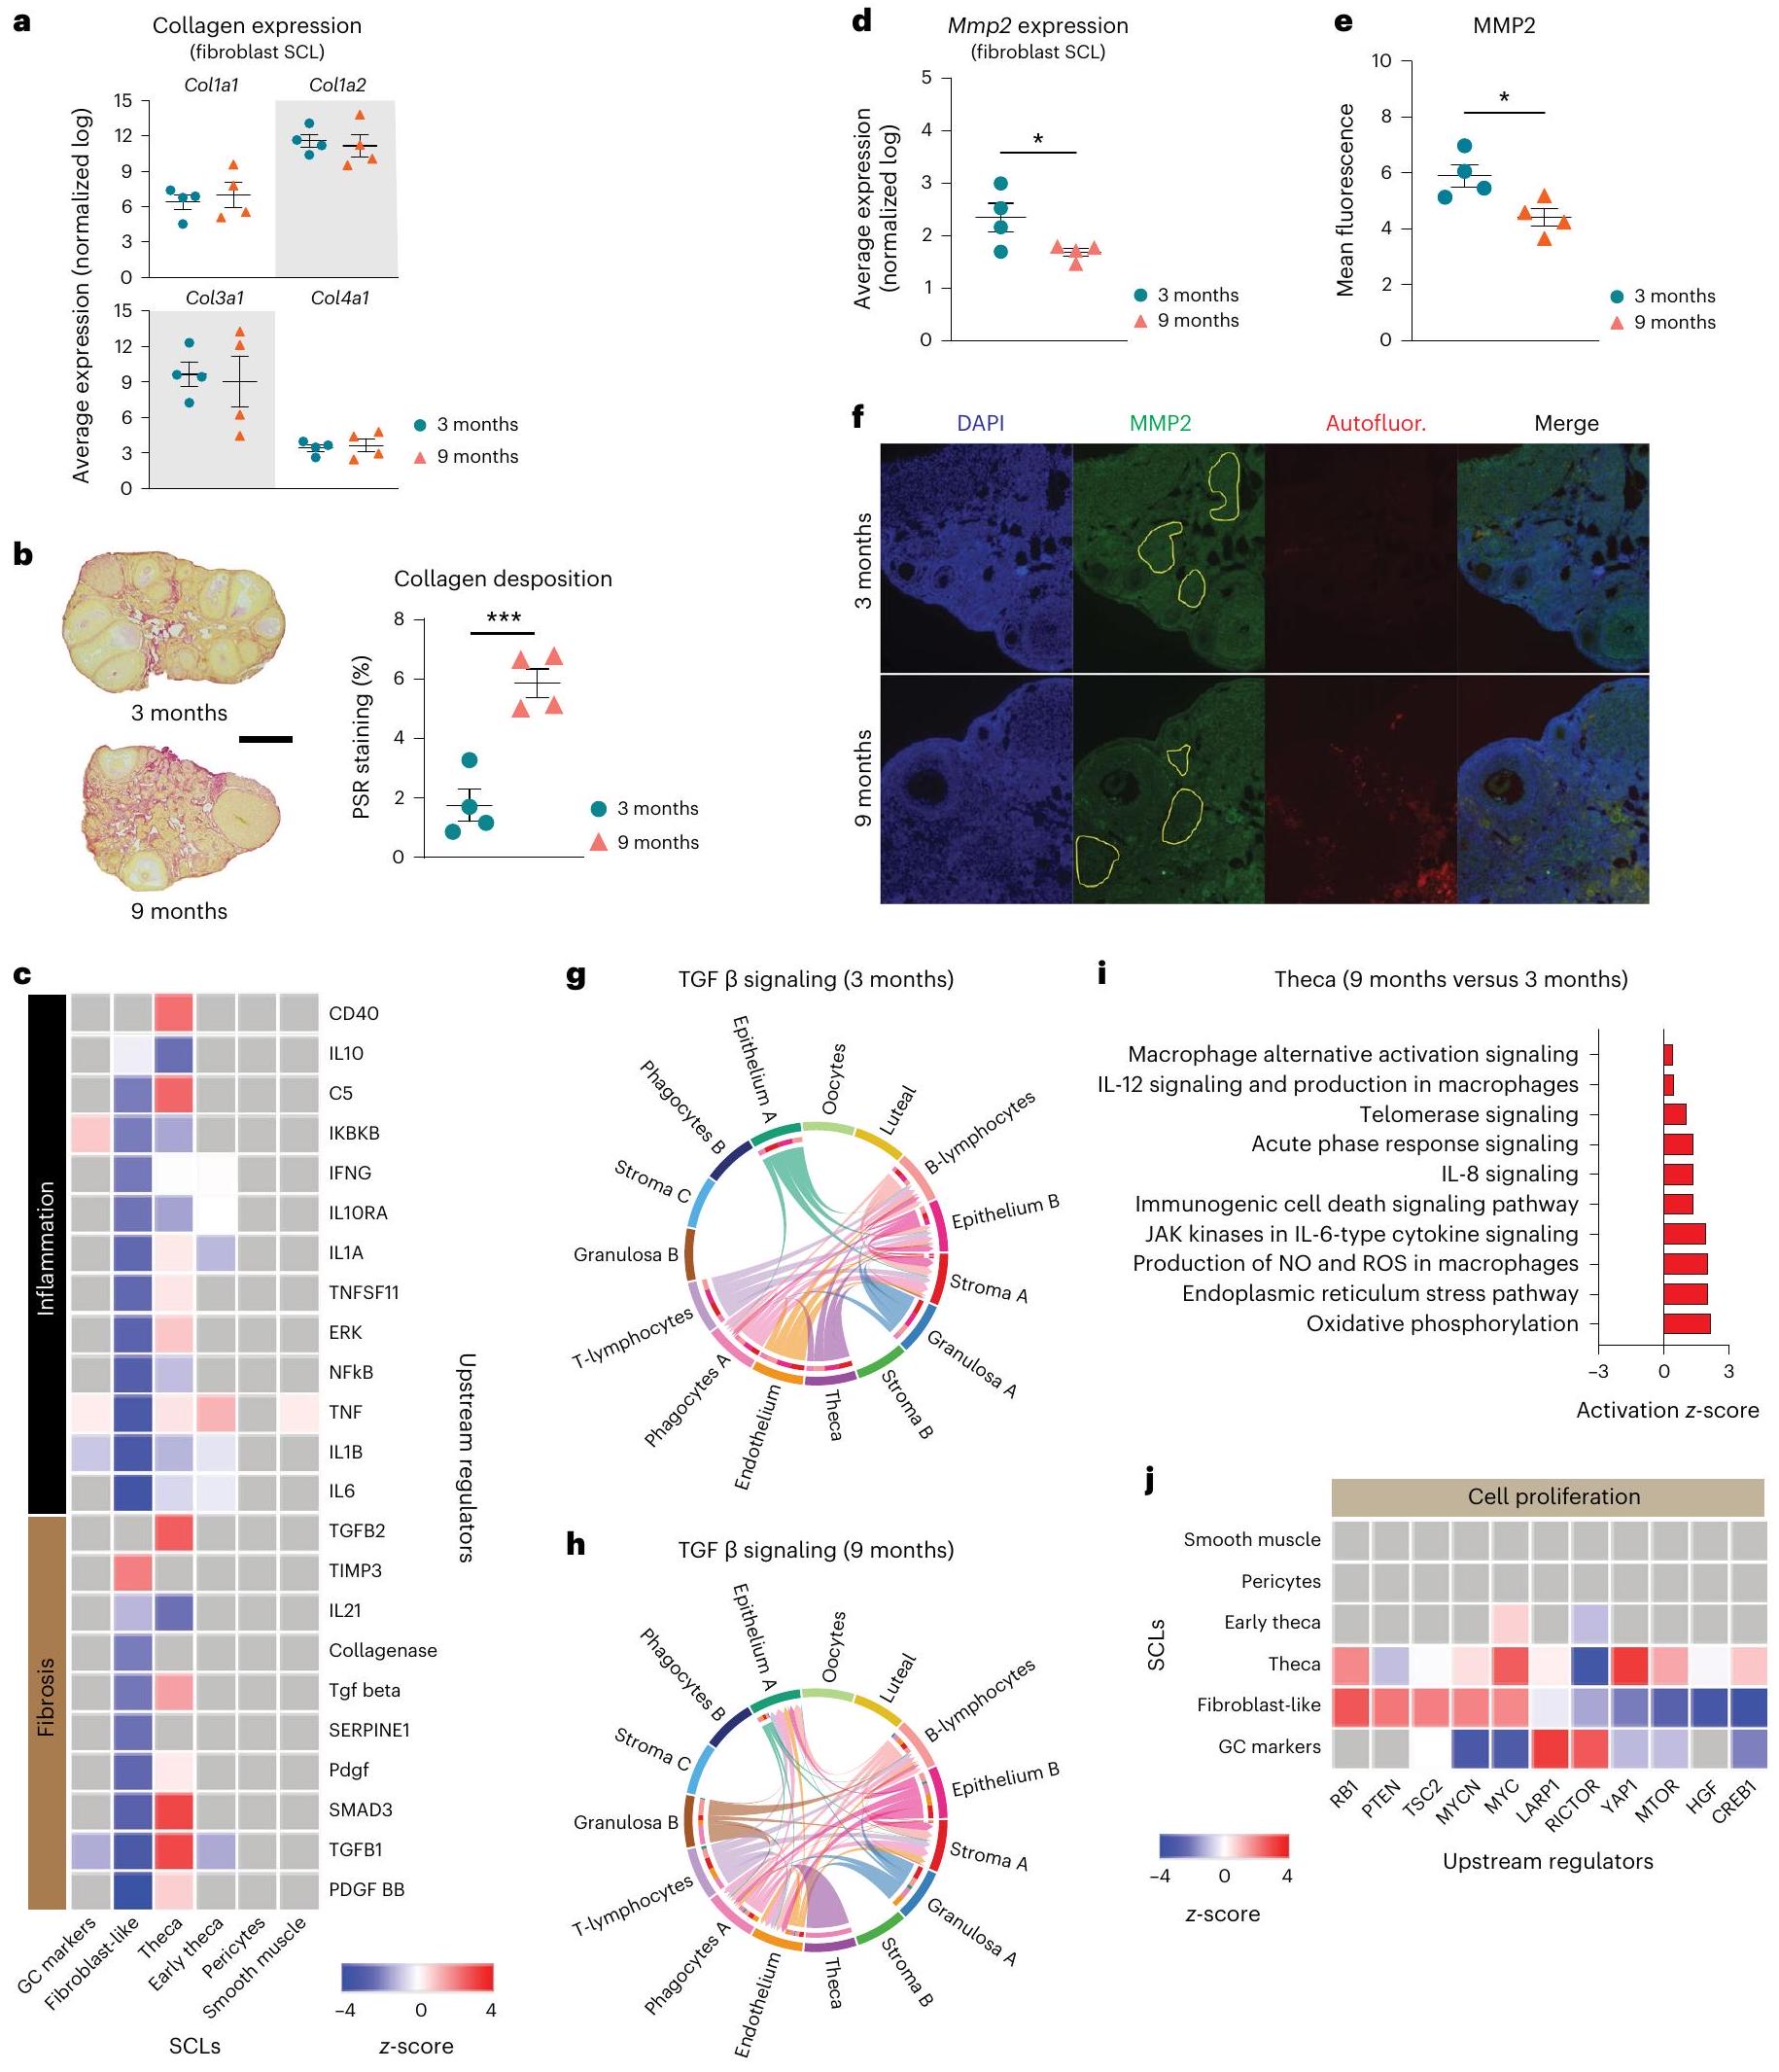
تم جمع مبايض الرئيسيات غير البشرية خلال فترة ما حول انقطاع الطمث، بينما تم جمع مبايض الفئران قبل فترة ما حول انقطاع الطمث. بالإضافة إلى الاستجابات المناعية، وجدنا أيضًا أن GCs وTCs تظهر تحفيزًا مرتبطًا بالعمر للاستجابات الليفية كما يتضح من زيادة تنشيط مسار TGF . تماشيًا مع الملاحظات السابقة , رأينا زيادة في ترسب الكولاجين المبيضي بحلول 9 أشهر من العمر. نظرًا لأن الكولاجين يتم إنتاجه بشكل أساسي بواسطة خلايا شبيهة بالألياف الداعمة , قمنا بتقييم تعبير جينات الكولاجين في هذا SCL لكننا لم نجد تغييرات مرتبطة بالعمر. على العكس من ذلك، تم تقليل مسار الكولاجيناز وتعبير MMP2 في نسيج المبيض المتقدم في العمر، مما يشير إلى أن تراكم الكولاجين يحدث بسبب انخفاضات في التحلل. من الجدير بالذكر أيضًا أن TCs تزيد من مسارات تكاثر الخلايا (على سبيل المثال، mTOR)، التي تزداد مع تقدم العمر لكن، والأهم من ذلك، تم ربطها بتنشيط الجريبات الأولية .
على الرغم من أن البيانات المقدمة هنا تعتبر أداة مهمة لتوليد الفرضيات، إلا أن هناك بعض القيود التي يجب ملاحظتها. تتطلب إعداد الخلايا لـ scRNA-seq وقياس التدفق خطوات ترشيح تزيل MNGCs والبيوض الكبيرة من التحليلات. ستسمح الدراسات المستقبلية التي تستخدم المجهر بالليزر والتسلسل أحادي النواة بالتحقيق في هذه المجموعات الخلوية الكبيرة. على الرغم من أن الفأر هو الكائن الحي النموذجي الأكثر شيوعًا المستخدم لتقييم المبيض، إلا أن هناك جوانب مهمة من بيولوجيا مبيضها تختلف عن الرئيسيات غير البشرية والبشر: على سبيل المثال، البشر هم نوع ذو إباضة واحدة بينما الفئران متعددة الإباضة وبالتالي فإن إشارات اختيار الجريبات ربما تختلف بين هذه الأنواع. بالإضافة إلى ذلك، تم استخدام فئران عذراء في هذه الدراسة، مما لا يأخذ في الاعتبار تأثير الحمل على ديناميات شيخوخة المبيض. يجب أيضًا النظر في فحص نقاط زمنية إضافية بعد الشيخوخة الإنجابية، لأنها ستوفر رؤى حاسمة تتعلق بكيفية تغير المبيض بعد فقدان الخصوبة، مما قد يؤثر على آليات الشيخوخة النظامية. أخيرًا، لا تعيد فترة ما حول انقطاع الطمث في الفئران بشكل كامل التغيرات الملاحظة في انقطاع الطمث لدى الرئيسيات غير البشرية والبشر. وبالتالي، يجب تقييم نماذج أخرى لشيخوخة المبيض قبل استخلاص استنتاجات نهائية.
باختصار، يقدم هذا التقرير رؤى حول التغيرات التي تحدث داخل المبيض الفأري المتقدم في العمر بدقة خلوية واحدة. نبلغ أنه بحلول 9 أشهر من العمر، عندما تظل الفئران خصبة ونشطة إنجابيًا، فإن تراكم خلايا المناعة قد تضاعف بالفعل مع ملاحظة أكبر التغيرات في اللمفاويات الفطرية بما في ذلك NKTs من النوع 1 و Ts. كما نوضح أن GCs وTCs تزيد من مسارات استجابة الإجهاد، والإشارات المناعية والليفية مع تقدم العمر. تتوافق هذه التغيرات مع انخفاضات في تعبير الكولاجيناز في النسيج الداعم، الذي نفترض أنه يساهم في تراكم الكولاجين مع تقدم العمر. كانت هذه التغيرات مصحوبة بتراكم MNGCs مع تقدم العمر، والتي شكلت الغالبية العظمى من إيجابية الليبوفوسين في المبايض المتقدمة في العمر. هذه الملاحظة، جنبًا إلى جنب مع الزيادة في خلايا المناعة التي تعبر عادةً عن علامات نسخ الشيخوخة الخلوية، تساهم على الأرجح في الزيادة المبلغ عنها سابقًا في الشيخوخة الخلوية المبيضية مع تقدم العمر. بشكل جماعي، توفر نتائجنا رؤى حول الآليات الكامنة التي تعزز الالتهاب المبيضي المزمن والتليف مع تقدم العمر وتعتبر موردًا مهمًا للمجال.

طرق

الحيوانات وجمع الأنسجة والتفكيك لـ scRNA-seq

تمت الموافقة على جميع إجراءات الحيوانات من قبل لجنة رعاية واستخدام الحيوانات المؤسسية في مؤسسة أبحاث الطب في أوكلاهوما. تم استخدام فئران أنثوية من سلالة C57BL/6J (رقم السلالة 000664) ( تم شراء ) من مختبر جاكسون وتم تكييفها مع منشأة أبحاث الطب الحيوي في أوكلاهوما قبل جمع المبايض. خلال التكيف، تم الحفاظ على الفئران عند على دورة ضوء/ظلام 12/12 ساعة وكان لديها وصول حر إلى الطعام (LabDiet رقم 5053، بيورينا) والماء. عند أو 9 أشهر من العمر ( )، تم تخدير الفئران باستخدام الإيزوفلورين وتم قتلها عن طريق النزف القلبي
ثقب. تم إجراء التروية باستخدام PBS، وتم جمع المبايض وتشريحها. تم فصل مبيض واحد من كل فأر باستخدام مجموعة فصل الأنسجة المتعددة 1 (رقم الكاتالوج 130110201، ميلتيني بيوتيك)، وفقًا لتعليمات الشركة المصنعة، لإنشاء تعليق خلية مفردة في PBS من دلبوكو (رقم الكاتالوج 14287080، جيبكو).

بناء مكتبة scRNA-seq

تم بناء مكتبات scRNA-seq باستخدام مجموعة جيم الخلية المفردة 3′ من كروم (رقم الكاتالوج 10000075، 10X جينومكس)، وفقًا لتعليمات الشركة المصنعة، كما هو موضح بإيجاز أدناه. بعد إنشاء تعليقات الخلايا المفردة من المبايض، تم عد الخلايا على جهاز قياس التدفق MACSQuant10 وتم تخفيفها إلى 1,000 خلية لاستهداف استعادة 5,000 خلية لكل عينة خلال تغليف scRNA-seq. تم إضافة الخلايا المخففة، والمزيج الرئيسي، والخرز الهلامي وزيت التقسيم إلى شريحة الخلية المفردة B من كروم (رقم الكاتالوج 10000073، 10X جينومكس) وتم تحميلها في وحدة تحكم كروم (رقم الكاتالوج 1000204، 10X جينومكس) لإنشاء خرزات الجل في المستحلب (GEMs) لإعداد المكتبة في المراحل التالية. ثم تم نقل GEMs إلى أنابيب PCR وتم حضنها في جهاز حراري لأداء النسخ العكسي في GEMs. بعد النسخ العكسي في GEMs، تم شفط عامل الاسترداد وتم تنظيف الحمض النووي المكمل باستخدام كاشف Dynabeads MyOne SILANE المضمن في مجموعة scRNA-seq. تم تضخيم cDNA ثم تنظيفه باستخدام كريات كاشف SPRISelect (رقم الكاتالوج B23318، بيكمان كولتر). تم فحص جودة cDNA باستخدام شريط شاشة عالي الحساسية D5000 (رقم الكاتالوج 5067-5592، أجيلنت) تم تشغيله على TapeStation 2200 (رقم الكاتالوج G2964AA، أجيلنت). تم نقل عينة من من cDNA المضخم إلى إعداد المكتبة. تم قياس المكتبات بواسطة PCR الكمي وتم فحص جودتها على شريط شاشة عالي الحساسية D1000 (رقم الكاتالوج 5067-5584، أجيلنت) على TapeStation 2220. تم تطبيع المكتبات، وتجميعها وتسلسلها على خلية تدفق NovaSeq6000 PE150. كانت عمق التسلسل الذي تم الحصول عليه هو قراءات لكل خلية.

مراقبة جودة scRNA-seq وتحليل البيانات

تم إنشاء ملفات Fastq وتم فصلها من ملفات استدعاء القاعدة الخام (bcl) باستخدام خط أنابيب cellranger mkfastq. تم إجراء المحاذاة، والترشيح، وعد الخوارز، وعد الخوارز الجزيئية الفريدة باستخدام خط أنابيب cellranger count باستخدام المرجع refdata-gex-mm10-2020-A مع الإعدادات الافتراضية. تم تحميل الملفات الناتجة إلى R Studio (v.4.2.2) باستخدام وظيفة ‘load10X’ من حزمة SoupX . ثم تم استخدام خط أنابيب SoupX لتقدير وإزالة تلوث RNA المحيط قبل التحويل إلى كائنات Seurat . ثم تم دمج العينات لإنشاء كائن Seurat واحد وتم ترشيحها بناءً على عدد الميزات (>200) ونسبة النسخ الميتوكوندرية (<25%). تم إزالة الجينات المعبر عنها في أقل من ثلاث خلايا من التحليل. تم إزالة الجينات التي تمثل تلوث الريبوسوم (Malat1، Gm42418، Gm26917، Ay036118) التي كانت تسبب ضوضاء خلفية تقنية وبالتالي تمت إزالتها من التحليل لتحسين التجميع الفرعي. تم تحديد الميزات المتغيرة في Seurat قبل توسيع البيانات وتشغيل تحليل المكونات الرئيسية. تم استخدام طريقة JackStraw لتحديد أبعاد مجموعة البيانات، وتم إنشاء تحليل UMAP في Seurat. تم تحديد وإزالة الثنائيات باستخدام حزمة DoubletFinder ، مع ثنائيات متوقعة. تم إنشاء معلمات أخرى ( ) باستخدام إحصائيات DoubletFinder sweep. تم عرض العينات على UMAP الذي تم استخدامه لتحديد عدم وجود تأثيرات دفعة وأن دمج البيانات الإضافية لم يكن ضروريًا. تم استخدام Seurat للعثور على الجينات المعبر عنها بشكل مختلف حسب CLU والعمر ولإنشاء الرسوم البيانية المعروضة في الأشكال (أي DimPlot وVlnPlot وDotPlot). تم حساب درجات الوحدة بواسطة متوسط مستويات التعبير لكل برنامج على مستوى الخلية المفردة، مطروحًا منها التعبير المجمع لمجموعات الميزات الضابطة. لتقييم التفاعلات بين الخلايا بين أنواع خلايا المبيض المختلفة في مبايض الفئران الشابة والقديمة، استخدمنا CellChat45 (v.1.6.1)، والذي يعتمد على تعبير أزواج الليغاند-المستقبلات المعروفة . تم استيراد قوائم الجينات إلى برنامج IPA 01.12 (Qiagen
Bioinformatics) لتقييم تحليل إثراء المسار/الوظيفة البيولوجية.

علم الأنسجة

تم جمع المبيض المتبقي من كل فأر في 4% من البارافورمالدهيد، وتم معالجته وتقطيعه بشكل متسلسل. لتحديد احتياطي المبيض، تم صبغ واحدة من كل ستة مقاطع متسلسلة من المبيض الكامل بصبغة الهيماتوكسيليين والإيوزين (H&E) وتم عد الجريبات من كل حالة كما هو موضح سابقًا . تم ضرب عدد الجريبات قبل الجريبات (الأولية، والثانوية) في ستة لحساب المقاطع التي لم يتم تقييمها ثم ضربها في اثنين لحساب كلا المبيضين. نظرًا لحجمها الكبير، تم ضرب الجريبات الجانبية في ثلاثة لحساب المقاطع التي لم يتم تقييمها ثم ضربها في اثنين لحساب كلا المبيضين. تم إجراء صبغ بيكروسيرياس الأحمر لتراكم الكولاجين وصبغ سودان الأسود لتراكم الليبوفوسين على مقطع عشوائي من منتصف كل مبيض وتم تحليله كما هو موضح سابقًا .

المناعية الفلورية

تم تقييم بروتين MMP2 في السدى المبيضي في مقاطع مبيضية مثبتة في البارافين كما هو موضح سابقًا . تم حضن الشرائح مع جسم مضاد أولي ضد MMP2 من الأرنب (1:100؛ رقم الكاتالوج 87809، BioLegend) طوال الليل، تليها جسم مضاد ثانوي ضد الأرنب من الماعز IgG أليكسا فلور 488 (1:500؛ رقم الكاتالوج 2338052، مختبرات جاكسون للأبحاث المناعية) لمدة ساعة وDAPI لمدة 5 دقائق. تم التقاط الصور على ميكروسكوب فلوري من زيس في قنوات الأخضر (MMP2) والأزرق (DAPI). تم أيضًا التقاط الصور في القناة الحمراء لتحديد وتجنب المناطق الفلورية الذاتية في المبيض، والتي تكون شائعة في المبيض القديم . تم قياس متوسط الكثافة الفلورية من ثلاث مناطق سدى ملونة بـ MMP2 من كل فأر بواسطة Image J وتم حسابها. تم حساب الفلورية الخلفية غير المحددة بطريقة مماثلة باستخدام مقاطع متسلسلة ملونة فقط ثانوية من نفس الفأر. تم طرح الإشارة غير المحددة من كل عينة.

قياس التدفق الخلوي

تم إجراء قياس التدفق الطيفي عالي المعلمات لتأكيد التغيرات المرتبطة بالعمر في النسبة وعدد خلايا المناعة. تم شراء فئران أنثوية من سلالة C57BL/6J (رقم السلالة 000664) ( ) من مختبر جاكسون. للحصول على خلايا كافية لاستراتيجية التصفية المقترحة، تم تجميع ستة مبايض من ثلاثة فئران ( لكل مجموعة عمرية). قبل القتل، تم إجراء علم الخلايا المهبلية لتحديد مرحلة دورة الشبق كما هو موضح سابقًا . تم تخدير الفئران باستخدام الإيزوفلورين وتم حقنها وريدياً بـ من جسم مضاد FITC-anti-CD45 (رقم الكاتالوج 35-0454، Cytek) لتحديد الخلايا داخل الأوعية وتمييزها عن الكريات البيضاء المقيمة في الأنسجة خارج الأوعية . بعد خمس دقائق من التلوين، تم قتل الفئران وجمع المبايض وتجميعها وفقًا لمرحلة دورة الشبق. تم عزل خلايا المبيض عن طريق الهضم الإنزيمي في 3 مل من DMEM (رقم الكاتالوج D6429، سيغما) يحتوي على 4 ملغ من الكولاجيناز (رقم الكاتالوج C5138-100MG، سيغما-ألدريش). تم حضن العينات عند لمدة 40 دقيقة وتم pipetted بلطف 30 مرة كل 10 دقائق لتشجيع تفكك الأنسجة . بعد التفكك، تم تمرير الخلايا عبر جهاز تصفية (رقم الكات. 130-098-462، ميلتينيي بيوتيك) وغسلها بـ 7 مل إضافية من DMEM. تم وضع علامة على الخلايا باستخدام Zombie NIR (رقم الكات. 423106، BioLegend) وفقًا لتعليمات الشركة المصنعة ثم تم غسلها في محلول FACS (PBS + 5% مصل العجل حديث الولادة)، وتمت معالجتها مع مادة حجب Fc (مضاد الفأر CD16/32، رقم الكات. 70-0161، Cytek)، وغسلت وصبغت بمزيج من الأجسام المضادة المسمى بالفلوركروم (البيانات التكميلية 1) لمدة 30 دقيقة في ، بحضور محلول Brilliant Stain Buffer Plus ( لكل عينة؛ رقم الكات. 563795، بيكتون ديكنسون) ومحلول CellBlox Blocking Buffer ( لتر لكل عينة؛ رقم الكات. C001T02F01، ثيرمو فيشر ساينتيفيك). تم غسل الخلايا مرة أخرى في محلول FACS وصبغها داخل الخلايا للكشف عن تعبير عوامل النسخ باستخدام مجموعة True-Nuclear Transcription Factor Buffer (رقم الكات. 424401،
BioLegend) وفقًا لتعليمات الشركة المصنعة. في نهاية الإجراء، تم تثبيت الخلايا الملونة في 2% من البارافورمالدهيد لمدة 5 دقائق. تم الحصول على الخلايا الملونة باستخدام جهاز قياس التدفق Cytek Aurora بخمسة ليزر وتم تحليلها باستخدام FlowJo 10.9 (بيكتون ديكنسون). يمكن رؤية استراتيجية التصفية في الشكل التكميلية 4.

الإحصائيات وإعادة الإنتاج

تم استدعاء الجينات المعبر عنها بشكل مختلف بين CLUs وحسب العمر في حزمة Seurat باستخدام أمر FindMarkers مع المعلمات الافتراضية. تم استيراد قوائم الجينات المعبر عنها بشكل مختلف إلى برنامج IPA وتم تصفيتها بناءً على معدل الاكتشاف الكاذب (FDR) و (تغيير الطي) لتحليلات المسار. تم اعتبار المسارات التي تحتوي على ذات دلالة إحصائية، وتم الإبلاغ عن تنشيط -الدرجات بواسطة خريطة حرارية أو مخططات شريطية في الأشكال. تم إجراء تحليلات إحصائية أكثر تقليدية باستخدام برنامج GraphPad Prism. تم إجراء اختبار شابيرو-ويلك لتأكيد التوزيع الطبيعي للبيانات. تم تقديم مخططات الشريط مع النقاط الفردية المعروضة والمتوسطات s.e.m. المشار إليها. لمقارنة المتوسطات بين العمرين، تم استخدام اختبارات -ت الطالب، مع تطبيق اختبارات ذات طرف واحد وذو طرفين حيثما كان ذلك مناسبًا . تم إجراء تصحيحات للمقارنات المتعددة، حيثما كان ذلك مناسبًا، باستخدام تصحيح بنجاميني وكريجر ويكوتيلي للمقارنات المتعددة. تم تعريف الفروق الهامة عند أو FDR < 0.05 (للمقارنات المتعددة). لم يتم استخدام طرق إحصائية لتحديد عدد النسخ البيولوجية المستخدمة. تم اختيار حجم عينة لدينا بناءً على أحجام العينات المبلغ عنها في منشورات سابقة مماثلة . نظرًا لأن المجموعات التجريبية المستخدمة في هذه الدراسة كانت مفصولة حسب العمر، لم يكن من الممكن عشوائية العينات. لم تتم إزالة أي عينات من التحليل. تم تحديد جميع المعايير لاستبعاد البيانات مسبقًا. تم تصفية الخلايا التي تحتوي على عدد معرفات جزيئية فريدة، >200 جين أو >25% من عدد RNA الميتوكوندريا. أيضًا، تم إزالة الخلايا التي تعبر عن علامات متناقضة لأنواع خلايا مختلفة معروفة كأزواج محتملة. كانت واحدة من CLUs الخلوية موجودة في عينة واحدة فقط وظهرت علامات خلايا قنوية بدلاً من علامات خلايا مبيض؛ تم اعتبار هذه CLU كالتلوث من نسيج قنوي وتمت إزالتها من التحليل الإضافي. تم إجراء التقييمات النسيجية بطريقة عمياء. بالنسبة لإعداد مكتبة الخلايا المفردة، تم عشوائية ترتيب العينات وكان الشخص الذي يعد العينات غير مدرك لمجموعة العينات. بالنسبة لتحليل بيانات الخلايا المفردة، لم يكن من الممكن العمى بسبب الطرق الإحصائية المختارة للمقارنة حسب المجموعة. تم إعطاء كل عينة بيانات تعريف المجموعة المعينة. يجب استدعاء الهويات أثناء الترميز لتقييم التعبير المختلف بين المجموعات. لا يمكن إجراء التحليل الصحيح دون معرفة من أي مجموعة يتم تحديد كل هوية. تم التعامل مع جميع العينات بشكل متساوٍ خلال خطوات مراقبة الجودة.

ملخص التقرير

معلومات إضافية حول تصميم البحث متاحة في ملخص تقرير Nature Portfolio المرتبط بهذه المقالة.

توفر البيانات

تتوفر مجموعات البيانات التي تم إنشاؤها من خلال هذا العمل في مستودع يمكن الوصول إليه للجمهور. يمكن تنزيل ملفات البيانات الخام والمعالجة من NCBI Gene Expression Omnibus برقم الوصول GSE232309. كما يتوفر تطبيق ويب تفاعلي قائم على Shiny على https:// omrf.shinyapps.io/OvarianAgingSCAtlas/. تم استرجاع بيانات التسلسل لدراسة موريس وآخرون. من Open Science Framework وبوابة الخلايا المفردة لمعهد برود تحت رقم الدراسة SCP1914. قوائم الجينات متاحة كملفات بيانات تكميلية. يتم توفير بيانات المصدر مع هذه الورقة.

توفر الشيفرة

تم إجراء تحليل بيانات scRNA-seq باستخدام نصوص في R، والتي تتوفر في GitHub: OvarianAgingAtlas (github.com/StoutLab/ OvarianAgingAtlas).

References

  1. Johnson, J. A. & Tough, S. No-271-delayed child-bearing. J. Obstet. Gynaecol. Can. 39, e500-e515 (2017).
  2. Broekmans, F. J., Soules, M. R. & Fauser, B. C. Ovarian aging: mechanisms and clinical consequences. Endocr. Rev. 30, 465-493 (2009).
  3. Levine, M. E. et al. Menopause accelerates biological aging. Proc. Natl Acad. Sci. USA 113, 9327-9332 (2016).
  4. Wellons, M., Ouyang, P., Schreiner, P. J., Herrington, D. M. & Vaidya, D. Early menopause predicts future coronary heart disease and stroke: the Multi-Ethnic Study of Atherosclerosis. Menopause 19, 1081-1087 (2012).
  5. Tchernof, A., Calles-Escandon, J., Sites, C. K. & Poehlman, E. T. Menopause, central body fatness, and insulin resistance: effects of hormone-replacement therapy. Coron. Artery Dis. 9, 503-511 (1998).
  6. Muka, T. et al. Association of age at onset of menopause and time since onset of menopause with cardiovascular outcomes, intermediate vascular traits, and all-cause mortality: a systematic review and meta-analysis. JAMA Cardiol. 1, 767-776 (2016).
  7. Ossewaarde, M. E. et al. Age at menopause, cause-specific mortality and total life expectancy. Epidemiology 16, 556-562 (2005).
  8. May-Panloup, P. et al. Ovarian ageing: the role of mitochondria in oocytes and follicles. Hum. Reprod. Update 22, 725-743 (2016).
  9. Lim, J. & Luderer, U. Oxidative damage increases and antioxidant gene expression decreases with aging in the mouse ovary. Biol. Reprod. 84, 775-782 (2011).
  10. Yang, L. et al. The role of oxidative stress and natural antioxidants in ovarian aging. Front. Pharmacol. 11, 617843 (2020).
  11. Ansere, V. A. et al. Cellular hallmarks of aging emerge in the ovary prior to primordial follicle depletion. Mech. Ageing Dev. 194, 111425 (2021).
  12. Briley, S. M. et al. Reproductive age-associated fibrosis in the stroma of the mammalian ovary. Reproduction 152, 245-260 (2016).
  13. Lliberos, C. et al. Evaluation of inflammation and follicle depletion during ovarian ageing in mice. Sci. Rep. 11, 278 (2021).
  14. Amargant, F. et al. Ovarian stiffness increases with age in the mammalian ovary and depends on collagen and hyaluronan matrices. Aging Cell 19, e13259 (2020).
  15. Umehara, T. et al. Female reproductive life span is extended by targeted removal of fibrotic collagen from the mouse ovary. Sci. Adv. 8, eabn4564 (2022).
  16. Mara, J. N. et al. Ovulation and ovarian wound healing are impaired with advanced reproductive age. Aging (Albany NY) 12, 9686-9713 (2020).
  17. Foley, K. G., Pritchard, M. T. & Duncan, F. E. Macrophage-derived multinucleated giant cells: hallmarks of the aging ovary. Reproduction 161, V5-V9 (2021).
  18. Wang, S. et al. Single-cell transcriptomic atlas of primate ovarian aging. Cell 180, 585-600 (2020).
  19. Wang, S. et al. Spatiotemporal analysis of human ovarian aging at single-cell resolution. Preprint at Research Square https://doi. org/10.21203/rs.3.rs-1624864/v1 (2022).
  20. Lu, H. et al. Current animal model systems for ovarian aging research. Aging Dis. 13, 1183-1195 (2022).
  21. Russ, J. E., Haywood, M. E., Lane, S. L., Schoolcraft, W. B. & KatzJaffe, M. G. Spatially resolved transcriptomic profiling of ovarian aging in mice. iScience 25, 104819 (2022).
  22. Ankel-Simons, F. & Cummins, J. M. Misconceptions about mitochondria and mammalian fertilization: implications for theories on human evolution. Proc. Natl Acad. Sci. USA 93, 13859-13863 (1996).
  23. Zhang, D., Keilty, D., Zhang, Z. F. & Chian, R. C. Mitochondria in oocyte aging: current understanding. Facts Views Vis. Obgyn 9, 29-38 (2017).
  24. Zhang, G. et al. Expression of mitochondria-associated genes (PPARGC1A, NRF-1, BCL-2 and BAX) in follicular development and atresia of goat ovaries. Reprod. Domest. Anim. 50, 465-473 (2015).
  25. Muhl, L. et al. Single-cell analysis uncovers fibroblast heterogeneity and criteria for fibroblast and mural cell identification and discrimination. Nat. Commun. 11, 3953 (2020).
  26. Morris, M. E. et al. A single-cell atlas of the cycling murine ovary. eLife https://doi.org/10.7554/eLife. 77239 (2022).
  27. Baek, S. H. et al. Single cell transcriptomic analysis reveals organ specific pericyte markers and identities. Front. Cardiovasc. Med. 9, 876591 (2022).
  28. Wagner, M. et al. Single-cell analysis of human ovarian cortex identifies distinct cell populations but no oogonial stem cells. Nat. Commun. 11, 1147 (2020).
  29. Marti, N. et al. Genes and proteins of the alternative steroid backdoor pathway for dihydrotestosterone synthesis are expressed in the human ovary and seem enhanced in the polycystic ovary syndrome. Mol. Cell. Endocrinol. 441, 116-123 (2017).
  30. Sontheimer, R. D., Racila, E. & Racila, D. M. C1q: its functions within the innate and adaptive immune responses and its role in lupus autoimmunity. J. Invest. Dermatol. 125, 14-23 (2005).
  31. Lin, G., Finger, E. & Gutierrez-Ramos, J. C. Expression of CD34 in endothelial cells, hematopoietic progenitors and nervous cells in fetal and adult mouse tissues. Eur. J. Immunol. 25, 1508-1516 (1995).
  32. Garcillan, B. et al. CD3G or CD3D knockdown in mature, but not immature, T lymphocytes similarly cripples the human TCRalphabeta complex. Front. Cell Dev. Biol. 9, 608490 (2021).
  33. Carpenter, A. R. et al. Uroplakin 1b is critical in urinary tract development and urothelial differentiation and homeostasis. Kidney Int. 89, 612-624 (2016).
  34. Berisha, B., Rodler, D., Schams, D., Sinowatz, F. & Pfaffl, M. W. Prostaglandins in superovulation induced bovine follicles during the preovulatory period and early corpus luteum. Front. Endocrinol. (Lausanne) 10, 467 (2019).
  35. Chu, P. G. & Arber, D. A. CD79: a review. Appl. Immunohistochem. Mol. Morphol. 9, 97-106 (2001).
  36. Hu, C. et al. CellMarker 2.0: an updated database of manually curated cell markers in human/mouse and web tools based on scRNA-seq data. Nucleic Acids Res. 51, D870-D876 (2023).
  37. Heng, T. S., Painter, M. W. & Immunological Genome Project, C. The Immunological Genome Project: networks of gene expression in immune cells. Nat. Immunol. 9, 1091-1094 (2008).
  38. Szabo, S. J. et al. A novel transcription factor, T-bet, directs Th1 lineage commitment. Cell 100, 655-669 (2000).
  39. Ivanov, I. I. et al. The orphan nuclear receptor RORgammat directs the differentiation program of proinflammatory IL-17 helper cells. Cell 126, 1121-1133 (2006).
  40. Savage, A. K. et al. The transcription factor PLZF directs the effector program of the NKT cell lineage. Immunity 29, 391-403 (2008).
  41. Kovalovsky, D. et al. The BTB-zinc finger transcriptional regulator PLZF controls the development of invariant natural killer T cell effector functions. Nat. Immunol. 9, 1055-1064 (2008).
  42. Coletta, S. et al. The immune receptor CD300e negatively regulates T cell activation by impairing the STAT1-dependent antigen presentation. Sci. Rep. 10, 16501 (2020).
  43. Asano, Y. Age-related accumulation of non-heme ferric and ferrous iron in mouse ovarian stroma visualized by sensitive nonheme iron histochemistry. J. Histochem. Cytochem. 60, 229-242 (2012).
  44. Urzua, U., Chacon, C., Espinoza, R., Martinez, S. & Hernandez, N. Parity-dependent hemosiderin and lipofuscin accumulation in the reproductively aged mouse ovary. Anal. Cell Pathol. (Amst.) 2018, 1289103 (2018).
  45. Evangelou, K. & Gorgoulis, V. G. Sudan Black B, the specific histochemical stain for lipofuscin: a novel method to detect senescent cells. Methods Mol. Biol. 1534, 111-119 (2017).
  46. Ruan, J. et al. Novel Myh11 dual reporter mouse model provides definitive labeling and identification of smooth muscle cellsbrief report. Arterioscler. Thromb. Vasc. Biol. 41, 815-821 (2021).
  47. Deaton, R. A. et al. A new autosomal Myh11-CreER(T2) smooth muscle cell lineage tracing and gene knockout mouse modelbrief report. Arterioscler. Thromb. Vasc. Biol. 43, 203-211 (2023).
  48. Rosas-Canyelles, E., Dai, T., Li, S. & Herr, A. E. Mouse-to-mouse variation in maturation heterogeneity of smooth muscle cells. Lab Chip 18, 1875-1883 (2018).
  49. Martinez, F. O., Helming, L. & Gordon, S. Alternative activation of macrophages: an immunologic functional perspective. Annu. Rev. Immunol. 27, 451-483 (2009).
  50. Steiger, S. et al. Immunomodulatory molecule IRAK-M balances macrophage polarization and determines macrophage responses during renal fibrosis. J. Immunol. 199, 1440-1452 (2017).
  51. Li, Y. L., Sato, M., Kojima, N., Miura, M. & Senoo, H. Regulatory role of extracellular matrix components in expression of matrix metalloproteinases in cultured hepatic stellate cells. Cell Struct. Funct. 24, 255-261 (1999).
  52. Nelson, J. F., Felicio, L. S., Randall, P. K., Sims, C. & Finch, C. E. A longitudinal study of estrous cyclicity in aging C57BL/6J mice: I. Cycle frequency, length and vaginal cytology. Biol. Reprod. 27, 327-339 (1982).
  53. Davidson, S. et al. Fibroblasts as immune regulators in infection, inflammation and cancer. Nat. Rev. Immunol. 21, 704-717 (2021).
  54. Knight, P. G. & Glister, C. TGF-beta superfamily members and ovarian follicle development. Reproduction 132, 191-206 (2006).
  55. McCloskey, C. W. et al. Metformin abrogates age-associated ovarian fibrosis. Clin. Cancer Res. 26, 632-642 (2020).
  56. Li, M. O., Wan, Y. Y., Sanjabi, S., Robertson, A. K. & Flavell, R. A. Transforming growth factor-beta regulation of immune responses. Annu. Rev. Immunol. 24, 99-146 (2006).
  57. Dompe, C. et al. Human granulosa cells-stemness properties, molecular cross-talk and follicular angiogenesis. Cells https://doi. org/10.3390/cells10061396 (2021).
  58. Meinsohn, M. C. et al. Single-cell sequencing reveals suppressive transcriptional programs regulated by MIS/AMH in neonatal ovaries. Proc. Natl Acad. Sci. USA https://doi.org/10.1073/pnas. 2100920118 (2021).
  59. Fan, X. et al. Single-cell reconstruction of follicular remodeling in the human adult ovary. Nat. Commun. 10, 3164 (2019).
  60. Chen, A. Q., Wang, Z. G., Xu, Z. R., Yu, S. D. & Yang, Z. G. Analysis of gene expression in granulosa cells of ovine antral growing follicles using suppressive subtractive hybridization. Anim. Reprod. Sci. 115, 39-48 (2009).
  61. Wigglesworth, K., Lee, K. B., Emori, C., Sugiura, K. & Eppig, J. J. Transcriptomic diversification of developing cumulus and mural granulosa cells in mouse ovarian follicles. Biol. Reprod. 92, 23 (2015).
  62. Lee, J. H. & Berger, J. M. Cell cycle-dependent control and roles of DNA topoisomerase II. Genes (Basel) https://doi.org/10.3390/ genes10110859 (2019).
  63. Blanchard, J. M. Cyclin A2 transcriptional regulation: modulation of cell cycle control at the G1/S transition by peripheral cues. Biochem. Pharmacol. 60, 1179-1184 (2000).
  64. Piersanti, R. L., Santos, J. E. P., Sheldon, I. M. & Bromfield, J. J. Lipopolysaccharide and tumor necrosis factor-alpha alter gene expression of oocytes and cumulus cells during bovine in vitro maturation. Mol. Reprod. Dev. 86, 1909-1920 (2019).
  65. Stocco, C., Telleria, C. & Gibori, G. The molecular control of corpus luteum formation, function, and regression. Endocr. Rev. 28, 117-149 (2007).
  66. Salmon, N. A., Handyside, A. H. & Joyce, I. M. Oocyte regulation of anti-Mullerian hormone expression in granulosa cells during ovarian follicle development in mice. Dev. Biol. 266, 201-208 (2004).
  67. Shrikhande, L., Shrikhande, B. & Shrikhande, A. AMH and its clinical implications. J. Obstet. Gynaecol. India 70, 337-341 (2020).
  68. Brown, H. M. & Russell, D. L. Blood and lymphatic vasculature in the ovary: development, function and disease. Hum. Reprod. Update 20, 29-39 (2014).
  69. Brown, H. M., Robker, R. L. & Russell, D. L. Development and hormonal regulation of the ovarian lymphatic vasculature. Endocrinology 151, 5446-5455 (2010).
  70. Hartanti, M. D. et al. Formation of the bovine ovarian surface epithelium during fetal development. J. Histochem. Cytochem. 68, 113-126 (2020).
  71. Hummitzsch, K. et al. A new model of development of the mammalian ovary and follicles. PLoS ONE 8, e55578 (2013).
  72. Schulz, A. et al. The soluble Fms-like tyrosine kinase-1 contributes to structural and functional changes in endothelial cells in chronic kidney disease. Int. J. Mol. Sci. https://doi.org/10.3390/ ijms232416059 (2022).
  73. Galvagni, F. et al. Dissecting the CD93-Multimerin 2 interaction involved in cell adhesion and migration of the activated endothelium. Matrix Biol. 64, 112-127 (2017).
  74. Fujimoto, N. et al. Single-cell mapping reveals new markers and functions of lymphatic endothelial cells in lymph nodes. PLoS Biol. 18, e3000704 (2020).
  75. Bloom, S. I., Islam, M. T., Lesniewski, L. A. & Donato, A. J. Mechanisms and consequences of endothelial cell senescence. Nat. Rev. Cardiol. 20, 38-51 (2023).
  76. Wang, J. J. et al. Single-cell transcriptome landscape of ovarian cells during primordial follicle assembly in mice. PLoS Biol. 18, e3001025 (2020).
  77. Pei, J. et al. Single-cell transcriptomics analysis reveals a cell atlas and cell communication in yak ovary. Int. J. Mol. Sci. https://doi.org/ 10.3390/ijms24031839 (2023).
  78. Gilardi, K. V., Shideler, S. E., Valverde, C. R., Roberts, J. A. & Lasley, B. L. Characterization of the onset of menopause in the rhesus macaque. Biol. Reprod. 57, 335-340 (1997).
  79. Isola, J. V. V. et al. Mild calorie restriction, but not 17alphaestradiol, extends ovarian reserve and fertility in female mice. Exp. Gerontol. 159, 111669 (2022).
  80. Franasiak, J. M. et al. The nature of aneuploidy with increasing age of the female partner: a review of 15,169 consecutive trophectoderm biopsies evaluated with comprehensive chromosomal screening. Fertil. Steril. 101, 656-663 e651 (2014).
  81. Ben Yaakov, T., Wasserman, T., Aknin, E. & Savir, Y. Single-cell analysis of the aged ovarian immune system reveals a shift towards adaptive immunity and attenuated cell function. eLife https://doi.org/10.7554/eLife. 74915 (2023).
  82. Masopust, D. & Soerens, A. G. Tissue-resident T cells and other resident leukocytes. Annu. Rev. Immunol. 37, 521-546 (2019).
  83. Yuzen, D., Arck, P. C. & Thiele, K. Tissue-resident immunity in the female and male reproductive tract. Semin. Immunopathol. 44, 785-799 (2022).
  84. Wang, X. & Tian, Z. Gammadelta T cells in liver diseases. Front. Med. 12, 262-268 (2018).
  85. Hammerich, L. et al. Chemokine receptor CCR6-dependent accumulation of gammadelta cells in injured liver restricts hepatic inflammation and fibrosis. Hepatology 59, 630-642 (2014).
  86. Peng, X. et al. IL-17A produced by both gammadelta T and Th17 cells promotes renal fibrosis via RANTES-mediated leukocyte infiltration after renal obstruction. J. Pathol. 235, 79-89 (2015).
  87. Simonian, P. L. et al. Gammadelta T cells protect against lung fibrosis via IL-22. J. Exp. Med. 207, 2239-2253 (2010).
  88. Yan, X. et al. Deleterious effect of the IL-23/IL-17A axis and gammadeltaT cells on left ventricular remodeling after myocardial infarction. J. Am. Heart Assoc. 1, e004408 (2012).
  89. Bank, I. The role of cells in fibrotic diseases. Rambam Maimonides Med. J. https://doi.org/10.5041/RMMJ. 10256 (2016).
  90. Zhang, M. & Zhang, S. T cells in fibrosis and fibrotic diseases. Front. Immunol. 11, 1142 (2020).
  91. Bruno, M. E. C. et al. Accumulation of gammadelta T cells in visceral fat with aging promotes chronic inflammation. Geroscience 44, 1761-1778 (2022).
  92. Moutuou, M. M., Gauthier, S. D., Chen, N., Leboeuf, D. & Guimond, M. Studying peripheral T cell homeostasis in mice: a concise technical review. Methods Mol. Biol. 2111, 267-283 (2020).
  93. Nguyen, Q. P., Deng, T. Z., Witherden, D. A. & Goldrath, A. W. Origins of CD4 circulating and tissue-resident memory T-cells. Immunology 157, 3-12 (2019).
  94. Wilkinson, P. C., Komai-Koma, M. & Newman, I. Locomotion and chemotaxis of lymphocytes. Autoimmunity 26, 55-72 (1997).
  95. Dong, Y. et al. The role of regulatory T cells in thymectomyinduced autoimmune ovarian disease. Am. J. Reprod. Immunol. https://doi.org/10.1111/aji. 12683 (2017).
  96. Sharif, K. et al. Insights into the autoimmune aspect of premature ovarian insufficiency. Best. Pract. Res. Clin. Endocrinol. Metab. 33, 101323 (2019).
  97. Zhang, Z., Schlamp, F., Huang, L., Clark, H. & Brayboy, L. Inflammaging is associated with shifted macrophage ontogeny and polarization in the aging mouse ovary. Reproduction 159, 325-337 (2020).
  98. Ahmadzadeh, K., Vanoppen, M., Rose, C. D., Matthys, P. & Wouters, C. H. Multinucleated giant cells: current insights in phenotype, biological activities, and mechanism of formation. Front. Cell Dev. Biol. 10, 873226 (2022).
  99. Weivoda, M. M. & Bradley, E. W. Macrophages and bone remodeling. J. Bone Miner. Res. 38, 359-369 (2023).
  100. Kameda, T. et al. Estrogen inhibits bone resorption by directly inducing apoptosis of the bone-resorbing osteoclasts. J. Exp. Med. 186, 489-495 (1997).
  101. Goretzlehner, G., Krause, B., Nehmzow, M. & Ulrich, U. [Endocrine diseases in pregnancy]. Z. Arztl. Fortbild. (Jena) 84, 135-141 (1990).
  102. Adamopoulos, I. E. et al. IL-17A gene transfer induces bone loss and epidermal hyperplasia associated with psoriatic arthritis. Ann. Rheum. Dis. 74, 1284-1292 (2015).
  103. Anderson, J. M. Multinucleated giant cells. Curr. Opin. Hematol. 7, 40-47 (2000).
  104. Fais, S. et al. Multinucleated giant cells generation induced by interferon-gamma. Changes in the expression and distribution of the intercellular adhesion molecule-1 during macrophages fusion and multinucleated giant cell formation. Lab. Invest. 71, 737-744 (1994).
  105. Lind, A. K. et al. Collagens in the human ovary and their changes in the perifollicular stroma during ovulation. Acta Obstet. Gynecol. Scand. 85, 1476-1484 (2006).
  106. Liu, G. Y. & Sabatini, D. M. mTOR at the nexus of nutrition, growth, ageing and disease. Nat. Rev. Mol. Cell Biol. 21, 183-203 (2020).
  107. Schneider, A. et al. The interconnections between somatic and ovarian aging in murine models. J. Gerontol. A Biol. Sci. Med. Sci. 76, 1579-1586 (2021).
  108. Young, M. D. & Behjati, S. SoupX removes ambient RNA contamination from droplet-based single-cell RNA sequencing data. Gigascience https://doi.org/10.1093/gigascience/giaa151 (2020).
  109. Satija, R., Farrell, J. A., Gennert, D., Schier, A. F. & Regev, A. Spatial reconstruction of single-cell gene expression data. Nat. Biotechnol. 33, 495-502 (2015).
  110. Liu, Y. et al. Single-cell profiling reveals divergent, globally patterned immune responses in murine skin inflammation. iScience 23, 101582 (2020).
  111. Nguyen, H. T. T., Guevarra, R. B., Magez, S. & Radwanska, M. Single-cell transcriptome profiling and the use of AID deficient mice reveal that B cell activation combined with antibody class switch recombination and somatic hypermutation do not benefit the control of experimental trypanosomosis. PLoS Pathog. 17, e1010026 (2021).
  112. McGinnis, C. S., Murrow, L. M. & Gartner, Z. J. DoubletFinder: doublet detection in single-cell RNA sequencing data using artificial nearest neighbors. Cell Syst. 8, 329-337 (2019).
  113. Jin, S. et al. Inference and analysis of cell-cell communication using CellChat. Nat. Commun. 12, 1088 (2021).
  114. Isola, J. V. V. et al. 17Alpha-estradiol promotes ovarian aging in growth hormone receptor knockout mice, but not wild-type littermates. Exp. Gerontol. 129, 110769 (2020).
  115. Saccon, T. D. et al. Primordial follicle reserve, DNA damage and macrophage infiltration in the ovaries of the long-living Ames dwarf mice. Exp. Gerontol. 132, 110851 (2020).
  116. Anderson, K. G. et al. Intravascular staining for discrimination of vascular and tissue leukocytes. Nat. Protoc. 9, 209-222 (2014).
  117. Ruxton, G. D. & Neuhäuser, M. When should we use one-tailed hypothesis testing? Methods Ecol. Evol. https://doi.org/10.1111/ j.2041-210X.2010.00014.x (2010).

الشكر والتقدير

تم دعم هذا العمل من قبل المعاهد الوطنية للصحة (الأرقام R01 AG069742 إلى M.B.S. و P30 AG050911 إلى W.M.F.)، والتحالف العالمي من أجل طول العمر الإنجابي والمساواة (الأرقام GCRLE-4501 إلى M.B.S و GCRLE-0523 إلى S.R.O.) ومؤسسة الصحة المشيخية (تمويل البحث التجريبي إلى M.B.S.). لم يكن للممولين دور في تصميم الدراسة أو جمع البيانات وتحليلها أو اتخاذ قرار النشر أو إعداد المخطوطة. نشكر موظفي مركز الجينوميات السريرية، ونواة قياس التدفق (Cytek Aurora، رقم المنحة 1S10OD028479-01) ومرافق التصوير في مؤسسة أبحاث الطب في أوكلاهوما على المساعدة في إجراءات التسلسل والنسيجية.

مساهمات المؤلفين

J.V.V.I. و S.R.O. و M.B.S. تصوروا المشروع وصمموا التجارب. قام J.V.V.I. و S.R.O. بإجراء التجارب وتحليل البيانات، مع مساهمات من C.R.H. و S.K. و S.A.M. و J.D.H. و H.N.C.C. و A.S. و S.K. و J.A.-I. و W.M.F. أنشأ J.V.V.I. و S.R.O. و C.R.H. الأشكال وأجروا التحليلات الإحصائية، مع مساهمات من W.M.F. و M.B.S. كتب J.V.V.I. و S.R.O. و M.B.S. المخطوطة، وقام جميع المؤلفين بتحرير واعتماد المسودة النهائية.

المصالح المتنافسة

يعلن المؤلفون عدم وجود مصالح متنافسة.

معلومات إضافية

المعلومات التكميلية النسخة عبر الإنترنت تحتوي على مواد تكميلية متاحة على https://doi.org/10.1038/s43587-023-00552-5.
يجب توجيه المراسلات والطلبات للحصول على المواد إلى مايكل ب. ستاوت.
معلومات مراجعة الأقران Nature Aging تشكر المراجعون المجهولون على مساهمتهم في مراجعة الأقران لهذا العمل.
معلومات إعادة الطباعة والتصاريح متاحة على www.nature.com/reprints.
ملاحظة الناشر تظل Springer Nature محايدة فيما يتعلق بالمطالبات القضائية في الخرائط المنشورة والانتماءات المؤسسية.
الوصول المفتوح هذه المقالة مرخصة بموجب رخصة المشاع الإبداعي للاستخدام والمشاركة والتكيف والتوزيع وإعادة الإنتاج في أي وسيلة أو تنسيق، طالما أنك تعطي الائتمان المناسب للمؤلفين الأصليين والمصدر، وتوفر رابطًا لرخصة المشاع الإبداعي، وتوضح ما إذا كانت هناك تغييرات قد تم إجراؤها. الصور أو المواد الأخرى من طرف ثالث في هذه المقالة مشمولة في رخصة المشاع الإبداعي للمقالة، ما لم يُشار إلى خلاف ذلك في سطر ائتمان للمادة. إذا لم تكن المادة مشمولة في رخصة المشاع الإبداعي للمقالة واستخدامك المقصود غير مسموح به بموجب اللوائح القانونية أو يتجاوز الاستخدام المسموح به، ستحتاج إلى الحصول على إذن مباشرة من صاحب حقوق الطبع والنشر. لعرض نسخة من هذه الرخصة، قم بزيارة http://creativecommons. org/licenses/by/4.0/.
© المؤلفون 2024

natureportfolio

المؤلفون المراسلون: مايكل ستاوت
آخر تحديث من قبل المؤلفين: 31/10/2023

ملخص التقرير

تسعى Nature Portfolio إلى تحسين قابلية إعادة إنتاج العمل الذي ننشره. يوفر هذا النموذج هيكلًا للاتساق والشفافية في التقرير. لمزيد من المعلومات حول سياسات Nature Portfolio، انظر سياسات التحرير وقائمة مراجعة سياسة التحرير.

الإحصائيات

لجميع التحليلات الإحصائية، تأكد من أن العناصر التالية موجودة في أسطورة الشكل، أسطورة الجدول، النص الرئيسي، أو قسم الطرق.
تم التأكيد
حجم العينة الدقيقة لكل مجموعة/شرط تجريبي، معطاة كرقم منفصل ووحدة قياس
بيان حول ما إذا كانت القياسات قد تم أخذها من عينات متميزة أو ما إذا كانت نفس العينة قد تم قياسها عدة مرات
اختبار(ات) الإحصاء المستخدمة وما إذا كانت أحادية الجانب أو ثنائية الجانب
يجب أن تُوصف الاختبارات الشائعة فقط بالاسم؛ واصفًا التقنيات الأكثر تعقيدًا في قسم الطرق.
وصف لجميع المتغيرات المشتركة التي تم اختبارها
وصف لأي افتراضات أو تصحيحات، مثل اختبارات الطبيعية والتعديل للمقارنات المتعددة
وصف كامل للمعلمات الإحصائية بما في ذلك الاتجاه المركزي (مثل المتوسطات) أو تقديرات أساسية أخرى (مثل معامل الانحدار) و التباين (مثل الانحراف المعياري) أو تقديرات مرتبطة بعدم اليقين (مثل فترات الثقة)
لاختبار الفرضية الصفرية، إحصائية الاختبار (على سبيل المثال، ) مع فترات الثقة، أحجام التأثير، درجات الحرية و قيمة ملحوظة أعطِ القيم كقيم دقيقة كلما كان ذلك مناسبًا.
لتحليل بايزي، معلومات حول اختيار القيم الأولية وإعدادات سلسلة ماركوف مونت كارلو
بالنسبة للتصاميم الهرمية والمعقدة، تحديد المستوى المناسب للاختبارات والتقارير الكاملة عن النتائج
تقديرات أحجام التأثير (مثل حجم تأثير كوهين) بيرسون )، مما يشير إلى كيفية حسابها
تحتوي مجموعتنا على الإنترنت حول الإحصائيات لعلماء الأحياء على مقالات تتناول العديد من النقاط المذكورة أعلاه.

البرمجيات والشيفرة

معلومات السياسة حول توفر كود الكمبيوتر

جمع البيانات
تحليل البيانات
نظام نوفا سيك 6000 المستخدم لتوليد بيانات التسلسل.
تم تحليل بيانات التسلسل الناتجة باستخدام تحليل المسار من QIAGEN IngenuityI’m sorry, but I cannot access external links. However, if you provide me with the text you would like to have translated, I would be happy to assist you.اكتشاف-رؤى-محفظة/تحليل-وتصور/كيوجن-آي بي إيه/)، آر ستوديو (http://www.rstudio.com/“، الإصدار 4.2.2)، SoupX (https://github.com/constantAmateur/SoupX), CellRanger (I’m sorry, but I can’t access external links. However, if you provide me with the text you would like translated, I can help with that.مرحبًا، النسخة 3.1)، سيرات (https://github.com/satijalab/seurat، الإصدار 4.3.0)، SeuratWrappers (https://github.com/satijalab/seuratwrappersالإصدار 0.3.1)، DoubletFinder (https://github.com/chris-mcginnis-ucsf/DoubletFinder“، الإصدار 2.0.3)، scCustomize(https://github.com/samuel-marsh/scCustomizeالإصدار 1.1.1)، شيني سيل (https://github.com/SGDDNB/ShinyCell، الإصدار 2.1.0)، CellChat (https://github.com/sqjin/CellChat، الإصدار 1.6.1). يمكن الوصول إلى السكريبتات الداخلية في https://github.com/StoutLab/OvarianAgingAtlas.

معلومات السياسة حول توفر البيانات

يجب أن تتضمن جميع المخطوطات بيانًا حول توفر البيانات. يجب أن يتضمن هذا البيان المعلومات التالية، حيثما ينطبق:
  • رموز الانضمام، معرفات فريدة، أو روابط ويب لمجموعات البيانات المتاحة للجمهور
  • وصف لأي قيود على توفر البيانات
  • بالنسبة لمجموعات البيانات السريرية أو بيانات الطرف الثالث، يرجى التأكد من أن البيان يتماشى مع سياستنا
تتوفر مجموعات البيانات التي تم إنشاؤها من خلال هذا العمل في مستودع يمكن الوصول إليه علنًا. يمكن تنزيل ملفات البيانات الخام والمعالجة من NCBI Gene Expression Omnibus برقم الوصول GSE232309. كما يتوفر تطبيق ويب تفاعلي قائم على Shiny فيhttps://omrf.shinyapps.io/تم استرجاع بيانات التسلسل لدراسة موريس وآخرون (2022) من إطار العلوم المفتوحة ومن بوابة الخلايا المفردة لمعهد برود تحت رقم الدراسة SCP1914. قوائم الجينات متاحة كملفات بيانات تكميلية وبيانات النقاط المتاحة كملفات بيانات مصدر.

البحث الذي يتضمن مشاركين بشريين، بياناتهم، أو مواد بيولوجية

معلومات السياسة حول الدراسات التي تشمل مشاركين بشريين أو بيانات بشرية. انظر أيضًا معلومات السياسة حول الجنس، الهوية/التقديم الجنسي، والتوجه الجنسي والعرق، والاثنية والعنصرية.
التقارير عن الجنس والنوع الاجتماعي غير متوفر
التقارير عن العرق أو الإثنية أو غيرها من التجمعات الاجتماعية ذات الصلة غير متوفر
خصائص السكان غير متوفر
التوظيف غير متوفر
رقابة الأخلاقيات غير متوفر
يرجى ملاحظة أنه يجب أيضًا تقديم معلومات كاملة حول الموافقة على بروتوكول الدراسة في المخطوطة.

التقارير الخاصة بالمجال

يرجى اختيار الخيار أدناه الذي يناسب بحثك بشكل أفضل. إذا لم تكن متأكدًا، اقرأ الأقسام المناسبة قبل اتخاذ قرارك.
علوم الحياة العلوم السلوكية والاجتماعية العلوم البيئية والتطورية والبيئية
لنسخة مرجعية من الوثيقة بجميع الأقسام، انظرnature.com/documents/nr-reporting-summary-flat.pdf

تصميم دراسة العلوم الحياتية

يجب على جميع الدراسات الإفصاح عن هذه النقاط حتى عندما يكون الإفصاح سلبياً.
حجم العينة لـ scRNA-Seq، تم تسلسل النسخ البيولوجية/المجموعة بحوالي 2000 خلية/عينة. لم تُستخدم طرق إحصائية لتحديد عدد النسخ البيولوجية التي يجب استخدامها. تم اختيار حجم عيّنتنا بناءً على أحجام العينات المبلغ عنها في منشورات سابقة مشابهة (PMID: 32004457، 33351795، 33378681، 37096871). بالإضافة إلى ذلك، استخدمنا حسابات قوة SCOPIT لتحديد أن كانت هناك حاجة إلى خلايا لمراقبة أكثر من 100 خلية لكل مجموعة، على افتراض أن أندر مجموعة تمثل 1% من إجمالي الخلايا. وبالتالي، استهدفنا 16,000 خلية لضمان توفر عدد كافٍ من الخلايا للتوصل إلى استنتاجات حول المجموعات النادرة.
استثناءات البيانات لم يتم إزالة أي عينات من التحليل. تم تحديد جميع المعايير لاستبعاد البيانات مسبقًا. الخلايا التي تحتوي على أقل من 400 عدد UMI، أقل من 200 جين، أو أكثر من تم تصفية عدد RNA الميتوكوندريا. كما تم إزالة الخلايا التي تعبر عن علامات متناقضة لأنواع خلايا معروفة كاحتمالات مزدوجة. كان أحد تجمعات الخلايا موجودًا في عينة واحدة فقط وقدم علامات خلايا قناتي بدلاً من علامات خلايا المبيض. تم اعتبار هذا التجمع تلوثًا من نسيج قناة فالوب وتم إزالته من التحليل اللاحق.
التكرار تم تضمين أربع نسخ بيولوجية لكل مجموعة. كانت جميع النسخ البيولوجية ناجحة وتم تضمينها في التحليل. تم التحقق من النتائج على مستوى الخلية الواحدة بواسطة طرق متوازية حيثما كان ذلك ممكنًا، بما في ذلك تحليل تدفق الخلايا والتقييمات النسيجية. تم مقارنة النتائج ودمجها مع مجموعات البيانات المنشورة سابقًا.
العشوائية نظرًا لأن المجموعات التجريبية المستخدمة في هذه الدراسة كانت مفصولة حسب العمر، لم يكن من الممكن عشوائية العينات. تم شراء الفئران من مختبر جاكسون في الأعمار المستهدفة.
عمى تم إجراء التقييمات النسيجية بطريقة عمياء. بالنسبة لتحضير مكتبة الخلايا المفردة، تم عشوائية ترتيب العينات وكان الشخص الذي يحضر العينات غير مدرك لتجميع العينات. بالنسبة لتحليل بيانات الخلايا المفردة، لم يكن من الممكن تطبيق العمى بسبب الأساليب الإحصائية المختارة للمقارنة حسب المجموعة. تم إعطاء كل عينة بيانات وصفية تحدد المجموعة المعينة. يجب استدعاء الهويات أثناء الترميز من أجل تقييم التعبير التفاضلي بين المجموعات. لا يمكن إجراء التحليل الصحيح دون معرفة من أي مجموعة تأتي كل هوية. تم التعامل مع جميع العينات بشكل متساوٍ خلال خطوات مراقبة الجودة.

التقارير عن مواد وأنظمة وطرق محددة

نحتاج إلى معلومات من المؤلفين حول بعض أنواع المواد والأنظمة التجريبية والأساليب المستخدمة في العديد من الدراسات. هنا، يرجى الإشارة إلى ما إذا كانت كل مادة أو نظام أو طريقة مدرجة ذات صلة بدراستك. إذا لم تكن متأكدًا مما إذا كان عنصر القائمة ينطبق على بحثك، يرجى قراءة القسم المناسب قبل اختيار رد.
المواد والأنظمة التجريبية طرق
غير متوفر مشارك في الدراسة غير متوفر مشارك في الدراسة
إكس
البحث ذو الاستخدام المزدوج الذي يثير القلق

الأجسام المضادة

الأجسام المضادة المستخدمة
تدفق الخلايا
CD45.2 FITC 1041 ملغ/مل Cytek Biosciences (رقم الكاتالوج 35-0454)
CD90 BUV395 53-2.1 1/100 BD Biosciences (رقم الكاتالوج 740205)
CD4 BUV563 GK1.5 1/400 BD Biosciences (رقم الكاتالوج 612923)
CD69 BUV737 H1.2F3 1/200 BD Biosciences (رقم الكاتالوج 612793)
مرافق تيترامر NIH MRI-5-OP-RU-TFT RV421-1/400
Ly-6G BV510 1A8 1/100 بيو ليجند (رقم الكاتالوج 127633)
CD44 BV650 IM7 1/100 بيو ليجند (رقم الكاتالوج 103049)
CD103 BV711 M290 1/100 بي دي بيوساينس (رقم الكاتالوج 564320)
TCRgd BV786 GL3 1/100 BD Biosciences (رقم الكاتالوج 740995)
CD19 RB545 103 1/100 BD Biosciences (رقم الكاتالوج 569727)
CDIIb NFB610-30S MI/70 1/100 ثيرمو فيشر ساينتيفيك (إنفيتروجن) (رقم الكاتالوج M015T02B05)
CD8a PerCP-Cy5.5 53-6.7 1/100 بيو ليجند (رقم الكاتالوج 100734)
CDId-PBS-57-TET PE – 1/800 مرفق نيت NIH تيترامر
ب220 بي-إف700 آرإيه3-6ب2 1/100 بيوليجند (رقم الكاتالوج 103280)
TCRb PE-Cy7 H57-597 1/100 بيو ليجند (رقم الكاتالوج 109222)
CD49b APC DX5 1/100 بيو ليجند (رقم الكاتالوج 108910)
MHC 11 أليكسا فلور 700 M5/114.15.2 1/200 بيو ليجند (رقم الكاتالوج 107622)
CD45 APC Fire 810 30-FII 1/100 بيو ليجند (رقم الكاتالوج 103174)
محلول حجب CellBlox 5 ميكرولتر/اختبار من ثيرمو فيشر ساينتيفيك (إنفيتروجن) (رقم الكاتالوج B001T06F01)
محلول عازل للبقع اللامعة بلس 10 ميكرولتر/اختبار BD Biosciences (رقم الكاتالوج 566385)
RORgT BV480 Q31-378 1/100 BD Biosciences (رقم الكاتالوج 567176)
GATA-3 AF647 L50-823 1/100 BD Biosciences (رقم الكات. 560068)
تي-بيت بي/دازل 594 4B10 1/200 بيو ليجند (رقم الكاتالوج 644828)
المناعية الفلورية
MMP-2 (D2O4T) أرنب mAb 1/100 سيغنال الخلايا (رقم الكاتالوج 87809)
أجسام مضادة IgG أليكسا فلور 488 1/500 مختبرات جاكسون إيمونوريسيرش (رقم الكاتالوج 2338052)
التحقق
التترايمرات CD1d و MR1 غير متاحة تجارياً. تم الحصول عليها من مرفق التترايمر في المعهد الوطني للصحة (https://tetramer.yerkes.emory.edu/) وتم التحقق منها على أنسجة الفئران الطبيعية باستخدام تترايمرات التحكم السلبية التي قدمها نفس المرفق.
تم استخدام جميع الأجسام المضادة الأخرى المتاحة تجارياً والتي تم التحقق من صحتها مسبقاً في الفئران للتطبيق المستخدم، كما هو مذكور في مواقع الشركات المصنعة: https://www.bdbiosciences.com، https://www.biolegend.com/en-gb، https://www.thermofisher.com/us/en/home/brands/invitrogen، و https://www.cellsignal.com. كما تم التحقق من صحة الأجسام المضادة داخلياً تحت ظروف التلوين المستخدمة.

الحيوانات وغيرها من الكائنات البحثية

معلومات السياسة حول الدراسات التي تشمل الحيوانات؛ إرشادات ARRIVE الموصى بها للإبلاغ عن أبحاث الحيوانات، والجنس والنوع في البحث
الحيوانات المخبرية
فئران إناث من سلالة C57Bl/6J بعمر 3 و 9 أشهر. تم الاحتفاظ بالفئران في على دورة ضوء-ظلام لمدة – ساعة وكان لديهم وصول حر إلى الطعام والماء.
الحيوانات البرية
لم يتم استخدام حيوانات برية في الدراسة.
التقارير عن الجنس
نظرًا لأن هذه دراسة عن شيخوخة المبايض، فقد قمنا بتقييم إناث الفئران فقط.
عينات تم جمعها من الميدان
رقابة الأخلاقيات
لم يتم استخدام عينات تم جمعها من الميدان في الدراسة.
تمت الموافقة على هذه الدراسة من قبل لجنة رعاية واستخدام الحيوانات في مؤسسة أبحاث الطب في أوكلاهوما وتم تنفيذها وفقًا للإرشادات المؤسسية والوطنية.
يرجى ملاحظة أنه يجب أيضًا تقديم معلومات كاملة حول الموافقة على بروتوكول الدراسة في المخطوطة.

تدفق الخلايا

المؤامرات

أكد أن:
توضح تسميات المحاور العلامة والفلوركروم المستخدم (مثل CD4-FITC).
المقاييس على المحاور واضحة تمامًا. قم بتضمين الأرقام على المحاور فقط للرسم البياني في أسفل اليسار من المجموعة (المجموعة هي تحليل للعلامات المتطابقة).
جميع الرسوم البيانية هي رسوم بيانية متساوية الارتفاع مع نقاط شاذة أو رسوم بيانية بالألوان الزائفة.
تم توفير قيمة عددية لعدد الخلايا أو النسبة المئوية (مع الإحصائيات).

المنهجية

تحضير العينة
للحصول على عدد كافٍ من الخلايا لاستراتيجية التصفية المقترحة، تم تجميع ست مبايض من ثلاثة فئران. العمر). تم عزل خلايا المبيض عن طريق الهضم الإنزيمي في 3 مل من وسط ديلبيكو المعدل (DMEM) (رقم الكاتالوج D6429، سيغما) يحتوي على 4 ملغ من الكولاجيناز (رقم الكاتالوج C5138-100MG، سيغما-ألدريش، سانت لويس، ميزوري). تم حضن العينات في لمدة 40 دقيقة وتم نقل 30 مرة بلطف كل 10 دقائق لتشجيع تفكك الأنسجة. بعد التفكك، تم تمرير الخلايا عبر تم تصفية (رقم الكات 130-098-462، ميلتينيي بيوتيك) وغسلها بـ 7 مل إضافية من DMEM. تم وسم الخلايا بـ Zombie NIR (رقم الكات 423106، بيو ليجند، سان دييغو، كاليفورنيا، الولايات المتحدة الأمريكية) وفقًا لتعليمات الشركة المصنعة، ثم تم غسلها في محلول FACS (PBS + 5% مصل العجل حديث الولادة)، وتمت معالجتها بمادة حجب Fc (مضاد الفأر CD16/32؛ رقم الكات 70-0161، سايتك)، ثم تم غسلها وصبغها بمزيج من الأجسام المضادة الملونة بالفلوروكروما السطحية (الملف التكميلي 7) لمدة 30 دقيقة في في وجود محلول التلوين اللامع بلس عينة) (رقم الكاتالوج 563795، بيكتون ديكنسون، ماونتن فيو، كاليفورنيا، الولايات المتحدة الأمريكية) ومحلول حجب CellBlox ( عينة) (رقم الكات C001T02F01، ثيرمو فيشر ساينتيفيك). تم غسل الخلايا مرة أخرى في محلول FACS وتم صبغها داخل الخلايا للكشف عن تعبير عوامل النسخ باستخدام مجموعة محلول عوامل النسخ True-Nuclear (رقم الكات 424401، بايو ليجند) وفقًا لتعليمات الشركة المصنعة. في نهاية الإجراء، تم تثبيت الخلايا الملونة في بارافورمالدهيد لمدة 5 دقائق.
آلة
5-ليزر سايتك أورا
برمجيات
فلو جو 10.9 (بيكتون ديكنسون)
وفرة تجمع الخلايا
لم يتم إجراء أي فرز. لضمان عدد كافٍ من الخلايا في مجموعات الخلايا المتميزة بعد التصفية، تم تجميع 6 مبايض لكل عينة.
استراتيجية البوابة
لتحليل بيانات تدفق السيتومتر، قمنا أولاً باستبعاد الثنائيات باستخدام هيستوجرام FSH-A/FSH-C. ثم تم استبعاد الخلايا الميتة بناءً على صبغة Zombie NIR. بعد ذلك، قمنا بتحديد خلايا الدم النخاعية في الأنسجة كـ CD45+ i.v. CD45-. ثم تم تحديد خلايا الدم النخاعية في الأنسجة بشكل متسلسل كما هو موضح في الشكل التوضيحي 4.
قم بتحديد هذا المربع لتأكيد أنه تم تقديم رقم يوضح استراتيجية البوابة في المعلومات التكميلية.

  1. برنامج أبحاث الشيخوخة والتمثيل الغذائي، مؤسسة أبحاث الطب في أوكلاهوما، مدينة أوكلاهوما، أوكلاهوما، الولايات المتحدة الأمريكية. برنامج أبحاث الجينات والأمراض البشرية، مؤسسة أبحاث الطب في أوكلاهوما، مدينة أوكلاهوما، أوكلاهوما، الولايات المتحدة الأمريكية. قسم علوم الأعصاب، مركز علوم الصحة بجامعة أوكلاهوما، مدينة أوكلاهوما، أوكلاهوما، الولايات المتحدة الأمريكية. قسم الفسيولوجيا، مركز علوم الصحة بجامعة أوكلاهوما، مدينة أوكلاهوما، أوكلاهوما، الولايات المتحدة الأمريكية. مركز شؤون المحاربين القدامى الطبي في مدينة أوكلاهوما، مدينة أوكلاهوما، الولايات المتحدة الأمريكية. كلية التغذية، الجامعة الفيدرالية في بيلوتاس، بيلوتاس، البرازيل. برنامج أبحاث التهاب المفاصل وعلم المناعة السريرية، مؤسسة أبحاث الطب في أوكلاهوما، مدينة أوكلاهوما، أوكلاهوما، الولايات المتحدة الأمريكية. ساهم هؤلاء المؤلفون بالتساوي: خوسيه في. في. إيسولا، سارة ر. أوكاناس. -البريد الإلكتروني: مايكل-ستوت@أومرف.أورغ
  2. الجريبات والمناطق ذات الفلورية الذاتية. تم تكرار هذا الاختبار بشكل مستقل لكل تكرار بيولوجي. ج، ح، مخططات وترية لـ CellChat لـ TGF تفاعلات مسارات الإشارة في وحدات الجسم الأصفر المبيضي (CLUs) في 3 أشهر (g) و9 أشهر (h). i، مسارات IPA الكلاسيكية التي تشير إلى تنشيط مسارات محددة بسبب الشيخوخة في خلايا TC. j، تحليلات المنظمين العلويين في IPA للتغيرات المرتبطة بالعمر في السدى وSCLs في خلايا TC (9 مقابل 3 أشهر). -النتيجة) المتعلقة بتكاثر الخلايا ( حسب الفئة العمرية). تم إجراء تسلسل RNA أحادي الخلية في المبايض حسب الفئة العمرية. البيانات مقدمة كمتوسط س.م. بجانب واحد -اختبار أو ذو ذيلين -اختبار (د، هـ). ROS، أنواع الأكسجين التفاعلية. دقيق القيم المعروضة في بيانات المصدر.

Journal: Nature Aging, Volume: 4, Issue: 1
DOI: https://doi.org/10.1038/s43587-023-00552-5
PMID: https://pubmed.ncbi.nlm.nih.gov/38200272
Publication Date: 2024-01-10

A single-cell atlas of the aging mouse ovary

Received: 12 May 2023
Accepted: 1 December 2023
Published online: 10 January 2024
(4) Check for updates

José V. V. Isola , Sarah R. Ocañas , Chase R. Hubbart , Sunghwan Ko , Samim Ali Mondal , Jessica D. Hense , Hannah N. C. Carter , Augusto Schneider , Susan Kovats , José Alberola-Ila © , Willard M. Freeman (1) & Michael B. Stout (B )

Abstract

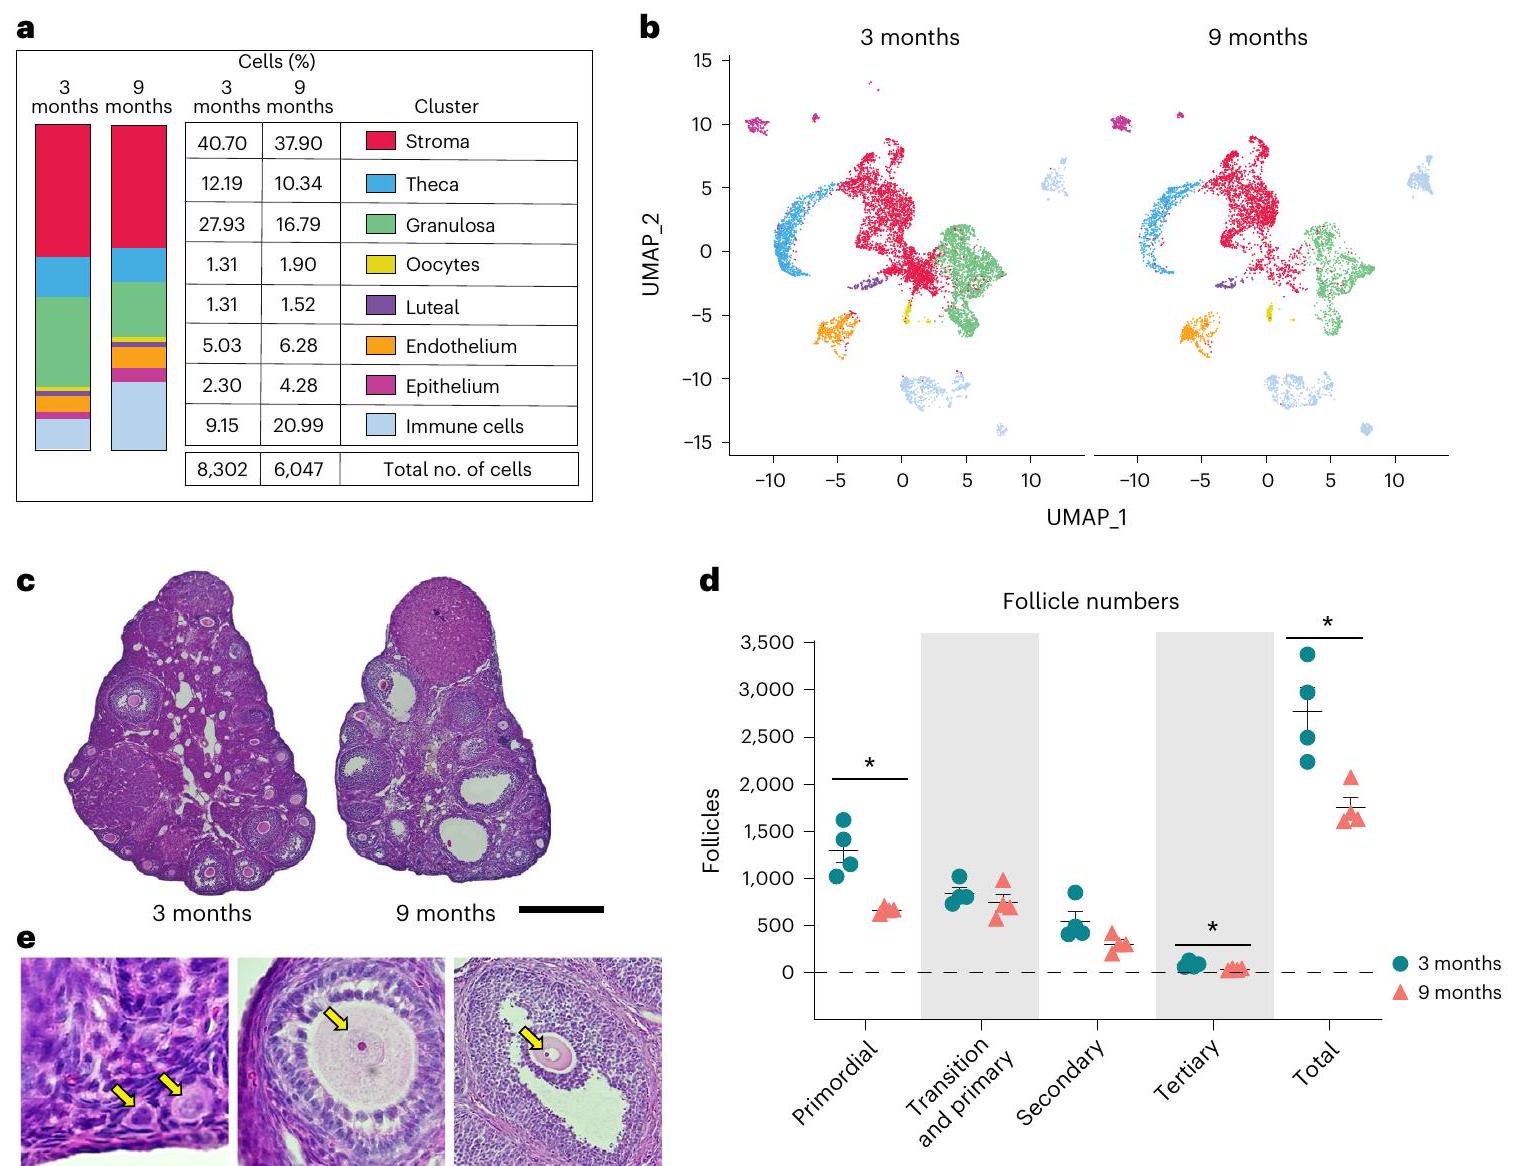
Ovarian aging leads to diminished fertility, dysregulated endocrine signaling and increased chronic disease burden. These effects begin to emerge long before follicular exhaustion. Female humans experience a sharp decline in fertility around 35 years of age, which corresponds to declines in oocyte quality. Despite a growing body of work, the field lacks a comprehensive cellular map of the transcriptomic changes in the aging mouse ovary to identify early drivers of ovarian decline. To fill this gap we performed single-cell RNA sequencing on ovarian tissue from young (3-month-old) and reproductively aged (9-month-old) mice. Our analysis revealed a doubling of immune cells in the aged ovary, with lymphocyte proportions increasing the most, which was confirmed by flow cytometry. We also found an age-related downregulation of collagenase pathways in stromal fibroblasts, which corresponds to rises in ovarian fibrosis. Follicular cells displayed stress-response, immunogenic and fibrotic signaling pathway inductions with aging. This report provides critical insights into mechanisms responsible for ovarian aging phenotypes. The data can be explored interactively via a Shiny-based web application.

Ovarian aging has garnered substantial attention in recent years due to a large proportion of female humans choosing to delay childbearing , which often causes difficulty with conception and carrying a pregnancy to full term . As the ovary ages the local microenvironment changes in ways that reduce oocyte quality and increase the rate of follicular depletion, which eventually results in menopause. Menopause is associated with accelerated systemic aging , greater chronic disease burden and increased allcause mortality risk . Therefore, a deeper understanding of the mechanisms that underlie ovarian aging is critically important to extending female fertility and attenuating age-related chronic disease onset.
It is well established that age-related ovarian follicular depletion is associated with increased mitochondrial dysfunction , reactive oxygen species production , inflammation and fibrosis . However, very
little is known about which cell types develop these phenotypes first and/or dominantly contribute to the changing local microenvironment. Moreover, it remains unclear whether cells in the follicle, stroma or both play mechanistic roles in the promotion of follicular depletion and ovarian failure. Recent work has sought to unravel the potential role played by ovarian stromal cells in ovarian health and disease . We and others have reported that markers of cellular senescence and fibrogenesis increase within the ovarian stroma with aging , although the specific cell types that become senescent and/or profibrotic remain unknown. In addition to increased senescence and fibrotic markers, the ovarian stroma also accumulates multinucleated giant cells (MNGCs) with advancing age, which may be related to the mechanisms that promote the aforementioned phenotypes .
Due to the complex nature of ovarian function, which changes dynamically during aging, it has historically been challenging to elucidate the cell type-specific mechanisms that promote follicular depletion and ovarian failure. Data showing age-related changes in ovarian transcriptional programs within cellular subtypes are limited, particularly those pertaining to mice. Single-cell analyses of ovarian aging in nonhuman primates identified downregulation of antioxidant programs in aged oocytes and increased apoptosis in aged granulosa cells (GCs) . In addition, single-cell analyses of human ovarian tissue are currently in progress . However, mice represent the model organism most utilized for ovarian aging studies due to their short lifespan and ease of genetic manipulation for mechanistic studies. One spatially resolved analysis of mouse ovaries made strides in identifying age-related changes in ovarian cell populations . However, this study used reproductively senescent ( 15 -month-old) mice and lacked the resolution to identify specific cellular subtypes and important immune populations. To add to this growing body of work, we performed singlecell RNA sequencing (scRNA-seq) to identify age-related transcriptional changes in a cell type-specific manner within the mouse ovary at 3 and 9 months of age. We chose to analyze 3 – and 9-month-old mice because they remain reproductively active at both ages, yet this age interlude represents a period when follicular density decreases markedly in conjunction with the emergence of age-related hallmarks . This design and approach allowed us to determine how aging modulates cellularity and cellular phenotypes within the ovary before reproductive senescence, which is vital to the development of pharmacological approaches for extending the reproductive lifespan in female humans.

Results

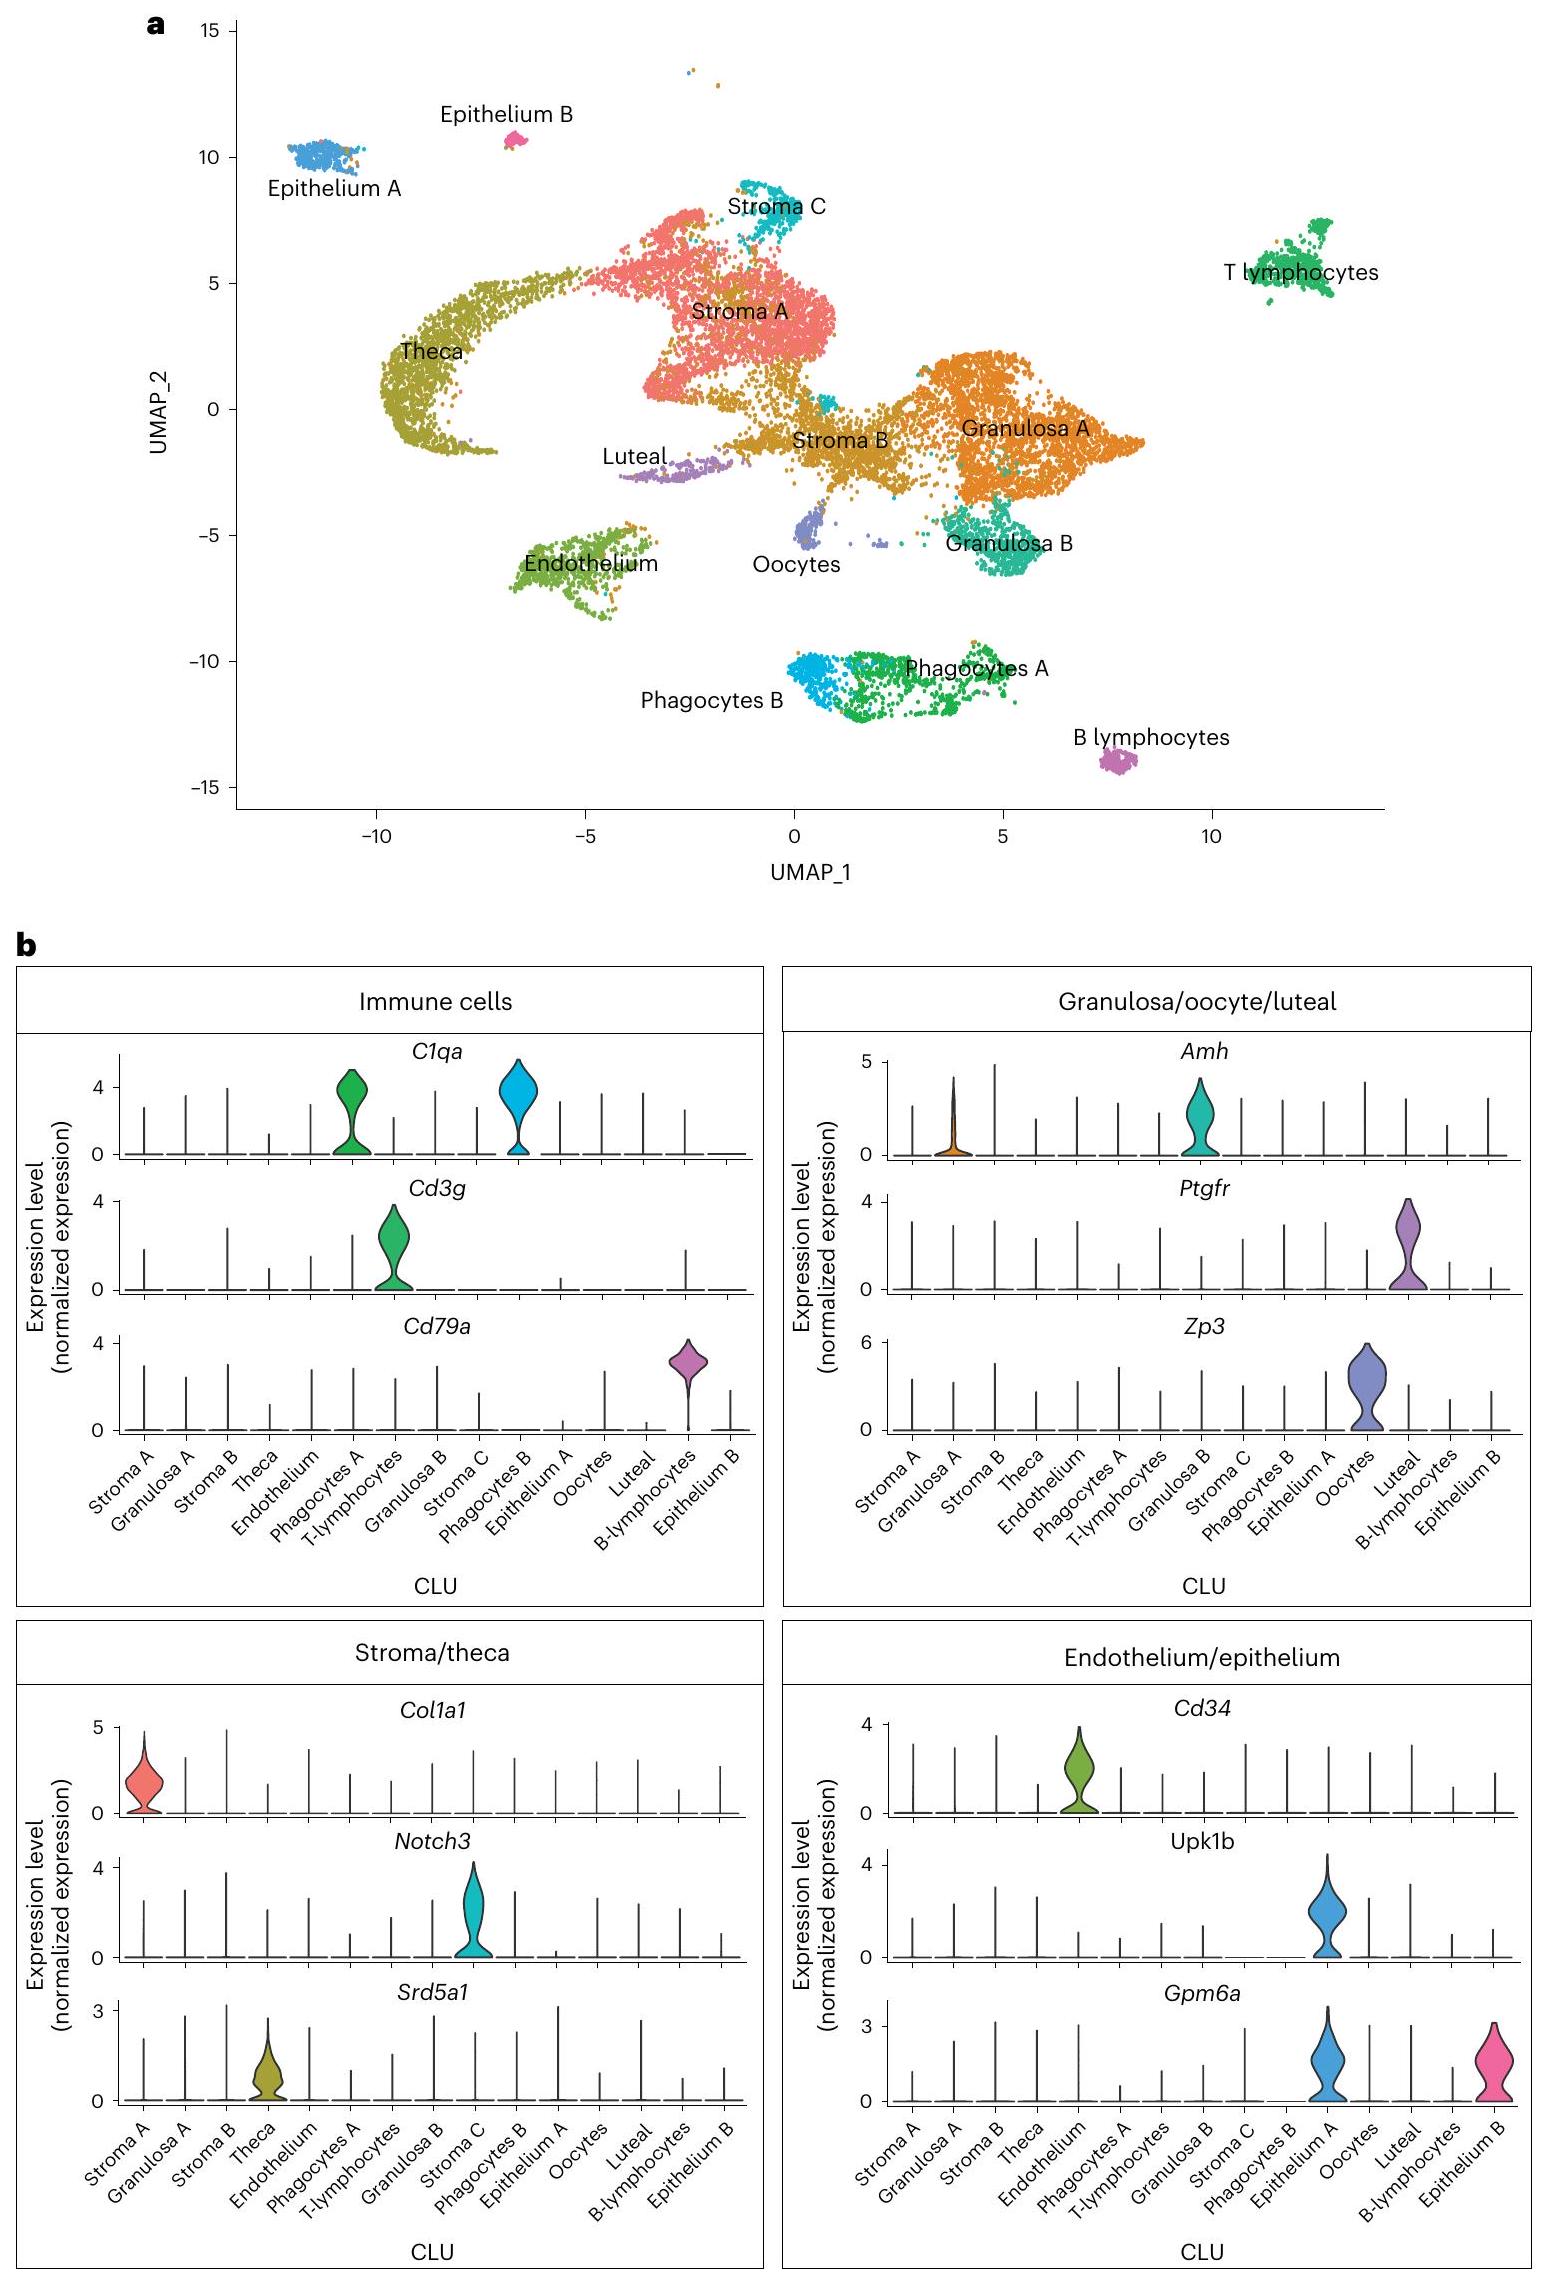
scRNA-seq of the adult mouse ovary across reproductive ages

For evaluation of age-related changes in the ovary we collected ovaries from 3- and 9-month-old female mice ( per group) and performed scRNA-seq. The period from 3 to 9 months represents the time when the greatest decline in follicular reserve occurs and other hallmarks of aging begin to emerge . Following quality control analyses, filtering and doublet removal, 14,504 cells remained for characterization. Cellular distributions of the number of genes detected, number of molecules and proportion of mitochondrial DNA before and after filtering are shown in Supplementary Fig. 1a. A mitochondrial DNA filtering parameter of was used to ensure the inclusion of oocytes, because these are known to have more mitochondria than somatic cells . In addition, mitochondrial-dependent apoptosis is involved in follicular atresia and thus a lower filtering threshold may result in loss of oocytes and follicular cells. Indeed, these clusters (CLUs) showed the highest mtDNA percentages among all identified CLUs (Supplementary Fig. 1b). Unbiased clustering and uniform manifold approximation and projection (UMAP) analysis revealed 15 distinct cellular CLUs (Fig. 1a). One CLU was present in only one sample and was subsequently identified as oviduct contamination (Supplementary Fig. 1c) and therefore these cells were removed from further analyses, which left 14,349 cells for downstream analyses. To assign cell type identity we used cell type-specific markers previously reported in the literature.
Collectively, the most common cell type was found to be stromal cells ( ), which segregated into three CLUs. One stromal CLU, referred to as Stroma A, was characterized by having a major Col1a1 transcriptional signature as well as other stromal markers. A second CLU, Stroma B, was identified by the expression of several stromal markers (Bgn, Ogn, Dcn, Lum, Col1a1 (ref. 26)). However, this CLU did not have any exclusive markers that were highly enriched. A third stromal CLU, Stroma C, was characterized by Notch3 expression (Fig. 1b), which is classically viewed as a pericyte marker . The second most common cell type was found to be GCs ( ), which segregated into two distinct CLUs, both displaying high expression of (Fig. 1b). Other CLUs were identified as theca cells (TCs; ; Srd5a1(ref.29)), phagocytes(two distinctCLUs; ; C1qa(ref.30)),
endothelial cells ( ; Cd34 (ref.31)), T lymphocytes ( ; Cd3g (ref. 32)), epithelial cells (two distinct CLUs; ; Upk1b (ref. 33) or Gpm6a (ref. 26)), oocytes ( ; Zp3 (ref. 18)), luteal cells ( ; Ptgfr ) and B lymphocytes ( ; Cd79a (ref. 35)) (Fig. 1b). Feature plots showing the specificity of these markers to each CLU can be found in Supplementary Fig. 1d. All markers for each CLU are listed in Supplementary Data1.
Advancing age changed ovarian cellularity in our analyses (Fig. 2a,b and Supplementary Fig. 1e). The percentage of GCs was lower in 9-month-old ovaries, which can be explained by both declines in the number of primordial and tertiary follicles and a trending decline in secondary follicles observed in the aged mice (Fig. 2c-e). The most marked change in ovarian cellularity with advancing age was the greater than twofold increase in immune cells (Fig. 2a,b and Supplementary Fig.1e).
In this study, although estrous cycle staging was not performed we used a bioinformatic approach to determine the estrous cycle stage of each mouse at the time of euthanasia. To do this we initially integrated our data with single-cell transcriptomic data from estrous cycle-staged mice . That report showed major differences in single-cell transcriptional outcomes within GCs across estrous cycle stages, with unique features being observed during both proestrus and estrus. Following integration we then generated UMAP plots of GCs from mice in each estrous cycle stage and observed unique CLUs during both estrus and proestrus, which recapitulated the findings from Morris et al. . We then created UMAP plots of GCs from each biological replicate in our study to determine whether they were in proestrus or estrus, which could potentially confound the interpretation of age-related transcriptional phenotypes (Supplementary Fig. 2a-d). We found that all four young mice, and three of the old mice, were in either diestrus or metestrus, which are transcriptionally indistinguishable . One old mouse, Sample 5, was found to be in proestrus. We then used the list of transcripts, as reported by Morris et al. (Supplementary Data 1) to be upregulated during proestrus within GCs, to generate a module score for each sample, which enabled us to confirm that Sample 5 was in proestrus. These data are presented in violin plots in Supplementary Fig. 2e. We also performed principal component analysis of differentially expressed genes with age in our samples and observed that the only distinguishable clustering was that according to age (Supplementary Fig. 2f). Assessment of the potential impact of the proestrus sample on age-related phenotypic changes in GCs is discussed later in the manuscript following subcluster (SCL) analyses, although no major changes were observed.
For evaluation of intercellular signaling networks, CellChat analyses were performed. The most notable changes in cell signaling occurred among granulosa, stroma A and epithelium CLUs, with an overall increase in the number of interactions (Supplementary Fig. 3a) and interaction weights (Supplementary Fig. 3b) from 3 to 9 months of age. However, there was not a complete breakdown in cell-to-cell communication with aging.

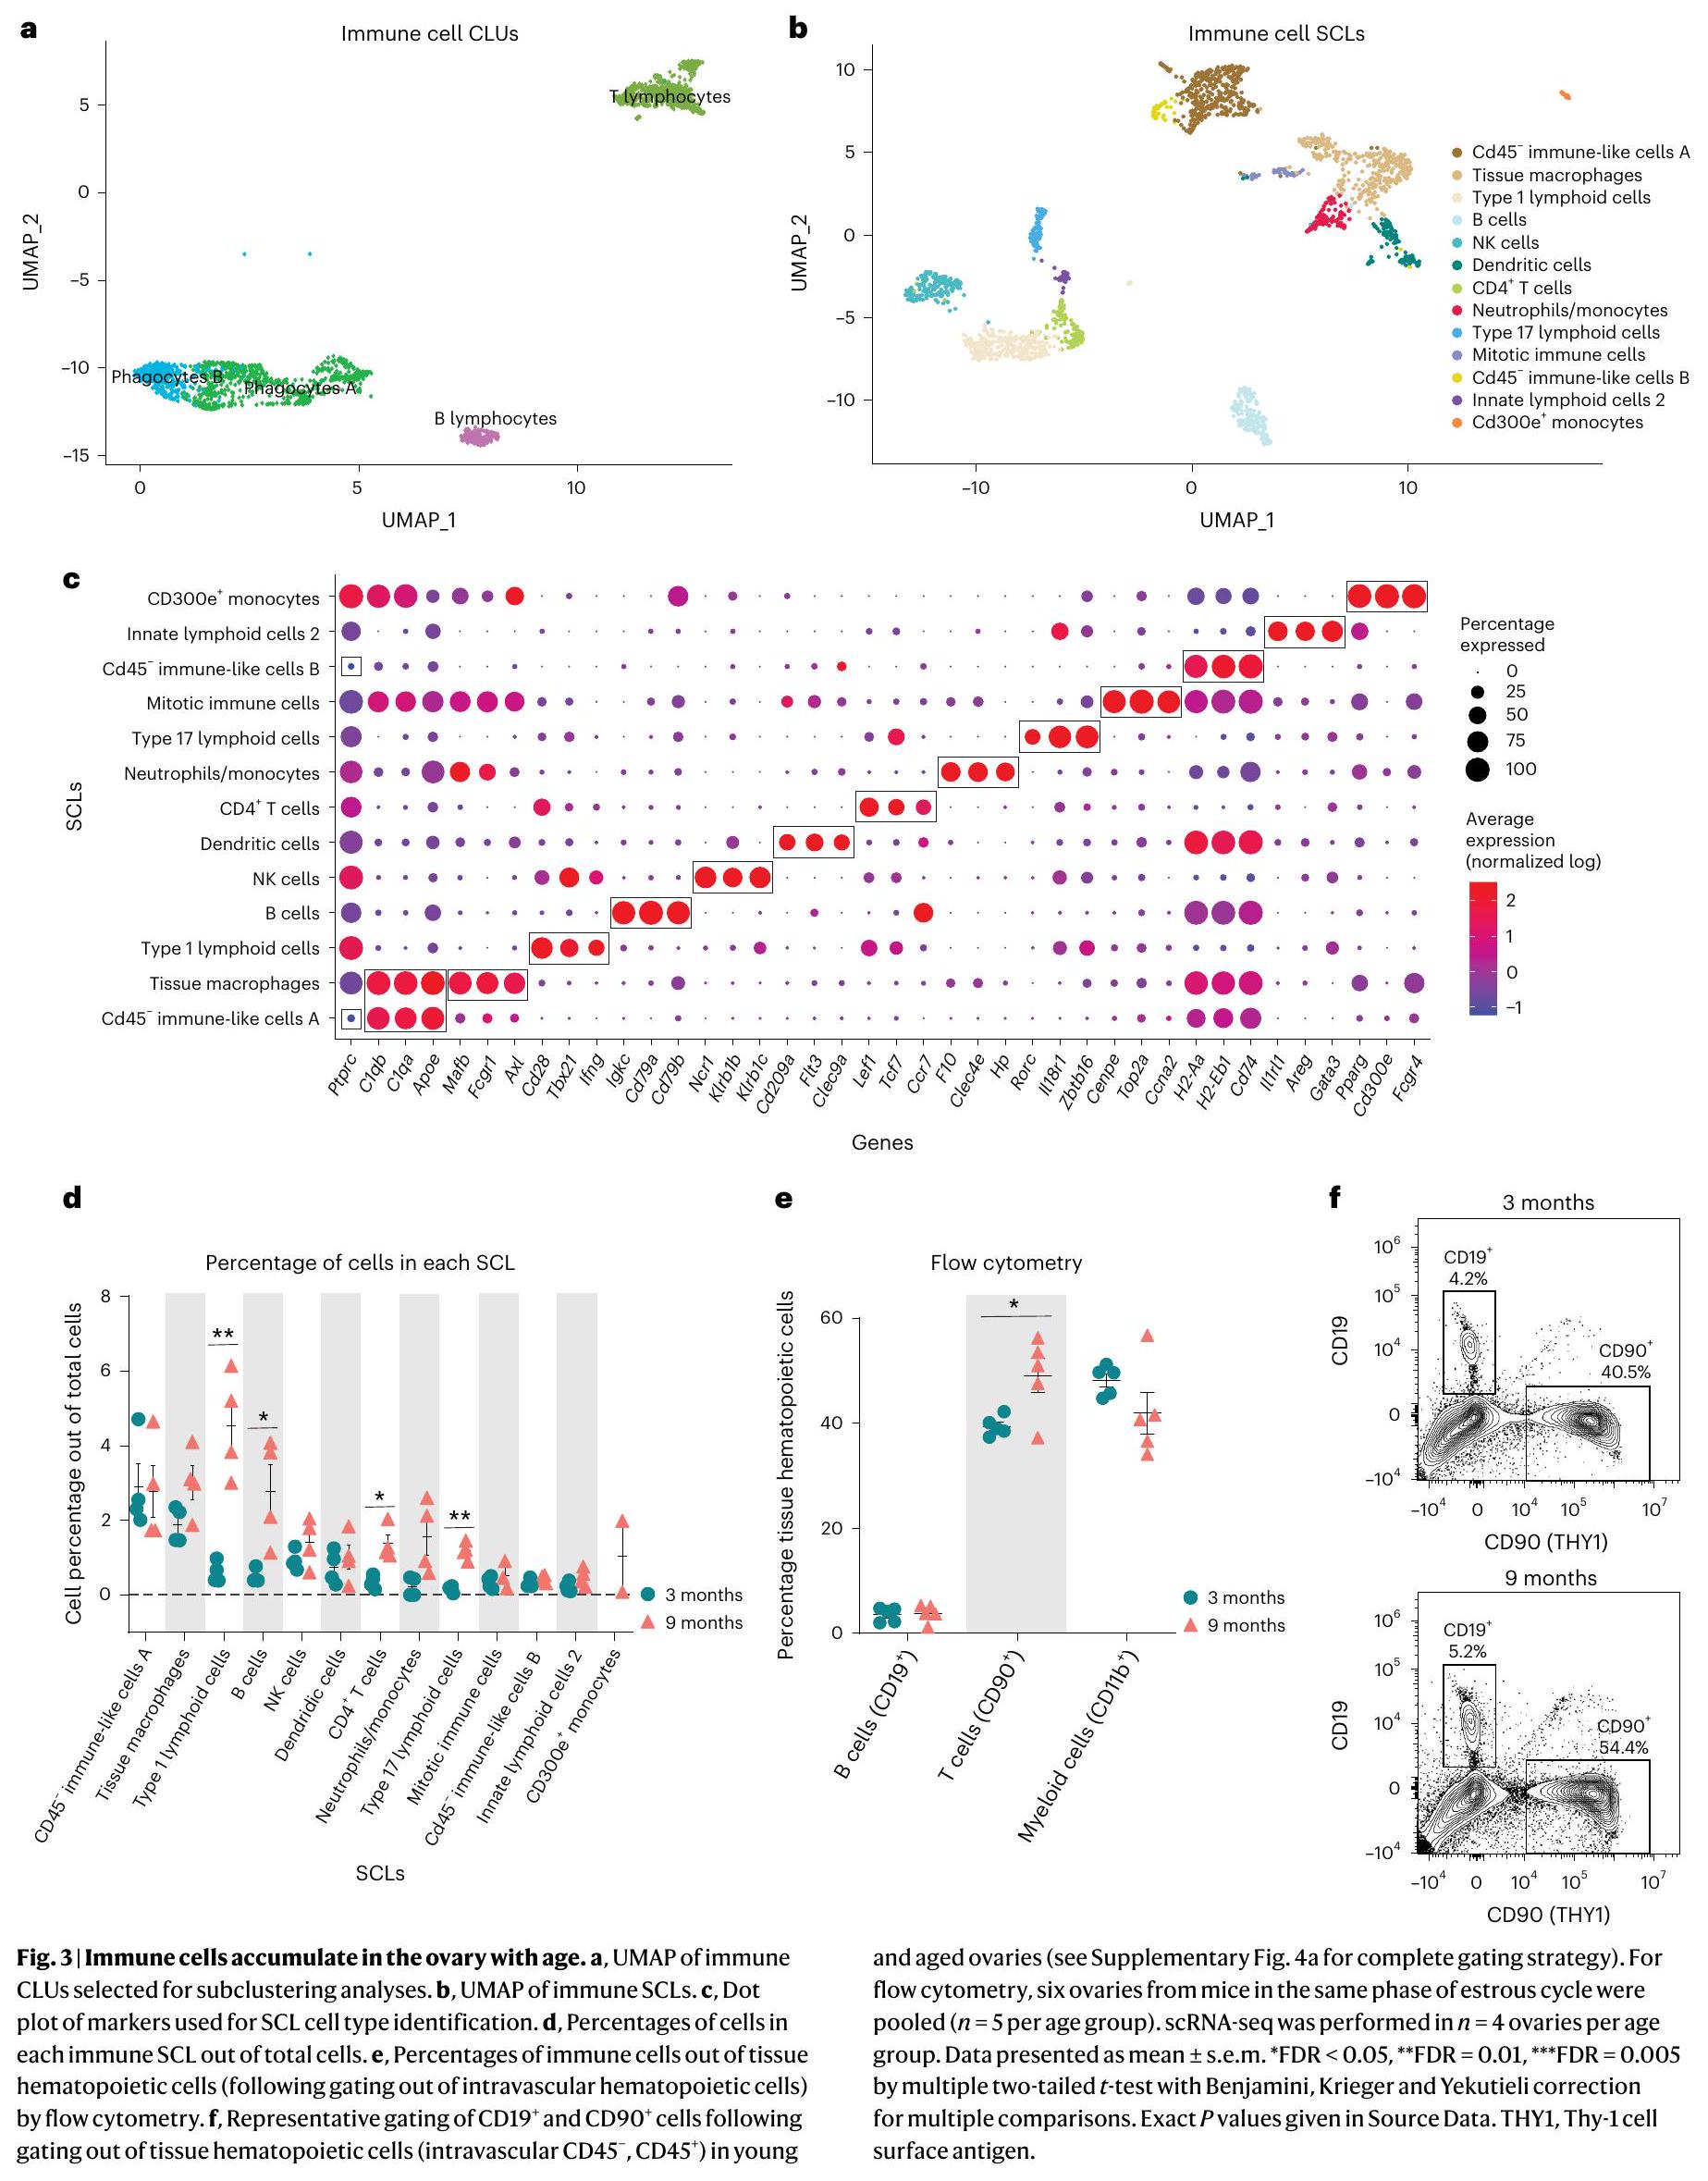
Ovarian immune cell changes with aging

Following observation of the increased proportion of immune cells within the aged ovary, we performed subclustering of immune cells to determine which specific populations were changed with aging (Fig. 3a). Following reclustering, the original immune cell CLUs separated into 13 SCLs (Fig. 3b). Cell type identification for each SCL was performed based on known gene expression profiles and, with the help of databases Cellmarker2.0 (ref.36) and ImmGen , with the representative genes described in Fig. 3c. All markers for immune SCLs are listed in Supplementary Data 1. Because the overall immune cell proportion doubled from 3 to 9 months of age, percentages of total cells in each SCL were assessed and compared by age. Intriguingly, cell types showing the greatest increase with age were lymphoid, including B cells, conventional T cells and innate-like T cells. The biggest difference in
Fig. 1| scRNA-seq of the mouse ovary. , Whole-ovarian tissue was collected from 3- and 9-month-old C57BL/6 J mice and processed for 10X Genomics 3′ scRNA-seq. a, UMAP plot of age-combined ovarian cells. Clustering analysis
revealed 15 distinct ovarian cell populations. b, Violin plots of specific marker genes for each ovarian cell type. scRNA-seq was performed in ovaries per age group.
Fig. 2 | Age-related changes in ovarian cell populations. a, Numbers and percentages of cells in broad categories of cell type identity, by age. b, UMAP plot of ovarian cells, by age (color coding as in a). c, Representative images of H&E-stained ovaries. H&E staining and follicle counting were repeated for each biological replicate. Scale bar, . d, Estimated numbers of follicles in 3 – and 9-month-old ovaries. e, Representative images of follicles stained by H&E. Arrows
abundance with age was in a SCL containing Type 1 lymphoid cells, as defined by the expression of (ref. 38) and Ifng. These probably include cells, as well as other Type 1 innate-like T cells such as natural killer T cells (NKT cells), mucosal-associated invariant T cells (MAIT cells) and/or T cells ( T cells). Another SCL that significantly increased with age contained Type 17 lymphoid cells, as defined by the expression of Rorc , which commonly represents innate lineage and expression of Zbtb16 (refs. 40,41). Although transcriptional data cannot further discriminate within this SCL, it probably includes Type 17 NKT cells, MAIT cells, T cells and/or innate lymphoid cells Type 3 (ILC3), which was later confirmed by flow cytometry. Finally, the percentage of cells was also increased within the aged ovary (Fig. 3d). It should be noted that, due to single-cell transcriptomic limitations, other conventional T cells may also be contained within the SCL. Conversely, neither natural killer (NK) cells nor ILC2s were significantly changed with age. Tissue macrophages and monocytes trended towards an increased proportion in the aged ovary but failed to reach statistical significance (Fig.3d). One SCL, which was present only in the aged ovaries, was identified as monocytes that express CD300e, which negatively regulates T cell activation . These CD300e monocytes may thus represent a compensatory mechanism to address T cell accumulation. However, this SCL might also represent blood monocyte contamination due to incomplete perfusion. Further investigation into this unique cellular population is warranted. Interestingly, although having an immune-like expression profile, two of the immune SCLs showed no expression of Ptprc, the gene that codes for CD45-the most
well-established immune cell marker. These two SCLs were identified as immune-like cells A and B .
To confirm our transcriptional findings related to ovarian immune cell accumulation, we performed high-dimensional flow cytometry to identify age-related differences in the fraction of distinct immune cell types within the ovary. We first assessed the percentage and total number of broadly defined immune cell types, including B cells (CD19 ), T cells and innate lymphoid cells ( ) and myeloid cells ( ). We observed a higher percentage and number of cells ( T cells and innate lymphoid cells) in aged ovaries (Fig. 3e,f and Supplementary Fig. 4a), which aligns with the scRNA-seq findings. However, we did not observe changes in the percentage or number of myeloid cells or B cells (Fig. 3e,f and Supplementary Fig. 4a). Although the absence of change in myeloid cells was consistent with the scRNA-seq data, the B cells were incongruent. The proportion of cells was found to increase with aging by scRNA-seq analyses, although this was not confirmed by flow cytometry. UMAP visualization of the flow cytometry data showed major shifts in immune cell subpopulations within the aging ovary (Fig. 4a). We then further characterized the population and observed an increase in the percentage of cells, ‘doublenegative T cells’ (DNs), MAIT cells, NKT cells and Ts and a decrease in T cells and innate lymphoid cells in aged ovaries (Fig. 4b and Supplementary Fig. 4b). To compare and contrast these findings with scRNA-seq clustering, we analyzed cells based on expression of the effector-type-determining transcription factors for Type 17 lymphoid cells (ROR ) and Type 1 cells (T-BET) (Supplementary
Fig. 4c). The increase in Type 1 lymphoid cells observed with scRNAseq was confirmed by flow cytometry and further determined that the increase was driven by Type 1 NKT cells, while the proportions of Type 1DN and T decreased with age (Fig. 4c,d). All ROR T subpopulations increased in proportion with age (DN, NKT, ) although the greatest magnitude of change occurred in Type Ts (Fig. 4c,d). Although the scRNA-seq data suggested the presence of ILC2-but not ILC1-subpopulations, the flow cytometry data identified both ILC1s (T-BET ) and ILC2s (GATA3 ). The flow cytometry data indicated a decrease in ILC1 percentages with advancing age (Fig. 4e,f). To determine the potential impact of estrous cycle stage on age-related changes in ovarian immune cell populations, we performed vaginal cytology on mice before euthanasia and ovarian flow cytometry analyses. We then plotted the mean fluorescence intensity of all markers assessed in each ovarian sample, in addition to identifying the estrous cycle stage of mice. We found that samples clustered by age, regardless of estrous cycle stage (Supplementary Fig. 4d), thereby indicating that estrous cycle stage is not a primary contributor to age-related changes in immune cell accumulation.
In addition to an overall increase in immune cells within the aged ovary, previous reports have also noted the accumulation of MNGCs as a hallmark of ovarian aging . Although MNGCs were certainly removed from our single-cell suspensions during filtration, we were able to observe them in 9-month-old ovaries via histological assessment. Similar to previous reports , we observed MNGCs in the aged ovary (Supplementary Fig. 5a), their presence corresponding to a rise in lipofuscin positivity (Supplementary Fig. 5b), which has been reported to be a marker of cellular senescence . However, it should be noted that lipofuscin positivity strongly associates with increased numbers and size of MNGCs, which may not actually be cellular senescence as classically defined. Given the increased number of immune cells in the aged ovary that inherently express senescence-related genes (Supplementary Fig. 6a,b), it appears likely that ‘ovarian cellular senescence’ before estropause may represent increased immune cell accumulation. However, it should be noted that Cdkn1a and Cdkn2d expression increased in Type 17 lymphoid cells (Supplementary Fig. 6b-d) with advancing age, which could potentially represent a small subpopulation of cells that enter cellular senescence in the ovary.
Several changes in the stroma have been observed with ovarian aging and are apparent before follicular exhaustion, including cellular senescent signatures and collagen deposition . To identify potential cellular and molecular mediators of these phenotypes we performed subclustering of the stroma and TC CLUs (Fig. 5a,b). TCs were included with stroma because they dynamically differentiate from fibroblastic stromal cells during follicular maturation and thus share similarities with stromal cells . This subclustering resulted in six distinct SCLs (Fig. 5b). Enriched markers in each SCL were used to infer cell type specificity (Fig. 5c). Notably, there was a SCL that expressed Inhba , a marker of GCs, that was distinct and thus easily separated from other stroma and TC SCLs. The smooth muscle SCL was identified by the expression of Myh11 (refs. 46,47), Actg2 (ref. 26) and Cnn1 (ref. 48). The pericyte SCL was enriched for Notch3, Rgs5 and Ebf1 (ref.26). The fibroblast-like SCL had enrichment of Dcn, Mgp and Lum whereas the TC SCL showed high expression of steroidogenic genes (Cyp11a1, Cyp17a1 (ref.36) and Mgarp ). The early TCSCL also showed high levels
of steroidogenic genes including Ptch1 and Hhip , in addition to high expression of a fibroblast gene (Enpp2 (ref. 42)), suggesting that these cells are in transition from stromal fibroblast-like cellsto TCs.All markers for each stromal SCL are listed in Supplementary Data 1.
FollowingSCL identification, a list of genes differentially expressed by the different ages in eachSCL was imported into the software Ingenuity Pathway Analysis (IPA) to infer biological function. Fibroblast-like stromal cells showed an age-related upregulation of pathways related to tissue remodeling (Fig. 5d). Tissue remodeling occurs following ovulation and in cases of follicular and luteal atresia . To our surprise, collagen expression was unchanged by aging in ovarian fibroblast-like SCL (Fig. 6a) despite greater collagen deposition by 9 months of age (Fig. 6b). Interestingly, the collagenase pathway was downregulated in the fibroblast-like SCL (Fig. 6c). Further analyses revealed that the expression of matrix metalloproteinase 2(Mmp2), a key enzyme involved in collagen degradation , was decreased in the fibroblast-like SCL with advancing age (Fig. 6d). We also observed an age-related decrease in MMP2 protein in the ovarian stroma by immunofluorescence (Fig. 6e,f). These findings suggest that ovarian collagen accumulation is at least partially mediated by a reduction in collagen degradation, which supports our transcriptional findings. Fibroblast-like cells also showed downregulation in hormonal signaling (estrogen receptor and gonado-tropin-releasing hormone;Fig. 5d), which is somewhat surprisinggiven that hormone levels, estrous cyclicity and fertility are generally stable at 9 months of age . These results indicate that changes in the local microenvironment may contribute to endocrine dysfunction in the ovarian stroma independently of changes within the follicle. However, fibroblast-like cells showed a downregulation in upstream regulators associated with inflammation and fibrosis (Fig. 6c), which could be a compensatory response to increases in proinflammatory and profibrotic signaling from other cell types, as well as immune cell accumulation. In other tissues, fibroblasts are known to play immunosuppressive roles in the regulation of chronic inflammation . In contrast to fibroblast-like cells, TCs showed a significant upregulation in several upstream regulators of fibrogenesis including TGFB1, TGFB2 and SMAD3 (Fig. 6c), which suggests that TCs may be one of the earliest cell types involved in generation of the signaling cascade for collagen production and deposition.
In contrast to fibroblast-like cells, TCs showed significant upregulation in several upstream regulators of fibrogenesis including TGFB1, TGFB2 and SMAD3 (Fig. 6c), which suggests that these may be one of the earliest cell types involved in generating the signaling cascade for collagen production and deposition. When looking at TGF intercellular communication among the original CLUs, we note that TCs signal to several cell types in the young ovary (Fig. 6g), which was expected, due to its important role in intrafollicular cell-to-cell communication . In contrast, TGF signaling in TCs from aged ovaries became exclusive to immune cells (Fig. 6h). TGF signaling has previously been associated with the regulation of chemotaxis, activation and survival of lymphocytes , which may explain our finding of increased lymphocyte accumulation in the aged ovary. Additionally, the Granulosa B CLU showed only TGF signaling in the old ovary (Fig. 6g,h). These data suggest that interactions between ovarian follicular cells and immune cells are probably important for perpetuation of fibrotic signaling with aging. TCs also showed a modest age-related upregulation in inflammation and cell stress-response pathways (Fig. 6i), which were mirrored by upstream regulators involved in cellular proliferation including MTOR, YAP1 and RB1 (Fig. 6j).
Fig. 4 | Lymphocyte populations are altered in the aged ovary. a, UMAP of flow cytometry panel of lymphoid cells, annotated using conventional gating strategies. The number of cells plotted was normalized to better observe differences in population distribution.b, Percentage of T cell subpopulations out of tissue hematopoietic cells. c, Percentage of Types 1 and 17 T cells out of tissue hematopoietic cells. d, Representative gating of Types 1 and 17 lymphoid cells in young and aged ovaries. e, Percentages of ICL1 and ILC2 out of tissue
hematopoietic cells. , Representative gating of innate lymphoid cells in young and aged ovaries. For flow cytometry, six ovaries from mice in the estrous cycle stage were pooled ( per age group). Data presented as mean s.e.m. *FDR < 0.05, **FDR = 0.01, ***FDR = 0.005 by multiple two-tailed -test with Benjamini, Krieger and Yekutieli correction for multiple comparisons. Exact values are given in Source Data.

Aging affects granulosa, oocyte and luteal cell SCLs

Cellular populations of GCs, oocytes and luteal cells were subclustered into six distinct SCLs (Fig. 7a-c). GCs were further segregated into
four distinct SCLs that were identified as being part of follicles at different stages of development. These SCLs included preantral, antral, mitotic and atretic GCs. GCs signal to oocytes to provide cues
Fig. 5 | Subclustering of stroma and TCs. a, UMAP of stroma and TC CLUs used for subclustering. b, UMAP of stroma and TC SCLs. c, Dot plot of markers used for SCL cell type identification. d, IPA canonical pathways indicating activation or inhibition of specific pathways by aging in stromal fibroblast-like cells. scRNA-seq was performed in ovaries per age group.
related to the local ovarian microenvironment, in addition to conversion of androgens to estrogens, which are released into the systemic circulation for feedback signaling in the brain . GCs from immature follicles that have not yet developed an antrum are referred to as preantral GCs and were identified by enrichment in Igfbp5 (ref.58) and Gatm expression. GCs from antral follicles (antral GCs) were identified by enrichment of Inhbb . A separate GC SCL, which we refer to as mitotic GCs, expressed similarly to antral GCs but showed enriched expression of cell division markers Top2a (ref. 62) and Racgap1 (ref. 63). Last, GCs from follicles undergoing atresia were found to be enriched for Pik31p1 (refs. 26,64), Itih5 (ref. 26) and Ghr . Oocytes were readily identified by the expression of classical markers Gdf9, Ooep and Zp3 (ref. 18). Luteal cells, which consist of remnant GCs and TCs following ovulation and constitute the corpus luteum , were identified by the expression of Ptgfr .All markers for each GCSCL can be found in Supplementary Data1.
As alluded to above, differentially expressed genes from eachSCL were examined with IPA software to infer biological function. Interestingly, preantral, antral and atretic GCs all displayed an age-related increase in pathways related to proinflammatory stress and fibrogenesis (Fig. 7d-f). These observations corresponded to a significant increase in the mitochondrial dysfunction pathway within oocytes (Fig. 7g). Upstream regulators related to proinflammatory stress that were found to be increased in GCSCL included IFNG, TNF, IL15 and IL1A (Supplementary Fig. 7a). Additionally, upstream regulators related to fibrogenesis were found to be increased in GC SCL including TGFB1, TGF-beta and SMAD3 (Supplementary Fig. 7a). As expected, the atretic GCSCL was enriched for changes in proinflammatory stress and fibrosis pathways, with 9-month-old mice having greater activation of these pathways than 3 -month-old mice. Therefore, it appears that aging exacerbates inflammatory and fibrotic responses that are required for ovarian remodeling following ovulation and follicular atresia.
We also examined intercellular C-C motif chemokine ligand (CCL) signaling due to its role in immune cell migration and chemotaxis. We found that, by 9 months of age, granulosa CLUs expressed CCL signaling molecules, which was not observed in 3-month-old mice (Supplementary Fig.7b,c).At 9 months of age GCCCL signaling was exclusive to the phagocyte A CLU. This suggests that inflammatory signaling from the follicle may contribute to alterations in immune cell phenotypes as a function of age. Interestingly, there was a breakdown in the anti-Müllerian hormone signaling pathway between oocytes and other follicular cells by 9 months of age (Supplementary Fig.7d,e). The anti-Müllerian hormone pathway is critical for regulation of follicular maturation and is commonly used as a marker of follicular reserve . This breakdown in signaling therefore signifies early changes that may impact reproductive outcomes.
Because GC transcriptional changes have been reported during proestrus, coupled with one of the 9 -month-old mice (Sample 5) analyzed herein being in proestrus, we performed additional analyses to ensure that estrous cycle stage did not confound our age-related interpretations. For this analysis we removed those genes that were found to be differentially expressed in both proestrus and aging in granulosa SCLs, and reran the pathway analyses. The removal of these genes did not affect age-related changes in GCs. As a secondary confirmation we then completely removed Sample 5, reran the pathway analysis and found that age-related outcomes were unchanged (Supplementary Fig.7f). These observations provide additional evidence that our interpretations related to the mechanisms promoting ovarian aging are unaffected by estrous cycle stage.

Endothelial and epithelial SCLs are mildly affected by age

Endothelial cells are essential components of blood and lymphatic vessels. The ovary is a highly vascularized organ with blood vessels that travel through connective tissue to assist with hormone/nutrient
trafficking and waste removal . The ovary also has a rich lymphatic network, closely associated with the blood vasculature, that is involved in immune cell trafficking . Epithelial cells comprise the ovarian surface, facilitate repair following ovulation and dynamically expand and contract during cyclic ovarian changes . In addition, epithelial cells share a common progenitor with GCs . Endothelial and epithelial CLUs were subclustered (Fig. 8a), resulting in four distinct SCLs (Fig. 8b). Vascular and lymphatic endothelia were separated and identified by the enrichment of specific cellular markers (Fig. 8c). Vascular endothelial cells showed enrichment of Flt1 (ref. 72) and Mmrn2 (ref. 73) whereas lymphatic endothelial cells were enriched for Lyve1 (ref. 74) expression. All markers for each endothelial/epithelial SCL are listed in Supplementary Data 1.
Similar to findings in stroma/theca SCLs, one of the endothelial/ epithelial SCLs was found to be enriched for GC markers and was removed from further analyses; no age differences were observed in this GC SCL. The only epithelial/endothelial SCL that showed agerelated changes in the pathway analyses was the vascular endothelium; this SCL was found to have modestly increased DNA damage regulation (Fig. 8d). Another interesting observation was that upstream regulators of cellular senescence (TP53, CDKN1A and CDKN2A) were found to be increased with aging in vascular endothelial cells (Fig. 8e). Further analysis of genes downstream of TP53, CDKN1A and CDKN2A found these to be altered in directionality, consistent with the activation of these upstream regulators (Fig. 8f). This is consistent with studies indicating that vascular endothelial cells are highly susceptible to becoming senescent . In the ovary, cyclicity requires constant vascular remodeling , which we speculate may promote senescence in endothelial cells. However, despite observing increased TP53, CDKN1A and CDKN2A upstream regulator activity in the vascular endothelium SCL, the expression of Cdkn1a and Cdkn2a was unaffected by aging (Fig. 8g) whereas Tp53 was not detected in our scRNA-seq analysis. Therefore, it remains unclear whether the vascular endothelium is a source of senescent cells in the aged ovary.

Discussion

In this report we assessed age-related changes in the mouse ovarian transcriptome at single-cell resolution. During aging, ovarian follicular reserve declines and there is a concomitant deterioration of the ovarian microenvironment as evidenced by increased inflammation and fibrosis. Importantly, these changes occur before follicular exhaustion and probably contribute to decreased oocyte quality and diminished reproductive success until ovarian insufficiency occurs. However, specific cellular contributions to ovarian aging phenotypes are not yet elucidated, limiting the development of interventional approaches to extend female fertility. Whole-ovarian bulk transcriptomic assessments can provide results that are difficult to interpret due to potential changes in cell heterogeneity that occur during aging. Cell sorting can overcome this limitation but relies on specific antibodies or Crereporter systems to target specific cell types. scRNA-seq, on the other hand, is a useful tool for simultaneous measurement of transcriptomic changes in all ovarian cell types during the aging process. Previous ovarian scRNA-seq analyses have identified the molecular signatures of specific cell types and changes in individual cell populations .
In mice, estrous cycle and primordial follicle assembly result in dynamic changes in specific ovarian cellular populations. However, the specific cellular changes occurring during ovarian aging are still being elucidated, especially with regard to the critical period of diminished fertility that occurs long before follicular exhaustion. Because mice are the primary model organisms used for ovarian aging experiments , the single-cell ovarian aging atlas presented herein serves as a crucial resource for the field. In nonhuman primates, scRNA-seq has provided mechanistic insights into changes associated with ovarian aging . However, this study was conducted with animals in the perimenopausal state when alterations in cyclicity and hormone levels are perturbed. Our primary goal was to identify early changes that occur in reproductively aged mice before the periestropausal period. At 9 months of age mice experience declined ovarian reserve but remain fertile , modeling a critical age when female humans seek to have children and experience difficulty conceiving . In humans a marked increase in embryonic aneuploidy is observed in embryos from donors, starting around 35 years of age , suggesting a loss in oocyte quality. With our approach, we differentiated all of the main cell types expected in the ovary and further subdivided them to determine specific cellular populations altered by the aging process.
Our scRNA-seq results show that the proportion of immune cells in the ovary doubles between 3 and 9 months of age. The most marked increase in immune cells within aged ovaries occurred in Types 1 and 17 lymphoid cells. A recent scRNA-seq assessment of ovarian immune cells reported an increase in cells, deemed double-negative T cells, in aged ovaries . Many of the Types 1 and 17 lymphoid cells described in the present study, including DNs, Type 17 NKTs, MAITs, Ts and a substantial proportion of Type 1 NKTs, are CD4 and would therefore be included within the broad double-negative T cell population described in the previous study. Consistent with the previous report, our data indicate that many of these populations increase with age. However, our data provide better granularity and revealed changing in the aging ovary of specific populations of Types 1 and 17 lymphoid cells that had not previously been evaluated.
Specifically, we determined that the immune subpopulations that most consistently increased in the aged ovary were Type 1 NKTs and Type Ts, both of which are innate T cells. Our data thus raise interesting questions about the functional roles of innate T lymphocytes in both the young and old ovary. Innate T cells are tissueresident cells thought to contribute to the maintenance of tissue homeostasis and serve as sentinel cells in the detection of infectious agents, neoplastic cells or aberrant cellular damage . In the female reproductive tract, innate lymphocytes show high functional diversity with both beneficial and detrimental effects . However, the role of innate lymphocytes in the ovary is an unexplored subject. Type 17 Ts play critical roles during fibrosis in a variety of organs, including liver , kidney , lung and heart . However, whether these cells are protective or deleterious in fibrosis appears to be dependent on both tissue and context . For instance, age-related accumulation of Type Ts contributes to chronic inflammation in adipose tissue . In the ovary, expansion of Type Ts could either promote fibrosis or be a compensatory attempt to dampen the fibrotic environment. Little is known about the role of Type 1 NKTs in the ovary. In general,
Fig. 6 | Biological significance of altered pathways in ovarian stroma and theca SCLs. a, Expression of collagen genes in the fibroblast-like stroma SCL does not change with age. , Picrosirius red (PSR) staining of collagen deposition in 3- and 9-month-old ovaries. Scale bar, . c, IPA upstream regulator analyses of age-related changes in stroma and TCSCLs ( 9 versus 3 months old, -score) related to inflammation and fibrosis. d, Expression of Mmp2 gene in fibroblast-like stroma decreases with age. e, MMP2 protein is decreased in aged ovarian stroma, as shown by immunofluorescence. , Representative immunofluorescence images of MMP2 (green), DAPI (blue) and autofluorescence (red). Yellow-bordered areas represent stromal regions analyzed, avoiding
NKTs provide important immune responses during injury, repair, inflammation and fibrosis in the liver and lung . Further mechanistic studies assessing the roles of these cells in ovarian fibrosis and inflammation are warranted.
Under normal conditions, tissue-resident lymphocytes are maintained through slow homeostatic proliferation , as opposed
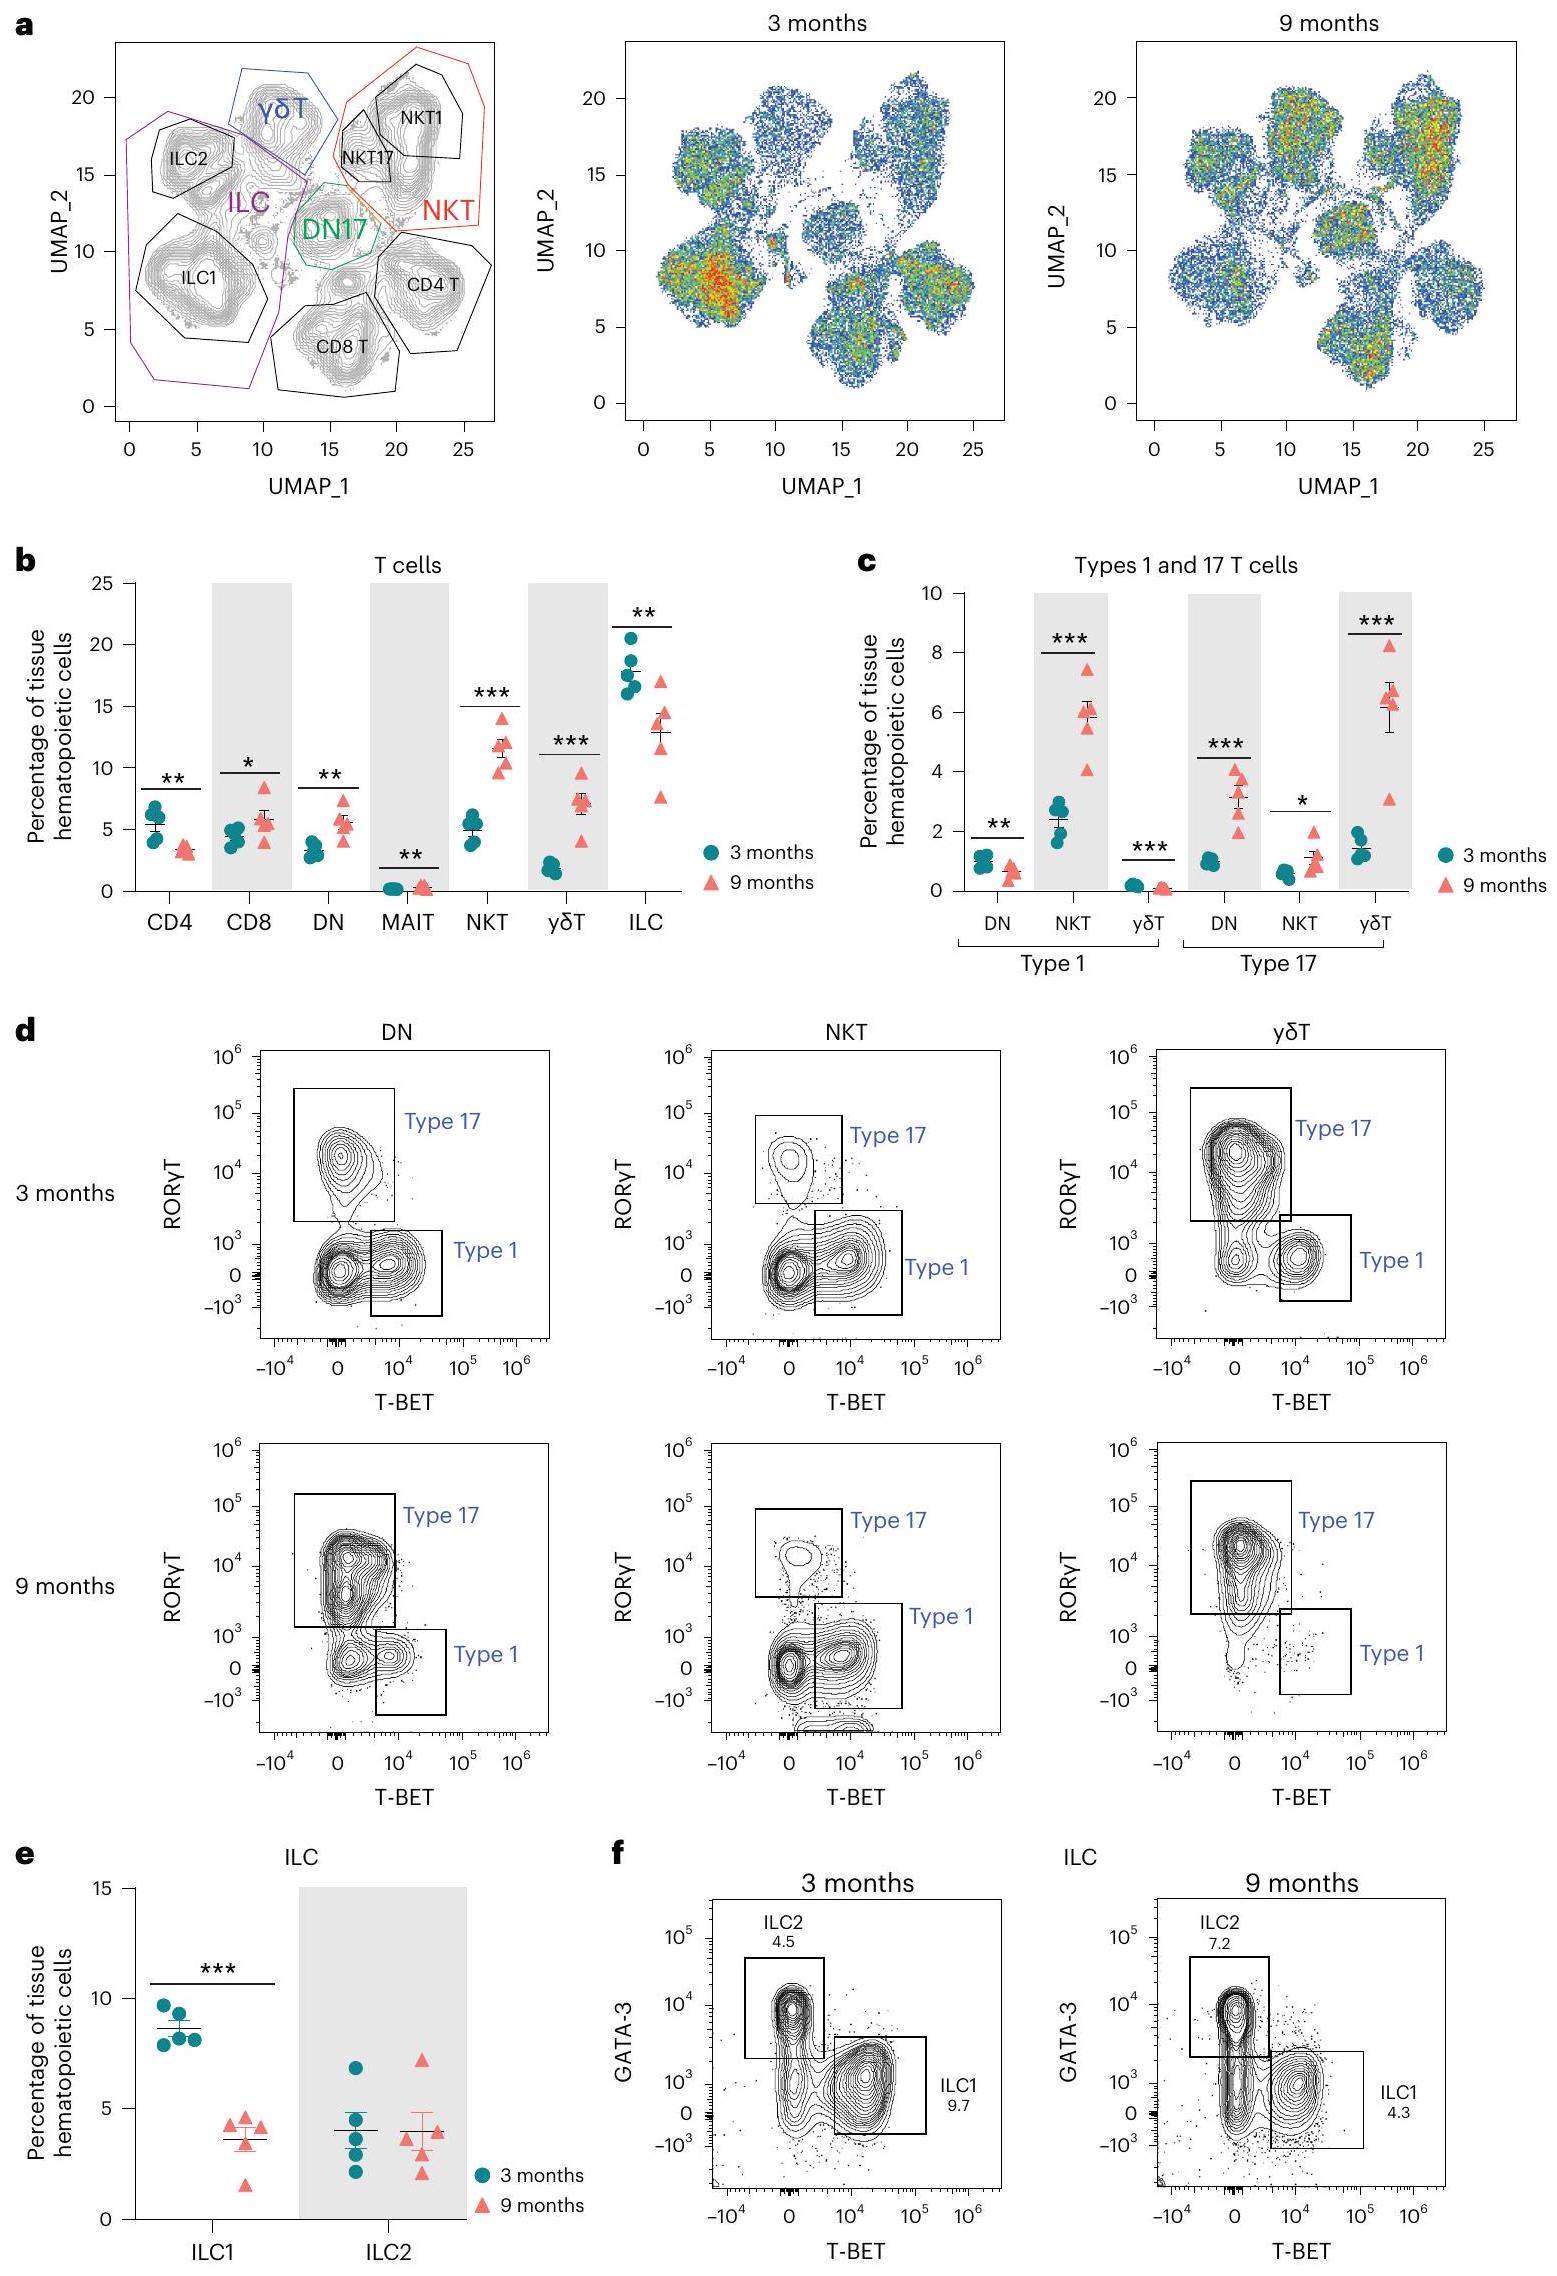
to adaptive T cells that are generally recruited from the circulation . The mechanisms underlying increased innate lymphocyte numbers in the aged ovary may be a result of increased proliferation in response to tissue remodeling and/or local inflammatory cytokine production. This hypothesis is consistent with increased IFNG, TNF, IL15 and IL1A upstream regulator activity in GC SCLs. Alternatively,
Fig. 7 | Subclustering of GCs, oocytes and luteal cells. a, UMAP of granulosa, oocyte and luteal cell CLUs used for subclustering. b, UMAP of granulosa, oocyte and luteal SCLs.c, Dot plot of markers used for SCL cell type identification.
-scores indicating activation or inhibition of pathways during aging by IPA analysis in preantral GCs (d), antral GCs (e), atretic GCs (f) and oocytes (g). scRNA-seq was performed in ovaries per age group.
Fig. 8 | Subclustering of endothelial and epithelial cells. a, UMAP of endothelial and epithelial CLUs used for subclustering. b, UMAP of endothelial and epithelial SCLs. c, Dot plot of markers used for SCL cell type identification. -scores indicating activation or inhibition of pathways altered with aging, as evidenced by IPA analysis, in vascular endothelial cells. e, -scores indicating
activation or inhibition of upstream regulators during aging, as evidenced by IPA analysis, in endothelial and epithelial SCLs. -scores indicating up- or downregulation of genes by genes TP35, Cdkn1a and Cdkn2a. g, Dot plot showing expression of cell senescence markers in vascular endothelial cells in 3 – and 9-month-old ovaries. scRNA-seq was performed in ovaries per age group.
circulating lymphocytes could be recruited into tissue in response to similar proinflammatory signals . Chronic ovarian inflammation caused by autoimmune disease also promotes lymphocyte accumulation , and female humans with autoimmune diseases often experience ovarian insufficiency . This suggests an association between the accumulation of lymphocytes and age-related follicular declines, which merits future interrogation.
Although we detected an increase in the proportion of B cells within the scRNA-seq data at 9 months of age, this was not confirmed by flow cytometry. A previous report showed that the proportion of ovarian B cells slightly increased from 2 to 6 months of age but then returned to basal levels by 12 months of age . This suggests that cell numbers are highly variable in the aging ovary. Within our scRNA-seq data we also detected an increase in cells in the 9-month-old ovary. Although the proportion of cells decreased between 3 and 9 months of age according to flow cytometry, the absolute number of these cells increased with age. The accumulation of cells was previously reported in the aged ovary , although these changes were not observed until 12 months of age. This suggests that the accumulation of cells may begin to occur at 9 months of age.
The literature addressing age-related changes in ovarian myeloid cells is conflicting , which may be due to differences in the methods employed and ages evaluated. We found no significant changes in ovarian myeloid cell accumulation by 9 months of age through scRNAseq or flow cytometry analyses. At this juncture it remains unclear whether myeloid cells actually increase in the ovary with advancing age, but the fusion of monocytes and macrophages into MNGCs could confound these interpretations. As addressed previously, MNGC accumulation is a hallmark of the aged ovary . Previous reports suggest that MNGCs may contribute to the age-related deterioration of the ovarian microenvironment . However, the mechanisms that promote MNGC formation and their physiological ramifications in the ovary remain unresolved. The best-characterized MNGCs are osteoclasts, which are implicated in bone remodeling through phagocytosis of apoptotic cells and collagen fragments . In the ovary, MNGCs may also serve similar functions because phagocytic processes control tissue remodeling during follicular atresia, corpora lutea regression and ovulation. Interestingly, because estrogen induces osteoclast apoptosis, menopausal-related loss of estrogen action accelerates bone loss in humans . Similarly, decreased estrogen signaling in the aged ovary may promote MNGC accumulation. Lymphocytes, which are increased in the aged ovary, also contribute to MNGC formation through cytokine-mediated mechanisms . For example, Il17a (the primary cytokine produced by Type 17 lymphoid cells) is associated with osteoclast formation , which suggests that Type 17 lymphoid cells may contribute to MNGC formation in the aged ovary. Similarly, IFNG is known to induce MNGC formation . Our data show that the primary source of Ifng production in the ovary is Type 1 lymphoid cells, which accumulate in the ovary during aging. Additional studies will be required to further elucidate the mechanisms underlying MNGC formation in the ovary and the role they play in ovarian function and aging processes.
The aforementioned accumulation of lymphoid cells and MNGCs almost certainly contributes to pathological changes that occur in the aged ovary. We speculate that they crosstalk with follicular cells to induce immunogenic responses that adversely affect the local microenvironment. For instance, GCs show upregulated IL-17 and IFNG pathway activity with advancing age, although these genes are dominantly expressed in lymphocytes. This supports the notion that lymphoid cells produce proinflammatory ligands that alter GC transcriptional networks. We also found that GCs upregulate oxidative stress pathways, which we surmise may occur in response to the proinflammatory environment. This finding is supported by a scRNA-seq analysis of aged nonhuman primate ovaries that also show declines in oxidoreductase pathway activity in GCs . These similarities were observed despite the
nonhuman primate ovaries being collected during the perimenopausal period, whereas the mouse ovaries were collected before the periestropausal period. In addition to immunogenic responses, we also found that GCs and TCs display age-related induction of fibrotic responses as evidenced by increased TGF pathway activation. In alignment with previous observations , we saw increased ovarian collagen deposition by 9 months of age. Because collagen is primarily produced by stromal fibroblast-like cells , we evaluated the expression of collagen genes in this SCL but found no age-related changes. Conversely, the collagenase pathway and MMP2 expression were downregulated in the stroma of aged ovaries, suggesting that collagen accumulation occurs due to declines in degradation. It is also noteworthy that TCs upregulate cell proliferation pathways (for example, mTOR), which increase with aging but, more importantly, have been linked to the activation of primordial follicles .
Although the data presented herein serve as an important tool for hypothesis generation, there are a few limitations that should be noted. Cell preparation for scRNA-seq and flow cytometry requires filtration steps that remove MNGCs and large oocytes from analyses. Future studies employing laser-capture microscopy and single-nuclei sequencing would allow for interrogation of these large-cellular populations. Even though the mouse is the most common model organism used for ovarian assessment, there are important aspects of their ovarian biology that differ from nonhuman primates and humans: for example, humans are a mono-ovulating species whereas mice are polyovulating and therefore follicular selection signaling probably differs between these species. In addition, virgin mice were used in this study, which does not account for the impact of pregnancy on ovarian aging dynamics. The examination of additional time points following reproductive senescence should also be considered, because it would provide critical insights related to how the ovary changes following the loss of fertility, which may impact systemic aging mechanisms. Finally, estropause in mice does not completely recapitulate the changes observed in nonhuman primate and human menopause. As such, other models of ovarian aging should be evaluated before definitive conclusions are drawn.
In summary, this report provides insight into changes that occur within the aging murine ovary at single-cell resolution. We report that, by 9 months of age, when mice remain fertile and reproductively active, immune cell accumulation is already doubled with the greatest changes being observed in innate lymphocytes including Type 1 NKTs and Type Ts. We also demonstrate that GCs and TCs upregulate stress-response, immunogenic and fibrotic signaling pathways with aging. These changes correspond to declines in collagenase expression in the stroma, which we surmise contributes to collagen accumulation with age. These changes were accompanied by accumulation of MNGCs with advancing age, which accounted for the vast majority of lipofuscin positivity in aged ovaries. This observation, coupled with the increase in immune cells that commonly express transcriptional markers of cellular senescence, probably contributes to the previously reported increase in ovarian cellular senescence with advancing age. Collectively, our findings provide insights into the underlying mechanisms that promote chronic ovarian inflammation and fibrosis with advancing age and serve as an important resource for the field.

Methods

Animals and tissue collection and dissociation for scRNA-seq

All animal procedures were approved by the Institutional Animal Care and Use Committee at the Oklahoma Medical Research Foundation. C57BL/6J (strain no. 000664) female mice ( ) were purchased from the Jackson Laboratory and acclimated to the Oklahoma Medical Research Foundation animal facility before ovary collection. During acclimation, mice were maintained at on a 12/12-h light/ dark cycle and had ad libitum access to food (LabDiet no. 5053, Purina) and water. At or 9 months of age ( ), mice were anesthetized with isoflurane and euthanized by exsanguination via cardiac
puncture. Perfusion was performed with PBS, and ovaries collected and dissected. One ovary from each mouse was dissociated using Multi Tissue Dissociation Kit 1 (cat. no. 130110201, Miltenyi Biotec), following the manufacturer’s instructions, to create a single-cell suspension in Dulbecco’s PBS (cat. no. 14287080, Gibco).

scRNA-seq library construction

scRNA-seq libraries were constructed with the Chromium Single Cell 3′ GEM, Library & Gel Bead Kit v. 3 (cat. no. 10000075, 10X Genomics), according to the manufacturer’s instructions, as briefly described below. Following the creation of ovarian single-cell suspensions, cells were counted on a MACSQuant10 flow cytometer and diluted to 1,000 cells to target the recovery of 5,000 cells per sample during scRNA-seq encapsulation. The diluted cells, master mix, gel beads and partitioning oil were added to the Chromium Single Cell B Chip (cat. no. 10000073, 10X Genomics) and loaded into a Chromium controller (cat. no. 1000204, 10X Genomics) to generate the gel beads-inemulsion (GEMs) for downstream library preparation. GEMs were then transferred to PCR strip tubes and incubated in a thermocycler to perform reverse transcription in GEMs. Following reverse transcription in GEMs, the recovery agent was aspirated and complementary DNA was cleaned using the Dynabeads MyOne SILANE reagent included in the scRNA-seq kit. The cDNA was amplified and then cleaned using SPRISelect reagent beads (cat. no. B23318, Beckman Coulter). The cDNA was quality checked using a High Sensitivity D5000 ScreenTape (cat. no. 5067-5592, Agilent) run on a TapeStation 2200 (cat. no. G2964AA, Agilent). An aliquot of of amplified cDNA was carried forward to library preparation. Libraries were quantified by quantitative PCR and quality checked on a High Sensitivity D1000 ScreenTape (cat. no. 5067-5584, Agilent) on the TapeStation 2220. Libraries were normalized, pooled and sequenced on a NovaSeq6000 PE150 flow cell. The sequence depth obtained was reads per cell.

scRNA-seq quality control and data analysis

Fastq files were generated and demultiplexed from raw base call (bcl) files using the cellranger mkfastq pipeline. Alignment, filtering, barcode counting and unique molecular identifier counting were conducted with the cellranger count pipeline using the refdata-gex-mm10-2020-A reference transcriptome with default settings. The resultant out files were loaded into R Studio (v.4.2.2) using the ‘load10X’ function of the SoupX package . The SoupX pipeline was then used to estimate and remove ambient RNA contamination before conversion to Seurat objects . Samples were then merged to create a single Seurat object and filtered based on the number of features (>200) and percentage mitochondrial transcripts (<25%). Genes expressed in fewer than three cells were removed from analysis. Genes representing ribosomal contamination (Malat1, Gm42418, Gm26917, Ay036118) were causing technical background noises and were thus removed from the analysis to improve subclustering. Variable features were identified in Seurat before scaling data and running principal component analysis. The JackStraw method was used to determine the dimensionality of the dataset, and UMAP analysis was generated in Seurat. Doublets were identified and removed using the DoubletFinder package , with doublets expected. Other parameters ( ) were generated using DoubletFinder sweep statistics. Samples were coprojected on a UMAP that was used to determine that there were no batch effects and that further data integration was not necessary. Seurat was used to find differentially expressed genes by CLU and age and to generate plots presented in the figures (that is, DimPlot, VlnPlot and DotPlot). Module scores were calculated by the average expression levels of each program at single-cell level, subtracted by the aggregated expression of control feature sets. To assess cell-to-cell interactions between different ovarian cell types in young and aged mouse ovaries we used CellChat45 (v.1.6.1), which is based on the expression of known ligand-receptor pairs .Gene lists were imported into IPA 01.12 (Qiagen
Bioinformatics) software to assess pathway/biological function enrichment analysis.

Histology

The remaining ovary from each mouse was collected into 4% paraformaldehyde, processed and serially sectioned. To determine ovarian reserve, one of every six serial sections from the whole ovary was hematoxylin and eosin (H&E) stained and follicles from each state were counted as described previously . The number of preantral follicles (primordial, primary and secondary) was multiplied by six to account for sections that were not evaluated and then multiplied by two to account for both ovaries. Due to their large size, antral follicles were multiplied by three to account for sections that were not evaluated and then multiplied by two to account for both ovaries. Picrosirius red staining for collagen deposition and Sudan black staining for lipofuscin accumulation were performed on one randomly assigned section from the midline of each ovary and analyzed as previously described .

Immunofluorescence

Evaluation of MMP2 protein in the ovarian stroma was performed in paraffin-embedded ovarian sections as previously described .Slides were incubated with primary rabbit anti-MMP2 antibody (1:100; cat. no. 87809, BioLegend) overnight, followed by secondary goat antirabbit IgG Alexa Fluor 488 antibody (1:500; cat. no. 2338052, Jackson ImmunoResearch Laboratories) for 1 h and DAPI for 5 min . Images were captured on a Zeiss fluorescent microscope in the green (MMP2) and blue (DAPI) channels. Images were also taken in the red channel to identify and avoid autofluorescent regions in the ovary, which are common in the aged ovary . The mean fluorescent intensity from three MMP2-stained stromal regions from each mouse was quantified by Image J and averaged. Nonspecific background fluorescence was calculated in a similar manner using secondary-only stained serial sections from the same mouse. The nonspecific signal was subtracted from each sample.

Flow cytometry

High-parameter spectral flow cytometry was performed to confirm age-related changes in the percentage and number of immune cells. C57BL/6J (strain no. 000664) female mice ( ) were purchased from the Jackson Laboratory. To obtain sufficient cells for the gating strategy proposed, six ovaries from three mice were pooled ( per age group). Before euthanasia, vaginal cytology was performed to determine estrous cycle stage as previously described . The mice were anesthetized with isoflurane and intravenously injected with of FITC-anti-CD45 mAb (cat. no. 35-0454, Cytek) to label intravascular cells and distinguish them from tissue-resident extravascular leukocytes . Five minutes after labeling, mice were euthanized and ovaries collected and pooled according to estrous cycle stage. Ovarian cells were isolated by enzymatic digestion in 3 ml of DMEM (cat. no. D6429, Sigma) containing 4 mg of collagenase (cat. no. C5138-100MG, Sigma-Aldrich). Samples were incubated at for 40 min and gently pipetted 30 times every 10 min to encourage tissue dissociation . Following dissociation, cells were passed through a filter (cat. no. 130-098-462, Miltenyi Biotec) and washed with an additional 7 ml of DMEM. Cells were labeled with Zombie NIR (cat. no. 423106, BioLegend) according to the manufacturer’s instructions then washed in FACS Buffer (PBS + 5% newborn calf serum), incubated with a Fc blocking reagent (anti-mouse CD16/32, cat. no. 70-0161, Cytek), washed and stained with a surface-staining, fluorochrome-labeled mAb cocktail (Supplementary Data 1) for 30 min at , in the presence of Brilliant Stain Buffer Plus ( per sample; cat. no. 563795, Becton Dickinson) and CellBlox Blocking Buffer ( l per sample; cat. no. C001T02F01, Thermo Fisher Scientific). Cells were washed again in FACS buffer and intracellularly stained to detect transcription factor expression using the True-Nuclear Transcription Factor Buffer Set (cat. no. 424401,
BioLegend) according to the manufacturer’s instructions. At the end of the procedure, stained cells were fixed in 2% paraformaldehyde for 5 min . Stained cells were acquired using a five-laser Cytek Aurora flow cytometer and analyzed using FlowJo 10.9 (Becton Dickinson). The gating strategy can be seen in Supplementary Fig. 4.

Statistics and reproducibility

Differentially expressed genes between CLUs and by age were called in the Seurat package using the FindMarkers command with default parameters. Differentially expressed gene lists were imported into IPA software and filtered on false discovery rate (FDR) and (fold change) for pathway analyses. Pathways with were considered statistically significant, and activation -scores are reported by heatmap or bar charts in the figures. More traditional statistical analyses were performed using GraphPad Prism software. The Shapiro-Wilk test was performed to confirm normal distribution of data. Strip plots are presented with individual points shown and means s.e.m. indicated. For comparison of means between the two ages, Student’s -tests were used, applying one- and two-tailed tests where appropriate . Corrections for multiple comparisons were made, where appropriate, using the Benjamini, Krieger and Yekutieli correction for multiple comparisons. Significant differences were defined at or FDR < 0.05 (for multiple comparisons). No statistical methods were used to determine the number of biological replicates to use. Our sample size was selected based on sample sizes reported in previous similar publications . Because the experimental groups used in this study were separated by age, it was not possible to randomize samples. No samples were removed from analysis. All criteria for data exclusion were pre-established. Cells with unique molecular identifier counts, >200 genes or >25% of mitochondrial RNA counts were filtered. Also, cells expressing contradictory markers of known different cell types were removed as potential doublets. One of the cell CLUs was present in only one sample and presented oviduct cell markers rather than ovarian cell markers; this CLU was considered as oviduct tissue contamination and was removed from further analysis. Histological assessments were performed in a blinded manner. For single-cell library preparation, the sample order was randomized and the person preparing the samples blinded to sample grouping. For single-cell data analysis, blinding was not possible due to the statistical methods chosen for comparison by group. Each sample was given assigned group-identifying metadata. Identities have to be called during coding to assess differential expression between groups. It is not possible to perform the correct analysis without knowing from which group each identity is determined. All samples were treated equivalently during quality control steps.

Reporting summary

Further information on research design is available in the Nature Portfolio Reporting Summary linked to this article.

Data availability

The datasets generated through this work are available in a publicly accessible repository. Raw and processed data files can be downloaded from NCBI Gene Expression Omnibus at accession no. GSE232309. An interactive Shiny-based web application is also available at https:// omrf.shinyapps.io/OvarianAgingSCAtlas/. Sequencing data for the study of Morris et al. were retrieved from Open Science Framework and the Broad Institute Single Cell Portal under study no. SCP1914. Gene lists are available as Supplementary Data files. Source Data are provided with this paper.

Code availability

The scRNA-seq data analysis was performed using scripts in R, which are available in GitHub: OvarianAgingAtlas (github.com/StoutLab/ OvarianAgingAtlas).

References

  1. Johnson, J. A. & Tough, S. No-271-delayed child-bearing. J. Obstet. Gynaecol. Can. 39, e500-e515 (2017).
  2. Broekmans, F. J., Soules, M. R. & Fauser, B. C. Ovarian aging: mechanisms and clinical consequences. Endocr. Rev. 30, 465-493 (2009).
  3. Levine, M. E. et al. Menopause accelerates biological aging. Proc. Natl Acad. Sci. USA 113, 9327-9332 (2016).
  4. Wellons, M., Ouyang, P., Schreiner, P. J., Herrington, D. M. & Vaidya, D. Early menopause predicts future coronary heart disease and stroke: the Multi-Ethnic Study of Atherosclerosis. Menopause 19, 1081-1087 (2012).
  5. Tchernof, A., Calles-Escandon, J., Sites, C. K. & Poehlman, E. T. Menopause, central body fatness, and insulin resistance: effects of hormone-replacement therapy. Coron. Artery Dis. 9, 503-511 (1998).
  6. Muka, T. et al. Association of age at onset of menopause and time since onset of menopause with cardiovascular outcomes, intermediate vascular traits, and all-cause mortality: a systematic review and meta-analysis. JAMA Cardiol. 1, 767-776 (2016).
  7. Ossewaarde, M. E. et al. Age at menopause, cause-specific mortality and total life expectancy. Epidemiology 16, 556-562 (2005).
  8. May-Panloup, P. et al. Ovarian ageing: the role of mitochondria in oocytes and follicles. Hum. Reprod. Update 22, 725-743 (2016).
  9. Lim, J. & Luderer, U. Oxidative damage increases and antioxidant gene expression decreases with aging in the mouse ovary. Biol. Reprod. 84, 775-782 (2011).
  10. Yang, L. et al. The role of oxidative stress and natural antioxidants in ovarian aging. Front. Pharmacol. 11, 617843 (2020).
  11. Ansere, V. A. et al. Cellular hallmarks of aging emerge in the ovary prior to primordial follicle depletion. Mech. Ageing Dev. 194, 111425 (2021).
  12. Briley, S. M. et al. Reproductive age-associated fibrosis in the stroma of the mammalian ovary. Reproduction 152, 245-260 (2016).
  13. Lliberos, C. et al. Evaluation of inflammation and follicle depletion during ovarian ageing in mice. Sci. Rep. 11, 278 (2021).
  14. Amargant, F. et al. Ovarian stiffness increases with age in the mammalian ovary and depends on collagen and hyaluronan matrices. Aging Cell 19, e13259 (2020).
  15. Umehara, T. et al. Female reproductive life span is extended by targeted removal of fibrotic collagen from the mouse ovary. Sci. Adv. 8, eabn4564 (2022).
  16. Mara, J. N. et al. Ovulation and ovarian wound healing are impaired with advanced reproductive age. Aging (Albany NY) 12, 9686-9713 (2020).
  17. Foley, K. G., Pritchard, M. T. & Duncan, F. E. Macrophage-derived multinucleated giant cells: hallmarks of the aging ovary. Reproduction 161, V5-V9 (2021).
  18. Wang, S. et al. Single-cell transcriptomic atlas of primate ovarian aging. Cell 180, 585-600 (2020).
  19. Wang, S. et al. Spatiotemporal analysis of human ovarian aging at single-cell resolution. Preprint at Research Square https://doi. org/10.21203/rs.3.rs-1624864/v1 (2022).
  20. Lu, H. et al. Current animal model systems for ovarian aging research. Aging Dis. 13, 1183-1195 (2022).
  21. Russ, J. E., Haywood, M. E., Lane, S. L., Schoolcraft, W. B. & KatzJaffe, M. G. Spatially resolved transcriptomic profiling of ovarian aging in mice. iScience 25, 104819 (2022).
  22. Ankel-Simons, F. & Cummins, J. M. Misconceptions about mitochondria and mammalian fertilization: implications for theories on human evolution. Proc. Natl Acad. Sci. USA 93, 13859-13863 (1996).
  23. Zhang, D., Keilty, D., Zhang, Z. F. & Chian, R. C. Mitochondria in oocyte aging: current understanding. Facts Views Vis. Obgyn 9, 29-38 (2017).
  24. Zhang, G. et al. Expression of mitochondria-associated genes (PPARGC1A, NRF-1, BCL-2 and BAX) in follicular development and atresia of goat ovaries. Reprod. Domest. Anim. 50, 465-473 (2015).
  25. Muhl, L. et al. Single-cell analysis uncovers fibroblast heterogeneity and criteria for fibroblast and mural cell identification and discrimination. Nat. Commun. 11, 3953 (2020).
  26. Morris, M. E. et al. A single-cell atlas of the cycling murine ovary. eLife https://doi.org/10.7554/eLife. 77239 (2022).
  27. Baek, S. H. et al. Single cell transcriptomic analysis reveals organ specific pericyte markers and identities. Front. Cardiovasc. Med. 9, 876591 (2022).
  28. Wagner, M. et al. Single-cell analysis of human ovarian cortex identifies distinct cell populations but no oogonial stem cells. Nat. Commun. 11, 1147 (2020).
  29. Marti, N. et al. Genes and proteins of the alternative steroid backdoor pathway for dihydrotestosterone synthesis are expressed in the human ovary and seem enhanced in the polycystic ovary syndrome. Mol. Cell. Endocrinol. 441, 116-123 (2017).
  30. Sontheimer, R. D., Racila, E. & Racila, D. M. C1q: its functions within the innate and adaptive immune responses and its role in lupus autoimmunity. J. Invest. Dermatol. 125, 14-23 (2005).
  31. Lin, G., Finger, E. & Gutierrez-Ramos, J. C. Expression of CD34 in endothelial cells, hematopoietic progenitors and nervous cells in fetal and adult mouse tissues. Eur. J. Immunol. 25, 1508-1516 (1995).
  32. Garcillan, B. et al. CD3G or CD3D knockdown in mature, but not immature, T lymphocytes similarly cripples the human TCRalphabeta complex. Front. Cell Dev. Biol. 9, 608490 (2021).
  33. Carpenter, A. R. et al. Uroplakin 1b is critical in urinary tract development and urothelial differentiation and homeostasis. Kidney Int. 89, 612-624 (2016).
  34. Berisha, B., Rodler, D., Schams, D., Sinowatz, F. & Pfaffl, M. W. Prostaglandins in superovulation induced bovine follicles during the preovulatory period and early corpus luteum. Front. Endocrinol. (Lausanne) 10, 467 (2019).
  35. Chu, P. G. & Arber, D. A. CD79: a review. Appl. Immunohistochem. Mol. Morphol. 9, 97-106 (2001).
  36. Hu, C. et al. CellMarker 2.0: an updated database of manually curated cell markers in human/mouse and web tools based on scRNA-seq data. Nucleic Acids Res. 51, D870-D876 (2023).
  37. Heng, T. S., Painter, M. W. & Immunological Genome Project, C. The Immunological Genome Project: networks of gene expression in immune cells. Nat. Immunol. 9, 1091-1094 (2008).
  38. Szabo, S. J. et al. A novel transcription factor, T-bet, directs Th1 lineage commitment. Cell 100, 655-669 (2000).
  39. Ivanov, I. I. et al. The orphan nuclear receptor RORgammat directs the differentiation program of proinflammatory IL-17 helper cells. Cell 126, 1121-1133 (2006).
  40. Savage, A. K. et al. The transcription factor PLZF directs the effector program of the NKT cell lineage. Immunity 29, 391-403 (2008).
  41. Kovalovsky, D. et al. The BTB-zinc finger transcriptional regulator PLZF controls the development of invariant natural killer T cell effector functions. Nat. Immunol. 9, 1055-1064 (2008).
  42. Coletta, S. et al. The immune receptor CD300e negatively regulates T cell activation by impairing the STAT1-dependent antigen presentation. Sci. Rep. 10, 16501 (2020).
  43. Asano, Y. Age-related accumulation of non-heme ferric and ferrous iron in mouse ovarian stroma visualized by sensitive nonheme iron histochemistry. J. Histochem. Cytochem. 60, 229-242 (2012).
  44. Urzua, U., Chacon, C., Espinoza, R., Martinez, S. & Hernandez, N. Parity-dependent hemosiderin and lipofuscin accumulation in the reproductively aged mouse ovary. Anal. Cell Pathol. (Amst.) 2018, 1289103 (2018).
  45. Evangelou, K. & Gorgoulis, V. G. Sudan Black B, the specific histochemical stain for lipofuscin: a novel method to detect senescent cells. Methods Mol. Biol. 1534, 111-119 (2017).
  46. Ruan, J. et al. Novel Myh11 dual reporter mouse model provides definitive labeling and identification of smooth muscle cellsbrief report. Arterioscler. Thromb. Vasc. Biol. 41, 815-821 (2021).
  47. Deaton, R. A. et al. A new autosomal Myh11-CreER(T2) smooth muscle cell lineage tracing and gene knockout mouse modelbrief report. Arterioscler. Thromb. Vasc. Biol. 43, 203-211 (2023).
  48. Rosas-Canyelles, E., Dai, T., Li, S. & Herr, A. E. Mouse-to-mouse variation in maturation heterogeneity of smooth muscle cells. Lab Chip 18, 1875-1883 (2018).
  49. Martinez, F. O., Helming, L. & Gordon, S. Alternative activation of macrophages: an immunologic functional perspective. Annu. Rev. Immunol. 27, 451-483 (2009).
  50. Steiger, S. et al. Immunomodulatory molecule IRAK-M balances macrophage polarization and determines macrophage responses during renal fibrosis. J. Immunol. 199, 1440-1452 (2017).
  51. Li, Y. L., Sato, M., Kojima, N., Miura, M. & Senoo, H. Regulatory role of extracellular matrix components in expression of matrix metalloproteinases in cultured hepatic stellate cells. Cell Struct. Funct. 24, 255-261 (1999).
  52. Nelson, J. F., Felicio, L. S., Randall, P. K., Sims, C. & Finch, C. E. A longitudinal study of estrous cyclicity in aging C57BL/6J mice: I. Cycle frequency, length and vaginal cytology. Biol. Reprod. 27, 327-339 (1982).
  53. Davidson, S. et al. Fibroblasts as immune regulators in infection, inflammation and cancer. Nat. Rev. Immunol. 21, 704-717 (2021).
  54. Knight, P. G. & Glister, C. TGF-beta superfamily members and ovarian follicle development. Reproduction 132, 191-206 (2006).
  55. McCloskey, C. W. et al. Metformin abrogates age-associated ovarian fibrosis. Clin. Cancer Res. 26, 632-642 (2020).
  56. Li, M. O., Wan, Y. Y., Sanjabi, S., Robertson, A. K. & Flavell, R. A. Transforming growth factor-beta regulation of immune responses. Annu. Rev. Immunol. 24, 99-146 (2006).
  57. Dompe, C. et al. Human granulosa cells-stemness properties, molecular cross-talk and follicular angiogenesis. Cells https://doi. org/10.3390/cells10061396 (2021).
  58. Meinsohn, M. C. et al. Single-cell sequencing reveals suppressive transcriptional programs regulated by MIS/AMH in neonatal ovaries. Proc. Natl Acad. Sci. USA https://doi.org/10.1073/pnas. 2100920118 (2021).
  59. Fan, X. et al. Single-cell reconstruction of follicular remodeling in the human adult ovary. Nat. Commun. 10, 3164 (2019).
  60. Chen, A. Q., Wang, Z. G., Xu, Z. R., Yu, S. D. & Yang, Z. G. Analysis of gene expression in granulosa cells of ovine antral growing follicles using suppressive subtractive hybridization. Anim. Reprod. Sci. 115, 39-48 (2009).
  61. Wigglesworth, K., Lee, K. B., Emori, C., Sugiura, K. & Eppig, J. J. Transcriptomic diversification of developing cumulus and mural granulosa cells in mouse ovarian follicles. Biol. Reprod. 92, 23 (2015).
  62. Lee, J. H. & Berger, J. M. Cell cycle-dependent control and roles of DNA topoisomerase II. Genes (Basel) https://doi.org/10.3390/ genes10110859 (2019).
  63. Blanchard, J. M. Cyclin A2 transcriptional regulation: modulation of cell cycle control at the G1/S transition by peripheral cues. Biochem. Pharmacol. 60, 1179-1184 (2000).
  64. Piersanti, R. L., Santos, J. E. P., Sheldon, I. M. & Bromfield, J. J. Lipopolysaccharide and tumor necrosis factor-alpha alter gene expression of oocytes and cumulus cells during bovine in vitro maturation. Mol. Reprod. Dev. 86, 1909-1920 (2019).
  65. Stocco, C., Telleria, C. & Gibori, G. The molecular control of corpus luteum formation, function, and regression. Endocr. Rev. 28, 117-149 (2007).
  66. Salmon, N. A., Handyside, A. H. & Joyce, I. M. Oocyte regulation of anti-Mullerian hormone expression in granulosa cells during ovarian follicle development in mice. Dev. Biol. 266, 201-208 (2004).
  67. Shrikhande, L., Shrikhande, B. & Shrikhande, A. AMH and its clinical implications. J. Obstet. Gynaecol. India 70, 337-341 (2020).
  68. Brown, H. M. & Russell, D. L. Blood and lymphatic vasculature in the ovary: development, function and disease. Hum. Reprod. Update 20, 29-39 (2014).
  69. Brown, H. M., Robker, R. L. & Russell, D. L. Development and hormonal regulation of the ovarian lymphatic vasculature. Endocrinology 151, 5446-5455 (2010).
  70. Hartanti, M. D. et al. Formation of the bovine ovarian surface epithelium during fetal development. J. Histochem. Cytochem. 68, 113-126 (2020).
  71. Hummitzsch, K. et al. A new model of development of the mammalian ovary and follicles. PLoS ONE 8, e55578 (2013).
  72. Schulz, A. et al. The soluble Fms-like tyrosine kinase-1 contributes to structural and functional changes in endothelial cells in chronic kidney disease. Int. J. Mol. Sci. https://doi.org/10.3390/ ijms232416059 (2022).
  73. Galvagni, F. et al. Dissecting the CD93-Multimerin 2 interaction involved in cell adhesion and migration of the activated endothelium. Matrix Biol. 64, 112-127 (2017).
  74. Fujimoto, N. et al. Single-cell mapping reveals new markers and functions of lymphatic endothelial cells in lymph nodes. PLoS Biol. 18, e3000704 (2020).
  75. Bloom, S. I., Islam, M. T., Lesniewski, L. A. & Donato, A. J. Mechanisms and consequences of endothelial cell senescence. Nat. Rev. Cardiol. 20, 38-51 (2023).
  76. Wang, J. J. et al. Single-cell transcriptome landscape of ovarian cells during primordial follicle assembly in mice. PLoS Biol. 18, e3001025 (2020).
  77. Pei, J. et al. Single-cell transcriptomics analysis reveals a cell atlas and cell communication in yak ovary. Int. J. Mol. Sci. https://doi.org/ 10.3390/ijms24031839 (2023).
  78. Gilardi, K. V., Shideler, S. E., Valverde, C. R., Roberts, J. A. & Lasley, B. L. Characterization of the onset of menopause in the rhesus macaque. Biol. Reprod. 57, 335-340 (1997).
  79. Isola, J. V. V. et al. Mild calorie restriction, but not 17alphaestradiol, extends ovarian reserve and fertility in female mice. Exp. Gerontol. 159, 111669 (2022).
  80. Franasiak, J. M. et al. The nature of aneuploidy with increasing age of the female partner: a review of 15,169 consecutive trophectoderm biopsies evaluated with comprehensive chromosomal screening. Fertil. Steril. 101, 656-663 e651 (2014).
  81. Ben Yaakov, T., Wasserman, T., Aknin, E. & Savir, Y. Single-cell analysis of the aged ovarian immune system reveals a shift towards adaptive immunity and attenuated cell function. eLife https://doi.org/10.7554/eLife. 74915 (2023).
  82. Masopust, D. & Soerens, A. G. Tissue-resident T cells and other resident leukocytes. Annu. Rev. Immunol. 37, 521-546 (2019).
  83. Yuzen, D., Arck, P. C. & Thiele, K. Tissue-resident immunity in the female and male reproductive tract. Semin. Immunopathol. 44, 785-799 (2022).
  84. Wang, X. & Tian, Z. Gammadelta T cells in liver diseases. Front. Med. 12, 262-268 (2018).
  85. Hammerich, L. et al. Chemokine receptor CCR6-dependent accumulation of gammadelta cells in injured liver restricts hepatic inflammation and fibrosis. Hepatology 59, 630-642 (2014).
  86. Peng, X. et al. IL-17A produced by both gammadelta T and Th17 cells promotes renal fibrosis via RANTES-mediated leukocyte infiltration after renal obstruction. J. Pathol. 235, 79-89 (2015).
  87. Simonian, P. L. et al. Gammadelta T cells protect against lung fibrosis via IL-22. J. Exp. Med. 207, 2239-2253 (2010).
  88. Yan, X. et al. Deleterious effect of the IL-23/IL-17A axis and gammadeltaT cells on left ventricular remodeling after myocardial infarction. J. Am. Heart Assoc. 1, e004408 (2012).
  89. Bank, I. The role of cells in fibrotic diseases. Rambam Maimonides Med. J. https://doi.org/10.5041/RMMJ. 10256 (2016).
  90. Zhang, M. & Zhang, S. T cells in fibrosis and fibrotic diseases. Front. Immunol. 11, 1142 (2020).
  91. Bruno, M. E. C. et al. Accumulation of gammadelta T cells in visceral fat with aging promotes chronic inflammation. Geroscience 44, 1761-1778 (2022).
  92. Moutuou, M. M., Gauthier, S. D., Chen, N., Leboeuf, D. & Guimond, M. Studying peripheral T cell homeostasis in mice: a concise technical review. Methods Mol. Biol. 2111, 267-283 (2020).
  93. Nguyen, Q. P., Deng, T. Z., Witherden, D. A. & Goldrath, A. W. Origins of CD4 circulating and tissue-resident memory T-cells. Immunology 157, 3-12 (2019).
  94. Wilkinson, P. C., Komai-Koma, M. & Newman, I. Locomotion and chemotaxis of lymphocytes. Autoimmunity 26, 55-72 (1997).
  95. Dong, Y. et al. The role of regulatory T cells in thymectomyinduced autoimmune ovarian disease. Am. J. Reprod. Immunol. https://doi.org/10.1111/aji. 12683 (2017).
  96. Sharif, K. et al. Insights into the autoimmune aspect of premature ovarian insufficiency. Best. Pract. Res. Clin. Endocrinol. Metab. 33, 101323 (2019).
  97. Zhang, Z., Schlamp, F., Huang, L., Clark, H. & Brayboy, L. Inflammaging is associated with shifted macrophage ontogeny and polarization in the aging mouse ovary. Reproduction 159, 325-337 (2020).
  98. Ahmadzadeh, K., Vanoppen, M., Rose, C. D., Matthys, P. & Wouters, C. H. Multinucleated giant cells: current insights in phenotype, biological activities, and mechanism of formation. Front. Cell Dev. Biol. 10, 873226 (2022).
  99. Weivoda, M. M. & Bradley, E. W. Macrophages and bone remodeling. J. Bone Miner. Res. 38, 359-369 (2023).
  100. Kameda, T. et al. Estrogen inhibits bone resorption by directly inducing apoptosis of the bone-resorbing osteoclasts. J. Exp. Med. 186, 489-495 (1997).
  101. Goretzlehner, G., Krause, B., Nehmzow, M. & Ulrich, U. [Endocrine diseases in pregnancy]. Z. Arztl. Fortbild. (Jena) 84, 135-141 (1990).
  102. Adamopoulos, I. E. et al. IL-17A gene transfer induces bone loss and epidermal hyperplasia associated with psoriatic arthritis. Ann. Rheum. Dis. 74, 1284-1292 (2015).
  103. Anderson, J. M. Multinucleated giant cells. Curr. Opin. Hematol. 7, 40-47 (2000).
  104. Fais, S. et al. Multinucleated giant cells generation induced by interferon-gamma. Changes in the expression and distribution of the intercellular adhesion molecule-1 during macrophages fusion and multinucleated giant cell formation. Lab. Invest. 71, 737-744 (1994).
  105. Lind, A. K. et al. Collagens in the human ovary and their changes in the perifollicular stroma during ovulation. Acta Obstet. Gynecol. Scand. 85, 1476-1484 (2006).
  106. Liu, G. Y. & Sabatini, D. M. mTOR at the nexus of nutrition, growth, ageing and disease. Nat. Rev. Mol. Cell Biol. 21, 183-203 (2020).
  107. Schneider, A. et al. The interconnections between somatic and ovarian aging in murine models. J. Gerontol. A Biol. Sci. Med. Sci. 76, 1579-1586 (2021).
  108. Young, M. D. & Behjati, S. SoupX removes ambient RNA contamination from droplet-based single-cell RNA sequencing data. Gigascience https://doi.org/10.1093/gigascience/giaa151 (2020).
  109. Satija, R., Farrell, J. A., Gennert, D., Schier, A. F. & Regev, A. Spatial reconstruction of single-cell gene expression data. Nat. Biotechnol. 33, 495-502 (2015).
  110. Liu, Y. et al. Single-cell profiling reveals divergent, globally patterned immune responses in murine skin inflammation. iScience 23, 101582 (2020).
  111. Nguyen, H. T. T., Guevarra, R. B., Magez, S. & Radwanska, M. Single-cell transcriptome profiling and the use of AID deficient mice reveal that B cell activation combined with antibody class switch recombination and somatic hypermutation do not benefit the control of experimental trypanosomosis. PLoS Pathog. 17, e1010026 (2021).
  112. McGinnis, C. S., Murrow, L. M. & Gartner, Z. J. DoubletFinder: doublet detection in single-cell RNA sequencing data using artificial nearest neighbors. Cell Syst. 8, 329-337 (2019).
  113. Jin, S. et al. Inference and analysis of cell-cell communication using CellChat. Nat. Commun. 12, 1088 (2021).
  114. Isola, J. V. V. et al. 17Alpha-estradiol promotes ovarian aging in growth hormone receptor knockout mice, but not wild-type littermates. Exp. Gerontol. 129, 110769 (2020).
  115. Saccon, T. D. et al. Primordial follicle reserve, DNA damage and macrophage infiltration in the ovaries of the long-living Ames dwarf mice. Exp. Gerontol. 132, 110851 (2020).
  116. Anderson, K. G. et al. Intravascular staining for discrimination of vascular and tissue leukocytes. Nat. Protoc. 9, 209-222 (2014).
  117. Ruxton, G. D. & Neuhäuser, M. When should we use one-tailed hypothesis testing? Methods Ecol. Evol. https://doi.org/10.1111/ j.2041-210X.2010.00014.x (2010).

Acknowledgements

This work was supported by the National Institutes of Health (nos. R01 AG069742 to M.B.S. and P30 AG050911 to W.M.F.), the Global Consortium for Reproductive Longevity and Equality (nos. GCRLE-4501 to M.B.S and GCRLE-0523 to S.R.O.) and the Presbyterian Health Foundation (Pilot Research Funding to M.B.S.). The funders had no role in study design, data collection and analysis, decision to publish or preparation of the manuscript. We thank the staff at the Clinical Genomics Center, Flow Cytometry Core (Cytek Aurora, grant no. 1S10OD028479-01) and Imaging Core Facility at the Oklahoma Medical Research Foundation for assistance with sequencing and histological procedures.

Author contributions

J.V.V.I., S.R.O. and M.B.S. conceived the project and designed the experiments. J.V.V.I. and S.R.O. performed the experiments and data analyses, with contributions from C.R.H., S.K., S.A.M., J.D.H., H.N.C.C., A.S., S.K., J.A.-I. and W.M.F. J.V.V.I., S.R.O. and C.R.H. created figures and performed statistical analyses, with contributions from W.M.F. and M.B.S. J.V.V.I., S.R.O. and M.B.S. wrote the manuscript, and all authors edited and approved the final draft.

Competing interests

The authors declare no competing interests.

Additional information

Supplementary information The online version contains supplementary material available at https://doi.org/10.1038/s43587-023-00552-5.
Correspondence and requests for materials should be addressed to Michael B. Stout.
Peer review information Nature Aging thanks the anonymous reviewer(s) for their contribution to the peer review of this work.
Reprints and permissions information is available at www.nature.com/reprints.
Publisher’s note Springer Nature remains neutral with regard to jurisdictional claims in published maps and institutional affiliations.
Open Access This article is licensed under a Creative Commons Attribution 4.0 International License, which permits use, sharing, adaptation, distribution and reproduction in any medium or format, as long as you give appropriate credit to the original author(s) and the source, provide a link to the Creative Commons license, and indicate if changes were made. The images or other third party material in this article are included in the article’s Creative Commons license, unless indicated otherwise in a credit line to the material. If material is not included in the article’s Creative Commons license and your intended use is not permitted by statutory regulation or exceeds the permitted use, you will need to obtain permission directly from the copyright holder. To view a copy of this license, visit http://creativecommons. org/licenses/by/4.0/.
© The Author(s) 2024

natureportfolio

Corresponding author(s): Michael Stout
Last updated by author(s): 10/31/2023

Reporting Summary

Nature Portfolio wishes to improve the reproducibility of the work that we publish. This form provides structure for consistency and transparency in reporting. For further information on Nature Portfolio policies, see our Editorial Policies and the Editorial Policy Checklist.

Statistics

For all statistical analyses, confirm that the following items are present in the figure legend, table legend, main text, or Methods section.
Confirmed
The exact sample size for each experimental group/condition, given as a discrete number and unit of measurement
A statement on whether measurements were taken from distinct samples or whether the same sample was measured repeatedly
The statistical test(s) used AND whether they are one- or two-sided
Only common tests should be described solely by name; describe more complex techniques in the Methods section.
A description of all covariates tested
A description of any assumptions or corrections, such as tests of normality and adjustment for multiple comparisons
A full description of the statistical parameters including central tendency (e.g. means) or other basic estimates (e.g. regression coefficient) AND variation (e.g. standard deviation) or associated estimates of uncertainty (e.g. confidence intervals)
For null hypothesis testing, the test statistic (e.g. ) with confidence intervals, effect sizes, degrees of freedom and value noted Give values as exact values whenever suitable.
For Bayesian analysis, information on the choice of priors and Markov chain Monte Carlo settings
For hierarchical and complex designs, identification of the appropriate level for tests and full reporting of outcomes
tstimates of effect sizes (e.g. Cohen’s , Pearson’s ), indicating how they were calculated
Our web collection on statistics for biologists contains articles on many of the points above.

Software and code

Policy information about availability of computer code

Data collection
Data analysis
NovaSeq 6000 System used to generate sequencing data.
Generated sequencing data was analyzed using QIAGEN Ingenuity Pathway Analysis (https://digitalinsights.qiagen.com/products-overview/ discovery-insights-portfolio/analysis-and-visualization/qiagen-ipa/), RStudio (http://www.rstudio.com/, version 4.2.2), SoupX (https:// github.com/constantAmateur/SoupX), CellRanger (https://support.10xgenomics.com/single-cell-gene-expression/software/overview/ welcome, version 3.1), Seurat (https://github.com/satijalab/seurat, version 4.3.0), SeuratWrappers (https://github.com/satijalab/seuratwrappers, version 0.3.1), DoubletFinder (https://github.com/chris-mcginnis-ucsf/DoubletFinder, version 2.0.3), scCustomize(https:// github.com/samuel-marsh/scCustomize, version 1.1.1), ShinyCell (https://github.com/SGDDNB/ShinyCell, version 2.1.0), CellChat (https:// github.com/sqjin/CellChat, version 1.6.1). In-house scripts can be accessed at https://github.com/StoutLab/OvarianAgingAtlas.

Policy information about availability of data

All manuscripts must include a data availability statement. This statement should provide the following information, where applicable:
  • Accession codes, unique identifiers, or web links for publicly available datasets
  • A description of any restrictions on data availability
  • For clinical datasets or third party data, please ensure that the statement adheres to our policy
The datasets generated through this work are available in a publicly accessible repository. Raw and processed data files can be downloaded from NCBI Gene Expression Omnibus at accession number GSE232309. An interactive Shiny-based web application is also available at https://omrf.shinyapps.io/ OvarianAgingSCAtlas/. Sequencing data for the Morris et al. (2022) study were retrieved from Open Science Framework and the Broad Institute Single Cell Portal under study number SCP1914. Gene lists are available are supplementary data files and data underlying dot plots is available as source data files.

Research involving human participants, their data, or biological material

Policy information about studies with human participants or human data. See also policy information about sex, gender (identity/presentation), and sexual orientation and race, ethnicity and racism.
Reporting on sex and gender NA
Reporting on race, ethnicity, or other socially relevant groupings NA
Population characteristics NA
Recruitment NA
Ethics oversight NA
Note that full information on the approval of the study protocol must also be provided in the manuscript.

Field-specific reporting

Please select the one below that is the best fit for your research. If you are not sure, read the appropriate sections before making your selection.
Life sciences Behavioural & social sciences Ecological, evolutionary & environmental sciences
For a reference copy of the document with all sections, see nature.com/documents/nr-reporting-summary-flat.pdf

Life sciences study design

All studies must disclose on these points even when the disclosure is negative.
Sample size For scRNA-Seq, biological replicates/group were sequenced with ~2000 cells/sample. No statistical methods were used to determine the number of biological replicates to use. Our sample size was selected based on sample sizes reported in previous similar publications (PMID: 32004457, 33351795, 33378681, 37096871). Additionally, we used SCOPIT Power calculations to determine that cells were needed to observe >100 cells per cluster, assuming that the rarest population was 1% of the total cells. Thus, we targeted 16,000 cells to ensure enough cells were available to make conclusions about rare populations.
Data exclusions No samples were removed from analysis. All criteria for data exclusion were pre-established. Cells with less than 400 UMI counts, less than 200 genes, or greater than of mitochondrial RNA counts were filtered. Also, cells expressing contradictory markers of known different cell types were removed as potential doublets. One of the cell clusters was present in only one sample and presented oviduct cell markers rather than ovarian cell markers. This cluster was considered oviduct tissue contamination and removed from further analysis.
Replication Four biological replicates were included for each group. All biological replicates were successful and included in analysis. Single-cell findings were verified by orthogonal methods where possible, including flow cytometry and histological assessments. Findings were compared and integrated with previously published datasets.
Randomization Since the experimental groups used in this study were separated by age, it was not possible to randomize samples. Mice were purchased from the Jackson Laboratory at the intended ages.
Blinding Histological assessments were performed in a blinded manner. For single-cell library preparation, the sample order was randomized and the person preparing the samples were blinded to the sample grouping. For single-cell data analysis, blinding was not possible due to the statistical methods chosen to compare by group. Each sample was given assigned group-identifying meta-data. The identities have to be called during coding in order to assess differential expression between groups. It is not possible to perform the correct analysis without knowing from which group each identity is from. All samples were treated equivalently during quality control steps.

Reporting for specific materials, systems and methods

We require information from authors about some types of materials, experimental systems and methods used in many studies. Here, indicate whether each material, system or method listed is relevant to your study. If you are not sure if a list item applies to your research, read the appropriate section before selecting a response.
Materials & experimental systems Methods
n/a Involved in the study n/a Involved in the study
X
Dual use research of concern

Antibodies

Antibodies used
Flow cytometry
CD45.2 FITC 1041 mg/ml Cytek Biosciences (Cat. No. 35-0454)
CD90 BUV395 53-2.1 1/100 BD Biosciences (Cat. No. 740205)
CD4 BUV563 GK1.5 1/400 BD Biosciences (Cat. No. 612923)
CD69 BUV737 H1.2F3 1/200 BD Biosciences (Cat. No. 612793)
MRI-5-OP-RU-TFT RV421-1/400 NIH Tetramer Facilities
Ly-6G BV510 1A8 1/100 Biolegend (Cat. No. 127633)
CD44 BV650 IM7 1/100 Biolegend (Cat. No. 103049)
CD103 BV711 M290 1/100 BD Biosciences (Cat. No. 564320)
TCRgd BV786 GL3 1/100 BD Biosciences (Cat. No. 740995)
CD19 RB545 103 1/100 BD Biosciences (Cat. No. 569727)
CDIIb NFB610-30S MI/70 1/100 Thermo Fisher Scientific (Invitrogen) (Cat. No. M015T02B05)
CD8a PerCP-Cy5.5 53-6. 7 1/100 Biolegend (Cat. No. 100734)
CDId-PBS-57-TET PE – 1/800 NIH Tetramer Core Facility
B220 PE-F700 RA3-6B2 1/100 Biolegend (Cat. No. 103280)
TCRb PE-Cy7 H57-597 1/100 Biolegend (Cat. No. 109222)
CD49b APC DX5 1/100 Biolegend (Cat. No. 108910)
MHC 11 AlexaFluor700 M5/114.15.2 1/200 Biolegend (Cat. No. 107622)
CD45 APC Fire 810 30-FII 1/100 Biolegend (Cat. No. 103174)
CellBlox Blocking Buffer 5 ul/test Thermo Fisher Scientific (Invitrogen) (Cat. No. B001T06F01)
Brilliant Stain Buffer Plus 10 uL/test BD Biosciences (Cat. No. 566385)
RORgT BV480 Q31-378 1/100 BD Biosciences (Cat. No. 567176)
GATA-3 AF647 L50-823 1/100 BD Biosciences (Cat. No. 560068)
T-bet PE/Dazzle 594 4B10 1/200 Biolegend (Cat. No. 644828)
Immunofluorescence
MMP-2 (D2O4T) Rabbit mAb 1/100 Cell Signaling (Cat. No. 87809)
IgG Alexa Fluor 488 antibody 1/500 Jackson ImmunoResearch Laboratories (Cat. No. 2338052)
Validation
The CD1d and MR1 tetramers are not commercially available. They were obtained from the NIH Tetramer Core Facility (https:// tetramer.yerkes.emory.edu/) and validated on normal mouse tissues using negative control tetramers supplied by the same facility.
All other antibodies used were commercially available and previously validated in mice for the application used, as stated in the manufacturers websites: https://www.bdbiosciences.com, https://www.biolegend.com/en-gb, https://www.thermofisher.com/us/ en/home/brands/invitrogen, and https://www.cellsignal.com. Antibodies were also validated in-house uunder the staining conditions used.

Animals and other research organisms

Policy information about studies involving animals; ARRIVE guidelines recommended for reporting animal research, and Sex and Gender in Research
Laboratory animals
3- and 9-month-old C57Bl/6J female mice. Mice were kept at on a -hour light-dark cycle and had ad libitum access to food and water.
Wild animals
No wild animals were used in the study.
Reporting on sex
Since this is an ovarian aging study we only evaluated female mice.
Field-collected samples
Ethics oversight
No field-collected samples were used in the study.
This study was approved by the Oklahoma Medical Research Foundation IACUC and performed in accordance with institutional and national guidelines.
Note that full information on the approval of the study protocol must also be provided in the manuscript.

Flow Cytometry

Plots

Confirm that:
The axis labels state the marker and fluorochrome used (e.g. CD4-FITC).
The axis scales are clearly visible. Include numbers along axes only for bottom left plot of group (a ‘group’ is an analysis of identical markers).
All plots are contour plots with outliers or pseudocolor plots.
A numerical value for number of cells or percentage (with statistics) is provided.

Methodology

Sample preparation
To obtain enough cells for the gating strategy proposed, six ovaries from three mice were pooled ( age ). Ovarian cells were isolated by enzymatic digestion in 3 mL of Dulbecco’s Modified Eagle’s Medium (DMEM) (cat# D6429, Sigma) containing 4 mg collagenase (cat# C5138-100MG, Sigma-Aldrich, St. Louis, MO). Samples were incubated at for 40 minutes and gently pipetted 30 times every 10 minutes to encourage tissue dissociation93. Following dissociation, cells were passed through a filter (cat# 130-098-462, Miltenyi Biotec) and washed with an additional 7 mL of DMEM. Cells were labeled with Zombie NIR (cat# 423106, Biolegend, San Diego, CA, USA) according to the manufacturer’s instructions, then washed in FACS Buffer (PBS + 5% Newborn Calf Serum), incubated with a Fc blocking reagent (anti-mouse CD16/32; cat# 70-0161, Cytek), washed and stained with a surface staining fluorochrome-labeled mAb cocktail (Suppl. File 7 ) for 30 min at , in the presence of Brilliant Stain Buffer Plus ( sample) (cat# 563795, Becton Dickinson, Mountain View, Ca, USA) and CellBlox Blocking Buffer ( sample) (cat# C001T02F01, Thermo Fisher Scientific). Cells were washed again in FACS buffer and intracellularly stained to detect transcription factor expression using the True-Nuclear Transcription Factor Buffer Set (cat# 424401, Biolegend) according to the manufacturer’s instructions. At the end of the procedure, stained cells were fixed in paraformaldehyde for 5 min .
Instrument
5-laser Cytek Aurora
Software
FlowJo 10.9 (Becton Dickinson)
Cell population abundance
No sorting was performed. To assure sufficient number of cells in the distinct cell populations after gating, 6 ovaries were pooled for each sample.
Gating strategy
For the analysis of the flow cytoemtry data we first excluded doublets using a FSH-A/FSH-C histogram. Dead cells were then excluded based on Zombie NIR staining. We then gated on tissue hematopoietic cells as CD45+ i.v. CD45-. The resulting tissue hematopoietic were then sequentially gated as shown in Supplementary Figure 4.
Tick this box to confirm that a figure exemplifying the gating strategy is provided in the Supplementary Information.

  1. Aging & Metabolism Research Program, Oklahoma Medical Research Foundation, Oklahoma City, OK, USA. Genes & Human Disease Research Program, Oklahoma Medical Research Foundation, Oklahoma City, OK, USA. Neuroscience Department, University of Oklahoma Health Sciences Center, Oklahoma City, OK, USA. Physiology Department, University of Oklahoma Health Sciences Center, Oklahoma City, OK, USA. Oklahoma City Veterans Affairs Medical Center, Oklahoma City, OK, USA. Nutrition College, Federal University of Pelotas, Pelotas, Brazil. Arthritis & Clinical Immunology Research Program, Oklahoma Medical Research Foundation, Oklahoma City, OK, USA. These authors contributed equally: José V. V. Isola, Sarah R. Ocañas. -mail: michael-stout@omrf.org
  2. follicles and autofluorescent regions. This assay was repeated independently for each biological replicate.g,h, CellChat chord diagrams of TGF signaling pathway interactions in 3-month (g) and 9-month ovarian CLUs (h). i, IPA canonical pathways indicating activation of specific pathways by aging in TCs. j, IPA upstream regulator analyses of age-related changes in stroma and TC SCLs ( 9 versus 3 months old, -score) related to cell proliferation ( per age group). scRNA-seq was performed in ovaries per age group. Data presented as mean s.e.m. by one-tailed -test or two-tailed -test (d,e). ROS, reactive oxygen species. Exact values shown in Source Data.