أنماط التنقل العالمية والإقليمية للمعادن (المعدنية) في التربة والمخاطر المرتبطة بها Global and regional patterns of soil metal(loid) mobility and associated risks

المجلة: Nature Communications، المجلد: 16، العدد: 1
DOI: https://doi.org/10.1038/s41467-025-58026-8
PMID: https://pubmed.ncbi.nlm.nih.gov/40140373
تاريخ النشر: 2025-03-26

أنماط التنقل العالمية والإقليمية للمعادن (المعدنية) في التربة والمخاطر المرتبطة بها

تاريخ الاستلام: 18 نوفمبر 2024
تم القبول: 10 مارس 2025
نُشر على الإنترنت: 26 مارس 2025
التربة، مورد طبيعي غير متجدد ولا غنى عنه، تدعم وظائف النظام البيئي الحيوية. ومع ذلك، فإن تراكم المعادن والفلزات (المشار إليها فيما بعد بالمعادن) في التربة، سواء كان طبيعياً أو ناتجاً عن الأنشطة البشرية، يشكل تهديداً عالمياً له آثار صحية عميقة على البشر. الماشية والحياة البرية تنبع التهديدات من سمّيتها، وانتشارها الواسع، ومقاومتها للتحلل الحيوي، وإمكانية امتصاصها بواسطة المحاصيل. تم الكشف عن محتويات عالية من المعادن (أو المعادن الشبيهة) في التربة في جميع أنحاء العالم، لا سيما في الاتحاد الأوروبي. والصين ، مما يؤثر على مجموعات سكانية كبيرة. أظهر تقييم عالمي أن أكثر من 23 مليون شخص يعيشون في مناطق الفيضانات، التي تمثل حوالي من مساحة اليابسة على الأرض تتأثر بتراكم المعادن (أو المعادن الشبيهة) المرتبطة بالتعدين مع النمو السكاني المتوقع وزيادة الطلب على الأراضي الزراعية من المحتمل أن تتفاقم الآثار الضارة لتلوث التربة بالمعادن (أو المعادن الشبيهة) على النظم البيئية وصحة الإنسان.

تشونغتشونغ تشي تاو يى تشينغ منغتينغ وو فيونا إتش. إم. تانغ مين ليو بينتيان زانغ سيبيل ديرابل تشين تشيوسونغ غونغرين هو ليوان تشاي وزانغ لين

تلوث التربة بالمعادن والمعادن شبه الموصلة (المعدن[ات] شبه الموصلة) هو قضية عالمية تحمل مخاطر كبيرة على صحة الإنسان والأنظمة البيئية وأمن الغذاء. يعتمد التقييم الدقيق للمخاطر على فهم حركة المعادن (شبه الموصلة)، والتي تحدد التوافر البيولوجي والأثر البيئي. هنا نعرض نموذج تعلم آلي موجه بواسطة نظرية يتنبأ بتجزئة المعادن (شبه الموصلة) في التربة عبر العالم. يحدد نموذجنا المحتوى الكلي للمعادن (شبه الموصلة) والكربون العضوي في التربة كعوامل رئيسية لحركة المعادن (شبه الموصلة). نجد أن تشير البيانات إلى أن نسبة من أراضي العالم تواجه خطر التحرك المتوسط إلى العالي، مع بؤر ساخنة في روسيا وتشيلي وكندا وناميبيا. تشير تحليلاتنا إلى أن الجهود العالمية لتعزيز احتجاز الكربون في التربة قد تزيد عن غير قصد من حركة المعادن (أو المعادن الشبيهة). علاوة على ذلك، في أوروبا، تم الكشف عن التباين بين التوزيعات المكانية للمعادن (أو المعادن الشبيهة) الكلية والمتنقلة. تقدم هذه النتائج رؤى حاسمة حول التوزيعات العالمية ومحركات حركة المعادن (أو المعادن الشبيهة) في التربة، مما يوفر أداة قوية لتحديد أولويات اختبار حركة المعادن (أو المعادن الشبيهة)، وزيادة الوعي، وإبلاغ ممارسات إدارة التربة المستدامة.

الملخص

لتقييم المخاطر المرتبطة بتلوث التربة بالمعادن (أو المعادن الشبيهة) بدقة وإبلاغ عمليات الترميم وصنع السياسات الفعالة من الضروري أن نأخذ في الاعتبار ليس فقط المحتوى الإجمالي لهذه الملوثات ولكن أيضًا حركتها داخل بيئة التربة. تحكم قابلية حركة المعادن (أو المعادن الشبيهة) في إمكانية وصولها الحيوي لامتصاص النباتات ودخولها اللاحق في سلسلة الغذاء. مما يجعله محددًا رئيسيًا لمصيرهم البيئي والمخاطر المحتملة فهم شامل لحركة المعادن (أو المعادن الشبيهة) في التربة العالمية، التي تحكمها بشكل كبير الأنواع الكيميائية، لا يزال فجوة حاسمة في الأدبيات.

الحصول على بيانات شاملة ودقيقة لتحديد الأنواع المعدنية (أو المعادن) في التربة على نطاق قاري أو عالمي لا يزال يمثل تحديًا كبيرًا، مما يعيق الجهود المبذولة لتقييم وفهم الحركة العالمية لمثل هذه الملوثات. على الرغم من أن التقنيات التحليلية المتقدمة، مثل مطيافية الامتصاص بالأشعة السينية عالية الطاقة وتقنية تخفيف النظائر، يمكن أن تحدد بدقة تحديد الأنواع المعدنية (أو المعادن). المتخصصين

تقييد الطبيعة والتوافر المحدود تطبيقها على نطاق واسع. تجارب الاستخراج المتسلسل، على الرغم من استخدامها على نطاق واسع لتجزئة المعادن (أو المعادن الشبيهة) وتقييم القابلية الحيوية. لم يتم استخدامها بعد بشكل متسق وموثوق لتحديد أنماط الفصل عند المقاييس القارية أو العالمية. ويعزى ذلك إلى الطبيعة التي تتطلب جهداً كبيراً من تجارب الاستخراج المتسلسل، والطبيعة غير المتجانسة لخصائص التربة، وتفاعل العديد من العوامل المربكة (المفصلة في الملاحظة التكميلية 1). النتائج غير المتسقة من الدراسات السابقة للفصل الكيميائي تؤكد بشكل أكبر على الفجوة المعرفية الحرجة في تحليل التFractionation والحركة للمعادن (أو المعادن الشبيهة) في التربة.
إن توفر بيانات الأرض الكبيرة والتقدم في تعلم الآلة (ML) قد مكن من تطوير نماذج بيئية تنبؤية عالمية، حتى مع وجود بيانات عينة محدودة. استغلالًا لهذه الفرصة، قمنا بتجميع مجموعة بيانات عالمية تحتوي على 30,832 قياسًا ميدانيًا لتفكيك المعادن (أو المعادن الشبيهة) في التربة عبر 5 قارات و56 دولة/إقليم (الطرق والشكل التوضيحي التكميلي 1). ثم قمنا بتطوير نموذج تعلم آلي موجه بواسطة نظرية للتنبؤ بتفكيك المعادن (أو المعادن الشبيهة) المختلفة، والذي تم تدريبه والتحقق من صحته باستخدام مجموعة البيانات المجمعة بالإضافة إلى مجموعة بيانات خارجية تحتوي على 4,900 نقطة بيانات مستمدة من الأدبيات والتجارب (الطرق). من خلال دمج خصائص التربة السطحية العالمية في من خلال الدقة العالية، كشف نموذجنا عن التوزيعات المكانية لأكثر المعادن (أو شبه المعادن) انتشارًا (الرصاص، الزرنيخ، الكادميوم، الكروم، النحاس، والزئبق)، موضحًا العوامل الأساسية التي تؤثر على حركتها في التربة. حددنا النقاط الساخنة العالمية لمخاطر تحرك المعادن (أو شبه المعادن) وقيمنا التغيرات المكانية والزمانية لها تحت سيناريوهات تلوث مرتفعة وجهود احتجاز الكربون في التربة المحتملة. كما تم إجراء فحص دقيق لمحتوى المعادن (أو شبه المعادن) المتحركة في دول الاتحاد الأوروبي. تسلط هذه الدراسة الضوء على الطبيعة الديناميكية لحركة المعادن (أو شبه المعادن)، مما يوفر رؤى لتخفيف تلوث التربة العالمي ودعم إدارة التربة المستدامة. يمكن أيضًا استخدام النموذج الحالي للمساعدة في تقييم المعادن (أو شبه المعادن) في التربة، وزيادة الوعي، وتحديد أولويات المزيد من اختبار حركة المعادن (أو شبه المعادن) على المستويات المحلية والعالمية.

النتائج

أنماط عالمية ومحركات رئيسية لتحرك المعادن (أو المعادن الشبيهة) في التربة

النموذج المعتمد على النظرية والموجه بواسطة التعلم الآلي، الذي تم التحقق من صحته باستخدام بيانات عالمية، يتنبأ بدقة بتوزيع المعادن (أو المعادن الشبيهة) عبر أربع فئات مع انخفاض في الحركة: القابلة للتبادل، القابلة للذوبان في الماء والحمض (F1)، القابلة للاختزال (F2)، القابلة للأكسدة (F3)، والرصيد (F4) (الطرق والشكل التوضيحي التكميلي 2). تشير فئة F1 إلى أكثر فئات المعادن (أو المعادن الشبيهة) حركة. يشكل أكبر تهديد للبيئة المحيطة . وبالتالي، فإن نسبة كتلته، المشار إليها بـ ، تم اعتباره مؤشر التنقل في هذه الدراسة. تم استخدام نموذج التعلم الآلي للتنبؤ بالتنقل الأساسي، الذي يُعرف بأنه عند عتبة تلوث التربة الأساسية، لـ 22 معدن(ة) عالميًا في القرار (انظر “الطرق”). تقيس القابلية الأساسية أكثر محتوى معدني (أو شبه معدني) متحرك بمجرد حدوث تلوث أساسي؛ تمثل القابلية الأساسية العالية احتمالاً كبيراً لتحرك المعادن (أو شبه المعادن) في التربة إلى مياه المسام التربة. وبالتالي، تشير تحليل القابلية في الدراسة الحالية إلى خطر تسرب تلوث المعادن (أو شبه المعادن) في التربة إلى المياه وأمن الغذاء، ويطلق على هذا الخطر المرتبط اسم خطر التحرك في التحليلات اللاحقة.
كشفت هذه التقييمات العالمية عن تباين مكاني كبير واختلافات محددة بالعناصر في قابلية الحركة الأساسية، كما هو موضح لأكثر المعادن (أو العناصر الشبيهة بالمعادن) انتشارًا في الشكل 1a-f. باستخدام الرصاص كمثال (الشكل 1a)، فإن مستوى الحركة المتوسط إلى العالي ، انظر “الطرق”) حدث في حوالي من التربة السطحية العالمية (باستثناء القارة القطبية الجنوبية)، موزعة بشكل رئيسي في شمال الولايات المتحدة، وجنوب كندا، وشمال إفريقيا، وجنوب أوروبا، وجنوب الصين. بالنسبة للمعادن (أو شبه المعادن) الأخرى الشائعة، بما في ذلك الزرنيخ، ، و Hg ، كانت النسب العالمية للأراضي ذات خطر التحريك المتوسط إلى العالي تبلغ ، و على التوالي. عالميًا، النسبة المتوسطة للأراضي ذات خطر التحريك المتوسط إلى العالي
كان لأكثر المعادن (الفلزات) انتشارًا (الجدول التكميلي 1).
من بين 22 معدن(ة) تم تناولها في الدراسة الحالية، أظهر اليورانيوم والزنك والصوديوم أعلى مستوى من الحركة الأساسية، مع متوسط عالمي قيم من ، و على التوالي، في حين أظهرت الحديد والفاناديوم والألمنيوم أدنى مستوى من الحركة الأساسية، مع متوسط عالمي قيم من ، و على التوالي (الشكل 1g). من الجدير بالذكر أن خطر التحريك زاد بشكل واضح مع مستوى التلوث. نظرًا لمستويات التلوث المرتفعة (الطرق)، فإن متوسط ​​نسبة الأراضي العالمية مع لأكثر المعادن (الفلزات) انتشارًا ستتوسع إلى (الجدول التكميلي 1)، كما توقعه نموذج التعلم الآلي. لوحظت اختلافات واضحة في زيادة النسب المتحركة من القاعدة إلى سيناريوهات التلوث المرتفعة (الشكل التكميلي 3)، مما يشير إلى أن خصائص التربة كان لها تأثير حاسم على توزيع الحركة والديناميات عبر العالم. على سبيل المثال، زادت نسبة الرصاص المتحرك بشكل أوضح في أمريكا الجنوبية وأفريقيا مقارنة بالمناطق الأخرى تحت نفس الزيادة في محتوى الرصاص الكلي. ومع ذلك، ظلت نقاط خطر التحريك مشابهة تحت كل من سيناريوهات القاعدة والتلوث المرتفع.
أظهرت تفسير نموذج التعلم الآلي (الطرق) أن الألفة الإلكترونية ونصف القطر التساهمي كانتا الخصائص العنصرية الرئيسية التي تؤثر على التنقل، في حين كانت محتويات المعادن (TMC) والكربون العضوي (OC) هي الخصائص التربة الأكثر تأثيرًا (الشكل 1h). التأثير الإيجابي لـ TMC على (الشكل 1h) يشير إلى أن حركة المعادن (أو المعادن الشبيهة) تزداد في التربة الملوثة بشدة، مما يعني أن مخاطر التحرك المرتبطة قد تتصاعد بشكل غير متناسب أسرع من مستوى التلوث. العلاقة الإيجابية بين TMC و يشرح التأثير المذكور أعلاه لمستويات التلوث المرتفعة على خطر التحريك. بالإضافة إلى ذلك، التأثير الإيجابي للمواد العضوية على (الشكل 1h) يشير إلى أن احتجاز الكربون في التربة، وهو استراتيجية تمثيلية لانبعاث الكربون السلبي قد تزيد بشكل غير مقصود من مخاطر التحريك في التربة الملوثة بالمعادن (أو العناصر المعدنية). بشكل عام، يرتبط الرقم الهيدروجيني للتربة أيضًا بشكل إيجابي مع (الشكل 1h)، على الرغم من التقلبات الطفيفة. تأثير سعة تبادل الكاتيونات (CEC) والطين على غير خطي بشكل كبير، مما يدل على آليات تأثير معقدة. على سبيل المثال، قد تعمل كميات معينة من الطين على استقرار المعادن (أو المعادن الشبيهة) في التربة من خلال توفير المزيد من مواقع الامتصاص، بينما يمكن أن يؤدي وجود كمية كبيرة من الطين أيضًا إلى تسهيل تسرب المعادن (أو المعادن الشبيهة) بسبب انخفاض كمية المكونات النشطة للغاية وزيادة ذوبانية الجسيمات.

زيادة خطر تحرك المعادن (أو المعادن الثقيلة) تحت مبادرة الأربعة بالألف

خريطة مخاطر التحرك الشامل (الطرق) لأكثر المعادن (أو المعادن الشبيهة) انتشارًا في التربة كشفت عن درجة عالية من التباين المكاني عالميًا، مع تركيز ملحوظ لمناطق عالية المخاطر في التحرك في المناطق ذات العرض العالي في نصف الكرة الشمالي (الشكل 2أ). كانت بؤر مخاطر التحرك المتوقعة موجودة في جميع القارات، بشكل رئيسي في وسط وشمال آسيا، والأجزاء الشمالية من أمريكا الشمالية وأفريقيا، وجنوب أوقيانوسيا، وأمريكا الجنوبية (الشكل 2ب-ي). المناطق التي تتميز بنسب عالية من التحرك، مثل الجزائر وشمال غرب الصين تم تمثيلها في خريطة المخاطر الشاملة للتعبئة.
كان خطر التعبئة العالية مرتبطًا بشكل قوي بمحتوى الكربون العضوي العالي (الشكل التكميلي 4). كان الكربون العضوي هو المحرك الرئيسي لخصائص التربة. ، تأتي في المرتبة الثانية بعد TMC، كما كشفت تحليل أهمية الميزات (الشكل 1h). علاوة على ذلك، كانت OC هي المحرك الأكثر أهمية لخصائص التربة لـ ، والنحاس، وكان له تأثير مهم على للمعادن (أو العناصر) الأخرى السائدة (الشكل التوضيحي التكميلي 5). قد تؤدي الجهود العالمية لتعزيز احتجاز الكربون في التربة كاستراتيجية لانبعاثات سلبية إلى زيادة محتملة في خطر تحريك المعادن (أو العناصر) في التربة. يسمح لنا نموذج التعلم الآلي بتقييم التغير في الكسر القابل للحركة ( ) لمختلف المعادن(لويد) في سيناريوهات مستقبلية لزيادة الكربون العضوي في التربة.
تهدف مبادرة الأربعة في الألف إلى زيادة محتوى الكربون العضوي في التربة بـ سنويًا لتحسين صحة التربة ومكافحة تغير المناخ . ومع ذلك، قد يؤدي هذا الزيادة في كربون التربة بشكل غير مقصود إلى زيادة خطر تحريك المعادن (أو المعادن الشبيهة). إذا تم تنفيذ هذه المبادرة بشكل مستمر من 2024 إلى 2050، ستشهد التربة العالمية زيادة كبيرة في خطر تحريك المعادن (أو المعادن الشبيهة) (الشكل 3أ). على وجه التحديد، من الأراضي العالمية (باستثناء القارة القطبية الجنوبية) كان من المتوقع أن تكون في مستوى متوسط إلى –
خطر تعبئة مرتفع لستة معادن (أو عناصر شبيهة بالمعادن) شائعة على الأقل في عام 2024؛ كانت هذه النسبة لخمس معادن (أو عناصر شبيهة بالمعادن) شائعة لأربعة معادن (أو شبه معادن) شائعة (الشكل 3ب). وفقًا لتوقعات نموذجنا، ستزداد النسبة العالمية للأراضي المعرضة لمخاطر التلوث المتوسطة إلى العالية بسبب وجود أربعة معادن (أو شبه معادن) شائعة على الأقل إلى بحلول عام 2050، إذا تم تنفيذ مبادرة الأربعة بالألف بالكامل، مما يمثل زيادة كبيرة من 23% في عام 2024.
الشكل 1 | التنبؤ العالمي والعوامل الرئيسية لتحرك المعادن (أو المعادن الشبيهة) في التربة.
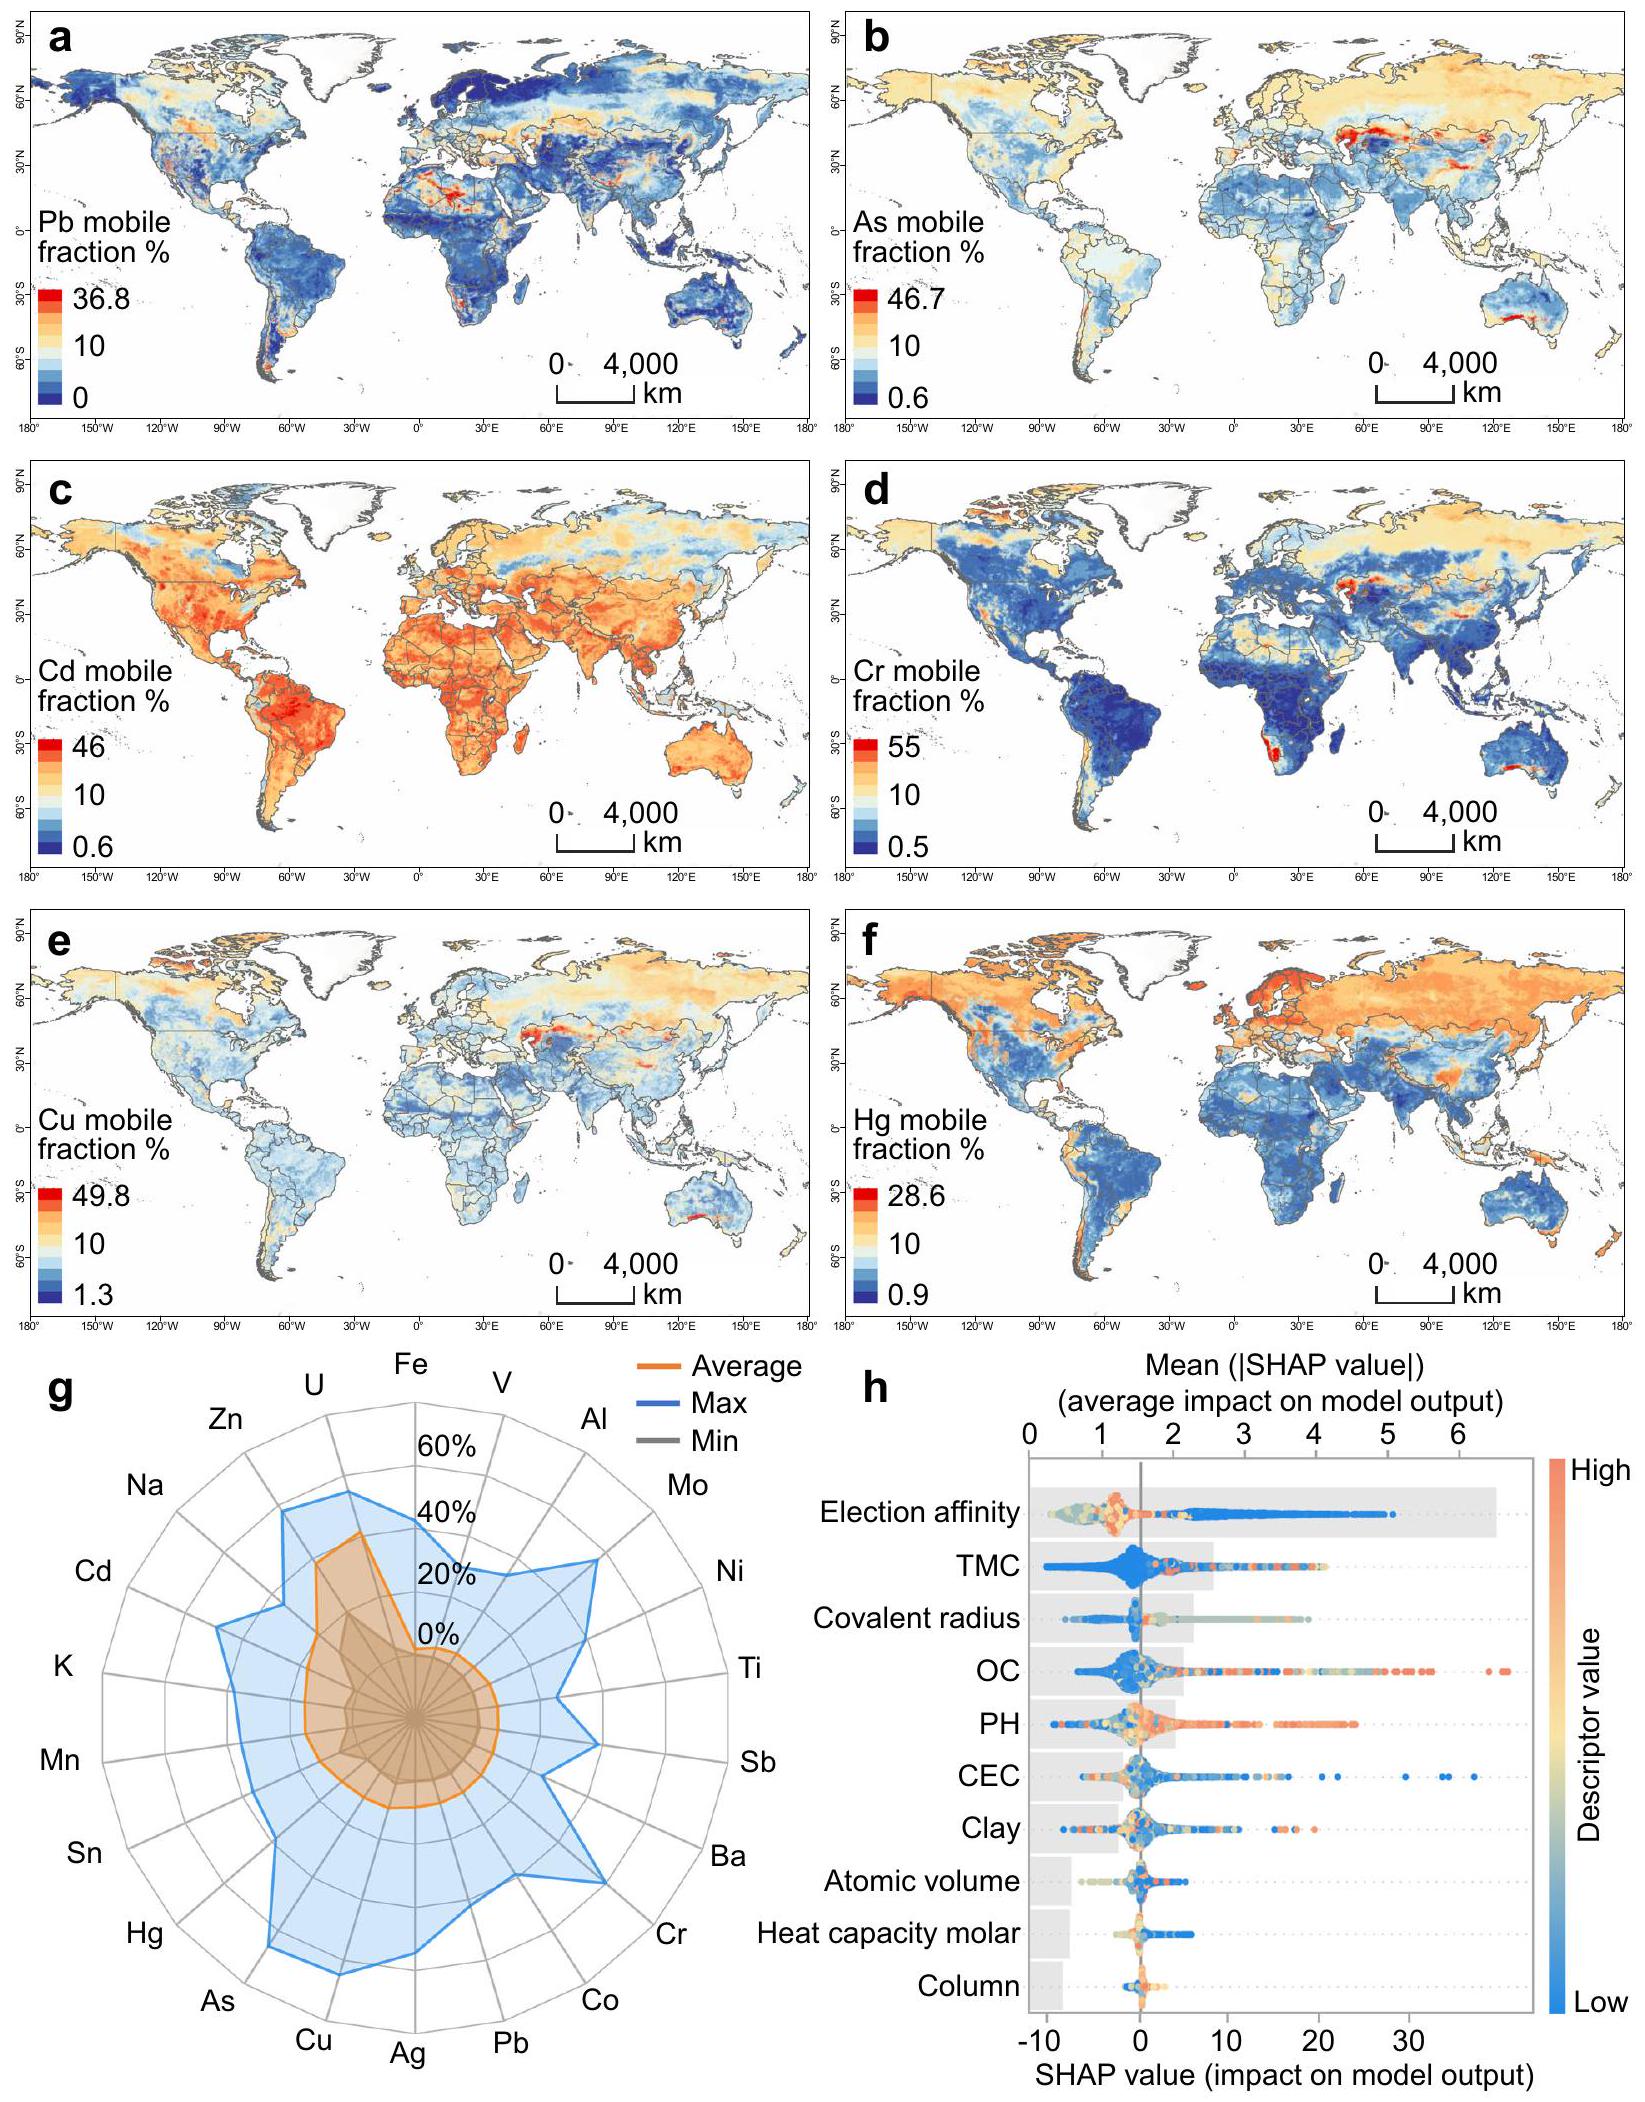
نموذج توزيع عالمي للجزء المتنقل لـ ، والزئبق في سيناريوهات الأساس. مستوى التنقل المتوسط إلى العالي ( ) موضح باللون الأحمر. متوسط قيم لـ 22 معدن(ة) عبر العالم. تم اختيار TMC لتحليل التنقل الأساسي استنادًا إلى القيم الإرشادية التنظيمية العالمية (RGVs) ، وإدارة حماية البيئة الأمريكية (USEPA) (الجداول التكميلية 2 و 3)؛ تحليل التفسيرات الإضافية شابلي (SHAP) للجزء المتنقل يتم توضيح تأثير أهم 10 أوصاف.
من خلال رسم سحابة لقيم SHAP المقابلة لها. يمثل لون النقطة القيمة النسبية للوصف في مجموعة البيانات (من العالي إلى المنخفض موضحًا بالألوان البرتقالية إلى الزرقاء). تُظهر الموقع الأفقي للنقاط ما إذا كان تأثير ذلك الوصف يساهم بشكل إيجابي أو سلبي في تلك الحالة التنبؤية. المحور). يوضح الرسم البياني الشريطي الرمادي القيم المطلقة المتوسطة لـ SHAP للموصوفات في كل حالة، مما يعني المساهمة العامة للموصوف في التنبؤ. تمثل OC و CEC الكربون العضوي وسعة تبادل الكاتيونات، على التوالي. يتم توفير بيانات المصدر كملف بيانات المصدر.
الشكل 2 | نقاط خطر التحرك العالمي في عام 2024، كما يكشف نموذج حركة المعادن (الفلزات) في التربة. أ نقاط خطر التحرك للمعادن (الفلزات) السائدة (الرصاص، الزرنيخ، ، والزئبق) في جميع أنحاء العالم. توضح هذه الرسم البياني عدد الحالات السائدة
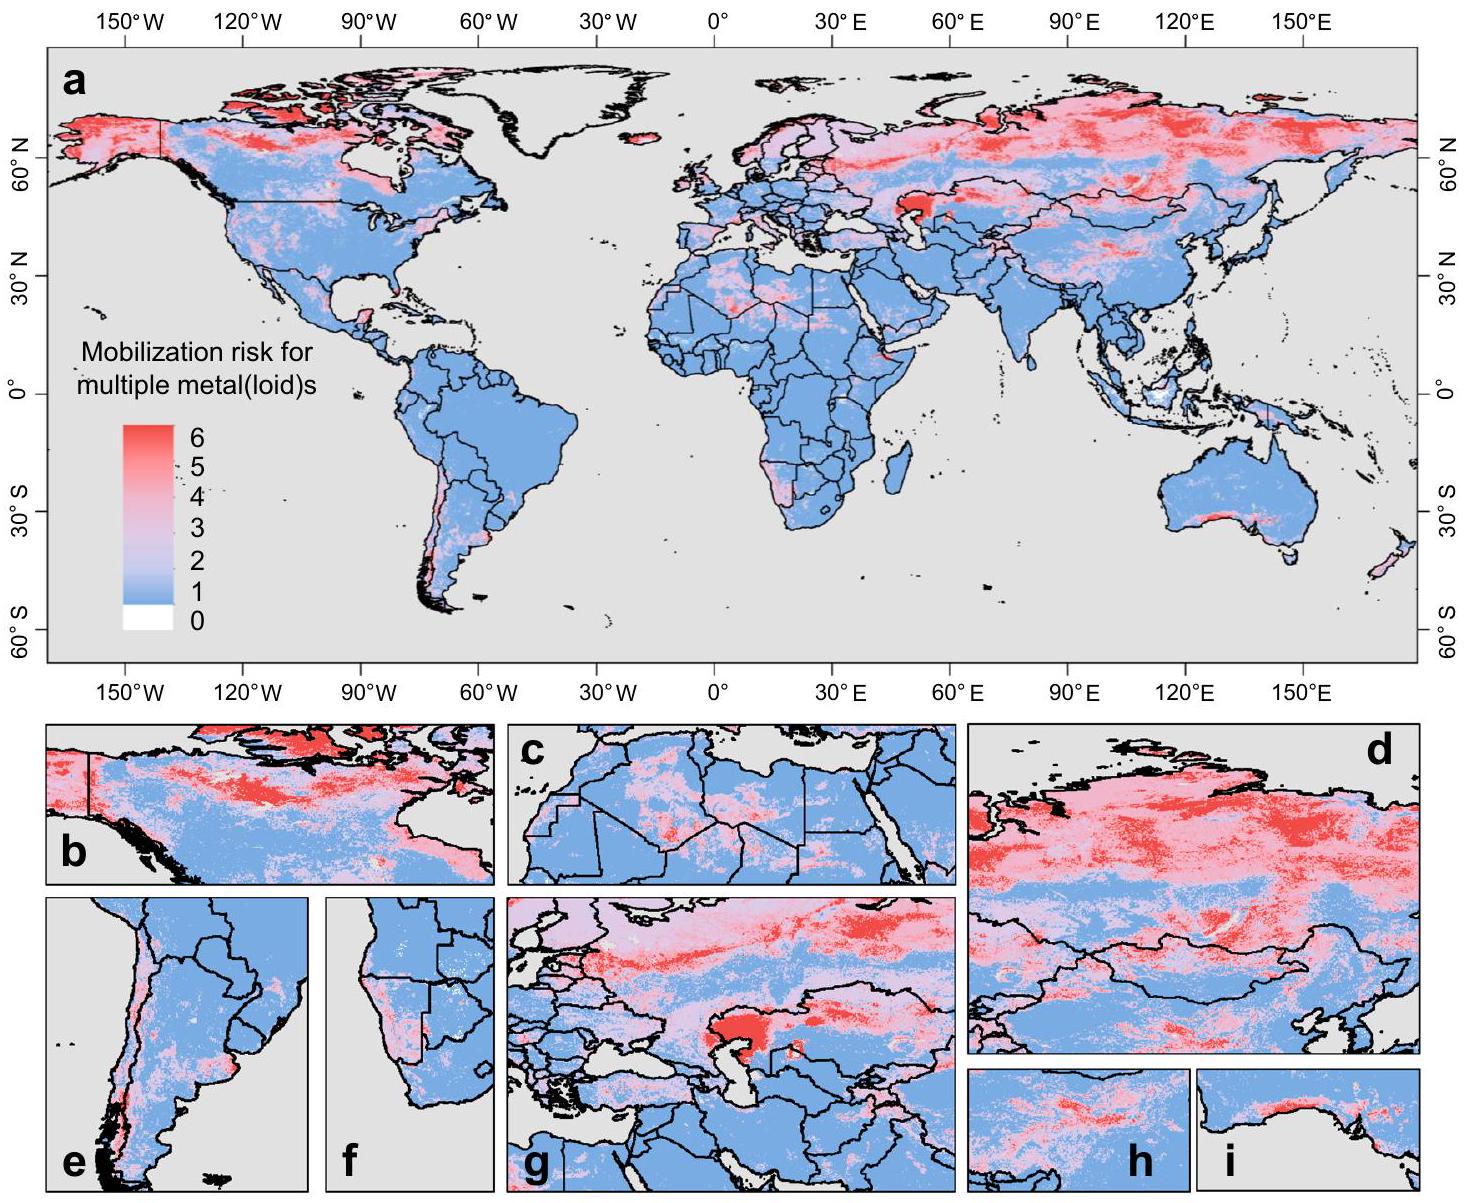
المعادن (أو المعادن غير المعدنية) التي تم تحديدها بمخاطر تحرك متوسطة إلى عالية في السيناريوهات الأساسية لموقع معين؛ ب-1 مقاطع مكبرة من النقاط الساخنة المعتادة لمخاطر التحرك. تم توفير بيانات المصدر كملف بيانات مصدر.
يحدث زيادة في خطر تحريك المعادن (أو المعادن الشبيهة) في معظم البلدان، وتوجد تباينات مكانية بسبب التأثيرات المترابطة للعديد من العوامل (مثل خصائص التربة والسيناريوهات الأساسية المستخدمة). كشفت التحليلات الوطنية أن من الأراضي الروسية كانت في خطر تعبئة متوسط إلى مرتفع لوجود أربعة معادن (أو شبه معادن) شائعة على الأقل في عام 2024، بينما كانت النسب في تشيلي وكندا وناميبيا ، و “، على التوالي. كانت الدول الثلاث التي تمتلك أكبر نسب من الأراضي ذات مخاطر تعبئة متوسطة إلى عالية لستة معادن (أو عناصر شبيهة بالمعادن) هي كندا ( روسيا ) وناميبيا ( في عام 2024. من المتوقع أن تشهد باكستان والصين وناميبيا أكبر الزيادات في مخاطر تحريك المعادن (أو المعادن الشبيهة) بسبب تنفيذ احتجاز الكربون في التربة، في حين من المتوقع أن تشهد روسيا زيادة متواضعة فقط في مخاطر التحريك (الشكل 3ب). على الرغم من أن تزايدت قيم المعادن (أو المعادن الشبيهة) الستة السائدة عمومًا مع زيادة محتوى الكربون العضوي، لكن معدل الزيادة تراجع عند مستويات أعلى من الكربون العضوي (الشكل التوضيحي التكميلي 6). كانت متوسطات محتوى الكربون العضوي في باكستان ( )، الصين ( ) وناميبيا ( كانت أقل بكثير من تلك في روسيا في عام 2024، مما يشير إلى مزيد من
زيادة واضحة في خطر التعبئة عندما تم اعتماد مبادرة الأربعة بالألف.

الفروق المكانية في محتويات المعادن (المعدنية) الكلية والمتنقلة في تربة الاتحاد الأوروبي

من خلال دمج نموذج التعلم الآلي مع بيانات TMC من مسح إطار استخدام الأراضي/غطاء الأرض (LUCAS)، قمنا بإنشاء خرائط كونتور (الشكل 4 والشكل التكميلية 7) توضح محتويات المعادن المتنقلة في التربة. TMC) لدول الاتحاد الأوروبي في عام 2009 (الطرق). إن الفجوة بين توزيعات TMC ومحتوى المعادن المتنقلة (اللويد) تعكس العوامل المعقدة التي تؤثر على الحركة وتبرز أهمية الاستفادة من نموذج التعلم الآلي لتقييم مخاطر التحرك. على سبيل المثال، تراوح المحتوى الكلي للرصاص بين 1.99 و بمتوسط تمت ملاحظة مستويات عالية من محتوى الرصاص (Pb) حول وسط المملكة المتحدة، ووسط ألمانيا، ووسط إيطاليا. المملكة المتحدة، وألمانيا، وإيطاليا، وفرنسا، بمتوسطات تبلغ 26.52، 21.96، 20.78 و على التوالي، تم تصنيفها من بين أعلى دول الاتحاد الأوروبي من حيث إجمالي محتوى الرصاص. المملكة المتحدة
الشكل 3 | تأثير مبادرة الأربعة بالألف على بؤر مخاطر التحرك العالمية في عام 2050. أ بؤر المخاطر العالمية في عام 2050 بعد اعتماد احتجاز الكربون في التربة بموجب مبادرة الأربعة بالألف؛ ب مقارنة عالمية ووطنية لبؤر مخاطر التحرك في عامي 2024 و2050. توضح هذه الرسم البياني العدد
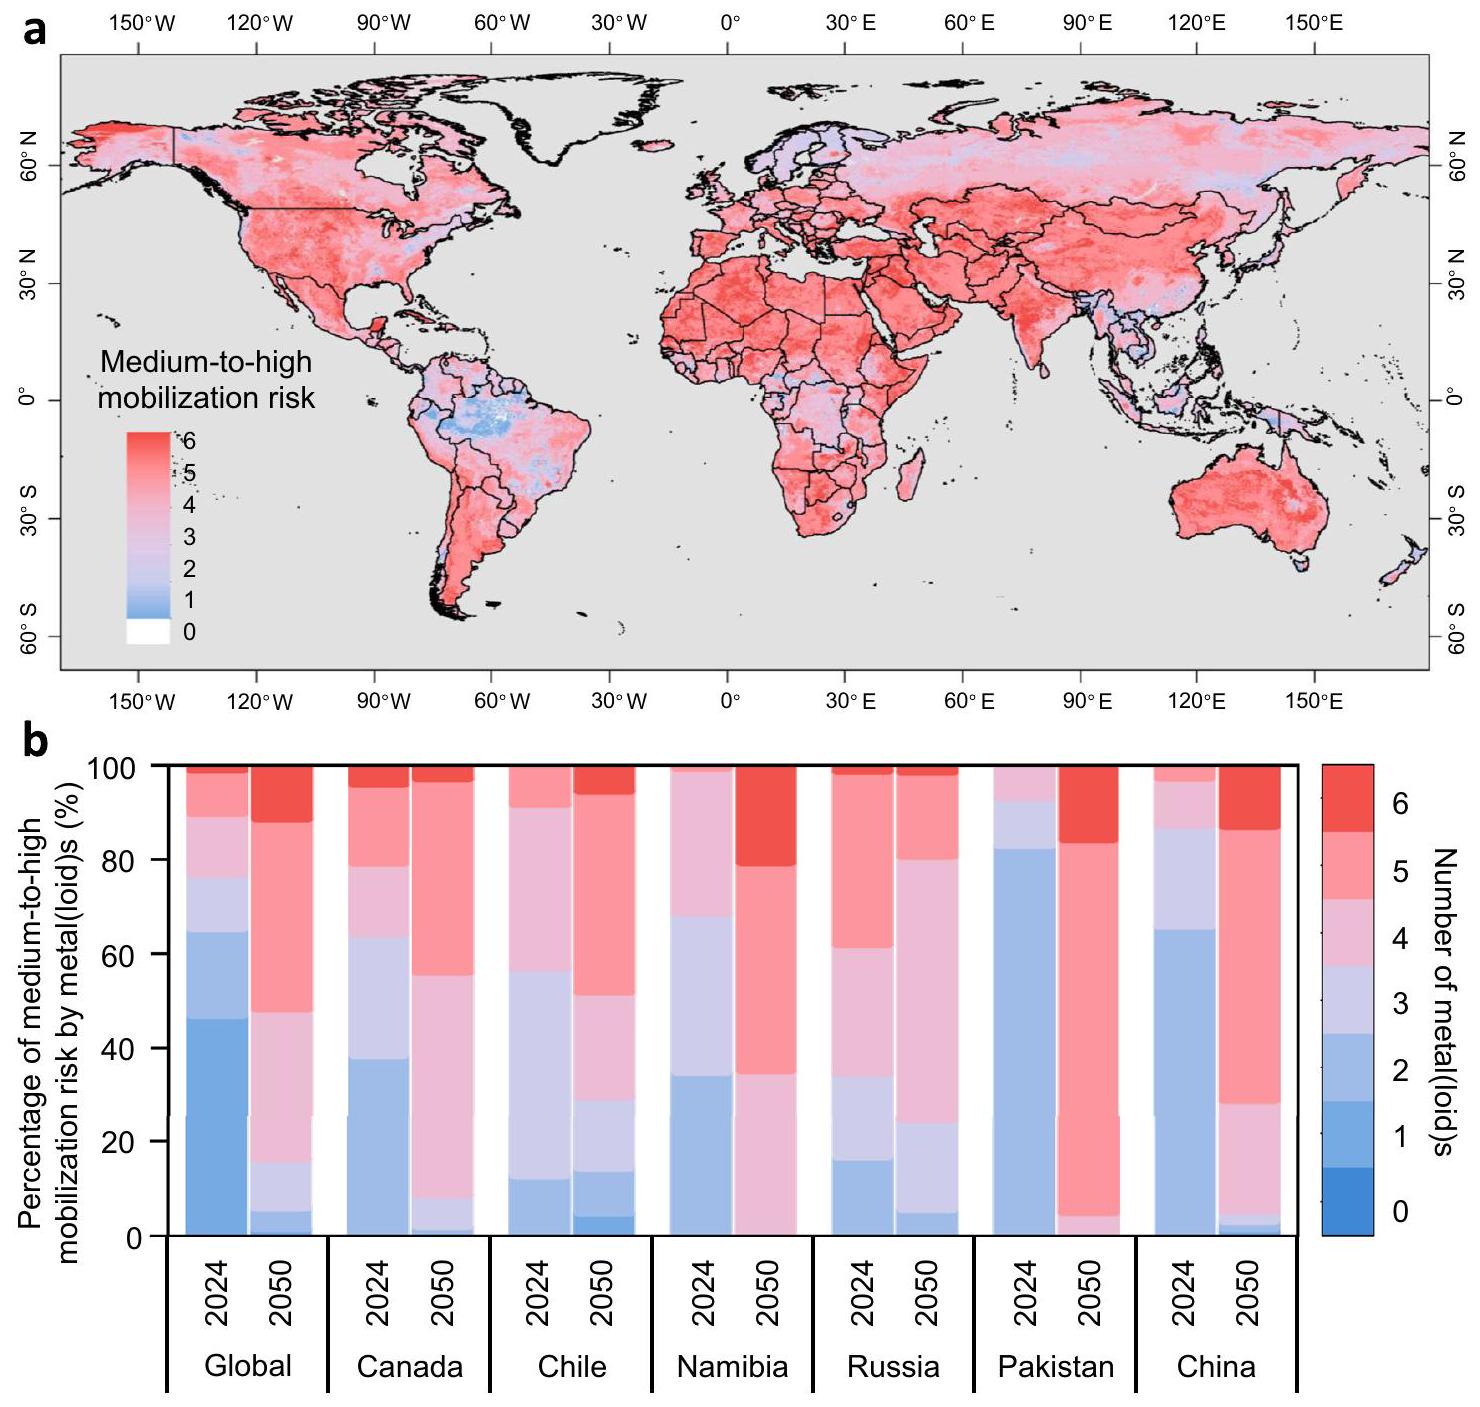
تم تحديد المعادن (الفلزات) الشائعة التي تُعتبر ذات مخاطر تحرك متوسطة إلى عالية في السيناريوهات الأساسية لموقع معين. تُظهر الرسوم البيانية الشريطية النسبة المئوية للأراضي التي تم تحديدها على أنها محفوفة بالمخاطر بواسطة المعادن (الفلزات) الشائعة، مما يبرز الدول التي تواجه مخاطر تحرك كبيرة. تم توفير بيانات المصدر كملف بيانات مصدر.
أظهرت أعلى محتوى من الرصاص المتنقل؛ ومع ذلك، تجاوزت إيطاليا ألمانيا من حيث الرصاص المتنقل (الشكل 4ب، د).
المناطق المتوقعة أن تشهد أكبر اختلافات في التوزيعات المكانية للرصاص الكلي والمتحرك تشمل جنوب ألمانيا، وجنوب المملكة المتحدة، وشمال فرنسا، مدفوعة بشكل أساسي بارتفاع درجة حموضة التربة (الشكل التوضيحي 8). . بالإضافة إلى ذلك، تم ملاحظة اختلافات مكانية في محتويات الرصاص الكلي والمتحرك في شمال ألمانيا والسويد، حيث تتأثر بقيم CEC وارتفاع قيم OC (الشكل التوضيحي 8). كما توجد اختلافات في تصنيفات دول الاتحاد الأوروبي من حيث المحتويات الكلية والمتحركة للزرنيخ، وكانت العناصر Hg أيضًا واضحة (الشكل 4e-i والشكل التوضيحي 7). عند مقارنة الترتيب حسب المحتويات الإجمالية والمتحركة، انخفضت النمسا من المركز الرابع إلى الخامس بالنسبة للنحاس، وانخفضت أيرلندا من المركز الثاني إلى الثالث بالنسبة للزئبق، على التوالي. كما كشف نموذج توقع الحركة عن زيادة واضحة في محتوى المعادن (أو المعادن الشبيهة) المتحركة عبر تربة الاتحاد الأوروبي عند اعتماد احتجاز الكربون في التربة (الشكل التوضيحي 9).

نقاش

هنا، نقدم تطبيقًا رائدًا للتعلم الآلي الموجه بالنظرية للتنبؤ بقدرة المعادن (أو المعادن الشبيهة) على الحركة في التربة، مع معالجة التحديات التي تطرحها التباين العالمي لخصائص التربة. التربة التي تم التحقق منها
نموذج تفرقة المعادن (أو المعادن الشبيهة) الذي يمكّن من التنبؤ بتفرقة 49 معدنًا (أو معدنًا شبيهًا) في أنواع التربة المتنوعة، من المتوقع أن يقلل بشكل كبير من الموارد والوقت المطلوبين للمسوحات الجيولوجية. لذلك، يمكّن نموذج حركة المعادن (أو المعادن الشبيهة) في التربة من إنشاء وتحديث خرائط حركة المعادن (أو المعادن الشبيهة) العالمية بشكل دوري.
يمكن استخدام نموذج تنقل المعادن (المعدنية) كدليل لتحديد أولويات اختبار تنقل المعادن (المعدنية) وزيادة الوعي، على سبيل المثال، في وسط وشمال آسيا، والأجزاء الشمالية من أمريكا الشمالية وأفريقيا، وجنوب أوقيانوسيا، وأمريكا الجنوبية. إن إعطاء الأولوية لمزيد من اختبارات تنقل المعادن (المعدنية) يعتبر أكثر أهمية بالنسبة للدول ذات الدخل المنخفض والمتوسط التي لديها إنتاج زراعي واسع (أي، جنوب البرازيل وشمال الأرجنتين)، حيث إن حالة تنقل المعادن (المعدنية) الحالية غير معروفة إلى حد كبير ويجب استخدام موارد الاختبار المحدودة بشكل فعال في المستقبل. نلاحظ أن خرائط تنقل المعادن (المعدنية) في التربة المقدمة لا يمكن استخدامها كدليل لتقييم الموقع على نطاق صغير وإعادة التأهيل تحت الدقة الحالية. 5 كم)، خاصةً لأن نطاق الموقع ( لا يمكن الحصول على المعادن (أو العناصر) غير المتجانسة وخصائص التربة من مجموعات البيانات العالمية الحالية. . ومع ذلك، يمكن أن يستمر نموذج تنقل المعادن (أو المعادن الشبيهة) في التربة لدينا في دعم تقييم التربة على مستوى الموقع وإعادة تأهيلها من خلال استبدال، على الأقل جزئيًا، الطرق المكلفة والتي تستغرق وقتًا طويلاً
الشكل 4 | التنبؤ القاري بقدرة المعادن (أو المعادن الشبيهة) على الحركة في التربة على النطاق الأوروبي. أ توزيع محتوى الرصاص الكلي، مع مقاطع مكبرة في وسط أوروبا؛ متوسط محتوى الرصاص الكلي في الدول الأوروبية مع عينات التربة >500؛ ج توزيع محتوى الرصاص المتحرك المُحاكى، مع مقاطع مكبرة في وسط أوروبا؛ محتوى الرصاص المحمول المتوسط النموذجي في الدول الأوروبية مع عينات التربة ; يتم تصنيف المحتويات الإجمالية والمتحركة في الخرائط باستخدام
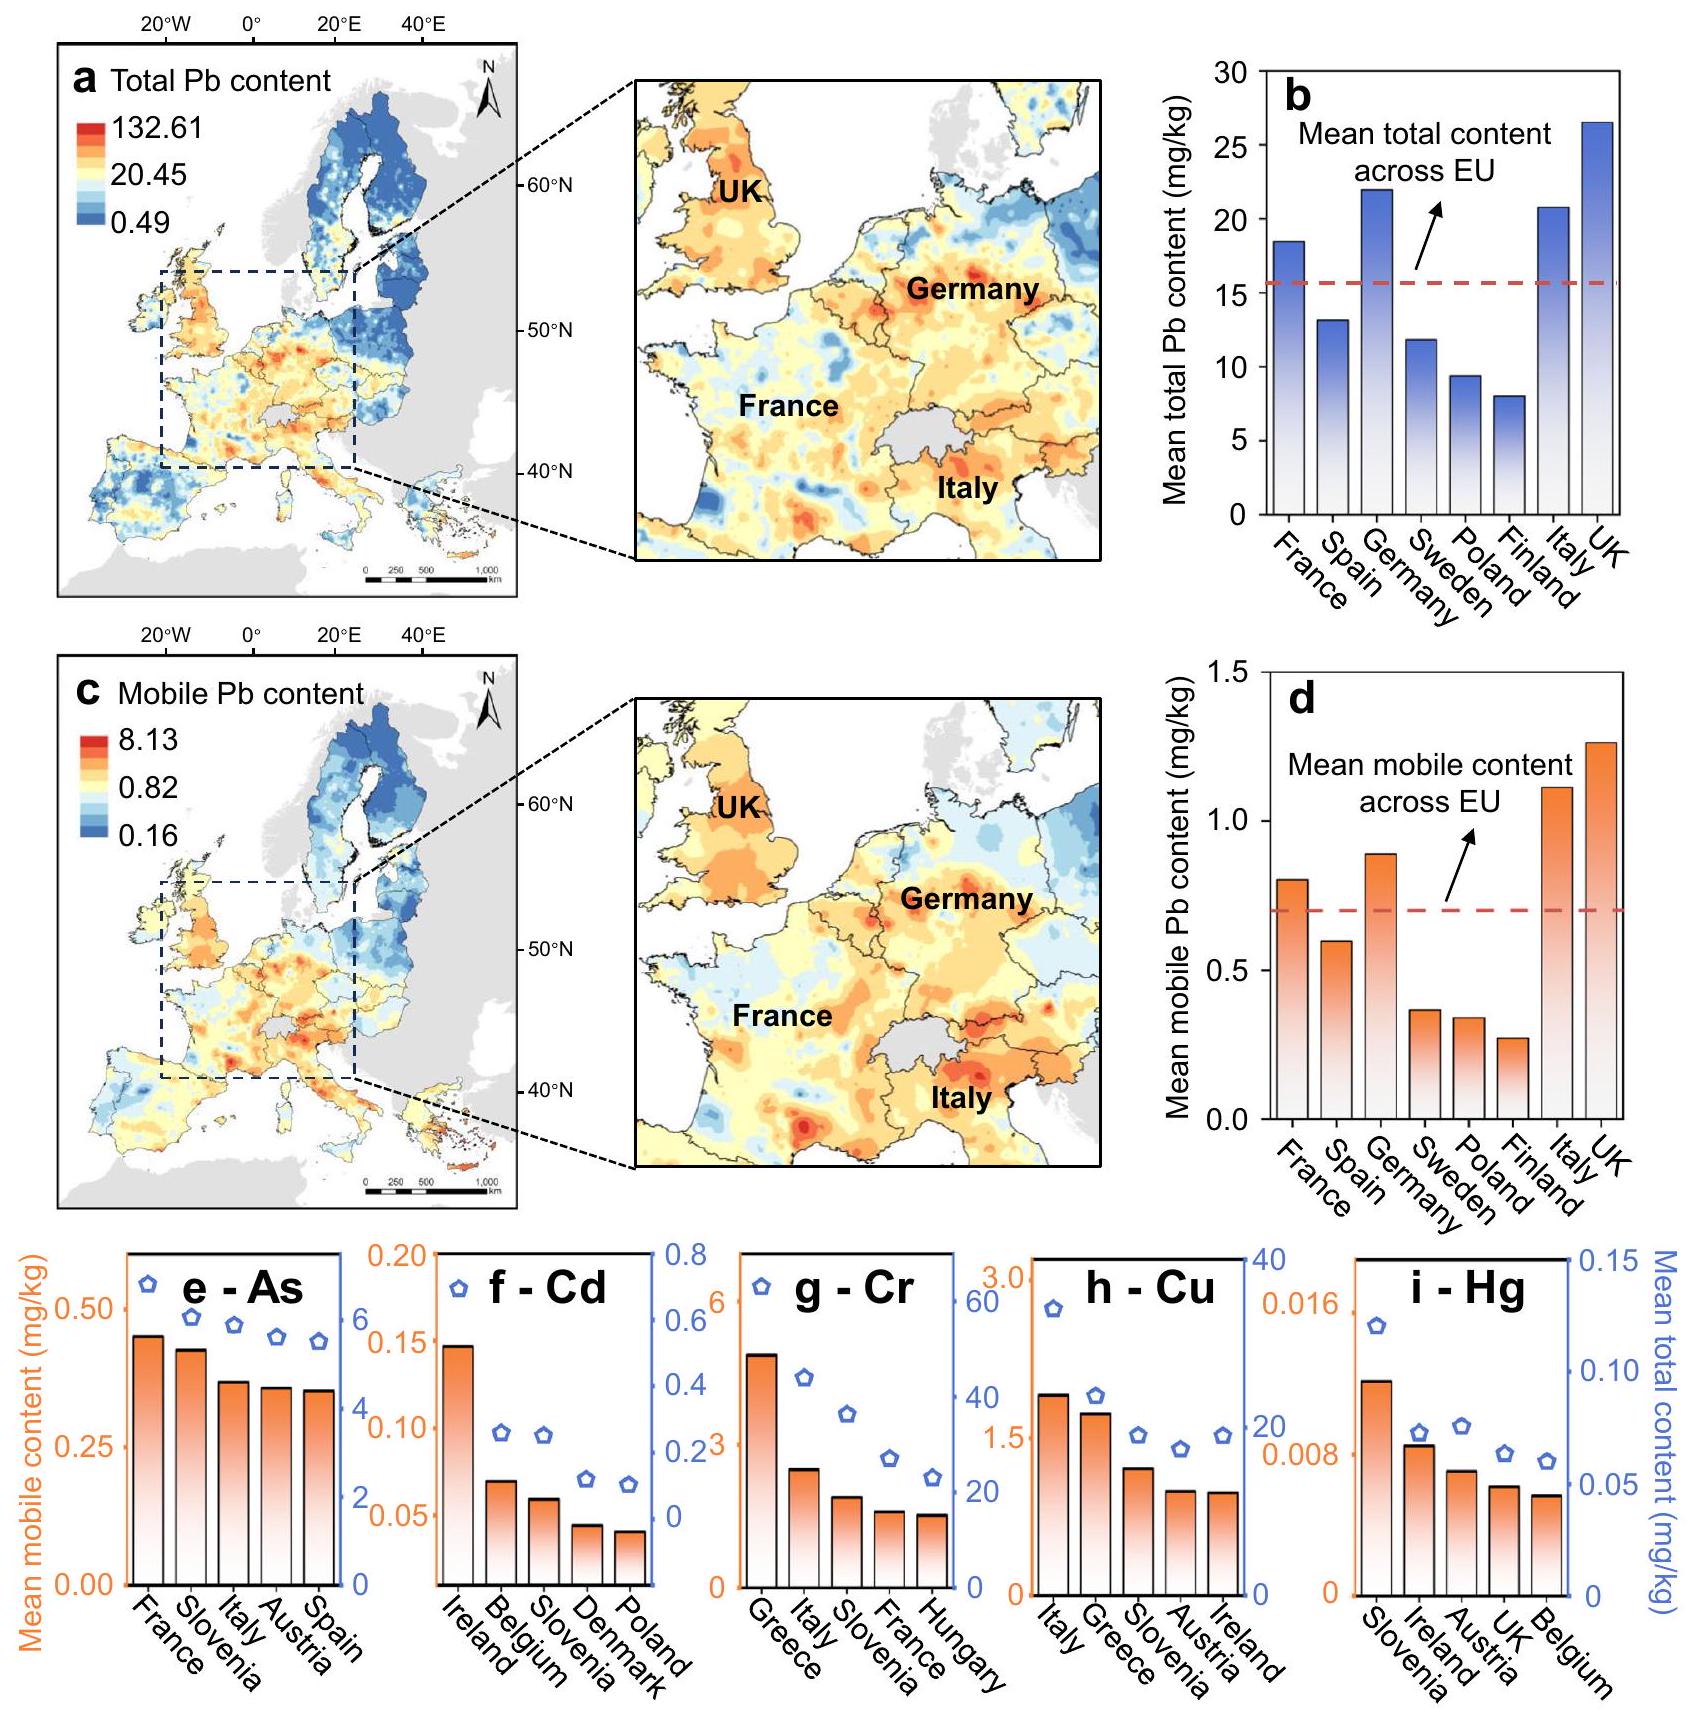
طريقة الفاصل الهندسي في طيف الألوان. e-i متوسط المحتويات الكلية والمتنقلة للزرنيخ، “، والزئبق للدول الخمس الأولى في الاتحاد الأوروبي. الأعمدة البرتقالية على الجانب الأيسر -المحور يمثل محتوى المعادن(اللافلزات) المتنقلة، والعلامات الزرقاء على الجانب الأيمن -المحور يمثل إجمالي محتوى المعادن (أو المعادن الشبيهة). الدول مرتبة بناءً على محتواها من المعادن (أو المعادن الشبيهة) المتنقلة. المملكة المتحدة تمثل المملكة المتحدة. تم توفير بيانات المصدر كملف بيانات المصدر.
تجارب الاستخراج المتسلسل. وبالتالي، فإن اعتماد نموذجنا في دراسات نطاق الموقع يمكن أن يوفر للممارسين القدرة الفريدة على تقييم حركة المعادن (أو المعادن الشبيهة) في التربة بسرعة وموثوقية.
تشير نتائجنا إلى زيادة غير متناسبة في خطر التحرك مقارنة بمستوى التلوث، مما يبرز الحاجة إلى مزيد من التحقيقات المخصصة في التنقل في دول/مناطق معينة تعاني من تلوث متزايد بالمعادن (أو المعادن الشبيهة). على سبيل المثال، من المتوقع أن تشهد التربة الصينية زيادة في تلوث الزرنيخ. تشير نتائجنا إلى أن الزيادة الناتجة في حركة الزرنيخ، لا سيما في المناطق التي تحتوي على مستويات عالية من الزرنيخ مثل جنوب شرق الصين، قد تفاقم التهديد لسلامة الغذاء وصحة الإنسان. علاوة على ذلك،
يمكن تقييم خرائط توزيع التنقل مع البيانات المتعلقة بمصادر المعادن الرئيسية، مما يوجه اختبارات التنقل التفصيلية، ويساعد في التخطيط الصناعي، ويدعم إدارة المحاصيل (الملاحظة التكميلية 2). على سبيل المثال، تم العثور على جنوب تشيلي وناميبيا وكازاخستان كمناطق ذات مخاطر عالية في التحرك مع احتمال كبير لتراكم المعادن في التربة بسبب المصادر الطبيعية والبشرية، والتي يجب أن تخضع لاختبارات ومراقبة تفصيلية لتحرك المعادن.
نموذج تنقل المعادن (أو المعادن شبه) لدينا يوفر أيضًا رؤى في الوقت المناسب حول كيفية تغير تنقل المعادن (أو المعادن شبه) مع الوصف المرتبط، مما يمكن أن يوفر معلومات أساسية لتصميم تدابير الترميم.
(ملاحظة إضافية 3). إن فحص التأثير الجماعي لخصائص التربة على حركة المعادن (أو المعادن الشبيهة) يسهل تصنيف جميع المعادن (أو المعادن الشبيهة) التي تم التحقيق فيها إلى ثلاث مجموعات بناءً على تأثير خصائص التربة (ملاحظة إضافية 3). يمكن أن يكون هذا النوع من تصنيف المعادن (أو المعادن الشبيهة) بمثابة معيار لتوجيه جهود معالجة التربة عندما تكون البيانات المحددة عن معدن (أو معدن شبيه) معين غير متوفرة ولكنها وفيرة بالنسبة لمعادين (أو معادن شبيهة) في نفس المجموعة. علاوة على ذلك، يمكن أن يعزز نموذج حركة المعادن (أو المعادن الشبيهة) استراتيجيات المعالجة لدينا من خلال توفير استجابات حركة أكثر تخصيصًا لخصائص التربة المتنوعة (مثل درجة حموضة التربة)، مما يقترح بالتالي المسار الأكثر كفاءة لتثبيت المعادن (أو المعادن الشبيهة) في التربة. على سبيل المثال، قد يوجد نطاق آمن متنوع لدرجة الحموضة، حيث يمكن أن يتم تقليله بشكل واضح للمعادن (أو شبه المعادن) المختلفة في ظروف متنوعة. وبالتالي، فإن نطاقات pH الآمنة الأكثر تخصيصًا التي تقدمها نماذج التعلم الآلي لدينا يمكن أن تعزز تقنيات الاستقرار الكيميائي الأكثر دقة للتعافي المحدد للمواقع.
تتمتع خرائط تنقل المعادن (المعدنية) المتوقعة بتداعيات كبيرة على إدارة التربة الدقيقة. تبرز خرائط التنقل التباين المكاني الواضح في مخاطر تحريك المعادن (المعدنية) عند نفس المحتوى الكلي، مما يجعل من غير الممكن وضع قيم مرجعية عالمية موحدة أو لدول ذات مساحات شاسعة وأنواع تربة متنوعة. إن إنشاء قيم مرجعية جديدة تأخذ في الاعتبار كل من المحتويات المتحركة والكليّة يعد خطوة ضرورية نحو تحسين تنظيم التربة. يمكن تخصيص القيم المرجعية بشكل أكبر لتناسب البيئة المحلية؛ وبالتالي، يجب اقتراح قيم مرجعية مختلفة لمناطق مختلفة بناءً على تباين التربة، بدلاً من استخدام قيم مرجعية موحدة في جميع أنحاء العالم أو على مستوى دول بأكملها.
تشير نتائجنا أيضًا إلى أن احتجاز الكربون في التربة، على الرغم من كونه واعدًا في التخفيف من انبعاثات غازات الدفيئة، يمكن أن يزيد بشكل كبير من قابلية تنقل المعادن (أو العناصر المعدنية) في التربة. وبالتالي، قد يُعتبر اعتماد احتجاز الكربون في التربة على مستوى العالم كاستراتيجية رئيسية لاحتجاز الكربون أمرًا محفوفًا بالمخاطر. بدلاً من ذلك، يجب على الدول دمج استراتيجيات متنوعة لاحتجاز الكربون في التربة لمعالجة التباين المكاني في زيادة مخاطر تحريك المعادن (أو العناصر المعدنية). إن الاعتراف بتلك التباينات في مخاطر التحريك الناتجة عن احتجاز الكربون في التربة هو أيضًا خطوة مهمة نحو تحقيق إدارة مستدامة للكربون في التربة.
على الرغم من وعده، فإن إطار عملنا لتحريك المعادن (المعدنية) له قيود فيما يتعلق بالبيانات والأساليب. ستفيد جمع بيانات الفصل الإضافية، ويفضل أن يكون ذلك بطريقة منسقة، من المناطق التي تعاني حاليًا من تغطية ضعيفة جهود النمذجة المستقبلية من خلال السماح للنموذج بالتكيف بشكل أفضل مع هذه المناطق. تنشأ قيود ملحوظة أخرى من استخدام فصل المعادن (المعدنية) لتمثيل التحرك. لقد تم استخدام الاستخراج المتسلسل على نطاق واسع لفصل المعادن (المعدنية) في التربة إلى أشكال محددة عمليًا وفقًا لتحركها الفيزيائي الكيميائي وتوافرها المحتمل. . لقد ثبت أن هذه الطريقة مفيدة في مجال الكيمياء التحليلية البيئية ويمكن أن تعمل كخطة شائعة بحيث يمكن مقارنة النتائج من باحثين مختلفين ويمكن إنشاء قاعدة بيانات دولية. على الرغم من الإبلاغ عن وجود علاقات إيجابية بين محتوى المواد المحمولة في التربة ومحتوى المعادن (أو المعادن الشبيهة) في النباتات تظل العلاقة بين التوافر البيولوجي وبيانات التFractionation مثيرة للجدل. جزئيًا بسبب نقص التعريف الدقيق للتوافر البيولوجي وطرق القياس القياسية له لذلك، يجب أن يتم التركيز بشكل خاص على تفسير النتائج الحالية فيما يتعلق بتوافر المعادن (أو المعادن الشبيهة). نحن ندرك أيضًا أن نموذجنا لتحرك المعادن (أو المعادن الشبيهة) يركز بشكل أساسي على تحرك المعادن (أو المعادن الشبيهة) في التربة؛ لذلك، يمكن أن يوفر تحليل مخاطر التحرك نظرة على احتمالية تحرك معدن (أو معدن شبيه) في التربة تحت سيناريوهات تلوث معينة. بعبارة أخرى، لا يمكن أن تمثل الخرائط العالمية لتحرك المعادن (أو المعادن الشبيهة) في التربة مخاطرها الفعلية، حيث إن التوزيع العالمي لمحتوى المعادن (أو المعادن الشبيهة) في التربة غير متاح، ولا تؤخذ تفاعلات المصدر-المسار-المستقبل في الاعتبار.
في الختام، تُظهر هذه الدراسة إمكانيات التعلم الآلي في تحويل تحليل تفرقة المعادن (أو المعادن الشبيهة) في التربة، مما يوفر أساسًا لأساليب تعلم آلي أكثر تقدمًا وتخصيصًا ودقة في علم التربة.

طرق

تجميع قاعدة بيانات عالمية لتفكيك المعادن (أو المعادن الشبيهة) في التربة

قمنا بمراجعة منهجية للأدبيات (1 مارس 2023) من خلال بحث بالكلمات الرئيسية للدراسات المنشورة منذ عام 1975 في Web of Science وGoogle Scholar: الموضوع: [“التربة” و”المعادن الثقيلة” و(“كسر*” أو “توزيع” أو “تخصص” أو “استخراج متسلسل”)]. أسفر البحث الأولي عن أكثر من 10,000 دراسة وأطروحة تمت مراجعتها من قبل الأقران من دلائل الجامعات. بالنظر إلى سهولة التنفيذ، ونتائج الفصل القابلة للتكرار، وتوافر البيانات. ، ركزنا على الدراسات التي تتعلق بفصل المعادن (أو المعادن الشبيهة) من استخراج أربع خطوات متسلسلة من المكتب المرجعي المجتمعي (BCR) الدراسات). قمنا بمراجعة هذه الأوراق بالكامل لتحديد الدراسات التي تحتوي على بيانات مفصلة عن خصائص التربة ( وصفين للتربة)، المحتوى الكلي للمعادن (أو المعادن)، وتفكيك المعادن (أو المعادن) ). لتخفيف المشاكل المحتملة المرتبطة بتضمين عدد كبير من الدراسات من إعدادات تجريبية متنوعة، استبعدنا الدراسات التي تحتوي على عدد محدود من نقاط البيانات ( ). تُظهر العملية المستخدمة في فرز الأدبيات وجمع البيانات في الشكل التوضيحي الإضافي 10. قمنا باستخراج جميع البيانات المتاحة من الدراسات المتبقية ( الجدول التكميلي 4)، واستخدمت WebPlotDigitizer لاستخراج البيانات من الرسوم البيانية والصور و/أو الخرائط .
F1-F4 في BCR تت correspond إلى كسور مرتبطة بالكربونات، الأكاسيد، المواد العضوية، والمعادن البلورية، على التوالي من بينها، تعتبر F1 هي الكتلة الأكثر حركة التي تشكل أكبر تهديد للبيئة المحيطة. تركيبة معينة من التربة والمعادن (أو المعادن الشبيهة) تحتوي على أربع نقاط بيانات، مع الأخذ في الاعتبار أربع فئات BCR، مما يؤدي إلى مجموعة بيانات عالمية ( الدراسات) مع 30,832 نقطة بيانات من 5 قارات تمتد عبر 56 دولة/إقليم (الشكل التوضيحي 1). احتوت على 49 معدن(ة) (الشكل التوضيحي 11)، وتنوع في قوام وأنواع التربة، وجميع مجموعات تغطية الأرض (الأراضي الزراعية، الغابات، الأراضي الشجرية، المراعي، الأراضي العارية، الخث، والمستنقعات). نلاحظ أنه على الرغم من أن التوزيع غير المتساوي لنقاط البيانات لوحظ في مجموعة البيانات العالمية، وهو ما يتم مواجهته غالبًا في التحقيقات العالمية للتربة. تشير تحليلاتنا اللاحقة للموثوقية وعدم اليقين لنماذج التعلم الآلي المدربة إلى قوتها وقدرتها على التعميم على عينات ومناطق غير معروفة.
نسبة الطين (%), الرقم الهيدروجيني, سعة تبادل الكاتيونات (CEC) )، وتم تحديد OC (%) كأوصاف رئيسية للتربة، مع الأخذ في الاعتبار أهميتها في تفرقة المعادن (الفلزات). ، توفر البيانات، وقابلية تطبيق النموذج المدرب على مستوى العالم (تم توثيق هذه الأوصاف الأربعة بشكل جيد في قاعدة بيانات التربة العالمية). استخدمنا محتوى المعادن (أو العناصر الشبيهة بالمعادن) المقاس بعد هضم التربة بـ كمحتوى إجمالي من المعادن (أو المعادن الشبيهة)، وعندما لم يتم توفيره، تم استخدام مجموع استخلاصات BCR. تم استبدال نوع المعدن (أو المعدن الشبيه) بـ 32 وصفًا عنصريًا لتسهيل استخدامها في نمذجة التعلم الآلي. بشكل عام، شمل مجموعة البيانات العالمية 37 مدخلاً (4 أوصاف لخصائص التربة، 32 وصفاً للمعادن و1 لمحتوى المعادن الكلي)، وكانت النتيجة هي نسبة الفصل تحت التأثير المترابط لـ 37 وصفاً. ثم تم تنفيذ تحويل البيانات والتعويض لإعداد مجموعة البيانات العالمية النهائية والكاملة (الملاحظة التكميلية 4).
تُحسن التباين القوي والمُفسر جيدًا في البيانات المجمعة من متانة وآفاق تطبيق نماذج التعلم الآلي المدربة عليها (الملاحظة التكميلية 5). لم يتم ملاحظة أي ارتباط خطي كبير بين الأوصاف وتفكيك المعادن (أو المعادن الشبيهة) (الملاحظة التكميلية 6)، مما يشير إلى علاقة غير خطية مرتبطة. تتعقد التحديات في التنبؤ بتفكيك المعادن (أو المعادن الشبيهة) بسبب التباينات الكبيرة بين المعادن (أو المعادن الشبيهة) المختلفة (الملاحظة التكميلية 7).

نمذجة تنقل المعادن (أو المعادن الشبيهة) باستخدام التعلم الآلي الموجه بواسطة النظرية

قمنا بالتحقق من صحة ومقارنة سبعة خوارزميات تعلم آلي، بما في ذلك الشبكة العصبية العميقة (DNN) غابة عشوائية (RF) آلة تعزيز التدرج (GBM) آلة تعزيز التدرج الشديد (XGBoost) آلة تعزيز التدرج الخفيف (LightGBM) آلة الدعم الناقل (SVM) وانحدار لوجستي (LR) أولاً، قمنا بتقسيم العدد الإجمالي لنقاط البيانات إلى مجموعات تدريب واختبار باستخدام تقسيمات عشوائية متكررة بنسبة 90/10 بعد اختبار تقارب شامل (الشكل التوضيحي 12). استخدمنا مجموعة التدريب لتحديد أفضل خوارزميات التعلم الآلي ومجموعة من المعلمات الفائقة، بالإضافة إلى تدريب النموذج النهائي. استخدمنا مجموعة الاختبار ومجموعة بيانات اختبار مستقلة جديدة لتقييم قدرة النموذج المدرب على التعميم.
ثم قمنا بإجراء نمذجة التعلم الآلي من خلال العملية التالية: (i) تحديد أفضل طرق قياس الميزات (التوحيد، التطبيع، وعدم القياس) لكل خوارزمية تعلم آلي مع معلماتها الافتراضية (الجدول التكميلي 5)؛ (ii) اختيار الميزات من خلال خمس طرق لاختيار الميزات (إزالة الميزات المتكررة، إزالة تجمع الميزات، اختيار الميزات المعتمد على الغابة العشوائية، وعدم اختيار الميزات)؛ (iii) تحسين معلمات التعلم الآلي من حوالي 4,000 مجموعة من المعلمات (الجدول التكميلي 6)؛ (iv) دمج قيد كيميائي بحيث، بالنسبة لمعدن(لويد) معين، يجب أن يكون مجموع جميع كسوره مساوياً لـ ، إلى نماذج التعلم الآلي. على وجه التحديد، بالنسبة لتوقع النسب المئوية للكسور النموذجية، توقعنا جميع النسب المئوية للكسور ( ) وقام بتطبيع تلك الكسر مع الأخذ في الاعتبار مجموع . لتسريع نمذجة التعلم الآلي، تم تطبيق عملية النمذجة المذكورة أعلاه فقط على أفضل ثلاثة خوارزميات تعلم آلي قوية مع أدائها الافتراضي (الجدول التكميلي 7). أظهرت عملية النمذجة المصممة تحسينات متتالية في الأداء التنبؤي، وكان التحسين الأكثر أهمية من إجمالي التحسين) تم تحقيقه من خلال دمج القيود الكيميائية (الشكل التكميلي 13).
تم بناء جميع نماذج التعلم الآلي وتقييمها في بايثون، مع تنفيذ الشبكة العصبية العميقة باستخدام حزمة Keras وجميع النماذج الأخرى تم تنفيذها باستخدام حزمة scikit-learn . استخدمنا طريقة البحث الشبكي مع التحقق المتقاطع بخمسة أضعاف (CV) في scikit-learn لاختيار أفضل مجموعة من المعلمات الفائقة. تم استخدام معامل التحديد ( ) من التحقق المتقاطع بخمسة أضعاف كمؤشر تقييم خلال عملية النمذجة. في حالتنا، كان أفضل نموذج مدرب هو XGBoost مع التوحيد القياسي، وإزالة تجمع الميزات، ومجموعة المعلمات الفائقة المحسّنة، والقيود الكيميائية.
بعد تحديد خوارزمية التعلم الآلي الأفضل أداءً ومجموعة المعلمات الفائقة، قمنا بتدريب نموذج XGBoost الأمثل لتوقعاتنا النهائية والتحقق من الأداء. كان نموذج XGBoost الأمثل قادرًا على إقامة علاقة قوية بين القيم الملاحظة والمتوقعة للفصل على مجموعة الاختبار ( التباين المفسر بمتوسط خطأ مطلق قدره 6.21) (الشكل التكميلي 13).

موثوقية النمذجة، وعدم اليقين في التنبؤ، وأهمية الوصف

بالإضافة إلى التحقق من التدريب والاختبار، استخدمنا سلسلة من التحليلات الموثوقة لتقييم خطأ النموذج خارج العينة. قمنا بتجميع مجموعة بيانات اختبار مستقلة من الدراسات الأحدث (1620 نقطة بيانات، الجدول التكميلي 8) وتجارب مختبرية واسعة (3748 نقطة بيانات). احتوت مجموعة بيانات الاختبار المستقلة المجمعة بشكل أساسي على عينات تربة من الصين والاتحاد الأوروبي (التفاصيل في الملاحظة التكملية 8). على الرغم من أن نموذج XGBoost الأمثل لم يتم تدريبه على أي قياسات من مجموعة بيانات الاختبار المستقلة، إلا أنه حقق مع ذلك قيمة قدرها 0.63 (الشكل التكميلي 14)؛ وهذا يشير إلى قدرته على التنبؤ بفصل المعادن (أو المعادن الشبيهة) لعينات التربة غير المعروفة بدقة . كما أجرينا اختبارًا احتياطيًا لإظهار أن نموذج XGBoost المدرب كان لديه قدرة جيدة على التعميم لمناطق أخرى لم يتم تغطيتها خلال تدريب النموذج (الملاحظة التكملية 9).
في الدراسة الحالية، استخدمنا طرق إعادة العينة بناءً على استراتيجية جاكنايف لتقدير فترات التنبؤ القوية باستخدام
نموذج XGBoost الأمثل . من الناحية المثالية، يجب أن يؤدي تقدير عدم اليقين لنموذج XGBoost الأمثل إلى فترة ثقة تحتوي على القيمة الحقيقية لحوالي من الوقت . كشفت تحليل عدم اليقين لدينا أن من بيانات الاختبار وقعت في فترات الثقة للتنبؤ، مما يشير إلى انخفاض عدم اليقين في التنبؤ بفصل المعادن (أو المعادن الشبيهة) في أثناء الاختبار.
استخدمنا أهمية التبديل لحساب الأهمية العامة للوصف بناءً على مجموعة البيانات الكاملة، باستخدام التنفيذ في scikit-learn . تم إجراء تحليل SHAP للتحقيق في تأثيرات مختلف الأوصاف على الكسر F 1. لهذا الغرض، استخدمنا حزمة TreeSHAP ورسم tforce من مكتبة SHAP في بايثون.

توزيع تنقل المعادن (أو المعادن الشبيهة) العالمية والمحركات الرئيسية

لإنشاء الخريطة العالمية لتنقل المعادن (أو المعادن الشبيهة) في التربة باستخدام نموذج XGBoost الأمثل، قمنا بأخذ عينات من خصائص التربة السطحية العالمية باستخدام SoilGrids الإصدار 2.0 بدقة . تم إجراء تحويل وحدات على بيانات SoilGrids لتمكين التطبيق المباشر لنموذج XGBoost الأمثل. تضمنت قاعدة البيانات الناتجة أكثر من 7 ملايين نقطة بيانات للتربة السطحية مع معلومات كاملة عن أوصاف التربة (pH، OC، الطين، وCEC). قبل التطبيق العالمي لنموذج XGBoost الأمثل، تم إجراء درجة من الاستيفاء/الاستقراء . وُجد أن نموذج XGBoost الأمثل يتطلب استقراءً محدودًا جدًا لخصائص التربة غير المدرجة في مخططات التدريب ( من OC التربة و من خصائص التربة الأخرى، الجدول التكميلي 9)، مما يظهر موثوقية تطبيقه العالمي.
نظرًا لعدم وجود مجموعة بيانات عالمية لمحتوى المعادن (أو المعادن الشبيهة) في التربة السطحية، قمنا بالتحقيق في الأنماط العالمية لتنقل المعادن (أو المعادن الشبيهة) تحت سيناريوهات التلوث الأساسية. لتحديد قيم محتوى المعادن (أو المعادن الشبيهة) التمثيلية لسيناريوهات الأساس، استخدمنا قيم الإرشاد التنظيمي (RGVs) من المنظمات متعددة الجنسيات الرائدة أو اللوائح الوطنية (الجدول التكميلي 1 و2) . لتجنب التحيز في الاستقراء التعلمي وضمان موثوقية توقعاتنا، تم تحليل 22 معدنًا (أو معدنًا شبيهًا) لأن قيم RGV المختارة كانت ضمن نطاق TMC لمجموعة البيانات العالمية . جنبًا إلى جنب مع خصائص التربة السطحية في SoilGrids، تم بناء خرائط تنقل أساسية عالمية للمعادن (أو المعادن الشبيهة). تم بناء خرائط عدم اليقين النسبية للتنبؤ العالمي من خلال عرض الانحراف المعياري مقسومًا على متوسط التنبؤ بناءً على 20 جولة من نموذج XGBoost النهائي لدينا (الشكل التكميلي 15). كان متوسط عدم اليقين النسبي للكسور المتنقلة العالمية للمعادن (أو المعادن الشبيهة) السائدة في سيناريوهات الأساس (الشكل 1a-f) عند ، مما يشير إلى عدم يقين نسبي صغير في التطبيق العالمي للنموذج . كما سمح لنا نموذج تنقل المعادن (أو المعادن الشبيهة) بالتحقيق في تأثير تلوث المعادن (أو المعادن الشبيهة) من خلال اختيار قيم RGV التمثيلية لسيناريوهات التلوث المرتفعة (الجدول التكميلي 1). في حالات نادرة خلال التطبيق العالمي، تم ملاحظة توقعات كسور سلبية وتم استبدالها لاحقًا باستخدام الصفر.
استخدمنا رمز تقييم المخاطر لتقييم خطر تحرك المعادن (أو المعادن الشبيهة) في التربة. على وجه التحديد، كانت المخاطر المنخفضة والمتوسطة إلى العالية للتحرك مرتبطة بـ من و ، على التوالي . أدى دمج خرائط التنقل الأساسية للمعادن (أو المعادن الشبيهة) الفردية إلى خريطة تنقل شاملة لأكثر المعادن (أو المعادن الشبيهة) انتشارًا، بما في ذلك Pb وAs وCd وCr وCu وHg. هنا، اعتبرنا موقعًا معينًا عرضة لخطر التحرك لمعدن (أو معدن شبيه) واحد عندما تم التنبؤ بأنه في خطر تحرك متوسط إلى مرتفع في سيناريو الأساس.
نلاحظ أنه، على الرغم من أن هذه السيناريوهات الافتراضية غير واقعية من منظور فيزيائي، إلا أنها تهدف إلى تسليط الضوء على الفروق في النقاط الساخنة العالمية لتنقل المعادن (أو المعادن الشبيهة) في ظل تأثير محتوى المعادن (أو المعادن الشبيهة). لذلك، يمكن أن تساعد هذه الخرائط في رفع الوعي، وتحسين التخطيط الصناعي، وتعزيز التنسيق الحكومي الدقيق.
باستخدام نموذج التنقل العالمي، قمنا أيضًا بتقييم التغير في تنقل المعادن (أو المعادن الشبيهة) تحت تأثير النشاط البشري. هنا، نحن
حققنا في التغير في تنقل المعادن (أو المعادن الشبيهة) المتأثر بجهد بشري نموذجي لمواجهة تغير المناخ العالمي، وهو احتجاز الكربون في التربة. تم تحليل احتجاز الكربون في التربة لأنه تم التعرف عليه كطريقة واعدة لإزالة CO2 من الغلاف الجوي عن طريق احتجاز C كـ OC في التربة. بعبارة أخرى، يخفف احتجاز الكربون في التربة من الزيادة السريعة في انبعاثات العالمية من خلال تغيير خصائص التربة، وخاصة OC في التربة. قبل التحقيق في تأثير احتجاز الكربون في التربة على تنقل المعادن (أو المعادن الشبيهة) في التربة، حددنا التغير في OC الناتج عن احتجاز الكربون في التربة. في الواقع، اقترحت مبادرة دولية حديثة زيادة OC في التربة العالمية بمقدار سنويًا للتخفيف من انبعاثات غازات الدفيئة ، والتي تم التعرف عليها جيدًا . باستخدام معدل الزيادة المذكور أعلاه لـ OC في التربة، قمنا بمحاكاة التغيرات في تنقل الكسر المتنقل للمعادن (أو المعادن الشبيهة) في عامي 2024 و2050، على التوالي. سمحت لنا خرائط توزيع الكسر المتنقل للمعادن (أو المعادن الشبيهة) بحساب نسبة الأراضي المعرضة لخطر التحرك المتوسط إلى العالي على المستويات العالمية والوطنية.

تطبيق نماذج تنقل التعلم الآلي عبر تربة الاتحاد الأوروبي

قمنا بتطبيق نموذج XGBoost الأمثل لرسم خريطة الحركة المعدنية (أو المعدنية) في التربة لدول الاتحاد الأوروبي في عام 2009. اخترنا دول الاتحاد الأوروبي كدراسة حالة لعدة أسباب. أولاً، تم إجراء أخذ عينات للتربة بشكل قياسي وشامل في مشروع مسح استخدام الأراضي/غطاء الأراضي (LUCAS)، الذي شمل منطقة واسعة مع توزيع كبير لأنواع التربة. ثانياً، تم إجراء تحليلات شاملة، بما في ذلك تحليل خصائص التربة والمحتويات الإجمالية للمعادن (أو المعادن) السائدة، في مختبر واحد لضمان التناسق داخل قاعدة البيانات. ثالثاً، تم توفير مجموعات بيانات عالية الجودة تحتوي على بيانات تتعلق بالوصف المطلوب لتوقع حركة المعادن (أو المعادن) بشكل علني لدول الاتحاد الأوروبي عبر الموارد التي تقدمها الوكالات الدولية. أخيراً، بالإضافة إلى المحتوى الإجمالي للمعادن (أو المعادن) الذي تم تحليله. ستوفر تحليل حركتهم تقييماً أكثر دقة لمخاطر تعبئتهم.
تم أخذ مجموعة بيانات الاتحاد الأوروبي من مشروع LUCAS المقدم من المركز الأوروبي لبيانات التربة (ESDC). تعتبر مجموعة بيانات LUCAS الأكثر شمولاً عبر القارة الأوروبية وقد تم استخدامها على نطاق واسع لأغراض النمذجة المختلفة. قمنا بأخذ عينات من خصائص التربة من قاعدة بيانات التربة السطحية LUCAS 2009. واستخرجت محتوى المعادن (أو المعادن شبه) من خرائط تلوث التربة لنفس المشروع . تتكون مجموعة البيانات الناتجة من 17,601 عينة تربة تحتوي على معلومات كاملة عن الوصف من 23 دولة في الاتحاد الأوروبي، والتي استخدمت لتوقع حركة المعادن (أو المعادن الشبيهة). تم حساب محتوى المعادن (أو المعادن الشبيهة) المتنقلة عن طريق ضرب الكسر المتنقل (F1) في المحتوى الكلي للمعادن (أو المعادن الشبيهة) . لقد بحثنا في تأثير احتجاز الكربون في التربة على تنقل المعادن (أو المعادن الشبيهة) في الاتحاد الأوروبي من خلال استخدام نفس استراتيجية النمذجة المطبقة عالميًا. وقد شمل ذلك زيادة محتوى الكربون العضوي في التربة عن طريق مع الحفاظ على جميع الخصائص الأخرى ثابتة.

تصوير البيانات والتحليلات الإحصائية

قمنا بتصوير توزيع الفلزات (أو المعادن) على المستوى القاري والعالمي باستخدام ArcGIS مع تقنيات التداخل المكاني Kriging بدقة قمنا بإنشاء الرسوم البيانية الأخرى باستخدام Matplotlib 3.7.0 و Seaborn 0.12.2 قمنا بإجراء اختبارات إحصائية (اختبار شابيرو-ويلك، اختبار رانك الموقع لويليكسون، وارتباط بيرسون) باستخدام Scipy 1.10.1 وأجريت تحليل عدم اليقين باستخدام MAPIE 0.9.2 لتقليل التباين في تقييم الأداء الناتج عن تقسيم مجموعة البيانات بشكل عشوائي، استخدمنا القيم المتوسطة من 20 تقسيمًا متكررًا لمجموعة البيانات كمؤشرات تقييم.

توفر البيانات

البيانات ذات الصلة التي تدعم النتائج الرئيسية لهذه الدراسة متاحة ضمن الورقة وملف المعلومات التكميلية. يتم توفير بيانات المصدر مع هذه الورقة، والتي تتوفر أيضًا على https:// figshare.com/s/fa76e3cb3e0e0709df8d73خصائص التربة و
يمكن العثور على بيانات المعادن (المعدنية) عبر الاتحاد الأوروبي في قاعدة بيانات مسح إطار منطقة استخدام الأراضي/غطاء الأرض (LUCAS) لعام 2009 وخرائط المعادن الثقيلة في التربة السطحية تتوفر بيانات خصائص التربة العالمية من SoilGridshttps://soilgrids.org/تم توفير بيانات المصدر مع هذه الورقة.

توفر الشيفرة

الكود لبناء نماذج التعلم الآلي متاح عبر فيغشيرhttps://figshare.com/s/fa76e3cb3e0e0709df8d) .

References

  1. Hou, D. et al. Metal contamination and bioremediation of agricultural soils for food safety and sustainability. Nat. Rev. Earth Environ. 1, 366-381 (2020).
  2. O’Connor, D., Hou, D., Ok, Y. S. & Lanphear, B. P. The effects of iniquitous lead exposure on health. Nat. Sustain. 3, 77-79 (2020).
  3. Thornton, I. & Abrahams, P. Soil ingestion-a major pathway of heavy metals into livestock grazing contaminated land. Sci. Total Environ. 28, 287-294 (1983).
  4. Bull, K. R., Murton, R. K., Osborn, D., Ward, P. & Cheng, L. High levels of cadmium in Atlantic seabirds and sea-skaters. Nature 269, 507-509 (1977).
  5. Rodríguez-Eugenio, N., McLaughlin, M. & Pennock, D. Soil Pollution: A Hidden Reality. (FAO, Rome, 2018).
  6. Pérez, A. P. & Eugenio, N. R. Status of Local Soil Contamination in Europe. https://doi.org/10.2760/093804, JRC107508 (EUR 29124 EN, Publications Office of the European Union: Luxembourg, 2018).
  7. Zhao, F.-J., Ma, Y., Zhu, Y.-G., Tang, Z. & McGrath, S. P. Soil contamination in China: current status and mitigation strategies. Environ. Sci. Technol. 49, 750-759 (2015).
  8. Nardi, F., Annis, A., Di Baldassarre, G., Vivoni, E. R. & Grimaldi, S. GFPLAIN250m, a global high-resolution dataset of Earth’s floodplains. Sci. Data 6, 180309 (2019).
  9. Macklin, M. G. et al. Impacts of metal mining on river systems: a global assessment. Science 381, 1345-1350 (2023).
  10. Foley, J. A. et al. Solutions for a cultivated planet. Nature 478, 337-342 (2011).
  11. Tilman, D., Balzer, C., Hill, J. & Befort, B. L. Global food demand and the sustainable intensification of agriculture. Proc. Natl Acad. Sci. 108, 20260-20264 (2011).
  12. Hou, D. & Ok, Y. S. Soil pollution-speed up global mapping. Nature 566, 455-456 (2019).
  13. Wang, X. et al. Climate and vegetation as primary drivers for global mercury storage in surface soil. Environ. Sci. Technol. 53, 10665-10675 (2019).
  14. Almendras, M.-L., Carballa, M., Diels, L., Vanbroekhoven, K. & Chamy, R. Prediction of heavy metals mobility and bioavailability in contaminated soil using sequential extraction and biosensors. J. Environ. Eng. 135, 839-844 (2009).
  15. Wang, J., Man, Y., Yin, R. & Feng, X. Isotopic and spectroscopic investigation of mercury accumulation in Houttuynia cordata colonizing historically contaminated soil. Environ. Sci. Technol. 56, 7997-8007 (2022).
  16. Li, Q. et al. Speciation of heavy metals in soils and their immobilization at micro-scale interfaces among diverse soil components. Sci. Total Environ. 825, 153862 (2022).
  17. Liang, Y. et al. Geochemical controls on the distribution and bioavailability of heavy metals in sediments from Yangtze River to the East China Sea: assessed by sequential extraction versus diffusive gradients in thin-films (DGT) technique. J. Hazard. Mater. 452, 131253 (2023).
  18. Bagherifam, S., Brown, T. C., Bagherifam, S. & Baglieri, A. Sequential extraction of labile and recalcitrant fractions of soil organic matter: a case study focusing on antimony (Sb) in humic acids, fulvic acids and humin fractions of long-term aged contaminated soils. Environ. Pollut. 327, 121610 (2023).
  19. Mbodji, M. et al. Speciation of metals by sequential extractions of agricultural soils located near a dumpsite for prediction of element availability to vegetables. Talanta 244, 123411 (2022).
  20. Blumenstock, J., Cadamuro, G. & On, R. Predicting poverty and wealth from mobile phone metadata. Science 350, 1073-1076 (2015).
  21. Toetzke, M., Banholzer, N. & Feuerriegel, S. Monitoring global development aid with machine learning. Nat. Sustain. 5, 533-541 (2022).
  22. . et al. Fertilizer management for global ammonia emission reduction. Nature 626, 792-798 (2024).
  23. Jin, J. et al. Influence of pyrolysis temperature on properties and environmental safety of heavy metals in biochars derived from municipal sewage sludge. J. Hazard. Mater. 320, 417-426 (2016).
  24. Yang, Y., Tilman, D., Furey, G. & Lehman, C. Soil carbon sequestration accelerated by restoration of grassland biodiversity. Nat. Commun. 10, 718 (2019).
  25. Benhachem, F. Z. & Harrache, D. Chemical speciation and potential mobility of heavy metals in forest soil near road traffic in Hafir, Algeria. J. Health Pollut. 11, 210614 (2021).
  26. Wang, X. S. & Qin, Y. Leaching characteristics of heavy metals and As from two urban roadside soils. Environ. Monit. Assess. 132, 83-92 (2007).
  27. . et al. Cr migration potential and species properties in the soil profile from a chromate production site in the groundwater depression cone area. Bull. Environ. Contam. Toxicol. 109, 600-608 (2022).
  28. Zeng, X., Jin, Q., Wang, P. & Huang, C. Distribution and speciation of heavy metal(loid)s in soils under multiple preservative-treated wooden trestles. Toxics 11, 249 (2023).
  29. Bradford, M. A. A leaky sink. Nat. Clim. Chang. 7, 475-476 (2017).
  30. Minasny, B. et al. Soil carbon 4 per mille. Geoderma 292, 59-86 (2017).
  31. Ballabio, C. et al. Mapping LUCAS topsoil chemical properties at European scale using Gaussian process regression. Geoderma 355, 113912 (2019).
  32. Poggio, L. et al. SoilGrids 2.0: producing soil information for the globe with quantified spatial uncertainty. Soil 7, 217-240 (2021).
  33. Zhang, S. et al. Escalating arsenic contamination throughout Chinese soils. Nat. Sustain. 7, 766-775 (2024).
  34. Hlavay, J., Prohaska, T., Weisz, M., Wenzel, W. W. & Stingeder, G. J. Determination of trace elements bound to soil and sediment fractions (IUPAC Technical Report). Pure Appl. Chem. 76, 415-442 (2004).
  35. Tessier, A. & Campbell, P. G. C. Comment on “Pitfalls of sequential extractions” by P. M. V. Nirel and F. M. M. Morel. Water Res. 25, 115-117 (1991).
  36. Sutherland, R. A. BCR -701: a review of 10-years of sequential extraction analyses. Anal. Chim. Acta 680, 10-20 (2010).
  37. Tack, F. M. G. & Verloo, M. G. Chemical speciation and fractionation in soil and sediment heavy metal analysis: a review. Int. J. Environ. Anal. Chem. 59, 225-238 (1995).
  38. Shober, A. L., Stehouwer, R. C. & MacNeal, K. E. Chemical fractionation of trace elements in biosolid-amended soils and correlation with trace elements in crop tissue. Commun. Soil Sci. Plant Anal. 38, 1029-1046 (2007).
  39. Kim, R.-Y. et al. Bioavailability of heavy metals in soils: definitions and practical implementation-a critical review. Environ. Geochem. Health 37, 1041-1061 (2015).
  40. Hernández-Moreno, J. M., Rodríguez-González, J. I. & Espino-Mesa, M. Evaluation of the BCR sequential extraction for trace elements in European reference volcanic soils. Eur. J. Soil Sci. 58, 419-430 (2007).
  41. Rohatgi, A. et al. WebPlotDigitizer user manual version 3.4. 1-18 https://automeris.io/WebPlotDigitizer (2014).
  42. Bogusz, A. & Oleszczuk, P. Sequential extraction of nickel and zinc in sewage sludge- or biochar/sewage sludge-amended soil. Sci. Total Environ. 636, 927-935 (2018).
  43. Huang, Y. et al. Size, distribution, and vulnerability of the global soil inorganic carbon. Science 384, 233-239 (2024).
  44. Shaheen, S. M. & Rinklebe, J. Geochemical fractions of chromium, copper, and zinc and their vertical distribution in floodplain soil profiles along the Central Elbe River, Germany. Geoderma 228-229, 142-159 (2014).
  45. Jiang, Y. et al. Topological representations of crystalline compounds for the machine-learning prediction of materials properties. npj Comput. Mater. 7, 28 (2021).
  46. Podgorski, J. & Berg, M. Global threat of arsenic in groundwater. Science 368, 845-850 (2020).
  47. Rosenblatt, F. The perceptron: a probabilistic model for information storage and organization in the brain. Psychol. Rev. 65, 386-408 (1958).
  48. LeCun, Y., Bengio, Y. & Hinton, G. Deep learning. Nature 521, 436-444 (2015).
  49. Breiman, L. Random forests. Mach. Learn. 45, 5-32 (2001).
  50. Friedman, J. H. Greedy function approximation: a gradient boosting machine. Ann. Stat. 29, 1189-1232 (2001).
  51. Chen, T. & Guestrin, C. XGBoost: a scalable tree boosting system. In Proc. 22nd ACM SIGKDD International Conference on Knowledge Discovery and Data Mining 785-794 (ACM, 2016).
  52. Ke, G. et al. Lightgbm: a highly efficient gradient boosting decision tree. Adv. Neural Inf. Process. Syst. 30, 3146-3154 (2017).
  53. Aiken, E., Bellue, S., Karlan, D., Udry, C. & Blumenstock, J. E. Machine learning and phone data can improve targeting of humanitarian aid. Nature 603, 864-870 (2022).
  54. Cortes, C. & Vapnik, V. Support-vector networks. Mach. Learn. 20, 273-297 (1995).
  55. Kleinbaum, D. G., Dietz, K., Gail, M., Klein, M. & Klein, M. Logistic Regression. (Springer, New York, 2002).
  56. Ketkar, N. Introduction to Keras. In Deep Learning with Python, 97-111 (Springer, 2017).
  57. Pedregosa, F. et al. Scikit-learn: machine learning in Python. J. Mach. Learn. Res. 12, 2825-2830 (2011).
  58. Cook-Patton, S. C. et al. Mapping carbon accumulation potential from global natural forest regrowth. Nature 585, 545-550 (2020).
  59. Barber, R. F., Candès, E. J., Ramdas, A. & Tibshirani, R. J. Predictive inference with the jackknife. Ann. Stat. 49, 486-507 (2021).
  60. Nemani, V. et al. Uncertainty quantification in machine learning for engineering design and health prognostics: a tutorial. Mech. Syst. Signal Process. 205, 110796 (2023).
  61. Altmann, A., Toloşi, L., Sander, O. & Lengauer, T. Permutation importance: a corrected feature importance measure. Bioinformatics 26, 1340-1347 (2010).
  62. van den Hoogen, J. et al. Soil nematode abundance and functional group composition at a global scale. Nature 572, 194-198 (2019).
  63. Jennings, A. A. Analysis of worldwide regulatory guidance values for the most commonly regulated elemental surface soil contamination. J. Environ. Manag. 118, 72-95 (2013).
  64. Muckley, E. S., Saal, J. E., Meredig, B., Roper, C. S. & Martin, J. H. Interpretable models for extrapolation in scientific machine learning. Digit. Discov. 2, 1425-1435 (2023).
  65. Zhan, J. et al. Evaluating interpolation and extrapolation performance of neural retrieval models. In Proceedings of the 31st ACM International Conference on Information & Knowledge Management, 2486-2496 (ACM, New York, 2022).
  66. Haaf, D., Six, J. & Doetterl, S. Global patterns of geo-ecological controls on the response of soil respiration to warming. Nat. Clim. Change 11, 623-627 (2021).
  67. Liu, J., Zhang, X.-H., Tran, H., Wang, D.-Q. & Zhu, Y.-N. Heavy metal contamination and risk assessment in water, paddy soil, and rice
    around an electroplating plant. Environ. Sci. Pollut. Res. 18, 1623-1632 (2011).
  68. Tóth, G., Hermann, T., Szatmári, G. & Pásztor, L. Maps of heavy metals in the soils of the European Union and proposed priority areas for detailed assessment. Sci. Total Environ. 565, 1054-1062 (2016).
  69. Orgiazzi, A., Ballabio, C., Panagos, P., Jones, A. & Fernández-Ugalde, O. LUCAS soil, the largest expandable soil dataset for Europe: a review. Eur. J. Soil Sci. 69, 140-153 (2018).
  70. Hunter, J. D. Matplotlib: a 2D graphics environment. Comput. Sci. Eng. 9, 90-95 (2007).
  71. Virtanen, P. et al. SciPy 1.0: fundamental algorithms for scientific computing in Python. Nat. Methods 17, 261-272 (2020).
  72. Cordier, T. et al. Flexible and Systematic Uncertainty Estimation with Conformal Prediction via the MAPIE library, In Proceedings of the Twelfth Symposium on Conformal and Probabilistic Prediction with Applications 204, 549-581 (PMLR, Limassol, 2023).
  73. Qi, C. C. et al. Figshare https://figshare.com/s/fa76e3cb3e0e070 9df8d (2025).

شكر وتقدير

تم تمويل هذه الدراسة من قبل مجموعات البحث المبتكرة التابعة لمؤسسة العلوم الطبيعية الوطنية في الصين (رقم 52121004، ل.ي.س.)، مؤسسة العلوم الطبيعية الوطنية في الصين (الأرقام 22376221، ج.ج.ق. و 22494680، ز.ل.)، مؤسسة العلوم الطبيعية في مقاطعة هونان (رقم 2024JJ2074، ج.ج.ق.)، وبرنامج رعاية العلماء الشباب المتميزين من قبل CAST (رقم 2023QNRC001، ج.ج.ق.). كما تم دعم هذا العمل جزئيًا من قبل مركز الحوسبة عالية الأداء في جامعة جنوب الوسطى.

مساهمات المؤلفين

صمم المشروع كل من C.C.Q. وY.Z. وL.Y.C. وZ.L. قام كل من C.C.Q. وT.H. وM.T.W. ببناء منهجية النمذجة وأجروا النمذجة. شارك كل من F.H.M.T. وG.R.H. في جمع البيانات والنقاش. شارك كل من M.L. وB.T.Z. وS.D. وQ.S.C. في تحليل النتائج والنقاش. كتب كل من C.C.Q. وZ.L. المسودة الأولية للمخطوطة، وقام جميع المؤلفين بتحرير المخطوطة.

المصالح المتنافسة

يعلن المؤلفون عدم وجود مصالح متنافسة.

معلومات إضافية

معلومات إضافية النسخة الإلكترونية تحتوي على مواد إضافية متاحة فيhttps://doi.org/10.1038/s41467-025-58026-8.
يجب توجيه المراسلات والطلبات للحصول على المواد إلى تشانغ لين.
تُعرب مجلة Nature Communications عن شكرها لمايكل هارباتل، شوجون وانغ والمراجعين الآخرين المجهولين على مساهمتهم في مراجعة هذا العمل. يتوفر ملف مراجعة الأقران.
معلومات إعادة الطباعة والتصاريح متاحة علىhttp://www.nature.com/reprints
ملاحظة الناشر: تظل شركة سبرينغر ناتشر محايدة فيما يتعلق بالمطالبات القضائية في الخرائط المنشورة والانتماءات المؤسسية.
الوصول المفتوح هذه المقالة مرخصة بموجب رخصة المشاع الإبداعي النسب-غير التجارية-عدم الاشتقاق 4.0 الدولية، التي تسمح بأي استخدام غير تجاري، ومشاركة، وتوزيع، واستنساخ في أي وسيلة أو صيغة، طالما أنك تعطي الائتمان المناسب للمؤلفين الأصليين والمصدر، وتوفر رابطًا لرخصة المشاع الإبداعي، وتوضح إذا قمت بتعديل المادة المرخصة. ليس لديك إذن بموجب هذه الرخصة لمشاركة المواد المعدلة المشتقة من هذه المقالة أو أجزاء منها. الصور أو المواد الأخرى من طرف ثالث في هذه المقالة مشمولة في رخصة المشاع الإبداعي الخاصة بالمقالة، ما لم يُشار إلى خلاف ذلك في سطر الائتمان للمادة. إذا لم تكن المادة مشمولة في رخصة المشاع الإبداعي الخاصة بالمقالة وكان استخدامك المقصود غير مسموح به بموجب اللوائح القانونية أو يتجاوز الاستخدام المسموح به، فسيتعين عليك الحصول على إذن مباشرة من صاحب حقوق الطبع والنشر. لعرض نسخة من هذه الرخصة، قم بزيارة http:// creativecommons.org/licenses/by-nc-nd/4.0/.
(ج) المؤلف(ون) 2025

  1. مدرسة المعادن والبيئة، جامعة جنوب الوسط، تشانغشا 410083، الصين. مدرسة هندسة الموارد والسلامة، جامعة جنوب الوسط، تشانغشا 410083، الصين. مدرسة علوم البيئة والهندسة، جامعة العلوم والتكنولوجيا الجنوبية، شنتشن 518000، الصين. قسم الهندسة المدنية، جامعة موناش، كلايتون 3800 فيكتوريا، أستراليا. مدرسة الفيزياء والإلكترونيات، جامعة جنوب الوسط، تشانغشا 410083 هونان، الصين. قسم الهندسة المدنية والمواد والبيئة، جامعة إلينوي في شيكاغو (UIC)، إلينوي 60607، الولايات المتحدة الأمريكية.
    كلية الهندسة الكيميائية، جامعة هuaqiao، شيامن 361021، الصين. البريد الإلكتروني:zhang_lin@csu.edu.cn

Journal: Nature Communications, Volume: 16, Issue: 1
DOI: https://doi.org/10.1038/s41467-025-58026-8
PMID: https://pubmed.ncbi.nlm.nih.gov/40140373
Publication Date: 2025-03-26

Global and regional patterns of soil metal(loid) mobility and associated risks

Received: 18 November 2024
Accepted: 10 March 2025
Published online: 26 March 2025
Soil, a non-renewable and indispensable natural resource, underpins vital ecosystem functions . However, the accumulation of metals and metalloids (hereafter referred to as metal[loid]s) in soil, whether naturally occurring or human-induced, poses a global threat with profound health implications for humans , livestock , and wildlife . The threat stems from their toxicity, widespread occurrence, resistance to biodegradation, and potential for uptake by crops . High contents of metal(loid)s in soil have been detected worldwide, notably in the European Union and China , impacting vast populations. A global assessment revealed that over 23 million people inhabiting floodplains, which account for approximately of the Earth’s land area , are affected by mining-related metal(loid) accumulation . With projected population growth and escalating demand for agricultural land , the detrimental impacts of soil metal(loid) contamination on ecosystems and human health are likely to intensify.

Chongchong Qi , Tao , Yi Zheng , Mengting Wu , Fiona H. M. Tang , Min Liu , Bintian Zhang , Sybil Derrible , Qiusong Chen , Gongren Hu , Liyuan Chai & Zhang Lin

Soil contamination by metals and metalloids (metal[loid]s) is a global issue with significant risks to human health, ecosystems, and food security. Accurate risk assessment depends on understanding metal(loid) mobility, which dictates bioavailability and environmental impact. Here we show a theory-guided machine learning model that predicts soil metal(loid) fractionation across the globe. Our model identifies total metal(loid) content and soil organic carbon as primary drivers of metal(loid) mobility. We find that of the world’s land is at medium-to-high mobilization risk, with hotspots in Russia, Chile, Canada, and Namibia. Our analysis indicates that global efforts to enhance soil carbon sequestration may inadvertently increase metal(loid) mobility. Furthermore, in Europe, the divergence between spatial distributions of total and mobile metal(loid)s is uncovered. These findings offer crucial insights into global distributions and drivers of soil metal(loid) mobility, providing a robust tool for prioritizing metal(loid) mobility testing, raising awareness, and informing sustainable soil management practices.

Abstract

To assess the risks associated with soil metal(loid) contamination accurately and inform effective remediation and policymaking , it is crucial to consider not only the total content of these pollutants but also their mobility within the soil environment . Metal(loid) mobility dictates their bioaccessibility for plant uptake and subsequent entry into the food chain , making it a key determinant of their environmental fate and potential risks . A comprehensive understanding of metal(loid) mobility in global soils, which is largely governed by chemical speciation, remains a critical gap in the literature.

Obtaining comprehensive, fine-resolution soil metal(loid) speciation data at continental or global scales remains a significant challenge, hindering efforts to assess and understand the global mobility of such pollutants. Although advanced analytical techniques, such as highenergy resolution X-ray absorption spectroscopy and isotope dilution, can accurately determine metal(loid) speciation , their specialized

nature and limited availability restrict their widespread application. Sequential extraction experiments, although widely used to fractionate metal(loid)s and evaluate bioaccessibility , have not yet been used to consistently and reliably determine fractionation patterns at continental or global scales. This is attributed to the laborintensive nature of sequential extraction experiments, the heterogeneous nature of soil properties, and the interplay of numerous confounding factors (detailed in Supplementary Note 1). Inconsistent results from previous chemical fractionation studies further underscore the critical knowledge gap in the fractionation and mobility analysis of soil metal(loid)s.
The availability of big Earth data and advancements in machine learning (ML) have enabled the development of global predictive environmental models, even with limited sample data . Leveraging this opportunity, we compiled a global dataset of 30,832 field measurements of soil metal(loid) fractionation across 5 continents and 56 countries/territories (Methods and Supplementary Fig. 1). We then developed a theory-guided ML model to predict the fractionation of various metal(loid)s, which was trained and validated using the compiled dataset plus an external dataset with 4,900 literature- and experiment-derived data points (Methods). By integrating global topsoil properties at a resolution, our model uncovered the spatial distributions of the most prevalent metal(loid)s (Pb, As, Cd, Cr, Cu, and Hg ), elucidating the fundamental drivers of their mobility in soil. We identified global hotspots of metal(loid) mobilization risk and evaluated their spatiotemporal changes under elevated contamination scenarios and potential soil carbon sequestration efforts. A detailed inspection of mobile metal(loid) content in the European Union (EU) member states was also conducted. This study highlights the dynamic nature of metal(loid) mobility, providing insights for mitigating global soil pollution and supporting sustainable soil management. The present model can also be used to aid soil metal(loid) assessment, raise awareness, and prioritize further testing of metal(loid) mobility at both local and global scales.

Results

Global patterns and key drivers of soil metal(loid) mobility

The developed theory-guided ML model, validated using global data, accurately predicts the distribution of metal(loid)s across four fractions with decreasing mobility: exchangeable, water- and acid-soluble (F1), reducible (F2), oxidizable (F3), and residual (F4) (Methods and Supplementary Fig. 2). The F1 fraction, indicative of the most mobile metal(loid) fraction , poses the greatest threat to the surrounding environment . Consequently, its mass percentage, denoted as , was regarded as the mobility index in this study. The ML model was employed to predict the baseline mobility, defined as at the soil baseline contamination threshold, of 22 metal(loid)s globally at a resolution (see “Methods”). The baseline mobility measures the most mobile metal(loid) content once baseline contamination occurs; a high baseline mobility represents a high likelihood of a soil metal(loid) being mobilized into soil pore water. Thus, the mobility analysis in the present study indicates the spillover risk of soil metal(loid) contamination to water and food security, and its associated risk is termed as the mobilization risk in subsequent analyzes.
This global assessment revealed substantial spatial variability and element-specific differences in baseline mobility, as illustrated for most prevalent metal(loid)s in Fig. 1a-f. Taking Pb as an example (Fig. 1a), the medium-to-high level of mobility ( , see “Methods”) occurred in approximately of the global topsoil (excluding Antarctica), mostly distributed in the northern USA, southern Canada, North Africa, southern Europe, and southern China. For other prevalent metal(loid)s, including As, , and Hg , the global land fractions with medium-to-high mobilization risk amounted to , and , respectively. Globally, the average proportion of land at medium-to-high mobilization risk
was for the most prevalent metal(loid)s (Supplementary Table 1).
Among 22 metal(loid)s covered in the current study, uranium, zinc, and sodium exhibited the highest baseline mobility, with global average values of , and , respectively, whereas iron, vanadium, and aluminum showed the lowest baseline mobility, with global average values of , and , respectively (Fig. 1g). Notably, the mobilization risk evidently increased with the contamination level. Given the elevated contamination levels (Methods), the global average land fraction with for the most prevalent metal(loid)s would expand to (Supplementary Table 1), as predicted by the ML model. Evident variations in the increase of the mobile fractions were observed from baseline to elevated contamination scenarios (Supplementary Fig. 3), indicating that soil properties had a crucial influence on the mobility distribution and dynamics across the globe. For example, the mobile Pb fraction increased more evidently in South America and Africa than in other regions under the same increase in total Pb content. However, the mobilization risk hotspots remained similar under both the baseline and elevated contamination scenarios.
Interpretation of the ML model (Methods) revealed that electron affinity and covalent radius were the primary elemental properties influencing mobility, whereas total metal(loid) content (TMC) and organic carbon (OC) were the most influential soil properties (Fig. 1h). The positive influence of TMC on (Fig. 1h) suggests that metal(loid) mobility increases in highly contaminated soils, implying that the associated mobilization risks may escalate disproportionately faster than the level of contamination. The positive correlation between TMC and explains the above-mentioned influence of elevated contamination levels on mobilization risk. Additionally, the positive influence of OC on (Fig. 1h) suggests that soil carbon sequestration, a representative negative carbon emission strategy , may unintentionally increase mobilization risks in metal(loid)-contaminated soils. Generally speaking, the soil pH is also positively correlated with (Fig. 1h), although with minor fluctuations. The influence of cation exchange capacity (CEC) and clay on is highly non-linear, indicating complex influencing mechanisms. For example, certain amounts of clay may stabilize metal(loid)s in soil by providing more adsorption sites, while too much clay can also facilitate metal(loid) leaching due to the decreased amount of highly active components and increased particle solubility.

Escalated metal(loid) mobilization risk under the four per mille initiative

The comprehensive mobilization risk map (Methods) of the most prevalent metal(loid)s in soil revealed a high degree of spatial heterogeneity globally, with a pronounced concentration of high mobilization risk areas in the high-latitude regions of the Northern Hemisphere (Fig. 2a). The predicted mobilization risk hotspots existed on all continents, predominantly in central and northern Asia, northern parts of North America and Africa, southern Oceania, and South America (Fig. 2b-i). Regions characterized by high mobile fractions, such as Algeria and northwest China , were represented in the comprehensive mobilization risk map.
High mobilization risk strongly corresponded with the high OC content (Supplementary Fig. 4). OC was the primary soil property driver of , second only to TMC, as revealed by feature importance analysis (Fig. 1h). Moreover, OC was the most important soil property driver for , and Cu , and it had an important influence on the of other prevalent metal(loid)s (Supplementary Fig. 5). Global efforts to promote soil carbon sequestration as a negative emission strategy may lead to a potentially escalated mobilization risk of soil metal(loid). The ML model allows us to evaluate the change in the mobile fraction ( ) of various metal(loid)s in future scenarios of enhanced soil OC.
The Four Per Mille Initiative aims to increase the soil OC content by annually to improve soil health and combat climate change . However, this increase in soil carbon could inadvertently heighten the mobilization risk of metal(loid). If this initiative was consistently fulfilled from 2024 to 2050, global soils would experience a considerable increase in the mobilization risk of metal(loid)s (Fig. 3a). Specifically, of global land (excluding Antarctica) was predicted to be at medium-to-
high mobilization risk for at least six prevalent metal(loid)s in 2024; this proportion was for five prevalent metal(loid)s and for four prevalent metal(loid)s (Fig. 3b). According to our model predictions, the global land proportion at medium-to-high mobilization risk of contamination by at least four prevalent metal(loid)s would rise to by 2050 if the Four Per Mille Initiative was fully implemented, representing a significant increase from 23% in 2024.
Fig. 1 | Global prediction and key drivers of soil metal(loid) mobility.
a-f Modeled global distribution of the mobile fraction for , and Hg at baseline scenarios. The medium-to-high level of mobility ( ) is indicated in red. Average values for 22 metal(loid)s across the globe. The TMC for baseline mobility analysis was selected based on worldwide regulatory guidance values (RGVs), primary US Environmental Protection Agency (USEPA) (Supplementary Tables 2 and 3); Shapley additive explanations (SHAP) analysis for the mobile fraction . The impact of the top 10 important descriptors is illustrated
through a swarm plot of their corresponding SHAP values. The color of the dot represents the relative value of the descriptor in the dataset (high-to-low depicted as orange-to-blue). The horizontal location of the dots shows whether the effect of that descriptor contributes positively or negatively in that prediction instance ( axis). The gray bar plot shows the mean absolute SHAP values of the descriptors in each instance, which implies the overall contribution of the descriptor to the prediction. OC and CEC represent organic carbon and cation exchange capacity, respectively. Source data are provided as a Source Data file.
Fig. 2 | Global mobilization risk hotspots in 2024, revealed by the soil metal(loid) mobility model. a Mobilization risk hotpots of prevalent metal(loid)s ( Pb , As, , and Hg ) across the globe. This plot illustrates the number of prevalent
metal(loid)s identified with medium-to-high mobilization risk in baseline scenarios for a specific site; b-i Zoomed-in sections of the typical mobilization risk hotspots. Source data are provided as a Source Data file.
An increase in the mobilization risk of metal(loid)s occurs in most countries, and spatial variation exists because of the coupled influences of many factors (i.e., soil properties and the employed baseline scenarios). National analysis revealed that of Russian land was at medium-to-high mobilization risk for at least four prevalent metal(loid)s in 2024, whereas the proportions for Chile, Canada, and Namibia were , and , respectively. The three countries with the largest land proportions at medium-to-high mobilization risk for six prevalent metal(loid)s were Canada ( ), Russia ( ), and Namibia ( ) in 2024. Pakistan, China, and Namibia were expected to experience the most substantial increases in the mobilization risk of metal(loid)s due to the implementation of soil carbon sequestration, whereas Russia was expected to experience only a modest increase in the mobilization risk (Fig. 3b). Although the values of the six prevalent metal(loid)s generally increased with increasing OC content, the rate of increase diminished at higher OC levels (Supplementary Fig. 6). The average OC contents in Pakistan ( ), China ( ), and Namibia ( ) were much lower than that in Russia ( ) in 2024, indicating a more
evident increase in the mobilization risk when the Four Per Mille Initiative was adopted.

Spatial disparities in total and mobile metal(loid) contents in EU soils

By combining the ML model with TMC data from the Land Use/Land Cover Area Frame Survey (LUCAS), we generated contour maps (Fig. 4 and Supplementary Fig. 7) illustrating the mobile metal(loid) contents in the soil ( TMC) of EU member states in 2009 (Methods). The disparity between the distributions of TMC and mobile metal(loid) content reflected the complex factors influencing mobility and underscores the importance of leveraging the ML model to assess mobilization risk. For example, the total Pb content ranged between 1.99 and , with an average of . High levels of Pb contents were observed around central United Kingdom (UK), central Germany, and central Italy. The UK, Germany, Italy, and France, with averages of 26.52, 21.96, 20.78 and , respectively, ranked among the top EU member states for total Pb content. The UK
Fig. 3 | Influence of the four per mille initiative on global mobilization risk hotspots in 2050. a Global risk hotspots in 2050 after the adoption of soil carbon sequestration under the Four Per Mille Initiative; b Global and national comparison of the mobilization risk hotspots in 2024 and 2050. This plot illustrates the number
of prevalent metal(loid)s identified as medium-to-high mobilization risk in baseline scenarios for a specific site. The bar charts depict the percentage of land identified to be risky by various prevalent metal(loid)s, highlighting the countries that face significant mobilization risks. Source data are provided as a Source Data file.
exhibited the highest mobile Pb content; however, Italy exceeded Germany in terms of mobile Pb (Fig. 4b, d).
The areas predicted to have the most significant differences in the spatial distributions of total and mobile Pb included southern Germany, southern UK, and northern France, primarily driven by high soil pH (Supplementary Fig. 8) . Additionally, spatial differences in total and mobile Pb contents were also observed in northern Germany and Sweden, where they are influenced by CEC values and high OC values (Supplementary Fig. 8). Differences in the rankings of EU countries in terms of the total and mobile contents of As, , and Hg were also apparent (Fig. 4e-i and Supplementary Fig. 7). Comparing the ranking by total and mobile contents, Austria decreased from fourth to fifth for Cu , and Ireland decreased from second to third for Hg , respectively. The mobility prediction model also revealed an evident increase in mobile metal(loid) content across EU soils when soil carbon sequestration is adopted (Supplementary Fig. 9).

Discussion

Herein, we present a pioneering application of theory-guided ML to predict soil metal(loid) mobility, addressing the challenges posed by the global heterogeneity of soil properties. The validated soil
metal(loid) fractionation model, which enables the fractionation prediction of 49 metal(loid)s in diverse soil types, is expected to significantly reduce the resources and time required for geological surveys. Therefore, our soil metal(loid) mobility model enables the creation and routine updating of global metal(loid) mobility maps.
The metal(loid) mobility model can be used as a guide for prioritizing metal(loid) mobility testing and for raising awareness, for example, in central and northern Asia, northern parts of North America and Africa, southern Oceania, and South America. Prioritizing further metal(loid) mobility testing holds more importance for low- and middle-income countries with extensive crop production (i.e., southern Brazil and northern Argentina), where the current metal(loid) mobility condition is largely unknown and limited testing resources must be employed effectively in the future. We note that the presented soil metal(loid) mobility maps cannot be used to guide site-scale assessment and remediation under the current resolution ( 5 km ), particularly because site-scale ( ) heterogeneous soil metal(loid)s and properties cannot be obtained from existing global datasets . Nevertheless, our soil metal(loid) mobility model can continue to support site-scale soil metal(loid) assessment and remediation by substituting, at least partially, costly and time-consuming
Fig. 4 | Continental prediction of soil metal(loid) mobility at the European scale. a Distribution of total Pb content, along with zoomed-in sections in central Europe; Mean total Pb content of European countries with soil samples >500; c Modeled distribution of mobile Pb content, along with zoomed-in sections in central Europe; Modeled mean mobile Pb content of European countries with soil samples ; The total and mobile contents in maps are classified using the
geometric interval method in the color spectrum. e-i Mean total and mobile contents of As, , and Hg for the top five EU countries. The orange bars on the left-hand side -axis represent the mobile metal(loid) content, and the blue markers on the right-hand side -axis represent the total metal(loid) content. The countries are ordered based on their mobile metal(loid) content. UK represents United Kingdom. Source data are provided as a Source Data file.
sequential extraction experiments. Thus, embracing our model in sitescale studies can provide practitioners with a unique ability to assess soil metal(loid) mobility rapidly and reliably.
Our results suggest a disproportionate increase in the mobilization risk compared with the contamination level, highlighting the need for more tailored mobility investigations in specific countries/regions with escalating metal(loid) contamination. For example, Chinese soils are anticipated to experience increasing As contamination . Our findings indicate that the resulting increase in As mobility, particularly in regions with high arsenic levels such as southeast China, could exacerbate the threat to food safety and human health. Furthermore,
the mobility distribution maps can be evaluated together with data on the major metal(loid) sources, guiding detailed mobility testing, aiding in industrial planning, and supporting crop management (Supplementary Note 2). For example, south Chile, Namibia, and Kazakhstan were found to be the mobilization risk hotspots with a high probability of soil metal(loid) accumulation due to natural and anthropogenic sources, which should undergo detailed metal(loid) mobility testing and monitoring.
Our metal(loid) mobility model also provides timely insights into how metal(loid) mobility changes with related descriptors, which can provide essential information for designing remediation measures
(Supplementary Note 3). Examining the collective effect of soil attributes on the mobility of metal(loid)s facilitates the classification of all investigated metal(loid)s into three groups on the basis of the influence of soil attributes (Supplementary Note 3). This type of metal(loid) grouping can serve as a benchmark for guiding soil remediation efforts when specific data is lacking for a particular metal(loid) but is abundant for similar metal(loid)s in the same group. Moreover, the metal(loid) mobility model can advance our remediation strategies by providing more tailored mobility responses to varying soil attributes (i.e., soil pH), thus suggesting the most efficient pathway to stabilize metal(loid)s in soils. For example, there might exist a varied safe pH range, where can be evidently decreased for different metal(loid)s at various conditions. Thus, more tailored safe pH ranges provided by our ML models can promote more precise chemical stabilization techniques for site-specific remediations.
The predicted soil metal(loid) mobility maps have substantial implications for precise soil management. The mobility maps highlight the evident spatial disparity in metal(loid) mobilization risk at the same total content, making it unfeasible to establish singular RGVs worldwide or for countries with large land areas and diverse soil types. Establishing new RGVs that consider both mobile and total contents serves as a necessary step towards improved soil regulation. RGVs can be further tailored to the local environment; thus, different RGVs should be proposed for different regions on the basis of soil heterogeneity, instead of using singular RGVs across the world or over entire countries.
Our results also suggest that soil carbon sequestration, although promising for mitigating greenhouse gas emissions, can significantly increase metal(loid) mobility in the soil. Thus, the adoption of soil carbon sequestration worldwide as a key carbon sequestration strategy might be considered highly risky. Instead, countries must incorporate diverse soil carbon sequestration strategies to address the spatial variation in metal(loid) mobilization risk increases. Acknowledging such mobilization risk variation caused by soil carbon sequestration is also an important step towards achieving sustainable soil carbon management.
Despite its promise, our metal(loid) mobility framework has limitations with respect to the data and methods. The collection of additional fractionation data, ideally in a coordinated manner, from areas that currently have poor coverage would benefit future modeling efforts by allowing the model to be better adapted to these areas. Another notable limitation arises from the use of metal(loid) fractionation to represent mobility. Sequential extraction has been widely used to fractionate soil metal(loid)s into operationally defined forms according to their physiochemical mobility and potential availability . This method has been proven to be useful in the field of environmental analytical chemistry and can work as a common scheme so that results from different researchers can be compared and an international database can be established . Although positive correlations between the mobile content in soil and metal(loid) content in plants have been reported , the correlation between bioavailability and fractionation data remains controversial , partly due to the lack of precise definition of bioavailability and standard methods for its measurement . Therefore, particular emphasis should be placed on interpreting the current results with respect to metal(loid) bioavailability. We also acknowledge that our metal(loid) mobility model primarily focuses on the mobility of soil metal(loid)s; therefore, the mobilization risk analysis could shed light on the likelihood of a metal(loid) in soil being mobilized under certain contamination scenarios. In other words, the global mobility maps of soil metal(loid)s cannot represent their actual risk, since the global distribution of the soil metal(loid) content is unavailable, and the source-pathway-receptor interactions are not considered.
In conclusion, this study demonstrates the potential of ML in transforming soil metal(loid) fractionation analysis, providing a foundation for more advanced, tailored, and accurate ML approaches in soil science.

Methods

Assembling a global database for metal(loid) fractionation in soil

We systematically reviewed the literature (March 1, 2023) with a keyword search of studies published since 1975 in the Web of Science and Google Scholar: TOPIC: [“soil” AND “heavy metal” AND (“fraction*” OR “distribution” OR “speciation” OR “sequential extraction”)]. The initial search yielded more than 10,000 peer-reviewed studies and theses from the university directories. Considering the simple implementation, repeatable fractionation results, and data availability , we focused on studies involving metal(loid) fractionation from the Community Bureau of Reference (BCR) four-step sequential extraction ( studies). We fully reviewed these papers to identify studies with detailed data on soil properties ( two soil descriptors), total metal(loid) content, and metal(loid) fractionation ( ). To mitigate the potential problems associated with including too many studies from various experimental settings, we excluded studies with a limited number of data points ( ). The process employed for literature screening and data collection is shown in Supplementary Fig. 10. We extracted all available data from the remaining studies ( , Supplementary Table 4), and used WebPlotDigitizer to extract data from plots, images, and/or maps .
F1-F4 in the BCR correspond to fractions bound to carbonates, oxides, organic matter, and crystal minerals, respectively . Among them, F1 is the most mobile fraction that poses the greatest threat to the surrounding environment . A specific soil and metal(loid) combination has four data points, considering four BCR fractions, leading to a global dataset ( studies) with 30,832 data points from 5 continents spanning 56 countries/territories (Supplementary Fig. 1). It contained 49 metal(loid)s (Supplementary Fig. 11), diverse soil textures and types, and all land cover groups (cropland, forest, shrubland, grassland, bare land, peat, and marsh). We note that though the uneven distribution of data points was observed in the global dataset, which is often encountered in global soil investigations , our subsequent reliability and uncertainty analyzes of trained ML models imply their robustness and generalization capability to unknown samples and regions.
Clay content (%), pH , CEC ( ), and OC (%) were identified as key descriptors of soil, considering their importance in metal(loid) fractionation , availability of data, and feasibility of the trained model for global application (these four descriptors have been well documented in the global soil database). We used the measured metal(loid) content after soil digestion with as the total metal(loid) content, and when it was not provided, the sum of BCR extractions was used. The metal(loid) type was replaced with 32 elemental descriptors to facilitate their utilization in ML modeling . Overall, the global dataset included 37 inputs (4 descriptors for soil properties, 32 descriptors for metal[loid]s and 1 for the total metal[loid] content), and the output was the fractionation percentage under the coupled influence of 37 descriptors. Data conversion and imputation were then implemented to prepare the final and complete global dataset (Supplementary Note 4).
The strong and well-explained input variation within the aggregated dataset improves the robustness and application prospects of the ML models trained on it (Supplementary Note 5) . No significant linear correlation was observed between the descriptors and metal(loid) fractionation (Supplementary Note 6), indicating a coupled, nonlinear relationship. The challenge in predicting metal(loid) fractionation is further complicated by the significant variations among various metal(loid)s (Supplementary Note 7).

Metal(loid) mobility modeling using theory-guided ML

We validated and compared seven ML algorithms, including deep neural network (DNN) , random forest (RF) , gradient boosting machine (GBM) , extreme gradient boosting machine (XGBoost) , light gradient boosting machine (LightGBM) , support vector machine (SVM) , and logistic regression (LR) . First, we split the total number of data points into training and test sets using repeated 90/10 random splits after a comprehensive convergence test (Supplementary Fig. 12). We used the training set to determine the best ML algorithms and set of hyperparameters, as well as train the final model. We used the test set and a brand-new independent test dataset to assess the generalization capability of the trained model.
We then conducted ML modeling through the following process: (i) determined the best feature scaling methods (standardization, normalization, and no scaling) for each ML algorithm with their default hyperparameters (Supplementary Table 5); (ii) selected features via five feature selection methods (recursion feature elimination, feature cluster removal, random-forest-based feature selection, and no feature selection); (iii) optimized ML hyperparameters from approximately 4,000 hyperparameter combinations (Supplementary Table 6); (iv) incorporated a chemical constraint such that, for a given metal(loid), the sum of all its fractions must be equal to , into ML models. Specifically, for a typical fraction prediction, we predicted all fraction percentages ( ) and normalized that fraction considering the sum of . To speed up ML modeling, the above-mentioned modeling process was only applied to the top three robust ML algorithms with their default performance (Supplementary Table 7). The designed modeling process demonstrated successive improvements in the predictive performance, and the most significant enhancement of the total improvement) was achieved by incorporating chemical constraints (Supplementary Fig. 13).
All ML models were built and evaluated in Python, with DNN implemented using the Keras package and all other models implemented using the scikit-learn package . We used the grid search method together with five-fold cross-validation (CV) in scikit-learn to select the best hyperparameter combination. The coefficient of determination ( ) from the five-fold CV was utilized as the evaluation indicator during the modeling process. In our case, the best-trained model was XGBoost with standardization, feature cluster removal, the optimized hyperparameter set, and chemical constraints.
After identifying the best-performing ML algorithm and the set of hyperparameters, we trained the optimal XGBoost model for our final predictions and performance verification. The optimal XGBoost model could establish a strong correspondence between the observed and predicted fractionation values on the test set ( variation explained with a mean absolute error of 6.21) (Supplementary Fig. 13).

Modeling reliability, prediction uncertainty, and descriptor importance

In addition to training-test verification, we employed a series of reliability analyzes to assess the out-of-sample error of our model. We compiled an independent test dataset from the most recent studies (1620 data points, Supplementary Table 8) and extensive laboratory experiments ( 3748 data points). The compiled independent test dataset primarily contained soil samples from China and EU (details in Supplementary Note 8). Although the optimal XGBoost model was not trained on any measurements from the independent test dataset, it nevertheless achieved an value of 0.63 (Supplementary Fig. 14); this indicates its ability to predict metal(loid) fractionation of unknown soil samples with accuracy . We also performed a hold-out test to showcase that the trained XGBoost model had a good generalization capability for other regions that were not covered during model training (Supplementary Note 9).
In the present study, we utilized resampling methods based on the jackknife strategy to estimate robust prediction intervals with the
optimal XGBoost model . Ideally, the uncertainty quantification of the optimal XGBoost model should yield a confidence interval that contains the true value for approximately of the time . Our uncertainty analysis revealed that of the testing data fell into the confidence intervals of prediction, indicating low uncertainty in predicting soil metal(loid) fractionation during testing.
We used permutation importance to calculate the overall descriptor importance based on the complete dataset, using the implementation in the scikit-learn . A SHAP analysis was performed to investigate the effects of various descriptors on the F 1 fraction. For this purpose, we used the TreeSHAP package and tforce plot visualization from the SHAP library in Python.

Global metal(loid) mobility distribution and key drivers

To create the global map of soil metal(loid) mobility using the optimal XGBoost model, we sampled the global topsoil properties using SoilGrids version 2.0 at a resolution of . Unit conversion was conducted on the SoilGrids data to enable straightforward application of the optimal XGBoost model. The resulting database comprised over 7 million topsoil data points with complete soil descriptor information (pH, OC, clay, and CEC). Before the global application of the optimal XGBoost model, the degree of interpolation/extrapolation was performed . It is found that the optimal XGBoost model required very limited extrapolation to soil properties not included in the training plots ( of soil OC and of other soil properties, Supplementary Table 9), manifesting the reliability of its global application.
As there is no global dataset of the metal(loid) content in the topsoil, we investigated the global patterns of metal(loid) mobility under baseline contamination scenarios. To determine representative metal(loid) content values for baseline scenarios, we used regulatory guidance values (RGVs) from leading multinational organizations or national regulations (Supplementary Tables 1 & 2) . To avoid bias in ML extrapolation and ensure the reliability of our prediction, 22 metal(loid)s were analyzed because their selected RGVs were within the TMC range of the global dataset . Together with the topsoil properties in SoilGrids, global baseline mobility maps for metal(loid)s were constructed. The relative uncertainty maps of global prediction were constructed by displaying standard deviation divided by the mean of prediction based on 20 runs of our final XGBoost model (Supplementary Fig. 15). The relative uncertainty of global mobile fractions for prevalent metal(loid)s in baseline scenarios (Fig. 1a-f) was averaged at , indicating a small relative uncertainty in the global application of the model . The metal(loid) mobility model also allowed us to investigate the influence of metal(loid) contamination by selecting representative RGVs for elevated contamination scenarios (Supplementary Table 1). In rare instances during the global application, negative fraction predictions were observed and subsequently replaced using zero.
We used the risk assessment code to evaluate the mobilization risk of metal(loid)s in the soil. Specifically, low and medium-to-high mobilization risks were associated with a of and , respectively . Combining the baseline mobility maps for single metal(loid)s led to a comprehensive mobility map of the most prevalent metal(loid)s, including Pb, As, Cd, Cr, Cu, and Hg. Here, we considered a specific site to be susceptible to the mobilization risk of a single metal(loid) when it was predicted to be at medium-to-high mobilization risk in the baseline scenario.
We note that, although these hypothetical scenarios are unrealistic from a physical perspective, they are intended to shed light on the differences in the global hotspots of soil metal(loid) mobility under the influence of metal(loid) content. Therefore, these metal(loid) mobility maps could help raise awareness, improve industrial layout, and promote precise government coordination.
Using the global mobility model, we also evaluated the variation in metal(loid) mobility under the influence of human activity. Here, we
investigated the variation in metal(loid) mobility influenced by a typical human endeavor to tackle global climate change, that is, soil carbon sequestration. Soil carbon sequestration was analyzed as it has been recognized as a promising technique to remove atmospheric CO2 by sequestering C as soil OC. In other words, soil carbon sequestration mitigates the rapid increase in global emissions by altering soil properties, particularly soil OC. Before investigating the influence of soil carbon sequestration on soil metal(loid) mobility, we determined the variation in OC caused by soil carbon sequestration. Indeed, a recent international initiative proposed an increase in global soil OC by per year to mitigate greenhouse gas emissions , which has been well recognized . Using the above-mentioned increasing rate of soil OC, we simulated mobility variations in the mobile metal(loid) fraction in 2024 and 2050, respectively. The distribution maps of the mobile metal(loid) fraction allowed us to compute the proportion of land at medium-to-high mobilization risk at global and national scales.

Applying ML mobility models across the EU soils

We applied the optimal XGBoost model to spatially map the metal(loid) mobility in the soil of EU member states in 2009. We selected EU member states as a case study for several reasons. First, standard and extensive soil sampling has been conducted in the Land Use/Land Cover Area Frame Survey (LUCAS) project, which encompassed a large area with a wide distribution of soil types. Second, comprehensive analyzes, including the analyzes of soil properties and total contents of prevalent metal(loid)s, have been performed in a single laboratory to ensure consistency within the database. Third, high-quality datasets containing data regarding the required descriptors for predicting metal(loid) mobility have been made publicly available for EU member states via resources offered by international agencies. Finally, in addition to the total metal(loid) content that has been analyzed , an analysis of their mobility would provide a more accurate assessment of their mobilization risk.
The EU dataset was sampled from the LUCAS project provided by the European Soil Data Center (ESDC). The LUCAS dataset is considered the most comprehensive across continental Europe and has been extensively used for various modeling purposes. We sampled soil properties from the LUCAS 2009 topsoil database and extracted the metal(loid) content from the soil contamination maps of the same project . The resulting dataset comprised 17,601 soil samples with complete descriptors’ information from 23 EU countries, which was used for the metal(loid) mobility prediction. The mobile metal(loid) content was calculated by multiplying the mobile fraction (F1) by the total metal(loid) content . We investigated the impact of soil carbon sequestration on EU metal(loid) mobility by using the same modeling strategy applied globally. This involved increasing soil OC content by while keeping all other properties constant.

Data visualization and statistical analyzes

We visualized the continental and global distribution of metal(loid) fractionation using ArcGIS with Kriging spatial interpolation at a resolution of . We generated the other plots using Matplotlib 3.7.0 and Seaborn 0.12.2 . We performed statistical tests (Shapiro-Wilk test, Wilcoxon Signed Rank test, and Pearson correlation) using Scipy 1.10.1 , and conducted uncertainty analysis using MAPIE 0.9.2 . To decrease the fluctuation in performance evaluation caused by random dataset splitting, we used the mean values from 20 repeated dataset splits as evaluation indicators.

Data availability

Relevant data supporting the key findings of this study are available within the paper and the supplementary information file. Source data are provided with this paper, which is also available at https:// figshare.com/s/fa76e3cb3e0e0709df8d73. The soil property and
metal(loid) data across EU can be found in the Land Use/Land Cover Area Frame Survey (LUCAS) 2009 database , and topsoil heavy metal maps . Global soil property data is available from SoilGrids (https://soilgrids.org/). Source data are provided with this paper.

Code availability

The code to construct the machine learning models is available via Figshare (https://figshare.com/s/fa76e3cb3e0e0709df8d) .

References

  1. Hou, D. et al. Metal contamination and bioremediation of agricultural soils for food safety and sustainability. Nat. Rev. Earth Environ. 1, 366-381 (2020).
  2. O’Connor, D., Hou, D., Ok, Y. S. & Lanphear, B. P. The effects of iniquitous lead exposure on health. Nat. Sustain. 3, 77-79 (2020).
  3. Thornton, I. & Abrahams, P. Soil ingestion-a major pathway of heavy metals into livestock grazing contaminated land. Sci. Total Environ. 28, 287-294 (1983).
  4. Bull, K. R., Murton, R. K., Osborn, D., Ward, P. & Cheng, L. High levels of cadmium in Atlantic seabirds and sea-skaters. Nature 269, 507-509 (1977).
  5. Rodríguez-Eugenio, N., McLaughlin, M. & Pennock, D. Soil Pollution: A Hidden Reality. (FAO, Rome, 2018).
  6. Pérez, A. P. & Eugenio, N. R. Status of Local Soil Contamination in Europe. https://doi.org/10.2760/093804, JRC107508 (EUR 29124 EN, Publications Office of the European Union: Luxembourg, 2018).
  7. Zhao, F.-J., Ma, Y., Zhu, Y.-G., Tang, Z. & McGrath, S. P. Soil contamination in China: current status and mitigation strategies. Environ. Sci. Technol. 49, 750-759 (2015).
  8. Nardi, F., Annis, A., Di Baldassarre, G., Vivoni, E. R. & Grimaldi, S. GFPLAIN250m, a global high-resolution dataset of Earth’s floodplains. Sci. Data 6, 180309 (2019).
  9. Macklin, M. G. et al. Impacts of metal mining on river systems: a global assessment. Science 381, 1345-1350 (2023).
  10. Foley, J. A. et al. Solutions for a cultivated planet. Nature 478, 337-342 (2011).
  11. Tilman, D., Balzer, C., Hill, J. & Befort, B. L. Global food demand and the sustainable intensification of agriculture. Proc. Natl Acad. Sci. 108, 20260-20264 (2011).
  12. Hou, D. & Ok, Y. S. Soil pollution-speed up global mapping. Nature 566, 455-456 (2019).
  13. Wang, X. et al. Climate and vegetation as primary drivers for global mercury storage in surface soil. Environ. Sci. Technol. 53, 10665-10675 (2019).
  14. Almendras, M.-L., Carballa, M., Diels, L., Vanbroekhoven, K. & Chamy, R. Prediction of heavy metals mobility and bioavailability in contaminated soil using sequential extraction and biosensors. J. Environ. Eng. 135, 839-844 (2009).
  15. Wang, J., Man, Y., Yin, R. & Feng, X. Isotopic and spectroscopic investigation of mercury accumulation in Houttuynia cordata colonizing historically contaminated soil. Environ. Sci. Technol. 56, 7997-8007 (2022).
  16. Li, Q. et al. Speciation of heavy metals in soils and their immobilization at micro-scale interfaces among diverse soil components. Sci. Total Environ. 825, 153862 (2022).
  17. Liang, Y. et al. Geochemical controls on the distribution and bioavailability of heavy metals in sediments from Yangtze River to the East China Sea: assessed by sequential extraction versus diffusive gradients in thin-films (DGT) technique. J. Hazard. Mater. 452, 131253 (2023).
  18. Bagherifam, S., Brown, T. C., Bagherifam, S. & Baglieri, A. Sequential extraction of labile and recalcitrant fractions of soil organic matter: a case study focusing on antimony (Sb) in humic acids, fulvic acids and humin fractions of long-term aged contaminated soils. Environ. Pollut. 327, 121610 (2023).
  19. Mbodji, M. et al. Speciation of metals by sequential extractions of agricultural soils located near a dumpsite for prediction of element availability to vegetables. Talanta 244, 123411 (2022).
  20. Blumenstock, J., Cadamuro, G. & On, R. Predicting poverty and wealth from mobile phone metadata. Science 350, 1073-1076 (2015).
  21. Toetzke, M., Banholzer, N. & Feuerriegel, S. Monitoring global development aid with machine learning. Nat. Sustain. 5, 533-541 (2022).
  22. . et al. Fertilizer management for global ammonia emission reduction. Nature 626, 792-798 (2024).
  23. Jin, J. et al. Influence of pyrolysis temperature on properties and environmental safety of heavy metals in biochars derived from municipal sewage sludge. J. Hazard. Mater. 320, 417-426 (2016).
  24. Yang, Y., Tilman, D., Furey, G. & Lehman, C. Soil carbon sequestration accelerated by restoration of grassland biodiversity. Nat. Commun. 10, 718 (2019).
  25. Benhachem, F. Z. & Harrache, D. Chemical speciation and potential mobility of heavy metals in forest soil near road traffic in Hafir, Algeria. J. Health Pollut. 11, 210614 (2021).
  26. Wang, X. S. & Qin, Y. Leaching characteristics of heavy metals and As from two urban roadside soils. Environ. Monit. Assess. 132, 83-92 (2007).
  27. . et al. Cr migration potential and species properties in the soil profile from a chromate production site in the groundwater depression cone area. Bull. Environ. Contam. Toxicol. 109, 600-608 (2022).
  28. Zeng, X., Jin, Q., Wang, P. & Huang, C. Distribution and speciation of heavy metal(loid)s in soils under multiple preservative-treated wooden trestles. Toxics 11, 249 (2023).
  29. Bradford, M. A. A leaky sink. Nat. Clim. Chang. 7, 475-476 (2017).
  30. Minasny, B. et al. Soil carbon 4 per mille. Geoderma 292, 59-86 (2017).
  31. Ballabio, C. et al. Mapping LUCAS topsoil chemical properties at European scale using Gaussian process regression. Geoderma 355, 113912 (2019).
  32. Poggio, L. et al. SoilGrids 2.0: producing soil information for the globe with quantified spatial uncertainty. Soil 7, 217-240 (2021).
  33. Zhang, S. et al. Escalating arsenic contamination throughout Chinese soils. Nat. Sustain. 7, 766-775 (2024).
  34. Hlavay, J., Prohaska, T., Weisz, M., Wenzel, W. W. & Stingeder, G. J. Determination of trace elements bound to soil and sediment fractions (IUPAC Technical Report). Pure Appl. Chem. 76, 415-442 (2004).
  35. Tessier, A. & Campbell, P. G. C. Comment on “Pitfalls of sequential extractions” by P. M. V. Nirel and F. M. M. Morel. Water Res. 25, 115-117 (1991).
  36. Sutherland, R. A. BCR -701: a review of 10-years of sequential extraction analyses. Anal. Chim. Acta 680, 10-20 (2010).
  37. Tack, F. M. G. & Verloo, M. G. Chemical speciation and fractionation in soil and sediment heavy metal analysis: a review. Int. J. Environ. Anal. Chem. 59, 225-238 (1995).
  38. Shober, A. L., Stehouwer, R. C. & MacNeal, K. E. Chemical fractionation of trace elements in biosolid-amended soils and correlation with trace elements in crop tissue. Commun. Soil Sci. Plant Anal. 38, 1029-1046 (2007).
  39. Kim, R.-Y. et al. Bioavailability of heavy metals in soils: definitions and practical implementation-a critical review. Environ. Geochem. Health 37, 1041-1061 (2015).
  40. Hernández-Moreno, J. M., Rodríguez-González, J. I. & Espino-Mesa, M. Evaluation of the BCR sequential extraction for trace elements in European reference volcanic soils. Eur. J. Soil Sci. 58, 419-430 (2007).
  41. Rohatgi, A. et al. WebPlotDigitizer user manual version 3.4. 1-18 https://automeris.io/WebPlotDigitizer (2014).
  42. Bogusz, A. & Oleszczuk, P. Sequential extraction of nickel and zinc in sewage sludge- or biochar/sewage sludge-amended soil. Sci. Total Environ. 636, 927-935 (2018).
  43. Huang, Y. et al. Size, distribution, and vulnerability of the global soil inorganic carbon. Science 384, 233-239 (2024).
  44. Shaheen, S. M. & Rinklebe, J. Geochemical fractions of chromium, copper, and zinc and their vertical distribution in floodplain soil profiles along the Central Elbe River, Germany. Geoderma 228-229, 142-159 (2014).
  45. Jiang, Y. et al. Topological representations of crystalline compounds for the machine-learning prediction of materials properties. npj Comput. Mater. 7, 28 (2021).
  46. Podgorski, J. & Berg, M. Global threat of arsenic in groundwater. Science 368, 845-850 (2020).
  47. Rosenblatt, F. The perceptron: a probabilistic model for information storage and organization in the brain. Psychol. Rev. 65, 386-408 (1958).
  48. LeCun, Y., Bengio, Y. & Hinton, G. Deep learning. Nature 521, 436-444 (2015).
  49. Breiman, L. Random forests. Mach. Learn. 45, 5-32 (2001).
  50. Friedman, J. H. Greedy function approximation: a gradient boosting machine. Ann. Stat. 29, 1189-1232 (2001).
  51. Chen, T. & Guestrin, C. XGBoost: a scalable tree boosting system. In Proc. 22nd ACM SIGKDD International Conference on Knowledge Discovery and Data Mining 785-794 (ACM, 2016).
  52. Ke, G. et al. Lightgbm: a highly efficient gradient boosting decision tree. Adv. Neural Inf. Process. Syst. 30, 3146-3154 (2017).
  53. Aiken, E., Bellue, S., Karlan, D., Udry, C. & Blumenstock, J. E. Machine learning and phone data can improve targeting of humanitarian aid. Nature 603, 864-870 (2022).
  54. Cortes, C. & Vapnik, V. Support-vector networks. Mach. Learn. 20, 273-297 (1995).
  55. Kleinbaum, D. G., Dietz, K., Gail, M., Klein, M. & Klein, M. Logistic Regression. (Springer, New York, 2002).
  56. Ketkar, N. Introduction to Keras. In Deep Learning with Python, 97-111 (Springer, 2017).
  57. Pedregosa, F. et al. Scikit-learn: machine learning in Python. J. Mach. Learn. Res. 12, 2825-2830 (2011).
  58. Cook-Patton, S. C. et al. Mapping carbon accumulation potential from global natural forest regrowth. Nature 585, 545-550 (2020).
  59. Barber, R. F., Candès, E. J., Ramdas, A. & Tibshirani, R. J. Predictive inference with the jackknife. Ann. Stat. 49, 486-507 (2021).
  60. Nemani, V. et al. Uncertainty quantification in machine learning for engineering design and health prognostics: a tutorial. Mech. Syst. Signal Process. 205, 110796 (2023).
  61. Altmann, A., Toloşi, L., Sander, O. & Lengauer, T. Permutation importance: a corrected feature importance measure. Bioinformatics 26, 1340-1347 (2010).
  62. van den Hoogen, J. et al. Soil nematode abundance and functional group composition at a global scale. Nature 572, 194-198 (2019).
  63. Jennings, A. A. Analysis of worldwide regulatory guidance values for the most commonly regulated elemental surface soil contamination. J. Environ. Manag. 118, 72-95 (2013).
  64. Muckley, E. S., Saal, J. E., Meredig, B., Roper, C. S. & Martin, J. H. Interpretable models for extrapolation in scientific machine learning. Digit. Discov. 2, 1425-1435 (2023).
  65. Zhan, J. et al. Evaluating interpolation and extrapolation performance of neural retrieval models. In Proceedings of the 31st ACM International Conference on Information & Knowledge Management, 2486-2496 (ACM, New York, 2022).
  66. Haaf, D., Six, J. & Doetterl, S. Global patterns of geo-ecological controls on the response of soil respiration to warming. Nat. Clim. Change 11, 623-627 (2021).
  67. Liu, J., Zhang, X.-H., Tran, H., Wang, D.-Q. & Zhu, Y.-N. Heavy metal contamination and risk assessment in water, paddy soil, and rice
    around an electroplating plant. Environ. Sci. Pollut. Res. 18, 1623-1632 (2011).
  68. Tóth, G., Hermann, T., Szatmári, G. & Pásztor, L. Maps of heavy metals in the soils of the European Union and proposed priority areas for detailed assessment. Sci. Total Environ. 565, 1054-1062 (2016).
  69. Orgiazzi, A., Ballabio, C., Panagos, P., Jones, A. & Fernández-Ugalde, O. LUCAS soil, the largest expandable soil dataset for Europe: a review. Eur. J. Soil Sci. 69, 140-153 (2018).
  70. Hunter, J. D. Matplotlib: a 2D graphics environment. Comput. Sci. Eng. 9, 90-95 (2007).
  71. Virtanen, P. et al. SciPy 1.0: fundamental algorithms for scientific computing in Python. Nat. Methods 17, 261-272 (2020).
  72. Cordier, T. et al. Flexible and Systematic Uncertainty Estimation with Conformal Prediction via the MAPIE library, In Proceedings of the Twelfth Symposium on Conformal and Probabilistic Prediction with Applications 204, 549-581 (PMLR, Limassol, 2023).
  73. Qi, C. C. et al. Figshare https://figshare.com/s/fa76e3cb3e0e070 9df8d (2025).

Acknowledgements

This study was funded by the Innovative Research Groups of the National Natural Science Foundation of China (No. 52121004, L.Y.C.), National Natural Science Foundation of China (Nos. 22376221, C.C.Q. and 22494680, Z.L.), Natural Science Foundation of Hunan Province (No. 2024JJ2074, C.C.Q.), and Young Elite Scientists Sponsorship Program by CAST (No. 2023QNRC001, C.C.Q.). This work was also supported in part by the High Performance Computing Center of Central South University.

Author contributions

C.C.Q., Y.Z., L.Y.C., and Z.L. designed the project. C.C.Q., T.H., and M.T.W. constructed the modelling methodology and performed the modelling. F.H.M.T. and G.R.H. participated in dataset collection and discussion. M.L., B.T.Z., S.D., and Q.S.C. participated in results analysis and discussion. C.C.Q. and Z.L. wrote the initial draft of the manuscript, and all authors edited the manuscript.

Competing interests

The authors declare no competing interests.

Additional information

Supplementary information The online version contains supplementary material available at https://doi.org/10.1038/s41467-025-58026-8.
Correspondence and requests for materials should be addressed to Zhang Lin.
Peer review information Nature Communications thanks Michael Harbottle, Xuejun Wang and the other, anonymous, reviewer(s) for their contribution to the peer review of this work. A peer review file is available.
Reprints and permissions information is available at http://www.nature.com/reprints
Publisher’s note Springer Nature remains neutral with regard to jurisdictional claims in published maps and institutional affiliations.
Open Access This article is licensed under a Creative Commons Attribution-NonCommercial-NoDerivatives 4.0 International License, which permits any non-commercial use, sharing, distribution and reproduction in any medium or format, as long as you give appropriate credit to the original author(s) and the source, provide a link to the Creative Commons licence, and indicate if you modified the licensed material. You do not have permission under this licence to share adapted material derived from this article or parts of it. The images or other third party material in this article are included in the article’s Creative Commons licence, unless indicated otherwise in a credit line to the material. If material is not included in the article’s Creative Commons licence and your intended use is not permitted by statutory regulation or exceeds the permitted use, you will need to obtain permission directly from the copyright holder. To view a copy of this licence, visit http:// creativecommons.org/licenses/by-nc-nd/4.0/.
(c) The Author(s) 2025

  1. School of Metallurgy and Environment, Central South University, Changsha 410083, China. School of Resources and Safety Engineering, Central South University, Changsha 410083, China. School of Environmental Science and Engineering, Southern University of Science and Technology, Shenzhen 518000, China. Department of Civil Engineering, Monash University, Clayton 3800 Victoria, Australia. School of Physics and Electronics, Central South University, Changsha 410083 Hunan, China. Department of Civil, Materials, and Environmental Engineering, University of Illinois Chicago (UIC), Illinois 60607, USA.
    College of Chemical Engineering, Huaqiao University, Xiamen 361021, China. e-mail: zhang_lin@csu.edu.cn