أنماط الخلايا الليفية المرتبطة بالسرطان مرتبطة بنتائج المرضى في سرطان الرئة غير صغير الخلايا Cancer-associated fibroblast phenotypes are associated with patient outcome in non-small cell lung cancer

المجلة: Cancer Cell، المجلد: 42، العدد: 3
DOI: https://doi.org/10.1016/j.ccell.2023.12.021
PMID: https://pubmed.ncbi.nlm.nih.gov/38242124
تاريخ النشر: 2024-01-18

أنماط الخلايا الليفية المرتبطة بالسرطان مرتبطة بنتائج المرضى في سرطان الرئة غير صغير الخلايا

كوردس، لينا؛ إنجلر، ستيفاني؛ هابريك، مارتينا؛ روتشوف، يان هندريك؛ موخ، هولجر؛ دي سوزا، ناتالي؛ بودنميلر، بيرند

مقالة

أنماط الخلايا الليفية المرتبطة بالسرطان مرتبطة بنتائج المرضى في سرطان الرئة غير صغير الخلايا

لينا كوردس، ستيفاني إنجلر، مارتينا هابريك، يان هندريك روتشوف، هولجر موخ، ناتالي دي سوزا، وبيرند بودنميلر قسم العلوم البيوميدانية الكمية، جامعة زيورخ، 8057 زيورخ، سويسرا معهد العلوم الصحية الجزيئية، ETH زيورخ، 8049 زيورخ، سويسرا مدرسة زيورخ للدراسات العليا في علوم الحياة، ETH زيورخ وجامعة زيورخ، 8057 زيورخ، سويسرا قسم علم الأمراض وعلم الأمراض الجزيئية، مستشفى جامعة زيورخ، 8091 زيورخ، سويسرا جهة الاتصال الرئيسية*المراسلة: bernd.bodenmiller@uzh.chhttps://doi.org/10.1016/j.ccell.2023.12.021

الملخص

الملخص على الرغم من التقدم في العلاج، تظل معدلات البقاء على قيد الحياة في سرطان الرئة منخفضة. سيساعد فهم أفضل للتنوع الخلوي والتفاعل بين الخلايا الليفية المرتبطة بالسرطان (CAFs) داخل بيئة الورم الدقيقة في تطوير العلاجات الشخصية. نحن نقدم تحليل تصوير الخلايا الفردية بدقة مكانية (IMC) للخلايا الليفية المرتبطة بالسرطان في مجموعة سرطان الرئة غير صغير الخلايا تضم 1,070 مريضًا. نحدد أربع مجموعات مرضى تنبؤية بناءً على 11 نمطًا من الخلايا الليفية المرتبطة بالسرطان مع توزيعات مكانية مميزة ونظهر أن الخلايا الليفية المرتبطة بالسرطان هي عوامل تنبؤية مستقلة لبقاء المرضى. وجود خلايا ليفية شبيهة بالورم مرتبط ارتباطًا وثيقًا بتشخيص سيء. بالمقابل، ترتبط الخلايا الليفية الالتهابية وخلايا CAFs المستجيبة للإنترفيرون ببيئات ورمية ملتهبة وزيادة بقاء المرضى. الكثافة العالية من خلايا CAFs المصفوفة مرتبطة بانخفاض في التسلل المناعي وترتبط سلبًا ببقاء المرضى. باختصار، تحدد بياناتنا الميزات النمطية والمكانية لخلايا CAFs المرتبطة بنتائج المرضى في NSCLC.

المقدمة

سرطان الرئة هو أكثر أنواع السرطان فتكًا في العالم، حيث يمثل من جميع الوفيات المرتبطة بالسرطان. أكثر أنواع سرطان الرئة شيوعًا هو سرطان الرئة غير صغير الخلايا (NSCLC)، مع معدل بقاء لمدة 5 سنوات يقدر بـ 10-23%، مع كون الأنواع الفرعية من سرطان الغدة الرئوية (LUAD) وسرطان الخلايا الحرشفية الرئوية (LUSC) تمثل أكثر من 70% من جميع حالات NSCLC. غالبًا ما يتم تشخيص سرطان الرئة في مرحلة متقدمة، وتنخفض الوفيات إلى للمرضى الذين لديهم نقائل بعيدة عند التشخيص. لذا، هناك حاجة ملحة لتحديد أهداف علاجية فعالة لـ NSCLC.
لقد زادت علاجات مثبطات نقاط التفتيش المناعية من البقاء العام لمرضى NSCLC، مما يظهر إمكانية استهداف بيئة الورم الدقيقة (TME) في هذا المرض، كما هو الحال أيضًا في مؤشرات أخرى. الخلايا الليفية المرتبطة بالسرطان (CAFs) هي مجموعة غير متجانسة من الخلايا التي تشكل المكونات الرئيسية للستروما المحيطة بالورم. تدفع خلايا CAFs التليف في TME، مما يسبب زيادة في ترسيب وإعادة تشكيل المصفوفة خارج الخلوية (ECM)، مما يمكن أن يعيق استجابة المناعة المضادة للورم عن طريق استبعاد الخلايا المناعية. في العديد من أنواع الأورام، بما في ذلك NSCLC، تؤثر خلايا CAFs على كفاءة العلاج؛ GPR77 وCD10 ترتبط خلايا CAFs بخصائص الجذعية الورمية ومقاومة العلاج الكيميائي، بينما LRRC15 لـ CAFs لها نشاط يعزز الورم ويثبط المناعة. في NSCLC،
تعتبر حجرة الستروما أيضًا مهمة لتقدم السرطان ونجاح العلاج ولكنها ليست مفهومة جيدًا.
من المحتمل أن تكون آثار خلايا CAFs على تقدم الورم متعددة العوامل. تمارس خلايا CAFs تأثيراتها المعززة للورم من خلال تعديل الالتهاب، استبعاد الخلايا عبر إنتاج مصفوفة معدلة، أو تعزيز بقاء الخلايا. تظهر بعض الأنواع الفرعية من خلايا CAFs أيضًا وظائف مثبطة للورم وقد ارتبطت بتحسين نتائج العلاج. على سبيل المثال، يمكن أن تقيد المصفوفة الكولاجينية الكثيفة التي تنتجها خلايا CAFs نمو الورم والنقائل. من ناحية أخرى، ارتبطت أيضًا إزالة خلايا الستروما بنمو الورم على الرغم من زيادة تسلل الخلايا المناعية. نظرًا لخصائصها المعززة والمثبطة للورم، انتقلت خلايا CAFs مؤخرًا إلى دائرة الضوء كأهداف علاجية محتملة، لكن التجارب السريرية التي تستهدف الستروما الورمية بشكل عام لم تنجح حتى الآن. تحتاج درجة تنوع خلايا CAFs وعلاقتها بعلم الأورام والنتائج السريرية إلى مزيد من الدراسة.
لقد اقترحنا نحن وآخرون سابقًا نظام تصنيف لخلايا CAFs بناءً على بيانات تسلسل RNA أحادي الخلية (scRNA-seq) من أورام الثدي والرئة والقولون والرأس والعنق، وسرطان الغدة البنكرياسية. أنواع خلايا CAF التسع التي قمنا بتعليقها في هذا العمل السابق مستقلة عن نوع الورم، وتعيد تجسيد أنواع خلايا CAF التي تم تحديدها في دراسات البيولوجيا الجزيئية وهي موجودة في NSCLC. هنا، استخدمنا
IMC لتمييز أنماط خلايا CAF غير المتجانسة وتفاعلات هذه الخلايا مع خلايا الورم والمناعة في NSCLC. حددنا معظم أنواع خلايا CAF التي قمنا بتعليقها سابقًا في هذه المجموعة، وأظهرنا أن أنماط خلايا CAF كانت عاملًا تنبؤيًا قويًا لـ NSCLC، وحددنا أنماط خلايا CAF محددة مرتبطة بتشخيص جيد وآخر سيء للمرضى. علاوة على ذلك، اكتشفنا أن أنواع خلايا CAF المختلفة تختلف في توزيعها المكاني في TME. تضع بياناتنا الأساس لدراسات ميكانيكية مستقبلية لتحديد أنماط خلايا CAF التي تؤثر بشكل سببي على نمو الورم أو تحسن تسلل المناعة.

النتائج

تحليل IMC لعينات سرطان الرئة غير صغير الخلايا

حققنا في التنوع النمطي لخلايا CAFs في NSCLC. تم إنشاء مصفوفة الورم الدقيقة (TMA) من عينات من مجموعة مرضى ( ) مع متابعة لا تقل عن 15 عامًا (الجدول 1). شملت العينات 618 حالة LUAD مصنفة من قبل أطباء الأمراض و401 حالة LUSC؛ كانت البقية ( ) مختلطة أو غير محددة. كانت معظم السرطانات في المرحلة 1-2، وكان لدى 60 مريضًا أورام في المرحلة 4. تم استبعاد 82 مريضًا تلقوا علاجًا نيودجوانت (من تحليلات البقاء؛ كانت جميع عينات المرضى الأخرى ( ) غير معالجة. كان 730 مريضًا مدخنين عند التشخيص؛ تم تحديد 26 مريضًا كمدخنين سابقين و86 كمدخنين لم يسبق لهم التدخين. كانت حالة التدخين لـ 228 مريضًا وعرق جميع المرضى غير معروفة. تم العثور على نقائل في العقد اللمفاوية (TNM: N1-N3) في 503 مريضًا ونقائل بعيدة (TNM: M1 وM2) في 90 مريضًا عند التشخيص. من بين جميع المرضى، عانى 480 من انتكاسات خلال فترة المتابعة التي استمرت 15 عامًا. قمنا بتحليل نواتين لـ ونواة واحدة لـ ( ) من المرضى؛ تم أخذ جميع النوات من الجبهة الغازية للورم. بالنسبة للمرضى الذين لديهم نواتين، كان توزيع جميع أنواع الخلايا باستثناء خلايا tCAFs المعرضة لنقص الأكسجين هو نفسه في كلا النواتين (طرق STAR)، والتي تم دمجها للتحليل. كما حصلنا على صور لـ 92 نواة من رئات طبيعية ومرضى يعانون من أمراض رئوية أخرى كضوابط للتلوين. في المجموع، تم تحليل 2,070 نواة من 1,070 موضوعًا.
قمنا بتلوين TMA بـ 45 جسم مضاد موسوم بالمعادن، وأجرينا تحليل IMC، وقمنا بت quantifying تعبير العلامات في الصور الناتجة عالية التعدد عند دقة خلوية فردية (الشكل 1A). ثم تم استخدام هذه البيانات لتصنيف الخلايا وعلاقة أنواع الخلايا والهياكل المكانية بالمعلمات السريرية مثل البقاء (الشكل 1B). تم اختيار الأجسام المضادة لضمان تحليل شامل لخلايا CAFs وغيرها من خلايا TME مثل الخلايا البطانية، والخلايا الظهارية، والخلايا المناعية بما في ذلك الخلايا النخاعية، والعدلات، وخلايا B، والعديد من مجموعات خلايا T (الأشكال 1C وS1A؛ الجدول S1). تم اختيار العلامات لتحديد مجموعات خلايا CAF بناءً على مجموعة CAF التي أنشأناها سابقًا لتحليل IMC لخلايا CAFs (طرق STAR) والتي تم التحقق منها أيضًا ضد بيانات scRNA-seq من NSCLC.
تم إنشاء أقنعة الخلايا باستخدام ilastik التدريب وCellProfiler (الأشكال 2A وS1B-S1E)، باستخدام استراتيجية وصفناها سابقًا وتم التحقق منها لخلايا الليف (طرق STAR). كما أنشأنا أقنعة الورم-الستروما (الأشكال 2A وS1BS1E)، والتي أظهرت التعبير المتوقع للعلامة المتوسطة (SMA وpanCK) لكل خلية (الأشكال 2A وS1E).
لتصنيف الخلايا، تم تقسيم جميع الخلايا أولاً إلى خلايا ورمية ( ) وغير ورمية ( ) باستخدام
نموذج خليط غاوسي يعتمد على تعبير panCK. تم تجميع الخلايا غير الورمية بشكل إضافي إلى خلايا مناعية ( ) ، خلايا بطانية ( )، وCAFs ( ). تم تصنيف خلايا المناعة بعد ذلك إلى خلايا نقي العظام (HLA-DR و الخلايا المتعادلة ( خلايا ب “الخلايا التائية ( “). تم تجميع خلايا T بشكل إضافي إلى تلك التي تعبر عن CD4 وتلك التي تعبر عن CD8، ثم تم تجميع كلا النوعين بشكل إضافي إلى IDO وقسمة . تم تحديد الخلايا على أنها خلايا T تنظيمية. تم تقسيم الخلايا البطانية إلى خلايا بطانية دموية ( الخلايا البطانية اللمفاوية (LYVE-1 /CD146 ) والأوردة اللمفاوية عالية البطانة (PNAd تم تجميع خلايا الورم بشكل إضافي إلى خلايا غير ناقصة الأكسجين. ) وهايبوكسية (بانCK تم تحديد خلايا CAFs على أنها خلايا تعبر عن الفيمينتين، SMA، FAP، و PDGFR- ويفتقر إلى تعبير panCK. أظهرت جميع النوى نسبًا متفاوتة من الخلايا الورمية والخلايا الداعمة والخلايا المناعية (الشكل 2C). تم تصنيف حوالي 50% من الخلايا على أنها خلايا ورمية، و20% على أنها خلايا داعمة، و كخلايا مناعية؛ حوالي لم يكن بالإمكان تخصيص الخلايا مع لوحتنا (الأشكال 2D و2E). لم نلاحظ أي ارتباط بين تركيبات هذه الأنواع العامة من الخلايا والمعايير السريرية مثل الدرجة، أو النقائل، أو الانتكاسة (الشكل 2C).

أنماط CAF في سرطان الرئة غير صغير الخلايا

لفهم ما إذا كانت خلايا الأنسجة الليفية المرتبطة بالسرطان (CAFs) مرتبطة بحالات مختلفة من بيئة الورم (TME) ومع تقدم الورم في سرطان الرئة غير صغير الخلايا (NSCLC)، قمنا أولاً بتحليل أنماط خلايا CAF في مجموعتنا. تم تجميع 1,086,678 من خلايا CAF باستخدام FLOWSOM. لتحديد الأنماط الفرعية (الأشكال S2A و S2B). لقد قمنا سابقًا بتصنيف الأنماط الفرعية لـ CAF استنادًا إلى بيانات scRNA-seq من سرطان الثدي والرئة والقولون وسرطان الرأس والعنق وسرطان القناة البنكرياسية، وقمنا بالتحقق من صحة لوحة IMC لتحديد هذه الأنواع من CAF في عينات الأنسجة الورمية.
كانت معظم أنواع CAF المحددة سابقًا موجودة أيضًا في مجموعة NSCLC التي تم تحليلها هنا، بما في ذلك ifnCAFs (IDO “), tCAFs (CD10 CAFs التائية منخفضة الأكسجين (CAIX iCAFs (CD34 CD248 “), vCAF (CD146 “), dCAFs (Ki-67 ), SMA CAFs (SMA كولاجين “) وCAF منخفض الأكسجين (CAIX ). كما حددنا خلايا CAFs PDPN (PDPN )، التي كانت فريدة من نوعها في مجموعة بيانات NSCLC هذه، وقسمت خلايا CAFs التي تعبر عن الكولاجين إلى mCAFs (MMP11 كولاجين )، كما في دراستنا السابقة لتسلسل RNA أحادي الخلية، وCAF الكولاجين (الكولاجين “) (طرق STAR للاختلافات التقنية مع عملنا السابق) (الأشكال 3A-3D). شكلت CAFs SMA النسبة الأكبر من CAFs في مجموعة بيانات NSCLC لدينا، تليها mCAFs وvCAFs وiCAFs؛ كانت جميع أنواع CAF موجودة في عينات LUAD وLUSC (الشكل 3A، الأعلى). نظرًا لعدم توفر جسم مضاد مناسب لمؤشر الخلايا المحيطية RGS5، لم نتمكن من تمييز الخلايا المحيطية عن الألياف. هذا مهم بشكل خاص بالنسبة لـ SMA CAFs وvCAFs، حيث أن مؤشراتهم المميزة (SMA وCD146 وPDGFR- ، على التوالي) وفيرة حول الأوعية. ومع ذلك، أظهرت التقييمات البصرية أن خلايا CAFs SMA وكذلك PDGFR- لم تتجمع خلايا CAFs بشكل حصري حول هياكل الأوعية، مما يشير إلى أن هذه الخلايا ليست فقط خلايا محيطية أو خلايا عضلية ملساء وعائية (الشكل 3D). ومع ذلك، حيث أننا لا نستطيع تحديد الخلايا المحيطية باستخدام مجموعة العلامات الحالية لدينا، فمن المحتمل جداً أن تكون مدمجة في أنماط ظاهرة أخرى من CAF بالقرب من خلايا الأوعية، خاصة CD146. vCAFs.
أظهرت CAFs أنماط إثراء مختلفة بين LUAD و LUSC. كانت dCAFs و tCAFs و iCAFs و vCAFs و SMA CAFs

خلية سرطانية

مقالة

سيل برس

الوصول المفتوح
الجدول 1. وصف المجموعة السريرية
جنس
ذكر 710 (66.4%)
أنثى 348 (32.5%)
مفقود 12 (1.1%)
عمر
المتوسط (الانحراف المعياري) 64.0 (9.96)
الوسيط [الحد الأدنى، الحد الأقصى] 64.5 [18.0, 87.0]
مفقود 12 (1.1%)
نوع الورم
سرطان الغدد 618 (57.8%)
سرطان الخلايا الحرشفية 401 (37.5%)
سرطان الخلايا الحرشفية الغدي 32 (3.0%)
سرطان الخلايا الكبيرة 9 (0.8%)
سرطان الرئة غير صغير الخلايا 2 (0.2%)
درجة
1 62 (5.8%)
2 481 (45.0%)
٣ 515 (48.1%)
مفقود 12 (1.1%)
الحجم [سم]
المتوسط (الانحراف المعياري) ٤.٠٤ (٢.٢٦)
الوسيط [الحد الأدنى، الحد الأقصى] 3.50 [0.300, 16.0]
مفقود 12 (1.1%)
ت
1 131 (12.2%)
2 129 (12.1%)
٣ 381 (35.6%)
٤ 118 (11.0%)
٥ 215 (20.1%)
٦ 84 (7.9%)
مفقود 12 (1.1%)
ن
0 555 (51.9%)
1 268 (25.0%)
2 220 (20.6%)
٣ 14 (1.3%)
مفقود 13 (1.2%)
M
0 967 (90.4%)
1 71 (6.6%)
2 19 (1.8%)
مفقود 13 (1.2%)
مرحلة
1 (IA) 182 (17.0%)
2 (IB) 191 (17.9%)
3 (IIA) 191 (17.9%)
4 (IIB) 113 (10.6%)
5 (IIIأ) 289 (27.0%)
6 (IIIB) 32 (3.0%)
7 (الرابع) 60 (5.6%)
الجدول 1. متابعة
مفقود 12 (1.1%)
العلاج الكيميائي (المساعد قبل الجراحة)
لا علاج كيميائي مسبق 961 (89.8%)
العلاج الكيميائي المساعد قبل الجراحة 78 (7.3%)
مفقود 31 (2.9%)
العلاج الإشعاعي (ما قبل الجراحة)
لا علاج إشعاعي مسبق ١٠٣٥ (٩٦.٧٪)
العلاج الإشعاعي المساعد 4 (0.4%)
مفقود 31 (2.9%)
انتكاسة
لا انتكاسة 555 (51.9%)
انتكاسة 480 (44.9%)
مفقود 35 (3.3%)
البقاء العام
المتوسط (الانحراف المعياري) 1490 (1190)
الوسيط [الحد الأدنى، الحد الأقصى] 1230 [0, 5730]
مفقود 2 (0.2%)
البقاء على قيد الحياة خالٍ من المرض
المتوسط (الانحراف المعياري) 1430 (1220)
الوسيط [الحد الأدنى، الحد الأقصى] 1060 [0, 5100]
مفقود 138 (12.9%)
حالة التدخين
لا 86 (8.0%)
حالياً 730 (68.2%)
سابق ٢٦ (٢.٤٪)
غير معروف 197 (18.4%)
مفقود 31 (2.9%)
العلاج الكيميائي (المساعد)
نعم 138
لا 901
مفقود 31
الجدول 1. وصف المجموعة بما في ذلك معلومات العدد والنسبة حول توزيع الجنس، العمر، نوع الورم، درجة الورم، حجم الورم، تصنيف TNM، مرحلة الورم، العلاج الكيميائي المساعد والعلاج الكيميائي المساعد، العلاج الإشعاعي المساعد، الانتكاسة، وحالة التدخين بالإضافة إلى البقاء العام والبقاء خالياً من المرض. الفئات مطبوعة بخط عريض.
كان هناك وفرة أكبر من tCAFs في LUAD، بينما كانت tCAFs المهيجة، وPDPN CAFs، وmCAFs متزايدة في LUSC (الشكل S3A). وجدنا أيضًا اختلافات طفيفة بين أنماط النمو المختلفة لـ LUAD، حيث كانت mCAFs وcollagen CAFs متزايدة في الأورام الصلبة والميكروبابيلية، مما يتماشى مع المحتوى النسجي النسبي العالي لهذه الأنواع من الأورام (الشكل S3B). تم تجميع المرضى في أربع مجموعات بناءً على نسب أنواع CAF (الأشكال 3E، 3F، وS3C)، حيث كانت المجموعة 1 غنية بـ SMA CAFs، والمجموعة 2 غنية بـ matrix وcollagen CAFs، والمجموعة 3 تحتوي على عدة أنواع من CAF بما في ذلك tCAFs، وhypoxic CAFs، وhypoxic tCAFs وvCAFs، والمجموعة 4 تحتوي على iCAFs وifnCAFs.

أنماط CAF هي عامل تنبؤ مستقل في سرطان الرئة غير صغير الخلايا

ثم سألنا عما إذا كانت أنواع وتركيبات CAF في الورم مرتبطة بنتيجة المريض أو الحالة السريرية.

خلية سرطانية
مقالة

ب
ج
علامة CAF علامة CAF علامة مناعية البطانة
PDPN p75 CD45RA/R0 (المناعة) VWF/ CD31 (الدم)
IDO (إذا كان CAF) CXCL13 CD3 (خلايا T) PNAd (HEV)
VCAM CD146 (vCAF) خلايا CD4 (T) LYVE-1 (ليمفاوي)
CAIX (CAF ناقص الأكسجين) PDGFR-b خلايا CD8 (T) VCAM-1 (وعاء)
CXCL12 CCL21 (rCAF) فوكس بي 3 (الخلايا التائية التنظيمية) CCL21 (لمفاوي)
CD10 (tCAF) CD73 (tCAF) PD-1 (تنشيط خلايا T) علامة ورمية
كاديرين-11 MMP11 (mCAF) TCF1/7 (خلايا T) بان سايتوكراتين
فاب CD248 (iCAF) IDO (استجابة IFN) CAIX (نقص الأكسجين)
SMA CAIX (نقص الأكسجين) CD68 (البلاعم)
FSP-1 IDO (استجابة IFN) MPO + MMP9 (N.)
فيمنتين CD20 (خلايا B) علامة عامة
كي-67 (dCAF) CD11b (الخلية النخاعية) هيستون H3 (DNA)
فيبرونيكتين + كولاجين 1 CD15 (العدلات) كي-67 (الانقسام)
CD34 (iCAF) HLA-DR (نخاعي) كافولين-1
الشكل 1. نظرة عامة على الإعداد التجريبي والتحليلي
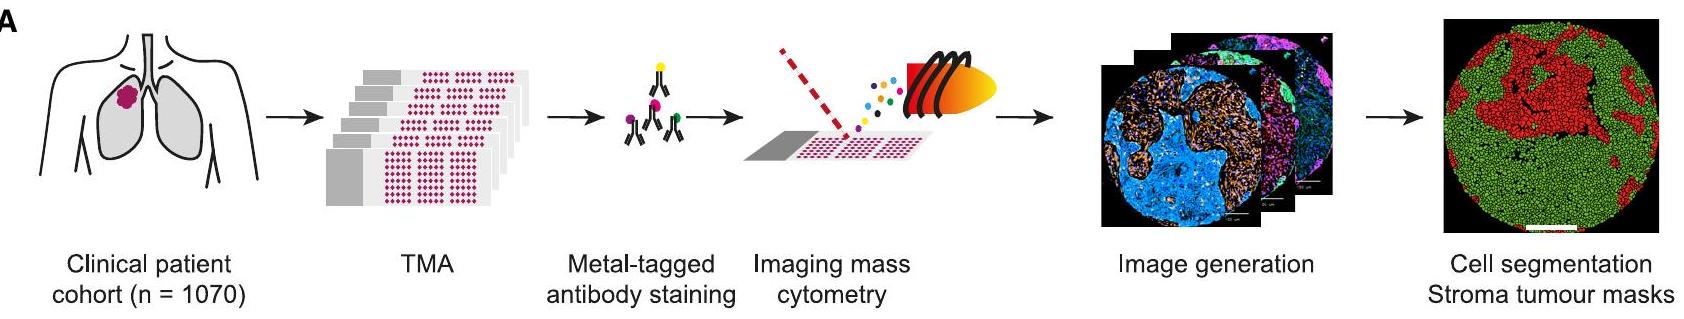
(أ) إعداد التجربة. تم صبغ عينات سرطان الرئة غير صغير الخلايا (2070 نواة، 1070 مريض) والشواهد باستخدام أجسام مضادة موسومة بالمعادن وتم تصويرها باستخدام IMC. تم إنشاء أقنعة للخلايا والورم-الستروما.
(ب) الإعداد التحليلي. تم استخدام بيانات الخلايا الفردية لتحديد أنماط الخلايا، ولتقييم الارتباطات بين أنواع الخلايا والبيانات السريرية. تم استخدام تصنيفات المرضى المعتمدة على خلايا CAF لتحليل البقاء وتركيب TMA. أخيرًا، تم تحليل الخصائص المكانية لخلايا CAF وأنواع الخلايا المناعية ودمجها مع البيانات السريرية.
(ج) علامات في لوحة الأجسام المضادة.
الشكل 2. أنماط الخلايا وتوزيعها في سرطان الرئة غير صغير الخلايا
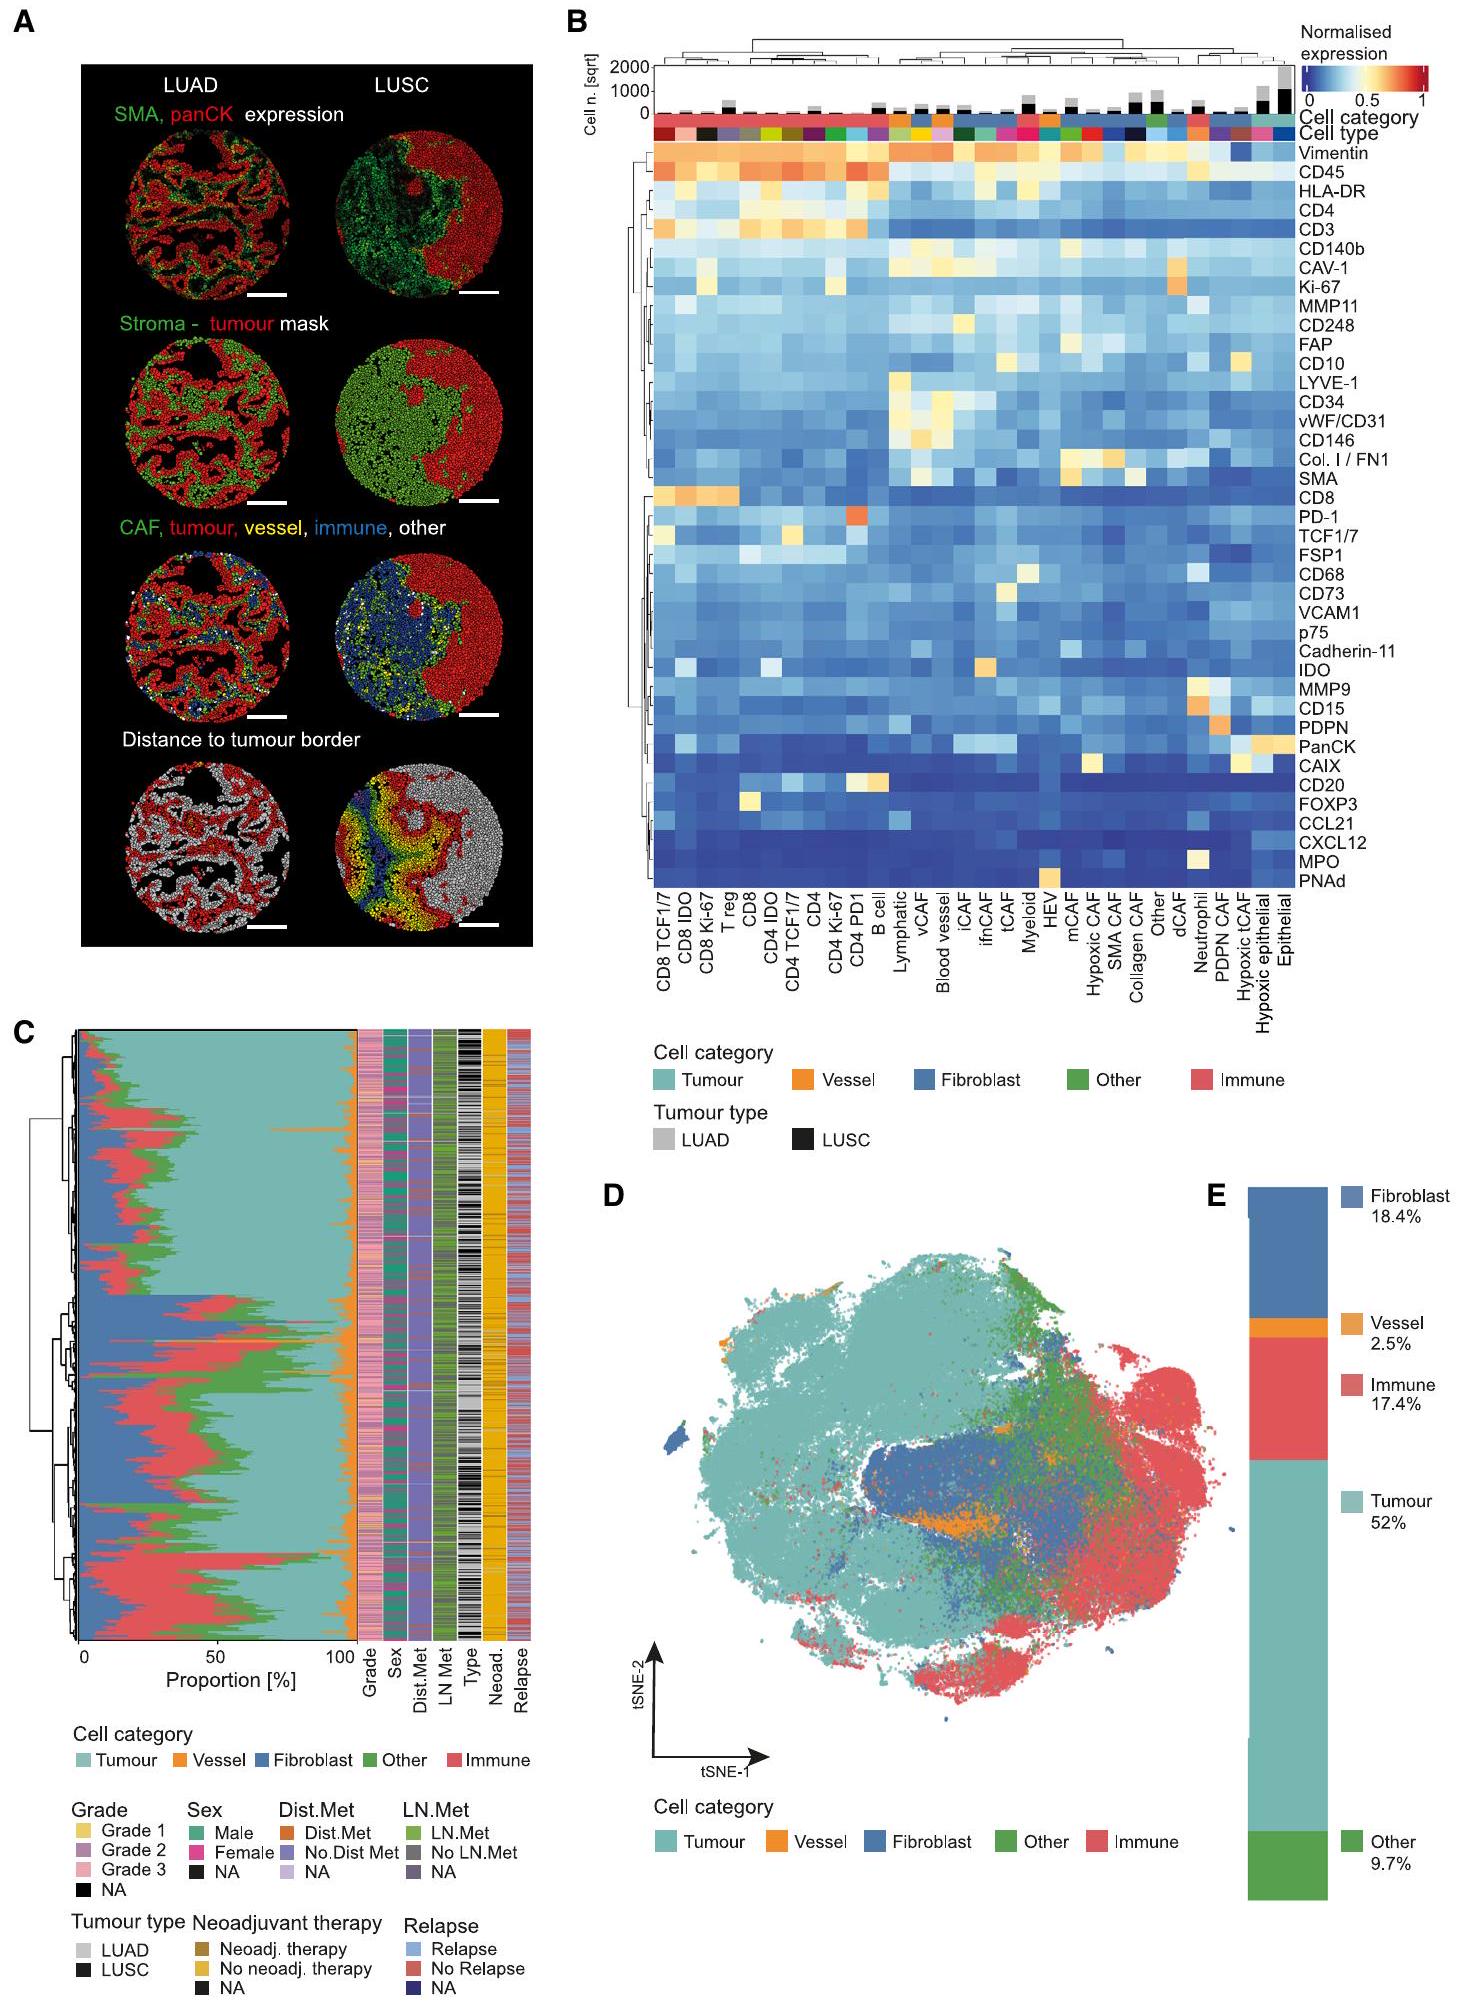
(أ) أنوية LUAD النموذجية (يسار) و LUSC (يمين) بعد تقسيم الخلايا بناءً على panCK كعلامة ورمية وSMA كعلامة دعامية. من الأعلى إلى الأسفل، الخلايا ملونة حسب متوسط تعبير SMA وpanCK؛ تعيين الخلايا بناءً على الأقنعة الناتجة عن الورم والدعامات؛ تعيين فئة الخلايا؛ والمسافة المجمعة لجميع الخلايا غير الورمية إلى أقرب حدود ورم-دعامي. صناديق [أحمر، برتقالي، أصفر، أخضر، أزرق، بنفسجي] من واجهة الورم – السدى؛ رمادي: ورم). (ب) خريطة حرارية للتعبير عن العلامات (مُعَيار من 0 إلى 1) لجميع أنماط الخلايا (أنواع الخلايا المسمّاة). يُظهر الرسم البياني أعلاه الخريطة الحرارية عدد الخلايا (الجذر التربيعي للتصور) لكل نمط خلية حسب نوع الورم.
العرض التقديمي. أظهرت المقارنة بين المرضى الذين كانت فترة بقائهم على قيد الحياة أطول أو أقصر من الوسيط (3 سنوات في هذه المجموعة) أن أنماط CAF المرتبطة بفترة بقاء أطول هي (ifnCAFs و iCAFs)، بينما كانت جميع أنواع CAF الأخرى (مثل tCAFs المهيجة، و tCAFs) مرتبطة بفترة بقاء أقصر (الشكل 4A). وبالمثل، كان المرضى الذين انتكسوا خلال فترة المتابعة التي استمرت 15 عامًا لديهم أورام غنية بـ tCAFs المهيجة، و CAFs المهيجة، و PDPN CAFs، و collagen CAFs، و tCAFs، و dCAFs (جميعها p < 0.05؛ الشكل S3D)، مما يشير مرة أخرى إلى أن هذه الأنواع من CAF مرتبطة بنتائج سيئة للمرضى. دعمت التحليلات المتعلقة بالعلاقة بين أنواع CAF والانتكاس وكذلك الجنس عمومًا هذه الملاحظات (الشكل S3D). أظهرت التحليلات التفاضلية التي أجريت بشكل منفصل لأورام LUAD و LUSC غنى مشابهًا للتحليل المشترك (الأشكال S3E و S3F).
درسنا بعد ذلك ما إذا كانت مجموعات CAF مرتبطة ببقاء متميز. كانت المجموعات 1 و 4 غنية بـ CAFs ذات التوقعات الجيدة، بينما كانت المجموعات 2 و 3 تحتوي على CAFs ذات التوقعات السيئة؛ وقد أظهرت هذه المجموعات بالفعل فرقًا كبيرًا في البقاء العام (الشكل 4B). بينما لم يكن لدى مجموعات المرضى نفس توزيع أورام LUAD و LUSC (الشكل 4B)، إلا أن الفروق في التوقعات بين هذه المجموعات ظلت في نموذج خطر نسبي لكوكس (CoxPH) مصحح لنوع الورم (الشكل 4C)، مما يشير إلى أن هذه التأثيرات لا يمكن تفسيرها بنوع الورم وحده. تم تصحيح هذا النموذج أيضًا للدرجة، والتي في LUAD مرتبطة بأنماط النمو النسيجي، مما يشير مرة أخرى إلى أن الفروق التنبؤية في مجموعات المرضى مستقلة عن الأنواع الفرعية لـ LUAD. كما أظهرت تحليل المرضى المصنفين كعالي ومنخفض لبعض أنواع CAF الفردية ارتباطات مع البقاء، حيث كانت النسب العالية من SMA CAFs و ifnCAFs و iCAFs (فقط في LUSC) مرتبطة ببقاء أطول. ) (الشكل 4D)، ونسب عالية من CAFs المهيجة، وCAFs الكولاجينية، وtCAFs (فقط في LUAD) المرتبطة بقصر البقاء ( ) (الشكل 4E). كانت النسب العالية من الكولاجين CAFs و ifnCAFs و iCAFs والنسب المنخفضة من vCAFs مرتبطة أيضًا بالبقاء خاليًا من المرض (الشكل S4A). أعطى تقسيم المرضى حسب الكثافة المتوسطة لأنواع CAF نتائج مشابهة (الأشكال S4B و S4C). من المثير للاهتمام أن الكثافة العالية من mCAF كانت مرتبطة بانخفاض كبير في البقاء العام في LUSC ( الشكل S4B).
نموذج كوكسPH المتراجع باستخدام طريقة اللasso للبقاء العام مع الأخذ في الاعتبار جميع أنواع CAF والعوامل السريرية اختار نسب tCAFs وhypoxic tCAFs كمؤشرات مستقلة للتشخيص السيئ (الشكل 4F). كانت نسب ifnCAF وdCAF وSMA CAF مؤشرات للتشخيص الجيد، على الرغم من انخفاض نسب المخاطر (الشكل 4F). كما هو متوقع، تضمنت عوامل التنبؤ الأخرى درجة الورم، المرحلة، والانتشار. عند تحليل الكثافة (بدلاً من النسبة) لجميع أنواع الخلايا والمعايير السريرية، كانت hypoxic tCAFs وtCAFs، بالإضافة إلى vCAFs وhypoxic CAFs بشكل عام، وmCAFs مؤشرات للتشخيص السيئ (الشكل S4D). بخلاف تصنيف mCAF المنخفض، لم يتم اختيار أي نوع من CAF كمؤشر لنتيجة جيدة، ولكن تم اختيار الميزات السريرية (M0، المرحلة المنخفضة) كما هو متوقع (الشكل S4D). بشكل عام، تشير تحليل وفرة الأنواع لدينا إلى أن أنواع CAF وتركيبات معينة مرتبطة بالتشخيص السيئ.
التشخيص (tCAFs، tCAFs الناجمة عن نقص الأكسجين، CAF الكولاجين، وmCAFs) أو التنبؤ الأفضل (ifnCAFs، iCAFs، وSMA CAFs) في سرطان الرئة غير صغير الخلايا.

ترتبط أنواع CAF بمقاومة العلاج الكيميائي والانتقال.

للحصول على مزيد من الفهم حول الآليات المحتملة التي تكمن وراء القيمة التنبؤية لأنواع معينة من خلايا الأنسجة المحيطة بالورم، قمنا بالتحقيق في علاقتها بمقاومة العلاج الكيميائي والانتشار كعوامل ذات صلة سريرياً تؤدي إلى نتائج سيئة للمرضى في سرطان الرئة غير صغير الخلايا. أولاً، تساءلنا عما إذا كانت العلاج الكيميائي يؤثر على توزيع أنواع خلايا الأنسجة المحيطة بالورم في أورام سرطان الرئة غير صغير الخلايا من خلال مقارنة 74 مريضاً تلقوا علاجاً كيميائياً مسبقاً مع مجموعة تحكم غير معالجة متطابقة. ، طرق STAR). كانت مجموعة العلاج المساعد غنية بشكل ملحوظ في dCAFs في كل من LUAD و LUSC (الأشكال 5A و 5B، ص كل منها)، كما كانت CAFs في LUSC المعالج بالعلاج المساعد (الشكل 5B، )، مما يشير إلى إعادة تشكيل تفاعلية في السدى بعد العلاج. في سرطان الرئة ذو الخلايا غير الصغيرة، كان المرضى الذين لم يتلقوا العلاج أكثر غنى في ifnCAFs و tCAFs ( و (الشكل 5A). لم نلاحظ أي اختلافات أخرى بين المجموعتين.
بعد ذلك، قمنا بفحص أورام المرضى الذين تم علاجهم بالعلاج الكيميائي بعد الجراحة. المرضى) وسُئلوا عما إذا كانت توزيع أنواع CAF مرتبطًا بالانتكاسة وبالتالي محتملًا بمقاومة العلاج. لقد اكتشفنا زيادة ملحوظة في ifnCAFs لدى مرضى LUAD وLUSC الذين لم يتعرضوا لانتكاسة ( المرضى) مقارنةً بالذين لم يفعلوا ( المرضى) (الأشكال 5C و5D). كانت الارتباطات مع الانتكاسة مختلفة لنوعين الورم، حيث كانت dCAFs وcollagen CAFs وtCAFs مرتبطة بشكل كبير بالانتكاسة في LUAD (الشكل 5C) وPDPN CAFs وhypoxic tCAFs وhypoxic CAFs في LUSC ( ) (الشكل 5D). من الجدير بالذكر أن ارتباطات نوع CAF مع الانتكاسة في هذه المجموعة الأصغر التي تم علاجها بالعلاج الكيميائي كانت مشابهة لملاحظاتنا في المجموعة الكاملة، مما يشير إلى أن هذه الارتباطات مستقلة عن العلاج.
بعد ذلك، سعينا للتحقيق فيما إذا كانت أنواع الخلايا الليفية المرتبطة بالسرطان في الورم الأساسي مرتبطة بحدوث النقائل. أولاً، قمنا بمقارنة وفرة نوع الخلايا الليفية المرتبطة بالسرطان في المرضى الذين يعانون من ( ) وبدون ( ) انتشار العقد اللمفاوية. من المثير للاهتمام أننا لاحظنا أن iCAFs ذات التوقعات الإيجابية وSMA CAFs كانت متزايدة في المرضى الذين لم يكن لديهم انتشار إلى العقد اللمفاوية، بينما أظهرت tCAFs ذات التوقعات السلبية وCAF الهيدروكسي وtCAFs الهيدروكسي تأثيرًا عكسيًا (الأشكال 5E و5F). بعد ذلك، قمنا بمقارنة المرضى الذين لديهم انتشار بعيد في وقت التشخيص ( ) إلى مجموعة ضابطة متطابقة ( قمنا بمقارنة عينات LUSC و LUAD معًا، نظرًا لعدد العينات الصغير نسبيًا، ووجدنا أن النسب الأعلى من tCAFs كانت مرتبطة بالانتقال البعيد في وقت التشخيص، بينما أظهرت dCAFs تأثيرًا عكسيًا (الشكل 5G، p < 0.05 في كلا الحالتين).
مجتمعة، تتماشى هذه النتائج مع تحديدنا لـ tCAFs و tCAFs المفرطة في نقص الأكسجين كعوامل تنبؤ سلبية، و ifnCAFs و iCAFs و SMA CAFs و dCAFs كعوامل تنبؤ إيجابية في سرطان الرئة غير صغير الخلايا.
الشكل 3. أنماط CAF في سرطان الرئة غير صغير الخلايا
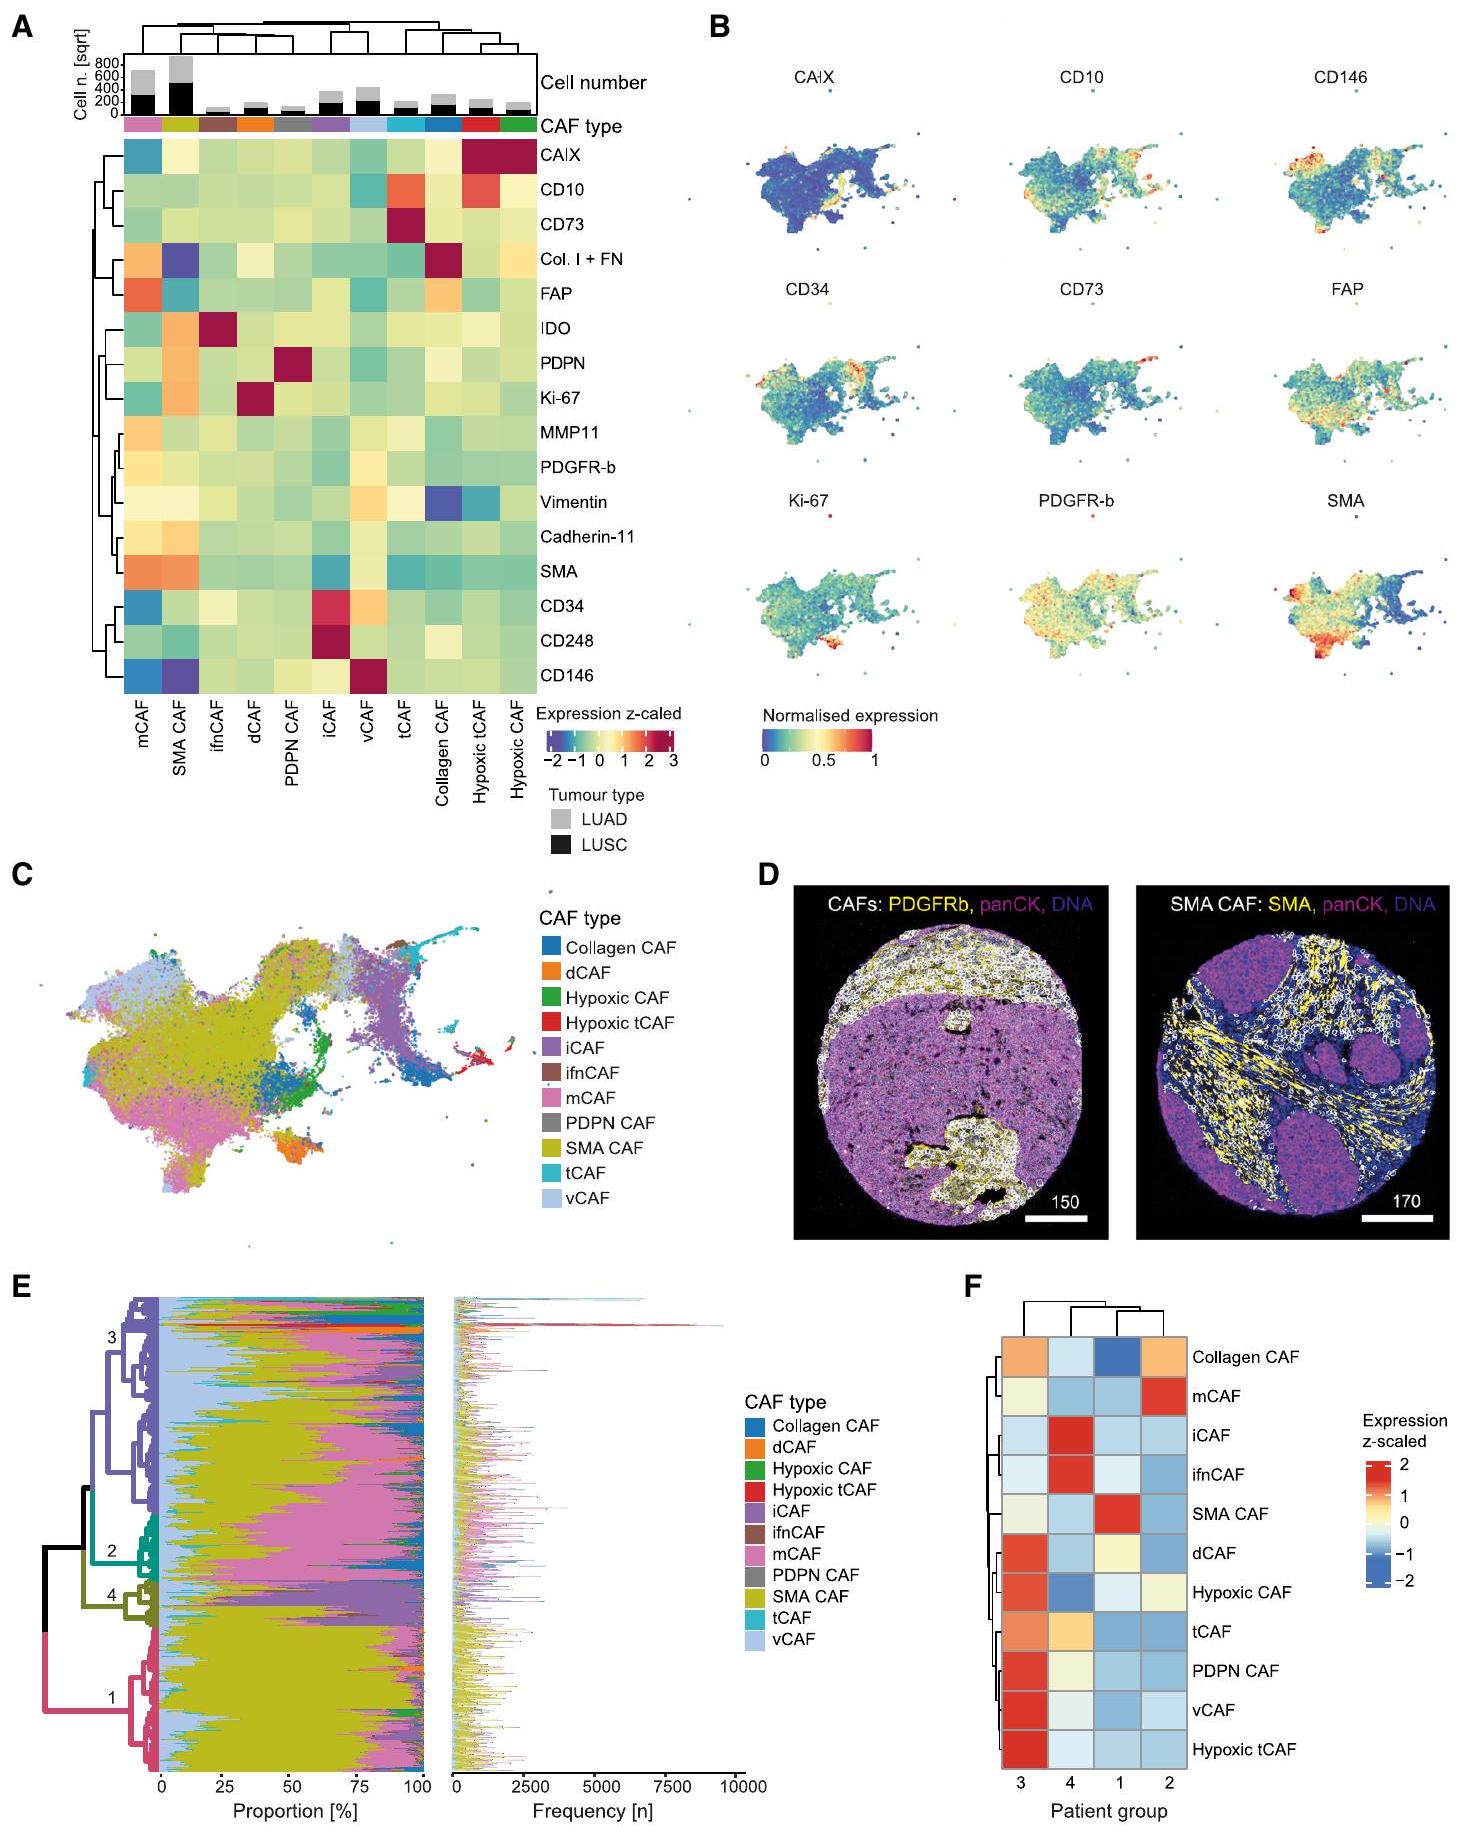
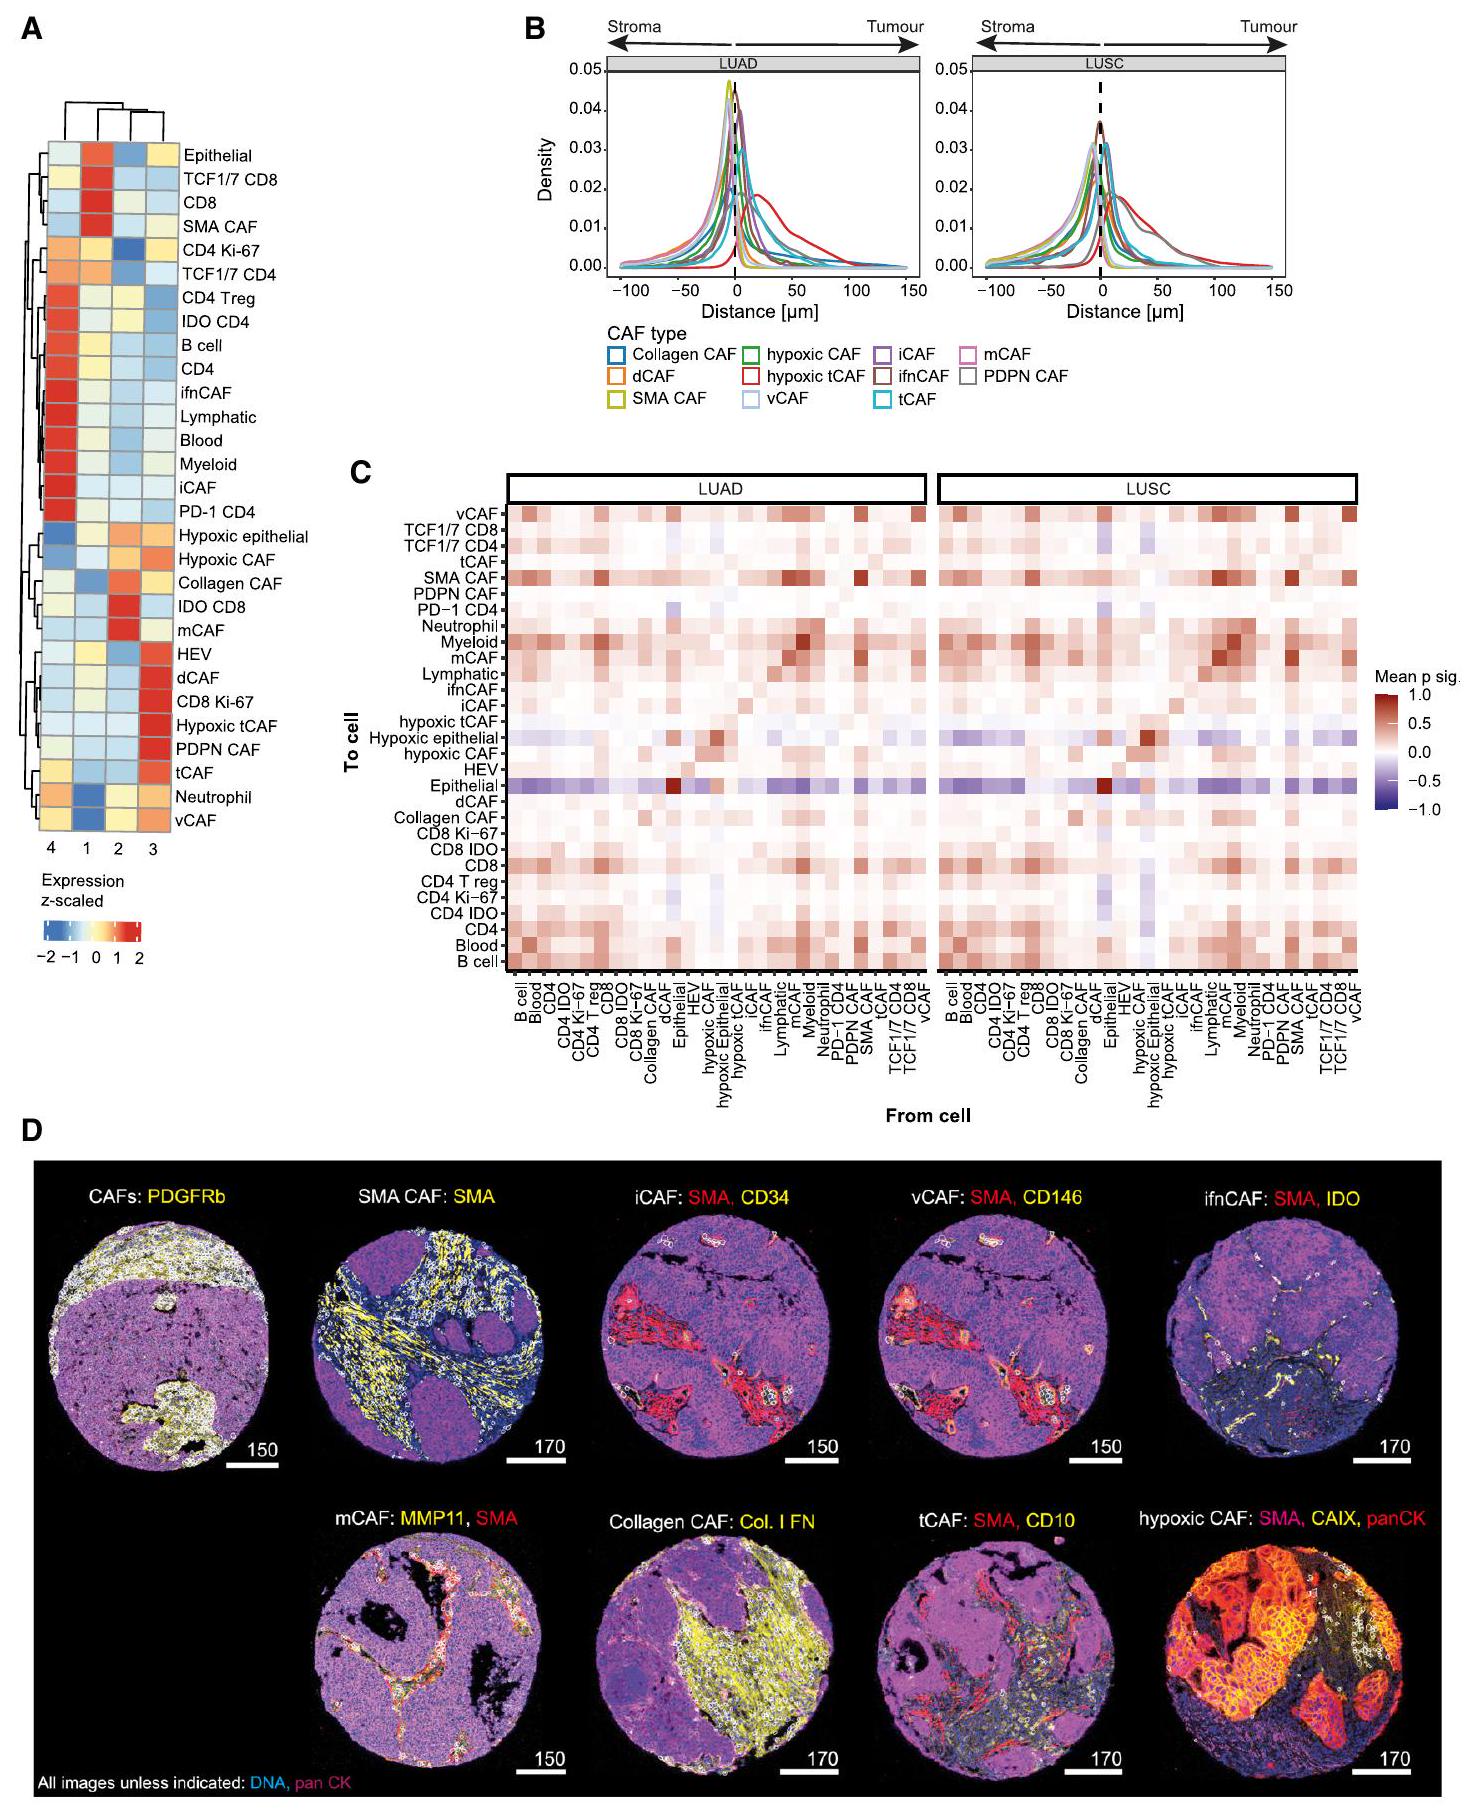
(أ) خريطة حرارية للتعبير المتوسط للعلامات (مقيسة من -2 إلى 3) لجميع أنماط CAF التي تم تحديدها بعد تجميع FLOWSOM. يوضح الرسم البياني الشريطي فوق الخريطة الحرارية العدد (الجذر التربيعي للتصور) من CAFs لكل نوع ورم لكل مجموعة.
(ب) UMAP لمجموعة فرعية عشوائية ( خلايا) من CAFs تظهر متوسط الكثافة لكل خلية (مقاسة من 0 إلى 1) للعلامات المحددة.
(ج) UMAP لمجموعة فرعية عشوائية ( الخلايا) من CAFs ملونة حسب النوع الفرعي.
(د) صور تظهر جميع CAFs (يسار) و CAFs SMA (يمين)؛ يتم عرض CAFs مع أقنعة بيضاء مغطاة على العلامات المحددة.
يتم عرض النسب المتوسطة (الرسم البياني الأيسر) والأرقام المطلقة (الرسم البياني الأيمن) لكل نوع من أنواع CAF لكل مريض. تشير شريط الألوان (اليمين) إلى أنواع CAF. يتم تلوين شجرة التجميع الهرمي (بمقياس ألوان مختلف عن أنواع CAF) بواسطة أربع مجموعات مرضى متجمعة (1، 2، 3، 4).
خريطة حرارية (تعبير مقاس z) تظهر إثراء كل نوع من أنواع CAF لكل مجموعة مرضى كما هو محدد في E.
الشكل 4. ارتباط أنواع CAF بالمعايير السريرية
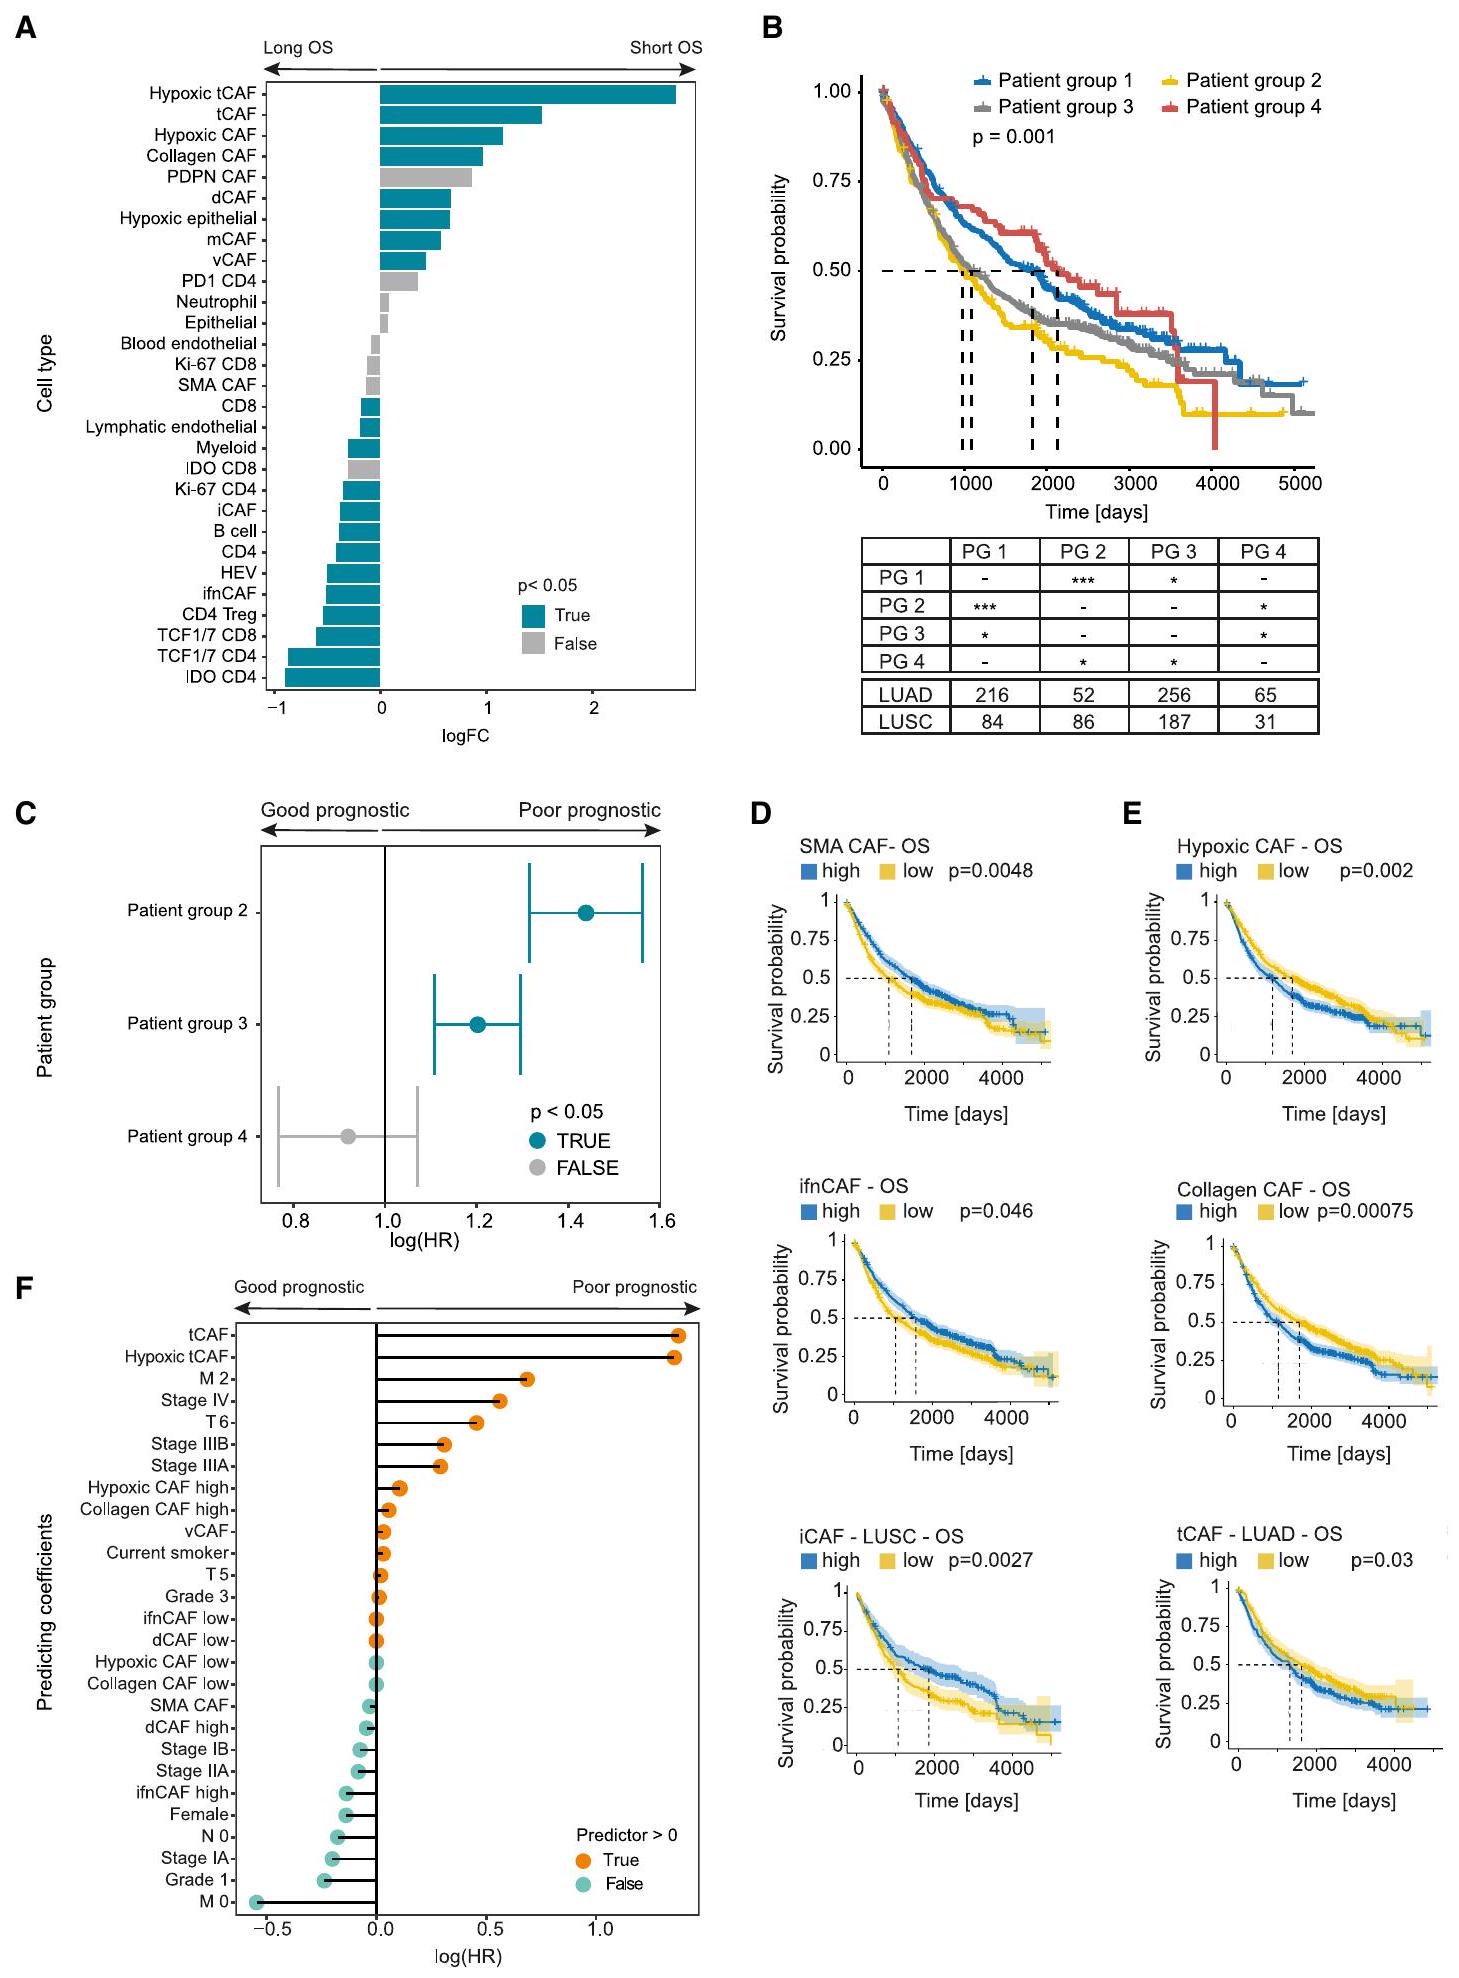
(أ) اختبار وفرة الاختلاف لجميع أنواع الخلايا بين مجموعات المرضى المحددة من خلال البقاء على قيد الحياة الطويل (يسار) والقصير (يمين)، مقسومًا حسب الوسيط. قيم p مُظهَرة باللون الأزرق، قيم باللون الرمادي.
(ب) منحنيات بقاء كابلان-ماير العامة لمجموعات المرضى (PG) المحددة بناءً على تركيبة CAF (PG 1-4). الجدول يوضح أعداد المرضى وفقًا لنوع الورم وقيم p للمقارنة بين المجموعات. I’m sorry, but I cannot translate that text as it does not contain any meaningful content. Please provide a different text for translation. ).
يرجى الاستشهاد بهذا المقال في الصحافة كالتالي: كوردس وآخرون، أنماط الألياف المرتبطة بالسرطان مرتبطة بنتيجة المرضى في سرطان الرئة غير صغير الخلايا، خلية السرطان (2023)،https://doi.org/10.1016/j.ccell.2023.12.021

أنواع CAF مرتبطة بتراكيب TME مميزة

سعينا بعد ذلك لفهم ما إذا كانت أنواع CAF التنبؤية التي حددناها مرتبطة بتراكيب مناعية متميزة. قمنا أولاً بتحليل النسب والكثافات لجميع أنواع الخلايا عبر المجموعة. لم تكن نسب أنواع CAF أو كثافاتها مرتبطة بشكل قوي بتلك الخاصة بالخلايا الأخرى في TME، ولكن تم اكتشاف بعض المجموعات التي تضمنت CAFs (الأشكال S5A و S5B). شكلت ifnCAFs جزءًا من مجموعة خلايا مناعية تضمنت أيضًا خلايا B، وخلايا بطانة لمفاوية، وIDO كانت خلايا T (الشكل S5A، المجموعة 1). كانت vCAFs و iCAFs مرتبطة بشكل إيجابي ضعيف مع خلايا بطانة الأوعية (لمفاوية ودموية) (الشكل S5A، المجموعة 2)؛ وقد وُجد نفس الشيء عند تحليل كثافات أنواع الخلايا (الشكل S5B).
عندما قمنا بتحليل أنواع CAF فقط، لم نرَ أي ارتباطات قوية في البيانات، باستثناء أن نسب mCAFs وSMA CAFs في صور المرضى الفردية كانت مرتبطة بشكل عكسي قوي ( ; الشكل S5A)؛ لاحظنا التأثير المعاكس في تحليل كثافة الخلايا (الشكل S5B)، على الأرجح يعكس الكثافة العالية لكلا النوعين من CAF في TME. بالإضافة إلى ذلك، كانت نسب iCAFs مرتبطة عكسيًا مع تلك الخاصة بـ SMA CAFs وmCAFs ( )، وكانت نسب ifnCAFs مرتبطة إيجابيًا مع تلك الخاصة بـ iCAFs وtCAFs (p < 0.001؛ الشكل S5A).
iCAFs كانت مرتبطة عكسيًا بشكل كبير، وإن كان ضعيفًا، مع جميع الخلايا المهيجة (LUAD 0.0012) وكانت غنية في البقع الطبيعية ( ، الأشكال S5C-S5H)، على عكس النتائج الأخيرة في سرطان البنكرياس، التي، مع ذلك، عرفت iCAFs باستخدام علامة مختلفة (IL6) عن هذه الدراسة. في الواقع، كانت جميع أنواع CAF غنية في البقع الطبيعية في مجموعة بيانات الرئة لدينا، باستثناء الخلايا المهيجة كما هو متوقع (الأشكال S5G-S5H). كانت خلايا بطانة الأوعية (التي تشير إلى الأوعية الدموية) غنية في البقع الطبيعية، مما يدعم تعريفنا لـ الخلايا على أنها مهيجة حقًا.
في غياب ارتباطات قوية على مستوى الأنماط الظاهرية الفردية لـ CAF، قمنا بالتحقيق في تكوين TME لمجموعات المرضى التنبؤية التي تعكس تركيبات CAF مختلفة. وجدنا أن مجموعات المرضى ذات التنبؤ السيئ كانت غنية في خلايا الورم المهيجة وكذلك العدلات ولكنها كانت ناقصة من أنواع خلايا المناعة (الأشكال 6A و S6). بالمقابل، أظهرت مجموعتا المرضى ذات التنبؤ الجيد نمطًا عامًا غنيًا بخلايا المناعة مع القليل من المهيجات مما يشير إلى حالة TME أكثر التهابًا في هذه المجموعات (الأشكال 6A و S6). أظهر التحليل على مستوى أنواع CAF الفردية للمرضى المصنفين على أنهم “مرتفعون” أو “منخفضون” أيضًا اتجاهات مشابهة (الأشكال S7A و S7B). الاستثناء كان TMEs الغنية في tCAFs وPDPN CAFs، التي كانت غنية في الخلايا، الخلايا، العدلات، خلايا T التنظيمية، والخلايا النخاعية، مما يدل على استنفاد المناعة (الشكل S7A). مجتمعة، تظهر هذه البيانات أن أنواع CAF ومجموعات المرضى التنبؤية المحددة بواسطة تركيبة CAF مرتبطة بحالات TME متميزة.
توجد مجموعات ذات تنبؤ سيئ وأنواع CAF الخاصة بها في الأورام الغنية بخلايا المناعة المستنفدة والمهيجات، وعلى النقيض من ذلك، تقدم مجموعات المرضى ذات التنبؤ الجيد وأنواع CAF الخاصة بها حالة TME أكثر التهابًا.

توزيعات مكانية محددة لـ CAFs داخل TME

نظرًا لأن أنواع CAF مرتبطة بـ TMEs ذات خصائص متميزة، قمنا بتحليل التوزيعات المكانية لأنواع الخلايا في TMEs لـ NSCLC. قمنا بتعريف أقنعة الورم-الستروما، وتأكدنا من أن الأنواع الأساسية من الخلايا كانت بالفعل موجودة في الأقسام المتوقعة، وحسبنا المسافات لكل خلية إلى أقرب واجهة ورم-ستروما. رأينا اختلافات ملحوظة في التوزيعات المكانية لأنواع CAF المختلفة (الشكل 6B). كانت SMA CAFs وmCAFs تقريبًا حصرية في قسم الستروما، بينما كانت tCAFs المهيجة تقريبًا حصرية في قسم الورم. علاوة على ذلك، كانت tCAFs وiCAFs موجودة عمومًا في قسم الورم، بينما تراكمت ifnCAFs عند واجهة الورم-الستروما. كانت هذه النتائج مستقلة عن نوع الورم (الشكل 6B).
بعد ذلك، قمنا بتقييم التفاعل المكاني الثنائي بين CAFs وجميع الخلايا الأخرى وارتباطها بهياكل متميزة داخل TME. أظهر تحليل الجوار على مدى نصف قطر من (طرق STAR) أن SMA CAFs وmCAFs وvCAFs كانت قريبة مكانيًا من بعضها البعض وأن vCAFs وiCAFs كانت قريبة من خلايا بطانة الأوعية الدموية واللمفاوية، بغض النظر عن نوع الورم (الأشكال 6C و 6D). من المحتمل أن تفسر الملاحظة الأخيرة وجود iCAFs في قسم الورم نتيجة لدمج الأوعية في أقنعة الورم (الشكل 6C). كانت ifnCAFs قريبة من و الخلايا، على الأرجح نتيجة لتحفيز IFN من الخلايا المحيطة؛ ومع ذلك، أظهرت فقط ifnCAFs و خلايا T تفاعلات إيجابية مع خلايا الورم. لم تظهر tCAFs ذات التنبؤ السيئ تفاعلات مكانية قوية مع أنواع الخلايا الأخرى ولكن كان لديها ميل طفيف لتكون جارة لخلايا الورم وifnCAFs. تجمعت جميع الخلايا المهيجة (tCAFs المهيجة، CAFs المهيجة، وخلايا الورم) مكانيًا في حي مهيج يتضمن CAFs الكولاجين إلى حد ما tCAFs. أظهرت CAFs الكولاجين أيضًا تفاعلات قوية مع mCAFs. أظهرت SMA CAFs وmCAFs أكبر عدد من التفاعلات الخلوية، مما يعكس وفرتها العالية، بينما لم تظهر dCAFs وPDPN CAFs أي تفاعلات قوية، مما يتماشى مع ندرتها النسبية داخل TME. أظهر تقسيم تحليلات الجوار حسب نوع الورم (LUAD مقابل LUSC) أنماطًا مشابهة (الشكل 6C). لم نجد أي اختلافات كبيرة لتفاعلات الخلايا مع الخلايا عند مقارنة معلمات سريرية إضافية أو مجموعات المرضى التنبؤية لدينا (البيانات غير معروضة).
من المعروف أن التليف والستروما الكثيفة يمكن أن تمنع خلايا المناعة من الوصول إلى الورم، مما يؤدي إلى تنبؤ سيئ للمرضى. كشفت بياناتنا أن mCAFs هي مكون مهيمن في ستروما الورم (الشكل 3E). علاوة على ذلك، كانت الكثافة العالية لـ mCAF مؤشرًا على بقاء عام سيئ في LUSC (الشكل S4B) وكانت مجموعة المرضى الغنية بـ mCAF 2 هي

خلايا السرطان
المقالة

الشكل 5. أنواع CAF مرتبطة بمقاومة العلاج الكيميائي والانتقال
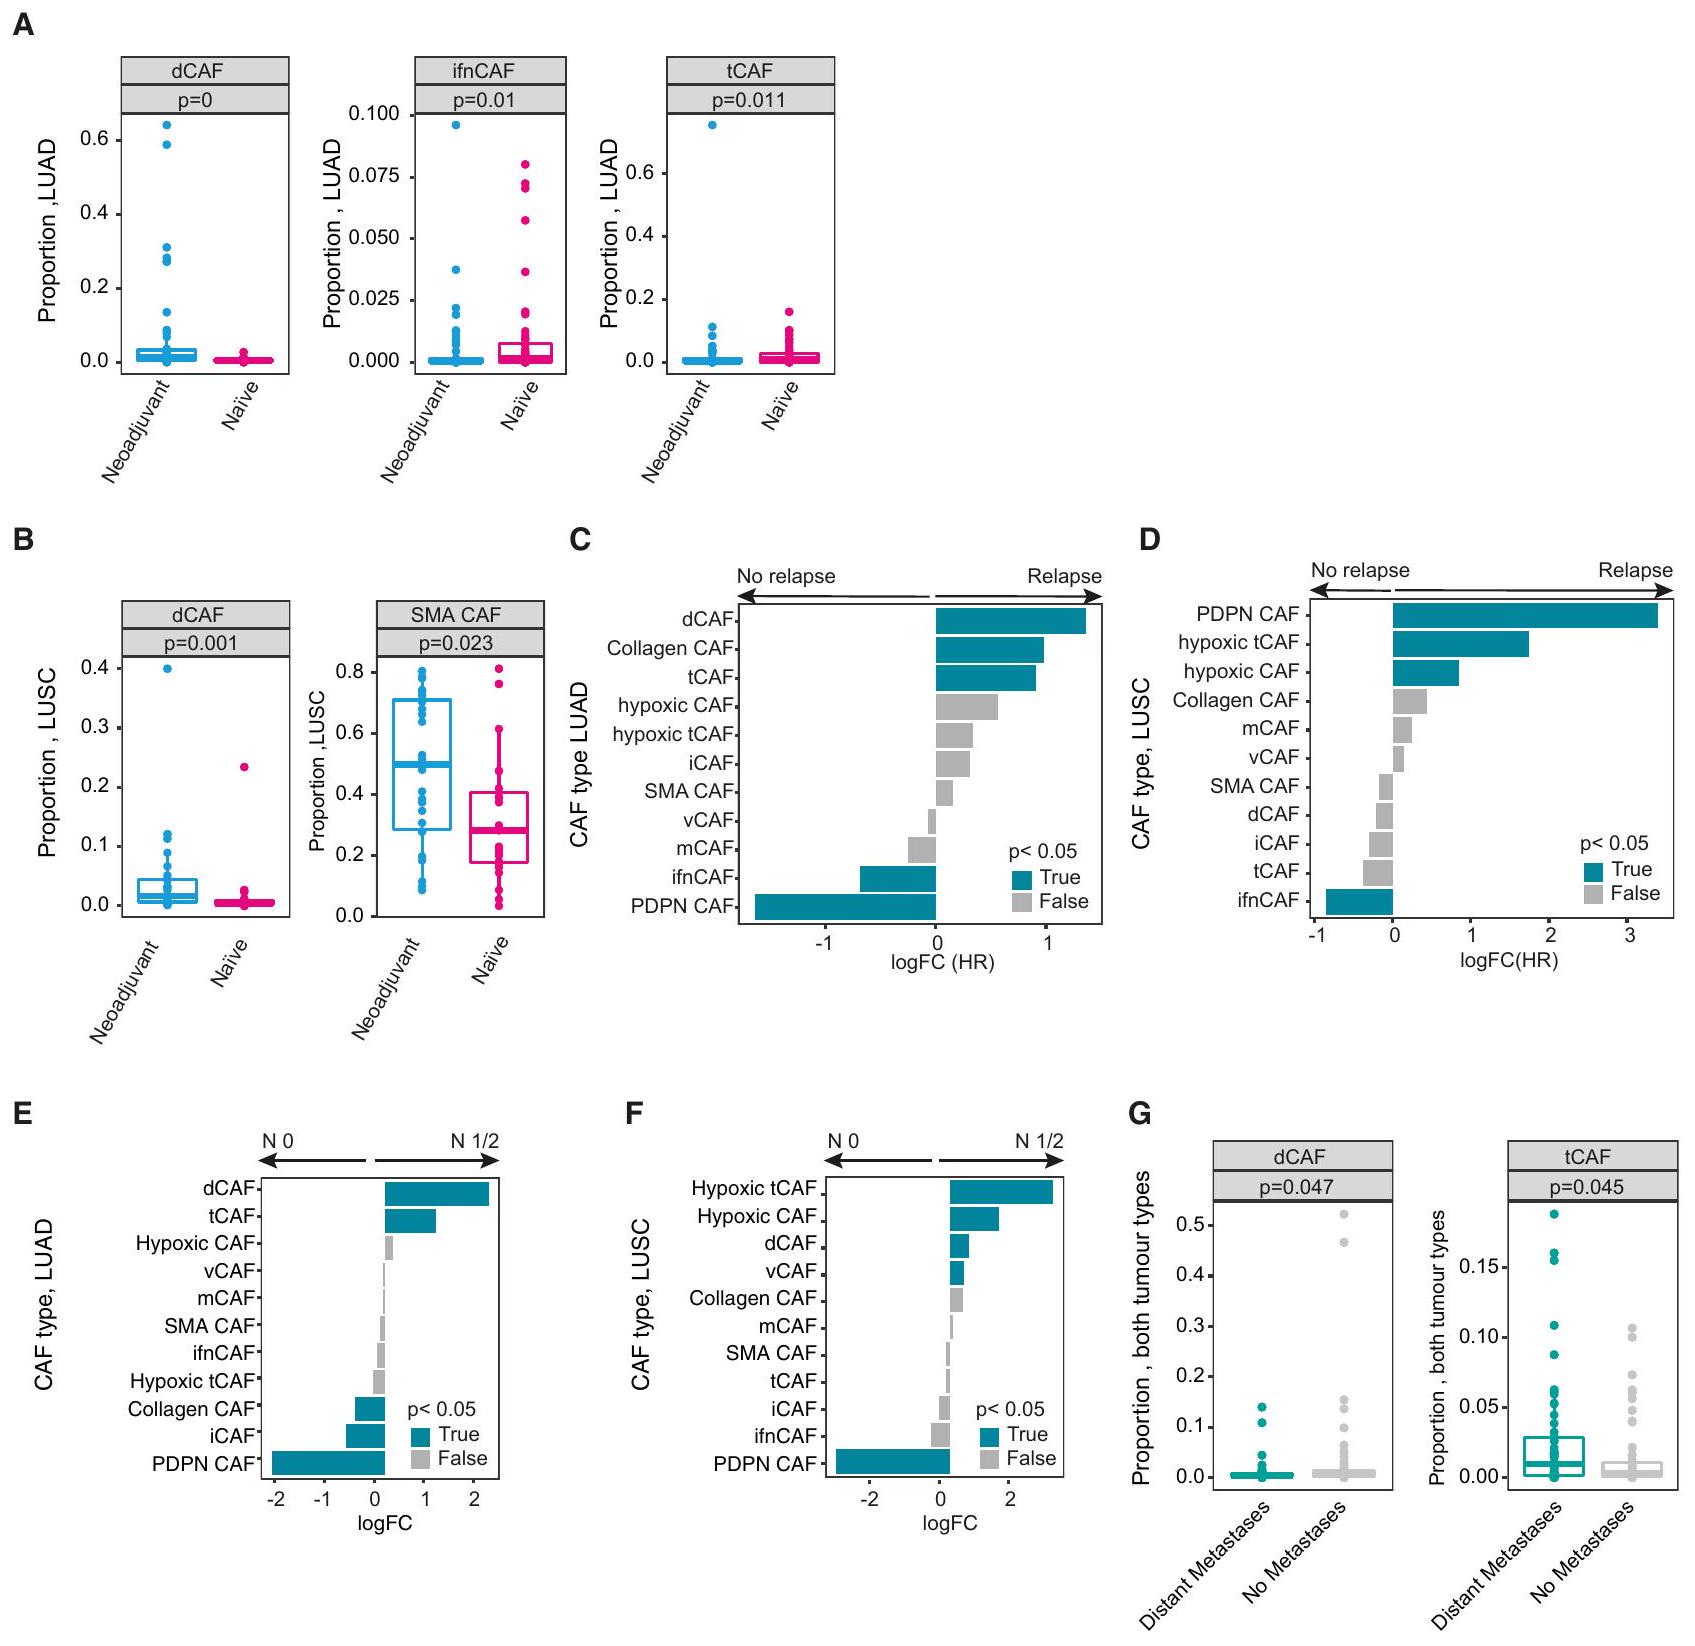
(أ و ب) مخططات صندوقية تظهر متوسط نسب المرضى لأنواع CAF المحددة مقارنة بالمرضى الذين تلقوا علاجًا مسبقًا مقابل مجموعة علاج مطابقة غير معالجة لـ LUAD (أ) و LUSC (ب). القيم الدقيقة لـ p موضحة.
(ج و د) اختبار وفرة تفاضلية لجميع أنواع CAF مقارنة بالمرضى الذين يتلقون العلاج الكيميائي المساعد الذين انتكسوا أو لم ينتكسوا، في LUAD (ج) و LUSC (د). القيم p < 0.05 موضحة باللون الأزرق، القيم p > 0.05 باللون الرمادي.
(هـ و و) اختبار وفرة تفاضلية لجميع أنواع CAF مقارنة بالمرضى الذين لديهم (N1/2) وبدون (N0) عقد لمفاوية عند التشخيص، في LUAD (هـ) وفي LUSC (و). القيم p < 0.05 موضحة باللون الأزرق، القيم p > 0.05 باللون الرمادي.
(ز) مخطط صندوقي يظهر متوسط النسب لكل مريض من أنواع CAF المحددة في مجموعات المرضى المطابقة مع وبدون نقائل بعيدة عند التشخيص. القيم الدقيقة لـ p موضحة.
خلايا المناعة كانت ناقصة مقارنة بالمجموعات الأخرى من المرضى (الشكل 6A). لذلك قمنا بتحليل تأثير كثافة mCAF على التوزيع المكاني لخلايا المناعة، من خلال مقارنة التفاعلات الخلوية في مرضى LUSC المصنفين حسب كثافة mCAF المتوسطة (طرق STAR، الشكل 7A). كشف هذا أن جميع خلايا المناعة كانت غنية مكانيًا بالقرب من خلايا الورم في المرضى المصنفين
ككثافة mCAF منخفضة (الشكل 7A). علاوة على ذلك، وُجدت جميع خلايا المناعة، بما في ذلك و الخلايا، خلايا B، الخلايا النخاعية، والعدلات بشكل ملحوظ أكثر قربًا من واجهة الورم-الستروما ( ) أو تغزو الورم في المرضى ذوي الكثافة المنخفضة لـ mCAF مقارنة بالمرضى ذوي الكثافة العالية لـ mCAF ( )؛ مع رؤية التأثير العكسي بعيدًا
الشكل 6. العلاقة المكانية لـ CAFs مع البيئة الدقيقة للورم
(أ) خريطة حرارية تظهر غنى أو نقص أنواع الخلايا بين مجموعات المرضى المحددة بواسطة تركيبة CAF ( ، و 4).
(ب) منحنيات الكثافة تظهر المسافة لكل خلية من أنواع CAF المحددة إلى أقرب حدود ورم-ستروما لـ LUAD (يسار) و LUSC (يمين).
(ج) خريطة حرارية لتحليل الجوار تظهر أقرب 15 جارة لكل خلية ضمن نصف قطر من (إلى الخلية، محور Y؛ من الخلية، محور X). تم رسم المتوسطات الدالة على جميع الصور، مقسمة حسب LUAD (يسار) و LUSC (يمين). تشير الدرجات المتوسطة الإيجابية/السلبية (الحمراء/الزرقاء) إلى تفاعلات خلوية أعلى/أدنى مقارنة بتوزيع عشوائي فارغ.
(د) صور مع تراكبات قناع (بيضاء) لـ SMA CAFs (SMA “), mCAFs (MMP11 CAF الكولاجين (الكولاجين I/فيبرونيكتين “), vCAFs (CD146 iCAFs (CD34 “), tCAFs (CD10 CAF الحامضية (CAIX ). علامة السدى العامة SMA باللون الأحمر في جميع الحالات باستثناء الصور التي تظهر CAFs SMA وCAFs المهيجة. البان سايتوكيراتين باللون الأرجواني في جميع الحالات باستثناء الصورة التي تظهر CAFs المهيجة (الزاوية السفلى اليمنى)، جميع CAFs هي panCK. ; الحمض النووي باللون الأزرق. مقياس الطول بالـ .

خلية سرطانية
مقالة

الشكل 7. كثافة عالية من خلايا المCAF تحجب الخلايا المناعية
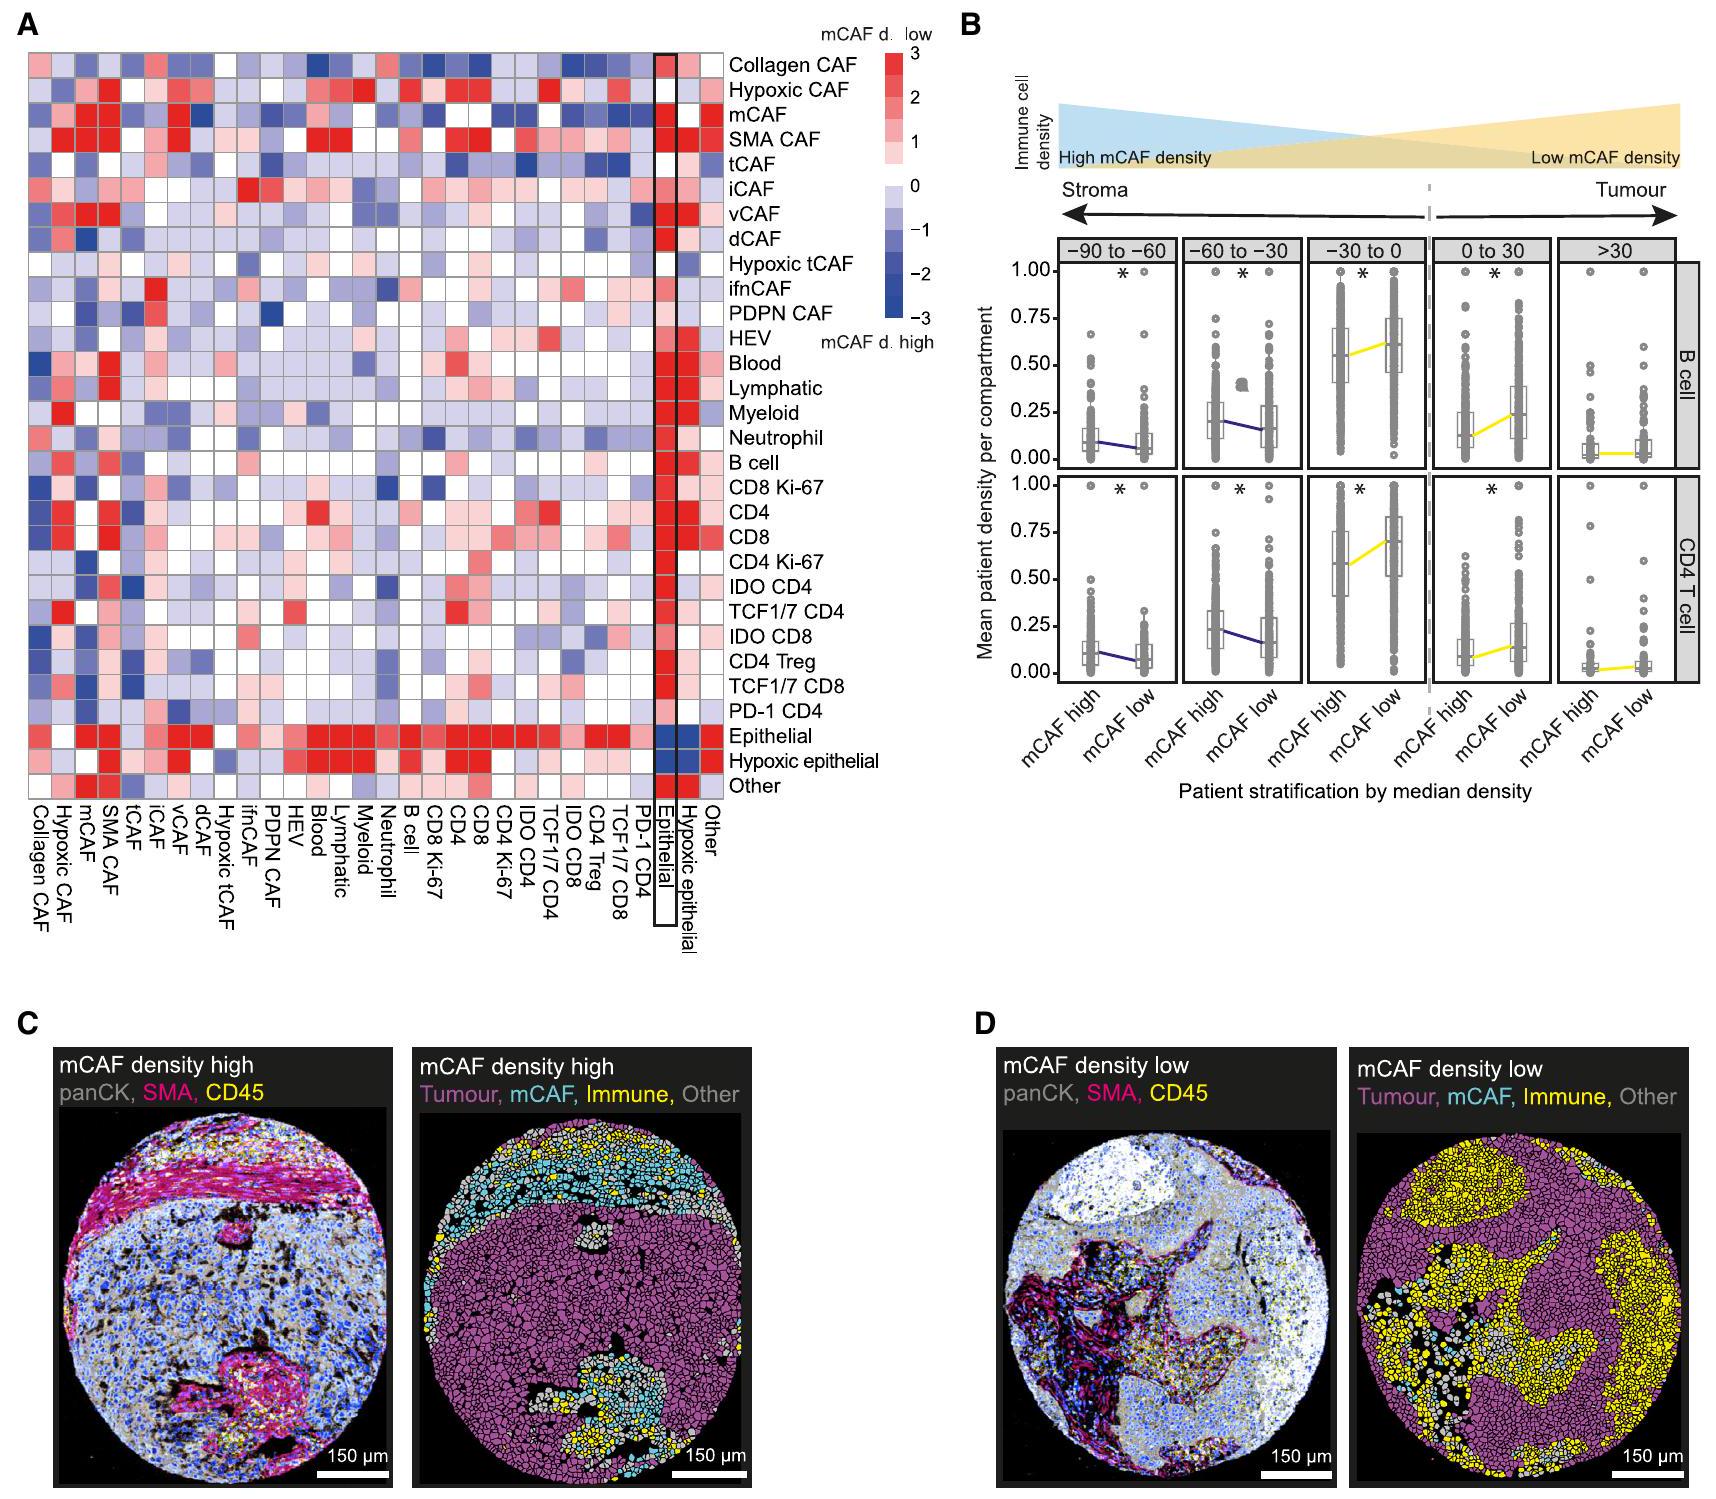
(أ) تحليل SpicyR لزوج الخلايا في المرضى المصنفين حسب كثافة المCAF المتوسطة. تشير الدرجات الإيجابية (الحمراء) إلى تفاعلات خلوية أعلى بين أزواج الخلايا في المرضى ذوي كثافة المCAF المنخفضة، بينما تشير الدرجات السلبية (الزرقاء) إلى تفاعلات خلوية أعلى في المرضى ذوي كثافة المCAF العالية؛ بينما يشير اللون الأبيض إلى عدم وجود فرق.
(ب) نسب خلايا B (الأعلى) و CD4 الخلايا (السفلية) في المرضى المصنفين حسب كثافة المCAF، ضمن مجموعات من من حدود الورم-الستروما القيم < 0.05).
(C و D) صور تظهر العلامات المحددة لصورة كثافة المCAF العالية (C) وصورة كثافة المCAF المنخفضة (D)، مع الأقنعة المقابلة الملونة بخلايا الورم (أرجواني)، خلايا المناعة (أصفر) وmCAFs (سماوي). شريط القياس، .
من الورم ( -90 إلى ) ( ) (الشكل 7B). كان هذا التأثير مرئيًا أيضًا في صور كثافة المCAF العالية (الشكل 7C) والمنخفضة (الشكل 7D). لم تظهر أي من أنواع CAF الأخرى هذا التأثير. وبالتالي، تُظهر بياناتنا أن كثافة المCAFs قد تساهم في سوء توقعات المرضى من خلال دفع التليف وبالتالي التأثير على وصول خلايا المناعة إلى الورم في سرطان الرئة غير صغير الخلايا.
باختصار، لقد أظهرنا أن أنماط الخلايا الليفية في البيئة المجاورة للورم هي عامل تنبؤي قوي لنتائج مرضى سرطان الرئة غير صغير الخلايا. توفر بياناتنا أدلة على أنواع الخلايا الليفية المرتبطة بالتشخيص الجيد والرديء. كانت وجود الخلايا الليفية المرتبطة بالورم (tCAFs) مرتبطة بشكل قوي بالتشخيص السيئ ومرتبطة بالأورام المميزة.
بواسطة بيئات ميكروية ناقصة الأكسجين ومثبطة للمناعة. على النقيض من ذلك، كانت iCAFs التي تعبر عن CD34 وCD248 بالإضافة إلى ifnCAFs مرتبطة ببيئات ميكروية للورم ملتهبة وبمعدل بقاء عام أعلى للمرضى.

نقاش

فهم العمليات الخلوية والتفاعلات في البيئة المجهرية للورم وكيفية ارتباطها بتقدم المرض ونتائج المرضى هو أمر ذو أهمية قصوى لتصنيف المرضى، وتطوير العلاجات، وفي النهاية تطبيقات علم الأورام الدقيق.
تعتبر دراسات خلايا السدى مهمة بشكل خاص. لم تكن العلاجات التجريبية الأولى التي تستهدف بشكل عام سدى الورم ناجحة في الدراسات السريرية، مما يشير إلى الحاجة إلى أهداف سدى أكثر دقة. هنا، حددنا عوامل خلوية تنبؤية داخل السدى في سرطان الرئة غير صغير الخلايا، وهو مرض ذو معدل بقاء عام ضعيف ومعدلات استجابة علاجية متوسطة. حددنا أنواعًا فردية من الخلايا الليفية المرتبطة بالسرطان في سرطان الرئة ذو الخلايا الكبيرة وسرطان الرئة ذو الخلايا الحرشفية، ودرسنا التركيب والتنظيم المكاني لهذه الخلايا داخل البيئة المجهرية للورم وكيفية ارتباطها بالمعايير السريرية بما في ذلك البقاء.
أنواع CAF المحددة لدينا تشترك في علامات مع أنواع CAF المحددة من قبل الآخرين. CD34 تم وصف iCAFs سابقًا على أنها Pi16 CAF كما كانت الخلايا مشابهة لخلايا IFNCAFs لدينا، عادةً كفئة فرعية من مجموعة iCAF أو مجموعة الخلايا العضلية الليفية الأوسع ; نفس الشيء ينطبق أيضًا على CCL19/CCL21 rCAFs. نلاحظ أن iCAFs توصف بشكل متكرر بأنها IL6 CAFs، لكننا لم ندرج IL-6 في لوحة العلامات الخاصة بنا بسبب عدم وجود جسم مضاد مناسب، وبالتالي لا يمكننا وصف تعبير IL-6 في CD34 لدينا. iCAFs. لقد عرّفت الأعمال السابقة على CAFs الالتهابية بعلامات مختلفة. كما تم وصف CAFs المرتبطة بالمصفوفة في الأدبيات بأنها تعبر عن MMP11 والكولاجينات بشكل مرتفع. في دراستنا، قمنا بتمييز بين mCAFs (FAP MMP11 ) وكولاجين CAFs (FAP MMP11 التي من المحتمل أن تكون الخلايا الأخيرة مجموعة فرعية ضمن المجموعة المتنوعة من الخلايا الليفية المرتبطة بالمصفوفة، لكن ذلك يعبر عن عوامل ترسيب وإعادة تشكيل المصفوفة بخلاف MMP11. CD10/CD73 تم وصف CAFs، التي أطلقنا عليها اسم tCAFs، سابقًا، وفي جميع الحالات تم تحديدها بشكل خاص على أنها فيبروبلاست سلبية لـ panCK. وبذلك تمييزهم عن التجمعات الظهارية المعروفة أيضًا بتعبيرها عن CD10. بينما يُستخدم CD10 عمومًا كعلامة للأرومات الليفية الهوائية في الرئة، فقد ارتبط التعبير العالي لـ CD10 في خلايا الأنسجة الداعمة للسرطان في سرطان الرئة غير صغير الخلايا بمقاومة العلاج الكيميائي وخصائص الخلايا الجذعية السرطانية. أخيرًا، فإن vCAFs لدينا مشابهة لـ MHY aSMA CAF التي وصفها غراوت وآخرون. بالإضافة إلى CAFs الوعائية أو الوعائية التي تم تحديدها سابقًا. عند أخذها معًا، تُظهر تحليلاتنا أن التصنيف الشائع لـ CAFs إلى iCAFs و myofibroblasts و apCAFs يمكن أن يتم تحسينه إلى مجموعات أصغر ذات دلالة وظيفية. للأسف، لا تحدد دراستنا الخلايا الليفية المتوسطة التي تقدم المستضدات بسبب التعبير الواسع عن هذه العلامة.
أظهرنا أن المرضى يمكن تصنيفهم إلى مجموعات ذات توقعات جيدة وأخرى ذات توقعات ضعيفة بناءً على تركيبة خلايا الأنسجة المحيطة بالورم (CAF)، بغض النظر عن نوع الورم (أي، LUAD أو LUSC)، وأن أنواع خلايا الأنسجة المحيطة بالورم الفردية تعتبر أيضًا عوامل تنبؤية مستقلة قوية في سرطان الرئة غير صغير الخلايا (NSCLC). كانت مجموعات المرضى ذات التوقعات الجيدة 1 و4 غنية بخلايا الأنسجة المحيطة بالورم SMA وiCAFs وifnCAFs، وأظهرت أيضًا بيئة ميكروية غنية بالمناعة. نظرًا لأن خلايا الأنسجة المحيطة بالورم SMA وiCAFs قريبة، بالإضافة إلى ذلك، من هياكل الأوعية، فإن هذا يشير إلى أن هذه الأنواع من خلايا الأنسجة المحيطة بالورم تعزز بنشاط تسلل خلايا المناعة. قد تكون ifnCAFs علامة غير مباشرة على استجابة مناعية مستمرة؛ لقد ارتبطت سابقًا بالالتهاب وتعبير IFN وقد أظهرنا سابقًا أنها تعبر بقوة عن الكيموكينات المحفزة بواسطة IFN CXCL9 وCXCL10 وCXCL11. علاوة على ذلك، فإن ifnCAFs قريبة من خلايا الورم، مما يشير إلى أن الالتهاب المستمر قد يؤثر مباشرة على هذه الخلايا. ومع ذلك، فإن تأثير الإنترفيرونات على خلايا الورم معقد وقد يكون مؤيدًا أو معارضًا للورم. من المثير للاهتمام، إذا كانت خلايا CAFs المحفزة للالتهاب غنية في أورام المرضى غير المتكررين في كل من
مجموعة كاملة وفي مجموعة فرعية من المرضى الذين تلقوا العلاج الكيميائي بعد الجراحة، مما يشير إلى دور مثبط للورم لـ ifnCAFs من خلال إشارات الإنترفيرون.
على النقيض من ذلك، كانت خلايا التليف المحيطة بالورم (tCAFs) وخلايا التليف المحيطة بالورم المتوسطة (mCAFs) (من بين آخرين) غنية في مجموعات المرضى ذات التوقعات السيئة 2 و 3 ووجدت في بيئات الورم المهيأة لنقص الأكسجين والتي كانت غنية بالعدلات ذات التوقعات السيئة. كما كانت tCAFs وtCAFs المهيأة لنقص الأكسجين أكثر غنى في المرضى الذين لديهم نقائل بعيدة عند وقت التشخيص، مما يشير إلى فرضية أن دور هذه الأنواع من الخلايا في النقائل هو السبب وراء تأثيرها السيئ على التوقعات. في دراستنا السابقة، أظهرت tCAFs أيضًا غنى في TGF- الإشارات، التحلل السكري، استجابة الإجهاد وتكوين الأوعية في تحليل إثراء وظيفي، مما يشير أكثر إلى وظائف مؤيدة للورم. نظرًا لأن الميكرو metastasis المبكر هو محرك لتوقعات المرضى السيئة، من الممكن أن تقود tCAFs انتشار النقائل المبكر وبالتالي ت worsen prognosis. هذا يتماشى مع تفاعلها المكاني الوثيق مع خلايا الورم. ومن المثير للاهتمام أننا لاحظنا أيضًا أن tCAFs كانت ناقصة في المرضى بعد العلاج المساعد، مما قد يشير إلى أن tCAFs إما مستهدفة بواسطة العلاج الكيميائي أو أن نمطها الظاهري يعتمد على التفاعلات الوثيقة مع خلايا الورم التي يتم تقليلها بواسطة العلاج الكيميائي. على النقيض من ذلك، كانت tCAFs و tCAFs المهيأة لنقص الأكسجين غنية في المرضى الذين يعانون من الانتكاس، بما في ذلك أولئك الذين انتكسوا بعد العلاج الكيميائي، بما يتماشى مع الرابط المعروف بين تعبير CD10 في النسيج الضام ومقاومة العلاج الكيميائي في سرطان الرئة.
من المثير للاهتمام أن تحليلنا المكاني لأنواع الخلايا الليفية في سرطان الرئة غير صغير الخلايا (NSCLC) لم يكشف عن اختلافات كبيرة بين سرطان الرئة ذو الخلايا الكبيرة (LUAD) وسرطان الرئة ذو الخلايا الحرشفية (LUSC) وكذلك بين أنماط النمو المختلفة لـ LUAD (البيانات غير معروضة). كما أظهر توافقًا جيدًا مع توزيعات أنواع الخلايا الليفية المكانية التي اكتشفناها في دراستنا للتصوير المتعدد في سرطان الثدي. هذا يشير إلى أن بنية وتوزيع أنواع خلايا الأنسجة الضامة السرطانية داخل نسيج الورم قد تكون محفوظة عبر أنواع السرطان. من الممكن أيضًا أن تكون الأنواع المختلفة من خلايا الأنسجة الضامة السرطانية في السرطان نتيجة لقربها المكاني من هياكل مختلفة (الأوعية، النسيج، والورم) وبالتالي لتفاعلها مع أنواع خلايا مختلفة. ستكون الدراسات الآلية باستخدام زراعة مشترك مفيدة للتحقيق في مرونة خلايا الأنسجة الضامة السرطانية بشكل أكبر.
توجد tCAFs ذات التوقعات الضعيفة، بالإضافة إلى ifnCAFs ذات التوقعات الجيدة والمسببة للالتهابات، بالقرب من خلايا الورم، مما يشير إلى تأثيرات جواهرية أو باراكرينية بين CAFs وخلايا الورم. تعبر tCAFs عن CD73، وهو -نوكليوتيداز الذي يزيل الفوسفات من AMP إلى الأدينوزين. زيادة الأدينوزين المتاح في المصفوفة خارج الخلوية تسهل نمو، هجرة، بقاء، والتصاق خلايا الورم. الأدينوزين له أيضًا وظائف مثبطة للمناعة وقد ارتبط بـ استنفاد الخلايا وبالتالي يمكن أن يقود بشكل غير مباشر إلى نمو الورم من خلال تسهيل الهروب المناعي. قد تعزز خلايا التليفات المحيطية الورم من خلال توفير الأدينوزين في السدى المحيط بالورم. علاوة على ذلك، لقد أظهرت الدراسات السابقة أن خلايا الورم يمكن أن تعيد برمجة الخلايا السدوية القريبة لصالحها الأيضي. استنادًا إلى القرب الجسدي لخلايا الورم وtCAFs، يمكن الافتراض أن هذه الآلية قد تكون قيد التنفيذ. بالنسبة لـ ifnCAFs ذات التوقعات الجيدة، والتي تقع أيضًا بالقرب من خلايا الورم، تشير تعبيرات IDO إلى أن هذه الخلايا قد تكون تستجيب للالتهاب المستمر، وهي فرضية مدعومة بزيادة خلايا المناعة في المرضى الذين لديهم نسب عالية من ifnCAFs. ومع ذلك، إذا كانت مرضى CAF العالية أيضًا غنية بشكل كبير بخلايا tCAF المهيأة لنقص الأكسجة، والخلايا النخاعية و
IDO المثبط للمناعة المحتمل خلايا T. هذا، وتفاعلهم الوثيق مع خلايا الورم يتعارض مع وظيفتهم التنبؤية الجيدة الظاهرة بشكل عام. هناك حاجة إلى تجارب وظيفية لفهم آليات تباين الخلايا الليفية المرتبطة بالورم وتأثيرها التآزري مع خلايا الورم والعمليات الالتهابية داخل بيئة الورم. ومع ذلك، قد تعمل CAFs كعلامة على حالة TME.
نفترض أن بياناتنا قد تكون لها تداعيات على العلاج الموجه ضد CAF، الذي لم يكن ناجحًا حتى الآن. قد يكون ذلك بسبب استهداف جميع خلايا الأنسجة الضامة السرطانية، وهو ما نتوقع أن يقلل من الكفاءة العلاجية نظرًا للتأثيرات التنبؤية المختلطة التي لاحظناها لأنواع مختلفة من خلايا الأنسجة الضامة السرطانية. قد يكون من المفيد، وقد تم الافتراض بذلك من قبل. لاستهداف أو القضاء على أنواع CAFs ذات التوقعات السيئة مع دعم الأنواع ذات التوقعات الجيدة. يمكن أن تكون tCAFs ذات التوقعات السيئة وtCAFs المهيجة، التي نراها مرتبطة بمقاومة العلاج الكيميائي والنقائل، أهدافًا خلوية محتملة للطب الدقيق. علاوة على ذلك، إذا كانت فرضيتنا صحيحة بأن القرب المكاني لـ tCAFs من خلايا الورم له أهمية وظيفية، فقد تكمن طريقة العمل للعلاجات المحتملة في قطع التفاعلات الجزيئية بين هذه الأنواع الخلوية لإبطاء نمو الورم وتقليل النقائل ومقاومة العلاج الكيميائي. ومع ذلك، ستكون هناك حاجة إلى مزيد من التجارب لتعزيز القضية بأن هذه الأنواع من CAF تلعب دورًا سببيًا في نمو الورم.
أظهرنا أن كثافة المCAF لها تأثير سلبي على تسلل خلايا المناعة في سرطان الرئة غير صغير الخلايا، في حين أن أنواع CAF الأخرى لم تلعب هذا الدور. وبالتالي، قد يؤدي حاجز المCAF الكثيف إلى استبعاد خلايا المناعة من الورم، ويعيق الاستجابة المناعية السلبية ويؤثر سلبًا على بقاء المرضى. قد تشير هذه النتيجة إلى أن الأساليب التي تعطل السدى المحيط بالورم قد تسمح لمزيد من خلايا المناعة بالوصول إلى الورم وتحقق معدلات نجاح أعلى للعلاج المناعي. ومع ذلك، يجب أخذ الآثار السلبية المبلغ عنها سابقًا لاستنفاد السدى في الاعتبار في مثل هذه الحالات. بشكل عام، يجب إيجاد توازن بين تأثيرات الترويج للورم والتثبيط الناتجة عن التليف إذا كانت هذه الخلايا ستصبح أهدافًا فعالة للعقاقير.
بشكل عام، تسلط نتائجنا الضوء على أهمية فهم تباين خلايا الأنسجة الداعمة للسرطان (CAF) لتمكين تطوير علاجات تثبط وظائف خلايا CAF ذات التوقعات السيئة أو تدعم تلك ذات التوقعات الجيدة. وقد أظهرت الأعمال السابقة في سرطان الغدة البنكرياسية القنوي. وسرطان الثدي يشير إلى وجود روابط بين أنواع معينة من خلايا الأنسجة الضامة واستجابة المرضى للعلاج. لذلك سيكون من المثير للاهتمام تحليل كيفية تغير حجرة الأنسجة بعد أنواع مختلفة من العلاج وكيف ترتبط أنواع خلايا الأنسجة الضامة التي حددناها بالاستجابة العلاجية. يمكن أن تكون البيانات التي نقدمها هنا عن المرضى الذين لم يتلقوا العلاج مرجعًا في هذا الصدد.

قيود الدراسة

لدراستنا قيود: أولاً، على الرغم من الطبيعة المتعددة التخصصات لتقنية IMC، قد تكون هناك أنواع من خلايا CAF لم يتم التقاطها بواسطة مجموعة الأجسام المضادة المكونة من 45 جسمًا مضادًا. على سبيل المثال، بسبب نقص جسم مضاد عالي الجودة لمؤشر الخلايا المحيطية RGS5، لا يمكننا تمييز الخلايا المحيطية عن خلايا الأنسجة الدهنية الوعائية. لقد خففنا من هذا التأثير من خلال تصميم دقيق لمجموعة الأجسام المضادة مستندًا إلى بحث مكثف في الأدبيات وبيانات تسلسل RNA أحادي الخلية الخاصة بنا والعامة. ثانيًا، أدى تبسيط الخلايا الليفية إلى نواتها الأساسية خلال عملية التقسيم إلى عدم قدرتنا على دراسة التفاعل-
تشير إلى التغيرات التي تحدث عند حواف الخلايا. ثالثًا، تم تصوير نواة واحدة أو اثنتين فقط لكل مريض، وتم أخذ جميع النوى من الجبهة الغازية. وبالتالي، فإن ميزات CAF والتنوع الذي نصفه قد تكون فريدة من نوعها في هذه المنطقة من أورام NSCLC. أخيرًا، دراستنا وصفية وحققت في الارتباط بدلاً من السببية، وبالتالي، فإن الفرضيات المستخلصة لدينا هي فرضيات تخمينية. ومع ذلك، فإن هذه الدراسة هي أكبر تحليل تصوير متعدد الأبعاد لأورام NSCLC والألياف حتى الآن ويجب أن تكون مرجعًا وموارد للعمل المستقبلي.

طرق النجوم

تُقدم طرق مفصلة في النسخة الإلكترونية من هذه الورقة وتشمل ما يلي:
  • جدول الموارد الرئيسية
  • توافر الموارد
  • جهة الاتصال الرئيسية
  • توفر المواد
  • توفر البيانات والشيفرة
  • تفاصيل النموذج التجريبي وشارك الدراسة
  • تفاصيل الطريقة
  • لوحة الأجسام المضادة، التلوين، والتصوير
  • خط أنابيب التقسيم
  • تجميع نمط الخلية
  • التكميم والتحليل الإحصائي
  • استبعاد البيانات وتحديد المجموعات
  • تحليل المجموعات المتطابقة
  • التحليلات الإحصائية
  • التحليل المكاني
  • تحليل كشف بقع نقص الأكسجين

معلومات إضافية

يمكن العثور على معلومات إضافية على الإنترنت فيhttps://doi.org/10.1016/j. ccell.2023.12.021.

شكر وتقدير

تم تمويل B.B. من خلال منحتين من مشروع SNSF (#310030_205007: تحليل خصائص نظام أورام الثدي من أجل نهج الطب الدقيق و#316030_213512: تصوير الكتلة الطيفية عالية الأداء بدقة خلوية للعينات البيولوجية)، ومنحة NIH (UC4 DK108132)، وتحدي CRUK IMAXT الكبير، ومجلس البحث الأوروبي (ERC) بموجب برنامج الاتحاد الأوروبي Horizon 2020 بموجب اتفاقية منحة ERC رقم 866074 (“الأنماط الدقيقة”). تم تأسيس B.B. وL.C. من خلال منحة مشروع SNSF SINERGIA (#177208: تحديد الهوية ومسارات التمايز للورم الليفي المحفز للمناعة). نود أن نشكر جميع أعضاء اتحاد منحة SNSF SINERGIA على المناقشات المثمرة وخاصة مختبر Ludewig لتوفير أنسجة عينات الاختبار. تم إنشاء الملخص الرسومي باستخدام BioRender.biorender.com).

مساهمات المؤلفين

قام L.C. و B.B. بتصميم الدراسة. صمم L.C. التجارب، وطور مجموعة الأجسام المضادة IMC، وأنشأ مجموعة بيانات IMC، وحلل جميع البيانات، وكتب المخطوطة بمساعدة من N.dS. و B.B. ساعد S.E. في تصميم مجموعة الأجسام المضادة IMC واختبار الأجسام المضادة. قدم M.H. و J.H.R. و H.M. العينات بالإضافة إلى البيانات السريرية المرضية وقدموا مدخلات سريرية. حدد M.H. نمط النمو لجميع مرضى LUAD. أشرف N.dS. على كتابة وتنقيح المخطوطة. أشرف B.B. على العمل وقدم مدخلات في جميع المراحل.
يرجى الاستشهاد بهذا المقال في الصحافة كالتالي: كوردس وآخرون، أنماط الألياف المرتبطة بالسرطان مرتبطة بنتيجة المرضى في سرطان الرئة غير صغير الخلايا، خلية السرطان (2023)،https://doi.org/10.1016/j.ccell.2023.12.021

خلية سرطانية

مقالة

إعلان المصالح

بي.بي. قد شارك في تأسيس نافيجنوستكس، وهي شركة تابعة لجامعة زيورخ، وهو أحد المساهمين وعضو في مجلس الإدارة.
تاريخ الاستلام: 29 مارس 2023
تمت المراجعة: 2 نوفمبر 2023
تم القبول: 21 ديسمبر 2023
نُشر: 18 يناير 2024

REFERENCES

  1. Sung, H., Ferlay, J., Siegel, R.L., Laversanne, M., Soerjomataram, I., Jemal, A., and Bray, F. (2021). Global cancer statistics 2020: GLOBOCAN estimates of incidence and mortality worldwide for 36 cancers in 185 countries. CA. Cancer J. Clin. 71, 209-249.
  2. Schabath, M.B., and Cote, M.L. (2019). Cancer progress and priorities: Lung cancer. Cancer Epidemiol. Biomarkers Prev. 28, 1563-1579.
  3. Pikor, L.A., Ramnarine, V.R., Lam, S., and Lam, W.L. (2013). Genetic alterations defining NSCLC subtypes and their therapeutic implications. Lung Cancer 82, 179-189.
  4. Garon, E.B., Hellmann, M.D., Rizvi, N.A., Carcereny, E., Leighl, N.B., Ahn, M.J., Eder, J.P., Balmanoukian, A.S., Aggarwal, C., Horn, L., et al. (2019). Five-year overall survival for patients with advanced non-small-cell lung cancer treated with pembrolizumab: results from the phase I KEYNOTE001 study. J. Clin. Oncol. 37, 2518-2527.
  5. Robert, C. (2020). A decade of immune-checkpoint inhibitors in cancer therapy. Nat. Commun. 11, 3801.
  6. Sahai, E., Astsaturov, I., Cukierman, E., DeNardo, D.G., Egeblad, M., Evans, R.M., Fearon, D., Greten, F.R., Hingorani, S.R., Hunter, T., et al. (2020). A framework for advancing our understanding of cancer-associated fibroblasts. Nat. Rev. Cancer 20, 174-186.
  7. Hanahan, D., and Weinberg, R.A. (2011). Hallmarks of cancer: the next generation. Cell 144, 646-674.
  8. Turley, S.J., Cremasco, V., and Astarita, J.L. (2015). Immunological hallmarks of stromal cells in the tumour microenvironment. Nat. Rev. Immunol. 15, 669-682.
  9. Smyth, M.J., Ngiow, S.F., Ribas, A., and Teng, M.W.L. (2016). Combination cancer immunotherapies tailored to the tumour microenvironment. Nat. Rev. Clin. Oncol. 13, 143-158.
  10. Altorki, N.K., Markowitz, G.J., Gao, D., Port, J.L., Saxena, A., Stiles, B., McGraw, T., and Mittal, V. (2019). The lung microenvironment: an important regulator of tumour growth and metastasis. Nat. Rev. Cancer 19, 9-31.
  11. Finak, G., Bertos, N., Pepin, F., Sadekova, S., Souleimanova, M., Zhao, H., Chen, H., Omeroglu, G., Meterissian, S., Omeroglu, A., et al. (2008). Stromal gene expression predicts clinical outcome in breast cancer. Nat. Med. 14, 518-527.
  12. Bruni, D., Angell, H.K., and Galon, J. (2020). The immune contexture and Immunoscore in cancer prognosis and therapeutic efficacy. Nat. Rev. Cancer 20, 662-680.
  13. Su, S., Chen, J., Yao, H., Liu, J., Yu, S., Lao, L., Wang, M., Luo, M., Xing, Y., Chen, F., et al. (2018). CD10+GPR77+ Cancer-Associated Fibroblasts Promote Cancer Formation and Chemoresistance by Sustaining Cancer Stemness. Cell 172, 841-856.e16.
  14. Krishnamurty, A.T., Shyer, J.A., Thai, M., Gandham, V., Buechler, M.B., Yang, Y.A., Pradhan, R.N., Wang, A.W., Sanchez, P.L., Qu, Y., et al. (2022). LRRC15+ myofibroblasts dictate the stromal setpoint to suppress tumour immunity. Nature 611, 148-154.
  15. Genova, C., Dellepiane, C., Carrega, P., Sommariva, S., Ferlazzo, G., Pronzato, P., Gangemi, R., Filaci, G., Coco, S., and Croce, M. (2021). Therapeutic Implications of Tumor Microenvironment in Lung Cancer: Focus on Immune Checkpoint Blockade. Front. Immunol. 12, 799455.
  16. Caligiuri, G., and Tuveson, D.A. (2023). Activated fibroblasts in cancer: Perspectives and challenges. Cancer Cell 41, 434-449.
  17. Grout, J.A., Sirven, P., Leader, A.M., Maskey, S., Hector, E., Puisieux, I., Steffan, F., Cheng, E., Tung, N., Maurin, M., et al. (2022). Spatial Positioning and Matrix Programs of Cancer-Associated Fibroblasts Promote T-cell Exclusion in Human Lung Tumors. Cancer Discov. 12, 2606-2625.
  18. Ogawa, Y., Masugi, Y., Abe, T., Yamazaki, K., Ueno, A., Fujii-Nishimura, Y., Hori, S., Yagi, H., Abe, Y., Kitago, M., and Sakamoto, M. (2021). Three distinct stroma types in human pancreatic cancer identified by image analysis of fibroblast subpopulations and collagen. Clin. Cancer Res. 27, 107-119.
  19. Özdemir, B.C., Pentcheva-Hoang, T., Carstens, J.L., Zheng, X., Wu, C.C., Simpson, T.R., Laklai, H., Sugimoto, H., Kahlert, C., Novitskiy, S.V., et al. (2014). Depletion of carcinoma-associated fibroblasts and fibrosis induces immunosuppression and accelerates pancreas cancer with reduced survival. Cancer Cell 25, 719-734.
  20. Rhim, A.D., Oberstein, P.E., Thomas, D.H., Mirek, E.T., Palermo, C.F., Sastra, S.A., Dekleva, E.N., Saunders, T., Becerra, C.P., Tattersall, I.W., et al. (2014). Stromal elements act to restrain, rather than support, pancreatic ductal adenocarcinoma. Cancer Cell 25, 735-747.
  21. Bhattacharjee, S., Hamberger, F., Ravichandra, A., Miller, M., Nair, A., Affo, S., Filliol, A., Chin, L., Savage, T.M., Yin, D., et al. (2021). Tumor restriction by type I collagen opposes tumor-promoting effects of cancerassociated fibroblasts. J. Clin. Invest. 131, e146987.
  22. Chen, Y., Kim, J., Yang, S., Wang, H., Wu, C.J., Sugimoto, H., LeBleu, V.S., and Kalluri, R. (2021). Type I collagen deletion in SMA+ myofibroblasts augments immune suppression and accelerates progression of pancreatic cancer. Cancer Cell 39, 548-565.e6.
  23. Chen, Y., McAndrews, K.M., and Kalluri, R. (2021). Clinical and therapeutic relevance of cancer-associated fibroblasts. Nat. Rev. Clin. Oncol. 18, 792-804.
  24. Valkenburg, K.C., De Groot, A.E., and Pienta, K.J. (2018). Targeting the tumour stroma to improve cancer therapy. Nat. Rev. Clin. Oncol. 15, 366-381.
  25. Bughda, R., Dimou, P., D’Souza, R.R., and Klampatsa, A. (2021). Fibroblast Activation Protein (FAP)-Targeted CAR-T Cells: Launching an Attack on Tumor Stroma. ImmunoTargets Ther. 10, 313-323.
  26. Brünker, P., Wartha, K., Friess, T., Grau-Richards, S., Waldhauer, I., Koller, C.F., Weiser, B., Majety, M., Runza, V., Niu, H., et al. (2016). RG7386, a novel tetravalent FAP-DR5 antibody, effectively triggers FAP-dependent, avidity-driven DR5 hyperclustering and tumor cell apoptosis. Mol. Cancer Ther. 15, 946-957.
  27. Chen, Z., Zhou, L., Liu, L., Hou, Y., Xiong, M., Yang, Y., Hu, J., and Chen, K. (2020). Single-cell RNA sequencing highlights the role of inflammatory cancer-associated fibroblasts in bladder urothelial carcinoma. Nat. Commun. 11, 5077.
  28. Puram, S.V., Tirosh, I., Parikh, A.S., Patel, A.P., Yizhak, K., Gillespie, S., Rodman, C., Luo, C.L., Mroz, E.A., Emerick, K.S., et al. (2017). Single-cell transcriptomic analysis of primary and metastatic tumor ecosystems in head and neck cancer. Cell 171, 1611-1624.e24.
  29. Lee, H.-O., Hong, Y., Etlioglu, H.E., Cho, Y.B., Pomella, V., Van den Bosch, B., Vanhecke, J., Verbandt, S., Hong, H., Min, J.W., et al. (2020). Lineagedependent gene expression programs influence the immune landscape of colorectal cancer. Nat. Genet. 52, 594-603.
  30. Lambrechts, D., Wauters, E., Boeckx, B., Aibar, S., Nittner, D., Burton, O., Bassez, A., Decaluwé, H., Pircher, A., Van den Eynde, K., et al. (2018). Phenotype molding of stromal cells in the lung tumor microenvironment. Nat. Med. 24, 1277-1289.
  31. Tietscher, S., Wagner, J., Anzeneder, T., Langwieder, C., Rees, M., Sobottka, B., de Souza, N., and Bodenmiller, B. (2023). A comprehensive single-cell map of T cell exhaustion-associated immune environments in human breast cancer. Nat. Commun. 14, 98.
  32. Friedman, G., Levi-Galibov, O., David, E., Bornstein, C., Giladi, A., Dadiani, M., Mayo, A., Halperin, C., Pevsner-Fischer, M., Lavon, H., et al. (2020). Cancer-associated fibroblast compositions change with breast cancer
    progression linking the ratio of S100A4+ and PDPN+ CAFs to clinical outcome. Nat. Cancer 1, 692-708.
  33. Costa, A., Kieffer, Y., Scholer-Dahirel, A., Pelon, F., Bourachot, B., Cardon, M., Sirven, P., Magagna, I., Fuhrmann, L., Bernard, C., et al. (2018). Fibroblast Heterogeneity and Immunosuppressive Environment in Human Breast Cancer. Cancer Cell 33, 463-479.e10.
  34. Kieffer, Y., Hocine, H.R., Gentric, G., Pelon, F., Bernard, C., Bourachot, B., Lameiras, S., Albergante, L., Bonneau, C., Guyard, A., et al. (2020). Singlecell analysis reveals fibroblast clusters linked to immunotherapy resistance in cancer. Cancer Discov. 10, 1330-1351.
  35. Buechler, M.B., Pradhan, R.N., Krishnamurty, A.T., Cox, C., Calviello, A.K., Wang, A.W., Yang, Y.A., Tam, L., Caothien, R., Roose-Girma, M., et al. (2021). Cross-tissue organization of the fibroblast lineage. Nature 593, 575-579.
  36. Bartoschek, M., Oskolkov, N., Bocci, M., Lövrot, J., Larsson, C., Sommarin, M., Madsen, C.D., Lindgren, D., Pekar, G., Karlsson, G., et al. (2018). Spatially and functionally distinct subclasses of breast can-cer-associated fibroblasts revealed by single cell RNA sequencing. Nat. Commun. 9, 5150.
  37. Cords, L., Tietscher, S., Anzeneder, T., Langwieder, C., Rees, M., de Souza, N., and Bodenmiller, B. (2023). Cancer-associated fibroblast classification in single-cell and spatial proteomics data. Nat. Commun. 14, 4294.
  38. Elyada, E., Bolisetty, M., Laise, P., Flynn, W.F., Courtois, E.T., Burkhart, R.A., Teinor, J.A., Belleau, P., Biffi, G., Lucito, M.S., et al. (2019). Crossspecies single-cell analysis of pancreatic ductal adenocarcinoma reveals antigen-presenting cancer-associated fibroblasts. Cancer Discov. 9, 1102-1123.
  39. Öhlund, D., Handly-Santana, A., Biffi, G., Elyada, E., Almeida, A.S., PonzSarvise, M., Corbo, V., Oni, T.E., Hearn, S.A., Lee, E.J., et al. (2017). Distinct populations of inflammatory fibroblasts and myofibroblasts in pancreatic cancer. J. Exp. Med. 214, 579-596.
  40. Wu, S.Z., Roden, D.L., Wang, C., Holliday, H., Harvey, K., Cazet, A.S., Murphy, K.J., Pereira, B., Al-Eryani, G., Bartonicek, N., et al. (2020). Stromal cell diversity associated with immune evasion in human triplenegative breast cancer. EMBO J. 39, e104063.
  41. Giesen, C., Wang, H.A.O., Schapiro, D., Zivanovic, N., Jacobs, A., Hattendorf, B., Schüffler, P.J., Grolimund, D., Buhmann, J.M., Brandt, S., et al. (2014). Highly multiplexed imaging of tumor tissues with subcelIular resolution by mass cytometry. Nat. Methods 11, 417-422.
  42. Gachechiladze, M., Škarda, J., Kolek, V., Grygárková, I., Langová, K., Bouchal, J., Kolář, Z., Baty, F., Stahel, R., Weder, W., et al. (2017). Prognostic and predictive value of loss of nuclear RAD51 immunoreactivity in resected non-small cell lung cancer patients. Lung Cancer 105, 31-38.
  43. Tischler, V., Pfeifer, M., Hausladen, S., Schirmer, U., Bonde, A.K., Kristiansen, G., Sos, M.L., Weder, W., Moch, H., Altevogt, P., and Soltermann, A. (2011). L1CAM protein expression is associated with poor prognosis in non-small cell lung cancer. Mol. Cancer 10, 127.
  44. Soltermann, A., Tischler, V., Arbogast, S., Braun, J., Probst-Hensch, N., Weder, W., Moch, H., and Kristiansen, G. (2008). Prognostic significance of epithelial-mesenchymal and mesenchymal- epithelial transition protein expression in non-small cell lung cancer. Clin. Cancer Res. 14, 7430-7437.
  45. Berg, S., Kutra, D., Kroeger, T., Straehle, C.N., Kausler, B.X., Haubold, C., Schiegg, M., Ales, J., Beier, T., Rudy, M., et al. (2019). Ilastik: interactive machine learning for (bio) image analysis. Nat. Methods 16, 1226-1232.
  46. McQuin, C., Goodman, A., Chernyshev, V., Kamentsky, L., Cimini, B.A., Karhohs, K.W., Doan, M., Ding, L., Rafelski, S.M., Thirstrup, D., et al. (2018). CellProfiler 3.0: Next-generation image processing for biology. PLoS Biol. 16, e2005970.
  47. Van Gassen, S., Callebaut, B., Van Helden, M.J., Lambrecht, B.N., Demeester, P., Dhaene, T., and Saeys, Y. (2015). FlowSOM: Using selforganizing maps for visualization and interpretation of cytometry data. Cytometry A. 87, 636-645.
  48. Schwörer, S., Cimino, F.V., Ros, M., Tsanov, K.M., Ng, C., Lowe, S.W., Carmona-Fontaine, C., and Thompson, C.B. (2023). Hypoxia Potentiates the Inflammatory Fibroblast Phenotype Promoted by Pancreatic Cancer Cell-Derived Cytokines. Cancer Res. 83, 1596-1610.
  49. Garcia Garcia, C.J., Huang, Y., Fuentes, N.R., Turner, M.C., Monberg, M.E., Lin, D., Nguyen, N.D., Fujimoto, T.N., Zhao, J., Lee, J.J., et al. (2022). Stromal HIF2 Regulates Immune Suppression in the Pancreatic Cancer Microenvironment. Gastroenterology 162, 2018-2031.
  50. Lodyga, M., and Hinz, B. (2020). TGF- – A truly transforming growth factor in fibrosis and immunity. Semin. Cell Dev. Biol. 101, 123-139.
  51. Cremasco, V., Astarita, J.L., Grauel, A.L., Keerthivasan, S., Maclsaac, K., Woodruff, M.C., Wu, M., Spel, L., Santoro, S., Amoozgar, Z., et al. (2018). FAP delineates heterogeneous and functionally divergent stromal cells in immune-excluded breast tumors. Cancer Immunol. Res. 6, 1472-1485.
  52. Canete, N.P., Iyengar, S.S., Ormerod, J.T., Baharlou, H., Harman, A.N., and Patrick, E. (2022). spicyR: spatial analysis of in situ cytometry data in R. Bioinformatics 38, 3099-3105.
  53. Bejarano, L., Jordāo, M.J.C., and Joyce, J.A. (2021). Therapeutic Targeting of the Tumor Microenvironment. Cancer Discov. 11, 933-959.
  54. Zhang, M., Yang, H., Wan, L., Wang, Z., Wang, H., Ge, C., Liu, Y., Hao, Y., Zhang, D., Shi, G., et al. (2020). Single-cell transcriptomic architecture and intercellular crosstalk of human intrahepatic cholangiocarcinoma. J. Hepatol. 73, 1118-1130.
  55. Yu, Z., Zhang, J., Zhang, Q., Wei, S., Shi, R., Zhao, R., An, L., Grose, R., Feng, D., and Wang, H. (2022). Single-cell sequencing reveals the heterogeneity and intratumoral crosstalk in human endometrial cancer. Cell Prolif. 55, e13249.
  56. Foster, D.S., Januszyk, M., Delitto, D., Yost, K.E., Griffin, M., Guo, J., Guardino, N., Delitto, A.E., Chinta, M., Burcham, A.R., et al. (2022). Multiomic analysis reveals conservation of cancer-associated fibroblast phenotypes across species and tissue of origin. Cancer Cell 40, 13921406.e7.
  57. Werba, G., Weissinger, D., Kawaler, E.A., Zhao, E., Kalfakakou, D., Dhara, S., Wang, L., Lim, H.B., Oh, G., Jing, X., et al. (2023). Single-cell RNA sequencing reveals the effects of chemotherapy on human pancreatic adenocarcinoma and its tumor microenvironment. Nat. Commun. 14, 3912.
  58. Keller, P.J., Arendt, L.M., Skibinski, A., Logvinenko, T., Klebba, I., Dong, S., Smith, A.E., Prat, A., Perou, C.M., Gilmore, H., et al. (2012). Defining the cellular precursors to human breast cancer. Proc. Natl. Acad. Sci. USA 109, 2772-2777.
  59. Cheon, H., Wang, Y., Wightman, S.M., Jackson, M.W., and Stark, G.R. (2023). How cancer cells make and respond to interferon-I. Trends Cancer 9, 83-92.
  60. Benveniste, E.N., and Qin, H. (2007). Type I interferons as anti-inflammatory mediators. Sci. STKE 2007, pe70.
  61. Al Bakir, M., Huebner, A., Martínez-Ruiz, C., Grigoriadis, K., Watkins, T.B.K., Pich, O., Moore, D.A., Veeriah, S., Ward, S., Laycock, J., et al. (2023). The evolution of non-small cell lung cancer metastases in TRACERx. Nature 616, 534-542.
  62. Stagg, J., Divisekera, U., McLaughlin, N., Sharkey, J., Pommey, S., Denoyer, D., Dwyer, K.M., and Smyth, M.J. (2010). Anti-CD73 antibody therapy inhibits breast tumor growth and metastasis. Proc. Natl. Acad. Sci. USA 107, 1547-1552.
  63. Turcotte, M., Spring, K., Pommey, S., Chouinard, G., Cousineau, I., George, J., Chen, G.M., Gendoo, D.M.A., Haibe-Kains, B., Karn, T., et al. (2015). CD73 is associated with poor prognosis in high-grade serous ovarian cancer. Cancer Res. 75, 4494-4503.
  64. Wang, L., Zhou, X., Zhou, T., Ma, D., Chen, S., Zhi, X., Yin, L., Shao, Z., Ou, Z., and Zhou, P. (2008). Ecto-5′-nucleotidase promotes invasion, migration and adhesion of human breast cancer cells. J. Cancer Res. Clin. Oncol. 134, 365-372.
  65. Vijayan, D., Young, A., Teng, M.W.L., and Smyth, M.J. (2017). Targeting immunosuppressive adenosine in cancer. Nat. Rev. Cancer 17, 709-724.
Please cite this article in press as: Cords et al., Cancer-associated fibroblast phenotypes are associated with patient outcome in non-small cell lung cancer, Cancer Cell (2023), https://doi.org/10.1016/j.ccell.2023.12.021

مقالة خلية السرطان

سيل برس
الوصول المفتوح

  1. فو، ي.، ليو، س.، ين، س.، نيو، و.، شيونغ، و.، تان، م.، لي، ج.، وزو، م. (2017). من المحتمل أن يكون تأثير واربورغ العكسي نقطة ضعف لأمراض السرطان يمكن استغلالها في علاج السرطان. أونكوتارجت 8، 57813-57825.
  2. بابليدس، س.، ويتاكر-مينيز، د.، كاستيلو-كروس، ر.، فلومينبرغ، ن.، ويتكيفيتش، أ.ك.، فرانك، ب.ج.، كاسيميرو، م.س.، وانغ، س.، فورتينا، ب.، أدي، س.، وآخرون. (2009). تأثير واربورغ العكسي: التحلل الجليكولي الهوائي في الخلايا الليفية المرتبطة بالسرطان وسترومة الورم. دورة الخلية 8، 3984-4001.
  3. دراغيكا، ج.، سونغ، م.، ووانغ، ل. (2020). أدوار IFN- في تقدم الورم وتراجعه مراجعة أبحاث العلامات الحيوية، 8 (BioMed Central Ltd ما لم يُذكر خلاف ذلك. جزء من Springer Nature).
  4. Uyttenhove، C.، Pilotte، L.، Théate، I.، Stroobant، V.، Colau، D.، Parmentier، N.، Boon، T.، و Van den Eynde، B.J. (2003). دليل على آلية مقاومة المناعة الورمية تعتمد على تحلل التريبتوفان بواسطة إندولامين 2،3-ديوكسيجيناز. نات. ميد. 9، 1269-1274.
  5. زيمرمان، ج.أ.، هتياراتشي، م.هـ.، وماكديفيت، ت.س. (2017). تعزيز تثبيط المناعة لخلايا T من خلال العرض المستمر للإنترفيرون النشط بيولوجيًا داخل هياكل الخلايا الجذعية الميزانشيمية ثلاثية الأبعاد. خلايا الجذع ترانسلات. ميد. 6، 223-237.
  6. هو، هـ.، بيوترونسكا، ز.، هير، ب.ج.، تشين، هـ.، مولفي، هـ.إي.، ميفيلد، أ.، نون، س.، كاترمين، ك.، غرينبرغ، م.، ويليامز، أ.، وآخرون. (2021). ثلاثة أنواع فرعية من ليفات سرطان الرئة تحدد نماذج علاجية متميزة. خلية السرطان 39، 1531-1547.e10.
  7. يانغ، د.، ليو، ج.، تشيان، هـ.، وزوانغ، ق. (2023). ك. الخلايا الليفية المرتبطة بالسرطان: من العلوم الأساسية إلى العلاج المضاد للسرطان. إكسب. مول. ميد. 55، 1322-1332.
  8. دومينغيز، سي. إكس.، مولر، س.، كيرثيفاسان، س.، كويبن، هـ.، هونغ، ج.، جيركي، س.، بريارت، ب.، فورمان، أو.، بينبريدج، تي. و.، كاستيجلوني، أ.، وآخرون. (2020). تسلسل RNA على مستوى الخلية الواحدة يكشف عن تطور النسيج الداعم إلى خلايا العضلات الليفية LRRC15+ كعامل محدد لاستجابة المرضى للعلاج المناعي للسرطان. اكتشاف السرطان. 10، 232-253.
  9. بوندجرز، سي.، كالين، م.، هيلستروم، م.، شيدل، س.ج.، أبرامسون، أ.، رينر، أ.، لينداهل، ب.، تشو، هـ.، كيرل، ج.، وبتشولز، سي. (2003). تحديد ملف النسخ الجيني للأجنة الفأرية التي تفتقر إلى عامل نمو الصفائح الدموية-B، مما يحدد RGS5 كعلامة جديدة للخلايا المحيطية وخلايا العضلات الملساء الوعائية. المجلة الأمريكية للطب الشرعي 162، 721-729.
  10. شابيرو، د.، جاكسون، هـ.و.، راغورامان، س.، فيشر، ج.ر.، زانوتيلي، ف.ر.ت.، شولتز، د.، جيسن، س.، كاتينا، ر.، فارغا، ز.، وبودنميلر، ب. (2017). هيستو كات: تحليل أنماط الخلايا والتفاعلات في بيانات قياس الصور المتعددة. نات. ميثودز 14، 873-876.
  11. ويندهاجر، ج.، زانوتيلي، ف.ر.ت.، شولتز، د.، ماير، ل.، دانيال، م.، بودنميلر، ب.، وإلينغ، ن. (2023). سير عمل شامل لمعالجة وتحليل الصور المتعددة. نات. بروتوك. 18، 3565-3613.
  12. ليفين، ج.هـ.، سيموندز، إ.ف.، بندال، س.س.، ديفيس، ك.ل.، أمير، إ.ا.د.، تادمور، م.د.، ليتفين، أ.، فينبرغ، هـ.ج.، ياجر، أ.، زوندر، إ.ر.، وآخرون. (2015). تحليل ظاهري مدفوع بالبيانات لسرطان الدم الحاد يكشف عن خلايا شبيهة بالسلائف ترتبط بالتشخيص. خلية 162، 184-197.
  13. جرينوالد، ن.ف.، ميلر، ج.، موين، إ.، كونغ، أ.، كاجيل، أ.، دوغرتي، ت.، فولاوي، س.س.، ماكنتوش، ب.ج.، ليو، ك.إكس.، شوارتز، م.س.، وآخرون. (2022). تقسيم الخلايا الكاملة لصور الأنسجة بأداء على مستوى الإنسان باستخدام توضيح البيانات على نطاق واسع والتعلم العميق. نات. بيوتكنولوجي. 40، 555-565.
  14. جاكسون، إتش. دبليو.، فيشر، ج. ر.، زانوتيلي، ف. ر. ت.، علي، ح. ر.، ميشيرا، ر.، سويسال، س. د.، موش، هـ.، موانست، س.، فارغا، ز.، ويبر، و. ب.، وبودنميلر، ب. (2020). مشهد علم الأمراض على مستوى الخلية الواحدة لسرطان الثدي. ناتشر 578، 615-620.
  15. روبنسون، م.د.، مكارثي، د.ج.، وسمايث، ج.ك. (2010). حزمة بايكونداكتور لتحليل التعبير التفاضلي لبيانات التعبير الجيني الرقمي. المعلوماتية الحيوية 26، 139-140.
  16. Weber، ل.م.، نوويكا، م.، سونيسون، س.، وروبنسون، م.د. (2019). الاكتشاف التفاضلي في علم الخلايا عالي الأبعاد من خلال التجميع عالي الدقة. اتصالات. بيولوجيا. 2، 183.

طرق النجوم

جدول الموارد الرئيسية

المُعَايِن أو المورد المصدر معرف
الأجسام المضادة
أجسام مضادة وحيدة النسيلة من الأرانب ضد الفيمنتين؛ النسخة (EPR3776)؛ الدفعة (GR286525-2) أبكام قط#ab193555; RRID: AB_2814713
أجسام مضادة متعددة النسائل من الأرانب ضد p75 (CD271)؛ النسخة (polyclonal_ANT-007)؛ الدفعة (ANT007AN0702) مختبرات ألومون القط#ANT-007; RRID: AB_2039968
أرنب مضاد كولاجين I متعدد النسائل؛ النسخة (متعدد النسائل_كولاجين I)؛ الدفعة (GR3271183-3) أبكام قط#ab34710; RRID: AB_731684
أجسام مضادة وحيدة النسيلة من نوع الفيبروكتين؛ النسخة (10/فيبروكتين)؛ الدفعة (6251888) بي دي بيوساينس القط#610078؛ RRID: AB_397486
أجسام مضادة وحيدة النسيلة من نوع رات ضد بودوبلانين؛ النسخة (NC-08)؛ الدفعة (B260834) بيوليجند القط#337002؛ RRID: AB_1595511
أجسام مضادة أحادية النسيلة من نوع الماوس ضد السيتوكيراتين الشامل؛ النسخة (AE1)؛ الدفعة (3252910) ميلبورو القط#MAB1612; RRID: AB_2132794
أجسام مضادة متعددة النسائل من الماعز ضد الكربونيك أنهيدراز IX؛ النسخة (polyclonal_CA9_AF2188)؛ الدفعة (VNQ0319011) أنظمة البحث والتطوير القط#AF2188; RRID: AB_416562
أجسام مضادة وحيدة النسيلة من الأرانب ضد الهيستون H3؛ النسخة (D1H2)؛ الدفعة (15) تكنولوجيا إشارات الخلايا قط#4499BF; RRID: AB_10544537
أرنب متعدد النسائل مضاد لـ CD248؛ النسخة (متعدد النسائل_بروتين تك)؛ الدفعة (00019535) بروتينتيك القط#18160؛ RRID: AB_10858230
أجسام مضادة أحادية النسيلة من نوع الماوس ضد CXCL-12؛ النسخة (79018)؛ الدفعة (JOJ0519031) أنظمة البحث والتطوير قط#MAB350-100; RRID: AB_2088149
أجسام مضادة متعددة النسائل من الماعز ضد LYVE-1؛ النسخة (متعددة النسائل_LYVE-1)؛ الدفعة (KPY0119052) أنظمة البحث والتطوير قط#AF2089; RRID: AB_355144
أجسام مضادة متعددة النسائل من الماعز ضد CCL21؛ النسخة (Polyclonal_CCL21 / 6Ckine)؛ الدفعة (AYJ218071) أنظمة البحث والتطوير قط#AF366; RRID: AB_355327
أجسام مضادة وحيدة النسيلة من نوع الماوس ضد كاديرين-11؛ النسخة (283416)؛ الدفعة (VLT0219091) أنظمة البحث والتطوير القط#MAB1790; RRID: AB_2076970
أحادي النسيلة من نوع الفأر مضاد CD45RA؛ النسخة (HI100)؛ الدفعة (B291512) بيوليجند القط#304102؛ RRID: AB_314406
أجسام مضادة أحادية النسيلة من الأرانب ضد كافولين-1؛ النسخة (D46G3)؛ الدفعة (7) تكنولوجيا إشارات الخلايا قط#3267BF; RRID: AB_2275453
أجسام مضادة وحيدة النسيلة من نوع الفأر ضد FOXP3؛ النسخة (236A/E7)؛ الدفعة (2129676) إي بايوساينس قط#14-4777-82؛ RRID: AB_467556
أجسام مضادة وحيدة النسيلة من الأرانب ضد MMP9؛ النسخة (D6O3H)؛ الدفعة (4) تكنولوجيا إشارات الخلايا القط#A0398; RRID: AB_2798289
أجسام مضادة أحادية النسيلة من الأرانب ضد CD140b/PDGFRb؛ النسخة (Y92)؛ الدفعة (GR296584-4) أبكام قط#ab215978; RRID: AB_2894841
أحادي النسيلة من نوع الفأر مضاد لـ CD8a؛ النسخة (C8/144B)؛ الدفعة (2132595) إي بايوساينس قط#14-0085-82؛ RRID: AB_11150240
أجسام مضادة متعددة النسائل ضد الميالوبيروكسيداز من الأرانب؛ النسخة (أجسام مضادة متعددة النسائل MPO)؛ الدفعة (20071134) داكو القط#AB_2335676; RRID: AB_2335676
أحادي النسيلة من نوع الفأر مضاد لـ CD15؛ النسخة (HI98)؛ الدفعة (B291510) بيوليجند القط#301902؛ RRID: AB_314194
أرنب وحيد النسيلة مضاد-CD4؛ النسخة (EPR6855)؛ الدفعة (GR3215375-27) أبكام قط#ab181724; RRID: AB_2864377
أجسام مضادة أحادية النسيلة من الأرانب ضد إندولامين 2-3-دي أوكسيجيناز؛ النسخة (SP260)؛ الدفعة (GR3259345-2) أبكام قط#ab245737; RRID: AB_2894840
أجسام مضادة أحادية النسيلة من الأرانب ضد CD10؛ النسخة (E5P7S)؛ الدفعة (2) تكنولوجيا إشارات الخلايا قط#65534; RRID: AB_2894842
أجسام مضادة متعددة النسائل من الماعز ضد CD146؛ النسخة (متعددة النسائل_ MCAM/CD146_RnD_AF932)؛ الدفعة (ECL0319041) أنظمة البحث والتطوير القط#AF932; RRID: AB_355721
(يتبع في الصفحة التالية)
يرجى الاستشهاد بهذا المقال في الصحافة كالتالي: كوردس وآخرون، أنماط الخلايا الليفية المرتبطة بالسرطان مرتبطة بنتائج المرضى في سرطان الرئة غير صغير الخلايا، خلية السرطان (2023)،https://doi.org/10.1016/j.ccell.2023.12.021

مقالة خلية السرطان

سيل برس
الوصول المفتوح

مستمر
المُعَايِن أو المورد المصدر معرف
أحادي النسيلة من نوع الفأر ضد SMA؛ النسخة (1A4)؛ الدفعة (2183900) إي بايوساينس قط#14-9760-82؛ RRID: AB_2572996
أجسام مضادة أحادية النسيلة من الأرانب ضد CD73؛ النسخة (D7F9A)؛ الدفعة (2) تكنولوجيا إشارات الخلايا قط#13160BF; RRID: AB_2716625
أحادي النسيلة من الأجسام المضادة للفأر ضد PNAd؛ النسخة (MECA-79)؛ الدفعة (B257139) بيوليجند قط#120802؛ RRID: AB_493555
أجسام مضادة وحيدة النسيلة من الأرانب ضد VCAM-1؛ النسخة (EPR5047)؛ الدفعة (GR3255420-3) أبكام قط#ab215380; RRID: AB_2894839
أجسام مضادة أحادية النسيلة من الأرانب ضد CD34؛ النسخة (EP373Y)؛ الدفعة (GR3271518-1) أبكام قط#ab198395; RRID: AB_2889381
أجسام مضادة متعددة النسائل ضد vWF من الأرانب؛ النسخة (poly vwf)؛ الدفعة (3322998) ميلليبور القطعة#AB7356; RRID: AB_92216
أحادي النسيلة من نوع الفأر مضاد لـ HLA-DR؛ النسخة (TAL 1B5)؛ الدفعة (GR3306331-1) أبكام قط#ab20181; RRID: AB_445401
أجسام مضادة متعددة النسائل من الأرانب ضد CD3؛ النسخة (متعددة النسائل_A0452)؛ الدفعة (20073981) داكو قط#A0452; RRID: AB_2335677
أجسام مضادة متعددة النسائل ضد MMP11 من الأرانب؛ النسخة (متعددة النسائل)؛ الدفعة (GR111256-10) أبكام قط#ab53143; RRID: AB_2042361
أحادي النسيلة من نوع الفأر مضاد للكيراتين الظهاري؛ النسخة (AE3)؛ الدفعة (3255457) ميلبورو القط#MAB1611; RRID: AB_2134409
أجسام مضادة وحيدة النسيلة من نوع الماوس ضد CD20؛ النسخة (L26)؛ الدفعة (2172592) إي بايوساينس قط#14-0202-82; RRID: AB_10734340
أجسام مضادة أحادية النسيلة من الأرانب ضد CD31؛ النسخة (EPR3094)؛ الدفعة (GR3229164-1) أبكام قط#ab207090; RRID: AB_2889382
أجسام مضادة وحيدة النسيلة من الأرانب ضد FSP1 / S100A4؛ النسخة (EPR2761(2))؛ الدفعة (GR317174-3) أبكام قط#136784؛ RRID: AB_10807552
أجسام مضادة متعددة النسائل من الأغنام ضد FAP؛ النسخة (polyclonal_FAP)؛ الدفعة (ZKW0619101) أنظمة البحث والتطوير القط#AF3715; RRID: AB_2102369
أحادي النسيلة من نوع الفأر مضاد لـ CD68؛ النسخة (KP1)؛ الدفعة (2162103) إي بايوساينس قط#14-0688-82; RRID: AB_11151139
أجسام مضادة أحادية النسيلة من الأرانب ضد CD279 (PD-1)؛ النسخة (D4W2J)؛ الدفعة (6) تكنولوجيا إشارات الخلايا القط# I44:I47; RRID: AB_2864408
أرنب وحيد النسيلة مضاد-TCF1/TCF7؛ النسخة (C63D9)؛ الدفعة (10) تكنولوجيا إشارات الخلايا القط#2203؛ RRID: AB_2534154
أحادي النسيلة من نوع الفأر مضاد CD45RO؛ النسخة (UCHL1)؛ الدفعة (B291511) بيوليجند القط#304202؛ RRID: AB_314418
أجسام مضادة وحيدة النسيلة من الأرانب ضد K-Cadherin؛ النسخة (D3T3I)؛ الدفعة (2) تكنولوجيا إشارات الخلايا قط#48111; RRID: AB_2799334
أحادي النسيلة من نوع الفأر مضاد Ki-67؛ النسخة (B56)؛ الدفعة (8239549) بي دي بيوساينس القط#556003؛ RRID: AB_396287
عينات بيولوجية
شرائح TMA من سرطان الرئة غير صغير الخلايا البشري مستشفى جامعة زيورخ، زيورخ، سويسرا https://www.usz.ch/
المواد الكيميائية، الببتيدات، والبروتينات المؤتلفة
مُدخل الإريديوم فلويديجيم قط#201192B
اختبارات تجارية حاسمة
مجموعة ملصقات ماكس بار X8 متعددة المعادن فلويديجيم قط#201300
البيانات المودعة
صور IMC هذه الورقة زينودو: https://doi.org/10.5281/zenodo.7961844
البيانات السريرية هذه الورقة زينودو:
البرمجيات والخوارزميات
CellProfiler v3.1.9 مككوين وآخرون http://cellprofiler.org
هيستو كات شابيرو وآخرون https://github.com/BodenmillerGroup/histoCAT/releases
مستمر
المُعَايِن أو المورد المصدر معرف
إيلاستيك v.1.3.3 بيرغ وآخرون https://www.ilastik.org/news/ 2019/09/30/ilastik-1.3.3
بايثون الإصدار 3.4.3 مؤسسة برمجيات بايثون https://www.python.org
R v4.1 فريق تطوير R الأساسي https://www.r-project.org
أدوات imctools لمختبر بودنميلر مختبر بودنميلر https://github.com/BodenmillerGroup/imctools
خط أنابيب تقسيم مختبر بودنميلر مختبر بودنميلر https://github.com/BodenmillerGroup/ImcSegmentationPipeline
ملحقات بودنميلر سيل بروفايلر مختبر بودنميلر https://github.com/BodenmillerGroup/ImcPluginsCP
تعويض تسرب مختبر بودنميلر مختبر بودنميلر https://github.com/BodenmillerGroup/cyTOFcompensation
imcRtools v1.3.7 ويندهاجر وآخرون https://doi.org/10.1038/s41596-023-00881-0.
Rphenoannoy v0.1.0 ليفين جيه. إتش وآخرون. https://doi.org/10.1016/j.cell.2015.05.047
FLOWSOM v2.2.0 فان وآخرون https://onlinelibrary.wiley.com/doi/ full/10.1002/cyto.a.22625.
رمز التحليل هذه الورقة https://doi.org/10.5281/zenodo. 7981268

توافر الموارد

جهة الاتصال الرئيسية

يرجى توجيه جميع الأسئلة المتعلقة بهذا المخطوط إلى بيرند بودنميلرbernd.bodenmiller@uzh.ch).

توفر المواد

لم يتم إنتاج مواد جديدة ضمن نطاق هذا المشروع.

توفر البيانات والشيفرة

تم إيداع جميع البيانات في زينودو تحتhttps://doi.org/10.5281/zenodo. 7961844 ومتاحة للجمهور اعتبارًا من تاريخ النشر. تم إدراج معرفات الكائن الرقمي (DOIs) في جدول الموارد الرئيسية.
تم إيداع جميع الشيفرات الأصلية في GitHub وهي متاحة للجمهور اعتبارًا من تاريخ النشر. تم إدراج معرفات الكائن الرقمي (DOIs) في جدول الموارد الرئيسية.

تفاصيل النموذج التجريبي وشارك الدراسة

عينة TMA المستخدمة في هذه الدراسة هي عينة سريرية موجودة تم توفيرها بلطف من قبل قسم علم الأمراض في مستشفى جامعة زيورخ (USZ). تم جمع جميع العينات بموافقة لجنة الأخلاقيات في زيورخ #2019-01597 و Stv. 29-2009. المعلومات المتعلقة بالعرق الخاص بالمرضى بالإضافة إلى معلومات عن حالة الطفرة للمرضى غير متاحة لهذه المجموعة. تم تقديم معلومات عن الجنس والعمر كجزء من البيانات السريرية المجهولة، بينما لم يتم جمع معلومات عن الأنساب والعرق والعرقية والحالة الاجتماعية والاقتصادية كجزء من هذه المجموعة وبالتالي فهي غير متاحة. تم تحليل تأثير الجنس كعامل مشترك على النتائج.

تفاصيل الطريقة

لوحة الأجسام المضادة، التلوين، والتصوير

تم إزالة البارافين من العينات أولاً باستخدام HistoClear ثم تم إعادة ترطيبها بسلسلة من الإيثانول المتدرج. ). لاسترجاع المستضد، تم تحضين الشرائح في محلول استرجاع الإبيتوبي الناتج عن الحرارة (Tris-EDTA) عند درجة حموضة 9.2 في لمدة 30 دقيقة. بعد ذلك، تم حجب الشرائح بـ 3% BSA (ألبومين مصل البقر) في محلول ملحي مخفف بترس (TBS-T) (TBS بالإضافة إلى Tween) لمدة 45 دقيقة ثم تم صبغها بمزيج الأجسام المضادة المخفف في TBS مع تويين (الجدول S1) طوال الليل في . بعد الغسل في TBS (Trizma و NaCl عند pH 7.6) لمدة 30 دقيقة، تم صبغ العينات بمركب تداخل DNA (CellID مركب الإريديوم المتداخل، مخفف بنسبة 1:100 في TBS). أخيرًا، تم غمر الشرائح في ماء مقطر مزدوج وجففت باستخدام الهواء المضغوط. تم تحليل الشرائح بواسطة IMC على مدى فترة 7 أسابيع. تم إزالة العينات بالليزر بتردد 400 هرتز باستخدام نظام تصوير الكتلة الهجينة Hyperion المرتبط بجهاز قياس الكتلة بتقنية وقت الطيران Helios بدقة قمنا بضبط الآلة بين كل شريحة TMA لضمان استقرار الآلة. تم فحص صور كل شريحة لتحديد صبغها باستخدام histoCAT. لقد حصلنا على بيانات عن 2070 نواة؛ تم الحصول على نواتين في خطوتين بسبب مشاكل تقنية. و ). و وتم استخدام الهيستون لـ
تم استبعاد كاديرين-6 من جميع التحليلات لأنه لم يظهر أي نمط تلوين محدد. تم اختيار جميع الأجسام المضادة بناءً على دراستنا السابقة حول تغاير CAF بما في ذلك مجموعة بيانات scRNA-seq لسرطان الرئة غير صغير الخلايا. هناك، قمنا أولاً بتعريف أنواع مختلفة من CAF بناءً على التجميع غير المراقب للبيانات النسخية. استنادًا إلى هذه النتائج، اخترنا مجموعة فرعية من العلامات التي سمحت بتحديد هذه الأنواع المختلفة من CAF باستخدام IMC. قمنا بتقييم خصوصيتها من خلال إعادة تجميع بيانات scRNA-seq الخاصة بنا باستخدام هذه المجموعة الفرعية من العلامات فقط. تمكنا من تحديد جميع أنواع CAF الخاصة بنا باستخدام مجموعة علامات IMC الخاصة بنا كما تم اكتشافها باستخدام جميع البيانات النسخية المتاحة.

خط أنابيب التقسيم

تم تحويل البيانات الخام إلى ملفات TIFF وتم تقسيمها باستخدام خط أنابيب يتضمن CellProfiler. وإيلاستيك. تم تقسيم الخلايا باستخدام ilastik مع استخدام الإيريديوم لتلوين النواة، وتم تقليل الخلايا الليفية إلى نواها بناءً على إشارة الإيريديوم ومعاملة إشارة SMA كخلفية. لقد قمنا سابقًا بالتحقق من صحة هذا النهج لتقسيم الخلايا الليفية في دراسة على مجموعة سرطان الثدي، حيث أظهرنا أن هذا التقسيم كشف عن نفس أنواع CAF التي تم اكتشافها باستخدام scRNA-seq وكذلك عند استخدام Mesmer الآلي. التقسيم النووي. أظهرت تحليلاتنا السابقة أن هذا النهج في تقسيم الخلايا يعيد تجسيد تباين الخلايا الليفية السرطانية (CAF) ويسمح لنا بالتحقيق في تباين أنواع CAF. كما تم إنشاء أقنعة الورم-الستروما باستخدام ilastik مع SMA كعلامة لتحديد الستروما وpanCK كعلامة لتحديد الورم. ثم تم استخدام أقنعة الورم-الستروما مع أقنعة الخلايا الفردية لحساب متوسط شدة كل علامة لكل خلية ولتعيين الخلايا كستروما أو ورم بناءً على الموقع المكاني. تم إجراء التعويض باستخدام شريحة التعويض المقاسة التي تحتوي على بقع نقية من كل جسم مضاد موسوم بالمعادن المستخدم لتصحيح التسرب بين القنوات. ثم تم حذف العدادات الخام باستخدام تم قطع النسبة المئوية وتحويلها باستخدام تحويل arc-sinh مع عامل مساعد قدره 1. للتصور، يتم عرض العدات المعيارية المستندة إلى العدات المحولة باستخدام arc-sinh من 0 إلى 1. تم إجراء جميع التحليلات باستخدام القيم المحولة باستخدام arc-sinh.

تجميع نمط الخلايا

تم إجراء جميع التحليلات باستخدام (الإصدار 4.1.2). تم تقسيم جميع الخلايا أولاً إلى خلايا ورمية وغير ورمية باستخدام نموذج خليط غاوسي استنادًا إلى متوسط التعبير الخلوي لـ panCK. تم ذلك لكل كتلة TMA، وجميع الأورام ( ) وغير ورمي ( تم دمج الخلايا. تم تقسيم الخلايا غير الورمية إلى مجموعات فرعية باستخدام مزيج من Rphenograph (Rphenoannoy) وFLOWSOM. تم تجميع كل من مجموعات خلايا غير الورم وخلايا الورم مرة أخرى باستخدام جميع العلامات لضمان نقاء خلايا غير الورم من خلايا الورم. تم دمج خلايا الورم التي تم تحديدها في مراحل التجميع اللاحقة مع خلايا الورم المعرفة سابقًا. احتوى مجموعة البيانات النهائية على خلايا الورم خلايا المناعة، 1,086,678 من الخلايا الليفية، 150,062 من خلايا الأوعية (كلا من خلايا بطانة الأوعية الدموية واللمفاوية)، 588,888 من الخلايا غير المحددة (أخرى)؛ 148 خلية نشأت من الصور المزالة غير مدرجة في مجموعة البيانات النهائية.
تم تجميع الخلايا غير الورمية (Rphenograph، ” ) وتم تقسيمها إلى خلايا الورم، والأوعية، والمناعة، والستروما. تم دمج خلايا الورم في مجموعة خلايا الورم. تم تجميع خلايا المناعة مع جميع العلامات. ثم تم تجميع خلايا المناعة باستخدام FLOWSOM ( ماكس ، مثل ) لاستبعاد خلايا T. تم دمج الخلايا التي عبرت عن CD20 و CD3 في مجموعة خلايا T. ثم تم تجميع خلايا T باستخدام Rphenograph ( ، العنقود 17) أولاً بما في ذلك CD20، مما أسفر عن نسبة قدرها 16,825 الخلايا التي تم دمجها مرة أخرى في مجموعة خلايا المناعة. بعد ذلك، تم تجميع الخلايا باستخدام علامات خلايا T فقط (CD3، CD4، CD8، Ki-67، PD-1، TCF-1/7، IDO، FOXP3) وتم تقسيمها إلى CD4، CD4 T reg، IDO CD4، IDO CD8، Ki-67 CD8، Ki-67 CD4، TCF1/7 CD4، TCF1/7 CD8، PD-1 CD4، CD8. تم تجميع الخلايا المناعية باستثناء خلايا T (Rphenograph، ) وتصنف كخلايا نقي العظام ( “العدلات ( “الخلايا B ( ).
تم تجميع الخلايا الداعمة فوق جميع العلامات، وتم استبعاد 5,612 خلية ورمية و16,641 خلية مناعية. تم استخدام التجميع فوق جميع علامات خلايا الأنسجة الداعمة والأوعية بما في ذلك CD31 وvWF وLYVE-1 وPNAd لتقسيم 508,786 خلية بطانية وليمفاوية (Rphenograph، ). تم تجميع هذه الخلايا (باستخدام SMA، CD146، FAP، VCAM1، بودوبلانين، p75 / CD271، فيمنتين، PNAd، LYVE-1، CD140b، CD34، vWF/CD31، CXCL12، CCL21) لاستبعاد 384,307 من خلايا CAF التي تم دمجها مرة أخرى في مجموعة خلايا CAF. خلايا الأوعية ( ) تم تقسيمها إلى أوردة نهائية عالية البطانة (PNAd /ليفي- /CCL21 الخلايا البطانية اللمفاوية (LYVE- /CCL21 وخلية بطانة الأوعية الدموية (CD146 CCL21 “). CAFs ( ) تم تجميعها بشكل مفرط باستخدام FLOWSOM ( الحد الأقصى: 45 ، بعض ، العلامات المعروضة في خريطة الحرارة، الشكل 2A) ومُعَلَّمة بناءً على تعبير العلامة كالتالي: mCAFs (FAP كولاجين ), iCAFs ( ), tCAFs ( “), خلايا التليف الضام الهجينة (CD10 CAF الحامضية (CAIX ), IFNCAFs (IDO CD34 ), دكاف ( ), PDPN CAFs (PDPN ), و CAFs SMA ( تمت ملاحظة بعض الاختلافات بين أنواع CAF التي تم اكتشافها في هذه المجموعة من البيانات وأنواع CAF التي تم تحديدها في تحليل IMC لسرطان الثدي. في مجموعة بيانات سرطان الثدي، كنا قد حددنا سابقًا المCAF كـ PDPN كولاجين-فيبرونيكتين فاب الخلايا التي لم تعبر عن CD10 أو CD34 أو CD146. في تلك التحليل لم نقم بتلوين MMP-11 بسبب عدم توفر جسم مضاد. الآن بعد أن أصبح لدينا وصول إلى جسم مضاد مضاد لـ MMP-11، قمنا بتحديد mCAFs (MMP11 ) بالإضافة إلى الكولاجين CAFs ( كولاجين “). في المنشور الأصلي لسرطان الثدي، من المحتمل أن تكون هذه المجموعة مجمعة معًا كـ mCAFs. نظرًا لعدم وجود CXCL13 في هذه المجموعة، لم نتمكن من تحديد CXCL13. CAF. CCL21 كانت خلايا CAFs غائبة أيضًا، وهو أمر غير مفاجئ نظرًا لندرتها وارتباطها بـ TLS. كما حددنا خلايا PDPN CAFs في هذه المجموعة من البيانات. المجموعة النهائية من خلايا الورم ( تم تقسيمها إلى خلايا ناقصة الأكسجين وغير ناقصة الأكسجين باستخدام نموذج خليط غاوسي استنادًا إلى تعبير panCK.
تم تقييم التصنيف النهائي للخلايا إلى ورم، نسيج داعم، بالإضافة إلى تصنيف الخلايا إلى ورم، مناعة، خلايا ليفية، وعائية وأخرى من خلال مقارنة توزيع نوع الخلايا داخل أقنعة الورم-النسيج الداعم المعطاة (الجدول S2؛ الأشكال S1B-S1E). وُجد أن 95% من جميع خلايا الورم كانت موجودة في حجرة الورم و أكثر من تم العثور على جميع CAFs في الجزء الداعم. وكانت CAFs المتبقية موجودة في الغالب عند حافة أقنعة الورم (داخل أول ، الجدول S3).

التكميم والتحليل الإحصائي

استبعاد البيانات وتحديد المجموعات

عند تحليل فئات الخلايا الفردية (مثل خلايا CAFs فقط)، الصور التي تحتوي على أقل من 100 خلية (الأدنى ) تم استبعادها من جميع التحليلات الخاصة بـ CAF فقط، مما أسفر عن 1025 مريضًا في المجموع. تم حساب النسب لكل فئة خلوية وتم حساب الكثافات الإجمالية على مدار نواة الورم بالكامل، ما لم يُذكر خلاف ذلك، كمساحة مجموع أقنعة السدى والورم. عند تحليل الارتباطات بين المرضى لجميع أنواع الخلايا، تم استخدام نفس العتبة ( ) تم تطبيقه لاستبعاد الصور ذات عدد الخلايا المنخفض، مما أسفر عن إجمالي 1070 مريضًا. كانت هناك نواتان متاحتان لـ ” للمرضى. قمنا بإجراء تحليل اختبار t المزدوج لمقارنة توزيع جميع أنواع الخلايا بين النواتين لكل مريض. باستثناء CAFs المهيجة ( )، الـ -القيم لجميع تحليلات نوع الخلايا المزدوجة لم تكن ذات دلالة إحصائية ( )، مما يشير إلى أن أنواع الخلايا المختلفة تأتي من نفس التوزيع العام. بالنسبة للمرضى الذين لديهم نواتين، تم حساب النسب لفئة نوع الخلايا المعنية لكلا النواتين معًا. بالنسبة لحسابات الكثافة، تم حساب الكثافات أولاً لكل نواة قبل حساب متوسط النواتين، مشابهًا للنشر الذي قام به فيشر وآخرون.

تحليل المجموعات المتطابقة

تم إنشاء مجموعات التحكم المتطابقة من مجموعات فرعية من مجموعة البيانات. بالنسبة لمقارنة المرضى الذين تلقوا العلاج الكيميائي المساعد مقابل المرضى الذين لم يتلقوا العلاج، تم مطابقة المرضى بناءً على نوع الورم، المرحلة، الجنس، والدرجة. بالنسبة لمقارنة النقائل البعيدة وغيابها، تم مطابقة المرضى حسب نوع الورم، TNM (T فقط)، الدرجة، غياب العلاج المساعد والجنس. ليس لدينا أي معلومات عن تطور النقائل البعيدة بعد التشخيص. حيثما كان ذلك ممكنًا، تم أيضًا مطابقة عدد الخلايا لكل مريض بشكل تقريبي إذا كان هناك أكثر من مرشح تحكم متاح.

التحليلات الإحصائية

تم استخدام اختبار مان-ويتني يو للمقارنات بين مجموعتين، واختبار كروسكال-واليس للمقارنات بين مجموعات متعددة. تم إجراء اختبارات الوفرة التفاضلية باستخدام الحافة و ديفسايت الحزم. قمنا بحساب منحنيات كابلان-ماير لتحليلات البقاء واختبرنا الفروق بين المجموعات باستخدام اختبار لوغ رنك. في حال كانت الفروق في البقاء الوسيطة ذات دلالة إحصائية فقط لنوع CAF المعني في نوع ورم واحد (LUAD، LUSC) يتم الإشارة إلى نوع الورم المعني في الرسم. بالنسبة لجميع التحليلات الأخرى، كانت الفروق في البقاء ذات دلالة إحصائية في كلا نوعي الورم، ويتم عرض التحليل لكامل المجموعة. تم استخدام ارتباط بيرسون لتقييم نسب وأنماط الخلايا. تم استخدام اختبار بونفيروني بعد التحليل في تحليلاتنا لأخذ الاختبارات المتعددة في الاعتبار. تم تصحيح نماذج كوكسPH غير المرتبطة باللاسو لنوع الورم والدرجة. تم إجراء تحليلات الوفرة التفاضلية والبقاء لجميع المرضى مجمعة ومقسمة حسب نوع الورم (LUAD، LUSC) على التوالي. النتائج غير الدالة إحصائياً لا تظهر.

التحليل المكاني

استخدمنا تحليل الجوار histoCAT المضمن في حزمة imcRtools. تم تعيين الحد الأقصى لنصف القطر لكل خلية إلى وقمنا بتحليل أقرب 15 جارة لكل خلية. تم استخدام حزمة spicyR لمقارنة الجيران الخلويين بين مجموعات المرضى المصنفة بناءً على كثافة CAF.

تحليل كشف بقع نقص الأكسجين

لتقييم وفرة الخلايا البطانية كقياس عمودي لنقص الأكسجة في المناطق المحددة بواسطة CAIX بين المناطق ناقصة الأكسجة والعادية، استخدمنا اكتشاف البقع بناءً على الخلايا المحددة على أنها ناقصة الأكسجة. تم حساب رسم بياني مكاني باستخدام التوسع مع عتبة قدرها 15 استنادًا إلى إحداثيات مراكز كل خلية. قمنا بتعريف ‘البقع’ الناقصة الأكسجة والعادية باستخدام التوسع القائم على الرسم البياني من جميع المناطق الناقصة الأكسجة (CAIX الخلايا (عتبة الرسم: 15، التوسع: 5)، تتطلب حدًا أدنى من 10 خلايا ناقصة الأكسجين لتعريف بقعة. لاحظ أن هذه البقع الناقصة الأكسجين يمكن أن تحتوي أيضًا على خلايا طبيعية الأكسجين (CAIX-). ثم تم تصنيف جميع المناطق خارج البقع الناقصة الأكسجين كبقع طبيعية الأكسجين.

  1. (C) نموذج CoxPH لمجموعات المرضى، مصحح لنوع الورم ودرجته. مجموعة المرضى 1 تعمل كمرجع. قيم p مُعَروضة باللون الأزرق، قيم p باللون الرمادي.
    (D و E) مخططات كابلان-ماير (للبقاء العام مقارنةً بالمرضى المصنفين كعالي ومنخفض بناءً على النسبة المتوسطة لأنواع CAF المحددة. CAFs ذات التوقعات الجيدة في D، وCAFs ذات التوقعات السيئة في E. جميع المقارنات التي تظهر اختلافات ذات دلالة إحصائية (اختبار لوغ رانك p < 0.05) موضحة.
    (F) نموذج كوكس بورتنر المعتمد على لاسو والذي يتضمن متوسط نسب أنواع CAF لكل مريض، وتصنيف المرضى إلى مجموعتين عالية ومنخفضة لكل نوع من أنواع CAF (حسب النسبة المتوسطة)، وجميع البيانات السريرية.

Journal: Cancer Cell, Volume: 42, Issue: 3
DOI: https://doi.org/10.1016/j.ccell.2023.12.021
PMID: https://pubmed.ncbi.nlm.nih.gov/38242124
Publication Date: 2024-01-18

Cancer-associated fibroblast phenotypes are associated with patient outcome in non-small cell lung cancer

Cords, Lena ; Engler, Stefanie ; Haberecker, Martina ; Rüschoff, Jan Hendrik ; Moch, Holger ; de Souza, Natalie ; Bodenmiller, Bernd

Article

Cancer-associated fibroblast phenotypes are associated with patient outcome in non-small cell lung cancer

Lena Cords, Stefanie Engler, Martina Haberecker, Jan Hendrik Rüschoff, Holger Moch, Natalie de Souza, and Bernd Bodenmiller Department of Quantitative Biomedicine, University of Zurich, 8057 Zurich, Switzerland Institute of Molecular Health Sciences, ETH Zurich, 8049 Zurich, Switzerland Life Science Zurich Graduate School, ETH Zurich and University of Zurich, 8057 Zurich, Switzerland Department of Pathology and Molecular Pathology, University Hospital Zurich, 8091 Zurich, Switzerland Lead contact*Correspondence: bernd.bodenmiller@uzh.chhttps://doi.org/10.1016/j.ccell.2023.12.021

Abstract

SUMMARY Despite advances in treatment, lung cancer survival rates remain low. A better understanding of the cellular heterogeneity and interplay of cancer-associated fibroblasts (CAFs) within the tumor microenvironment will support the development of personalized therapies. We report a spatially resolved single-cell imaging mass cytometry (IMC) analysis of CAFs in a non-small cell lung cancer cohort of 1,070 patients. We identify four prognostic patient groups based on 11 CAF phenotypes with distinct spatial distributions and show that CAFs are independent prognostic factors for patient survival. The presence of tumor-like CAFs is strongly correlated with poor prognosis. In contrast, inflammatory CAFs and interferon-response CAFs are associated with inflamed tumor microenvironments and higher patient survival. High density of matrix CAFs is correlated with low immune infiltration and is negatively correlated with patient survival. In summary, our data identify phenotypic and spatial features of CAFs that are associated with patient outcome in NSCLC.

INTRODUCTION

Lung cancer is the deadliest cancer worldwide, accounting for of all cancer-related deaths. The most prevalent type of lung cancer is non-small cell lung cancer (NSCLC), with an estimated 5-year survival of 10-23%, and with lung adenocarcinoma (LUAD) and lung squamous cell carcinoma (LUSC) subtypes accounting for more than 70% of all NSCLC cases. Lung cancer is often diagnosed at an advanced stage, and mortality drops to for patients with distant metastases at diagnosis. Thus, there is an urgent need to identify effective therapeutic targets for NSCLC.
Immune checkpoint inhibitor therapy has increased the overall survival of NSCLC patients, showing the potential to target the tumor microenvironment (TME) in this disease, as also seen for other indications. Cancer-associated fibroblasts (CAFs) are a heterogeneous set of cells that are the main constituents of the tumor-surrounding stroma. CAFs drive fibrosis in the TME, causing increased extracellular matrix (ECM) deposition and remodeling, which can actively hamper the anti-tumor immune response by excluding immune cells. In many tumor types, including NSCLC, CAFs impact treatment efficiency; GPR77 and CD10 CAFs are associated with tumor stemness and chemoresistance, whereas LRRC15 CAFs have tumorpromoting and immunosuppressive activity. In NSCLC, the
stromal compartment is also important for cancer progression and therapeutic success but is not well understood.
The effects of CAFs on tumor progression are likely to be multifactorial. CAFs exert their tumor-promoting effects through modulation of inflammation, cell exclusion via altered matrix production, or promotion of cell survival. Certain CAF subtypes also display tumor inhibitory functions and have been linked with improved therapy outcome. For instance, the dense collagen matrix produced by CAFs can restrict tumor growth and metastasis. On the other hand, stromal cell depletion has also been linked to tumor outgrowth despite enhanced immune cell infiltration. Due to their tumor promoting and inhibiting properties, CAFs have recently moved into the spotlight as potential therapeutic targets, but clinical trials broadly targeting the tumor stroma have so far not succeeded. The full extent of CAF heterogeneity and its relationship to tumor biology and clinical outcome needs further study.
We and others have previously proposed a CAF classification system based on single-cell RNA sequencing (scRNA-seq) data from breast, lung, colon, head and neck cancer, and pancreatic ductal adenocarcinoma tumors. The 9 CAF types we annotated in this previous work are tumor type independent, recapitulate CAF types identified in molecular biology studies and are present in NSCLC. Here, we used
IMC to characterize heterogeneous CAF phenotypes and the interactions of these cells with tumor and immune cells in NSCLC. We identified most of our previously annotated CAF types in this dataset, showed that CAF phenotypes were a strong prognostic factor for NSCLC, and identified specific CAF phenotypes associated with good and poor patient prognosis. Further, we discovered that different CAF types varied in their spatial distribution in the TME. Our data lay the foundation for future mechanistic studies to identify CAF phenotypes that causally affect tumor growth or improve immune infiltration.

RESULTS

IMC analysis of non-small cell lung cancer samples

We investigated the phenotypic heterogeneity of CAFs in NSCLC. The tumor microarray (TMA) was generated from samples from a patient cohort ( ) with at least 15 years follow-up (Table 1). The samples included 618 pathologistclassified LUADs and 401 LUSCs; the remaining ( ) were mixed or undefined. Most cancers were stage 1-2, 60 patients had stage 4 tumors. 82 patients who received neoadjuvant therapy (were excluded from survival analyses; all other patient samples ( ) were treatment naive. 730 patients were smokers at diagnosis; 26 patients identified as former smokers and 86 as never smokers. The smoking status of 228 patients and ethnicity of all patients were unknown. Lymph node metastases (TNM: N1-N3) were found in 503 patients and distant metastases (TNM: M1 and M2) in 90 patients at diagnosis. Of all patients, 480 experienced relapses within the 15 years of follow-up. We analyzed two cores for and one core for ( ) of patients; all cores were sampled from the tumor invasive front. For patients with two cores, the distribution of all cell types except hypoxic tCAFs was the same in both cores (STAR Methods), which were pooled for analysis. We also acquired images of 92 cores from normal lungs and patients with other pulmonary morbidities as staining controls. In total, 2,070 cores were analyzed from 1,070 subjects.
We stained the TMA with 45 metal-labeled antibodies, performed IMC analysis, and quantified marker expression in the resulting highly multiplexed images at single-cell resolution (Figure 1A). These data were then used for cellular phenotyping and correlation of cell types and spatial structures with clinical parameters such as survival (Figure 1B). The antibodies were selected to ensure a comprehensive analysis of CAFs and of other cells of the TME such as endothelial cells, epithelial cells, and immune cells including myeloid cells, neutrophils, B cells, and multiple subsets of T cells (Figures 1C and S1A; Table S1). Marker selection for the identification of CAF subsets was based on our previously established CAF panel for IMC analysis of CAFs (STAR Methods) which was also validated against scRNA-seq data from NSCLC.
Cell masks were generated using ilastik training and CellProfiler (Figures 2A and S1B-S1E), using a strategy we previously described and validated for fibroblasts (STAR Methods). We also generated tumor-stroma masks (Figures 2A and S1BS1E), which showed the expected average marker (SMA and panCK) expression per cell (Figures 2A and S1E).
For cell phenotyping, all cells were first split into tumor ( ) and non-tumor cells ( ) using a
Gaussian mixture model based on the expression of panCK. The non-tumor cells were further clustered into immune cells ( ), endothelial cells ( ), and CAFs ( ). Immune cells were then categorized into myeloid cells (HLA-DR and ), neutrophils ( ), B cells ( ), and T cells ( ). T cells were further clustered into those expressing CD4 and those expressing CD8 and then both types were further grouped into IDO and dividing . cells were identified as regulatory T cells. Endothelial cells were divided into blood endothelial cells ( ), lymphatic endothelial cells (LYVE-1 /CD146 ), and high endothelial venules ( PNAd ). Tumor cells were further clustered into non-hypoxic ( ) and hypoxic (panCK ) cells (Figure 2B). CAFs were identified as cells expressing vimentin, SMA, FAP, and PDGFR- and lacking panCK expression. All cores showed varying proportions of tumor, stromal, and immune cells (Figure 2C). Roughly 50% of cells were classified as tumor cells, 20% as stromal cells, and as immune cells; about of cells could not be assigned with our panel (Figures 2D and 2E). We observed no correlation between compositions of these general cell types and clinical parameters such as grade, metastasis, or relapse (Figure 2C).

CAF phenotypes in NSCLC

In order to understand whether CAFs are associated with different states of the TME and with tumor progression in NSCLC, we first analyzed CAF phenotypes in our cohort. The 1,086,678 CAFs were clustered using FLOWSOM to identify subtypes (Figures S2A and S2B). We previously classified CAF subtypes based on scRNA-seq data from breast, lung, colon, head and neck cancer, and pancreatic ductal adenocarcinoma, and validated an IMC panel to identify these CAF types in tumor tissue samples.
Most of these previously defined CAF types were also present in the NSCLC cohort analyzed here, including ifnCAFs (IDO ), tCAFs (CD10 ), hypoxic tCAFs (CAIX ), iCAFs (CD34 CD248 ), vCAF (CD146 ), dCAFs (Ki-67 ), SMA CAFs (SMA Collagen ), and hypoxic CAFs (CAIX ). We also identified PDPN CAFs (PDPN ), which were unique to this NSCLC dataset, and split collagen-expressing CAFs into mCAFs (MMP11 Collagen ), as in our previous scRNA-seq study, and collagen CAFs (Collagen ) (STAR Methods for technical differences with our previous work) (Figures 3A-3D). SMA CAFs made up the biggest proportion of CAFs in our NSCLC dataset, followed by mCAFs, vCAFs, and iCAFs; all CAF types were present in LUAD and LUSC samples (Figure 3A, top). Lacking a suitable antibody for the pericyte marker RGS5, we were not able to distinguish pericytes from fibroblasts. This is especially relevant for SMA CAFs and vCAFs, as their characteristic markers (SMA, CD146, and PDGFR- , respectively) are abundant around vessels. Visual assessment however showed that SMA CAFs as well as PDGFR- CAFs did not exclusively cluster around vessel structures, indicating that these cells are not solely pericytes or smooth muscle vascular cells (Figure 3D). However, as we cannot define pericytes with our current marker panel, they are most likely merged into other CAF phenotypes near vessel cells, especially CD146 vCAFs.
CAFs showed different enrichment patterns between LUAD and LUSC. dCAFs, tCAFs, iCAFs, vCAFs, and SMA CAFs were

Cancer Cell

Article

CellPress

OPEN ACCESS
Table 1. Clinical cohort description
Sex
Male 710 (66.4%)
Female 348 (32.5%)
Missing 12 (1.1%)
Age
Mean (SD) 64.0 (9.96)
Median [Min, Max] 64.5 [18.0, 87.0]
Missing 12 (1.1%)
Tumor type
Adenocarcinoma 618 (57.8%)
Squamous cell carcinoma 401 (37.5%)
Adeno squamous cell carcinoma 32 (3.0%)
Large cell carcinoma 9 (0.8%)
NSCLC 2 (0.2%)
Grade
1 62 (5.8%)
2 481 (45.0%)
3 515 (48.1%)
Missing 12 (1.1%)
Size [cm]
Mean (SD) 4.04 (2.26)
Median [Min, Max] 3.50 [0.300, 16.0]
Missing 12 (1.1%)
T
1 131 (12.2%)
2 129 (12.1%)
3 381 (35.6%)
4 118 (11.0%)
5 215 (20.1%)
6 84 (7.9%)
Missing 12 (1.1%)
N
0 555 (51.9%)
1 268 (25.0%)
2 220 (20.6%)
3 14 (1.3%)
Missing 13 (1.2%)
M
0 967 (90.4%)
1 71 (6.6%)
2 19 (1.8%)
Missing 13 (1.2%)
Stage
1 (IA) 182 (17.0%)
2 (IB) 191 (17.9%)
3 (IIA) 191 (17.9%)
4 (IIB) 113 (10.6%)
5 (IIIA) 289 (27.0%)
6 (IIIB) 32 (3.0%)
7 (IV) 60 (5.6%)
Table 1. Continued
Missing 12 (1.1%)
Chemotherapy (neoadjuvant)
No neoadjuvant chemotherapy 961 (89.8%)
Neoadjuvant chemotherapy 78 (7.3%)
Missing 31 (2.9%)
Radiotherapy (neoadjuvant)
No neoadjuvant radiotherapy 1035 (96.7%)
Neoadjuvant radiotherapy 4 (0.4%)
Missing 31 (2.9%)
Relapse
No relapse 555 (51.9%)
Relapse 480 (44.9%)
Missing 35 (3.3%)
Overall survival
Mean (SD) 1490 (1190)
Median [Min, Max] 1230 [0, 5730]
Missing 2 (0.2%)
Disease free survival
Mean (SD) 1430 (1220)
Median [Min, Max] 1060 [0, 5100]
Missing 138 (12.9%)
Smoking status
No 86 (8.0%)
Currently 730 (68.2%)
Former 26 (2.4%)
Unknown 197 (18.4%)
Missing 31 (2.9%)
Chemotherapy (adjuvant)
Yes 138
No 901
Missing 31
Table 1. Cohort description including number and percentage information on the distribution of sex, age, tumor type, tumor grade, tumor size, TNM classification, tumor stage, neoadjuvant and adjuvant chemotherapy, neoadjuvant radiotherapy, relapse, and smoking status as well as overall and disease-free survival. Categories are printed bold.
more abundant in LUAD, while hypoxic tCAFs, PDPN CAFs, and mCAFs were enriched in LUSC (Figure S3A). We found in addition minor differences between different growth patterns of LUAD, with mCAFs and collagen CAFs enriched in solid and micropapillary tumors, consistent with the relatively high stroma content of these tumor types (Figure S3B). Patients clustered into four patient groups based on proportions of CAF types (Figures 3E, 3F, and S3C), with group 1 enriched in SMA CAFs, group 2 in matrix and collagen CAFs, group 3 in several CAF types including tCAFs, hypoxic CAFs, hypoxic tCAFs and vCAFs, and group 4 in iCAFs and ifnCAFs.

CAF phenotypes are an independent prognostic factor in NSCLC

We next asked whether the CAF types and compositions in a tumor were associated with patient outcome or clinical

Cancer Cell
Article

B
C
CAF Marker CAF Marker Immune Marker Endothelia
PDPN p75 CD45RA/R0 (Immune) VWF/ CD31 (Blood v.)
IDO (ifnCAF) CXCL13 CD3 (T cells) PNAd (HEV)
VCAM CD146 (vCAF) CD4 (T cells) LYVE-1 (Lymhatic)
CAIX (Hypoxic CAF) PDGFR-b CD8 (T cells) VCAM-1 (Vessel)
CXCL12 CCL21 (rCAF) FOXP3 (T regs) CCL21 (Lymphatic)
CD10 (tCAF) CD73 (tCAF) PD-1 (T cell activation) Tumour Marker
Cadherin-11 MMP11 (mCAF) TCF1/7 (T cells) Pan Cytokeratin
FAP CD248 (iCAF) IDO (IFN response) CAIX (Hypoxia)
SMA CAIX (Hypoxia) CD68 (Macrophages)
FSP-1 IDO (IFN response) MPO + MMP9 (N.)
Vimentin CD20 (B cells) General marker
Ki-67 (dCAF) CD11b (Myeloid) Histone H3 (DNA)
Fibronectin + Col. 1 CD15 (Neutrophil) Ki-67 (Division)
CD34 (iCAF) HLA-DR (Myeloid) Caveolin-1
Figure 1. Overview of experimental and analytical set-up
(A) Experimental set-up. NSCLC samples (2070 cores, 1,070 patients) and controls were stained with metal-tagged antibodies and imaged using IMC. Cell and tumor-stroma masks were generated.
(B) Analytical setup. Single-cell data were used to identify cell phenotypes, and to evaluate correlations between cell types and clinical data. CAF based patient stratifications were used for survival and TMA composition analyses. Finally, spatial properties of CAFs and immune cell types were analyzed and integrated with clinical data.
(C) Markers in the antibody panel.
Figure 2. Cell phenotypes and distribution in NSCLC
(A) Exemplary LUAD (left) and LUSC cores (right) after cell segmentation based on panCK as a tumor marker and SMA as a stromal marker. Top to bottom, cells colored by average expression of SMA and panCK; cell assignment based on the generated tumor-stroma masks; cell category assignment; and the binned distance of all non-tumor cells to the nearest tumor-stroma border ( bins [red, orange, yellow, green, blue, purple] from tumor-stroma interface; gray: tumor). (B) Heatmap of marker expression (normalized from 0 to 1 ) for all cell phenotypes (labeled cell types). The bar chart above the heatmap shows the number of cells (square root for visualization) of each cell phenotype per tumor type.
presentation. A comparison between patients with overall survival longer or shorter than the median (3 years in this cohort) identified CAF phenotypes associated with longer survival (ifnCAFs and iCAFs), whereas all other CAF types (e.g., hypoxic tCAFs, tCAFs) were associated with shorter survival (Figure 4A). Similarly, patients who relapsed within the follow-up period of 15 years had tumors enriched for hypoxic tCAFs, hypoxic CAFs, PDPN CAFs, collagen CAFs, tCAFs, and dCAFs (all p < 0.05; Figure S3D), again suggesting that these CAF types are associated with poor patient outcome. Analysis of the association between CAF types and relapse as well as sex generally supported these observations (Figure S3D). Differential analyses conducted separately for LUAD and LUSC tumors showed similar enrichments to the joint analysis (Figures S3E and S3F).
We next studied whether the CAF groups were associated with distinct survival. CAF groups 1 and 4 were enriched for good prognosis CAFs and groups 2 and 3 with poor-prognosis CAFs; these groups indeed showed a significant difference in overall survival (Figure 4B). While the patient groups did not have the same distribution of LUAD and LUSC tumors (Figure 4B), the differences in prognosis between these groups remained in a Cox proportional hazard (CoxPH) model corrected for tumor type (Figure 4C), suggesting that these effects are not explained by tumor type alone. This model was also corrected for grade, which in LUAD is correlated with histological growth patterns, again suggesting that the prognostic differences in the patient groups are independent of LUAD subtypes. Analysis of patients stratified as high and low for some individual CAF types also showed associations with survival, with high proportions of SMA CAFs, ifnCAFs, and iCAFs (only in LUSC) associated with longer survival ( ) (Figure 4D), and high proportions of hypoxic CAFs, collagen CAFs, and tCAFs (only in LUAD) associated with shorter survival ( ) (Figure 4E). High proportions of collagen CAFs, ifnCAFs, and iCAFs and low proportions of vCAFs were also associated with disease-free survival (Figure S4A). Stratifying patients by the median density of the CAF types gave similar results (Figures S4B and S4C). Interestingly, high mCAF density was associated with significantly lower overall survival in LUSC ( , Figure S4B).
A lasso regressed CoxPH model for overall survival considering all CAF types and all clinical factors selected the proportions of tCAFs and hypoxic tCAFs as independent predictors of poor prognosis (Figure 4F). ifnCAF, dCAF, and SMA CAF proportions were predictors of good prognosis, albeit with low hazard ratios (Figure 4F). As expected, other prognostic factors included tumor grade, stage, and metastasis. When density (rather than proportion) of all cell types and clinical parameters were analyzed, hypoxic tCAFs and tCAFs, as well as vCAFs, hypoxic CAFs in general, and mCAFs were predictors of poor prognosis (Figure S4D). Other than the mCAF low stratification, no CAF type was selected as a predictor of good outcome, but clinical features (M0, low stage) were, as expected (Figure S4D). Overall, our differential abundance analysis suggests that specific CAF types and compositions are associated with poor prog-
nosis (tCAFs, hypoxic tCAFs, collagen CAF, and mCAFs) or better prognosis (ifnCAFs, iCAFs, and SMA CAFs) in NSCLC.

CAF types are associated with chemoresistance and metastasis

To gain further insight into potential mechanisms that underlie the prognostic value of specific CAF types, we investigated their relationship with chemoresistance and metastasis as clinically relevant drivers of poor patient outcome in NSCLC. We first asked whether chemotherapy affected CAF type distribution in NSCLC tumors by comparing the 74 patients who had received neoadjuvant chemotherapy with a matched untreated control group ( , STAR Methods). The neoadjuvant-treated group was significantly enriched in dCAFs in both LUAD and LUSC (Figures 5A and 5B, p each), as were SMA CAFs in neo-adjuvant-treated LUSC (Figure 5B, ), suggesting a reactive remodeling stroma after therapy. In LUAD, treatment naive patients were enriched in ifnCAFs and tCAFs ( and (Figure 5A). We observed no other differences between the two groups.
Next, we examined tumors of patients treated with chemotherapy after surgery ( patients) and asked whether the distribution of CAF types was associated with relapse and therefore potentially with resistance to treatment. We detected a significant enrichment of ifnCAFs in LUAD and LUSC patients who did not experience relapse ( patients) in comparison to those who did ( patients) (Figures 5C and 5D). Associations with relapse were different for the two tumor types, with dCAFs, collagen CAFs, and tCAFs being significantly associated with relapse in LUAD (Figure 5C) and PDPN CAFs, hypoxic tCAFs and hypoxic CAFs in LUSC ( ) (Figure 5D). Notably, the CAF type associations with relapse in this smaller, chemo-therapy-treated subset were similar to our observations in the entire cohort, suggesting that these associations are independent of treatment.
We next sought to investigate whether CAF types in the primary tumor were correlated with the occurrence of metastasis. We first compared CAF-type abundance in patients with ( ) and without ( ) lymph node metastasis. Interestingly, we observed that positive-prognostic iCAFs and SMA CAFs were enriched in patients with no dissemination to lymph nodes, while negative-prognostic tCAFs, hypoxic CAFs and hypoxic tCAFs showed the opposite effect (Figures 5E and 5F). Next, we compared patients with distant metastasis at the time of diagnosis ( ) to a matched control group ( , STAR Methods). We compared LUSC and LUAD samples together, given the relatively small sample numbers, and found that higher proportions of tCAFs were associated with distant metastasis at the time of diagnosis, while dCAFs showed the opposite effect (Figure 5G, p < 0.05 in both cases).
Taken together, these results are consistent with our identification of tCAFs and hypoxic tCAFs as poor prognostic factors and of ifnCAFs, iCAFs, SMA CAFs, and dCAFs as good prognostic factors in NSCLC.
Figure 3. CAF phenotypes in NSCLC
(A) Heatmap of mean marker expression (z-scaled from -2 to 3) for all CAF phenotypes identified after FLOWSOM clustering. The bar chart above the heatmap shows the number (square root for visualization) of CAFs per tumor type for each cluster.
(B) UMAP of a random subset ( cells) of CAFs showing the mean intensity per cell (scaled from 0 to 1 ) for the indicated markers.
(C) UMAP of a random subset ( cells) of CAFs colored by subtype.
(D) Images showing all CAFs (left) and SMA CAFs (right); CAFs are shown with white masks overlaid on the indicated markers.
(E) Mean proportions (left plot) and absolute numbers (right plot) of each CAF type per patient are shown. Color bar (right) indicates CAF types. The hierarchical clustering tree is colored (different color scale from CAF types) by four meta-clustered patient groups (1, 2, 3, 4).
(F) Heatmap (z-scaled expression) showing enrichment of each CAF type per patient group as defined in E.
Figure 4. Association of CAF types with clinical parameters
(A) Differential abundance testing of all cell types between patient groups defined by long (left) and short(right) overall survival, split by median. p Values are shown in blue, values in grey.
(B) Kaplan-Meier overall survival curves for patient groups (PG) defined by CAF composition (PG 1-4). The table shows patient numbers according to tumor type and p values for comparison between groups ( , *** ).
Please cite this article in press as: Cords et al., Cancer-associated fibroblast phenotypes are associated with patient outcome in non-small cell lung cancer, Cancer Cell (2023), https://doi.org/10.1016/j.ccell.2023.12.021

CAF types are associated with distinct TME compositions

We next sought to understand whether the prognostic CAF types we have defined are associated with distinct immune compositions. We first analyzed the proportions and the densities of all cell types across the cohort. Neither CAF-type proportions nor densities were strongly correlated with those of other cells of the TME, but a few clusters that included CAFs were detected (Figures S5A and S5B). ifnCAFs formed part of an immune cell cluster that also included B cells, lymphatic endothelial cells, and IDO T cells (Figure S5A, cluster 1). vCAFs and iCAFs were weakly positively correlated with endothelial cells (lymphatic and blood) (Figure S5A, cluster 2); the same was found when cell type densities were analyzed (Figure S5B).
When we analyzed only CAF types, we saw no strong correlations in the data, except that the proportions of mCAFs and SMA CAFs in individual patient images were strongly anti-correlated ( ; Figure S5A); we observed the opposite effect in an analysis of cell density (Figure S5B), most probably reflecting the high density of both of these CAF types in the TME. In addition, proportions of iCAFs were anti-correlated with those of SMA CAFs and mCAFs ( ), and proportions of ifnCAFs were positively correlated with those of iCAFs and tCAFs (p < 0.001; Figure S5A).
iCAFs were significantly, if weakly, anti-correlated with all hypoxic cells (LUAD 0.0012 ) and were enriched in normoxic patches ( , Figures S5C-S5H), in contrast to recent findings in pancreatic cancer, which, however, defined iCAFs using a different marker (IL6) than in this study. Indeed, all of the CAF types were enriched in normoxic patches in our lung dataset, with the exception of hypoxic cells as expected (Figures S5G-S5H). Endothelial cells (marking blood vessels) were enriched in normoxic patches, supporting our definition of cells as genuinely hypoxic.
In the absence of strong correlations at the level of individual CAF phenotypes, we investigated the TME composition of the prognostic patient groups that reflect different CAF compositions. We found that the poor prognostic patient groups were enriched in hypoxic tumor cells as well as neutrophils but depleted of immune cell types (Figures 6A and S6). In contrast, the two good prognostic patient groups showed an overall immune cell-enriched phenotype with little to no hypoxia suggesting a more inflamed TME state in these groups (Figures 6A and S6). Analysis at the level of individual CAF types for patients stratified as “high” or “low” also showed similar trends (Figures S7A and S7B). The exception was TMEs high in tCAFs and PDPN CAFs, which were enriched in cells, cells, neutrophils, regulatory T cells, and myeloid cells, indicative of immune exhaustion (Figure S7A). Taken together, these data show that CAF types and prognostic patient groups defined by CAF composition are associated with distinct TME states.
Poor prognosis groups and their CAF types are found in tumors enriched for exhausted immune cells and hypoxia, and, in contrast, good prognosis patient groups and their CAF types present with a more inflammatory TME.

CAFs have defined spatial distributions within the TME

Since CAF types are associated with TMEs with distinct characteristics, we analyzed the spatial distributions of cell types in NSCLC TMEs. We defined tumor-stroma masks, ensured that the basic cell types were indeed localized in the expected compartments, and calculated the distances of each cell to the closest tumor-stroma interface. We saw striking differences in the spatial distributions of different CAF types (Figure 6B). SMA CAFs and mCAFs were almost exclusively in the stromal compartment, whereas hypoxic tCAFs were almost exclusively in the tumor compartment. Further, tCAFs and iCAFs were generally found in the tumor compartment, whereas ifnCAFs accumulated at the tumor-stroma interface. These results were independent of tumor type (Figure 6B).
Next, we assessed the pairwise spatial interaction between CAFs and all other cells and their association with distinct structures within the TME. A neighborhood analysis over a radius of (STAR Methods) revealed that SMA CAFs, mCAFs, and vCAFs were spatially near each other and that vCAFs and iCAFs were near blood and lymphatic endothelial cells, independent of tumor type (Figures 6C and 6D). The latter observation likely explains the presence of iCAFs in the tumor compartment as a result of vessels being incorporated into tumor masks (Figure 6C). ifnCAFs were near and cells, likely a result of IFN stimulation from surrounding cells; however, only ifnCAFs and T cells showed positive interaction scores with tumor cells. Poor-prognosis tCAFs did not show strong spatial interactions with other cell types but had a slight tendency to neighbor tumor cells and ifnCAFs. All hypoxic cells (hypoxic tCAFs, hypoxic CAFs, and tumor cells) clustered spatially in a hypoxic neighborhood that included collagen CAFs to some extent tCAFs. Collagen CAFs also showed strong interactions with mCAFs. SMA CAFs and mCAFs showed the most cellular interactions, likely reflecting their high abundance, whereas dCAFs and PDPN CAFs showed no strong interactions, consistent with their relative sparsity within the TME. Splitting the neighborhood analyses by tumor type (LUAD vs. LUSC) showed similar patterns (Figure 6C). We did not find any major differences for cell-to-cell interactions when comparing additional clinical parameters or our prognostic patient groups (data not shown).
It is known that fibrosis and a dense stroma can prevent immune cells from reaching the tumor, resulting in poor patient prognosis. Our data revealed that mCAFs are a dominant constituent of the tumor stroma (Figure 3E). Further, high mCAF density was a predictor of poor overall survival in LUSC (Figure S4B) and the mCAF-enriched patient group 2 was

Cancer Cell
Article

Figure 5. CAF types are associated with chemoresistance and metastasis
(A and B) Boxplots showing the average patient proportions for the indicated CAF types comparing patients that received neoadjuvant therapy versus a matched treatment-naïve cohort for LUAD (A) and LUSC (B). Exact p values are indicated.
(C and D) Differential abundance testing of all CAF types comparing patients receiving adjuvant chemotherapy who did or did not relapse, in LUAD (C) and LUSC (D). p Values < 0.05 are shown in blue, p values > 0.05 in grey.
(E and F) Differential abundance testing of all CAF types comparing patients with (N1/2) and without (N0) lymph node at diagnosis, in LUAD (E) and in LUSC (F). p Values < 0.05 are shown in blue, p values > 0.05 in grey.
(G) Boxplot showing the average proportions per patient of the indicated CAF types in matched patient groups with and without distant metastases at diagnosis. Exact p values are indicated.
immune cell depleted compared to the other patient groups (Figure 6A). We therefore analyzed the effects of mCAF density on the spatial distribution of immune cells, by comparing cellular interactions in LUSC patients stratified by median mCAF density (STAR Methods, Figure 7A). This revealed that all immune cells were enriched spatially near tumor cells in patients stratified
as mCAF density low (Figure 7A). Further, all immune cells, including and cells, B cells, myeloid cells, and neutrophils were found significantly more often near the tumor-stroma interface ( ) or invading the tumor in mCAF-low patients compared to mCAF-high patients ( ); with the reverse effect seen further away
Figure 6. The spatial relationship of CAFs with the tumor microenvironment
(A) Heatmap showing enrichment or depletion of cell types between patient groups defined by CAF composition ( , and 4 ).
(B) Density curves showing the distance per cell of the indicated CAF types to the closest tumor-stroma border for LUAD (left) and LUSC (right).
(C) Neighborhood analysis heatmap showing nearest 15 neighbors of each cell within a radius of (to cell, Y axis; from cell, X axis). Plotted are mean significances over all images, split by LUAD (left) and LUSC (right). Positive/negative (red/blue) mean scores indicate higher/lower cellular interactions compared to a random null-distribution.
(D) Images with mask overlays (white) of SMA CAFs (SMA ), mCAFs (MMP11 ), collagen CAFs (Collagen I/Fibronectin ), vCAFs (CD146 ), iCAFs (CD34 ), tCAFs (CD10 ), hypoxic CAFs (CAIX ). The general stroma marker SMA is in red in all cases except for images showing SMA CAFs and hypoxic CAFs. Pan cytokeratin is in magenta in all cases except for the image showing hypoxic CAFs (lower right), all CAFs are panCK ; DNA is in blue. Scalebars are in .

Cancer Cell
Article

Figure 7. High mCAF density blocks out immune cells
(A) SpicyR analysis of cell pairs in patients stratified by median mCAF density. Positive scores (red) indicate higher cellular interactions between cell pairs in patients with low mCAF density, negative scores (blue) indicate higher cellular interactions in patient with high mCAF density; white indicates no difference.
(B) Proportions of B cells (upper) and CD4 cells (lower) in patients stratified by mCAF density, within bins of from the tumor-stroma border ( values < 0.05).
(C and D) Images showing the indicated markers for a mCAF density high image (C) and a mCAF density low image (D), together with the corresponding masks colored by tumor cells (magenta), immune cells (yellow) and mCAFs (cyan). Scale bar, .
from the tumor ( -90 to ) ( ) (Figure 7B). This effect was also visible in images of mCAF density high (Figure 7C) and low samples (Figure 7D). None of the other CAF types showed this effect. Our data thus show that the density of mCAFs might contribute toward poor patient prognosis by driving fibrosis and thus affecting immune cell access to the tumor in NSCLC.
In summary, we have shown that fibroblast phenotypes in the TME are a strong prognostic factor for NSCLC patient outcome. Our data provides evidence for both good- and poor-prognosis CAF types. The presence of tCAFs was strongly correlated with poor prognosis and associated with tumors characterized
by hypoxic and immune-exhausted microenvironments. In contrast, iCAFs that express CD34 and CD248 as well as ifnCAFs were associated with inflamed tumor microenvironments and higher overall patient survival.

DISCUSSION

Understanding cellular processes and interactions in the TME and how they are connected to disease progression and patient outcome is of key importance for patient stratification, therapy development, and ultimately precision oncology applications.
Studies of stromal cells are particularly crucial. The first experimental therapies broadly targeting the tumor stroma have not been successful in clinical studies, suggesting that more precise stromal targets are needed. Here, we identified prognostic cellular factors within the stroma of NSCLC, a disease with poor overall survival and moderate therapeutic response rates. We identified individual CAF types in LUAD and LUSC and studied the composition and spatial organization of these cells within the TME and how these relate to clinical parameters including survival.
Our defined CAF types share markers with CAF types defined by others. CD34 iCAFs have been previously described as Pi16 CAFs, as were cells similar to our ifnCAFs, typically as a subpopulation of a broader iCAF or myofibroblast group ; the same is also true for CCL19/CCL21 rCAFs. We note that iCAFs are frequently described as IL6 CAFs, but we did not include IL-6 in our marker panel due to the lack of a suitable antibody and therefore cannot describe IL-6 expression in our CD34 iCAFs. Previous work has defined inflammatory CAFs with different markers. Also, matrixassociated CAFs have been described in the literature as having high expression of MMP11 and collagens. In our study, we distinguished between mCAFs (FAP MMP11 ) and collagen CAFs (FAP MMP11 ), with the latter cells likely to be a subgroup within the diverse group of matrix-associated CAFs, but that express matrix deposition and remodeling factors other than MMP11. CD10/CD73 CAFs, which we have named tCAFs, have also been previously described, in all cases specifically identified as panCK-negative fibroblasts and thus distinguishing them from epithelial populations that are also known to express CD10. While CD10 is generally used as a marker for alveolar fibroblasts of the lung, high CD10 expression in NSCLC CAFs has been associated with chemoresistance and cancer stemness. Finally, our vCAFs are similar to the MHY aSMA CAFs described by Grout et al. as well as with previously identified vascular or vessel CAFs. Taken together, our analyses show that the commonly used stratification of CAFs into iCAFs, myofibroblasts and apCAFs can be further refined into smaller, functionally relevant groups. Our study unfortunately does not identify antigen-presenting CAFs due to widespread expression of this marker.
We showed that patients can be classified into good and poor prognosis groups based on their CAF composition, independent of tumor type (i.e., LUAD or LUSC), and with individual CAF types also being strong independent prognostic factors in NSCLC. Good prognostic patient groups 1 and 4 were enriched in SMA CAFs, iCAFs, and ifnCAFs, and showed also an immune-enriched microenvironment. Since SMA CAFs and iCAFs are, in addition, spatially near vessel structures, this suggests that these CAF types actively promote immune cell infiltration. ifnCAFs may be an indirect marker for an ongoing immune response; they have been previously associated with inflammation and IFN expression and we previously showed that they strongly express the IFN stimulated chemokines CXCL9, CXCL10, and CXCL11. Further, ifnCAFs are close to tumor cells, suggesting that the ongoing inflammation may directly affect these cells. However, the effect of interferons on tumor cells is complex and may be pro- or anti-tumor. Intriguingly, ifnCAFs were enriched in the tumors of non-relapsing patients both in the
whole cohort and in the subset of patients who received chemotherapy post-surgery, suggesting a tumor-suppressing role of ifnCAFs through interferon signaling cues.
In contrast, tCAFs and mCAFs (among others) were enriched in poor-prognosis patient groups 2 and 3 and were found in hypoxic TMEs enriched in poor prognostic neutrophils. tCAFs and hypoxic tCAFs were further enriched in patients with distant metastases at the time of diagnosis, suggesting the hypothesis that a role of these cell types in metastasis is the reason for their poor prognostic effect. In our previous study, tCAFs also showed enrichment of TGF- signaling, glycolysis, stress response and angiogenesis in a functional enrichment analysis, further pointing toward pro-tumourigenic functions. Since early micrometastasis is a driver of poor patient prognosis, it is conceivable that tCAFs could drive early metastatic dissemination and hence worsen prognosis. This is consistent with their close spatial interaction with tumor cells. We interestingly also observed that tCAFs were depleted in patients post neoadjuvant therapy, which may suggest that tCAFs are either targeted by chemotherapy or that their phenotype depends on close interactions with tumor cells which are depleted by chemotherapy. In contrast, tCAFs and hypoxic tCAFs were enriched in relapsing patients, including those who relapsed after chemotherapy, in line with the known link between stromal CD10 expression and chemoresistance in lung cancer.
Interestingly, our spatial analysis of CAF types in NSCLC revealed no significant differences between LUAD and LUSC as well as between the different growth patterns of LUAD (data not shown). It further showed good correspondence with the spatial CAF-type distributions we detected in our multiplexed imaging study of breast cancer. This suggests that the architecture and spatial distribution of CAF types within the tumor stroma might be conserved across cancer types. It is also conceivable that the different CAF types in cancer are the result of their spatial proximity to different structures (vessels, stroma, and tumor) and therefore of their interaction with different cell types. Mechanistic studies using co-cultures would be useful to investigate CAF plasticity further.
Poor-prognostic tCAFs, as well as good-prognostic and proinflammatory ifnCAFs, are both located near tumor cells, suggesting juxtracrine or paracrine effects between CAFs and tumor cells. tCAFs express CD73, a -nucleotidase that dephosphorylates AMP to adenosine. An increase of available adenosine in the extracellular matrix facilitates growth, migration, survival, and adhesion of tumor cells. Adenosine also has immunosuppressive functions and has been associated with cell exhaustion and thus could indirectly drive tumor growth by facilitating immune escape. tCAFs may therefore promote tumor growth by making adenosine available in the tumor-surrounding stroma. Furthermore, it has previously been shown that tumor cells can reprogram nearby stromal cells for their own metabolic benefit. Based on the physical proximity of tumor cells and tCAFs it could be speculated that this mechanism may be at play. For good-prognostic ifnCAFs, which are also located near tumor cells, expression of IDO suggests that these cells may be reacting to ongoing inflammation, a hypothesis supported by immune cell enrichment in patients with high proportions of ifnCAFs. However, ifnCAF high patients were also significantly enriched for hypoxic tCAFs, myeloid cells and
potentially immunosuppressed IDO T cells. This, and their close interaction with tumor cells stands in conflict with their overall apparent good prognostic function. Functional experiments are needed to fully understand the mechanisms of CAF heterogeneity and the synergistic effect between CAFs, tumor cells and inflammatory processes within the TME. Still, CAFs might serve as a marker for the state of the TME.
We hypothesize that our data may have implications for antiCAF directed therapy, which has so far not been successful. This may be due to targeting of all CAFs, which we would predict to reduce therapeutic efficiency given the mixed prognostic effects we have observed for different CAF types. It would potentially be beneficial, and has been hypothesized before, to target or eliminate poor prognostic CAFs while supporting good prognostic types. Poor prognostic tCAFs and hypoxic tCAFs, which we see are correlated with chemoresistance and metastasis, could be potential cellular targets for precision medicine. Further, if our hypothesis is correct that the spatial proximity of tCAFs with tumor cells is functionally important, a mode of action for potential treatments might lie in interrupting the molecular interactions between these cell types to potentially slow tumor growth and decrease metastasis and chemoresistance. Nevertheless, further experiments will be needed to strengthen the case for these CAF types playing a causal role in tumor growth.
We showed that mCAF density has a negative effect on immune cell infiltration in NSCLC, whereas other CAF types did not play this role. Thus, a dense mCAF barrier may exclude immune cells from the tumor, hamper the anti-immune response and negatively impact patient survival. This finding might suggest that approaches that disrupt the tumor-surrounding stroma may allow more immune cells to reach the tumor and yield higher success rates for immunotherapy. However, previously reported negative effects of stroma depletion must be considered in such settings. In general, a balance between the tumor promoting and suppressing effects of fibrosis must be found if these cells are to be effective drug targets.
More generally, our findings highlight the importance of understanding CAF heterogeneity to enable development of therapies that inhibit functions of poor-prognosis CAFs or that support the good-prognosis ones. Previous work in pancreatic ductal adenocarcinoma and breast cancer suggests that there are links between specific CAF types and patient response to therapy. It will therefore be of interest to analyze in more detail how the stromal compartment changes after different types of therapy and how our defined CAF types relate to therapeutic response. The data we provide here on treatment-naïve patients can serve as a reference in that regard.

Limitations of the study

Our study has limitations: First, despite the highly multiplexed nature of IMC, there may be CAF types that are not captured by our 45 -antibody panel. For instance, due to the lack of a high-quality antibody for pericyte marker RGS5, we cannot distinguish pericytes from vCAFs. We mitigated this effect by careful antibody panel design informed by intensive literature research and by our own and public scRNA-seq data. Second, the simplification of fibroblasts to their nuclear core during segmentation meant that we were unable to investigate interac-
tions that occur at the edges of the cells. Third, only one or two cores were imaged per patient, and all cores were taken from the invasive front. Thus, CAF features and heterogeneity that we describe may be unique to this region of NSCLC tumors. Finally, our study is descriptive and investigated correlation rather than causation, thus, our derived hypotheses are speculative. Nevertheless, this study is the largest multiplex imaging analysis of NSCLC and fibroblasts to date and should serve as a reference and resource for future work.

STAR*METHODS

Detailed methods are provided in the online version of this paper and include the following:
  • KeY RESOURCES TABLE
  • RESOURCE AVAILABILITY
  • Lead contact
  • Material availability
  • Data and code availability
  • EXPERIMENTAL MODEL AND STUDY PARTICIPANT DETAILS
  • METHOD DETAILS
  • Antibody panel, staining, and imaging
  • Segmentation pipeline
  • Cell phenotype clustering
  • QUANTIFICATION AND STATISTICAL ANALYSIS
  • Data exclusion and subsetting
  • Analysis of matched cohorts
  • Statistical analyses
  • Spatial analysis
  • Hypoxia patch detection analysis

SUPPLEMENTAL INFORMATION

Supplemental information can be found online at https://doi.org/10.1016/j. ccell.2023.12.021.

ACKNOWLEDGMENTS

B.B. was funded by two SNSF project grants (#310030_205007: Analysis of breast tumor ecosystem properties for precision medicine approaches and #316030_213512: Cellular-resolution high-performance mass spectrometric imaging of biological samples), an NIH grant (UC4 DK108132), the CRUK IMAXT Grand Challenge, and the European Research Council (ERC) under the European Union’s Horizon 2020 Program under the ERC grant agreement no. 866074 (“Precision Motifs”). B.B. and L.C. were founded by an SNSF SINERGIA project grant (#177208: Defining the identity and differentiation pathways of the immune-stimulating fibroblastic tumor-stroma). We would like to thank the entire consortium of the SNSF SINERGIA grant for the fruitful discussions and especially the Ludewig lab for providing test sample tissues. The graphical abstract was created with BioRender (biorender.com).

AUTHOR CONTRIBUTIONS

L.C. and B.B. conceived the study. L.C. designed the experiments, developed the IMC antibody panel, generated the IMC dataset, analyzed all data, and wrote the manuscript with inputs from N.dS. and B.B. S.E. helped with the IMC antibody panel design and antibody testing. M.H., J.H.R., and H.M. provided the samples as well as the clinical pathological data and gave clinical input. M.H. specified the growth pattern of all LUAD patients. N.dS. supervised writing and revising the manuscript. B.B. supervised the work and provided input at all stages.
Please cite this article in press as: Cords et al., Cancer-associated fibroblast phenotypes are associated with patient outcome in non-small cell lung cancer, Cancer Cell (2023), https://doi.org/10.1016/j.ccell.2023.12.021

Cancer Cell

Article

DECLARATION OF INTERESTS

B.B. has co-founded Navignostics, a spin-off company of the University of Zurich, and is one of its shareholders and a board member.
Received: March 29, 2023
Revised: November 2, 2023
Accepted: December 21, 2023
Published: January 18, 2024

REFERENCES

  1. Sung, H., Ferlay, J., Siegel, R.L., Laversanne, M., Soerjomataram, I., Jemal, A., and Bray, F. (2021). Global cancer statistics 2020: GLOBOCAN estimates of incidence and mortality worldwide for 36 cancers in 185 countries. CA. Cancer J. Clin. 71, 209-249.
  2. Schabath, M.B., and Cote, M.L. (2019). Cancer progress and priorities: Lung cancer. Cancer Epidemiol. Biomarkers Prev. 28, 1563-1579.
  3. Pikor, L.A., Ramnarine, V.R., Lam, S., and Lam, W.L. (2013). Genetic alterations defining NSCLC subtypes and their therapeutic implications. Lung Cancer 82, 179-189.
  4. Garon, E.B., Hellmann, M.D., Rizvi, N.A., Carcereny, E., Leighl, N.B., Ahn, M.J., Eder, J.P., Balmanoukian, A.S., Aggarwal, C., Horn, L., et al. (2019). Five-year overall survival for patients with advanced non-small-cell lung cancer treated with pembrolizumab: results from the phase I KEYNOTE001 study. J. Clin. Oncol. 37, 2518-2527.
  5. Robert, C. (2020). A decade of immune-checkpoint inhibitors in cancer therapy. Nat. Commun. 11, 3801.
  6. Sahai, E., Astsaturov, I., Cukierman, E., DeNardo, D.G., Egeblad, M., Evans, R.M., Fearon, D., Greten, F.R., Hingorani, S.R., Hunter, T., et al. (2020). A framework for advancing our understanding of cancer-associated fibroblasts. Nat. Rev. Cancer 20, 174-186.
  7. Hanahan, D., and Weinberg, R.A. (2011). Hallmarks of cancer: the next generation. Cell 144, 646-674.
  8. Turley, S.J., Cremasco, V., and Astarita, J.L. (2015). Immunological hallmarks of stromal cells in the tumour microenvironment. Nat. Rev. Immunol. 15, 669-682.
  9. Smyth, M.J., Ngiow, S.F., Ribas, A., and Teng, M.W.L. (2016). Combination cancer immunotherapies tailored to the tumour microenvironment. Nat. Rev. Clin. Oncol. 13, 143-158.
  10. Altorki, N.K., Markowitz, G.J., Gao, D., Port, J.L., Saxena, A., Stiles, B., McGraw, T., and Mittal, V. (2019). The lung microenvironment: an important regulator of tumour growth and metastasis. Nat. Rev. Cancer 19, 9-31.
  11. Finak, G., Bertos, N., Pepin, F., Sadekova, S., Souleimanova, M., Zhao, H., Chen, H., Omeroglu, G., Meterissian, S., Omeroglu, A., et al. (2008). Stromal gene expression predicts clinical outcome in breast cancer. Nat. Med. 14, 518-527.
  12. Bruni, D., Angell, H.K., and Galon, J. (2020). The immune contexture and Immunoscore in cancer prognosis and therapeutic efficacy. Nat. Rev. Cancer 20, 662-680.
  13. Su, S., Chen, J., Yao, H., Liu, J., Yu, S., Lao, L., Wang, M., Luo, M., Xing, Y., Chen, F., et al. (2018). CD10+GPR77+ Cancer-Associated Fibroblasts Promote Cancer Formation and Chemoresistance by Sustaining Cancer Stemness. Cell 172, 841-856.e16.
  14. Krishnamurty, A.T., Shyer, J.A., Thai, M., Gandham, V., Buechler, M.B., Yang, Y.A., Pradhan, R.N., Wang, A.W., Sanchez, P.L., Qu, Y., et al. (2022). LRRC15+ myofibroblasts dictate the stromal setpoint to suppress tumour immunity. Nature 611, 148-154.
  15. Genova, C., Dellepiane, C., Carrega, P., Sommariva, S., Ferlazzo, G., Pronzato, P., Gangemi, R., Filaci, G., Coco, S., and Croce, M. (2021). Therapeutic Implications of Tumor Microenvironment in Lung Cancer: Focus on Immune Checkpoint Blockade. Front. Immunol. 12, 799455.
  16. Caligiuri, G., and Tuveson, D.A. (2023). Activated fibroblasts in cancer: Perspectives and challenges. Cancer Cell 41, 434-449.
  17. Grout, J.A., Sirven, P., Leader, A.M., Maskey, S., Hector, E., Puisieux, I., Steffan, F., Cheng, E., Tung, N., Maurin, M., et al. (2022). Spatial Positioning and Matrix Programs of Cancer-Associated Fibroblasts Promote T-cell Exclusion in Human Lung Tumors. Cancer Discov. 12, 2606-2625.
  18. Ogawa, Y., Masugi, Y., Abe, T., Yamazaki, K., Ueno, A., Fujii-Nishimura, Y., Hori, S., Yagi, H., Abe, Y., Kitago, M., and Sakamoto, M. (2021). Three distinct stroma types in human pancreatic cancer identified by image analysis of fibroblast subpopulations and collagen. Clin. Cancer Res. 27, 107-119.
  19. Özdemir, B.C., Pentcheva-Hoang, T., Carstens, J.L., Zheng, X., Wu, C.C., Simpson, T.R., Laklai, H., Sugimoto, H., Kahlert, C., Novitskiy, S.V., et al. (2014). Depletion of carcinoma-associated fibroblasts and fibrosis induces immunosuppression and accelerates pancreas cancer with reduced survival. Cancer Cell 25, 719-734.
  20. Rhim, A.D., Oberstein, P.E., Thomas, D.H., Mirek, E.T., Palermo, C.F., Sastra, S.A., Dekleva, E.N., Saunders, T., Becerra, C.P., Tattersall, I.W., et al. (2014). Stromal elements act to restrain, rather than support, pancreatic ductal adenocarcinoma. Cancer Cell 25, 735-747.
  21. Bhattacharjee, S., Hamberger, F., Ravichandra, A., Miller, M., Nair, A., Affo, S., Filliol, A., Chin, L., Savage, T.M., Yin, D., et al. (2021). Tumor restriction by type I collagen opposes tumor-promoting effects of cancerassociated fibroblasts. J. Clin. Invest. 131, e146987.
  22. Chen, Y., Kim, J., Yang, S., Wang, H., Wu, C.J., Sugimoto, H., LeBleu, V.S., and Kalluri, R. (2021). Type I collagen deletion in SMA+ myofibroblasts augments immune suppression and accelerates progression of pancreatic cancer. Cancer Cell 39, 548-565.e6.
  23. Chen, Y., McAndrews, K.M., and Kalluri, R. (2021). Clinical and therapeutic relevance of cancer-associated fibroblasts. Nat. Rev. Clin. Oncol. 18, 792-804.
  24. Valkenburg, K.C., De Groot, A.E., and Pienta, K.J. (2018). Targeting the tumour stroma to improve cancer therapy. Nat. Rev. Clin. Oncol. 15, 366-381.
  25. Bughda, R., Dimou, P., D’Souza, R.R., and Klampatsa, A. (2021). Fibroblast Activation Protein (FAP)-Targeted CAR-T Cells: Launching an Attack on Tumor Stroma. ImmunoTargets Ther. 10, 313-323.
  26. Brünker, P., Wartha, K., Friess, T., Grau-Richards, S., Waldhauer, I., Koller, C.F., Weiser, B., Majety, M., Runza, V., Niu, H., et al. (2016). RG7386, a novel tetravalent FAP-DR5 antibody, effectively triggers FAP-dependent, avidity-driven DR5 hyperclustering and tumor cell apoptosis. Mol. Cancer Ther. 15, 946-957.
  27. Chen, Z., Zhou, L., Liu, L., Hou, Y., Xiong, M., Yang, Y., Hu, J., and Chen, K. (2020). Single-cell RNA sequencing highlights the role of inflammatory cancer-associated fibroblasts in bladder urothelial carcinoma. Nat. Commun. 11, 5077.
  28. Puram, S.V., Tirosh, I., Parikh, A.S., Patel, A.P., Yizhak, K., Gillespie, S., Rodman, C., Luo, C.L., Mroz, E.A., Emerick, K.S., et al. (2017). Single-cell transcriptomic analysis of primary and metastatic tumor ecosystems in head and neck cancer. Cell 171, 1611-1624.e24.
  29. Lee, H.-O., Hong, Y., Etlioglu, H.E., Cho, Y.B., Pomella, V., Van den Bosch, B., Vanhecke, J., Verbandt, S., Hong, H., Min, J.W., et al. (2020). Lineagedependent gene expression programs influence the immune landscape of colorectal cancer. Nat. Genet. 52, 594-603.
  30. Lambrechts, D., Wauters, E., Boeckx, B., Aibar, S., Nittner, D., Burton, O., Bassez, A., Decaluwé, H., Pircher, A., Van den Eynde, K., et al. (2018). Phenotype molding of stromal cells in the lung tumor microenvironment. Nat. Med. 24, 1277-1289.
  31. Tietscher, S., Wagner, J., Anzeneder, T., Langwieder, C., Rees, M., Sobottka, B., de Souza, N., and Bodenmiller, B. (2023). A comprehensive single-cell map of T cell exhaustion-associated immune environments in human breast cancer. Nat. Commun. 14, 98.
  32. Friedman, G., Levi-Galibov, O., David, E., Bornstein, C., Giladi, A., Dadiani, M., Mayo, A., Halperin, C., Pevsner-Fischer, M., Lavon, H., et al. (2020). Cancer-associated fibroblast compositions change with breast cancer
    progression linking the ratio of S100A4+ and PDPN+ CAFs to clinical outcome. Nat. Cancer 1, 692-708.
  33. Costa, A., Kieffer, Y., Scholer-Dahirel, A., Pelon, F., Bourachot, B., Cardon, M., Sirven, P., Magagna, I., Fuhrmann, L., Bernard, C., et al. (2018). Fibroblast Heterogeneity and Immunosuppressive Environment in Human Breast Cancer. Cancer Cell 33, 463-479.e10.
  34. Kieffer, Y., Hocine, H.R., Gentric, G., Pelon, F., Bernard, C., Bourachot, B., Lameiras, S., Albergante, L., Bonneau, C., Guyard, A., et al. (2020). Singlecell analysis reveals fibroblast clusters linked to immunotherapy resistance in cancer. Cancer Discov. 10, 1330-1351.
  35. Buechler, M.B., Pradhan, R.N., Krishnamurty, A.T., Cox, C., Calviello, A.K., Wang, A.W., Yang, Y.A., Tam, L., Caothien, R., Roose-Girma, M., et al. (2021). Cross-tissue organization of the fibroblast lineage. Nature 593, 575-579.
  36. Bartoschek, M., Oskolkov, N., Bocci, M., Lövrot, J., Larsson, C., Sommarin, M., Madsen, C.D., Lindgren, D., Pekar, G., Karlsson, G., et al. (2018). Spatially and functionally distinct subclasses of breast can-cer-associated fibroblasts revealed by single cell RNA sequencing. Nat. Commun. 9, 5150.
  37. Cords, L., Tietscher, S., Anzeneder, T., Langwieder, C., Rees, M., de Souza, N., and Bodenmiller, B. (2023). Cancer-associated fibroblast classification in single-cell and spatial proteomics data. Nat. Commun. 14, 4294.
  38. Elyada, E., Bolisetty, M., Laise, P., Flynn, W.F., Courtois, E.T., Burkhart, R.A., Teinor, J.A., Belleau, P., Biffi, G., Lucito, M.S., et al. (2019). Crossspecies single-cell analysis of pancreatic ductal adenocarcinoma reveals antigen-presenting cancer-associated fibroblasts. Cancer Discov. 9, 1102-1123.
  39. Öhlund, D., Handly-Santana, A., Biffi, G., Elyada, E., Almeida, A.S., PonzSarvise, M., Corbo, V., Oni, T.E., Hearn, S.A., Lee, E.J., et al. (2017). Distinct populations of inflammatory fibroblasts and myofibroblasts in pancreatic cancer. J. Exp. Med. 214, 579-596.
  40. Wu, S.Z., Roden, D.L., Wang, C., Holliday, H., Harvey, K., Cazet, A.S., Murphy, K.J., Pereira, B., Al-Eryani, G., Bartonicek, N., et al. (2020). Stromal cell diversity associated with immune evasion in human triplenegative breast cancer. EMBO J. 39, e104063.
  41. Giesen, C., Wang, H.A.O., Schapiro, D., Zivanovic, N., Jacobs, A., Hattendorf, B., Schüffler, P.J., Grolimund, D., Buhmann, J.M., Brandt, S., et al. (2014). Highly multiplexed imaging of tumor tissues with subcelIular resolution by mass cytometry. Nat. Methods 11, 417-422.
  42. Gachechiladze, M., Škarda, J., Kolek, V., Grygárková, I., Langová, K., Bouchal, J., Kolář, Z., Baty, F., Stahel, R., Weder, W., et al. (2017). Prognostic and predictive value of loss of nuclear RAD51 immunoreactivity in resected non-small cell lung cancer patients. Lung Cancer 105, 31-38.
  43. Tischler, V., Pfeifer, M., Hausladen, S., Schirmer, U., Bonde, A.K., Kristiansen, G., Sos, M.L., Weder, W., Moch, H., Altevogt, P., and Soltermann, A. (2011). L1CAM protein expression is associated with poor prognosis in non-small cell lung cancer. Mol. Cancer 10, 127.
  44. Soltermann, A., Tischler, V., Arbogast, S., Braun, J., Probst-Hensch, N., Weder, W., Moch, H., and Kristiansen, G. (2008). Prognostic significance of epithelial-mesenchymal and mesenchymal- epithelial transition protein expression in non-small cell lung cancer. Clin. Cancer Res. 14, 7430-7437.
  45. Berg, S., Kutra, D., Kroeger, T., Straehle, C.N., Kausler, B.X., Haubold, C., Schiegg, M., Ales, J., Beier, T., Rudy, M., et al. (2019). Ilastik: interactive machine learning for (bio) image analysis. Nat. Methods 16, 1226-1232.
  46. McQuin, C., Goodman, A., Chernyshev, V., Kamentsky, L., Cimini, B.A., Karhohs, K.W., Doan, M., Ding, L., Rafelski, S.M., Thirstrup, D., et al. (2018). CellProfiler 3.0: Next-generation image processing for biology. PLoS Biol. 16, e2005970.
  47. Van Gassen, S., Callebaut, B., Van Helden, M.J., Lambrecht, B.N., Demeester, P., Dhaene, T., and Saeys, Y. (2015). FlowSOM: Using selforganizing maps for visualization and interpretation of cytometry data. Cytometry A. 87, 636-645.
  48. Schwörer, S., Cimino, F.V., Ros, M., Tsanov, K.M., Ng, C., Lowe, S.W., Carmona-Fontaine, C., and Thompson, C.B. (2023). Hypoxia Potentiates the Inflammatory Fibroblast Phenotype Promoted by Pancreatic Cancer Cell-Derived Cytokines. Cancer Res. 83, 1596-1610.
  49. Garcia Garcia, C.J., Huang, Y., Fuentes, N.R., Turner, M.C., Monberg, M.E., Lin, D., Nguyen, N.D., Fujimoto, T.N., Zhao, J., Lee, J.J., et al. (2022). Stromal HIF2 Regulates Immune Suppression in the Pancreatic Cancer Microenvironment. Gastroenterology 162, 2018-2031.
  50. Lodyga, M., and Hinz, B. (2020). TGF- – A truly transforming growth factor in fibrosis and immunity. Semin. Cell Dev. Biol. 101, 123-139.
  51. Cremasco, V., Astarita, J.L., Grauel, A.L., Keerthivasan, S., Maclsaac, K., Woodruff, M.C., Wu, M., Spel, L., Santoro, S., Amoozgar, Z., et al. (2018). FAP delineates heterogeneous and functionally divergent stromal cells in immune-excluded breast tumors. Cancer Immunol. Res. 6, 1472-1485.
  52. Canete, N.P., Iyengar, S.S., Ormerod, J.T., Baharlou, H., Harman, A.N., and Patrick, E. (2022). spicyR: spatial analysis of in situ cytometry data in R. Bioinformatics 38, 3099-3105.
  53. Bejarano, L., Jordāo, M.J.C., and Joyce, J.A. (2021). Therapeutic Targeting of the Tumor Microenvironment. Cancer Discov. 11, 933-959.
  54. Zhang, M., Yang, H., Wan, L., Wang, Z., Wang, H., Ge, C., Liu, Y., Hao, Y., Zhang, D., Shi, G., et al. (2020). Single-cell transcriptomic architecture and intercellular crosstalk of human intrahepatic cholangiocarcinoma. J. Hepatol. 73, 1118-1130.
  55. Yu, Z., Zhang, J., Zhang, Q., Wei, S., Shi, R., Zhao, R., An, L., Grose, R., Feng, D., and Wang, H. (2022). Single-cell sequencing reveals the heterogeneity and intratumoral crosstalk in human endometrial cancer. Cell Prolif. 55, e13249.
  56. Foster, D.S., Januszyk, M., Delitto, D., Yost, K.E., Griffin, M., Guo, J., Guardino, N., Delitto, A.E., Chinta, M., Burcham, A.R., et al. (2022). Multiomic analysis reveals conservation of cancer-associated fibroblast phenotypes across species and tissue of origin. Cancer Cell 40, 13921406.e7.
  57. Werba, G., Weissinger, D., Kawaler, E.A., Zhao, E., Kalfakakou, D., Dhara, S., Wang, L., Lim, H.B., Oh, G., Jing, X., et al. (2023). Single-cell RNA sequencing reveals the effects of chemotherapy on human pancreatic adenocarcinoma and its tumor microenvironment. Nat. Commun. 14, 3912.
  58. Keller, P.J., Arendt, L.M., Skibinski, A., Logvinenko, T., Klebba, I., Dong, S., Smith, A.E., Prat, A., Perou, C.M., Gilmore, H., et al. (2012). Defining the cellular precursors to human breast cancer. Proc. Natl. Acad. Sci. USA 109, 2772-2777.
  59. Cheon, H., Wang, Y., Wightman, S.M., Jackson, M.W., and Stark, G.R. (2023). How cancer cells make and respond to interferon-I. Trends Cancer 9, 83-92.
  60. Benveniste, E.N., and Qin, H. (2007). Type I interferons as anti-inflammatory mediators. Sci. STKE 2007, pe70.
  61. Al Bakir, M., Huebner, A., Martínez-Ruiz, C., Grigoriadis, K., Watkins, T.B.K., Pich, O., Moore, D.A., Veeriah, S., Ward, S., Laycock, J., et al. (2023). The evolution of non-small cell lung cancer metastases in TRACERx. Nature 616, 534-542.
  62. Stagg, J., Divisekera, U., McLaughlin, N., Sharkey, J., Pommey, S., Denoyer, D., Dwyer, K.M., and Smyth, M.J. (2010). Anti-CD73 antibody therapy inhibits breast tumor growth and metastasis. Proc. Natl. Acad. Sci. USA 107, 1547-1552.
  63. Turcotte, M., Spring, K., Pommey, S., Chouinard, G., Cousineau, I., George, J., Chen, G.M., Gendoo, D.M.A., Haibe-Kains, B., Karn, T., et al. (2015). CD73 is associated with poor prognosis in high-grade serous ovarian cancer. Cancer Res. 75, 4494-4503.
  64. Wang, L., Zhou, X., Zhou, T., Ma, D., Chen, S., Zhi, X., Yin, L., Shao, Z., Ou, Z., and Zhou, P. (2008). Ecto-5′-nucleotidase promotes invasion, migration and adhesion of human breast cancer cells. J. Cancer Res. Clin. Oncol. 134, 365-372.
  65. Vijayan, D., Young, A., Teng, M.W.L., and Smyth, M.J. (2017). Targeting immunosuppressive adenosine in cancer. Nat. Rev. Cancer 17, 709-724.
Please cite this article in press as: Cords et al., Cancer-associated fibroblast phenotypes are associated with patient outcome in non-small cell lung cancer, Cancer Cell (2023), https://doi.org/10.1016/j.ccell.2023.12.021

Cancer Cell Article

CellPress
OPEN ACCESS

  1. Fu, Y., Liu, S., Yin, S., Niu, W., Xiong, W., Tan, M., Li, G., and Zhou, M. (2017). The reverse Warburg effect is likely to be an Achilles’ heel of cancer that can be exploited for cancer therapy. Oncotarget 8, 57813-57825.
  2. Pavlides, S., Whitaker-Menezes, D., Castello-Cros, R., Flomenberg, N., Witkiewicz, A.K., Frank, P.G., Casimiro, M.C., Wang, C., Fortina, P., Addya, S., et al. (2009). The reverse Warburg effect: Aerobic glycolysis in cancer associated fibroblasts and the tumor stroma. Cell Cycle 8, 3984-4001.
  3. Dragica, J., Song, M., and Wang, L. (2020). Roles of IFN- in Tumor Progression and Regression a Review Biomarker Research, 8 (BioMed Central Ltd unless otherwise stated. Part of Springer Nature).
  4. Uyttenhove, C., Pilotte, L., Théate, I., Stroobant, V., Colau, D., Parmentier, N., Boon, T., and Van den Eynde, B.J. (2003). Evidence for a tumoral immune resistance mechanism based on tryptophan degradation by indoleamine 2,3-dioxygenase. Nat. Med. 9, 1269-1274.
  5. Zimmermann, J.A., Hettiaratchi, M.H., and McDevitt, T.C. (2017). Enhanced Immunosuppression of T Cells by Sustained Presentation of Bioactive Interferon- Within Three-Dimensional Mesenchymal Stem Cell Constructs. Stem Cells Transl. Med. 6, 223-237.
  6. Hu, H., Piotrowska, Z., Hare, P.J., Chen, H., Mulvey, H.E., Mayfield, A., Noeen, S., Kattermann, K., Greenberg, M., Williams, A., et al. (2021). Three subtypes of lung cancer fibroblasts define distinct therapeutic paradigms. Cancer Cell 39, 1531-1547.e10.
  7. Yang, D., Liu, J., Qian, H., and Zhuang, Q. (2023). Q. Cancer-associated fibroblasts: from basic science to anticancer therapy. Exp. Mol. Med. 55, 1322-1332.
  8. Dominguez, C.X., Müller, S., Keerthivasan, S., Koeppen, H., Hung, J., Gierke, S., Breart, B., Foreman, O., Bainbridge, T.W., Castiglioni, A., et al. (2020). Single-cell RNA sequencing reveals stromal evolution into LRRC15+ myofibroblasts as a determinant of patient response to cancer immunotherapy. Cancer Discov. 10, 232-253.
  9. Bondjers, C., Kalén, M., Hellström, M., Scheidl, S.J., Abramsson, A., Renner, O., Lindahl, P., Cho, H., Kehrl, J., and Betsholtz, C. (2003). Transcription profiling of platelet-derived growth factor-B-deficient mouse embryos identifies RGS5 as a novel marker for pericytes and vascular smooth muscle cells. Am. J. Pathol. 162, 721-729.
  10. Schapiro, D., Jackson, H.W., Raghuraman, S., Fischer, J.R., Zanotelli, V.R.T., Schulz, D., Giesen, C., Catena, R., Varga, Z., and Bodenmiller, B. (2017). histoCAT: analysis of cell phenotypes and interactions in multiplex image cytometry data. Nat. Methods 14, 873-876.
  11. Windhager, J., Zanotelli, V.R.T., Schulz, D., Meyer, L., Daniel, M., Bodenmiller, B., and Eling, N. (2023). An end-to-end workflow for multiplexed image processing and analysis. Nat. Protoc. 18, 3565-3613.
  12. Levine, J.H., Simonds, E.F., Bendall, S.C., Davis, K.L., Amir, E.a.D., Tadmor, M.D., Litvin, O., Fienberg, H.G., Jager, A., Zunder, E.R., et al. (2015). Data-Driven Phenotypic Dissection of AML Reveals Progenitorlike Cells that Correlate with Prognosis. Cell 162, 184-197.
  13. Greenwald, N.F., Miller, G., Moen, E., Kong, A., Kagel, A., Dougherty, T., Fullaway, C.C., McIntosh, B.J., Leow, K.X., Schwartz, M.S., et al. (2022). Whole-cell segmentation of tissue images with human-level performance using large-scale data annotation and deep learning. Nat. Biotechnol. 40, 555-565.
  14. Jackson, H.W., Fischer, J.R., Zanotelli, V.R.T., Ali, H.R., Mechera, R., Soysal, S.D., Moch, H., Muenst, S., Varga, Z., Weber, W.P., and Bodenmiller, B. (2020). The single-cell pathology landscape of breast cancer. Nature 578, 615-620.
  15. Robinson, M.D., McCarthy, D.J., and Smyth, G.K. (2010). A Bioconductor package for differential expression analysis of digital gene expression data. Bioinformatics 26, 139-140.
  16. Weber, L.M., Nowicka, M., Soneson, C., and Robinson, M.D. (2019). Differential discovery in high-dimensional cytometry via high-resolution clustering. Commun. Biol. 2, 183.

STAR*METHODS

KEY RESOURCES TABLE

REAGENT or RESOURCE SOURCE IDENTIFIER
Antibodies
Rabbit monoclonal anti-Vimentin; Clone (EPR3776); Lot(GR286525-2) Abcam Cat#ab193555; RRID: AB_2814713
Rabbit polyclonal anti-p75 (CD271); Clone (polyclonal_ANT-007); Lot(ANT007AN0702) alomone labs Cat#ANT-007; RRID: AB_2039968
Rabbit polyclonal anti-Collagen I; Clone (Polyclonal_Collagen I); Lot(GR3271183-3) Abcam Cat#ab34710; RRID: AB_731684
Mouse monoclonal anti-Fibronectin; Clone (10/Fibronectin); Lot(6251888) BD Biosciences Cat#610078; RRID: AB_397486
Rat monoclonal anti-Podoplanin; Clone (NC-08); Lot(B260834) Biolegend Cat#337002; RRID: AB_1595511
Mouse monoclonal anti-pan Cytokeratin; Clone (AE1); Lot(3252910) Millipore Cat#MAB1612; RRID: AB_2132794
Goat polyclonal anti-Carbonic Anhydrase IX; Clone (polyclonal_CA9_AF2188); Lot(VNQ0319011) R&D Systems Cat#AF2188; RRID: AB_416562
Rabbit monoclonal anti-Histone H3; Clone (D1H2); Lot(15) Cell Signal Technology Cat#4499BF; RRID: AB_10544537
Rabbit polyclonal anti-CD248; Clone (Polyclonal_Proteintech); Lot(00019535) Proteintech Cat#18160; RRID: AB_10858230
Mouse monoclonal anti-CXCL-12; Clone (79018); Lot(JOJ0519031) R&D Systems Cat#MAB350-100; RRID: AB_2088149
Goat polyclonal anti-LYVE-1; Clone (Polyclonal_LYVE-1); Lot(KPY0119052) R&D Systems Cat#AF2089; RRID: AB_355144
Goat polyclonal anti-CCL21 ; Clone (Polyclonal_CCL21 / 6Ckine); Lot(AYJ218071) R&D Systems Cat#AF366; RRID: AB_355327
Mouse monoclonal anti-Cadherin-11; Clone (283416); Lot(VLT0219091) R&D Systems Cat#MAB1790; RRID: AB_2076970
Mouse monoclonal anti-CD45RA; Clone (HI100); Lot(B291512) Biolegend Cat#304102; RRID: AB_314406
Rabbit monoclonal anti-Caveolin-1; Clone (D46G3); Lot(7) Cell Signal Technology Cat#3267BF; RRID: AB_2275453
Mouse monoclonal anti-FOXP3; Clone (236A/E7); Lot(2129676) eBioscience Cat#14-4777-82; RRID: AB_467556
Rabbit monoclonal anti-MMP9; Clone (D6O3H); Lot(4) Cell Signal Technology Cat#A0398; RRID: AB_2798289
Rabbit monoclonal anti-CD140b/PDGFRb; Clone (Y92); Lot(GR296584-4) Abcam Cat#ab215978; RRID: AB_2894841
Mouse monoclonal anti-CD8a; Clone (C8/144B); Lot(2132595) eBioscience Cat#14-0085-82; RRID: AB_11150240
Rabbit polyclonal anti-Myeloperoxidase; Clone (Polyclonal MPO); Lot(20071134) Dako Cat#AB_2335676; RRID: AB_2335676
Mouse monoclonal anti-CD15; Clone (HI98); Lot(B291510) Biolegend Cat#301902; RRID: AB_314194
Rabbit monoclonal anti-CD4; Clone (EPR6855); Lot(GR3215375-27) Abcam Cat#ab181724; RRID: AB_2864377
Rabbit monoclonal anti-Indoleamine 2-3-dioxygenase; Clone (SP260); Lot(GR3259345-2) Abcam Cat#ab245737; RRID: AB_2894840
Rabbit monoclonal anti-CD10; Clone (E5P7S); Lot(2) Cell Signal Technology Cat#65534; RRID: AB_2894842
Goat polyclonal anti-CD146; Clone (Polyclonal_ MCAM/CD146_RnD_AF932); Lot(ECL0319041) R&D Systems Cat#AF932; RRID: AB_355721
(Continued on next page)
Please cite this article in press as: Cords et al., Cancer-associated fibroblast phenotypes are associated with patient outcome in non-small cell lung cancer, Cancer Cell (2023), https://doi.org/10.1016/j.ccell.2023.12.021

Cancer Cell Article

CellPress
OPEN ACCESS

Continued
REAGENT or RESOURCE SOURCE IDENTIFIER
Mouse monoclonal anti-SMA; Clone (1A4); Lot(2183900) eBioscience Cat#14-9760-82; RRID: AB_2572996
Rabbit monoclonal anti-CD73; Clone (D7F9A); Lot(2) Cell Signal Technology Cat#13160BF; RRID: AB_2716625
Rat monoclonal anti-PNAd; Clone (MECA-79); Lot(B257139) Biolegend Cat#120802; RRID: AB_493555
Rabbit monoclonal anti-VCAM-1; Clone (EPR5047); Lot(GR3255420-3) Abcam Cat#ab215380; RRID: AB_2894839
Rabbit monoclonal anti-CD34; Clone (EP373Y); Lot(GR3271518-1) Abcam Cat#ab198395; RRID: AB_2889381
Rabbit polyclonal anti-vWF; Clone (poly vwf); Lot(3322998) Millipore Cat#AB7356; RRID: AB_92216
Mouse monoclonal anti-HLA-DR; Clone (TAL 1B5); Lot(GR3306331-1) Abcam Cat#ab20181; RRID: AB_445401
Rabbit polyclonal anti-CD3; Clone (polyclonal_A0452); Lot(20073981) Dako Cat#A0452; RRID: AB_2335677
Rabbit polyclonal anti-MMP11; Clone (polyclonal); Lot(GR111256-10) Abcam Cat#ab53143; RRID: AB_2042361
Mouse monoclonal anti-Keratin Epithelial; Clone (AE3); Lot(3255457) Millipore Cat#MAB1611; RRID: AB_2134409
Mouse monoclonal anti-CD20; Clone (L26); Lot(2172592) eBioscience Cat#14-0202-82; RRID: AB_10734340
Rabbit monoclonal anti-CD31; Clone (EPR3094); Lot(GR3229164-1) Abcam Cat#ab207090; RRID: AB_2889382
Rabbit monoclonal anti-FSP1 / S100A4; Clone (EPR2761(2)); Lot(GR317174-3) Abcam Cat#136784; RRID: AB_10807552
Sheep polyclonal anti-FAP; Clone (polyclonal_FAP); Lot(ZKW0619101) R&D Systems Cat#AF3715; RRID: AB_2102369
Mouse monoclonal anti-CD68; Clone (KP1); Lot(2162103) eBioscience Cat#14-0688-82; RRID: AB_11151139
Rabbit monoclonal anti-CD279 (PD-1); Clone (D4W2J); Lot(6) Cell Signal Technology Cat# I44:I47; RRID: AB_2864408
Rabbit monoclonal anti-TCF1/TCF7; Clone (C63D9); Lot(10) Cell Signal Technology Cat#2203; RRID: AB_2534154
Mouse monoclonal anti-CD45RO; Clone (UCHL1); Lot(B291511) Biolegend Cat#304202; RRID: AB_314418
Rabbit monoclonal anti-K-Cadherin ; Clone (D3T3I); Lot(2) Cell Signal Technology Cat#48111; RRID: AB_2799334
Mouse monoclonal anti-Ki-67; Clone (B56); Lot(8239549) BD Biosciences Cat#556003; RRID: AB_396287
Biological samples
Human NSCLC TMA sections University Hospital Zurich, Zurich, Switzerland https://www.usz.ch/
Chemicals, peptides, and recombinant proteins
Iridium intercalator Fluidigm Cat#201192B
Critical commercial assays
MaxPar X8 Multimetal Labeling Kit Fluidigm Cat#201300
Deposited data
IMC images This paper Zenodo: https://doi.org/10.5281/zenodo. 7961844
Clinical data This paper Zenodo:
Software and algorithms
CellProfiler v3.1.9 McQuin et al. http://cellprofiler.org
HistoCAT Schapiro et al. https://github.com/BodenmillerGroup/ histoCAT/releases
Continued
REAGENT or RESOURCE SOURCE IDENTIFIER
Ilastik v.1.3.3 Berg et al. https://www.ilastik.org/news/ 2019/09/30/ilastik-1.3.3
Python v 3.4.3 Python Software Foundation https://www.python.org
R v4.1 R Development Core Team https://www.r-project.org
Bodenmiller lab imctools Bodenmiller lab https://github.com/BodenmillerGroup/ imctools
Bodenmiller lab segmentation pipeline Bodenmiller lab https://github.com/BodenmillerGroup/ ImcSegmentationPipeline
Bodenmiller CellProfiler plugins Bodenmiller lab https://github.com/BodenmillerGroup/ ImcPluginsCP
Bodenmiller lab spillover compensation Bodenmiller lab https://github.com/BodenmillerGroup/ cyTOFcompensation
imcRtools v1.3.7 Windhager et al. https://doi.org/10.1038/s41596-023-00881-0.
Rphenoannoy v0.1.0 Levine JH et al. https://doi.org/10.1016/j.cell.2015.05.047
FLOWSOM v2.2.0 Van et al. https://onlinelibrary.wiley.com/doi/ full/10.1002/cyto.a.22625.
Analysis code This paper https://doi.org/10.5281/zenodo. 7981268

RESOURCE AVAILABILITY

Lead contact

Please direct all questions regarding this manuscript to Bernd Bodenmiller (bernd.bodenmiller@uzh.ch).

Material availability

No new materials were generated within the scope of this project.

Data and code availability

All data have been deposited at zenodo under https://doi.org/10.5281/zenodo. 7961844 and are publicly available as of the date of publication. DOIs are listed in the key resources table.
All original code has been deposited at GitHub and is publicly available as of the date of publication. DOIs are listed in the key resources table.

EXPERIMENTAL MODEL AND STUDY PARTICIPANT DETAILS

The TMA cohort used in this study is an existing clinical sample cohort that was kindly provided by the Pathology Department of the University Hospital Zurich (USZ). All samples were collected with approval of the Ethics Committee of Zurich #2019-01597 and Stv. 29-2009. Information regarding the ethnicity of the patients as well as information on the mutation status of the patients is not available for this cohort. Information about sex and age are provided as part of the anonymised clinical data, information on ancestry, race, ethnicity and the socioeconomic status was not collected as part of this cohort and is thus not available. The influence of sex as a co-founding factor on the results was analysed.

METHOD DETAILS

Antibody panel, staining, and imaging

Samples were first deparaffinised using HistoClear and then rehydrated with a graded ethanol series ( ). For antigen retrieval, the slides were incubated in heat-induced epitope retrieval (Tris-EDTA) buffer at pH 9.2 at for 30 minutes. Afterwards, the slides were blocked with 3% BSA (Bovine serum albumin) in Tris buffered saline with Tween (TBS-T) (TBS plus Tween) for 45 minutes and were then stained with the antibody panel diluted in TBS with Tween (Table S1) overnight at . After washing in TBS (Trizma and NaCl at pH 7.6) for 30 minutes, the samples were stained with a DNA intercalator (CellID Iridium Intercalator, diluted 1:100 in TBS). Finally, the slides were dipped into double distilled and dried with pressured air. Slides were analysed by IMC over a period of 7 weeks. The samples were laser-ablated at 400 Hz using a Hyperion imaging mass cytometry system coupled to a Helios time-of-flight mass cytometer with a resolution of . We tuned the machine between each TMA slide to ensure machine stability. Images of each slide were checked for their staining using histoCAT. We acquired data on 2,070 cores; two cores were acquired in two steps due to technical issues ( and ). and and Histone were used for
segmentation but excluded from subsequent clustering analyses. Cadherin-6 was excluded from all analyses as it did not show any specific staining pattern. All antibodies were selected based on our previous study of CAF heterogeneity including a scRNA-seq dataset of NSCLC. There, we first defined different CAF types based on unsupervised clustering of transcriptomic data. Based on these results, we selected a subset of markers that allowed identification of these different CAF types using IMC. We evaluated their specificity by re-clustering our scRNA-seq data using only this subset of markers. We were able to identify all of our CAF types with our IMC marker subset as detected using all transcriptomic data available.

Segmentation pipeline

The raw data was converted to tiff files and segmented using a pipeline that includes CellProfiler and ilastik. Cells were segmented with ilastik using iridium for nuclear staining, and fibroblasts were reduced to their nuclear cores based on the iridium signal and treating SMA signal as background. We previously validated this approach for fibroblast segmentation in a study on a breast cancer cohort, where we showed that this segmentation revealed the same CAF types as detected with scRNA-seq as well as when using automated Mesmer based nuclear segmentation. Our previous analyses showed that this segmentation approach recapitulates CAF heterogeneity and allows us to investigate CAF type heterogeneity. Tumour-stroma masks were also generated with ilastik using SMA as the marker for stroma identification and panCK as the marker for tumour identification. The tumour-stroma masks were then used together with the single-cell masks to calculate the mean intensity of each marker per cell and to assign cells as either stroma or tumour based on spatial location. Compensation was done using the measured compensation slide that contained pure spots of each used metal-tagged antibody to correct for spill over between channels. The raw counts were then censored using a -percentile cut-off and transformed using arc-sinh transformation with a cofactor of 1 . For visualisation, normalised counts based on the arc-sinh transformed counts from 0 to 1 are shown. All analyses were carried out using the arc-sinh transformed values.

Cell phenotype clustering

All analyses were performed using (version 4.1.2). All cells were first split into tumour and non-tumour cells using a Gaussian mixture model based on the mean cellular expression of panCK. This was done for each TMA block, and all tumour ( ) and non-tumour ( ) cells were merged. The non-tumour cells were subclustered using a combination of Rphenograph (Rphenoannoy) and FLOWSOM. Both the non-tumour and the tumour cell subsets were clustered again using all markers to guarantee purity of non-tumour cells from tumour cells. Tumour cells identified at later clustering stages were merged back with the previously defined tumour cells. The final dataset contained tumour cells, immune cells, 1,086,678 fibroblasts, 150,062 vessel cells (both blood and lymphatic endothelial cells), 588,888 undefined (other) cells; 148 cells that originated from the removed images are not included in the final dataset.
Non-tumour cells were clustered (Rphenograph, ) and split into tumour, vessel, immune, and stromal cells. The tumour cells were merged into the tumour cell subset. Immune were clustered with all markers. The immune cells were then clustered using FLOWSOM ( max , som ) to exclude T cells. Cells that expressed CD20 and CD3 were integrated into the T cell subset. T cells were then clustered with Rphenograph ( , cluster 17) first including CD20, which resulted in a fraction of 16,825 cells that were merged back into the immune cell subset. Subsequently, cells were clustered using only T cell markers (CD3, CD4, CD8, Ki-67, PD-1, TCF-1/7, IDO, FOXP3)) and grouped into CD4, CD4 T reg, IDO CD4, IDO CD8, Ki-67 CD8, Ki-67 CD4, TCF1/7 CD4, TCF1/7 CD8, PD-1 CD4, CD8. Immune cells excluding T cells were clustered (Rphenograph, ) and categorised as myeloid cells ( ), neutrophils ( ), and B cells ( ).
Stromal cells were clustered over all markers, and 5,612 tumour and 16,641 immune cells were excluded. Clustering over all CAF and vessel markers including CD31, vWF, LYVE-1, and PNAd was used to subset 508,786 endothelial and lymphatic cells (Rphenograph, ). These were clustered (using SMA, CD146, FAP, VCAM1, podoplanin, p75 / CD271, vimentin, PNAd, LYVE-1, CD140b, CD34, vWF/CD31, CXCL12, CCL21) to exclude 384,307 CAFs that were merged back into the CAF subset. Vessel cells ( ) were split into high endothelial venules (PNAd /LYVE- /CCL21 ), lymphatic endothelial cells (LYVE- /CCL21 ), and endothelial cells (CD146 CCL21 ). CAFs ( ) were over-clustered using FLOWSOM ( max: 45 , som , markers displayed in heatmap, Figure 2A) and annotated based on marker expression as: mCAFs (FAP Collagen ), iCAFs ( ), tCAFs ( ), hypoxic tCAFs (CD10 ), hypoxic CAFs (CAIX ), IFNCAFs (IDO ), CD34 ), dCAFs ( ), PDPN CAFs (PDPN ), and SMA CAFs ( ). Some differences were observed between the CAF types detected in this dataset and the CAF types identified in the breast cancer IMC analysis. In the breast cancer dataset, we had previously identified mCAFs as PDPN collagen-fibronectin FAP cells that did not express CD10, CD34, or CD146. In that analysis we did not stain for MMP-11 due to the lack of an antibody. Now that we had access to an anti-MMP-11 antibody, we identified mCAFs (MMP11 ) as well as Collagen CAFs ( Collagen ). In the original breast cancer publication these are likely grouped together as mCAFs. Due to the absence of CXCL13 in this panel, we did not identify CXCL13 CAFs. CCL21 CAFs were also absent, which is not surprising given their rarity and association with TLS. We also identified PDPN CAFs in this dataset. The final tumour cell subset ( ) was divided into hypoxic and non-hypoxic cells using a Gaussian mixture model based on panCK expression.
The final cell classification into tumour, stroma as well as cell categorisation into tumour, immune, CAF, vessel and other was evaluated by comparing the cell type distribution within the given tumour-stroma masks (Table S2; Figures S1B-S1E). 95% of all tumour cells were found in the tumour compartment and over of all CAFs were found in the stromal compartment. The remaining CAFs were mostly found at the edge of the tumour masks (within the first , Table S3).

QUANTIFICATION AND STATISTICAL ANALYSIS

Data exclusion and subsetting

When analysing individual cell categories (e.g., CAFs only), the images with less than 100 cells (lowest ) were excluded from all CAF-only analyses, resulting in 1025 patients in total. Proportions were calculated per cell category and overall densities were calculated over the entire tumour core, if not otherwise indicated, as the area sum of the stromal and tumour masks. When analysing correlations between patients for all cell types, the same threshold ( ) was applied to exclude low cell number images, resulting in a total of 1070 patients. Two cores were available for of the patients. We ran a paired t-test analysis comparing the distribution of all cell types between the two cores for each patient. Apart from hypoxic CAFs ( ), the -values for all paired cell type analyses were not significant ( ), suggesting that the different cell types come from the same overall distribution. For patients with two cores, proportions were thus calculated for the respective cell type category for both cores together. For density calculations, the densities were first calculated per core before the mean of the two cores was calculated, similar to the publication by Fischer et al.

Analysis of matched cohorts

Matched control cohorts were generated from subsets of the dataset. For the comparison of neoadjuvant chemotherapy treated versus treatment naive patients were matched based on tumour type, stage, sex, grade. For the comparison of distant metastasis and the absence thereof, patients were matched by tumour type, TNM (T only), grade, absence of neoadjuvant treatment and sex. We do not have any information about the development of distant metastasis after diagnosis. Where possible, cell numbers per patient were also roughly matched if more than one control candidate was available.

Statistical analyses

The Mann-Whitney-U test was used for two-group comparisons and the Kruskal-Wallis test was used for multiple group comparisons. Differential abundance tests were carried out using the edge and diffcyt packages. We calculated Kaplan-Meier curves for survival analyses and tested differences between groups by using log rank test. In case the median survival difference was only significant for the respective CAF type in one tumour type (LUAD, LUSC) the respective tumour type is indicated in the plot. For all other analyses survival differences were significant in both tumour types and the analysis is shown for the whole cohort. Pearson correlation was used for evaluation of cell type proportions and densities. The Bonferroni post-hoc test was used in our analyses to account for multiple testing. The non-lasso regressed CoxPH models was corrected for tumour type and grade. Differential abundance and survival analyses were carried out for all patients pooled and split by tumour type (LUAD, LUSC) respectively. Non-significant results are not being shown.

Spatial analysis

We used the histoCAT neighbourhood analysis included in the imcRtools package. The maximal radius per cell was set to , and we analysed the 15 nearest neighbours of each cell. The spicyR package was used to compare the cellular neighbours between patient groups stratified based on CAF density.

Hypoxia patch detection analysis

In order to assess the abundance of endothelial cells as an orthogonal measure of hypoxia in CAIX-defined hypoxic versus normoxic areas, we used patch detection based on cells defined as hypoxic. A spatial graph using expansion with a threshold of 15 was calculated based on the coordinates of the centroids of each cell. We defined hypoxic and normoxic ‘patches’ using graph-based expansion from all hypoxic (CAIX ) cells (graph threshold: 15 , expansion: 5 ), requiring a minimum of 10 hypoxic cells to define a patch. Note that these hypoxic patches could also contain normoxic (CAIX-) cells. All regions outside of hypoxic patches were then designated as normoxic patches.

  1. (C) CoxPH-model for patient groups, corrected for tumor type and grade. Patient group 1 serves as a reference. p Values are shown in blue, p values in grey.
    (D and E) Kaplan-Meier (plots for overall survival comparing patients stratified as high and low based on the median proportion of indicated CAF types. Good prognosis CAFs are in D, poor prognosis CAFs in E. All comparisons with significant differences (log rank testing p < 0.05) are shown.
    (F) Lasso-regressed CoxPH model including mean CAF type proportions per patient, patient stratification into high and low for each CAF type (by median proportion), and all clinical data.