إحداث ثورة في توقع أمراض القلب باستخدام التعلم الآلي المعزز بالكمّ
س. فينكاتيش بابوب. رامياوجيفين غرايسويل
الملخص
لقد فتحت التطورات الأخيرة في تكنولوجيا الكم فرصًا جديدة لخوارزميات التعلم الآلي لمساعدة صناعة الرعاية الصحية في تشخيص الاضطرابات الصحية المعقدة، مثل أمراض القلب. في هذا العمل، نقوم بتلخيص فعالية QuEML في توقع أمراض القلب. لتقييم أداء QuEML مقابل خوارزميات التعلم الآلي التقليدية، تم استخدام مجموعة بيانات أمراض القلب من كاجل التي تحتوي على 1190 عينة منهامن العينات مصنفة على أنها عينات إيجابية والباقيتم تصنيف العينات على أنها عينات سلبية. تم تقييم أداء QuEML من حيث الدقة، والتميز، والاسترجاع، والخصوصية، ودرجة F1، ووقت التدريب مقارنةً بخوارزميات التعلم الآلي التقليدية. من النتائج التجريبية، لوحظ أن الأساليب الكمية المقترحة توقعت حواليمن العينات الإيجابية كإيجابية ومتوسط لـمن العينات السلبية يتم التنبؤ بها على أنها سلبية بينما يمكن أن تتنبأ الأساليب التقليدية في التعلم الآلي بحواليمن العينات الإيجابية على أنها إيجابية ومن العينات السلبية على أنها سلبية. علاوة على ذلك، تم قياس التعقيد الحسابي لـ QuEML الذي استهلك متوسطلتدريبها في حين أن خوارزميات التعلم الآلي التقليدية يمكن أن تستهلك متوسطاًللتدريب. ومن ثم، وُجد أن QuEL كانت نهجًا واعدًا في توقع أمراض القلب بمعدل دقةوقت التدريب الأعلى وأسرع من ذلك في الأساليب التقليدية لتعلم الآلة.
الكلمات الرئيسية: الحوسبة الكمومية، تعلم الآلة، طرق التجميع، توقع أمراض القلب في العالم الحديث، أصبحت أمراض القلب السبب الرئيسي للوفاة بين البشر. التغيرات في عادات الطعام، ونمط الحياة، والضغط المرتبط بالعمل هي العوامل الرئيسية التي تسهم في زيادة معدل أمراض القلب. أفادت منظمة الصحة العالمية (WHO) أن 17.7 مليون شخص حول العالم يعانون من أمراض القلب كل عام.وفقًا للتقرير الذي أصدرته العبء العالمي للأمراض في عام 2016، تأثر 1.7 مليون هندي بأمراض القلب والأوعية الدموية.مرض الشريان التاجي (CAD) هو أكثر أنواع أمراض القلب والأوعية الدموية شيوعًا، والسبب وراء مرض الشريان التاجي هو انسداد أو عائق في واحد على الأقل من الشرايين التاجية. لذلك، فإن نقص إمدادات الدم سيتسبب في تلف القلب والدماغ والساقين، مما يؤدي بدوره إلى النوبات القلبية وتمزق الأوعية الدموية. تقريبًايعاني الناس في جميع أنحاء العالم من مرض الشريان التاجي ومن الميزانية السنوية تم إنفاقه على علاج CADتزيد الأمراض القلبية مثل مرض الشريان التاجي من الإنفاق على الرعاية الصحية وتقلل من إنتاجية الفرد. ومن ثم، هناك حاجة إلى آليات وقائية وتشخيصية دقيقة لتقليل معدل الوفيات الناتج عن مرض الشريان التاجي.
عادةً، يمكن تشخيص أمراض القلب من خلال الفحص اليدوي لعوامل الخطر مثل عمر المريض، الجنس، التاريخ العائلي، نمط الحياة، إلخ، وتقارير الفحص البدني، وتحليل أعراض المريض. لكن الفحص اليدوي يؤدي إلى توقعات غير دقيقة حيث قد تظل بعض المعايير التي يجب تحليلها مخفية، ومن المكلف حسابياً تحليل مثل هذه العوامل الضخمة.تُستخدم الأشعة التاجية على نطاق واسع كأكثر الطرق دقة لتشخيصومع ذلك، فإنها مرتبطة بتكاليف عالية وآثار جانبية كبيرة. تعاني قطاعات الرعاية الصحية من صعوبة تقديم تشخيصات موثوقة بتكلفة معقولة. علاوة على ذلك، فإن الكشف القائم على الصور أكثر تكلفة وغير مناسب لفحص السكان الكبيرين. لذلك، سعى العديد من الباحثين لتطوير نظام تشخيص آلي غير جراحي واقتصادي وسريع للكشف المبكر عن مرض الشريان التاجي استنادًا إلى خوارزميات التعلم الآلي.
العديد من خوارزميات التعلم الآليلقد أظهرت نتائج واعدة من حيث زيادة معدل الدقة وتسريع الأداء في التشخيص المبكر لأمراض القلب من خلال تحديد الأنماط الخفية. على الرغم من هذه الفوائد الكبيرة، لا يزال هناك عنق زجاجة حسابي عند التعامل مع بيانات أكبر وأكثر تعقيدًا باستخدام الطرق التقليدية.
نتائج الحواسيب خوارزميات التعلم الآلي غير قادرة على التعامل مع المهام الغنية حسابياًفي هذه المرحلة، قدم مبدأ الحوسبة الكمومية يد العون لتعزيز القدرة الحاسوبية. وبالتالي، تسهل خوارزميات التعلم الآلي المعززة بالكموم الصناعات الصحية لتقييم وعلاج الاضطرابات الصحية المعقدة.
المساهمة الرئيسية في هذه المقالة هي إجراء دراسة تجريبية حول خوارزميات التعلم الآلي المختلفة التي تم استخدامها مؤخرًا في التنبؤ بأمراض القلب، والتي تم من خلالها تحديد طرق التعلم الآلي المناسبة. ثم كشفت هذه الدراسة عن أساسيات دمج الحوسبة الكمومية لتعزيز خوارزميات التعلم الآلي لتسريع عملية الحساب. بعد ذلك، تم تقييم تقنيات QuEML المقترحة بناءً على الميزات المختارة التي تظهر دقة وسرعة أكبر في التنبؤ.
تبدأ الورقة بتقديم نظرة عامة على خوارزميات التعلم الآلي المختلفة المستخدمة في تشخيص القلب، والتي تم تقديمها في “المقدمة”. يتبع ذلك دراسة مفصلة لخوارزميات التعلم الآلي والتعلم الآلي الكمي لاستكشاف نقاط قوتها وضعفها في اكتشاف الأمراض، والتي تم شرحها في “خلفية الدراسة”. علاوة على ذلك، يتم تقديم شرح لآلية عمل خوارزميات التعلم الآلي المعزز كميًا (QML) في “مواد النظام وطرق البحث”. ثم يتم عرض النتائج التجريبية، التي تم الحصول عليها من استخدام مجموعات البيانات، في “النتائج والمناقشات” لإظهار فعالية طرق التشخيص. تختتم الورقة بتلخيص النتائج وتسليط الضوء على المجالات المحتملة للتحسين في المستقبل، والتي تم تقديمها في “الخاتمة”.
خلفية الدراسة
تتناول هذه القسم تقنيات التعلم الآلي المختلفة التي استخدمها عدد من الأكاديميين لتشخيص أمراض القلب بشكل فعال. السبب الرئيسي لاستخدام خوارزمية التعلم الآلي هو أنها قادرة على اكتشاف الأنماط الخفية ويمكنها العمل مع مجموعات بيانات كبيرة لإجراء التنبؤات. كان سيد وآخرون مشاركين في تطوير تشخيص أمراض القلب المعتمد على SVM باستخدام مجموعات البيانات كليفلاند، والمجر، وسويسرا، ومجموعة مدمجة من جميعها (709 حالات). ثم، تم الاستفادة من مزايا خوارزميات اختيار الميزات المعتمدة على متوسط فيشر واختيار الميزات المعتمدة على الدقة لتحقيق اختيار ميزات مثالي. بعد ذلك، يتم تنقيح مجموعة الميزات المختارة من خلال تحليل المكونات الرئيسية. أخيرًا، يتم تطبيق آلة الدعم المعتمدة على نواة دالة القاعدة الشعاعية على مجموعة الميزات المخفضة لتصنيف مرضى القلب عن الأشخاص العاديين. أظهرت نتائجهم التجريبية أن الإطار المقترح يتفوق بمعدل دقة متوسط قدره. يون-جونغ وآخرونلقد اخترنا خوارزمية SVM لأنها قادرة على التعامل مع مشاكل الأبعاد العالية لاكتشاف مرضى القلب حيث يتم جمع بيانات عن المرضى من المستشفى الجامعي من خلال استبيان يتم الإبلاغ عنه ذاتيًا، ويتم إجراء التجربة بناءً على التحقق المتقاطع بترك عينة واحدة (LOOCV) وقد ثبت أن التصنيف القائم على SVM هو نهج واعد بأعلى دقة اكتشاف لـإبنيزر وآخرونلقد طورنا آلية تعتمد على تعزيز SVM لتحسين دقة التنبؤ من خلال دمج نتائج جميع المتعلمين الضعفاء. لتقليل الأخطاء في التصنيف، تم تطبيق التطبيع، وإزالة التكرار، وخريطة الحرارة على مجموعات البيانات المعطاة. عند تطبيق خريطة الحرارة، يتم تحديد العوامل المهمة مثل العمر ومعدلات ضربات القلب القصوى في التنبؤ بأمراض القلب، مما يسهل التنبؤ بشكل أكبر. في هذه الدراسة، تم استخدام مجموعات بيانات كليفلاند التي تحتوي على 303 حالات مع 13 سمة. من خلال النتائج التجريبية، تم مقارنة أداء تعزيز SVM مع الانحدار اللوجستي، ونايف بايز، وأشجار القرار، والبيرسيبترون متعدد الطبقات، والغابة العشوائية. من بين هذه، يحقق تعزيز SVM المقترح دقة أكبر من.
مدهكر وآخرونكانوا متورطين في تطوير نظام توقع مرض القلب يعتمد على مصنف بايز الساذج (NBC) باستخدام مجموعة بيانات كليفلاند التي تم تنزيلها من مستودع UCI لتصنيف المرضى إلى خمس فئات وهي: لا، منخفض، متوسط، مرتفع، ومرتفع جداً لتحديد مستوى شدة المرض. ثم تم حساب دقة النظام وتم جدولتها لتقييم أداء النظام، ومن خلال ذلك يمكن ملاحظة أن النظام المقترح القائم على NBC يمكن أن يحققالدقة. فمبنداسامي وآخرون.، اقترح إطار عمل لاكتشاف أمراض القلب باستخدام NBC. تم إجراء التجربة بواسطة أداة WEKA على مجموعات البيانات المجمعة من معهد أبحاث السكري في تشيناي، ومعدل الدقة الذي حققه النظام هو حوالي. مؤلفو قدمت مقالًا لاكتشاف أمراض القلب باستخدام NBC وتمكنت من تحقيق معدل دقة قدرهالذي يعتبر ضعيفًا بالمقارنة من خلال إجراء التنبؤ على مجموعة البيانات المجمعة من مستشفى مايوبادا والتي تحتوي على 60,589 سجلًا. يعتبر التنبؤ بأمراض القلب باستخدام NBC تحديًا كبيرًا نظرًا لأن جميع الخصائص في NBC يجب أن تكون مستقلة عن بعضها البعض..
مؤلفولقد تم استخدام مفهوم الشبكات العصبية في تشخيص أمراض القلب لتحسين الدقة بشكل أكبر.، أولاً، تم إخضاع مجموعات بيانات كليفلاند لخوارزمية اختيار الميزات التي تستخدم كسب المعلومات لإزالة الميزات التي لا تساهم في توقع المرض. بعد ذلك، تم تطبيق خوارزمية الشبكة العصبية الاصطناعية على مجموعة الميزات المخفضة للتصنيف. وقد أظهرت هذه الدراسة أن الدقة ( ) للنظام مع مجموعة ميزات مخفضة ( 8 ميزات) هو أفضل قليلاً من الدقة ( ) من النظام مع مجموعة كاملة من الميزات ( 13 ميزة). ميراى وآخرون.لقد قدمنا طريقة ذكية لتشخيص أمراض القلب باستخدام شبكة عصبية اصطناعية هجينة (ANN) وخوارزمية جينية (GA) حيث يتم استخدام GA لتحسين معلمات ANN. تم الحصول على النتائج التجريبية باستخدام بيانات كليفلاند، والتي من خلالها يتضح أن النهج الهجين يتفوق على خوارزميات بايز البسيط، وأقرب جار، وC4.5 من حيث معدل الدقة.الدقة )، استرجاع ( ) ومقياس F ( على الرغم من أن نموذج الشبكة العصبية (NN) جيد في تعميم البيانات وقادر على تحليل البيانات المعقدة لاكتشاف الأنماط المخفية، إلا أن العديد من الخبراء الطبيين غير راضين عن نموذج الشبكة العصبية بسبب خصائصه كصندوق أسود. أي أن نماذج الشبكة العصبية تتدرب دون معرفة العلاقة بين ميزات الإدخال والمخرجات. لذا، إذا تم استخدام العديد من الميزات غير ذات الصلة لتدريب نموذج الشبكة العصبية، فإن ذلك يؤدي إلى توقعات غير دقيقة في الاختبار. لمعالجة هذه التحديات، قام كيم وكانغلقد تم استخدام خطوتين للمعالجة المسبقة قبل تطبيق الشبكة العصبية الاصطناعية. الخطوة الأولى هي خطوة اختيار الميزات لاختيار الميزات بناءً على الترتيب. ثم يتم إجراء تحليل ارتباط الميزات لجعل النظام يتعلم عن الارتباط بين علاقات الميزات ونتيجة الشبكة العصبية، وبالتالي القضاء على طبيعة الصندوق الأسود. تم إجراء التجربة الكلية على مجموعة البيانات الكورية التي تحتوي على 4146 سجلًا وأسفرت عن منحنى ROC أكبر مع توقعات أكثر دقة.
ومع ذلك، قد تعاني الشبكات العصبية الاصطناعية من الإفراط في التكيف مع البيانات وتعقيد زمني، وقد تفشل في التقارب عندما تكون الأبعاد منخفضة.
نظرًا لأن خوارزمية الجار الأقرب (KNN) هي نهج بسيط ومباشر حيث يتم تصنيف العينات بناءً على فئة الجيران الأقرب، فإن مؤلفيلقد تم استخدام خوارزمية KNN لتصنيف أمراض القلب. نظرًا لأن مجموعات البيانات الطبية أكبر، تم استخدام الخوارزمية الجينية لتقليص الميزات الزائدة وغير ذات الصلة من 6 مجموعات بيانات طبية مختلفة مأخوذة من مستودع UCI لتحسين دقة التنبؤ والتي هيأعلى من معدل الدقة الذي حققه خوارزمية KNN بدون GA. كيتوت وآخرون.لقد أثبتت أن الميزات البسيطة والأقل عددًا كافية لتقليل التصنيف الخاطئ، خاصة في توقع أمراض القلب. في الدراسة التجريبية، تم إجراء تقييم كاي-تربيع على مجموعة البيانات الهنغارية المعطاة التي تحتوي على 293 سجلًا مع 76 معلمة. ولكن، في هذه الورقة، تم أخذ 13 معلمة فقط بعين الاعتبار وبعد إجراء تقييم كاي-تربيع، أسفر ذلك عن 8 معلمات كأهم المعلمات. بعد ذلك، تم تنفيذ KNN مع مجموعة الميزات المخفضة مما أسفر عندقة أكبر بكثير من NBC و CART و KNN مع مجموعة الميزات الكاملة.
تم تنفيذ نموذج توقع مرض القلب باستخدام خوارزمية شجرة القرار (DT) على مجموعات بيانات UCI.الهدف الرئيسي من هذه الورقة هو الكشف عن أهمية نهج التقليم في شجرة القرار (DT) الذي يوفر قواعد قرار مضغوطة وتصنيف دقيق. تم تنفيذ خوارزمية شجرة القرار J48 مع ثلاثة أنواع مثل شجرة القرار مع التقليم، بدون تقليم، والتقليم مع معدل خطأ مخفض. في هذه التجربة، يظهر أن مستوى السكر في الدم السريع هو السمة الأكثر أهمية التي تحقق دقة أكبر. ) من السمات الأخرى، لكنه ضعيف بشكل مقارن. خوارزمية شجرة القرار بسيطة، لكنها قادرة على التعامل فقط مع البيانات الفئوية وغير مناسبة لمجموعات البيانات الصغيرة ومجموعات البيانات التي تحتوي على قيم مفقودة..
في البحثتم تطبيق الانحدار اللوجستي (LR) على مجموعات بيانات UCI لتصنيف أمراض القلب. في البداية، يتم إجراء معالجة البيانات لتصفية القيم المفقودة، ويتم تنفيذ عملية اختيار الميزات بناءً على الارتباط لاختيار الميزات المرتبطة بشكل كبير. ثم يتم تقسيم البيانات المعطاة إلى مجموعات تدريب واختبار لأداء التصنيف بواسطة LR. من النتائج المجمعة، يتبين أن LR يزيد من الدقة بنسبةعندما يزيد حجم التدريب من 50 إلىباريا وأريزوكانوا متورطين في تطوير نظام توقع نوبات القلب يعتمد على الانحدار. لهذا الغرض، تم إنشاء ثلاثة نماذج انحدار بناءً على خوارزمية اختيار المتغيرات وتطبيقها على مجموعة البيانات التي تحتوي على 28 ميزة تم جمعها من مستشفيات إيران. النموذج الذي يستخدم الميزات التالية مثل ألم الصدر الشديد، وألم الظهر، والتعرق البارد، وضيق التنفس، والغثيان، والتقيؤ حقق دقة أكبر منمن تلك الخاصة بالنموذج الذي يستخدم بيانات الفحص البدني وبيانات تخطيط القلب.
يشفيندرا وآخرونلقد تم استخدام خوارزمية الغابة العشوائية (RF) لتوقع أمراض القلب. في هذه الورقة، تم استغلال مجموعة بيانات أمراض القلب في كليفلاند التي تحتوي على سمات تعتمد على غير الخطية. لذلك، تعتبر RF الحل الأمثل لمجموعات البيانات ذات الاعتماد غير الخطي وقد حققت دقة جيدة منمن خلال إجراء بعض التعديلات على مجموعة البيانات غير الخطية. لتقليل مشكلة الإفراط في التكيف، قام جافيد وآخرون.لقد طورنا نظام تشخيص ذكي لأمراض القلب يستخدم خوارزمية البحث العشوائي (RSA) لاختيار الميزات من مجموعة بيانات كليفلاند ونموذج الغابة العشوائية (RF) لتوقع أمراض القلب. استنادًا إلى النتائج التجريبية، لوحظ أن نموذج RF القائم على RSA أنتجالدقة باستخدام 7 ميزات فقط وهيأعلى من الترددات الراديوية التقليدية. حيث إن الطبيعة الجماعية للترددات الراديوية قادرة على إنتاج دقة عالية، والتعامل مع البيانات المفقودة والضخمة، وإلغاء الحاجة إلى تقليم الأشجار، وحل مشكلة الإفراط في التكيف، مؤلفولقد تم استخدام RF للتنبؤ بأمراض القلب. بالإضافة إلى ذلك، تم تطبيق اختبار كاي-تربيع والخوارزميات الجينية لاختيار الميزات البارزة من مجموعة بيانات أمراض القلب التي تم جمعها من مستشفيات الشركات المختلفة في حيدر أباد. أداء النظام المقترح هو حواليدقة أكبر بكثير من NBC وDT والشبكات العصبية.
جعفر وبابكاقترح نظامًا فعالًا ودقيقًا لتشخيص أمراض القلب. طورت هذه الدراسة نموذج تصنيف جماعي يعتمد على نهج اختيار الميزات. مجموعة بيانات أمراض القلب المستخدمة في هذه الدراسة تم تنزيلها من مستودع UCI الذي يحتوي على 270 سجلًا مع 13 متغيرًا مفيدًا. بعد اختيار الميزات البارزة، تم استخدام سبعة مصنفات وهي SVM وNBC وDT وMLP وKNN وRF وLR في التعلم الجماعي للتنبؤ بالمرض. يتم إجراء التنبؤ النهائي على العينة المعطاة من خلال دمج نتيجة التنبؤ لجميع المصنفات السبعة باستخدام طريقة التعلم الجماعي المكدس. أظهر التعلم الجماعي القائم على خوارزمية جينية أفضل أداء وقد يؤدي إلى دقة، حساسية، وخصوصية. التعلم الجماعي هو مزيج من عدة مصنفات مما يحسن الأداء التنبؤي من خلال دمج مخرجات المصنفات الفردية. لتحديد أفضل طريقة جماعية في الكشف عن أمراض القلب من مجموعة بيانات Heart Stalog، قام إندو وآخرون بتطوير نظام تشخيص آلي للأمراض يعتمد على ثلاثة متعلمين جماعيين مثل الغابة العشوائية، والتعزيز، والتجميع جنبًا إلى جنب مع طريقة اختيار مجموعة الميزات المعتمدة على PSO. تم إجراء التجربة العامة باستخدام RStudio وحقق النظام المقترح مع نهج التجميع دقة أكبر من الطرق الأخرى. تلخص الجدول 1 النتائج الرئيسية.
النتائج الرئيسية للدراسة
تم استعراض أنظمة التشخيص الآلي للقلب التي تم تطويرها باستخدام تقنيات التعلم الآلي حيث أن أمراض القلب هي السبب الرئيسي لوفيات البشر في عالم اليوم، لذا يجب تطوير نظام تشخيص فعال ودقيق لإنقاذ الأرواح البشرية.
من الدراسة أعلاه، لوحظ أن العديد من الباحثين كانوا مهتمين بالتعلم الآلي لتشخيص أمراض القلب لأنه يساعد في تقليل وقت التشخيص وزيادة الدقة.
من الدراسة، تتنافس كل طريقة جديدة مع الأخرى لتحقيق معدل دقة أكبر.
يتم اعتبار SVM المعتمد على التعزيز ومجموعة المصنفات كأكثر الطرق الواعدة التي حققت أعلى دقة تم رؤيتها على الإطلاق.
قد تعمل خوارزمية واحدة بشكل جيد لمجموعة بيانات واحدة بينما لا يمكن أن تعمل بشكل جيد لمجموعة بيانات أخرى.
رقم س.
المراجع
الخوارزميات
النتائج الرئيسية
1
13-15
SVM
SVM هو الأكثر تفضيلًا لأنه يمكنه التعامل مع مشاكل الأبعاد العالية
يعزز SVM المعزز الدقة حتى 99.75%
2
16،17
18
NBC
تنبؤ NBC بأمراض القلب يمثل تحديًا. لأنه يتطلب أن تكون جميع الميزات مستقلة عن بعضها البعض
3
19،20
21
ANN
ANN جيد في التعميم وقادر على تحليل البيانات المعقدة وقادر على تحقيق دقة تصل إلى
لإزالة طبيعة الصندوق الأسود لـ ANN، يتم استخدام اختيار الميزات مما يعزز دقة التنبؤ أكثر
4
22،23
KNN
KNN بسيط وغير مناسب للبيانات عالية الأبعاد التي تكون شائعة في مجموعات بيانات أمراض القلب
في البيانات عالية الأبعاد، تميل المسافة بين النقاط إلى أن تصبح أقل معلوماتية، مما يجعل من الصعب على KNN تحديد الجيران الأقرب بدقة
5
24،25
DT
يمكن أن يكون عرضة للتكيف المفرط وغير مناسب للتعامل مع البيانات التي تحتوي على قيم مفقودة
يمكن أن يكون DT أحيانًا متحيزًا نحو اختيار الميزات مما يؤدي إلى نموذج أقل دقة
6
26،27
LR
يتطلب علاقة خطية بين الميزات
يمكن أن يحد من القدرة على التقاط الأنماط الأساسية مما يؤدي إلى دقة أقل
7
28،29
30
RF
المشكلة المحتملة مع RF هي أنها قد تكون مكلفة حسابيًا وتحتاج إلى ذاكرة كبيرة، خاصة عند التعامل مع البيانات الطبية
8
31،32
النهج الجماعي
حقق نهج التجميع دقة أكبر تصل إلى بفضل قدرته على تقليل التكيف المفرط، وتحسين التعميم، ودمج نقاط القوة لعدة خوارزميات تعلم آلي
9
36-40
الحوسبة الكمومية
تؤدي بعض العمليات بشكل أسرع
يمكن استغلال هذه السرعة لتسريع بعض خوارزميات التعلم الآلي من خلال تقليل الوقت المطلوب للتدريب
الجدول 1. النتائج الرئيسية للدراسة.
قد تعتمد دقة النظام على جودة مجموعات البيانات المستخدمة.
يمكن أن تحتوي بعض مجموعات البيانات على قيم مفقودة، وتكرارات، وضوضاء مما يجعل البيانات غير مناسبة. يمكن حل هذه الشكوك من خلال تطبيق تقنيات معالجة البيانات مثل التطبيع، وإدخال القيم المفقودة، وما إلى ذلك.
قد تحتوي بعض مجموعات البيانات على عدد كبير جدًا من السمات مما قد يهدد أداء التعلم الآلي من حيث الدقة ووقت الحساب. يمكن تحسين ذلك من خلال تطبيق استراتيجيات اختيار الميزات المناسبة لإجراء التنبؤ بأكثر الميزات معلوماتية.
نظرًا لأن خوارزميات التعلم الآلي تتنبأ بالمخرجات من خلال تعلم العلاقة بين ميزات الإدخال وتسميات الفئات بناءً على النظريات الكلاسيكية للاحتمالات والمنطق، فإن معدل الدقة لا يزال في الجانب الأدنى . لذا، يتطلب الأمر الكثير من التحسينات لتحقيق قبول عام لتنبؤ الأمراض. قضية رئيسية أخرى في خوارزميات التعلم الآلي التقليدية هي وقت الحساب. حيث يزداد وقت الحساب مع زيادة حجم مجموعة الميزات. لذلك، الهدف الرئيسي من الورقة هو تعزيز أداء خوارزميات التعلم الآلي الكلاسيكية وجعلها تتفوق على جميع المعايير من حيث الدقة، والاسترجاع، ومقاييس F، ووقت الحساب . يعيد توجيه البحث نحو الحوسبة الكمومية لخلق طريق لدمج الحوسبة الكمومية مع نهج التعلم الآلي.
الدافع للدراسة
بعد إجراء ملاحظات مفصلة من المقالات الحديثة ، أظهرت ميكانيكا الكم أداءً ممتازًا في مجالات متعددة مثل التصنيف، وتنبؤ الأمراض، واكتشاف الأجسام، والتتبع وحققت أداءً ملحوظًا مقارنة بالنماذج القائمة على نظرية الاحتمالات الكلاسيكية. الأساسيات الخاصة بالحوسبة الكمومية، وميزاتها الأساسية، وطريقة عملها متاحة في المجالات العامة، ونتيجة لذلك، لا يمكن استكشافها أكثر.
عند مقارنتها بخوارزميات التعلم الآلي التقليدية، فإن خوارزميات التعلم الآلي المعززة بالكم قادرة على تقليل وقت التدريب، وضبط معلمات الشبكة الفائقة تلقائيًا، وأداء عمليات مصفوفة ومعالجة موتر معقدة بسرعات عالية، واستخدام النفق الكمومي لتحقيق أهداف الدالة الموضوعية. يتيح دمج الحوسبة الكمومية والتعلم الآلي لقطاعات الرعاية الصحية تقييم وعلاج الاضطرابات الصحية المعقدة. تستخدم الحوسبة الكمومية مبدأ الفيزياء الكمومية حيث يمكن تمثيل بت واحد في كل من 0 و 1 وهو ما يعرف بالكيوبتات (Bits الكم). ميزة بارزة أخرى للحوسبة الكمومية هي أن التراكب يسمح للجسيم بالوجود في حالات متعددة في وقت واحد مما يوفر قوة هائلة للتعامل مع كميات ضخمة من البيانات، يحدث التشابك عندما يتم إنتاج زوج من الجسيمات مما يسمح لهما بمشاركة القرب المكاني أو التفاعل، يمكّن النفق الكمومي الكمبيوتر من إكمال المهمة بشكل أسرع وتعمل البوابات الكمومية على مجموعات من الحالات الكمومية لإنتاج المخرجات المطلوبة. جاء أول جهاز حوسبة كمومية إلى حيز التنفيذ في عام 2000، لذا استخدم العديد من الباحثين مؤخرًا مبدأ الحوسبة الكمومية لتحليل مليارات البيانات التشخيصية بمساعدة تقنيات الذكاء الاصطناعي. يساعد التعلم الآلي المعزز بالكم الأطباء في تحقيق تنبؤات صحية دقيقة وسابقة لأوانها. وفقًا لتقرير ، سينخفض الوقت المستغرق في البحث وتحليل البيانات التشخيصية عندما يتم دمج الحوسبة الكمومية مع أنظمة الرعاية الصحية.
مع هذا الدافع، تهدف الورقة إلى تنفيذ نهج التعلم الآلي المعزز بالكم لتشخيص أمراض القلب ويحقق معدل دقة ملحوظ ووقت حساب موضح في “النتائج والمناقشات” من خلال استبدال نظرية الاحتمالات الكلاسيكية بنظرية الاحتمالات الكمومية ويستخدم حالة التراكب التي توفر درجة أعلى من الحرية في اتخاذ القرار.
مواد وطرق النظام
وصف مجموعة البيانات
يصف مجموعات البيانات التي تم استخدامها لتنفيذ إطار عمل QuEML (تعلم الآلة المعزز بالكم) لتشخيص أمراض القلب. تم أخذ مجموعة بيانات أمراض القلب (HDD) من مستودع كاجل وهي مجموعة بيانات شاملة تحتوي على 1190 حالة، وهي مزيج من خمس مجموعات بيانات مختلفة مدرجة في الجدول 2، ويستند هذا المزيج إلى 11 ميزة شائعة مع متغير هدف واحد مدرج في الجدول 3.
المنهجيات المقترحة
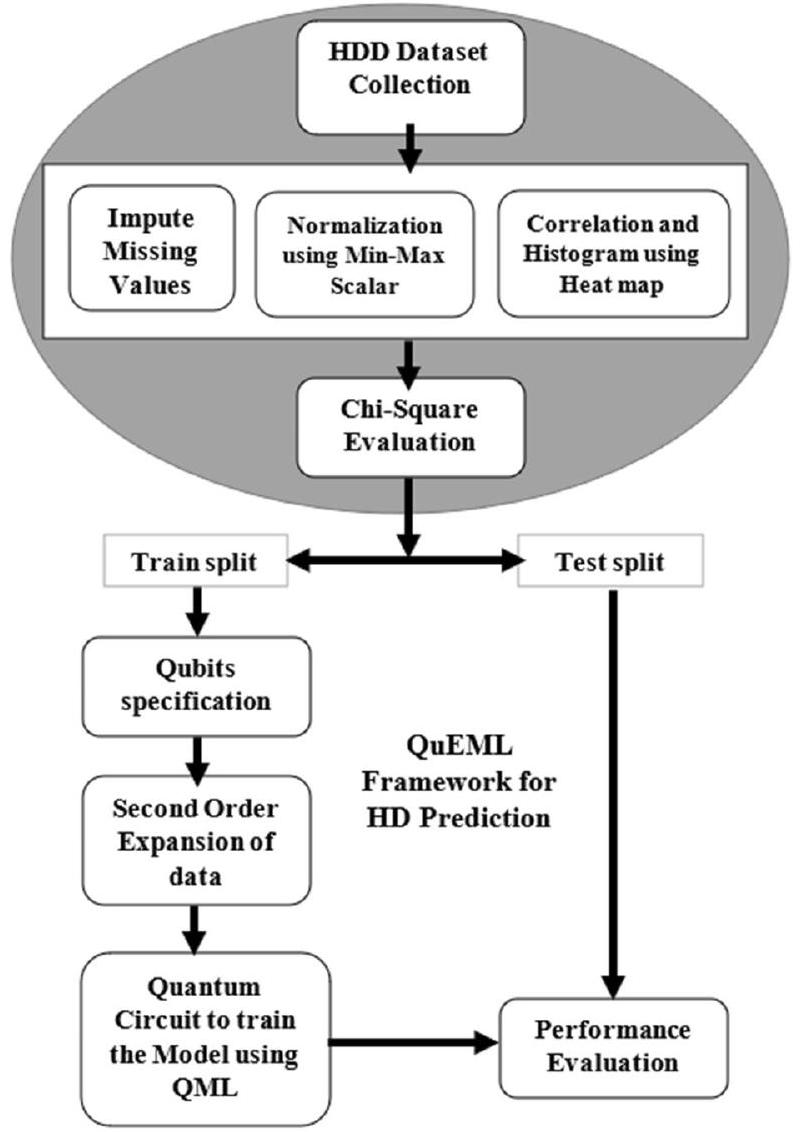
الخطوات التي تم اتباعها في هذا البحث موضحة في الشكل 1. يتم إخضاع البيانات المجمعة (HDD) لتحليل البيانات الاستكشافية (EDA) لإزالة القيم الشاذة، وتقدير القيم المفقودة، وتطبيع مجموعة البيانات. ثم يتم إدخال مجموعة البيانات المعالجة إلى تقييم كاي-تربيع للاحتفاظ بأعلى الميزات تصنيفًا (TRF). بعد ذلك، يتم تقسيم مجموعات البيانات مع TRF إلى مجموعة تدريب واختبار بنسبة 70:30. الآن، يتم تطوير النهج المعزز بالكم بناءً على بيانات التدريب حيث يتم تحديد عدد الكيوبتات بناءً على (عدد الميزات). يمكن إجراء مزيد من رسم الميزات عن طريق تشابك الكيوبتات لتوسيع من الدرجة الثانية. أخيرًا، يتم إنشاء الدائرة الكمومية لتدريب النموذج باستخدام أساليب التعلم الآلي الكمومي مثل QSVM و QANN و QBE. بعد ذلك، يتم تقييم أداء إطار التعلم الآلي المعزز بالكم ضد أساليب التعلم الآلي التقليدية من خلال مجموعة الاختبار استنادًا إلى عدة مقاييس أداء مثل الدقة، والتميز، والاسترجاع، ودرجة F1. يتم تصوير العملية العامة لإطار QuEML المقترح في الخوارزمية 1.
تحليل البيانات الاستكشافي (EDA)
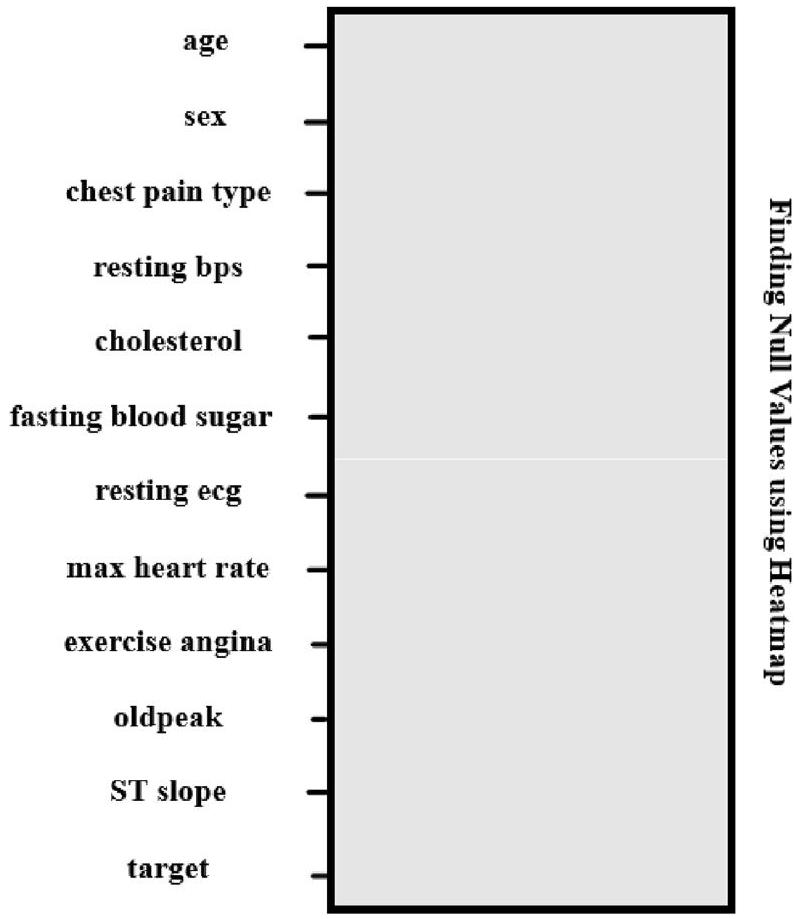
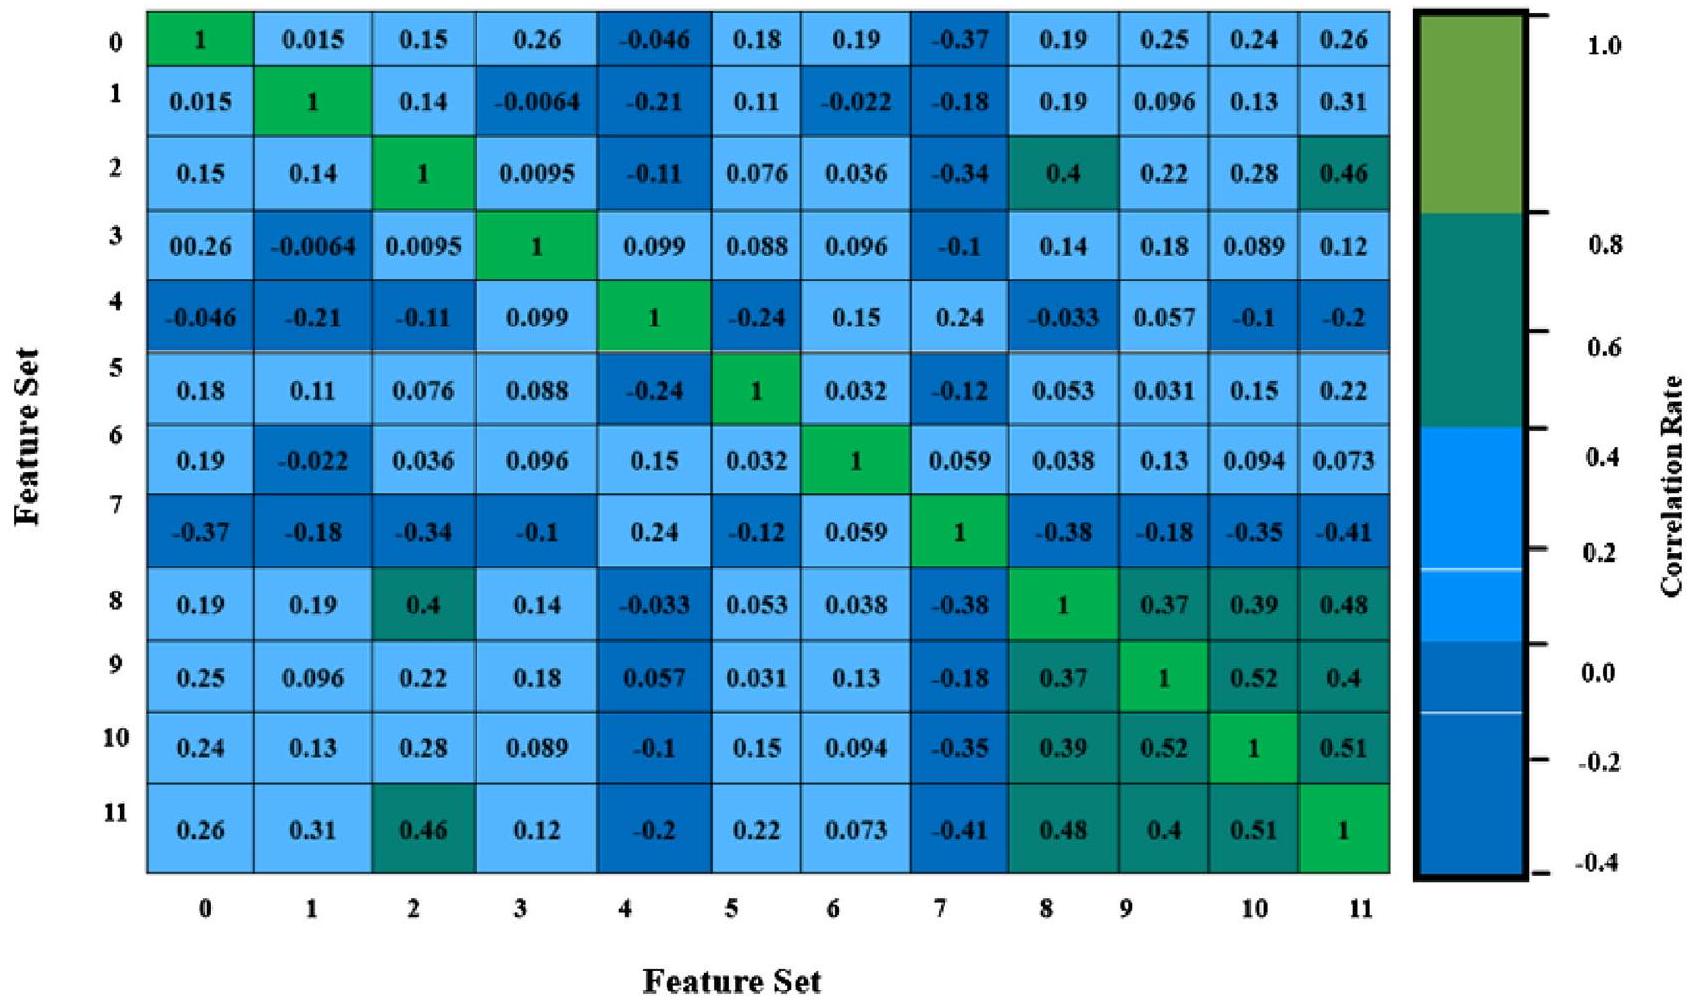
يعتبر خطوة أساسية في التحليل القائم على البيانات. يتعامل مع تصور البيانات من جوانب مختلفة مثل إدخال القيم المفقودة، والتطبيع، وتحديد السمات ذات الارتباط العالي والانحراف المنخفض. يمكن القيام بذلك بمساعدة مكتبات pandas وmatplotlib، والنتيجة موضحة في الشكل 2، من الذي تم استنتاج أن مجموعة البيانات المختارة لا تحتوي على قيم مكررة أو فارغة، وأنها جيدة وسيتم تحليلها بشكل أكبر. بعد ذلك، يتم تطبيق تقنية مقياس Min-Max على مجموعة البيانات المعطاة، والتي تعيد قياس البيانات من نطاقها الأصلي إلى نطاق محدد.باستخدام المعادلة (1) حيث X ‘ هو قيمة معادلة و X هو قيمة أصلية، والرموز المختلفة المستخدمة في الأقسام التالية موضحة في الجدول 4. يمكن القيام بذلك بمساعدة MinMaxScaler () من مكتبة sklearn، والتي تمكّن أيضًا خوارزميات التعلم الآلي المعززة كميًا من معالجة مجموعة البيانات بشكل متساوٍ. أخيرًا، يمكن استنتاج الميزات المهمة من مجموعة البيانات المعطاة بواسطة heatmap () التي تحدد العلاقة بين كل ميزة كما هو موضح في الشكل 3.
رقم التسلسل
مجموعة بيانات
حالات
1
كليفلاند
٣٠٣
2
هنغاري
294
٣
سويسرا
123
٤
لونغ بيتش، فيرجينيا
٢٠٠
٥
مجموعة بيانات قلب ستالوج
٢٧٠
الجدول 2. مجموعات البيانات.
نوع
اسم
وصف
نطاق
ديموغرافي
عمر
عمر المريض بالسنوات
٢٨ إلى ٧٧
ديموغرافي
جنس
جنس المريض؛ 1-ذكر؛ 0-أنثى
0 أو 1
الأعراض والفحص
نوع ألم الصدر
1-نموذجي؛ 2-ذبحة صدرية نموذجية؛ 3-ألم غير ذبحي؛ 4-بدون أعراض
1 إلى 4
الأعراض والفحص
ضغط الدم أثناء الراحة
مستوى ضغط الدم في وضع الراحة بوحدة مم زئبق
0 إلى 200
المختبر والصدى
كوليسترول
الكوليسترول في المصل بالملليغرام/ديسيلتر
0 إلى 603
المختبر والصدى
سكر الدم الصائم
مستوى سكر الدم أثناء الصيام
من 0 إلى 1
ECG
تخطيط القلب أثناء الراحة
نتيجة تخطيط القلب الكهربائي في حالة الراحة؛ 0-طبيعي؛ 1-شذوذ في موجات ST-T؛ 2-يظهر تضخمًا محتملًا أو مؤكدًا في البطين الأيسر وفقًا لمعايير إستي.
0 إلى 2
ECG
أقصى معدل ضربات القلب
أقصى معدل ضربات قلب تم تحقيقه
60 إلى 202
الأعراض والفحص
ذبحة صدرية عند exertion
ذبحة صدرية ناتجة عن التمارين؛ 0-لا؛ 1-نعم
من 0 إلى 1
ECG
القمة القديمة
انخفاض ST الناتج عن التمرين مقارنةً بحالة الراحة
-2.6 إلى 6.2
ECG
منحدر ST
ميل قطعة ST أثناء التمرين الأقصى؛ 1-ميل لأعلى؛ 2-مستوي؛ 3-ميل لأسفل
0 إلى 3
المتغير المستهدف
0-طبيعي؛ 1-أمراض القلب
0 أو 1
الجدول 3. وصف ميزات مجموعة البيانات.
الشكل 1. الخطوات المستخدمة في QuEML.
في الشكل 3، يتم ترقيم الميزات المدرجة في الجدول 3 من 0 إلى 11. يظهر الشكل أن ميزة نوع ألم الصدر لها ارتباط إيجابي مع المتغير المستهدف، مما يشير إلى أن الأشخاص الذين يعانون من ألم في الصدر لديهم فرصة أكبر للإصابة بأمراض القلب الشديدة. بالإضافة إلى ذلك، فإن ميزات الكوليسترول ومعدل ضربات القلب لها ارتباط سلبي مع المتغير المستهدف.
تقييم كاي-تربيع (CSE)
يختار ميزات معينة من مجموعة البيانات غير السلبية التي لها أفضل علاقة مع المتغير المستهدف. بعد تنفيذ CSE، يتم اختيار أفضل K ميزات بناءً على نتائج درجات كاي-تربيع من مجموعة الميزات المخفضة حيث أن العدد الكبير من الميزات غير ذات الصلة يزيد من وقت التدريب بشكل كبير ويزيد من خطر الإفراط في التكيف. في هذا البحث، تم تعيين قيمة K على 8 ويتم تنفيذ CSE بواسطة SelectKBest() من مكتبة sklearn. يتم حساب درجة كاي-تربيع (CSS) بين كل ميزة والمتغير المستهدف باستخدام المعادلة (2) حيثيمثل التردد الملحوظ للميزة ‘i’ بالنسبة للمتغير المستهدف و” يدل على التردد المتوقع للميزة ‘ ‘ فيما يتعلق بالمتغير المستهدف.
إطار عمل QuEML
تم استخدام خوارزميات التعلم الآلي المعززة بالكم في هذا البحث لأنها تعمل على تحسين خوارزميات التعلم الآلي التقليدية وتساعد في التصنيف المتفوق واكتشاف الأنماط، مما يؤدي بدوره إلى اكتشاف السلوكيات غير الطبيعية والقضاء على المطالبات الطبية الاحتيالية. من الدراسة التي تم إجراؤها في “خلفية الدراسة”، تم تصور أن الأساليب التقليدية مثل SVM وANN ونهج التجميع قد أظهرت أداءً ممتازًا في أنظمة تشخيص أمراض القلب التلقائية بمعدل دقة أعلى. وبالتالي، استخدم الإطار المقترح تلك المصنفات التقليدية التي تم تحسينها بشكل أكبر من خلال تطبيق مبادئ الحوسبة الكمومية.
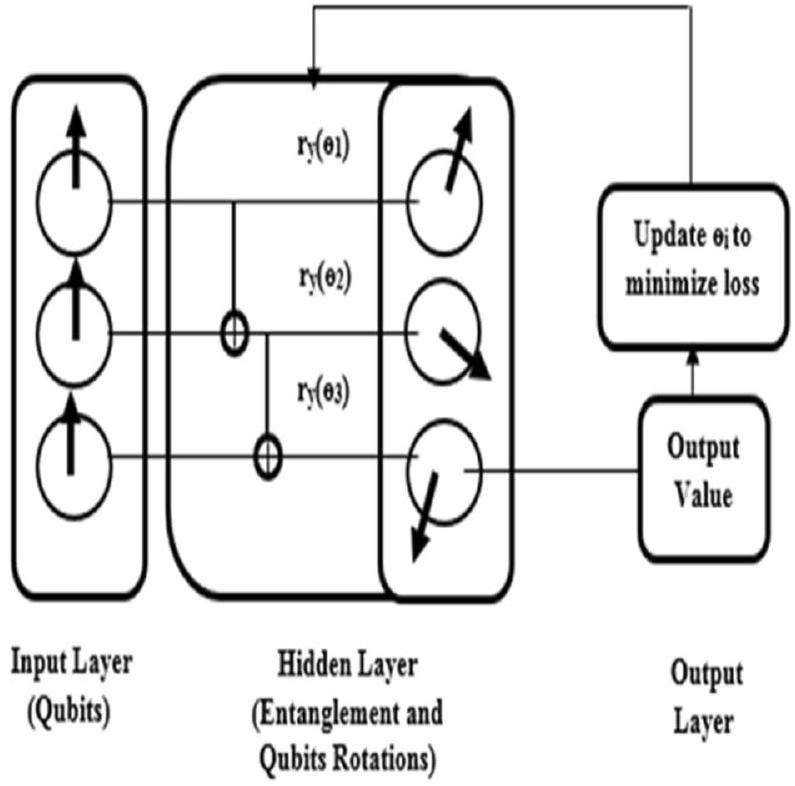
شبكة الأعصاب الاصطناعية الكمومية (QANN). تدريب شبكة الأعصاب الاصطناعية هو مهمة معقدة حيث يجب تحسين معلمات الشبكة لتجنب الإفراط في التكيف. عندما يزداد عدد المعلمات التي يجب تحسينها، يؤدي ذلك إلى الكثير من الأعباء الحاسوبية. لذلك، يمكن التعامل مع مثل هذه المهام المعقدة بسهولة بواسطة QANN. في QANN، يتم استبدال خلايا الإدخال بـ Qubits كما هو موضح في الشكل 4، مما يتجنب استخدام العقد في الطبقات المخفية.
Input: Datasets HDD
Output: prediction of HD + and HD - cases.
Begin
Do
For each row in HDD
    Apply EDA to generate preprocessed dataset HDD_P
End
Do
    Execute CSE on HDD_P to retain top ranked feature set HDD_TRF
End
Split HDD_TRF into training and testing set
Apply Quantum approach on training split
Do
    Specify Qubits Qb
    Then apply entangling Qb based feature mapping
    Then generate Quantum Circuit Qc
End
Do till reaches Max_Iteration
    Execute QuEML approaches on training split using Qc to train the model
End
Evaluate QuEML approaches using testing split
Stop
الخوارزمية 1. إطار عمل QuEML. كما هو الحال في الشبكات العصبية التقليدية. وبالتالي، فإنه يقلل من عدد المعلمات التي يجب تحسينها. في النهج المقترحعدد المعلمات التي يجب تحسينها هو 18 حيث يوجد ست طبقات مخفية مع ثلاث دورات مفردة لكل طبقة. يتم ترميز بيانات الإدخال كحالة تراكب منتوضح أن k تمثل بعد الكيوبتات باستخدام مخطط تضمين السعة حيث يتم تضمين بيانات الإدخال كسعة لحالات مختلفة في التراكب وتمثل السعات بواسطة متجه حالة بعده. على سبيل المثال، في هذا البحث، عدد الكيوبتات هووتم ترميز بيانات الإدخال كحالة كمومية مع تراكب لمختلف الحالات مثلتحتوي الطبقة المخفية على اتصال بين الكيوبتات يستخدم بوابات NOT المسيطر عليها (CNOT)للتشابك.هو دوران كيوبت واحد حول محور y بزاويةتُستخدم بوابات الكم لتعديل حالة الكيوبتات باستخدام معلمات الدوران. أخيرًا، يتم تحديد قيمة الخرج بناءً على قياس حالة الكيوبت. يتم قياس قيمة الخرج باستخدام باولي-ز.قياس يتم فيه تمثيل الدول كـ و لتحديد الناتج الثنائي 1 و -1 على التوالي. هنا، تعمل القياسات الكمومية كدالة تنشيط توفر الجهد الحاسوبي. ثم يتم مقارنة قيمة الناتج مع المتغير المستهدف لحساب الخسارة. بعد ذلك، يتم تعديل المعلمات الدورانية باستمرار حتى تعطي حالة الكيوبتات القيمة المستهدفة المرغوبة.
آلة الدعم الكمي (QSVM). تقدم آلة الدعم الكمي ميزة حسابية على آلة الدعم التقليدية، مما يسهل التصنيف في أبعاد أعلى. يمكن تدريبها بشكل مشابه لآلة الدعم التقليدية بمجرد الحصول على النواة الكمية. في QSVMيتم تحويل بيانات الإدخال إلى حالات كموميةيمكن تحقيق ذلك من خلال تنفيذ خريطة الميزات الكموميةفي الذي هو مصنف يمكن تطبيقه على بيانات الإدخال x’. يتم إنشاء خرائط الميزات بناءً على مبدأ Ansatz كما هو موضح في المعادلة (3) حيث ‘ h ‘ تشير إلى بوابة هادامارد التي يتم تطبيقها على كل كيوبيت و ‘ n ‘ تشير إلى عدة كيوبيتات. علاوة على ذلك، يمكن تعريف عمق الدائرة على أنه ‘ 2 ‘ والذي يطبق مبدأ Ansatz مرتين. وبالتالي، يمكن أن تكون شكل خريطة الميزات كما هو موضح في المعادلة (4). ثم، يمكن قياس نواة الكم عن طريق تقدير التداخل بين حالتين والتي يمكن القيام بها باستخدام الدائرة الموضحة في الشكل 5 وتكرار سلسلة القياس مثل يعطي تقديرًا لتداخل الحالة. يتم إنشاء الدائرة الكمومية المعلمة باستخدام مكتبة Qiskit Aqua التي تستخدم دالة SecondOrderExpansion التي تأخذ أبعاد الميزات والعمق كوسائط. أخيرًا، توفر Qiskit دالة محددة مسبقًا يتم من خلالها إجراء التدريب عن طريق تطبيق نواة كمومية بتكلفة حسابية أقل، ويتم ضبط المعلمات الفائقة لـ QSVM لتقليل الخسارة.
الشكل 2. العثور على القيم الفارغة.
تجميع كمي جماعي (QBE). ينتج نموذجًا مركبًا يتفوق على نموذج واحد من خلال دمج نقاط القوة لمجموعات من المتعلمين الضعفاء البسيطين مما يقلل من خطأ التنبؤ. من أجل تنفيذ يتم استخدام سجلات كمومية ( ) مثل سجل التحكم ( )، سجل التدريب ( )، سجل مؤقت ( )، سجل الاختبار ( ) وسجل الهدف ( ) كما هو موضح في الشكل 6 حيث يعتمد حجم و على حجم الإدخال، يحدد حجم العينات الفرعية المستخدمة كمدخل في المصنف الضعيف الفردي، حجم يعتمد على طبيعة المتغير المستهدف وحجم يحدد عدد المتعلمين الضعفاء المستخدمين في التنبؤ. ثم، يبدأ QBE المقترح بعملية إعداد الحالة ( ) حيث يتم ترميز بيانات التدريب والاختبار في السجلات المعنية، ويتم تهيئة سجل التحكم في تراكب موحد كما هو موضح في المعادلة (5) حيث ‘ ‘ تشير إلى بوابة هادامارد، ‘ ‘ تشير إلى عدد من الكيوبيتات، و هما الوحدة التي ترمز بيانات الإدخال ‘ x ‘ و ‘ y ‘ إلى الحالة الكمومية و هي حالة السجلات الكمومية. علاوة على ذلك، يتم إجراء أخذ العينات في التراكب ( ) باستخدام المعادلة (6) حيث يتم استخدام الأوركل الكمومي ‘v’ الذي يربط عدة عينات فرعية من البيانات (xi,yi) مع سجل التحكم. أخيرًا، يمكن إجراء التصنيف من خلال التفاعل عبر التداخل (|S3>) بين و كما هو موضح في المعادلة (7) حيث يتم استخدام fi(x’) لتخزين تقدير المتغير المستهدف الذي يعتمد على العينة الفرعية ‘ith’ ومجموعة الاختبار x ‘ ويتم تحديد قياس التوقع (<M>) على الكيوبيت المستهدف باستخدام المعادلة (8) حيث يكون عدد المتعلمين الضعفاء (B) مساويًا لـ مما يوفر تنبؤًا جماعيًا حيث يتم الحصول على النتيجة النهائية من متوسط تنبؤات جميع المتعلمين الضعفاء. إذا كانت فئات المتغير المستهدف مشفرة في حالتين أساسيتين، فإنه من الممكن تحديد قيمة التنبؤ النهائية باستخدام قياس كيوبيت واحد كما هو موضح في المعادلة (9) حيث و هما الاحتمالات المتوسطة لمجموعة الاختبار x ‘ ليتم تصنيفها في الفئة ‘ 0 ‘ والفئة ‘ 1 ‘ على التوالي.
رقم التسلسل
الرمز
الوصف
1
العثور على الحد الأدنى للقيمة في مجموعة البيانات المعطاة X
2
العثور على الحد الأقصى للقيمة في مجموعة البيانات المعطاة X
3
CSS
درجة مربع كاي
4
OF(i)
التردد الملحوظ للميزة ‘I’
5
EF(i)
التردد المتوقع للميزة ‘I’
6
دوران الكيوبيت حول محور y من خلال زاوية
7
و
الحالات الممثلة في قياس باولي-Z( )
8
الحالات الكمومية
9
خريطة الميزات الكمومية
10
بوابة هادامارد
11
C(r)
سجل التحكم
12
T(r)
سجل التدريب
13
Te(r)
سجل مؤقت
14
Tt(r)
سجل الاختبار
15
Ta(r)
سجل الهدف
16
S0
حالة السجلات الكمومية
17
fi(x’)
تقدير المتغير المستهدف
18
و
ترميز بيانات الإدخال x و y إلى الحالة الكمومية
19
<M>
قياس التوقع
20
N(T+)
عدد الإيجابيات الحقيقية
21
N(T-)
عدد السلبيات الحقيقية
22
N(F+)
عدد الإيجابيات الكاذبة
23
N(F-)
عدد السلبيات الكاذبة
24
P
الدقة
25
A
الدقة
26
R
الاسترجاع
27
Se
الحساسية
28
Sp
الخصوصية
29
F
درجة F1
30
T
وقت التدريب
الجدول 4. الرموز مع الوصف.
النتائج والمناقشات
في هذا القسم، يتم تقديم نتائج الأساليب الكمومية التي تم تنفيذها على المحاكيات الكمومية. تم تنفيذ QANN باستخدام مكتبة PennyLane بايثون التي تحتوي على طرق مدمجة لتحسين معلمات الدوران لبوابات الكم. تم إجراء التجربة على مجموعة البيانات الشاملة الموضحة في الجدول 2 والتي تحتوي على 1190 حالة من بينها 629 حالة مصنفة على أنها HD (إيجابية مرض القلب) و 561 حالة مصنفة على أنها (سلبية مرض القلب). بالمثل، تم تنفيذ ANN التقليدية بنفس مجموعة البيانات باستخدام واجهة برمجة التطبيقات Keras. في ANN التقليدية، تحتوي على طبقات إدخال مع 8 عقد، وطبقتين مخفيتين مع 5 و 3 عقد على التوالي، وطبقة الإخراج تحتوي على عقدة واحدة حيث يرتبط كل إدخال بتسمية فئة ذات قيمة ثنائية. وبالتالي، فإن العدد الإجمالي للمعلمات في ANN التقليدية التي يجب تحسينها هو 58 ويتم توقع تسمية الفئة باستخدام دالة تنشيط سيغمويد. تم تنفيذ كل من QANN و ANN مع مجموعة من المعلمات الفائقة كما هو موضح في الجدول 5.
وبالمثل، تم تنفيذ SVM التقليدية وتجميع Bagging باستخدام مكتبة Scikit-learn بايثون مع المعلمات الفائقة المضبوطة التالية لـ SVM كما هو موضح في الجدول 5 حيث ç تشير إلى معلمة التنظيم، و ṕ تمثل نوع العقوبة، و تشير إلى معلمة التسامح. تحدد ç معدل التصنيف الخاطئ وتتحكم معلمة التنظيم في قوة التنظيم التي تكون عكسية بالنسبة لـ ç و تحدد معيار الإنهاء بينما تم تنفيذ SVM الكمومي و QBE باستخدام مكتبة Qiskit مع عدد من الكيوبيتات . علاوة على ذلك، تم إجراء تجربة شاملة باستخدام بايثون وواجهة برمجة التطبيقات Keras من Tensorflow 2 على معالج Ryzen7-3.20 GHz، ووحدة معالجة الرسوميات (GPU) NVIDIA RTX 3060 مع 6 جيجابايت و 16 جيجابايت من الذاكرة العشوائية على التوالي. تم تقييم أداء إطار عمل QuEML من حيث الدقة (P)، الدقة ، الاسترجاع ، الحساسية (Se)، الخصوصية (Sp)، درجة F1 (F)، ووقت التدريب (T) وتم جمع النتائج
الشكل 3. توزيع الميزات.
باستخدام تقنية التحقق المتقاطع بخمسة أضعاف. علاوة على ذلك، تم تقسيم مجموعة البيانات المعطاة إلى و للتدريب، والتحقق، والاختبار على التوالي. رياضيًا، يتم حساب هذه المقاييس الأداء باستخدام المعادلات (10)، (11)، (12)، (13) و (14) حيث N(T+) تشير إلى عدد الإيجابيات الحقيقية، N(T-) تشير إلى عدد السلبيات الحقيقية، N(F+) تشير إلى عدد الإيجابيات الكاذبة و N(F-) تشير إلى عدد السلبيات الكاذبة.
تظهر مصفوفة الارتباك في الجداول 6 و 7 التي تظهر قدرة التصنيف لأساليب التعلم الآلي المعزز بالكم (QuEML) وأساليب التعلم الآلي التقليدية (TML). من الجداول أعلاه، لوحظ أن QBE يتنبأ بشكل صحيح بـ 1144 عينة من العينات المعطاة البالغة 1190. إنه و أعلى من QSVM و QANN على التوالي. عند مقارنة أداء التصنيف لـ QuEML مع TML، تم تنفيذ أساليب TML بمعدل تصنيف خاطئ متوسط قدره أي أن 211 عينة تم تصنيفها بشكل خاطئ وهو حوالي أعلى من تقنيات QuEML.
يوضح الجدول 8 كيف يتفوق QuEML على جميع المعايير من حيث الدقة (A)، الدقة (P)، الاسترجاع (R)، الخصوصية (Sp)، ودرجة F1 (F) حيث تقيس A قدرة التصنيف ويظهر QBE أداءً ممتازًا في التنبؤ بدقة 0.953 بسبب طبيعته الجماعية والتي هي حوالي و أكبر من QSVM و QANN على التوالي. المصطلح P يقيس معدل الإيجابيات الكاذبة لـ QuEML حيث أن QBE و QSVM و QANN لديهم معدل دقة قدره و 0.930 على التوالي. R يظهر قدرة التنبؤ للتقنيات الكمومية من حيث معدل الإيجابيات الحقيقية. بشكل إجمالي، تم استخدام 629 عينة إيجابية لأغراض تجريبية حيث تنبأت الأساليب الكمومية المقترحة بحوالي 595 عينة إيجابية كإيجابية. بالمثل، توقعت الأطر الكمومية المقترحة متوسط 531 عينة كعينة سلبية من 561 عينة سلبية.
الشكل 4. هيكل QANN.
الشكل 5. تقدير تداخل الحالة: العمق .
الشكل 6. دائرة كمومية لـ QBE.
وفقًا للاعتبار، فإن ارتفاع معدل الدقة والاسترجاع يزيد تلقائيًا من درجة F1. لذا، فإن QuEML لديه درجة F1 تبلغ 0.950 والتي تقترب من 1 مما يشير إلى قدرة تصنيف ممتازة للنهج الكمي. يوضح الجدول 9 الأداء العام لـ TML حيث لوحظ أن الدقة العامة لـ TML هي متوسط 0.941 والذي يدور حولأقل من QuEML. وبالمثل، فإن معدل P و R و Sp و F لـ TML حوالي
رقم التسلسل
المعلمات
القيم
1
محسّن
محسن آدم
2
معدل التعلم
0.01
٣
الزخم
0.9
٤
تهيئة النواة
التوزيع الطبيعي القياسي
٥
عصور
100
٦
ç
1
٧
ṕ
تنظيم 12
٨
0.0001
9
كيوبتات
٣
الجدول 5. المعلمات الفائقة.
QuEML (بالنسبة المئوية)
QBE
50.50
٤٥.٦٣
1.513
2.35
QSVM
50.08
44.87
٢.٢٦٩
2.77
قن
٤٩.٥٠
٤٣.٤٥
3.697
3.36
الجدول 6. مصفوفة الالتباس لـ QuEML.
، و أقل من QuEML. بشكل عام، يحقق QuEML أداءً أفضل قليلاً (أكبر) من TML بسبب طبيعته الكمومية.
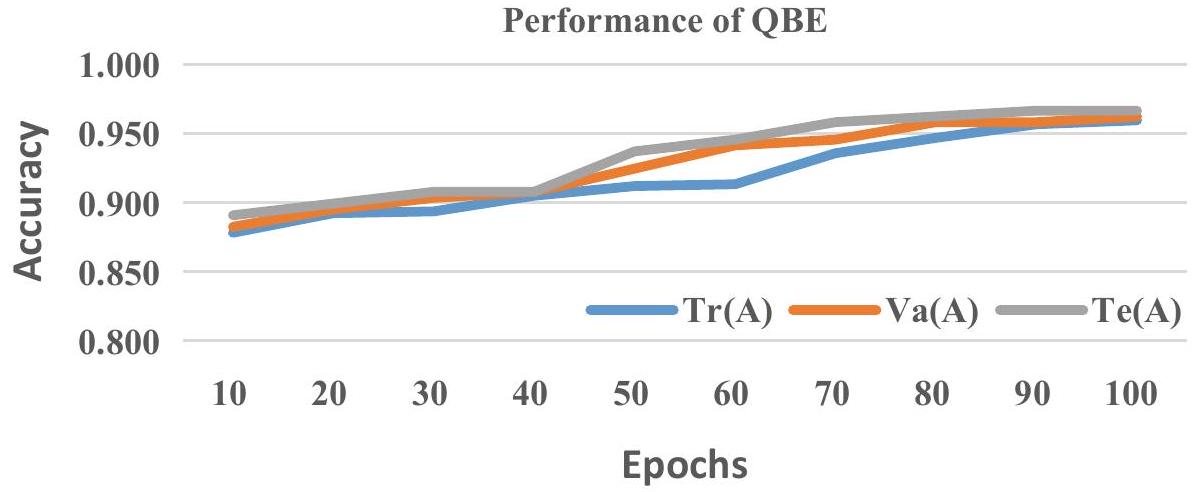
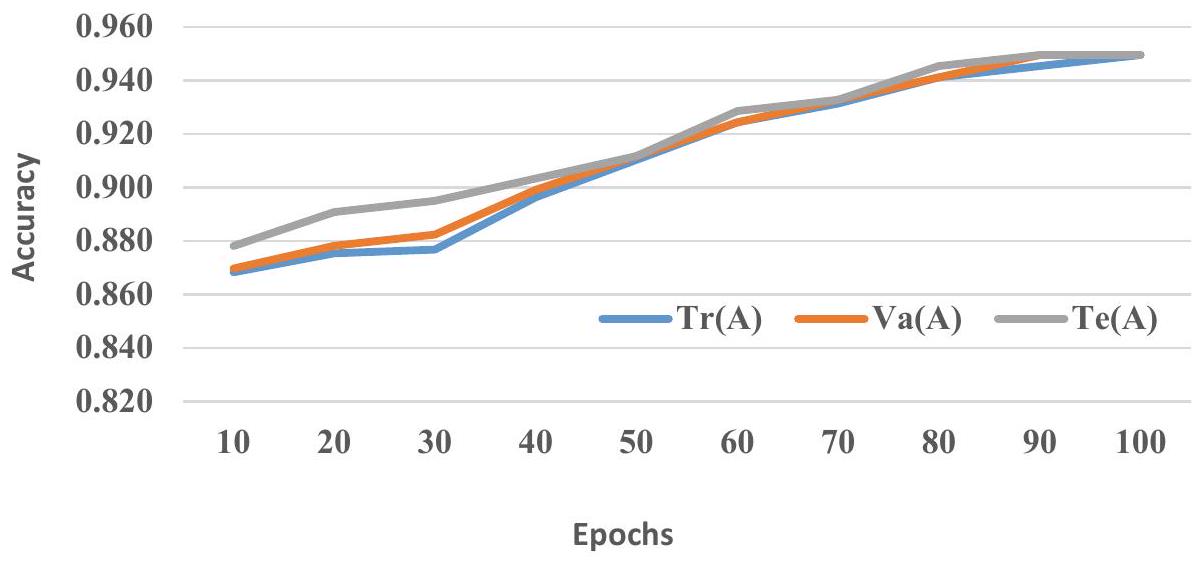
لقياس أداء التعميم للإطار الكمي المقترح، يتم تقسيم مجموعة البيانات المعطاة والتدريباختبارو التحققيتم قياس الدقة في كل عصر من 1 إلى 100 كما هو موضح في الأشكال 7 و 8 و 9. في العصر المئة، يمتلك QBE، و معدلات، و0.966 على التوالي. وبالمثل، زادت دقة QSVM وQANN من 0.872 و0.815 إلى 0.950 و0.929 على التوالي. من الرسوم البيانية أعلاه، يتضح أن الإطار الكمي المقترح خالٍ من الإفراط في التكيف، مما يظهر تميزه في أداء التعميم حيث يقلل بشكل كبير من المسافة بين ، و .
علاوة على ذلك، السبب الرئيسي لتنفيذ QuEML هو تسريع أداء التصنيف. في هذه الورقة، تم تطبيق طريقتين لتقليل الوقت المستغرق لتدريب النموذج مثل اختيار الميزات المعتمد على CSE وطرق التعلم الآلي المعززة بالكم. تظهر النتائج الموضحة في الجدول 10 وقت التدريب. من QuEML الذي يتم مقارنته مع من TML بالميكروثانية. وقد تم إثبات أن QuEML المقترح قد رفع الأداء من حيثالذي يزيد بحوالي 1.3 مرة عن طرق التعلم الآلي التقليدية. من الجدول 9، استغرق SVM وقتًا أقلللتدريب أكثر من الشبكات العصبية الاصطناعية و BE. ولكن عند استخدام المبادئ الكمية في TML، حقق QANN أداءً ملحوظًا منفي وقت التدريب أكثر من QBE و QSVM. في الإطار المقترح، تُستخدم طريقة CSE لإزالة الميزات غير ذات الصلة من مجموعة البيانات المعطاة، مما يقلل بشكل كبير من وقت التدريب كما هو موضح في الجدول 11. بعد تطبيق CSE، يتم تزويد QuEML بمجموعة ميزات محسّنة (OFS) تحتوي على ميزات مخفضة. وقد حسّنت مجموعة الميزات المخفضة أداء QuEML من حيث وقت التدريب. كما هو موضح في الجدول 10، استهلك QBE مع OFSالذي يدور حولأسرع من QBE مع FFS (مجموعة الميزات الكاملة). وبالمثل، تم تدريب QSVM و QANN مع OFS بشكل أسرع. و ) من QSVM و QANN مع FFS ( و ).
الخاتمة
التشخيص الدقيق لأمراض القلب أمر حاسم في تقليل معدلات الوفيات. تستعرض هذه الورقة أنظمة التشخيص المدعومة بالحاسوب (CAD) المختلفة التي تم تطويرها باستخدام أساليب التعلم الآلي (ML)، مع تسليط الضوء على نقاط قوتها وضعفها. من الدراسة، وُجد أن الأساليب التقليدية للتعلم الآلي يتم تعزيزها بشكل أكبر من خلال استخدام المبادئ الكمومية. لإثبات ذلك، تم إجراء دراسة تجريبية على مجموعة بيانات أمراض القلب من كاجل. تم تقييم الأداء مقابل QuEML مقابل TML حيث
HTML (بالنسبة المئوية)
كن
50.17
٤٥.١٣
2.02
2.69
SVM
50.00
٤٤.٩٦
2.18
2.86
إيه إن إن
٤٩.١٦
42.86
٤.٢٩
٣.٧٠
الجدول 7. مصفوفة الالتباس لـ TML.
QuEML
أ
P
ر
سب
ف
QBE
0.961
0.971
0.955
0.968
0.963
QSVM
0.950
0.957
0.948
0.952
0.952
قن
0.929
0.930
0.936
0.922
0.933
الجدول 8. الأداء العام لـ QuEML.
تمل
أ
P
ر
سب
ف
كن
0.953
0.961
0.949
0.957
0.955
SVM
0.950
0.958
0.946
0.954
0.952
إيه إن إن
0.920
0.920
0.930
0.909
0.925
الجدول 9. الأداء العام لـ TML.
الشكل 7. مقابل مقابل من QBE.
لقد حقق أسلوب التجميع التقليدي (BE) أداءً جيدًا بدقةالذي هو و أكبر من SVM التقليدي وANN. ولكن في حالة وقت التدريب، كان أداء SVM أفضل مع وقت تدريب قدرهالذي يدور حولأقل من الطرق التقليدية لشبكات الأعصاب الاصطناعية وطرق BE. بشكل عام، حققت طرق QuEML دقة متوسطة تبلغ 0.947 والتي تقترب منأكبر من TML، وقد حققت QuEML أيضًا أداءً ملحوظًا في وقت التدريب والذي يبلغ حواليس أكبر من TML. من الدراسة التجريبية، تم إثبات أن الأساليب المعززة بالكم في تعلم الآلة تتفوق على الأساليب التقليدية في تعلم الآلة من حيث الدقة ووقت الحوسبة.
على الرغم من أن QuEML مفيد للدقة وتسريع عملية التشخيص، إلا أنه لا يزال يطرح العديد من التحديات العملية. قد تفقد الكيوبتات خصائصها الكمومية مثل التشابك، مما يؤدي إلى فقدان البيانات المخزنة، حيث أن الحرارة والضوء يسببان تدهور الكم. وبالمثل، تؤدي دورات الكيوبت غير الصحيحة إلى نتيجة غير دقيقة مما يسبب تشخيصًا خاطئًا. في المستقبل، يمكن تعزيز أداء نظام تشخيص أمراض القلب بشكل أكبر من خلال دمج أساليب التعلم العميق مع QuEML.
أداء QSVM
الشكل 8. مقابل مقابل من QSVM.
الشكل 9. مقابل مقابل من قن.
QuEML
QBE
713.4
كن
951.2
QSVM
679.9
SVM
755.5
قن
616.6
إيه إن إن
٨٨٠.٨
الجدول 10. وقت التدريب فيس.
QuEML
OFS
يا إلهي
QBE
713.4
761.0
QSVM
679.9
690.7
قن
616.6
666.4
الجدول 11. أداء CSE من حيثفي.
توفر البيانات
تتوفر مجموعات البيانات التي تم تحليلها خلال الدراسة الحالية في مستودع كاجل،https://www.kaggle.com/datasets/sid321axn/heart-statlog-cleveland-hungary-final.
تاريخ الاستلام: 7 فبراير 2023؛ تاريخ القبول: 23 يونيو 2023 نُشر على الإنترنت: 29 مارس 2024
References
Ramalingam, V.-V., Dandapath, A. & Raja, M. Heart disease prediction using machine learning techniques: A survey. Int. J. Eng. Technol. 7(28), 684-687 (2018).
Mendis, S., Puska, P., Norrving, B. & World Health Organization. Global Atlas on Cardiovascular Disease Prevention and Control. (World Health Organization, 2011).
Katarya, R. & Srinivas, P. Predicting heart disease at early stages using machine learning: A survey. Int. Conf. Electron. Sustain. Commun. Syst. 8, 302-305 (2020).
Li, J.-P. et al. Heart disease identification method using machine learning classification in e-healthcare. IEEE Access. 8, 107562107582 (2022).
Arabasadi, Z., Alizadehsani, R., Roshanzamir, M., Moosaei, H. & Yarifard, A. A. Computer aided decision making for heart disease detection using hybrid neural network-genetic algorithm. Comput. Methods Progr. Biomed. 141, 19-26 (2017).
Alizadehsani, R. et al. A data mining approach for diagnosis of coronary artery disease. Comput. Methods Progr. Biomed. 111, 52-61 (2013).
Nahar, J., Imam, T., Tickle, K.-S. & Chen, Y.-P. Computational intelligence for heart disease diagnosis: A medical knowledge driven approach. Expert Syst. Appl. 40, 96-104 (2013).
Nahar, J., Imam, T., Tickle, K.-S. & Chen, Y.-P. Association rule mining to detect factors which contribute to heart disease in males and females. Expert Syst. Appl. 40, 1086-1093 (2013).
Tsipouras, M.-G. et al. Automated diagnosis of coronary artery disease based on data mining and fuzzy modeling. IEEE Trans. Inf. Technol. Biomed. 12, 447-458 (2008).
Anooj, P.-K. Clinical decision support system: Risk level prediction of heart disease using weighted fuzzy rules. J. King Saud Univ. Comput. Inf. Sci. 24, 27-40 (2012).
Pal, D., Mandana, K.-D., Pal, S., Sarkar, D. & Chakraborty, C. Fuzzy expert system approach for coronary artery disease screening using clinical parameters. Knowl. Based Syst. 36, 162-174 (2012).
Kavitha, S. S. & Kaulgud, N. Quantum K-means clustering method for detecting heart disease using quantum circuit approach. Soft Comput. 3, 1-14 (2022).
Shah, S. M. S., Shah, F. A., Hussain, S. A. & Batool, S. Support vector machines-based heart disease diagnosis using feature subset wrapping selection and extraction methods. Comput. Electr. Eng. 84, 106628 (2020).
Son, Y.-J., Kim, H.-G., Kim, E.-H., Choi, S. & Lee, S.-K. Application of support vector machine for prediction of medication adherence in heart failure patients. Healthc. Inform. Res. 16(4), 253-259 (2010).
Owusu, E., Boakye-Sekyerehene, P., Appati, J. K. & Ludu, J. Y. Computer-aided diagnostics of heart disease risk prediction using boosting support vector machine. Comput. Intell. Neurosci. 23, 5132 (2021).
Medhekar, D., Mayur, S., Bote, P. & Deshmukh, S.D. Heart disease prediction system using naive Bayes. Int. J. Enhanced Res. Sci. Technol. Eng. 2, 3 (2013).
Miranda, E., Irwansyah, E., Amelga, A.-Y., Maribondang, M.-M. & Salim, M. Detection of cardiovascular disease risk’s level for adults using naive bayes classifier. Healthc. Inform. Res. 22(3), 196-205 (2016).
Vembandasamy, K., Sasipriya, R. & Deepa, E. Heart diseases detection using Naive Bayes algorithm. Int. J. Innov. Sci. Eng. Technol. 4, 441-444 (2015).
Miray, A., Sönmez, Ö.E. & Özcan, T. Diagnosis of heart disease using an intelligent method: A hybrid ANN-GA approach. InInternational Conference on Intelligent and Fuzzy Systems. 1250-1257 (Springer, 2019).
Khemphila, A. & Boonjing, V. Heart disease classification using neural network and feature selection. In: 21st International Conference on Systems Engineering (IEEE, 2011).
Kim, J. K. & Kang, S. Neural network-based coronary heart disease risk prediction using feature correlation analysis. J. Healthc. Eng. 3, 406-409 (2017).
Deekshatulu, B.-L. & Chandra, P. Classification of heart disease using k-nearest neighbor and genetic algorithm. Proc. Technol. 10, 85-94 (2013).
Enriko, I., Agung, K., Suryanegara, M. & Gunawan, D. Heart disease prediction system using k-Nearest neighbor algorithm with simplified patient’s health parameters. J. Telecommun. Electron. Comput. Eng. (JTEC) 8(12), 59-65 (2016).
Pandey, A.-K., Pandey, P., Jaiswal, K.-L. & Sen, A.-K. A heart disease prediction model using decision tree. IOSR J. Comput. Eng. (IOSR-JCE) 12(6), 83-86 (2013).
Zhang, Z. et al. Application of decision trees to the determination of the year-end level of a carryover storage reservoir based on the iterative dichotomizer 3. Int. J. Electr. Power Energy Syst. 64, 375-383 (2015).
Ambrish, G., Ganesh, B., Ganesh, A., Srinivas, C. & Mensinkal, K. Logistic regression technique for prediction of cardiovascular disease. In Global Transitions Proceedings (2022).
Soleimani, P. & Neshati, A. Applying the regression technique for prediction of the acute heart attack. Int. J. Biomed. Biol. Eng. 9(11), 767-771 (2015).
Singh, Y.K., Sinha, N. & Singh, S.K. Heart disease prediction system using random forest. In International Conference on Advances in Computing and Data Sciences. 613-623 (Springer, 2016).
Javeed, A. et al. An intelligent learning system based on random search algorithm and optimized random forest model for improved heart disease detection. IEEE Access. 7, 180235-180243 (2019).
Jabbar, M.-A., Deekshatulu, B.-L. & Chandra, P. Intelligent heart disease prediction system using random forest and evolutionary approach. J. Netw. Innov. Comput. 4(2016), 175-184 (2016).
Abdollahi, J. & Nouri-Moghaddam, B. A hybrid method for heart disease diagnosis utilizing feature selection based ensemble classifier model generation. Iran J. Comput. Sci. 4, 1-18 (2022).
Yekkala, I., Dixit, S. & Jabbar, M.-A. Prediction of heart disease using ensemble learning and particle swarm optimization. In International Conference on Smart Technologies for Smart Nation (SmartTechCon) (IEEE, 2017)
Tiwari, P. & Melucci, M. Towards a quantum-inspired binary classifier. IEEE Access. 7, 42354-42372 (2019).
Khan, T.-M. & Robles-Kelly, A. Machine learning: Quantum vs classical. IEEE Access. 8, 219275-219294 (2020).
Tiwari, P. & Melucci, M. Towards a quantum-inspired binary classifier. IEEE Access 7, 42354-42372 (2019).
Wereszczynski, K., Michalczuk, A., Josinski, H. & Polanski, A. Quantum computing for clustering big datasets. Appl. Electromagnet. Mod. Tech. Med. (PTZE) 4, 276-280 (2018).
Dang, Y., Jiang, N., Hu, H. Z., Ji, X. & Zhang, W. Image classification based on quantum K-nearest-neighbor algorithm. Quantum Inf. Process. 17, 9 (2018).
Lu, S. & Braunstein, S. Quantum decision tree classifier. Quantum Inf. Process. 13(3), 757-770 (2014).
Amin, J., Sharif, M., Gul, N., Kadry, S. & Chakraborty, C. Quantum machine learning architecture for COVID-19 classification based on synthetic data generation using conditional adversarial neural network. Cognit. Comput. 13, 1-12 (2021).
Sharma, S. Qeml (quantum enhanced machine learning): Using quantum computing to enhance ml classifiers and feature spaces. arXiv preprint arXiv:2002.10453 (2020).
Sharma, S., Rastogi, S. & Devanssh, M. Quantum computing will completely change the healthcare infrastructure to new level and -help transform the healthcare from preventive to predictive healthcare: A future perspective. Innov. J. 9, 2020-2277 (2020).
Chalumuri, A., Kune, R. & Manoj, B.-S. Training an artificial neural network using qubits as artificial neurons: A quantum computing approach. Proc. Comput. Sci. 171, 568-575 (2020).
Vashisth, S., Dhall, I. & Aggarwal, G. Design and analysis of quantum powered support vector machines for malignant breast cancer diagnosis. J. Intell. Syst. 30(1), 998-1013 (2021).
Macaluso, A., Lodi, S. & Sartori, C. Quantum algorithm for ensemble learning. In Italian Conference on Theoretical Computer Science (ICTCS).149-154 (2020).
Haq, A. U. et al. DACBT: Deep learning approach for classification of brain tumors using MRI data in IoT healthcare environment. Sci. Rep. 12, 15331 (2022).
Haq, A., Li, J.P., Kumar, R. et al. MCNN: A multi-level CNN model for the classification of brain tumors in IoT-healthcare system. J. Ambient Intell. Hum. Comput. (2022).
ul Haq, A. et al. A survey of deep learning techniques-based Parkinson’s disease recognition methods employing clinical data. Exp. Syst. Appl. 208, 118045 (2022).
مساهمات المؤلفين
V.B.-الكتابة؛ R.-التجريب؛ J.-التحقق.
المصالح المتنافسة
يعلن المؤلفون عدم وجود مصالح متنافسة.
معلومات إضافية
يجب توجيه المراسلات والطلبات للحصول على المواد إلى S.V.B. معلومات إعادة الطبع والتصاريح متاحة علىwww.nature.com/reprints. ملاحظة الناشر: تظل شركة سبرينغر ناتشر محايدة فيما يتعلق بالمطالبات القضائية في الخرائط المنشورة والانتماءات المؤسسية.
قسم علوم الحاسوب، كلية كريستيان للهندسة والتكنولوجيا، دينديجول، الهند.قسم الذكاء الاصطناعي وعلوم البيانات، كلية PSNA للهندسة والتكنولوجيا، دينديجول، الهند.قسم هندسة الإلكترونيات والاتصالات، كلية سافيثا الهندسية، تشيناي، الهند.البريد الإلكتروني:venkateshflower6@gmail.com
Revolutionizing heart disease prediction with quantum-enhanced machine learning
S. Venkatesh Babu , P. Ramya & Jeffin Gracewell
Abstract
The recent developments in quantum technology have opened up new opportunities for machine learning algorithms to assist the healthcare industry in diagnosing complex health disorders, such as heart disease. In this work, we summarize the effectiveness of QuEML in heart disease prediction. To evaluate the performance of QuEML against traditional machine learning algorithms, the Kaggle heart disease dataset was used which contains 1190 samples out of which of samples are labeled as positive samples and rest samples are labeled as negative samples. The performance of QuEML was evaluated in terms of accuracy, precision, recall, specificity, F1 score, and training time against traditional machine learning algorithms. From the experimental results, it has been observed that proposed quantum approaches predicted around of positive samples as positive and an average of of negative samples are predicted as negative whereas traditional machine learning approaches could predict around of positive samples as positive and of negative samples as negative. Furthermore, the computational complexity of QuEML was measured which consumed average of for its training whereas traditional machine learning algorithms could consume an average s for training. Hence, QuEL was found to be a promising approach in heart disease prediction with an accuracy rate of higher and training time of s faster than that of traditional machine learning approaches.
Keywords Quantum computing, Machine learning, Ensemble methods, Heart disease prediction
In the modern world, heart disease is being emerged as the prominent cause of human death. Changes in food habits, lifestyle, and work-related stress are the major contributors to the increase in the rate of heart disease. The World Health Organization (WHO) stated that 17.7 million people all around the world have been suffered from heart disease every year . According to the report released by Global Burden of Disease in 2016, 1.7 million Indians were affected by cardiovascular diseases (CVD) . Coronary artery disease (CAD) is the most common type of CVD and the reason behind CAD is blockage or obstruction in at least one of the coronary arteries. Therefore, a lack of blood supply will damage the heart, brain, and legs which in turn causes heart attacks and rupturing of blood vessels. Approximately of people around the world are suffering from CAD and of the annual budget has been spent on CAD treatment . The heart-related disease like CAD increases the spending on health care and reduce the productivity of the individual. Hence, there is a need for precise preventive and diagnostic mechanisms to reduce the mortality rate of CAD.
Normally, diagnosis of heart disease can be done by manual examination of the risk factors such as patient’s age, sex, family history, lifestyle, etc., physical examination reports, and analyzing the patient’s symptoms. But the manual examination leads to inaccurate prediction since some parameters to be analyzed may remain hidden and it is computationally expensive to analyze such huge factors . Angiography is widely used as the most precise method for diagnosing , but, it is associated with high cost and major side effects. Healthcare sectors are struggling to offer reliable diagnoses at a reasonable cost. Moreover, image-based detections are more costly and not suitable for screening large populations. So, many researchers have endeavored to develop a non-invasive, economical, and fast automated diagnosis system for early detection of CAD based on Machine Learning Algorithms.
Many ML algorithms have shown promising results in terms of greater accuracy rate and speed up the performance in early diagnosis of heart disease by identifying hidden patterns. Despite these greater benefits, still there is a computational bottleneck when dealing with larger and more complex data using traditional
computers results ML algorithms being incapable of handling computationally rich tasks . At this point, the quantum computing principle has lent its hand to enhance computational power. Thus, quantum Enhanced machine learning algorithms facilitate healthcare industries to evaluate and treat complicated health disorders.
The major contribution of this article is conducting an experimental study about various ML algorithms that have been utilized recently in predicting heart disease from which suitable ML methods have been identified. Then this study revealed the essentials of quantum computing integration to enhance the machine learning algorithms to speed up the computation process. Then, the proposed QuEML techniques have been evaluated based on selected features that show greater accuracy and speed in prediction.
The paper begins by providing an overview of the various machine-learning algorithms used for heart diagnosis which is given in “Introduction”. This is followed by a detailed study of ML and QML algorithms to explore their strengths and weakness in detecting disease are explained in “Background of study”. Further, an explanation of the workings of Quantum Enhanced Machine Learning Algorithms (QML) is presented in “System materials and methods”. The experimental results, obtained from utilizing the datasets, are then presented in “Results and discussions” to demonstrate the effectiveness of the diagnostic methods. The paper concludes by summarizing the findings and highlighting potential areas for future improvement which is presented in “Conclusion”.
Background of study
This section portrays the various ML techniques that have been employed by various academicians for effective heart disease diagnosis. The major reason to utilize the ML algorithm is that it is capable of detecting hidden patterns and can operate with large datasets to make predictions. , Syed et al. were involved in developing SVM-based Heart Disease Diagnosis using the datasets Cleveland, Hungarian, Switzerland, and a combination of all of them ( 709 instances). Then, utilize the advantages of Mean Fisher Based Future Selection and Accuracy-based Feature selection algorithms for optimal feature selection. Further, the selected feature subset is refined through Principal Component Analysis. Finally, Radial Basis Function Kernel Based Support Vector Machine is applied over the reduced feature subset to categorize the heart disease patient from normal people. Their experimental result demonstrated that the proposed framework outperforms with an average accuracy rate of . Youn-Jung et al. have chosen the SVM algorithm as it can handle high dimensionality problems to detect heart patients where data about patients are collected from University Hospital through a self-reported questionnaire and the experiment is carried out based on leave-oneout cross-validation (LOOCV) and it was proven that SVM based classification is a promising approach with the highest detection accuracy of . Ebenezer et al. have developed a mechanism based on Boosting SVM to enhance prediction accuracy by combining the results of all weak learners. For reducing misclassification, normalization, redundancy removal, and heat-map are applied over the given datasets. Upon applying heat-map, it identifies important factors such as age and maximum heart rates in predicting heart disease which further facilitates prediction. In this study, Cleveland datasets were used which contain 303 instances with 13 attributes. Through the experimental results, the performance of the Boosting SVM is compared with Logistic regression, Nave Bayes, decision trees, Multilayer Perceptron, and random forest. Out of which, the proposed Boosting SVM achieves greater accuracy of .
Medhekar et al. were involved in developing a Naïve Bayes Classifier (NBC) based Heart Disease Prediction System using the Cleveland dataset downloaded from the UCI repository to classify the patients into five categories viz. no, low, average, high, and very high to identify the severity level of disease. Then, System accuracy was calculated and the results are tabulated to evaluate the system performance through which it can be observed that the proposed NBC-based system could attain of accuracy. Vembandasamy et al. , proposed a framework to detect heart disease using NBC. The experiment is carried out by the WEKA tool over the datasets collected from a diabetic research institute in Chennai and the accuracy rate yielded by the system is about . The authors of presented an article for heart disease detection using NBC and could able to attain an accuracy rate of which is comparably poor by performing prediction over the dataset collected from Mayapada Hospital which contains 60,589 records. Heart disease prediction using NBC is quite challenging since all the properties in NBC are required to be mutually independent .
The authors of have employed the concept of neural networks in heart disease diagnosis to improve the accuracy further. , Firstly, Cleveland datasets were subjected to a Feature selection algorithm that uses information gain to remove the features which do not contribute to the disease prediction. Further, the ANN algorithm was applied over the reduced feature set for classification. This study dictated that the accuracy ( ) of the system with a reduced feature set ( 8 features) is slightly improved than the accuracy ( ) of the system with a full feature set ( 13 features). Miray et al. have presented an intelligent heart disease diagnosis method using a hybrid Artificial Neural Network (ANN) and Genetic Algorithm (GA) where GA is used to optimize the parameters of ANN. Experimental results are obtained by using Cleveland data through which it is visible that the hybrid approach outperforms Naive Bayes, K- Nearest Neighbor, and C4.5 algorithms in terms of accuracy rate ( ), precision ( ), recall ( ) and F-measure ( ). Even NN model is good at generalizing data and capable of analyzing complex data to discover hidden patterns, many medical experts are dissatisfied with NN because of its black-box characteristics. That is, NN models get trained without knowing the relationship between input features and outputs. So, if many irrelevant features are used to train the NN model, it results in inaccurate prediction in testing. To address this challenge, Kim and Kang have employed two preprocessing steps before applying ANN. The first step is the feature selection step to select the features based on ranking. Then, feature correlation analysis is performed to make the system learns about the correlation between feature relations and NN output thereby eliminating the black-box nature. The overall experiment is performed on the Korean dataset containing 4146 records and resulted in a larger ROC curve with more accurate predictions.
However, ANN could be suffered from data overfitting and temporal complexity and it may fail to converge when dimensionality is low.
As K-Nearest Neighbor (KNN) is a simple and straightforward approach where samples are classified based on the class of nearest neighbors, the authors of have employed the KNN algorithm for classifying heart disease. Since medical datasets are larger, the Genetic algorithm was utilized to prune redundant and irrelevant features from 6 different medical datasets taken from the UCI repository to improve the prediction accuracy which is greater than the accuracy rate achieved by the KNN algorithm without GA. Ketut et al. have proved that simple and fewer features are good enough to reduce misclassification, especially in heart disease prediction. In the experimental study, chi-square evaluation is done over the given Hungarian data set which contains 293 records with 76 parameters. But, in this paper, only 13 parameters were taken into consideration and after performing a chi-square evaluation, it results in 8 parameters as the most important parameters. Subsequently, KNN is executed with reduced feature set results with of accuracy which is considerably greater than NBC, CART, and KNN with full feature set.
A heart disease prediction model using Decision Tree Algorithm (DT) has been implemented on UCI datasets . The main aim of this paper is to reveal the importance of the pruning approach in DT which provides compact decision rules and accurate classification. The J48 DT algorithm is implemented with three types such as DT with pruning, un-pruning, and pruning with a reduced error rate. In this experiment, it shows fast blooding sugar is the most important attribute which yields greater accuracy ( ) than other attributes but, it is comparably very poor. The DT algorithm is simple, but it is capable of handling only categorical data and it is inappropriate for smaller datasets and datasets with missing values .
In Research , Logistic Regression (LR) is applied to UCI datasets to classify cardiac disease. Initially, data preprocessing is done to filter the missing values, and a feature selection process based on correlation is carried out to select the highly co-related features. Then given data is split into training and testing splits to perform classification by LR. From the tabulated results, it shows that LR increases the accuracy by when increases the training size from 50 to . Paria and Arezoo were involved in developing a regression-based heart attack prediction system. For this purpose, three regression models were made based on the variable selection algorithm and applied to the dataset with 28 features collected from Iran hospitals. The model that uses the following features such as severe chest pain, back pain, cold sweats, shortness of breath, nausea, and vomiting yielded a greater accuracy of than that of the model using physical examination data and ECG data.
Yeshvendra et al. have employed Random Forest (RF) algorithm for heart disease prediction. In this paper, the Cleveland heart disease dataset was exploited which has non-linear dependency attributes. So, RF is considered the optimum solution for the non-linear dependent datasets and it produced good accuracy of by making a bit of adjustment over the non-linear dataset. To reduce the overfitting problem, Javeed et al. have developed an Intelligent Heart Disease Diagnostic system that uses Random Search Algorithm (RSA) for feature selection from the Cleveland dataset and Random Forest (RF) model for heart disease prediction. Based on the experimental results, it is observed that RSA-based RF produced accuracy using only 7 features which are higher than the conventional RF . As the ensemble nature of RF is capable of producing high accuracy, handling missing and huge data, eliminating the need for tree pruning, and solving the problem of overfitting, authors of have employed RF to predict heart disease. In addition, chi-square and genetic algorithms were applied to select the prominent features from the heart disease data set collected from various corporate hospitals in Hyderabad. The performance of the proposed system is about of accuracy which is considerably greater than the NBC, DT, and Neural Nets.
Jafar and Babak proposed an efficient and accurate system to diagnose heart disease. This research developed an ensemble classification model based on a feature selection approach. The heart disease dataset used by this research is downloaded from the UCI repository which contains 270 records with 13 useful variables. After selecting the prominent features, seven classifiers namely SVM, NBC, DT MLP, KNN, RF, and LR were used in ensemble learning to predict the disease. The final prediction over the given sample is done by combining the prediction result of all seven classifiers using the Stacked Ensemble method. An ensemble learning based on a genetic algorithm had shown the best performance and could lead to accuracy, sensitivity, and specificity. Ensemble learning is a combination of multiple classifiers which improves the predictive performance by combining the output of individual classifiers. To identify the best ensemble method in heart disease detection from the heart Stalog dataset, Indu et al. developed an automatic disease diagnosis system based on three ensemble learners such as Random Forest, Boosting, and Bagging along with PSO-based feature subset selection method. The overall experiment is carried out using RStudio and the proposed system with the bagging approach yielded greater accuracy than the other approaches. The Table 1 summaries the major finding.
Major findings of the study
Automatic heart diagnostic systems that were developed using ML techniques were surveyed as heart disease is the major cause of human deaths in today’s world, so an effective and accurate diagnosis system is to be developed to save human lives.
From the above study, it is observed that many researchers were interested in machine learning for heart disease diagnosis since it helps to reduce diagnosis time and increases accuracy.
From the study, every new approach competes with one another to win a greater accuracy rate.
Boosting-based SVM and an Ensemble of classifiers are being seen as the most promising methods that yielded the greater accuracy ever seen.
One algorithm may work well for one dataset while cannot work well for another dataset.
S. no.
References
Algorithms
Major findings
1
13-15
SVM
SVM is most preferred as it can handle high dimensionality problems
Boosting SVM enhances accuracy up to 99.75%
2
16,17
18
NBC
NBC’s heart disease prediction is challenging. Since requires all features to be mutually independent
3
19,20
21
ANN
ANN is good at generalization and capable of analyzing complex data and able to attain an accuracy of up to
To eliminate the block box nature of ANN, feature selection is employed which enhances prediction accuracy further
4
22,23
KNN
KNN is simple and not suitable for high dimensional data which is common in heart disease datasets
In high-dimensional data, the distance between points tends to become less informative, making it difficult for KNN to identify the nearest neighbors accurately
5
24,25
DT
It can be prone to overfitting and it is inappropriate for handling data with missing values
DT can sometimes be biased toward selecting features resulting in a less accurate model
6
26,27
LR
It requires a linear relationship between features
It can limit the capability to capture underlying patterns leading to lower accuracy
7
28,29
30
RF
The Potential issue with RF is that it can be computationally expensive and memory-intensive, particularly when dealing with medical data
8
31,32
Ensemble Approaches
The Bagging Ensemble approach yielded greater accuracy up to due to its ability to reduce overfitting, improve generalization, and combine the strengths of multiple machine learning algorithms
9
36-40
Quantum Computing
It performs certain operations faster
This speedup can be harnessed to accelerate certain machine-learning algorithms by reducing the time required for training
Table 1. Major findings of the study.
The accuracy of the system may rely on the quality of the datasets used.
Some datasets can have missing values, redundancies, and noises which makes data to be unsuitable. Such uncertainty can be resolved by applying data preprocessing techniques such as normalization, missing value imputation, etc.
Some datasets may have too many attributes which may threaten the performance of ML in accuracy and computational time. It can be improved by applying suitable feature selection strategies to perform prediction with the most informative features.
As machine learning algorithms predict the output by learning the relationship between input features and class labels based on classical theories of probability and logic, the accuracy rate is still on the lower side . So, it requires a lot of improvements to have general acceptability for disease prediction. Another major issue in traditional machine learning algorithms is computation time. Since the computation time is increased with an increase in the size of the feature set. Therefore, the main aim of the paper is to enrich the performance of classical ML algorithms and make them outperform all the baselines in terms of Precision, Recall, F-Measures, and Computation Time . It redirects the research toward quantum computing to create a pave to integrate quantum computing with ML approaches.
Motivation for the study
After having detailed observation from the recent articles , quantum mechanics have shown excellent performance in various fields such as classification, disease prediction, object detection, and tracking and achieved remarkable performance over classical probability theory-based models. The basics of quantum computing, its essential features, and working are available in public domains, as a result, it cannot be explored further.
When compared with traditional machine learning algorithms, quantum Enhanced machine learning algorithms are capable of reducing training time, automatically adjusting the network hyper-parameters, performing complex matrix and tensor manipulation at high speeds, and use of quantum tunneling to achieve objective function goals. Integrating quantum computing and machine learning enables healthcare sectors to evaluate and treat complicated health disorders. Quantum computing uses the principle of quantum physics in which a single bit can be represented in both 0 and 1 which is known as qubits (Quantum Bits). Another salient feature of quantum computing is Superposition allows the particle to exist in multiple states at a time which provides tremendous power to handle massive amount of data, Entanglement occurs when pair of particles are generated which allows them to share spatial proximity or interact, Quantum tunneling enables computer to complete the task faster and Quantum gates work on collections of quantum sates to produce desired output. The first quantum computing device came into act in the year of 2000 , so many researchers recently utilized quantum computing principle to analyze billions of diagnostic data with the help of artificial intelligence techniques. Quantum-enhanced machine learning assists physicians with earlier and more accurate health disease predictions. According to the report of , the time spent on research and analyzing diagnostic data will decrease when quantum computing is integrated with healthcare systems.
With this motivation, the paper aims to implement Quantum Enhanced Machine Learning approaches for diagnosing heart diseases and it yields a remarkable accuracy rate and computation time shown in “Results and discussions” by simply replacing classical probability theory with quantum probability theory and it makes use of superposition state that provides a higher degree of freedom in decision making.
System materials and methods
Dataset description
It describes the datasets that have been used to implement QuEML (Quantum Enhanced Machine Learning) Framework for heart disease diagnosis. The Heart Disease Dataset (HDD) is taken from the Kaggle repository and it is a comprehensive dataset of 1190 instances which is a combination of five different datasets listed in Table 2 and the combination is based on 11 common features with one target variable listed in Table 3.
Proposed methodologies
The steps that are followed in this research are depicted in Fig. 1. The collected HDD is subjected to Exploratory Data Analysis (EDA) to eliminate outliers, impute missing values and normalize the dataset. Then preprocessed dataset is fed into Chi-square Evaluation to retain the top-ranked features (TRF). Then the data sets with TRF are split into training, and testing split with the ratio of 70:30. Now, the quantum-enhanced approach is developed based on training data in which the number of qubits is specified based on (No.offeatures). Further feature mapping can be carried out by entangling qubits to second-order expansion. At last, the quantum circuit is generated to train the model using QML approaches such as QSVM, QANN, and QBE. Thereafter, the performance of Quantum enhanced machine learning framework is evaluated against traditional machine learning approaches by test set based on several performance metrics such as Accuracy, Precision, Recall, and F1-Score. The overall process of proposed QuEML framework is depicted in Algorithm 1.
Exploratory data analysis (EDA)
It is considered an essential step in the data-driven analysis. It deals with the visualization of data with various aspects such as imputing missing values, normalization, and identifying highly correlated and low variance attributes. It can be done with the help of pandas and matplot libraries and the result is shown in Fig. 2 from which it has been inferred that the chosen dataset has no duplicate and null values and it is good which will be further analyzed. Subsequently, Min-Max scalar technique is applied over the given data set which rescales the data from its original range to a defined range using Eq. (1) where X ‘ is a rescaled value and X is an original value and various notations used in the following subsequent sections are given in Table 4. It can be done with the help of MinMaxScaler () from the sklearn library which further enables Quantum enhanced machine learning algorithms to treat the dataset equally. Finally, the important features can be inferred from the given data set by heatmap () which identifies the correlation between each feature as shown in Fig. 3.
Result of ECG at rest; 0-normal; 1-ST-T wave abnormality; 2-showing probable or definite left ventricular hypertrophy by Estes’ criteria
0 to 2
ECG
Maximum heart rate
Maximum heart rate achieved
60 to 202
Symptom and examination
Exercise angina
Angina induced by exercise; 0-no; 1-yes
0 to 1
ECG
Old peak
Exercise-induced ST depression in comparison with the state of rest
-2.6 to 6.2
ECG
ST slope
The slope of the peak exercise ST segment; 1-up sloping; 2-flat; 3-down sloping
0 to 3
Target variable
0-normal; 1-HD (heart disease)
0 or 1
Table 3. Description of dataset features.
Figure 1. Steps used in QuEML.
In Fig. 3, the features which are listed in Table 3 are numbered from 0 to 11 . The figure shows that the feature Chest Pain Type has a positive correlation with the target variable which indicates that people who have chest pain results in a greater chance to have severe heart disease. In addition to this, cholesterol and heart rate features have a negative correlation with the target variable.
Chi-square evaluation (CSE)
It picks certain features from the non-negative data set that has the best relationship with the target variable. After performing CSE, top K-features are chosen based on their chi-square score results from a reduced feature set as a large number of irrelevant features increase the training time exponentially and increase the risk of overfitting. In this research, the K value is set as 8 and the implementation of CSE is carried out by SelectKBest() of the sklearn library. The Chi-Square Score (CSS) is calculated between each feature and target variable by using Eq. (2) where represents the Observed Frequency of feature ‘i’ concerning the target variable and denotes the Expected Frequency of feature ‘ ‘ concerning target variable.
QuEML framework
Quantum Enhanced Machine Learning algorithms are employed in this research since it is optimizing traditional machine learning algorithms and helps in superior classification and pattern detection which in turn discover abnormal behaviors and eliminating fraudulent medical claims. From the study that has been conducted in “Background of study”, it has been visualized that the traditional approaches such as SVM, ANN, and Ensemble approach had shown excellent performance in automatic heart disease diagnosis systems with greater accuracy rate. Hence, the proposed framework has utilized those traditional classifiers which are further optimized by applying quantum computing principles.
Quantum artificial neural network (QANN). Training an ANN is a complex task since the parameters of the network must be optimized to avoid overfitting. When the number of parameters to be optimized is increased, it leads to a lot of computational overhead. So, such complex tasks can be easily handled by QANN. In QANN, the neurons of input layers are replaced by Qubits as shown in Fig. 4 which avoids the usage of nodes in hidden layers
Input: Datasets HDD
Output: prediction of HD + and HD - cases.
Begin
Do
For each row in HDD
    Apply EDA to generate preprocessed dataset HDD_P
End
Do
    Execute CSE on HDD_P to retain top ranked feature set HDD_TRF
End
Split HDD_TRF into training and testing set
Apply Quantum approach on training split
Do
    Specify Qubits Qb
    Then apply entangling Qb based feature mapping
    Then generate Quantum Circuit Qc
End
Do till reaches Max_Iteration
    Execute QuEML approaches on training split using Qc to train the model
End
Evaluate QuEML approaches using testing split
Stop
Algorithm 1. QuEML framework.
as in traditional ANN. Thus, it reduces the number of parameters to be optimized. In the proposed approach , no of parameters to be optimized are 18 as there are six hidden layers with three single qubit rotation in each layer. The input data is encoded as the superposition of states where k denotes the dimension of qubits using an amplitude embedding scheme where input data is embedded as the amplitude of different states in superposition and the amplitudes are represented by a state vector with a dimension of . For example, in this research, no of Qubits are and input data is encoded as a quantum state with a superposition of different states such as . The hidden layer contains a connection between qubits that uses Controlled NOT (CNOT) gates for entanglement. is a single qubit rotation around the y -axis through an angle of . Quantum gates are used to modify the state of the qubits using rotational parameters. Finally, the output value is determined based on measuring the state of the qubit. The output value is measured by using Pauli-Z measurement in which states are represented as and to determine the binary output 1 and -1 respectively. Here quantum measurement act as an activation function that saves computational effort. Then, the output value is compared with the target variable to calculate the loss. Then, rotational parameters are modified continuously until the state of qubits gives the desired target value.
Quantum support vector machine (QSVM). Quantum SVM offers a computational advantage over traditional SVM which further facilitates classification with higher dimensions. It can be trained as similar to traditional SVM once the quantum kernel is obtained. In QSVM , the input data is transformed into quantum states . This can be achieved by performing quantum feature map in which is a classifier that can be applied to input data x’. Feature maps are done based on the Ansatz principle as given in Eq. (3) in which ‘ h ‘ denotes the hadamard gate which is applied to each qubit and ‘ n ‘ indicates several qubits. Moreover, the depth of the circuit can be defined as ‘ 2 ‘ which applies the Ansatz principle two times. Hence, the form of the feature map can be as shown in Eq. (4). Then, the Quantum kernel can be measured by estimating the overlap between two states which can be done by using the circuit shown in Fig. 5 and the frequency of the measurement string like gives the estimation of state overlap. The parameterized quantum circuit is generated using Qiskit Aqua Library which uses the SecondOrderExpansion function that takes feature dimensions and depth as arguments. At last, Qiskit provides a predefined function through which training is performed by applying a quantum kernel with less computational cost, and the hyperparameters of QSVM are tuned to minimize the loss.
Figure 2. Finding null values.
Quantum bagging ensemble (QBE). It produces a combined model that outperforms a single model by combining the strengths of collections of simple weak learners which reduces the prediction error. In order to implement quantum registers ( ) are used such as Control register ( ), Training register ( ), Temp register ( ), Test register ( ) and Target register ( ) as shown in Fig. 6 where the size of and depends on the size of the input, determines the size of subsamples used as input in the single weak classifier, size of depends on the nature of target variable and size of determines the number of weak learners used in the prediction. Then, the proposed QBE begins with the state preparation process ( ) where training and testing data are encoded into respective registers, and the control register is initialized into uniform superposition as given in Eq. (5) in which ‘ ‘ indicates Hadamard gate, ‘ ‘ indicates a number of qubits, and are the unitary which encode the input data ‘ x ‘ and ‘ y ‘ into quantum state and is the state of quantum registers. Further, sampling in superposition ( ) is performed using Eq. (6) where quantum oracle ‘v’ is used which entangles several sub-samples of data (xi,yi) with control register. Finally, classification can be done by interaction via interference (|S3>) between and as shown in Eq. (7) in which fi(x’) is used to store the estimate of the target variable which depends on the ‘ith’ sub-sample and test set x ‘ and expectation measurement (<M>) on target qubit is determined using Eq. (8) where several weak learners (B) is equal to which provides ensemble prediction since the final result is obtained from the average of predictions of all weak learners. If classes of the target variable are encoded into two basic states then it is possible to determine the final prediction value by using a single qubit measurement as shown in Eq. (9) in which and are the average probabilities for the test set x ‘ to be classified in class ‘ 0 ‘ and class ‘ 1 ‘ respectively.
S.No
Notation
Description
1
Find minimum value in given data set X
2
Find maximum value in given data set X
3
CSS
Chi square score
4
OF(i)
Observed frequency of feature ‘I’
5
EF(i)
Expected frequency of feature ‘I’
6
Qubit rotation around y axis through an angle
7
and
States represented in Pauli-Z( ) measurement
8
Quantum states
9
Quantum feature map
10
Hadamard gate
11
C(r)
Control register
12
T(r)
Training register
13
Te(r)
Temporary register
14
Tt(r)
Test register
15
Ta(r)
Target register
16
S0
State of quantum registers
17
fi(x’)
Estimate of target variable
18
and
Encode input data x and y into quantum state
19
<M>
Expectation measurement
20
N(T+)
Number of true positives
21
N(T-)
Number of true negatives
22
N(F+)
Number of false positives
23
N(F-)
Number of false negatives
24
P
Precision
25
A
Accuracy
26
R
Recall
27
Se
Sensitivity
28
Sp
Specificity
29
F
F1 score
30
T
Training time
Table 4. Notations with description.
Results and discussions
In this section, the results of quantum approaches performed over quantum simulators are presented. The QANN has been implemented using the PennyLane python library which has inbuilt methods for optimizing rotational parameters of quantum gates. The experiment is performed over the comprehensive data set described in Table 2 which contains 1190 instances among which 629 instances are labeled as HD (Heart Disease Positive) and 561 instances are labeled as (Heart Disease Negative). Likewise, traditional ANN has been implemented with the same data set using Keras API. In traditional ANN, it contains input layers with 8 nodes, two hidden layers with 5 and 3 nodes respectively, and the output layer has one node since each input is associated with a class label of binary value. Thus, the total number of parameters in traditional ANN to be optimized is 58 and the class label is predicted by using the sigmoid activation function. Both QANN and ANN are implemented with a set of hyperparameters as shown in Table 5.
Similarly, traditional SVM and Bagging Ensemble are implemented using Scikit-learn python library with the following tuned hyper-parameters of SVM as shown in Table 5 in which ç denotes the regularization parameter, ṕ represents penalty type, and denotes the tolerance parameter. ç defines the misclassification rate and the regularization parameter controls the strength of regularization which is inversely proportional to çand defines the termination criterion whereas quantum SVM and QBE are implemented using Qiskit Library with the number of qubits . Moreover, an overall experiment is carried out with Python and Keras API of Tensorflow 2 on a Ryzen7-3.20 GHz Processor, Graphical Processing Unit (GPU) NVIDIA RTX 3060 with 6 GB and 16 GB RAM respectively. The performance of the QuEML framework has been evaluated in terms of precision (P), accuracy , recall , sensitivity (Se), specificity (Sp), F1score (F), and training time (T) and results are populated
Figure 3. Features distribution.
using fivefold cross validation technique. Further, the given data set has been split into , and for training, validation, and testing respectively. Mathematically, these performance metrics are computed using Eqs. (10), (11), (12), (13) and (14) where N(T+) denotes the number of True Positives, N(T-) denotes the number of True Negatives, N(F+) denotes the number of False Positives and N(F-) denotes the number of False Negatives.
The confusion matrix is shown in Tables 6 and 7 which shows the classification ability of Quantum Enhanced Machine Learning approaches (QuEML) and Traditional Machine Learning approaches (TML). From the above tables, it has been observed that QBE is predicting 1144 samples correctly from the given samples of 1190 . It is and higher than the QSVM and QANN respectively. When comparing the classification performance of QuEML with TML, TML approaches are performed with an average misclassification rate of that is 211 samples are misclassified which is around higher than QuEML techniques.
Table 8 shows how QuEML outperforms all baselines in terms of Accuracy (A), Precision (P), Recall (R), Specificity (Sp), and F1 Score (F) where A measures the classification ability and QBE shows excellent prediction performance with 0.953 of accuracy because of its ensemble nature which is around and greater than QSVM and QANN respectively. The term P measures the false positive rate of QuEML where QBE, QSVM, and QANN have the precision rate of , and 0.930 respectively. R shows the prediction ability of quantum techniques in terms of true positive rate. Totally, 629 positive samples are used for experimental purposes in which the proposed quantum approaches predicted around 595 positive samples as positive. Similarly, the proposed quantum frameworks have predicted an average of 531 samples as negative from the 561 negative samples.
Figure 4. QANN architecture.
Figure 5. Estimating state overlap: depth .
Figure 6. Quantum circuit for QBE.
As per the assertion, the higher rate of precision and recall automatically increases the F1 score. So, QuEML has an F1 score of 0.950 which is closer to 1 indicating excellent classification ability of quantum approaches. Table 9 shows the overall performance of TML in which it has been observed that the overall accuracy of TML is an average of 0.941 which is around lesser than QuEML. Likewise, the P, R, Sp, and F rate of TML is around
S.no
Parameters
Values
1
Optimizer
Adam optimizer
2
Learning rate
0.01
3
Momentum
0.9
4
Kernel initialization
Standard normal distribution
5
epochs
100
6
ç
1
7
ṕ
12 regularization
8
0.0001
9
Qubits
3
Table 5. Hyperparameters.
QuEML (in %)
QBE
50.50
45.63
1.513
2.35
QSVM
50.08
44.87
2.269
2.77
QANN
49.50
43.45
3.697
3.36
Table 6. Confusion matrix of QuEML.
, and lesser than QuEML. Overall, QuEML is attaining a little bit greater performance ( greater) than TML because of its quantum nature.
To measure the generalization performance of the proposed quantum framework, the given data set is split and training , testing and validation accuracy is measured at each epoch from 1 to 100 which is shown in Figs. 7, 8 and 9 At the 100th epoch, QBE has , and rates of , and 0.966 respectively. Likewise, QSVM and QANN have increased the accuracy rate from 0.872 and 0.815 to 0.950 and 0.929 respectively. From the above charts, it is visible that the proposed quantum framework is free from overfitting which shows its excellence in generalization performance since it greatly reduces the distance between , and .
Moreover, the major reason to implement the QuEML is to speed up the classification performance. In this paper, two methods were enforced to reduce the time taken to train the model such as CSE-based feature selection and quantum-enhanced machine learning approaches. The results populated in Table 10 show the training time of QuEML which is compared with of TML in microseconds. It is demonstrated that the proposed QuEML uplifted the performance in terms of which is around 1.3 times greater than the traditional machine learning approaches. From Table 9, SVM has taken less time for training than ANN and BE. But when employing quantum principles in TML, QANN has achieved a remarkable performance of in training time than QBE and QSVM. In the proposed framework, the CSE method is used to eliminate the irrelevant features from the given data set which shortens the training time considerably as shown in Table 11. After applying CSE, QuEML is fed with an Optimized Feature Set (OFS) which has reduced features. Such a reduced feature set improved the performance of QuEML in terms of training time. As shown in Table 10, QBE with OFS has consumed which is around faster than QBE with FFS (Full Feature Set). Similarly, QSVM and QANN with OFS trained faster ( and ) than QSVM and QANN with FFS ( and ).
Conclusion
The accurate diagnosis of heart disease is critical in reducing mortality rates. This paper reviews various com-puter-aided diagnosis (CAD) systems developed using machine learning (ML) approaches, highlighting their strengths and weaknesses. From the study, it has been found that traditional machine-learning approaches are further enhanced by employing quantum principles. To prove this, an experimental study has been carried out over the Kaggle heart disease dataset. The performance evaluation is made against QuEML vs. TML in which the
HTML (in %)
BE
50.17
45.13
2.02
2.69
SVM
50.00
44.96
2.18
2.86
ANN
49.16
42.86
4.29
3.70
Table 7. Confusion matrix of TML.
QuEML
A
P
R
Sp
F
QBE
0.961
0.971
0.955
0.968
0.963
QSVM
0.950
0.957
0.948
0.952
0.952
QANN
0.929
0.930
0.936
0.922
0.933
Table 8. Overall performance of QuEML.
TML
A
P
R
Sp
F
BE
0.953
0.961
0.949
0.957
0.955
SVM
0.950
0.958
0.946
0.954
0.952
ANN
0.920
0.920
0.930
0.909
0.925
Table 9. Overall performance of TML.
Figure 7. vs. vs. of QBE.
traditional bagging ensemble (BE) has performed well with an accuracy of which is and greater than traditional SVM and ANN. But in the case of training time, SVM performed better with a training time of s which is around s than traditional ANN and BE approaches. Overall, QuEML approaches yielded average accuracy of 0.947 which is around greater than TML, and also QuEML has attained a remarkable performance in training time which is around s greater than TML. From the experimental study, it is proved that quantum-enhanced machine-learning approaches outperform traditional machine-learning approaches in terms of accuracy and computational time.
Even though the QuEML is beneficial for accuracy and speed up the diagnosis process, still it poses several practical challenges. The qubits may drop their quantum properties such as entanglement which leads to loss in stored data since heat and light causes quantum de-coherence. Similarly, incorrect qubit rotations lead to an inaccurate result which causes misdiagnosis. In the future, the performance of the heart disease diagnosis system can be boosted further by integrating deep learning approaches with QuEML.
Performance of QSVM
Figure 8. vs. vs. of QSVM.
Figure 9. vs. vs. of QANN.
QuEML
QBE
713.4
BE
951.2
QSVM
679.9
SVM
755.5
QANN
616.6
ANN
880.8
Table 10. Training time in s.
QuEML
OFS
FFS
QBE
713.4
761.0
QSVM
679.9
690.7
QANN
616.6
666.4
Table 11. Performance of CSE in terms of in .
Data availability
The datasets analysed during the current study are available in the kaggle repository, https://www.kaggle.com/ datasets/sid321axn/heart-statlog-cleveland-hungary-final.
Received: 7 February 2023; Accepted: 23 June 2023
Published online: 29 March 2024
References
Ramalingam, V.-V., Dandapath, A. & Raja, M. Heart disease prediction using machine learning techniques: A survey. Int. J. Eng. Technol. 7(28), 684-687 (2018).
Mendis, S., Puska, P., Norrving, B. & World Health Organization. Global Atlas on Cardiovascular Disease Prevention and Control. (World Health Organization, 2011).
Katarya, R. & Srinivas, P. Predicting heart disease at early stages using machine learning: A survey. Int. Conf. Electron. Sustain. Commun. Syst. 8, 302-305 (2020).
Li, J.-P. et al. Heart disease identification method using machine learning classification in e-healthcare. IEEE Access. 8, 107562107582 (2022).
Arabasadi, Z., Alizadehsani, R., Roshanzamir, M., Moosaei, H. & Yarifard, A. A. Computer aided decision making for heart disease detection using hybrid neural network-genetic algorithm. Comput. Methods Progr. Biomed. 141, 19-26 (2017).
Alizadehsani, R. et al. A data mining approach for diagnosis of coronary artery disease. Comput. Methods Progr. Biomed. 111, 52-61 (2013).
Nahar, J., Imam, T., Tickle, K.-S. & Chen, Y.-P. Computational intelligence for heart disease diagnosis: A medical knowledge driven approach. Expert Syst. Appl. 40, 96-104 (2013).
Nahar, J., Imam, T., Tickle, K.-S. & Chen, Y.-P. Association rule mining to detect factors which contribute to heart disease in males and females. Expert Syst. Appl. 40, 1086-1093 (2013).
Tsipouras, M.-G. et al. Automated diagnosis of coronary artery disease based on data mining and fuzzy modeling. IEEE Trans. Inf. Technol. Biomed. 12, 447-458 (2008).
Anooj, P.-K. Clinical decision support system: Risk level prediction of heart disease using weighted fuzzy rules. J. King Saud Univ. Comput. Inf. Sci. 24, 27-40 (2012).
Pal, D., Mandana, K.-D., Pal, S., Sarkar, D. & Chakraborty, C. Fuzzy expert system approach for coronary artery disease screening using clinical parameters. Knowl. Based Syst. 36, 162-174 (2012).
Kavitha, S. S. & Kaulgud, N. Quantum K-means clustering method for detecting heart disease using quantum circuit approach. Soft Comput. 3, 1-14 (2022).
Shah, S. M. S., Shah, F. A., Hussain, S. A. & Batool, S. Support vector machines-based heart disease diagnosis using feature subset wrapping selection and extraction methods. Comput. Electr. Eng. 84, 106628 (2020).
Son, Y.-J., Kim, H.-G., Kim, E.-H., Choi, S. & Lee, S.-K. Application of support vector machine for prediction of medication adherence in heart failure patients. Healthc. Inform. Res. 16(4), 253-259 (2010).
Owusu, E., Boakye-Sekyerehene, P., Appati, J. K. & Ludu, J. Y. Computer-aided diagnostics of heart disease risk prediction using boosting support vector machine. Comput. Intell. Neurosci. 23, 5132 (2021).
Medhekar, D., Mayur, S., Bote, P. & Deshmukh, S.D. Heart disease prediction system using naive Bayes. Int. J. Enhanced Res. Sci. Technol. Eng. 2, 3 (2013).
Miranda, E., Irwansyah, E., Amelga, A.-Y., Maribondang, M.-M. & Salim, M. Detection of cardiovascular disease risk’s level for adults using naive bayes classifier. Healthc. Inform. Res. 22(3), 196-205 (2016).
Vembandasamy, K., Sasipriya, R. & Deepa, E. Heart diseases detection using Naive Bayes algorithm. Int. J. Innov. Sci. Eng. Technol. 4, 441-444 (2015).
Miray, A., Sönmez, Ö.E. & Özcan, T. Diagnosis of heart disease using an intelligent method: A hybrid ANN-GA approach. InInternational Conference on Intelligent and Fuzzy Systems. 1250-1257 (Springer, 2019).
Khemphila, A. & Boonjing, V. Heart disease classification using neural network and feature selection. In: 21st International Conference on Systems Engineering (IEEE, 2011).
Kim, J. K. & Kang, S. Neural network-based coronary heart disease risk prediction using feature correlation analysis. J. Healthc. Eng. 3, 406-409 (2017).
Deekshatulu, B.-L. & Chandra, P. Classification of heart disease using k-nearest neighbor and genetic algorithm. Proc. Technol. 10, 85-94 (2013).
Enriko, I., Agung, K., Suryanegara, M. & Gunawan, D. Heart disease prediction system using k-Nearest neighbor algorithm with simplified patient’s health parameters. J. Telecommun. Electron. Comput. Eng. (JTEC) 8(12), 59-65 (2016).
Pandey, A.-K., Pandey, P., Jaiswal, K.-L. & Sen, A.-K. A heart disease prediction model using decision tree. IOSR J. Comput. Eng. (IOSR-JCE) 12(6), 83-86 (2013).
Zhang, Z. et al. Application of decision trees to the determination of the year-end level of a carryover storage reservoir based on the iterative dichotomizer 3. Int. J. Electr. Power Energy Syst. 64, 375-383 (2015).
Ambrish, G., Ganesh, B., Ganesh, A., Srinivas, C. & Mensinkal, K. Logistic regression technique for prediction of cardiovascular disease. In Global Transitions Proceedings (2022).
Soleimani, P. & Neshati, A. Applying the regression technique for prediction of the acute heart attack. Int. J. Biomed. Biol. Eng. 9(11), 767-771 (2015).
Singh, Y.K., Sinha, N. & Singh, S.K. Heart disease prediction system using random forest. In International Conference on Advances in Computing and Data Sciences. 613-623 (Springer, 2016).
Javeed, A. et al. An intelligent learning system based on random search algorithm and optimized random forest model for improved heart disease detection. IEEE Access. 7, 180235-180243 (2019).
Jabbar, M.-A., Deekshatulu, B.-L. & Chandra, P. Intelligent heart disease prediction system using random forest and evolutionary approach. J. Netw. Innov. Comput. 4(2016), 175-184 (2016).
Abdollahi, J. & Nouri-Moghaddam, B. A hybrid method for heart disease diagnosis utilizing feature selection based ensemble classifier model generation. Iran J. Comput. Sci. 4, 1-18 (2022).
Yekkala, I., Dixit, S. & Jabbar, M.-A. Prediction of heart disease using ensemble learning and particle swarm optimization. In International Conference on Smart Technologies for Smart Nation (SmartTechCon) (IEEE, 2017)
Tiwari, P. & Melucci, M. Towards a quantum-inspired binary classifier. IEEE Access. 7, 42354-42372 (2019).
Khan, T.-M. & Robles-Kelly, A. Machine learning: Quantum vs classical. IEEE Access. 8, 219275-219294 (2020).
Tiwari, P. & Melucci, M. Towards a quantum-inspired binary classifier. IEEE Access 7, 42354-42372 (2019).
Wereszczynski, K., Michalczuk, A., Josinski, H. & Polanski, A. Quantum computing for clustering big datasets. Appl. Electromagnet. Mod. Tech. Med. (PTZE) 4, 276-280 (2018).
Dang, Y., Jiang, N., Hu, H. Z., Ji, X. & Zhang, W. Image classification based on quantum K-nearest-neighbor algorithm. Quantum Inf. Process. 17, 9 (2018).
Lu, S. & Braunstein, S. Quantum decision tree classifier. Quantum Inf. Process. 13(3), 757-770 (2014).
Amin, J., Sharif, M., Gul, N., Kadry, S. & Chakraborty, C. Quantum machine learning architecture for COVID-19 classification based on synthetic data generation using conditional adversarial neural network. Cognit. Comput. 13, 1-12 (2021).
Sharma, S. Qeml (quantum enhanced machine learning): Using quantum computing to enhance ml classifiers and feature spaces. arXiv preprint arXiv:2002.10453 (2020).
Sharma, S., Rastogi, S. & Devanssh, M. Quantum computing will completely change the healthcare infrastructure to new level and -help transform the healthcare from preventive to predictive healthcare: A future perspective. Innov. J. 9, 2020-2277 (2020).
Chalumuri, A., Kune, R. & Manoj, B.-S. Training an artificial neural network using qubits as artificial neurons: A quantum computing approach. Proc. Comput. Sci. 171, 568-575 (2020).
Vashisth, S., Dhall, I. & Aggarwal, G. Design and analysis of quantum powered support vector machines for malignant breast cancer diagnosis. J. Intell. Syst. 30(1), 998-1013 (2021).
Macaluso, A., Lodi, S. & Sartori, C. Quantum algorithm for ensemble learning. In Italian Conference on Theoretical Computer Science (ICTCS).149-154 (2020).
Haq, A. U. et al. DACBT: Deep learning approach for classification of brain tumors using MRI data in IoT healthcare environment. Sci. Rep. 12, 15331 (2022).
Haq, A., Li, J.P., Kumar, R. et al. MCNN: A multi-level CNN model for the classification of brain tumors in IoT-healthcare system. J. Ambient Intell. Hum. Comput. (2022).
ul Haq, A. et al. A survey of deep learning techniques-based Parkinson’s disease recognition methods employing clinical data. Exp. Syst. Appl. 208, 118045 (2022).
Author contributions
V.B.-writing; R.-experimenting; J.-validation.
Competing interests
The authors declare no competing interests.
Additional information
Correspondence and requests for materials should be addressed to S.V.B.
Reprints and permissions information is available at www.nature.com/reprints.
Publisher’s note Springer Nature remains neutral with regard to jurisdictional claims in published maps and institutional affiliations.
Department of CSE, Christian College of Engineering and Technology, Dindigul, India. Department of AI and DS, PSNA College of Engineering and Technology, Dindigul, India. Department of Electronics and Communication Engineering, Saveetha Engineering College, Chennai, India. email: venkateshflower6@gmail.com