إخماد الحرائق يجعل حرائق الغابات أكثر شدة ويزيد من آثار تغير المناخ وتراكم الوقود Fire suppression makes wildfires more severe and accentuates impacts of climate change and fuel accumulation
تعتبر مكافحة الحرائق الاستجابة الإدارية الرئيسية للحرائق البرية في العديد من المناطق حول العالم. من خلال إزالة الحرائق البرية الأقل شدة، تضمن هذه الطريقة أن تحترق الحرائق المتبقية في ظروف أكثر شدة. هنا، نسمي هذا “تحيز المكافحة” ونستخدم نموذج محاكاة لتسليط الضوء على كيفية تأثير هذا التحيز بشكل أساسي على نشاط الحرائق البرية، بغض النظر عن تراكم الوقود وتغير المناخ. نوضح كيف أن محاولة مكافحة جميع الحرائق البرية تعني بالضرورة أن الحرائق ستحترق بتأثيرات بيئية أكثر شدة وأقل تنوعًا، مع زيادة المساحة المحترقة بمعدلات أسرع مما هو متوقع من تراكم الوقود أو تغير المناخ. على مدى حياة الإنسان، تتجاوز الآثار النموذجية لتحيز المكافحة تلك الناتجة عن تراكم الوقود أو تغير المناخ وحده، مما يشير إلى أن المكافحة قد تمارس تأثيرًا كبيرًا وغير مقدر على أنماط الحرائق عالميًا. وبالتالي، فإن إدارة الحرائق البرية لتشتعل بأمان في ظروف منخفضة ومتوسطة هي أداة حاسمة لمعالجة أزمة الحرائق البرية المتزايدة.
تزداد الحرائق البرية تدميرًا وفتكًا في جميع أنحاء العالم . الآثار الاجتماعية والبيئية للحرائق موجودة في وعينا الجماعي – من حرائق أستراليا الضخمة 2019-2020 , إلى الحرائق المدمرة في البحر الأبيض المتوسط , إلى السيكويا العملاقة المحبوبة التي قتلت بالنار في كاليفورنيا – مما أدى إلى دعوات واسعة النطاق لمعالجة أزمة الحرائق البرية . نحن نفهم المحركات العامة لزيادة نشاط الحرائق: التغيرات في المناخ , والنباتات وتراكم الوقود , وأنماط الاشتعال . ومع ذلك، يلعب البشر أيضًا دورًا مباشرًا في تعديل نشاط الحرائق عبر الكثير من العالم من خلال التفاعل مع الحرائق بعد دقائق إلى ساعات من الاشتعال (أي، الهجوم الأولي )، والمكافحة اللاحقة للحرائق الهاربة . بينما تحدد الأحوال الجوية والوقود والتضاريس والاشتعالات كيفية احتراق الحرائق، يشكل البشر بشكل كبير هذا في متى وأين وكيف تحترق الحرائق (الشكل 1).
لا تحترق الحرائق البرية إلا إذا لم يتم إخمادها من خلال المكافحة. وبالتالي، فإن المكافحة هي “مرشح” يسمح لبعض أنواع الحرائق بالمرور بينما يزيل أنواعًا أخرى من الحرائق (الشكل 1ب). في بعض
المواقع (مثل منطقة برية نائية) قد يكون هذا المرشح نسبيًا مساميًا، وقد تحترق العديد من الحرائق مع الحد الأدنى من المكافحة . في معظم المناظر الطبيعية، ومع ذلك، فإن المكافحة العدوانية للحرائق هي توقع ثقافي، ومرشح المكافحة أقل نفاذية بكثير، مع هروب فقط أكثر الحرائق شدة (مثل، الحد الأقصى من المكافحة في الشكل 1) . الحرائق المتعمدة (أي، الحرائق المقررة والحرق الثقافي) هي الأنواع الوحيدة من الحرائق التي لا تمر عبر مرشح المكافحة، حيث يُسمح لها بالاحتراق دون عائق إذا كانت ضمن الوصفة (الشكل 1أ). المنطقة التي لا تحترق لأنها “أزيلت” من خلال المكافحة، تؤدي إلى تراكم الوقود وزيادة احتمال وشدة الحرائق المستقبلية (الشكل 1أ). وقد أطلق على هذه العاقبة المعروفة “مفارقة مكافحة الحرائق” : من خلال إخماد حريق اليوم، نجعل الحرائق أصعب في الإخماد في المستقبل (الجدول 1).
تؤدي مكافحة الحرائق البرية أيضًا إلى عاقبة إضافية وغير محددة بشكل جيد نعرفها باسم “تحيز المكافحة”:
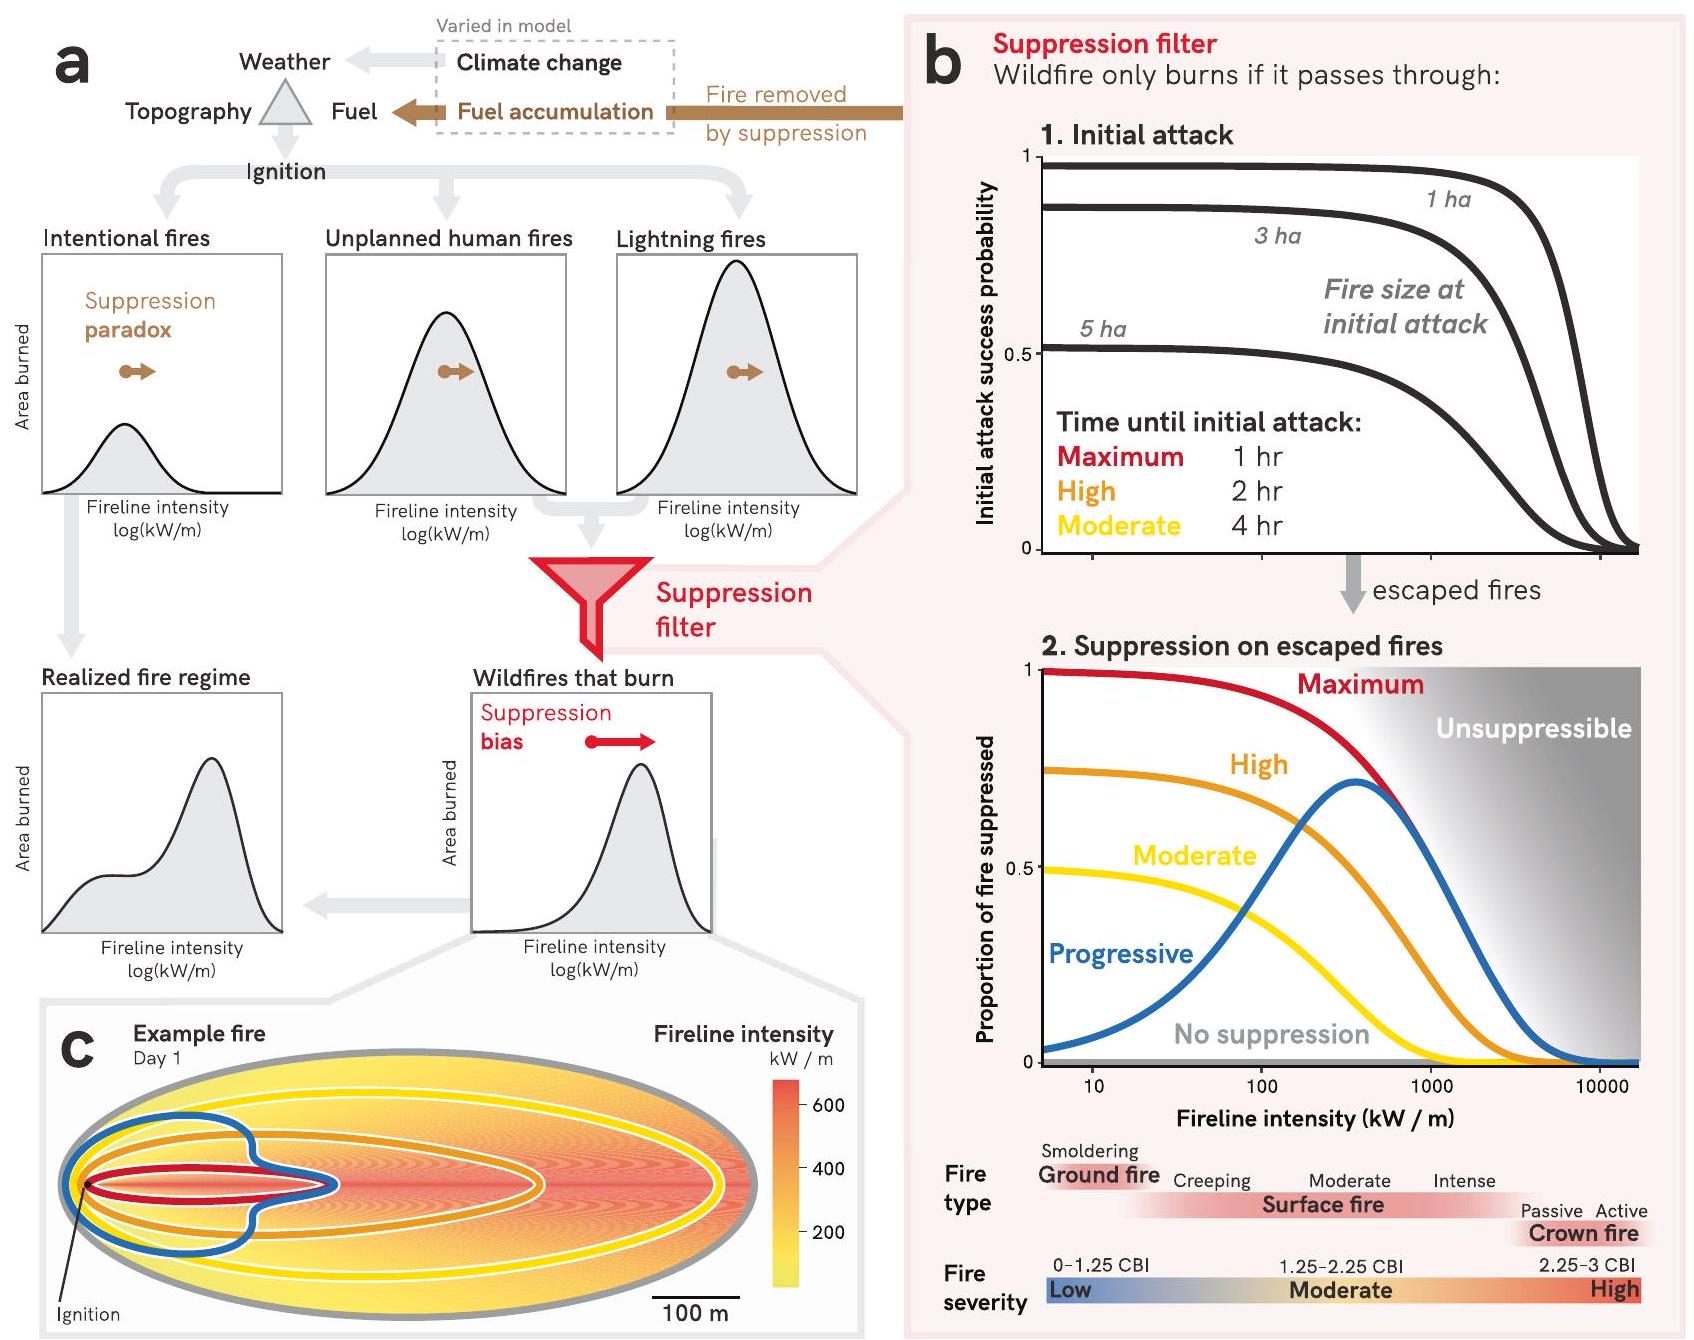
الشكل 1 | الرسم البياني المفاهيمي لكيفية تأثير المكافحة على الحريق. أ يعتمد سلوك الحريق المحتمل على مثلث الحريق (التضاريس، الطقس، الوقود) والاشتعالات. لا تمر الاشتعالات المتعمدة (أي، الحرائق المقررة والحرق الثقافي) عبر مرشح المكافحة، حيث يُسمح لها بالاحتراق دون عائق إذا كانت ضمن الوصفة. تحترق الاشتعالات البشرية غير المخطط لها واشتعلت البرق فقط إذا نجحت في المرور عبر “مرشح المكافحة.” الحريق “المزال” بواسطة مرشح المكافحة يؤدي إلى تراكم الوقود، مما يؤثر على الحرائق من جميع أنواع الاشتعالات (مفارقة المكافحة، اللون البني). الحرائق البرية التي تحترق متحيزة نحو الحريق الذي لم يُزال (تحيز المكافحة، الأحمر). تشكل هذه الحرائق البرية، مع الحرائق المتعمدة،
النظام الناري المتحقق مع مفارقة المكافحة وتحقيق التحيز مضمنين بشكل جوهري. ب مرشح المكافحة. 1) احتمال نجاح الهجوم الأولي كدالة لشدة خط النار وحجم الحريق عند الهجوم الأولي (من هيرش وآخرون. ); 2) نسبة الحريق الهارب الذي تم إخماده كدالة لشدة الحريق. تصبح المكافحة أكثر استحالة بشكل متزايد عند شدة الحرائق العالية. الألوان تمثل سيناريوهات المكافحة المستخدمة في المحاكاة. ج محيطات الحرائق (المشاهدة من الأعلى) بعد اليوم الأول من الاحتراق لمثال اشتعال. الألوان تتوافق مع سيناريوهات المكافحة الموضحة في اللوحة ب. تُعرض شدة الحريق في المنطقة المحترقة مع تدرج لوني.
الجدول 1 | مقارنة بين مفارقة المكافحة والتحيز
المصطلح
التعريف
الآلية
الأثر
فترة التأخير
مفارقة مكافحة الحرائق
من خلال مكافحة الحريق اليوم، نزيد من أحمال الوقود، مما يجعل الحرائق أصعب في المكافحة في المستقبل
تراكم الوقود
غير مباشر
مستقبل
تحيز مكافحة الحرائق
من خلال مكافحة بعض أنواع الحرائق أكثر من غيرها، تعكس البقية تمثيلًا متحيزًا لأنواع الحرائق
مرشح المكافحة التفاضلي
مباشر
فوري
تؤدي مكافحة الحرائق إلى إخماد بعض أنواع الحرائق (مثل، حريق السطح) أكثر من غيرها (مثل، حريق التاج)، وبالتالي تشوه النشاط الناري الناتج نحو تلك الأنواع الأقل احتمالًا للإزالة (الجدول 1). في إدارة الحرائق المعاصرة، التي تخمد بسهولة وتزيل الحرائق ذات الشدة المنخفضة، يكون هذا التحيز حتمًا نحو الاحتراق العالي الشدة الذي يحدث تحت ظروف جوية شديدة . وبالتالي، فإن الحرائق التي تواجهها النظم البيئية والأنواع والناس تميل نحو الأكثر شدة وتدميرًا.
نحدد أساليب الإدارة التي تخمد الحرائق ذات الشدة المنخفضة بشكل أكبر من الحرائق ذات الشدة العالية باسم “المكافحة التراجعية”، مستعيرين اللغة من الاقتصاد (مثل، معدل الضريبة التراجعية ينخفض مع زيادة الدخل الخاضع للضريبة) (الجدول 2). في بعض الحالات، ومع ذلك، يمكن أن تحتوي الإدارة وتخمد الحرائق ذات الشدة الأعلى بشكل أكبر من الحرائق ذات الشدة المنخفضة، وهو نهج نسميه “المكافحة التقدمية” (مثل، معدل الضريبة التقدمية يزيد مع زيادة الدخل الخاضع للضريبة) (الجدول 2). كلا من المكافحة التراجعية والتقدمية تخضع لنفس الحد الأعلى، فوقه تكون الحرائق
الجدول 2 | كيف يؤثر نوع المكافحة على التحيز الناتج عن المكافحة
نوع المكافحة
التعريف
اتجاه تحيز المكافحة
المكافحة التراجعية
تخمد الحرائق ذات الشدة المنخفضة بشكل أكبر من الحرائق ذات الشدة العالية
نحو الحرائق ذات الشدة العالية، الحرائق الأكثر شدة
المكافحة التقدمية
تخمد الحرائق ذات الشدة العالية بشكل أكبر من الحرائق ذات الشدة المنخفضة
نحو الحرائق ذات الشدة المنخفضة، الحرائق الأكثر اعتدالًا
ببساطة تكون شديدة جدًا للإخماد (الشكل 1ب) ; ومع ذلك، ضمن المجال الذي تكون فيه المكافحة ممكنة، يمكن أن يكون للمناهج التراجعية والتقدمية آثار (أي، تحيزات) مختلفة بشكل عميق على كيفية احتراق الحرائق.
على الرغم من أن تحيز مكافحة الحرائق قد تم الإشارة إليه بشكل غير مباشر في الأدبيات , إلا أن الآثار الناشئة عن تحيز المكافحة لم يتم تقييمها. ويرجع ذلك إلى حد كبير إلى صعوبة عزل تأثير المكافحة باستخدام البيانات التجريبية. المكافحة شائعة جدًا لدرجة أنه ليس لدينا تقريبًا أي مناظر طبيعية تحكم حيث لا يتم إخماد الحريق تمامًا؛ حتى في المناطق البرية النائية، لا تزال بعض الحرائق تُخمد . علاوة على ذلك، من الصعب قياس حجم جهود المكافحة لأن حتى المؤشرات المباشرة نسبيًا مثل تكلفة المكافحة تتداخل مع عوامل أخرى، بما في ذلك إمكانية الوصول إلى التضاريس، والبنية التحتية البشرية المعرضة للخطر، وتوافر موارد المكافحة . أخيرًا، تتوفر بيانات حول جهود المكافحة عمومًا فقط للحرائق الكبيرة , مما يحجب العديد من الاشتعالات التي يتم إخمادها بسرعة وسهولة خلال الهجوم الأولي لتجاوز هذه القيود، استخدمنا نهج المحاكاة لتقييم وقياس حجم انحياز إخماد الحرائق على سلوك الحرائق والآثار البيئية، مقارنة بتأثير تغير المناخ وتراكم الوقود.
إطار النمذجة لدينا يحاكي المكونات الأساسية للحرائق: الطقس ورطوبة الوقود؛ الاشتعالات؛ نمو الحريق؛ إخماد الحريق (من خلال الهجوم الأولي واحتواء الحرائق الهاربة)؛ والتأثيرات البيئية. لعزل تأثير إخماد الحريق، قمنا بمحاكاة آلاف الحرائق تحت ظروف بيولوجية وفيزيائية متطابقة، ولكنها تختلف فقط في سيناريو الإخماد، بما في ذلك ثلاثة سيناريوهات “إخماد تراجعي” (متوسط، عالي، وأقصى؛ الشكل 1ب)، وسيناريو “إخماد تقدمي” (تقدمي؛ الشكل 1ب)، وسيناريو تحكم بدون إخماد. لكل حريق، قمنا بحساب النسبة المحترقة بشدة عالية، ومتوسط شدة الحريق، وحجم الحريق اليومي والإجمالي، وتنوع شدة الحريق.لمقارنة تأثير القمع بتأثير تغير المناخ وتراكم الوقود، قمنا بمحاكاة الحرائق عبر مجموعة من ظروف جفاف الوقود الحالية والمستقبلية المحتملة (عجز ضغط البخار؛ VPD) وظروف تحميل الوقود في النظم البيئية الغابية في أمريكا الشمالية. تمثل هذه النطاقات فترة زمنية للسنة لزيادة النمذجة (على سبيل المثال، زيادة VPD استنادًا إلى سيناريو المناخ RCP 8.5)معدلات تحميل الوقود استنادًا إلى نمذجة الوقود التاريخية ).
باستخدام هذا الإطار النمذجي، نوضح كيف يؤثر تحيز الإخماد بشكل مباشر على نشاط الحرائق والآثار الناتجة عنها. على وجه التحديد، طرحنا الأسئلة التالية: 1) كيف يؤثر إخماد الحرائق على أنماط المساحة المحترقة، والآثار البيئية (أي شدة الحريق)، وتنوع كلا العاملين عبر الزمان والمكان؟ 2) كيف تقارن شدة هذا التأثير بتأثيرات تغير المناخ وتراكم الوقود؟
النتائج
إخماد الحرائق التراجعي يجعل الحرائق أكثر شدة
عبر نطاق الجفاف الوقودي المحاكى، زادت سيناريوهات القمع التراجعي (المعتدل، العالي، والحد الأقصى) من التأثيرات البيئية للحرائق، كما يتضح من ارتفاع مقاييس شدة الحريق. قمنا بمحاكاة شدة الحريق من خلال ربط شدة الحريق بمؤشر الاحتراق المركب (CBI)، الذي يتراوح من صفر (غير محترق) إلى ثلاثة (أقصى شدة للحريق)، مع اعتبار القيم التي تتجاوز 2.25 شدة عالية.تحت سيناريو أقصى إخماد للحرائق، احترق نسبة أكبر من كل حريق غابات بشدة عالية (الشكل 2أ، ب). في المتوسط، كانت حرائق الغابات التي تحترق تحت سيناريو الإخماد الأقصى تحتوي على أكثر من ضعف النسبة التي احترقت بشدة عالية، مقارنة بالحرائق. يحترق دون أي كبح. عبر جميع محاكاة جفاف الوقود، زاد الكبح الأقصى من شدة الحريق المتوسطة بمعدل 0.21 وحدة CBI، مقارنة بالحرائق دون كبح (الشكل 2c). هذه الزيادة في شدة الحريق تعادل التأثيرات التراكمية لـ 102 سنة من زيادة جفاف الوقود نتيجة لتغير المناخ وحده، تحت سيناريو عدم الكبح (أي، زيادة في متوسط ضغط بخار الماء الصيفي بمقدار +0.85 كيلو باسكال) (الشكل 2c في الإطار). وبالمثل، عبر نطاق قيم تحميل الوقود المحاكية، زاد الكبح الأقصى من شدة الحريق المتوسطة بمعدل 0.22 وحدة CBI، مقارنة بالسيناريوهات الضابطة (الشكل 2d). هذه الزيادة تعادل تأثير 102 سنة من تراكم الوقود الإضافي تحت عدم كبح الحريق (أي، زيادة في تحميل الوقود السطحي لمدة 100 ساعة من ) (الشكل 2د داخل).
على النقيض من ذلك، قللت عملية القمع التدريجي من نسبة كل حريق غابات احترق بشدة عالية، لمعظم مستويات جفاف الوقود وتحميل الوقود (الشكل 2أ، ب). مقارنةً بالحرائق التي تحترق دون قمع، كانت الحرائق التي تحترق تحت سيناريو القمع التدريجي أقل بمعدل 17% (عبر تدرج جفاف الوقود) و15% (عبر تدرج تحميل الوقود) من النسبة التي احترقت بشدة عالية. كانت شدة الحريق المتوسطة أيضًا أقل تحت سيناريو قمع الحرائق التدريجي، عبر معظم نطاق جفاف الوقود وتحميله المحاكى، مع انخفاض متوسط قدره 0.04 و0.03 وحدة CBI، على التوالي (الشكل 2ج، د). بالنظر إلى معدلات جفاف الوقود وتغير تحميل الوقود المودلة، فإن هذه الاختلافات تعادل الاحتراق تحت سيناريوهات عدم القمع من 17 و14 عامًا في الماضي (أي، تغييرات قدرها -0.15 kPa VPD و )، على التوالي (الشكل 2c، d في المداخل).
تؤكد أساليب إخماد الحرائق التراجعية على الاتجاهات المتزايدة لمساحة الأراضي المحترقة
بينما أدت زيادة جفاف الوقود وتحميل الوقود إلى ارتفاع المساحة المحترقة في حرائق الغابات تحت جميع السيناريوهات (أي، سواء تم السيطرة عليها أم لا)، أظهرت الحرائق تحت سيناريوهات السيطرة التراجعية حساسية أعلى لزيادة جفاف الوقود وتحميل الوقود (الشكل 3). عبر تدرج زيادة جفاف الوقود، زادت المساحة المحترقة تحت سيناريو السيطرة القصوى بـفي السنة، مقارنةً بـ فقطسنويًا للحرائق البرية في سيناريو عدم السيطرة. وبالتالي، على مدى فترة 240 عامًا من زيادة جفاف الوقود، تضاعف المساحة المحترقة سنويًا تقريبًا ثلاث مرات أسرع تحت أقصى سيطرة على الحرائق، مقارنة بالسيناريوهات بدون سيطرة على الحرائق (أي 14 مقابل 39 عامًا). كانت هذه الفجوة أكثر وضوحًا تحت زيادة تحميل الوقود: المساحة المحترقة تحت سيناريو أقصى سيطرة زادت بـفي السنة، مقارنةً بـ فقطسنويًا للحرائق البرية التي لم يتم إخمادها (الشكل 3). وبالتالي، على مدى فترة 240 عامًا من زيادة تحميل الوقود، تضاعف المساحة المحترقة سنويًا بأكثر من خمس مرات أسرع تحت أقصى إخماد، مقارنة بالسيناريوهات التي لا تشمل إخماد الحرائق (أي 19 مقابل 94 عامًا). كانت الحرائق المحاكية تحت سيناريو الإخماد التدريجي الأقل حساسية لزيادة جفاف الوقود وتحميل الوقود من أي استراتيجية إخماد، بما في ذلك عدم الإخماد. تضاعف المساحة المحترقة سنويًا كل 44 عامًا عبر الزيادات المحاكية في جفاف الوقود، وفقط كل 133 عامًا عبر التدرج المحاكي لتراكم الوقود. كانت الأنماط مشابهة للمساحة المحترقة بشدة عالية، حيث أدت السيناريوهات التراجعية إلى زيادات نسبية أسرع في المساحة المحترقة، بينما حافظ السيناريو التدريجي على أبطأ زيادة في المساحة المحترقة (الشكل التكميلي S1).
تقلل إخماد الحرائق التراجعي من تنوع آثار الحرائق. بالمقارنة مع الحرائق غير المكبوحة، قلل الإخماد التراجعي من تنوع آثار الحرائق (أي، تنوع شدة الاحتراق) عند جميع مستويات جفاف الوقود وقيم تحميل الوقود (الشكل 4). في الحد الأقصى سيناريو القمع،تم احتواء الحرائق تحت 121 هكتار (300 فدان) في جميع الحالات باستثناء أكثر مستويات جفاف الوقود وتحميله تطرفًا (الشكل التوضيحي S2). تحت سيناريوهات قمع الحرائق التراجعية، جاءت نسبة أعلى من المساحة المحترقة من نسبة صغيرة من الحرائق الشديدة (الشكل 4c). على سبيل المثال، تحت سيناريو القمع الأقصى، جاءت 91% من المساحة المحترقة من أكبر 1% من الحرائق، مقارنةً بـمن المساحة المحترقة التي جاءت من أكبر 1% من الحرائق في سيناريو عدم مكافحة الحرائق. بالمقابل، في سيناريو مكافحة الحرائق التقدمية، كانت الحرائق تتمتع بأعلى تنوع في آثار الحرائق عبر مجموعة كاملة من قيم جفاف الوقود وتحميل الوقود، مع زيادات ملحوظة بشكل خاص في التنوع تحت ظروف أكثر تطرفًا. كما أدت مكافحة الحرائق التقدمية إلى حرائق ذات توزيع أكثر توازنًا للمساحة المحترقة عبر الحرائق في أي سيناريو لمكافحة الحرائق (الشكل 4c).
نقاش
نظهر من خلال تجربة محاكاة كيف أن عقودًا من قمع الحرائق التراجعي قد ساهمت على الأرجح في معدلات زيادة المساحات المحترقة والمناطق المحترقة بشدة، بغض النظر عن تغير المناخ وتراكم الوقود. بينما كانت بعض الحرائق البرية دائمًا تحترق تحت ظروف قاسية وبشدة عالية، فإن تحيز قمع الحرائق يضخم التمثيل النسبي لهذه الحرائق من خلال إزالة الحرائق التي كانت ستحترق بشدة منخفضة أو معتدلة (الشكل التكميلي S3). النتيجة تشبه الإفراط في وصف المضادات الحيوية: في محاولتنا للقضاء على جميع الحرائق، نحن قد فقط أزال الحرائق الأقل شدة (التي قد تتماشى بشكل أفضل مع أهداف الإدارة مثل تقليل الوقود ) وبدلاً من ذلك تم اختيار الأحداث الأكثر تطرفًا بشكل أساسي (تحيز القمع) وخلق أحمال وقود أعلى وحرائق أكثر “مقاومة للقمع” (مفارقة القمع). من خلال قمع الحرائق التراجعي، نحن فعليًا نجلب مستقبلًا أكثر شدة إلى الحاضر، حيث نشهد شدة حرائق متوسطة لن تحدث بخلاف ذلك لمدة قرن. تشير نتائجنا إلى أن النسب غير العادية من حرائق الشدة العالية التي شهدتها العديد من المناطق عالميًا (على سبيل المثال، المراجع 48-51) تعود، جزئيًا، إلى تأثير تحيز القمع نفسه.
التحيز في القمع له أيضًا تأثيرات عميقة على المجتمع والتصورات الاجتماعية للنار. من خلال إزالة الحرائق التي لها تأثيرات مرغوبة بشكل غير متناسبتضمن أنظمة إخماد الحرائق التراجعية أن يتفاعل معظم الناس مع حرائق الغابات التي تشتعل خلال الأحداث الشديدة. وهذا بدوره يجعل من غير المحتمل أن يقدّر الأفراد الجوانب المفيدة للحرائق الأقل شدة، ويجعل من غير المحتمل أن يدعموا أو يرغبوا في إدارة الحرائق النشطة.مما يزيد من تفاقم انحياز القمع.
على الرغم من أن القمع التراجعي يحافظ على العديد من الحرائق بأحجام صغيرة (الشكل التكميلي S2) ويقلل من الكمية المطلقة للمنطقة المحترقة (بالنسبة لعالم بدون قمع)، إلا أنه في مواجهة تغير المناخ وتراكم الوقود، يؤدي بشكل غير بديهي إلى زيادة النسبة النسبية لمساحة الحرائق المحترقة مع مرور الوقت. وذلك لأن القمع التراجعي يعزز الفارق بين كمية الحرائق التي تحدث في مناخات أقل ملاءمة للاحتراق (مثلما كان في الماضي القريب) وكمية الحرائق التي ستحدث على الرغم من القمع الشديد في المناخات الأكثر ملاءمة.
الشكل 3 | آثار إخماد الحرائق على زيادة المساحة المحترقة. الألواح و عرض الاتجاهات في متوسط حجم الحريق عبر نطاقات جفاف الوقود وتحميل الوقود. تحميل الوقود في اللوحةتصور قيم تحميل الوقود السطحي بعمق 100 هكتار. معدلات الزيادة السنوية في الألواح و يتم حسابها مع زيادة سنوية في جفاف الوقود قدرهاأو زيادة سنوية في تراكم الوقودمعدل تراكم الوقود) 0.036 ميغاغرام، على التوالي. الأرقام البيضاء في قاعدة الأعمدة هي زمن التضاعف، في سنوات، من المساحة المحترقة. يتم عرض التباين عبر 40 تكرارًا لمحاكاة مع فترات ثقة 95% (أ و ب؛ صغيرة جدًا بحيث لا يمكن رؤيتها على بعض المنحنيات) أو أشرطة الخطأ ( و ). تم تشغيل المحاكاة عبر نطاق جفاف الوقود عند مستوى ثابت تحميل الوقود السطحيتم تشغيل المحاكاة عبر نطاق تحميل الوقود عند عجز ضغط بخار موسم الحرائق المتوسط الثابت البالغ 1.17 كيلو باسكال. المناخات المستقبلية المواتية للحرائق. على سبيل المثال، في ظل تغير المناخ المحاكى، تضاعف المساحة المحترقة تقريبًا مرتين أسرع تحت suppression التراجعية، مقارنة بعدم قمع الحرائق على الإطلاق. وبالتالي، تشير أعمالنا إلى أن المعدلات العالية الملحوظة لزيادة المساحة المحترقة حول العالم (على سبيل المثال، المراجع 3، 53) مدفوعة جزئيًا على الأقل بتحيز القمع. الناس والمجتمعات تتكيف مع ما يعتبرونه “طبيعيًا”، والانحرافات عن هذا الأساس تتطلب التكيف؛ من خلال التسبب في تحول الأساس بمعدل أسرع، يزيد القمع التراجعي من الضغط على المجتمعات التي تستجيب للظروف المتغيرة..
التحيز في إخماد الحرائق له أيضًا تأثيرات أساسية على الدور البيئي والتطوري الطويل الأمد للنار في النظم البيئية الأرضية.تخفيف الحرائق لا يقلل فقط من مدى تعرض النباتات والحيوانات للنار، وهو ما يضر بالكائنات الحية المعتمدة على النار.ولكنه يضمن أيضًا أن نسبة أكبر من هذه اللقاءات تكون مع حرائق عالية الشدة. من خلال إزالة الحرائق منخفضة الشدة بشكل تفضيلي من خلال الإخماد التراجعي، من المحتمل أننا قد قمنا بتحويل الضغوط الانتقائية للاختيار الطبيعي، مما يفضل عن غير قصد الصفات التي تمنح المقاومة أو القدرة على التكيف مع الحرائق عالية الشدة على الصفات التي تدعم الاستمرارية من خلال الحرائق منخفضة الشدة. كما أن الحريق يعد محفزًا مهمًا لإعادة تنظيم المجتمع والتكيف في مواجهة الظروف البيئية المتغيرة مثل التغيرات المناخية العالمية. احترار. ومع ذلك، من خلال تقليل انتشار الحرائق، تحدّ عمليات الإخماد من الفرص لإعادة التنظيم؛ بدلاً من ذلك، تتراكم النظم البيئية على الجمود الناتج عن التركيب والهيكل الحاليين للأنواع، والذي قد لا يتماشى بشكل جيد مع الظروف المستقبلية.. علاوة على ذلك، لأن القمع التراجعي يميل إلى توجيه الحرائق نحو ظروف أكثر شدة، مع انخفاض توفر البذور والشتلات وبيئات مناخية أكثر إجهادًا بعد الحريق، فإن أي إعادة تنظيم تحدث من المرجح أن تؤدي إلى تغييرات في الحالة..
نحن نوضح أن التخفيف التدريجي يؤدي إلى سلوك وتأثيرات حريق محاكي أقل تطرفًا. في الواقع، تشير البيانات التجريبية من المناطق المحمية (التي تميل إلى أن تكون لديها معدلات أقل من التخفيف) إلى ذلك.وقد تمثل أقرب الأمثلة الموجودة على القمع التقدمي) تظهر شدة حرائق أقلوتنوع أكبر في تأثيرات النار، متسقة مع استنتاجاتنا. في محاكياتنا، كانت الحرائق تحت سيناريو الإخماد التقدمي لها شدة حرائق تعادل الحرائق غير المكبوحة التي تحترق تحت ظروف أقل ملاءمة للاحتراق – بعبارة أخرى، تعكس فعليًا آثار تغير المناخ أو تراكم الوقود لمدة تتراوح بين عقد إلى عقدين. كما أن المساحة المحترقة تحت سيناريو الإخماد التقدمي تضاعفت بشكل أبطأ بكثير استجابة لتغير المناخ، مقارنة بسيناريوهات الإخماد التراجعي. ستكون المجتمع الذي يعيش تحت الإخماد التقدمي أقل توترًا بسبب تغير المناخ، حيث أن “الطبيعي” الذي يدركونه
الشكل 4 | آثار إخماد الحرائق على تنوع آثار الحرائق. الألواح و أظهر تأثيرات إخماد الحرائق على تنوع تأثيرات الحرائق عبر نطاقات جفاف الوقود وحمولة الوقود. يتم حساب تنوع تأثيرات الحرائق كمتوسط الانحراف المطلق لشدة الحريق (CBI) وفقًا لستيل وزملائه.تظهر تحميل الوقود في اللوحة ب قيم تحميل الوقود السطحي لمدة 100 ساعة. تم تشغيل المحاكاة عبر نطاق جفاف الوقود عند مستوى ثابتتحميل الوقود السطحيتم تشغيل المحاكاة عبر نطاق تحميل الوقود عند ضغط بخار موسم الحرائق المتوسط الثابت عجز قدره 1.17 كيلو باسكال. منحنيات لورينز لكل سيناريو قمع؛ يتم تصنيف الحرائق حسب زيادة المساحة المحترقة. تم تشغيل المحاكاة عند متوسط عجز ضغط بخار الموسم البالغ 1.17 كيلو باسكال وحمولة الوقود من ( حمولة الوقود). الخط المتقطع يمثل نشاط الحريق الافتراضي حيث يتم توزيع المساحة المحترقة بالتساوي على جميع أيام الحريق. يتم عرض التباين عبر 40 تكرارًا لمحاكاة معفترات الثقة ولكنها صغيرة جدًا بحيث لا يمكن رؤيتها لبعض المنحنيات. ستتغير الظروف بمعدل نصف السرعة. من خلال السماح بمزيد من الحرائق ذات الكثافة المنخفضة، يمكن أن تشتري عمليات الإخماد التقدمية الوقت، مما يساعد المجتمعات والأنظمة البيئية على التكيف مع تغير المناخ..
تستند محاكياتنا إلى الجوانب الفيزيائية الأساسية لسلوك النار.وكشف العواقب المهمة والمُهملة لعمليات إخماد الحرائق؛ ومع ذلك، فإن نموذجنا ليس مصممًا للتنبؤ بسلوك الحرائق على نطاق دقيق. على سبيل المثال، لم نقم بإدراج التباين المكاني في التضاريس، اتجاه الرياح، أو تحميل الوقود داخل أي حريق فردي. بالإضافة إلى ذلك، فإن كل حريق تم نمذجته غير متأثر بالحرائق التي حدثت في السنوات السابقة (أي أن النموذج لا يتضمن آثار مفارقة إخماد الحرائق؛ الجدول 1). قد يجعل هذا نتائجنا تقديرًا محافظًا للتأثير الكلي للإخماد التراجعي، حيث ستتراكم الوقود في المناظر الطبيعية التي تخضع للإخماد التراجعي بشكل أسرع من تلك التي لا تخضع للإخماد، مما يزيد من الفارق في شدة الحرائق.
بينما يتضمن نموذجنا تطبيقات عملية للقمعلا يتضمن تخصيص الموارد الديناميكي مع زيادة عدد الحرائق عبر المناظر الطبيعية. هذا يعني أنه لا يأخذ في الاعتبار بشكل صريح السيناريوهات التي يتم فيها استنفاد موارد الإطفاء بسبب العديد من الحرائق المشتعلة في وقت واحد، مثلما يحدث خلال مستوى الاستعداد للحرائق الوطنية 5 في الولايات المتحدة.. وبالتالي، قد يبالغ المحاكاة في تقدير فعالية الإخماد ويقلل من تقدير أحجام الحرائق المكبوتة في هذه الظروف. ومع ذلك، يفترض النموذج عدم فعالية الإخماد تقريبًا خلال الأحداث الجوية القاسية عندما تكون شدة الحريق عالية (الشكل 1ب)، مما يدمج بشكل فعال ندرة الموارد. بغض النظر، في الظروف التي يكون فيها إخماد الحرائق فعالًا، تظهر نتائجنا أنها تحيز بشكل جوهري أنماط الحرائق الناتجة.
ينتج نموذجنا أنماط سلوك الحريق التي تتماشى مع البيانات التجريبية. على سبيل المثال، تشبه أنماط المناطق المحترقة تحت الإخماد الأقصى (مثل، احتواء جميع الحرائق تقريبًا قبل الوصول إلى 121 هكتار (300 فدان)؛ 1% من الحرائق تمثل 91% من المساحة المحترقة) عن كثب الاتجاهات طويلة الأجل التي لوحظت في الولايات المتحدة (97-99% من الحرائق تم احتواؤها قبل الوصول إلى 121 هكتار (300 فدان)؛ 1% من الحرائق تمثل 98% من المساحة المحترقة
المحترقة ). وبالتالي، تكشف نتائجنا عن توقعات عامة مهمة لتأثيرات إخماد الحرائق، ذات صلة بأي موقع قابل للاشتعال في جميع أنحاء العالم حيث يتم استخدام الإخماد. يمكن أن تختبر الأعمال التجريبية المستقبلية هذه التأثيرات المتوقعة عبر مجموعة متنوعة من الإعدادات البيئية والثقافية.
على الرغم من أن السماح بأمان للحريق منخفض ومتوسط الشدة أمر ضروري للتعلم من أجل التعايش مع حرائق الغابات ، فإن تنفيذ الإخماد التقدمي يواجه مجموعة من التحديات التي تمتد عبر الأنظمة الاجتماعية والبيئية . تمتلك العديد من وكالات إدارة الأراضي ثقافات وسياسات متجذرة تحفز الإخماد الرجعي للحريق ، وقد تعيق التحولات في الإدارة نقص الثقة والدعم من الجمهور ، بالإضافة إلى التوقع العام الواسع بأن جميع حرائق الغابات يجب أن يتم إخمادها . سيسمح الإخماد التقدمي بانتشار الحريق منخفض الشدة نسبيًا دون عوائق، بينما يتم إخماد الحريق عالي الشدة بشكل أقوى – وهو نهج إداري قد لا يكون دائمًا عمليًا أو آمنًا أو ممكنًا. بالإضافة إلى ذلك، فإن المساحة التشغيلية للإخماد التقدمي (أي، الحفاظ على تدرج حيث يتم إخماد الحريق عالي الشدة بشكل أكبر من الحريق منخفض الشدة) مقيدة بشكل متزايد مع تزايد الظروف المواتية للحريق (الشكل التكميلي S4)، ومع بناء المزيد من الموارد البشرية القيمة في البيئات القابلة للاشتعال . أخيرًا، بينما يمكن أن تقلل حرائق الشدة المنخفضة والمتوسطة من التأثيرات الصحية المتعلقة بالدخان الناتج عن حرائق الغابات الكبيرة وعالية الشدة ، فإن الانتقال نحو الإخماد التقدمي من المحتمل أن يزيد من تكرار انبعاثات الدخان المنخفضة، تمامًا كما زاد الاستخدام المتزايد للحريق الموصوف . وبالتالي، ستتطلب التحولات في إدارة الحرائق تدخلات الصحة العامة على جميع المستويات: من استراتيجيات السلوك الفردي إلى السياسات العامة وموارد المجتمع (مثل، تسهيل استخدام بيانات جودة الهواء المتاحة للجمهور، دعم أو توفير فلاتر الهواء عالية الكفاءة [HEPA]، وإنشاء مساحات هواء نظيف متاحة للجمهور) .
حتى عندما وأينما يكون الإخماد التقدمي غير ممكن، تظهر نتائجنا أن تنفيذات أقل عدوانية من الإخماد الرجعي (مثل، الانتقال من الإخماد الأقصى إلى الإخماد المعتدل، مماثل للدعوات لزيادة استخدام الحريق ) يمكن أن تقلل بشكل كبير من تحيز الإخماد. يمكن أن تساعد أطر الإدارة التكيفية التي تسهل الفروق المستندة إلى المخاطر في الأساليب الإدارية (مثل، إطار PODs ) أيضًا في تقليل تأثير تحيز الإخماد. على سبيل المثال، يمكن أن تنفذ إدارة الحريق هذه أساليب الإخماد الرجعي عند الضرورة (مثل، بالقرب من البنية التحتية البشرية) وأساليب الإخماد التقدمي أو عدم الإخماد عندما وأينما يكون ذلك أكثر قابلية للتطبيق. أخيرًا، تلعب الحرائق المتعمدة (أي، الحرائق الموصوفة والحرق الثقافي؛ الشكل 1) أيضًا دورًا مهمًا بالتوازي مع الإخماد التقدمي . بينما تدعم هذه الممارسات مجموعة من القيم بمفردها ، فإنها تسهل أيضًا تنفيذ استراتيجيات الإخماد التقدمي من خلال إدخال حريق منخفض الشدة وخلق تباين في المناظر الطبيعية.
نظهر أن تحيز الإخماد هو دافع رئيسي لنشاط الحريق وتأثيراته البيئية. بينما يتم التعرف على التأثيرات السلبية لتراكم الوقود عادةً كعاقبة غير مباشرة للإخماد، فإن دمج تأثيرات تحيز الإخماد من شأنه تحسين فهمنا لعلاقات الحريق بالبشر، والتغيرات المستمرة في نشاط الحريق. جزء من الحل للتعايش مع حرائق الغابات الآن وفي المستقبل يتطلب تطوير وتطبيق تقنيات وأساليب تسمح لنا بإدارة حرائق الغابات بأمان تحت ظروف حرق معتدلة. يمكن القول إن هذا سيكون فعالًا مثل التدخلات الأخرى المطلوبة، مثل التخفيف من ظاهرة الاحتباس الحراري، وتقليل الاشتعالات غير المقصودة المرتبطة بالبشر، وتعديل هيكل الغابات لتقليل شدة الحريق عند حدوث الحرائق.
طرق
يُحاكي نموذجنا أحداث الحريق الفردية بشكل مستقل، وليس من المقصود أن يمثل منظرًا طبيعيًا محددًا في العالم الحقيقي. جميع النماذج هي تنازلات بين الدقة على نطاق صغير والعمومية على نطاق واسع
العمومية ، وقد صممنا نهج المحاكاة لدينا ليكون عامًا مع دمج الجوانب الفيزيائية الأساسية لسلوك الحريق. نستخدم مجموعة واسعة من معلمات تحميل الوقود والمناخ، لإظهار التطبيق العالمي لنتائجنا ومعالجة التباين وعدم اليقين المتأصل في البيئات المعقدة في العالم الحقيقي ونظهر أن عواقب تحيز الإخماد ليست فريدة من نوعها لإعداد بيولوجي فيزيائي محدد (أي، نظام حريق). المعلمات والمحاكاة الموصوفة أدناه مستندة عمومًا إلى متغيرات ونطاقات من التباين تمثل نظم الغابات في شمال غرب أمريكا. يتم تقديم التفاصيل الكاملة في المعلومات التكميلية (طرق تكميلية).
محاكاة الاشتعالات وانتشار الحريق
لكل حريق، اخترنا عشوائيًا يوم اشتعال من موسم حريق افتراضي مدته 150 يومًا. يمكن أن تتأجج الاشتعالات لمدة تصل إلى ثلاثة أيام، خلال ذلك الوقت سيحدث انتشار الحريق إذا كانت رطوبة الوقود اليومية أقل من رطوبة الإخماد ( ). إذا لم تنخفض رطوبة الوقود أبدًا تحت خلال هذه الفترة التي تستغرق ثلاثة أيام، فقد افترضنا أن الاشتعال قد تم إخماده بشكل طبيعي.
افترضنا شكل حريق بيضاوي ونمذجة نمو الحريق اليومي بناءً على مبدأ هويجنز ، الذي يفترض أن نمو كل نقطة على محيط الحريق يمكن نمذجته بشكل مستقل كبيضاوي متوسع. يصبح شكل هذا البيضاوي أطول وأضيق عند سرعات الرياح العالية (الشكل التكميلي S5). نمذجنا معدل انتشار الحريق في اتجاه الرأس اليومي، باستخدام دالة روذرميل في حزمة R firebehavio ، التي تدمج الانتقالات المحتملة إلى انتشار حريق التاج (الشكل التكميلي S5). قمنا بتحويل معدلات انتشار الحريق في اتجاه الرأس المودل إلى عوامل توسع بيضاوية ومسافات عند أي زاوية من الاشتعال (طرق تكميلية). قمنا بحساب مقياسين لشدة الحريق – شدة خط الحريق وطول اللهب – باستخدام معادلات من دالة روذرميل في حزمة R firebehavioR ومددناها إلى شدة خط الحريق البيضاوي باستخدام معادلات كاتشبول وزملائه . قدرنا شدة الحريق من خلال ربط طول اللهب بوفاة الأشجار المقدرة من نظم الغابات المختلطة الصنوبرية وأخيرًا إلى مؤشر الاحتراق المركب (CBI)، وهو مقياس لوفيات النباتات الناتجة عن الحريق واستهلاك المواد العضوية في التربة .
محاكاة الإخماد
اختبرنا عدة سيناريوهات إخماد مختلفة: ثلاثة سيناريوهات إخماد رجعية (معتدل، عالي، أقصى)، سيناريو إخماد تقدمي واحد (تقدمي)، وسيناريو تحكم واحد (بدون إخماد). قمنا بمحاكاة إخماد الحرائق بعملية من خطوتين: 1) الهجوم الأولي، و2) الإخماد اللاحق للحرائق التي تهرب من الهجوم الأولي . لمحاكاة نجاح الهجوم الأولي، استخدمنا علاقة نموذجية من هيرش وزملائه التي تقدر احتمال الهروب كدالة لشدة خط الحريق وحجم الحريق في وقت الانخراط الأولي. بالنسبة لسيناريوهات الإخماد الرجعي، قمنا بمحاكاة عشوائية ما إذا كان الهجوم الأولي ناجحًا (أي، تم احتواء الحريق بالكامل) باستخدام أوقات مختلفة من الانخراط الأولي، وبالتالي حجم الحريق (معتدل ; عالي ; الحد الأقصى في سيناريو القمع التدريجي، افترضنا أن الإشعال تم إدارته دون أي هجوم أولي ولكن مع قمع لاحق. بالنسبة للحرائق التي لم يكن الهجوم الأولي ناجحًا، قمنا بنمذجة القمع اللاحق باستخدام دوال القمع لربط شدة خط النار بالنسبة المتوقعة من الحريق الذي تم قمعه (الشكل 1ب). مرشح القمع الأقصى يعادل تقريبًا أقصى فعالية ممكنة لجهود قمع الحرائق على الأرض، حيث يصبح القمع شبه مستحيل فوق شدة خط النار معينة..
قمنا بحساب المسافة البيضاوية اليومية المحترقة تحت كل سيناريو من سيناريوهات الإخماد كالمسافة المحترقة غير المخمدّة (مع افتراض أن الحريق انتشر بنشاط لنصف طول اليوم) مضروبة في نسبة الحريق المتبقية بعد الإخماد. كانت النقاط على البيضة تعتبر مطفأة بشكل دائم إذا كانت اليومية كانت المسافة المحترقة أقل من 5 أمتار. يمكن أن تستمر نقاط أخرى على الإهليلج في الاحتراق، ولم يُعتبر الحريق مُطفأً حتى يتم إطفاء النقاط عند جميع الزوايا أو حتى بعديوم موسم الحرائق. الشكل التوضيحي الإضافي S6 يوضح أحوال الطقس المتعلقة بالحرائق والتقدم في الاشتعال لمثال على الاشتعال، عبر جميع سيناريوهات الإخماد.
مدخلات نموذج سلوك الحريق
لكل اشتعال، قمنا بمحاكاة أحوال الطقس النارية اليومية: سرعة الرياح ورطوبة الوقود الحي والميت المرتبطة زمنياً. قمنا بنمذجة سرعات الرياح اليومية على أنها ناتجة عن توزيع ويبول، مع اتجاه رياح واحد لكل حدث حريق. قمنا بمحاكاة رطوبة وقود السقف على أنها تتغير زمنياً عبر اتجاه موسمي جيبي. كما قمنا بمحاكاة رطوبة الوقود السطحي الحي والميت اليومية (أي، 1-، 10-، ورطوبة الوقود، رطوبة الوقود الخشبي الحي والعشبي) باستخدام اتجاه موسمي جيبي حول قيمة جفاف الوقود الموسمية المتوسطة، مع تباين عشوائي في السعة وتقلبات يومية مرتبطة زمنياً. بالنسبة لإشعال معين، افترضنا ميل التضاريس بـوتحميل الوقود بشكل موحد ومستمر، مما يعني أن الحرائق المحاكية لم تواجه انقطاعًا في الوقود وستستمر في الاشتعال طالما كانت ظروف الطقس تسمح بانتشار النار.
قمنا بتشغيل محاكاة عبر نطاقات من جفاف الوقود ومتطلبات الوقود لمحاكاة التغيرات في كل من الزمن (أي، تغير المناخ، تراكم الوقود) والمكان (أي، الانتقال من منطقة مناخية أو نوع غابة إلى آخر). شملت نطاقات جفاف الوقود ومتطلبات الوقود 240 عامًا من تغير المناخ النموذجي أو تراكم الوقود في غرب الولايات المتحدة، على التوالي. لتقدير معدل تغير جفاف الوقود السنوي تحت سيناريو تغير المناخ RCP 8.5، استخدمنا نموذج فيكلين ونوفيك.الزيادة المتوقعة في متوسط ضغط بخار الماء الناقص (VPD) في الصيف بمقدار 0.72 كيلو باسكال للولايات المتحدة القارية من الفترة التاريخية (1979-2013؛ منتصف الفترة 1996) إلى الفترة المستقبلية (2065-2099؛ منتصف الفترة 2082) لحساب متوسط الزيادة السنوية بين سنوات المنتصف.نظرًا لأن نماذج انتشار النار تعتمد على رطوبة الوقود، قمنا بتحويل VPD إلى رطوبة الوقود الميت، باستخدام علاقة إحصائية تم تحديدها ببيانات gridMET.من غابات الصنوبر المعتدلة في غرب الولايات المتحدة. لتقدير الزيادات السنوية المحتملة في تحميل الوقود، قمنا بتقدير ميل تراكم الكربون من الخشب الميت المودل (أي، الفرق في تحميل الوقود بين سيناريوهات النموذج المكبوت وغير المكبوت) في غرب الولايات المتحدة من 1980 إلى 2010 من بويسرامي وزملائه.افترضنا أن الكربون يتكون منمن إجمالي وزن الوقود وأنتشكل الوقود 50% من جميع الوقود الميت (تماشيًا مع نسب نموذج الوقود) )، مما يؤدي إلى زيادة في حمولة الوقود السنوية بمقدار 100 ساعة .
هيكل المحاكاة
قمنا بتشغيل محاكيات حيث قمنا بتغيير إما متوسط جفاف الوقود أو تحميل الوقود، مع الاحتفاظ بالآخر عند قيم متوسطة ثابتة. تضمنت نسخة واحدة من المحاكاة 1000 اشتعال، كل منها كان له يوم اشتعال فريد ومحاكاة عشوائية لسلسلة زمنية من قيم رطوبة الوقود وسرعات الرياح (أي سيناريو الطقس). باستخدام يوم الاشتعال وسيناريو الطقس هذا، قمنا بعد ذلك بمحاكاة انتشار الحريق بشكل مستقل إما 1) لجميع مستويات تحميل الوقود، مع الاحتفاظ بجفاف موسم الحريق المتوسط ثابتًا (VPD بمقدار 1.17 كيلو باسكال)، أو 2) لجميع مستويات جفاف الوقود المتوسط، مع الاحتفاظ بتحميل الوقود ثابتًا (تحميل وقود 100 ساعة من ). لكل من هذه الأحداث المحاكية لانتشار الحريق، قمنا أيضًا بنمذجة جميع السيناريوهات الأربعة لإخماد الحريق (الأقصى، العالي، المعتدل، والتدريجي) بالإضافة إلى سيناريو عدم الإخماد. ثم قمنا بتكرار محاكاة واحدة 40 مرة، ليصل المجموع إلى 5 ملايين حريق محاكى عبر كل نطاق من جفاف الوقود المتوسط أو تحميل الوقود (1000 إشعالمستويات جفاف الوقود أو تحميل الوقودمستويات القمعنسخ).
تلخيص الآثار التراكمية لإخماد الحرائق
لتقييم تأثير إخماد الحرائق على أنماط شدة الحرائق، قمنا بحساب النسبة التي احترقت بشدة عالية (CBI) لكل حريق. القيم؛ وفقًا لـ باركس وأباتزوجلو ) ومتوسط شدة الحريق الموزونة. لكل محاكاة، قمنا بحساب التغيير المطلوب في متوسط جفاف الوقود أو حمولة الوقود للحرائق بدون إخماد لتحقيق نفس شدة الحريق كما في الحرائق المخمدّة. قسمنا هذه القيمة على المعدلات السنوية المقدرة للتغيير في متوسط جفاف الوقود وحمولة الوقود، لتقييم عدد سنوات التغير المناخي أو تراكم الوقود التي ستحتاجها الحرائق غير المخمدّة للاحتراق بنفس متوسط شدة الحريق. للتحقيق في كيفية تأثير إخماد الحرائق على أنماط المساحة المحترقة، قمنا بحساب إجمالي المساحة المحترقة لكل حريق. لكل محاكاة، قمنا أيضًا بحساب متوسط معدل الزيادة السنوي المضاعف ( ) في المنطقة المحترقة عبر نطاقات 240 عامًا من جفاف الوقود وتحميل الوقود. قمنا بحساب تنوع شدة الحرائق لكل حريق باستخدام الطريقة المفصلة من قبل ستيل وزملائه.، مع CBI كخاصية إدخال واحدة للحريق – والتي تعادل الانحراف المطلق المتوسط لقيم CBI. قمنا بدراسة كيفية توزيع المساحة المحترقة بشكل متساوٍ عبر الحرائق من خلال حساب منحنيات لورينز للمساحة المحترقة تحت كل سيناريو من سيناريوهات الإخماد.
داخل تكرار (أي 1000 إشعال)مستويات جفاف الوقود أو تحميل الوقود)، لكل سيناريو من سيناريوهات الإخماد قمنا بحساب القيم المتوسطة للمعلمات ذات الاهتمام، عند كل مستوى من مستويات جفاف الوقود أو تحميل الوقود. ثم قمنا بحساب المتوسطات العامة عبر 40 تكرارًا لمحاكاة واستخدمنافترات الثقة لعرض التباين. قمنا بإجراء جميع المحاكاة والتحليل في.
Balch, J. K. et al. Warming weakens the night-time barrier to global fire. Nature 602, 442-448 (2022).
Ellis, T. M., Bowman, D. M. J. S., Jain, P., Flannigan, M. D. & Williamson, G. J. Global increase in wildfire risk due to climate-driven declines in fuel moisture. Glob. Change Biol. 28, 1544-1559 (2022).
Bowman, D. M. J. S. et al. Vegetation fires in the Anthropocene. Nat. Rev. Earth Environ. 1, 500-515 (2020).
Xu, R. et al. Wildfires, Global Climate Change, and Human Health. N. Engl. J. Med. 383, 2173-2181 (2020).
Iglesias, V. et al. Fires that matter: reconceptualizing fire risk to include interactions between humans and the natural environment. Environ. Res. Lett. 17, 045014 (2022).
Higuera, P. E., Abatzoglou, J. T., Littell, J. S. & Morgan, P. The Changing Strength and Nature of Fire-Climate Relationships in the Northern Rocky Mountains, U.S.A., 1902-2008. PLOS One 10, e0127563 (2015).
Godfree, R. C. et al. Implications of the 2019-2020 megafires for the biogeography and conservation of Australian vegetation. Nat. Commun. 12, 1023 (2021).
Moreira, F. et al. Wildfire management in Mediterranean-type regions: paradigm change needed. Environ. Res. Lett. 15, 011001 (2020).
Shive, K. L. et al. Ancient trees and modern wildfires: Declining resilience to wildfire in the highly fire-adapted giant sequoia. For. Ecol. Manag. 511, 120110 (2022).
North, M. P. et al. Reform forest fire management. Science 349, 1280-1281 (2015).
Stephens, S. L. et al. Managing Forests and Fire in Changing Climates. Science 342, 41-42 (2013).
US Forest Service. Confronting the Wildfire Crisis: A Strategy for Protecting Communities and Improving Resilience in America’s Forests (US Department of Agriculture Forest Service Fire and
Aviation Management and Department of the Interior Office of Wildland Fire, 2022).
13. Spreading like Wildfire: The Rising Threat of Extraordinary Landscape Fires. UNEP – UN Environment Programme (UNEP2, O22).
14. Calkin, D. E. et al. Wildland-urban fire disasters aren’t actually a wildfire problem. Proc. Natl Acad. Sci. 120, e2315797120 (2023).
15. Jones, M. W. et al. Global and Regional Trends and Drivers of Fire Under Climate Change. Rev. Geophys. 60, e2020RG000726 (2022).
16. Abatzoglou, J. T., Williams, A. P. & Barbero, R. Global Emergence of Anthropogenic Climate Change in Fire Weather Indices. Geophys. Res. Lett. 46, 326-336 (2019).
17. Miller, J. D., Safford, H. D., Crimmins, M. & Thode, A. E. Quantitative Evidence for Increasing Forest Fire Severity in the Sierra Nevada and Southern Cascade Mountains, California and Nevada, USA. Ecosystems 12, 16-32 (2009).
18. Roos, C. I. et al. Fire Suppression Impacts on Fuels and Fire Intensity in the Western U.S.: Insights from Archaeological Luminescence Dating in Northern New Mexico. Fire 3, 32 (2020).
19. Balch, J. K. et al. Human-started wildfires expand the fire niche across the United States. Proc. Natl Acad. Sci. 114, 2946-2951 (2017).
20. Fried, J. S. et al. Predicting the effect of climate change on wildfire behavior and initial attack success. Clim. Change 87, 251-264 (2008).
21. Arienti, M. C., Cumming, S. G. & Boutin, S. Empirical models of forest fire initial attack success probabilities: the effects of fuels, anthropogenic linear features, fire weather, and management. Can. J. Res. 36, 3155-3166 (2006).
22. Bowman, D. M. J. S., O’Brien, J. A. & Goldammer, J. G. Pyrogeography and the Global Quest for Sustainable Fire Management. Annu. Rev. Environ. Resour. 38, 57-80 (2013).
23. Plucinski, M. P. Fighting Flames and Forging Firelines: Wildfire Suppression Effectiveness at the Fire Edge. Curr. Forestry Rep. 5, 1-19 (2019).
24. Plucinski, M. P. Contain and Control: Wildfire Suppression Effectiveness at Incidents and Across Landscapes. Curr. Forestry Rep. 5, 20-40 (2019).
25. Berkey, J. K., Miller, C. & Larson, A. J. A history of wilderness fire management in the Northern Rockies. Gen. Tech. Rep. RMRS-GTR428. (U.S. Department of Agriculture, Forest Service, Rocky Mountain Research Statio, 2021).
26. Dodge, M. Forest Fuel Accumulation-A Growing Problem. Science 177, 139-142 (1972).
27. Parisien, M.-A. et al. Fire deficit increases wildfire risk for many communities in the Canadian boreal forest. Nat. Commun. 11, 2121 (2020).
28. Arno, S. F. & Brown, J. K. Overcoming the paradox in managing wildland fire. West. Wildlands 17, 40-46 (1991).
29. Ingalsbee, T. Whither the paradigm shift? Large wildland fires and the wildfire paradox offer opportunities for a new paradigm of ecological fire management. Int. J. Wildl. Fire 26, 557-561 (2017).
30. Parsons, D. J. & DeBenedetti, S. H. Impact of fire suppression on a mixed-conifer forest. For. Ecol. Manag. 2, 21-33 (1979).
31. Schoennagel, T., Veblen, T. T. & Romme, W. H. The Interaction of Fire, Fuels, and Climate across Rocky Mountain Forests. BioScience 54, 661-676 (2004).
32. Steel, Z. L., Safford, H. D. & Viers, J. H. The fire frequency-severity relationship and the legacy of fire suppression in California forests. Ecosphere 6, art8 (2015).
33. Calkin, D. E., Thompson, M. P. & Finney, M. A. Negative consequences of positive feedbacks in US wildfire management. Ecosyst. 2, 9 (2015).
34. Katuwal, H., Calkin, D. E. & Hand, M. S. Production and efficiency of large wildland fire suppression effort: A stochastic frontier analysis. J. Environ. Manag. 166, 227-236 (2016).
35. Silva, F. R. Y., O’Connor, C. D., Thompson, M. P., Martinez, J. R. M., & Calkin, D. E., Modelling suppression difficulty: Current and future applications. Int. J. Wildl. Fire. https://doi.org/10.1071/ WF19042 (2020).
36. Andrews, P. Heinsch, F., Schelvan, L. How to Generate and Interpret Fire Characteristics Charts for Surface and Crown Fire Behavior (USDA Forest Service – General Technical Report RMRS-GTR, 2011).
37. Calkin, D. E., Cohen, J. D., Finney, M. A. & Thompson, M. P. How risk management can prevent future wildfire disasters in the wildlandurban interface. Proc. Natl Acad. Sci. 111, 746-751 (2014).
38. Miller, C. & Aplet, G. H. Progress in Wilderness Fire Science: Embracing Complexity. J. Forestry 114, 373-383 (2016).
39. Seielstad, C. Reconside ring wildland fire use: Perspectives from the Northern Rockies. In Proceedings of the large wildland fires conference. (eds. Keane, R.E., Jolly, M., Parsons, R., Riley, K.) 73, 207-212 (U.S. Department of Agriculture, Forest Service, Rocky Mountain Research Station, 2015).
40. Miller, C. The hidden consequences of fire suppression. Park Sci. 28, 75-80 (2012).
41. Daniels, M. C. et al. Multiple social and environmental factors affect wildland fire response of full or less-than-full suppression. J. Environ. Manag. 351, 119731 (2024).
42. St. Denis, L. A. et al. All-hazards dataset mined from the US National Incident Management System 1999-2020. Sci. Data 10, 112 (2023).
43. Steel, Z. L., Collins, B. M., Sapsis, D. B. & Stephens, S. L. Quantifying pyrodiversity and its drivers. Proc. R. Soc. B Biol. Sci. 288, 20203202 (2021).
44. Ficklin, D. L. & Novick, K. A. Historic and projected changes in vapor pressure deficit suggest a continental-scale drying of the United States atmosphere. J. Geophys. Res. Atmos. 122, 2061-2079 (2017).
45. Boisramé, G. F. S., Brown, T. J. & Bachelet, D. M. Trends in western USA fire fuels using historical data and modeling. Fire Ecol. 18, 8 (2022).
46. Key, C. H. & Benson, N. C. Landscape Assessment: Sampling and Analysis Methods. USDA Forest Service General Technical Report RMRS-GTR-164-CD, 55 (SDA Forest Service, 2006).
47. Prichard, S. J. et al. Adapting western North American forests to climate change and wildfires: 10 common questions. Ecol. Appl. 31, eO2433 (2021).
48. Reilly, M. J. et al. Contemporary patterns of fire extent and severity in forests of the Pacific Northwest, USA (1985-2010). Ecosphere 8, e01695 (2017).
49. Williams, J. N., Safford, H. D., Enstice, N., Steel, Z. L. & Paulson, A. K. High-severity burned area and proportion exceed historic conditions in Sierra Nevada, California, and adjacent ranges. Ecosphere 14, e4397 (2023).
50. Collins, L. et al. The 2019/2020 mega-fires exposed Australian ecosystems to an unprecedented extent of high-severity fire. Environ. Res. Lett. 16, 044029 (2021).
51. Fernández-García, V. & Alonso-González, E. Global Patterns and Dynamics of Burned Area and Burn Severity. Remote Sens. 15, 3401 (2023).
52. Borrie, W., McCool, S. & Whitmore, J. Wildland Fire Effects on Visits and Visitors to the Bob Marshal Wilderness Complex. Int. J. Wilderness 12, 32-38 (2006).
53. Parks, S. A. & Abatzoglou, J. T. Warmer and Drier Fire Seasons Contribute to Increases in Area Burned at High Severity in Western US Forests From 1985 to 2017. Geophys. Res. Lett. 47, e2020GL089858 (2020).
54. Schoennagel, T. et al. Adapt to more wildfire in western North American forests as climate changes. PNAS 114, 4582-4590 (2017).
55. Kais, S. M. & Islam, M. S. Community Capitals as Community Resilience to Climate Change: Conceptual Connections. Int. J. Environ. Res. Public Health 13, 1211 (2016).
56. Keeley, J. E., Pausas, J. G., Rundel, P. W., Bond, W. J. & Bradstock, R. A. Fire as an evolutionary pressure shaping plant traits. Trends Plant Sci. 16, 406-411 (2011).
57. Tubbesing, C. L., York, R. A., Stephens, S. L. & Battles, J. J. Rethinking fire-adapted species in an altered fire regime. Ecosphere 11, e03091 (2020).
58. Seidl, R. & Turner, M. G. Post-disturbance reorganization of forest ecosystems in a changing world. Proc. Natl Acad. Sci. 119, e2202190119 (2022).
59. Hagmann, R. K. et al. Evidence for widespread changes in the structure, composition, and fire regimes of western North American forests. Ecol. Appl. 31, e02431 (2021).
60. Young, D. J. N. et al. Post-fire forest regeneration shows limited climate tracking and potential for drought-induced type conversion. Ecology 100, e02571 (2019).
61. Larson, A. J. et al. Tamm Review: Ecological principles to guide post-fire forest landscape management in the Inland Pacific and Northern Rocky Mountain regions. For. Ecol. Manag. 504, 119680 (2022).
62. Harvey, B. J., Donato, D. C. & Turner, M. G. High and dry: post-fire tree seedling establishment in subalpine forests decreases with post-fire drought and large stand-replacing burn patches. Glob. Ecol. Biogeogr. 25, 655-669 (2016).
63. Coop, J. D. et al. Wildfire-Driven Forest Conversion in Western North American Landscapes. BioScience 70, 659-673 (2020).
64. Davis, K. T. et al. Reduced fire severity offers near-term buffer to climate-driven declines in conifer resilience across the western United States. Proc. Natl Acad. Sci. 120, e2208120120 (2023).
65. Haire, S., McGarigal, K., Miller, C. Wilderness shapes contemporary fire size distributions across landscapes of the western United States. Ecosphere 4, 1-20 (2013).
66. van Wagtendonk, J. W. & Lutz, J. A. Fire Regime Attributes of Wildland Fires in Yosemite National Park, USA. Fire Ecol. 3, 34-52 (2007).
67. Rivera-Huerta, H., Safford, H. D. & Miller, J. D. Patterns and Trends in Burned Area and Fire Severity from 1984 to 2010 in the Sierra de San Pedro Mártir, Baja California, Mexico. Fire Ecol. 12, 52-72 (2016).
68. Rothermel, R. C. A mathematical model for predicting fire spread in wildland fuels. Res. Pap. INT-115. (U.S. Department of Agriculture, Intermountain Forest and Range Experiment Station, 1972).
69. Hirsch, K. G., Corey, P. N. & Martell, D. L. Using Expert Judgment to Model Initial Attack Fire Crew Effectiveness. For. Sci. 44, 539-549 (1998).
70. Cullen, A. C., Axe, T. & Podschwit, H. High-severity wildfire potential – associating meteorology, climate, resource demand and wildfire activity with preparedness levels. Int. J. Wildland Fire 30, 30-41 (2020).
71. Calkin, D. E., Gebert, K. M., Jones, J. G. & Neilson, R. P. Forest service large fire area burned and suppression expenditure trends, 19702002. J. Forestry 103, 179-183 (2005).
72. Moritz, M. A. et al. Learning to coexist with wildfire. Nature 515, 58-66 (2014).
73. Olsen, C. S., Sharp, E., Olsen, C. S. & Sharp, E. Building community-agency trust in fire-affected communities in Australia and the United States. Int. J. Wildland Fire 22, 822-831 (2013).
74. Steelman, T. A. & McCaffrey, S. Best practices in risk and crisis communication: Implications for natural hazards management. Nat. Hazards 65, 683-705 (2013).
75. Long, J. et al., Comparing smoke emissions and impacts under alternative forest management regimes. Ecol. Soc. 27, 26-42 (2022).
76. Schultz, C. A. et al. Policy barriers and opportunities for prescribed fire application in the western United States. Int. J. Wildland Fire 28, 874-884 (2019).
77. US Environmental Protection Agency (EPA). Wildfire Smoke: A Guide for Public Health Officials (US Environmental Protection Agency, 2021).
78. Thompson, M. P. et al. Potential operational delineations: new horizons for proactive, risk-informed strategic land and fire management. Fire Ecol. 18, 17 (2022).
79. Hoffman, K. M. et al. Conservation of Earth’s biodiversity is embedded in Indigenous fire stewardship. Proc. Natl Acad. Sci. 118, e2105073118 (2021).
80. Lake, F. K. et al. Returning Fire to the Land: Celebrating Traditional Knowledge and Fire. J. Forestry 115, 343-353 (2017).
81. Levins, R. The Strategy of Model Building in Population Biology. Am. Scientist 54, 421-431 (1966).
82. Geary, W. L. et al. A guide to ecosystem models and their environmental applications. Nat. Ecol. Evol. 4, 1459-1471 (2020).
83. Finney, M. A., McAllister, S. S., Grumstrup, T. P., Forthofer, J. M. Wildland Fire Behaviour (CSIRO Publishing, 2021).
84. Anderson, D. H., Catchpole, E. A., Mestre, N. J. D. & Parkes, T. Modelling the spread of grass fires. ANZIAM J. 23, 451-466 (1982).
85. Ziegler, J. P., Hoffman, C. M. & Mell, W. firebehavioR: An R Package for Fire Behavior and Danger Analysis. Fire 2, 41 (2019).
86. Scott, J., Reinhardt, E. Assessing Crown Fire Potential by Linking Models of Surface and Crown Fire Behavior. Research Paper RMRSRP (USDA Forest Service, 2001).
87. Finney, M. A. FARSITE: Fire A rea Simulator-model development and evaluation. Res. Pap. RMRS-RP-4, Revis. 2004. (U.S. Department of Agriculture, Forest Service, Rocky Mountain Research Station, 1998)..
88. Catchpole, E. A., Mestre, N. D., Gill, A. Intensity of fire at its perimeter. Aust. For. Res. 12, 47-54 (1982).
89. Ryan, K. & Noste, N. Evaluating Prescribed Fires. In Proc. – Symposium and Workshop on Wilderness Fire 230-238 (USDA Forest Service Intermountain Forest and Range Experiment Station, 1985).
90. Abatzoglou, J. T. Development of gridded surface meteorological data for ecological applications and modelling. Int. J. Climatol. 33, 121-131 (2011).
91. Anderson, H. E. Aids to determining fuel models for estimating fire behavior. Gen. Tech. Rep. INT-122. (U.S. Department of Agriculture, Forest Service, Intermountain Forest and Range Experiment Station, 1982).
92. R Core Team. R: A language and environment for statistical computing (R Core Team, 2023).
93. Kreider, M. Scripts for manuscript “Fire suppression makes wildfires more severe and accentuates impacts of climate change and fuel accumulation.” Nat. Commun. https://doi.org/10.5281/zenodo. 10729478 (2024).
شكر وتقدير
نشكر مارك فيني وأعضاء ندوة كتابة علم البيئة في جامعة مونتانا على الاقتراحات التي حسنت هذا العمل. تم دعم هذا العمل من خلال زمالة البحث العليا من مؤسسة العلوم الوطنية، الجائزة 1745048 (م.ر.ك.). جاء دعم إضافي من خدمة الغابات الأمريكية، محطة أبحاث جبال روكي، معهد ألدوا ليوبولد لأبحاث البرية من خلال الاتفاق 19-JV-11221639-098 (م.ر.ك. و أ.ج.ل.) ومن مركز علوم التكيف المناخي في الشمال الأوسط التابع لوزارة الداخلية من خلال الاتفاق التعاوني G18AC00325 من المسح الجيولوجي الأمريكي (ب.إ.هـ.). النتائج والاستنتاجات في هذا المنشور هي تلك الخاصة بالمؤلفين ولا ينبغي تفسيرها على أنها تمثل أي تحديد أو سياسة رسمية من USDA أو USGS أو حكومة الولايات المتحدة.
مساهمات المؤلفين
قام م.ر.ك، ب.إ.هـ، س.أ.ب و أ.ج.ل بتصميم البحث؛ كتب م.ر.ك النموذج وأجرى محاكاة حاسوبية؛ قام م.ر.ك بتحليل البيانات؛ كتب م.ر.ك الورقة؛ قام م.ر.ك، ب.إ.هـ، س.أ.ب، و.ل.ر، ن.و و أ.ج.ل بإجراء المراجعة والتحرير.
يجب توجيه المراسلات والطلبات للحصول على المواد إلى مارك ر. كرايدر.
تُشكر مجلة Nature Communications غابرييل بواسرام، ميغيل كروز، والمراجع الآخر المجهول على مساهمتهم في مراجعة الأقران لهذا العمل. يتوفر ملف مراجعة الأقران.
ملاحظة الناشر تظل Springer Nature محايدة فيما يتعلق بالمطالبات القضائية في الخرائط المنشورة والانتماءات المؤسسية.
الوصول المفتوح هذه المقالة مرخصة بموجب رخصة المشاع الإبداعي النسب 4.0 الدولية، التي تسمح بالاستخدام والمشاركة والتكيف والتوزيع وإعادة الإنتاج بأي وسيلة أو صيغة، طالما أنك تعطي الائتمان المناسب للمؤلفين الأصليين والمصدر، وتوفر رابطًا لرخصة المشاع الإبداعي، وتوضح ما إذا تم إجراء تغييرات. الصور أو المواد الأخرى من طرف ثالث في هذه المقالة مشمولة في رخصة المشاع الإبداعي للمقالة، ما لم يُذكر خلاف ذلك في سطر الائتمان للمادة. إذا لم تكن المادة مشمولة في رخصة المشاع الإبداعي للمقالة وكان استخدامك المقصود غير مسموح به بموجب اللوائح القانونية أو يتجاوز الاستخدام المسموح به، ستحتاج إلى الحصول على إذن مباشرة من صاحب حقوق الطبع والنشر. لعرض نسخة من هذه الرخصة، قم بزيارةhttp://creativecommons.org/licenses/by/4.0/.
(ج) المؤلفون 2024
قسم إدارة الغابات، جامعة مونتانا، ميسولا، MT 59812، الولايات المتحدة الأمريكية.قسم علوم النظام البيئي والحفاظ، جامعة مونتانا، ميسولا، MT 59812، الولايات المتحدة الأمريكية.معهد ألدوا ليوبولد لأبحاث البرية، محطة أبحاث جبال روكي، خدمة الغابات الأمريكية، ميسولا، MT 59801، الولايات المتحدة الأمريكية.قسم المجتمع والحفاظ، جامعة مونتانا، ميسولا، MT 59812، الولايات المتحدة الأمريكية.علوم البيئة وصحافة الموارد الطبيعية، جامعة مونتانا، ميسولا، MT 59812، الولايات المتحدة الأمريكية.معهد البرية، جامعة مونتانا، ميسولا، MT 59812، الولايات المتحدة الأمريكية.
Fire suppression is the primary management response to wildfires in many areas globally. By removing less-extreme wildfires, this approach ensures that remaining wildfires burn under more extreme conditions. Here, we term this the “suppression bias” and use a simulation model to highlight how this bias fundamentally impacts wildfire activity, independent of fuel accumulation and climate change. We illustrate how attempting to suppress all wildfires necessarily means that fires will burn with more severe and less diverse ecological impacts, with burned area increasing at faster rates than expected from fuel accumulation or climate change. Over a human lifespan, the modeled impacts of the suppression bias exceed those from fuel accumulation or climate change alone, suggesting that suppression may exert a significant and underappreciated influence on patterns of fire globally. Managing wildfires to safely burn under low and moderate conditions is thus a critical tool to address the growing wildfire crisis.
Wildfires are becoming more destructive and deadly around the world . The societal and ecological impacts of fires are in our collective consciousness-from Australia’s 2019-2020 megafires , to destructive wildfires in the Mediterranean , to beloved giant sequoias killed by fire in California -prompting widespread calls to address the wildfire crisis . We understand the broad drivers of increasing fire activity: changes in climate , vegetation and fuel accumulation , and ignition patterns . However, humans also play a direct role in modifying fire activity across much of the globe by engaging with fires minutes to hours after ignition (i.e., initial attack ), and subsequent suppression of escaped fires . While weather, fuels, topography, and ignitions determine how fires might burn, humans strongly shape this into when, where, and how fires do burn (Fig. 1).
Wildfires only burn if they are not extinguished through suppression. Thus, suppression is a “filter” that allows certain types of fire to pass through while removing other types of fire (Fig. 1b). In some
locations (e.g., a remote wilderness area) this filter may be relatively porous, and many fires may burn with only minimal suppression . In most landscapes, however, aggressive suppression of fire is a cultural expectation, and the suppression filter is much less permeable, with only the most extreme fires escaping (e.g., Maximum suppression in Fig. 1) . Intentional fires (i.e., prescribed fires and cultural burning) are the only types of fires that do not pass through the suppression filter, as they are allowed to burn unimpeded if they are within prescription (Fig. 1a). Area that does not burn because it was “removed” through suppression, results in fuel accumulation and ultimately increases the likelihood and intensity of future fires (Fig. 1a). This well-known consequence has been termed the “fire suppression paradox” : by putting out a fire today, we make fires harder to put out in the future (Table 1).
Suppressing wildfires also has an additional and poorly quantified consequence that we define as the “suppression bias”:
Fig. 1 | Conceptual diagram of how suppression influences fire. a Potential fire behavior depends on the fire triangle (topography, weather, fuel) and ignitions. Intentional ignitions (i.e., prescribed fires and cultural burning) do not pass through the suppression filter, as they are allowed to burn unimpeded if within prescription. Unplanned human ignitions and lightning ignitions only burn if they successfully pass through the “suppression filter.” Fire “removed” by the suppression filter leads to fuel accumulation, influencing fires from all ignition types (suppression paradox, brown color). Wildfires that do burn are biased toward the fire that was not removed (suppression bias, red). These wildfires, together with intentional fires,
form the realized fire regime with the suppression paradox and suppression bias inherently incorporated. b The suppression filter. 1) Initial attack success probability as a function of fireline intensity and fire size at initial attack (from Hirsch et al. ); 2) Proportion of escaped fire suppressed as a function of fire intensity. Suppression becomes increasingly impossible at high fire intensities. Colors depict the suppression scenarios used in the simulation. c Fire perimeters (viewed from overhead) after the first day of burning for an example ignition. Colors correspond to suppression scenarios shown in panel b. Fire intensity of the burned area is displayed with a color ramp.
Table 1 | Comparison of the fire suppression paradox and bias
Term
Definition
Mechanism
Impact
Time lag
Fire suppression paradox
By suppressing fire today, we increase fuel loads, making fires harder to suppress in the future
Fuel accumulation
Indirect
Future
Fire suppression bias
By suppressing some fire types more than others, the remainder reflects a biased representation of fire types
Differential suppression filter
Direct
Immediate
fire suppression extinguishes some types of fire (e.g., surface fire) more than others (e.g., crown fire), and thus skews the resulting fire activity toward those types less likely to be removed (Table 1). In contemporary fire management, which easily suppresses and removes low-intensity fire, this bias is inevitably toward higher-intensity burning occurring under extreme weather . Thus, the fires which ecosystems, species, and people experience are skewed towards the most severe and destructive.
We define management approaches that suppress lower-intensity fire more heavily than higher-intensity fire as “regressive suppression,” borrowing language from economics (e.g., a regressive tax rate decreases as taxable income increases) (Table 2). In some instances, however, management could contain and suppress relatively higherintensity fire more heavily than lower-intensity fire, an approach we term “progressive suppression” (e.g., a progressive tax rate increases as taxable income increases) (Table 2). Both regressive and progressive suppression are subject to the same upper limit, above which fires are
Table 2 | How the type of suppression influences the resulting suppression bias
Type of suppression
Definition
Direction of suppression bias
Regressive suppression
Suppresses lower-intensity fire more heavily than higher-intensity fire
Toward higher-intensity fires, more extreme fires
Progressive suppression
Suppresses higher-intensity fire more heavily than lower-intensity fire
Toward lower-intensity fires, more moderate fires
simply too intense to suppress (Fig. 1b) ; however, within the domain where suppression is possible, regressive and progressive approaches can have profoundly different impacts (i.e., biases) on the way fires burn.
Although the fire suppression bias has been referenced tangentially in the literature , the emergent impacts of the suppression bias have not been assessed. This is largely due to the difficulty of isolating the impact of suppression with empirical data. Suppression is so ubiquitous that we have virtually no control landscapes where fire is completely unsuppressed; even in remote wilderness areas, some fires are still suppressed . Furthermore, it is difficult to measure the magnitude of suppression efforts because even relatively direct proxies such as suppression cost are confounded by other factors, including terrain accessibility, human infrastructure at risk, and availability of suppression resources . Finally, data on suppression efforts are generally only available for larger fires , obscuring the many ignitions that are quickly and easily suppressed during initial attack . To overcome these constraints, we used a simulation approach to assess and quantify the magnitude of the fire suppression bias on fire behavior and ecological impacts, relative to the influence of climate change and fuel accumulation.
Our modeling framework simulates fundamental components of fires: weather and fuel moisture; ignitions; fire growth; fire suppression (through initial attack and containment of escaped fires); and ecological effects. To isolate the effect of fire suppression, we simulated thousands of fires with identical biophysical conditions, but which differed only in their suppression scenario, including three “regressive suppression” scenarios (Moderate, High, and Maximum; Fig. 1b), one “progressive suppression” scenario (Progressive; Fig. 1b), and a control scenario with no suppression. For each fire, we calculated the proportion burned at high severity, average fire severity, daily and total fire size, and the diversity of fire severity . To compare the influence of suppression to that of climate change and fuel accumulation, we simulated fires across a range of plausible current and future fuel aridity (vapor pressure deficit; VPD) and fuel loading conditions in forest ecosystems in North America. These ranges represent a year time period of modeled increases (e.g., increased VPD based on RCP 8.5 climate scenario ; fuel loading rates based on historical fuel modeling ).
Using this modeling framework, we show how the suppression bias directly influences fire activity and subsequent fire effects. Specifically, we asked: 1) How does fire suppression influence patterns of area burned, ecological impacts (i.e., fire severity), and the diversity of both factors over space and time? 2) How does the magnitude of this influence compare to that from climate change and fuel accumulation?
Results
Regressive fire suppression makes fires more severe
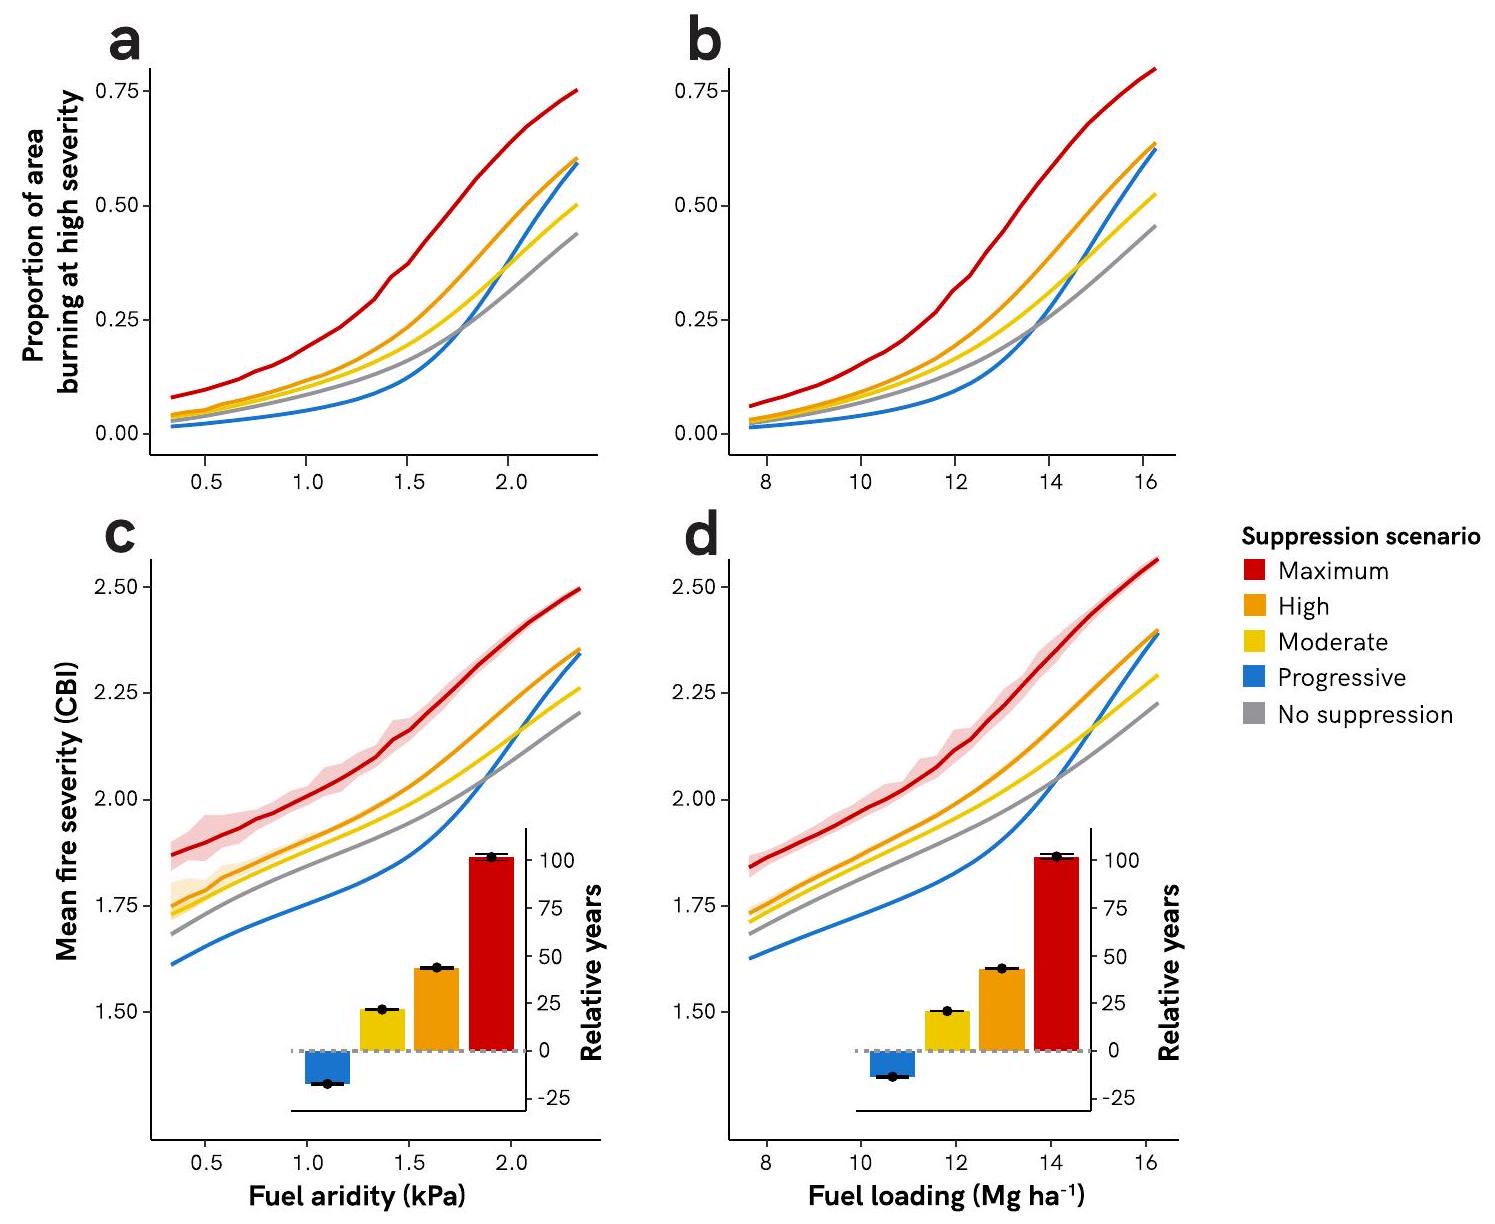
Across the simulated range of fuel aridity, regressive suppression scenarios (Moderate, High, and Maximum) increased the ecological impacts of wildfire, as reflected by higher fire severity metrics. We simulated fire severity by linking fire intensity to the Composite Burn Index (CBI), which runs from zero (unburned) to three (maximum fire severity), with values above 2.25 considered high-severity . Under the Maximum fire suppression scenario, a greater proportion of each wildfire burned at high severity (Fig. 2a, b). On average, wildfires burning under the Maximum suppression scenario had over twice as high proportion that burned at high severity, compared to fires
burning with no suppression. Across all fuel aridity simulations, Maximum suppression increased mean fire severity by an average of 0.21 CBI units, relative to fires with no suppression (Fig. 2c). This increase in fire severity is equivalent to the cumulative effects of 102 years of increased fuel aridity from climate change alone, under the nosuppression scenario (i.e., an increase in mean summer VPD of +0.85 kPa ) (Fig. 2c inset). Similarly, across the simulated range of fuel loading values, Maximum suppression increased mean fire severity by an average of 0.22 CBI units, relative to control scenarios (Fig. 2d). This increase is equivalent to the effect of 102 years of additional fuel accumulation under no fire suppression (i.e., an increase in 100-h surface fuel loading of ) (Fig. 2d inset).
In contrast, Progressive suppression reduced the proportion of each wildfire that burned at high severity, for most levels of fuel aridity and fuel loading (Fig. 2a, b). Compared to fires burning with no suppression, wildfires burning under the Progressive suppression scenario had an average of 17% (across fuel aridity gradient) and 15% (across fuel loading gradient) less proportion that burned at high severity. Mean fire severity was also lower under the Progressive fire suppression scenario, across most of the simulated range of fuel aridity and loading, with an average reduction of 0.04 and 0.03 CBI units, respectively (Fig. 2c, d). Given modeled rates of fuel aridity and fuel loading change, these differences are equivalent to burning under scenarios of no suppression from 17 and 14 years in the past (i.e., changes of -0.15 kPa VPD and ), respectively (Fig. 2c, d insets).
Regressive fire suppression accentuates trends of increasing area burned
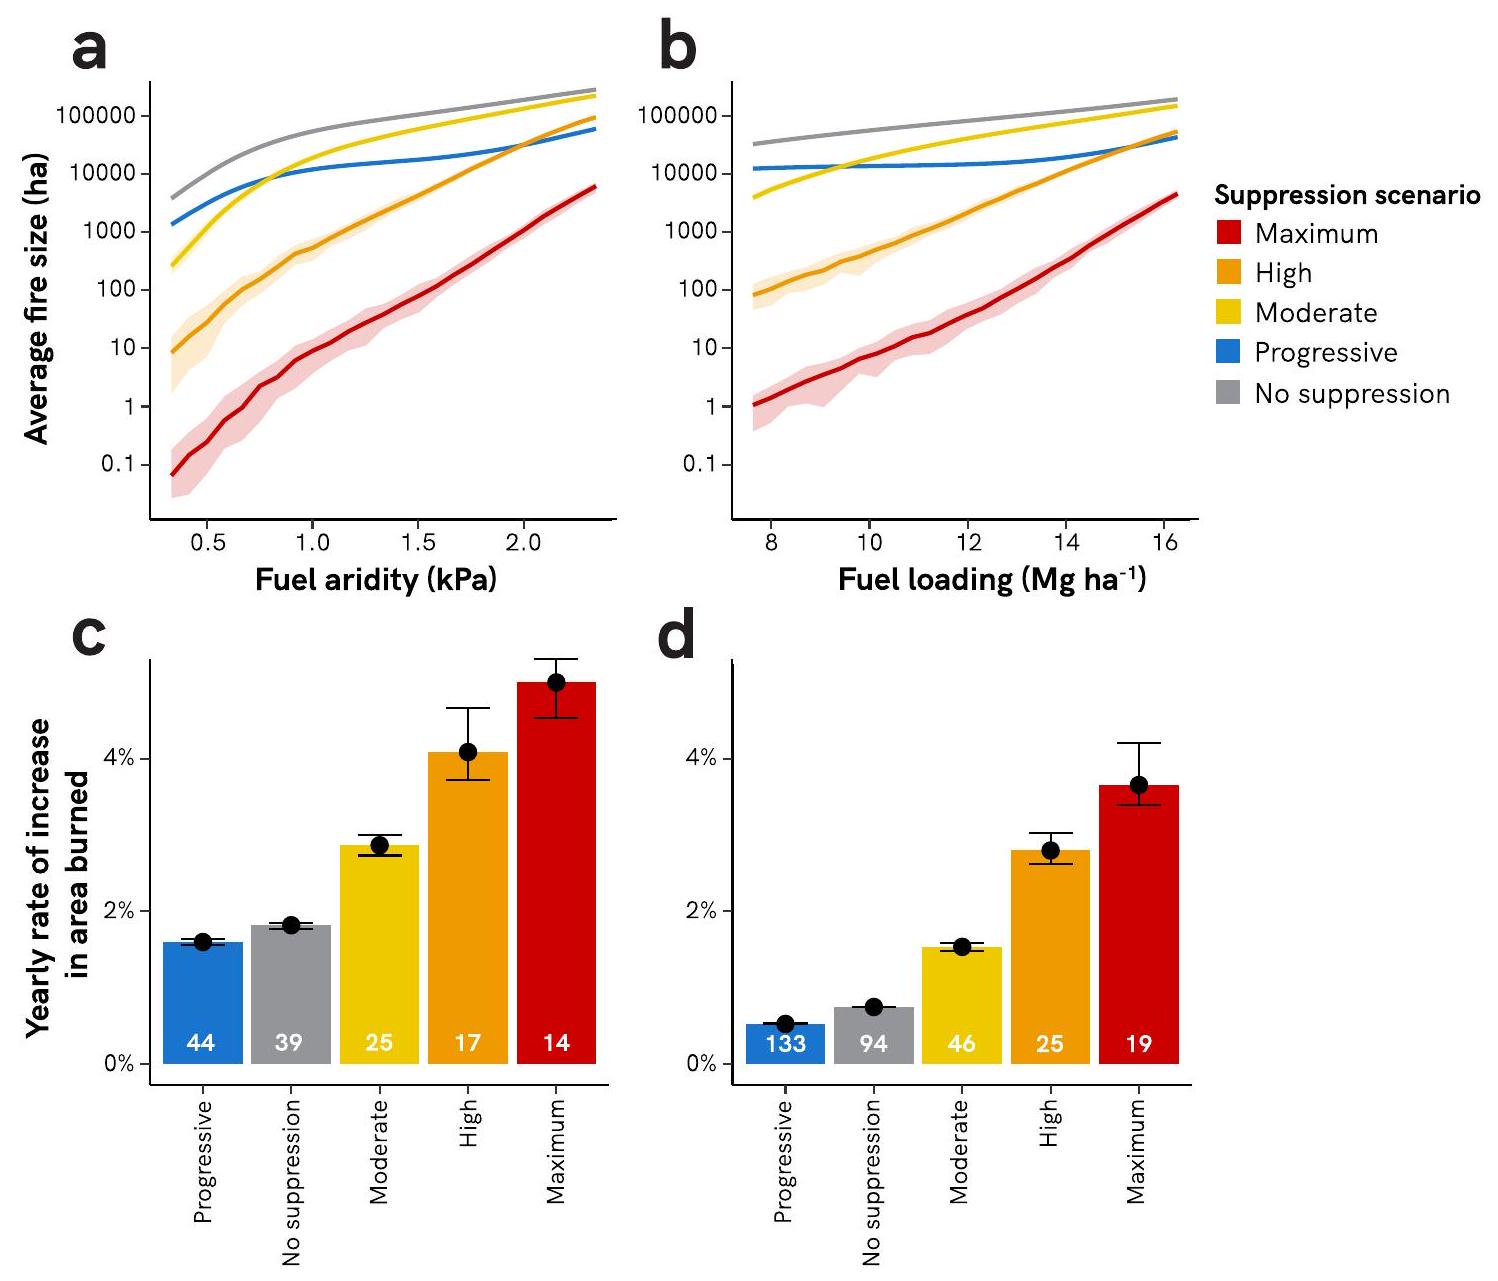
While increasing fuel aridity and fuel loading led to a rise in area burned for wildfires under all scenarios (i.e., suppression or not), fires under the regressive suppression scenarios displayed higher sensitivity to increasing fuel aridity and fuel loading (Fig. 3). Across the gradient of increasing fuel aridity, area burned under the Maximum suppression scenario increased by per year, compared to only per year for wildfires under the no-suppression scenario. Thus, across the 240-year range of increased fuel aridity, yearly burned area doubled nearly three times as fast under Maximum fire suppression, compared to scenarios without fire suppression (i.e., 14 vs. 39 years). This difference was even more marked under increasing fuel loading: area burned under the Maximum suppression scenario increased by per year, compared to only per year for wildfires that were not suppressed (Fig. 3). Thus, across the 240-year range of increased fuel loading, yearly burned area doubled over five times faster under Maximum suppression, compared to scenarios without fire suppression (i.e., 19 vs. 94 years). Fires simulated under the Progressive suppression scenario had the lowest sensitivity to increasing fuel aridity and fuel loading of any suppression strategy, including no suppression. Yearly burned area doubled every 44 years across the simulated increases in fuel aridity, and only every 133 years across the simulated gradient of fuel accumulation. Patterns were similar for area burned at high severity, with regressive scenarios leading to faster proportional increases in area burned and the Progressive scenario maintaining the slowest increase in area burned (Supplementary Fig. S1).
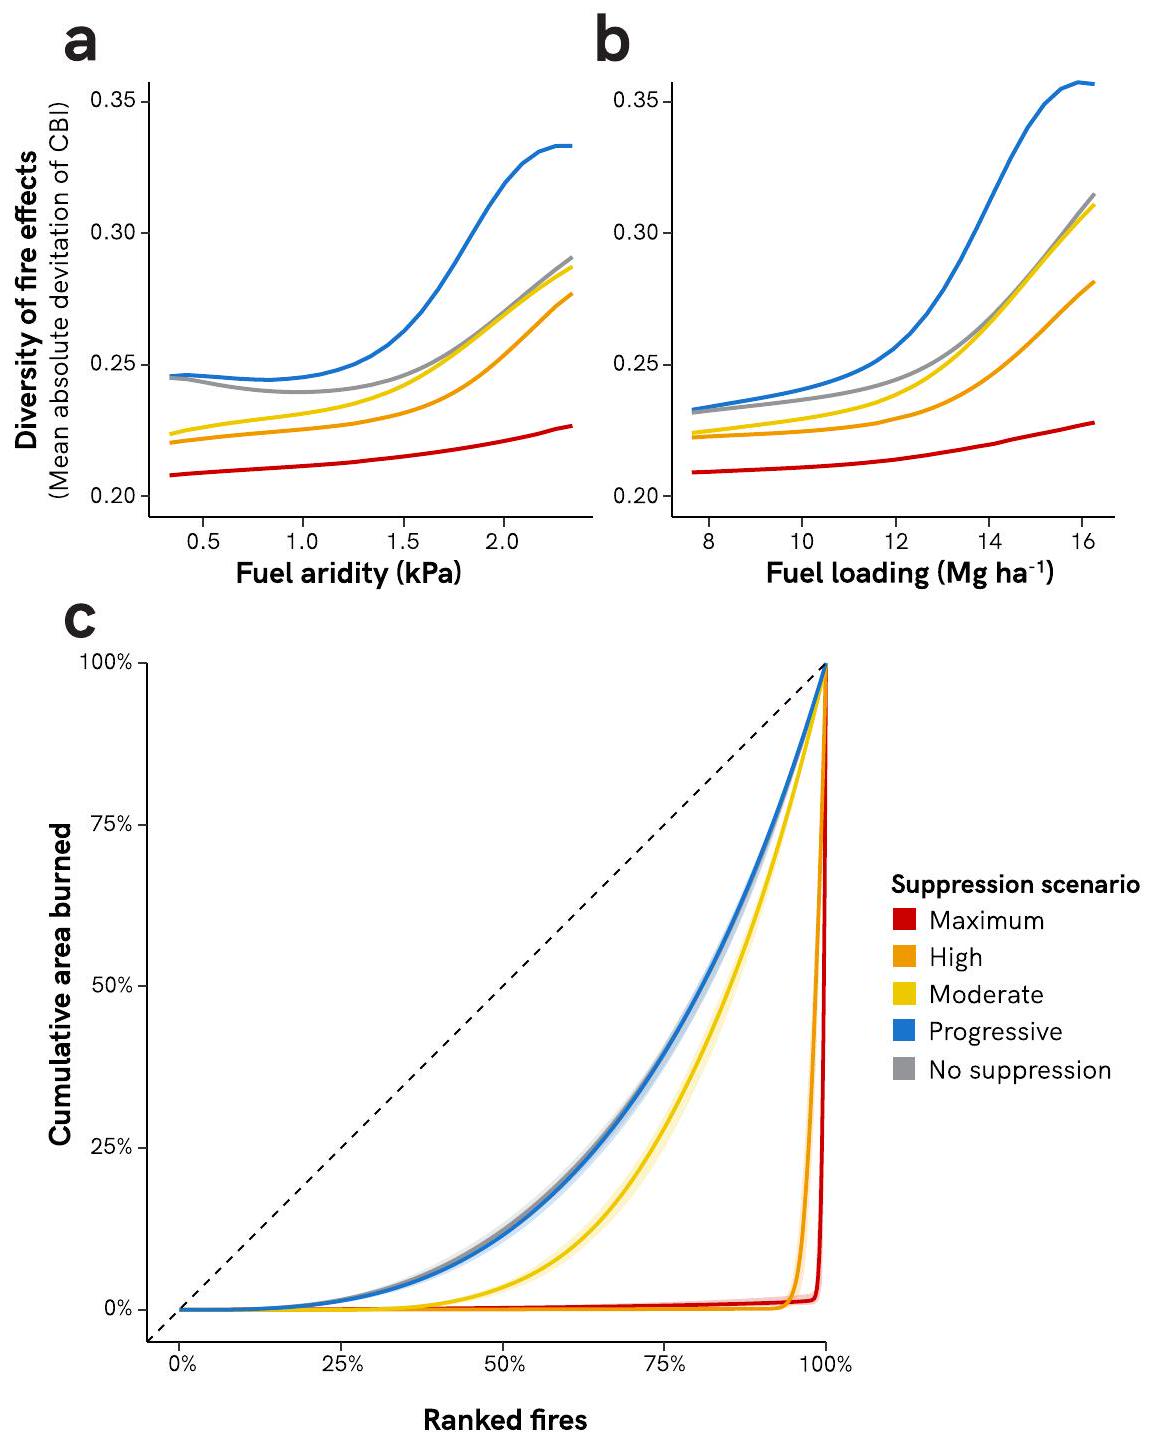
Regressive fire suppression decreases the diversity of fire effects Relative to unsuppressed fires, regressive suppression decreased the diversity of fire effects (i.e., diversity of burn severity) at all levels of fuel aridity and fuel loading values (Fig. 4). In the Maximum
suppression scenario, of fires were contained under 121 ha ( 300 ac ) for all but the most extreme levels of fuel aridity and loading (Supplementary Fig. S2). Under the regressive fire suppression scenarios, a higher proportion of area burned came from a small proportion of extreme fires (Fig. 4c). For example, under the Maximum suppression scenario, 91% of the area burned came from the largest 1% of fires, compared to only of the area burned that came from the largest 1% of fires under the scenario of no fire suppression. In contrast, under the Progressive fire suppression scenario, fires had the highest diversity of fire effects across the entire range of fuel aridity and fuel loading values, with especially pronounced increases in diversity under more extreme conditions. Progressive suppression also led to fires with the most even distribution of area burned across fires of any suppression scenario (Fig. 4c).
Discussion
We show with a simulation experiment how decades of regressive fire suppression have likely contributed to observed rates of increased burned area and high-severity area burned, independent of climate change and fuel accumulation. While some wildfires have always burned under extreme conditions and at high severity, the fire suppression bias magnifies the proportional representation of these fires by removing fires that would have burned with low or moderate severity (Supplementary Fig. S3). The result is akin to the overprescription of antibiotics: in our attempt to eliminate all fires, we have
only eliminated the less intense fires (that may best align with management objectives such as fuel reduction ) and instead selected for primarily the most extreme events (suppression bias) and created higher fuel loads and more “suppression-resistant” fires (suppression paradox). Through regressive fire suppression, we are effectively bringing a more severe future to the present-experiencing average fire severities that would not otherwise happen for a century. Our findings suggest that the abnormally high proportions of high-severity fire witnessed in many areas globally (e.g. refs. 48-51), is due, in part, to the influence of the suppression bias itself.
The suppression bias also has profound impacts on society and social perceptions of fire. By disproportionately removing fires with desirable impacts , regressive fire suppression ensures that most people interact with wildfires that burn during extreme events. This in turn makes it less likely for individuals to value the beneficial aspects of less-extreme fires, and less likely to support or desire active fire management , further exacerbating the suppression bias .
Though regressive suppression keeps many fires at small sizes (Supplementary Fig. S2) and reduces the absolute amount of burned area (relative to a world with no suppression), in the face of climate change and fuel accumulation, it counter-intuitively leads to a higher relative rate of increasing area burned over time. This is because regressive suppression amplifies the difference between the amount of fire that burns under less fire-conducive climates (e.g., in the recent past) and how much will burn despite heavy suppression under more
Fig. 3 | Effects of fire suppression on burned area increase. Panels and show trends in average fire size across ranges of fuel aridity and fuel loading. Fuel loading in panel depicts 100-h surface fuel loading values. Yearly rates of increase in panels and are calculated with a yearly increase in fuel aridity of or a yearly increase in fuel accumulation ( fuel accumulation rate) of 0.036 Mg , respectively. White numbers at the base of bars are the doubling time, in
years, of burned area. Variability across the 40 simulation replications is shown with 95% confidence intervals (a and b; too small to see on some curves) or error bars ( and ). Simulations across the fuel aridity range were run at a constant surface fuel loading of ; simulations across the fuel loading range were run at constant mean fire season vapor pressure deficit of 1.17 kPa .
fire-conducive future climates. For example, across simulated climate change, area burned doubled nearly twice as quickly under regressive suppression, compared to not suppressing fires at all. Our work thus suggests that observed high rates of increasing area burned around the world (e.g. refs. 3,53) are at least partially driven by the suppression bias. People and societies are adapted to what they experience to be “normal,” and deviations from this baseline require adaptation; by causing the baseline to shift at an even faster rate, regressive suppression further heightens the stress on societies responding to changing conditions .
The fire suppression bias also has fundamental effects on the longstanding ecological and evolutionary role of fire in terrestrial ecosystems . Fire suppression not only reduces how often plants and animals are exposed to fire, which is detrimental to fire-dependent organisms , but it also guarantees that a greater proportion of these encounters are with high-intensity fire. By preferentially removing lowintensity fire through regressive suppression, we have likely shifted the selective pressures of natural selection, unintentionally favoring traits that confer resistance or resilience to high-intensity fire over traits supporting persistence through lower-intensity fire. Fire is also an important catalyst for community reorganization and adaptation in the face of changing environmental conditions such as global
warming . However, by reducing the prevalence of fire, suppression limits opportunities for reorganization; instead, ecosystems accumulate inertia from the current species composition and structure, which may not be well-aligned to future conditions . Furthermore, because regressive suppression biases fire toward more severe conditions, with decreased seed and propagule availability and more stressful post-fire climatic environments, any reorganization that does occur is more likely to lead to state-shifts .
We demonstrate that progressive suppression leads to less extreme simulated fire behavior and effects. Indeed, empirical data from protected areas (which tend to have lower rates of suppression and may represent the closest existing examples to progressive suppression) show lower fire severities and a greater diversity of fire effects , consistent with our conclusions. In our simulations, fires under the Progressive suppression scenario had equivalent fire severity to unsuppressed fires burning under less fire-conducive con-ditions-in other words, effectively reversing the impacts of climate change or fuel accumulation by one to nearly two decades. Area burned under the Progressive suppression scenario also doubled much slower in response to climate change, compared to regressive suppression scenarios. A society living under progressive suppression would be less stressed by climate change, as their perceived “normal”
Fig. 4 | Effects of fire suppression on diversity of fire effects. Panels and show the effects of fire suppression on the diversity of fire effects across ranges of fuel aridity and fuel loading. Diversity of fire effects is calculated as the mean absolute deviation of fire severity (CBI) sensu Steel and colleagues . Fuel loading in panel b depicts 100 -h surface fuel loading values. Simulations across the fuel aridity range were run at a constant surface fuel loading of ; simulations across the fuel loading range were run at constant mean fire season vapor pressure
deficit of 1.17 kPa . c Lorenz curves for each suppression scenario; fires are ranked by increasing area burned. Simulations run at mean seasonal vapor pressure deficit of 1.17 kPa and fuel loading of ( fuel load). The dashed line represents hypothetical fire activity where the area burned is spread equally across all fire days. Variability across the 40 simulation replications is shown with confidence intervals but which are too small to see for some curves.
conditions would change half as fast. By allowing more lower-intensity fire, progressive suppression could buy time, helping societies and ecosystems adapt to climate change .
Our simulations are grounded in fundamental physical aspects of fire behavior and reveal important and underappreciated consequences of fire suppression; however, our model is not intended to predict fine-scale fire behavior. For example, we did not incorporate spatial variability in topography, wind direction, or fuel loading within any individual fire. Additionally, each modeled fire is unaffected by fires that have occurred in prior years (i.e., the model does not incorporate the effects of the fire suppression paradox; Table 1). This may make our results a conservative estimate of the total impact of regressive suppression, since landscapes under regressive suppression would accumulate fuel faster than those with no suppression, further heightening the difference in fire intensity.
While our model includes practical implementations of suppression , it does not incorporate dynamic resource allocation
as the number of fires increase across a landscape. This means it does not explicitly account for scenarios where suppression resources are depleted from numerous fires burning simultaneously, such as during National Wildland Fire Preparedness Level 5 in the U.S. . Consequently, the simulation may overestimate suppression effectiveness and underestimate suppressed fire sizes in these conditions. However, the model assumes near-complete ineffectiveness of suppression during extreme weather events when fire intensity is high (Fig. 1b), effectively incorporating resource scarcity. Regardless, in conditions when fire suppression is effective, our results show that it inherently biases resulting fire patterns.
Our model generates patterns of fire behavior that align with empirical data. For example, burned area patterns under Maximum suppression (e.g., nearly all fires contained before reaching 121 ha ( 300 ac); 1% of fires accounting for 91% of area burned) closely resemble long-term trends observed in the U.S. (97-99% of fires contained before reaching 121 ha ( 300 ac); 1% of fires accounting for 98% of area
burned ). Thus, our results reveal important general expectations of the impacts of fire suppression, relevant to any flammable location worldwide where suppression is used. Future empirical work can test these expected impacts across a variety of ecological and cultural settings.
Although safely allowing low- and moderate-intensity fire is essential for learning to co-exist with wildfire , implementing progressive suppression faces a range of challenges that span socialecological systems . Numerous land management agencies have ingrained cultures and policies that incentivize regressive fire suppression , and shifts in management may be hampered by a lack of trust and support from the public , in addition to the widespread public expectation that all wildfires should be suppressed . Progressive suppression would let low-intensity fire spread relatively unencumbered, while more strongly suppressing higher-intensity fire -a management approach that may not always be practical, safe, or possible. Additionally, the operating space for progressive suppression (i.e., maintaining a gradient where higher-intensity fire is more heavily suppressed than lower-intensity fire) is increasingly constrained as conditions become more fire-conducive (Supplementary Fig. S4), and as more valued human resources are built in flammable environments . Finally, while lower- and moderate-intensity fires can reduce the smoke-related health impacts of large, high-intensity wildfires , moving toward progressive suppression would likely increase the frequency of low-level smoke emissions, much like the increased use of prescribed fire . As such, paradigm shifts in fire management would necessitate public health interventions at all levels: from individual behavioral strategies to public policies and community resources (e.g., facilitating the use of publicly available airquality data, subsidizing or providing high efficiency particulate air [HEPA] air filters, and creating publicly accessible clean-air spaces) .
Even when and where progressive suppression is infeasible, our results show that less aggressive implementations of regressive suppression (e.g., moving from Maximum to Moderate suppression, analogous to calls for increased fire use ) can dramatically reduce the suppression bias. Adaptive management frameworks that facilitate risk-informed differences in management approaches (e.g., the PODs framework ) could likewise help lessen the impact of the suppression bias. For example, such fire management could implement regressive suppression approaches when necessary (e.g., near human infrastructure) and progressive or no suppression approaches when and where more feasible. Finally, intentional fires (i.e., prescribed fires and cultural burning; Fig. 1) also play an important role in tandem with progressive suppression . While these practices support a range of values on their own , they also facilitate the implementation of progressive suppression strategies by introducing low-intensity fire and creating landscape heterogeneity.
We demonstrate that the suppression bias is a major driver of fire activity and ecological impacts. While the negative impacts of fuel accumulation are commonly recognized as an indirect consequence of fire suppression, integrating the impacts of the suppression bias would improve our understanding of fire-human relationships, and ongoing changes in fire activity. Part of the solution to coexisting with wildfire now and into the future requires developing and applying technologies and approaches that allow us to safely manage wildfires under moderate burning conditions. Arguably, this will be as effective as other needed interventions, such as mitigating global warming, minimizing unintentional human-related ignitions, and modifying forest structure to reduce fire severity when fires occur.
Methods
Our model simulates individual fire events independently, and it is not intended to represent a specific real-world landscape. All models are tradeoffs between fine-scale precision and large-scale
generalizability , and we designed our simulation approach to be generalizable while incorporating fundamental physical aspects of fire behavior. We use a wide range of fuel loading and climate parameters, to both demonstrate the global applicability of our results and address the variability and uncertainty inherent in complex real-world environments and demonstrate that the consequences of the suppression bias are not unique to a specific biophysical setting (i.e., a fire regime). The parameters and simulations described below are generally informed by variables and ranges of variability representing forest ecosystems in western North America. Full details are provided in the Supplementary Information (Supplementary Methods).
Simulating ignitions & fire spread
For each fire, we randomly chose an ignition day from a hypothetical 150-day fire season. Ignitions could smolder for up to three days, during which fire spread would occur if the daily fuel moisture was less than the moisture of extinction ( ). If fuel moisture never fell below during this three-day period, the ignition was assumed to be extinguished naturally.
We assumed elliptical fire shape and modeled daily fire growth based on Huygens’ principle , which assumes that the growth of each point on the fire perimeter can be independently modeled as an expanding ellipse. The shape of this ellipse becomes longer and narrower at higher wind speeds (Supplementary Fig. S5). We modeled daily heading-direction fire spread rate, using the rothermel function in the R package firebehavio , which incorporates potential transitions to crown fire spread (Supplementary Fig. S5). We converted the modeled heading-direction fire spread rates to elliptical expansion factors and distances at any angle from the ignition (Supplementary Methods). We calculated two metrics of fire intensity-fireline intensity and flame length-using equations from the rothermel function in the R package firebehavioR and extended them to elliptical fireline intensity using equations of Catchpole and colleagues . We estimated fire severity by linking flame length to estimated tree mortality from mixed-conifer ecosystems and finally to Composite Burn Index (CBI), a measure of fire-caused vegetation mortality and soil organic matter consumption .
Simulating suppression
We tested several different suppression scenarios: three regressive suppression scenarios (Moderate, High, Maximum), one progressive suppression scenario (Progressive), and one control scenario (No suppression). We simulated suppression of fires with a two-step process: 1) initial attack, and 2) subsequent suppression of fires that escape initial attack . To simulate initial attack success, we used a modeled relationship from Hirsch and colleagues that estimates the probability of escape as a function of heading fireline intensity and fire size at the time of initial engagement. For regressive suppression scenarios, we stochastically simulated whether initial attack was successful (i.e., the fire was fully contained) using different times of initial engagement, and thus fire size (Moderate ; High ; Maximum ). For the progressive suppression scenario, we assumed ignitions were managed without any initial attack but with subsequent suppression. For fires where initial attack was not successful, we modeled subsequent suppression using suppression functions to relate fireline intensity to the expected proportion of fire suppressed (Fig. 1b). The Maximum suppression filter roughly equates to the maximum possible effectiveness of on-the-ground fire suppression efforts, where suppression becomes virtually impossible above a certain fireline intensity .
We calculated daily elliptical distance burned under each suppression scenario as the unsuppressed distance burned (with the assumption that fire actively spread for half of the day length) multiplied by the proportion of fire remaining after suppression. Points on the ellipse were considered permanently extinguished if the daily
distance burned was less than 5 m . Other points on the ellipse could continue burning, and a fire was not considered extinguished until points at all angles were extinguished or until after the day of the fire season. Supplementary Fig. S6 shows the daily fire weather and progression of burning for an example ignition, across all suppression scenarios.
Fire behavior model inputs
For each ignition, we simulated daily fire weather: windspeed and temporally autocorrelated live and dead fuel moistures. We modeled daily windspeeds as arising from a Weibull distribution, with a single wind direction for each fire event. We simulated canopy fuel moisture as varying temporally across a sinusoidal seasonal trend. We also simulated daily live and dead surface fuel moisture (i.e., 1 -, 10-, and fuel moisture, live woody and herbaceous fuel moisture) using a sinusoidal seasonal trend around a mean seasonal fuel aridity value, with random variation in amplitude and daily, temporally autocorrelated fluctuations. For a given ignition, we assumed a terrain slope of and uniform and continuous fuel loading, meaning that simulated fires never experienced fuel breaks and would continue burning as long as weather conditions allowed for fire spread.
We ran simulations across ranges of mean fuel aridity and fuel loading to emulate changes in both time (i.e., climate change, fuel accumulation) and space (i.e., moving from one climatic region or forest type to another). Fuel aridity and fuel loading ranges spanned 240 years of modeled climate change or fuel accumulation in the Western U.S., respectively. To estimate a rate of yearly fuel aridity change under an RCP 8.5 climate change scenario, we used Ficklin & Novick’s projected median increase in summer vapor pressure deficit (VPD) of 0.72 kPa for the continental U.S. from the historical period (1979-2013; midpoint 1996) to the future period (2065-2099; midpoint 2082) to calculate a mean annual increase between midpoint years of . Because fire spread models are input with fuel moisture, we converted VPD to dead fuel moisture, using a statistical relationship parameterized with gridMET data from across Western U.S. temperate conifer forests. To estimate plausible yearly increases in fuel loading, we estimated the slope of modeled dead wood carbon accumulation (i.e., the difference in fuel loads between suppressed and unsuppressed model scenarios) in the Western U.S. from 1980-2010 from Boisramé and colleagues . We assumed that carbon made up of total fuel weight and that fuels comprised 50% of all dead fuels (in keeping with ratios of Fuel Model ), yielding a yearly 100-h fuel load increase of .
Simulation structure
We ran simulations where we varied either mean fuel aridity or fuel loading, while holding the other at constant mean values. A single simulation replicate involved 1000 ignitions, each of which had a unique, randomly simulated ignition day and timeseries of fuel moisture values and windspeeds (i.e., weather scenario). Using this ignition-day and weather scenario, we then simulated fire spread independently for either 1) all levels of fuel loading, while holding mean fire season fuel aridity constant (VPD of 1.17 kPa ), or 2 ) all levels of mean fuel aridity, while holding fuel loading constant (100-h fuel loading of ). For each of these simulated fire-spread events, we also modeled all four scenarios of fire suppression (Maximum, High, Moderate, and Progressive) in addition to the nosuppression scenario. We then replicated a single simulation 40 times, for a total of 5 million simulated fires across each range of mean fuel aridity or fuel loading ( 1000 ignitions levels of fuel aridity or fuel loading levels of suppression replicates).
Summarizing the cumulative impacts of fire suppression
To assess the effect of fire suppression on patterns of fire severity, for each fire we calculated the proportion that burned at high severity (CBI
values ; sensu Parks & Abatzoglou ) and the weighted mean fire severity. For each simulation we calculated the required change in mean fuel aridity or fuel load for fires with no suppression to yield the same fire severity as suppressed fires. We divided this value by estimated yearly rates of change in mean fuel aridity and fuel loading, to evaluate how many years of climate change or fuel accumulation it would take for unsuppressed fires to burn at the same mean fire severity. To investigate how fire suppression affected patterns of burned area, we calculated the total area burned for each fire. For each simulation, we also calculated the average multiplicative yearly rate of increase ( ) in burned area across the 240-year ranges of fuel aridity and fuel loading. We calculated the diversity of fire severity for each fire using the method detailed by Steel and colleagues , with CBI as the single input fire trait-which is equivalent to the mean absolute deviation of CBI values. We investigated how equally burned area was spread across fires by calculating Lorenz curves of area burned under each suppression scenario.
Within a replicate (i.e., 1000 ignitions fuel aridity or fuel loading levels), for each suppression scenario we calculated the mean values for parameters of interest, at each level of fuel aridity or fuel loading. We then calculated overall means across the 40 simulation replications and used confidence intervals to display variability. We conducted all simulation and analysis in .
Balch, J. K. et al. Warming weakens the night-time barrier to global fire. Nature 602, 442-448 (2022).
Ellis, T. M., Bowman, D. M. J. S., Jain, P., Flannigan, M. D. & Williamson, G. J. Global increase in wildfire risk due to climate-driven declines in fuel moisture. Glob. Change Biol. 28, 1544-1559 (2022).
Bowman, D. M. J. S. et al. Vegetation fires in the Anthropocene. Nat. Rev. Earth Environ. 1, 500-515 (2020).
Xu, R. et al. Wildfires, Global Climate Change, and Human Health. N. Engl. J. Med. 383, 2173-2181 (2020).
Iglesias, V. et al. Fires that matter: reconceptualizing fire risk to include interactions between humans and the natural environment. Environ. Res. Lett. 17, 045014 (2022).
Higuera, P. E., Abatzoglou, J. T., Littell, J. S. & Morgan, P. The Changing Strength and Nature of Fire-Climate Relationships in the Northern Rocky Mountains, U.S.A., 1902-2008. PLOS One 10, e0127563 (2015).
Godfree, R. C. et al. Implications of the 2019-2020 megafires for the biogeography and conservation of Australian vegetation. Nat. Commun. 12, 1023 (2021).
Moreira, F. et al. Wildfire management in Mediterranean-type regions: paradigm change needed. Environ. Res. Lett. 15, 011001 (2020).
Shive, K. L. et al. Ancient trees and modern wildfires: Declining resilience to wildfire in the highly fire-adapted giant sequoia. For. Ecol. Manag. 511, 120110 (2022).
North, M. P. et al. Reform forest fire management. Science 349, 1280-1281 (2015).
Stephens, S. L. et al. Managing Forests and Fire in Changing Climates. Science 342, 41-42 (2013).
US Forest Service. Confronting the Wildfire Crisis: A Strategy for Protecting Communities and Improving Resilience in America’s Forests (US Department of Agriculture Forest Service Fire and
Aviation Management and Department of the Interior Office of Wildland Fire, 2022).
13. Spreading like Wildfire: The Rising Threat of Extraordinary Landscape Fires. UNEP – UN Environment Programme (UNEP2, O22).
14. Calkin, D. E. et al. Wildland-urban fire disasters aren’t actually a wildfire problem. Proc. Natl Acad. Sci. 120, e2315797120 (2023).
15. Jones, M. W. et al. Global and Regional Trends and Drivers of Fire Under Climate Change. Rev. Geophys. 60, e2020RG000726 (2022).
16. Abatzoglou, J. T., Williams, A. P. & Barbero, R. Global Emergence of Anthropogenic Climate Change in Fire Weather Indices. Geophys. Res. Lett. 46, 326-336 (2019).
17. Miller, J. D., Safford, H. D., Crimmins, M. & Thode, A. E. Quantitative Evidence for Increasing Forest Fire Severity in the Sierra Nevada and Southern Cascade Mountains, California and Nevada, USA. Ecosystems 12, 16-32 (2009).
18. Roos, C. I. et al. Fire Suppression Impacts on Fuels and Fire Intensity in the Western U.S.: Insights from Archaeological Luminescence Dating in Northern New Mexico. Fire 3, 32 (2020).
19. Balch, J. K. et al. Human-started wildfires expand the fire niche across the United States. Proc. Natl Acad. Sci. 114, 2946-2951 (2017).
20. Fried, J. S. et al. Predicting the effect of climate change on wildfire behavior and initial attack success. Clim. Change 87, 251-264 (2008).
21. Arienti, M. C., Cumming, S. G. & Boutin, S. Empirical models of forest fire initial attack success probabilities: the effects of fuels, anthropogenic linear features, fire weather, and management. Can. J. Res. 36, 3155-3166 (2006).
22. Bowman, D. M. J. S., O’Brien, J. A. & Goldammer, J. G. Pyrogeography and the Global Quest for Sustainable Fire Management. Annu. Rev. Environ. Resour. 38, 57-80 (2013).
23. Plucinski, M. P. Fighting Flames and Forging Firelines: Wildfire Suppression Effectiveness at the Fire Edge. Curr. Forestry Rep. 5, 1-19 (2019).
24. Plucinski, M. P. Contain and Control: Wildfire Suppression Effectiveness at Incidents and Across Landscapes. Curr. Forestry Rep. 5, 20-40 (2019).
25. Berkey, J. K., Miller, C. & Larson, A. J. A history of wilderness fire management in the Northern Rockies. Gen. Tech. Rep. RMRS-GTR428. (U.S. Department of Agriculture, Forest Service, Rocky Mountain Research Statio, 2021).
26. Dodge, M. Forest Fuel Accumulation-A Growing Problem. Science 177, 139-142 (1972).
27. Parisien, M.-A. et al. Fire deficit increases wildfire risk for many communities in the Canadian boreal forest. Nat. Commun. 11, 2121 (2020).
28. Arno, S. F. & Brown, J. K. Overcoming the paradox in managing wildland fire. West. Wildlands 17, 40-46 (1991).
29. Ingalsbee, T. Whither the paradigm shift? Large wildland fires and the wildfire paradox offer opportunities for a new paradigm of ecological fire management. Int. J. Wildl. Fire 26, 557-561 (2017).
30. Parsons, D. J. & DeBenedetti, S. H. Impact of fire suppression on a mixed-conifer forest. For. Ecol. Manag. 2, 21-33 (1979).
31. Schoennagel, T., Veblen, T. T. & Romme, W. H. The Interaction of Fire, Fuels, and Climate across Rocky Mountain Forests. BioScience 54, 661-676 (2004).
32. Steel, Z. L., Safford, H. D. & Viers, J. H. The fire frequency-severity relationship and the legacy of fire suppression in California forests. Ecosphere 6, art8 (2015).
33. Calkin, D. E., Thompson, M. P. & Finney, M. A. Negative consequences of positive feedbacks in US wildfire management. Ecosyst. 2, 9 (2015).
34. Katuwal, H., Calkin, D. E. & Hand, M. S. Production and efficiency of large wildland fire suppression effort: A stochastic frontier analysis. J. Environ. Manag. 166, 227-236 (2016).
35. Silva, F. R. Y., O’Connor, C. D., Thompson, M. P., Martinez, J. R. M., & Calkin, D. E., Modelling suppression difficulty: Current and future applications. Int. J. Wildl. Fire. https://doi.org/10.1071/ WF19042 (2020).
36. Andrews, P. Heinsch, F., Schelvan, L. How to Generate and Interpret Fire Characteristics Charts for Surface and Crown Fire Behavior (USDA Forest Service – General Technical Report RMRS-GTR, 2011).
37. Calkin, D. E., Cohen, J. D., Finney, M. A. & Thompson, M. P. How risk management can prevent future wildfire disasters in the wildlandurban interface. Proc. Natl Acad. Sci. 111, 746-751 (2014).
38. Miller, C. & Aplet, G. H. Progress in Wilderness Fire Science: Embracing Complexity. J. Forestry 114, 373-383 (2016).
39. Seielstad, C. Reconside ring wildland fire use: Perspectives from the Northern Rockies. In Proceedings of the large wildland fires conference. (eds. Keane, R.E., Jolly, M., Parsons, R., Riley, K.) 73, 207-212 (U.S. Department of Agriculture, Forest Service, Rocky Mountain Research Station, 2015).
40. Miller, C. The hidden consequences of fire suppression. Park Sci. 28, 75-80 (2012).
41. Daniels, M. C. et al. Multiple social and environmental factors affect wildland fire response of full or less-than-full suppression. J. Environ. Manag. 351, 119731 (2024).
42. St. Denis, L. A. et al. All-hazards dataset mined from the US National Incident Management System 1999-2020. Sci. Data 10, 112 (2023).
43. Steel, Z. L., Collins, B. M., Sapsis, D. B. & Stephens, S. L. Quantifying pyrodiversity and its drivers. Proc. R. Soc. B Biol. Sci. 288, 20203202 (2021).
44. Ficklin, D. L. & Novick, K. A. Historic and projected changes in vapor pressure deficit suggest a continental-scale drying of the United States atmosphere. J. Geophys. Res. Atmos. 122, 2061-2079 (2017).
45. Boisramé, G. F. S., Brown, T. J. & Bachelet, D. M. Trends in western USA fire fuels using historical data and modeling. Fire Ecol. 18, 8 (2022).
46. Key, C. H. & Benson, N. C. Landscape Assessment: Sampling and Analysis Methods. USDA Forest Service General Technical Report RMRS-GTR-164-CD, 55 (SDA Forest Service, 2006).
47. Prichard, S. J. et al. Adapting western North American forests to climate change and wildfires: 10 common questions. Ecol. Appl. 31, eO2433 (2021).
48. Reilly, M. J. et al. Contemporary patterns of fire extent and severity in forests of the Pacific Northwest, USA (1985-2010). Ecosphere 8, e01695 (2017).
49. Williams, J. N., Safford, H. D., Enstice, N., Steel, Z. L. & Paulson, A. K. High-severity burned area and proportion exceed historic conditions in Sierra Nevada, California, and adjacent ranges. Ecosphere 14, e4397 (2023).
50. Collins, L. et al. The 2019/2020 mega-fires exposed Australian ecosystems to an unprecedented extent of high-severity fire. Environ. Res. Lett. 16, 044029 (2021).
51. Fernández-García, V. & Alonso-González, E. Global Patterns and Dynamics of Burned Area and Burn Severity. Remote Sens. 15, 3401 (2023).
52. Borrie, W., McCool, S. & Whitmore, J. Wildland Fire Effects on Visits and Visitors to the Bob Marshal Wilderness Complex. Int. J. Wilderness 12, 32-38 (2006).
53. Parks, S. A. & Abatzoglou, J. T. Warmer and Drier Fire Seasons Contribute to Increases in Area Burned at High Severity in Western US Forests From 1985 to 2017. Geophys. Res. Lett. 47, e2020GL089858 (2020).
54. Schoennagel, T. et al. Adapt to more wildfire in western North American forests as climate changes. PNAS 114, 4582-4590 (2017).
55. Kais, S. M. & Islam, M. S. Community Capitals as Community Resilience to Climate Change: Conceptual Connections. Int. J. Environ. Res. Public Health 13, 1211 (2016).
56. Keeley, J. E., Pausas, J. G., Rundel, P. W., Bond, W. J. & Bradstock, R. A. Fire as an evolutionary pressure shaping plant traits. Trends Plant Sci. 16, 406-411 (2011).
57. Tubbesing, C. L., York, R. A., Stephens, S. L. & Battles, J. J. Rethinking fire-adapted species in an altered fire regime. Ecosphere 11, e03091 (2020).
58. Seidl, R. & Turner, M. G. Post-disturbance reorganization of forest ecosystems in a changing world. Proc. Natl Acad. Sci. 119, e2202190119 (2022).
59. Hagmann, R. K. et al. Evidence for widespread changes in the structure, composition, and fire regimes of western North American forests. Ecol. Appl. 31, e02431 (2021).
60. Young, D. J. N. et al. Post-fire forest regeneration shows limited climate tracking and potential for drought-induced type conversion. Ecology 100, e02571 (2019).
61. Larson, A. J. et al. Tamm Review: Ecological principles to guide post-fire forest landscape management in the Inland Pacific and Northern Rocky Mountain regions. For. Ecol. Manag. 504, 119680 (2022).
62. Harvey, B. J., Donato, D. C. & Turner, M. G. High and dry: post-fire tree seedling establishment in subalpine forests decreases with post-fire drought and large stand-replacing burn patches. Glob. Ecol. Biogeogr. 25, 655-669 (2016).
63. Coop, J. D. et al. Wildfire-Driven Forest Conversion in Western North American Landscapes. BioScience 70, 659-673 (2020).
64. Davis, K. T. et al. Reduced fire severity offers near-term buffer to climate-driven declines in conifer resilience across the western United States. Proc. Natl Acad. Sci. 120, e2208120120 (2023).
65. Haire, S., McGarigal, K., Miller, C. Wilderness shapes contemporary fire size distributions across landscapes of the western United States. Ecosphere 4, 1-20 (2013).
66. van Wagtendonk, J. W. & Lutz, J. A. Fire Regime Attributes of Wildland Fires in Yosemite National Park, USA. Fire Ecol. 3, 34-52 (2007).
67. Rivera-Huerta, H., Safford, H. D. & Miller, J. D. Patterns and Trends in Burned Area and Fire Severity from 1984 to 2010 in the Sierra de San Pedro Mártir, Baja California, Mexico. Fire Ecol. 12, 52-72 (2016).
68. Rothermel, R. C. A mathematical model for predicting fire spread in wildland fuels. Res. Pap. INT-115. (U.S. Department of Agriculture, Intermountain Forest and Range Experiment Station, 1972).
69. Hirsch, K. G., Corey, P. N. & Martell, D. L. Using Expert Judgment to Model Initial Attack Fire Crew Effectiveness. For. Sci. 44, 539-549 (1998).
70. Cullen, A. C., Axe, T. & Podschwit, H. High-severity wildfire potential – associating meteorology, climate, resource demand and wildfire activity with preparedness levels. Int. J. Wildland Fire 30, 30-41 (2020).
71. Calkin, D. E., Gebert, K. M., Jones, J. G. & Neilson, R. P. Forest service large fire area burned and suppression expenditure trends, 19702002. J. Forestry 103, 179-183 (2005).
72. Moritz, M. A. et al. Learning to coexist with wildfire. Nature 515, 58-66 (2014).
73. Olsen, C. S., Sharp, E., Olsen, C. S. & Sharp, E. Building community-agency trust in fire-affected communities in Australia and the United States. Int. J. Wildland Fire 22, 822-831 (2013).
74. Steelman, T. A. & McCaffrey, S. Best practices in risk and crisis communication: Implications for natural hazards management. Nat. Hazards 65, 683-705 (2013).
75. Long, J. et al., Comparing smoke emissions and impacts under alternative forest management regimes. Ecol. Soc. 27, 26-42 (2022).
76. Schultz, C. A. et al. Policy barriers and opportunities for prescribed fire application in the western United States. Int. J. Wildland Fire 28, 874-884 (2019).
77. US Environmental Protection Agency (EPA). Wildfire Smoke: A Guide for Public Health Officials (US Environmental Protection Agency, 2021).
78. Thompson, M. P. et al. Potential operational delineations: new horizons for proactive, risk-informed strategic land and fire management. Fire Ecol. 18, 17 (2022).
79. Hoffman, K. M. et al. Conservation of Earth’s biodiversity is embedded in Indigenous fire stewardship. Proc. Natl Acad. Sci. 118, e2105073118 (2021).
80. Lake, F. K. et al. Returning Fire to the Land: Celebrating Traditional Knowledge and Fire. J. Forestry 115, 343-353 (2017).
81. Levins, R. The Strategy of Model Building in Population Biology. Am. Scientist 54, 421-431 (1966).
82. Geary, W. L. et al. A guide to ecosystem models and their environmental applications. Nat. Ecol. Evol. 4, 1459-1471 (2020).
83. Finney, M. A., McAllister, S. S., Grumstrup, T. P., Forthofer, J. M. Wildland Fire Behaviour (CSIRO Publishing, 2021).
84. Anderson, D. H., Catchpole, E. A., Mestre, N. J. D. & Parkes, T. Modelling the spread of grass fires. ANZIAM J. 23, 451-466 (1982).
85. Ziegler, J. P., Hoffman, C. M. & Mell, W. firebehavioR: An R Package for Fire Behavior and Danger Analysis. Fire 2, 41 (2019).
86. Scott, J., Reinhardt, E. Assessing Crown Fire Potential by Linking Models of Surface and Crown Fire Behavior. Research Paper RMRSRP (USDA Forest Service, 2001).
87. Finney, M. A. FARSITE: Fire A rea Simulator-model development and evaluation. Res. Pap. RMRS-RP-4, Revis. 2004. (U.S. Department of Agriculture, Forest Service, Rocky Mountain Research Station, 1998)..
88. Catchpole, E. A., Mestre, N. D., Gill, A. Intensity of fire at its perimeter. Aust. For. Res. 12, 47-54 (1982).
89. Ryan, K. & Noste, N. Evaluating Prescribed Fires. In Proc. – Symposium and Workshop on Wilderness Fire 230-238 (USDA Forest Service Intermountain Forest and Range Experiment Station, 1985).
90. Abatzoglou, J. T. Development of gridded surface meteorological data for ecological applications and modelling. Int. J. Climatol. 33, 121-131 (2011).
91. Anderson, H. E. Aids to determining fuel models for estimating fire behavior. Gen. Tech. Rep. INT-122. (U.S. Department of Agriculture, Forest Service, Intermountain Forest and Range Experiment Station, 1982).
92. R Core Team. R: A language and environment for statistical computing (R Core Team, 2023).
93. Kreider, M. Scripts for manuscript “Fire suppression makes wildfires more severe and accentuates impacts of climate change and fuel accumulation.” Nat. Commun. https://doi.org/10.5281/zenodo. 10729478 (2024).
Acknowledgements
We thank Mark Finney and members of the University of Montana Systems Ecology Writing Seminar for suggestions that improved this work. This work was supported by a Graduate Research Fellowship from the National Science Foundation, award 1745048 (M.R.K.). Additional support came from the USDA Forest Service, Rocky Mountain Research Station, Aldo Leopold Wilderness Research Institute through agreement 19-JV-11221639-098 (M.R.K. and A.J.L.) and from the Department of the Interior North Central Climate Adaptation Science Center through Cooperative Agreement G18AC00325 from the United States Geological Survey (P.E.H.). The findings and conclusions in this publication are those of the authors and should not be construed to represent any official USDA, USGS, or U.S. Government determination or policy.
Author contributions
M.R.K., P.E.H., S.A.P. and A.J.L. designed research; M.R.K. wrote the model and ran computer simulations; M.R.K. analyzed data; M.R.K wrote the paper; M.R.K., P.E.H., S.A.P., W.L.R., N.W. and A.J.L. conducted review and editing.
Correspondence and requests for materials should be addressed to Mark R. Kreider.
Peer review information Nature Communications thanks Gabrielle Boisrame, Miguel Cruz, and the other, anonymous, reviewer for their contribution to the peer review of this work. A peer review file is available.
Publisher’s note Springer Nature remains neutral with regard to jurisdictional claims in published maps and institutional affiliations.
Open Access This article is licensed under a Creative Commons Attribution 4.0 International License, which permits use, sharing, adaptation, distribution and reproduction in any medium or format, as long as you give appropriate credit to the original author(s) and the source, provide a link to the Creative Commons licence, and indicate if changes were made. The images or other third party material in this article are included in the article’s Creative Commons licence, unless indicated otherwise in a credit line to the material. If material is not included in the article’s Creative Commons licence and your intended use is not permitted by statutory regulation or exceeds the permitted use, you will need to obtain permission directly from the copyright holder. To view a copy of this licence, visit http://creativecommons.org/ licenses/by/4.0/.
(c) The Author(s) 2024
Department of Forest Management, University of Montana, Missoula, MT 59812, USA. Department of Ecosystem and Conservation Sciences, University of Montana, Missoula, MT 59812, USA. Aldo Leopold Wilderness Research Institute, Rocky Mountain Research Station, USDA Forest Service, Missoula, MT 59801, USA. Department of Society and Conservation, University of Montana, Missoula, MT 59812, USA. Environmental Science and Natural Resource Journalism, University of Montana, Missoula, MT 59812, USA. Wilderness Institute, University of Montana, Missoula, MT 59812, USA.