إشارات STING في البلعميات تعزز التليف في تضيق مجرى الهواء الحميد عبر مسار IL6-STAT3 Macrophage STING signaling promotes fibrosis in benign airway stenosis via an IL6-STAT3 pathway
تعتبر الالتهابات الحادة والمزمنة من الأمراض الهامة لتليف تضيق مجرى الهواء الحميد (BAS)، وهو مضاعف شائع للمرضى الذين يعانون من حالات حرجة. يلعب إشارات cGAS-STING دورًا مهمًا في الالتهاب والتليف، ومع ذلك فإن وظيفة STING في BAS لا تزال غير واضحة. هنا نوضح باستخدام تسلسل RNA أحادي الخلية أن إشارات cGAS-STING تشارك في BAS، والتي تترافق مع زيادة dsDNA، وتعبير وتفعيل STING. إن تثبيط أو نقص STING يخفف بشكل فعال من تليف القصبة الهوائية في الفئران المصابة بـ BAS عن طريق تقليل كل من الالتهاب الحاد والمزمن. كما أن استنفاد البلعميات يخفف بشكل فعال من BAS. من الناحية الميكانيكية، يقوم dsDNA من الخلايا الظهارية التالفة بتنشيط مسار cGAS-STING للبلعميات ويحفز IL-6 لتنشيط STAT3 وتعزيز التليف. باختصار، تشير النتائج الحالية إلى أن إشارات cGAS-STING تحفز الالتهاب الحاد وتضخم الالتهاب المزمن وتليف القصبة الهوائية المرتبط بتضيق مجرى الهواء الحميد، مما يبرز الآلية والهدف المحتمل للعلاج لـ BAS.
تضيق مجرى الهواء الحميد (BAS) هو حالة تنفسية شائعة، تتميز بدرجات متفاوتة من ضيق التنفس ويمكن أن تؤدي إلى الاختناق وحتى الوفاة في الحالات الشديدة. الالتهاب الحاد والالتهاب المزمن هما المرضان الرئيسيان لتليف تضيق مجرى الهواء الحميد (BAS). الأسباب الرئيسية لـ BAS هي الإصابات الميكانيكية، بما في ذلك تضيق القصبة الهوائية بعد التنبيب (PITS)، وتضيق القصبة الهوائية بعد فتح القصبة الهوائية (PTTS)، وتضيق القصبة الهوائية بعد الجراحة.. مع تكرار حدوث الأحداث الصحية العامة، مثل حادث COVID-19 في السنوات الأخيرة، يعتبر التنبيب القصبي أداة مهمة لعلاج المرضى في حالة حرجة الذين يعانون من فشل رئوي.. ومع ذلك، فإن التنبيب القصبي طويل الأمد سيؤدي إلى زيادة خطر BAS. حاليًا، تشمل التدخلات السريرية لـ BAS بشكل أساسي العلاجات الشاملة بالمنظار القصبي، مثل زراعة الدعامات
وزرع البالون. بينما تظهر الإجراءات الجراحية فعالية كبيرة، إلا أنها يمكن أن تؤدي أيضًا إلى إصابة ثانوية، مما يؤدي إلى فرط تكاثر مفرط للأنسجة الحبيبية وتضيق القصبة الهوائية مرة أخرى. لذلك، فإن تحديد أهداف علاجية جديدة أثناء إصابة مجرى الهواء لمنع تكوين BAS أمر بالغ الأهمية. في حالات فرط التنسج الندبي المتكرر، يمكن استخدام بعض الأدوية (مثل ميتوميسين C، باكليتاكسيل، أو بيرفينيدون) لتثبيط عملية التليف، مما يثبط بشكل فعال تطور وتكرار الأنسجة الندبية.. علاوة على ذلك، تشير التقارير إلى أن إعطاء المضادات الحيوية، والهرمونات، وأدوية مضادة للالتهابات الأخرى خلال المرحلة الالتهابية يمكن أن يحقق فوائد علاجية في علاج تضيق القصبة الهوائية.. الاستجابة الالتهابية المفرطة غالبًا ما
تعتبر عاملًا مساهمًا كبيرًا في تطور تضيق مجرى الهواء، ويمكن أن يؤدي التثبيط الفوري لهذه الاستجابة إلى تخفيف شدة التضيق.
يعتبر مسار cGAS-STING مكونًا حيويًا من المناعة الفطرية، حيث يعمل كآلية دفاع. يمكن أن تحفز الحمض النووي الاستجابات المناعية، وعندما يكتشف مسار cGAS-STING الحمض النووي غير الطبيعي، مثل الحمض النووي من البكتيريا، والفيروسات، والحمض النووي الذاتي الذي يتم إطلاقه من النواة، والميتوكوندريا، والخلايا الميتة، فإنه ينشط، مما يؤدي إلى إنتاج الإنترفيرونات من النوع الأول (IFNs) والسيتوكينات المسببة للالتهاب.. وقد كشفت العديد من الدراسات أن مسار cGAS-STING لا يلعب فقط دورًا وقائيًا في مكافحة مسببات الأمراض الأجنبية، ولكنه يلعب أيضًا دورًا كبيرًا في بدء وتقدم حالات مختلفة مثل العدوى، والالتهابات، والأورام، والأمراض المناعية الذاتية، وأمراض أخرى.. علاوة على ذلك، كشفت التقارير عن مشاركة مسار STING في مسببات الأمراض للأمراض التليفية، بما في ذلك تليف الرئة، وتليف الكبد، وتليف الكلى.. يتم التعبير عن STING بشكل كبير على الخلايا المكونة للدم، مثل البلعميات،, ووجود البلعميات ضروري للشفاء السليم للجروح. عندما تصبح البلعميات غير منظمة ويتم إطلاق عوامل التهابية مفرطة، يمكن أن يحدث شفاء غير طبيعي للجروح، مما يؤدي إلى تكوين أنسجة ندبية.. أظهرت الدراسات السابقة أن dsDNA الذي يتم إطلاقه بعد إصابة عضلة القلب ينشط STING في البلعميات، مما يعزز تليف عضلة القلب في الفئران المصابة بنوبة قلبية.. ومع ذلك، فإن العلاقة بين إشارات STING في البلعميات و BAS لا تزال غامضة.
في هذا العمل، نجد أن الإشارات عبر STING تشارك في تطور BAS. توفر الدراسة الحالية دليلًا على أن dsDNA الذي يتم إطلاقه بعد إصابة القصبة الهوائية ينشط مسار cGAS-STING في الفئران المصابة بـ BAS، وأن تثبيط STING يخفف من التليف في تضيق مجرى الهواء الحميد. من الناحية الميكانيكية، يؤدي تنشيط STING في البلعميات بواسطة dsDNA عند إصابة القصبة الهوائية إلى تحفيز العامل الالتهابي IL-6، الذي ينشط بدوره الخلايا الليفية عبر محور IL-6-STAT3 ويعزز التليف. وبالتالي، تشير النتائج الحالية إلى أن مسار cGAS-STING هو هدف علاجي محتمل لمنع BAS.
النتائج
يكشف تسلسل RNA أحادي الخلية عن تعبير مسار cGASSTING في الأنسجة الحبيبية من المرضى الذين يعانون من BAS
يستخدم تسلسل RNA أحادي الخلية (scRNA-seq) على نطاق واسع لدراسة الأمراض، حيث يقدم رؤى لا مثيل لها في التباين الخلوي. تم إجراء scRNA-seq لفحص الهوية الخلوية والتحقيق في تباين التعبير عن مسار cGAS-STING في BAS، والذي يرتبط ارتباطًا وثيقًا بالالتهاب الحاد والمزمن.
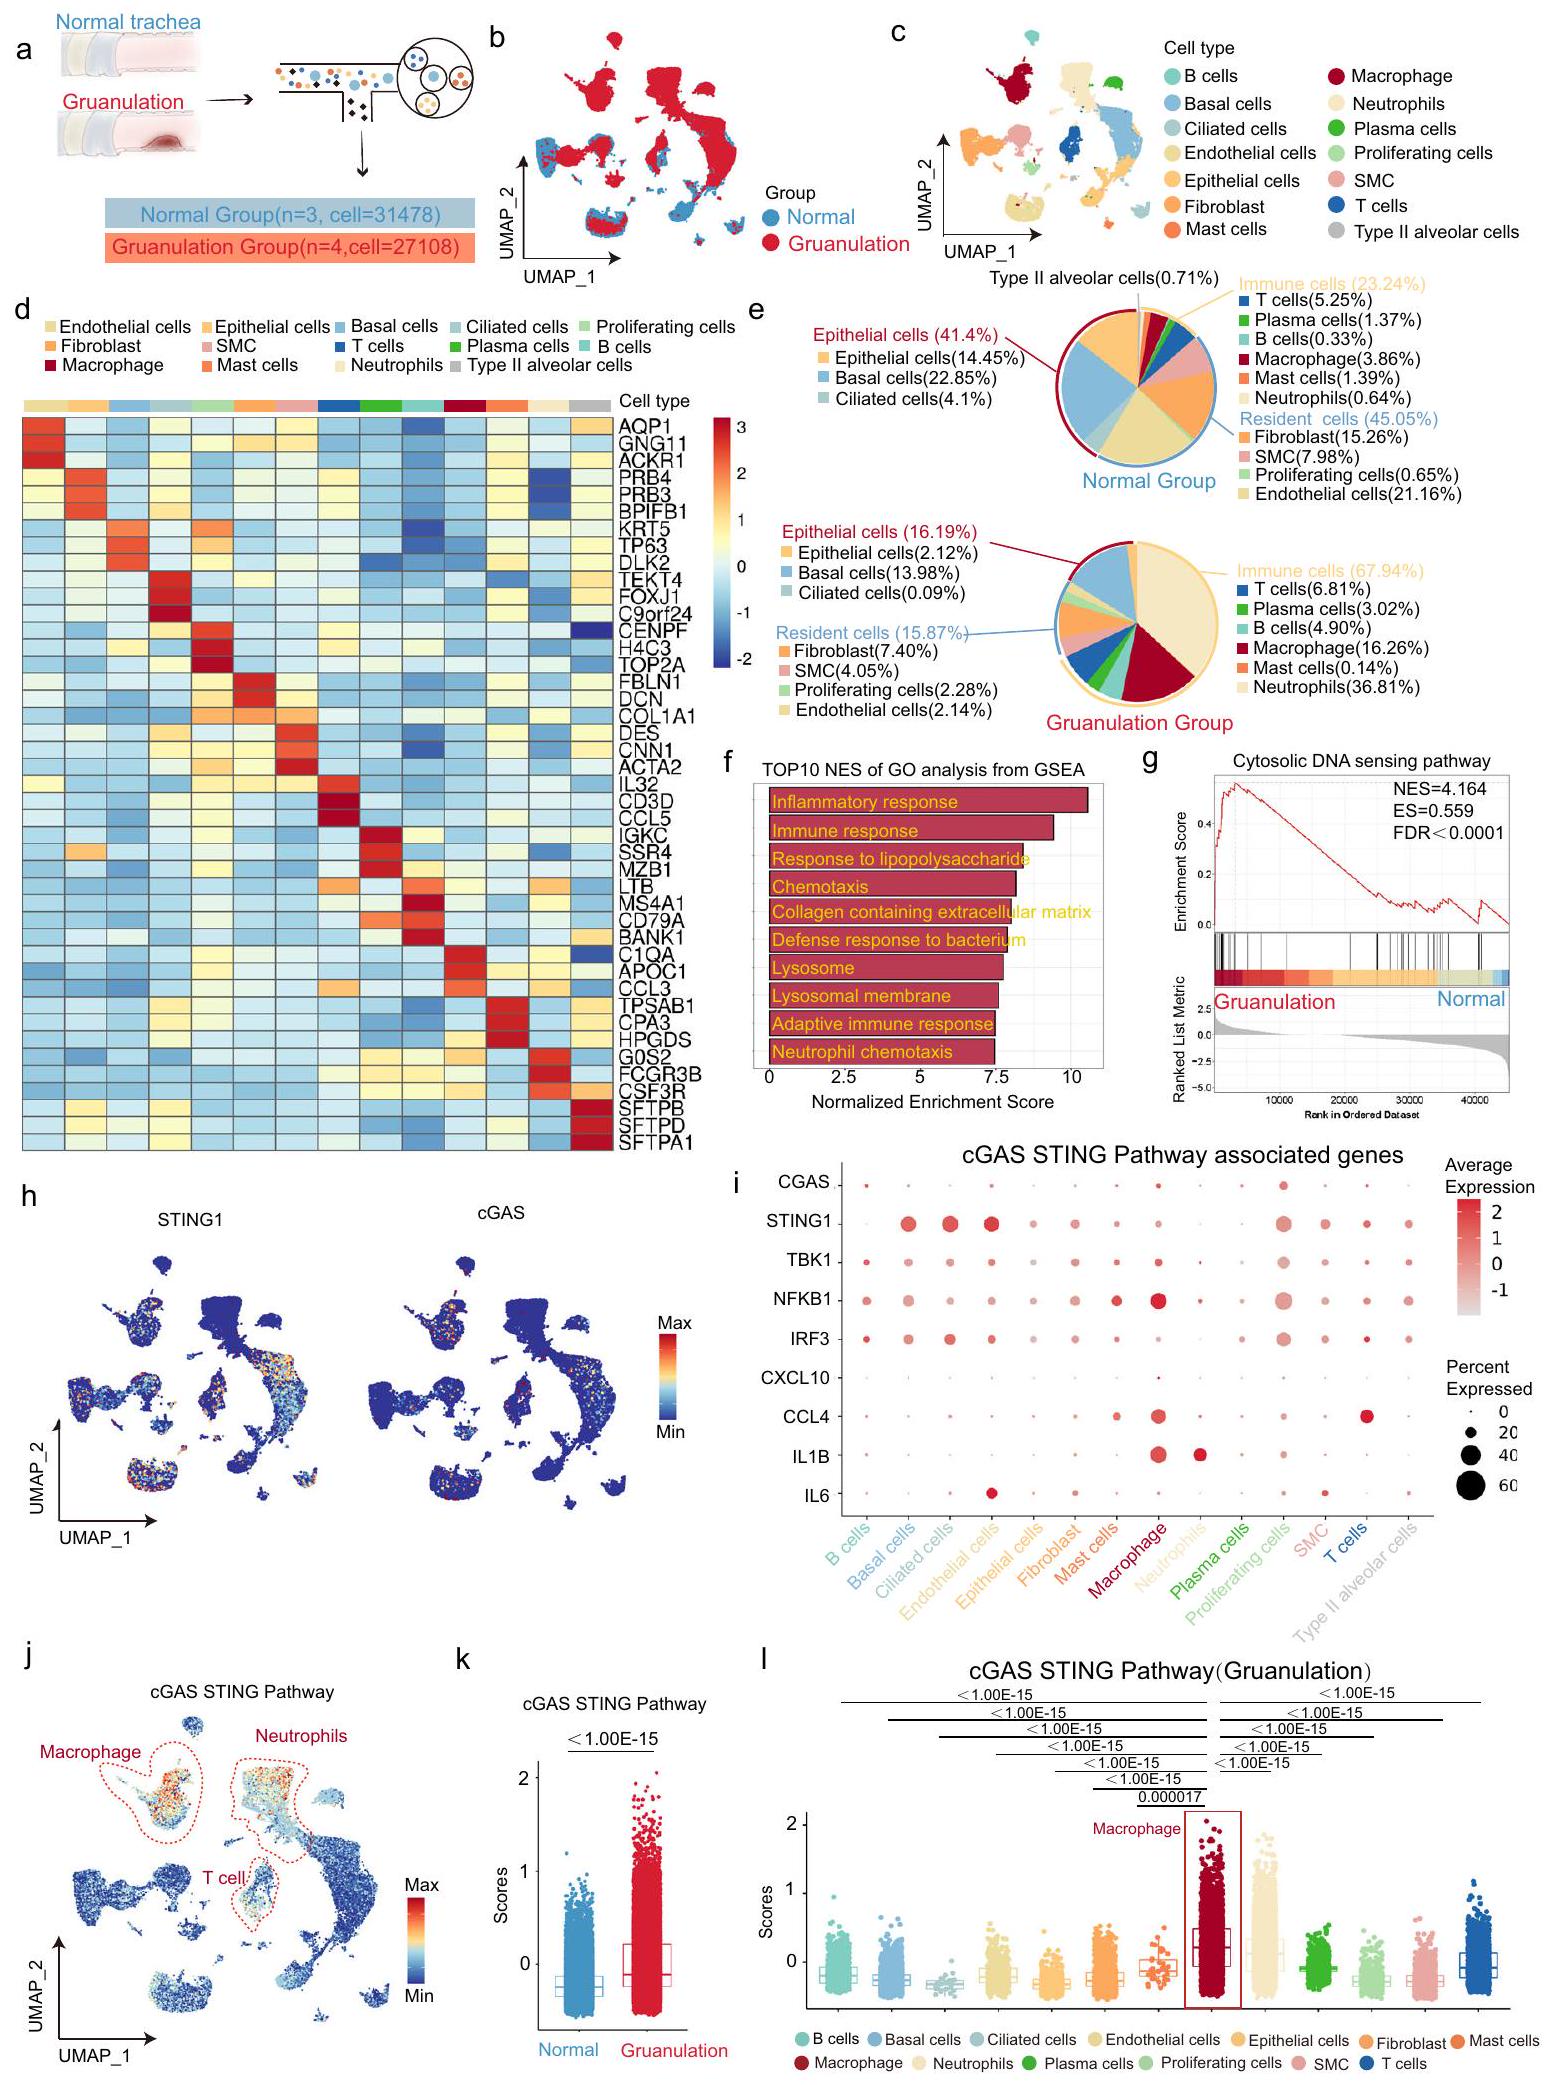
تم جمع ثلاث عينات من الأنسجة القصبية الطبيعية (المجموعة الطبيعية) وأربع عينات من الأنسجة الحبيبية (المجموعة الحبيبية) لإجراء scRNA-seq. تم التقاط ما مجموعه 31,478 خلية في المجموعة الطبيعية، و27,108 خلايا في المجموعة الحبيبية (الشكل 1a). لوحظ تشكيل مجموعات نسخ متميزة في فضاء تقريب متعدد الأبعاد (UMAP)، حيث تعكس المجموعات نوع الخلية أو المجموعة (الشكل 1b، c). تم تقسيم الخلايا إلى 14 مجموعة وفقًا لجينات العلامة: خلايا B، خلايا قاعدية، خلايا مهدبة، خلايا بطانية، خلايا ظهارية، خلايا ليفية، خلايا قاعدية، بلعميات، كريات دم بيضاء، خلايا بلازمية، خلايا متكاثرة، خلايا عضلية ملساء، خلايا T، وخلايا رئوية من النوع الثاني (الشكل 1d). تم تقسيم هذه المجموعات الـ 14 من الخلايا إلى ثلاث مجموعات رئيسية، وهي: الخلايا الظهارية، والخلايا المقيمة، والخلايا المناعية. كانت نسبة الخلايا المناعية أكبر بكثير في المجموعة الحبيبية مقارنة بالمجموعة الطبيعية (الشكل 1e). اقترحت تحليل GSEA أن أكثر مصطلح Go غنى كان الاستجابة الالتهابية في المجموعة الحبيبية مقارنة بالمجموعة الطبيعية (الشكل 1f). هذا يتماشى مع الميزات المرضية للالتهاب الحاد والمزمن في BAS. بالإضافة إلى ذلك، كانت مصطلحات Go الغنية مرتبطة أيضًا ارتباطًا وثيقًا بالاستجابة المناعية (الشكل 1f). كشفت التحليلات الإضافية أن مسار استشعار الحمض النووي السيتوزولي، الذي يرتبط ارتباطًا وثيقًا بالاستجابة المناعية، كان غنيًا بشكل كبير في الأنسجة الحبيبية (الشكل 1g). بعد
تحليل مستويات التعبير الجيني لـ cGAS و STING، وُجد أن كل من cGAS و STING تم التعبير عنهما في معظم المجموعات (الشكل 1h). وقد تم التأكيد على أن STING و cGAS تم التعبير عنهما بشكل شائع في كل من الخلايا المناعية وغير المناعية.. على عكس التعبير العام عن STING و cGAS في معظم تجمعات الخلايا، كانت الدرجات العالية لمسار cGAS-STING مركزة بشكل رئيسي في الخلايا المناعية، بما في ذلك البلعميات، وخلايا T، والعدلات (الشكل 1i). كانت درجة مسار cGAS-STING أكبر في مجموعة التكوين الحبيبي مقارنة بالمجموعة الطبيعية (الشكل 1j). بعد ذلك، تم تقييم درجات مسار cGAS-STING في كل تجمع من مجموعة التكوين الحبيبي، مما كشف عن أعلى درجة في تجمع البلعميات (الشكل 1k). مجتمعة، اقترحت بيانات scRNA-seq أن مسار cGAS-STING، الذي تلعب فيه البلعميات دورًا مهمًا، يتم التعبير عنه بشكل كبير في نسيج التكوين الحبيبي للمرضى الذين يعانون من تضيق مجرى الهواء الحميد.
تم تنشيط إشارة cGAS-STING في BAS
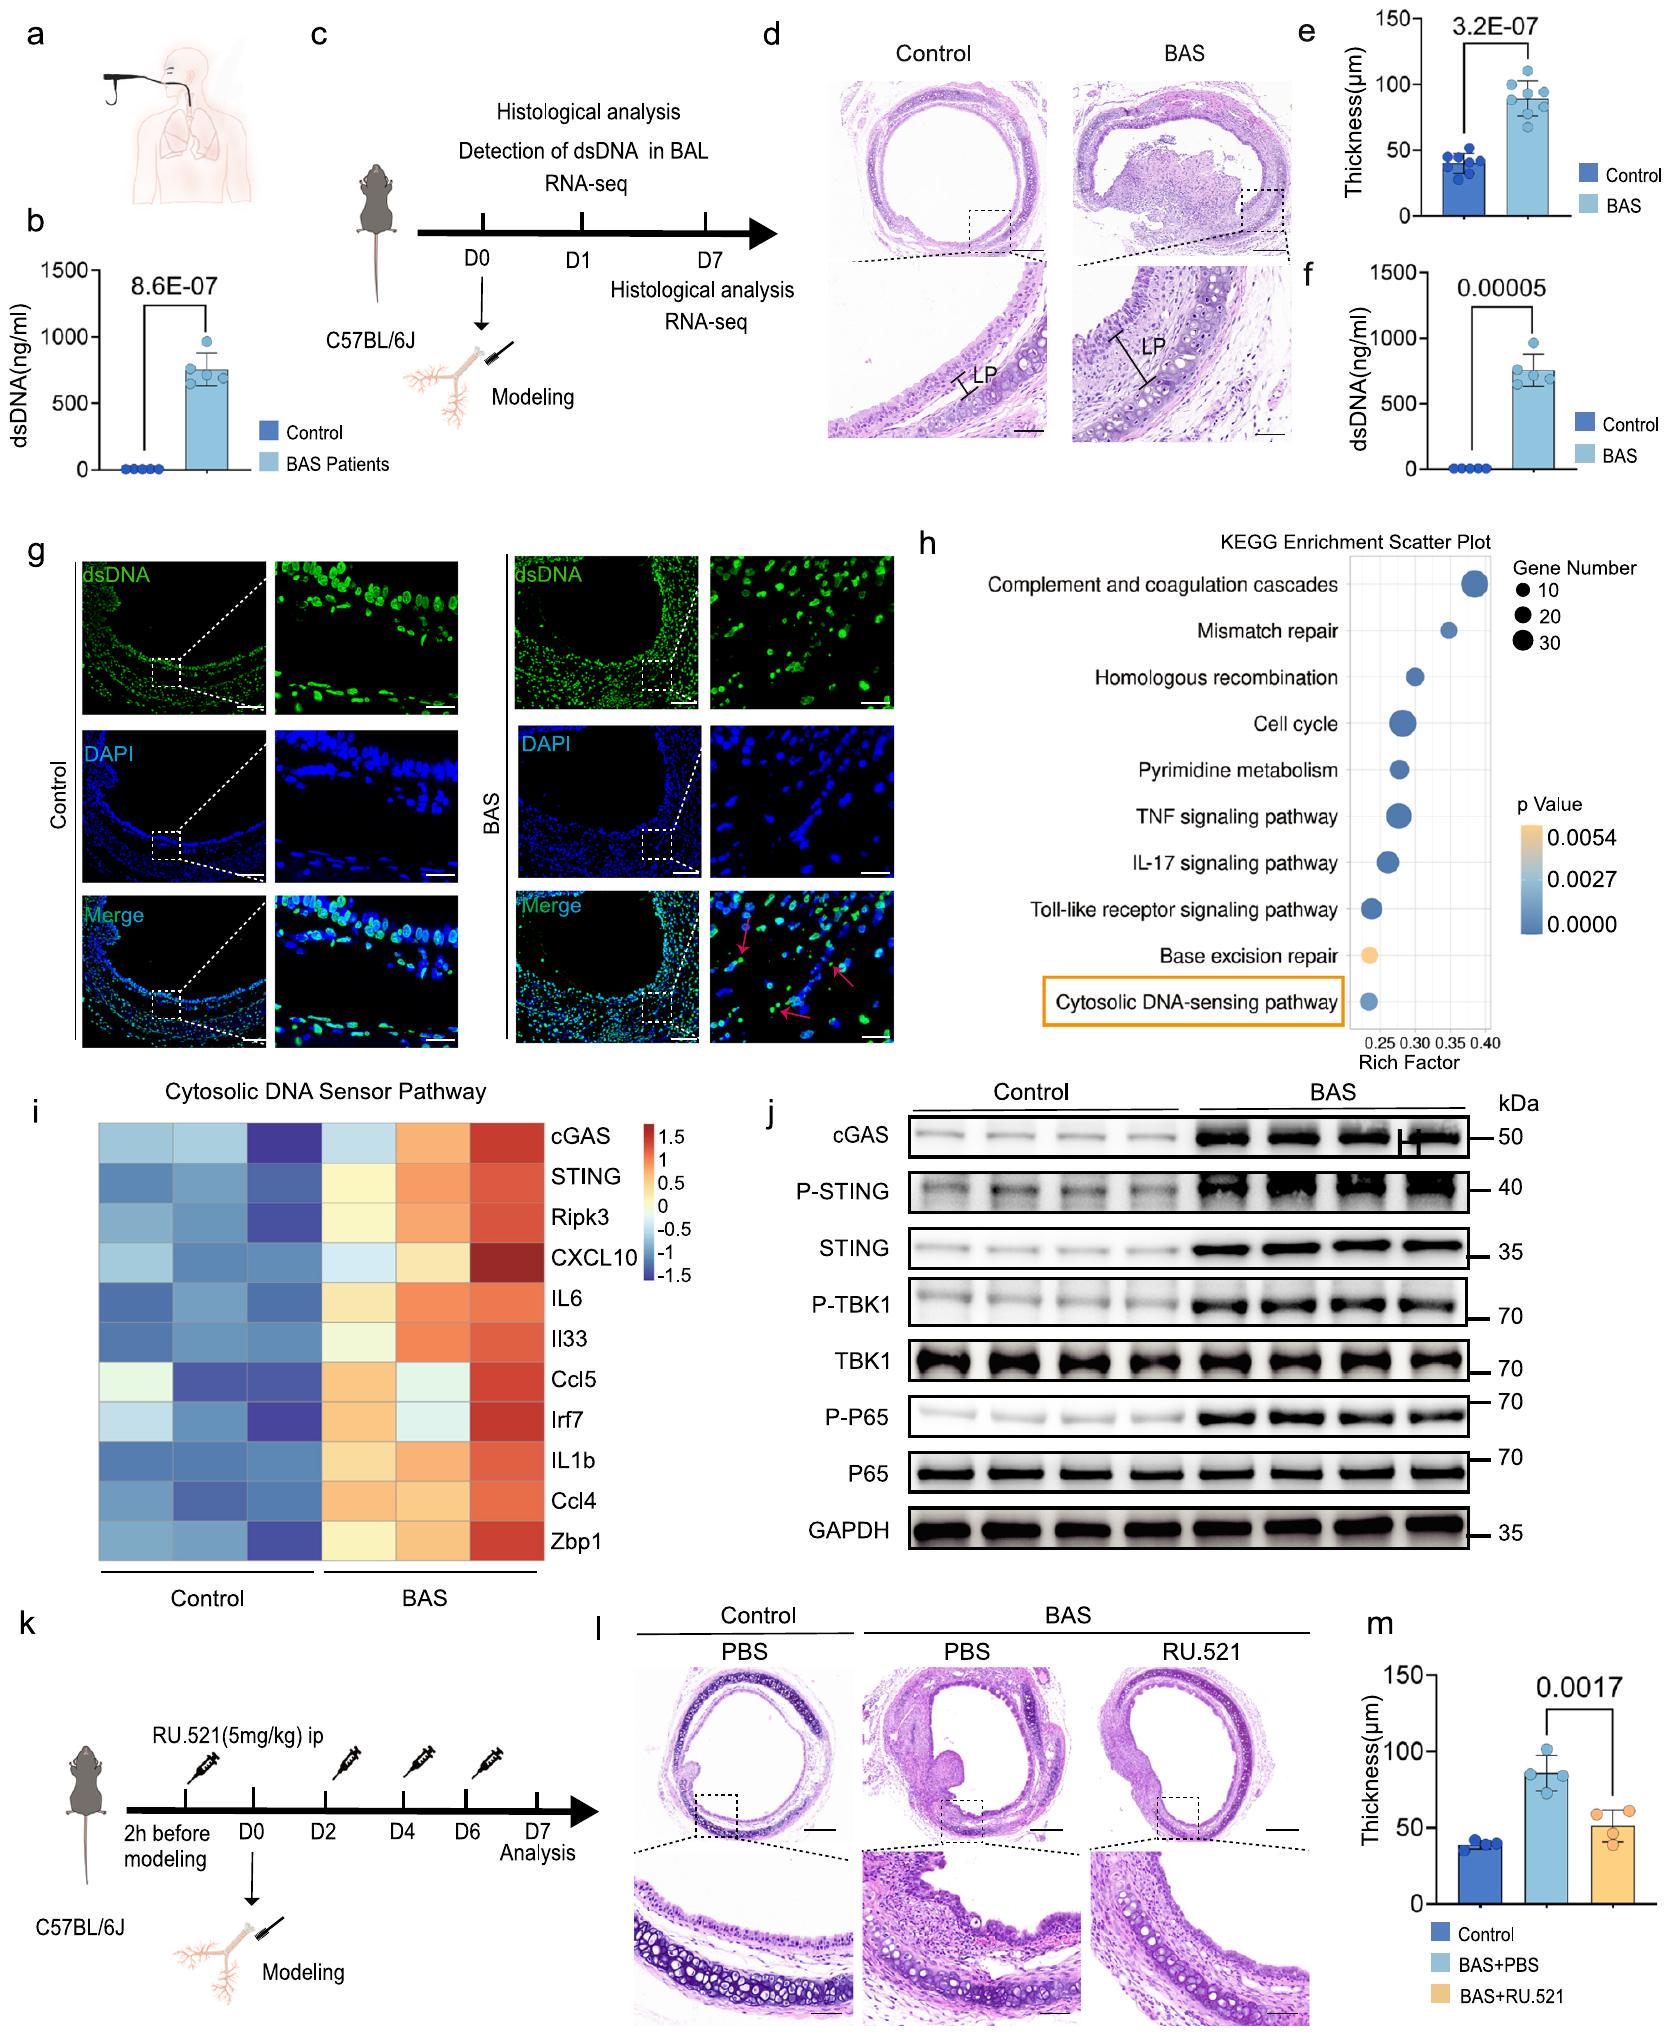
إطلاق الحمض النووي مزدوج الشريطة (dsDNA) من الخلايا التالفة أو الميتة هو حدث رئيسي في بدء استجابة التهابية. تضيق مجرى الهواء الحميد هو حالة مرضية تتميز بالتهاب حاد ومزمن نتيجة تلف المجاري الهوائية المركزية الكبيرة الناجم عن إدخال أنبوب القصبة الهوائية أو وضع دعامة قصبية (الشكل التوضيحي 1). بعد غسل القصبات الهوائية بالمنظار في المرضى الذين يعانون من تضيق مجرى الهواء الحميد، كان محتوى dsDNA في سائل غسل القصبة الهوائية مرتفعًا بشكل ملحوظ في المرضى مقارنة بالمجموعة الضابطة (الشكل 2a، b). لتحديد دور مسار cGAS-STING في BAS، تم إنشاء نموذج لـ BAS باستخدام فرشاة لإحداث تلف في القصبة الهوائية للفئران (الشكل 2c). كشفت النتائج النسيجية أن الفئران في المجموعة الضابطة كانت لديها قصبة هوائية مفتوحة مع ظهارة سليمة وبدون تسلل خلايا التهابية أو تكاثر نسيج حبيبي (الشكل 2d). بالمقابل، في مجموعة BAS، أظهر منطقة الإصابة الميكانيكية درجات متفاوتة من التضيق وتكاثر حبيبي ملحوظ، مع تكاثر خلايا الظهارة القصبية، وتسلل واسع للخلايا الالتهابية، وتكاثر مفرط، وعدم تنظيم في الخلايا الليفية، وزيادة في تكوين الأوعية الدموية الجديدة، وتراكم مفرط لمصفوفة خارج الخلية، مما أدى إلى زيادة سمك الغشاء الأساسي (LP) (الشكل 2d). من الجدير بالذكر أن سمك LP كان أكبر في مجموعة BAS مقارنة بالمجموعة الضابطة (الشكل 2e). تم جمع أنسجة القصبة الهوائية للفئران في نقاط زمنية مختلفة لتسلسل النسخ. أظهر تحليل علم الأحياء الجيني (GO) للنسخ في القصبة الهوائية أن المظاهر السائدة تشمل الاستجابة الالتهابية الناتجة عن الإصابة، وتنشيط الجهاز المناعي، وعمليات بيولوجية متنوعة مرتبطة بالحمض النووي في فترة الـ 24 ساعة الأولى بعد كشط القصبة الهوائية (الشكل التوضيحي 2a). ومع ذلك، في اليوم السابع بعد النمذجة، كانت أنسجة القصبة الهوائية بالفعل في حالة إصلاح، تتكون أساسًا من تجديد الظهارة الشعرية للقصبة الهوائية، وإعادة تشكيل المصفوفة خارج الخلية وإنتاج نسيج حبيبي ليفي (الشكل التوضيحي 2b)، مما يشير إلى أن القصبة الهوائية للفئران المكسورة مرت بعملية فسيولوجية تتماشى مع نمو الساركومير. علاوة على ذلك، في المرحلة المبكرة من BAS، يتم تنشيط العديد من الوظائف الجزيئية المتعلقة بالحمض النووي في القصبة الهوائية للفئران. أظهرت العديد من الدراسات الآن أن الحمض النووي يمكن أن ينشط الاستجابة المناعية.. لذلك، قامت الدراسة الحالية بتقييم وجود الحمض النووي مزدوج الشريطة (dsDNA) في القصبات الهوائية الضابطة والمصابة، مما كشف أن محتوى dsDNA في سائل غسل القصبة الهوائية في مجموعة BAS كان أكبر بكثير من المجموعة الضابطة (الشكل 2f). علاوة على ذلك، أظهر تحليل IF أن كشط القصبة الهوائية أدى إلى تسرب ملحوظ للـ dsDNA السيتوزولي في القصبة الهوائية (الشكل 2g). أظهر تحليل مسار Kyoto Encyclopaedia of Genes and Genomes (KEGG) للجينات المعبر عنها بشكل مختلف (DEGs) أن مسار استشعار الحمض النووي السيتوزولي تم تنشيطه بشكل كبير في BAS بعد 24 ساعة من إصابة القصبة الهوائية (الشكل 2h). كما هو موضح في خريطة الحرارة للجينات الرئيسية المعبر عنها بشكل مختلف، كانت الجينات المتعلقة بمسار استشعار الحمض النووي السيتوزولي معبرة بشكل كبير بعد 24 ساعة من إصابة القصبة الهوائية في مجموعة BAS مقارنة بالمجموعة الضابطة (الشكل 2i). أظهر تحليل Western blot أن تعبير cGAS،
STING، وفوسفات STING، P65، وTBK1 كانت مرتفعة بعد 24 ساعة من إصابة القصبة الهوائية مقارنة بالمجموعة الضابطة (الشكل 2j). لتحديد وظيفة مستقبل dsDNA الحر cGAS في سياق BAS، تم إعطاء مثبط RU.521 cGAS للفئران (الشكل 2k). بعد إعطاء RU.521، تم تخفيف نمو التكوين الحبيبي بشكل فعال، وتم تقليل سمك طبقة LP في القصبة الهوائية بشكل كبير (الشكل 21، م). بالإضافة إلى cGAS، تم تنشيط الـ AlM2
الالتهاب الذي يتم تنشيطه أيضًا بواسطة . أظهرت بيانات تسلسل النسخ (الشكل التوضيحي 3a) انخفاض تعبير mRNA لـ AIM2 في أنسجة القصبة الهوائية في مجموعة الشام ومجموعة BAS. كما أظهر WB انخفاض تعبير البروتين لـ AIM2 في كل من أنسجة القصبة الهوائية في مجموعة الشام ومجموعة BAS (الشكل التوضيحي 3b، c). في تسلسل sc-RNA، وجدنا أن AIM2 كان أيضًا بتعبير منخفض في البلعميات (الشكل التوضيحي 3d، e). تشير البيانات أعلاه إلى أن AIM2 قد لا يعمل في ال
الشكل 1 | تعبير مسار cGAS-STING في مرضى BAS بواسطة تسلسل RNA أحادي الخلية. أ نظرة عامة تخطيطية على تصميم التجربة. تسلسل RNA أحادي الخلية لمجموعة طبيعية (, الخلية ) ومجموعة التكوين الحبيبي (, الخلية=27108). ب تصور UMAP لمجموعة طبيعية ومجموعة التكوين الحبيبي (58586 خلية إجمالاً). ج تصور UMAP لـ 14 نوعًا من الخلايا (58586 خلية إجمالاً). د خريطة حرارة للتعبير عن ثلاثة جينات علامة تمثيلية لكل نوع من الخلايا. هـ مخطط دائري لنسبة إجمالي كل نوع من الخلايا المحددة في مجموعة طبيعية ومجموعة التكوين الحبيبي. و تحليل GSEA للجينات المعبر عنها بشكل متزايد يظهر أعلى 10 من مصطلحات GO الغنية في مجموعة التكوين الحبيبي مقارنة بالمجموعة الطبيعية. ز تحليل GSEA يظهر غنى ملحوظ لمجموعات الجينات المرتبطة بمسار استشعار الحمض النووي السيتوزولي في مجموعة التكوين الحبيبي مقارنة بالمجموعة الطبيعية. ح تصور UMAP لتعبير STING و cGAS في جميع التجمعات. ط مخطط نقطي يظهر تعبير 9 جينات مرتبطة بمسار cGAS-STING (cGAS، STING، TBK1، NFKB1، IRF3، CXCL10، CCL4، IL1B، IL6) في جميع التجمعات. ي تصور UMAP لدرجة مسار cGAS-STING
في جميع التجمعات. ك مخطط صندوقي يظهر درجة مسار cGAS-STING في المجموعة الطبيعية ( خلايا) ومجموعة التكوين الحبيبي ( خلية). ل مخطط صندوقي يظهر درجة مسار cGAS-STING في جميع التجمعات من مجموعة التكوين الحبيبي: خلايا B , خلايا قاعدية (), خلايا شعرية (), خلايا بطانية (), خلايا ظهارية (), خلايا ليفية (), خلايا قاعدية (), بلعميات (), عدلات (), خلايا بلازمية (), خلايا متكاثرة , SMCs وخلايا T . يمثل عدد الخلايا في التجمع. في () تظهر حدود الصندوق النسب المئوية 25 و 75، وتظهر الشعيرات النسب المئوية 25 ناقصًا (نطاق الربع، القيمة هي 75th النسب المئوية ناقص 25th النسب المئوية) إلى 75th النسب المئوية زائد 1.5*IQR ومركز الصندوق يظهر الوسيط. تم استخدام اختبار مان ويتني ذو الجانبين في (ك). تم استخدام تحليل ANOVA أحادي الاتجاه متبوعًا باختبار دانيكان متعدد النطاقات في (ل). تم توفير بيانات المصدر كملف بيانات المصدر.
تقدم BAS. معًا، تشير هذه البيانات إلى أن dsDNA الحر موجود في القصبة الهوائية للمرضى الذين يعانون من BAS وفي نموذج الفأر لـ BAS. علاوة على ذلك، يؤدي dsDNA الحر إلى تنشيط مسار cGAS-STING الحساس للحمض النووي في السيتوبلازم في القصبة الهوائية بعد إصابة القصبة الهوائية في الفئران. بالإضافة إلى ذلك، فإن تثبيط مستقبل الحمض النووي cGAS يخفف بشكل فعال من أعراض BAS.
يتم التعبير عن STING في مراحل مختلفة من BAS
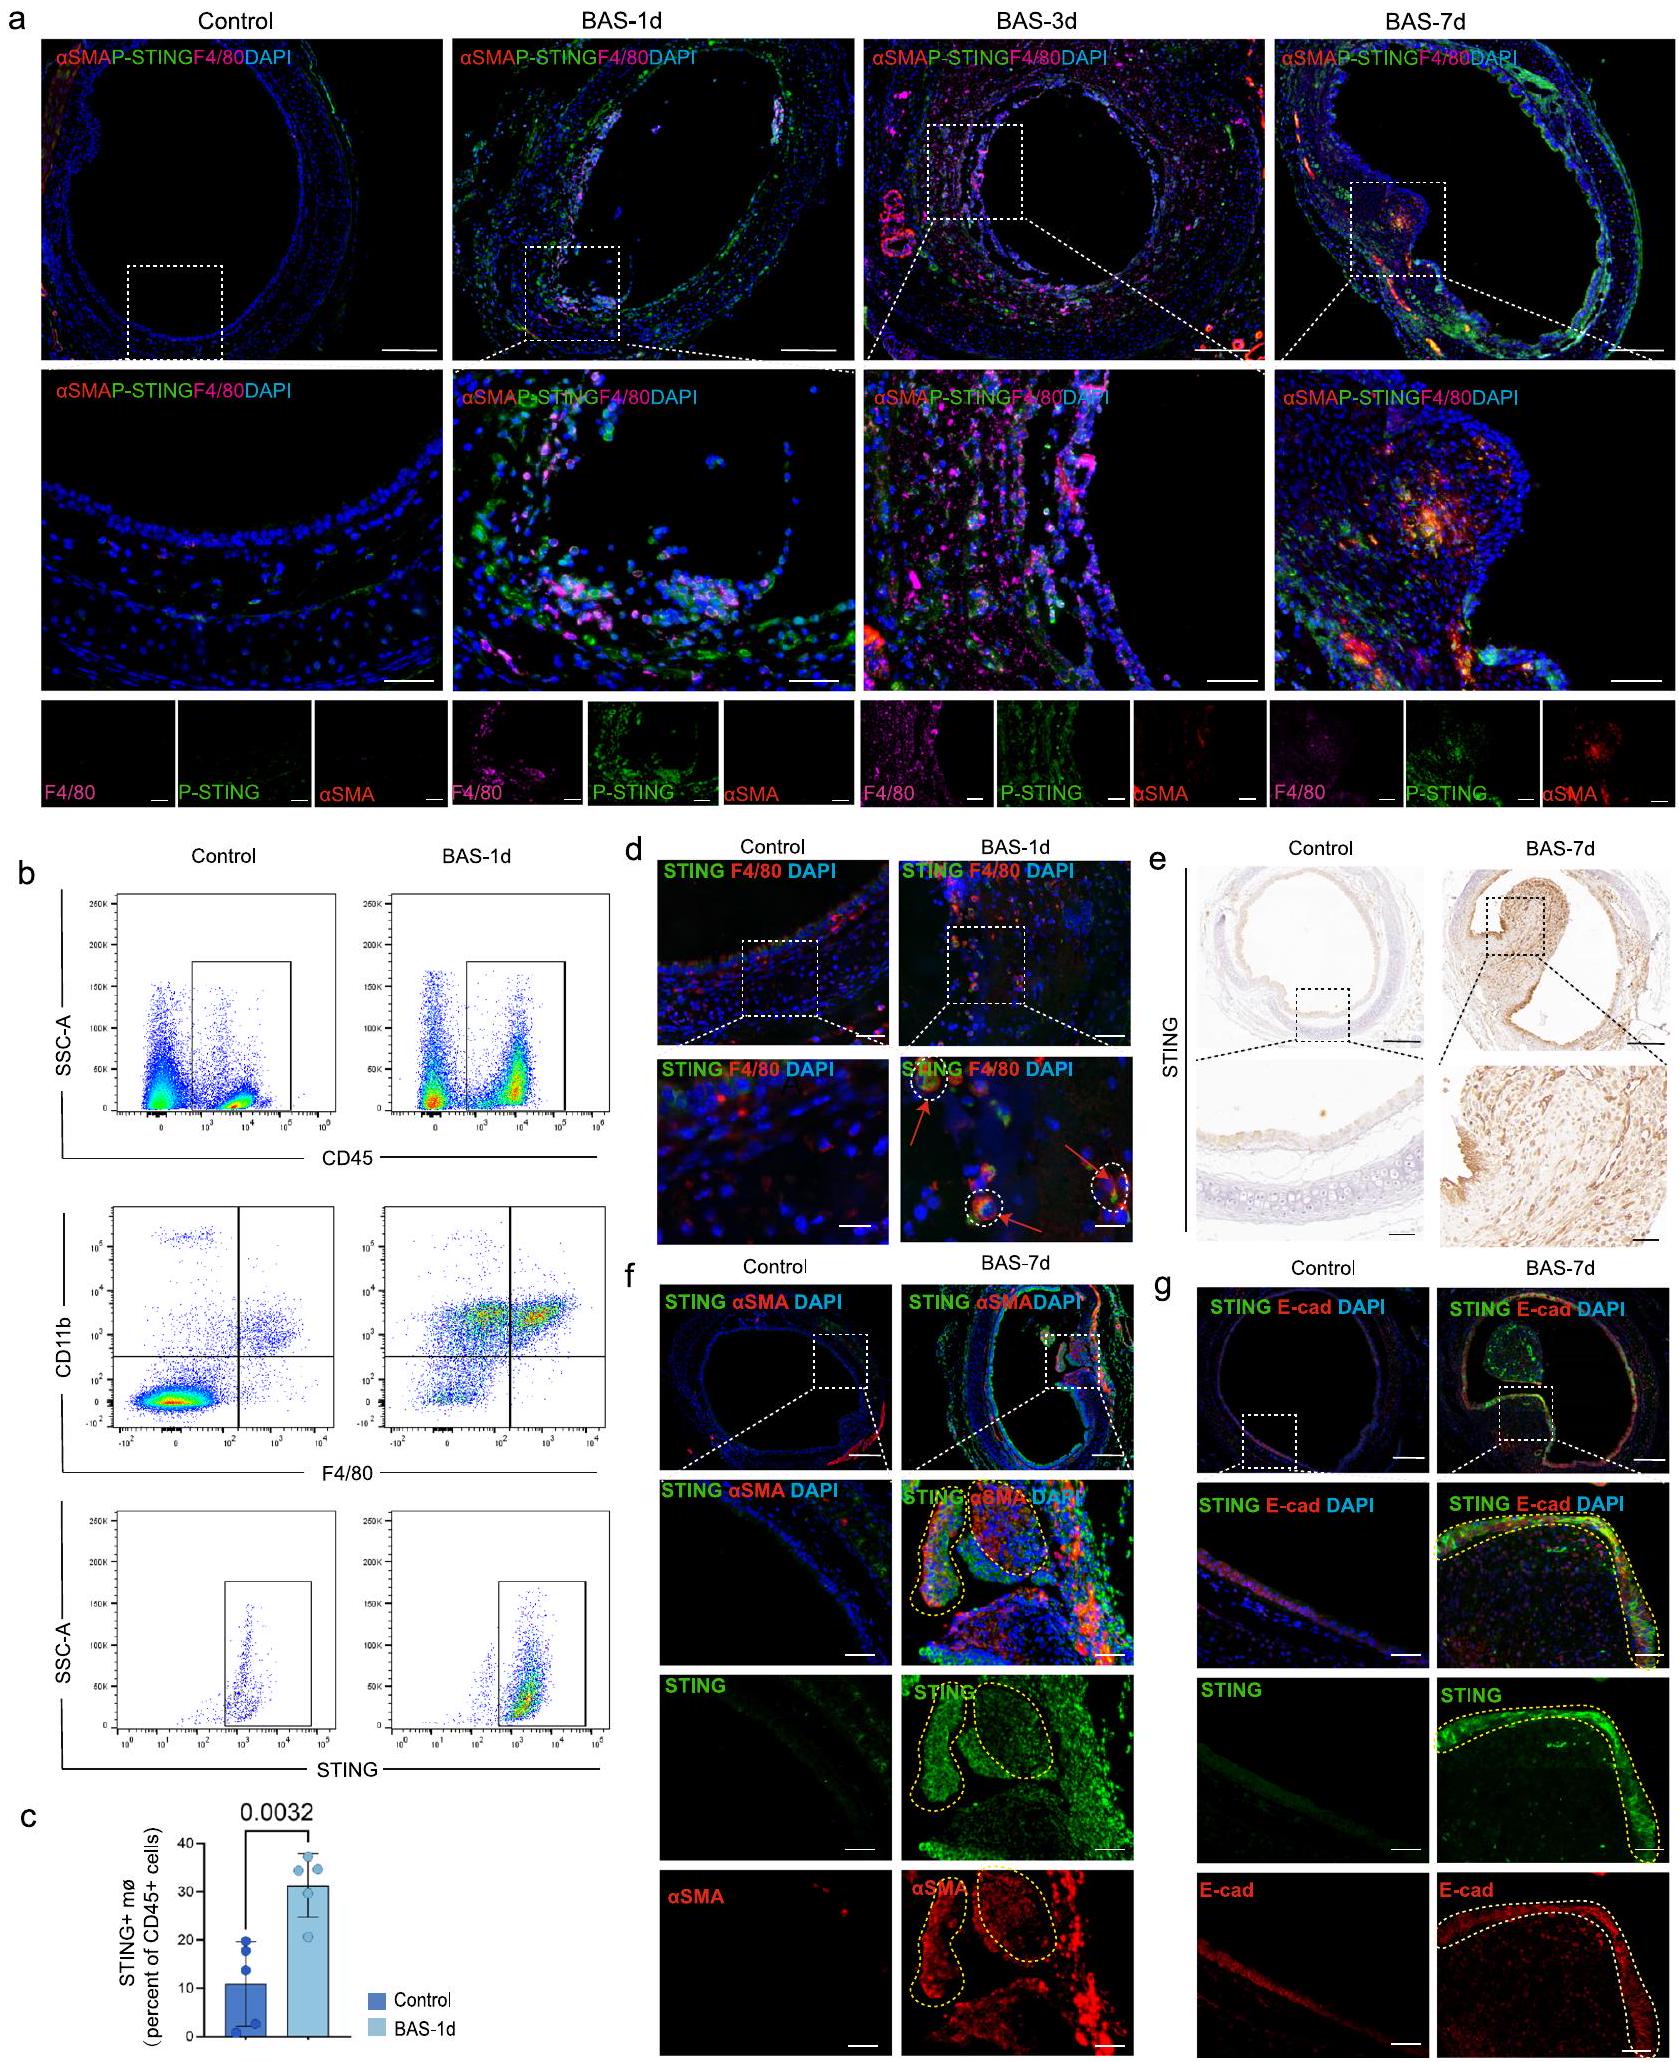
نظرًا لأن STING يتم التعبير عنه على نطاق واسع في الخلايا المكونة للدم (البلعميات، وخلايا T اللمفاوية، والخلايا الشجرية) والخلايا غير المكونة للدم (الخلايا البطانية، والخلايا الظهارية، والخلايا الليفية)تم تحليل تعبير STING في مراحل مختلفة من BAS. كشفت تحليل Mfuzz لبيانات RNA-seq عن تعبير مرتفع لـ cGAS و STING بعد 24 ساعة، مع اتجاه تنازلي في التعبير بعد 7 أيام من إصابة القصبة الهوائية (الشكل التوضيحي 2c). تم استخدام المناعة الفلورية لتحليل حالة الفسفرة لـ STING في البلعميات والأرومات الليفية خلال الفترات المختلفة من BAS. في المرحلة الالتهابية المبكرة من BAS، زاد مستوى فسفرة STING بشكل أكبر في البلعميات، ولكن مع تقدم BAS، كان هناك زيادة تدريجية في مستوى فسفرة STING في الأرومات الليفية (الشكل 3a). خلال المرحلة الالتهابية، كانت القصبة الهوائية مملوءة بالعديد من الخلايا الالتهابية، مثل البلعميات، بعد 24 ساعة من إصابة القصبة الهوائية (الشكل التوضيحي 7a، b). كانت نسبة البلعميات الإيجابية لـ STING بين CD45تم تحليل خلايا (علامة الخلايا الكريات البيضاء) ، والتي أظهرت أن عدد البلعميات الإيجابية لـ STING زاد خلال المرحلة الالتهابية من تضيق مجرى الهواء في مجموعة BAS مقارنة بمجموعة التحكم (الشكل 3b، c). علاوة على ذلك، كشفت تحليل المناعة الفلورية عن العديد من STINGتم العثور على خلايا تعبر عن STING في القصبة الهوائية للفئران في مجموعة BAS، بينما كانت مثل هذه الخلايا نادرة في مجموعة التحكم (الشكل 3d). أشارت النتائج المناعية النسيجية إلى أن STING كان معبرًا عنه في كل من الخلايا الظهارية والأرومات الليفية من نسيج التندب في القصبة الهوائية لفئران BAS في مرحلة التندب في اليوم السابع (الشكل 3e). علاوة على ذلك، كشفت تحليل المناعة الفلورية عن وجود خلايا تعبر عن STING + SMA+ و STING + E-cad+ في القصبة الهوائية للفئران في مجموعة BAS، بينما كانت مثل هذه الخلايا نادرة في مجموعة التحكم (الشكل 3f، g). يرتبط STING ارتباطًا وثيقًا بتطور الأمراض الليفية، وقد تم إثبات أن تنشيط STING يسهل تنشيط الأرومات الليفية.. ومع ذلك، لا يزال غير معروف ما إذا كان STING يتم تنشيطه داخل الخلايا الليفية ويرتبط بعملية التليف في BAS. بعد ذلك، تم تحليل تجمعات الخلايا الليفية في بيانات scRNA-seq (الشكل التوضيحي التكميلي 4a)، والتي أظهرت أن مستويات التعبير لجينات تنشيط الخلايا الليفية COL1 و FAP و TGFB1 و FN1 كانت مرتفعة في تجمعات الخلايا الليفية لمجموعة التكوين مقارنة بتلك الخاصة بالمجموعة الطبيعية (الشكل التوضيحي التكميلي 4b). كانت درجة مسار cGAS-STING أكبر في تجمعات الخلايا الليفية لمجموعة التكوين مقارنة بتلك الخاصة بالمجموعة الطبيعية (الشكل التوضيحي التكميلي 4c). بعد تحفيز الخلايا الليفية عبر نقل الحمض النووي القصبي للفئران، زادت مستويات فسفرة STING بشكل كبير، وزادت مستويات الخلايا الليفية- تم زيادة العلامات المرتبطة، بما في ذلك الكولاجين I وSMA، في الخلايا الليفية (الشكل التكميلي 4d، e). عندما تم تقليل التعبير عن STING في الخلايا الليفية عبر siRNA (الشكل التكميلي 4f، g)، فشلت تحفيزات الحمض النووي في تعزيز تنشيط الخلايا الليفية (الشكل التكميلي 4h، i). مجتمعة، أظهرت هذه النتائج أن STING يتم التعبير عنه في مراحل الالتهاب الحاد والمزمن في BAS.
تثبيط STING يخفف من تطور BAS
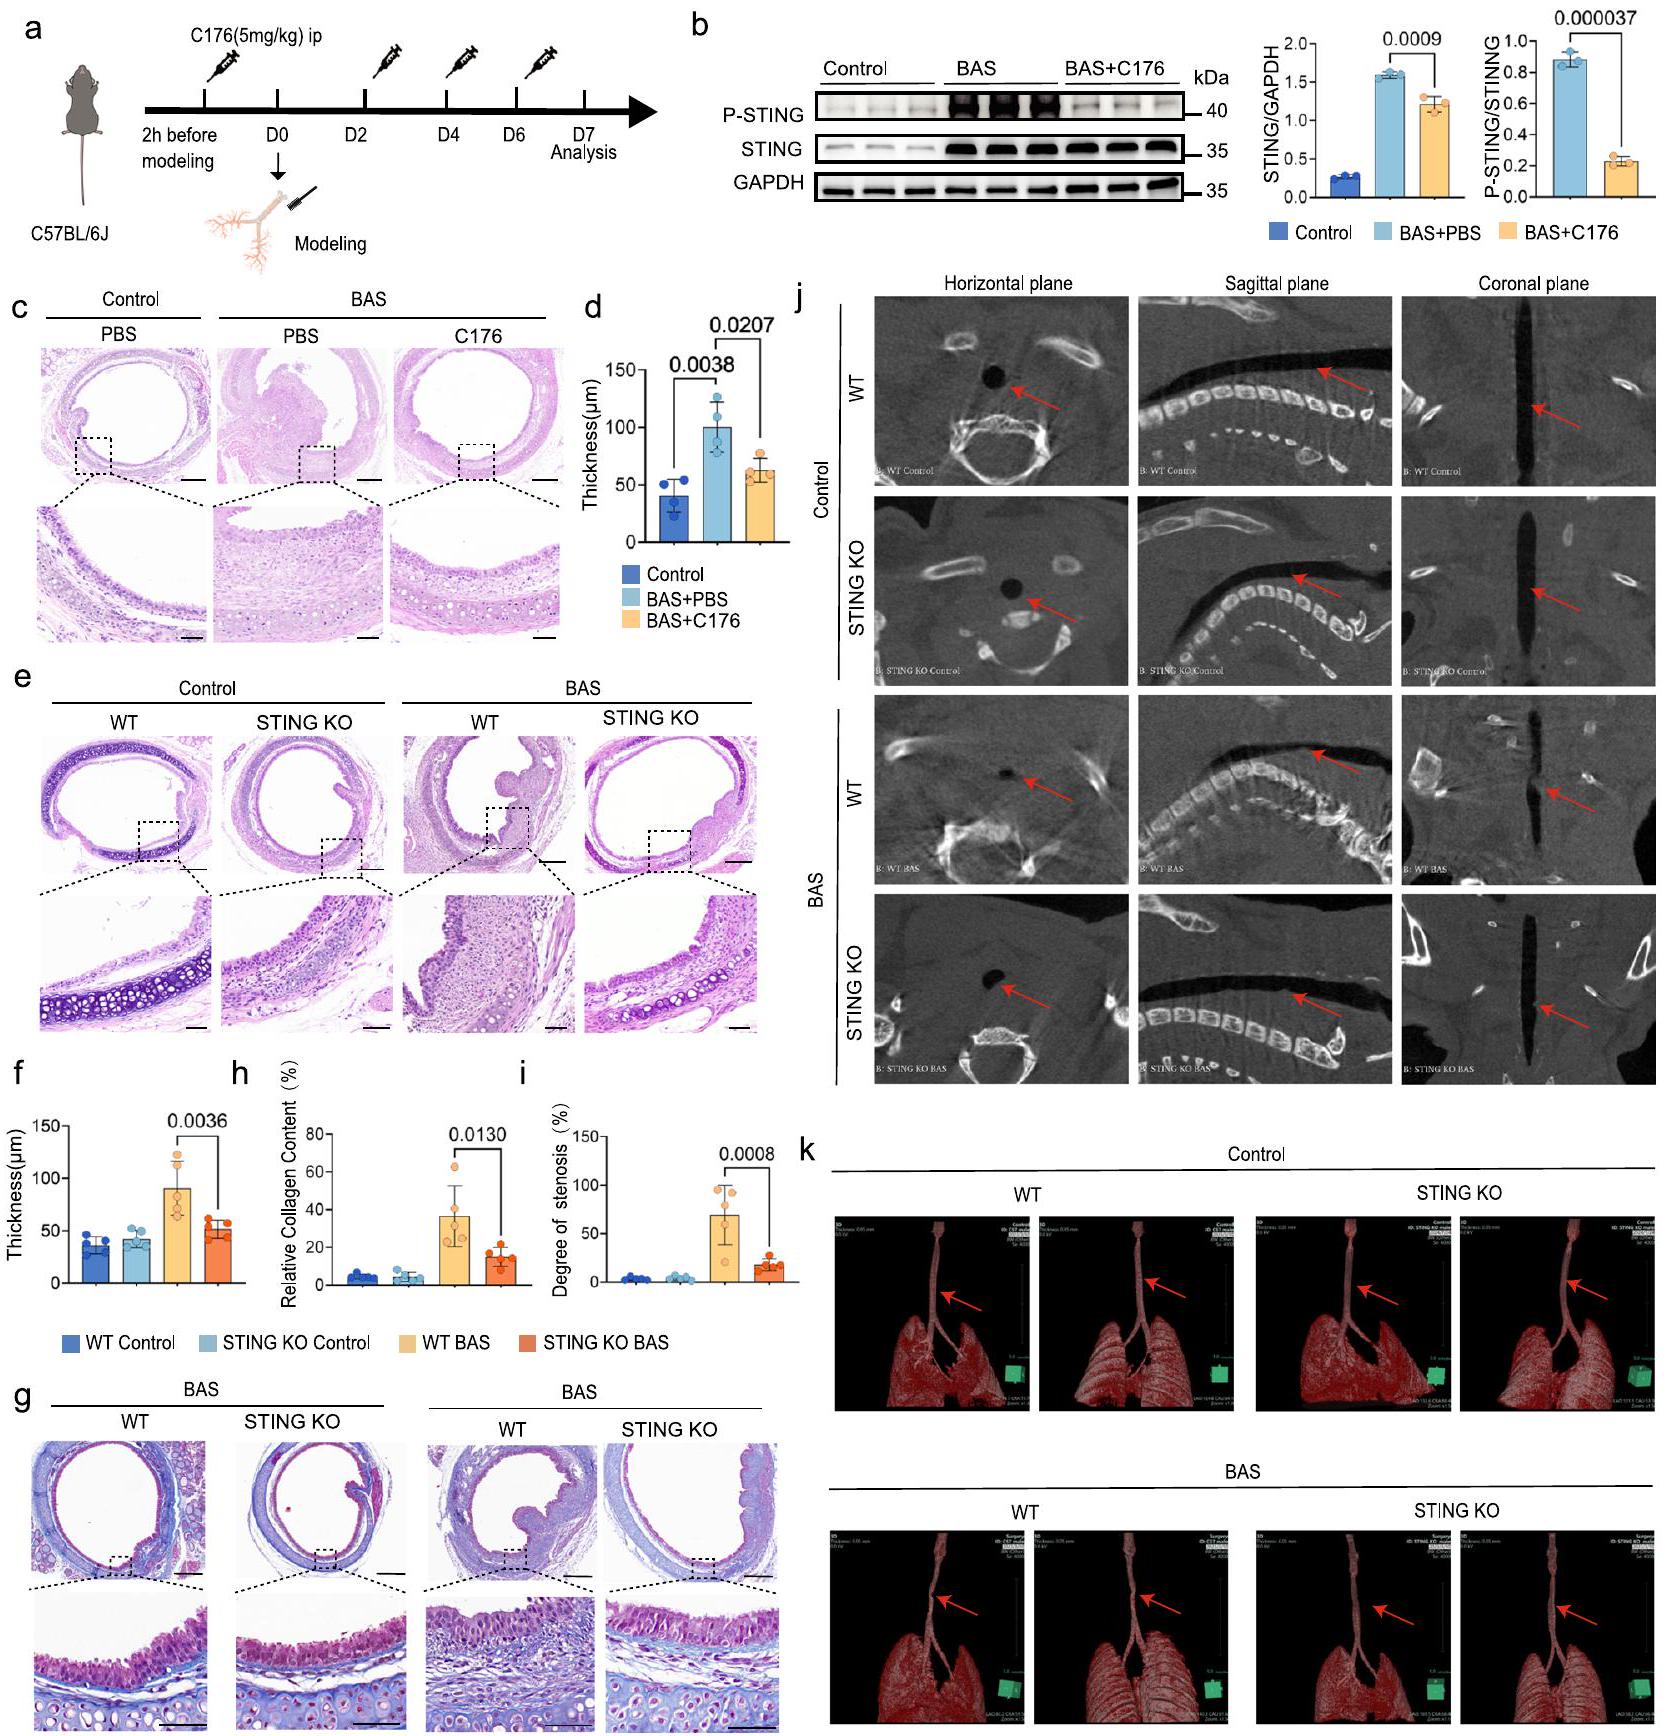
لتأكيد تأثير مسار cGAS-STING على تقدم BAS، تم معالجة الفئران بمثبط STING C176 (الشكل 4a). أظهر تحليل Western blot قدرة C176 على تقليل تعبير STING ومستوى فسفرة STING (الشكل 4b). في اليوم السابع بعد النمذجة، أظهرت مجموعة الفئران BAS المعالجة بـ C176 تطورًا أقل بشكل ملحوظ في نسيج التندب، وتكاثر الظهارة الهوائية، وترسب الكولاجين، ودرجة التليف مقارنة بمجموعة الفئران BAS المعالجة بـ PBS (الشكل 4c). علاوة على ذلك، كشفت التقييمات الكمية لسمك LP عن سمك أقل في LP لدى الفئران BAS المعالجة بـ C176 مقارنة بالفئران BAS المعالجة بـ PBS (الشكل 4d). بالإضافة إلى ذلك، قمنا بإعطاء الدواء بعد 24 ساعة من إصابة القصبة الهوائية ووجدنا نفس التأثير الوقائي (الشكل التكميلي 5a، b). لوحظ نفس الظاهرة في الفئران STING KO بعد 7 أيام من كشط القصبة الهوائية حيث كانت درجة فرط التنسج الحبيبي في القصبة الهوائية أقل بشكل ملحوظ في مجموعة BAS مقارنة بمجموعة WT (الشكل 4e). أظهر التحليل النسيجي المرضي تقليل سمك LP في الفئران STING KO مقارنة بالفئران WT في اليوم السابع بعد النمذجة (الشكل 4f). كشفت صبغة Masson’s trichrome أن الفئران STING knockout مع BAS تعبر عن عدد أقل من ألياف الكولاجين مقارنة بالفئران البرية (الشكل 4g، h). أظهرت مسحات Micro-CT للفئران البرية والفئران STING KO في مجموعة التحكم عدم وجود تضيق في القصبة الهوائية (الشكل 4j، k). في المقابل، في اليوم السابع بعد النمذجة، أظهرت الفئران البرية والفئران STING KO تشكيل بروزات ملحوظة داخل تجويف القصبة الهوائية (الشكل 4j، k). كانت هذه الشذوذات تشير إلى تضيق موضعي في موقع الإصابة، والذي كان واضحًا عند تحليل الصور. من الجدير بالذكر أن مسحات Micro-CT أظهرت أن شدة تضيق التجويف كانت أقل بشكل ملحوظ في الفئران STING knockout مقارنة بنظيراتها البرية (الشكل 4i). تشير هذه النتائج إلى أن تثبيط STING يقلل من تقدم تضيق مجرى الهواء وقد يمنع أيضًا تقدم التليف.
تعبير STING في البلعميات الكبيرة مرتبط بالالتهاب في BAS
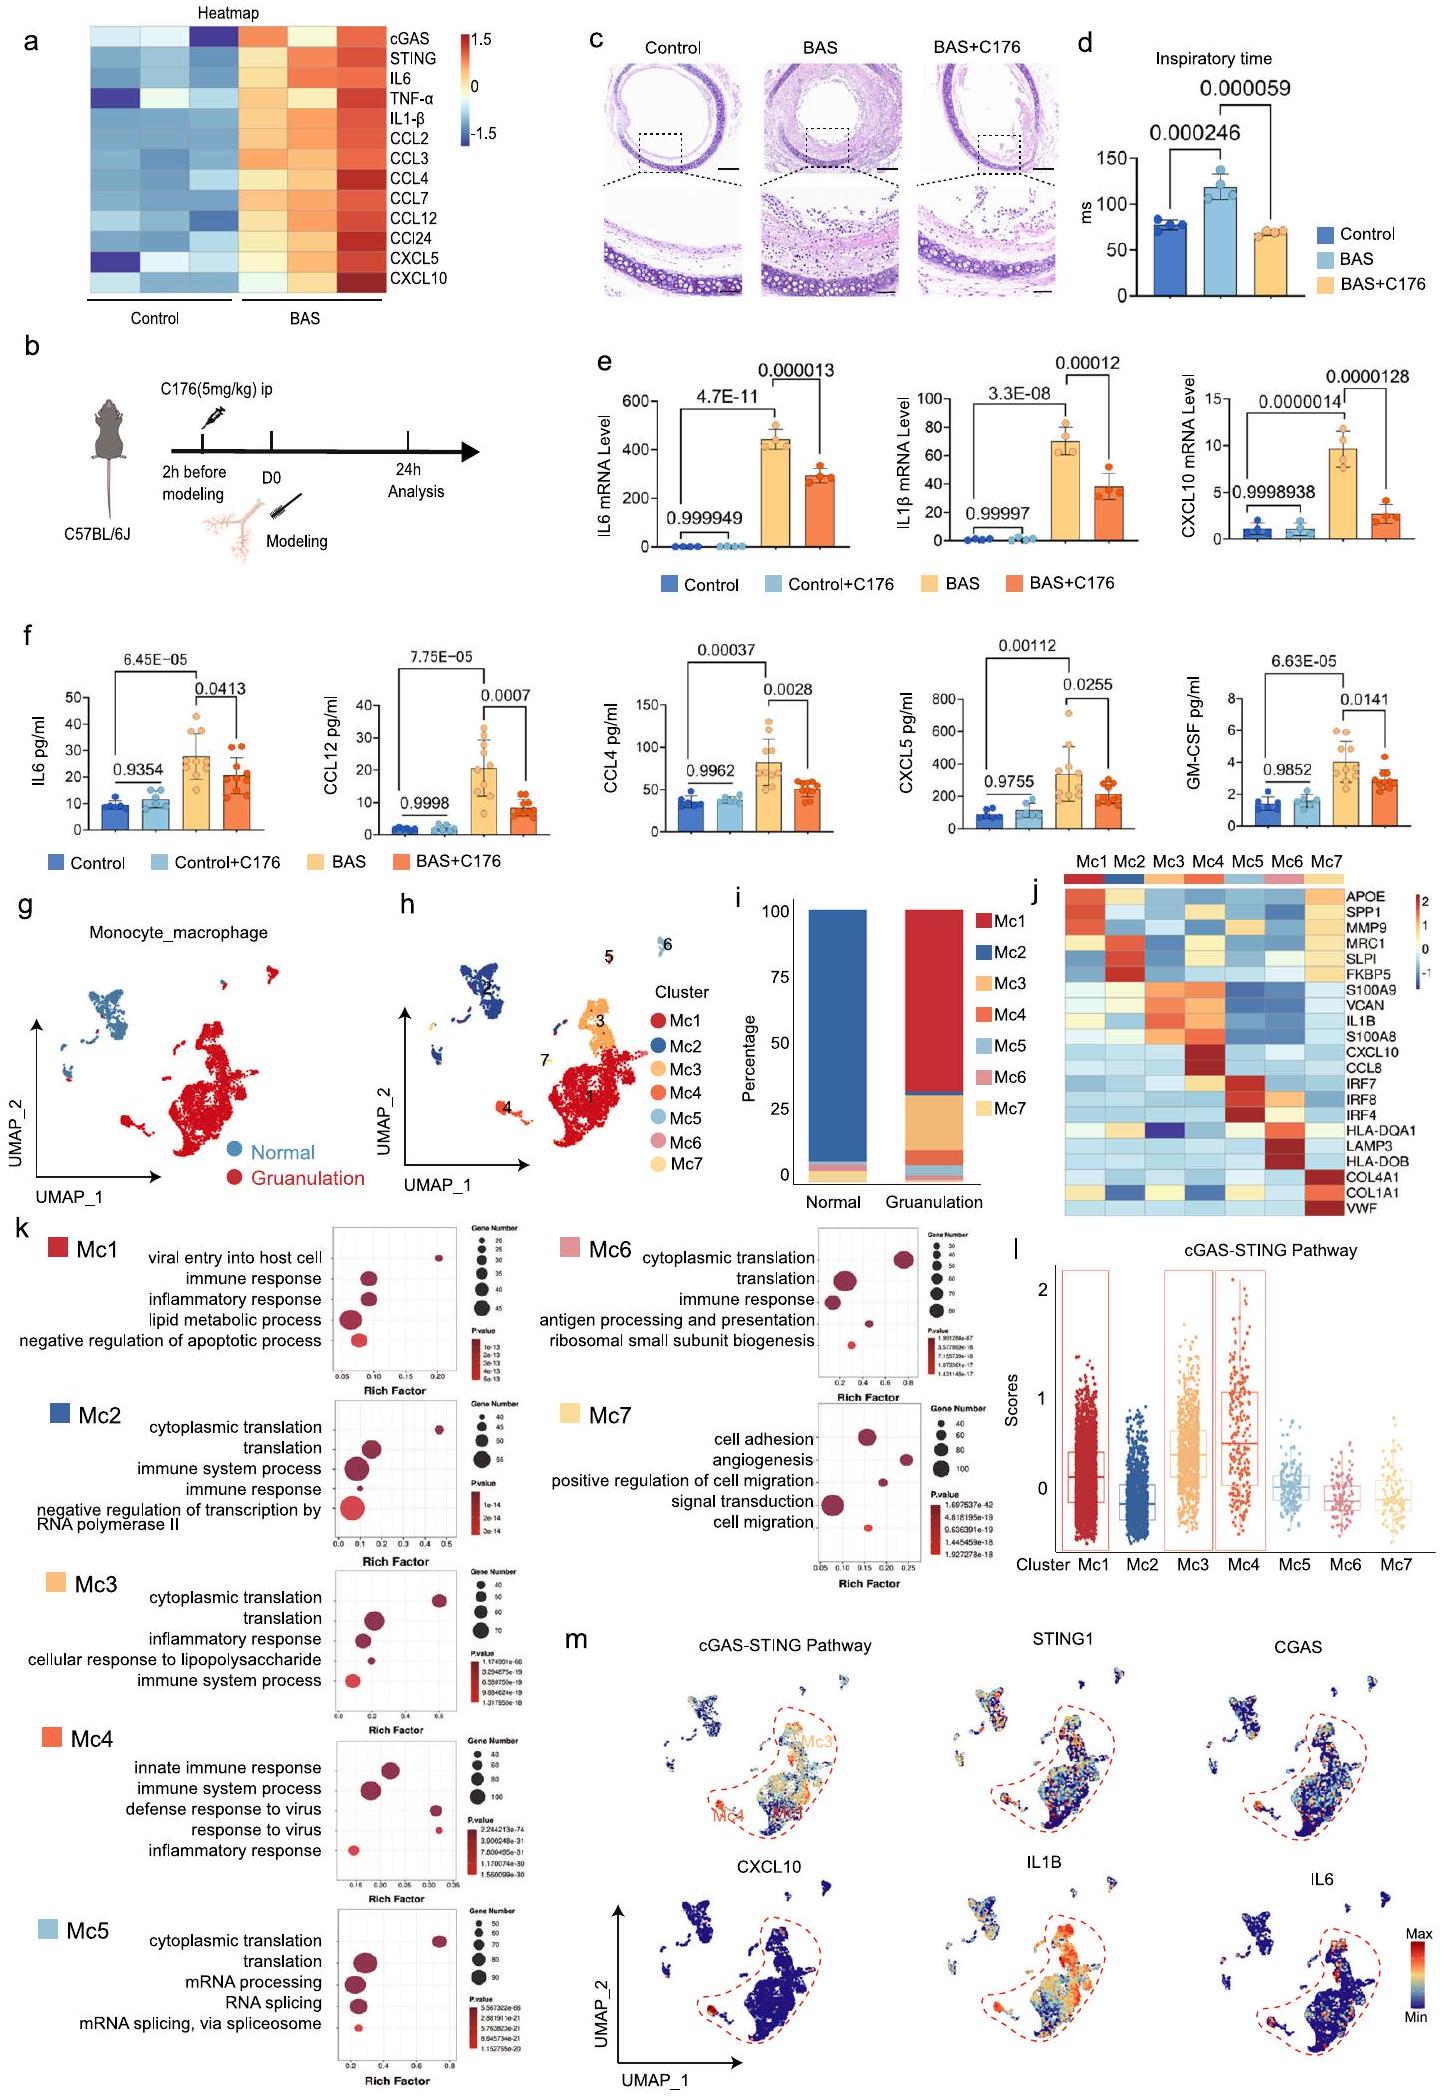
في الوقت الحاضر، العلاج السريري الرئيسي لمرض التهاب الشعب الهوائية الحاد هو إزالة نسيج التندب تحت التنظير القصبي، ولكن هذا يمكن أن يسبب تضيقًا ثانويًا. لذلك، قد يكون التدخل المبكر فعالًا في تخفيف تكاثر نسيج التندب. أظهرت الدراسة الحالية أن STING تم التعبير عنه في المرحلة الالتهابية الحادة المبكرة من BAS وفي المرحلة الالتهابية المزمنة اللاحقة (فرط تنسج التندب). وقد أظهرت الدراسات أن STING مرتبط بقوة بالالتهاب.كما هو موضح في خريطة الحرارة للجينات المعبر عنها بشكل مختلف (DEGs)، كانت جينات STING والالتهابات معبرة بشكل كبير بعد 24 ساعة من إصابة القصبة الهوائية في الفئران المعالجة. مقارنةً بالفئران الضابطة (الشكل 5أ). للتحقيق في دور STING في المرحلة الالتهابية من تضيق مجرى الهواء، تم علاج الفئران بـ C176 (الشكل 5ب). مقارنةً بتلك الخاصة بمجموعة BAS المعالجة بـ PBS، تحسنت أعراض الصفير في مجموعة BAS المعالجة بـ C176 خلال المرحلة الالتهابية من تضيق مجرى الهواء، وأظهرت نتائج صبغة HE أن درجة الوذمة الالتهابية في مجاري الهواء لمجموعة BAS المعالجة بـ C176 قد تحسنت أيضًا (الشكل 5ج). في المرحلة الالتهابية المبكرة، تسبب إصابة مجرى الهواء في التهاب وذمة مجرى الهواء، مما أدى إلى تضيق القصبة الهوائية والصفير.
أظهر اختبار وظائف الرئة غير الغازية أن C176 يمكن أن يقلل بشكل فعال من وقت الشهيق لدى الفئران بعد إصابة القصبة الهوائية، مما يخفف من أعراض الصفير لدى الفئران (الشكل 5d). علاوة على ذلك، أشارت نتائج qRT-PCR إلى أن تعبير IL6 و IL1وكان مستوى CXCL10 في مجموعة BAS المعالجة بـ C176 أقل بكثير من ذلك في مجموعة BAS المعالجة بـ PBS (الشكل 5e). على مستوى البروتين، اقترح الاختبار متعدد العوامل بشكل مشابه أن تعبير عوامل الالتهاب والكيموكينات المرتبطة بالالتهاب قد انخفض بعد إصابة مجرى الهواء في الفئران التي تم حقنها بـ C176.
الشكل 2 | يتم تنشيط إشارة cGAS-STING في القصبة الهوائية للفأر عند الإصابة. رسم تخطيطي لغسل القصبة الهوائية للمريض. ب تحليل كمي لـ dsDNA في سائل غسل القصبة الهوائية في مجموعة التحكم ( ) ومجموعة مرضى BAS ( ). رسم تخطيطي يصف الاستراتيجيات التجريبية في الفئران ذات تضيق مجرى الهواء الحميد. د صبغة H&E تظهر الظروف داخل القصبة الهوائية و LP في الفئران الضابطة و BAS في اليوم السابع. تشير القضبان إلى و تحليل كمي لسمك LP في مجموعة التحكم ومجموعة BASتم جمع أنسجة القصبة الهوائية من الفئران المصابة بـ BAS بعد 24 ساعة من إصابة القصبة الهوائية. تم الكشف الكمي عن dsDNA في سائل غسل القصبة الهوائية للفئران في مجموعة التحكم ومجموعة BAS.فئران لكل مجموعة).صور مناعية فلورية تمثيلية للقصبة الهوائية لـ dsDNA (أخضر) في مجموعة BAS ومجموعة التحكم. تشير القضبان المقياسية إلى و ( فئران لكل مجموعة).تحليل موسوعة كيوتو للجينات والجينومات (KEGG) يظهر أن إصابة القصبة الهوائية زادت من التعبير الجينات المشاركة في عدة عمليات بيولوجية. خريطة حرارية تظهر أن مجموعة BAS زادت من تعبير الجينات المشاركة في مسار مستشعر الحمض النووي السيتوزولي مقارنة بمجموعة التحكم.الفئران لكل مجموعة). تحليل Western blot يظهر مستويات cGAS و PSTING و STING و P-TBK1 و TBK1 و P-P65 و P65 في القصبة الهوائية لمجموعة BAS ومجموعة التحكم (فئران لكل مجموعة)مخطط للروثينيوم.إدارة (ip) في الفئران. 1 صبغة H&E تظهر الظروف داخل القصبة الهوائية و LP في الفئران الضابطة و BAS في اليوم السابع. تشير القضبان المقياسية إلى و أظهرت التحليلات الكمية انخفاض سمك الطبقة تحت المخاطية في مجموعة BAS المعالجة بـ Ru. 521 مقارنةً بمجموعة BAS المعالجة بـ PBS.الفئران لكل مجموعة). يتم تقديم البيانات كمتوسط ± SEM. تم استخدام اختبار T ثنائي الجانب في (ب، هـ، و). تم استخدام اختبار هايبرجومتريك في (ح). تم استخدام تحليل ANOVA أحادي الاتجاه متبوعًا باختبار المقارنة المتعددة Tukey في (م). تم توفير بيانات المصدر كملف بيانات مصدر. (الشكل 5f). تلعب البلعميات المؤيدة للالتهاب دورًا مهمًا في عملية شفاء الجروح، حيث تنتج السيتوكينات المؤيدة للالتهاب، مثل TNF-a و IL6 ووسائط أخرى تعزز شفاء الجروح.تم تحليل تجمعات البلعميات في بيانات تسلسل RNA أحادي الخلية بشكل منفصل، حيث كان هناك 1216 خلية في المجموعة الطبيعية و4409 خلايا في مجموعة التكوين (الشكل 5 ج). تم تصنيف البلعميات إلى سبعة تجمعات وظيفية (Mc1-Mc7) (الشكل 5 ح). من بين هذه التجمعات، كانت تجمعات Mc5 وMc6 وMc7 موجودة في كلا المجموعتين. كانت المجموعة الطبيعية تحتوي بشكل أساسي على تجمعات M2، بينما كانت مجموعة التكوين تحتوي بشكل أساسي على تجمعات Mc1 وعدد قليل من تجمعات Mc3 وMc4 (الشكل 5 ط). كانت تجمعات Mc1 تحتوي على أعلى نسبة من الجينات المعبر عنها بشكل مختلف (DEGs) في مجموعة التكوين، مع جينات مميزة تتعلق بتمثيل الدهون، وتنظيم الاستجابات الالتهابية، وتعزيز إصلاح الأنسجة. كانت أعلى 5 عمليات بيولوجية وفقًا لتحليل GO مرتبطة أيضًا بشكل أساسي بالالتهاب والمناعة وتمثيل الدهون (الشكل 5 ي، ك). كانت تجمعات Mc2، التي تشكل الغالبية في المجموعة الطبيعية، تعبر بشكل كبير عن MRC1، مما يشير إلى أنها بلعميات محتفظ بها في الأنسجة، وكشفت تحليلات GO عن ارتباط ترجمي بشكل أساسي (الشكل 5 ي، ك). قدمت تجمعات Mc3 وMc4 الموجودة في مجموعة التكوين ميزات مؤيدة للالتهاب، وكانت الجينات المميزة بشكل رئيسي جينات التهابية مبكرة (IL1B) وبروتينات تحذيرية (S100a8 وS100a9). أشارت تحليلات GO لتجمعات Mc3 وMc4 إلى أن هذه التجمعات كانت مرتبطة بشكل رئيسي بالالتهاب والمناعة. بالإضافة إلى ذلك، اقترحت جينة العلامة VCAN أن تجمعات Mc3 وMc4 كانت موجودة بشكل رئيسي في المصفوفة خارج الخلوية (الشكل 5 ي، ك). كانت IRF4، وهي جينة استقطاب البلعميات، جينة العلامة لتجمع M5، مما يشير إلى أن هذا التجمع قد يستقطب نحو بلعميات مؤيدة للإصلاح (الشكل 5 ي، ك).أظهر تجمع Mc6 نشاط معالجة المستضدات وعبر عن HLA-DQA1 وLAMP3 وHLA-DOB، المرتبطة بعرض المستضدات، وكانت مصطلحات GO تشمل معالجة وعرض المستضدات (الشكل 5j، k). أظهر Mc7 نشاطًا إصلاحيًا وكولاجينيًا، وعبر عن جينات مرتبطة بمصفوفة ECM الكولاجينية (COL1A1 وCOL4A1) ومصطلحات GO المتعلقة بإصلاح الأنسجة (التصاق الخلايا وهجرة الخلايا) (الشكل 5j، k). كما عبر Mc7 عن جين مرتبط بإصلاح الأوعية الدموية (VWF)، مما يشير إلى أنه يشارك أيضًا في تكوين الأوعية الجديدة في نسيج التندب (الشكل 5j). تم تقييم درجة مسار cGAS-STING عبر التجمعات، مما كشف عن درجات أعلى لـ Mc1 وMc3 وMc4 (الشكل 51). بالإضافة إلى ذلك، كانت عدة عوامل التهابية، مثل IL6 وIL13 وCXCL10، مركزة بشكل رئيسي في تجمعات Mc1 وMc3 وMc4 (الشكل 5m). نظرًا لأن ماكروفاجات Mc1 وMc3 وMc4 كانت مرتبطة بشكل رئيسي بالالتهاب (الشكل 5j، k)، فإن تجمعات الماكروفاجات ذات درجات مسار cGAS-STING العالية قد تكون مرتبطة بالالتهاب. بشكل عام، تشير هذه النتائج إلى أنه في المراحل المبكرة من إصابة مجرى الهواء، يعزز تنشيط STING في الماكروفاجات داخل مجرى الهواء التعبير عن عوامل الالتهاب.
تعمل البلعميات على تعزيز تنشيط الألياف عبر محور IL6STAT3
أظهر تحليل إثراء مجموعة الجينات (GSEA) باستخدام مجموعات الجينات الرئيسية من MSigDB أنه بالمقارنة مع المجموعة الطبيعية، كانت مجموعة التكتل تم إثراءه بشكل رئيسي في المسارات المرتبطة بالالتهابات، والمسارات المتعلقة بنمو الخلايا، والمسارات المتعلقة بالإجهاد التأكسدي (الشكل 6أ). من بين هذه المسارات، كانت مسار IL6-STAT3 المرتبطة بالتجديد (الشكل 6ب) قد أظهرت أنها مرتبطة بالتليف.تم الإبلاغ مؤخرًا عن أن STAT3 يتم التعبير عنه بشكل مرتفع في نسيج الترقوة الحبيبي لدى المرضى الذين يعانون من BAS.. بعد ذلك، قامت الدراسة الحالية بتحليل بيانات scRNA-seq وكشفت أن مسار JAK-STAT مرتبط بشكل أساسي بالخلايا الليفية (الشكل 6c). أظهرت تحليل المناعة النسيجية أن نسيج التندب من المرضى الذين يعانون من BAS كان لديه مستوى عالٍ من فسفرة STAT3 وSTING مقارنةً بالمجاري الهوائية الطبيعية (الشكل 6d). كان تركيز درجة مسار cGAS-STING بشكل رئيسي على الخلايا المناعية، مثل البلعميات، وخلايا T، والعدلات (الشكل 2h). مقارنةً بخلايا T والعدلات، تتفاعل البلعميات بقوة مع الخلايا الليفية وفقًا لتحليل ligand-receptor من CellPhoneDB (الشكل 6e). تم تقييم مستويات تعبير IL6 عبر scRNA-seq، والذي كشف أن تعبير IL6 زاد في البلعميات، والخلايا العضلية الملساء، والخلايا الليفية، والخلايا البطانية (الشكل التكميلية 6a). تم تقييم الخلايا التي تعبر عن كل من STING وIL6 في المجموعات الأربع، مما أشار إلى أن أقوى ارتباط بين تعبير STING وIL6 كان في مجموعة البلعميات (الشكل التكميلية 6b). للتحقيق في العلاقة بين البلعميات والخلايا الليفية، تم معالجة الفئران مع ليفوسومات الكلودرونات (الشكل 6f). اقترحت تحليل تدفق الخلايا أنه خلال المرحلة الالتهابية، كانت تسلل البلعميات أكبر بكثير في مجموعة BAS التي تم حقنها بـ PBS مقارنةً بمجموعة التحكم التي تم حقنها بـ PBS، ولكن نسبة البلعميات في مجموعة BAS انخفضت بوضوح بعد حقن ليفوسومات الكلودرونات مقارنةً بتلك في مجموعة PBS (الشكل التكميلية 7c). اقترحت النتائج النسيجية أنه بعد حقن ليفوسومات الكلودرونات، تم تثبيط التكاثر الحبيبي في القصبة الهوائية للفئران في مجموعة BAS بشكل كبير مقارنةً بتلك في مجموعة الحقن بـ PBS في اليوم السابع (الشكل 6g). علاوة على ذلك، كانت سماكة LP في مجموعة BAS المعالجة بليفوسومات الكلودرونات أصغر بكثير من تلك في مجموعة BAS المعالجة بـ PBS (الشكل 6h). تم استكشاف الفوائد العلاجية المحتملة لتثبيط العملية التليفية في BAS في اليوم الرابع عشر بعد إصابة القصبة الهوائية. قدمت مجموعة BAS المعالجة بـ PBS تندب ليفي في حلقات القصبة الهوائية، ولكن مجموعة BAS المعالجة بليفوسومات الكلودرونات لم يكن لديها ترسب ليفي مفرط في موقع إصابة القصبة الهوائية، بل كانت في حالة قصبة هوائية مصابة فقط (الشكل 6g). علاوة على ذلك، كانت سماكة LP في مجموعة BAS المعالجة بليفوسومات الكلودرونات لا تزال أقل من تلك في مجموعة BAS المعالجة بـ PBS (الشكل 6h). اقترحت بيانات Micro-CT أن الكائنات النمائية المفرطة في القصبة الهوائية للفئران كانت أصغر بكثير بعد حقن الكلودرونات (الشكل 6i، j). بعد ذلك، تم تحليل درجة تضيق القصبة الهوائية على المستوى الأفقي، مما كشف أن درجة التضيق في مجموعة BAS المعالجة بليفوسومات الكلودرونات كانت أقل من تلك في مجموعة BAS المعالجة بـ PBS (الشكل 6k). وبالتالي، اقترحت هذه النتائج أن استنفاد البلعميات يخفف من تقدم BAS، مما يشير إلى أن البلعميات قد تلعب دورًا مهمًا في التليف في BAS. للتحقيق في دور البلعميات في التليف في BAS، تم إجراء RNA-seq على الفئران.
بعد 7 أيام من النمذجة، وكذلك في مجموعة الفئران التي تم حقنها بالليبوسومات الكلودرونات بعد 7 أيام من النمذجة. أظهر تحليل علم الأحياء الجيني (GO) للترانسكريبتوم أن الجينات المعبرة بشكل مكثف، مثل الجينات المتعلقة بتنظيم المصفوفة خارج الخلوية، التصاق الخلايا، ثلاثيات الكولاجين، المصفوفة خارج الخلوية المحتوية على الكولاجين، والمكونات الهيكلية للمصفوفة خارج الخلوية التي تمنح القوة الشد، في مجموعة BAS المعالجة بـ PBS والمعالجة بالليبوسومات الكلودرونات كانت مرتبطة بشكل أساسي بالتليف مقارنة بتلك الموجودة في
مجموعة التحكم؛ ومع ذلك، كانت درجة الإثراء أقل في مجموعة الفئران التي تم حقنها بالليبوسومات الكلودرونات مقارنة بمجموعة الفئران التي تم حقنها بـ PBS (الشكل التوضيحي 8a). أظهر خريطة حرارية لنتائج تسلسل RNA أن تعبير الجينات المتعلقة بالالتهاب والجينات المتعلقة بالتليف كان مرتفعًا بشكل ملحوظ مقارنة بمجموعة التحكم، لكن درجة الزيادة في مجموعة BAS المعالجة بالليبوسومات الكلودرونات كانت أقل من تلك في مجموعة BAS المعالجة بـ PBS (الشكل التوضيحي 8b). GSEA لـ KEGG
الشكل 3 | تم التعبير عن STING في مراحل مختلفة من BAS. تم جمع عينات من القصبة الهوائية من مجموعة التحكم من الفئران ومجموعة BAS من الفئران عندأيام، و7 أيام بعد النمذجة، وصور مناعية تمثيلية لـ P-STING (أخضر)، البلعميات (المعلمة بـ F4/80، وردي)، الخلايا الليفية (المعلمة بـ aSMA، أحمر) في أنسجة القصبة الهوائية للفئران. تشير القضبان المقياسية إلىوفأر لكل مجموعة). تم جمع أنسجة القصبة الهوائية من الفئران التي تعاني من BAS بعد 24 ساعة من إصابة القصبة الهوائية. تُظهر الرسوم البيانية لتدفق السيتومتر النسبة المئوية لـ STINGالبلاعم في كريات الدم البيضاء في القصبة الهوائية (CD45خلايا)، وأظهرت النتائج أن النسبة كانت أعلى بشكل ملحوظ في مجموعة BAS مقارنة بمجموعة التحكم (فأر لكل مجموعة). صور مناعية تمثيلية للقصبة الهوائية لـ STING (أخضر)، والبلاعم (المعلمة بـ F4/80، أحمر) في الفئران (فأر لكل مجموعة). تشير القضبان المقياسية إلىو. تشير الأسهم الحمراء إلى STING
البلاعم. تم جمع أنسجة القصبة الهوائية من الفئران التي تعاني من BAS بعد 7 أيام من إصابة القصبة الهوائية. تشير النتائج المناعية الكيميائية إلى أن STING يعبر في القصبة الهوائية للفئران المصابة بـ BAS في مرحلة التكوين في اليوم السابع (فأر لكل مجموعة). تشير القضبان المقياسية إلىو. صور مناعية تمثيلية للقصبة الهوائية لـ STING (أخضر)، والخلايا الليفية (المعلمة بـ aSMA، أحمر) في الفئران (فأر لكل مجموعة). الخط المنقط الأصفر: مناطق التعبير المشترك لـ STING و aSMA. تشير القضبان المقياسية إلىو. صور مناعية تمثيلية للقصبة الهوائية لـ STING (أخضر)، والخلايا الظهارية (المعلمة بـ Ecad، أحمر) في الفئران (فأر لكل مجموعة). الخط المنقط الأصفر: مناطق التعبير المشترك لـ STING و E-cad. تشير القضبان المقياسية إلىو. يتم تقديم البيانات كمتوسط ± SEM. تم استخدام اختبار T لطلبة ذو جانبين في (ج). تم توفير بيانات المصدر كملف بيانات مصدر.
أظهرت مجموعات الجينات انخفاضًا في إثراء مسار استشعار الحمض النووي السيتوزولي، ومسار NFkb، والمسارات المتعلقة بإصلاح الأنسجة، مثل تفاعل مستقبلات ECM والتصاق الخلايا، بعد إدارة الليبوسومات الكلودرونات (الشكل التوضيحي 8c). من الجدير بالذكر أن نتائج صبغة ماسون أظهرت أن مجموعة BAS المعالجة بالليبوسومات الكلودرونات قدمت مستوى أقل من إعادة ترسيب ألياف الكولاجين مقارنة بمجموعة BAS المعالجة بـ PBS (الشكل 61، م). اقترحت نتائج المناعة الفلورية أن مستويات التعبير لـ SMA والكولاجين-1 كانت مرتفعة بشكل ملحوظ في مجموعة BAS؛ ومع ذلك، كانت مستويات التعبير لـ SMA والكولاجين-1 في مجموعة BAS المعالجة بالليبوسومات الكلودرونات أقل من تلك في مجموعة BAS المعالجة بـ PBS (الشكل 6ن، ص). استكشفت الدراسة الحالية آلية تعزيز البلاعم لتفعيل الخلايا الليفية. أظهر تحليل إثراء مجموعة الجينات للتغيرات النسخية عبر المسارات الرئيسية المنسقة زيادة قوية في مسار IL6-STAT3، مما يشير إلى درجة عالية من الإثراء في الفئران المصابة بـ BAS (الشكل التوضيحي 9a). بعد ذلك، تم معالجة الفئران بـ STATTIC، مثبط لـ STAT3، على الفئران (الشكل التوضيحي 9b). أظهرت صبغة HE أن تكاثر التكوين في القصبة الهوائية تم حظره وأن سمك LP قد انخفض بشكل ملحوظ في مجموعة BAS المعالجة بـ STATTIC مقارنة بمجموعة BAS المعالجة بـ PBS (الشكل التوضيحي 9c، د). اقترحت هذه البيانات أن STAT3 يلعب دورًا مهمًا في تقدم BAS. أشارت نتائج تسلسل RNA إلى أن مسار IL6-STAT3 كان أقل إثراءً في مجموعة BAS المعالجة بالليبوسومات الكلودرونات مقارنة بمجموعة BAS المعالجة بـ PBS (الشكل 6ص) بعد ذلك، تم التحقيق في دور البلاعم على STAT3. بعد استنفاد البلاعم، كانت مستويات التعبير لـ IL6 ومستوى فسفرة STAT3 في القصبة الهوائية للفئران المصابة بـ BAS أقل بشكل ملحوظ من تلك في مجموعة BAS المعالجة بـ PBS (الشكل 6ق، ر). لتقييم تأثير IL6 على BAS، تم معالجة الفئران بمضاد IL6 المحايد وإضافة IL6 الخارجي (الشكل التوضيحي 9e). أظهرت صبغة HE أن تكاثر نسيج التكوين قد تم تخفيفه باستخدام مضاد IL6 المحايد، بينما زادت إضافة IL6 الخارجي من نمو نسيج التكوين (الشكل التوضيحي 9f). بالإضافة إلى ذلك، انخفض سمك طبقة LP وزاد مع معارضة IL6 والإضافة، على التوالي (الشكل التوضيحي 9g). أظهر تحليل المناعة الفلورية أن استخدام مضاد IL6 المحايد قلل من مستوى فسفرة STAT3 وتفعيل الخلايا الليفية، بينما زادت إضافة IL6 من مستوى التعبير عن فسفرة STAT3 وتفعيل الخلايا الليفية (الشكل التوضيحي 9h، أنا). كشفت هذه البيانات أن استنفاد البلاعم مفيد لتخفيف عملية التليف في BAS، وأن التفاعل بين البلاعم والخلايا الليفية يتم عبر مسار إشارة IL6-STAT3.
يُفعل الحمض النووي القصبي مسار STING في البلاعم مما يعزز تفعيل الخلايا الليفية عبر محور IL6-STAT3. يمكن أن يُفعل الحمض النووي الثنائي السلسلة الناتج عن موت الخلايا STING في البلاعم، مما يعزز إفراز العوامل الالتهابية. أكدت الدراسة الحالية أن هناك إفراز كبير للحمض النووي الثنائي السلسلة بعد إصابة القصبة الهوائية والعديد من المسارات المعبرة بشكل كبير المرتبطة بـ
إصلاح تلف الحمض النووي بعد 24 ساعة من إصابة القصبة الهوائية (الشكل 7أ).تم تحديد علامة H2AX، التي ترتبط عادةً بتلف الحمض النووي، بعد 24 ساعة من عملية النمذجة، وكانت معبرًا عنها بشكل رئيسي في الظهارة الهوائية بعد الإصابة (الشكل 7ب). أظهرت صبغة المناعية الفلورية أن التداخل بين علامة البلعميات F4/80 مع الحمض النووي الحر dsDNA وcGAS وكذلك P-STING في القصبة الهوائية المصابة (الشكل 7ج). للتحقق مما إذا كان الحمض النووي الحر dsDNA يعمل على استقطاب البلعميات بعد إصابة القصبة الهوائية، تم معالجة الفئران بـ DNase I (الشكل التكميلية 10أ). انخفض محتوى الحمض النووي dsDNA في سائل غسل القصبة الهوائية للفئران بشكل كبير بعد استخدام DNase I (الشكل التكميلية 10ب). علاوة على ذلك، تم تحسين درجة الالتهاب والوذمة بعد إصابة القصبة الهوائية في الفئران أيضًا مع استخدام DNase I (الشكل التكميلية 10ج). أشارت تحليلات المناعة الفلورية وقياس التدفق الخلوي إلى أن تسرب البلعميات في القصبة الهوائية للفئران قد انخفض بشكل كبير بعد استخدام DNase I (الشكل التكميلية 10د-ز). بعد ذلك، تم استخدام سوائل الخلايا الظهارية الميتة (DECS) لزراعة BMDMs (الشكل 7د). بعد موت الخلايا الظهارية الناتج عن الأشعة فوق البنفسجية، احتوت DECS على كمية كبيرة من الحمض النووي dsDNA (الشكل 7هـ، و). علاوة على ذلك، ارتفع مستوى فسفرة STING في BMDMs بشكل كبير بعد 24 ساعة من الزراعة مع DECS (الشكل 7ز، ح). تم الحصول على الحمض النووي من القصبة الهوائية من الفئران بعد 24 ساعة من النمذجة، تلاها تنشيط BMDMs (الشكل 7ط). أظهر تحليل Western blot زيادة في مستوى فسفرة STING في BMDMs بعد نقل الحمض النووي من القصبة الهوائية (الشكل 7ي، ك). علاوة على ذلك، كشفت تحليلات المناعة الفلورية أن مستوى التعبير عن P-STING في BMDMs زاد بعد نقل الحمض النووي من القصبة الهوائية، بينما انخفض بعد العلاج بـ DNase I (الشكل 71، م). أظهرت نتائج ELISA أن تركيز IL6 في السائل الثقافي لـ BMDMs زاد بشكل كبير بعد نقل الحمض النووي من القصبة الهوائية (الشكل 7ع). اقترحت تحليلات qRT-PCR أن BMDMs التي تم نقلها بالحمض النووي أظهرت مستويات أقل بكثير من IL6 بعد العلاج بـ C176، وهو مثبط لـ STING (الشكل 7ص). معًا، اقترحت هذه النتائج أن تثبيط STING كان قادرًا أيضًا على تقليل مستوى فسفرة STAT3. أشارت تحليلات المناعة الفلورية إلى أنه في القصبة الهوائية للفئران KO لـ STING مع BAS، كان تعبير IL6 وSTAT3 أقل بكثير من ذلك في القصبة الهوائية من النوع البري مع BAS (الشكل 7ق، ر). لذلك، اقترحت هذه النتائج أن تثبيط STING في البلعميات يتبعه انخفاض في تعبير IL6، مما يثبط التليف عن طريق قمع تنشيط STAT3 في الخلايا الليفية. بعد ذلك، تم زراعة BMDM مع الخلايا الليفية وتم استخدام الحمض النووي من القصبة الهوائية لتنشيط STING في BMDMs (الشكل 7س). مقارنةً بتلك الموجودة في مجموعة التحكم، أشارت تحليلات المناعة الفلورية إلى أن تعبير P-STAT3 وαSMA في الخلايا الليفية في مجموعة الزراعة المشتركة زاد، ولكن تعبير P-STAT3 وαSMA انخفض بعد إضافة C176 إلى الزراعة المشتركة لـ BMDMs والخلايا الليفية التي تم نقلها بالحمض النووي (الشكل 7ع، ف). اقترحت هذه النتائج أن الحمض النووي dsDNA الذي تم إطلاقه بعد إصابة القصبة الهوائية ينشط مسار STING في البلعميات، مما يعزز تعبير عامل الالتهاب IL6، الذي ينشط بدوره تعبير STAT3 في الخلايا الليفية، مما يعزز تنشيط الخلايا الليفية لتسريع التليف في المرضى الذين يعانون من تضيق مجرى الهواء الحميد.
الشكل 4 | قمع STING يقلل من تطور BAS. أ رسم تخطيطي لإدارة C176 في الفئران. ب تحليل Western blot يظهر تعبير P-STING و STING في القصبة الهوائية للفئران بعد 24 ساعة من النمذجة في مجموعة التحكم، مجموعة BAS المعالجة بـ PBS ومجموعة BAS المعالجة بـ C176.الفئران لكل مجموعة). ج صبغة H&E تظهر حالات داخل القصبة الهوائية والطبقة الأساسية في مجموعة التحكم، مجموعة BAS المعالجة بـ PBS ومجموعة BAS المعالجة بـ C176 (فئران لكل مجموعة). تشير القضبان إلى و أظهرت التحليلات الكمية انخفاض سمك الطبقة تحت المخاطية في مجموعة BAS المعالجة بـ C176 مقارنةً بمجموعة BAS المعالجة بـ PBS.الفئران لكل مجموعة). يظهر صبغ H&E الظروف داخل القصبة الهوائية والطبقة الأساسية في مجموعة التحكم WT، مجموعة التحكم STING KO، مجموعة BAS WT، مجموعة BAS STING KO (فئران لكل مجموعة). تشير القضبان إلى و أظهر المقارنة الكمية لسمك القصبة الهوائية انخفاضًا في سمك مجموعة STING KO BAS مقارنة بمجموعة WT BAS. مجموعات من الفئران). ج، ح مقاطع القصبة الهوائية ملونة بصبغة ماسون ثلاثية الألوان لمجموعات مختلفة من الفئران، وكان محتوى الكولاجين النسبي منخفضًا في مجموعة STING KO BAS مقارنة بمجموعة WT BAS (فئران لكل مجموعة). تشير القضبان إلى و “. رسم تخطيطي للأشعة المقطعية لمنطقة تضيق القصبة الهوائية التي تم قياسها بواسطة SYNPASE 3D، وأظهرت النتائج أن منطقة تضيق القصبة الهوائية في مجموعة STING KO BAS كانت أصغر بكثير من تلك في مجموعة WT BAS (فئران لكل مجموعة). ج. صور الأشعة المقطعية الدقيقة لمجموعات مختلفة في المستوى الأفقي، والمستوى التاجي، والمستوى السهمي مع أسهم حمراء تشير إلى موقع التضيق.إعادة بناء SYNPASE ثلاثية الأبعاد لقصبة هوائية الفأر مع أسهم حمراء تشير إلى موقع التضيق. يتم تقديم البيانات كمتوسط ± الانحراف المعياري. تم استخدام اختبار T ثنائي الجانب في (ب). تم استخدام تحليل ANOVA أحادي الاتجاه متبوعًا باختبار المقارنة المتعددة Tukey في (ب، د). تم استخدام تحليل ANOVA ثنائي الاتجاه متبوعًا باختبار المقارنة المتعددة Tukey في (ف، ح، ط). يتم توفير بيانات المصدر كملف بيانات المصدر.
نقاش
في السنوات الأخيرة، مع زيادة سيارات الإسعاف للعناية الحرجة، والت intubation الرغامي، وفتح القصبة الهوائية وغيرها من التدخلات، زادت نسبة حدوث BAS تدريجياً. على الرغم من أن الجهاز التنفسي الحالي تتحكم التدخلات في الأعراض على المدى القصير، لكنها تحمل خطر إعادة التضيق. لذلك، فإن تحديد الأهداف العلاجية لمنع تضيق الشرايين التاجية أمر ضروري. كشفت الدراسة الحالية أن تثبيط STING يقلل من درجة التليف المرتبطة بتضيق الشرايين التاجية ويحسن حالة المرضى. التشخيص. من الناحية الميكانيكية، فإن هذا التحسن ناتج عن إطلاق dsDNA من إصابة القصبة الهوائية، مما ينشط إفراز IL6 المعزز بواسطة STING من البلعميات المتسللة خلال المرحلة الالتهابية لتضيق مجرى الهواء الحميد. يزيد IL6 من تنشيط STAT3 في الخلايا الليفية، مما يعزز التليف. تم عرض استراتيجية البحث الشاملة والعملية في الشكل 8. تشير هذه النتائج إلى أن مسار cGAS-STING هو عامل حاسم متورط في تضيق مجرى الهواء الحميد.
تتميز عملية الإصلاح بعد إصابة القصبة الهوائية بخصائص مشابهة لتلك الخاصة بإصابات الأنسجة الرخوة والأعضاء الأخرى، وتشمل أربع مراحل إجرائية، وهي: التوقف عن النزيف، الالتهاب، التكاثر، وإعادة التشكيل.يمكن أن تؤدي عدم التنظيم في أي مرحلة إلى فرط التنسج في نسيج الندبة. تتضمن تقدم تضيق مجرى الهواء الحميد تنشيط بعض خلايا المناعة، والسيتوكينات، ومجموعة من مسارات الإشارة. وبالتالي، يتم التعرف الآن على BAS كـ
الشكل 5 | يرتبط تعبير STING في البلعميات في BAS بالالتهاب – خريطة حرارية تظهر أن مجموعة BAS زادت من تعبير الجينات المرتبطة بـ cGAS و STING وعوامل الالتهاب مقارنة بمجموعة التحكم بعد 24 ساعة من إصابة القصبة الهوائية.الفئران لكل مجموعة). ب-ف تم تقسيم الفئران إلى ثلاث مجموعات: مجموعة التحكم، BAS + PBS و BAS + C176. ب مخطط لإدارة C176 في الفئران. ج صور تمثيلية لصبغة H&E في المجموعات المختلفة. تشير القضبان إلى و . مقارنة كمية لمؤشرات وظيفة الرئة (وقت الشهيق) في مجموعات مختلفة (الفئران لكل مجموعة). مستويات mRNA لـ, IL1 و Cxcl10 في القصبة الهوائية من مجموعات مختلفة ( فئران لكل مجموعة).مستويات بروتين عوامل الالتهاب (IL6، CCL12، CCL4، CXCL5 و GM-CSF) في القصبة الهوائية من مجموعات مختلفةفئران لكل مجموعة تحكم،الفئران لكل مجموعة BAS). تحليل تسلسل RNA المرسال باستخدام تقنية sc-RNA لمجموعات البلعميات.تصوير UMAP لمجموعات البلعميات في المجموعة الطبيعية (1216 خلية إجمالاً) ومجموعة التكتل (4409 خلايا إجمالاً). h تصوير UMAP لسبعة أنواع من البلعميات (5625 خلية إجمالاً). i رسم بياني شريطي لنسبة كل نوع في المجموعة الطبيعية ومجموعة التكتل.خريطة حرارية للتعبير عن ثلاثة جينات علامة تمثيلية لكل نوع من الخلايا.رسم نقطي لعمليات علم الأحياء في مصفوفة جينات الأغراض (GO) المعززة للجينات ذات التعبير العالي في كل مجموعة. حجم النقطة يتناسب مع نسبة الخلايا داخل المجموعة التي تعبر عن كل جين، ولون النقطة يتناسب مع إثراء GO.-القيمة. رسم بياني لصندوق يوضح درجة مسار cGAS-STING في جميع المجموعات: Mc1 ( ), مك2( ), مك3 مك4مك 5مك6, مك7 ( ). n تمثل عدد الخلايا في الكتلة. m تصور UMAP لدرجة مسار cGASSTING وتعبير STING وcGAS وIL1B وIL6 وCXCL10 في جميع الكتل. في (I)، تظهر حدود الصندوق النسب المئوية 25 و75، وتظهر الشعيرات النسب المئوية 25 ناقص إلى النسبة المئوية 75 زائدويظهر مركز الصندوق الوسيط. يتم تقديم البيانات كمتوسط ± SEM. تم استخدام تحليل ANOVA أحادي الاتجاه متبوعًا باختبار Tukey للمقارنات المتعددة في (د، هـ). تم استخدام اختبار كروسكال واليس في (و). تم استخدام الاختبار الفائق الهندسي في (ك). يتم توفير بيانات المصدر كملف بيانات المصدر. حدث التهابي ليفي ناتج عن تغييرات مناعيةتلعب مسار cGAS-STING دورًا أساسيًا في المناعة الذاتية، وقد أكدت دراسة سابقة أن الحمض النووي المزدوج الشريطة (dsDNA) الذي يتم إطلاقه بعد الإصابة يزيد من الالتهاب والتليف من خلال تنشيط cGAS-STING.تشير النتائج الحالية إلى أن الدنا المزدوج الشريطة الحر (dsDNA) موجود في القصبة الهوائية لمرضى BAS والفئران بعد كشط القصبة الهوائية باستخدام فرشاة صغيرة. بالإضافة إلى ذلك، اقترحت نتائج تسلسل RNA أن هناك زيادة في الجينات المرتبطة بتلف الدنا في المراحل المبكرة من BAS. لذلك، تشير النتائج الحالية إلى أن الدنا المزدوج الشريطة الناتج عن إصابة القصبة الهوائية قد يعمل كمبادر لمسار cGAS-STING. على الرغم من عدم وجود دراسات تربط مباشرة بين مسار cGAS-STING وBAS، فقد تم إثبات أنه مرتبط بعمليات التليف في أعضاء وأنسجة أخرى.أظهر تحليل تسلسل الخلايا المفردة للقصبة الهوائية الطبيعية ونسج التندب من مرضى BAS أن مسار cGAS-STING كان مفعلًا في نسج التندب. وبالمثل، كشفت النتائج الحالية عن زيادة ملحوظة في تعبير مسار cGAS-STING في نموذج الفئران لمرض BAS. بعد تثبيط أو حذف STING، تم تخفيف الالتهاب والتليف المرتبطين بتضيق مجرى الهواء في الفئران. تشير هذه النتائج إلى أن إشارات cGAS-STING في البلعميات مسؤولة عن مرحلة الالتهاب الحاد وأن إشارات cGAS-STING في الخلايا الليفية قد تكون مسؤولة عن مرحلة الالتهاب المزمن للتندب. قد يؤدي إعطاء C176 كل يومين إلى تخفيف التندب عن طريق تقليل الالتهاب، مما يشير إلى أن C176 قد يكون مرشحًا محتملاً كدواء لمرض BAS.
تعتبر المرحلة الالتهابية مرحلة مهمة في عملية التليف الناتجة عن تضيق مجرى الهواء الحميد. الغرض من هذه الطريقة هو إزالة العوامل الممرضة والأنسجة النخرية لوضع الأساس لتجديد الأنسجة وإصلاحها. في الدراسة الحالية، تم تنشيط مسار cGAS-STING بشكل كبير خلال المرحلة الالتهابية لتضيق مجرى الهواء الحميد، وكانت مثبطات STING فعالة في تخفيف التهاب مجرى الهواء. خلال المرحلة الالتهابية للتليف، تتسلل العديد من الخلايا الالتهابية، مثل العدلات، البلعميات، واللمفاويات. تلعب البلعميات دورًا مهمًا في المرحلة الالتهابية من خلال عملها كجامعات، حيث تبتلع الخلايا الميتة والحطام في محيطها بينما تفرز كمية كبيرة من السيتوكينات (IL6، IL1 وTNF). ) تم الإبلاغ عن أن التنشيط الشاذ لمسار cGAS-STING في البلعميات مرتبط بأمراض تتعلق بالتليف.في الدراسة الحالية، تم تسرب عدد كبير من البلعميات التي تعبر عن STING إلى القصبة الهوائية خلال المرحلة الالتهابية من تضيق مجرى الهواء الحميد في الفئران. وبالمثل، كشفت تحليل scRNAseq أن مجموعة البلعميات ذات الدرجات العالية من مسار cGAS-STING كانت مرتبطة بقوة باستجابة التهابية. لذلك، تشير هذه النتائج إلى أن تعبير STING في البلعميات المتسللة خلال المرحلة الالتهابية من تضيق مجرى الهواء الحميد مرتبط بالالتهاب. بالإضافة إلى ذلك، فإن تحفيز BMDMs باستخدام dsDNA من خلايا الظهارة الميتة ومن القصبة الهوائية للفئران نشط STING.
الخلايا الليفية هي الخلايا الفعالة الرئيسية لتراكم وإعادة توجيه المصفوفة خارج الخلوية في الأمراض التليفية.من المثير للاهتمام، الدراسة الحالية اكتشفت الخلايا الليفية التي تعبر عن STING في القصبة الهوائية للفئران المعالجة بـ BSA في مرحلة الالتهاب المزمن. تنشيط STING في الخلايا الليفية عبر نقل الحمض النووي للقصبة الهوائية للفئران عزز التليف في الخلايا الليفية، وتم تثبيط هذا التأثير عن طريق تقليل مستوى STING. الدراسات السابقة أشارت إلى أنه خلال احتشاء عضلة القلب (MI)، يمكن أن يؤدي تحفيز مسار cGAS-STING في البلعميات المتسللة إلى تليف الخلايا الليفية القلبية.مما يشير إلى أن نفس الوضع قد يوجد داخل نظام المناعة الأساسي. وقد أظهرت الأبحاث أن القضاء على البلعميات خلال المراحل الأولية من الالتهاب يمكن أن يساعد في تقليل تكوين الندبات.وفقًا لهذا المنظور، كشفت الدراسة الحالية عن وجود تليف أقل بشكل ملحوظ في الفئران التي تعاني من تضيق مجرى الهواء الحميد بعد استنفاد البلعميات في الفئران. أظهر تسلسل RNA للفئران وبيانات scRNA-seq أن عملية التليف قد تتأثر من خلال مسار IL6-STAT3. على الرغم من أن مسار IL6-STAT3 قد تم إثبات ارتباطه بمرض التليف.لم تؤكد أي دراسات أن هذا المحور يلعب دورًا في BAS. في هذه الدراسة، أظهرت الدراسة الحالية أن مستوى فسفرة STAT3 كان مرتفعًا في نسيج التكوين الحبيبي القصبي البشري، وأن تليف القصبة الهوائية قد تم تخفيفه في فئران BAS بعد تثبيط P-STAT3. بالإضافة إلى ذلك، تم استكشاف دور IL6 في BAS. تم تخفيف تليف القصبة الهوائية في فئران BAS أو تفاقمه بعد استخدام جسم مضاد محايد لـ IL6 أو تكملة بـ IL6. كما أظهرت الدراسة الحالية أن تنشيط STING في البلعميات يعزز إفراز IL6 وأن إفراز IL6 من البلعميات قد انخفض بعد استخدام مثبطات STING. بالإضافة إلى ذلك، زادت مستويات التعبير عن P-STAT3 وعلامات التليف في الخلايا الليفية بعد زراعة BMDMs المنشطة بـ DNA القصبي مع الخلايا الليفية. كما أظهرت الدراسة الحالية أن البلعميات في نسيج التكوين الحبيبي أظهرت مستويات مرتفعة بشكل ملحوظ من IL6 مقارنة بتلك الموجودة في نسيج القصبة الهوائية الطبيعي، وأن هذه البلعميات أظهرت مستويات تعبير عالية من و CXCL1O (الشكل 5 م). علاوة على ذلك، أدى العلاج بمثبط C176 STING إلى تقليل كبير في تعبير هذه السيتوكينات (الشكل 5e)، مما يشير إلى الدور المحتمل لمسار cGAS-STING في تطور BAS. وقد أثبتت الدراسات السابقة وجود علاقة قوية بين IL-1 وأمراض ليفية متنوعة، وقد تم اقتراح أن CXCL10 ضروري لعملية كيمياء الخلايا المناعية. IL-1لقد تم الإشارة إلى أنه متورط في تنشيط الإنفلامازوم، ووجدنا أن إنفلامازوم AIM2 قد لا يلعب دورًا في BAS. بالإضافة إلى إنفلامازوم AlM2، يتم تنشيط إنفلامازوم NLRP3 وإنفلامازوم NLRP1 أيضًا IL-1.. لذلك، قمنا بتحليل بيانات النسخ الجيني للقصبة الهوائية لفئران BAS ووجدنا أن NLRP3 و NLRP1 كانا معبرين بشكل كبير (الشكل التكميلي 3f). وفي بيانات تسلسل RNA المفرد، IL-1كان معبرًا عنه بشكل كبير بشكل رئيسي في البلعميات والخلايا المتعادلة، حيث كان هناك تعبير مرتفع عن NLRP3 في البلعميات وNLRP1 في الخلايا المتعادلة (الشكل التكميلي 3g). لذلك، كان IL-1 المعبر عنه بشكل كبيرلا يتعلق AIM2 في BAS، ولكنه يتعلق بـ NLRP3 و NLRP1. وقد تم التأكيد على أن مسار cGAS-STING يؤدي أيضًا إلى تنشيط NLRP3.. تشير هذه النتائج إلى أن IL-1و CXCL10
الشكل 6 | تعزز البلعميات تنشيط الألياف عبر محور IL6-STAT3. أ تحليل GSEA يظهر أعلى 5 مسارات مميزة في مجموعة التكوين مقارنةً بمجموعة الطبيعية. ب تحليل GSEA يظهر إثراء مسار IL6 jak STAT3 في مجموعة التكوين. ج مخطط الصندوق يظهر درجة مسار JAK-STAT في جميع المجموعات في مجموعة الطبيعية ومجموعة التكوين: خلايا B (الخلايا القاعدية )، خلايا مهدبة ( ) ، خلايا بطانة الأوعية الدموية ( ) ، خلايا الظهارة الخلايا الليفية (الخلايا البدينة (الخلايا البلعمية ( الخلايا المتعادلة ( خلايا البلازما (الخلايا المتكاثرة )، الشركات الصغيرة والمتوسطة خلاياوخلايا الحويصلات الهوائية من النوع الثاني. ن تمثل عدد الخلايا في الكتلة. د صور تمثيلية لتلوين P-STAT3 و P-STING المناعي النسيجي. (عينة لكل مجموعة). توضح خريطة الحرارة تفاعلات الليغاند-المستقبل بين البلعميات، وخلايا T، والعدلات، والأرومات الليفية.تم تقسيم الفئران إلى ثلاث مجموعات: مجموعة التحكم، BAS + PBS وBAS + ليفوسومات كلودرونات. الشكل التوضيحي لإدارة ليفوسومات كلودرونات في الفئران.صور تمثيلية لصبغة H&E في مجموعات مختلفة في اليومين 7 و 14. h التحليل الكمي لسمك LP في مجموعات مختلفة.فئران لكل مجموعة). صور الأشعة المقطعية الدقيقة لمجموعات مختلفة في المستوى الأفقي، والمستوى التاجي، والمستوى السهمي. إعادة بناء SYNPASE ثلاثي الأبعاد لقصبة هوائية الفأر. الأسهم الحمراء تشير إلى موقع التضيق في (i-k). الرسم البياني للأشعة المقطعية لمنطقة تضيق القصبة الهوائية المقاسة بواسطة SYNPASE 3D والتحليل الكمي للمنطقة في مجموعات مختلفة.فئران لكل مجموعة). 1 صور تمثيلية لصبغة ماسون في مجموعات مختلفة.التحليل الكمي لمساحة الكولاجين في مجموعات مختلفةفئران لكل مجموعة). ، صور المناعة الفلورية الممثلة للقصبة الهوائية وشدة الفلورة المتوسطة لـ SMA(أحمر) و COL1(أخضر) في مجموعات مختلفةالفئران لكل مجموعة). تحليل GSEA يظهر إثراء مسار IL6 jak STAT3 في مجموعة BAS + PBS. q، r صور تمثيلية للتألق المناعي للقصبة الهوائية وكثافة التألق المتوسطة لـ P-STAT3 (أخضر) و IL6 (أحمر) في مجموعات مختلفة (فئران لكل مجموعة). تشير القضبان المقياسية في (د، ج، ن، ق) إلى و توضح القضبان المقياسية في (I) . في (ج)، يوضح حدود الصندوق النسب المئوية 25 و 75، بينما تظهر الشعيرات النسب المئوية 25 ناقصاًإلى النسبة المئوية 75 زائدويظهر مركز الصندوق الوسيط. يتم تقديم البيانات كمتوسط ± SEM. تم استخدام تحليل ANOVA أحادي الاتجاه متبوعًا باختبار المقارنات المتعددة Tukey في (h، k، m، o، r). تم استخدام تحليل ANOVA أحادي الاتجاه متبوعًا باختبار النطاق المتعدد Duncan في c. يتم توفير بيانات المصدر كملف بيانات المصدر. فهم أفضل لدور مسار STING في التليف، مما يوجه في النهاية التحقيقات الإضافية في إمكانياته العلاجية عبر مختلف الأمراض التليفية.
في الختام، تشير النتائج الحالية إلى أن مسار cGAS-STING يلعب دورًا حاسمًا في BAS من خلال تعزيز إفراز عامل الالتهاب IL6 من البلعميات لتنشيط STAT3 في الخلايا الليفية، مما يعزز التليف. لذلك، قد يمثل مسار cGAS-STING هدفًا علاجيًا للوقاية من BAS.
طرق
الحيوانات
تم شراء فئران C57BL/6J، الإناث والذكور، بعمر 8 أسابيع من شركة SPF (بكين) للتكنولوجيا الحيوية المحدودة. كانت فئران STING KO (رقم الكاتالوج T012747)، بعمر 8 أسابيع، من خلفية C57BL/6J، وتم شراؤها من شركة جيانغسو جيمفارماتيك، الصين. تم إطعام جميع الحيوانات في منازل حيوانات خالية من مسببات الأمراض المحددة (SPF) في المستشفى الأول لجامعة الطب البحري مع نظام إضاءة قياسي لمدة 12 ساعة.ظروف مظلمة وكان لديهم وصول حر إلى الماء والطعام. تم الحفاظ على درجة حرارة الغرفة عند، وكانت الرطوبة النسبية حواليتم إجراء جميع تجارب الحيوانات وفقًا لدليل رعاية واستخدام الحيوانات المخبرية المنشور من قبل المعهد الوطني للصحة (NIH) والمعتمد من قبل لجنة رعاية واستخدام الحيوانات في مستشفى شانغهاي تشانغهاي تحت الرقم CHEC2021-006.
لا يختلف حدوث تضيق مجرى الهواء الحميد بين الذكور والإناث.في هذه الدراسة، استخدمنا كل من ذكور وإناث الفئران ووجدنا أن شدة تضيق مجرى الهواء الحميد لم تختلف أيضًا بين المجموعتين.
المرضى والعينات
تمت الموافقة على جميع الإجراءات التي تم تنفيذها في الدراسة من قبل اللجنة الأخلاقية في المستشفى الأول التابع لجامعة الطب البحري. تم إجراء الدراسة بعد الحصول على موافقة خطية مستنيرة من المرضى وفقًا للمبادئ الموضحة في إعلان هلسنكي. كان رقم الموافقة الأخلاقية CHEC2021-043. تم تلخيص معلومات المشاركين في الجدول التكميلي 1.
تم الحصول على إجمالي سبع عينات لتسلسل RNA على مستوى الخلية الواحدة. في مجموعة التكوين الحبيبي، تم جمع 4 عينات من نسيج التكوين الحبيبي من مرضى يعانون من تضيق مجرى الهواء الحميد بواسطة تقنية الخزع الكهربائي بالمنظار في المستشفى الأول التابع لجامعة الطب البحرية (شنغهاي، الصين). كانت معايير اختيار نسيج التكوين الحبيبي هو النسيج الحبيبي المتكون حديثًا خلال شهر واحد من إصابة الرغامى الأخيرة. في المجموعة الطبيعية، تم جمع 3 عينات من الرغامى الطبيعية من مرضى خضعوا لاستئصال الفص في المستشفى الأول التابع لجامعة الطب البحرية (شنغهاي، الصين). تم الحصول على الرغامى الطبيعية عن طريق فصل نسيج الرئة بعد استئصال الفص.
تم استخدام عشرة سوائل لغسل القصبة الهوائية للكشف عن محتوى dsDNA. في مجموعة BASمنطقة الرغامى المصابة تم ري المرضى الذين خضعوا للتنبيب الرغامي بواسطة التنظير الرغامي في المستشفى الأول التابع لجامعة الطب البحري (شنغهاي، الصين)، وتم جمع سائل غسل الرغامي. في مجموعة التحكمتم الحصول على سائل غسل القصبة الهوائية من مرضى يعانون من عقيدات رئوية خضعوا لعملية تنظير القصبات في المستشفى الأول التابع لجامعة الطب البحري (شنغهاي، الصين) والذين لم تتعرض مجاريهم الهوائية للتلف.
تم الحصول على إجمالي ست عينات للتلوين المناعي النسيجي. 3 عينات في مجموعة التحكم و3 عينات في مجموعة BAS. تم الحصول على هذه العينات بنفس الطريقة التي تم الحصول بها على العينات المستخدمة في تسلسل RNA أحادي الخلية.
إدارة الأدوية
لتفريغ البلعميات في الفئران، تم إعطاء الفئرانمن ليفوسومات كلودرونات (#40337ES10، ياسين، شنغهاي، الصين) عن طريق الحقن الوريدي قبل 6 ساعات من الجراحة وحقن ليفوسومات الكلودرونات عن طريق الوريد في الأيام 2 و4 و6 بعد الجراحة. تم تقييم كفاءة استنفاد البلعميات بواسطة تحليل تدفق الخلايا.
لإعاقة STING في الفئران، تم إعطاء الفئرانتم إذابة C176(#S6575، سيلك، الولايات المتحدة الأمريكية) في 10% DMSO (# HY-Y0320، ميد كيم إكسبريس، الولايات المتحدة الأمريكية) و90% زيت الذرة (#HY-Y1888، ميد كيم إكسبريس، الولايات المتحدة الأمريكية) عن طريق الحقن داخل الصفاق قبل ساعتين من النمذجة، في اليومين 2 و4 و6 بعد النمذجة.
لإعاقة P-STAT3 في الفئران، تم إعطاء الفئرانStat-tic (#HY-13818، ميد-كيم إكسبريس، الولايات المتحدة) مذاب في 10% DMSO + 40% PEG300 (#HY-Y0873، ميد-كيم إكسبريس، الولايات المتحدة) + 5% Tween-80 (#HYY1891، ميد-كيم إكسبريس، الولايات المتحدة)محلول ملحي عن طريق الحقن داخل البطن قبل ساعتين من النمذجة، في اليومين 2 و4 و6 بعد النمذجة.
لإعاقة cGAS في الفئران، تم إعطاء الفئرانRU.521(# HY-114180، ميد-كيم إكسبريس، الولايات المتحدة) مذاب في 10% DMSO + 40% PEG300تويين-محلول ملحي عن طريق الحقن داخل الصفاق قبل ساعتين من النمذجة، في اليومين 2 و4 و6 بعد النمذجة.
لتحقيق دور IL6، تم استخدام مضاد IL6-إن فيفو MP5-20F3 (#A2118، سيلك، الولايات المتحدة الأمريكية) و IL6 الموصوفة وراثيًا (#HY-P7063، ميد كيم إكسبريس، الولايات المتحدة الأمريكية). للتجارب التي تستخدم مضاد IL6-إن فيفو MP5-20F3 (كانت الحقن داخل البطن قبل ساعتين من النمذجة، في اليومين 2 و4 و6 بعد النمذجة. للتجارب التي تستخدم IL الفأري المعاد تركيبهفأركانت الحقنة الوريدية قبل ساعتين من النمذجة، في اليومين 2 و4 و6 بعد النمذجة.
للعلاج بـ DNase I، تم معالجة الفئران بـ DNase I خارج الخليةفأر) (#10104159001، سيغما-ألدريتش، الولايات المتحدة الأمريكية) 4 ساعات قبل و8 ساعات بعد النمذجة.
نقل siRNA
تم شراء siRNAs من HANBIO (شنغهاي، الصين). تم استخدام siRNA مخلوط كعنصر تحكم سلبي. تم تقديم تسلسلات الهدف للـ siRNAs وsiNC في الجدول التكميلي 2. تم إجراء عمليات النقل
الشكل 7 | ينشط dsDNA مسار STING في البلعميات مما يعزز تنشيط الألياف عبر محور IL6-STAT3. أظهر تحليل إثراء الوظائف الجينية (GO) أن الجينات الغنية المتعلقة بتلف الحمض النووي وإصلاحه في مجموعة BAS بعد 24 ساعة من إصابة القصبة الهوائية مقارنة بمجموعة التحكم.فئران لكل مجموعة). ب صور تمثيلية لصبغة H&E والتألق المناعي لـ (الأخضر) في القصبة الهوائية للفأر فئران لكل مجموعة). تشير القضبان إلىفي صور صبغة H&E، و في صور المناعة الفلورية. ج صور المناعة الفلورية للقصبة الهوائية تمثل dsDNA (وردي)، F4/80 (أحمر)، P-STING (أخضر)، cGAS (أصفر) في قصبة هوائية الفأر (فئران لكل مجموعة). تشير القضبان إلى و . رسم تخطيطي لاستخدام DECS لتحفيز BMDMs. e تحليل الكمية لـ dsDNA في سوائل الثقافة الخلوية في مجموعة التحكم ومجموعة DECS (تجارب مستقلة).صور تمثيلية لرحلان الهلام AGAR لمستخلصات الخلايا من مجموعات التحكم و DECSتجارب مستقلة).مستويات البروتينات من STING الفوسفوري في مجموعة BMDM المحفزة مع أو بدون DECS،تجارب مستقلة. i مخطط لخلية بونت من الفئران البرية المحفزة عن طريق نقل الحمض النووي القصبي للفئران بواسطة ليو 3000. j، k مستويات البروتين للـ STING الفوسفوري في مجموعة بونت. محفز مع أو بدون الحمض النووي (صور مناعية فلورية تمثيلية لـ P-STING (أخضر) في BMDM، تشير القضبان إلىالتحليل الكمي لشدة الفلورسنت المتوسطة النسبية لـ P-STINGتجارب مستقلة). مستويات بروتين IL6 في السائل الفائق لمجموعة BMDM المحفزة مع أو بدون الحمض النووي (مستويات mRNA المستقلة من التجارب).في مجموعة التحكم، مجموعة تحفيز الحمض النووي ومجموعة تحفيز الحمض النووي المعالجة بـ C176تجارب مستقلة).صور مناعية فلورية تمثيلية للقصبة الهوائية وتحليل كمي لشدة الفلورة المتوسطة لـ P-STAT3 (الأخضر) و IL6 (الأحمر) في المجموعات المختلفةفئران لكل مجموعة). تشير القضبان إلى و رسم تخطيطي يوضح نموذج الزراعة المشتركة في المختبر. صور تمثيلية مناعية فلورية وتحليل كمي لشدة الفلورة المتوسطة لـ P-STAT3 (باللون الأحمر) و αSMA (باللون الأخضر) في الخلايا الليفية.تجارب مستقلة). تشير القضبان المقياسية إلىتم تقديم البيانات كمتوسط ± SEM. تم استخدام اختبار T ثنائي الجانب في (e، h، k، o). تم استخدام تحليل ANOVA أحادي الاتجاه متبوعًا باختبار المقارنة المتعددة Tukey في (m، p، r، u). تم توفير بيانات المصدر كملف بيانات المصدر.
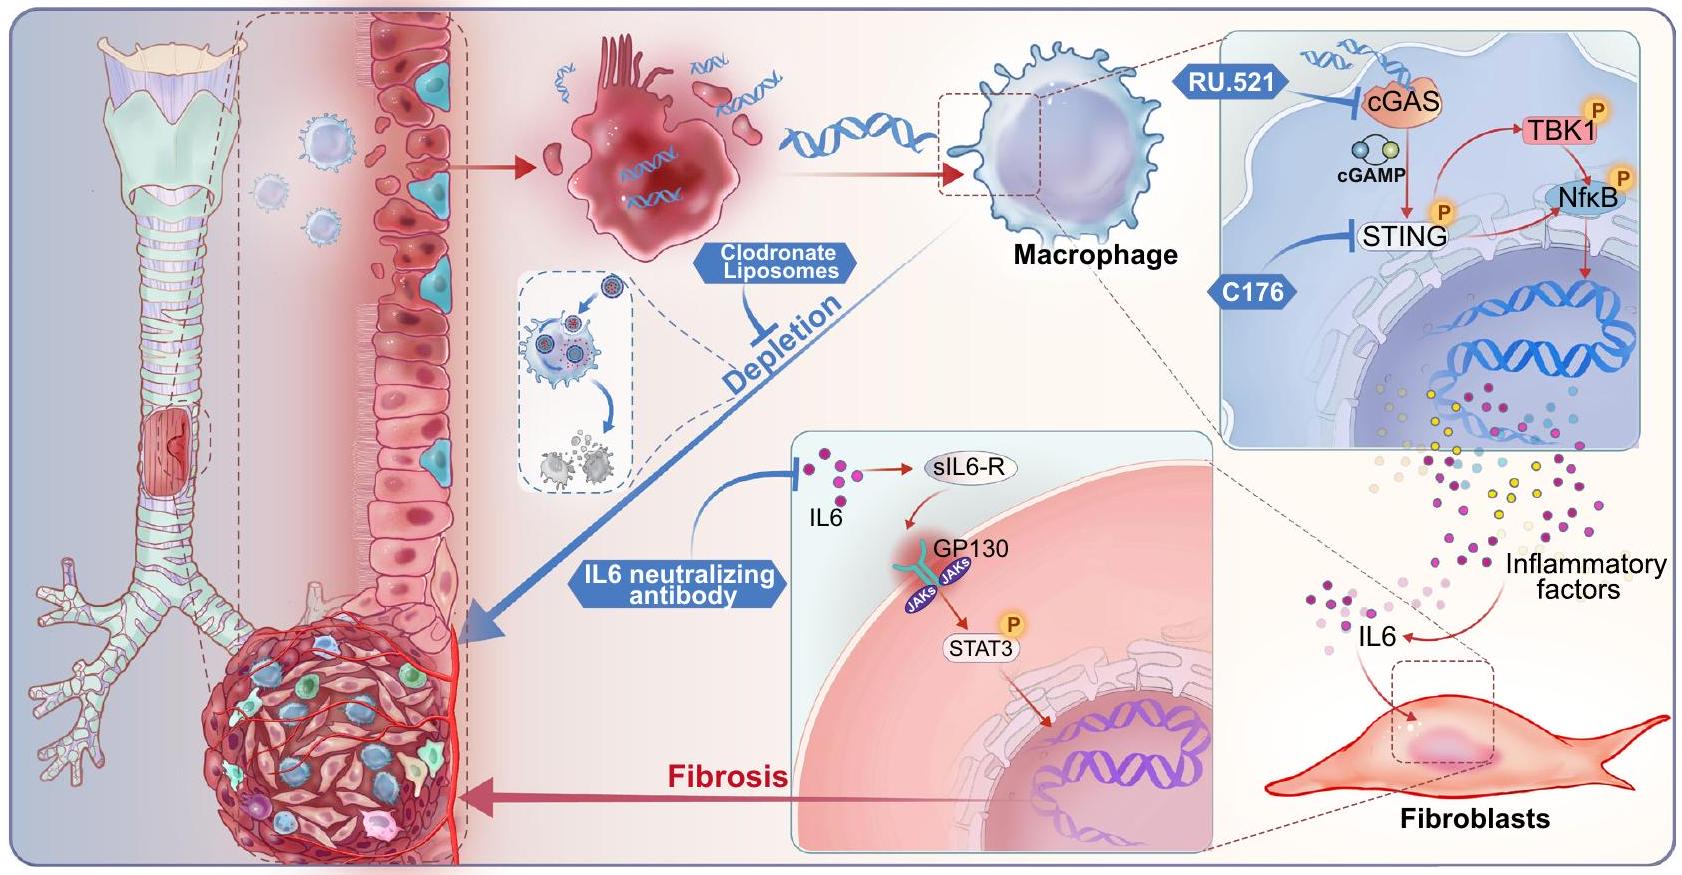
الشكل 8 | مخطط توضيحي لدرب cGAS-STING الذي ينشط بواسطة dsDNA في القصبة الهوائية والذي يحفز تكوين الأنسجة الندبية في BAS. عند حدوث إصابة، يتم إطلاق dsDNA من الظهارة القصبية مما ينشط درب STING في البلعميات، مما يؤدي إلى إفراز السيتوكين الالتهابي IL-6. ثم يقوم IL-6 بتنشيط إشارة STAT3 في
الخلايا الليفية، التي تساهم في تليف نسيج التئام الجروح. العلاج بمثبط cGAS RU.521، أو مثبط STING C176، أو الأجسام المضادة المعادلة لـ IL-6 يخفف من تليف نسيج التئام الجروح. بالإضافة إلى ذلك، فإن استنفاد البلعميات باستخدام حويصلات البيسفوسفونات يقلل من مدى التليف في نسيج التئام الجروح. عن طريق نقل الحمض النووي القصبي للفأر باستخدام Lipofectaminee3000 (#L3000015، Thermo Fisher Scientific، الولايات المتحدة الأمريكية). بالنسبة لعلاج DNase I، تم معالجة وسط زراعة BMDMs بـدي إنز I قبل 3 ساعات، وDNase I بعد إضافة مواد التحويل.
تم شراء خلايا الظهارة الرئوية للفأر MLE12 من شركة شانغهاي كوي ساي للتكنولوجيا الحيوية المحدودة (#QuiCell-M212). تم تحفيز موت خلايا الظهارة باستخدام إشعاع الضوء فوق البنفسجي، وتم جمع سوائل الخلايا الظهارية الميتة (DECS) لزراعة خلايا بونت مونوكليوسيتية مشتقة من نخاع العظم (BMDM) لمدة 24 ساعة.
تم شراء الخلايا الليفية القصبية من بروسل (#CPM008). تم تحفيز الخلايا الليفية عن طريق نقل الحمض النووي القصبي لـ STING النشط، وتم تقليل مستوى STING في الخلايا الليفية عن طريق نقل siRNA. لاستكشاف تأثير العوامل الالتهابية التي تفرزها البلعميات على الخلايا الليفية، تم تم زراعة الخلايا الليفية في نظام زراعة Transwell، حيث تم زرعها في قاع لوحة من 6 آبار بينما تم زرع BMDMs في حُقن زراعة 6 آبار. قبل الزراعة المشتركة، تم معالجة BMDMs بـ DNA القصبة الهوائية للفأر. ثم تم زراعة BMDMs المعالجة مسبقًا مع الخلايا الليفية.
تم زراعة جميع خطوط الخلايا في وسط RPMI-1640 (هايكلاون، الولايات المتحدة الأمريكية) معمصل جنيني من الأبقار (#SH30406.05، هايكلون، الولايات المتحدة الأمريكية)، 1% بنسلين وستربتوميسين (#SV30010، هايكلون، الولايات المتحدة الأمريكية) عندفيالغلاف الجوي.
إجراء جراحي
بناء نموذج فأر لتضيق مجرى الهواء الحميد عن طريق إحداث ضرر في قصبة الفأر الهوائية باستخدام فرشاة صغيرة (مكمل)
الشكل 11). بالنسبة للإجراء، تم تخدير الفأر عن طريق الحقن داخل الصفاق بمزيج من الكيتامين ( ) وزيلزين ( ). أولاً، بعد تعقيم الجلد بـتم إجراء شق بطول 1.5 سم في جلد العنق الأمامي للفأر باستخدام الكحول، وتم كشف القصبة الهوائية بالكامل بعد فصل الغدد وعضلات ما قبل القصبة الهوائية بشكل غير حاد. ثم تم شق القصبة الهوائية عرضيًا على طول غضروفين قصبيين أسفل غضروف الكريكويد، بطول شق يبلغ ثلثي المحيط. بعد ذلك، تم إدخال فرشاة صغيرة بقطر 1 مم من خلال قنية قسطرة IV آمنة 20 G (B | BRAUN Medical) إلى القصبة الهوائية بعمق 6 مم، ثم تم سحب القنية من القصبة الهوائية عن طريق سحب الخط المرتبط بالقنية، مما ترك الفرشاة في القصبة الهوائية وخدشها ثلاث مرات لإحداث ضرر في جدار القصبة الهوائية. أخيرًا، تم إغلاق القصبة الهوائية المشقوقة بخيوط 6-0 وتم إغلاق الأنسجة تحت الجلد والجلد بخيوط 3-0. تم قتل الفئران عن طريق خلع العنق تحت تأثير التخدير باستخدام 3% إيزوفلوران.
خضعت الفئران الضابطة لعملية جراحية وهمية، حيث تم قطع القصبة الهوائية للفئران، ولكن لم تتعرض القصبة الهوائية للإصابة بفرشاة صغيرة.
قياس dsDNA
تم جمع فئران ضيق مجرى الهواء الحميد من أجل نسيج القصبة الهوائية بعد 24 ساعة من النمذجة. ثم تم ري داخل القصبة الهوائية ثلاث مرات بـتم جمع سائل غسيل القصبة الهوائية مع محلول TE. تم جمع سائل غسيل القصبة الهوائية من المرضى الذين يعانون من BAS وكذلك من الضوابط كما هو موضح في المرضى والعينات. تم قياس dsDNA في سائل غسيل القصبة الهوائية للفئران وسائل غسيل القصبة الهوائية البشرية وDECS باستخدام مادة قياس dsDNA Picogreen (#12640ES60، YEASEN، شنغهاي، الصين)، وفقًا لبروتوكول الشركة المصنعة.
علم الأنسجة
تم تثبيت القصبات الهوائية فيفورمالديهايد مخفف لمدة 24 ساعة، محاط بالشمع، تم إعداد شرائح من 3 –تم قطع مقاطع بسمك م في مستوى محوري، والتي تم صبغها بعد ذلك بمستحضرات الهيماتوكسيلين-إيوزين، ومادة ماسون ثلاثية الألوان. تم قياس مساحة الكولاجين المصبوغ بمادة ماسون باستخدام برنامج Image J.
قياسات الغشاء تحت المخاطي للقصبة الهوائية
تم إجراء قياسات طبقة LP كما هو موضح في الأدبياتلقياس سمك طبقة LP، تم تقسيم حلقة غضروف القصبة الهوائية إلى خمسة أجزاء، وتم قياس سمك طبقة LP من الجانب الإنسي للغضروف إلى غشاء القاعدة الظهارية. تم قياس وتسجيل الجزء الأكثر سمكًا من كل جزء، وتم حساب متوسط سمك طبقة LP لكل عينة. يتم عرض مخطط القياس في الشكل التوضيحي 12 المرفق.
علم المناعة النسيجية
للتلوين المناعي النسيجي (IHC)، تم استرجاع المستضد عن طريق الحضانة عندفي محلول إصلاح مستضد حمض الستريك لمدة 30 دقيقة، تم تلطيخ الشرائح مناعياً باستخدام مضاد-STING (D2P2F) من الأرنب (1:100، #13647، تكنولوجيا الإشارة الخلوية)، مضاد-فوسفور-Stat3 (Tyr705) (D3A7) من الأرنب (1:100، #9145، تكنولوجيا الإشارة الخلوية) ومضاد-فوسفور-STING (Ser366) (E9A9K) من الأرنب (1:1600، #50907، تكنولوجيا الإشارة الخلوية) فيتم الكشف عن الأجسام المضادة المرتبطة باستخدام أجسام مضادة ثانوية من الماعز مضادة للأرانب موصولة بالبيوتين وتمت الحضانة لمدة ساعة واحدة في درجة حرارة الغرفة. ثم تم تطوير الشرائح باستخدام محلول DAB، وتمت صبغها بعكس مع الهيماتوكسيلين.
تلطيخ المناعة الفلورية للشعب الهوائية والخلايا
تم تثبيت أنسجة القصبة الهوائية في الفورمالديهايد المخفف لمدة 24 ساعة، مدفون في البارافين، ومقطع إلى شرائح عند تم تحضين أنسجة القصبة الهوائية مع الأجسام المضادة الأولية طوال الليل في، تليها فترة حضانة مدتها ساعتان مع الأجسام المضادة الثانوية. تم استخدام الأجسام المضادة لتلوين المناعة الفلورية في الدراسة: مضاد STING (E9X7F) من
أرنب (1:400، #78827، تكنولوجيا الإشارة الخلوية)، مضاد-فوسفوستينغ (سير365) (D1C4T) من أرنب (1:50، #62912، تكنولوجيا الإشارة الخلوية)، مضاد-F4/80 (D4C8V) من أرنب (1:400، #30325، تكنولوجيا الإشارة الخلوية)، مضاد-فوسفو-ستات3 (تير705) (D3A7) من أرنب (1:200، #9145، تكنولوجيا الإشارة الخلوية)، مضاد-cGAS من أرنب (1:200، #29958-1-AP، بروتين تك)، مضاد-كولاجين I (RM11310) من أرنب (1:100، #ab316222، أبكام)، مضاد-αSMA (D4K9N) من أرنب (1:200، #19245، تكنولوجيا الإشارة الخلوية)، مضاد-فوسفو-هيستون H2A.X (سير139) (20E3) من أرنب (1:200، #9718، تكنولوجيا الإشارة الخلوية)، مضاد-IL-6 (D5W4V) من أرنب (1:200، #12912، تكنولوجيا الإشارة الخلوية)، علامة dsDNA من الفئران (1:100، #sc-58749، سانتا كروز للتكنولوجيا الحيوية).
تم تثبيت الخلايا في 1% من البارافورمالدهيد لمدة 15 دقيقة، وتم اختراقها بـترايتون-X100/PBS، وتم حظره بـتمت زراعة الخلايا في محلول حجب. بعد ذلك، تم تحضين الشرائح مع الأجسام المضادة الثانوية لمدة ساعة واحدة في درجة حرارة الغرفة وأخيرًا تم صبغها بـ DAPI لمدة 5 دقائق في درجة حرارة الغرفة. تم استخدام الأجسام المضادة لتلوين المناعة الفلورية في الدراسة: مضاد فوسفور-STING (Ser365) (D1C4T) من الأرنب (1:400، #62912، تكنولوجيا الإشارة الخلوية)، مضاد فوسفور-Stat3 (Tyr705) (D3A7) من الأرنب (1:100، #9145، تكنولوجيا الإشارة الخلوية)، مضاد αSMA(D4K9N) من الأرنب (1:200، #19245، تكنولوجيا الإشارة الخلوية)
qRT-PCR
للحصول على mRNA، نستخدم مجموعة استخراج RNeasy (#RC112، فازايم، نانجينغ، الصين) لاستخراج mRNA من أنسجة القصبة الهوائية والمكونات داخل الخلوية. تم إنتاج cDNA باستخدام مجموعة تخليق cDNA من نوع One-step iScript (#R323، فازايم، نانجينغ، الصين)، وتم إجراء qRT-PCR باستخدام SYBR green Master Mix (#Q711، فازايم، نانجينغ، الصين) على نظام QuantStudio 3 (ثيرمو فيشر العلمية). تم استخدام جين GAPDH كعنصر تحكم. تم تحليل البيانات باستخدام التحليل المقارن للتعبير النسبي بواسطةالطرق. تم إدراج البرايمرات المستخدمة في هذه الدراسة في الجدول التكميلي 3.
التحليل الغربي
تم استخراج أنسجة القصبة الهوائية للب mice والبروتينات الخلوية باستخدام محلول التحلل الذي تم إعداده عن طريق خلط محلول RIPA، ومثبط البروتياز، ومثبط الفوسفاتاز بنسب متناسبة. تم تحديد تركيز البروتين باستخدام طريقة BCA، وتم خلط العينات مع محلول التحميل وغليها عندلمدة 10 دقائق. تم تحضير هلام بولي أكريلاميد مع دوديكان الصوديوم (SDS). ثم تم تحميل كميات متساوية من عينات البروتين وسلم البروتين (#WJ103، إبيزيم) في الآبار لإجراء التحليل الكهربائي (عند لمدة 60 دقيقة). تم إعداد محلول نقل قائم على الميثانول، وتم نقل البروتينات إلى غشاء PVDF، تلاه حجب في محلول الحجب. تم تحضين الغشاء طوال الليل فيمع الأجسام المضادة الأولية، بما في ذلك مضاد STING (D2P2F) من الأرنب (1:1000، #13647، تكنولوجيا الإشارة الخلوية)، مضاد Phospho-STING (Ser365) (D8F4W) من الأرنب (1:1000، #72971، تكنولوجيا الإشارة الخلوية)، مضاد TBK1 (E8I3G) من الأرنب (1:1000، #38066، تكنولوجيا الإشارة الخلوية)، مضاد Phospho-TBK1 (Ser172) (D52C2) من الأرنب (1:1000، #5483، تكنولوجيا الإشارة الخلوية)، مضاد NF-кB p65 (D14E12) من الأرنب (1:1000، #8242، تكنولوجيا الإشارة الخلوية)، مضاد Phospho-NF-kB p65 (Ser536) (93H1) من الأرنب (1:1000، #3033، تكنولوجيا الإشارة الخلوية)، مضاد αSMA (D4K9N) من الأرنب (1:1000، #19245، تكنولوجيا الإشارة الخلوية)، مضاد كولاجين I (RM11310) من الأرنب (1:1000، #ab316222، أبكام)، مضاد cGAS (D3O8O) من الأرنب (1:1000، #31659، تكنولوجيا الإشارة الخلوية)، مضاد AIM2 من الأرنب (1:1000، #63660S، تكنولوجيا الإشارة الخلوية) ومضاد GAPDH من الأرنب (1:5000، #10494-1-AP، بروتين تك). بعد ذلك، تم تحضين الغشاء مع مضاد IgG من الماعز المرتبط بـ HRP (1:8000، #SA00001-2، بروتين تك). بعد مسح الغشاء باستخدام نظام التصوير الكيميائي الضوئي Tanon 5200 (شنغهاي)، تم تحليل حزم البروتين باستخدام برنامج ImageJ.
الميكرو سي تي وطريقة قياس تضيق القصبة الهوائية في التصوير
في اليوم السابع بعد النمذجة، تم فحص مجاري الهواء في الفأر بواسطة الميكروCT، تم قياس منطقة القصبة الهوائية ضمن نافذة الدهون. تم قياس درجة التضيق عند المستوى الأكثر انقباضًا باستخدام الصيغة التالية:حيث تمثل s مساحة المستوى الأكثر تضيقًا من القصبة الهوائية و S تمثل متوسط المساحات عند المستويات الطبيعية 3 مم فوق وتحت المستوى الأكثر تضيقًا. تم استخدام SYNPASE 3D (SYNAPSE 3D V4.4، فوجي فيلم الطبية، طوكيو، اليابان) لقياس مساحة القصبة الهوائية للفأر وإجراء إعادة بناء ثلاثية الأبعاد للقصبة الهوائية.
تقييم وظيفة الرئة
تم تسجيل بيانات وظيفة الرئة للفئران عن طريق وضعها في جهاز قياس التنفس الكلي (WBP-4MR، TOW، الصين). يحدث تضيق مجرى الهواء الحميد (BAS) بشكل أساسي في المجاري الهوائية العليا. سريرياً، يعاني المرضى الذين يعانون من تضيق المجاري الهوائية العليا غالباً من زيادة في وقت الشهيق. لذلك، تم اختيار وقت الشهيق (Ti) كمؤشر لتقييم وظيفة الرئة. تم اختبار كل فأر لمدة 30 دقيقة. تم استخدام أول 10 دقائق للتكيف مع البيئة، وتم حساب متوسط وقت الشهيق كمتوسط لوقت الشهيق في آخر 20 دقيقة.
تدفق الخلايا
تم فصل أنسجة القصبة الهوائية للفأر وتنظيفها بمحلول PBS، ثم وضعت في محلول إنزيم التفكيك (ليبرز)روشي 5401119001، DNase I، سيغما 10104159001) في DMEM عندلمدة 45 دقيقة، ثم قطع الأنسجة غير المذابة واستمر في الاستحمام عند 37 لمدة 60 دقيقة. بعد التفكك، اغسل بـ 10 مل من PBS المبرد مسبقًا، وقم بتصفية باستخدام شاشة 70 ميكرومتر، ثم قم بالطرد المركزي عند 500 جرام لمدة 5 دقائق. بعد الطرد المركزي، تم التخلص من السائل العلوي وجمع رواسب الخلايا.. ثم، قم بتلوين الخلايا باستخدام صبغة LIVE/DEAD (#564406، BV510، BD Biosciences) وأجسام مضادة لعلامات سطح الخلية. بعد تلوين السطح، قم بتثبيت وتمرير الخلايا باستخدام مجموعة تثبيت/تمرير BD (#554714، BD Pharmingen)، تليها صبغة السيتوكينات داخل الخلايا. أخيرًا، تم الكشف عنها بواسطة CytoFlexS (Beckman Coulter). تم تلوين الخلايا باستخدام أجسام مضادة للعلامات التالية: مضاد CD45 من الجرذ (1:200، #557659، APC-CY7، BD Biosciences)، مضاد CD11b من الجرذ (1:200، #552850، PE-CY7، BD Biosciences)، مضاد F4/80 من الجرذ (1:200، #565411، BV421، BD Biosciences)، مضاد STING (E9X7F) من الأرنب (1:1600، #78827S، AF488، Cell Signaling Technology).
تحليل عوامل الالتهاب
بعد عزل نسيج القصبة الهوائية، تم استخدام اختبارات السيتوكين المتعددة من لومنكس (#12009159، بايو راد، هيركوليس، كاليفورنيا، الولايات المتحدة الأمريكية) للكشف عن السيتوكينات الالتهابية. /مجموعة التحكم، تمت هذه الاختبارات بواسطة مجموعة /BAS) من قبل LabEx (شنغهاي، الصين) باستخدام جهاز Luminex X-200، وفقًا لبروتوكول الشركة المصنعة (Luminex، أوستن، تكساس، الولايات المتحدة الأمريكية). كانت اختبارات السيتوكين المتعددة من Luminex قادرة على الكشف عن العوامل الالتهابية والكيماويات التالية: IL6، CCL20، IL-1بيتا، CXCL5، TNF-alpha، GM-CSF، CX3CL1، CCL1، CXCL13، IL-16، IFN-gamma، CXCL10، IL-2، CXCL11، IL-4، CCL7، CCL12، CCL2، CCL22، CCL5، IL-10، CXCL1، CCL27، CCL17، CCL19، CXCL16، CXCL12، CCL24، CCL11، CCL4، CCL3.
تم إجراء اختبار الامتزاز المناعي المرتبط بالإنزيم لقياس IL6 (EK206، LIANKE) في سوائل زراعة الخلايا وفقًا لتعليمات الشركة المصنعة.
التحليل الكهربائي لهلام الأجار
تم تشغيل عينات الكشف فيهلام الأجاروز، مصبوب من أجاروز بدرجة علم الأحياء الجزيئي (#RM02852، أبكلون، ووهان، الصين) مذاب فيمحلول تيريز (TBE). تم خلط السائل الفائق للخلايا مع محلول تحميل الحمض النووي (#RK30151، أبكلون، ووهان، الصين) وأضيف إلى المسار لإجراء التحليل الكهربائي مع علامة الحمض النووي (#RK30192، أبكلون،
ووهان، الصين)، الذي تم تشغيله عند 90 فولت في درجة حرارة الغرفة لمدة 25 دقيقة. تم الانتهاء من التصوير على نظام تحليل صور الهلام الأوتوماتيكي تانون 3500B (شنغهاي).
استخراج RNA بكميات كبيرة وبناء المكتبة والتسلسل
قمنا بإجراء تسلسل RNA بالجملة مرتين إجمالاً. كانت المرة الأولى لاكتشاف الفروق الجينية في الفئران المصابة بـ BAS في نقاط زمنية مختلفة (التحكمفئران، BAS-24hالفئران و BAS-7dالفئران)، وكان الهدف الثاني هو دراسة تأثير نقص البلعميات على BAS (التحكمفئران، BAS-7dالفئران و BAS-7 د مع ليفوسومات كلودروناتفئران).
تم جمع أنسجة القصبة الهوائية للفئران، وكانت كل قصبة هوائية عينة مستقلة. تم استخراج RNA الكلي باستخدام كاشف Trizol (Thermo Fisher، 15596018) وفقًا لإجراءات الشركة المصنعة. تم تحليل كمية ونقاء RNA الكلي باستخدام Bioanalyzer 2100 ومجموعة RNA 6000 Nano LabChip (Agilent، كاليفورنيا، الولايات المتحدة الأمريكية، 5067-1511)، مع عينات RNA عالية الجودة برقم RIN.تم استخدامها لبناء مكتبة التسلسل. بعد استخراج RNA الكلي، تم تنقية mRNA من RNA الكلي (5 ميكروغرام) باستخدام كرات دينابيدز أوليجو (dT) (ثيرمو فيشر، كاليفورنيا، الولايات المتحدة الأمريكية) مع جولتين من التنقية. بعد التنقية، تم تجزئة mRNA إلى قطع قصيرة باستخدام أيونات ثنائية التكافؤ تحت درجة حرارة مرتفعة (وحدة تجزئة RNA المغنيسيوم (NEB، رقم الكات. e6150، الولايات المتحدة الأمريكية) تحت ). ثم تم عكس نسخ شظايا RNA المفصولة لإنشاء cDNA بواسطة SuperScript II Reverse Transcriptase (Invitrogen، رقم الكاتالوج 1896649، الولايات المتحدة الأمريكية)، والتي تم استخدامها بعد ذلك لتخليق DNAs مزدوجة الشريط موسومة بـ U باستخدام بوليميراز DNA I من E. coli (NEB، رقم الكاتالوج m0209، الولايات المتحدة الأمريكية)، RNase H (NEB، رقم الكاتالوج m0297، الولايات المتحدة الأمريكية) و محلول dUTP (Thermo Fisher، رقم الكاتالوج R0133، الولايات المتحدة الأمريكية). ثم تمت إضافة قاعدة A إلى الأطراف المستقيمة لكل شريط، مما أعدها للربط بالمهايئات المفهرسة. احتوى كل مهايئ على بروز T للربط بالمهايئ إلى DNA المجزأ ذو ذيل A. تم ربط المهايئات ذات الفهرس المزدوج بالشظايا، وتم إجراء اختيار الحجم باستخدام كرات AMPureXP. بعد معالجة إنزيم UDG القابل للحرارة (NEB، رقم الكاتالوج m0280، الولايات المتحدة الأمريكية) لـ DNAs مزدوجة الشريط الموسومة بـ U، تم تضخيم المنتجات المربوطة باستخدام PCR. كان متوسط حجم الإدراج لمكتبات cDNA النهائية . أخيرًا، قمنا بأداء الـتسلسل الأطراف المزدوجة (PE150) على جهاز إلومينا نوفاسيك 6000 (شركة LC-Bio Technology CO.، Ltd.، هانغتشو، الصين) وفقًا للبروتوكول الموصى به من قبل المورد.
تحليل تسلسل RNA بالجملة
تم تسلسل مكتبة cDNA تم إنشاؤها بواسطة تقنية من RNA المجمعة من القصبة الهوائية للفئران باستخدام منصة تسلسل Illumina Novaseq 6000. باستخدام نهج RNA-seq مزدوج النهاية من Illumina، قمنا بتسلسل النسخ الجينية، مما أدى إلى إنتاج إجمالي مليونقراءات نهاية مزدوجة bp. القراءات التي تم الحصول عليها من آلات التسلسل تشمل قراءات خام تحتوي على موصلات أو قواعد منخفضة الجودة والتي ستؤثر على التجميع والتحليل التالي. لذلك، للحصول على قراءات نظيفة عالية الجودة، تم تصفية القراءات بشكل إضافي بواسطة Cutadapt.https://cutadapt.readthedocs.io/en/stable/، الإصدار: cutadapt-1.9). كانت المعلمات كما يلي: 1) إزالة القراءات التي تحتوي على المحولات؛ 2) إزالة القراءات التي تحتوي على بولي A وبولي G؛ 3) إزالة القراءات التي تحتوي على أكثر من من النيوكليوتيدات غير المعروفة (N)؛ 4) إزالة القراءات ذات الجودة المنخفضة التي تحتوي على أكثر من منخفض الجودة (قيمة Q ) قواعد.
ثم تم التحقق من جودة التسلسل باستخدام FastQChttp://www. bioinformatics.babraham.ac.uk/projects/fastqc/“، 0.11.9). بما في ذلك Q20 و Q30 ومحتوى GC للبيانات النظيفة. بعد ذلك، تم إنتاج إجمالي من جزيئات bp من القراءات النظيفة والمقترنة. قمنا بمحاذاة القراءات لجميع العينات إلى الجينوم المرجعي للفئران باستخدام HISAT2 (https://daehwankimlab.github.io/hisat2/، الإصدار: hisat2-2.2.1) الحزمة، التي تقوم في البداية بإزالة جزء من القراءات بناءً على معلومات الجودة المرفقة بكل قراءة ثم تقوم بتعيين القراءات إلى الجينوم المرجعي. تم إجراء تحليل التعبير الجيني التفاضلي بواسطة برنامج DESeq2 بين مجموعتين مختلفتين (ومن خلال edgeR بين عينتين). الجينات التي تحتوي على معامل معدل الاكتشاف الخاطئ (FDR) أقل من 0.05 وتغير مطلق في الطيتم اعتبارها جينات معبرة بشكل مختلف.
يمكن أن يفسر تحليل إثراء GO و KEGG للجينات المختلفة إثراء الوظائف للجينات المختلفة ويوضح الفروق بين العينات على مستوى وظيفة الجين. نستخدم حزمة البرمجيات R cluster Profiler (v4.1.3) لتحليل إثراء وظيفة GO وتحليل إثراء مسار KEGG. عندمايعتبر أن وظيفة GO أو KEGG غنية بشكل كبير. تم استخدام تحليل إثراء مجموعة الجينات (GSEA) باستخدام برنامج GSEA (الإصدار 4.1.0) مع MSigDB (الإصدار 7.5.1). تم استخدام تحليل Mufzz باستخدام خوارزمية التجميع Fuzzy C-means (FCM) مع حزمة Mufzz (الإصدار 2.54.0) في R (الإصدار 4.1.3).
تم إجراء جميع تحليلات بيانات تسلسل RNA الضخم باستخدام أدوات OmicStudio التي أنشأتها شركة LC-BIO المحدودة (هانغتشو، الصين) فيhttps://www.omicstudio.cn/cell.
تحضير مكتبة الخلايا المفردة وتسلسلها
تُوصف طرق جمع العينات في المرضى والعينات. تم قطع النسيج إلى قطع صغيرة منثم تم غسلها بمحلول 1xPBS لفصل الأنسجة إلى خلايا فردية في محلول التفكك. تجاوزت نسبة بقاء الخلايا الإجمالية، كما تم التأكيد بواسطة استبعاد صبغة التريبان الزرقاء. تم فصل الأنسجة إلى خلايا مفردة في محلول التفكك (كولاجيناز IVباباين، 120 وحدة/مل DNase Iحمام مائي مع اهتزاز لمدة 20 دقيقة بسرعة 100 دورة في الدقيقة. تم إنهاء الهضم بـPBS يحتوي علىمصل الجنين البقري (FBS، V/V) ثم سحب 5-10 مرات باستخدام ماصة باستور. تم تصفية تعليق الخلايا الناتج عن طريق تمريره عبرمصفاة خلايا مكدسة وتم الطرد المركزي عند 300 جرام لمدة 5 دقائق فيتم إعادة تعليق راسب الخلايا فيPBS BSA) وأضيفت بـ محلول تحليل كريات الدم الحمراء (MACS 130-094-183، ) وتم حضنها في درجة حرارة الغرفة أو على الثلج لمدة 2-10 دقائق لتحليل خلايا الدم الحمراء المتبقية. بعد الحضانة، تم طرد المعلق في جهاز الطرد المركزي بسرعة 300 جرام لمدة 5 دقائق في درجة حرارة الغرفة. تم إعادة تعليق المعلق في إزالة الخلايا الميتة باستخدام كريات ميكروبيود (MACS 130-090-101) وإزالة الخلايا الميتة باستخدام مجموعة إزالة الخلايا الميتة من ميلتيني (MACS 130-090-101). ثم تم إعادة تعليق التعليق فيوتم الطرد المركزي عند 300 جرام لمدة 3 دقائق في (تكرر مرتين). تم إعادة تعليق راسب الخلايا في منPBSتم تأكيد بقاء الخلايا العام من خلال استبعاد صبغة التريبان الأزرق، والتي يجب أن تكون فوقتم عد التعليق الخلوي المفرد باستخدام جهاز العد الخلوي هايموسيتومتر/ عداد الخلايا الأوتوماتيكي Countess II وتم تعديل التركيز إلى 700-1200 خلية/ل.
تم تحميل تعليقات الخلايا المفردة إلى 10x Chromium لالتقاط الخلايا المفردة وفقًا لتعليمات الشركة المصنعة لمجموعة 10 X Genomics Chromium Single-Cell 3′ (V3). تم تنفيذ خطوات تضخيم cDNA وبناء المكتبة التالية وفقًا للبروتوكول القياسي. تم تسلسل المكتبات على نظام تسلسل Illumina NovaSeq 6000 (تشغيل متعدد الأطراف، 150 نقطة أساس) بواسطة شركة LCBio Technology co.ltd.، (هانغتشو، الصين) بعمق أدنى يبلغ 20,000 قراءة لكل خلية.
تحليل بيانات الخلايا المفردة
تم فصل نتائج التسلسل وتحويلها إلى تنسيق FASTQ باستخدام برنامج Illumina bcl2fastq (الإصدار 2.20). تم فصل العينات، ومعالجة الرموز الشريطية، وعدّ الجينات الفردية من الطرف 3 باستخدام خط أنابيب Cell Ranger.https://support.10xgenomics.com/single-cellgeneexpression/تم محاذاة بيانات scRNA-seq إلى الجينوم المرجعي Ensembl v110 للإنسان العاقل، وتم معالجة ما مجموعه 67,390 خلية مفردة تم التقاطها من 3 مجموعات طبيعية و4 مجموعات تكتل باستخدام حل 10X Genomics Chromium Single Cell 3.
تم تحميل مخرجات Cell Ranger إلى Seurat (الإصدار 3.1.1) لاستخدامها في تقليل الأبعاد، والتجميع، وتحليل بيانات scRNA-seq. بشكل عام، اجتاز 58,586 خلية عتبة مراقبة الجودة: جميعها تمت إزالة الجينات المعبر عنها في أقل من ثلاث خلايا (المعلمات الافتراضية: خلية واحدة)، عدد الجينات المعبر عنها لكل خلية كان 100 كحد أدنى وinf كحد أقصى، لم يكن لدى NUMI أي حدود، كانت نسبة التعبير الجيني المشتق من الحمض النووي الميتوكوندري < 25%.
لتصور البيانات، قمنا بتقليل الأبعاد لجميع 18,339 خلية باستخدام Seurat واستخدمنا UMAP لإسقاط الخلايا في الفضاء ثنائي الأبعاد. تشمل الخطوات: 1 استخدام طريقة LogNormalize من دالة “Normalization” في برنامج Seurat لحساب قيمة تعبير الجينات؛ 2 تم إجراء تحليل PCA (تحليل المكونات الرئيسية) باستخدام قيمة التعبير المنظم، حيث تم استخدام أفضل 10 مكونات رئيسية لإجراء التجميع وتحليل UMAP؛ 3 للعثور على المجموعات، تم اختيار طريقة التجميع المعتمدة على الرسم البياني للجار الأقرب المشترك (SNN) الموزون. تم تحديد الجينات المميزة لكل مجموعة باستخدام اختبار ويلكوكسون للرتب مع المعلمات الافتراضية عبر دالة FindAllMarkers في Seurat. هذا يختار الجينات المميزة التي يتم التعبير عنها في أكثر من 10% من الخلايا في مجموعة ومتوسط اللوغاريتم (تغيير النسبة) أكبر من 0.25.
لإعادة تجميع البلعميات، تم تقسيم تجمعات البلعميات واستخدام التجميع غير المراقب لتحديد تحت مجموعات البلعميات. تم تحليل تحت مجموعات البلعميات باستخدام FindMarkers، لتوصيف هويات التجمعات والاختلافات في التعبير الجيني بين ظروف العلاج.
لتحقيق الوظائف المحتملة، تم استخدام حزمة البرمجيات R Cluster Profiler (v4.1.32) لتحليل علم الجينات (GO)، وتم استخدام برنامج GSEA (v4.1.0) مع MSigDB (v7.5.1) لتحليل إثراء مجموعة الجينات (GSEA). المسارات التي تحتوي علىتم اعتبار القيم الأقل من 0.05 غنية بشكل ملحوظ. تم تقييم مسار cGAS-STING بناءً على وظيفة Addmodulescore في Seurat (الإصدار 4.1.0). تم استخدام تحليل شبكة التفاعل بين الخلايا CellChat لوصف تفاعلات الخلايا المناعية مع الألياف بواسطة Cellphonedb (الإصدار 5.0.0).
تم إجراء جميع تحليلات بيانات الخلايا المفردة باستخدام أدوات OmicStudio التي أنشأتها شركة LC-BIO المحدودة (هانغتشو، الصين) فيhttps://www. omicstudio.cn/cell.
التحليل الإحصائي
تم تقديم جميع التواريخ كمتوسط ± SEM. تم استخدام GraphPad Prism 9 للتحليل الإحصائي (برنامج GraphPad، سان دييغو، كاليفورنيا، الولايات المتحدة الأمريكية). تم تحديد الفروق بين مجموعتين باستخدام اختبار Student ذو الجانبين واختبار Mann Whitney ذو الجانبين. تم استخدام تحليل ANOVA أحادي أو ثنائي الاتجاه للمجموعات المتعددة يليه اختبار Kruskal-Wallis واختبار النطاق المتعدد لدنكان. تم استخدام تحليل ارتباط سبيرمان لتحليل الارتباط بين المجموعتين.تم اعتبار القيم التي تقل عن 0.05 ذات دلالة إحصائية.
ملخص التقرير
معلومات إضافية حول تصميم البحث متاحة في ملخص تقارير مجموعة نيتشر المرتبط بهذه المقالة.
توفر البيانات
جميع البيانات التي تدعم نتائج هذه الدراسة متاحة ضمن المقالة وملفاتها التكميلية. يمكن توجيه أي طلبات إضافية للحصول على معلومات إلى المؤلفين المراسلين، وسيتم تلبيتها من قبلهم. بيانات التسلسل الخام متاحة في NCBI-SRA (أرشيف قراءة التسلسل): تسلسل الخلايا المفردة (SRR31229501، SRR31229502، SRR31229503، SRR31229504، SRR31229505، SRR31229506، SRR31229507)، تسلسل RNA الكمي من فئران تضيق مجرى الهواء الحميد (SRR30898181، SRR30898182، SRR30898183، SRR30898184، SRR30898185، SRR30898186، SRR30898187، SRR30898188، SRR30898189)، تسلسل RNA الكمي المستخدم لتحليل تأثير استنفاد البلعميات على BAS (SRR30831591، SRR30831592، SRR30831593، SRR30831594، SRR30831595، SRR30831596، SRR30831597، SRR30831598، SRR30831599). جميع البيانات الأخرى متاحة في المقالة وملفاتها التكميلية أو من المؤلف المراسل عند الطلب. يتم توفير بيانات المصدر مع هذه الورقة.
References
Oberg, C. L., Holden, V. K. & Channick, C. L. Benign Central Airway Obstruction. Semin Respir. Crit. Care Med. 39, 731-746 (2018).
Piazza, C. et al. Long-term intubation and high rate of tracheostomy in COVID-19 patients might determine an unprecedented increase of airway stenoses: a call to action from the European Laryngological Society. Eur. Arch. Otorhinolaryngol. 278, 1-7 (2021).
Guibert, N., Saka, H. & Dutau, H. Airway stenting: Technological advancements and its role in interventional pulmonology. Respirology 25, 953-962 (2020).
Sun, K. et al. Long-term prognostic factors of clinical success after interventional bronchoscopy in patients with scarring central airway stenosis. BMC Pulm. Med. 21, 73 (2021).
Chen, N. et al. Inhibitory effect of mitomycin C on proliferation of primary cultured fibroblasts from human airway granulation tissues. Respiration 85, 500-504 (2013).
Li, X. et al. Treatment of scarring central airway stenosis with pirfenidone: Case report. Med. (Baltim.) 101, e31354 (2022).
Qiu, X. et al. Paclitaxel-Loaded PLGA Coating Stents in the Treatment of Benign Cicatrical Airway Stenosis. J. Clin. Med 11, 517 (2022).
Enyuan, Q. et al. Erythromycin combined with corticosteroid reduced inflammation and modified trauma-induced tracheal stenosis in a rabbit model. Ther. Adv. Respir. Dis. 12, 1753466618773707 (2018).
Huang, Z. et al. Protective effects of different anti-inflammatory drugs on tracheal stenosis following injury and potential mechanisms. Mol. Med Rep. 23, 314 (2021).
Konno, H. & Barber, G. N. The STING controlled cytosolic-DNA activated innate immune pathway and microbial disease. Microbes Infect. 16, 998-1001 (2014).
Chen, Q., Sun, L. & Chen, Z. J. Regulation and function of the cGASSTING pathway of cytosolic DNA sensing. Nat. Immunol. 17, 1142-1149 (2016).
Barber, G. N. STING: infection, inflammation and cancer. Nat. Rev. Immunol. 15, 760-770 (2015).
Benmerzoug, S. et al. STING-dependent sensing of self-DNA drives silica-induced lung inflammation. Nat. Commun. 9, 5226 (2018).
Wang, X. et al. STING expression in monocyte-derived macrophages is associated with the progression of liver inflammation and fibrosis in patients with nonalcoholic fatty liver disease. Lab Invest 100, 542-552 (2020).
Zeng, H. M. et al. Pharmacological Inhibition of STING/TBK1 Signaling Attenuates Myeloid Fibroblast Activation and Macrophage to Myofibroblast Transition in Renal Fibrosis. Front. Pharmacol. 13, https://doi.org/10.3389/fphar.2022.940716 (2022).
Kessler, N. et al. Monocyte-derived macrophages aggravate pulmonary vasculitis via cGAS/STING/IFN-mediated nucleic acid sensing. J. Exp. Med. 219. e20220759 (2022).
Minutti, C. M. et al. Tissue-specific contribution of macrophages to wound healing. Semin Cell Dev. Biol. 61, 3-11 (2017).
Hu, S. et al. The selective STING inhibitor H-151 preserves myocardial function and ameliorates cardiac fibrosis in murine myocardial infarction. Int Immunopharmacol. 107, 108658 (2022).
Dvorkin, S. et al. New frontiers in the cGAS-STING intracellular DNAsensing pathway. Immunity 57, 718-730 (2024).
Zhang, Z. et al. Multifaceted functions of STING in human health and disease: from molecular mechanism to targeted strategy. Signal Transduct. Target Ther. 7, 394 (2022).
Zou, M. et al. Inhibition of cGAS-STING by JQ1 alleviates oxidative stress-induced retina inflammation and degeneration. Cell Death Differ. 29, 1816-1833 (2022).
Hu, B. et al. The DNA-sensing AIM2 inflammasome controls radiation-induced cell death and tissue injury. Science 354, 765-768 (2016).
Wan, D., Jiang, W. & Hao, J. Research Advances in How the cGASSTING Pathway Controls the Cellular Inflammatory Response. Front Immunol. 11, 615 (2020).
Zhang, C. et al. Intercellular mitochondrial component transfer triggers ischemic cardiac fibrosis. Sci. Bull. (Beijing) 68, 1784-1799 (2023).
Liu, C. et al. DNA from macrophages induces fibrosis and vasculopathy through POLR3A/STING/type I interferon axis in systemic sclerosis. Rheumatol. (Oxf.) 62, 934-945 (2023).
Decout, A. et al. The cGAS-STING pathway as a therapeutic target in inflammatory diseases. Nat. Rev. Immunol. 21, 548-569 (2021).
Hesketh, M. et al. Macrophage Phenotypes Regulate Scar Formation and Chronic Wound Healing. Int J. Mol. Sci. 18, 1545 (2017).
Nam, S. & Lim, J. S. Essential role of interferon regulatory factor 4 (IRF4) in immune cell development. Arch. Pharm. Res 39, 1548-1555 (2016).
Bharadwaj, U. et al. Targeting Janus Kinases and Signal Transducer and Activator of Transcription 3 to Treat Inflammation, Fibrosis, and Cancer: Rationale, Progress, and Caution. Pharm. Rev. 72, 486-526 (2020).
Montero, P. et al. Role of JAK/STAT in Interstitial Lung Diseases; Molecular and Cellular Mechanisms. Int. J. Mol. Sci. 22, https://doi. org/10.3390/ijms22126211 (2021).
Feng, T. M. et al. Involvement of PD-1(+)CD4(+) T cells in the development of traumatic tracheal stenosis by regulating the IL-17/STAT3 pathway. Biochim Biophys. Acta Mol. Basis Dis. 1870, 167216 (2024).
Yu, Y. et al. Cytosolic DNA-Mediated STING-Dependent Inflammation Contributes to the Progression of Psoriasis. J. Invest. Dermatol. 142, 898-906.e4 (2022).
Marchioni, A. et al. Molecular Mechanisms and Physiological Changes behind Benign Tracheal and Subglottic Stenosis in Adults. Int J. Mol. Sci. 23, 2421 (2022).
Motz, K. M. et al. Sirolimus-eluting airway stent reduces profibrotic Th17 cells and inhibits laryngotracheal stenosis. JCI Insight. 8. https://doi.org/10.1172/jci.insight. 158456 (2023).
Gao, L. et al. STING/ACSL4 axis-dependent ferroptosis and inflammation promote hypertension-associated chronic kidney disease. Mol. Ther. 31, 3084-3103 (2023).
Zhang, Y. et al. STING-Dependent Sensing of Self-DNA Driving Pyroptosis Contributes to Radiation-Induced Lung Injury. Int J. Radiat. Oncol. Biol. Phys. 117, 928-941 (2023).
Li, M. et al. Macrophage Related Chronic Inflammation in NonHealing Wounds. Front Immunol. 12, 6817 (2021).
Ou, L. et al. Targeting STING-mediated pro-inflammatory and profibrotic effects of alveolar macrophages and fibroblasts blunts silicosis caused by silica particles. J. Hazard Mater. 458, 131907 (2023).
Plikus, M. V. et al. Fibroblasts: Origins, definitions, and functions in health and disease. Cell 184, 3852-3872 (2021).
Lee, C. C. et al. An updated review of the immunological mechanisms of keloid scars. Front. Immunol. 14, 1117630 (2023).
Borthwick, L. A. The IL-1 cytokine family and its role in inflammation and fibrosis in the lung. Semin Immunopathol. 38, 517-534 (2016).
Ning, L. et al. Cytosolic DNA-STING-NLRP3 axis is involved in murine acute lung injury induced by lipopolysaccharide. Clin. Transl. Med. 10, e228 (2020).
Zhao, Q. et al. STING signalling protects against chronic pancreatitis by modulating Th17 response. Gut 68, 1827-1837 (2019).
Savigny, F. et al. Protective Role of the Nucleic Acid Sensor STING in Pulmonary Fibrosis. Front Immunol. 11, 588799 (2020).
Li, M. et al. Risk Factors for Posttracheostomy Tracheal Stenosis. Otolaryngol. Head. Neck Surg. 159, 698-704 (2018).
Wang, X. et al. DNA sensing via the cGAS/STING pathway activates the immunoproteasome and adaptive T-cell immunity. Embo J. 42, e110597 (2023).
Hillel, A. T. et al. An in situ, in vivo murine model for the study of laryngotracheal stenosis. JAMA Otolaryngol. Head. Neck Surg. 140, 961-966 (2014).
Hillel, A. T. et al. Dysregulated Macrophages Are Present in Bleomycin-Induced Murine Laryngotracheal Stenosis. Otolaryngol. Head. Neck Surg. 153, 244-250 (2015).
شكر وتقدير
نحن ممتنون للدعم في المعلوماتية الحيوية من كوين شيا وشيولي مينغ (شركة LC-Bio Technology المحدودة). تم دعم هذا العمل من قبل المؤسسة الوطنية للعلوم الطبيعية في الصين برقم المنح 82270112 (C.B.) و 82000102 (H.S.). تم إنشاء الشكل 2c، k، الشكل 4a، الشكل 5b، الشكل 6f، الشكل 7i، s، الشكل التكميلية 5a، الشكل التكميلية 9b، e والشكل التكميلية 10a جزئيًا بواسطة MedPeer.medpeer.cnوقد تم تأكيد ذلك من خلال حقوق النشر والترخيص.
مساهمات المؤلفين
صمم Y.C. و H.S. و C.B. الدراسة. قام Y.C. و C.Y. و Y.M. بإجراء التجارب وتحليل البيانات. جمع D.S. و X.L. و S.T. و Y.Z. و C.X. و Y.D. عينات بشرية وإعادة بناء ثلاثية الأبعاد لصور الميكروCT من الفئران. كتب Y.C. المخطوطة. نظم C.H. و H.S. و C.B. وأشرفوا على الدراسة.
ملاحظة الناشر: تظل شركة سبرينجر ناتشر محايدة فيما يتعلق بالمطالبات القضائية في الخرائط المنشورة والانتماءات المؤسسية.
الوصول المفتوح هذه المقالة مرخصة بموجب رخصة المشاع الإبداعي النسب-غير التجارية-عدم الاشتقاق 4.0 الدولية، التي تسمح بأي استخدام غير تجاري، ومشاركة، وتوزيع، وإعادة إنتاج في أي وسيلة أو صيغة، طالما أنك تعطي الائتمان المناسب للمؤلفين الأصليين والمصدر، وتوفر رابطًا لرخصة المشاع الإبداعي، وتوضح إذا قمت بتعديل المادة المرخصة. ليس لديك إذن بموجب هذه الرخصة لمشاركة المواد المعدلة المشتقة من هذه المقالة أو أجزاء منها. الصور أو المواد الأخرى من طرف ثالث في هذه المقالة مشمولة في رخصة المشاع الإبداعي الخاصة بالمقالة، ما لم يُشار إلى خلاف ذلك في سطر الائتمان للمادة. إذا لم تكن المادة مشمولة في رخصة المشاع الإبداعي الخاصة بالمقالة وكان استخدامك المقصود غير مسموح به بموجب اللوائح القانونية أو يتجاوز الاستخدام المسموح به، فستحتاج إلى الحصول على إذن مباشرة من صاحب حقوق الطبع والنشر. لعرض نسخة من هذه الرخصة، قم بزيارة http:// creativecommons.org/licenses/by-nc-nd/4.0/. (ج) المؤلف(ون) 2025
¹قسم الطب التنفسي والعناية الحرجة، المستشفى الأول التابع لجامعة الطب البحري، شنغهاي، الصين.قسم الطب التنفسي والعناية الحرجة، المستشفى العام للقيادة المركزية لجيش التحرير الشعبي الصيني، ووهان، الصين.قسم الطب التنفسي والعناية الحرجة، مستشفى رقم 906 التابع لقوة الدعم اللوجستي المشتركة لجيش التحرير الشعبي الصيني، نينغبو، الصين.قسم الأنسجة وعلم الأجنة، جامعة الطب البحرية، شنغهاي، الصين.ساهم هؤلاء المؤلفون بالتساوي: يي لين تشين، تشينغ تشينغ يانغ، يو شان مياو. البريد الإلكتروني:hcf@immunol.org; Shihui@smmu.edu.cn; تشونغباي@smmu.edu.cn
Macrophage STING signaling promotes fibrosis in benign airway stenosis via an IL6STAT3 pathway
Received: 17 May 2024
Accepted: 4 December 2024
Published online: 03 January 2025
YiLin Chen , ChengCheng Yang , YuShan Miao , DongChen Shi , Xiang Li , Sen Tian , YiFei Zhang , ChengFei Xu , YuChao Dong , ChaoFeng Han , Hui Shi & Chong Bai ⊗
Abstract
Acute and chronic inflammation are important pathologies of benign airway stenosis (BAS) fibrosis, which is a frequent complication of critically ill patients. cGAS-STING signalling has an important role in inflammation and fibrosis, yet the function of STING in BAS remains unclear. Here we demonstrate using scRNA sequencing that cGAS-STING signalling is involved in BAS, which is accompanied by increased dsDNA, expression and activation of STING. STING inhibition or deficiency effectively alleviates tracheal fibrosis of BAS mice by decreasing both acute and chronic inflammation. Macrophage depletion also effectively ameliorates BAS. Mechanistically, dsDNA from damaged epithelial cells activates the cGAS-STING pathway of macrophages and induces IL-6 to activate STAT3 and promote fibrosis. In summary, the present results suggest that cGAS-STING signalling induces acute inflammation and amplifies the chronic inflammation and tracheal fibrosis associated with benign airway stenosis, highlighting the mechanism and potential drug target of BAS.
Benign airway stenosis (BAS) is a prevalent respiratory condition, characterized by varying degrees of respiratory distress and it can lead to asphyxia and even mortality in severe cases. The acute inflammation and chronic inflammation are the critical pathology of benign airway stenosis (BAS) fibrosis. The primary aetiologies of BAS are mechanical injuries, including postintubation tracheal stenosis (PITS), posttracheotomy tracheal stenosis (PTTS), and postsurgical tracheal stenosis . With the frequent occurrence of public health events, such as the COVID-19 incident in recent years, tracheal intubation is an important tool for treating critical care patients with lung failure . However, long-term endotracheal intubation will lead to an increased risk of BAS. Currently, clinical interventions for BAS primarily encompass comprehensive bronchoscopic therapies, such as stent
implantation and balloon dilation . While surgical procedures demonstrate considerable effectiveness, they can also result in secondary injury, which leads to excessive hyperproliferation of granulation tissue granulation tissue and tracheal restenosis. Thus, identifying new therapeutic targets during airway injury to prevent the formation of BAS is crucial. In cases of recurrent cicatricial hyperplasia, some medications (such as mitomycin C, paclitaxel, or pirfenidone) can be utilized to inhibit the fibrosis process, effectively suppressing the development and recurrence of scar tissue . Furthermore, the reports have suggested that the administration of antibiotics, hormones, and other anti-inflammatory medications during the inflammatory phase can yield therapeutic benefits in the treatment of tracheal stenosis . The excessive inflammatory response frequently
serves as a significant contributing factor to the development of airway stenosis, and timely inhibition of this response can effectively alleviate the severity of stenosis.
The cGAS-STING pathway serves as a crucial component of innate immunity, acting as a defence mechanism. DNA can stimulate immune responses, and when the cGAS-STING pathway detects abnormal DNA, such as from bacteria, DNA viruses, and self-DNA released from the nucleus, mitochondria, and dying cells, it becomes activated, leading to the generation of type I interferons (IFNs) and proinflammatory cytokines . Several studies have revealed that the cGAS-STING pathway not only plays a protective role in combating foreign pathogens but also plays a significant role in the initiation and progression of various conditions such as infections, inflammation, tumors, autoimmune diseases, and other diseases . Moreover, reports have revealed the involvement of the STING pathway in the pathogenesis of fibrotic diseases, including pulmonary fibrosis, liver fibrosis, and renal fibrosis . STING is highly expressed on haematopoietic cells, such as macrophages ,and the presence of macrophages is essential for the proper healing of wounds. When macrophages become dysregulated and excessive inflammatory factors are released, abnormal wound healing can occur, resulting in the formation of scar tissue . Previous studies have demonstrated that dsDNA released after myocardial injury activates STING in macrophages, thereby promoting myocardial fibrosis in mice with myocardial infarction . However, the relationship between macrophage STING signalling and BAS remains elusive.
In this work, we find that signalling through STING is involved in the development of BAS. The present study provides evidence that dsDNA released after tracheal injury activates the cGAS-STING pathway in mice with BAS, and that inhibition of STING alleviates fibrosis in benign airway stenosis. Mechanistically, the activation of STING in macrophages by dsDNA upon tracheal injury induces the inflammatory factor IL-6, which further activates fibroblasts via the IL-6-STAT3 axis and promotes fibrosis. Thus, the present findings suggest that the cGAS-STING pathway is a potential therapeutic target for preventing BAS.
Results
Single-cell RNA sequencing reveals the expression of the cGASSTING pathway in granulation tissue from patients with BAS
Single-cell RNA sequencing (scRNA-seq) is widely used for the study of diseases, offering unparalleled insights into cellular heterogeneity. scRNA-seq were performed to examine the cellular identity and investigate the expression heterogeneity of the cGAS-STING pathway in BAS, which is closely associated with acute and chronic inflammation.
Three normal tracheal tissues (normal group) and four granulation tissues (granulation group) were collected for scRNA-seq. In total, 31,478 cells were captured in the normal group, and 27,108 cells were captured in the granulation group (Fig. 1a). The formation of distinct transcriptomic clusters in uniform manifold approximation and projection (UMAP) space was observed, with the clusters reflecting the cell type or group (Fig. 1b, c). The cells were divided into the following 14 clusters according to marker genes: B cells, basal cells, ciliated cells, endothelial cells, epithelial cells, fibroblasts, mast cells, macrophages, neutrophils, plasma cells, proliferating cells, SMCs, T cells, and Type II alveolar cells (Fig. 1d). These 14 clusters of cells were divided into three main groups, namely, epithelial cells, resident cells, and immune cells. The percentage of immune cells was significantly greater in the granulation group than in the normal group (Fig. 1e). GSEA analysis suggested that the most significantly enriched Go term was inflammatory response in Granulation group compare to Normal group (Fig. 1f). This is consistent with the pathological features of acute and chronic inflammation in BAS. In addition, enriched Go terms were also closely related to immune response (Fig. 1f). Further analysis revealed that Cytosolic DNA sensing pathway which closely related to immune response was highly enriched in granulation tissue (Fig. 1g). After
analysis of the gene expression levels of cGAS and STING found that both cGAS and STING were expressed within most of clusters (Fig. 1h). It has been confirmed that STING and cGAS were commonly expressed in both immune and nonimmune cells . In contrast to the general expression of STING and cGAS in most of cell clusters, the high scores for the cGAS-STING pathway were mainly concentrated in immune cells, including macrophages, T cells, and neutrophils (Fig. 1i). The cGAS-STING pathway score was greater in the granulation group than in the normal group (Fig. 1j). Next, the cGAS-STING pathway scores were assessed in each cluster of the granulation group, which revealed the highest score in the macrophage cluster (Fig. 1k). Taken together, the scRNA-seq data suggested that the cGAS-STING pathway, in which macrophages play an important role, is highly expressed in the granulation tissue of patients with benign airway stenosis.
cGAS-STING signalling is activated in BAS
The release of double-stranded DNA (dsDNA) from damaged or dead cells is a key event in the initiation of an inflammatory response. Benign airway stenosis is a pathological condition characterized by acute and chronic inflammation resulting from damage to the large central airways caused by tracheal intubation or the placement of a tracheal stent (Supplementary Fig. 1). Following bronchoscopic lavage in patients with benign airway stenosis, the dsDNA content of tracheal lavage fluid was significantly elevated in patients with benign airway stenosis compared with controls (Fig. 2a, b). To determine the role of the cGASSTING pathway in BAS, a model of BAS was generated by using a brush to inflict damage on the trachea of mice (Fig. 2c). The histological results revealed that the mice in the control group had a patent trachea with an intact epithelium and no inflammatory cell infiltration or granulation tissue proliferation (Fig. 2d). In contrast, in the BAS group, the area of mechanical injury showed varying degrees of stenosis and significant granulomatous hyperplasia, with proliferation of tracheal epithelial cells, extensive inflammatory cell infiltration, excessive proliferation, disorganization of fibroblasts, and increased neovascularization, and excessive extracellular matrix deposition, resulting in thickening of the lamina propria (LP) (Fig. 2d). Notably, the LP thickness was greater in the BAS group than in the control group (Fig. 2e). Mouse tracheal tissues were collected at different time points for transcriptome sequencing. Gene Ontology (GO) analysis of the tracheal transcriptome revealed that the predominant manifestations included the inflammatory reaction elicited by the injury, immune system activation, and various biological processes associated with DNA in the initial 24 h period subsequent to tracheal scraping (Supplementary Fig. 2a). However, in the 7th day after modelling, the tracheal tissue was already in a state of repair, consisting mainly of regeneration of the tracheal ciliated epithelium, remodeling of the extracellular matrix and production of fibroblastic granulation tissue (Supplementary Fig. 2b), which suggested that the trachea of scraped mice underwent a physiological process consistent with sarcomere growth. Moreover, in the early stage of BAS, many molecular functions related to DNA are activated in the trachea of mice. Several studies have now demonstrated that DNA can activate the immune response . Therefore, the present study evaluated the presence of doublestranded DNA (dsDNA) in control and injured tracheas, which revealed that that the dsDNA content in the tracheal lavage fluid in the BAS group was significantly greater than that in the control group (Fig. 2f). Moreover, IF analysis revealed that tracheal scraping led to prominent cytosolic dsDNA leakage in the trachea (Fig. 2g). Kyoto Encyclopaedia of Genes and Genomes (KEGG) pathway analysis of the upregulated differentially expressed genes (DEGs) revealed that the cytosolic DNAsensing pathway was significantly activated in BAS at 24 h after tracheal injury (Fig. 2h). As shown by the heatmap of key DEGs, genes related to the cytosolic DNA-sensing pathway were highly expressed at 24 h after tracheal injury in the BAS group compared with the control group (Fig. 2i). Western blot analysis revealed that expression of cGAS,
STING, and phosphorylation of STING, P65, and TBK1 were elevated at 24 h post-tracheal injury compared with the control group (Fig. 2j). To ascertain the function of the free dsDNA receptor cGAS in the context of BAS, the RU. 521 cGAS inhibitor was administered to the mice (Fig. 2k). Following the administration of RU.521, granulation growth was effectively alleviated, and the thickness of the tracheal LP layer was significantly reduced (Fig. 21, m). In addition to cGAS, the AlM2
inflammasome which also is activated by . Transcriptome sequencing data (Supplementary Fig. 3a) showed the low mRNA expression of AIM2 in the sham and BAS trachea tissue. WB also showed the low protein expression of AIM2 in the both sham and BAS trachea tissue (Supplementary Fig. 3b, c). In sc-RNA seq, we found that AIM2 was also low expression in macrophages (Supplementary Fig. 3d, e). Above data suggested that AIM2 might not function in the
Fig. 1 | Expression of the cGAS-STING pathway in BAS patients by single-cell RNA sequencing. a Schematic overview of the experimental design. Single-cell RNA sequencing of Normal group ( , cell ) and Granulation group ( , cell=27108). b UMAP visualization of Normal group and Granulation group (58586 cells in total). c UMAP visualization of 14 cell types ( 58586 cells in total). d Heatmap of expression for three representative marker genes of each cell type. e Pie chart of the total proportion of each cell type identified in Normal group and Granulation group. f GSEA analysis of increasingly expressed genes showing TOP 10 of enriched GO terms in Granulation group compared with Normal group. g GSEA analysis showing significant enrichment of gene sets associated with cytosolic DNA sensor pathway in Granulation group compared with Normal group. h UMAP visualization of STING and cGAS expression in all clusters. i Dot plot showing the expression of cGAS-STING pathway 9 associated genes (cGAS, STING, TBK1,NFKB1, IRF3, CXCL10,CCL4,IL1B,IL6) in all clusters. j UMAP visualization of cGAS-STING pathway
score in all clusters. k Box Plot showing the cGAS-STING pathway score in Normal group ( cells) and Granulation group ( cell). I Box Plot showing the cGAS-STING pathway score in all clusters of Granulation group: B cells , basal cells ( ), ciliated cells ( ), endothelial cells ( ), epithelial cells ( ), fibroblasts ( ), mast cells ( ), macrophages ( ), neutrophils ( ), plasma cells ( ), proliferating cells , SMCs and T cells . represents the number of cells in cluster. In ( ), box bounds shows 25th and 75th percentiles, whiskers shows 25th percentiles minus (Interquartile Range, the value is 75th percentiles minus 25th percentiles) to 75th percentiles plus 1.5*IQR and box center shows the median.The two-sided Mann Whitney test was used in (k). One-way ANOVA analysis followed by Duncan multiple- range test was used in (I). Source data are provided as a Source Data file.
BAS progress. Together, these data suggested that free dsDNA is present in the trachea of patients with BAS and in a mouse model of BAS. Moreover, free dsDNA leads to the activation of the cytoplasmic DNA-sensitive cGAS-STING pathway in the trachea after tracheal injury in mice. In addition, inhibition of the DNA receptor cGAS effectively alleviates the symptoms of BAS.
STING is expressed at different stages of BAS
Considering that STING is widely expressed in haematopoietic cells (macrophages, T lymphocytes, and dendritic cells) and nonhaematopoietic cells (endothelial cells, epithelial cells, and fibroblasts) , STING expression was analysed at different stages of BAS. Mfuzz analysis of the RNA-seq data revealed high expression of cGAS and STING at 24 h , with a decreasing trend in expression at 7 days after tracheal injury (Supplementary Fig. 2c). Immunofluorescence was used to analyse the phosphorylation status of STING in macrophages and fibroblasts during the different periods of BAS. In the early inflammatory phase of BAS, the level of STING phosphorylation was further increased in macrophages, but with the progression of BAS, there was a gradual increase of the level of STING phosphorylation in fibroblasts (Fig. 3a). During the inflammatory phase, the trachea was infiltrated with many inflammatory cells, such as macrophages, 24 h after tracheal injury (Supplementary Fig. 7a, b). The proportion of STING-positive macrophages among CD45 (pan-leukocyte marker) cells was analysed, which revealed that the number of STING-positive macrophages increased during the inflammatory phase of airway stenosis in the BAS group compared with the control group (Fig. 3b, c). Moreover, immunofluorescence analysis revealed many STING coexpressing cells in the trachea of mice in the BAS group, whereas such cells were rarely found in the control group (Fig. 3d). The immunohistochemical results suggested that STING was expressed in both epithelial cells and fibroblasts from granulation tissue in the trachea of BAS mice at the granulation phase on Day 7 (Fig. 3e). Moreover, the immunofluorescence analysis revealed that there were STING + SMA+ and STING + E-cad+ coexpressing cells in the trachea of the mice in the BAS group, whereas such cells were rarely found in the control group (Fig. 3f, g). STING is strongly linked to the development of fibrotic diseases, and the activation of STING has been demonstrated to facilitate the activation of fibroblasts . However, it remains unknown whether STING is activated within fibroblasts and is associated with the fibrotic process in BAS. Next, the fibroblast clusters in the scRNA-seq data were analysed (Supplementary Fig. 4a), which demonstrated that the expression levels of the COL1, FAP, TGFB1, and FN1 fibroblast activation genes were elevated in the fibroblast clusters of the granulation group compared with those of the normal group (Supplementary Fig. 4b). The cGAS-STING pathway score was greater in the fibroblast clusters of the granulation group than in those of the normal group (Supplementary Fig. 4c). After fibroblast stimulation via the transfection of mouse tracheal DNA, the level of STING phosphorylation was significantly increased, and the levels of fibroblast-
related markers, including collagen I and SMA, were increased in fibroblasts (Supplementary Fig. 4d, e). When STING was knocked down in fibroblasts via siRNA (Supplementary Fig. 4f, g), DNA stimulation failed to promote the activation of fibroblasts (Supplementary Fig. 4h, i). Taken together, these results showed that STING is expressed at acute and chronic inflammation stages of BAS.
Suppression of STING attenuates the development of BAS
To confirm the effect of the cGAS-STING pathway on the progression of BAS, mice were treated with the C176 STING inhibitor (Fig. 4a). Western blot analysis revealed the ability of C176 to reduce the expression of STING and the level of STING phosphorylation (Fig. 4b).On the 7th day after modelling, the BAS group of mice treated with C176 presented significantly less development of granulation tissue, proliferation of the airway epithelium, collagen deposition, and degree of fibrosis compared to the BAS group of mice treated with PBS (Fig. 4c). Moreover, quantitative assessment of LP thickness revealed a thinner LP in C176-treated BAS mice than in PBS-treated BAS mice (Fig. 4d). In addition, we administered the drug 24 h after tracheal injury and found the same protective effect (Supplementary Fig. 5a, b). The same phenomenon was observed in STING KO mice at 7 days after tracheal scraping in which the degree of granulomatous hyperplasia in the trachea was significantly lower in the BAS group than in the WT group (Fig. 4e).Histopathologic analysis revealed reduced LP thickness in STING KO mice compared with WT mice on the 7th day after modelling (Fig. 4f). Masson’s trichrome staining revealed that STING knockout mice with BAS expressed fewer collagen fibers than wildtype mice (Fig. 4g, h). Micro-CT scans of wild-type mice and STING KO mice in the control group revealed no tracheal stenosis (Fig. 4j, k). In contrast, on the 7th day after modelling, the wild-type mice and STING KO mice exhibited the formation of discernible protrusions within the tracheal lumen (Fig. 4j, k). This aberration was indicative of localized narrowing at the site of injury, which was readily apparent upon imaging analysis. Notably, micro-CT scans revealed that the severity of luminal constriction was markedly lower in STING knockout mice than in their wild-type counterparts (Fig. 4i). These results suggested that the inhibition of STING reduces the progression of airway stenosis and may also inhibit the progression of fibrosis.
Macrophage STING expression in BAS is associated with inflammation
At present, the main clinical treatment for BAS is the removal of granulation tissue under bronchoscopy, but this can cause secondary stenosis. Therefore, early intervention may effectively alleviate the proliferation of granulation tissue. The present study demonstrated that STING was expressed in the early acute inflammatory stage of BAS and in the later chronic inflammatory stage (granulation hyperplasia). STING has been shown to be strongly associated with inflammation . As shown by the heatmap of key DEGs, STING and inflammatory genes were highly expressed at 24 h after tracheal injury in the treated mice
compared with the control mice (Fig. 5a). To investigate the role of STING in the inflammatory phase of airway stenosis, mice were treated with C176 (Fig. 5b). Compared with those of the BAS group treated with PBS, the wheezing symptoms of the BAS group treated with C176 improved during the inflammatory phase of airway stenosis, and the HE staining results revealed that the degree of inflammatory oedema in the airways of the BAS group treated with C176 also improved (Fig. 5c). In the early inflammatory stage, the airway injury caused airway inflammation and edema, resulting in tracheal stenosis and wheezing.
Noninvasive pulmonary function test showed that C176 could effectively reduce the inspiratory time of the mice after tracheal injury, thereby alleviating the wheezing symptoms of the mice (Fig. 5d). Moreover, the qRT-PCR results suggested that the expression of IL6, IL1 and CXCL10 in the BAS group treated with C176 was significantly lower than that in the BAS group treated with PBS (Fig. 5e). At the protein level, the multifactorial assay similarly suggested that the expression of inflammatory factors and inflammation-associated chemokines was reduced after airway injury in mice injected with C176
Fig. 2 | cGAS-STING signalling is activated in mouse tracheal upon injury.
a Schematic diagram of tracheal lavage of the patient. b Quantification analysis of dsDNA in tracheal lavage fluid in control group ( ) and BAS patients’ group ( ). c Schematic diagram describing experimental strategies in mice with benign airway stenosis. d H&E staining showing Intratracheal and LP conditions in control and BAS mice at 7th day. Scale bars indicate and m.e Quantitative analysis of LP thickness in control group and BAS group ( mice per group). f-j Tracheal tissues were collected from mice with BAS at 24 h after tracheal injury. f Quantitative detection of dsDNA in tracheal lavage fluid of mice in control group and BAS group ( mice per group). Representative tracheal immunofluorescence images of dsDNA(green) in the BAS group and control group. Scale bars indicate and ( mice per group). Kyoto Encyclopedia of Genes and Genomes (KEGG) analysis showing that tracheal injury upregulated
genes involved in several biological process. i Heatmap showing that the BAS group upregulated genes involved in cytosolic DNA sensor pathway compare to control group ( mice per group). j Western blot analysis showing the levels of cGAS, PSTING, STING, P-TBK1, TBK1, P-P65, and P65 in the trachea of BAS group and control group ( mice per group) at Schematic of Ru. , ip) administration in mice. 1 H&E staining showing Intratracheal and LP conditions in control and BAS mice at 7th day. Scale bars indicate and Quantitative analysis demonstrated decreased lamina propria thickness in BAS group treated with Ru. 521 compared to BAS group treated with PBS ( mice per group). Data are presented as the mean ± SEM. A two-sided student’s T-test was used in (b, e, f). hypergeometric test was used in (h). One-way ANOVA analysis followed by Tukey post hoc multi-comparison test was used in (m). Source data are provided as a Source Data file.
(Fig. 5f). The process of wound healing, proinflammatory macrophages play an important role, as they produce proinflammatory cytokines, such as TNF-a and IL6 and other mediators that promote wound healing . The macrophage clusters in the scRNA-seq data were separately analysed, with 1216 cells in the normal group and 4,409 cells in the granulation group (Fig. 5 g ). The macrophages were further classified into seven functional clusters (Mc1-Mc7) (Fig. 5h). Of these, the Mc5, Mc6, and Mc7 clusters were present in both groups. The normal group had predominantly M2 clusters, and the granulation group had predominantly Mc1 clusters and a small number of Mc3 and Mc4 clusters (Fig. 5i). The Mc1 cluster had the highest percentage of DEGs in the granulation group, with signature genes corresponding to lipid metabolism, the regulation of inflammatory responses, and the promotion of tissue repair. The top 5 biological processes according to the GO analysis were also predominantly related to inflammation, immunity, and lipid metabolism (Fig. 5j, k). The Mc2 cluster, which constituted the majority of the normal group, highly expressed MRC1, suggesting that it is a tissue-retained macrophage, and GO analyses revealed a predominantly translational correlation (Fig. 5j, k). The Mc3 and Mc4 clusters present in the granulation group presented proinflammatory features, and the marker genes were mainly early inflammatory genes (IL1B) and warning proteins (S100a8 and S100a9). GO analyses of the Mc3 and Mc4 clusters indicated that these clusters were associated mainly with inflammation and immunity. In addition, the VCAN marker gene suggested that the Mc3 and Mc4 clusters were located mainly in the extracellular matrix (Fig. 5j, k). IRF4, which is a macrophage polarization gene, was marker gene for the M5 cluster, suggesting that this cluster may polarize towards pro-repair macrophages (Fig. 5j, k) . The Mc6 cluster showed antigen processing activity and expressed HLA-DQA1, LAMP3, and HLA-DOB, which are linked to antigen presentation, and the GO terms included antigen processing and presentation (Fig. 5j, k). Mc7 exhibited reparative and collagenic activity, and it expressed genes associated with collagenous ECM (COL1A1 and COL4A1) and tissue repair-related GO terms (cell adhesion and cell migration) (Fig. 5j, k). Mc7 also expressed a vascular repair-related gene (VWF), suggesting that it is also involved in neovascularization in granulation tissue (Fig. 5j). The cGAS-STING pathway score was assessed across clusters, which revealed higher scores for Mc1, Mc3, and Mc4 (Fig. 51). In addition, several inflammatory factors, such as IL6, IL13, and CXCL10, were also mainly concentrated in the Mc1, Mc3, and Mc4 clusters (Fig. 5 m ). Because Mc1, Mc3, and Mc4 macrophages were associated mainly with inflammation (Fig. 5j, k), the macrophage clusters with high cGAS-STING pathway scores may be associated with inflammation. Overall, these findings suggested that in the early stages of airway injury, STING activation in macrophages within the airway promotes inflammatory factor expression.
Macrophages promote fibroblast activation via the IL6STAT3 axis
Gene set enrichment analysis (GSEA) using MSigDB hallmark gene sets revealed that compared with the normal group, the granulation group
was enriched predominantly in inflammation-associated pathways, cell growth-related pathways, and oxidative stress-related pathways (Fig. 6a). Among these pathways, the IL6-STAT3 pathway was associated with granulation (Fig. 6b) has been shown to be associated with fibrosis . STAT3 has recently been reported to be highly expressed in the tracheal granulation tissue of patients with BAS . Next, the present study analysed from the scRNA-seq data and revealed that the JAK-STAT pathway was associated primarily with fibroblasts (Fig. 6c). Immunohistochemistry analysis indicated that granulation tissue from patients with BAS highly the level of STAT3 and STING phosphorylation compared with normal airways (Fig. 6d). The high cGAS-STING pathway score was focused mainly on immune cells, such as macrophages, T cells, and neutrophils (Fig. 2h). Compared with T cells and neutrophils, macrophages strongly interact with fibroblasts according to CellPhoneDB ligand-receptor analysis (Fig. 6e). The IL6 expression levels were assessed via scRNA-seq, which revealed that IL6 expression was increased in macrophages, SMCs, fibroblasts, and endothelial cells (Supplementary Fig. 6a). Cells expressing both STING and IL6 were assessed in the four clusters, which indicated that the strongest correlation between STING and IL6 expression was in the macrophage cluster (Supplementary Fig. 6b). To investigate the relationship of macrophages with fibroblasts and mice were treated with clodronate liposomes (Fig. 6f). Flow Cytometry analysis suggested that during the inflammatory phase, macrophage infiltration was significantly greater in the BAS group with injected with PBS than in the control group injected with PBS, but the percentage of macrophages in the BAS group clearly decreased after clodronate liposome injection compared with that in the PBS group (Supplementary Fig. 7c). The histological results suggested that after Clodronate Liposomes injection, granulomatous proliferation in the trachea of mice in the BAS group was significantly inhibited compared with that in PBS injection group on the 7th day (Fig. 6g). Moreover, the LP thickness in the BAS group treated with Clodronate Liposomes was significantly smaller than that in the BAS group treated with PBS (Fig. 6h). The potential therapeutic benefits of inhibiting of the fibrotic process in BAS on the 14th day after tracheal injury were explored. The BAS group treated with PBS presented of fibrous scarring of tracheal rings, but the BAS group treated with Clodronate Liposomes did not have excessive fibrous deposition at the site of tracheal injury, but instead had a state of just-injured trachea (Fig. 6g). Moreover, the LP thickness in the BAS group treated with Clodronate Liposomes was still lower than that in the BAS group treated with PBS (Fig. 6h). Micro-CT data suggested that the hyperplastic neoplastic organisms in the trachea of the mice were significantly smaller after clodronate injection (Fig. 6i, j). Next, the degree of tracheal stenosis at the horizontal level was analyzed, which revealed that the degree of stenosis in the BAS group treated with Clodronate Liposomes was less than that in the BAS group treated with PBS (Fig. 6k). Thus, these results suggested that macrophage depletion attenuates the progression of BAS, suggesting that macrophages may play an important role in fibrosis in BAS. To investigate the role of macrophages in fibrosis in BAS, RNA-seq was conducted on mice
7 days after modelling, as well as on the Clodronate Liposomesinjected group of mice 7 days after modelling. Gene Ontology (GO) analysis of the transcriptome revealed that the enriched DEGs, such as genes related to extracellular matrix organization, cell adhesion, collagen trimers, collagen-containing extracellular matrix, and extracellular matrix structural constituents conferring tensile strength, in the BAS group treated with PBS and treated with clodronate liposomes were predominantly associated with fibrosis compared with those in
the control group; however, the degree of enrichment was lower in the clodronate liposome-injected group than in the PBS-injected group (Supplementary Fig. 8a). A heatmap of the RNA sequencing results indicated that the expression of inflammation-related genes and fibrosis-related genes was significantly upregulated compared with that in the control group, but the degree of upregulation in the BAS group treated with Clodronate Liposomes was lower than that in to the BAS group treated with PBS (Supplementary Fig. 8b). GSEA of KEGG
Fig. 3 | STING was expressed at different stages of BAS. a Tracheal specimens were collected from control group of mice and BAS group of mice at days, and 7 days after modeling, and representative immunofluorescence images of P-STING (green), macrophages (marked with F4/80, pink), fibroblasts (marked with aSMA, red) in mice tracheal tissues. Scale bars indicate and mice per group). b-d Tracheal tissues were collected from mice with BAS at 24 h after tracheal injury. b, c Flow cytometry plots demonstrate percentage of STING macrophages in tracheal leukocytes (CD45 cells), and the results showed that the percentage was significantly higher in the BAS group compare to control group ( mice per group). d Representative tracheal immunofluorescence images of STING(green), and macrophages (marked with F4/80, red) in mice ( mice per group). Scale bars indicate and . Red arrows indicate STING
macrophages. e-g Tracheal tissues were collected from mice with BAS at 7 d after tracheal injury. e Immunohistochemical results suggested that STING expressing in the trachea of BAS mice at the granulation stage on the 7th day ( mice per group). Scale bars indicate and . f Representative tracheal immunofluorescence images of STING (green), and fibroblasts (marked with aSMA, red) in mice ( mice per group). Yellow dashed line: Areas of co-expression of STING and aSMA. Scale bars indicate and . g Representative tracheal immunofluorescence images of STING (green), and epithelial cells (marked with Ecad,red) in mice ( mice per group). Yellow dashed line: Areas of co-expression of STING and E-cad. Scale bars indicate and . Data are presented as the mean ± SEM. A two-sided student’s T-test was used in (c). Source data are provided as a Source Data file.
gene sets revealed reduced enrichment of the cytosolic DNA-sensing pathway, the NFkb pathway, and pathways related to tissue repair, such as ECM receptor interaction and cell adhesion, following clodronate liposome administration (Supplementary Fig. 8c). Notably, Masson staining results revealed that the BAS group treated with Clodronate Liposomes presented a lower level of collagen fib redeposition compared to the BAS group treated with PBS (Fig. 61, m). The immunofluorescence results suggested that the expression levels of SMA and collagen-1 were markedly elevated in the BAS group; however, the expression levels of SMA and collagen-1 in the BAS group treated with clodronate liposomes were lower than those in the BAS group treated with PBS (Fig. 6n, o). the present study explored the mechanism of macrophages promoting fibroblast activation. Gene set enrichment analysis of the transcriptional changes via curated hallmark pathways revealed strong upregulation of the IL6-STAT3 pathway, indicating a high degree of enrichment in mice with BAS (Supplementary Fig. 9a). Subsequently, mice were treated with STATTIC, an inhibitor of STAT3, on mice (Supplementary Fig. 9b). HE staining revealed that granulation proliferation in the trachea was blocked and the thickness of LP was significantly reduced in the BAS group treated with STATTIC compared with the BAS group treated with PBS (Supplementary Fig. 9c,d). These data suggested that STAT3 plays an important role in the progression of BAS. The RNA-seq results indicated that the IL6-STAT3 pathway was less enriched in the BAS group treated with Clodronate Liposomes than in the BAS group treated with PBS (Fig. 6p) Next, the role of macrophages on STAT3 was investigated. After macrophage depletion, the expression levels of IL6 and the level of STAT3 phosphorylation in the trachea of BAS mice were significantly lower than those in the BAS group treated with PBS (Fig. 6q, r). To assess the effect of IL6 on BAS, mice were treated with an IL6 neutralizing antibody and exogenous IL6 supplementation (Supplementary Fig. 9e). HE staining revealed that the proliferation of granulation tissue was alleviated by the use of an IL6 neutralizing antibody, whereas supplementation with exogenous IL6 exacerbated the growth of the granulation tissue (Supplementary Fig. 9f). In addition, the thickness of the LP layer also decreased and increased with IL6 antagonism and supplementation, respectively (Supplementary Fig. 9g). Immunofluorescence analysis revealed that the use of an IL6 neutralizing antibody reduced the level of STAT3 phosphorylation and fibroblast activation, whereas IL6 supplementation promoted he level of STAT3 phosphorylation expression and fibroblast activation (Supplementary Fig. 9h, i).These data revealed that macrophage depletion is beneficial for alleviating the fibrotic process of BAS, and that the interaction between macrophages and fibroblasts is mediated through the IL6-STAT3 signalling pathway.
Tracheal DNA activates the STING pathway in macrophages thereby promoting fibroblast activation via the IL6-STAT3 axis The dsDNA released by cell death can activate STING in macrophages, promoting the release of inflammatory factors . The present study confirmed that there is substantial release of dsDNA after tracheal injury and numerous highly expressed pathways associated with the
repair of DNA damage after 24 h after tracheal injury (Fig. 7a). The H2AX marker, which is commonly associated with DNA damage, was identified 24 h after the modelling process and was expressed mainly in the tracheal epithelium after injury (Fig. 7b). Immunofluorescence staining showed that the colocalization macrophages marker F4/80 with free dsDNA, cGAS as well as P-STING in the injured tracheal (Fig. 7c). To investigate whether free dsDNA acts to recruit macrophages after tracheal injury, mice were treated with DNase I (Supplementary Fig. 10a). The dsDNA content of the mouse tracheal lavage fluid decreased significantly after the use of DNase I (Supplementary Fig. 10b). Moreover, the degree of inflammation and oedema after tracheal injury in mice was also improved with the use of DNase I (Supplementary Fig. 10c). Immunofluorescence and flow cytometry analyses indicated that macrophage infiltration in the trachea of mice was significantly reduced after the use of DNase I (Supplementary Fig. 10d-g). Next, the death epithelial cell supernatant (DECS) was used to culture BMDMs (Fig. 7d). After ultraviolet-induced epithelial cell death, the DECS contained a large amount of dsDNA (Fig. 7e, f). Moreover, the level of STING phosphorylation in BMDMs was significantly elevated after 24 h of culture with DECS (Fig. 7g, h). Tracheal DNA was obtained from mice 24 h post-modelling, followed by the activation of BMDMs (Fig. 7i). Western blot analysis revealed increased the level of STING phosphorylation in BMDMs after transfection of tracheal DNA (Fig. 7j, k). Moreover, Moreover, immunofluorescence analysis revealed that the expression level of P-STING in BMDMs increased after transfection of the tracheal DNA, whereas it decreased after treatment with DNase I (Fig. 71, m). The ELISA results demonstrated that the concentration of IL6 in the culture supernatant of BMDMs was significantly increased after the transfection of tracheal DNA (Fig. 7o). The qRT-PCR analysis suggested that BMDMs transfected with DNA expressed significantly lower levels of IL6 after treatment with C176, an inhibitor of STING (Fig. 7p). Together, these findings suggested that the inhibition of STING was also able to reduces the level of STAT3phosphorylation. Immunofluorescence analysis suggested that in the trachea of STING KO mice with BAS, the expression of IL6 and STAT3 was significantly lower than that in the trachea of wild-type with BAS (Fig. 7q, r). Therefore, these findings suggested that the inhibition of STING in macrophages is followed by a decrease in IL6 expression, which inhibits fibrosis by suppressing STAT3 activation in fibroblasts. Subsequently, BMDM were cocultured with fibroblasts and tracheal DNA was used to activate STING in BMDMs (Fig. 7s). Compared with those in the control group, immunofluorescence analysis indicated that the expression of P-STAT3 and αSMA in fibroblasts in the coculture group increased, but the expression of P-STAT3 and αSMA was reduced after the addition of C176 to the coculture of BMDMs and fibroblasts transfected with DNA (Fig. 7t, u). These results suggested that dsDNA released after tracheal injury activates the STING pathway in macrophages, which promotes the expression of the IL6 inflammatory factor, which further activates STAT3 expression in fibroblasts, thereby promoting fibroblast activation to accelerate fibrosis in patients with benign airway stenosis.
Fig. 4 | Suppression of the STING attenuates the development of BAS. a Schematic of C176 administration in mice. b Western blot analysis showing the P-STING and STING expression in mouse trachea at 24 h after modeling in control group, BAS group treated with PBS and BAS group treated with C176 ( mice per group). c H&E staining showing Intratracheal and lamina propria conditions in control group, BAS group treated with PBS and BAS group treated with C176 ( mice per group). Scale bars indicate and . d Quantitative analysis demonstrated decreased lamina propria thickness in BAS group treated with C176 compared to BAS group treated with PBS ( mice per group). e H&E staining showing Intratracheal and lamina propria conditions in WT control group,STING KO control group, WT BAS group, STING KO BAS group ( mice per group). Scale bars indicate and . f Quantitative comparison of tracheal LP showed reduced thickness at STING KO BAS group compare to WT BAS group (
mice per group). g, h Tracheal sections stained with Masson trichromatic staining of different groups of mice, and relative collagen content were reduced in STING KO BAS group compare to WT BAS group ( mice per group).Scale bars indicate and . i The CT diagram of the area of tracheal stenosis measured by SYNPASE 3D, and results showed that the area of tracheal stenosis in STING KO BAS group was significantly smaller than that in WT BAS group ( mice per group). j Micro CT scans of different groups in Horizontal, Coronal and Sagittal plane with red arrows indicating the stenosis site. SYNPASE 3D reconstruction of mouse trachea with red arrows indicating the stenosis site. Data are presented as the mean ± SEM. Two-sided student’s T-test were used in (b). One-way ANOVA analysis followed by Tukey post hoc multi-comparison test was used in (b, d). Two-way ANOVA analysis followed by Tukey post hoc multi-comparison test was used in (f, h, i). Source data are provided as a Source Data file.
Discussion
In recent years, with the increase in critical care ambulances, endotracheal intubation, tracheotomy and other manipulations, the incidence of BAS has gradually increased. Although the current respiratory
interventions control symptoms in the short term, they carry a risk of restenosis. Therefore, identifying therapeutic targets to prevent BAS is imperative. The present study revealed that the inhibition of STING reduces the degree of fibrosis associated with BAS and improves patient
prognosis. Mechanistically, this improvement due to the release of dsDNA from tracheal injury, which activates STING-promoted IL6 release from infiltrating macrophages during the inflammatory phase of benign airway stenosis. Increased IL6 further activates STAT3 in fibroblasts, thereby promoting fibrosis. The comprehensive research strategy and process was shown in Fig. 8. These findings suggest that the cGAS-STING pathway is a critical factor involved in BAS.
The repair process after tracheal injury has similar characteristics to that of other soft tissue and organ injuries, and it involves four procedural stages, namely, haemostasis, inflammation, proliferation, and remodelling . Dysregulation at any stage can lead to hyperplasia of scar granulation. The progression of benign airway stenosis involves the activation of certain immune cells, cytokines and a range of signalling pathways. Hence, BAS is now being recognized as a
Fig. 5 | STING expression in macrophages in BAS is associated with inflamma-
tion. a Heatmap showing that the BAS group upregulated genes involved in cGAS,STING and inflammation factors compare to control group at 24 h after tracheal injury ( mice per group). b-f Mice were divided into three groups: control, BAS + PBS and BAS + C176. b Schematic of C176 administration in mice. c Representative images of H&E staining in different groups. Scale bars indicate and . d Quantitative comparison of lung function indices (Inspiratory time) in different groups ( mice per group). e mRNA levels of , IL1 and Cxcl10 in trachea from different groups ( mice per group). Protein levels of inflammation factors (IL6,CCL12,CCL4,CXCL5 and GM-CSF)in trachea from different groups ( mice per control group, mice per BAS group). g-m sc-RNA seq analysis of macrophage clusters. UMAP visualization of macrophage clusters in Normal group ( 1216 cells in total) and Granulation group ( 4409 cells in total). h UMAP visualization of Seven types of macrophages ( 5625 cells in total). i Barplot of the percentage of each type in Normal group and Granulation group. Heatmap
of expression for three representative marker genes of each cell type. Dot plot of the enriched Gene ontology (GO) biological processes of highly expressed genes in each cluster. Dot size corresponds to the proportion of cells within the group expressing each gene, and dot color correspond to GO enrichment -value. I Box Plot showing the cGAS-STING pathway score in all clusters:Mc1 ( ), Mc2( ), Mc3 , Mc4 , Mc5 , Mc6 , Mc7 ( ). n represents the number of cells in cluster. m UMAP visualization of cGASSTING pathway score and the expression of STING,cGAS,IL1B,IL6 and CXCL10 in all clusters. In (I), box bounds shows 25th and 75th percentiles, whiskers shows 25th percentiles minus to 75 th percentiles plus and box center shows the median. Data are presented as the mean ± SEM. One-way ANOVA analysis followed by Tukey post hoc multi-comparison test was used in (d, e). Kruskal waliis test used in (f). Hypergeometric test was used in (k). Source data are provided as a Source Data file.
fibroinflammatory event triggered by immune alterations . The cGASSTING pathway plays an essential role in intrinsic immunity, and a previous study has confirmed that dsDNA released after injury exacerbates inflammation and fibrosis by activating cGAS-STING . The present findings indicated that free dsDNA is present in the trachea of BAS patients and mice after tracheal scraping with a small brush. Additionally, the RNA sequencing results suggested that there is an enrichment of genes related to DNA damage in the early stages of BAS. Therefore, the present findings suggested that the dsDNA produced following tracheal injury may serve as the initiator of the cGAS-STING pathway. While there are no studies that directly link the cGAS-STING pathway to BAS, it has been demonstrated to be involved in fibrotic processes in other organs and tissues . Single-cell sequencing analysis of normal trachea and granulation tissue from BAS patients revealed that cGAS-STING pathway was activated in granulation tissue. Similarly, the present results revealed significant upregulation of cGASSTING pathway expression in a mouse model of BAS. After the inhibition or knockout of STING, inflammation and fibrosis associated with airway stenosis are alleviated in mice. These results suggested that cGAS-STING signalling in macrophages is responsible for the acute inflammation phase and that cGAS-STING signalling in fibroblasts may be responsible for the chronic inflammation phase of granulation. Administration of C176 every other day may alleviate granulation by decreasing inflammation, suggesting that C176 may be a potential drug candidate for BAS.
The inflammatory phase is an important stage in the fibrotic process of benign airway stenosis. The purpose of this method is to remove pathogens and necrotic tissue to lay the foundation for tissue regeneration and repair. In the present study, the cGAS-STING pathway was highly activated during the inflammatory phase of BAS, and STING inhibitors were effective in alleviating airway inflammation. During the inflammatory phase of fibrosis, many inflammatory cells, such as neutrophils, macrophages, and lymphocytes, infiltrate. Macrophages play an important role in inflammatory phase by acting as scavengers, engulfing dead cells and debris in their surroundings while secreting a considerable quantity of cytokines (IL6, IL1and TNF ) . Aberrant activation of the cGAS-STING pathway in macrophages has been reported to be associated with fibrosis-related diseases . In the present study, the trachea was infiltrated with large numbers of STING-expressing macrophages during the inflammatory phase of BAS in mice. Similarly, scRNAseq analysis revealed that a highly scored macrophage population of the cGAS-STING pathway was strongly associated with an inflammatory response. Therefore, these findings suggested that the expression of STING in infiltrated macrophages infiltrated during the inflammatory phase of benign airway stenosis is correlated with inflammation. In addition, stimulation of BMDMs with dsDNA from dead epithelial cells and from mouse trachea activated STING.
Fibroblasts are the key cellular effector cells for extracellular matrix deposition and reorientation in fibrotic diseases . Interestingly,
the present study detected STING-expressing fibroblasts in the trachea of BSA-treated mice at the chronic inflammation stage. Activation of STING in fibroblasts via the transfection of mouse tracheal DNA promoted fibrosis in fibroblasts, and this effect was inhibited by knocking down STING. Previous studies have indicated that during myocardial infarction (MI), stimulation of the cGAS-STING pathway in infiltrated macrophages can induce fibrosis of cardiac fibroblasts , suggesting that the same situation may exist within the BAS. Research has indicated that eliminating macrophages during the initial stages of inflammation can help minimize scar formation . Consistent with this perspective, the present study detected significantly less fibrosis in mice with benign airway stenosis after depletion of mouse macrophages. RNA sequencing of mice and scRNA-seq data revealed that the fibrosis process may be affected through the IL6-STAT3 pathway. Although the IL6-STAT3 pathway has been shown to be associated with fibrotic disease ,no studies have confirmed that this axis plays a role in BAS. In this study, the present study demonstrated that the level of STAT3 phosphorylation was highly in human tracheal granulation tissue, and that trachea fibrosis is attenuated in BAS mice after the inhibition of P-STAT3. In addition, the role of IL6 was explored in BAS. Tracheal fibrosis in BAS mice was alleviated or exacerbated after the use of an IL6-neutralizing antibody or supplementation with IL6. The present study also demonstrated that STING activation in macrophages promotes the release of IL6 and that the release of IL6 from macrophages was reduced after the use of STING inhibitors. In addition, the expression levels of P-STAT3 and fibrosis markers in fibroblasts were increased after coculturing tracheal DNA-stimulated BMDMs with fibroblasts. The present study also demonstrated that macrophages in granulation tissue presented significantly elevated levels of IL6 compared with those in normal tracheal tissue, and these macrophages presented high expression levels of and CXCL1O (Fig. 5 m ). Moreover, treatment with the C176 STING inhibitor resulted in a significant reduction in the expression of these cytokines (Fig. 5e), indicating the potential role of the cGAS-STING pathway in the development of BAS. Previous studies have established a strong correlation between IL-1 and various fibrotic diseases , and CXCL10 has been suggested to be crucial for the chemotaxis of immune cells. IL-1 has been implicated in inflammasome activation, and we found that AIM2 inflammasome may not play a role in BAS. In addition to AlM2 inflammasome, NLRP3 inflammasome and NLRP1 inflammasome are also activated IL-1 . So, we analyzed the transcriptome data of the trachea of BAS mice and found that NLRP3 and NLRP1 were highly expressed (Supplementary Fig. 3f). And in the sc-RNA seq data, IL-1 was highly expressed mainly in macrophages and neutrophils, where there was high expression of NLRP3 in macrophages and NLRP1 in neutrophils (Supplementary Fig. 3g). Therefore, the highly expressed IL-1 is not related to AIM2 in BAS, but is related to NLRP3 and NLRP1.And it has been confirmed that cGAS-STING pathway also leads to NLRP3 activation . These findings suggest that IL-1 and CXCL10
Fig. 6 | Macrophages promote fibroblast activation via the IL6-STAT3 axis. a GSEA analysis showing TOP5 enriched hallmark pathways in Granulation group compared with Normal group. b GSEA analysis show IL6 jak STAT3 pathway enrichment in Granulation group. c Box Plot showing the JAK-STAT pathway score in all clusters in Normal group and Granulation group: B cells ( ), basal cells( ), ciliated cells ( ), endothelial cells ( ), epithelial cells , fibroblasts ( ), mast cells ( ), macrophages ( ), neutrophils ( ), plasma cells ( ), proliferating cells ( ), SMCs cells and Type II alveolar cells . n represents the number of cells in cluster. d Representative images of P-STAT3 and P-STING immunohistochemical staining. ( sample per group). e Heatmap illustrates ligand-receptor interactions between Macrophages, T cells, neutrophils, and fibroblasts. Mice were divided into three groups: control, BAS + PBS and BAS + Clodronate Liposomes. f Schematic of Clodronate Liposomes administration in mice. Representative images of H&E staining in different groups at days 7 and 14. h Quantitative analysis of LP thickness in different groups. ( mice per group). i Micro CT scans of different groups in Horizontal, Coronal and Sagittal plane.
j SYNPASE 3D reconstruction of mouse trachea. Red arrows indicating the stenosis site in (i-k). The CT diagram of the area of tracheal stenosis measured by SYNPASE 3D and quantitative analysis of area in different groups( mice per group). 1 Representative images of Masson staining in different groups. Quantitative analysis of collagen area in different groups ( mice per group).
n, o Representative tracheal immunofluorescence images and mean fluorescence intensity of SMA(red) and COL1(green) in different groups ( mice per group). p GSEA analysis show IL6 jak STAT3 pathway enrichment in BAS + PBS group. q, r Representative tracheal immunofluorescence images and mean fluorescence intensity of P-STAT3(green) and IL6(red) in different groups ( mice per group). Scale bars in (d, g, n, q) indicates and . Scale bars in (I) indicate . In (c), box bounds shows 25th and 75th percentiles, whiskers shows 25th percentiles minus to 75 th percentiles plus and box center shows the median. Data are presented as the mean ± SEM. One-way ANOVA analysis followed by Tukey post hoc multi-comparison test was used in (h, k, m, o, r). One-way ANOVA analysis followed by Duncan multiple- range test was used in c. Source data are provided as a Source Data file.
a better understanding of the involvement of the STING pathway in fibrosis, ultimately guiding further investigations into its therapeutic potential across different fibrotic diseases.
In conclusion, the present findings indicated that the cGAS-STING pathway plays a critical role in BAS through mainly promoting the release of the IL6 inflammatory factor from macrophages to activate STAT3 in fibroblasts, thereby promoting fibrosis. Therefore, the cGASSTING pathway may represent a therapeutic target for preventing BAS.
Methods
Animals
C57BL/6J, female and male mice, 8 weeks of age, were purchased from SPF (Beijing) Biotechnology Co., Ltd. The STING KO mice (Cat No. T012747), 8 weeks of age, were C57BL/6 J background, and were purchased from Jiangsu Gempharmatech, China. All animal were fed in Specific pathogen free (SPF) class animal houses at the First Hospital of the Naval Medical University with a standard 12 h light dark conditions and had free access to water and food. The room temperature was maintained at , and relative humidity was around . All animal experiments were performed in accordance with the Guide for the Care and Use of Laboratory Animals published by the NIH and approved by the Animal Care and Utilization Committee of Shanghai Changhai Hospital under number CHEC2021-006.
The incidence of benign airway stenosis does not differ between males and females . In this study, we used both male and female mice and found that the severity of benign airway stenosis also did not differ between the two groups.
Patients and samples
All procedures performed in the study were approved by the Ethical Committee of The First Affiliated Hospital of Naval Medical University. The study was performed after obtaining written informed consent from the patients following the principles outlined in the Declaration of Helsinki. The ethical approval number was CHEC2021-043. The information of participants was summarized in Supplementary Table 1.
A total of seven samples were obtained for single-cell RNA sequencing. In the granulation group, 4 samples of granulation tissue from patients with benign airway stenosis were collected by Bronchoscopic Electrosurgical Snaring at The First Affiliated Hospital of Naval Medical University (ShangHai, China). The selection criterion of granulation tissue was the newly formed granulation tissue within one month of recent tracheal injury. In the normal group, 3 samples of normal trachea from patients undergoing lobectomy at The First Affiliated Hospital of Naval Medical University (ShangHai, China). The normal trachea was obtained by separating the lung tissue after lobectomy.
A total of ten tracheal lavage fluids were used to detect the content of dsDNA. In the BAS group , the area of the injured trachea
in patients with tracheal intubation was irrigated by tracheoscopy at The First Affiliated Hospital of Naval Medical University (ShangHai, China), and tracheal lavage fluid was collected. In the control group , tracheal lavage fluid was obtained from patients with pulmonary nodules who underwent bronchoscopy at The First Affiliated Hospital of Naval Medical University (ShangHai, China) and whose airways had not been damaged.
A total of six samples were obtained for Immunohistochemistry. 3 samples in control group and 3 samples in BAS group. These samples were obtained in the same way as those obtained for single-cell RNA sequencing.
Drug administration
For deplete macrophages in mice, the mice were given of Clodronate Liposomes (#40337ES10, YEASEN, Shanghai, China) by intravenous Injection on 6 h before surgery and of Clodronate Liposomes by intravenous Injection on days 2, 4 and 6 after surgery. The efficiency of macrophages depletion was evaluated by Flow Cytometry.
For inhibit STING in mice, the mice were given C176(#S6575, Selleck, USA) dissolved in 10% DMSO (# HY-Y0320, MedChem Express, USA) and 90% corn oil(#HY-Y1888, Med-Chem Express, USA) by intraperitoneal injection on 2 h before modeling, days 2, 4 and 6 after modeling.
For inhibit P-STAT3 in mice, the mice were given Stat-tic(#HY-13818, Med-Chem Express, USA) dissolved in 10% DMSO + 40% PEG300(#HY-Y0873, Med-Chem Express, USA) + 5%Tween-80(#HYY1891, Med-Chem Express, USA) saline by intraperitoneal injection on 2 h before modeling, days 2, 4 and 6 after modeling.
For inhibit cGAS in mice, the mice were given RU.521(# HY-114180, Med-Chem Express, USA) dissolved in 10% DMSO + 40% PEG300 Tween- saline by intraperitoneal injection on 2 h before modeling, days 2, 4 and 6 after modeling.
To investigate the role of IL6, Anti-mouse IL6-InVivo MP5-20F3 (#A2118, Selleck, USA) and recombinant mouse IL6(#HY-P7063, MedChem Express, USA) were used. For experiments utilizing Anti-mouse IL6-InVivo MP5-20F3 ( ) was intraperitoneal injection on 2 h before modeling, days 2, 4 and 6 after modeling. For experiments utilizing recombinant mouse IL mouse was intravenous Injection on 2 h before modeling, days 2, 4 and 6 after modeling.
For DNase I treatment, Mice were treated with extracellular DNase I ( mouse ) (#10104159001,Sigma-Aldrich,USA) 4 h prior and 8 h after modeling .
Transfection of siRNA
siRNAs were purchased from HANBIO(ShangHai,China). A scrambled siRNA was used as an NC. The target sequences of the siRNAs and siNC are presented in Supplementary Table 2. Transfections were
Fig. 7 | dsDNA activates the STING pathway in macrophages thereby promoting fibroblast activation via the IL6-STAT3 axis. a Gene ontology (GO) functional enrichment analysis showed that the enriched DNA damage and repair genes in the BAS group at 24 h after tracheal injury compare to control group ( mice per group). b Representative images of H&E staining and immunofluorescence of (green) in mouse trachea( mice per group). Scale bars indicate in H&E staining images, and in immunofluorescence images. c Representative tracheal immunofluorescence images of dsDNA(pink), F4/80(red), P-STING (green), cGAS(yellow) in mouse trachea ( mice per group). Scale bars indicate and . d Schematic of use DECS to stimulate BMDMs. e Quantification analysis of dsDNA in cell culture supernatant in control group and DECS group ( independent experiments). Representative images of AGAR gel electrophoresis of cell supernatants from control and DECS groups ( independent experiments). Protein levels of phosphorylated STING in BMDM group stimulated with or without DECS, independent experiments. i Schematic of BMDMs from WT mice stimulated by transfection of mouse tracheal DNA by lipo3000. j, k Protein levels of phosphorylated STING in the BMDM group
stimulated with or without DNA ( independent experiments). I Representative immunofluorescence images of P-STING(green) in BMDM, Scale bars indicate Quantitative analysis of relative Mean fluorescence intensity of P-STING ( independent experiments). o Protein levels of IL6 in the supernatant of BMDM group stimulated with or without DNA ( independent experiments). p mRNA levels of in control group, DNA stimulated group and DNA stimulated group treated with C176 ( independent experiments). Representative tracheal immunofluorescence images of and quantitative analysis of mean fluorescence intensity of P-STAT3(green) and IL6(red) in the different groups ( mice per group). Scale bars indicate and . s Schematic diagram depicting invitro co-culture model. t, u Representative immunofluorescence images of and quantitative analysis of mean fluorescence intensity of P-STAT3(red) and αSMA(green) in fibroblasts ( independent experiments). Scale bars indicate . Data are presented as the mean ± SEM. A two-sided student’s T-test was used in (e, h, k, o). One-way ANOVA analysis followed by Tukey post hoc multi-comparison test was used in (m, p, r, u). Source data are provided as a Source Data file.
Fig. 8 | Schematic diagram of tracheal dsDNA activating cGAS-STING pathway of macrophages to promote fibrosis in BAS. Upon injury, dsDNA released from the tracheal epithelium activates the STING pathway in macrophages, leading to the release of the inflammatory cytokine IL-6. IL-6 then activates STAT3 signaling in
fibroblasts, contributing to the fibrosis of granulation tissue. Treatment with the cGAS inhibitor RU.521, the STING inhibitor C176, or IL-6 neutralizing antibody alleviates granulation tissue fibrosis. Additionally, depletion of macrophages using bisphosphonate liposomes reduces the extent of fibrosis in the granulation tissue.
by transfection of mouse tracheal DNA by Lipofectaminee3000(#L3000015, Thermo Fisher Scientific, USA). For DNase I Treatment, BMDMs culture medium were treated with DNase I 3 h prior, and DNase I after transfection reagents added .
Mouse lung epithelial cells MLE12 were purchased from ShangHai KuiSai BioTechnology Co Ltd (#QuiCell-M212). Epithelial cell death was induced by using UV light irradiation, and dead epithelial cells supernatants (DECS) were collected to culture BMDM for 24 h .
Mouse tracheal fibroblasts were purchased from Procell (#CPM008). Fibroblasts were stimulated by transfection of tracheal DNA for active STING, and STING was knocked down in fibroblasts by transfection of siRNA. To explore the effect of inflammatory factors secreted by macrophages on fibroblasts, fibroblasts and BMDMs were
cocultured in a Transwell culture system, the fibroblasts were seeded into the bottom of a 6-well plate while the BMDMs were seeded into the 6-well culture inserts. Prior to coculture, the BMDMs were treated with transfection mouse tracheal DNA. The pretreated BMDMs were then cocultured with fibroblasts.
All Cell lines were cultured in RPMI-1640 medium (Hyclone, USA) with fetal bovine serum (#SH30406.05, Hyclone, USA), 1% penicillin and streptomycin(#SV30010,, Hyclone, USA) at in a atmosphere.
Surgical procedure
Constructing a mouse model of benign airway stenosis by causing damage to the mouse trachea with a small brush (Supplementary
Fig. 11). For the procedure, the mouse was anesthetized by IP injection of a mixture of ketamin ( ) and xylazine ( ). Firstly, after sterilisation of the skin with alcohol, a 1.5 cm incision was made in the anterior cervical skin of the mouse, and the trachea was fully exposed after bluntly separating the glands and the pre-tracheal muscles. Then, the trachea was incised transversely along the two tracheal cartilages below the cricoid cartilage, and with an incised length of two thirds of the circumference. Next a diameter of 1 mm small brush was inserted through cannula of safety IV catheter 20 G (B | BRAUN Medical) into the trachea 6 mm deep, then pull the cannula out of the trachea by pulling the line tied to cannula, leaving the brush in the trachea and scraping for three times to cause damage to the tracheal wall. Finally, the incised trachea was closed with 6-0 sutures and the subcutaneous tissue and skin were closed with 3-0 sutures. The mice were euthanized by cervical dislocation under 3% isoflurane anesthesia.
The control mice underwent sham surgery, in which the mice’s trachea was cut, but the trachea was not injured with a small brush.
Measurement of dsDNA
Benign airway stenosis mice were collected for tracheal tissue 24 h after modelling. The interior of the trachea was then irrigated three times with of TE buffer and the trachea lavage fluid was collected. Tracheal lavage fluid was collected in patients with BAS as well as in controls as described in Patiens and Samples. dsDNA was measured in the mouse trachea lavage fluid, human trachea lavage fluid and DECS using Picogreen dsDNA Quantitation Reagent (#12640ES60, YEASEN, Shanghai, China), according to the manufacturer’s protocol.
Histology
The tracheas were fixed in buffered formaldehyde for 24 h , paraffinembedded, Slides were made from 3 – m-thick sections cut through in an axial plane, which were then stained with hematoxylin-eosin, Masson trichrome reagents. Masson-stained collagen area was measured by Image J software.
Tracheal Lamina Propria measurements
Measurements of the LP layer was performed as described in the literature . To measure the thickness of the LP layer, the tracheal cartilage ring was divided into five segments, and the thickness of LP layer was measured from the medial side of the cartilage to the epithelial basement membrane. The thickest part of each segment was measured and recorded, and the mean LP layer thickness was calculated for each sample. A schematic of the measurement is shown in Supplementary Fig. 12.
Immunohistochemistry
For immunohistochemistry (IHC), the antigen was retrieved by incubation at in citric acid antigen repair solution for 30 min , the slides were immunestained with anti-STING (D2P2F) from Rabbit (1:100, #13647, Cell Signaling Technology), anti-Phospho-Stat3 (Tyr705) (D3A7) from Rabbit (1:100, #9145, Cell Signaling Technology) and anti-Phospho-STING (Ser366) (E9A9K) from Rabbit (1:1600, #50907, Cell Signaling Technology) at overnight. Binding antibodies were detected using biotinylated goat anti-rabbit secondary antibodies and incubated for 1 h at room temperature. The sections were then developed with DAB solution, and counterstained with hematoxylin.
Immunofluorescence staining of tracheal and cells
Tracheal tissues were fixed in buffered formaldehyde for 24 h , embedded in paraffin, and sectioned at . The tracheal tissues were incubated with primary antibodies overnight at , followed by a 2 h incubation with the secondary antibody. Antibodies were used for immunofluorescence staining in the study: anti-STING (E9X7F) from
Rabbit (1:400, #78827, Cell Signaling Technology), anti-PhosphoSTING (Ser365) (D1C4T) from Rabbit (1:50, #62912, Cell Signaling Technology), anti-F4/80 (D4C8V) from Rabbit (1:400,#30325, Cell Signaling Technology), anti-Phospho-Stat3 (Tyr705) (D3A7) from Rabbit (1:200, #9145,Cell Signalling Technology), anti-cGAS from Rabbit (1:200, #29958-1-AP, Proteintech), anti-Collagen I(RM11310) from Rabbit (1:100,#ab316222,Abcam), anti-αSMA(D4K9N) from Rabbit(1:200,#19245,Cell Signaling Technology), anti-Phospho-Histone H2A.X (Ser139) (20E3) from Rabbit (1:200,#9718,Cell Signaling Technology), anti-IL-6 (D5W4V) from Rabbit (1:200,#12912, Cell Signaling Technology),dsDNA Marker from mice (1:100, #sc-58749, Santa Cruz Biotechnology).
Cells were fixed in 1% paraformaldehyde for 15 min , permeabilized with Triton-X100/PBS, and blocked with BSA. Cells were then incubated with in blocking buffer. Subsequently, the coverslips were incubated with secondary antibodies for 1 h at room temperature and finally stained with DAPI for 5 min at room temperature. Antibodies were used for immunofluorescence staining in the study: anti-Phospho-STING (Ser365) (D1C4T) from Rabbit (1:400, #62912, Cell Signaling Technology), anti-Phospho-Stat3 (Tyr705) (D3A7) from Rabbit (1:100, #9145, Cell Signaling Technology), anti-αSMA(D4K9N) from Rabbit (1:200, #19245, Cell Signaling Technology)
qRT-PCR
To obtain mRNA, we use a RNeasy extraction kit (#RC112, Vazyme, Nanjing, China) to extract mRNA from tracheal tissues and intracellular components. cDNA was generated with a One-step iScript cDNA Synthesis Kit (#R323, Vazyme, Nanjing, China), and qRT-PCR was performed using SYBR green Master Mix (#Q711, Vazyme, Nanjing, China) on QuantStudio 3 System (Thermo Fisher Scientific). The GAPDH gene was used as the control Data were analyzed using the comparative analysis of relative expression by methods. The primers used in this study are listed in Supplementary Table 3.
Western blotting
Mouse tracheal tissues and cellular proteins were extracted using a lysis buffer prepared by proportionally mixing RIPA buffer, protease inhibitor, and phosphatase inhibitor. Protein concentration was determined using the BCA method, and samples were mixed with loading buffer and boiled at for 10 min . A polyacrylamide gel with sodium dodecyl sulfate (SDS) was prepared. Then equal amounts of protein samples and Protein Ladder (#WJ103, Epizyme) were loaded into the wells for electrophoresis (at for 60 min ). A methanolbased transfer buffer was prepared, and proteins were transferred onto a PVDF membrane, followed by blocking in a blocking solution. The membrane was incubated overnight at with primary antibodies, including anti-STING (D2P2F) from Rabbit (1:1000, #13647, Cell Signaling Technology), anti-Phospho-STING (Ser365) (D8F4W) from Rabbit (1:1000, #72971, Cell Signaling Technology), antiTBK1(E8I3G) from Rabbit (1:1000, #38066, Cell Signaling Technology), anti-Phospho-TBK1(Ser172) (D52C2) from Rabbit (1:1000, #5483, Cell Signaling Technology), anti-NF-кB p65 (D14E12) from Rabbit (1:1000, #8242, Cell Signaling Technology), anti-Phospho-NF-kB p65 (Ser536) (93H1) from Rabbit (1:1000, #3033, Cell Signaling Technology),antiαSMA(D4K9N) from Rabbit (1:1000, #19245, Cell Signaling Technology), anti-Collagen I(RM11310) from Rabbit (1:1000, #ab316222, Abcam), anti-cGAS (D3O8O) from Rabbit (1:1000, #31659, Cell Signaling Technology),anti-AIM2 from Rabbit (1:1000, #63660S, Cell Signalling Technology) and anti-GAPDH from Rabbit (1:5000, #10494-1-AP, Proteintech).Next, the membrane was incubated with HRPconjugated Goat anti-rabbit IgG (1:8000, #SA00001-2, Proteintech). After scanning the membrane with Tanon 5200 chemiluminescent imaging system (Shang Hai), protein bands were analyzed using ImageJ software.
Micro CT and measurement method of tracheal stenosis in imaging
On the seventh day post-modeling, the mouse airways were examined by microCT ( , PINGSENG Healthcare) scanning, and the tracheal area was measured within the adipose window. The degree of narrowing at the most constricted level was measured using the following formula: , where s represents the area of the most constricted level of the trachea and S represents the average of the areas at the normal levels 3 mm above and below the most constricted level. SYNPASE 3D (SYNAPSE 3D V4.4, Fujifilm Medical, Tokyo, Japan) was utilized for measuring the mouse tracheal area and performing 3D reconstruction of the trachea.
Evaluation of lung function
The lung function data of mice was recorded by putting them into a WBP respiratory whole-body plethysmography (WBP-4MR, TOW, China). Benign airway stenosis (BAS) occurs primarily in the upper airways. Clinically, patients with upper airway narrowing often experience prolonged inspiratory time. So, inspiratory time (Ti) was chossed as the indicators adopted to assess lung function. Each mouse was tested for 30 min . The first 10 min were used to acclimate to the environment, and the average inspiratory time was calculated as the average of the inspiratory time of the last 20 min .
Flow cytometry
Mouse tracheal tissue was dissociated and cleaned with PBS, placed in dissociation enzyme solution (Liberase , Roche 5401119001, DNase I , Sigma 10104159001) in DMEM at for 45 min , Then cut the undissociated tissue and continue to bathe at 37 for 60 min , After the dissociation, wash with 10 ml pre-cooled PBS, filter with 70 um screen, centrifuge 500 g for 5 min .After centrifugation, the supernatant was poured away and cell precipitates were collected . Then, perform cell staining using LIVE/DEAD Stain (#564406, BV510, BD Biosciences) and cell surface marker antibodies. After surface staining, fix and permeabilize using the BD Fixation/Permeabilization Kit (#554714, BD Pharmingen), followed by intracellular cytokine staining. Finally, it was detected by CytoFlexS (Beckman Coulter). Cells were stained with antibody to the following markers: Anti-CD45 from Rat (1:200, #557659, APC-CY7, BD Biosciences), anti-CD11b from Rat (1:200, #552850, PE-CY7, BD Biosciences), anti-F4/80 from Rat (1:200, #565411, BV421, BD Biosciences), anti-STING (E9X7F) from Rabbit (1:1600, #78827S, AF488, Cell Signaling Technology).
Inflammatory factor analysis
After tracheal tissue isolation, Luminex multiplex cytokine assays (#12009159, BIO-RAD, Hercules, CA, USA) were used to detect inflammatory cytokines ( /control group, /BAS group) and were performed by LabEx (Shanghai, China) using the Luminex X-200, according to the manufacturer’s protocol (Luminex, Austin, TX, USA). The Luminex multiplex cytokine assays could detect following Inflammatory factors and chemokines: IL6, CCL20, IL-1beta, CXCL5, TNF-alpha, GM-CSF, CX3CL1, CCL1, CXCL13, IL-16, IFN-gamma, CXCL10, Il-2, CXCL11, IL-4, CCL7, CCL12, CCL2, CCL22, CCL5, IL-10, CXCL1, CCL27, CCL17, CCL19, CXCL16, CXCL12, CCL24, CCL11, CCL4, CCL3.
Enzyme-linked immunosorbent assay was performed for the measurement of IL6(EK206, LIANKE) in cell culture supernatant according to the manufacturer’s instructions.
AGAR gel electrophoresis
The detection samples were run in agarose gels, cast from molecular biology grade agarose (#RM02852,Abclone,WuHan,China) dissolved in TBE buffer. The cell supernatant was mixed with DNA loading buffer (#RK30151, Abclone, WuHan, China) and added to the lane for electrophoresis with DNA marker (#RK30192, Abclone,
WuHan, China), which was run at 90 V at room temperature for 25 min . Imaging was completed on Tanon 3500B (Shang Hai) automatic gel image analysis system.
Bulk RNA extraction library construction and sequencing
We performed bulk RNA sequencing twice in total. The first was to detect genetic differences in mice with BAS at different time points (Control mice, BAS-24h mice and BAS-7d mice), and the second was to investigate the effect of macrophage depletion on BAS (Control mice, BAS-7d mice and BAS-7 d with Clodronate Liposomes mice).
Mouse tracheal tissues were collected, and each trachea was an independent sample. Total RNA was extracted using Trizol reagent (thermofisher, 15596018) following the manufacturer’s procedure. The total RNA quantity and purity were analysis of Bioanalyzer 2100 and RNA 6000 Nano LabChip Kit (Agilent, CA, USA, 5067-1511), high-quality RNA samples with RIN number were used to construct sequencing library. After total RNA was extracted, mRNA was purified from total RNA (5ug) using Dynabeads Oligo (dT) (Thermo Fisher, CA, USA) with two rounds of purification. Following purification, the mRNA was fragmented into short fragments using divalent cations under elevated temperature (Magnesium RNA Fragmentation Module (NEB, cat.e6150, USA) under ). Then the cleaved RNA fragments were reverse-transcribed to create the cDNA by SuperScript II Reverse Transcriptase (Invitrogen, cat. 1896649, USA), which were next used to synthesise U-labeled second-stranded DNAs with E. coli DNA polymerase I (NEB, cat.m0209, USA), RNase H (NEB, cat.m0297, USA) and dUTP Solution (Thermo Fisher, cat.R0133, USA). An A-base was then added to the blunt ends of each strand, preparing them for ligation to the indexed adapters. Each adapter contained a T-base overhang for ligating the adapter to the A-tailed fragmented DNA. Dual-index adapters were ligated to the fragments, and size selection was performed with AMPureXP beads. After the heat-labile UDG enzyme (NEB, cat.m0280, USA) treatment of the U-labeled secondstranded DNAs, the ligated products were amplified with PCR. The average insert size for the final cDNA librarys were . At last, we performed the paired-end sequencing (PE150) on an Illumina Novaseq 6000 (LC-Bio Technology CO., Ltd., Hangzhou, China) following the vendor’s recommended protocol.
Bulk-RNA sequencing analysis
A cDNA library constructed by technology from the pooled RNA from trachea of mice was sequenced run with Illumina Novaseq 6000 sequence platform. Using the Illumina paired-end RNA-seq approach, we sequenced the transcriptome, generating a total of million bp paired-end reads. Reads obtained from the sequencing machines includes raw reads containing adapters or low-quality bases which will affect the following assembly and analysis. Thus, to get high quality clean reads, reads were further filtered by Cutadapt (https://cutadapt.readthedocs.io/en/stable/, version: cutadapt-1.9). The parameters were as follows: 1) removing reads containing adapters; 2) removing reads containing polyA and polyG;3) removing reads containing more than of unknown nucleotides (N);4) removing low quality reads containing more than of low quality (Qvalue ) bases.
Then sequence quality was verified using FastQC (http://www. bioinformatics.babraham.ac.uk/projects/fastqc/, 0.11.9). including the Q20, Q30 and GC-content of the clean data. After that, a total of G bp of cleaned, paired-end reads were produced. We aligned reads of all samples to the mice reference genome using HISAT2 (https:// daehwankimlab.github.io/hisat2/, version: hisat2-2.2.1) package, which initially remove a portion of the reads based on quality information accompanying each read and then maps the reads to the reference genome. Genes differential expression analysis was performed by DESeq2 software between two different groups (and by
edgeR between two samples). The genes with the parameter of false discovery rate (FDR) below 0.05 and absolute fold change were considered differentially expressed genes.
The GO and KEGG enrichment analysis of differential genes can explain the functional enrichment of differential genes and clarify the differences between samples at the gene function level. We use cluster Profiler (v4.1.3) R software package for GO function enrichment and KEGG pathway enrichment analysis. When , it is considered that the GO or KEGG function is significantly enriched. Gene Set Enrichment Analysis (GSEA) was using software GSEA (v4.1.0) with the MSigDB (v7.5.1). Mufzz Analysis was using Fuzzy C-means Clustering algorithm (FCM) with Mufzz package (v 2.54.0) in R (v4.1.3).
All Bulk-RNA sequencing data analysis was performed using the OmicStudio tools created by LC-BIO Co., Ltd (HangZhou, China) at https://www.omicstudio.cn/cell.
Single-cell library preparation and sequencing
Sample collection methods are described in Patients and Samples. The tissue was cut into small pieces of and then washed with 1xPBS to dissociate the tissue into individual cells in dissociation solution. Overall cell viability exceeded , as confirmed by trypan blue exclusion. Tissues were dissociated into single cells in dissociation solution ( collagenase IV papain, 120 Units/ml DNase I) in water bath with shaking for 20 min at 100 rpm . Digestion was terminated with PBS containing fetal bovine serum (FBS, V/V) then pipetting 5-10 times with a Pasteur pipette。The resulting cell suspension was filtered by passing through stacked cell strainer and centrifuged at 300 g for 5 min at . The cell pellet was resuspended in PBS ( BSA) and added with red blood cell lysis buffer (MACS 130-094-183, ) and incubated at room temperature or on ice for 2-10 min to lyse remaining red blood cells. After incubation, the suspension was centrifuged at 300 g for 5 min at room temperature. The suspension was resuspended in Dead Cell Removal MicroBeads(MACS 130-090-101) and remove dead cells using Miltenyi Dead Cell Removal Kit (MACS 130-090-101). Then the suspension was resuspended in and centrifuged at 300 g for 3 min at (repeat twice). The cell pellet was resuspended in of PBS ( BSA). The overall cell viability was confirmed by trypan blue exclusion, which needed to be above , single cell suspensions were counted using a haemocytometer/ Countess II Automated Cell Counter and concentration adjusted to 700-1200 cells/ l.
Single-cell suspensions were loaded to 10x Chromium to capture single cell according to the manufacturer’s instructions of 10 X Genomics Chromium Single-Cell 3′ kit (V3). The following cDNA amplification and library construction steps were performed according to the standard protocol. Libraries were sequenced on an Illumina NovaSeq 6000 sequencing system (paired-end multiplexing run, 150 bp) by LCBio Technology co.ltd., (HangZhou, China) at a minimum depth of 20,000 reads per cell.
Single-cell data analysis
Sequencing results were demultiplexed and converted to FASTQ format using Illumina bcl2fastq software(version2.20). Sample demultiplexing, barcode processing and single-cell 3’gene counting by using the Cell Ranger pipeline(https://support.10xgenomics.com/single-cellgeneexpression/ software/pipelines/latest/what-is-cell-ranger,version 3.1.0) and scRNA-seq data were aligned to Ensembl v110 homo_sapiens reference genome, a total of 67,390 single cell captured from 3 Normal group and 4 Granulation group were processed using 10X Genomics Chromium Single Cell 3’Solution.
The Cell Ranger output was loaded into Seurat (version 3.1.1) be used to Dimensional reduction, clustering, and analysis of scRNA-seq data. Overall 58,586 cells passed the quality control threshold: all
genes expressed in less than three cells(default parameters:1 cell)were removed, number of genes expressed per cell å 100 as low and inf as high cut-off, NUMI had no limits, the percent of mitochondrial-DNA derived gene-expression < 25%.
To visualize the data, we further reduced the dimensionality of all 18,339 cells using Seurat and used UMAP to project the cells into 2D space. The steps include:1 Using the LogNormalize method of the “Normalization” function of the Seurat software to calculated the expression value of genes; 2 PCA (Principal component analysis) analysis was performed using the normalized expression value, within all the PCs, the top 10 PCs were used to do clustering and UMAP analysis;3 To find clusters, selecting weighted Shared Nearest Neighbor (SNN) graph-based clustering method. Marker genes for each cluster were identified with the Wilcoxon rank-sum test with default parameters via the FindAllMarkers function in Seurat. This selects markers genes which are expressed in more than 10% of the cells in a cluster and average log (Fold Change) of greater than 0.25.
For macrophage reclustering, macrophage clusters were subset and unsupervised clustering was used to identify macrophage subpopulations. Macrophage subsets were analyzed with FindMarkers, to characterize cluster identities and DGE between treatment conditions.
To investigate the potential functions, cluster Profiler (v4.1.32) R software package was used for Gene Ontology (GO) analysis, and software GSEA (v4.1.0) with the MSigDB (v7.5.1) were used for Gene Set Enrichment analysis (GSEA). Pathways with value less than 0.05 were considered as significantly enriched. The cGAS-STING pathway scoring was based on the Addmodulescore function in Seurat (v 4.1.0). CellChat cell-cell interaction network analysis was used to characterize Immune cell-fibroblast interactions by Cellphonedb (v5.0.0).
All SingleCell Data Analysis was performed using the OmicStudio tools created by LC-BIO Co., Ltd (HangZhou, China) at https://www. omicstudio.cn/cell.
Statistical analysis
All dates are presented as mean ± SEM. GraphPad Prism 9 was used for statistical analysis (GraphPad software, San Diego, California, USA). Differences between two groups were identified using the two-sided Student’s test and two-sided Mann Whitney test. Multiple groups using One-or two- way ANOVA analysis followed by Kruskal-Wallis’s test and Duncan multiple- range test. Spearman correlation analysis was used to analyze the correlation between the two groups. values of less than 0.05 were considered statistically significant.
Reporting summary
Further information on research design is available in the Nature Portfolio Reporting Summary linked to this article.
Data availability
All data supporting the findings of this study are available within the article and its supplementary files. Any additional requests for information can be directed to, and will be fulfilled by, the corresponding authors. Sequence raw data are available in the NCBI-SRA (Sequence Read Archive): Single Cell Sequencing (SRR31229501, SRR31229502, SRR31229503, SRR31229504, SRR31229505, SRR31229506, SRR31229507), Bulk RNA sequencing of benign airway stenosis mice (SRR30898181, SRR30898182, SRR30898183, SRR30898184, SRR30898185, SRR30898186, SRR30898187, SRR30898188, SRR30898189), Bulk RNA sequencing used to analyze the effect of macrophage depletion on BAS (SRR30831591, SRR30831592, SRR30831593, SRR30831594, SRR30831595, SRR30831596, SRR30831597, SRR30831598, SRR30831599). All other data are available in the article and its Supplementary files or from the corresponding author upon request. Source data are provided with this paper.
References
Oberg, C. L., Holden, V. K. & Channick, C. L. Benign Central Airway Obstruction. Semin Respir. Crit. Care Med. 39, 731-746 (2018).
Piazza, C. et al. Long-term intubation and high rate of tracheostomy in COVID-19 patients might determine an unprecedented increase of airway stenoses: a call to action from the European Laryngological Society. Eur. Arch. Otorhinolaryngol. 278, 1-7 (2021).
Guibert, N., Saka, H. & Dutau, H. Airway stenting: Technological advancements and its role in interventional pulmonology. Respirology 25, 953-962 (2020).
Sun, K. et al. Long-term prognostic factors of clinical success after interventional bronchoscopy in patients with scarring central airway stenosis. BMC Pulm. Med. 21, 73 (2021).
Chen, N. et al. Inhibitory effect of mitomycin C on proliferation of primary cultured fibroblasts from human airway granulation tissues. Respiration 85, 500-504 (2013).
Li, X. et al. Treatment of scarring central airway stenosis with pirfenidone: Case report. Med. (Baltim.) 101, e31354 (2022).
Qiu, X. et al. Paclitaxel-Loaded PLGA Coating Stents in the Treatment of Benign Cicatrical Airway Stenosis. J. Clin. Med 11, 517 (2022).
Enyuan, Q. et al. Erythromycin combined with corticosteroid reduced inflammation and modified trauma-induced tracheal stenosis in a rabbit model. Ther. Adv. Respir. Dis. 12, 1753466618773707 (2018).
Huang, Z. et al. Protective effects of different anti-inflammatory drugs on tracheal stenosis following injury and potential mechanisms. Mol. Med Rep. 23, 314 (2021).
Konno, H. & Barber, G. N. The STING controlled cytosolic-DNA activated innate immune pathway and microbial disease. Microbes Infect. 16, 998-1001 (2014).
Chen, Q., Sun, L. & Chen, Z. J. Regulation and function of the cGASSTING pathway of cytosolic DNA sensing. Nat. Immunol. 17, 1142-1149 (2016).
Barber, G. N. STING: infection, inflammation and cancer. Nat. Rev. Immunol. 15, 760-770 (2015).
Benmerzoug, S. et al. STING-dependent sensing of self-DNA drives silica-induced lung inflammation. Nat. Commun. 9, 5226 (2018).
Wang, X. et al. STING expression in monocyte-derived macrophages is associated with the progression of liver inflammation and fibrosis in patients with nonalcoholic fatty liver disease. Lab Invest 100, 542-552 (2020).
Zeng, H. M. et al. Pharmacological Inhibition of STING/TBK1 Signaling Attenuates Myeloid Fibroblast Activation and Macrophage to Myofibroblast Transition in Renal Fibrosis. Front. Pharmacol. 13, https://doi.org/10.3389/fphar.2022.940716 (2022).
Kessler, N. et al. Monocyte-derived macrophages aggravate pulmonary vasculitis via cGAS/STING/IFN-mediated nucleic acid sensing. J. Exp. Med. 219. e20220759 (2022).
Minutti, C. M. et al. Tissue-specific contribution of macrophages to wound healing. Semin Cell Dev. Biol. 61, 3-11 (2017).
Hu, S. et al. The selective STING inhibitor H-151 preserves myocardial function and ameliorates cardiac fibrosis in murine myocardial infarction. Int Immunopharmacol. 107, 108658 (2022).
Dvorkin, S. et al. New frontiers in the cGAS-STING intracellular DNAsensing pathway. Immunity 57, 718-730 (2024).
Zhang, Z. et al. Multifaceted functions of STING in human health and disease: from molecular mechanism to targeted strategy. Signal Transduct. Target Ther. 7, 394 (2022).
Zou, M. et al. Inhibition of cGAS-STING by JQ1 alleviates oxidative stress-induced retina inflammation and degeneration. Cell Death Differ. 29, 1816-1833 (2022).
Hu, B. et al. The DNA-sensing AIM2 inflammasome controls radiation-induced cell death and tissue injury. Science 354, 765-768 (2016).
Wan, D., Jiang, W. & Hao, J. Research Advances in How the cGASSTING Pathway Controls the Cellular Inflammatory Response. Front Immunol. 11, 615 (2020).
Zhang, C. et al. Intercellular mitochondrial component transfer triggers ischemic cardiac fibrosis. Sci. Bull. (Beijing) 68, 1784-1799 (2023).
Liu, C. et al. DNA from macrophages induces fibrosis and vasculopathy through POLR3A/STING/type I interferon axis in systemic sclerosis. Rheumatol. (Oxf.) 62, 934-945 (2023).
Decout, A. et al. The cGAS-STING pathway as a therapeutic target in inflammatory diseases. Nat. Rev. Immunol. 21, 548-569 (2021).
Hesketh, M. et al. Macrophage Phenotypes Regulate Scar Formation and Chronic Wound Healing. Int J. Mol. Sci. 18, 1545 (2017).
Nam, S. & Lim, J. S. Essential role of interferon regulatory factor 4 (IRF4) in immune cell development. Arch. Pharm. Res 39, 1548-1555 (2016).
Bharadwaj, U. et al. Targeting Janus Kinases and Signal Transducer and Activator of Transcription 3 to Treat Inflammation, Fibrosis, and Cancer: Rationale, Progress, and Caution. Pharm. Rev. 72, 486-526 (2020).
Montero, P. et al. Role of JAK/STAT in Interstitial Lung Diseases; Molecular and Cellular Mechanisms. Int. J. Mol. Sci. 22, https://doi. org/10.3390/ijms22126211 (2021).
Feng, T. M. et al. Involvement of PD-1(+)CD4(+) T cells in the development of traumatic tracheal stenosis by regulating the IL-17/STAT3 pathway. Biochim Biophys. Acta Mol. Basis Dis. 1870, 167216 (2024).
Yu, Y. et al. Cytosolic DNA-Mediated STING-Dependent Inflammation Contributes to the Progression of Psoriasis. J. Invest. Dermatol. 142, 898-906.e4 (2022).
Marchioni, A. et al. Molecular Mechanisms and Physiological Changes behind Benign Tracheal and Subglottic Stenosis in Adults. Int J. Mol. Sci. 23, 2421 (2022).
Motz, K. M. et al. Sirolimus-eluting airway stent reduces profibrotic Th17 cells and inhibits laryngotracheal stenosis. JCI Insight. 8. https://doi.org/10.1172/jci.insight. 158456 (2023).
Gao, L. et al. STING/ACSL4 axis-dependent ferroptosis and inflammation promote hypertension-associated chronic kidney disease. Mol. Ther. 31, 3084-3103 (2023).
Zhang, Y. et al. STING-Dependent Sensing of Self-DNA Driving Pyroptosis Contributes to Radiation-Induced Lung Injury. Int J. Radiat. Oncol. Biol. Phys. 117, 928-941 (2023).
Li, M. et al. Macrophage Related Chronic Inflammation in NonHealing Wounds. Front Immunol. 12, 6817 (2021).
Ou, L. et al. Targeting STING-mediated pro-inflammatory and profibrotic effects of alveolar macrophages and fibroblasts blunts silicosis caused by silica particles. J. Hazard Mater. 458, 131907 (2023).
Plikus, M. V. et al. Fibroblasts: Origins, definitions, and functions in health and disease. Cell 184, 3852-3872 (2021).
Lee, C. C. et al. An updated review of the immunological mechanisms of keloid scars. Front. Immunol. 14, 1117630 (2023).
Borthwick, L. A. The IL-1 cytokine family and its role in inflammation and fibrosis in the lung. Semin Immunopathol. 38, 517-534 (2016).
Ning, L. et al. Cytosolic DNA-STING-NLRP3 axis is involved in murine acute lung injury induced by lipopolysaccharide. Clin. Transl. Med. 10, e228 (2020).
Zhao, Q. et al. STING signalling protects against chronic pancreatitis by modulating Th17 response. Gut 68, 1827-1837 (2019).
Savigny, F. et al. Protective Role of the Nucleic Acid Sensor STING in Pulmonary Fibrosis. Front Immunol. 11, 588799 (2020).
Li, M. et al. Risk Factors for Posttracheostomy Tracheal Stenosis. Otolaryngol. Head. Neck Surg. 159, 698-704 (2018).
Wang, X. et al. DNA sensing via the cGAS/STING pathway activates the immunoproteasome and adaptive T-cell immunity. Embo J. 42, e110597 (2023).
Hillel, A. T. et al. An in situ, in vivo murine model for the study of laryngotracheal stenosis. JAMA Otolaryngol. Head. Neck Surg. 140, 961-966 (2014).
Hillel, A. T. et al. Dysregulated Macrophages Are Present in Bleomycin-Induced Murine Laryngotracheal Stenosis. Otolaryngol. Head. Neck Surg. 153, 244-250 (2015).
Acknowledgements
We are grateful for bioinformatics support from Qin Xie and XiaoLi Meng (LC-Bio Technology co.,ltd.).This work was supported by the National Natural Science Foundation of China with Grants number 82270112(C.B.) and 82000102(H.S.). The Fig. 2c, k, Fig.4a, Fig.5b, Fig.6f, Fig. 7i, s, Supplementary Fig. 5a, Supplementary Fig. 9b, e and Supplementary Fig. 10a partly Created by MedPeer (medpeer.cn), and has been confirmed by publication and licensing rights.
Author contributions
Y.C., H.S., and C.B. designed the study. Y.C., C.Y., and Y.M. conducted experiments and analyzed data. D.S., X.L., S.T., Y.Z., C.X., and Y.D. collected human specimens and three-dimensional reconstructions of microCT images from mice. Y.C. wrote the manuscript. C.H., H.S. and C.B. organized and supervised the study.
Correspondence and requests for materials should be addressed to ChaoFeng Han, Hui Shi or Chong Bai.
Peer review information Nature Communications thanks Lars Lunding, Silke Meiners, Nicolas Riteau and the other, anonymous, reviewer(s) for their contribution to the peer review of this work. A peer review file is available.
Reprints and permissions information is available at
Publisher’s note Springer Nature remains neutral with regard to jurisdictional claims in published maps and institutional affiliations.
Open Access This article is licensed under a Creative Commons Attribution-NonCommercial-NoDerivatives 4.0 International License, which permits any non-commercial use, sharing, distribution and reproduction in any medium or format, as long as you give appropriate credit to the original author(s) and the source, provide a link to the Creative Commons licence, and indicate if you modified the licensed material. You do not have permission under this licence to share adapted material derived from this article or parts of it. The images or other third party material in this article are included in the article’s Creative Commons licence, unless indicated otherwise in a credit line to the material. If material is not included in the article’s Creative Commons licence and your intended use is not permitted by statutory regulation or exceeds the permitted use, you will need to obtain permission directly from the copyright holder. To view a copy of this licence, visit http:// creativecommons.org/licenses/by-nc-nd/4.0/.
(c) The Author(s) 2025
¹Department of Respiratory and Critical Care Medicine, The First Affiliated Hospital of Naval Medical University, Shanghai, China. Department of Respiratory and Critical Care Medicine, General Hospital of Central Theater Command of Chinese People’s Liberation Army, Wuhan, China. Department of Respiratory and Critical Care Medicine, No. 906 Hospital of the Chinese People’s Liberation Army Joint Logistic Support Force, Ningbo, China. Department of Histology and Embryology, Naval Medical University, Shanghai, China. These authors contributed equally: YiLin Chen, ChengCheng Yang, YuShan Miao.
ஒe-mail: hcf@immunol.org; Shihui@smmu.edu.cn; Chongbai@smmu.edu.cn