إعادة برمجة البيئة الدقيقة للورم بواسطة الإيفيروسيتوز لتعزيز انتشار سرطان البنكرياس إلى الكبد Efferocytosis reprograms the tumor microenvironment to promote pancreatic cancer liver metastasis
سرطان القناة البنكرياسية الغدي هو مرض عالي الانتشار، وتدعم البلعميات النقائل الكبدية. الإيفيروسيتوز، أو ابتلاع الخلايا الميتة بواسطة البلعميات، هو عملية أساسية في توازن الأنسجة وشفاء الجروح، لكن دورها في النقائل أقل فهمًا. هنا، وجدنا أن استعمار موقع النقائل الكبدية مصحوب بإصابة نسيجية منخفضة الدرجة وأن إزالة الخلايا الميتة بواسطة الإيفيروسيتوز تعزز إعادة برمجة البلعميات والنقائل الكبدية. من الناحية الآلية، فإن تعبير بروجرانولين في البلعميات ضروري لفعالية الإيفيروسيتوز من خلال التحكم في حموضة الليزوزومات عبر منظم التوصيل عبر الغشاء للالتهاب الكيسي وتفكيك الحمولة الليزوزومية، مما يؤدي إلى LXR.-تحويل البلعميات بواسطة الوسائط وزيادة مستوى الأرجيناز 1. إن حجب الأدوية لعملية الإيفرُوسيتوز أو النقص الجيني المحدد للبلعميات في البروجرانولين يعيق تحويل البلعميات، ويحسنوظائف الخلايا، وتقلل من انتشار السرطان في الكبد. تكشف نتائجنا كيف تساهم الوظائف المدمجة للمكروفاجات في إصلاح الأنسجة في انتشار السرطان في الكبد وتحدد الأهداف المحتملة للوقاية من انتشار سرطان القناة البنكرياسية الغدي في الكبد.
سرطان الغدة البنكرياسية القنوي (PDAC) هو مرض عالي الانتشار مع معدل بقاء لمدة 5 سنوات أقل من 7%. الانتشار النقيلي يحدث عادة إلى الكبد وهو السبب الرئيسي للوفاة للمرضى الذين يعانون من PDAC.بحلول الوقت الذي يتم فيه تشخيص مرض PDAC، فإن الغالبية العظمى من المرضى (لديهم سرطان نقيل غير قابل للاستئصالحواليمن المرضى الذين تمت إزالة ورمهم الأساسي، يعودون للانتكاس مع نقائل كبدية خلال عامين من الجراحةفهم الآليات الكامنة وراء انتشار السرطان في البنكرياس أمر حاسم لتحسين النتائج لهؤلاء المرضى.
إزالة الخلايا الميتة أساسية للتوازن الداخلي، وإصلاح الأنسجة، والأمراض.الابتلاع الخلوي، وهو عملية ابتلاع الخلايا الميتة بواسطة البلعميات، يتم بشكل أساسي بواسطة البلعميات الكبيرة.البلاعم هي خلايا مناعية حيوية ومرنة للغاية، حيث تكتسب وظائف مثبطة أو داعمة للورم اعتمادًا على السياق.ترافق انتشار سرطان البنكرياس في الكبد تراكم البلعمياتغالبًا ما تظهر البلعميات (المكروفاجات) نمطًا مناعيًّا مثبطًا، مما يعزز نمو الورم ويحد من تأثير العلاج المناعي..
تشير الدراسات الناشئة إلى أن البلعميات المرتبطة بالأورام يمكن أن تتواجد داخل نفس الورم كأنماط فرعية منشطة للمناعة ومثبطة للمناعة.استهداف البلعميات المثبطة للمناعة علاجياً يحمل وعداً كبيراً لتحسين خيارات العلاج الحالية للمرضى المصابين بالسرطان. في هذه الدراسة، باستخدام تحليل الخلايا المفردة، حددنا مجموعة من البلعميات البلعومية في المرحلة المبكرة من انتشار سرطان البنكرياس إلى الكبد، والتي تظهر نشاطاً مثبطاً للمناعة قوياً. وجدنا أن البلعمة الذاتية تعيد برمجة البلعميات نحو نمط مثبط للمناعة وأن تثبيط البلعميات البلعومية جينياً أو دوائياً أعاد المناعة ضد الورم في انتشار سرطان البنكرياس إلى الكبد وأضعف نمو النقائل.
النتائج
تجمعات البلعميات في الكبد النقيلي متنوعة
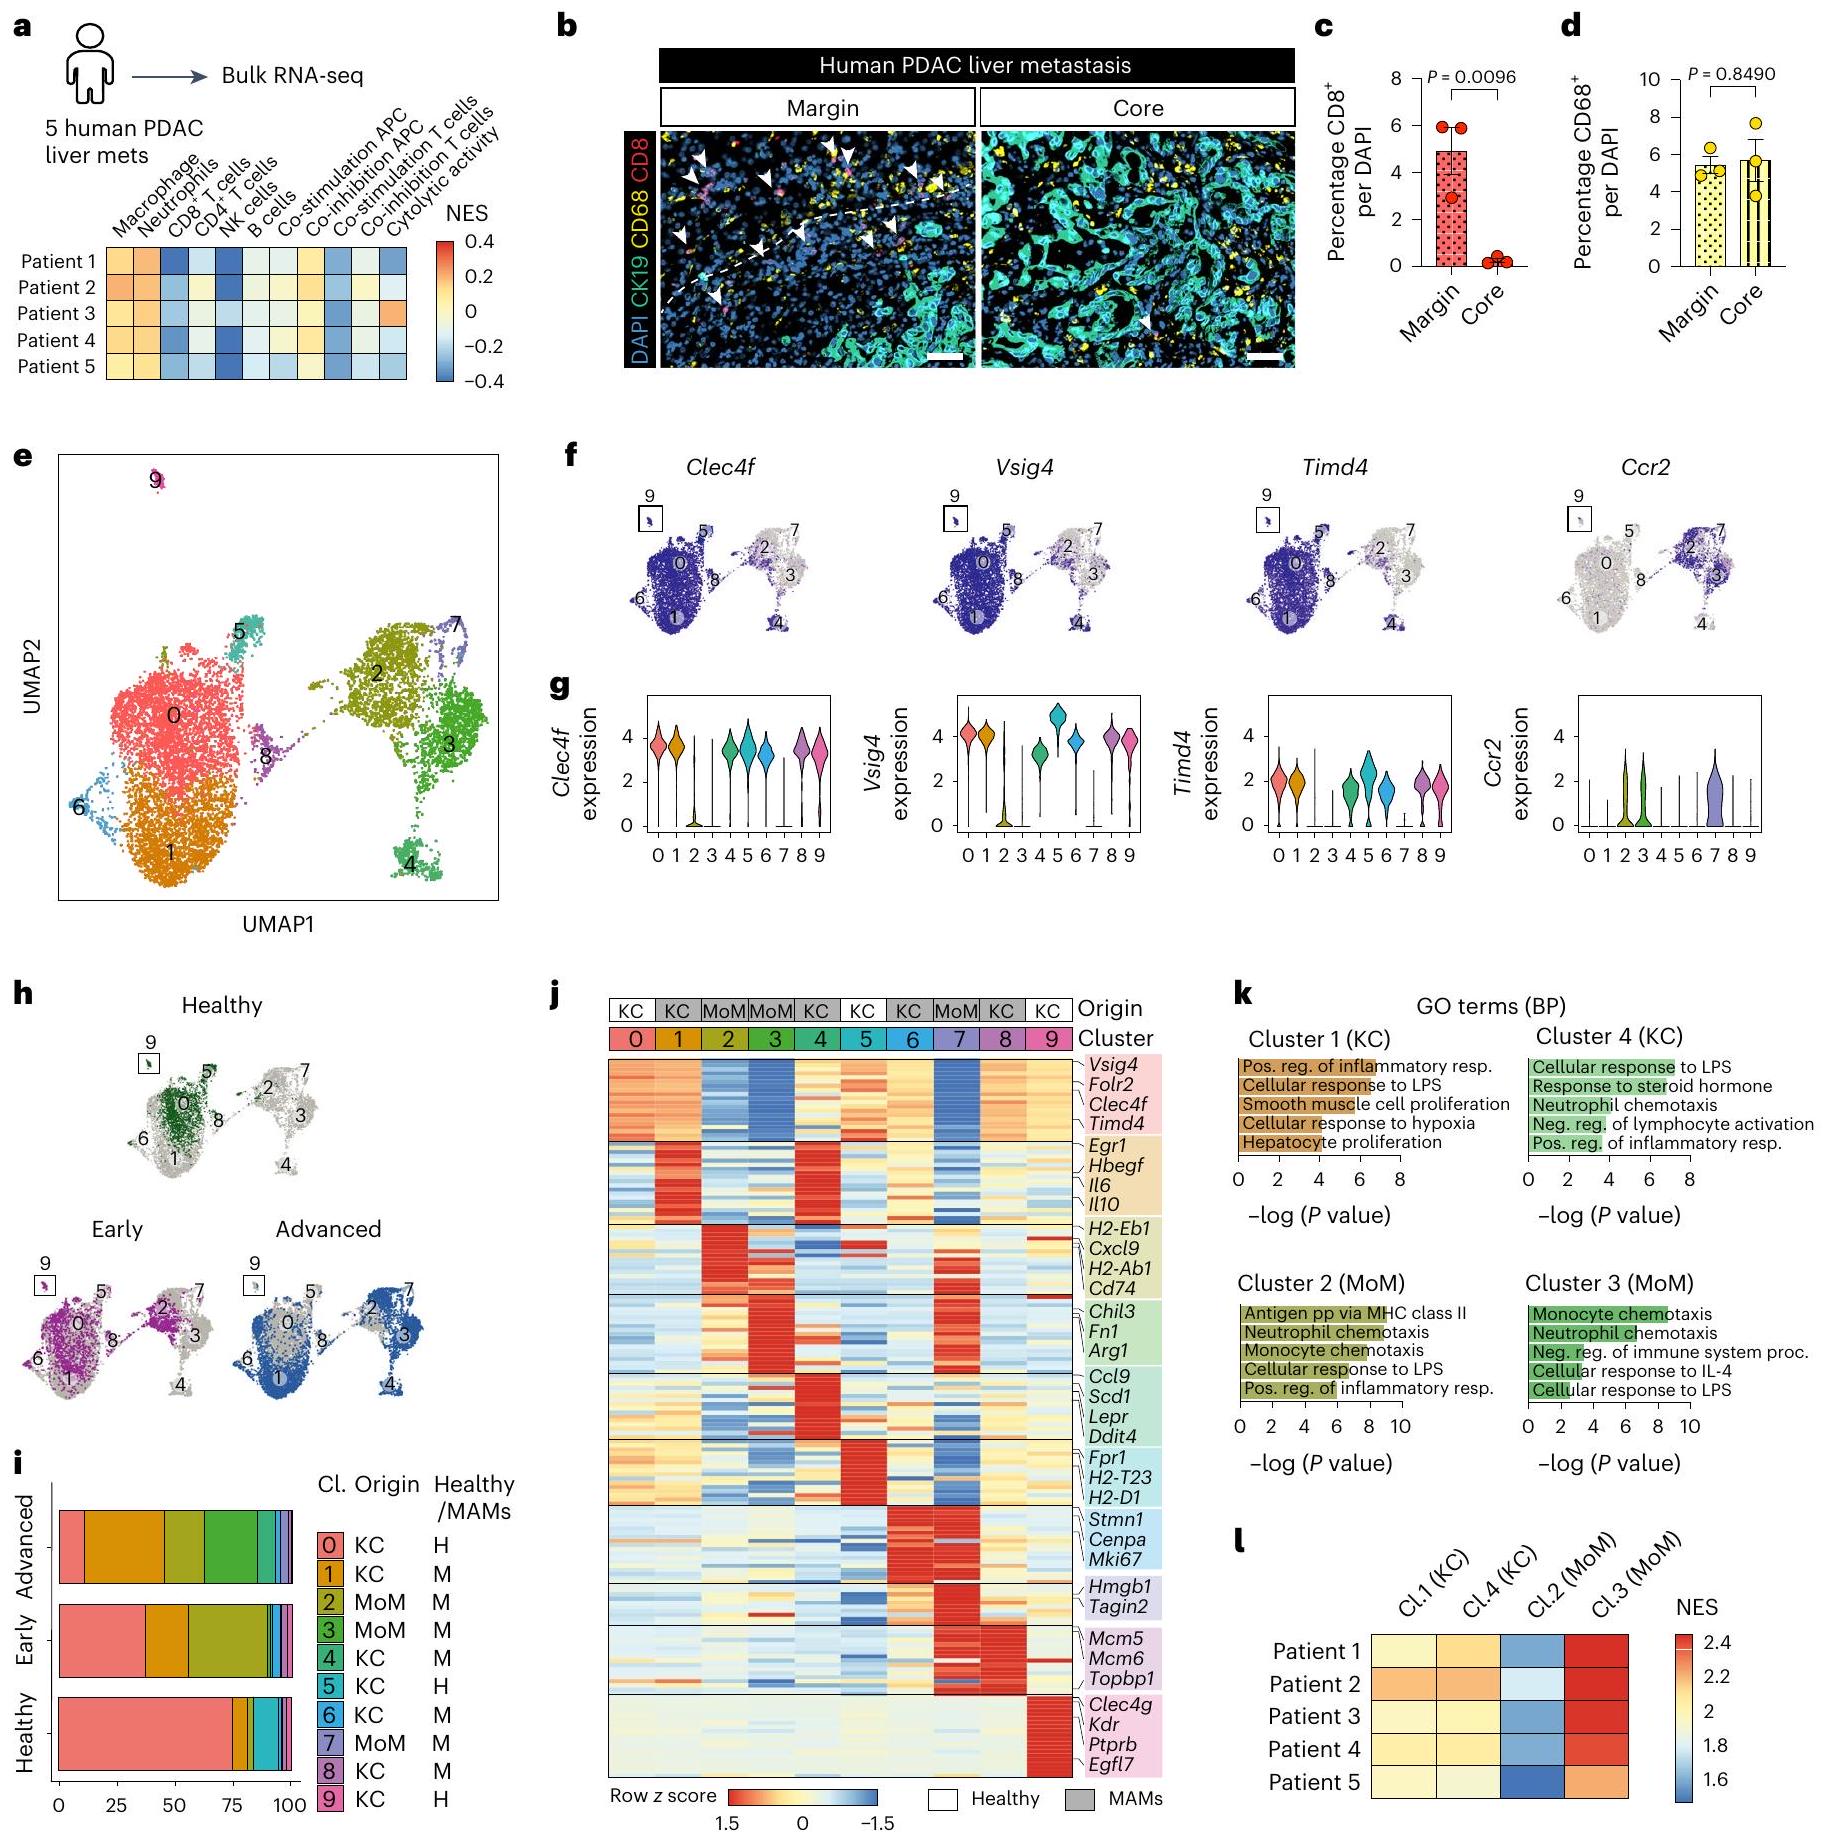
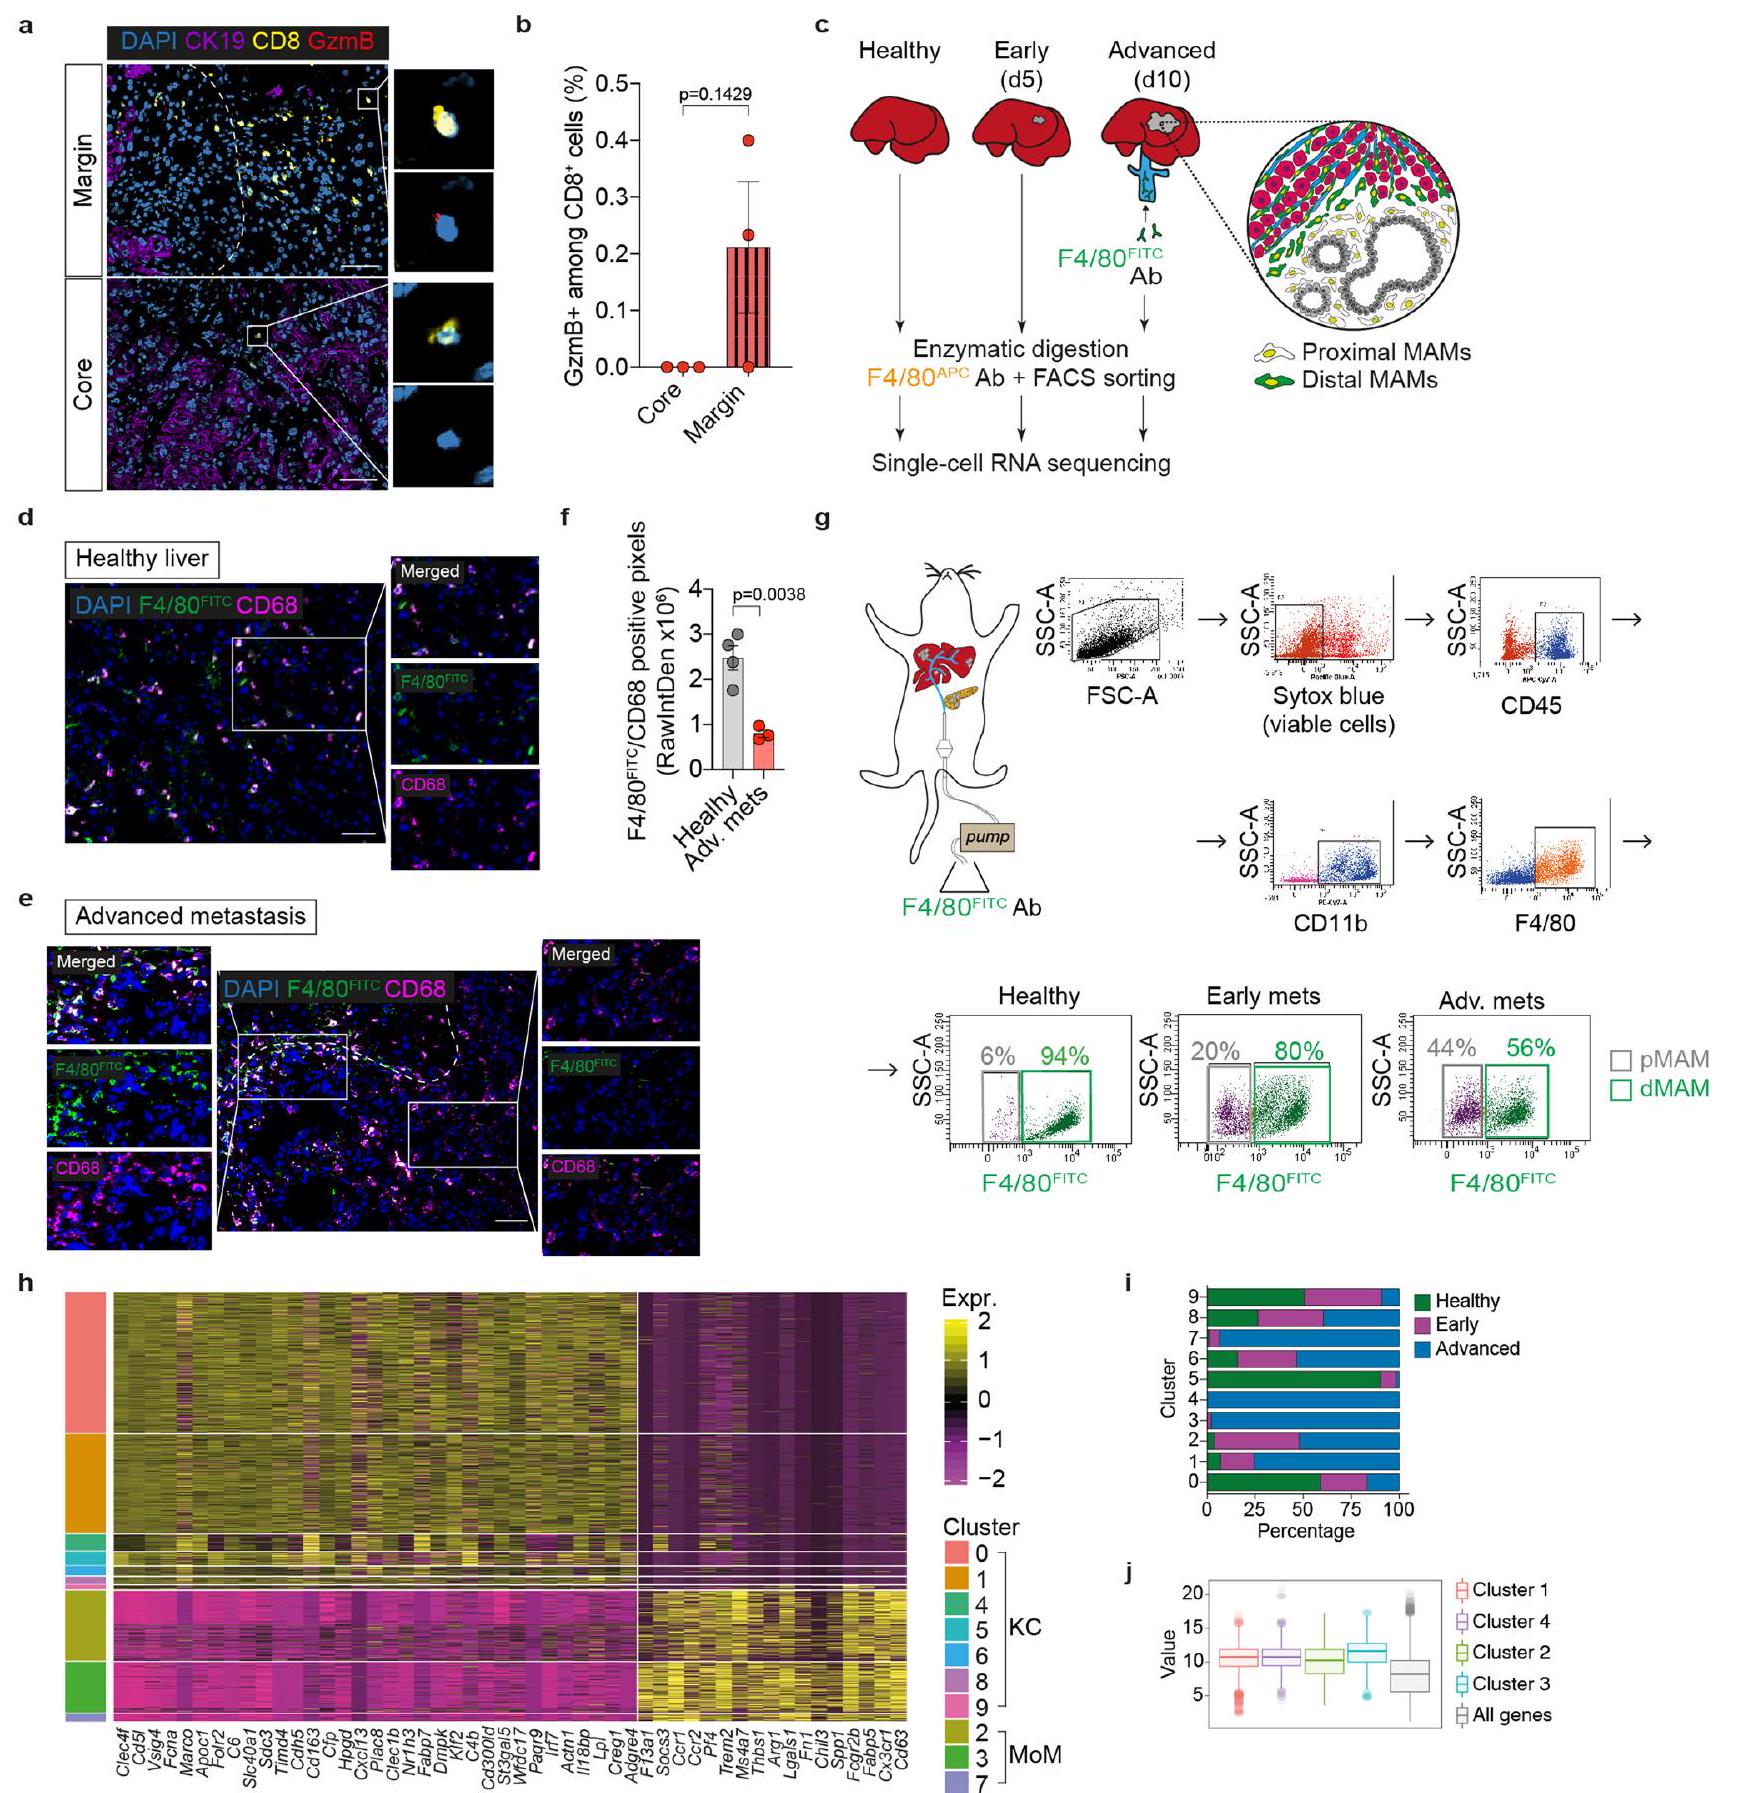
للتحقيق في الحالة المناعية للآفات النقيليّة المتقدمة في سرطان البنكرياس، جمعنا خزعات كبدية طازجة من مرضى نقيليين لم يتلقوا العلاج بعد، وأجرينا تسلسل RNA الشامل. وجدنا أن الآفات النقيليّة تعاني من صمت مناعي، وغنية بالبلاعم والعدلات، مع درجات توقيع منخفضة للخلايا التائية، والخلايا البائية، وخلايا القاتل الطبيعي (الشكل 1أ). أظهر صبغ الأنسجة المناعي الفلوري لآفات سرطان البنكرياس النقيلي المتقدم أن محيط الآفة غني بالبلاعم (CD68) وخلايا T السلبية بشكل رئيسي للجرانزيم B (CD8 ) (الشكل 1ب-د والشكل البياني الموسع 1أ،ب). كانت البلعميات أيضًا وفيرة في النواة النقيليّة؛ ومع ذلك، كانت الخلايا غائبة تقريبًا (الشكل 1ب-د). وبالتالي، فإن بيئة الورم النقيلي في سرطان البنكرياس القنوي (PDAC) مثبطة للمناعة، مع أعداد كبيرة من البلعميات المرتبطة بالنقائل (MAMs) وضعف تسلل الخلايا.
لتوصيف تباين MAM في نقائل سرطان البنكرياس في الكبد في الجسم الحي، قمنا بتحفيز نقائل الكبد عن طريق حقن الخلايا المعزولة من نموذج الفأر المعدل وراثيًا ‘KPC’ لسرطان البنكرياس (Kras; تر ب53 “; Pdx1-Cre)، في فئران تحمل أورام PDAC في الموقع. تم عزل MAMs بواسطة تحليل تدفق الخلايا وتم تحليلها باستخدام تسلسل RNA أحادي الخلية (scRNA-seq) (الشكل البياني الموسع 1c). قمنا بحل توزيع MAMs المكاني من الآفات النقيليّة المبكرة (اليوم 5) والمتقدمة (اليوم 10) باستخدام نهج وسم الأجسام المضادة في الموقع. الأورام الكبدية النقيليّة المتقدمة في PDAC هي ذات تليف عالٍ وقلة في الأوعية الدموية.التروية مع F4/80 المرتبط بـ FITCلذلك، فإن محلول الأجسام المضادة يلون بشكل رئيسي البلعميات في المنطقة المحيطية من الآفات النقيليّة.تظل البلعميات داخل النقائل غير ملونة (F4/80نحن نعرف البلعميات غير الملونة على أنها البلعميات القريبة من النقائل (pMAMs) والبلعميات الملونة على أنها البلعميات البعيدة عن النقائل (dMAMs).
قمنا بتحليل البلعميات من الكبد السليم (2,428 خلية)، والانتقال المبكر (2,007 خلايا)، والانتقال المتقدم القريب (1,953 خلية) والانتقال المتقدم البعيد (2,783 خلية). تم الكشف عن عشر مجموعات متميزة بعد التجميع القائم على Seurat وتقليل الأبعاد (الشكل 1e). تتكون مجموعة البلعميات في الكبد من خلايا كوفبر المقيمة في الأنسجة (KCs) والبلعميات المشتقة من وحيدات النوى (MoMs).العناقيدوأظهرت 9 تعبيرًا عاليًا عن علامات خلايا KC مثل Clec4f و Vsig4 و Timd4 (المرجع 17) (الشكل 1f، g والشكل البياني الممتد 1h). بالتوازي، عبرت المجموعات 2 و 3 و 7 عن علامة البلعميات المشتقة من وحيدات النوى (MoM) Ccr2 (المرجع 18) (الشكل 1f، g والشكل البياني الممتد 1h).
في الكبد الخالي من الأورام، كانت مجموعات KC تهيمن على مجموعة البلعميات، وخاصة المجموعة 0 فيمن السكان (الشكل 1هـ، و)، مما يؤكد التقارير السابقة. في الكبد الذي يحتوي على آفات نقيلية، كانت تجمعات KC 1 و4 و6 و8 وجميع تجمعات MoM الثلاثة موسعة مقارنةً بالكبد الخالي من الأورام، وبالتالي تم التعرف عليها على أنها بلاعمات مستحثة بواسطة النقائل (الشكل 1h,i والشكل الإضافي 1i). أكدت تحليل توقيع الجينات المعبر عنها بشكل مختلف (DEG) أن التجمع 0 أظهر تعبيرًا عاليًا عنبما في ذلك Vsig4 و C6 و Folr2 و Clec4f و Apoc1 و Timd4 (الشكل 1j والجدول التكميلي 1)، والتي كانت معبر عنها بشكل كبير أيضًا في تجمعات KCو 9. بالإضافة إلى هذه علامات بان-KC، العنقود 5 (10% من البلعميات الكبدية الساذجة) تعبر بشكل كبير عن جينات معالجة وتقديم المستضدات (AP) (H2-Eb1، H2-Ab1، H2-T23 و H2-D1) (الشكل 1j والجدول التكميلي 1). العنقود 9 (2% من البلعميات الكبدية الساذجة) أظهر خصائص شبيهة بالبطانة من خلال تعبيراته العالية عن Clec4g، Kdr، Ptprb و Egfl7 (الشكل 1j والجدول التكميلي 1).
أظهرت مجموعتان رئيسيتان من KC-MAM، المجموعتان 1 و4، توقيعًا التهابيًا مع تعبير مرتفع عن السيتوكينات المؤيدة للالتهاب، مثل Il6 وIl1a وIl1b وIl18، وجينات مسارات إشارات NF-кВ وMAPK (Nfkbiz وFosb وTrim25 وNfkbia وMap3k8) (الشكل 1j، k والجدول التكميلي 1). كما تم التعبير عن مثبطات الالتهاب Egr1 وII10، مما يشير إلى آلية تغذية راجعة سلبية (الشكل 1j، k والجدول التكميلي 1). كانت المجموعة 4 مميزة بشكل فريد بتعبيرها عن مستقبل الليبتين Lepr، بالإضافة إلى التعبير المرتفع عن Scd1 وTnf،و IL6، مما يشير إلى نمط ظاهري مؤيد لتكوين الأنسجة الليفيةأظهرت المجموعات الفرعية المتبقية من KC-MAM تعبيرًا عاليًا عن جينات دورة الخلية (Stmn1 وCenpa وMki67) في العنقود 6 وجينات تكرار الحمض النووي (Mcm5 وMcm6 وTopbp1) في العنقود 8، وهو ما يميز البلعميات المتكاثرة (الشكل 1j والجدول التكميلي 1).
داخل مجموعات MAM المشتقة من وحيدات النواة، أظهر العنقود 2 توقيعات جينية مرتبطة بـ AP، كما يتضح من التعبير العالي عن H2-Eb1 و H2-Ab1 و Cd74 (الشكل 1j، k والجدول التكميلي 1). على العكس، أظهر العنقود 3 غنى في Chil3 و Mrc1 و Arg1، مما يشير إلى نمط ظاهري شبيه بـ M2/ مثبط للمناعة (الشكل 1j، k والجدول التكميلي 1). عرضت مجموعة MoM الصغيرة، العنقود 7، تعبيرًا مشابهًا عن Chil3 و Arg1 وتعبيرًا عاليًا عن جينات دورة الخلية (Stmn1 و Cenpa و Mki67)، مما يشير إلى أنها مجموعة متكاثرة من العنقود 3 (الشكل 1j والجدول التكميلي 1).
استكشفنا ما إذا كانت التوقيعات المحددة لـ MAM موجودة في بيانات RNA-seq لانتقالات الكبد البشرية في PDAC. كانت جميع التوقيعات الأربعة لـ MAM (مجموعات KC 1 و 4 ومجموعات MoM 2 و 3) قابلة للاكتشاف في البيانات البشرية (الشكل التمديدي 1j). أظهر تحليل scRNA-seq لدينا أن مجموعة MoMs 3 كانت الأكثر وفرة في المناطق الأساسية من الانتقالات المتقدمة. وبما يتماشى مع ذلك، وجدنا أعلى درجة توقيع لهذه المجموعة في جميع خزعات الكبد المأخوذة من نوى الأورام المتقدمة للمرضى الذين يعانون من PDAC (الشكل 11).
تشير هذه البيانات معًا إلى أن انتشار سرطان البنكرياس (PDAC) يزيد من تنوع البلعميات داخل كل من مجموعات موما (MoM) وكاي سي (KC) وأن هناك تواجدًا متزامنًا لمجموعات البلعميات المثبطة للمناعة والمحفزة للمناعة.
تظهر خلايا MoMs CD74-/low وظائف مثبطة للمناعة قوية
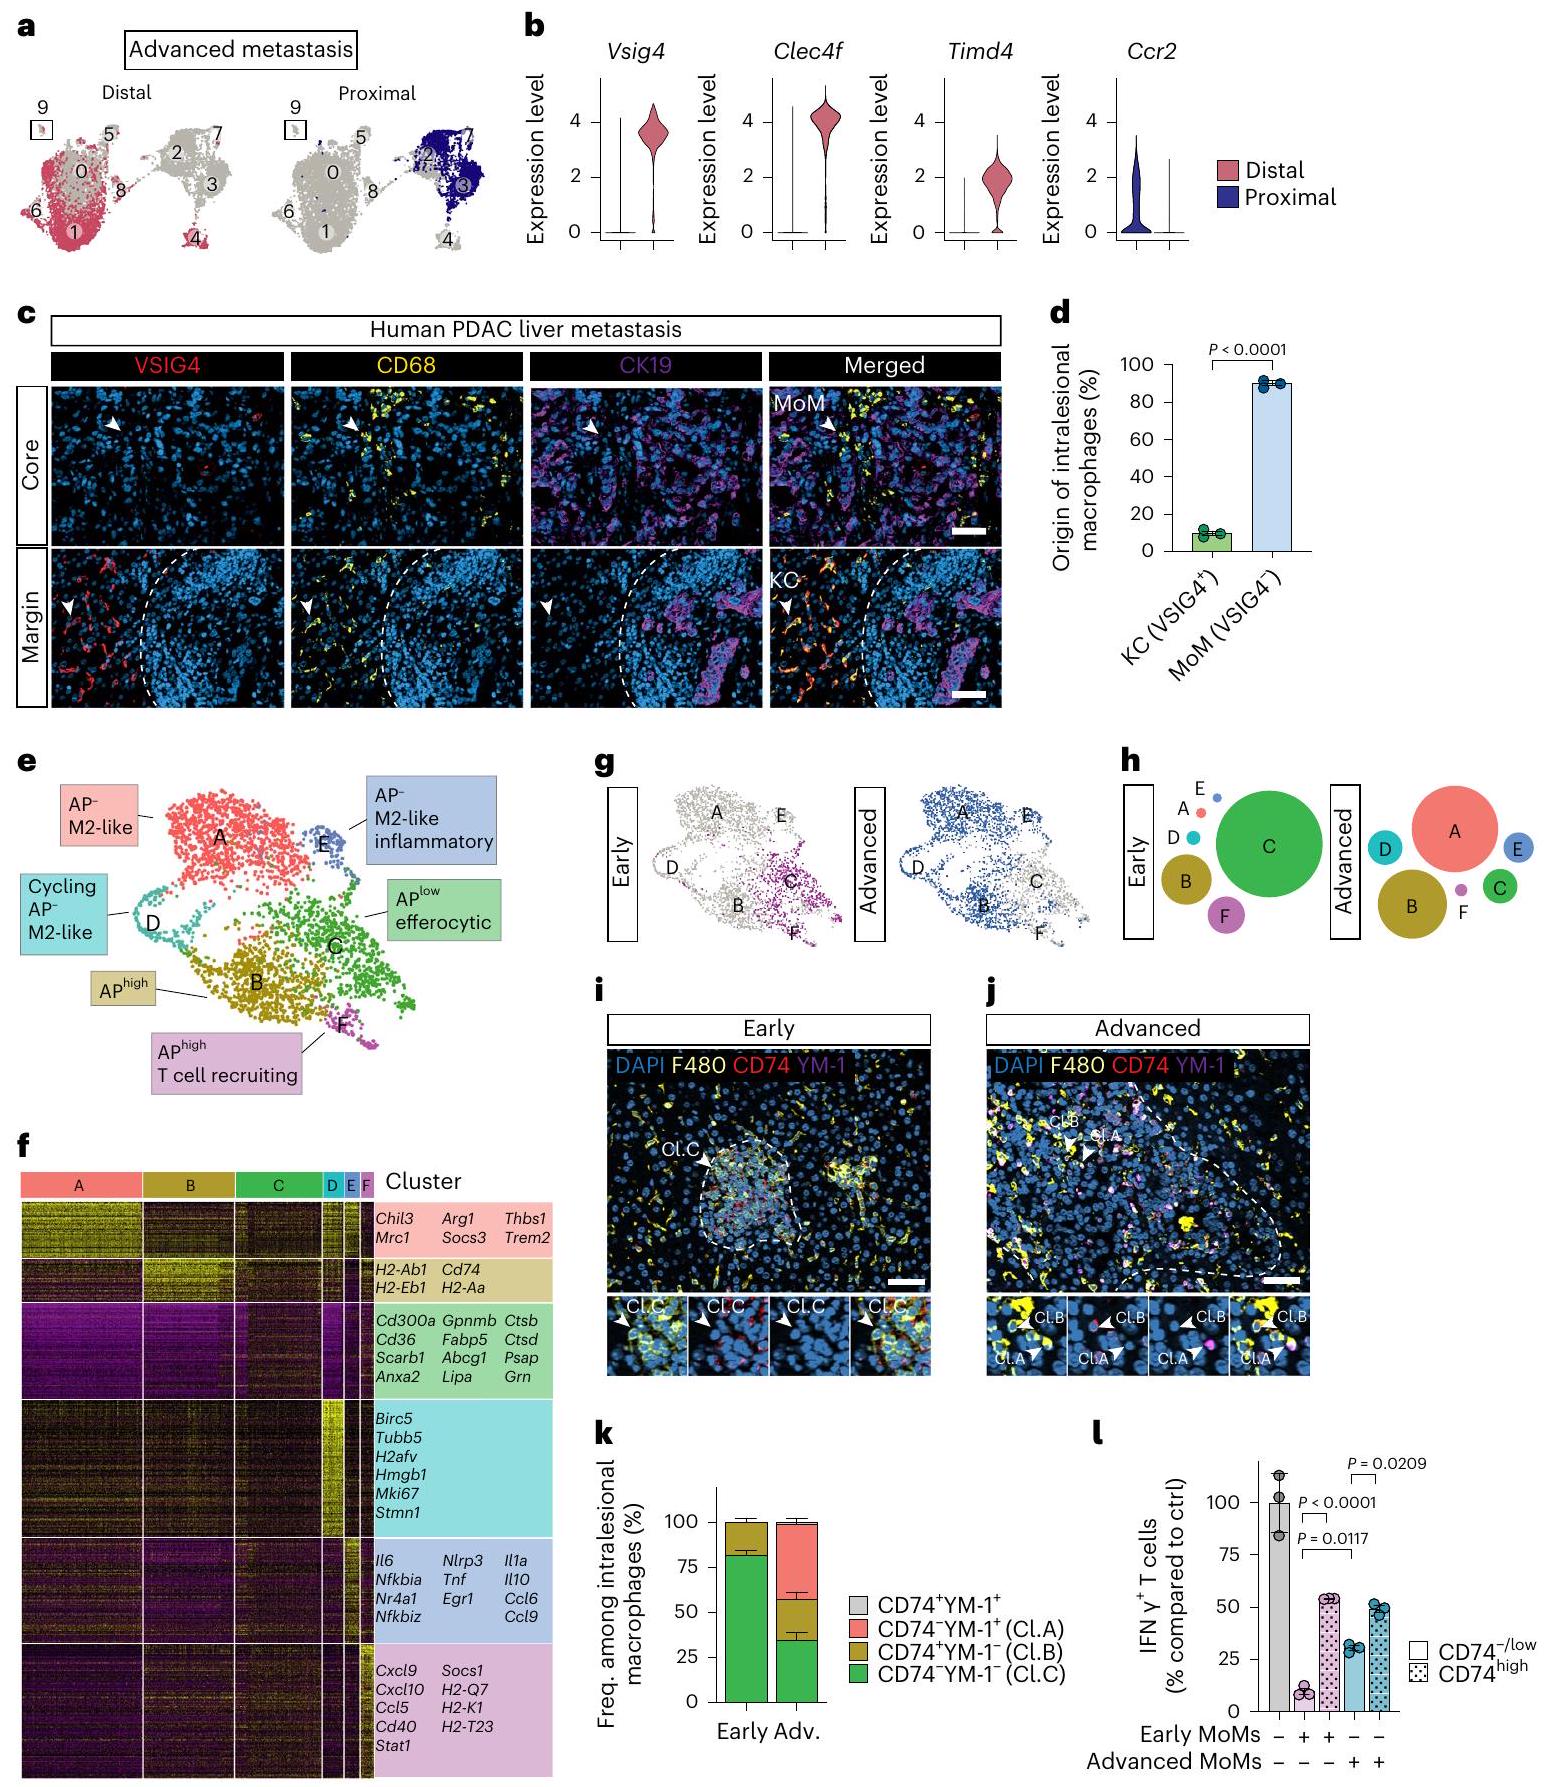
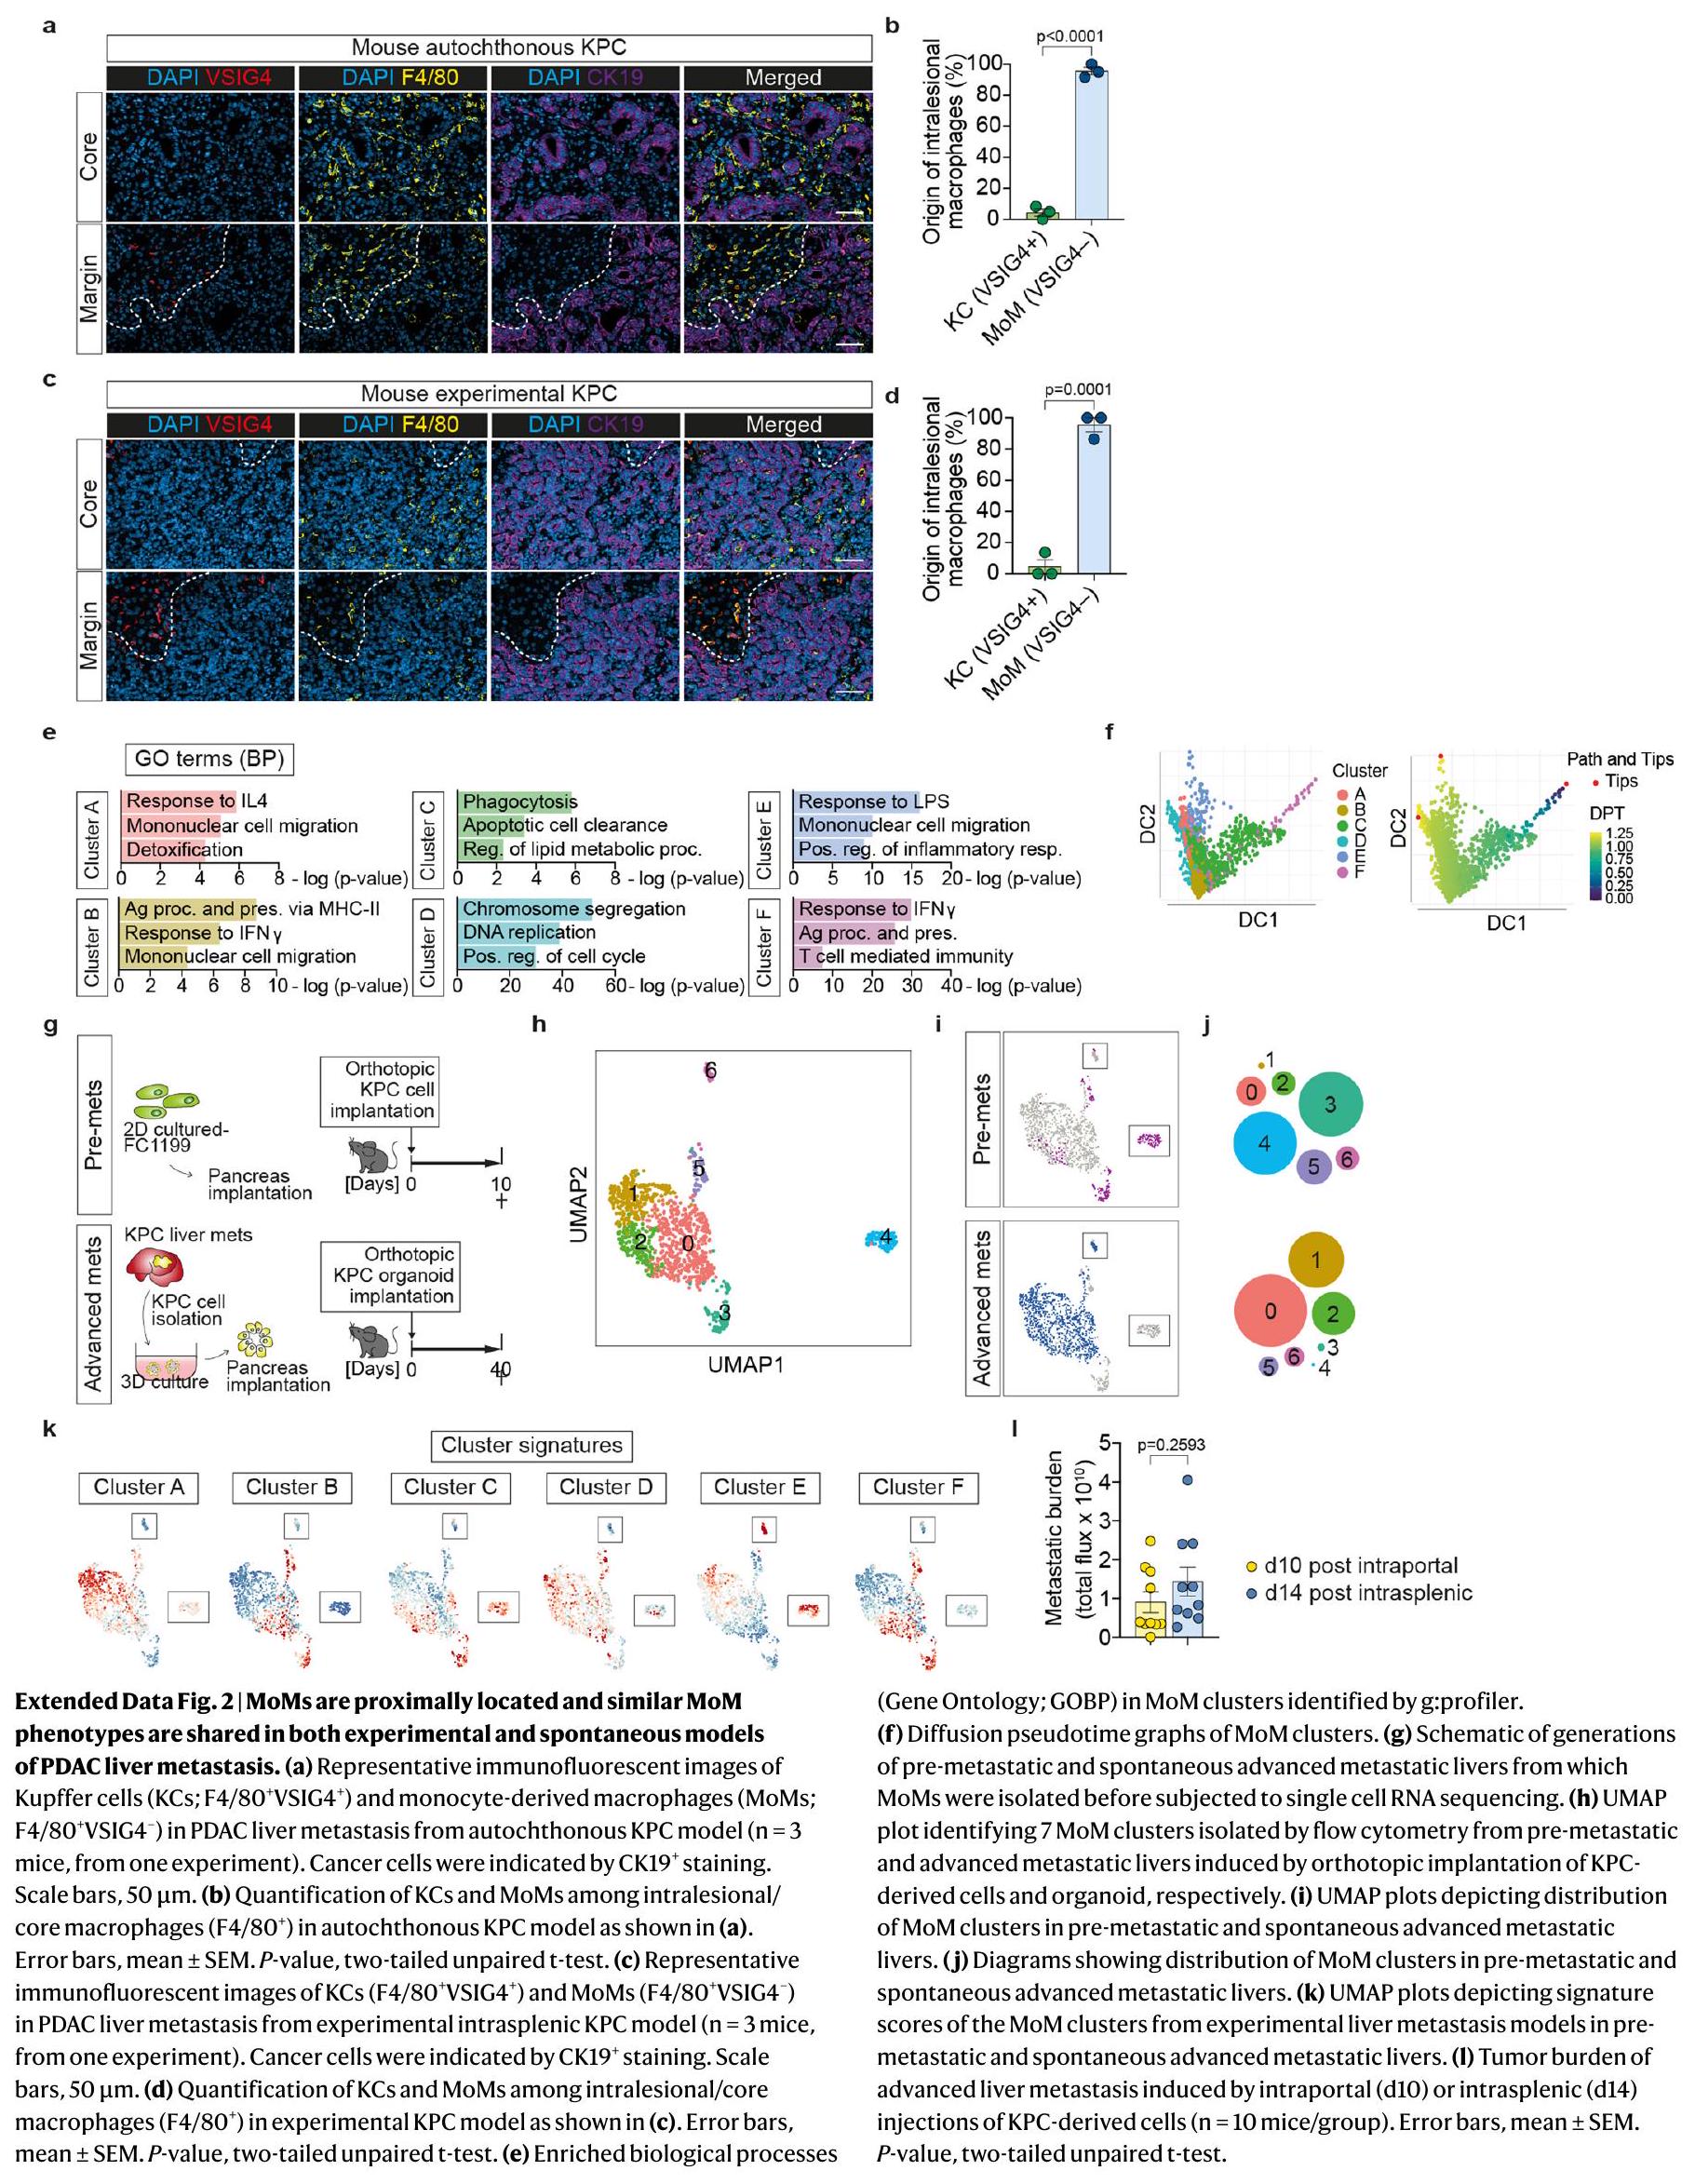
قمنا بتحليل التوزيع المكاني لمجموعات MAM. أظهرت مجموعات pMAM و dMAM من النقائل الكبدية المتقدمة تداخلًا ضئيلًا، مما يؤكد خصوصية نهج التوسيم الخاص بنا (الشكل 2a). وجدنا أن pMAMs المت infiltrating بالنقائل تنشأ من وحيدات النوى، في حين أن dMAMs تتكون بشكل رئيسي من خلايا كبدية مقيمة في الأنسجة، وهو ما يتماشى مع تقرير سابق. (الشكل 2ب). أظهرت تحليلات مقاطع الأنسجة للآفات النقيليّة المتقدمة المشتقة من مرضى يعانون من سرطان البنكرياس (الشكل 2ج، د)، نموذج الفأر KPC الذاتي المنشأ (الشكل التمديدي 2أ، ب) ونموذج الفأر النقيلي التجريبي (الشكل التمديدي 2ج، د)، أن الأورام النقيليّة كانت مُخترقة بشكل كبير بواسطة البلعميات. في جميع الحالات، كانت البلعميات المحيطية ملونة إيجابياً لمؤشر KC VSIG4، في حين كانت البلعميات داخل النواة سلبية لـ VSIG4. تشير هذه البيانات إلى أن البلعميات المستقطبة تتسلل إلى الآفات النقيليّة، بينما تنشأ البلعميات الموجودة بعيداً عن الآفات النقيليّة من خلايا KCs المقيمة في الأنسجة.
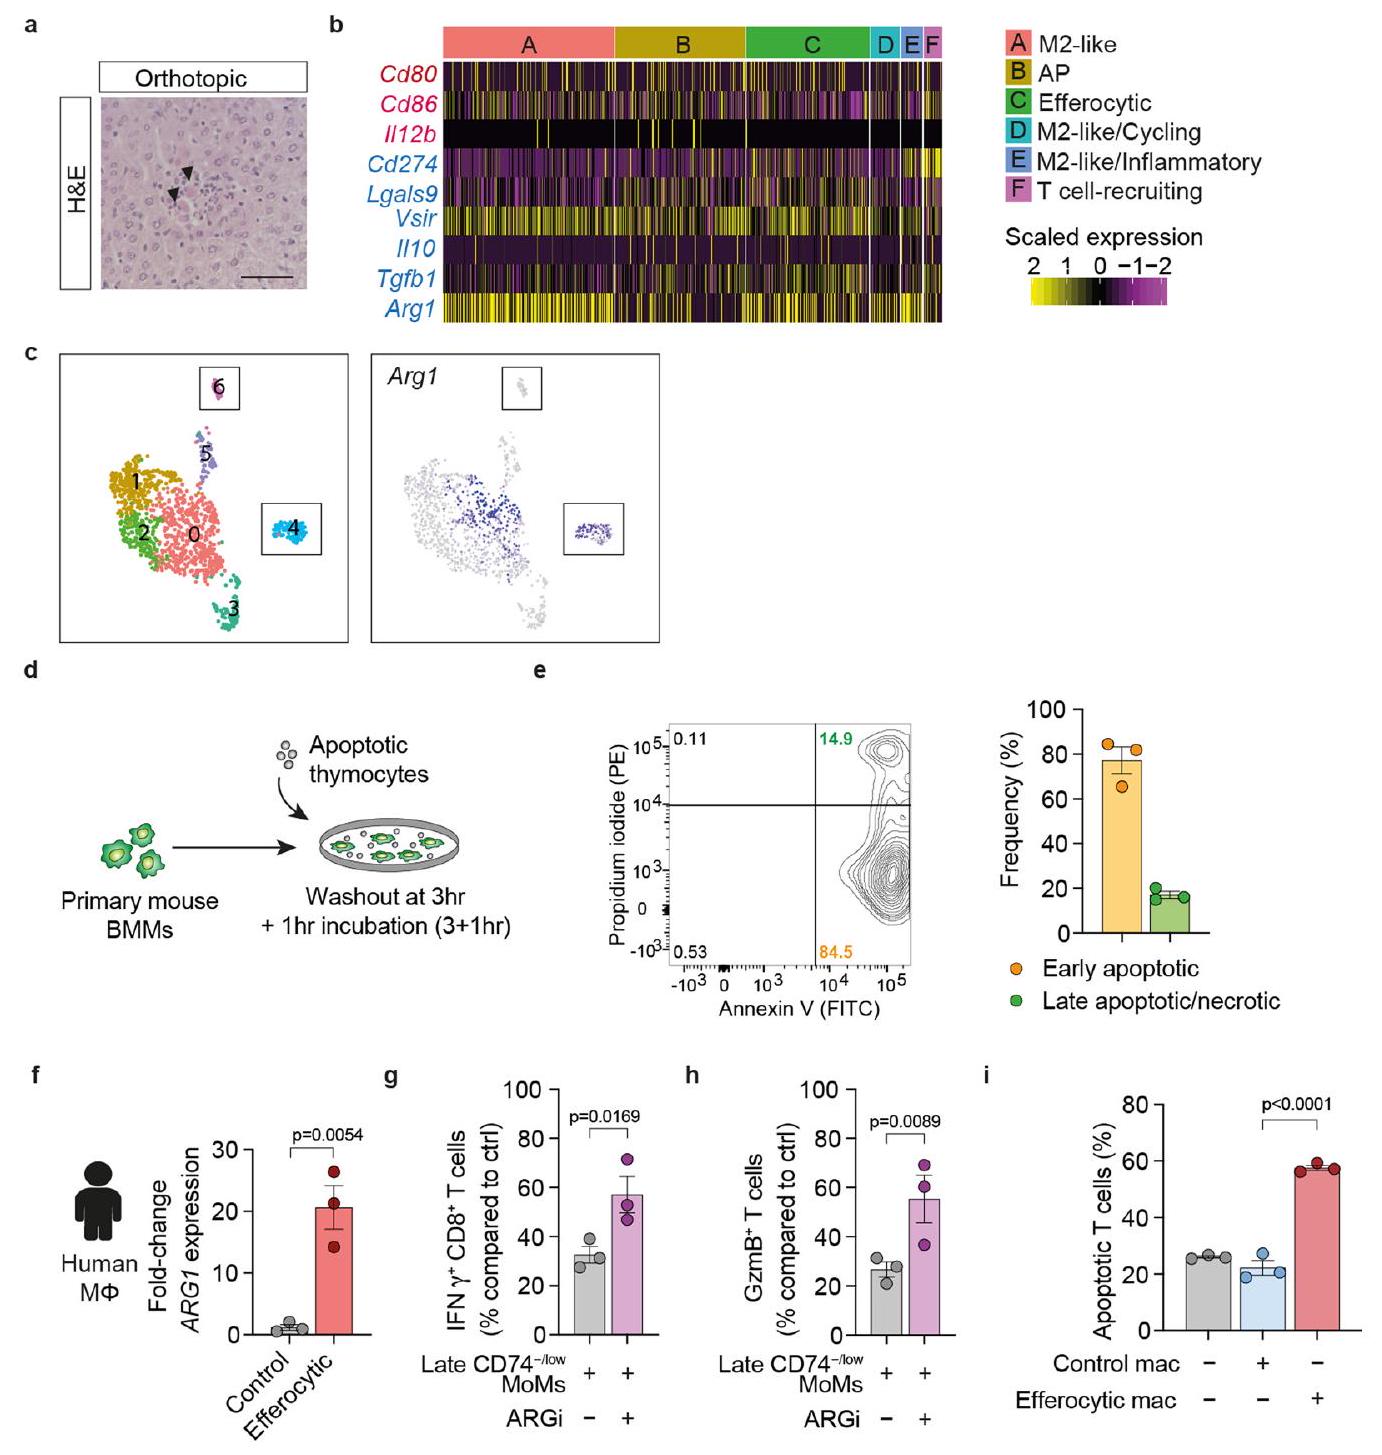
نظرًا لأن pMAMs في المراحل المتقدمة من النقائل مشتقة بشكل أساسي من المونوسيتات، قمنا بإجراء تجميع إضافي وتقليل الأبعاد على تجمعات MoM، المجموعات 2 و3 و7. وجدنا ستة تجمعات MoM متميزة أخرى (الشكل 2e). داخل المجموعة المرتبطة بالإيجابية لـ AP (المجموعة الأصلية 2)، وجدنا ثلاث مجموعات جديدة (B وC وF). ومن الجدير بالذكر أن توقيع AP كان غنيًا في المجموعة B وF (AP )، ولكن ليس في العنقود (الشكل 2f). كانت المجموعة C مرتبطة بتوقيعات البلعمة/إزالة الخلايا المبرمجة للموت (Cd3OOa، Cd36، Scarb1، Anxa2 و Gpnmb) وكانت غنية بالجينات الليزوزومية (Lipa، Ctsb، Ctsd،
الشكل 1 | تحديد تجمعات MAM في كبد PDAC النقيلي بواسطة تسلسل RNA أحادي الخلية مع التصنيف المكاني في الموقع. أ، مخطط لتسلسل RNA الكلي على خزعات كبد النقيلي الطازجة من مرضى PDAC غير المعالجين بالعلاج الكيميائي. ) (الأعلى) وخريطة الحرارة التي تظهر الدرجات (درجة الإثراء المنظم (NES)؛ تحليل إثراء مجموعة الجينات لعينة واحدة (ssGSEA)) لتوقيعات المناعة (الأسفل). NK، الخلايا القاتلة الطبيعية. ب-د، صور مناعية تمثيلية (ب) وقياس الكمية لـالخلايا (ج) والبلاعم (CD68) (د) في هامش الورم ونواة نقائل سرطان البنكرياس الغدي البشري في الكبد (الخلايا السرطانية تم الإشارة إليها بـتلوين. تشير الأسهم إلى CD8خلايا T. قضبان القياس،أشرطة الخطأ، المتوسطس.م.القيم، غير مرتبطة ذات طرفين-اختبار. DAPI، 4,6-دياميدينو-2-فينيل إندول. e، رسم تخطيطي لتقريب وتقدير الشكل الموحد (UMAP) يحدد عشرة مجموعات داخل البلعميات () تم عزلها بواسطة تحليل تدفق الخلايا من كبد صحي، وكبد ميتاستازي مبكر (d5) وكبد ميتاستازي متقدم (d10) ناتج عن زراعة خلايا مشتقة من KPC داخل البوابة في فئران ذات حالة مثبتة
أورام سرطان البنكرياس القنوي الموضعيةالفئران لكل مجموعة). fg، مخططات UMAP (f) ومخططات الكمان ( ) تصوير تعبير العلامات الشائعة لـ KCs (Clec4f و Vsig4 و Timd4) و MoMs (Ccr2) في مجموعة بيانات scRNA-seq. h,i، مخططات UMAP (h) ورسم بياني عمودي (i) توضح توزيع مجموعات الماكروفاج المختلفة في الكبد السليم، والكبد المبكر النقيلي (d5) والكبد المتقدم النقيلي (d10). j، خريطة حرارية توضح التعبير النسبي المتوسط لأعلى الجينات المعبر عنها بشكل مختلف في كل مجموعة ماكروفاج مقارنة بجميع المجموعات الأخرى في مجموعة بيانات scRNA-seq. تم وضع علامات على الجينات التمثيلية لكل مجموعة. k، العمليات البيولوجية الغنية في مصطلحات علم الأحياء الجيني (GO) في مجموعات MAM الرئيسية المستمدة من KCs (المجموعة 1 و 4) والعدلات (المجموعة 2 و 3). تم إجراء تحليلات الإثراء الإحصائي باستخدام اختبار فيشر الدقيق على g:Profiler. LPS، ليببوليسكاريد؛ pp، المعالجة والعرض؛ MHC، معقد التوافق النسيجي الرئيسي؛ IL، إنترلوكين. I، خريطة حرارية تظهر درجات التوقيع (NES؛ ssGSEA) لمجموعات KC-MAM و Mo-MAM الرئيسية في عينات نقيليات الكبد البشرية PDAC (المرضى).
الشكل 2 | CD74تظهر خلايا المناعة المتحولة (MoMs) وظائف مثبطة للمناعة قوية في مرحلة مبكرة من الانتقال السرطاني. أ، مخططات UMAP توضح توزيع pMAMs و dMAMs في الأورام المتقدمة (d10) بناءً على الوسم في الموقع. ب، مخططات الكمان توضح مستويات التعبير لجينات KC (Vsig4 و Clec4f و Timd4) وجينات MoM (Ccr2) في pMAMs و dMAMs. ج، صور تمثيلية باستخدام التألق المناعي توضح توزيعات KCs (CD68VSIG4) و MoMs (CD68VSIG4“) في نواة الورم (الأعلى) ومناطق الحافة (الأسفل، الخط المتقطع) من النقائل الكبدية المشتقة من مرضى سرطان البنكرياس (تم الإشارة إلى خلايا السرطان النقيلي بواسطة CK19تلوين. مقياس الرسم،. د، قياس KCs و MoMs بين البلعميات داخل الآفات/النواة كما هو موضح في ج. أشرطة الخطأ، المتوسطس.م.قيمة، غير مرتبطة ذات طرفين-اختبار. e، رسم UMAP يحدد ستة تجمعات من MoMs المستمدة من التجمع 2 و3 و7 في UMAP الأصلي (الشكل 1c).خريطة حرارية توضح التعبير النسبي للجينات المعبر عنها بشكل مرتفع في كل مجموعة من مجموعات MoM مقارنة بجميع مجموعات MoM الأخرى في مجموعة بيانات RNA-seq. تم وضع علامات على الجينات التمثيلية لكل مجموعة. g، مخططات UMAP توضح توزيع مجموعات MoM في المرحلة المبكرة (d5)
وأكباد متقدمة النقائل (d10). h، مخطط يوضح توزيع تجمعات MoM في الأكباد النقيلية المبكرة (d5) والأكباد المتقدمة النقائل (d10). i-k، صور مناعية فلورية تمثيلية لعدة نوعيات من البلعميات () التعبير عن علامة تقديم المستضد CD74 أو علامة M2 YM-1 في النقائل الكبدية المبكرة (i) والمتقدمة (j) المستمدة من نموذج التجارب داخل الطحال (فئران لكل مجموعة، من تجربة واحدة). قضبان القياس،تحديد كمية الصبغة التي تظهر نسب البلعميات داخل الآفات التي تشبه تجمعات MoM الرئيسية: مثل تجمع C (Cl.C) (CD74- YM-1-)، مثل تجمع B (Cl.B) (CD74) ونمط مشابه للعناقيد A (Cl.A) (CD74) ( ). أشرطة الخطأ، المتوسط س.م. أنا، قريبتنشيط الخلايا يقاس بنسب الإنترفيرون (IFN)الخلايا التي تلت التحفيز باستخدام كريات دينابيد المرتبطة بـ anti-CD3/CD28 والتعايش مع MoMs المبكرة أو المتقدمة (F4/80+ TIM4-) المفصولة بواسطة FACS من نموذج تجريبي داخل الطحال مقارنةً بتحكم كريات الدينابيد فقط (ctrl) (التكرارات البيولوجية لكل مجموعة من تجربة واحدة). أشرطة الخطأ، المتوسطس.م.القيم، تحليل التباين أحادي الاتجاه (ANOVA) مع اختبار سيداكس اللاحق.
Psap و Grn) (الشكل 2 ف والبيانات الموسعة الشكل 2هـ)، تشير إلى البلعميات الفعالة. تم اشتقاق مجموعتين (المجموعة A و E) من مجموعة فرعية شبيهة بـ M2/مثبطة للمناعة (المجموعة الأصلية 3) (الشكل 2ف والبيانات الموسعة الشكل 2هـ). كانت كلتا المجموعتين تفتقران إلى تعبير جين AP (AP) وأظهرت تعبيرات أعلى لجينات علامات M2 Chil3 و Mrc1. كما أظهر العنقود E توقيعًا التهابيًا، معبرًا عن NF-кB و TNFجينات مرتبطة بالإشارات مثل Il6 وTnf وIl1a (الشكل 2f والشكل الإضافي 2e). يظهر العنقود D غنى بجينات دورة الخلية وملف مشابه للعنقود A، مما يشير إلى أن العنقود D هو مجموعة متزايدة من العنقود A (الشكل 2f والشكل الإضافي 2e).
في المراحل المبكرة من الانبثاث، كانت مجموعة MoM مهيمنة من قبل المجموعة C، مع مساهمة طفيفة منالمجموعات الفرعية المرتبطة و كانت الآفات النقيليّة المتقدمة مهيمنة على العنقودومجموعة فرعية مشابهة لـ M2، تليها المجموعات E و D (الشكل 2g، h). كشفت تحليل الزمن الزائف عن مسار فينوتيبي يبدأ بالمجموعة F، تليها المجموعة C والمجموعة B، والتمايز النهائي إلى المجموعة A/D أو E خلال التقدم النقيلي (الشكل البياني الممتد 2f). في الكبد قبل النقيلي المعزول من الفئران التي تحتوي على أورام مزروعة في موضعها الأصلي، اكتشفناوعنقود-مثل تجمعات MoM (الشكل البياني الموسع. )، مما يظهر وجود تجمعات MoM المتعلمة على السرطان خلال تشكيل مكان ما قبل النقائل في الفئران الحاملة للأورام. كان تجمع شبيه بالتجمع A هو السائد في الكبد مع نقائل عفوية متقدمة تم عزلها من الفئران المزروعة بشكل موضعي مع عضيات أورام KPC (الشكل البياني الموسع. ). وقد تم دعم هذه النتائج من خلال صبغ المناعة لبروتين AP CD74 وعلامة M2 Chil3 المشفرة YM-1 في الأنسجة النقيليّة المبكرة والمتقدمة المعزولة من زراعة خلايا KPC بعد زراعة داخل الطحال. تم جمع الكبد في اليوم الخامس واليوم الرابع عشر (حمل ورمي قابل للمقارنة كما في اليوم العاشر بعد الزراعة داخل البوابة (الشكل البياني الممتد 21)). كما هو متوقع، كانت مستويات CD74 منخفضة أو غائبة تكون خلايا MoMs (العنقود C) الأكثر وفرة في الآفات النقيليّة المبكرة، بينما CD74 YM كانت MoMs (المجموعة A) تمثل أكثر مجموعة MoM شيوعًا في الآفات النقيليّة المتقدمة (الشكل 2i-k).
لوصف النمط الظاهري الوظيفي لـ ضد الأمهات، قمنا بعزل CD74و CD74موما (F4/80TIM4) من الأورام النقيليّة المبكرة والمتقدمة باستخدام تقنية فرز الخلايا بالتدفق (FACS) وزرعها مع خلايا مفعّلة الخلايا. في كلا الحالتينكانت MoMs أكثر فعالية في تثبيطوظائف الخلايا مقارنة بـمومز (الشكل 21). لاحظنا نشاطًا مثبطًا للمناعة أقل في مومز CD74-/low من الأورام المتقدمة مقارنة بمومز CD74-/low المبكرة. قد يُعزى ذلك إلى المجموعة الالتهابية (العنقود E) الموجودة في CD74 المتأخر.الخلايا المناعية (الشكل 2g) التي تعبر عن عوامل تحفيز الخلايا التائية مثل Illa وتشير بياناتنا بشكل جماعي إلى أن نمط المناعة المثبط يتم اكتسابه في خلايا موما (MoMs) في وقت مبكر خلال الانتقال النقيلي، ويرتبط بفقدان تعبير CD74 ووجود توقيع جيني للإيفيروسيتوز.
تؤدي الإيفيروسيتوز إلى نمط ظاهري مثبط للمناعة
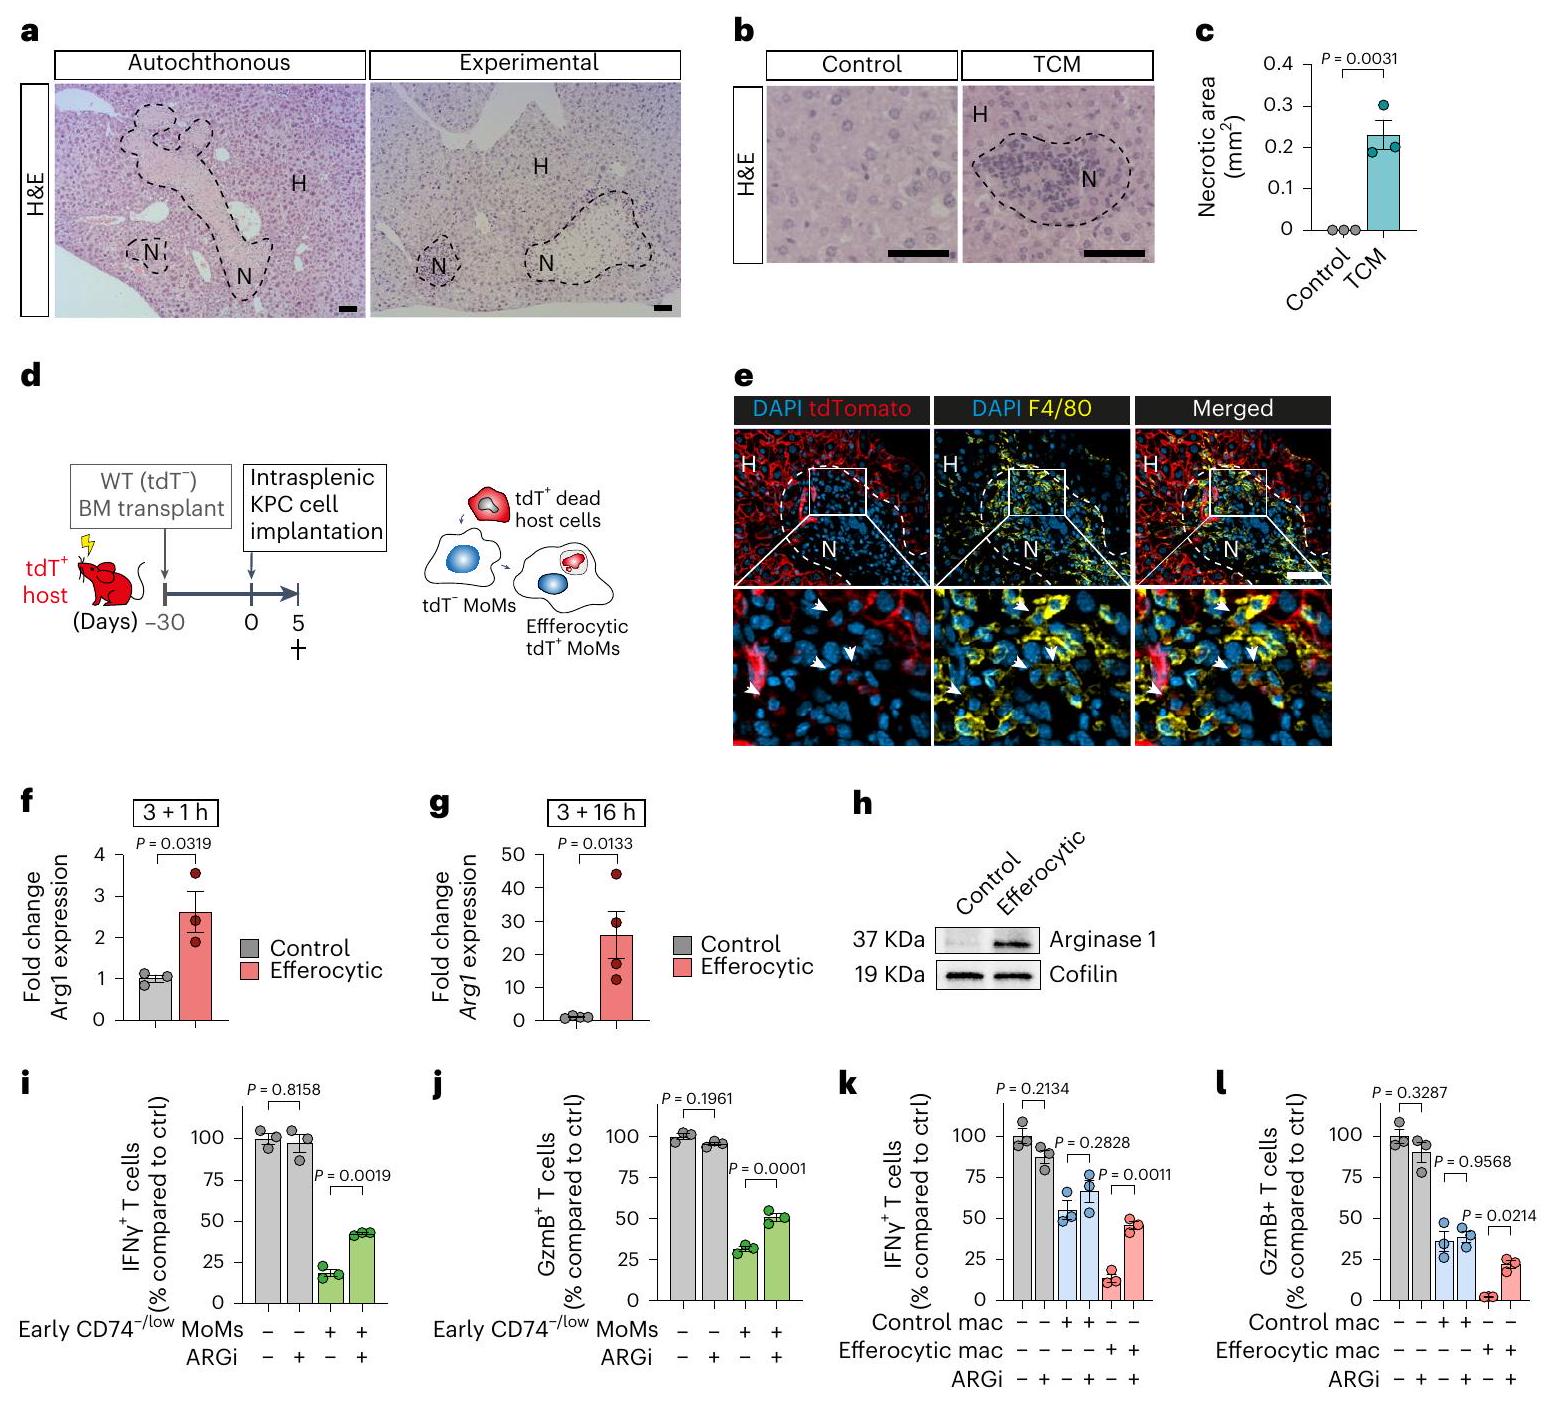
لقد استنتجنا أن توقيعات المسار الملحوظة في خلايا المناعة المتعددة (MoMs) قد تكون ناتجة عن إصابة الكبد المرتبطة بالنقائل. لاختبار ذلك، قمنا بفحص مدى الإصابة المرتبطة بالنقائل في أكباد مأخوذة من (1) نموذج KPC الذاتي المنشأ، (2) نموذج النقائل داخل الطحال التجريبي و(3) بعد الإدارة اليومية للوسط المكيف من ورم البنكرياس (TCM) عن طريق الوريد في الفئران السليمة. تم الكشف عن نخر كبدي في أنسجة الكبد لنموذج KPC الذاتي المنشأ، بعد زراعة خلايا KPC بشكل متجانس وفي المراحل المبكرة من نموذج النقائل داخل الطحال التجريبي (الشكل 3أ والشكل الإضافي 3أ). كانت الإدارة اليومية لـ TCM من البنكرياس كافية لتحفيز النخر الكبدي (الشكل 3ب، ج). وبالتالي، فإن نقائل سرطان البنكرياس (PDAC) مصحوبة بموت الخلايا المقيمة خلال الانتشار النقائلي الأولي، وحتى استجابةً لعوامل مشتقة من الورم. لتأكيد وجود MoMs الملتهمة، قمنا بزراعة خلايا نخاع العظم (BM) من نوع البرية (WT) في فئران تعبر عن tdTomato (tdT)، مما أدى إلى فئران هجينة تعبر عن tdT بشكل شامل، بما في ذلك في الخلايا الكبدية وخلايا كوفال (KCs)، بينما ظلت MoMs غير موسومة (الشكل 3د). بعد تحفيز نقائل الكبد، لاحظنا تراكمالخلايا المناعية في المناطق النخرية، بعضها يحتوي على tdTالحطام في السيتوبلازم لديهم (الشكل 3e). تظهر هذه البيانات أن مجموعة فرعية من الخلايا المناعية الملتهمة تظهر مبكرًا في انتشار السرطان الكبدي لحل إصابات الأنسجة.
لتحديد الوسيط للنشاط المثبط للمناعة في مجموعة MoM المبكرة، قمنا بفحص تعبير الجينات المثبطة للمناعة في مجموعة MoM في بيانات scRNA-seq الخاصة بنا. مشابهًا لمجموعات M2like A/D/E، وجدنا تعبير الجين المثبط للخلايا التائية Arg1 في مجموعة MoMs C، والتي قد تكون مسؤولة عن النشاط المثبط للمناعة لمجموعات MoMs المبكرة CD74-/low (الشكل 3b من البيانات الموسعة). علاوة على ذلك، تم ربط الأرجيناز 1 بعملية الإيفيروسيتوز.تماشيًا مع وجود إصابة في الكبد قبل زراعة النقائل، تم العثور على تعبير عالٍ لـ Arg1 في تجمعات MoM المعزولة من أكباد ما قبل النقائل للفئران التي تم زرع الأورام فيها بشكل موضعي (الشكل التوضيحي الممتد 3c). أكدت تجارب زراعة الخلايا في المختبر باستخدام البلعميات الأولية من الفئران والبشر أن الإيفيروسيتوز هو كافٍ لتحفيز زيادة تعبير Arg1/أرجيناز 1 (الشكل 3f-h والشكل التوضيحي الممتد 3d-f).
لاختبار الأهمية البيولوجية للأرجيناز 1، قمنا بتحفيزتم عزل خلايا T وزرعها مع خلايا MoMs المبكرة CD74-/low (الشكل 3i، j) أو البلعميات الفعالة (الشكل 3k، l) في وجود مثبط الأرجيناز 1، CB1158. مشابهة لخلايا MoMs المبكرة، أظهرت البلعميات الفعالة زيادة ملحوظة في النشاط المناعي المثبط، وعلاجها بمثبط الأرجيناز 1 CB1158 (ARGi) ألغى هذا التأثير (الشكل 3i-1). وهذا يشير إلى أن الأرجيناز 1 مسؤول عن النشاط المثبط لخلايا T من قبل البلعميات الفعالة. كما أن حجب نشاط الأرجيناز 1 قلل أيضًا من تأثير تثبيط خلايا T من قبل خلايا MoMs المتأخرة CD74-/low، مما يشير إلى أن الأرجيناز 1 يتوسط التأثيرات المناعية المثبطة في كل من خلايا MoMs المبكرة والمتأخرة CD74-/low (بيانات موسعة الشكل 3g، h). كما لاحظنا زيادة في موت الخلايا المبرمج للخلايا المنشطة.الخلايا عند زراعتها مع البلعميات الملتهمة في المختبر (الشكل 3i من البيانات الموسعة). باختصار، فإن انتشار سرطان البنكرياس في الكبد مصحوب بتلف الكبد وبلعمة الخلايا الميتة، مما يعزز تحويل البلعميات نحو نمط ظاهري مثبط للمناعة.
تثبيط الإيفيروسيتوز يوقف تحويل الخلايا المناعية و الانتقال
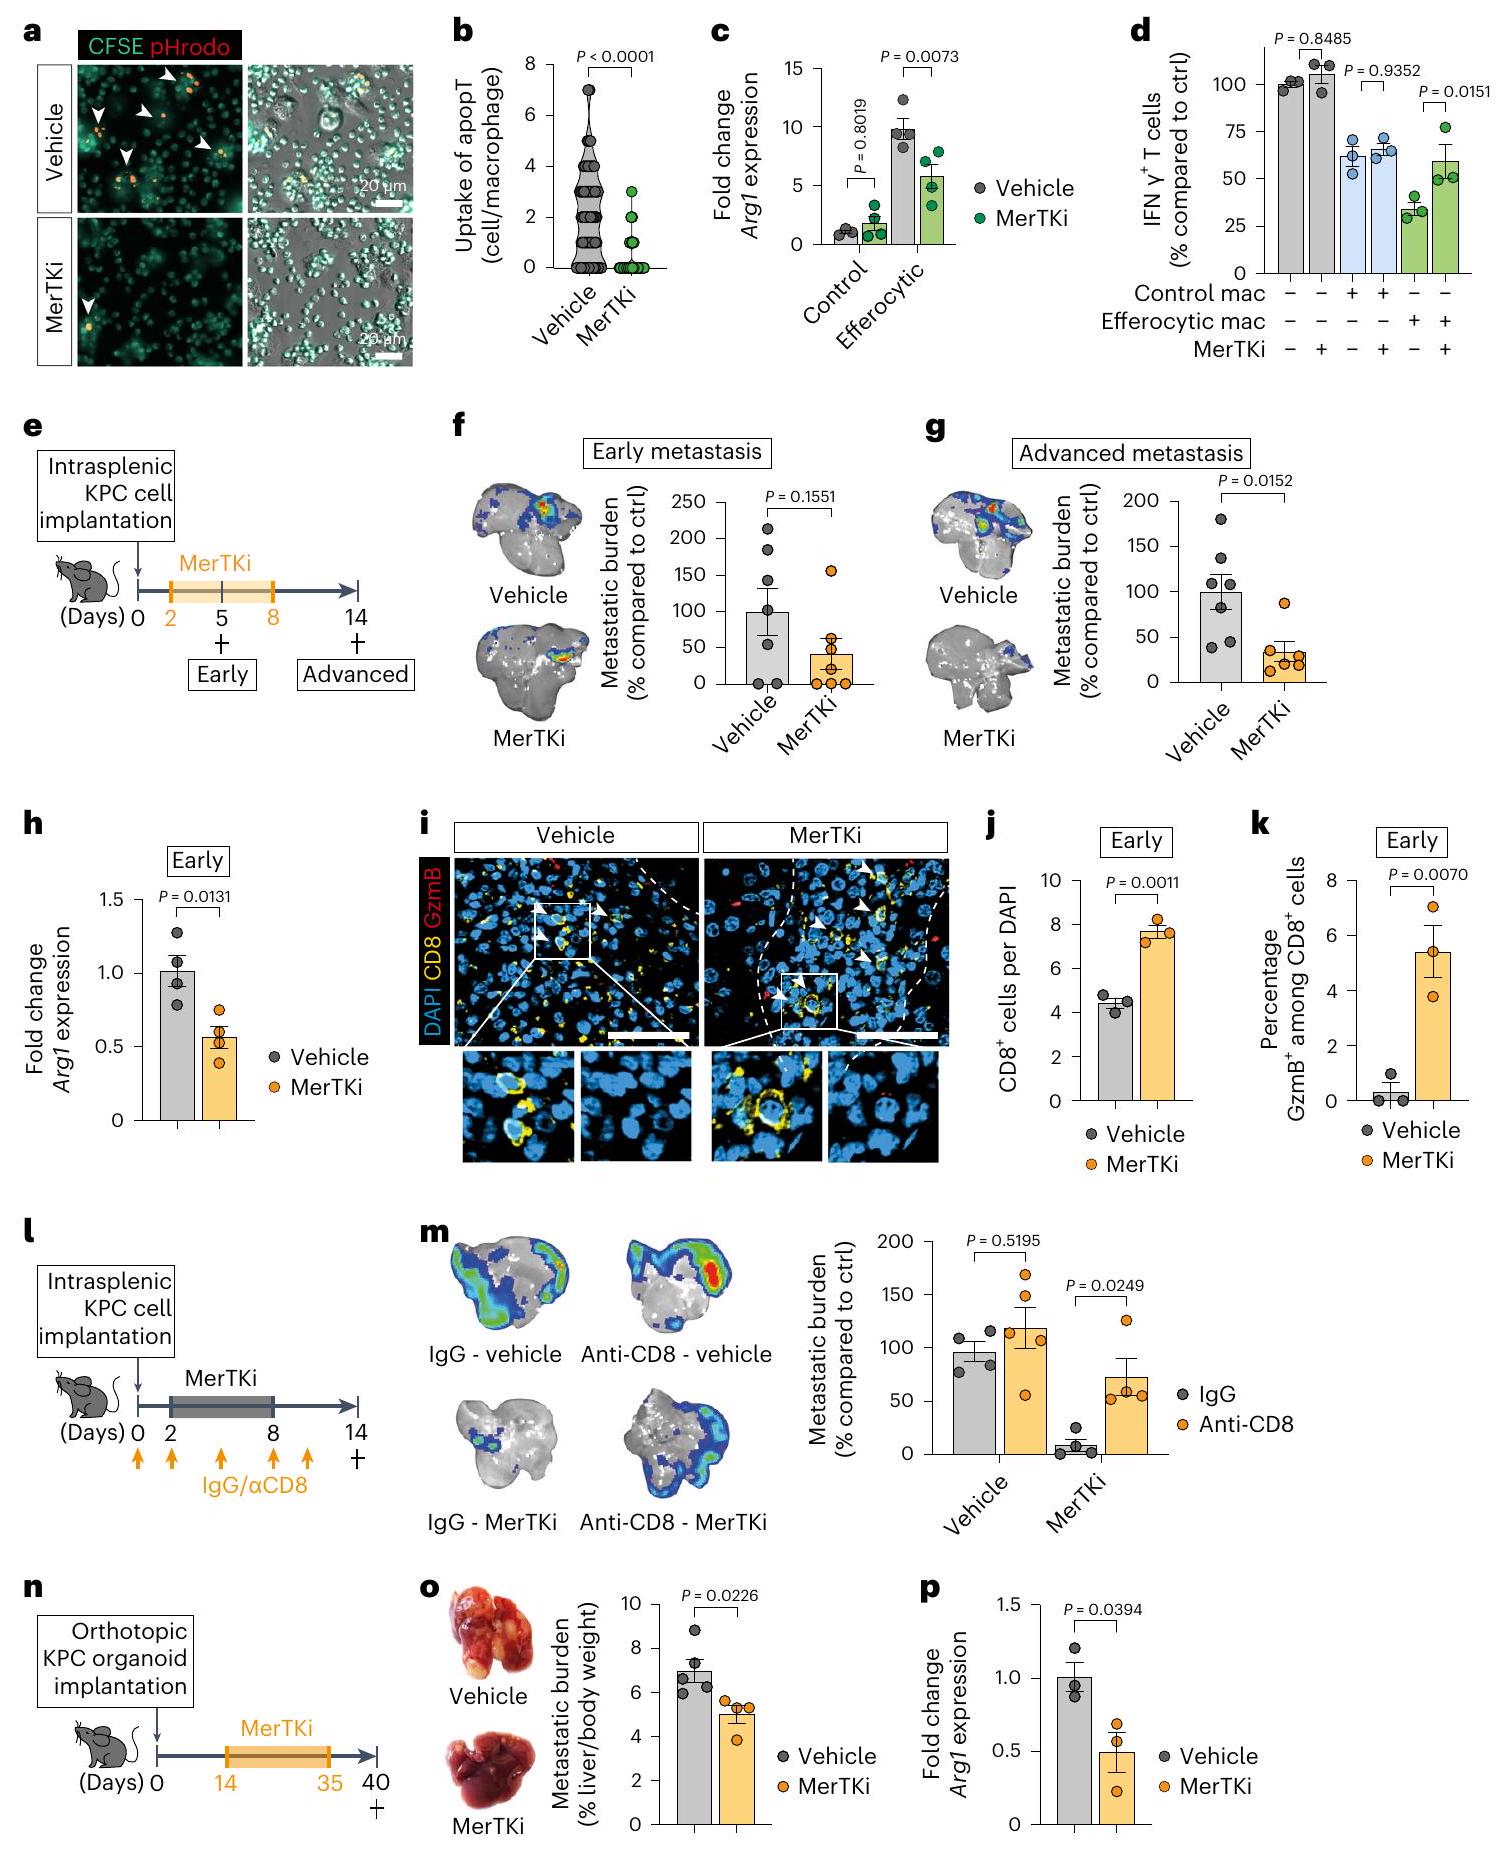
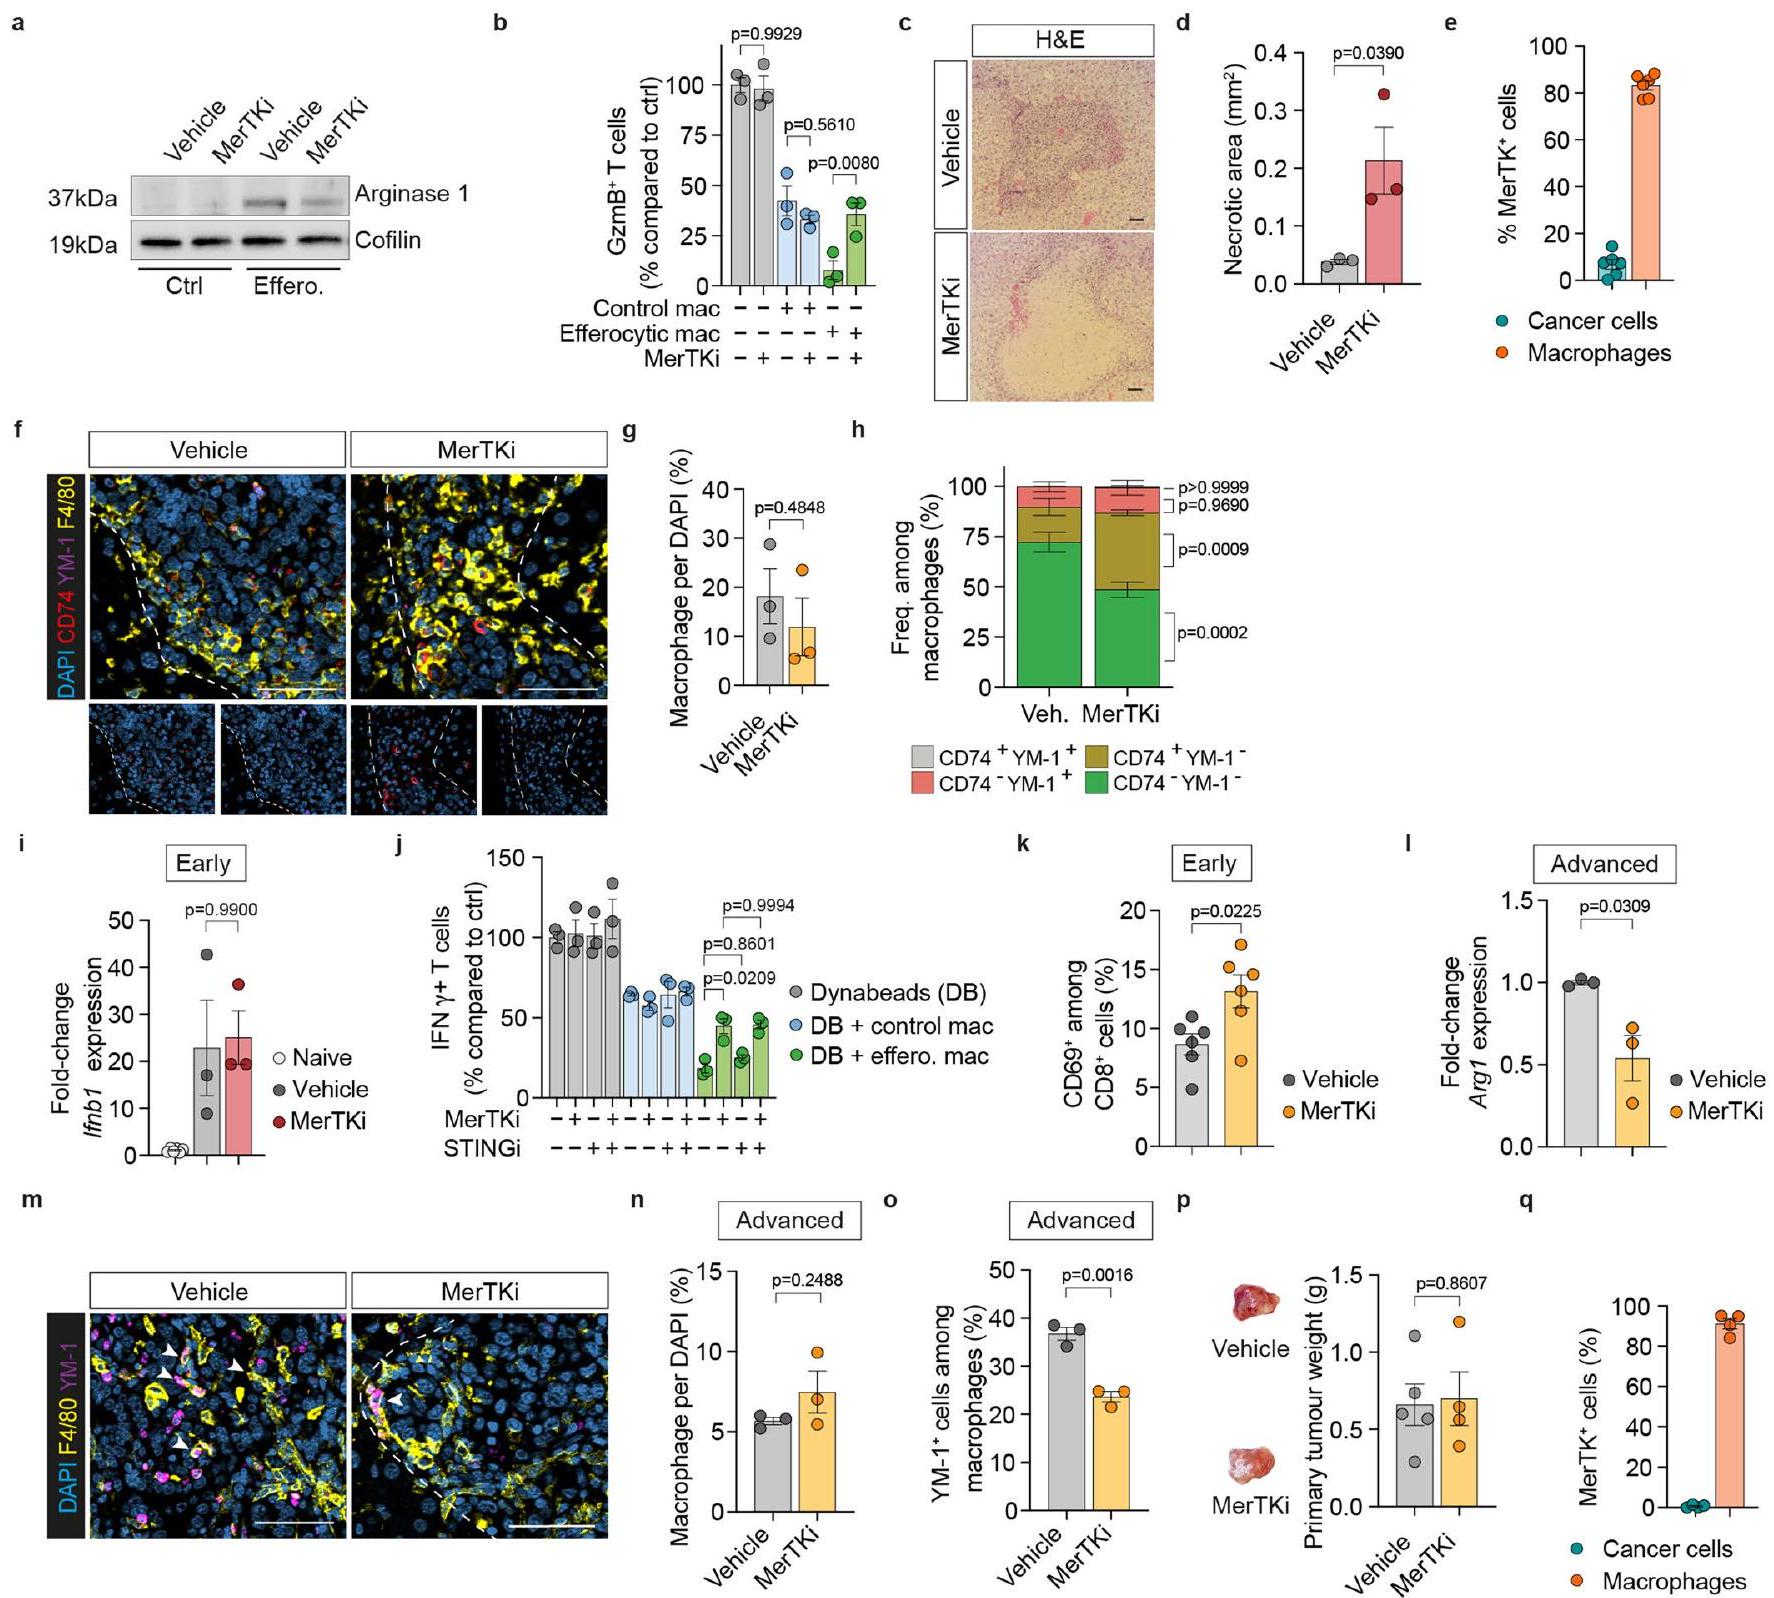
لتقييم الوظيفة البيولوجية لتحويل البلعميات الناتج عن الإيفيروسيتوز في نقائل الكبد الناتجة عن سرطان البنكرياس، قمنا بحظر الإيفيروسيتوز في المختبر باستخدام مثبط لبروتين كيناز التيروزين مير (MerTK)، UNC2250 (MerTKi). كما هو متوقع، قلل MerTKi من الإيفيروسيتوز في البلعميات التي تم زراعتها مع الخلايا التيموسية الميتة (الشكل 4أ، ب) وأزال تحفيز تعبير Arg1 في البلعميات (الشكل 4ج والشكل الإضافي 4أ). علاوة على ذلك، قلل MerTKi من نشاط قمع خلايا T بواسطة البلعميات الإيفيروسيتوزية (الشكل 4د والشكل الإضافي 4ب).
لاختبار هذه النتائج في الجسم الحي، قمنا بتحفيز نقائل الكبد عن طريق زراعة خلايا KPC داخل الطحال، تلاها علاج الحيوانات بمثبط MerTKi لمدة سبعة أيام متتالية (الشكل 4e). كانت المناطق النخرية الكبدية مرتفعة بشكل ملحوظ في الآفات النقيلية المبكرة (d5) في أكباد الفئران المعالجة بمثبط MerTKi، مما يشير إلى تأخير في إزالة الخلايا المبرمجة للموت بسبب ضعف عملية الإيفيروسيتوز (البيانات الموسعة الشكل 4c,d). لم يؤثر إعطاء مثبط MerTKi على عبء الورم النقيل المبكر؛ ومع ذلك، تم العثور على انخفاض كبير في المرحلة المتقدمة (الشكل 4f,g).
بينما تعبر بعض خلايا السرطان عن MerTKوجدنا أن نسبة منخفضة فقط من خط الخلايا المشتق من KPC FC1199 تعبر عن هذا المستقبل (الشكل البياني الممتد 4e)، مما يشير إلى أن MerTKi لا يؤثر على وظيفة خلايا السرطان. على النقيض من ذلك، عبرت الغالبية العظمى من البلعميات عن MerTK (الشكل البياني الممتد 4e). أكدت تحليل MoMs المعزولة انخفاضًا كبيرًا في تعبير Arg1 في الآفات النقيليّة المبكرة عندما تكون عملية الإيفرستوسيس معطلة (الشكل 4h). بينما لم يتأثر عدد MoM، تسبب علاج MerTKi في انخفاض في CD74.وزيادة في CD74 (الشكل 4f-h من البيانات الموسعة).
لقد أظهر تثبيط MerTK تنشيط مسار STING/الإنترفيرون من النوع الأول.لقد لاحظنا زيادة في Ifnb1 بين الأمهات المبكرات؛ ومع ذلك، لم يتأثر ذلك بتثبيط MerTK (الشكل 4i من البيانات الموسعة). علاوة على ذلك، بينما أزال MerTKi الأنشطة المناعية المثبطة لـ
الشكل 3 | موت الخلايا المقيمة في الأنسجة يحفز التحويل المناعي المثبط المدعوم بالاستجابة المناعية في MoMs. أ، صور تمثيلية لصبغة الهيماتوكسيلين والإيوزين (H&E) من نخر الكبد في فئران KPC الأصلية مع سرطان البنكرياس المتقدم قبل النقائل (يسار) و48 ساعة بعد زراعة خلايا KPC في الطحال في فئران WT (يمين). الخطوط المنقطة تحدد المناطق النخرية (N، نخرية؛ H، صحية) (فئران لكل مجموعة، من تجربة واحدة). قضبان القياس،. ب، ج، تم إعطاء الفئران KPC TCM أو DMEM التحكم مرة واحدة يوميًا لمدة 3 أيام. تم جمع الكبد بعد 24 ساعة من آخر حقنة. صور تمثيلية لصبغة H&E للكبد (ب) وتقدير مناطق النخر الكبدي (ج) في الكبد (الفئران لكل مجموعة، من تجربة واحدة). الخط المنقط يحدد المنطقة النخرية. قضبان القياس،أشرطة الخطأ، المتوسطس.م.قيمة، غير مرتبطة ذات طرفين-اختبار. د، مخطط لإنشاء الفئران الهجينة من خلال زراعة خلايا غير موسومة (خلايا BM المتبرع بها إلى tdTالمضيفين (الفئران). e، صور مناعية فلورية تمثيلية لمومس الإيفيروسيت (رؤوس الأسهم،المحتوي على الحطامالخلايا) في شفاء المناطق النخرية (الفئران، من تجربة واحدة). شريط القياس،.
تحليل لـفي خلايا BMMs المزروعة مع الخلايا التيموسية الميتة لمدة 3 ساعات أو بعد الغسل. BMM، البلعميات المشتقة من نخاع العظم. أشرطة الخطأ، المتوسطس.م.التكرارات البيولوجية لكل مجموعة).قيمة، غير مرتبطة ذات طرفين-test.h، صورة تمثيلية لنقل البروتين الغربي لمستويات الأرجيناز 1 و مستوى التحكم في التحميل كوفيلين في خلايا BMMs (تم إجراء التجربة ثلاث مرات مع نتائج مشابهة). i، j، مستويات التنشيط النسبية لـالخلايا، مقاسة كنسب من IFNأو غرانزيم ب (GzmB)، تم تحفيزها باستخدام Dynabeads المرتبطة بـ anti-CD3/ CD28 وتم زراعتها مع MoMs منخفضة/غير موجودة CD74 (F4/80+TIM4-) من كبد اليوم الخامس مقارنةً بالتحكم الذي يحتوي على Dynabeads فقط (التكرارات البيولوجية لكل مجموعة من تجربة واحدة). أشرطة الخطأ، المتوسطس.م.القيم، تحليل التباين الأحادي مع اختبار سيداكس بعد الاختبار. ك، ل، مستويات التنشيط النسبية لـالخلايا، مقاسة كنسب مئوية من IFNأو غرانزيم ب (GzmB)الخلايا (ل)، المنشطة بواسطة كريات دينابيد المرتبطة بمضاد CD3/CD28 والمزروعة مع خلايا بون مار ماكروفاج مقارنةً بالتحكم الذي يحتوي على كريات دينابيد فقطالتكرارات البيولوجية لكل مجموعة). أشرطة الخطأ، المتوسطس.م.القيم، تحليل التباين الأحادي مع اختبار سيداكس بعد الاختبار. لم تُظهر البلعميات النخاعية الخبيثة أي تأثير إضافي عند حجب STING دوائيًا، مما يشير إلى دور غير ضروري لمسارات STING/الإنترفيرون من النوع الأول في هذا السياق (الشكل 4j من البيانات الموسعة).
بالإضافة إلى وفرة أكبر من البلعميات الأقل تثبيطًا للمناعة في الآفات النقيليّة المبكرة للفئران المعالجة بـ MerTKi، وجدنا زيادة ملحوظة في الخلايا المتسللةخلايا T (الشكل 4i، j). من بين هذه، رأينا نسبة أعلى بشكل ملحوظ من الخلايا السامة.خلايا T (الشكل 4i، k) و CD69 المنشطةالخلايا (الشكل 4 ك من البيانات الموسعة). استنفادالخلايا ألغت التأثير المضاد للنقائل لعلاج MerTK (الشكل 41، م) مما يشير إلى أن MerTKi يعمل من خلال زيادة وظائف خلايا T السامة.
من الجدير بالذكر أنه حتى في الأورام النقيلي المتقدمة (d14)، أدى علاج MerTKi إلى تقليل تعبير Arg1 في MoMs (الشكل البياني الممتد 41) دون التأثير على وفرة MoMs بشكل عام (الشكل البياني الممتد 4m,n). علاوة على ذلك، احتوت الآفات المعالجة بـ MerTKi على عدد أقل من YM-البلاعم (الشكل البياني الموسع) )، مما يؤكد أن تثبيط الإيفيروسيتوز في الميتاستاز المبكر يعيق التحول الظاهري لخلايا الماكروفاج المستمدة من الدم (MoMs) خلال تقدم الميتاستاز في الجسم الحي.
تم العثور على تقليل مماثل في عبء الورم النقيلي مع تثبيط MerTK في نموذج النقيليات الكبدية التلقائية (الشكل 4n,0)، بينما ظلت الأورام الأولية غير متأثرة (الشكل التمديدي 4p). لم يكن هناك تعبير عن MerTK في العضوية المشتقة من KPC المستخدمة في
الشكل 4 | يمنع تثبيط الإيفيروسيتوز التحول إلى MoM وانتشار PDAC. أ، ب، صورة فلورية تمثيلية (أ) وقياس الخلايا التائية الميتة الموصوفة بـ CSFE/pHrodo التي تم ابتلاعها في BMMs (ب) (المركبةالخلايا؛ MerTKiالخلايا، تم إجراء التجربة مرتين مع نتائج مشابهة). CFSE، استر السكسينيميديل الكربوكسي فلوريسئين. أشرطة الخطأ، المتوسطس.م.قيمة، غير مرتبطة ذات طرفين-test.c، تحليل qPCR لـفي BMMs (20 ساعة). أشرطة الخطأ، المتوسطس.م. (تحكم/عقار)التحكم/MerTKiالتخلص من الخلايا/ المركبةإيفيروسيتيك / مير تي كيالتكرارات البيولوجية).القيم، تحليل التباين الثنائي مع اختبار سيداكس بعد الاختبار. د، مستوى التنشيط النسبي لـخلية، تقاس كنسب من IFNالخلايا، المنشطة بواسطة كريات دينابيد المرتبطة بـ CD3/CD28 والمزروعة مع خلايا بون مارو المكونة للدم مقارنةً بالتحكم الذي يحتوي على كريات دينابيد فقطالتكرارات البيولوجية لكل مجموعة). أشرطة الخطأ، المتوسطس.م.القيم، تحليل التباين ثنائي الاتجاه مع اختبار سيداكس اللاحق. هـ، مخطط يوضح الجدول الزمني لتجربة MerTKi. و، ز، صور تمثيلية لتصوير الإضاءة الحيوية (BLI) (يسار) وعبء الورم النسبي (يمين) في اليوم الخامس (فئران لكل مجموعة، من تجربة واحدة) (f) أو كبد d14 (g) (تحكمفئران، MerTKiالفئران، من تجربتين). أشرطة الخطأ، المتوسطس.م.القيم، غير مرتبطة ذات طرفين-اختبار. h، تحليل qPCR of Arg1 في MoMs (F4/80+ ) من كبد d5 ( فئران لكل مجموعة). أشرطة الخطأ، المتوسطس.م.قيمة، غير مرتبطة ذات طرفين-اختبار.صور المناعة الفلورية التمثيلية (i) وقياس الكمية الإجمالية (j) والسامة للخلاياالخلايا في كبد d5. تشير الأسهم إلى خلايا ( فئران لكل مجموعة، من تجربة واحدة). قضبان القياس،أشرطة الخطأ، المتوسطس.م.القيم، غير مرتبطة ذات طرفين-اختبار. أنا، مخطط يوضح CD8جدول زمني لتجربة استنفاد الخلايا. م، صور BLI تمثيلية خارج الجسم (يسار) وحمولة الورم النسبية (يمين) لكبد اليوم الرابع عشر (علاج وهمي/IgGفئران، مركبة/ مضاد-CD8مرتك/IgGمرتك/مضاد-CD8، من تجربة واحدة). أشرطة الخطأ، المتوسطس.م.القيم، تحليل التباين ثنائي الاتجاه مع اختبار سيداكس اللاحق. ن، مخطط توضيحي يوضح تجربة MerTKi في نموذج النقائل الكبدية التلقائية. o، صور كبد تمثيلية (يسار) وحمولة الورم في اليوم الأربعين من المجموعات العلاجية المحددة (التحكمفئران، MerTKiالفئران، من تجربة واحدة). أشرطة الخطأ، المتوسطس.م.قيمة، غير مرتبطة ذات طرفين-اختبار. تحليل p، qPCR لـفي MoMs (F4/80+TIM4) من 40 كبد ( فئران لكل مجموعة). أشرطة الخطأ، المتوسطس.م.قيمة، غير مرتبطة ذات طرفين-اختبار. هذا النموذج (الشكل 4q من البيانات الموسعة). كما هو متوقع، تم تقليل تعبير Arg1 في MoMs مع علاج MerTKi (الشكل 4p).
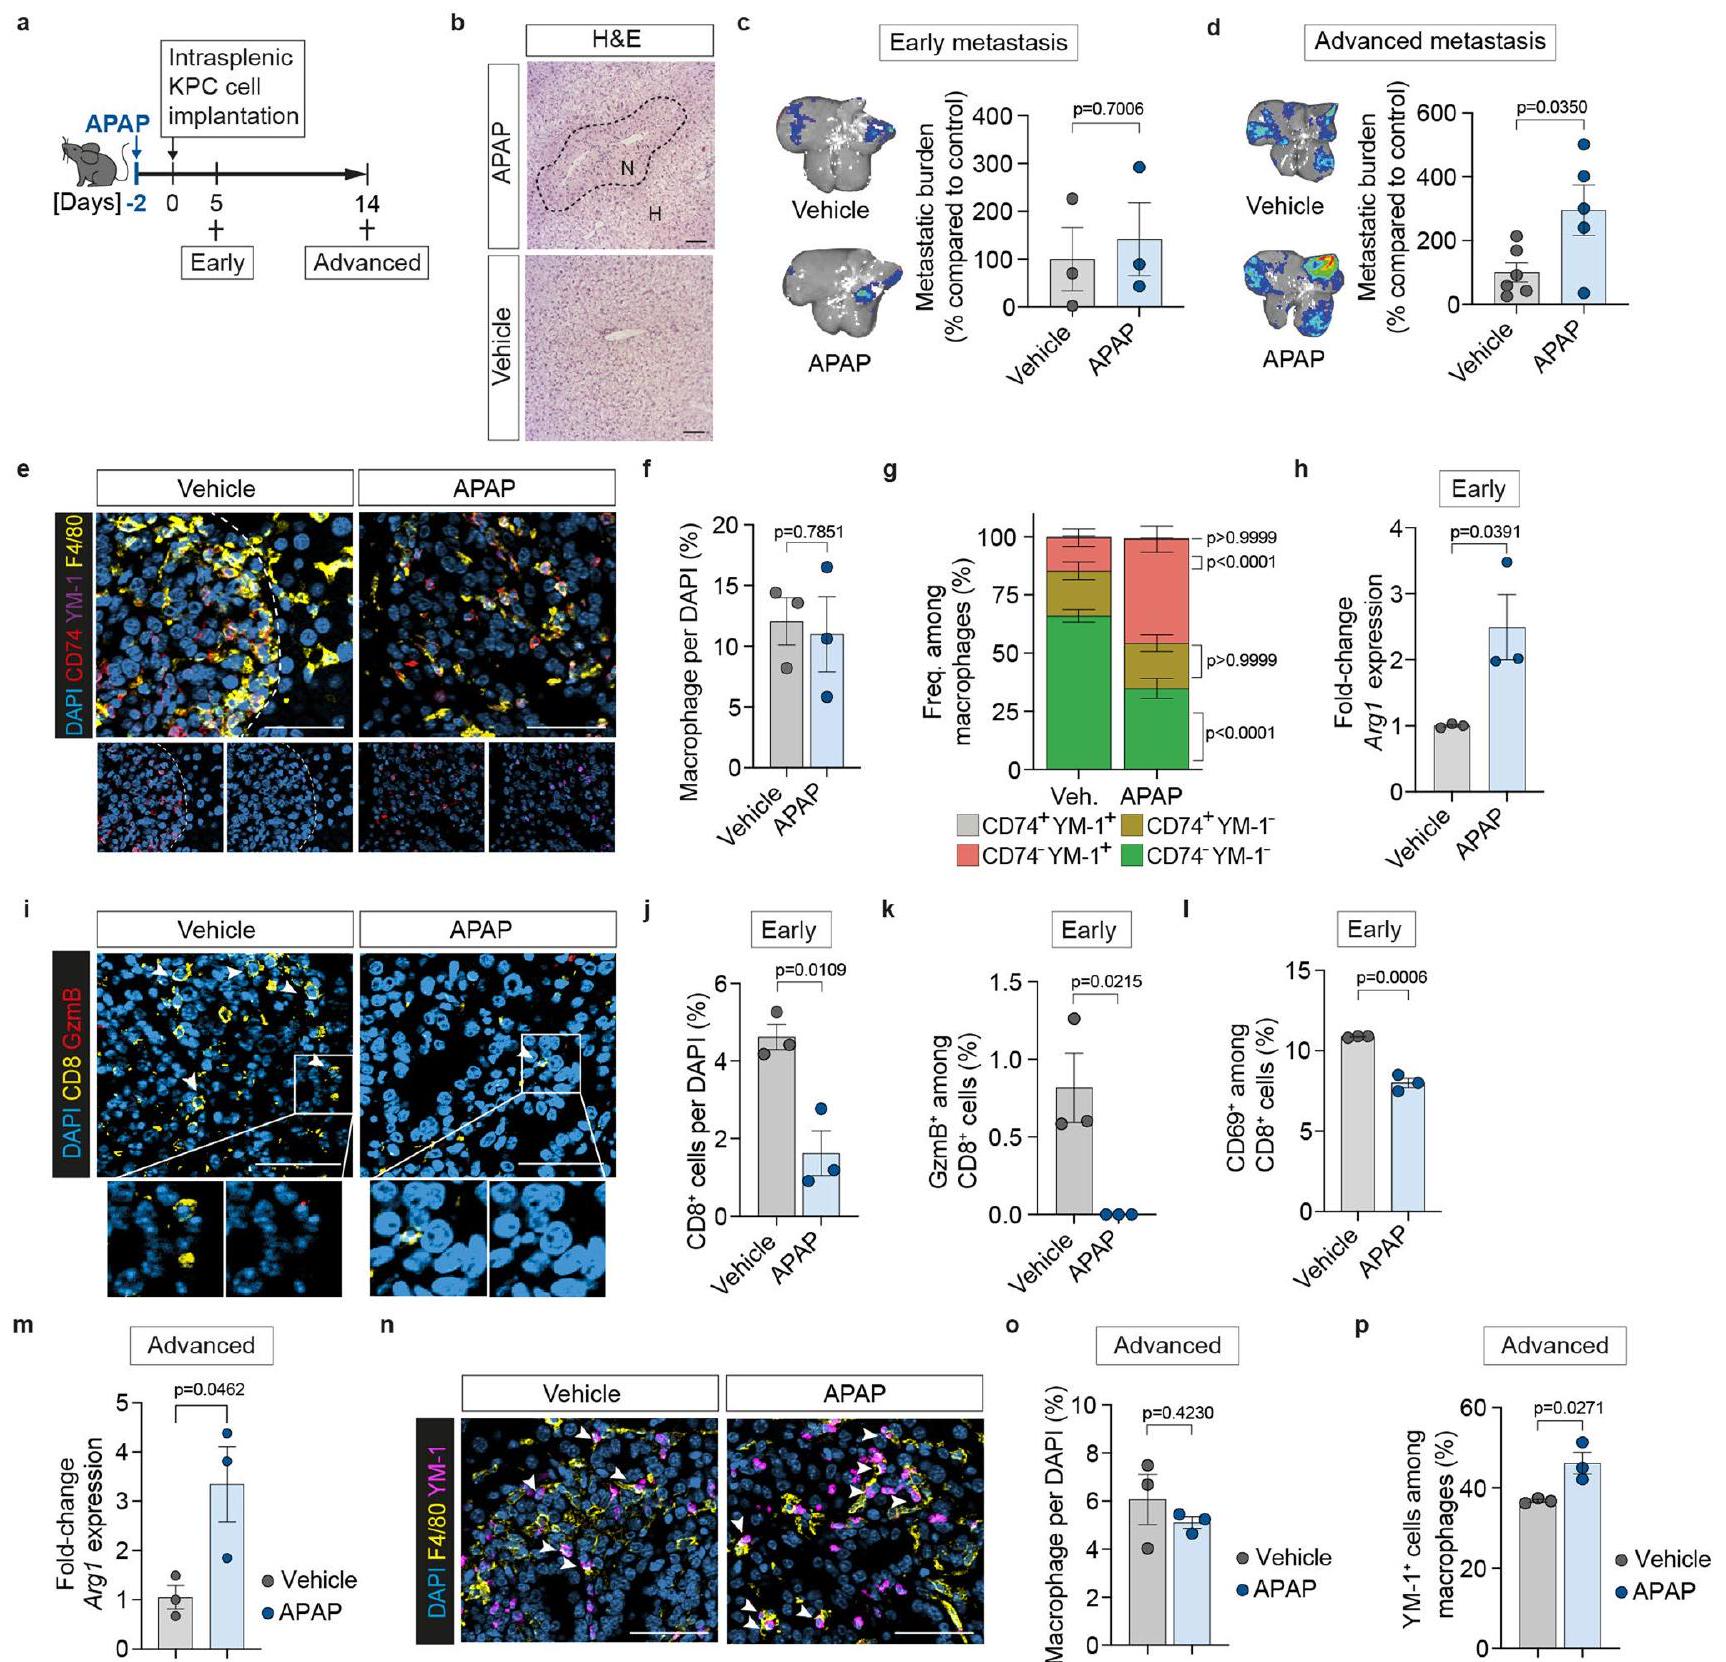
تسبب إصابة الكبد المرتبطة بالنقائل في ظهور نمط MAM المؤيد للورم، لذلك تساءلنا عما إذا كانت إصابة الكبد غير السرطانية تزيد من وجود MAMs المؤيدة للورم، مما يجعل الكبد أكثر قبولاً للنقائل. قمنا بتحفيز إصابة حادة في الكبد باستخدام جرعة واحدة من الباراسيتامول.-أسيتيل-بارا-أمينوفينول؛ APAP). بعد يومين، خضعت الحيوانات لزراعة خلايا سرطان البنكرياس داخل الطحال (الشكل البياني الموسع 5a). كما هو متوقعتسبب تناول الـ APAP في نخر الكبد بعد 24 ساعة من الإعطاء (الشكل 5b من البيانات الموسعة). أظهر العلاج المسبق بالـ APAP تأثيرًا هامشيًا على النمو المبكر للنقائل (الشكل 5c من البيانات الموسعة)، ولكنه أدى إلى زيادة كبيرة في عبء الورم في المرحلة المتقدمة مقارنةً بالعلاج المسبق بالدواء الوهمي (الشكل 5d من البيانات الموسعة). لم يؤثر العلاج المسبق بالـ APAP على CD74.YM-1الخلايا المناعية في الآفات النقيليّة المبكرة (الشكل التوضيحي الإضافي 5e-g) ولكنها قللت من نسبة الخلايا المناعية CD74- YM-1- وزادت من الخلايا المناعية CD74- YM-1+ (الشكل التوضيحي الإضافي 5e-g)، مما يشير إلى تسريع تحويل الخلايا المناعية إلى النمط الشبيه بالمرحلة المتأخرة M2.تم تقليل MoMs مع معالجة سابقة بـ APAP مقارنة بالحيوانات المعالجة بالسيارة (الشكل 5h من البيانات الموسعة)، في حين أن CD8تسلل الخلايا (الشكل البياني الممتد 5i، j) وحالتها السامة/حالة تنشيطها (الشكل البياني الممتد 5i، k، l) كانت منخفضة بشكل ملحوظ. أظهرت الآفات النقيليّة المتقدمة في الفئران المعالجة مسبقًا بـ APAP زيادة مستدامة في تعبير Arg1 (الشكل البياني الممتد 5m)، في حين أن أعداد MoM لم تتغير (الشكل البياني الممتد 5n، 0). كانت النسبة المتزايدة من YM-1تم العثور على البلعميات الكبيرة مقارنة بتلك الموجودة في كبد التحكم المستمد من المركبة (الشكل البياني الموسع 5n، p).
تظهر هذه النتائج أن التحول الناتج عن الإيفيروسيتوزيس في البلعميات يعزز انتشار سرطان البنكرياس إلى الكبد، وأنه يمكن حظر هذه العملية عن طريق تثبيط MerTK.
حذف البروجرانولين يقلل من انتشار سرطان البنكرياس إلى الكبد
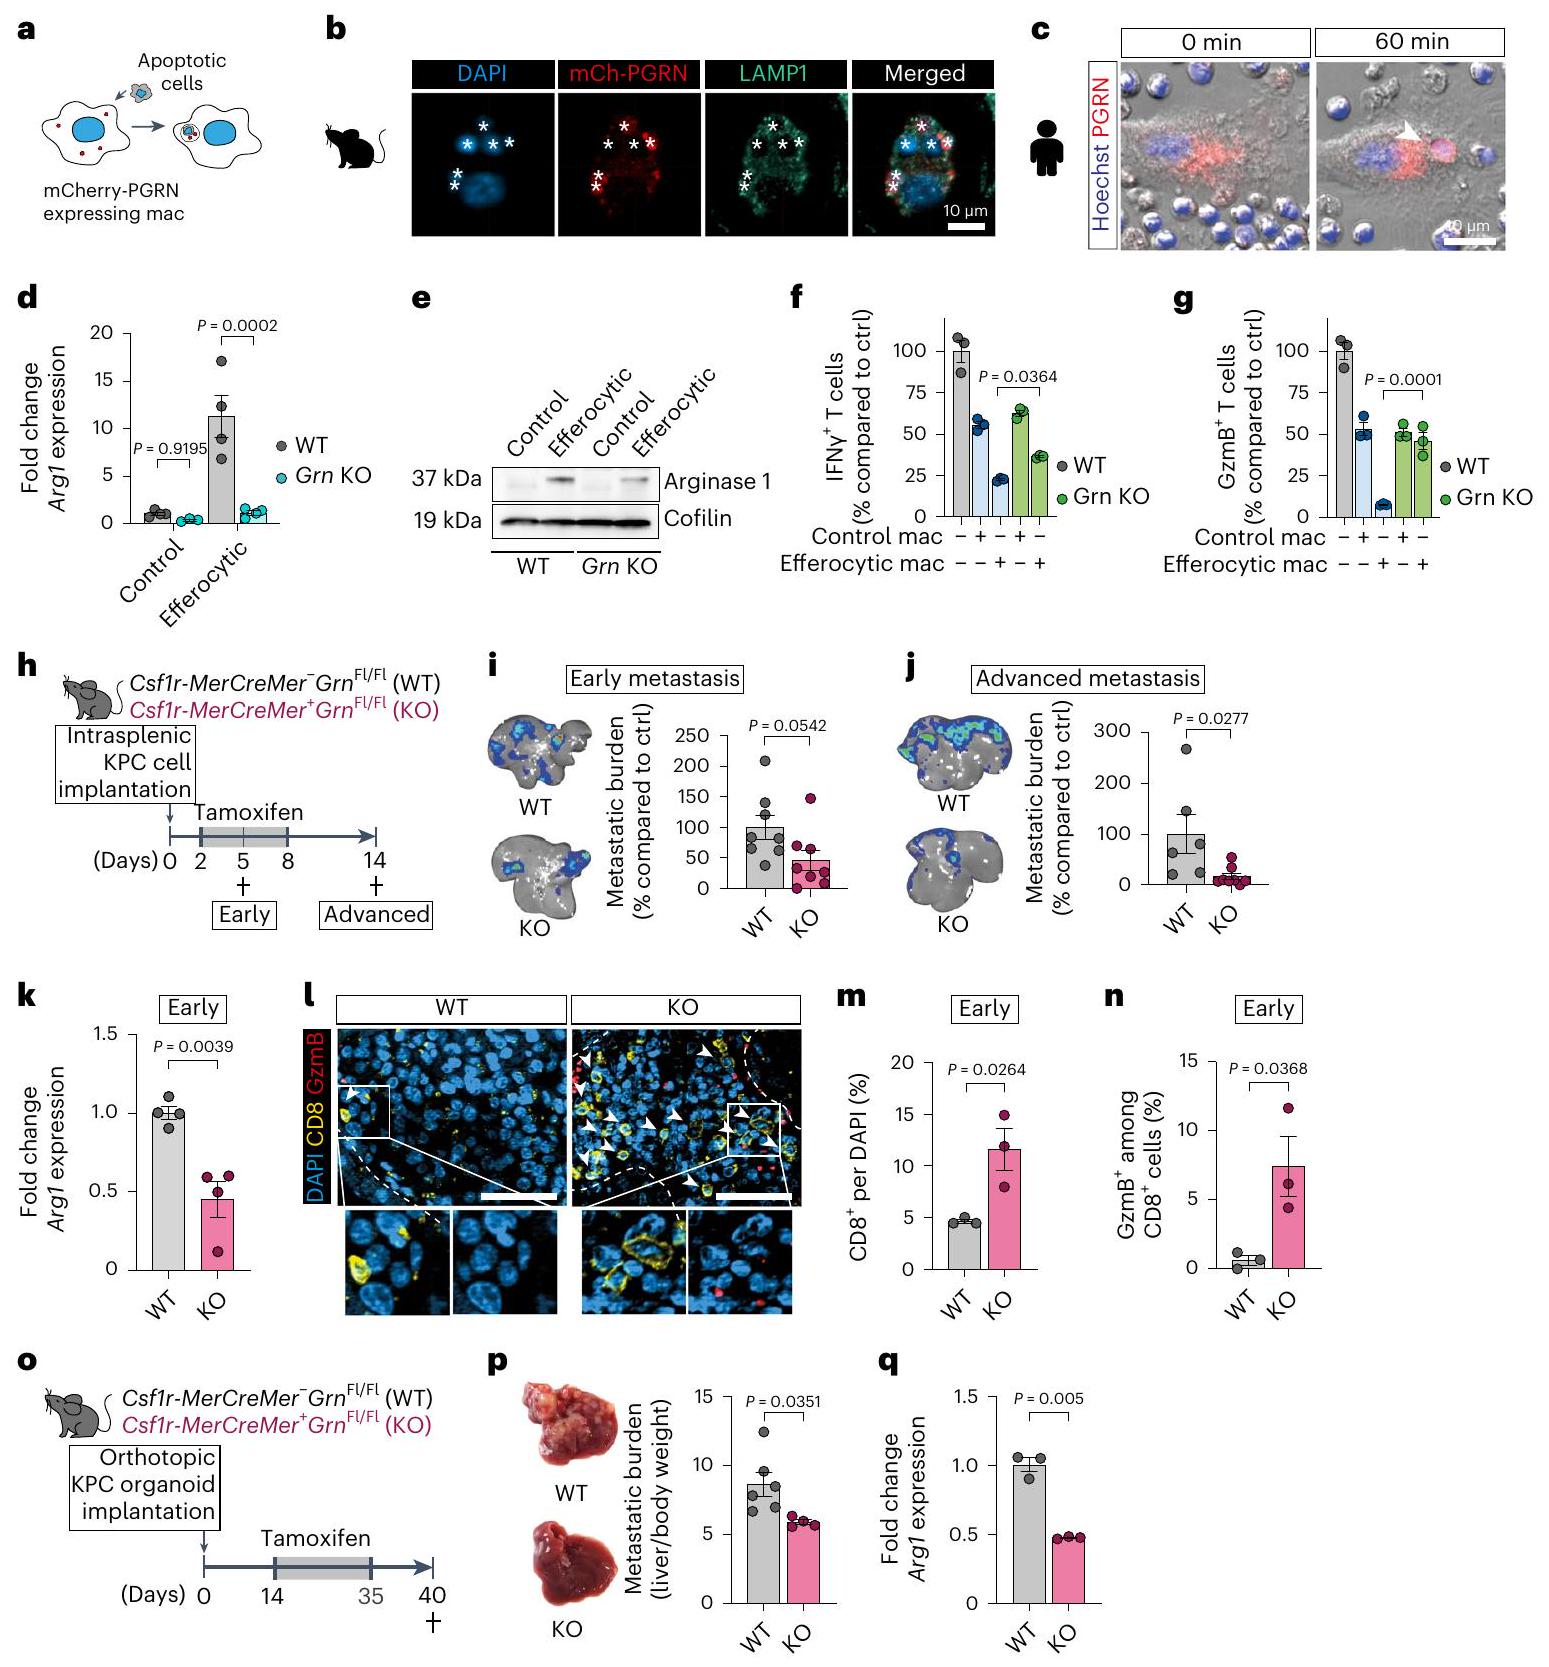
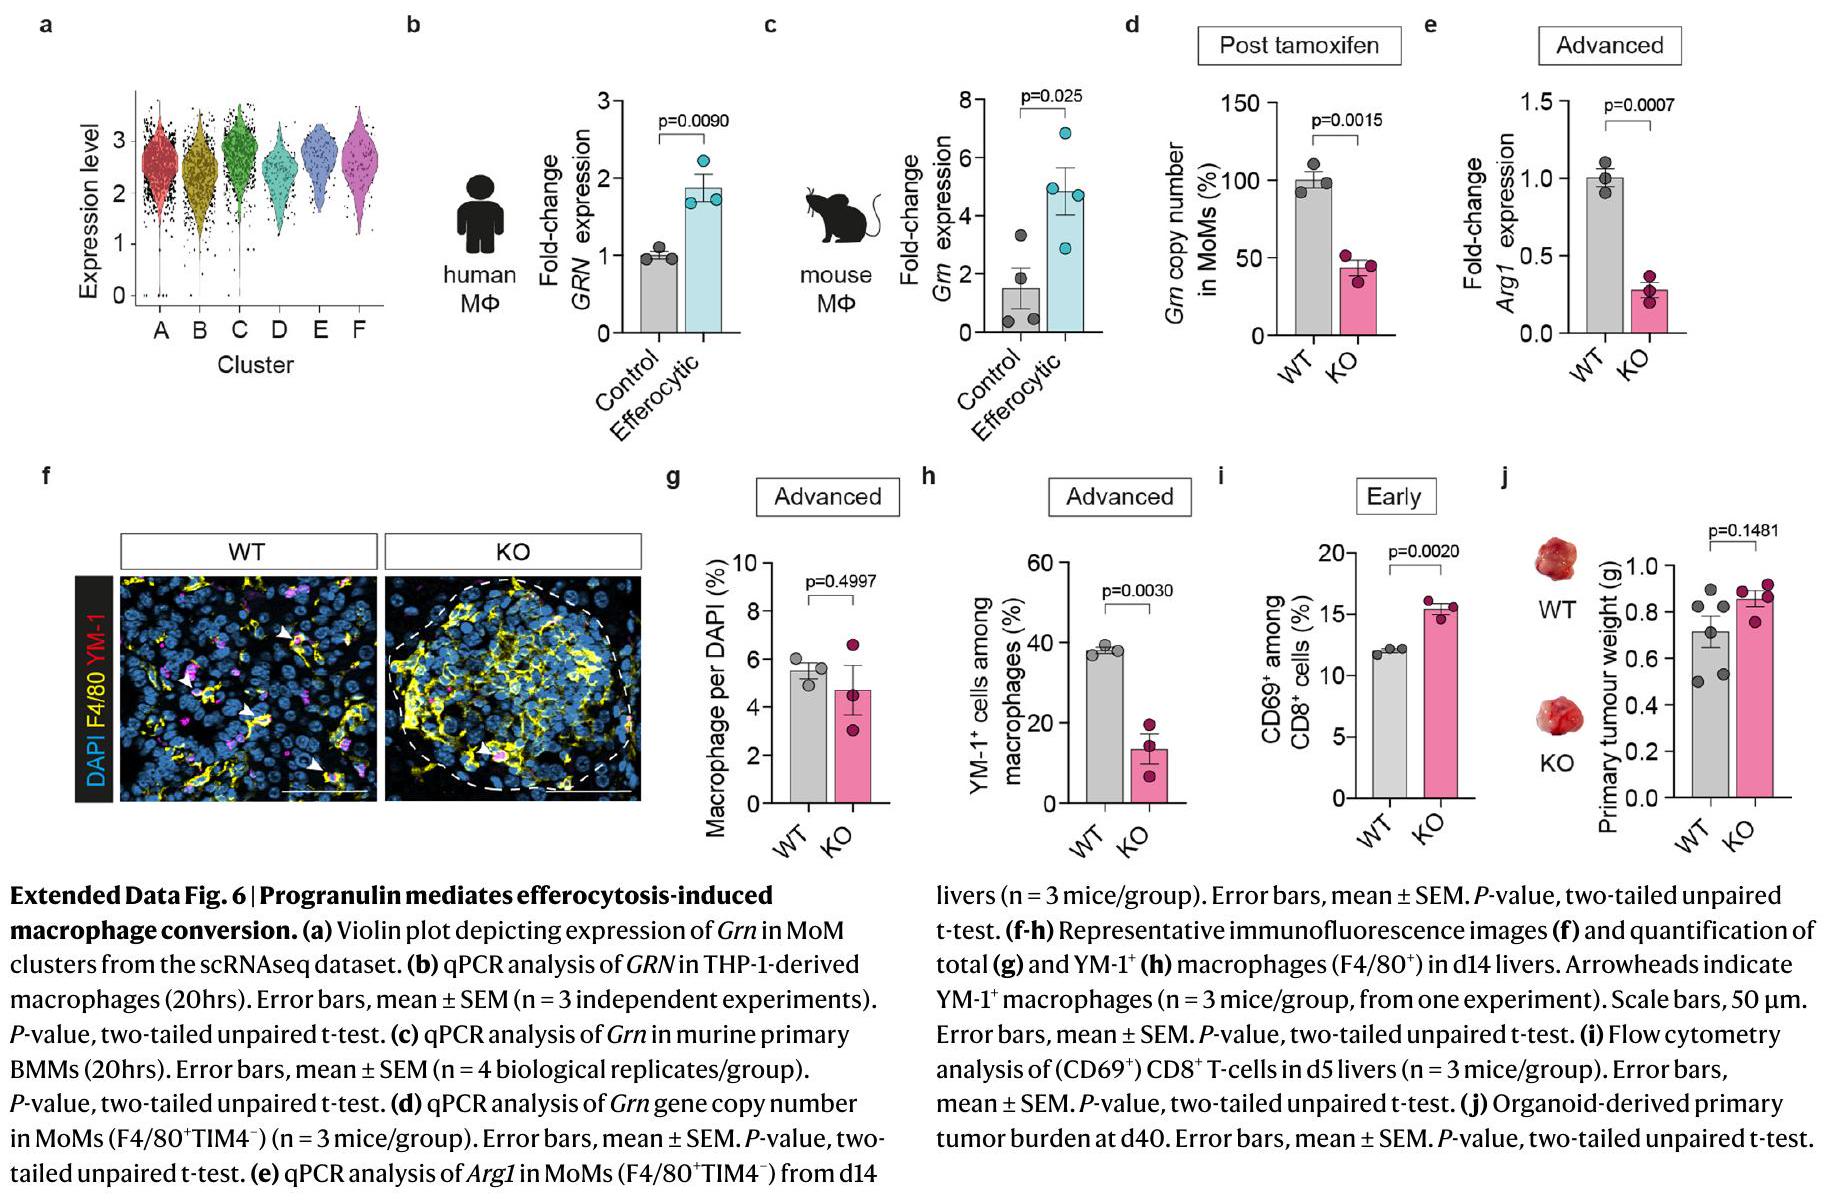
حجب إزالة الخلايا النخرية يؤدي إلى زيادة تلف الأنسجة. قد يكون التدخل في مراحل ما بعد الابتلاع من الإيفيروسيتوز استراتيجية أفضل لقمع استقطاب البلعميات خلال انتشار سرطان البنكرياس إلى الكبد. لتحديد هدف محدد للبلعميات، قمنا بتحليل الجينات الليزوزومية المرتفعة في مجموعة موM المبكرة 2 من تحليل تسلسل RNA أحادي الخلية لدينا. من بين الجينات المرتفعة كان بروجرانولين (Grn) (الشكل التمديدي 6a)، وهو بروتين سابق موجه إلى الحجرة الليزوزومية، حيث يُعتقد أن القطع المقطوعة بروتينيًا المعروفة باسم الجرانولينات ضرورية لوظيفة الليزوزوم في البلعميات.لقد أظهرنا أن البلعميات هي مصدر رئيسي للبروجرانولين في نقائل سرطان البنكرياس إلى الكبد.وأن نقص البروجرانولين مرتبط بأنشطة بلعومية معيبة استجابةً للعدوى البكتيريةافترضنا أن البروجرانولين قد يلعب دورًا حاسمًا في عملية الإيفيروسيتوز التي تتوسطها البلعميات. ووفقًا لفرضيتنا، وجدنا أن الإيفيروسيتوز يحفز التعبير عن Grn في البلعميات البشرية والفأرية الأولية (الشكل التمديدي 6ب، ج) وأن البروجرانولين يتوضع في الحجرة الليزوزومية في هذه الخلايا أثناء الإيفيروسيتوز (الشكل 5أ-ج). بالإضافة إلى ذلك، فإن زيادة التعبير عن Arg1 الناتجة عن الإيفيروسيتوز (الشكل 5د، هـ) وقمع CD8تم تقليل وظيفة خلايا T بشكل كبير في البلعميات التي تفتقر إلى البروجرانولين (الطفرة الجينية Grn (KO)) (الشكل 5f، g).
اختبرنا ما إذا كان استنفاد البروجرانولين المحدد للماكروفاج يؤثر على استقطاب MAM خلال انتشار سرطان البنكرياس إلى الكبد في الجسم الحي. قمنا بزرع خلايا سرطان البنكرياس داخل الطحال في نماذج Csf1r-MerCreMer المشروطة؛ Grn.فئران (KO) مع Csf1r-MerCreMer ؛ Gr (WT) كفئة تحكم. في سلالة KO، يؤدي إعطاء التاموكسيفين إلى استنفاد البروجرانولين في البلعميات. (الشكل 5h والشكل الإضافي 6d). أدى الاستنفاد المحدد للبروجرانولين في البلعميات إلى تقليل كبير في عبء الورم النقيلي في المرحلة المتقدمة (الشكل 5i، j). أدى استنفاد البروجرانولين إلى تقليل تعبير Arg1 في MoMs المعزولة (الشكل 5k). وقد استمر هذا الانخفاض في الميتاستاز المتقدم (الشكل الإضافي 6e) جنبًا إلى جنب مع انخفاض فيالبلاعم، في حين أن وفرة البلاعم ظلت غير متأثرة (الشكل 6f-h من البيانات الموسعة). أدى نقص البروجرانولين في البلعميات إلى زيادة كبيرة في الإجماليأرقام الخلايا (الشكل 51، م)، في السمية الخلويةالخلايا (الشكل 51، ن) وفي الحالة المنشطةالخلايا (الشكل البياني الإضافي 6i) في الكبدات النقيليّة المبكّرة.
أدى نقص البروجرانولين في البلعميات أيضًا إلى تقليل عبء الورم في نموذج النقائل الكبدية التلقائية دون تغيير كبير في الأورام الأولية (الشكل 5o، p والشكل التمديدي 6j). وبشكل متسق، كان تعبير Arg1 في MoMs أيضًا منخفضًا بشكل كبير في هذا النموذج (الشكل 5q).
تظهر هذه البيانات أن تعبير البروجرانولين في البلعميات ضروري لتحويل الخلايا الوحيدة إلى نمط ظاهري مثبط للمناعة نتيجة لعملية الإيفيروسيتوز، مما يدعم بعد ذلك النمو النقيلي لخلايا سرطان البنكرياس في الكبد.
نقص البروجرانولين يؤثر سلبًا على حموضة الليزوزومات
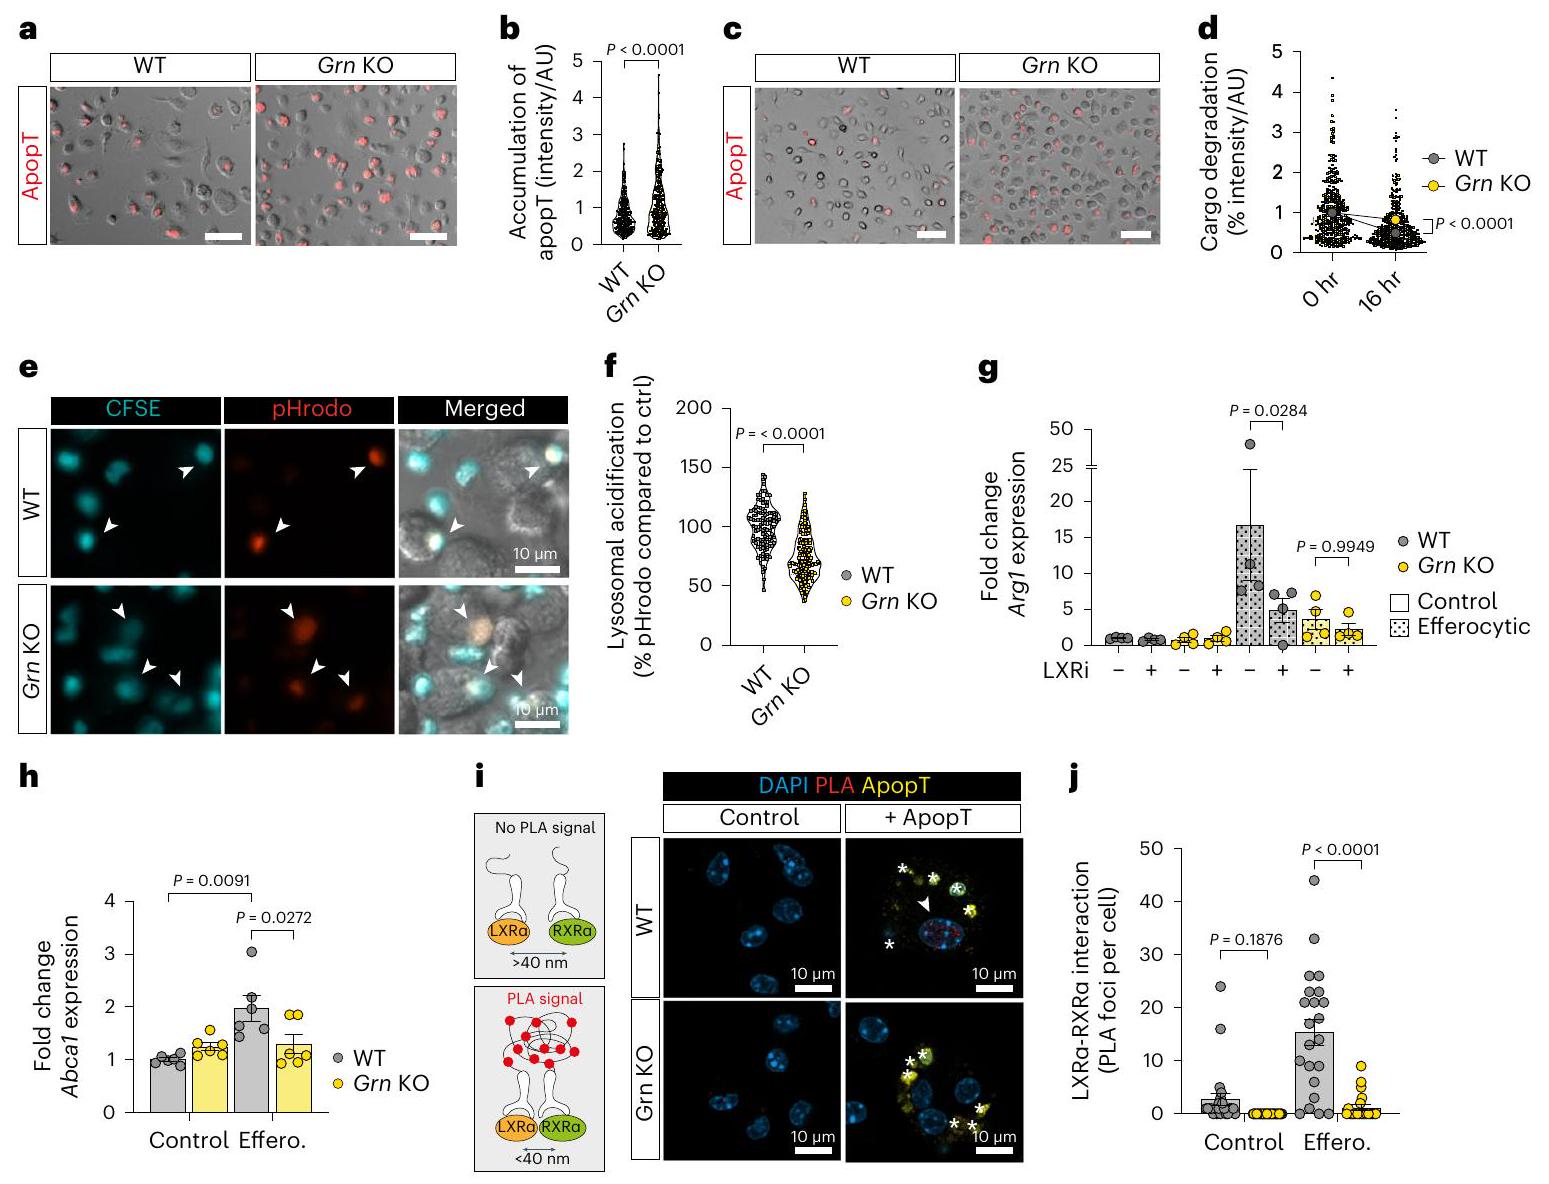
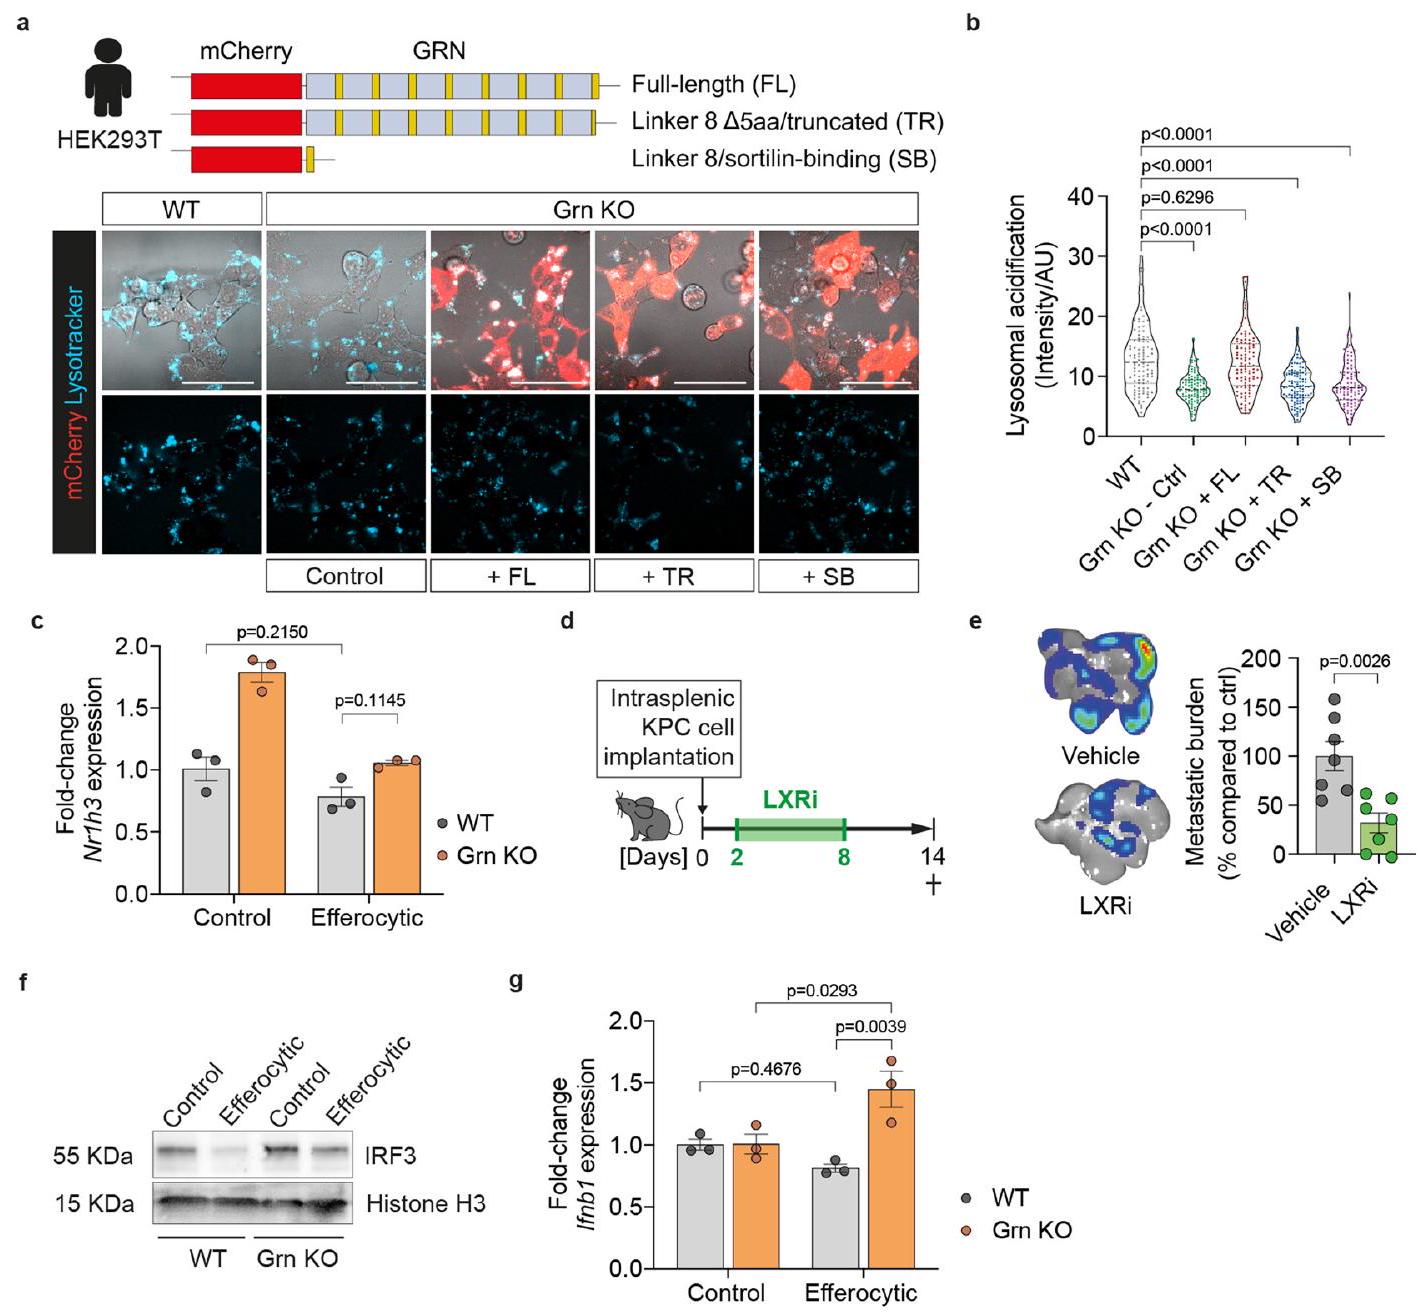
لفهم الوظيفة البيولوجية للبروجرانولين بشكل أفضل، اختبرنا ما إذا كان نقص البروجرانولين يؤثر على الإيفيروسيتوز (التخلص من الخلايا الميتة) للخلايا الميتة المبرمجة و/أو تحللها البروتيني في الجسيمات الحالة. ومن الجدير بالذكر أن البلعميات التي تفتقر إلى البروجرانولين (Grn KO) أظهرت زيادة في تراكم الخلايا الميتة المبتلعة (الشكل 6أ، ب) وزيادة في احتباس الحمولة في حجرة الجسيمات الحالة مع مرور الوقت (16 ساعة) (الشكل 6ج، د). تشير هذه البيانات إلى أن البلعميات التي تفتقر إلى البروجرانولين تستوعب الخلايا الميتة، ولكن معالجة الحمولة في الجسيمات الحالة معطلة. وقد تم الإبلاغ عن أن البروجرانولين ينتقل بواسطة مجاله المرتبط بالسورتيليين إلى حجرة الجسيمات الحالة.ولتنظيم حموضة الليزوزومات خلال البلعمة الذاتيةيتطلب تدمير الحمولة الليزوزومية الفعال درجة حموضة منخفضة في اللمعة.قمنا بقياس حموضة الليزوزوم في WT والبلاعم خلال عملية الإيفيروسيتوز. في النوع البري (WT)، ولكن ليس في البلاعم التي تفتقر إلى البروجرانولين (Grn KO)، انخفض الرقم الهيدروجيني بسرعة وزادت حموضة الحويصلات اللمفاوية في الفاغوليسوزومات استجابةً للإيفيروسيتوز (الشكل 6e، f). في الخلايا التي تفتقر إلى البروجرانولين (GRNKO)، تم استعادة حموضة الحويصلات اللمفاوية إلى مستوى النوع البري عند التعبير الخارجي عن البروجرانولين الكامل المعاد التركيب، ولكن ليس البروجرانولين المقطوع الذي يفتقر إلى مجال ارتباط السورتيلاين أو مجال ارتباط السورتيلاين المعزول (بيانات موسعة الشكل 7a، b).
عند التحلل البروتيني لشحنة الخلايا الميتة داخل الليزوزوم، يتم استشعار منتجات الدهون بواسطة مستقبلات الستيرول النووية مثل LXR.الذي تم الإبلاغ عنه سابقًا لتنظيم تعبير Arg1التثبيط الدوائي لـ LXR (LXRi; GSK-2033) أزال تعبير Arg1 الناتج عن الإيفيروسيتوز في البلعميات WT، لكنه لم يكن له تأثير إضافي على البلعميات KO Grn (الشكل 6g). علاوة على ذلك، LXRالجين المستهدف، Abca1 (المرجع 38)، كان مرتفع التعبير في الخلايا البالعة الطبيعية، ولكن ليس في الخلايا البالعة التي تفتقر إلى الجرانيولين (الشكل 6h)، مما يشير إلى انخفاض LXRالنشاط في البلعمة الخلوية في البلعميات التي تفتقر إلى GRN. في WT، ولكن ليس في البلعميات التي تفتقر إلى GRN، زادت البلعمة الخلوية بشكل ملحوظ من تفاعل LXR. (المشفرة بواسطة Nr1h3) مع شريكها الهتروثنائي RXR (الشكل 6i، j)، في حين ظلت مستويات تعبير Nr1h3 دون تغيير (الشكل التمديدي 7c). بما يتماشى مع زيادة LXRتنشيط في البلعميات الطبيعية الفعالة، الحصار الدوائي لـ LXRتقليل نقائل الكبد في الجسم الحي (الشكل التوضيحي الممتد 7d,e).
تم ربط ضعف إشارات الإيفيروسيتوز مع استجابة مناعية من النوع الأول من الإنترفيرون المضاد للأورام.. وجدنا أن نقص البروجرانولين زاد بشكل كبير من تنشيط استجابة الإنترفيرون من النوع الأول، كما يتضح من المستويات المرتفعة من IRF3 النووي (الشكل التمديدي 7f) وزيادة تعبير Ifnb1 (الشكل التمديدي 7g). تشير بياناتنا إلى أن ضعف وظيفة الليزوزوم في البلعميات التي تفتقر إلى البروجرانولين يوقف LXR-تعبير Arg1 الذي يتم بوساطة ويؤدي إلى تنشيط النوع الأول من الإنترفيرون استجابةً لضعف الإيفرسيطوز.
البروجرانولين ينظم حموضة الليسوزومات عبر CFTR
لتحديد الآلية الجزيئية التي من خلالها ينظم البروجرانولين تحمض الليسوزومات الناتج عن الإيفيروسيتوز، قمنا بتحليل الشركاء المحتملين المرتبطين المدرجين في قاعدة بيانات التفاعل IntAct. وشملت هذه المنظم الناقل عبر الغشاء لمرض التليف الكيسي.
الشكل 5| نقص البروجرانولين يمنع تحويل البلعميات ويقلل من انتشار سرطان البنكرياس إلى الكبد. أ، مخطط يوضح التجربة لتتبع موضع البروجرانولين في البلعميات التي تعبر عن mCherry-PGRN. PGRN، البروجرانولين. ب، صورة تمثيلية للتألق المناعي لـ mCherry-PGRN في الإيفيروسومات (النجوم) من بليعات الفئران.الخلايا، تم إجراء التجربة مرتين مع نتائج مشابهة). شريط القياس،. ج، صورة فلورية تمثيلية لـ mCherry-PGRN في الإيفيروسوم (رأس السهم) من خلايا المناعة البشرية على مر الزمن كما تم تقييمه بواسطة تصوير الخلايا الحية (تم إجراء التجربة مرتين مع نتائج مشابهة). د، تحليل qPCR لـ في BMMs ( التكرارات البيولوجية لكل مجموعة). أشرطة الخطأ، المتوسطس.م.القيم، تحليل التباين ثنائي الاتجاه مع اختبار سيداك بعد الاختبار. هـ، صورة تمثيلية لبلوت الغربي لمستويات الأرجيناز 1 و مستوى التحكم في التحميل كوفيلين في خلايا BMMs (تم إجراء التجربة ثلاث مرات مع نتائج مشابهة). fg، التنشيط النسبي لـخلية، تقاس بنسب من IFNأو غرانزيم ب (GzmB)خلايا T، المنشطة بواسطة Dynabeads المرتبطة بـ anti-CD3/CD28 والمزروعة مع BMMs مقارنةً بالتحكم الذي يحتوي على Dynabeads فقطنسخ بيولوجية لكل مجموعة من واحد
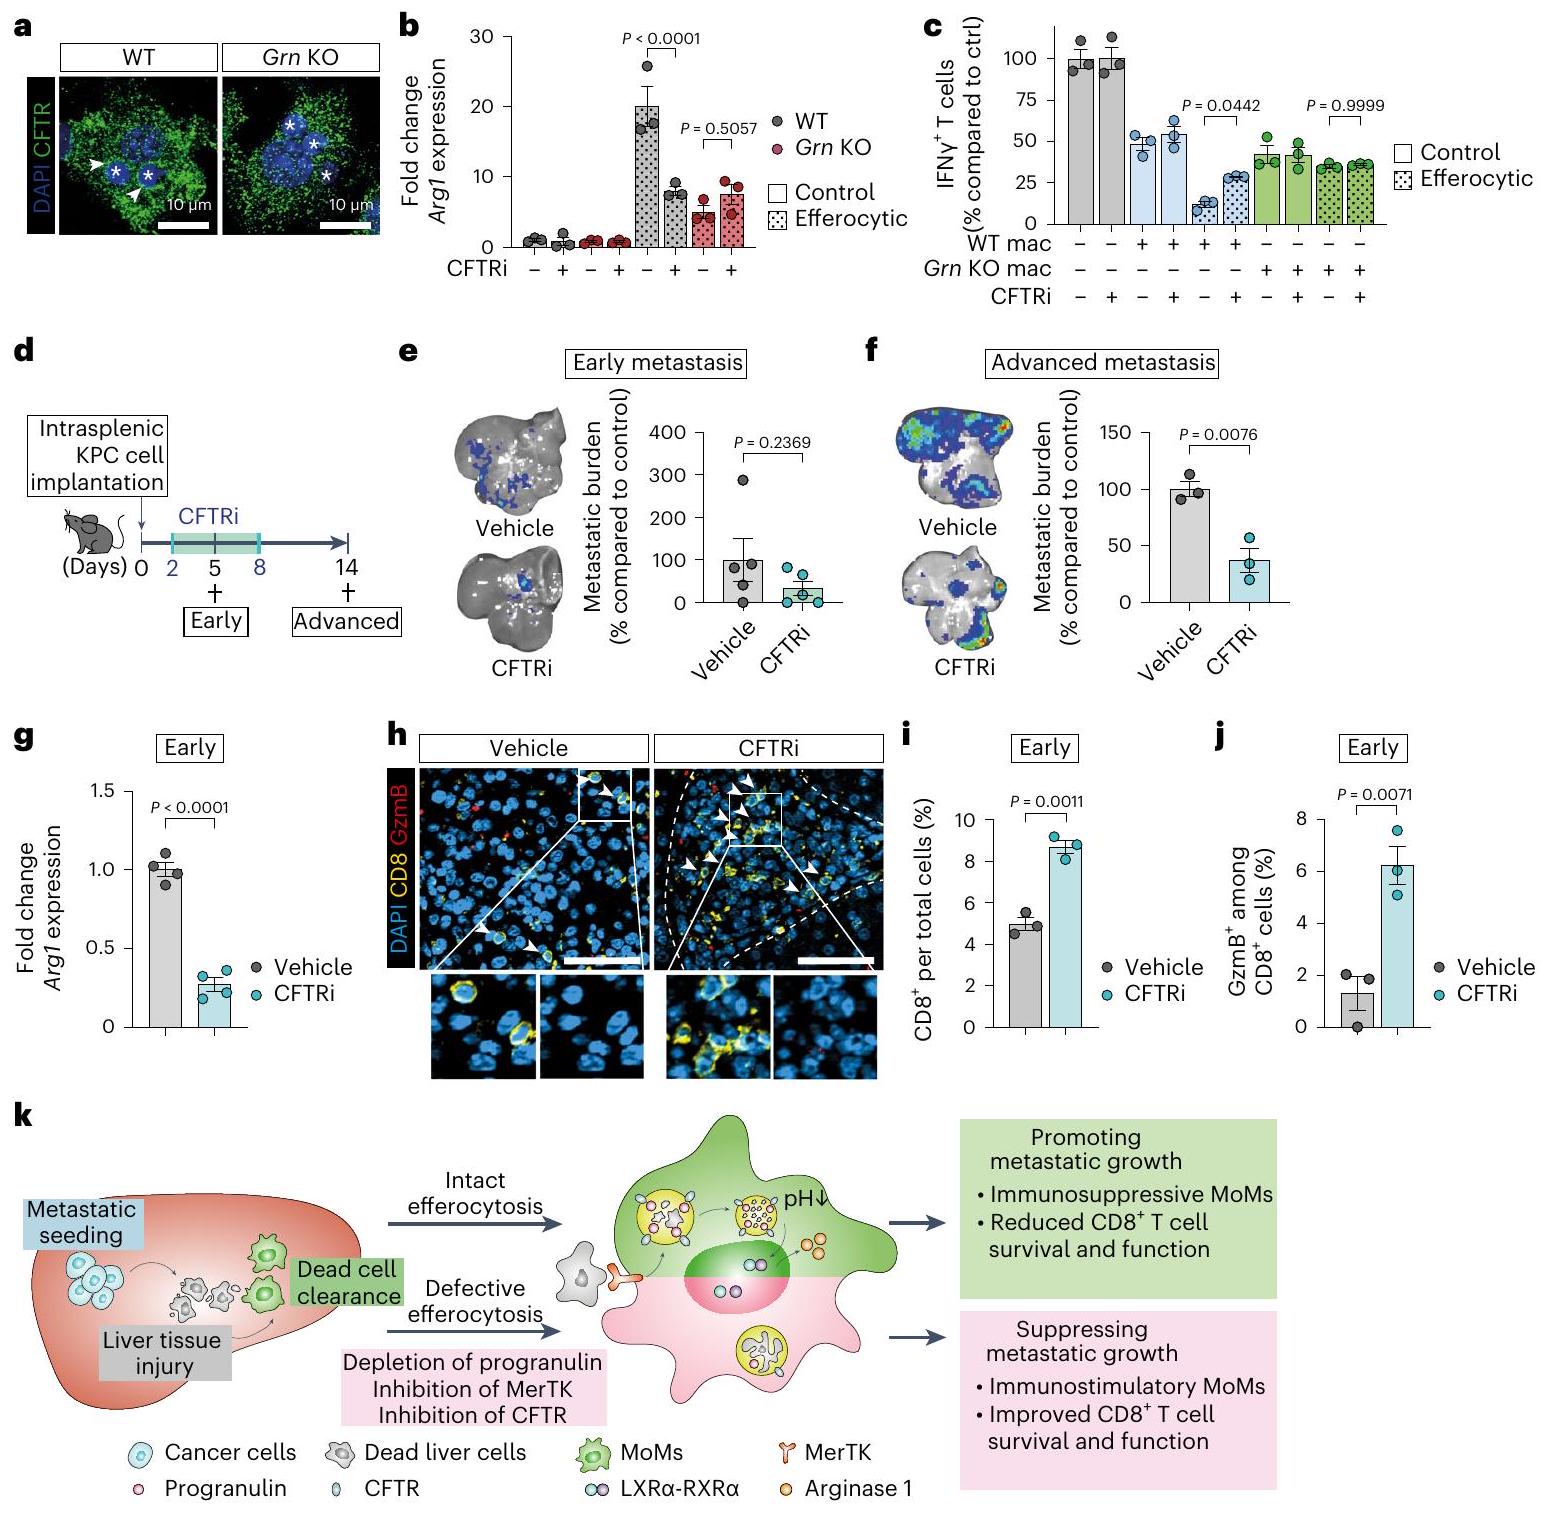
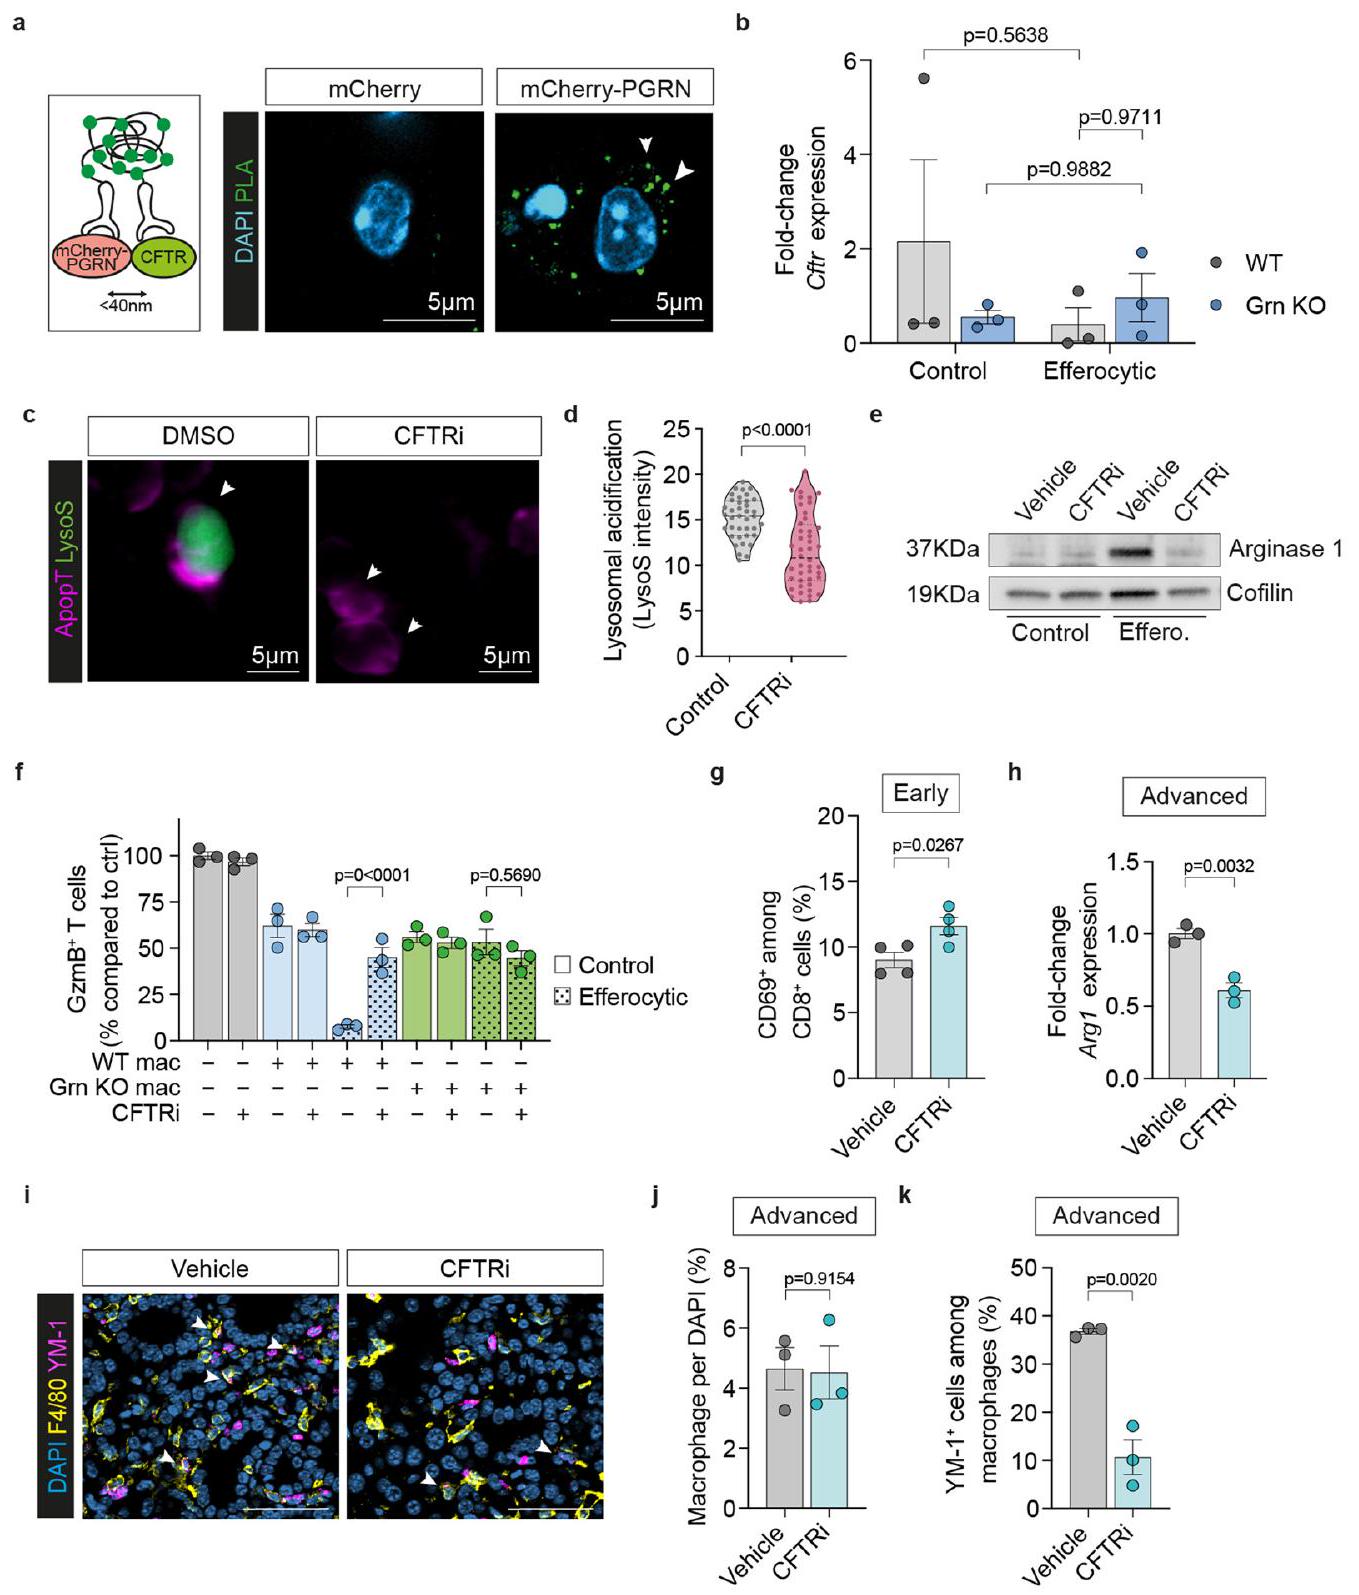
تجربة). أشرطة الخطأ، المتوسطس.م.القيم، تحليل التباين الأحادي الاتجاه مع اختبار سيداكس بعد الاختبار. هـ، مخطط يوضح الجدول الزمني لتجربة KO لـ Grn. و، ز، صور BLI التمثيلية خارج الجسم (يسار) والحمل الورمي النسبي (يمين) في اليوم الخامس (فئران لكل مجموعة، من تجربتين) (i) و d14 (WT،فئران؛ KO،الفئران، من تجربتين) (ج) الكبد. أشرطة الخطأ، المتوسطس.م.القيم، غير مرتبطة ذات طرفين-اختبار. تحليل qPCR لـ Arg1 في MoMs (F4/80+TIM4-) من كبد اليوم الخامس (فئران لكل مجموعة). أشرطة الخطأ، المتوسطس.م.القيم، غير مرتبطة ذات طرفين-اختبار.صور المناعة الفلورية التمثيلية (1) وقياس إجمالي (m) وGzmB السامة للخلاياالخلايا في كبد d5فئران لكل مجموعة، من تجربة واحدة). تشير رؤوس الأسهم إلى CD8الخلايا. قضبان القياس،أشرطة الخطأ، المتوسطس.م.القيم، غير مرتبطة ذات طرفين-اختبار. o، مخطط يوضح تجربة Grn KO في نموذج انتشار الكبد التلقائي. p، صور تمثيلية للكبد (يسار) وحمولة الورم (WT،فئران؛ KO،الفئران، من تجربة واحدة). أشرطة الخطأ، المتوسطس.م.القيم، غير مرتبطة ذات طرفين-اختبار. تحليل qPCR لـفي MoMs (F4/80+TIM4) من كبد d5 ( فئران لكل مجموعة). أشرطة الخطأ، المتوسطس.م.القيم، غير مرتبطة ذات طرفين-اختبار. (CFTR) الذي ينظم حموضة الليزوزومات في البلعميات بعد ابتلاع البكتيرياأكد اختبار الربط القريب للبروجرانولين وCFTR تواجدهم معًا في السيتوبلازم. نقص البروجرانولين يقلل من مستوى CFTR في الليزوزومات (الشكل 7أ)، بينما تظل مستويات تعبيره غير متأثرة (الشكل 8ب).
الشكل 6 | نقص البروجرانولين يعيق حموضة الليسوزومات وتفكيك الحمولة أثناء الإيفيروسيتوز. أ،ب، صور فلورية تمثيلية (أ) وقياس (ب) لامتصاص الخلايا التائية المبرمجة للموت (ApopT) المعلمة بـ CellTrace في خلايا بون مارو المكونة للدم (WT،الخلايا؛ جين غرين KO،الخلايا؛ تم إجراء التجربة مرتين مع نتائج مشابهة). أشرطة الخطأ، المتوسطس.م.قيمة، غير مرتبطة ذات طرفين-اختبار. قضبان القياس،. وحدة عشوائية. ج، صور تمثيلية لبلاعم بون ماري (WT، 0/16 ساعةالخلايا؛ جين غرين KO،الخلايا؛ تم إجراء التجربة مرتين مع نتائج مشابهة) 16 ساعة بعد غسل الخلايا الموصوفة بعلامة CellTrace من الخلايا التائية المبرمجة للموت (ApopT). قضبان القياس،تحديد كمية تحلل حمولات الخلايا التائية الميتة في خلايا بون مارrow الملتهمة كما هو موضح في (ج). أشرطة الخطأ، المتوسطس.م.قيمة، غير مرتبطة ذات طرفين-اختبار. صور الفلورسنت التمثيلية (e) والتquantification (f) لذروة شدة pHrodo في خلايا BMMs المرباة مع الخلايا التائية الميتة الموسومة بـ CFSE/pHrodo (WT،الخلايا؛ جين غرين KO،الخلايا؛ تم إجراء التجربة ثلاث مرات
مع نتائج مماثلة). أشرطة الخطأ، المتوسطس.م.قيمة، غير مرتبطة ذات طرفين-اختبار. تحليل qPCR لـفي BMMs (20 ساعة). أشرطة الخطأ، المتوسطس.م.تكرارات بيولوجية لكل مجموعة).القيم، تحليل التباين الثنائي الاتجاه مع اختبار سيداكس بعد الاختبار. h، تحليل qPCR لـ LXRالجين المستهدففي BMMs (20 ساعة). أشرطة الخطأ، المتوسطس.م.التكرارات البيولوجية لكل مجموعة).القيم، تحليل التباين ثنائي الاتجاه مع اختبار توكي بعده. i، مخطط لاختبار الربط القريب (PLA) لـ LXR و RXR (يسار) وصور الفلورسنت التمثيلية (يمين) لمؤشر PLA المرتبط بالفلوروفور (PLA) في خلايا بون مارو الماكرومولية (BMMs) بعد الحضانة مع الخلايا التيموسية المبرمجة للموت (ApopT، أخضر). تشير النجوم إلى الخلايا المبرمجة للموت التي تم ابتلاعها. ج، قياس بؤر PLA (رأس السهم) في خلايا BMMs من النوع البري أو KO Grn كما هو موضح في i (التحكم WT، الخلايا؛ التحكم في Grn KO،الخلايا؛ الخلايا الفعالة WT،الخلايا؛ غياب جين Grn في الخلايا المبتلعة،الخلايا؛ تم تكرار التجربة ثلاث مرات مع نتائج مشابهة). أشرطة الخطأ، المتوسطس.م.القيم، تحليل التباين ثنائي الاتجاه مع اختبار سيداكس اللاحق.
التثبيط الدوائي لـ CFTR باستخدام CFTRinh172 (CFTRi) أثر بشكل كبير على حموضة الليسوزومات الناتجة عن الإيفيروسيتوز في البلعميات (الشكل التمديدي 8c، d). بالإضافة إلى ذلك، أدى تثبيط CFTR في المختبر إلى تقليل تعبير Arg1 بشكل كبير (الشكل 7b والشكل التمديدي 8e) وألغى الأنشطة المناعية المثبطة المتزايدة للبلعميات WT الإيفيروسيتية، لكنه لم يظهر أي تأثير على البلعميات التي تفتقر إلى البروجرانولين (الشكل 7c والشكل التمديدي 8f).
لتقييم تأثير تثبيط CFTR على نقائل سرطان البنكرياس في الكبد، قمنا بزراعة خلايا سرطان مستمدة من KPC داخل الطحال تلاها علاج بتثبيط CFTR أو التحكم الوهمي لمدة سبعة أيام متتالية (الشكل 7d). تسبب تثبيط CFTR في تقليل كبير في عبء الورم النقائلي في المرحلة المتقدمة (الشكل 7e,f). تماشيًا مع نتائجنا في المختبر، أدى إعطاء CFTRi إلى تقليل كبير في مستويات تعبير Arg1 في MoMs (الشكل 7g)، وزيادة CD8تسلل خلايا T (الشكل 7هـ، و) وتنشيطها (خلايا T) في الأورام النقيليّة المبكّرة (الشكل 7i,j والشكل الإضافي 8 g).
في المراحل المتقدمة من الانبثاث، أظهرت الفئران المعالجة بـ CFTRi انخفاضًا مستمرًا في تعبير Arg1 في MoMs (الشكل 8h من البيانات الموسعة) وتثبيط تحويل البلعميات، كما يتضح من العدد الإجمالي المنخفض لـ YM-1.البلاعم داخل الآفات النقيليّة (الشكل البياني الممتد 8i-k). معًا، تُظهر نتائجنا أن البروجرانولين ينظم حموضة الليزوزومات في البلاعم عبر CFTR وأن الحصار الدوائي لحموضة الليزوزومات باستخدام مثبط CFTR يمنع نمو النقيليات الكبدية لسرطان البنكرياس (الشكل 7k).
نقاش
باستخدام تقنية تسلسل RNA أحادي الخلية (scRNA-seq) ونهج تعليم الخلايا في الموقع، نكشف عن التباين المكاني والزماني للبلاعم في نقائل سرطان البنكرياس في الكبد. نؤكد أن أصل الأنسجة للبلاعم يلعب دورًا رئيسيًا في تحديد موقع هذه الخلايا ووظيفتها في الأورام الكبدية النقيلية. البلاعم المستقطبة (MoMs) (TIM4/VSIG4) وخلايا كبدية مقيمة في الأنسجة (TIM4) تتوسع خلال تقدم المرض النقيلي؛ ومع ذلك، فإن MoMs تقع داخل آفات الورم النقيلي، في حين أن KCs توجد في الغالب عند المحيط. تتماشى نتائجنا مع الدراسات
الشكل 7| تثبيط CFTR المنظم بواسطة البروجرانولين يعيق استقطاب البلعميات الناتج عن البلع. أ، صور تمثيلية للتألق المناعي لـ CFTR في البلعميات البلعومية (تم إجراء التجربة مرتين مع نتائج مشابهة). تشير النجوم إلى الخلايا التائية الميتة المبتلعة. ب، تحليل qPCR لـ Arg1 في البلعميات البلعومية (20 ساعة). أشرطة الخطأ، المتوسطس.م.التكرارات البيولوجية/المجموعة).القيم، تحليل التباين ثنائي الاتجاه مع اختبار سيداكس اللاحق. ج، مستوى التنشيط النسبي لـخلايا T، مقاسة كنسب من IFNالخلايا، المنشطة بواسطة كريات دينابيد المرتبطة بـ CD3/CD28 والمزروعة مع خلايا بون مار مكونة من ماكروفاجات مقارنةً بالتحكم الذي يحتوي على كريات دينابيد فقطالتكرارات البيولوجية لكل مجموعة من تجربة واحدة). أشرطة الخطأ، المتوسطس.م.القيم، تحليل التباين الأحادي الاتجاه مع اختبار سيداكس بعد الاختبار. د، مخطط يوضح الجدول الزمني لتجربة CFTRi. صور BLI التمثيلية خارج الجسم (يسار) وعبء الورم النسبي (يمين) في اليوم الخامس (فئران لكل مجموعة، من تجربة واحدة) (هـ) وكبد d14 (و)فئران لكل مجموعة، من تجربتين). أشرطة الخطأ، المتوسطس.م.القيم، اختبار t غير المقترن ذو طرفين. ج، تحليل qPCR لـفي خلايا المناعة (F4/80) من كبد d5 ( فئران لكل مجموعة). أشرطة الخطأ، المتوسطس.م.قيمة، غير مرتبطة ذات طرفين -اختبار.صور المناعة الفلورية التمثيلية ) وقياس الإجمالي (i) وGzmB السامة للخلايا الخلايا في كبد d5فئران لكل مجموعة، من تجربة واحدة). تشير رؤوس الأسهم إلىخلية. قضبان القياس،أشرطة الخطأ، المتوسطس.م.قيمة، غير مرتبطة ذات طرفين-test.k، مخطط رسومي يلخص دور البلعميات المفرطة في انتشار سرطان البنكرياس إلى الكبد. خلال المرحلة المبكرة من الانتشار، يؤدي انبثاق خلايا السرطان إلى إصابة الكبد مما يؤدي إلى إزالة حطام الخلايا الميتة بواسطة البلعميات المشتقة من وحيدات النواة (MoMs) عبر مستقبل MerTK. يتم تحلل الخلايا الميتة المبتلعة في تجويف الفاجوليزوزوم الحمضي، وهي عملية تعتمد على حموضة الليزوزوم بواسطة البروجرانولين (PGRN) و CFTR. بعد التحلل الفعال للحمل الخلوي الميت في الليزوزوم، LXRيتم تنشيطه ويحفز التعبير عن عامل تثبيط خلايا T، الأرجيناز 1. إن تقليل عدد خلايا T وتنشيطها بواسطة الأرجيناز 1 يسهل في النهاية نمو النقائل. يمكن تحقيق ضعف في هذه العمليات وكبح نمو الورم من خلال استنفاد البروجرانولين أو حجب وظائف MerTK أو CFTR. إظهار إثراء البلعميات المقيمة في الأنسجة المجاورة للورماستعمار الكبد بواسطة خلايا السرطان يحفز خلايا كوفرت (KCs) على إظهار نمط التهابي يتم الحفاظ عليه طوال تقدم النقائل (المجموعة 1 و4). في مراحل لاحقة من النقائل، يكتسب مجموعة فرعية من خلايا كوفرت توقيعًا مؤيدًا للتليف (المجموعة 4)، مما قد يساهم في تنشيط خلايا الكبد النجمية/الألياف في الآفات المتقدمة وبالتالي يساعد في الحفاظ على النسيج الدسْموبلاستي في سرطان البنكرياس القنوي. الانتقال. تماشياً مع هذه النتائج، تم الإبلاغ مؤخرًا عن نمط ظاهري مسبب للتليف في البلعميات المقيمة في سرطان البنكرياس الغدي الأولي وأنواع أخرى من السرطان.تتطلب التغيرات التي لاحظناها في تجمعات خلايا KC استجابةً للأورام النقيلية دراسات مستقبلية لتفكيك الوظائف البيولوجية لهذه البلعميات في نقائل الكبد الناتجة عن سرطان البنكرياس. بالنظر إلى تجمعات MoM، تتواجد الأنماط الظاهرية المناعية المحفزة والمثبطة في الآفات النقيلية المبكرة والمتقدمة. ومن الجدير بالذكر أن الأنماط الظاهرية يحدث التحول نحو نوع فرعي مثبط للمناعة في المراحل المبكرة والمتقدمة من النقائل. تشير بياناتنا إلى أن خلايا موما يتم استقطابها باستمرار إلى موقع النقائل حيث تفقد بسرعة قدرتها على تحفيز المناعة.
في الأورام الصلبة، أظهرت استراتيجيات استهداف الماكروفاجات الشاملة باستخدام مثبطات CSF-1 كعامل وحيد نشاطًا متواضعًا جدًا أو عدم نشاط.ستؤدي الاستراتيجيات المستهدفة للماكروفاجات الشاملة حتماً إلى إزالة الماكروفاجات المناعية المحفزة والمثبطة. تدعم نتائجنا تطوير أساليب مخصصة في المستقبل، تستهدف تجمعات الماكروفاجات المثبطة للمناعة أو المنظمات التي تتحكم في تحويل الماكروفاجات نحو مجموعة مثبطة للمناعة.
على الرغم من فهمنا المتزايد لتنوع البلعميات، إلا أن العوامل التي تؤدي إلى استقطاب البلعميات من حيث الشكل والوظيفة في البيئة الدقيقة النقيليّة لم تُوضح بالكامل. يمكن أن تؤدي وجود الخلايا الميتة في البيئة الدقيقة للورم إلى تحفيز حالة مثبطة للمناعة في البلعميات.في الفسيولوجيا الطبيعية، تعتبر عملية الإزالة بواسطة الإيفيروسيتوز (efferocytosis) التي تقوم بها البلعميات (macrophages) لإزالة الحطام والخلايا الميتة أساسية في التخفيف من الالتهاب خلال مرحلة الشفاء بعد الإصابة ومنع تلف الأنسجة المزمن.وبالتالي، يتم استخدام الإيفيروسيتوزيس فسيولوجيًا لحماية أنسجة المضيف من الهجوم المناعي، مما يؤدي إلى تثبيط المناعة المحلي. هنا، نوضح أن خلايا السرطان النقيلي تستولي على هذه المسارات المحفوظة تطوريًا والمترابطة لإنشاء بيئة ميكروية مثبطة للمناعة في الكبد، مما يسمح لخلايا السرطان المنتشرة بالهروب من الكشف المناعي والنمو.
يُقال إن البلعميات المقيمة في الأنسجة أكثر بلعمة من البلعميات المشتقة من نخاع العظام.; تشير ملاحظتنا إلى أن خلايا المناعة المتعددة (MoMs) تتجمع في المواقع النخرية وقادرة على ابتلاع الخلايا الساكنة الميتة. يمكن تحقيق عكس الحالة المناعية المثبطة الناتجة عن الإيفيروتوزيس عن طريق تثبيط مستقبل الفوسفاتيديل سيرين MerTK. إن حجب ابتلاع MerTK للخلايا السرطانية الميتة يثبط نمو الورم في أنواع أخرى من السرطان.في دراسة واحدة، أدى حجب MerTK إلى إضعاف إزالة الخلايا الميتة بواسطة البلعميات، مما زاد من تراكم أجسام الخلايا الميتة وأدى إلى تنشيط مسار STING في البلعميات عبر cGAMP/ATP.لقد لاحظنا تنشيط مسار STING في غياب تثبيط MerTK، على الأرجح بسبب التراكم العالي للخلايا الميتة خلال إصابة الكبد الناتجة عن النقائل. وبما يتفق مع ذلك، فإن إصابة الكبد تحفز مسار STING في ظل ظروف غير سرطانية..
بالإضافة إلى مستقبلات TAM، مثل MerTK، يمكن للبلاعم أن ترتبط بالخلايا الميتة عبر مستقبلات الفوسفاتيديل سيرين الأخرى، مثل CD300 أو CD36 (المرجع 5). نظرًا للعديد من متغيرات مستقبلات الإيفيروسيتوز، قمنا بفحص ما إذا كان استهداف المسار الفاجوليزوزومي السفلي يمكن أن يثبط الحالة المناعية المثبطة الناتجة عن الإيفيروسيتوز في البلاعم. ومن الجدير بالذكر أن امتصاص تراكم الدهون خارج الخلوية قد أظهر مؤخرًا أنه يحفز نمطًا مناعيًا مثبطًا في البلاعم.بينما يتم معالجة الدهون المبتلعة من خلال الآلية الليزوزومية، قد يؤدي إعاقة وظيفة الليزوزوم إلى تثبيط تحويل البلعميات الناتج عن الدهون، مما يمثل نقطة تفتيش ناشئة لوظائف البلعميات.
البروجرانولين هو بروتين ليسوزومي منظم للمناعةلقد أظهرنا أن البروجرانولين له تأثيرات مؤيدة للورم وينشط الخلايا الليفية في نقائل الكبد المتقدمة لسرطان البنكرياس.في هذه الدراسة، كان استنفاد البروجرانولين في البلعميات الملتهمة كافياً لمنع زيادة تعبير Arg1 واستعادة تنشيط خلايا T. من الناحية الآلية، ينظم البروجرانولين حموضة الليزوزومات، عبر CFTR، وهو ما يتطلب لمعالجة مثلى لشحنة الخلايا الميتة والـ LXR اللاحق.-تنظيم مفرط لـ Arg1 بواسطة الوسائط (الشكل 7م). وبالتالي، CFTR أو LXRتؤدي المثبطات أيضًا إلى تحويل البلعميات وتحفيز خلايا T. ستكون هناك حاجة إلى مزيد من الدراسات لاستكشاف ما إذا كان استهداف الإيفيروسيتوز (MerTK) أو التحلل الليزوزومي (بروجرانولين/CFTR) أو LXR في المراحل اللاحقة.التفعيل سيكون مفيدًا، بالاشتراك مع العلاج الكيميائي السام للكبد أو العلاجات المناعية المعتمدة على نقاط التفتيش، لاستغلال الاستجابات المناعية المضادة للأورام المتزايدة.
باختصار، أظهرت نتائجنا أن انتشار سرطان البنكرياس إلى الكبد يؤدي إلى تنوع في الخلايا البلعمية، وأن مجموعات فرعية تعزز الانتشار وأخرى تقيده تتواجد معًا في الكبد النقيلي، وأن التدخل في عملية بلع الخلايا الميتة بواسطة الخلايا البلعمية، أو في أحداث الإشارات اللاحقة لها، يمنع الوظائف المناعية المثبطة للخلايا البلعمية ويستعيد المناعة المضادة للورم. قد يكون استهداف بلع الخلايا الميتة بواسطة الخلايا البلعمية استراتيجية علاجية جديدة جذابة للمرضى الذين يعانون من سرطان البنكرياس النقيلي.
طرق
بيان الأخلاقيات
تتوافق هذه الدراسة مع جميع اللوائح الأخلاقية ذات الصلة. تم الوصول إلى الدراسات التي تتضمن استخدام خزعة من نقائل الكبد وعينات دم من مرضى يعانون من سرطان البنكرياس المتقدم غير المعالج باستخدام منصة دراسة PINCER، المعتمدة من لجنة الأخلاقيات الوطنية للبحوث في شمال غرب إنجلترا، REC15/NW/0477. قدم جميع الأفراد موافقات خطية مستنيرة وفقًا للبروتوكول المؤسسي المعتمد. تم إجراء جميع الدراسات الحيوانية وفقًا للوائح وزارة الداخلية البريطانية بموجب ترخيص المشروع P16F36770.
فئران
تم إيواء الفئران في ظروف خالية من مسببات الأمراض المحددة في وحدة العلوم الطبية الحيوية بجامعة ليفربول. تم الحصول على فئران C57BL/6 من مختبرات تشارلز ريفر.(B6(Cg)-جرين ), جرين (C57BL/6-Grn ) و tdTomato فئران (B6.129(Cg)Gt(ROSA)26Sorتم شراء جميعها على خلفية جينية C57BL/6 من مختبر جاكسون. تم توفير فئران Csf1r-Cre القابلة للتحفيز بواسطة التاموكسيفين (BL6-Tg(Csf1r-cre/Esr1*)1Jwp/J) على خلفية C57BL/6 بلطف من مختبر J.W. Pollard (جامعة إدنبرة). بالنسبة للدراسات الحيوانية، كانت الفئران الإناث في سنتم استخدام فئران بعمر أسابيع، باستثناء دراسة Grn KO في نموذج النقائل الكبدية التلقائية، التي استخدمت ذكور الفئران. لم يتم تجاوز الحد الأقصى لحجم الورم البالغ 1.5 سم في المتوسط. في جميع الدراسات الحيوانية، كانت الشدة محدودة عند مستوى معتدل.
نموذج KPC الأصلي
KPC (كراس; تر ب53 ; فئران Pdx1-Cre) على مزيج تم تربية سلالات C57BL/6 النقية في المنزل في معهد بيتسون التابع لمؤسسة أبحاث السرطان في المملكة المتحدة (CRUK) وتم الحفاظ عليها مع تحسين البيئة، والوصول إلى طعام قياسي وماء بحرية. تم إجراء جميع التجارب على الحيوانات تحت ترخيص من وزارة الداخلية البريطانية وتمت الموافقة عليها من قبل مجلس رعاية الحيوانات والأخلاقيات بجامعة غلاسكو. تم إجراء تحليل الجينات بواسطة ترانسنيتيكس. تم جمع الأنسجة بعد تطور الورم الأولي أو في نقطة زمنية إنسانية.
الخلايا
تم عزل خط خلايا سرطان البنكرياس الفأري KPC FC1199 (المقدم بلطف من مختبر توفيسون، مختبر كولد سبرينغ هاربور) من أنسجة أورام PDAC لـ KPC (Kras; ; تم توثيق فئران Pdx1-Cre على خلفية نقية من C57BL/6 كما تم الإبلاغ عنه سابقًا. KPCتم إنتاج الخلايا باستخدام pHIV Luc-ZsGreen (هدية من ب. ويلم، جامعة يوتا؛ بلازميد Addgene 39196) من خلال عدوى الفيروسات القهقرية. تم اختيار الخلايا المصابة لمستويات عالية من تعبير ZsGreen باستخدام جهاز فرز الخلايا FACSAria III (BD Biosciences). تم الحصول على خطوط الخلايا البشرية HEK293T (CRL-3216)، THP-1 (TIB-202) و Jurkat (TIB-152) من ATCC. تم حضانة خلايا THP-1 مع 50 نانومتر من فوروبيول 12- ميريستات 13-أسيتات (PMA) لمدة 72 ساعة لتوليد البلعميات المشتقة من THP-1.
تم الحفاظ على جميع خطوط الخلايا في RPMI (لـ THP-1 و Jurkat) أو DMEM (للبقية) معززة بـمحلول FBS والمضاد الحيوي المضاد للفطرياتالبنسلينستربتوميسين وأمفوتيريسين ب) (سيغما) وتم اختبارها سلبياً لميكوبلازما. خطوط الخلايا المستخدمة في هذه المقالة غير مدرجة في لجنة توثيق خطوط الخلايا الدولية والمركز الوطني لـ
قاعدة بيانات عينات البيولوجيا الجزيئية للمعلومات عن خطوط الخلايا المعرّفة بشكل خاطئ.
تم إنتاج خلايا بون مارو الماوسية الأولية عن طريق غسل نقي العظام من عظام الفخذ والساق، تلاها الحضانة مع M-CSF الفأري (Peprotech) لمدة 5 أيام. تم إنتاج خلايا المناعة البشرية الأولية عن طريق عزل الخلايا الوحيدة النواة من الدم المحيطي (PBMCs) باستخدام الطرد المركزي بالتدرج، تلاها الحضانة مع مستخلص M-CSF البشري (بيبرتيك) لمدة 7 أيام.
عزل وزراعة الأعضاء العضوية للفأر
تم عزل خلايا الأعضاء الكبدية النقيليّة من KPC (Kras); تر ب53 ; فئران Pdx1-Cre) على خلفية C57BL/6 مع انتشار متقدم في الكبد باستخدام طريقة تم وصفها سابقًاباختصار، تم تقطيع أنسجة الكبد النقيلي وهضمها فييستخدملاجنز كروود نوع الحادي عشرديباز II لـ، تليها عملية هضم إضافية باستخدام TrypLE وعندلمدة 10 دقائق. بعد ذلك، تم زراعة الخلايا المهضومة في ماتريجيل منخفض عوامل النمو (كورنينغ) وزرعت في وسط تغذية متقدم DMEM/F12 (ثيرمو فيشر) يحتوي على A83-01 (توكرس)، (ثيرمو فيشر)، FGF-10 (بيبرتيك)غاسترين I (توكريس) (Peprotech)، 1.25 مللي مولار N -أسيتيل سيستين (سيغما)، 10 مللي مولار نيكوتيناميد (سيغما)، -وسط يحتوي على سبوندين ومكمل B27 (ثيرمو فيشر). عندما تم عزل الأورغانويد لأول مرة، أو إذابته أو تفكيكه إلى خلايا مفردة، تم إضافة 10.5 مللي مولار Y-27632 للمرور الأول.
نماذج نقائل الكبد
تم تحفيز نقائل الكبد التجريبية عن طريق حقنفي PBS إلى الطحال. لدراسة تسلسل RNA أحادي الخلية، تم تحفيز تكوين الورم الأولي عن طريق حقن البنكرياس بـفي ماتريجيل. بعد عشرة أيام من الزرع، عندما وصلت الأورام الأولية إلى 200تم تحفيز نقائل الكبد عن طريق حقنفي PBS إلى الوريد البابي. تم قتل الفئران في النقاط الزمنية المحددة وتم قياس عبء الورم النقيلي في الكبد كإجمالي التدفق من خلال تصوير البيولومينسنس الخارجي باستخدام نظام تصوير IVIS spectrum (PerkinElmer).
تم تحفيز نقائل الكبد العفوية عن طريق زراعةخلايا الأورغانويد الكبدية لسرطان البنكرياس النقيلي في ماتريجيل إلى البنكرياس.
زراعة الخلايا الجذعية
المستقبل tdTomatoتم تعريض الفئران لإشعاع بقوة 10 غراي، تلاه حقن في الوريد الذيل بـخلايا نخاع العظم من المتبرع C57BL/6. بعد حوالي 4 أسابيع من الزرع، تم تقييم إعادة تكوين نخاع العظم بواسطة قياس التدفق لخلايا الدم المحيطية. الفئران التي لديها مستوى من الكيميريةتم حقنهم داخل الطحال بخلايا KPC لتحفيز انتشار السرطان في الكبد. في اليوم الخامس بعد الزرع، تم جمع الكبدات للتحليل.
TCM
لإعداد TCM، تم زراعة خلايا KPC إلىالتقاء، بعده تم التخلص من الوسط واستبداله بوسط منخفض المصل (وسط FBS). بعد 24 ساعة، تم جمع الوسط وحقنه فيإلى الوريد الذيل من C57BLفئران.
علاجات الأدوية
تم إعطاء مثبط MerTK UNC2250 (APExBIO) فيجرعة عن طريق التغذية الفموية مرة واحدة يوميًا في دراسات الانبثاث التجريبية ومرة واحدة كل يومين في دراسة الانبثاث التلقائي. بالنسبة لـ CD8دراسة استنفاد خلايا Tمضاد CD8 للفأر (نسخة 2.43، BioXcell) أو التحكم في نوع IgG2b (BioXcell) تم إعطاؤه عن طريق الحقن داخل الصفاق كل 3 أيام. لتحفيز إصابة الكبد، تم إعطاء جرعة واحدة ( ) من تم إعطاء -أسيتيل-بارا-أمينوفينول (APAP، سيغما) عن طريق الحقن داخل البطن قبل يومين من تحفيز انتشار الكبد. بالنسبة لـ Csf1r-Cre; غرنف و Csf1r-Cre;جرنتم إعطاء التاموكسيفين عن طريق التغذية الفموية في الدراساتجرعة واحدة يوميًا في نموذج الانبثاث التجريبي وجرعة واحدة كل يومين في الانبثاث التلقائي نموذج النقائل. LXRتم إعطاء مثبط GSK-2033 (Axon Medchem) مرة واحدة يوميًا عن طريق الحقن داخل الصفاق بجرعة منتم إعطاء مثبط CFTR CFTRinh172 (Selleckchem) عن طريق الحقن داخل البطن بجرعة منمرتين في اليوم.
عزل خلايا الكبد
تم إعداد تعليقات الخلايا المفردة من كبد الفئران عن طريق التكسير الميكانيكي والإنزيمي معكولاجيناز P (روش) في محلول ملح هانك المتوازن عندلـثم تم حضن الخلايا معتريبسين عندلمدة 5 دقائق. بعد إزالة الحطام عن طريق تصفية تعليق الخلايا من خلالتمت إزالة خلايا الدم الحمراء باستخدام محلول تحليل خلايا الدم الحمراء (BioLegend).
تدفق الخلايا وفرز الخلايا
تم إعداد تعليقات الخلايا المفردة من الكبد كما هو موضح أعلاه، تلتها إعادة التعليق في محلول MACS. BSA، 2 مليمول EDTA و PBS) والت incubating مع مضاد الفأر CD16/CD32 (BD Biosciences) لمدة 10 دقائق على الثلج. لتلوين سطح الخلايا، تم تحضين الخلايا مع علامة حيوية SYTOX Blue (Thermo Fisher) والأجسام المضادة المرتبطة بالفلوروفور (BioLegend؛ الجدول التكميلي 4).
بالنسبة لاختبار تنشيط خلايا T، بعد حجب مستقبلات Fc، تم حضانة الخلايا باستخدام مجموعة صبغة خلايا ميتة FIXABLE AQUA LIVE/DEAD (ثيرمو فيشر) وأجسام مضادة CD8 المرتبطة بالفلوروفور (بايو ليجند). ثم تم تثبيت الخلايا باستخدام محلول تثبيت IC وتم اختراقها باستخدام محلول غسل الصبغ داخل الخلايا (بايو ليجند) وفقًا لتعليمات الشركة المصنعة، تلا ذلك صبغ مع IFN المرتبط بالفلوروفور.وأجسام مضادة للجرانزيم B (BioLegend؛ الجدول التكميلي 4). لقياس الخلايا التائية الميتة، تم حضن الخلايا مع Apotracker Green (BioLegend) لمدة 20 دقيقة وتم تلوينها مع جسم مضاد CD8 (BioLegend).
تم الحصول على بيانات تحليل التدفق الخلوي باستخدام جهاز FACS Canto II (BD Biosciences) باستخدام برنامج FACSDiva (BD Biosciences) وتم تحليلها باستخدام برنامج FlowJo v. 10 (استراتيجيات التصفية في الأشكال التكميلية 1-6). تم فرز الخلايا باستخدام جهاز فرز الخلايا FACS Aria III (BD Biosciences). تم فرز البلعميات إلى محلول RLT.-ميركابتوإيثانول وفقًا لتعليمات الشركة المصنعة لعزل RNA (QIAGEN) أو في DMEM المدعوم بـFBS لاختبار تنشيط خلايا T.
اختبار الإيفيروسيتوز
قبل التحليل، تم زراعة خلايا BMMs الفأرية الأولية أو خلايا MoMs البشرية في وسط خالٍ من M-CSF وخلايا THP-1 في وسط خالٍ من PMA لمدة 24 ساعة. تم تحفيز موت الخلايا المبرمج في الخلايا التيموسية الفأرية الأولية أو الخلايا اللمفاوية البشرية أو خلايا Jurkat باستخدامستاورسبورين لمدة 24 ساعة. تم إضافة الخلايا المبرمجة للموت إلى البلعميات بنسبة 10:1 (الخلايا المبرمجة للموت: البلعميات). في بعض الحالات، تم استخدام أدوية (جي إس كيمثبط H-151 (توكرس)تم إضافة CFTRinh-172 إلى BMMs قبل 30 دقيقة من الحضانة مع الخلايا التيموسية الميتة. تم حضانة البلعميات مع الخلايا الميتة إما لمدة 3 ساعات، تليها عملية غسل وحضانة إضافية لمدة 16 ساعة. ) أو مقابل 20 بدون ذكر خلاف ذلك. لاختبار تنشيط خلايا T، قبل الزراعة المشتركة مع CD8تم زراعة خلايا T وخلايا BMMs مع الخلايا التيموسية الميتة لمدة 4 ساعات ثم تم غسلها.
اختبار تنشيط خلايا T
تم تنشيط الخلايا الطحالية الأولية من الفئران باستخدام كريات دينابيد المرتبطة بـ CD3/CD28 بنسبة 2:1 (الخلايا الطحالية:الكريات) وتم زراعتها مع خلايا بون مار ماكروفاج (BMMs) بنسبة 20:1 (الخلايا الطحالية:BMMs) لمدة 24 ساعة. ثم تم حضانة الخلايا معمحلول بريفيلدين أ (بايو ليجند) لـقبل التلوين المناعي وتحليل تدفق الخلايا كما هو موصوف أعلاه.
تحلل الحمولة الفاغوسومية
تم صبغ الخلايا التيموسية الميتة باستخدام محلول تلوين الخلايا Vybrant DiD (ثيرمو فيشر) وفقًا لبروتوكول الشركة المصنعة. تم حضن خلايا BMMs لمدة 3 ساعات مع الخلايا التيموسية الميتة تلاها غسل شامل. ثم تم تثبيت الخلايا لمدة 10 دقائق في درجة حرارة الغرفة معالفورمالين (0 ساعة) أو تركه لمدة 16 ساعة إضافية للسماح بـ تم تدهور الشحنة وتم إصلاحها في اليوم التالي. تم تصوير الخلايا باستخدام ميكروسكوب Axio Observer Z1 (زايس).
اختبار حموضة الفاجوليزوزوم
تم إجراء اختبار حموضة الليزوزومات باستخدام مجموعة تلوين الخلايا pHrodo Red من IncuCyte (Sartorius) أو LysoSensor DND-189 (Thermo Fisher). بالنسبة للاختبار باستخدام pHrodo، تم صبغ الخلايا التيموسية الميتة.من pHrodo عندلمدة ساعة واحدة ثم معCellTracker CFSE (ثيرمو فيشر) فيلمدة 20 دقيقة.
للاختبارات باستخدام LysoSensor، تم صبغ BMMs قبل ساعتين من الاختبار بـتم صبغ الخلايا التيموسية المبرمجة للموت المبرمج باستخدام LysoSensor Green DND-189 (ثيرمو فيشر) وفقًا لبروتوكول الشركة المصنعة.دي دي لمدة 45 دقيقة فيفي الظلام وتم حضانته مع خلايا بون مارو.
تم إجراء تصوير الخلايا الحية باستخدام مجهر Cell Discoverer 7 أو LSM800 (زايس). تم تحليل ذروة شدة pHrodo أو LysoSensor باستخدام Zen v.3.8 (زايس) أو CellTracker (جامعة ووريك).
جيش التحرير الشعبي
تم إجراء PLA باستخدام مجموعة Duolink PLA (Sigma) وفقًا لإرشادات الشركة المصنعة. باختصار، بعد العزل والتمايز لمدة 5 أيام، تم زرع خلايا BMM الأولية المأخوذة من الفئران على شرائح زجاجية وتركها طوال الليل لتلتصق. ثم تم تثبيت خلايا BMM باستخدامبارافورمالدهيد وتم اختراقه بـترايتون-X/PBS، تليها حضانة مع LXR و RXR الأجسام المضادة (الجدول التكميلي 4) طوال الليل عند . تم بعد ذلك حضن خلايا BMMs مع مجسات PLA، تلتها خطوات الربط والتضخيم. تم الحصول على بيانات الصورة باستخدام مجهر LSM800 (زايس) وتم تحليلها باستخدام برنامج Zen v.3.8 (زايس).
الكيمياء المناعية
تم إجراء إزالة البارافين واسترجاع المستضد باستخدام نظام PT-Link (داكو)، تلتها صبغة مناعية باستخدام نظام EnVision Plus (داكو). تم حضن مقاطع الأنسجة مع جسم مضاد أولي (الجدول التكميلي 4) عند طوال الليل، تلتها حضانة مع بوليمر مرتبط بـ HRP. تم تطوير الصبغة باستخدام دايامينوبنزيدين وتم صبغها بعكس مع الهيماتوكسيلين (سيغما). تم الحصول على بيانات الصورة باستخدام مجهر Axio Observer Z1 (زايس) وتم تحليلها باستخدام برنامج Zen v.3.8 (زايس).
الفلوروسينس المناعي
لصبغ الأنسجة، تم إجراء إزالة البارافين واسترجاع المستضد باستخدام نظام PT-Link (داكو)، تلتها حجب باستخدام مصل الماعز العادي بنسبة 10%. تم بعد ذلك حضن مقاطع الأنسجة مع أجسام مضادة أولية (الجدول التكميلي 4) عند طوال الليل، تلتها حضانة مع أجسام مضادة ثانوية مرتبطة بالفلوروفور (الجدول التكميلي 4) وصبغة نووية DAPI (ثيرمو فيشر) في درجة حرارة الغرفة لمدة ساعة واحدة. تم بعد ذلك تثبيت مقاطع الأنسجة باستخدام وسط تثبيت فلوروسينس (داكو). لصبغ باستخدام جسمين مضادين تم إنتاجهما من نفس نوع المضيف، تم إجراء تضخيم إشارة التيراميد باستخدام مجموعة Tyramide Superboost (ثيرمو فيشر) وفقًا لإرشادات الشركة المصنعة. تم الحصول على بيانات الصورة باستخدام مجهر Axio Observer Z1 (زايس) وتم تحليلها باستخدام برنامج Zen v.3.8 (زايس).
لصبغ الفلوروسينس المناعي لخلايا BMMs الفأرية الأولية، تم زراعة الخلايا في -صفيحة 24 -بئر سوداء (إيبيدي) وثبتت باستخدام بارافورمالدهيد في PBS، pH 7.4، لمدة 10 دقائق في درجة حرارة الغرفة. تم نفاذ الخلايا لمدة 10 دقائق في محلول نفاذية (eBioscience) يحتوي على سابونين وتم حجبها لمدة ساعة واحدة في مصل حيوانات أخرى و محلول سابونين. تم بعد ذلك حضن الخلايا مع أجسام مضادة أولية (الجدول التكميلي 4) طوال الليل عند ، تلتها حضانة مع أجسام مضادة ثانوية مرتبطة بالفلوروفور (الجدول التكميلي 4) وصبغة نووية DAPI لمدة ساعتين في درجة حرارة الغرفة. تم الحصول على بيانات الصورة باستخدام مجهر LSM800 (زايس) وتم تحليلها باستخدام برنامج Zen v.3.8 (زايس).
RT-qPCR
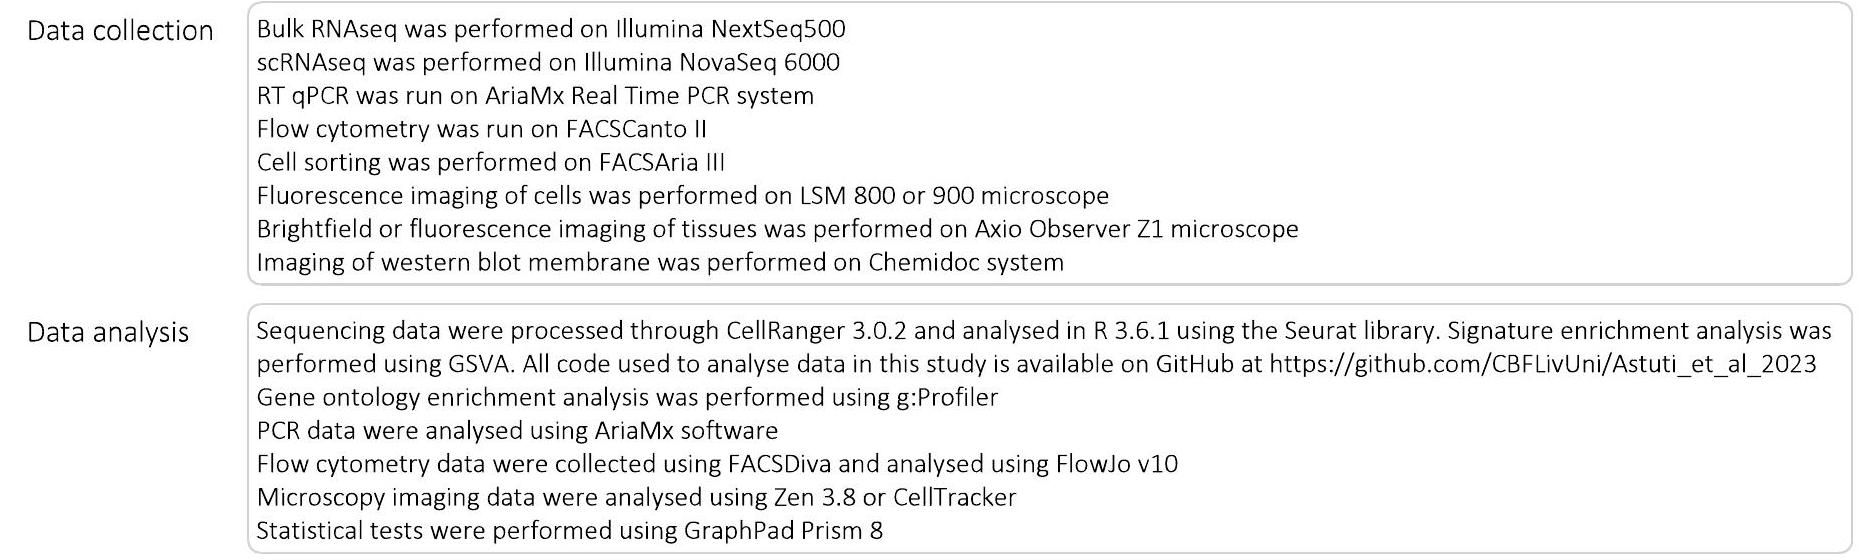
تم استخراج RNA من خلايا BMMs الفأرية الأولية أو من موماز الكبد المعزولة باستخدام مجموعة RNeasy (QIAGEN) وتم تصنيع cDNA باستخدام مجموعة Quantitect Reverse Transcription (QIAGEN). تم إجراء PCR في الوقت الحقيقي (الجدول التكميلي 3) باستخدام كاشف EvaGreen (Solis Biodyne) وفقًا لإرشادات الشركة المصنعة على نظام PCR في الوقت الحقيقي AriaMX (Agilent).
التحليل المناعي
تم إعداد مستخلصات البروتين باستخدام نظام RIPA Lysis Buffer (سانتا كروز). تم تحديد تركيز البروتين باستخدام مجموعة Pierce Protein BCA Assay (ثيرمو فيشر) وفقًا لإرشادات الشركة المصنعة. تم فصل كميات متساوية من البروتينات على هلام TGX Precast (بايو راد) وتم نقلها باستخدام نظام Trans-blot Turbo Transfer (بايو راد). تم حجب الأغشية في 5% BSA في محلول ملحي مخفف تريس يحتوي على توين-20 (TBST)، تلتها حضانة مع أجسام مضادة أولية (الجدول التكميلي 4) عند طوال الليل. بعد الغسل في TBST، تم حضن الأغشية مع أجسام مضادة ثانوية مرتبطة بـ HRP (الجدول التكميلي 4). تم تصور حزم البروتين باستخدام مادة Pierce ECL Western Blotting (ثيرمو فيشر) وتم تصويرها باستخدام نظام Chemidoc Imaging (بايو راد).
الاستنساخ
تم استنساخ إدخالات mCherry و mGr التي تم إنشاؤها باستخدام أزواج البرايمر mCherry-mPGRN-F1 و mCherry-mPGRN-F2 (الجدول التكميلي 3) في بلازميد pHIV باستخدام طريقة SLiCE عن طريق حضن محلول SLiCE، مستخلص SLiCE، 50 نانوغرام من DNA البلازميد المستقيم وإدخالات DNA بنسبة مولية من لمدة ساعة واحدة عند . تم تأكيد الإدخالات عن طريق التسلسل باستخدام البرايمرات ef1.F و mcherry.R أو mPGRNclonecheck.F و pHIV.rev (الجدول التكميلي 3).
لإنشاء خلايا GRN KO HEK293T، تم استخدام زوج من الأدلة (CCCTTGTGCCCTCATTCATG و GACTGAGTGACCCTAGAATCA) لحذف حوالي 1 كيلو بايت من DNA من الإكسون 2 إلى الإكسون 4 من GRN. تم فوسفات الأدلة التكميلية RNA (sgRNA) باستخدام كيناز البوليمر T4 (ثيرمو فيشر) وفقًا لبروتوكول الشركة المصنعة. تم ربط المنتجات الفوسفاتية في LentiCRISPRv2 عند طوال الليل باستخدام T4 DNA Ligase (ثيرمو فيشر). تم استخدام PCR مع البرايمرات hU6-F و البرايمرات الخاصة بالدليل RP للتحقق من التسلسل.
تم نقل خلايا HEK293T باستخدام إنشائيات sgRNA باستخدام Lipofectamine 2000 (ثيرمو فيشر). تم تغيير الوسط بعد 24 ساعة وتم إضافة البيروميسين (ثيرمو فيشر) لمدة 48 ساعة. تم توسيع الخلايا التي تم حذفها بنجاح وتم تأكيد عدم تعبير PGRN باستخدام التحليل المناعي.
تسلسل RNA بالجملة
تم تجانس أنسجة خزعة الكبد من المرضى الذين تم تأكيد وجود نقائل كبدية مرضية باستخدام جهاز تجانس Minilys (بيرتين). تم استخراج RNA الكلي باستخدام مجموعة RNAeasy (QIAGEN) وتم إزالة DNA الجينوم باستخدام مجموعة TURBO DNA-free (ثيرمو فيشر). تم إعداد مكتبات التسلسل باستخدام مجموعة SMARTer Stranded Total RNA-Seq Kit v2، مجموعة Pico Input Mammalian (تاكارا) وتم تسلسلها على جهاز Illumina’s NextSeq500.
scRNA-seq
تم إجراء وسم الأجسام المضادة في الموقع لبلعميات الكبد في الفئران ذات النقائل المتقدمة باستخدام ضخ عكسي للكبد كما هو موصوف سابقًا مع جسم مضاد F4/80 مرتبط بـ FITC. تم إعداد تعليقات خلوية مفردة من الكبد غير المسمى (صحي ومبكر النقائل) والمسمى بالأجسام المضادة (نقائل متقدمة)، بالإضافة إلى الكبد قبل النقائل والكبد الناتج عن الأورام، كما هو موضح أعلاه وتم صبغها بـ SYTOX Blue (ثيرمو فيشر)، CD45، CD11b وأجسام مضادة F4/80 المرتبطة بـ APC (الجدول التكميلي 4). تم فرز البلعميات الحية (SYTOX ) باستخدام جهاز فرز الخلايا FACSAria III (BD Biosciences) وتم معالجتها لإعداد المكتبة
باستخدام مجموعة 10x Genomics Chromium Chip B Single Cell ومجموعة Single Cell3′ GEM، Library & Gel Bead (10x Genomics)، وفقًا لبروتوكول الشركة المصنعة. تم إجراء تسلسل مزدوج النهاية باستخدام جهاز Illumina NovaSeq 6000.
تم تقليم ملفات FASTQ وتصفيتها لإزالة القراءات ذات الجودة المنخفضة. تم تحويل القراءات إلى مصفوفات التعبير باستخدام CellRanger v.3.0.2 (10x Genomics) باستخدام نسخة الجينوم المرجعي للفأر mm10 المتاحة من موقع 10x Genomics. تم تحميل البيانات إلى R v.3.6.1 باستخدام مكتبة Seurat، والتي تم استخدامها لجميع التحليلات اللاحقة ما لم يُذكر خلاف ذلك. تم إزالة الجينات التي تم اكتشافها في أقل من 20 خلية بالإضافة إلى الجينات المشفرة للميتوكوندريا وجينات الوحدة الريبوسومية. تم إزالة الخلايا التي تم اكتشاف أقل من 200 (جودة منخفضة) أو أكثر من 6,000 (احتمالية أعلى للثنائيات) جينات، وكذلك الخلايا التي تشكل الجينات المشفرة للميتوكوندريا أكثر من 10% من إجمالي التعبير وتلك التي لم تعبر عن أي من علامة البلعميات العامة Cd68 أو mRNA Adgre1. احتوى مجموعة البيانات التجريبية النهائية على 9,171 خلية (2,428 صحي، 2,007 مبكر، 1,953 متقدمة قريبة و2,783 متقدمة بعيدة) و13,005 جين. لتحليل مجموعة فرعية من موماز، تم تضمين 2,820 خلية من مجموعة البيانات التجريبية. احتوى مجموعة البيانات النموذجية قبل النقائل والعفوية على 1,366 خلية (294 قبل النقائل و1,022 نقائل متقدمة).
تم تطبيع البيانات باستخدام طريقة ‘LogNormalize’ ثم تم قياسها. تم اكتشاف الجينات التي تحتوي على مزيد من التباين أكثر مما يمكن تفسيره بواسطة العوامل التقنية باستخدام طريقة ‘vst’ (الجينات). تم إجراء تحليل المكونات الرئيسية (PCA) باستخدام وظيفة RunPCA، تلاه فحص مخطط الكوع، الذي أظهر أن 20 مكونًا رئيسيًا قد التقطت معظم التباين في البيانات. ثم تم حساب إسقاطات UMAP باستخدام أعلى 20 مكونًا رئيسيًا. تم حساب خريطة الجوار الأقرب بين الخلايا باستخدام وظيفة FindNeighbors، باستخدام أعلى 20 مكونًا رئيسيًا من PCA لإبلاغ مصفوفة المسافة. تم اكتشاف تجمعات الخلايا باستخدام وظيفة FindClusters، التي تستخدم تنفيذ خوارزمية لوفان، مع تعيين معلمة الدقة إلى 0.44. تم اكتشاف الجينات المعبر عنها بشكل مختلف (DEGs) بين التجمعات باستخدام اختبار ويلكوكسون للرتب، كما هو موضح في وظيفة FindMarkers. بعد تصحيح بونفيروني، تم تعديل الجينات بـالقيمة الأقل من 0.01 اعتُبرت ذات دلالة إحصائية ما لم يُذكر خلاف ذلك.
تحليلات إثراء المسارات والتوقيعات
تم إجراء تحليل إثراء التوقيع في بيانات RNA-seq الكثيفة باستخدام حزمة R GSVA، باستخدام طريقة ssGSEA وتطبيع الدرجات. تم إجراء تحليل إثراء مسار GO BP للجينات المعبر عنها بشكل مختلف (DEGs) باستخدام :المحلل.
الإحصائيات وإمكانية التكرار
لم تُستخدم أي طرق إحصائية لتحديد أحجام العينات مسبقًا، ولكننا استخدمنا أعدادًا كافية من العينات التي من شأنها أن توفر نتائج ذات دلالة إحصائية بناءً على تجربتنا السابقة مع نماذج الأورام. تم إجراء الدراسات الحيوانية مرتين، باستثناء دراسات النقائل الكبدية التلقائية لمركب MerTKi و Grn KO، التي أُجريت مرة واحدة. تم تكرار التجارب في المختبر ثلاث مرات ما لم يُذكر خلاف ذلك. لم يتم استبعاد أي بيانات من التحليلات. لم تكن التجارب عشوائية؛ ومع ذلك، تم تخصيص الفئران ذات العمر ووزن الجسم المتقاربين إلى مجموعات التحكم والتجريب. الاستثناء من ذلك كان دراسة MerTKi في نموذج النقائل الكبدية التلقائية حيث، قبل علاج الدواء، تم تخصيص الفئران ذات الحمل الورمي الأولي المتقارب بشكل عشوائي. لم يكن الباحثون معميين عن التخصيص أثناء التجارب وتقييم النتائج. تم افتراض توزيع البيانات أنه طبيعي ولكن لم يتم اختباره رسميًا.
تم إجراء التحليل الإحصائي باستخدام برنامج GraphPad Prism الإصدار 8 (GraphPad).قيمة لـاعتُبر ذا دلالة إحصائية. في بعض الرسوم البيانية،تم الإشارة إلى ذلك، حيث إن GraphPad Prism لا يوفر القيم الدقيقة لـعندما كانت أقل من 0.0001.
ملخص التقرير
معلومات إضافية حول تصميم البحث متاحة في ملخص تقارير مجموعة نيتشر المرتبط بهذه المقالة.
توفر البيانات
تم تقديم بيانات تسلسل RNA أحادي الخلية للفأر إلى مستودع Gene Expression Omnibus ويمكن الوصول إليها تحت رقم الوصول GSE215118. بيانات تسلسل RNA البشري المتعددة متاحة من المؤلفين عند الطلب المعقول وبعد توقيع اتفاقية نقل البيانات لحماية خصوصية المرضى. جميع البيانات الأخرى التي تدعم نتائج هذه الدراسة متاحة من المؤلف المراسل عند الطلب المعقول. تم توفير بيانات المصدر مع هذه الورقة.
Allemani, C. et al. Global surveillance of trends in cancer survival 2000-14 (CONCORD-3): analysis of individual records for 37513025 patients diagnosed with one of 18 cancers from 322 population-based registries in 71 countries. Lancet 391, 1023-1075 (2018).
Ryan, D. P., Hong, T. S. & Bardeesy, N. Pancreatic adenocarcinoma. N. Engl. J. Med. 371, 1039-1049 (2014).
Vincent, A., Herman, J., Schulick, R., Hruban, R. H. & Goggins, M. Pancreatic cancer. Lancet 378, 607-620 (2011).
Conroy, T. et al. FOLFIRINOX or gemcitabine as adjuvant therapy for pancreatic cancer. N. Engl. J. Med. 379, 2395-2406 (2018).
Doran, A. C. Efferocytosis in health and disease. Nat. Rev. Immunol. 20, 254-267 (2020).
Green, D. R. The clearance of dead cells by efferocytosis. Nat. Rev. Mol. Cell Biol. 21, 398-414 (2020).
DeNardo, D. G. & Ruffell, B. Macrophages as regulators of tumour immunity and immunotherapy. Nat. Rev. Immunol. 19, 369-382 (2019).
Kitamura, T., Qian, B.-Z. & Pollard, J. W. Immune cell promotion of metastasis. Nat. Rev. Immunol. 15, 73-86 (2015).
Nielsen, S. R. et al. Macrophage-secreted granulin supports pancreatic cancer metastasis by inducing liver fibrosis. Nat. Cell Biol. 18, 549-560 (2016).
Tsilimigras, D. I. et al. Liver metastases. Nat. Rev. Dis. Prim. 7, 27 (2021).
Doak, G. R., Schwertfeger, K. L. & Wood, D. K. Distant relations: macrophage functions in the metastatic niche. Trends Cancer 4, 445-459 (2018).
Nielsen, S. R. & Schmid, M. C. Macrophages as key drivers of cancer progression and metastasis. Mediators Inflamm. 2017, 9624760 (2017).
Mantovani, A., Allavena, P., Marchesi, F. & Garlanda, C. Macrophages as tools and targets in cancer therapy. Nat. Rev. Drug Discov. 21, 799-820 (2022).
Ma, R.-Y., Black, A. & Qian, B.-Z. Macrophage diversity in cancer revisited in the era of single-cell omics. Trends Immunol. 43, 546-563 (2022).
Quaranta, V. et al. Macrophage-derived granulin drives resistance to immune checkpoint inhibition in metastatic pancreatic cancer. Cancer Res. 78, 4253-4269 (2018).
Wen, Y. Hepatic macrophages in liver homeostasis and diseasesdiversity, plasticity and therapeutic opportunities. Cell. Mol. Immunol. 18, 45-56 (2021).
Guilliams, M. et al. Spatial proteogenomics reveals distinct and evolutionarily conserved hepatic macrophage niches. Cell 185, 379-396 (2022).
Shi, C. & Pamer, E. G. Monocyte recruitment during infection and inflammation. Nat. Rev. Immunol. 11, 762-774 (2011).
Lai, K. K. Y. et al. Stearoyl-CoA desaturase promotes liver fibrosis and tumor development in mice via a Wnt positive-signaling loop by stabilization of low-density lipoprotein-receptor-related proteins 5 and 6. Gastroenterology 152, 1477-1491 (2017).
Kazankov, K. et al. The role of macrophages in nonalcoholic fatty liver disease and nonalcoholic steatohepatitis. Nat. Rev. Gastroenterol. Hepatol. 16, 145-159 (2019).
Li, S. et al. Metabolism drives macrophage heterogeneity in the tumor microenvironment. Cell Rep. 39, 110609 (2022).
Ben-Sasson, S. Z. et al. IL-1 enhances expansion, effector function, tissue localization, and memory response of antigen-specific CD8 T cells. J. Exp. Med. 210, 491-502 (2013).
Mehta, A. K., Gracias, D. T. & Croft, M. TNF activity and T cells. Cytokine 101, 14-18 (2018).
Cai, W. et al. STAT6/Arg1 promotes microglia/macrophage efferocytosis and inflammation resolution in stroke mice. JCI Insight 4, e131355 (2019).
Yurdagul, A. J. et al. Macrophage metabolism of apoptotic cell-derived arginine promotes continual efferocytosis and resolution of injury. Cell Metab. 31, 518-533 (2020).
Wu, Y.-M., Robinson, D. R. & Kung, H.-J. Signal pathways in up-regulation of chemokines by tyrosine kinase MER/NYK in prostate cancer cells. Cancer Res. 64, 7311-7320 (2004).
Linger, R. M. A. et al. Mer or Axl receptor tyrosine kinase inhibition promotes apoptosis, blocks growth and enhances chemosensitivity of human non-small cell lung cancer. Oncogene 32, 3420-3431 (2013).
Graham, D. K., Deryckere, D., Davies, K. D. & Earp, H. S. The TAM family: phosphatidylserine-sensing receptor tyrosine kinases gone awry in cancer. Nat. Rev. Cancer 14, 769-785 (2014).
Zhou, Y. et al. Blockade of the phagocytic receptor MerTK on tumor-associated macrophages enhances P2X7R-dependent STING activation by tumor-derived cGAMP. Immunity 52, 357-373 (2020).
Bhushan, B. et al. Pro-regenerative signaling after acetaminopheninduced acute liver injury in mice identified using a novel incremental dose model. Am. J. Pathol. 184, 3013-3025 (2014).
Adhyapok, P. et al. A computational model of liver tissue damage and repair. PLoS ONE 15, e0243451 (2021).
Kao, A. W., McKay, A., Singh, P. P., Brunet, A. & Huang, E. J. Progranulin, lysosomal regulation and neurodegenerative disease. Nat. Rev. Neurosci. 18, 325-333 (2017).
Yin, F. et al. Exaggerated inflammation, impaired host defense, and neuropathology in progranulin-deficient mice. J. Exp. Med. 207, 117-128 (2010).
Hu, F. et al. Sortilin-mediated endocytosis determines levels of the frontotemporal dementia protein, progranulin. Neuron 68, 654-667 (2010).
Chang, M. C. et al. Progranulin deficiency causes impairment of autophagy and TDP-43 accumulation. J. Exp. Med. 214, 2611-2628 (2017).
Trzeciak, A., Wang, Y.-T. & Perry, J. S. A. First we eat, then we do everything else: The dynamic metabolic regulation of efferocytosis. Cell Metab. 33, 2126-2141 (2021).
Pourcet, B. & Pineda-Torra, I. LXR activation induces arginase 1 expression in macrophages. Atherosclerosis 213, e7 (2010).
Repa, J. J. et al. Regulation of absorption and ABC1-mediated efflux of cholesterol by RXR heterodimers. Science 289, 1524-1529 (2000).
Cunha, L. D. et al. LC3-associated phagocytosis in myeloid cells promotes tumor immune tolerance. Cell 175, 429-441 (2018).
Lee, J. S., Badr, A., Eltobgy, M., Krause, K. & Hamilton, K. CFTR modulators restore acidification of autophago-lysosomes and bacterial clearance in cystic fibrosis macrophages. Front. Cell Infect. Microbiol. 12, 819554 (2022).
Di, A. et al. CFTR regulates phagosome acidification in macrophages and alters bactericidal activity. Nat. Cell Biol. 8, 933-944 (2006).
Cheng, S. et al. A pan-cancer single-cell transcriptional atlas of tumor infiltrating myeloid cells. Cell 184, 792-809 (2021).
Zilionis, R. et al. Single-cell transcriptomics of human and mouse lung cancers reveals conserved myeloid populations across individuals and species. Immunity 50, 1317-1334 (2019).
Mulder, K. et al. Cross-tissue single-cell landscape of human monocytes and macrophages in health and disease. Immunity 54, 1883-1900 (2021).
Zhu, Y. et al. Tissue-resident macrophages in pancreatic ductal adenocarcinoma originate from embryonic hematopoiesis and promote tumor progression. Immunity 47, 323-338 (2017).
Yin, C. & Heit, B. Cellular responses to the efferocytosis of apoptotic cells. Front. Immunol. 12, 631714 (2021).
Roberts, A. W. et al. Tissue-resident macrophages are locally programmed for silent clearance of apoptotic cells. Immunity 47, 913-927 (2017).
Cook, R. S. et al. MerTK inhibition in tumor leukocytes decreases tumor growth and metastasis. J. Clin. Invest. 123, 3231-3242 (2013).
Caetano, M. S. et al. Triple therapy with MerTK and PD1 inhibition plus radiotherapy promotes abscopal antitumor immune responses. Clin. Cancer Res. 25, 7576-7584 (2019).
Davra, V. et al. Axl and mertk receptors cooperate to promote breast cancer progression by combined oncogenic signaling and evasion of host antitumor immunity. Cancer Res. 81, 698-712 (2021).
Chen, R., Du, J., Zhu, H. & Ling, Q. The role of cGAS-STING signalling in liver diseases. JHEP Rep. Innov. Hepatol. 3, 100324 (2021).
Marelli, G. et al. Lipid-loaded macrophages as new therapeutic target in cancer. J. Immunother. Cancer 10, e004584 (2022).
Lan, Y.-J., Sam, N. B., Cheng, M.-H., Pan, H.-F. & Gao, J. Progranulin as a potential therapeutic target in immune-mediated diseases. J. Inflamm. Res. 14, 6543-6556 (2021).
Olive, K. P. et al. Inhibition of Hedgehog signaling enhances delivery of chemotherapy in a mouse model of pancreatic cancer. Science 324, 1457-1461 (2009).
Hingorani, S. R. et al. Trp53R172H and KrasG12D cooperate to promote chromosomal instability and widely metastatic pancreatic ductal adenocarcinoma in mice. Cancer Cell 7, 469-483 (2005).
Boj, S. F. et al. Organoid models of human and mouse ductal pancreatic cancer. Cell 160, 324-338 (2015).
Zhang, Y., Werling, U. & Edelmann, W. Seamless ligation cloning extract (SLiCE) cloning method. Methods Mol. Biol. 1116, 235-244 (2014).
Mederacke, I., Dapito, D. H., Affò, S., Uchinami, H. & Schwabe, R. F. High-yield and high-purity isolation of hepatic stellate cells from normal and fibrotic mouse livers. Nat. Protoc. 10, 305-315 (2015).
شكر وتقدير
نشكر مرافق الأبحاث المشتركة في ليفربول ومعهد أبحاث السرطان في المملكة المتحدة (CRUK) في اسكتلندا على توفير المعدات والدعم الفني. نشكر E. Boyd وM. Glenn على الدعم الفني في استنساخ الجزيئات واكتساب وتحليل الصور. نشكر الممرضة البحثية R. Stafferton على الحصول على موافقة المرضى. كما نشكر المرضى وعائلاتهم الذين ساهموا بعينات الأنسجة وتبرعات الدم. كانت هذه الدراسات مدعومة بمنح من CRUK (A25607، A26978 وA26979) ومجلس البحث الطبي. (MR/PO18920/1) وصندوق أبحاث السرطان في شمال غرب إنجلترا لمؤسسة M.C.S، وصندوق ويلكوم (102521/Z/13/Z) وصندوق أبحاث السرطان في شمال غرب إنجلترا لـ A.M. وCRUK A17196، A2996 وA25233 لـ J.P.M.
مساهمات المؤلفين
قام Y.A. بتصميم وتنفيذ معظم التجارب، وتحليل وتفسير البيانات، والمساهمة في إعداد المخطوطة. ساعد M.R. و V.Q. و M.A. و O.S. و G.B. في التجارب الحية، وساعد V.C.G. في تحليل مقاطع الأنسجة، وقام K.C. بإجراء التحليل المعلوماتي الحيوي. قام C.N. بإجراء تسلسل RNA الكمي، وساعد F.C. في تحليل وتفسير خزعات الورم. قدم D.P. و P.G. و C.H. و R.J. عينات المرضى. قدم J.W.P. السائل الدماغي الشوكي.-قدم ج.ب.م. فئران كري وعيون مفاهيمية. قدم أ.م. نصائح مفاهيمية، وفسر البيانات وكتب المخطوطة. تصور م.س.م. وأشرف على المشروع، وفسر البيانات وكتب المخطوطة. قام جميع المؤلفين بتحليل المخطوطة بشكل نقدي والموافقة عليها.
الشكل البياني الممتد 1 | تحليل الخلايا الفردية مع الوسم المكاني في الموقع يحدد التباين في البلعميات المرتبطة بالنقائل. (أ-ب) صور مناعية فلورية تمثيلية (أ) وقياس (ب) لجزيء GzmB السام للخلاياالخلايا في نقائل سرطان البنكرياس في الكبد البشريالخلايا السرطانية تم الإشارة إليها بـتلوين. قضبان المقياس،أشرطة الخطأ، المتوسطSEM.-القيمة، اختبار t غير المقترن ذو طرفين. (ج) مخطط نهج تسلسل RNA أحادي الخلية مع استراتيجية وسم مكاني في الموقع. MAMs=البلاعم المرتبطة بالنقائل. (د، هـ) صور تمثيلية للتألق المناعي للكبد السليم (د) ومرحلة متقدمة (د10) (هـ) من نقائل الكبد بعد الوسم في الموقع باستخدام جسم مضاد F4/80 المرتبط بـ FITC.فئران/مجموعة، من تجربة واحدة) عبر الترشيح العكسي، تليها صبغة خارج الجسم باستخدام علامة الماكروفاج الشاملة CD68. مقياس الأشرطة،. (f) قياس البلعميات المزدوجة الوسم ( ) في صحة وأكباد تحمل الأورام (صحيةفئران، نقيلةالفئران) كما هو موضح في (د، هـ). أشرطة الخطأ، المتوسطSEM.-القيمة، اختبار t غير المقترن ذو طرفين. (g) استراتيجية تصنيف FACS لفرز القريب ( ) والماكروفاجات المرتبطة بالنقائل البعيدة (dMAMs؛ ). (h) خريطة حرارية توضح تعبيرات الجينات الأكثر غنى في مجموعات KC مقابل MoM في مجموعة بيانات scRNAseq. (i) نسب كل مجموعة من الماكروفاجات المحددة في scRNAseq في الكبد السليم، والانتقال المبكر، والانتقال المتقدم. (j) قيم التعبير للجينات في توقيعات المجموعات 1-4 من تحليلات scRNAseq مقابل جميع الجينات في العينات البشرية (المجموعة الجينات؛ المجموعة 4جينات؛ مجموعةجينات؛ مجموعةالجينات). تشير الرسوم البيانية الصندوقية إلى الوسيط، والربع الأول والربع الثالث (المفاصل)، ونقاط القيم الشاذة التي تمتد إلى ما وراءنطاقات الربع الداخلي من أي مفصل (شعيرات).
الشكل البياني الممتد 3 | الإيفيروسيتوزيس يحفز النشاط المناعي المثبط في البلعميات الذي يتم بوساطة الأرجيناز 1. (أ) صورة تمثيلية بصبغة H&E لخلايا كبد ميتة في الكبد قبل النقيلة في اليوم العاشر بعد زراعة خلايا مستمدة من KPC.الفئران، من تجربة واحدة). شريط القياس،. (ب) خريطة حرارية توضح التعبير النسبي لجينات تحفيز خلايا T (بالأحمر) أو الجينات المثبطة (بالأزرق) في تجمعات MoM. (ج) مخططات UMAP توضح مستويات تعبير Arg1 في MoMs المعزولة من كبد ما قبل النقائل وكبد النقائل المتقدمة العفوية. (د) مخطط لتجربة الإيفيروتوسيس في البلعميات المشتقة من نخاع العظام الأولية (BMMs). (هـ) مخطط FACS (يسار) وكمية (يمين) للخلايا التيموسية الميتة بعد معالجة الستاورسبورين (التكرارات البيولوجية/المجموعة). أشرطة الخطأ، المتوسطتحليل qPCR باستخدام SEM.في الإنسان
الأمهات الرئيسياتالتكرارات البيولوجية/المجموعة). أشرطة الخطأ، المتوسطSEM.-القيمة، اختبار t غير المتزاوج ذو طرفين.مستويات التنشيط النسبية لـخلايا T، تقاس كنسب من IFN أو الخلايا، المنشطة بواسطة Dynabeads المرتبطة بـ anti-CD3/CD28 والمزروعة مع خلايا MoMs من الكبد النقيلي المتقدم مقارنةً بالتحكم الذي يحتوي على Dynabeads فقطالتكرارات البيولوجية/المجموعة من تجربة واحدة). أشرطة الخطأ، المتوسطSEM.-القيم، تحليل التباين الأحادي مع اختبار سيداكس بعد الاختبار. (ط) النسب المئوية للخلايا الميتة (أبوتراكير) الخلايا التائية، بعد التحفيز باستخدام كريات دينابيد المرتبطة بـ anti-CD3/CD28 وزراعة مشتركة مع خلايا بون مارو ماكروفاج (BMMs)التكرارات البيولوجية/المجموعة). أشرطة الخطأ، المتوسطSEM.-القيم، تحليل التباين الأحادي مع اختبار سيداك بعد الاختبار.
الشكل البياني الممتد 4 | الإيفيروسيتوزيس يحفز تحويل البلعميات المثبطة للمناعة. (أ) صورة تمثيلية لبلوت غربي لمستويات الأرجيناز 1 وCofilin كعينة تحكم في BMMs (تم إجراء التجربة ثلاث مرات مع نتائج مشابهة). (ب) مستويات التنشيط النسبية لـخلية، تقاس كنسب مئوية من IFNالخلايا، المنشطة باستخدام كريات دينابيد المرتبطة بـ anti-CD3/CD28 والمزروعة مع خلايا الكبد MoMs (F4/80+ TIM4-) مقارنةً بالتحكم الذي يحتوي على كريات دينابيد فقطالتكرارات البيولوجية/المجموعة من تجربة واحدة). أشرطة الخطأ، المتوسطSEM.-القيم، تحليل التباين الأحادي مع اختبار سيداك بعد الاختبار. (ج، د) صور تمثيلية لـ H&E (ج) وقياس (د) للنخرات في كبد اليوم الخامس (فئران/مجموعة، من تجربة واحدة). قضبان القياس،أشرطة الخطأ، المتوسطSEM.-القيمة، اختبار t غير المقترن ذو طرفين. (هـ) تحليل تدفق الخلايا لـالخلايا بين خلايا السرطان (CD45-ZsGreen+) أو البلعميات (CD45) في كبد d14 ( فئران/مجموعة). أشرطة الخطأ، المتوسطصور المناعة الفلورية التمثيلية (f) وقياس الكمية الإجمالية (g) وCD74و/أو البلعميات (h) التي تعبر عن YM-1 (F4/80) في كبد d5 ( فئران/مجموعة، من تجربة واحدة). قضبان القياس،أشرطة الخطأ، المتوسطSEM.-القيمة، اختبار t غير المقترن ذو طرفين. (ط) تحليل qPCR لـ Ifnb في MoMs (F4/80+TIM4-) من كبد اليوم الخامس (فئران/مجموعة). أشرطة الخطأ، المتوسطSEM.
-القيمة، اختبار t غير المتزاوج ذو طرفين. (j) مستويات التنشيط النسبية لـالخلايا، مقاسة كنسب مئوية من IFNالخلايا، المنشطة بواسطة كريات دينابيد المرتبطة بـ anti-CD3/CD28 والمزروعة مع خلايا الكبد MoMs (F4/80+) مقارنةً بالتحكم الذي يحتوي فقط على Dynabeads (التكرارات البيولوجية/المجموعة من تجربة واحدة). أشرطة الخطأ، المتوسطSEM.-القيم، تحليل التباين الأحادي مع اختبار سيداك بعده. (ك) تحليل تدفق الخلايا للمنشطة (CD69) خلايا T في كبد d5فئران/مجموعة). أشرطة الخطأ، المتوسطSEM.-القيمة، اختبار t غير المتزاوج ذو طرفين. (I) تحليل qPCR لـفي MoMs (F4/80+TIM4“) معزولة من كبد d14 (فئران/مجموعة). أشرطة الخطأ، المتوسطSEM.-القيمة، اختبار t غير المقترن ذو طرفين. (م-ع) صور مناعية تمثيلية (م) وقياس إجمالي ( ) و البلاعم) في كبد d14. تشير الأسهم إلى YM-1البلاعمفئران/مجموعة، من تجربة واحدة). قضبان القياس،أشرطة الخطأ، المتوسطSEM.-القيمة، اختبار t غير المقترن ذو طرفين. (ص) عبء الورم الأولي المشتق من الأورغانويد في اليوم 40. أشرطة الخطأ، المتوسطSEM.-القيمة، اختبار t غير المقترن ذو طرفين. (q) تحليل تدفق الخلاياالخلايا بين خلايا السرطان (CD45-Epcam+) أو البلعميات (CD45+F4/80+) في كبد اليوم الأربعين (فئران/مجموعة). أشرطة الخطأ، المتوسطSEM.
الشكل البياني الموسع | إصابة الكبد تسهل انتشار السرطان في الكبد وتسبب تحويل البلعميات المناعية المثبطة. (أ) مخطط توضيحي يوضح الجدول الزمني لتجربة APAP. (ب) صور تمثيلية لصبغة هيماتوكسيلين وإيوزين للنخر الكبدي بعد 24 ساعة من حقن المركب أو APAP (فئران/ مجموعة، من تجربة واحدة). قضبان القياس،. (c,d) صور تصوير البيولومينسنس ex vivo التمثيلية (يسار) والحمل النسبي للورم (يمين) للكبد في اليوم الخامس (c) واليوم الرابع عشر (d) (اليوم الخامسفئران/مجموعة، من تجربة واحدة؛ d14 التحكمفئران؛ باراسيتامولالفئران، من تجربتين). أشرطة الخطأ، المتوسطSEM.-القيمة، اختبار t غير المقترن ذو طرفين. (e-g) صور مناعية تمثيلية (e) وقياس إجمالي (f) وCD74و/أو البلعميات (g) التي تعبر عن YM-1 (F4/80+) في كبد اليوم الخامس (فئران/مجموعة). قضبان القياس،أشرطة الخطأ، المتوسطSEM.-القيمة، اختبار t غير المقترن ذو طرفين. (ح) تحليل qPCR لـ Arg1 في MoMs (F4/80+TIM4-) من كبد اليوم الخامس (فئران/مجموعة). أشرطة الخطأ، المتوسطSEM.
-القيمة، اختبار t غير المقترن ذو طرفين. (i-k) صور المناعة الفلورية التمثيلية (i) وقياس الكمية الإجمالية ( ) وجرانزيم السمية الخلوية الخلايا التائية في كبد d5فئران/مجموعة). تشير رؤوس الأسهم إلىالخلايا. قضبان القياس،أشرطة الخطأ، المتوسطSEM.-القيمة، اختبار t غير المقترن ذو طرفين. (I) تحليل تدفق الخلايا للمنشطة (CD69) الخلايا في كبد d5فئران/ مجموعة). أشرطة الخطأ، المتوسطSEM.-القيمة، اختبار t غير المتزاوج ذو طرفين.تحليل qPCR لـ Arg1 في MoMs (F4/80+ TIM4-) من كبد اليوم الرابع عشرفئران/مجموعة). أشرطة الخطأ، المتوسطSEM.-القيمة، اختبار t غير المتزاوج ذو طرفين.صور المناعة الفلورية التمثيلية ) وقياس الكمية الإجمالية ( ) و البلاعم (F4/80+)رؤوس الأسهم تشير إلىالبلاعم. قضبان القياس،أشرطة الخطأ، المتوسطSEM.-القيمة، اختبار t غير المتزاوج ذو طرفين.
الشكل 7 من البيانات الموسعة | نقص البروجرانولين يعيق الليزوزومات تحمض. (أ) مخطط لإنشاءات mCherry-mPGRN (الأعلى) وصور الفلورسنت التمثيلية (الأسفل) لخلايا HEK293T المعالجة والموسومة بـ LysoSensor (WT خلايا؛ GRNKO الخلايا، تم إجراء التجربة مرتين مع نتائج مشابهة). قضبان القياس،. (ب) قياس شدة LysoSensor كما هو موضح في (أ). أشرطة الخطأ، المتوسطSEM.-القيم، تحليل التباين الأحادي مع اختبار دنّيت بعد الاختبار. (ج) تحليل qPCR لـ LXR-جين الترميزفي BMMs (20 ساعة). أشرطة الخطأ، المتوسطSEMالتكرارات البيولوجية/المجموعة).-القيم، تحليل التباين ثنائي الاتجاه مع اختبار سيداكس بعد الاختبار. (د) مخطط توضيحي يوضح الجدول الزمني لتجربة LXRi. (هـ) صور تصوير البيولومينسنس الخارجي التمثيلية (يسار) والحمل النسبي للورم (يمين) لكبد اليوم الرابع عشرفئران/مجموعة، من تجربة واحدة). أشرطة الخطأ، المتوسطSEM.-القيمة، اختبار t غير المقترن ذو طرفين. (f) صورة تمثيلية لبلوت غربي لمستويات IRF3 وHistone H 3 كتحكم تحميل في الكسور النووية لـ BMMs بعد 4 ساعات من الحضانة مع الخلايا التائية الميتة (تم إجراء التجربة ثلاث مرات مع نتائج مشابهة). (g) تحليل qPCR لـ Ifnb1 في BMMs بعد 4 ساعات من الحضانة مع الخلايا التائية الميتة (التكرارات البيولوجية/المجموعة). أشرطة الخطأ، المتوسطSEM.-القيمة، تحليل التباين ثنائي الاتجاه مع اختبار سيداكس بعد الاختبار.
الشكل البياني الممتد 8| حجب CFTR يعيق تحويل البلعميات الناتج عن الإيفيروسيتوز. (أ) مخطط لتجربة الربط القريب (PLA) لـ mCherry و CFTR (يسار) وصور فلورية تمثيلية (يمين) لمؤشر PLA المرتبط بالفلوروفور (PLA، أخضر) في البلعميات المستخرجة من نخاع العظام التي تم نقلها بواسطة PGRN المسمى بـ mCherry (تم إجراء التجربة ثلاث مرات مع نتائج مشابهة). (ب) تحليل qPCR لـفي BMMs (20 ساعة). أشرطة الخطأ، المتوسطSEMالتكرارات البيولوجية/المجموعة). قيم P، تحليل التباين ثنائي الاتجاه مع اختبار بوست-تست سيداك. (ج) صور فلورية تمثيلية لبروتينات BMMs المعلّمة بـ LysoSensor (الخلايا/المجموعة، تم إجراء التجربة مرتين مع نتائج مشابهة) تم حضنها مع الخلايا التيموسية المبرمجة للموت الموصوفة بعلامة CellTrace (ApopT). (د) قياس شدة LysoSensor كما هو موضح في (ج). أشرطة الخطأ، المتوسطSEM من تجربة واحدة. قيمة P، اختبار t غير المتزاوج ذو طرفين. (e) صورة تمثيلية لبلوت ويسترن لمستويات أرجيناز 1 وCofilin كعينة تحكم في BMMs.،
تم إجراء التجربة ثلاث مرات مع نتائج مشابهة). (f) مستوى التنشيط النسبي لخلايا CD8 + T، مقاسًا كنسب من خلايا GzmB +، المنشطة بواسطة Dynabeads المرتبطة بـ anti-CD3/CD28 والمزروعة مع BMMs مقارنةً بالتحكم الذي يحتوي على Dynabeads فقط (التكرارات البيولوجية/المجموعة من تجربة واحدة). أشرطة الخطأ، المتوسطSEM. قيم P، تحليل ANOVA أحادي الاتجاه مع اختبار Sidak بعده. (g) تحليل تدفق الخلايا لخلية CD8 + T المفعلة (CD69+) في كبد اليوم الخامس.فئران/مجموعة). أشرطة الخطأ، المتوسطSEM. قيمة P، اختبار t غير المقترن ذو طرفين. (h) تحليل qPCR لـ Arg1 في MoMs (F4/80 + TIM4-) من كبد اليوم الرابع عشرفئران/مجموعة). أشرطة الخطأ، المتوسطSEM. قيمة P، اختبار t غير المقترن ذو طرفين. (i-k) صور تمثيلية للتألق المناعي (i) وقياس إجمالي (j) وYM-1+ (k) البلعميات (F4/80+) في كبد اليوم الرابع عشر. تشير الأسهم إلى البلعميات YM-1+.فئران/مجموعة، من تجربة واحدة). قضبان القياس،أشرطة الخطأ، المتوسطSEM. قيمة P، اختبار t غير المتزاوج ذو طرفين.
محفظة الطبيعة
المؤلف (المؤلفون) المراسلون: مايكل سي شميت آخر تحديث من المؤلفين: 11 ديسمبر 2023
ملخص التقرير
تسعى Nature Portfolio إلى تحسين إمكانية تكرار العمل الذي ننشره. يوفر هذا النموذج هيكلًا للاتساق والشفافية في التقرير. لمزيد من المعلومات حول سياسات Nature Portfolio، يرجى الاطلاع على سياسات التحرير وقائمة مراجعة سياسة التحرير.
الإحصائيات
لجميع التحليلات الإحصائية، تأكد من أن العناصر التالية موجودة في أسطورة الشكل، أسطورة الجدول، النص الرئيسي، أو قسم الطرق.
مؤكد
حجم العينة بالضبط ( ) لكل مجموعة/شرط تجريبي، معطاة كرقم منفصل ووحدة قياس
بيان حول ما إذا كانت القياسات قد أُخذت من عينات متميزة أو ما إذا كانت نفس العينة قد تم قياسها عدة مرات
اختبار(ات) الإحصاء المستخدمة وما إذا كانت أحادية الجانب أو ثنائية الجانب يجب أن تُوصف الاختبارات الشائعة فقط بالاسم؛ واصفًا التقنيات الأكثر تعقيدًا في قسم الطرق.
وصف لجميع المتغيرات المشتركة التي تم اختبارها
وصف لأي افتراضات أو تصحيحات، مثل اختبارات الطبيعية والتعديل للمقارنات المتعددة X وصف كامل للمعلمات الإحصائية بما في ذلك الاتجاه المركزي (مثل المتوسطات) أو تقديرات أساسية أخرى (مثل معامل الانحدار) والتباين (مثل الانحراف المعياري) أو تقديرات عدم اليقين المرتبطة (مثل فترات الثقة)
لاختبار الفرضية الصفرية، فإن إحصائية الاختبار (على سبيل المثال، ) مع فترات الثقة، أحجام التأثير، درجات الحرية وقيمة ملحوظة أعطِالقيم كقيم دقيقة كلما كان ذلك مناسبًا. لتحليل بايزي، معلومات حول اختيار القيم الأولية وإعدادات سلسلة ماركوف مونت كارلو للتصاميم الهرمية والمعقدة، تحديد المستوى المناسب للاختبارات والتقارير الكاملة عن النتائج تقديرات أحجام التأثير (مثل حجم تأثير كوهين)بيرسون )، مما يشير إلى كيفية حسابها تحتوي مجموعتنا على الإنترنت حول الإحصائيات لعلماء الأحياء على مقالات تتناول العديد من النقاط المذكورة أعلاه.
البرمجيات والشيفرة
معلومات السياسة حول توفر كود الكمبيوتر
بالنسبة للمخطوطات التي تستخدم خوارزميات أو برامج مخصصة تكون مركزية في البحث ولكن لم يتم وصفها بعد في الأدبيات المنشورة، يجب أن تكون البرمجيات متاحة للمحررين والمراجعين. نحن نشجع بشدة على إيداع الشيفرة في مستودع مجتمعي (مثل GitHub). راجع إرشادات مجموعة Nature لتقديم الشيفرة والبرمجيات لمزيد من المعلومات.
بيانات
معلومات السياسة حول توفر البيانات
يجب أن تتضمن جميع المخطوطات بيانًا حول توفر البيانات. يجب أن يتضمن هذا البيان المعلومات التالية، حيثما ينطبق:
رموز الانضمام، معرفات فريدة، أو روابط ويب لمجموعات البيانات المتاحة للجمهور
وصف لأي قيود على توفر البيانات
بالنسبة لمجموعات البيانات السريرية أو بيانات الطرف الثالث، يرجى التأكد من أن البيان يتماشى مع سياستنا.
تم تقديم بيانات تسلسل RNA أحادي الخلية للفئران إلى مستودع التعبير الجيني (GEO) ويمكن الوصول إليها تحت رقم الوصول GEO GSE215118. بيانات تسلسل RNA الكمي البشري متاحة من المؤلفين عند الطلب المعقول وبعد اتفاقية نقل البيانات لحماية خصوصية المرضى.
البحث الذي يتضمن مشاركين بشريين، بياناتهم، أو مواد بيولوجية
معلومات السياسة حول الدراسات التي تشمل مشاركين بشريين أو بيانات بشرية. انظر أيضًا معلومات السياسة حول الجنس، الهوية/التقديم الجنسي، والتوجه الجنسي والعرق، والاثنية والعنصرية.
التقارير عن الجنس والنوع الاجتماعي
لم يتم جمع هذه المعلومات
التقارير عن العرق أو الإثنية أو غيرها من التجمعات الاجتماعية ذات الصلة
لم يتم جمع هذه المعلومات
خصائص السكان
تم جمع عينات خزعة الكبد من مرضى يعانون من سرطان البنكرياس المتقدم غير المعالج مع وجود نقائل كبدية مؤكدة مرضيًا. تم جمع عينات دم من مرضى في أي مرحلة من مراحل سرطان البنكرياس. كان عمر المرضى يتراوح بين 53-64 عامًا، ومع ذلك لم يكن العمر اعتبارًا لجمع العينات.
التوظيف
كانت خزعات الكبد جزءًا من عينات التشخيص من المرضى الذين تم الحصول على موافقتهم والذين يعانون من سرطان البنكرياس المتقدم غير المعالج في مستشفى رويال ليفربول الجامعي. تم جمع عينات الدم من المرضى الذين تم الحصول على موافقتهم والذين يعانون من أي مرحلة من مراحل سرطان البنكرياس. لم تكن هناك أي تحيزات.
رقابة الأخلاقيات
تمت الموافقة على الدراسات البشرية من قبل خدمة الأخلاقيات الوطنية للبحوث (NRES). قدم جميع الأفراد موافقات خطية مستنيرة للتبرع بالأنسجة وفقًا للبروتوكول المؤسسي المعتمد.
يرجى ملاحظة أنه يجب أيضًا تقديم معلومات كاملة حول الموافقة على بروتوكول الدراسة في المخطوطة.
التقارير المتخصصة في المجال
يرجى اختيار الخيار أدناه الذي يناسب بحثك بشكل أفضل. إذا لم تكن متأكدًا، اقرأ الأقسام المناسبة قبل اتخاذ قرارك. علوم الحياة X العلوم السلوكية والاجتماعية العلوم البيئية والتطورية والبيئية
يجب على جميع الدراسات الإفصاح عن هذه النقاط حتى عندما يكون الإفصاح سلبياً.
حجم العينة
لم تُستخدم أي طرق إحصائية لتحديد أحجام العينات مسبقًا، ولكننا استخدمنا أعدادًا كافية من العينات التي من شأنها أن توفر نتائج ذات دلالة إحصائية بناءً على تجربتنا السابقة مع نماذج الأورام. تم تحليل ما لا يقل عن 3 فئران لكل مجموعة في الدراسات الحيوانية.
استثناءات البيانات
لم يتم استبعاد أي بيانات من التحليلات.
التكرار
تم تعريف النسخ البيولوجية لكل تجربة في أساطير الأشكال. تم إجراء الدراسات الحيوانية مرتين، باستثناء دراسات الانبثاث الكبدي التلقائي لمركب MerTKi و Grn KO، التي أجريت مرة واحدة. تم تكرار التجارب في المختبر ثلاث مرات ما لم يُذكر خلاف ذلك في أساطير الأشكال.
التوزيع العشوائي
لم تكن التجارب عشوائية، ومع ذلك تم توزيع الفئران ذات العمر ووزن الجسم المتقاربين في مجموعات التحكم والتجريب. الاستثناء من ذلك كان دراسة MerTKi في نموذج النقائل الكبدية التلقائية حيث، قبل العلاج الدوائي، تم توزيع الفئران ذات الحمل الورمي الأولي المتقارب عشوائيًا.
عمى
لم يكن المحققون معزولين عن التخصيص خلال التجارب وتقييم النتائج. تم إجراء العلاجات وجمع البيانات والتحليلات بواسطة نفس الشخص، لذا لم يكن من الممكن تحقيق العزل. في بعض الحالات، تم الحصول على بيانات التصوير بواسطة شخص آخر لم يكن لديه معرفة بالنتيجة المتوقعة للعلاج.
تصميم دراسة العلوم السلوكية والاجتماعية
يجب على جميع الدراسات الإفصاح عن هذه النقاط حتى عندما يكون الإفصاح سلبياً.
وصف الدراسة
غير متوفر
عينة البحث
غير متوفر
استراتيجية أخذ العينات
غير متوفر
جمع البيانات
غير متوفر
التوقيت
غير متوفر
استثناءات البيانات
غير متوفر
عدم المشاركة
غير متوفر
العشوائية
غير متوفر
تصميم دراسة العلوم البيئية والتطورية والبيئية
يجب على جميع الدراسات الإفصاح عن هذه النقاط حتى عندما يكون الإفصاح سلبياً.
وصف الدراسة
غير متوفر
عينة البحث
غير متوفر
استراتيجية أخذ العينات
غير متوفر
جمع البيانات
غير متوفر
التوقيت والمقياس المكاني
غير متوفر
استثناءات البيانات
غير متوفر
إعادة الإنتاج
غير متوفر
العشوائية
غير متوفر
مُعَمي
غير متوفر
هل شمل البحث العمل الميداني؟
نحتاج إلى معلومات من المؤلفين حول بعض أنواع المواد والأنظمة التجريبية والأساليب المستخدمة في العديد من الدراسات. هنا، يرجى الإشارة إلى ما إذا كانت كل مادة أو نظام أو طريقة مدرجة ذات صلة بدراستك. إذا لم تكن متأكدًا مما إذا كان عنصر القائمة ينطبق على بحثك، يرجى قراءة القسم المناسب قبل اختيار رد.
المواد والأنظمة التجريبية
طرق
غير متوفر
مشارك في الدراسة
غير متوفر
مشارك في الدراسة
خطوط خلايا حقيقية النواة
الأجسام المضادة المستخدمة
الأجسام المضادة الأولية
مستضد – نسخة – الشركة المصنعة – رقم الكتالوج – التطبيق – التخفيف
فأر مضاد CD8 53-6.7 بيو ليجند 100734 فاك 1:100
فأر مضاد لـ IFNg XMG1.2 Biolegend 505808 FACS 1:100
فأر مضاد CD11b M1/70 بيو ليجند 101216 FACS 1:100
فأر مضاد لـ TIM4 RMT4-54 بايو ليجند 130005 FACS 1:100
معلومات السياسة حول خطوط الخلايا والجنس والنوع في البحث
مصدر(s) خط الخلية
المصادقة تلوث الميكوبلازما الخطوط التي يتم التعرف عليها بشكل خاطئ بشكل شائع (انظر سجل ICLAC)
تم توفير خلايا PDAC المشتقة من فئران KPC ذات الخلفية C57BL/6 من قبل الدكتور ديفيد توفيسون في مختبر كولد سبرينغ هاربر. تم إنشاء ثقافات الأورغانويد النقيلي الكبدي من فئران KPC ذات الخلفية C57BL/6 في مختبر مايكل شميت، جامعة ليفربول، المملكة المتحدة. تم الحصول على خلايا HEK293T وTHP-1 وJurkat من ATCC.
تم التحقق من خلايا KPC بواسطة تفاعل البوليميراز المتسلسل (PCR) لتحديد النمط الجيني. وتم التحقق من خلايا HEK293T وTHP-1 وJurkat من قبل الموردين. تم اختبار جميع خطوط الخلايا بانتظام وكانت النتائج سلبية لوجود الميكوبلازما.
لم يتم استخدام أي خطوط خلوية يتم التعرف عليها بشكل خاطئ بشكل شائع في هذه الدراسة.
الحيوانات وغيرها من الكائنات البحثية
معلومات السياسة حول الدراسات التي تشمل الحيوانات؛ توجيهات ARRIVE الموصى بها للإبلاغ عن أبحاث الحيوانات، والجنس والنوع في البحث
الحيوانات المخبرية تم الحصول على فئران C57BL/6 من مختبرات تشارلز ريفر. تم شراء فئران Grn-/- (B6(Cg)-Grntm1.1Aidi) و Grnfl/fl (C57BL/6-Grntm1Aidi) و tdTomato+ (B6.129(Cg)-Gt(ROSA)26Sortm4(ACTB-tdTomato,-EGFP)Luo) على الخلفية الجينية C57BL/6 من مختبر جاكسون. تم توفير فئران Csf1r-Cre القابلة للتحفيز بواسطة التاموكسيفين (Csf1r-Mer-iCre-Mer) على الخلفية C57BL/6 بواسطة
الدكتور جيفري و. بولارد في جامعة إدنبرة.
الحيوانات البرية لم يتم استخدام حيوانات برية في الدراسات الحيوانية.
التقارير عن الجنس تم استخدام إناث الفئران، باستثناء دراسة النقائل الكبدية العفوية، التي استخدمت ذكور الفئران.
عينات تم جمعها من الميدان لم يتم استخدام أي عينات تم جمعها من الميدان في هذه الدراسة.
رقابة الأخلاقيات تم إجراء جميع إجراءات الحيوانات وفقًا للوائح وزارة الداخلية البريطانية بموجب ترخيص المشروع P16F36770. لم يتم تجاوز الحد الأقصى لحجم الورم البالغ 1.5 سم في المتوسط. في جميع الدراسات الحيوانية، كانت الشدة محدودة عند مستوى معتدل.
يرجى ملاحظة أنه يجب أيضًا تقديم معلومات كاملة حول الموافقة على بروتوكول الدراسة في المخطوطة.
النباتات
مخزونات البذور
غير متوفر
أنماط جينية نباتية جديدة
غير متوفر
المصادقة
غير متوفر
تدفق الخلايا
المؤامرات
أكد أن:
توضح تسميات المحاور العلامة والفلوكروم المستخدم (مثل CD4-FITC). المقاييس على المحاور واضحة تمامًا. قم بتضمين الأرقام على المحاور فقط للرسم البياني في أسفل اليسار من المجموعة (المجموعة هي تحليل للعلامات المتطابقة). جميع الرسوم البيانية هي رسوم بيانية متساوية الارتفاع مع نقاط شاذة أو رسوم بيانية بالألوان الزائفة. تم توفير قيمة عددية لعدد الخلايا أو النسبة المئوية (مع الإحصائيات).
المنهجية
تحضير العينة
تم إعداد تعليقات الخلايا المفردة من كبد الفئران من خلال التكسير الميكانيكي والإنزيمي معالكولاجيناز P (روش) في محلول ملح هانك المتوازن (HBSS) عند 37 درجة مئوية لمدة 30-40 دقيقة. ثم تم حضن الخلايا معتريبسين عند 37 درجة مئوية لمدة 5 دقائق. بعد إزالة الحطام عن طريق تصفية تعليق الخلايا من خلال مصفاة بفتحة 70 ميكرومتر، تمت إزالة كريات الدم الحمراء باستخدام محلول تحليل كريات الدم الحمراء (بايو ليجند).
ثم تم إعادة تعليق تعليقات خلايا الكبد في محلول MACS BSA، 2 مليمول EDTA، PBS). تم حجب مستقبلات Fc باستخدام مضاد CD16/CD32 الفأري (BD Biosciences) لمدة 10 دقائق على الثلج. لتلوين سطح الخلايا، تم بعد ذلك حضانة الخلايا مع علامة حيوية SYTOX Blue (Thermo Fisher) وأجسام مضادة مرتبطة بالفلوروفور (Biolegend، الجدول التكميلي 12). لاختبار تنشيط خلايا T، بعد حجب مستقبلات Fc، تم حضانة الخلايا مع LIVE/DEADمجموعة صبغة الخلايا الميتة القابلة للإصلاح (ثيرمو فيشر) والأجسام المضادة CD8 المرتبطة بالفلوروفور (بايو ليجند). ثم تم تثبيت الخلايا باستخدام محلول تثبيت IC وتم اختراقها باستخدام محلول غسل الصبغ داخل الخلايا (بايو ليجند) وفقًا لتعليمات الشركة المصنعة، تلا ذلك صبغ باستخدام جسم مضاد IFNg المرتبط بالفلوروفور.
لإجراء اختبار تنشيط خلايا T، بعد حجب مستقبلات Fc، تم تحضين الخلايا باستخدام مجموعة صبغة الخلايا الميتة LIVE/DEAD™ Fixable Aqua (ثيرمو فيشر) والأجسام المضادة CD8 المرتبطة بالفلوروفور (بايو ليجند). ثم تم تثبيت الخلايا باستخدام محلول تثبيت IC وتم اختراقها باستخدام محلول غسل الصبغ داخل الخلايا (بايو ليجند) وفقًا لتعليمات الشركة المصنعة، تلا ذلك صبغ مع IFN المرتبط بالفلوروفور.وأجسام مضادة للجرانزيم B (Biolegend، الجدول التكميلي 4).
آلة
فاسكانتو II
FACSAria III (لفصل الخلايا)
برمجيات
برنامج BD FACSDiva
وفرة تجمع الخلايا
تم تحديد وفرة الخلايا ونقاوتها المصنفة بواسطة FACS باستخدام برنامج FACSDiva
استراتيجية البوابة
تم تحديد الخلايا المفردة بناءً على FSC-A وFSC-H. تم تحديد الخلايا الحية بناءً على صبغة Sytox أو صبغة LIVE/DEAD. تم تحديد البلعميات بناءً على صبغة CD45+ F4/80+. تم تحديد خلايا CD8 T من عينات in vivo بناءً على صبغة CD45+ CD3+ CD8+. تم تحديد خلايا CD8 T من عينات in vitro بناءً على CD8+.
قم بتحديد هذا المربع لتأكيد أنه تم تقديم رقم يوضح استراتيجية البوابة في المعلومات التكميلية.
قسم الطب السرطاني الجزيئي والسريري، جامعة ليفربول، ليفربول، المملكة المتحدة.مرفق البيولوجيا الحاسوبية، جامعة ليفربول، ليفربول، المملكة المتحدة.معهد أبحاث السرطان المملكة المتحدة اسكتلندا، غلاسكو، المملكة المتحدة.مدرسة علوم السرطان، جامعة غلاسكو، غلاسكو، المملكة المتحدة.المتوفى: جيفري و. بولارد.البريد الإلكتروني: mschmid@liv.ac.uk
Pancreatic ductal adenocarcinoma is a highly metastatic disease and macrophages support liver metastases. Efferocytosis, or engulfment of apoptotic cells by macrophages, is an essential process in tissue homeostasis and wound healing, but its role in metastasis is less well understood. Here, we found that the colonization of the hepatic metastatic site is accompanied by low-grade tissue injury and that efferocytosis-mediated clearance of parenchymal dead cells promotes macrophage reprogramming and liver metastasis. Mechanistically, progranulin expression in macrophages is necessary for efficient efferocytosis by controlling lysosomal acidification via cystic fibrosis transmembrane conductance regulator and the degradation of lysosomal cargo, resulting in LXR -mediated macrophage conversion and upregulation of arginase 1 . Pharmacological blockade of efferocytosis or macrophage-specific genetic depletion of progranulin impairs macrophage conversion, improves cell functions, and reduces liver metastasis. Our findings reveal how hard-wired functions of macrophages in tissue repair contribute to liver metastasis and identify potential targets for prevention of pancreatic ductal adenocarcinoma liver metastasis.
Pancreatic ductal adenocarcinoma (PDAC) is a highly metastatic disease with a 5-year survival rate of less than 7% . Metastatic spread commonly occurs to the liver and is the primary cause of death for patients with PDAC . By the time that PDAC is diagnosed, the majority of patients ( ) have non-resectable metastatic cancer . Around of the patients whose primary tumor is removed relapse with hepatic metastasis within 2 years of surgery . Understanding the mechanisms underlying metastasis in pancreatic cancer is critical to improve outcomes for these patients.
Clearance of dying cells is fundamental to homeostasis, tissue repair and disease . Efferocytosis, the engulfment of dead cells by phagocytes, is performed predominantly by macrophages . Macrophages are critical immune cells and are highly plastic, acquiring tumor repressive or supportive functions depending on the context . PDAC liver metastasis is accompanied by macrophage accumulation , with macrophages often displaying an immunosuppressive phenotype, promoting tumor growth and limiting the impact of immunotherapy .
Emerging studies indicate that tumor-associated macrophages can coexist within the same tumor as immunostimulatory and immunosuppressive subtypes . Therapeutically targeting immunosuppressive macrophages holds great promise to improve current treatment options for patients with cancer. In this study, using single-cell analysis, we identified an efferocytic macrophage population in the early stage of PDAC liver metastasis that displays potent immunosuppressive activity. We found that efferocytosis reprograms macrophages toward an immunosuppressive phenotype and that genetic or pharmacological inhibition of efferocytic macrophages restored tumor immunity in PDAC liver metastasis and impaired metastatic outgrowth.
Results
Macrophage populations in metastatic livers are diverse
To investigate the immunological status of advanced metastatic lesions in PDAC, we collected fresh liver biopsies from treatment-naive metastatic patients with PDAC and performed bulk RNA sequencing. We found that metastatic lesions are immune silenced, enriched in macrophages and neutrophils, with low signature scores for T cells, B cells and natural killer cells (Fig. 1a). Immunofluorescence tissue staining of advanced metastatic PDAC lesions showed that the lesion periphery is rich in macrophages (CD68 ) and mostly granzyme B-negative T cells (CD8 ) (Fig. 1b-d and Extended Data Fig. 1a,b). Macrophages were also abundant in the metastatic core; however, cells were virtually absent (Fig. 1b-d). Thus, the metastatic tumor microenvironment in PDAC is immunosuppressive, with high numbers of metastasis-associated macrophages (MAMs) and poor cell infiltration.
To characterize MAM heterogeneity in pancreatic cancer liver metastasis in vivo, we induced liver metastasis by intra-portal injection of cells isolated from the genetically engineered ‘KPC’ mouse model of PDAC (Kras ; Trp53 ; Pdx1-Cre), in orthotopic PDAC tumor-bearing mice. MAMs were isolated by flow cytometry and analyzed using single-cell RNA sequencing (scRNA-seq) (Extended Data Fig. 1c). We resolved the spatial distribution of MAMs from early (day 5) and advanced metastatic lesions (day 10) using an in situ antibody-labeling approach. Established metastatic liver tumors in PDAC are highly fibrotic and poorly vascularized . Perfusion with FITC-conjugated F4/80 ( ) antibody solution therefore mainly stains macrophages in the peripheral area of metastatic lesions ( ); intra-metastatic macrophages remain unstained (F4/80 ) (Extended Data Fig. 1d-g). We define unstained macrophages as metastasis-proximal macrophages (pMAMs) and stained macrophages as metastasis-distal macrophages (dMAMs).
We analyzed macrophages from healthy livers ( 2,428 cells), early metastasis ( 2,007 cells), advanced proximal metastasis ( 1,953 cells) and advanced distal metastasis ( 2,783 cells). Ten distinct populations were revealed after Seurat-based clustering and dimensionality reduction (Fig. 1e). Tissue resident Kupffer cells (KCs) and monocyte-derived macrophages (MoMs) comprise the macrophage population in the liver . Clusters and 9 showed high expression of KC markers such as Clec4f, Vsig4, and Timd4 (ref. 17) (Fig. 1f,g and Extended Data Fig. 1h). In parallel, clusters 2, 3 and 7 expressed monocyte-derived macrophage (MoM) marker Ccr2 (ref.18) (Fig.1f,g and Extended Data Fig. 1h).
In tumor-free livers KC subsets dominated the macrophage population, especially cluster 0 at of the population (Fig. 1h,i), confirming previous reports . In livers with metastatic lesions, KC clusters 1,4,6 and 8 and all three MoM clusters were expanded compared to tumor-free livers and were therefore identified as metastasis-induced macrophages (Fig. 1h,i and Extended Data Fig. 1i). Differentially expressed gene (DEG) signature analysis confirmed that cluster 0 showed high expression of , including Vsig4,C6,Folr2,Clec4f, Apoc1 and Timd4 (Fig. 1j and Supplementary Table 1), which were also highly expressed in the KC clusters and 9 . In addition to these
pan-KC markers, cluster 5 (10% of naive liver macrophages) highly expressed antigen-processing and presentation (AP) genes (H2-Eb1, H2-Ab1, H2-T23 and H2-D1) (Fig. 1j and Supplementary Table1). Cluster 9 (2% of naive liver macrophages) showed endothelial-like characteristics by their high expressions of Clec4g, Kdr, Ptprb and Egfl7 (Fig. 1j and Supplementary Table 1).
Two major KC-MAM clusters, clusters 1 and 4, showed an inflammatory signature with high expression of pro-inflammatory cytokines, such as Il6, Il1a, Il1b and Il18, and NF-кВ and MAPK signaling pathway genes (Nfkbiz, Fosb, Trim25, Nfkbia and Map3k8) (Fig. 1j,k and Supplementary Table 1). Inflammation repressors Egr1 and II10 were also expressed, suggesting a negative feedback mechanism (Fig. 1j,k and Supplementary Table 1). Cluster 4 was uniquely characterized by expression of the leptin receptor Lepr, plus high expression of Scd1, Tnf, and Il6, suggesting a pro-fibrogenic phenotype . The remaining KC-MAM subsets showed high expression of cell-cycle genes (Stmn1, Cenpa and Mki67) in cluster 6 and DNA replication genes (Mcm5,Mcm6 and Topbp1) in cluster 8, characteristic of proliferating macrophages (Fig. 1j and Supplementary Table 1).
Within monocyte-derived MAM subsets, cluster 2 exhibited AP gene signatures, demonstrated by high expression of H2-Eb1, H2-Ab1 and Cd74 (Fig. 1j,k and Supplementary Table 1). Conversely, cluster 3 showed enrichment of Chil3, Mrc1 and Arg1, suggesting an M2-like/ immunosuppressive phenotype (Fig.1j,k and Supplementary Table1). The minor MoM population, cluster 7, displayed similar expression of Chil3 and Arg1 and high expression of cell-cycle genes (Stmn1, Cenpa and Mki67), suggesting that it is a proliferating subset of cluster 3(Fig. 1j and Supplementary Table 1).
We explored whether the identified MAM signatures were present in our human PDAC liver metastasis RNA-seq data. All four MAM signatures (KC clusters 1 and 4 and MoM clusters 2 and 3) were detectable in human data (Extended Data Fig. 1j). Our scRNA-seq analysis showed cluster 3 MoMs to be the most abundant subset in core areas of advanced metastasis. In agreement with this, we found the highest signature score for this cluster in all liver biopsies taken from cores of advanced metastatic tumors of patients with PDAC (Fig. 11).
Together, these data suggest that PDAC metastasis increases macrophage heterogeneity within both MoM and KC subsets and that immunosuppressive and immunostimulatory macrophage subpopulations coexist.
We analyzed the spatial distribution of MAM clusters. pMAM and dMAM subsets from advanced liver metastasis displayed minimal overlap, confirming the specificity of our labeling approach (Fig. 2a). We found that metastasis-infiltrating pMAMs originate from monocytes, whereas dMAMs mainly consist of tissue-resident KCs, consistent with a previous report (Fig. 2b). Tissue section analyses of advanced metastatic lesions derived from patients with PDAC (Fig. 2c,d), an autochthonous KPC mouse model (Extended Data Fig. 2a,b) and an experimental metastasis mouse model (Extended Data Fig. 2c,d), all confirmed that metastatic tumors were highly infiltrated by macrophages. In all cases peripheral macrophages stained positive for the KC marker VSIG4, whereas macrophages within the core were VSIG4-negative. These data suggest that recruited MoMs infiltrate the metastatic lesions, whereas MAMs distal to metastatic lesions originate from tissue-resident KCs.
As pMAMs in advanced metastasis are predominantly derived from monocytes, we performed additional clustering and dimensionality reduction on MoM populations, clusters 2, 3 and 7. We found six further distinct MoM clusters (Fig. 2e). Within the AP-positive-associated subset (original cluster 2), we found three new clusters (B, C and F). Notably, the AP signature was enriched in cluster B and F (AP ), but not in cluster (Fig. 2f). Cluster C was associated with phagocytosis/apoptotic cell-clearance signatures (Cd3OOa, Cd36, Scarb1, Anxa2 and Gpnmb) and enriched in lysosomal genes (Lipa,Ctsb,Ctsd,
Fig. 1 | Identification of MAM populations in metastatic PDAC livers by singlecell RNA sequencing combined with spatial in situ labeling. a, Schematic of bulk RNA sequencing on fresh liver metastasis biopsies from chemotherapynaive patients with PDAC ( ) (top) and heat map showing scores (normalized enrichment score (NES); single-sample gene set enrichment analysis (ssGSEA)) for immune signatures (bottom). NK, natural killer.b-d, Representative immunofluorescence images (b) and quantification of cells (c) and macrophages (CD68 ) (d) in the tumor margin and core of human PDAC liver metastasis ( patients). Cancer cells were indicated by staining. Arrowheads indicate CD8 T cells. Scale bars, . Error bars, mean s.e.m. values, two-tailed unpaired -test. DAPI, 4,6-diamidino-2-phenylindole. e, Uniform Manifold Approximation and Projection (UMAP) plot identifying ten clusters within macrophages ( ) isolated by flow cytometry from healthy liver, early metastatic livers (d5) and advanced metastatic livers (d10) induced by intra-portal implantation of KPC-derived cells into mice with established
orthotopic PDAC tumors ( mice per group).fg, UMAP plots (f) and violin plots ( ) depicting expression of common markers of KCs (Clec4f, Vsig4 and Timd4) and MoMs (Ccr2) in the scRNA-seq dataset. h,i, UMAP plots (h) and bar chart (i) depicting distribution of different macrophage clusters in healthy livers, early metastatic livers (d5) and advanced metastatic livers (d10). j, Heat map depicting relative average expression of the top upregulated differentially expressed genes in each macrophage cluster compared to all other clusters in the scRNA-seq dataset. Representative genes are labeled for each cluster. k, Enriched Gene Ontology (GO) biological processes (BP) in major MAM clusters derived from KCs (cluster 1 and 4) and monocytes (cluster 2 and 3). Statistical enrichment analyses were performed using Fisher’s exact test on g:Profiler.LPS, lipopolysaccharide;pp, processing and presentation; MHC, major histocompatibility complex; IL, interleukin. I, Heat map showing signature scores (NES; ssGSEA) of major KC-MAM and Mo-MAM clusters in human PDAC liver metastasis samples ( patients).
Fig. 2 | CD74 MoMs display potent immunosuppressive functions at an early metastatic stage. a, UMAP plots showing distribution of pMAMs and dMAMs in advanced metastatic tumors (d10) based on in situ labeling. b, Violin plots depicting expression levels of KC (Vsig4,Clec4f and Timd4) and MoM (Ccr2) genes in pMAMs and dMAMs. c, Representative immunofluorescent images showing distributions of KCs (CD68 VSIG4 ) and MoMs (CD68 VSIG4 ) in tumor core (top) and margin areas (bottom, dashed line) of liver metastasis derived from patients with PDAC ( patients). Metastatic cancer cells were indicated by CK19 staining. Scale bar, . d, Quantification of KCs and MoMs among intralesional/core macrophages as shown in c. Error bars, mean s.e.m. value, two-tailed unpaired -test. e, UMAP plot identifying six clusters of MoMs derived from cluster 2, 3 and 7 in the original UMAP (Fig. 1c). , Heat map depicting relative expression of upregulated DEGs in each MoM cluster compared to all other MoM clusters in the RNA-seq dataset. Representative genes are labeled for each cluster. g, UMAP plots depicting distribution of MoM clusters in early (d5)
and advanced metastatic livers (d10). h, Diagram showing distribution of MoM clusters in early (d5) and advanced metastatic livers (d10). i-k, Representative immunofluorescent images of different macrophages ( ) expressing antigen presentation marker CD74 or M2 marker YM-1 in early (i) and advanced (j) liver metastasis derived from experimental intrasplenic model ( mice per group, from one experiment). Scale bars, . Quantification of staining showing percentages of intralesional macrophages resembling major MoM clusters: cluster C-like (Cl.C) (CD74- YM-1-), cluster B-like (Cl.B) (CD74 ) and cluster A-like (Cl.A) (CD74 ) ( ). Error bars, mean s.e.m. I, Relative cell activation measured by percentages of interferon (IFN) cells following stimulation with anti-CD3/CD28-coupled Dynabeads and co-culture with FACS-sorted early or advanced MoMs (F4/80+ TIM4-) from an experimental intrasplenic model compared to a Dynabead-only control (ctrl) ( biological replicates per group from one experiment). Error bars, mean s.e.m. values, one-way analysis of variance (ANOVA) with Sidak’s post-test.
Psap and Grn) (Fig. 2 f and Extended Data Fig. 2e), suggestive of efferocytic macrophages. Two clusters (cluster A and E) were derived from the M2-like/immunosuppressive subset (original cluster 3) (Fig. 2f and Extended Data Fig. 2e). Both clusters lacked AP gene expression (AP ) and showed higher expressions of the M2 marker genes Chil3 and Mrc1. Cluster E also displayed an inflammatory signature, expressing NF-кB and TNF signaling-related genes such as Il6, Tnf and Il1a (Fig. 2f and Extended Data Fig. 2e). Cluster D, displayed enrichment of cell-cycle genes and a similar profile to cluster A, suggesting that cluster D is a proliferating subset of cluster A (Fig. 2 f and Extended Data Fig. 2e).
In early metastasis, the MoM population was dominated by cluster C , with a minor contribution from the -associated subsets clusters and . Advanced metastatic lesions were dominated by cluster and the M2-like subset cluster A, followed by clusters E and D (Fig. 2g,h). Pseudotime analysis revealed a phenotype trajectory that starts with cluster F, followed by cluster C and cluster B, and final differentiation into cluster A/D or E during metastatic progression (Extended Data Fig. 2f). In pre-metastatic livers isolated from mice with orthotopically implanted tumors, we detected and cluster -like MoM populations (Extended Data Fig. ), showing the presence of cancer-educated MoM populations during pre-metastatic niche formation in tumor-bearing mice. A cluster A-like population was dominant in livers with advanced spontaneous metastasis isolated from mice orthotopically implanted with KPC tumor organoids (Extended Data Fig. ). These findings were supported by immunostaining of AP protein CD74 and M2-marker Chil3-encoded YM-1 in early and advanced metastatic tissues isolated from post-intrasplenic KPC cell implantation. Livers were collected at d5 and d14 (comparable tumor burden as d10 post-intraportal implantation (Extended Data Fig. 21)). As expected, CD74-/low MoMs (cluster C) are most abundant in early metastatic lesions, whereas CD74 YM MoMs (cluster A) represented the most frequent MoM subset in advanced metastatic lesions (Fig. 2i-k).
To characterize the functional phenotype of versus MoMs, we isolated CD74 and CD74 MoMs (F4/80 TIM4 ) from early and advanced metastatic tumors using FACS and co-cultured them with activated cells. In both cases MoMs were more potent in inhibiting cell functions compared to MoMs (Fig. 21). We observed lower immunosuppressive activity in CD74-/low MoMs from advanced tumors compared to early CD74-//low MoMs. This may be attributed to the inflammatory subset (cluster E) present in late CD74 MoMs (Fig. 2g) that express T cell-stimulating factors such as Illa and . Collectively, our data suggest that an immunosuppressive phenotype is acquired in MoMs early during metastasis and is associated with the loss of CD74 expression and the presence of an efferocytosis gene signature.
Efferocytosis mediates an immunosuppressive phenotype
We reasoned that the observed pathway signatures in MoMs might be induced by metastasis-related liver injury. To test this, we examined the extent of metastasis-related injury in livers derived from (1) an autochthonous KPC model, (2) an experimental intrasplenic metastasis model and (3) after daily intravenous administration of pancreatic tumor-conditioned medium (TCM) into healthy mice. Hepatic necroses were detected in the liver tissues of the autochthonous KPC model, post-orthotopic implantation of KPC cells and at the early stages of the experimental intrasplenic metastasis model (Fig. 3a and Extended Data Fig. 3a). Daily administration of pancreatic TCM was sufficient to induce hepatic necroses (Fig. 3b,c). Thus, PDAC liver metastasis is accompanied by resident cell death during initial metastatic spreading, and even in response to, tumor-derived factors. To confirm the presence of efferocytic MoMs, we transplanted wild-type (WT) bone-marrow (BM) cells into tdTomato-expressing (tdT) mice, resulting in chimeric mice that have ubiquitous expression of tdT, including in hepatocytes and KCs, whereas MoMs remained unlabeled (Fig. 3d). Following induction of
liver metastasis, we observed accumulation of MoMs in necrotic areas, some of which contained tdT debris in their cytoplasm (Fig. 3e). These data show that an efferocytotic MoM subpopulation emerges early in liver metastasis to resolve tissue injuries.
To identify the mediator of immunosuppressive activity in the early MoM subset, we examined expression of immunosuppressive genes in the MoM population in our scRNA-seq data. Similar to M2like clusters A/D/E, we found T cell inhibitory gene Arg1 expression in cluster C MoMs, which may be responsible for the immunosuppressive activity of early CD74-/low MoMs (Extended Data Fig. 3b). Furthermore, arginase 1 has been linked to efferocytosis . Consistent with the presence of liver injury before metastatic engraftment, high Arg1 expression was found in MoM populations isolated from pre-metastatic livers of mice with orthotopically implanted tumor (Extended Data Fig. 3c). In vitro cell culture assays using primary mouse and human macrophages confirmed that efferocytosis is sufficient to induce the upregulation of Arg1/arginase 1(Fig. 3f-h and Extended Data Fig. 3d-f).
To test the biological relevance of arginase 1 , we stimulated T cells and co-cultured them with CD74-/low early MoMs (Fig. 3i, j) or efferocytic macrophages (Fig. 3k,l) in the presence of an arginase 1 inhibitor, CB1158. Similar to early MoMs, efferocytic macrophages showed markedly increased immunosuppressive activity and treatment with arginase 1 inhibitor CB1158 (ARGi) abrogated this effect (Fig. 3i-1). This suggests that arginase 1 is responsible for the T cell-suppressing activity of efferocytic macrophages. Blockade of arginase 1 activity also reduced the T cell inhibitory effect of CD74-/low late MoMs, suggesting that arginase 1 mediates immunosuppressive effects in both early and late CD74-/low MoMs (Extended Data Fig. 3g,h). We also observed increased apoptosis of stimulated cells when co-cultured with efferocytic macrophages in vitro (Extended Data Fig. 3i). In summary, PDAC liver metastasis is accompanied by liver damage and efferocytosis, promoting the conversion of macrophages toward an immunosuppressive phenotype.
Inhibiting efferocytosis halts MoM conversion and metastasis
To assess the biological function of efferocytosis-induced macrophage conversion in PDAC liver metastases, we blocked efferocytosis in vitro using an inhibitor of tyrosine protein kinase Mer (MerTK), UNC2250 (MerTKi).As expected, MerTKi reduced efferocytosis in macrophages co-cultured with apoptotic thymocytes (Fig. 4a,b) and ablated the induction of Arg1 expression in macrophages (Fig. 4c and Extended Data Fig. 4a). Furthermore, MerTKi reduced the T cell suppressing activity of efferocytic macrophages (Fig. 4d and Extended Data Fig. 4b).
To test these findings in vivo, we induced liver metastasis by intrasplenic implantation of KPC cells, followed by treatment of the animals with MerTKi for seven consecutive days (Fig. 4e). Hepatic necrotic areas were markedly increased in early metastatic lesions (d5) in livers derived from mice treated with MerTKi, suggesting a delay in clearing apoptotic cells due to impaired efferocytosis (Extended Data Fig.4c,d). MerTKi administration did not affect early metastatic tumor burden; however, a significant reduction was found at the advanced stage (Fig.4f,g).
While some cancer cells express MerTK , we found that only a low percentage of the KPC-derived cell line FC1199 express this receptor (Extended Data Fig. 4e), suggesting that MerTKi does not act on cancer cell function. In contrast, the majority of macrophages expressed MerTK (Extended Data Fig. 4e). Analysis of isolated MoMs confirmed a significant reduction in Arg1 expression in early metastatic lesions when efferocytosis is impaired (Fig. 4h). While MoM abundance was not affected, MerTKi treatment caused a decrease in CD74 and an increase in CD74 (Extended Data Fig. 4f-h).
MerTK inhibition has been shown to activate the STING/type I interferon pathway . We observed increased Ifnb1 among early MoMs; however, this was not affected by MerTK inhibition (Extended Data Fig. 4i). Moreover, while MerTKi ablated the immunosuppressive activities of
Fig. 3 | Tissue-resident cell death triggers efferocytosis-mediated immunosuppressive conversion in MoMs. a, Representative hematoxylin and eosin (H&E) images of hepatic necroses in autochthonous KPC mice with pre-metastatic PDAC (left) and 48 h post-intrasplenic implantation of KPC cells in WT mice (right). Dotted lines demarcate necrotic areas ( N , necrotic; H , healthy) ( mice per group, from one experiment). Scale bars, . b,c, Mice were given KPC TCM or control DMEM once daily for 3 d. Livers were collected 24 h after the last injection. Representative H&E images of livers (b) and quantification of hepatic necroses areas (c) in the livers ( mice per group, from one experiment). Dotted line demarcates the necrotic area. Scale bars, . Error bars, mean s.e.m. value, two-tailed unpaired -test. d, Schematic of chimeric mice generation via transplantation of non-labeled ( ) donor BM cells into tdT hosts ( mice). e, Representative immunofluorescent images of efferocytic MoMs (arrowheads, debris-containing cells) in healing necrotic areas ( mice, from one experiment). Scale bar, .
analysis of in BMMs co-cultured for 3 h with apoptotic thymocytes at or after washout. BMM, bone marrow-derived macrophages. Error bars, mean s.e.m. ( biological replicates per group). value, twotailed unpaired -test.h, Representative western blot image of arginase 1 and loading control cofilin levels in BMMs ( , experiment was performed three times with similar results). i, j, Relative activation levels of cells, measured as percentages of IFN or granzyme B (GzmB) , stimulated with anti-CD3/ CD28-coupled Dynabeads and co-cultured with CD74-/low MoMs (F4/80+TIM4-) from d5 livers compared to Dynabead-only control ( biological replicates per group from one experiment). Error bars, mean s.e.m. values, one-way ANOVA with Sidak’s post-test. k, l, Relative activation levels of cells, measured as percentages of IFN or granzyme B (GzmB) cells (l), stimulated with anti-CD3/CD28-coupled Dynabeads and co-cultured with BMMs compared to Dynabead-only control ( biological replicates per group). Error bars, mean s.e.m. values, one-way ANOVA with Sidak’s post-test.
efferocytic macrophages, additional pharmacological blockade of STING did not show any effect, suggesting a dispensable role of the STING/type I interferon pathways in this setting (Extended Data Fig. 4j).
In addition to a greater abundance of less-immunosuppressive macrophages in early metastatic lesions of MerTKi-treated mice, we found a significant increase in infiltrating T cells (Fig.4i,j). Among these we saw a significantly higher proportion of cytotoxic T cells (Fig. 4i,k) and activated CD69 cells (Extended Data Fig. 4 k ). Depletion of cells ablated the anti-metastatic effect of MerTK treatment (Fig. 41,m) suggesting that MerTKi acts through increasing cytotoxic T cell functions.
Of note, even in advanced metastatic tumors (d14), MerTKi treatment reduced Arg1 expression in MoMs (Extended Data Fig. 41) without affecting overall abundance of MoMs (Extended Data Fig. 4m,n). Furthermore, MerTKi-treated lesions contained fewer YM- macrophages (Extended Data Fig. ), confirming that inhibition of efferocytosis in early metastasis impairs the phenotypic conversion of MoMs during metastatic progression in vivo.
Similar reduction in metastatic tumor burden was found with MerTK inhibition in the spontaneous liver metastasis model (Fig. 4n,0), whereas primary tumors remained unaffected (Extended Data Fig.4p). There was no MerTK expression in the KPC-derived organoid used in
Fig. 4 | Inhibition of efferocytosis prevents MoM conversion and PDAC metastasis. a,b, Representative fluorescence image(a) and quantification of engulfed CSFE/pHrodo-labeled apoptotic thymocytes in BMMs (b) (vehicle cells; MerTKi cells, experiment was performed twice with similar results). CFSE, carboxyfluorescein succinimidyl ester. Error bars, mean s.e.m. value, two-tailed unpaired -test.c, qPCR analysis of in BMMs ( 20 h ). Error bars, mean s.e.m. (control/vehicle , control/MerTKi , efferocytic/ vehicle , efferocytic/MerTKi biological replicates). values, twoway ANOVA with Sidak’s post-test. d, Relative activation level of cell, measured as percentages of IFN cells, stimulated with anti-CD3/CD28-coupled Dynabeads and co-cultured BMMs compared to Dynabead-only control ( biological replicates per group). Error bars, mean s.e.m. values, two-way ANOVA with Sidak’s post-test. e, Schematic illustrating the MerTKi experiment timeline.f,g, Representative bioluminescence imaging (BLI) images (left) and relative tumor burden (right) of d5 ( mice per group, from one experiment) (f) or d14 livers (g) (control mice, MerTKi mice, from two experiments). Error bars, mean s.e.m. values, two-tailed unpaired -test. h, qPCR analysis
of Arg1 in MoMs (F4/80+ ) from d5 livers ( mice per group). Error bars, mean s.e.m. value, two-tailed unpaired -test. , Representative immunofluorescence images (i) and quantification of total (j) and cytotoxic cells in d5 livers. Arrowheads indicate cells ( mice per group, from one experiment). Scale bars, . Error bars, mean s.e.m. values, two-tailed unpaired -test. I, Schematic illustrating the CD8 cell depletion experiment timeline. m, Representative ex vivo BLI images (left) and relative tumor burden (right) of d14 livers (vehicle/IgG mice, vehicle/ anti-CD8 , MerTKi/IgG , MerTKi/anti-CD8 , from one experiment). Error bars, mean s.e.m. values, two-way ANOVA with Sidak’s post-test. n, Schematic diagram illustrating the MerTKi experiment in spontaneous liver metastasis model. o, Representative liver photographs (left) and d40 tumor burden from indicated treatment groups (control mice, MerTKi mice, from one experiment). Error bars, mean s.e.m. value, two-tailed unpaired -test. p, qPCR analysis of in MoMs (F4/80+TIM4 ) from d 40 livers ( mice per group). Error bars, mean s.e.m. value, two-tailed unpaired -test.
this model (Extended Data Fig. 4q). Expectedly, Arg1 expression in MoMs was reduced with MerTKi treatment (Fig. 4p).
Metastasis-associated liver injury induces a pro-tumorigenic MAM phenotype, we therefore questioned whether non-cancerous liver injury increases the presence of pro-tumorigenic MAMs, making livers more permissive for metastasis. We induced acute liver injury using a single dose of paracetamol ( -acetyl-para-aminophenol; APAP). Two days later, animals underwent intrasplenic implantation of pancreatic cancer cells (Extended Data Fig. 5a). As expected , APAP induced hepatic necroses 24 h after administration (Extended Data Fig. 5b). APAP pre-treatment showed marginal effect on early metastatic outgrowth (Extended Data Fig. 5c), but resulted in significantly increased tumor burden at advanced stage compared to vehicle pretreatment (Extended Data Fig. 5d). APAP pretreatment did not affect CD74 YM-1 MoMs in early metastatic lesions (Extended Data Fig. 5e-g) but reduced the proportion of CD74- YM-1- MoMs and increased CD74- YM-1+ MoMs (Extended Data Fig. 5e-g), indicating accelerated MoM conversion into the late-stage M2-like phenotype. Expression of in MoMs was reduced with APAP pretreatment compared to vehicle-treated animals (Extended Data Fig. 5h), whereas CD8 cell infiltration (Extended Data Fig. 5i, j) and their cytotoxicity/activation state (Extended Data Fig. 5i,k,l) were significantly reduced. Advanced metastatic lesions in APAP pretreated mice showed sustained significant elevated Arg1 expression (Extended Data Fig. 5m), whereas MoM numbers were unchanged (Extended Data Fig. 5n,0). An increased proportion of YM-1 macrophages was found compared to that in vehicle control-derived livers (Extended Data Fig. 5n,p).
These findings demonstrate that an efferocytosis-induced macrophage switch promotes PDAC liver metastasis and that this process can be blocked by inhibiting MerTK.
Blocking the clearance of necrotic cells leads to increased tissue damage. Interfering with post-engulfment stages of efferocytosis may therefore be a better strategy to suppress macrophage polarization during PDAC liver metastasis. To identify a suitable macrophage-specific target, we analyzed upregulated lysosomal genes in early cluster 2 MoM from our scRNA-seq analysis. Among the upregulated genes was progranulin (Grn) (Extended Data Fig. 6a), a precursor protein directed to the lysosomal compartment, where proteolytically cleaved fragments called granulins are thought to be critical for lysosome function in macrophages . We have shown that macrophages are a major source of progranulin in PDAC liver metastasis and that depletion of progranulin is associated with defective phagocytic activities in response to bacterial infections . We hypothesized that progranulin might play a critical role in macrophage-mediated efferocytosis. In agreement with our hypothesis, we found that efferocytosis induces the expression of Grn in primary human and mouse macrophages (Extended Data Fig. 6b,c) and that progranulin localizes to the lysosomal compartment in these cells during efferocytosis (Fig. 5a-c). In addition, efferocytosis-induced upregulation of Arg1 expression (Fig. 5d,e) and suppression of CD8 T cell function were significantly reduced in progranulin-deficient (Grn knockout (KO)) macrophages (Fig. 5f,g).
We tested whether macrophage-specific depletion of progranulin affects MAM polarization during PDAC liver metastasis in vivo. We intrasplenically implanted pancreatic cancer cells into conditional Csf1r-MerCreMer ; Grn mice (KO) with Csf1r-MerCreMer ; Gr (WT) as a control cohort. In the KO strain, tamoxifen administration induces depletion of progranulin in macrophages. (Fig. 5h and Extended Data Fig. 6d). Macrophage-specific depletion of progranulin significantly reduced metastatic tumor burden in the advanced stage (Fig. 5i, j). Depletion of progranulin reduced expression of Arg1 in isolated MoMs (Fig. 5k). This reduction was sustained in advanced metastasis (Extended Data Fig. 6e) along with reduction in macrophages, whereas macrophage abundance remained unaffected
(Extended Data Fig. 6f-h). Lack of progranulin in macrophages led to a significant increase in total cell numbers (Fig. 51,m), in cytotoxic cells (Fig. 51,n) and in activated cells (Extended Data Fig. 6i) in early metastatic livers.
Depletion of progranulin in macrophages also resulted in reduced tumor burden in the spontaneous liver metastasis model without significant change in the primary tumors (Fig. 5o,p and Extended Data Fig. 6j). Consistently, Arg1 expression in MoMs was also significantly diminished in this model (Fig. 5q).
These data demonstrate that progranulin expression in macrophages is necessary for efferocytosis-induced conversion of MoMs into an immunosuppressive phenotype that then supports metastatic growth of pancreatic cancer cells in the liver.
To better understand the biological function of progranulin, we tested whether lack of progranulin affects efferocytosis of apoptotic cells and/or their proteolytic degradation in the lysosomes. Notably, progranulin-deficient macrophages (Grn KO) showed an increased accumulation of engulfed apoptotic cells (Fig. 6a,b) and increased retention of cargo in the lysosomal compartment over time ( 16 h ) (Fig. 6c,d). These data suggest that progranulin-deficient macrophages take up apoptotic cells, but that lysosomal cargo processing is impaired. Progranulin has been reported to shuttle by its sortilin-binding domain to the lysosomal compartment and to regulate lysosomal acidification during autophagy . As efficient lysosomal cargo destruction requires low pH in the lumen , we measured lysosome acidification in WT and macrophages during efferocytosis. In WT, but not in progranulin-deficient macrophages (Grn KO), the pH rapidly lowered and lysosomal acidification increased in phagolysosomes in response to efferocytosis (Fig. 6e,f). In progranulin-deficient cells (GRNKO), restoration of lysosomal acidification to WT level was seen on exogenous expression of recombinant full length progranulin, but not truncated progranulin lacking the sortilin-binding domain or isolated sortilin-binding domain (Extended Data Fig. 7a,b).
Upon proteolytic degradation of apoptotic cell cargo within the lysosome, lipid products are sensed by nuclear sterol receptors such as LXR , which has previously been reported to regulate Arg1 expression . Pharmacological inhibition of LXR (LXRi; GSK-2033) ablated efferocytosis-induced Arg1 expression in efferocytic WT macrophages but had no additional effect on Grn KO macrophages (Fig. 6g). Furthermore, LXR target gene, Abca1 (ref. 38), was upregulated in WT, but not granulin deficient, efferocytic macrophages (Fig. 6h), suggesting reduced LXR activity in efferocytic Grn KO macrophages. In WT, but not in GRN KO macrophages, efferocytosis markedly increased the interaction of LXR (encoded by Nr1h3) with its heterodimer partner RXR (Fig. 6i, j), whereas Nr1h3 expression levels remained unchanged (Extended Data Fig. 7c). In agreement with increased LXR activation in efferocytic WT macrophages, pharmacological blockade of LXR reduced liver metastasis in vivo (Extended Data Fig. 7d,e).
Impairment of efferocytosis signaling has been associated with an antitumor type I interferon immune response . We found that depletion of progranulin significantly increased activation of the type I interferon response, as evidenced by elevated levels of nuclear IRF3 (Extended Data Fig. 7f) and upregulation of Ifnb1 expression (Extended Data Fig. 7g). Our data suggest that impaired lysosomal function in progranulin-deficient macrophages pauses LXR -mediated Arg1 expression and leads to type I interferon activation in response to impaired efferocytosis.
Progranulin regulates lysosomal acidification via CFTR
To identify the molecular mechanism by which progranulin regulates efferocytosis-induced lysosome acidification we analyzed potential binding partners listed in the interactome database IntAct. These included the cystic fibrosis transmembrane conductance regulator
Fig. 5|Depletion of progranulin prevents macrophage conversion and reduces PDAC liver metastasis. a, Schematic illustrating experiment to track progranulin localization in efferocytic mCherry-PGRN-expressing macrophages. PGRN, progranulin.b, Representative immunofluorescence image of mCherryPGRN in efferosomes (asterisks) of murine BMMs ( cells, experiment was performed twice with similar results). Scale bar, . c, Representative fluorescence image of mCherry-PGRN in efferosome (arrowhead) of human MoMs over time as assessed by live-cell imaging (experiment was performed twice with similar results). d, qPCR analysis of in BMMs ( biological replicates per group). Error bars, mean s.e.m. values, two-way ANOVA with Sidak’s post-test. e, Representative western blot image of arginase 1 and loading control cofilin levels in BMMs ( , experiment was performed three times with similar results).fg, Relative activation of cell, measured by percentages of IFN or granzyme B (GzmB) T cells, stimulated with anti-CD3/CD28-coupled Dynabeads and co-cultured with BMMs compared to Dynabead-only control ( biological replicates per group from one
experiment). Error bars, mean s.e.m. values, one-way ANOVA with Sidak’s posttest. h, Schematic illustrating the Grn KO experiment timeline. i, j, Representative ex vivo BLI images (left) and relative tumor burden (right) of d 5 ( mice per group, from two experiments) (i) and d14 (WT, mice; KO, mice, from two experiments) (j) livers. Error bars, mean s.e.m. values, two-tailed unpaired -test. k, qPCR analysis of Arg1 in MoMs (F4/80+TIM4-) from d5 livers ( mice per group). Error bars, mean s.e.m. values, two-tailed unpaired -test. , Representative immunofluorescence images (1) and quantification of total (m) and cytotoxic GzmB cells in d5 livers ( mice per group, from one experiment). Arrowheads indicate CD8 cells. Scale bars, . Error bars, mean s.e.m. values, two-tailed unpaired -test. o, Schematic illustrating the Grn KO experiment in a spontaneous liver metastasis model. p, Representative liver photographs (left) and tumor burden (WT, mice; KO, mice, from one experiment). Error bars, mean s.e.m. values, two-tailed unpaired -test. q, qPCR analysis of in MoMs (F4/80+TIM4 ) from d5 livers ( mice per group). Error bars, mean s.e.m. values, two-tailed unpaired -test.
(CFTR), which regulates lysosome acidification in macrophages following phagocytosis of bacteria . A proximity ligation assay of progranulin and CFTR confirmed their colocalization in the cytoplasm
of WT macrophages (Extended Data Fig. 8a). Consistently, a lack of progranulin depletes the level of CFTR in lysosomes (Fig. 7a), whereas its expression levels remained unaffected (Extended Data Fig. 8b).
Fig. 6 | Progranulin deficiency impairs lysosomal acidification and cargo degradation during efferocytosis. a,b, Representative fluorescence images (a) and quantification (b) of uptake of CellTrace-labeled apoptotic thymocytes (ApopT) in BMMs (WT, cells; Grn KO, cells; experiment was performed twice with similar results). Error bars, mean s.e.m. value, twotailed unpaired -test. Scale bars, . AU, arbitrary unit. c, Representative images of efferocytic BMMs (WT, 0/16 h cells; Grn KO, cells; experiment was performed twice with similar results) 16 h after washout of CellTrace-labeled apoptotic thymocytes (ApopT). Scale bars, . d, Quantification of apoptotic thymocyte cargo degradation in efferocytic BMMs depicted in c. Error bars, mean s.e.m. value, two-tailed unpaired -test. e,f, Representative fluorescence images (e) and quantification (f) of peak pHrodo intensity in BMMs incubated with CFSE/pHrodo-labeled apoptotic thymocytes (WT, cells; Grn KO, cells; experiment was performed three times
with similar results). Error bars, mean s.e.m. value, two-tailed unpaired -test. g, qPCR analysis of in BMMs ( 20 h ). Error bars, mean s.e.m. ( biological replicates per group). values, two-way ANOVA with Sidak’s post-test. h, qPCR analysis of LXR target gene in BMMs ( 20 h ). Error bars, mean s.e.m. ( biological replicates per group). values, two-way ANOVA with Tukey’s post-test. i, Schematic of proximity ligation assay (PLA) for LXR and RXR (left) and representative fluorescence images (right) of PLA probe-bound fluorophore (PLA) in BMMs after incubation with CFSE-labeled apoptotic thymocytes (ApopT, green). Asterisks indicate phagocytosed apoptotic cells.j, Quantification of PLA foci (arrowhead) in WT or Grn KO BMMs as depicted in i (control WT, cells; control Grn KO, cells; efferocytic WT, cells; efferocytic Grn KO, cells; experiment was repeated three times with similar results). Error bars, mean s.e.m. values, two-way ANOVA with Sidak’s post-test.
Pharmacological inhibition of CFTR using CFTRinh172 (CFTRi) significantly impaired efferocytosis-induced lysosomal acidification in macrophages (Extended Data Fig. 8c,d). In addition, in vitro CFTR inhibition significantly reduced Arg1 expression (Fig. 7b and Extended Data Fig. 8e) and ablated the increased immunosuppressive activities of efferocytic WT macrophages, but did not show any effect on efferocytic progranulin-deficient macrophages (Fig. 7c and Extended Data Fig. 8f).
To assess the impact of CFTR inhibition on PDAC liver metastasis, we performed intrasplenic implantation of KPC-derived cancer cells followed by treatment with CFTRi or vehicle control for seven consecutive days (Fig. 7d). CFTR inhibition caused significant reduction in metastatic tumor burden at advanced stage (Fig. 7e,f). In agreement with our in vitro finding, administration of CFTRi significantly reduced Arg1 expression levels in MoMs (Fig. 7g), increased CD8 T cell infiltration (Fig. 7h,i) and their activation ( T cells) in early metastatic tumors (Fig. 7i,j and Extended Data Fig. 8 g ).
In advanced metastasis, CFTRi-treated mice displayed sustained impaired Arg1 expression in MoMs (Extended Data Fig. 8h) and inhibited macrophage conversion, demonstrated by overall reduced numbers of YM-1 macrophages within metastatic lesions (Extended Data Fig. 8i-k). Together, our findings show that progranulin regulates lysosomal acidification in macrophages via CFTR and that pharmacological blockade of lysosomal acidification with a CFTR inhibitor inhibits PDAC liver metastasis growth (Fig. 7k).
Discussion
Using a scRNA-seq and in situ cell-labeling approach, we reveal the spatial and temporal heterogeneity of macrophages in PDAC liver metastases. We confirm that macrophage tissue origin plays a key role in determining the localization and function of these cells in metastatic liver tumors. Recruited MoMs (TIM4 /VSIG4 ) and tissue-resident KCs (TIM4 ) expand during metastatic disease progression; however, MoMs are located within metastatic tumor lesions, whereas KCs are mostly found at the periphery. Our finding is consistent with studies
Fig. 7| Inhibition of progranulin-regulated CFTR impairs efferocytosisinduced macrophage polarization. a, Representative immunofluorescence images of CFTR in efferocytic BMMs (experiment was performed twice with similar results). Asterisks indicate engulfed apoptotic thymocytes.b, qPCR analysis of Arg1 in efferocytic BMMs ( 20 h). Error bars, mean s.e.m. ( biological replicates/group). values, two-way ANOVA with Sidak’s post-test. c, Relative activation level of T cells, measured as percentages of IFN cells, stimulated with anti-CD3/CD28-coupled Dynabeads and co-cultured with BMMs compared to Dynabead-only control ( biological replicates per group from one experiment). Error bars, mean s.e.m. values, one-way ANOVA with Sidak’s post-test. d, Schematic illustrating the CFTRi experiment timeline.
e,f, Representative ex vivo BLI images (left) and relative tumor burden (right) of d5 ( mice per group, from one experiment) (e) and d14 (f) livers ( mice per group, from two experiments). Error bars, mean s.e.m. values, two-tailed unpaired t-test. g, qPCR analysis of in MoMs (F4/80 ) from d5 livers ( mice per group). Error bars, mean s.e.m. value, two-tailed unpaired -test. , Representative immunofluorescence images ( ) and quantification of total (i) and cytotoxic GzmB cells in d5 livers ( mice per group, from one experiment). Arrowheads indicate cell. Scale bars, . Error bars, mean s.e.m. value, two-tailed unpaired -test.k, Graphical schematic summarizing the role of efferocytic macrophages in PDAC liver metastasis. During early stage of metastasis, seeding of cancer cells induces liver injury leading to clearance of dead cell debris by monocyte-derived macrophages (MoMs) via receptor MerTK. Engulfed dead cells are degraded in acidic phagolysosome lumen, a process that is dependent on lysosomal acidification by progranulin (PGRN) and CFTR. Following efficient lysosomal degradation of the dead cell cargo, LXR is activated and induces expression of the T cell inhibitory factor, arginase 1. Arginase 1-mediated reduction in T cell numbers and activation eventually facilitates metastatic outgrowth. Impairment in these processes and suppression of tumor growth can be achieved via depletion of progranulin or blockade of MerTK or CFTR functions.
showing enrichment of resident macrophages at tumor-adjacent tissue . Colonization of the liver by cancer cells induces KCs to display an inflammatory phenotype that is maintained throughout metastatic progression (cluster 1 and 4). At later stages of metastasis a subset of KCs acquires a pro-fibrotic signature (cluster 4), potentially contributing to hepatic stellate cell/fibroblast activation in advanced lesions and thereby helping to sustain the desmoplastic stroma in PDAC liver
metastasis. In agreement with these findings, a pro-fibrotic phenotype of resident macrophages has recently been reported in primary PDAC and other cancers . Our observed changes in KC clusters in response to metastatic tumors call for future studies to dissect the biological functions of these macrophages in PDAC liver metastasis. Considering MoM clusters, immunostimulatory and immunosuppressive phenotypes coexist in early and advanced metastatic lesions. Notably, phenotypic
conversion toward an immunosuppressive subtype occurs in early and advanced stages of metastasis. Our data suggest that MoMs are constantly recruited to the site of metastasis where they rapidly lose their immunostimulatory potential.
In solid tumors, pan-macrophage targeted strategies using CSF-1 inhibitors as a single agent have shown very modest or no activity . Pan-macrophage-targeted strategies will inevitably remove immunostimulatory and immunosuppressive macrophages. Our findings support future development of tailored approaches, targeting immunosuppressive macrophage clusters or regulators controlling macrophage conversion toward an immunosuppressive subset.
Despite our increasing understanding of macrophage heterogeneity, drivers of macrophage phenotypic and functional polarization in the metastatic microenvironment are not fully elucidated. The presence of dead cells in the tumor microenvironment can induce an immunosuppressive state in macrophages . In normal physiology, efferocytosis-mediated clearance of debris and dead cells by macrophages is pivotal to mitigating inflammation during the resolution phase after injury and preventing chronic tissue damage . Thus, efferocytosis is physiologically used to protect host tissues from immune attack, resulting in local immunosuppression. Here, we show that metastatic cancer cells hijack these evolutionary conserved and hard-wired pathways to create a local immunosuppressive microenvironment in the liver, allowing disseminated cancer cells to escape immune detection and grow.
Tissue-resident macrophages are reportedly more phagocytic than bone marrow-derived macrophages ; our observation suggests that MoMs accumulate at necrotic sites and are able to phagocytose dead resident cells. Reversal of the efferocytosis-induced immunosuppressive state can be achieved by inhibiting phosphatidylserine receptor MerTK. Blockade of MerTK-mediated phagocytosis of dying cancer cells suppresses tumor growth in other cancers . In one study, MerTK blockade impaired macrophage-mediated clearance of apoptotic cells, increasing the accumulation of dead cell bodies and resulting in the activation of the STING pathway in macrophages via cGAMP/ATP . We observed STING pathway activation in the absence of MerTK inhibition, likely due to the high accumulation of dead cells during metastasis-induced liver injury. In agreement, liver injury induces the STING pathway under non-cancerous conditions .
In addition to TAM receptors, such as MerTK, macrophages can bind apoptotic cells via other phosphatidylserine receptors, such as CD300 or CD36 (ref. 5). Given the many efferocytosis receptor variants, we examined whether targeting the downstream phagolysosomal pathway could suppress the efferocytosis-induced immunosuppressive state in macrophages. Of note, uptake of extracellular accumulation of lipids has recently been shown to induce an immunosuppressive phenotype in macrophages . As engulfed lipids are processed through the lysosomal machinery, impairing lysosomal function may also inhibit lipid-induced macrophage conversion, thereby representing an emerging checkpoint of macrophage functions.
Progranulin is an immunoregulatory lysosomal protein . We have shown that progranulin has pro-tumorigenic effects and activates fibroblasts in advanced PDAC liver metastasis . In this study, depletion of progranulin in efferocytic macrophages was sufficient to block upregulation of Arg1 and restore T cell activation. Mechanistically, progranulin regulates the lysosomal acidification, via CFTR, which is required for optimal processing of apoptotic cell cargo and subsequent LXR -mediated upregulation of Arg1 (Fig. 7m). Consequently, CFTR or LXR inhibition also result in macrophage conversion and T cell stimulation. Further studies will be needed to explore whether targeting efferocytosis (MerTK), lysosomal degradation (progranulin/CFTR) or downstream LXR activation will be beneficial, in combination with
hepatotoxic chemotherapy or immune-checkpoint therapies, to harness increased antitumor immune responses.
In summary, our findings showed that PDAC liver metastasis induces macrophage heterogeneity, that metastasis-promoting and restricting subclusters coexist in metastatic livers, and that interfering with macrophage efferocytosis, or its downstream signaling events, inhibits macrophage immunosuppressive functions and restores antitumor immunity. Targeting macrophage efferocytosis may be an attractive new treatment strategy for patients with metastatic PDAC.
Methods
Ethics statement
This study complies with all relevant ethical regulations. Studies involving the use of liver metastasis biopsy and blood samples from patients with treatment-naive, advanced PDAC were accessed using the PINCER platform study, approved by the National Research Ethics Service Committee North West, Greater Manchester REC15/NW/0477. All individuals provided written informed consents on approved institutional protocol. All animal studies were conducted in accordance with UK Home Office regulations under project license P16F36770.
Mice
Mice were housed under specific-pathogen-free conditions at the Biomedical Science Unit at the University of Liverpool. C57BL/6 mice were obtained from Charles River Laboratories. Grn (B6(Cg)-Grn ), Grn (C57BL/6-Grn ) and tdTomato mice (B6.129(Cg)Gt(ROSA)26Sor ) all on a C57BL/6 genetic background were purchased from The Jackson Laboratory. Tamoxifeninducible Csf1r-Cre mice (BL6-Tg(Csf1r-cre/Esr1*)1Jwp/J) on a C57BL/6 background were kindly provided by J.W. Pollard’s laboratory (University of Edinburgh). For animal studies, female mice aged weeks old were used, except for the Grn KO study in spontaneous liver metastasis model, which used male mice. The maximum tumor burden limit of 1.5 cm mean diameter was not exceeded in the studies. In all animal studies, the severity was limited to moderate.
Autochthonous KPC model
KPC (Kras ; Trp53 ; Pdx1-Cre) mice on mixed and pure C57BL/6 backgrounds were bred in-house at the Cancer Research UK (CRUK) Beatson Institute and maintained with environmental enrichment, access to standard chow and water ad libitum. All animal experiments were performed under a UK Home Office license and approved by the University of Glasgow Animal Welfare and Ethical Review Board. Genotyping was performed by Transnetyx. Tissues were collected after primary tumor development or at a humane time point.
Cells
The murine pancreatic cancer cell line KPC FC1199 (kindly provided by the Tuveson Laboratory, Cold Spring Harbor Laboratory) was isolated from PDAC tumort tissues of KPC ( Kras ; ; Pdx1-Cre ) mice on a pure C57BL/6 background and authenticated as previously reported . KPC cells were generated using pHIV Luc-ZsGreen (a gift from B. Welm,University of Utah;Addgene plasmid 39196) through lentivirus infection. Infected cells were selected for high ZsGreen expression levels using a FACSAria III cell sorter (BD Biosciences). Human cell lines HEK293T (CRL-3216), THP-1 (TIB-202) and Jurkat (TIB-152) were obtained from ATCC. THP-1 cells were incubated with 50 nM phorbol 12- myristate 13-acetate (PMA) for 72 h to generate THP-1-derived macrophages.
All cell lines were maintained in RPMI (for THP-1 and Jurkat) or DMEM (for others) supplemented with FBS and antibiotic antimycotic solution ( penicillin, streptomycin and amphotericin B) (Sigma) and tested negative for Mycoplasma. The cell lines used in this article are not listed in the International Cell Line Authentication Committee and National Center for
Biotechnology Information Biosample database of misidentified cell lines.
Primary murine BMMs were generated by flushing BM from femurs and tibias followed by incubation with murine M-CSF (Peprotech) for 5 d . Primary human MoMs were generated by isolating peripheral blood mononuclear cells (PBMCs) using gradient centrifugation, followed by incubation with human M-CSF (Peprotech) for 7 d .
Mouse organoid isolation and culture
Metastatic liver organoid cells were isolated from KPC ( Kras ; Trp53 ; Pdx1-Cre) mice on a C57BL/6 background with advanced liver metastasis using a previously described method . Briefly, metastatic liver tissues were minced and digested at using lagenase Crude Type XI and Dispase II for , followed by further digestion using TrypLE and at for 10 min . Afterwards, digested cells were seeded in Growth Factor-Reduced Matrigel (Corning) and cultured in Advanced DMEM/F12 feeding medium (Thermo Fisher) containing A83-01 (Tocris), (Thermo Fisher), FGF-10 (Peprotech), Gastrin I (Tocris), (Peprotech), 1.25 mM N -acetylcysteine (Sigma), 10 mM nicotinamide (Sigma), -Spondin-containing medium and B27 supplement (Thermo Fisher). When organoids were first isolated, thawed or dissociated into single cells, 10.5 mM Y-27632 was added for the first passage.
Liver metastasis models
Experimentalliver metastasis was induced by injecting in PBS into the spleen. For the scRNA-seq study, primary tumor formation was induced by pancreatic injection of in Matrigel. Ten days after implantation, when primary tumors reached 200, liver metastasis was induced by injecting in PBS into the portal vein. Mice were killed at the indicated time points and metastatic tumor burden in the liver was measured as total flux by ex vivo bioluminescence imaging using IVIS spectrum imaging system (PerkinElmer).
Spontaneous liver metastasis was induced by implanting metastatic PDAC liver organoid cells in Matrigel into the pancreas.
BM transplantation
Recipient tdTomato mice were given 10 Gy irradiation, followed by tail vein injection of donor C57BL/6 BM cells. Approximately 4 weeks after transplantation, BM reconstitution was assessed by flow cytometry of peripheral blood cells. Mice with a chimerism level of were intrasplenically injected with KPC cells to induce liver metastasis. At day 5 after implantation, livers were collected for analysis.
TCM
To prepare the TCM, KPC cells were grown to confluence, after which the medium was discarded and replaced with low-serum ( FBS) medium. After 24 h , the medium was collected and injected at to the tail vein of C57BL mice.
Drug treatments
MerTK inhibitor UNC2250 (APExBIO) was administered at dose via oral gavage once daily in experimental metastasis studies and once every 2 d in the spontaneous metastasis study. For the CD8 T cell depletion study, of anti-mouse CD8 (clone 2.43, BioXcell) or IgG2b isotype control (BioXcell) was administered via intraperitoneal injection every 3 d. For induction of liver injury, a single dose ( ) of -acetyl-para-aminophenol (APAP, Sigma) was administered via intraperitoneal injection 2 d before induction of liver metastasis. For Csf1r-Cre ; Grnf and Csf1r-Cre ;Grn studies, tamoxifen was administered via oral gavage at dose once daily in experimental metastasis model and once every 2 d in spontaneous
metastasis model.LXR inhibitor GSK-2033 (Axon Medchem) was given once daily via intraperitoneal injection at a dose of . CFTR inhibitor CFTRinh172 (Selleckchem) was administered via intraperitoneal injection at a dose of twice a day.
Liver cell isolation
Single-cell suspensions from murine livers were prepared by mechanical and enzymatic disruption with Collagenase P (Roche) in Hanks balanced salt solution at for . Cells were then incubated with trypsin at for 5 min . After removal of debris by filtering the cell suspension through a strainer, red blood cells were removed using RBC Lysis Buffer (BioLegend).
Flow cytometry and cell sorting
Liver single-cell suspensions were prepared as above, followed by resuspension in MACS buffer ( BSA, 2 mMEDTA and PBS) and incubation with anti-mouse CD16/CD32 (BD Biosciences) for 10 min on ice. For cell surface staining, cells were incubated with SYTOX Blue viability marker (Thermo Fisher) and fluorophore-conjugated antibodies (BioLegend; Supplementary Table 4).
For the T cell activation assay, following Fc receptor blocking, cells were incubated with a LIVE/DEAD Fixable Aqua Dead Cell Stain kit (Thermo Fisher) and fluorophore-conjugated CD8 antibody (BioLegend). Cells were then fixed using IC Fixation Buffer and permeabilized using Intracellular Staining Perm Wash Buffer (BioLegend) according to the manufacturer’s instructions, followed by staining with fluorophore-conjugated IFN and granzyme B antibodies (BioLegend; Supplementary Table 4). For apoptotic T cell measurement, cells were incubated with Apotracker Green (BioLegend) for 20 min and co-stained with CD8 antibody (BioLegend).
Flow cytometry data were acquired on a FACS Canto II (BD Biosciences) using FACSDiva (BD Biosciences) software and analyzed using FlowJo v. 10 software (gating strategies in Supplementary Figs.1-6). Cell sorting was performed on a FACS Aria III cell sorter (BD Biosciences). Macrophages were sorted into RLT buffer -mercaptoethanol according to the manufacturer’s instruction for RNA isolation (QIAGEN) or in DMEM supplemented with FBS for the T cell activation assay.
Efferocytosis assay
Before assay, primary murine BMMs or human MoMs were cultured in M-CSF-free and THP-1 cells in PMA-free media for 24 h . Apoptosis in primary murine thymocytes, human lymphocytes or Jurkat cells was induced with staurosporine for 24 h . Apoptotic cells were added to macrophages at a 10:1 (apoptotic cells:macrophages) ratio. In some instances, drugs ( GSK- inhibitor H-151 (Tocris) CFTRinh-172) were added to BMMs 30 min before incubation with apoptotic thymocytes. Macrophages were incubated with apoptotic cells either for 3 h , followed by a washout and further 16-h incubation ( ) or for 20 hunless otherwise stated. For the T cell activation assay, before co-culture with CD8 T cells, BMMs were co-cultured with apoptotic thymocytes for 4 h and then washed.
T cell activation assay
Primary murine splenocytes were activated with Dynabead-conjugated CD3/CD28 at a 2:1 (splenocytes:beads) ratio and co-cultured with BMMs at a 20:1 (splenocytes:BMMs) ratio for 24 h . Cells were then incubated with Brefeldin A Solution (BioLegend) for before immunostaining and flow cytometry analysis as described above.
Phagosomal cargo degradation
Apoptotic thymocytes were stained with Vybrant DiD Cell-Labeling Solution (Thermo Fisher) following the manufacturer’s protocol. BMMs were incubated for 3 h with apoptotic thymocytes followed by thorough washing. Cells were then either fixed for 10 min at room temperature with formalin ( 0 h ) or left for further 16 h to allow for
cargo degradation and fixed the next day. Cells were imaged using Axio Observer Z1 microscope (Zeiss).
Phagolysosomal acidification assay
Lysosomal acidification assay was performed using the IncuCyte pHrodo Red Cell-Labeling kit (Sartorius) or LysoSensor DND-189 (Thermo Fisher). For assay using pHrodo, apoptotic thymocytes were stained with of pHrodo at for 1 h and then with CellTracker CFSE (Thermo Fisher) at for 20 min .
For assays using LysoSensor, 2 h before the assay, BMMs were stained with LysoSensor Green DND-189 (Thermo Fisher) following the manufacturer’s protocol. Apoptotic thymocytes were stained with DiD for 45 min at in the dark and incubated with BMMs.
Live-cell imaging was performed on a Cell Discoverer 7 or LSM800 microscopes (Zeiss). Peak intensity of pHrodo or LysoSensor was analyzed using Zen v.3.8 (Zeiss) or CellTracker (Warwick University).
PLA
A PLA was performed using the Duolink PLA kit (Sigma) according to the manufacturer’s guidelines. Briefly, following isolation and differentiation for 5 d , primary murine BMMs were seeded onto coverslips and left overnight to adhere. BMMs were then fixed with paraformaldehyde and permeabilized with Triton-X/PBS, followed by incubation with LXR and RXR antibodies (Supplementary Table 4) overnight at . BMMs were then incubated with PLA probes, followed by ligation and amplification steps. Image data were acquired on an LSM800 microscope (Zeiss) and analyzed using Zen v.3.8 software (Zeiss).
Immunohistochemistry
Deparaffinization and antigen retrieval were carried out using the PT-Link System (Dako), followed by immunostaining using the EnVision Plus System (Dako). Tissue sections were incubated with a primary antibody (Supplementary Table 4) at overnight, followed by incubation with an HRP-conjugated polymer. Staining was developed using diaminobenzidine and counterstained with hematoxylin (Sigma). Image data were acquired on an Axio Observer Z1 microscope (Zeiss) and analyzed using Zen v.3.8 software (Zeiss).
Immunofluorescence
For tissue staining, deparaffinization and antigen retrieval was carried out using the PT-Link System (Dako), followed by blocking using 10% normal goat serum. Tissue sections were then incubated with primary antibodies (Supplementary Table 4) at overnight, followed by incubation with fluorophore-conjugated secondary antibodies (Supplementary Table 4) and nuclear dye DAPI (Thermo Fisher) at room temperature for 1 h . Tissue sections were then mounted using Fluorescent Mounting Medium (Dako). For staining using two antibodies raised from the same host species, tyramide signal amplification was performed using a Tyramide Superboost kit (Thermo Fisher) according to the manufacturer’s guidelines. Image data were acquired on an Axio Observer Z1 microscope (Zeiss) and analyzed using Zen v.3.8 software (Zeiss).
For immunofluorescence staining of primary murine BMMs, cells were cultured in -Plate 24 -well black (ibidi) and fixed with paraformaldehyde in PBS, pH 7.4, for 10 min at room temperature. Cells were permeabilized for 10 min in Permeabilization Buffer (eBioscience) containing saponin and blocked for 1 h in donkey serum and saponin buffer. Cells were then incubated with primary antibodies (Supplementary Table 4) overnight at , followed by incubation with fluorophore-conjugated secondary antibodies (Supplementary Table 4) and nuclear dye DAPI for 2 h at room temperature. Image data were acquired on an LSM800 microscope (Zeiss) and analyzed using Zen v.3.8 software (Zeiss).
RT-qPCR
RNA was extracted from primary murine BMMs or isolated liver MoMs using RNeasy kit (QIAGEN) and cDNA was synthesized using Quantitect Reverse Transcription kit (QIAGEN). Real time PCR (Supplementary Table3) was performed using EvaGreen reagent (Solis Biodyne) according to the manufacturer’s guideline on AriaMX Real Time PCR System (Agilent).
Immunoblotting
Protein lysates were prepared using a RIPA Lysis Buffer System (Santa Cruz). Protein concentration was determined using a Pierce Protein BCA Assay kit (Thermo Fisher) according to the manufacturer’s guidelines. Equal amounts of proteins were separated on TGX Precast Gel (Bio-Rad) and blotted using a Trans-blot Turbo Transfer System (Bio-Rad). Membranes were blocked in 5% BSA in Tris-buffered saline containing Tween-20 (TBST), followed by incubation with primary antibodies (Supplementary Table 4) at overnight. After washing in TBST, membranes were incubated with HRP-conjugated secondary antibodies (Supplementary Table 4). The protein bands were visualized using the Pierce ECL Western Blotting Substrate (Thermo Fisher) and imaged using Chemidoc Imaging System (Bio-Rad).
Cloning
mCherry and mGr inserts generated using mCherry-mPGRN-F1 and mCherry-mPGRN-F2 primer pairs (Supplementary Table 3), respectively, were cloned into pHIV vector plasmid using SLiCE method by incubating SLiCE buffer, SLiCE extract, 50 ng linearized vector DNA and DNA inserts at a molar ratio of for 1 h at . Insertions were confirmed by sequencing using ef1.F and mcherry.R or mPGRNclonecheck.F and pHIV.rev primers (Supplementary Table3).
To generate GRN KO HEK293T cells, a pair of guides (CCCTTGTGCCCTCATTCATG and GACTGAGTGACCCTAGAATCA) were used to delete approximately 1 kb of DNA from exon 2 to exon 4 of GRN. Complementary guide RNA (sgRNA) sequence primers, guide 1 FP/RP and guide 2 FP/RP (Supplementary Table 3), were phosphorylated using T4 Polynucleotide kinase (Thermo Fisher) following the manufacturer’s protocol. Phosphorylated products were ligated into LentiCRISPRv2 at overnight using T4 DNA Ligase (Thermo Fisher). PCR with hU6-F and guide-specific RP primers were used for sequence verification.
HEK293T cells were transfected with sgRNA constructs using Lipofectamine 2000 (Thermo Fisher). The medium was changed 24 h later and puromycin (Thermo Fisher) was added for 48 h . Cells with successful double deletion were expanded and lack of PGRN expression was confirmed using immunoblotting.
Bulk RNA sequencing
Liver biopsy tissues from patients with pathologically confirmed liver metastasis were homogenized using a Minilys homogenizer (Bertin). Total RNA was extracted using RNAeasy kit (QIAGEN) and genomic DNA was removed using TURBO DNA-free kit (Thermo Fisher). Sequencing libraries were prepared using the SMARTer Stranded Total RNA-Seq Kit v2, Pico Input Mammalian kit (Takara) and sequenced on an Illumina’s NextSeq500 instrument.
scRNA-seq
In situ antibody labeling of liver macrophages in mice with advanced metastasis was performed using a retrograde perfusion of the liver as previously described with FITC-conjugated F4/80 antibody. Single-cell suspensions from unlabeled (healthy and early metastasis) and antibody-labeled (advanced metastasis) livers, as well as pre-metastatic and organoid-induced metastatic livers, were prepared as outlined above and stained with SYTOX Blue (Thermo Fisher), CD45, CD11b and APC-conjugated F4/80 antibodies (Supplementary Table 4). Live macrophages (SYTOX ) were sorted using a FACSAria III cell sorter (BD Biosciences) and processed for library
preparation using the 10x Genomics Chromium Chip B Single Cell kit and Single Cell3′ GEM, Library & Gel Bead kit (10x Genomics), according to the manufacturer’s protocol. Paired-end sequencing was performed using an Illumina NovaSeq 6000 instrument.
FASTQ files were trimmed and filtered to remove low-quality reads. Reads were converted to expression matrices using CellRanger v.3.0.2 (10x Genomics) using the mouse reference genome version mm10 available from the 10x Genomics website. Data were loaded into R v.3.6.1 using the Seurat library, which was used for all subsequent analysis unless stated otherwise. Genes that were detected in fewer than 20 cells as well as mitochondrially-encoded and ribosomal subunit genes were removed. Cells for which fewer than 200 (low quality) or more than 6,000 (higher probability of duplets) genes were detected and removed, as were cells for which mitochondrially-encoded genes made up greater than 10% of the total expression and those that did not express either pan-macrophage marker Cd68 or Adgre1 mRNA. The final experimental model dataset contained 9,171 cells (2,428 healthy, 2,007 early, 1,953 proximal advanced and 2,783 distal advanced) and 13,005 genes. For analysis of MoM subpopulation, 2,820 cells from the experimental model dataset were included. The pre-metastatic and spontaneous model dataset contained 1,366 cells (294 pre-metastatic and 1,022 advanced metastasis).
Data were normalized using the ‘LogNormalize’ method and then scaled. Genes with more variation than could be explained by technical factors were detected using the ‘vst’ method ( genes). Principal-component analysis (PCA) was performed using the RunPCA function, followed by inspection of an elbow plot, which revealed that 20 principal components captured most of the variation in the data. UMAP projections were then calculated using the top 20 principal components. A nearest neighbor map between cells was calculated using the FindNeighbors function, using the top 20 principal components from the PCA to inform the distance matrix. Cell clusters were detected using the FindClusters function, which uses an implementation of the Louvain algorithm, with the resolution parameter set to 0.44. DEGs between clusters were detected using the Wilcoxon rank-sum test as implemented in the FindMarkers function. After Bonferroni correction, genes with an adjusted value less than 0.01 were deemed significant unless stated otherwise.
Pathway and signature enrichment analyses
Signature enrichment analysis in bulk RNA-seq data was performed using the R package GSVA, using the ssGSEA method and normalizing scores. The GO BP pathway enrichment analysis of DEGs was performed using :Profiler.
Statistics and reproducibility
No statistical methods were used to predetermine sample sizes, but we used adequate numbers of samples that would provide statistically significant results based on our previous experience with the tumor models. Animal studies were performed twice, with the exceptions of the MerTKi and Grn KO spontaneous liver metastasis studies, which were performed once. In vitro experiments were repeated three times unless otherwise specified. No data were excluded from the analyses. The experiments were not randomized; however, mice with comparable age and body weight were assigned into control and experimental groups. The exception of this was the MerTKi study in spontaneous liver metastasis model where, before drug treatment, mice with comparable primary tumor burden were randomly assigned. The investigators were not blinded to allocation during experiments and outcome assessment. Data distribution was assumed to be normal but this was not formally tested.
Statistical analysis was performed using GraphPad Prism v. 8 software (GraphPad). A value of was considered statistically significant. In some graphs, was indicated, as GraphPad Prism does not provide the exact values of when it was lower than 0.0001 .
Reporting summary
Further information on research design is available in the Nature Portfolio Reporting Summary linked to this article.
Data availability
Mouse scRNA-seq were submitted to the Gene Expression Omnibus repository and can be accessed under accession no. GSE215118. Human bulk RNA-seq data are available from the authors upon reasonable request and subsequent Data Transfer Agreement to protect patients’ privacy. All other data supporting the findings of this study are available from the corresponding author on reasonable request. Source data are provided with this paper.
Allemani, C. et al. Global surveillance of trends in cancer survival 2000-14 (CONCORD-3): analysis of individual records for 37513025 patients diagnosed with one of 18 cancers from 322 population-based registries in 71 countries. Lancet 391, 1023-1075 (2018).
Ryan, D. P., Hong, T. S. & Bardeesy, N. Pancreatic adenocarcinoma. N. Engl. J. Med. 371, 1039-1049 (2014).
Vincent, A., Herman, J., Schulick, R., Hruban, R. H. & Goggins, M. Pancreatic cancer. Lancet 378, 607-620 (2011).
Conroy, T. et al. FOLFIRINOX or gemcitabine as adjuvant therapy for pancreatic cancer. N. Engl. J. Med. 379, 2395-2406 (2018).
Doran, A. C. Efferocytosis in health and disease. Nat. Rev. Immunol. 20, 254-267 (2020).
Green, D. R. The clearance of dead cells by efferocytosis. Nat. Rev. Mol. Cell Biol. 21, 398-414 (2020).
DeNardo, D. G. & Ruffell, B. Macrophages as regulators of tumour immunity and immunotherapy. Nat. Rev. Immunol. 19, 369-382 (2019).
Kitamura, T., Qian, B.-Z. & Pollard, J. W. Immune cell promotion of metastasis. Nat. Rev. Immunol. 15, 73-86 (2015).
Nielsen, S. R. et al. Macrophage-secreted granulin supports pancreatic cancer metastasis by inducing liver fibrosis. Nat. Cell Biol. 18, 549-560 (2016).
Tsilimigras, D. I. et al. Liver metastases. Nat. Rev. Dis. Prim. 7, 27 (2021).
Doak, G. R., Schwertfeger, K. L. & Wood, D. K. Distant relations: macrophage functions in the metastatic niche. Trends Cancer 4, 445-459 (2018).
Nielsen, S. R. & Schmid, M. C. Macrophages as key drivers of cancer progression and metastasis. Mediators Inflamm. 2017, 9624760 (2017).
Mantovani, A., Allavena, P., Marchesi, F. & Garlanda, C. Macrophages as tools and targets in cancer therapy. Nat. Rev. Drug Discov. 21, 799-820 (2022).
Ma, R.-Y., Black, A. & Qian, B.-Z. Macrophage diversity in cancer revisited in the era of single-cell omics. Trends Immunol. 43, 546-563 (2022).
Quaranta, V. et al. Macrophage-derived granulin drives resistance to immune checkpoint inhibition in metastatic pancreatic cancer. Cancer Res. 78, 4253-4269 (2018).
Wen, Y. Hepatic macrophages in liver homeostasis and diseasesdiversity, plasticity and therapeutic opportunities. Cell. Mol. Immunol. 18, 45-56 (2021).
Guilliams, M. et al. Spatial proteogenomics reveals distinct and evolutionarily conserved hepatic macrophage niches. Cell 185, 379-396 (2022).
Shi, C. & Pamer, E. G. Monocyte recruitment during infection and inflammation. Nat. Rev. Immunol. 11, 762-774 (2011).
Lai, K. K. Y. et al. Stearoyl-CoA desaturase promotes liver fibrosis and tumor development in mice via a Wnt positive-signaling loop by stabilization of low-density lipoprotein-receptor-related proteins 5 and 6. Gastroenterology 152, 1477-1491 (2017).
Kazankov, K. et al. The role of macrophages in nonalcoholic fatty liver disease and nonalcoholic steatohepatitis. Nat. Rev. Gastroenterol. Hepatol. 16, 145-159 (2019).
Li, S. et al. Metabolism drives macrophage heterogeneity in the tumor microenvironment. Cell Rep. 39, 110609 (2022).
Ben-Sasson, S. Z. et al. IL-1 enhances expansion, effector function, tissue localization, and memory response of antigen-specific CD8 T cells. J. Exp. Med. 210, 491-502 (2013).
Mehta, A. K., Gracias, D. T. & Croft, M. TNF activity and T cells. Cytokine 101, 14-18 (2018).
Cai, W. et al. STAT6/Arg1 promotes microglia/macrophage efferocytosis and inflammation resolution in stroke mice. JCI Insight 4, e131355 (2019).
Yurdagul, A. J. et al. Macrophage metabolism of apoptotic cell-derived arginine promotes continual efferocytosis and resolution of injury. Cell Metab. 31, 518-533 (2020).
Wu, Y.-M., Robinson, D. R. & Kung, H.-J. Signal pathways in up-regulation of chemokines by tyrosine kinase MER/NYK in prostate cancer cells. Cancer Res. 64, 7311-7320 (2004).
Linger, R. M. A. et al. Mer or Axl receptor tyrosine kinase inhibition promotes apoptosis, blocks growth and enhances chemosensitivity of human non-small cell lung cancer. Oncogene 32, 3420-3431 (2013).
Graham, D. K., Deryckere, D., Davies, K. D. & Earp, H. S. The TAM family: phosphatidylserine-sensing receptor tyrosine kinases gone awry in cancer. Nat. Rev. Cancer 14, 769-785 (2014).
Zhou, Y. et al. Blockade of the phagocytic receptor MerTK on tumor-associated macrophages enhances P2X7R-dependent STING activation by tumor-derived cGAMP. Immunity 52, 357-373 (2020).
Bhushan, B. et al. Pro-regenerative signaling after acetaminopheninduced acute liver injury in mice identified using a novel incremental dose model. Am. J. Pathol. 184, 3013-3025 (2014).
Adhyapok, P. et al. A computational model of liver tissue damage and repair. PLoS ONE 15, e0243451 (2021).
Kao, A. W., McKay, A., Singh, P. P., Brunet, A. & Huang, E. J. Progranulin, lysosomal regulation and neurodegenerative disease. Nat. Rev. Neurosci. 18, 325-333 (2017).
Yin, F. et al. Exaggerated inflammation, impaired host defense, and neuropathology in progranulin-deficient mice. J. Exp. Med. 207, 117-128 (2010).
Hu, F. et al. Sortilin-mediated endocytosis determines levels of the frontotemporal dementia protein, progranulin. Neuron 68, 654-667 (2010).
Chang, M. C. et al. Progranulin deficiency causes impairment of autophagy and TDP-43 accumulation. J. Exp. Med. 214, 2611-2628 (2017).
Trzeciak, A., Wang, Y.-T. & Perry, J. S. A. First we eat, then we do everything else: The dynamic metabolic regulation of efferocytosis. Cell Metab. 33, 2126-2141 (2021).
Pourcet, B. & Pineda-Torra, I. LXR activation induces arginase 1 expression in macrophages. Atherosclerosis 213, e7 (2010).
Repa, J. J. et al. Regulation of absorption and ABC1-mediated efflux of cholesterol by RXR heterodimers. Science 289, 1524-1529 (2000).
Cunha, L. D. et al. LC3-associated phagocytosis in myeloid cells promotes tumor immune tolerance. Cell 175, 429-441 (2018).
Lee, J. S., Badr, A., Eltobgy, M., Krause, K. & Hamilton, K. CFTR modulators restore acidification of autophago-lysosomes and bacterial clearance in cystic fibrosis macrophages. Front. Cell Infect. Microbiol. 12, 819554 (2022).
Di, A. et al. CFTR regulates phagosome acidification in macrophages and alters bactericidal activity. Nat. Cell Biol. 8, 933-944 (2006).
Cheng, S. et al. A pan-cancer single-cell transcriptional atlas of tumor infiltrating myeloid cells. Cell 184, 792-809 (2021).
Zilionis, R. et al. Single-cell transcriptomics of human and mouse lung cancers reveals conserved myeloid populations across individuals and species. Immunity 50, 1317-1334 (2019).
Mulder, K. et al. Cross-tissue single-cell landscape of human monocytes and macrophages in health and disease. Immunity 54, 1883-1900 (2021).
Zhu, Y. et al. Tissue-resident macrophages in pancreatic ductal adenocarcinoma originate from embryonic hematopoiesis and promote tumor progression. Immunity 47, 323-338 (2017).
Yin, C. & Heit, B. Cellular responses to the efferocytosis of apoptotic cells. Front. Immunol. 12, 631714 (2021).
Roberts, A. W. et al. Tissue-resident macrophages are locally programmed for silent clearance of apoptotic cells. Immunity 47, 913-927 (2017).
Cook, R. S. et al. MerTK inhibition in tumor leukocytes decreases tumor growth and metastasis. J. Clin. Invest. 123, 3231-3242 (2013).
Caetano, M. S. et al. Triple therapy with MerTK and PD1 inhibition plus radiotherapy promotes abscopal antitumor immune responses. Clin. Cancer Res. 25, 7576-7584 (2019).
Davra, V. et al. Axl and mertk receptors cooperate to promote breast cancer progression by combined oncogenic signaling and evasion of host antitumor immunity. Cancer Res. 81, 698-712 (2021).
Chen, R., Du, J., Zhu, H. & Ling, Q. The role of cGAS-STING signalling in liver diseases. JHEP Rep. Innov. Hepatol. 3, 100324 (2021).
Marelli, G. et al. Lipid-loaded macrophages as new therapeutic target in cancer. J. Immunother. Cancer 10, e004584 (2022).
Lan, Y.-J., Sam, N. B., Cheng, M.-H., Pan, H.-F. & Gao, J. Progranulin as a potential therapeutic target in immune-mediated diseases. J. Inflamm. Res. 14, 6543-6556 (2021).
Olive, K. P. et al. Inhibition of Hedgehog signaling enhances delivery of chemotherapy in a mouse model of pancreatic cancer. Science 324, 1457-1461 (2009).
Hingorani, S. R. et al. Trp53R172H and KrasG12D cooperate to promote chromosomal instability and widely metastatic pancreatic ductal adenocarcinoma in mice. Cancer Cell 7, 469-483 (2005).
Boj, S. F. et al. Organoid models of human and mouse ductal pancreatic cancer. Cell 160, 324-338 (2015).
Zhang, Y., Werling, U. & Edelmann, W. Seamless ligation cloning extract (SLiCE) cloning method. Methods Mol. Biol. 1116, 235-244 (2014).
Mederacke, I., Dapito, D. H., Affò, S., Uchinami, H. & Schwabe, R. F. High-yield and high-purity isolation of hepatic stellate cells from normal and fibrotic mouse livers. Nat. Protoc. 10, 305-315 (2015).
Acknowledgements
We thank the Liverpool Shared Research Facilities and the Cancer Research UK (CRUK) Scotland Institute Biological Science Unit for provision of equipment and technical assistance. We thank E. Boyd and M. Glenn for technical support with molecular cloning and imaging acquisition and analysis. We thank research nurse R. Stafferton for obtaining consent from the patients. We also thank the patients and their families who contributed tissue samples and blood donations. These studies were supported by grants from CRUK (A25607, A26978 and A26979), the Medical Research Council
(MR/PO18920/1) and North West Cancer Research Fund for M.C.S, Wellcome Trust (102521/Z/13/Z) and North West Cancer Research Fund to A.M. and CRUK A17196, A2996 and A25233 to J.P.M.
Author contributions
Y.A. designed and performed most of the experiments, analyzed and interpreted the data, and contributed to the preparation of the manuscript. M.R., V.Q., M.A., O.S. and G.B. helped with in vivo experiments, V.C.G. helped with tissue section analysis, K.C. performed bioinformatic analysis. C.N. performed bulk RNA sequencing, F.C. helped with the analysis and interpretation of tumor biopsies. D.P., P.G., C.H. and R.J. provided patient samples. J.W.P. provided CSF-Cre mice and conceptual advice. J.P.M. provided KPC mice and KPC-derived tissue samples. A.M. provided conceptual advice, interpreted data and wrote the manuscript. M.C.S. conceived and supervised the project, interpreted data and wrote the manuscript. All authors critically analyzed and approved the manuscript.
Correspondence and requests for materials should be addressed to Michael C. Schmid.
Peer review information Nature Cancer thanks Massimiliano Mazzone and the other, anonymous, reviewer(s) for their contribution to the peer review of this work.
Extended Data Fig. 1 | Single cell analysis with spatial in-situ labeling identifies heterogeneity in metastasis-associated macrophages.
(a-b) Representative immunofluorescence images (a) and quantification (b) of cytotoxic GzmB cells in human PDAC liver metastasis ( patients). Cancer cells were indicated by staining. Scale bars, . Error bars, mean SEM. -value, two-tailed unpaired t-test. (c) Schematic of the scRNA sequencing approach combined with a spatial in-situ labeling strategy. MAMs=metastasis associated macrophages. (d,e) Representative immunofluorescence images of healthy livers(d) and advanced stage (d10) (e) of liver metastasis following in situ labeling with FITC-conjugated F4/80 antibody ( mice/group, from one experiment) via retrograde perfusion, followed by ex vivo staining with pan-macrophage marker CD68. Scale bars, . (f) Quantification of double-labeled macrophages ( ) in healthy
and tumor bearing livers (healthy mice, metastasis mice) as shown in (d, e). Error bars, mean SEM. -value, two-tailed unpaired t-test. (g) FACS gating strategy for sorting of proximal ( ) and distal metastasis-associated macrophages (dMAMs; ). (h) Heatmap depicting expressions of the most enriched genes in KC vs MoM clusters in the scRNAseq dataset. (i) Proportions of each macrophage cluster identified in the scRNAseq in healthy liver, early metastasis, and advanced metastasis. (j) Expression values of the genes in the cluster 1-4 signatures from scRNAseq analyses versus all genes in the human samples (cluster genes; cluster 4 genes; cluster genes; cluster genes). Boxplots indicate the median, first and third quartiles (hinges), and outlier points extend beyond interquartile ranges from either hinge (whiskers).
Extended Data Fig. 3 | Efferocytosis induces immunosuppressive activity in macrophages that is mediated by Arginase 1. (a) Representative H&E image of dead hepatocytes in pre-metastatic liver at d10 post pancreatic implantation of KPC-derived cells ( mice, from one experiment). Scale bar, . (b) Heatmap depicting relative expression of T cell-stimulatory (red) or repressive genes (blue) in MoM clusters. (c) UMAP plots depicting Arg1 expression levels in MoMs isolated from pre-metastatic and spontaneous advanced metastatic livers. (d) Schematic of efferocytosis assay in primary bone marrow-derived macrophages (BMMs). (e) FACS plot (left) and quantification (right) of apoptotic thymocytes post staurosporine treatment ( biological replicates/group). Error bars, mean SEM. (f) qPCR analysis of in human
primary MoMs ( biological replicates/group). Error bars, mean SEM. -value, two-tailed unpaired t-test. ( ) Relative activation levels of T cell, measured as percentages of IFN or cells, stimulated with anti-CD3/CD28-coupled Dynabeads and co-cultured with MoMs from advanced metastatic livers compared to Dynabeads-only control ( biological replicates/group from one experiment). Error bars, mean SEM. -values, oneway ANOVA with Sidak’s post-test. (i) Percentages of apoptotic (Apotracker ) T-cells, following stimulation with anti-CD3/CD28-coupled Dynabeads and co-culture with BMMs ( biological replicates/group). Error bars, mean SEM. -values, one-way ANOVA with Sidak’s post-test.
Extended Data Fig. 4 | Efferocytosis induces immunosuppressive macrophage conversion. (a) Representative Western blot image of Arginase 1 and loading control Cofilin levels in BMMs (experiment was performed three times with similar results). (b) Relative activation levels of cell, measured as percentages of IFN cells, stimulated with anti-CD3/CD28-coupled Dynabeads and co-cultured with d5 liver MoMs (F4/80+ TIM4-) compared to Dynabeads-only control ( biological replicates/group from one experiment). Error bars, mean SEM. -values, one-way ANOVA with Sidak’s post-test. (c,d) Representative H&E images (c) and quantification (d) of necroses in d5 livers ( mice/group, from one experiment). Scale bars, . Error bars, mean SEM. -value, two-tailed unpaired t-test. (e) Flow cytometry analysis of cells among cancer cells (CD45-ZsGreen+) or macrophages (CD45 ) in d14 livers ( mice/group). Error bars, mean SEM. (f-h) Representative immunofluorescence images (f) and quantification of total (g) and CD74 and/or YM-1-expressing (h) macrophages (F4/80 ) in d5 livers ( mice/group, from one experiment). Scale bars, . Error bars, mean SEM. -value, two-tailed unpaired t-test. (i) qPCR analysis of Ifnb in MoMs (F4/80+TIM4-) from d5 livers ( mice/group). Error bars, mean SEM.
-value, two-tailed unpaired t-test. (j) Relative activation levels of cells, measured as percentages of IFN cells, stimulated with anti-CD3/CD28-coupled Dynabeads and co-cultured with d5 liver MoMs (F4/80+ ) compared to Dynabeads-only control ( biological replicates/group from one experiment). Error bars, mean SEM. -values, one-way ANOVA with Sidak’s post-test. (k) Flow cytometry analysis of activated (CD69 ) T cells in d5 livers ( mice/group). Error bars, mean SEM. -value, two-tailed unpaired t-test. (I) qPCR analysis of in MoMs (F4/80+TIM4 ) isolated from d14 livers ( mice/group). Error bars, mean SEM. -value, two-tailed unpaired t-test. (m-o) Representative immunofluorescence images (m) and quantification of total ( ) and macrophages ( ) in d14 livers. Arrowheads indicate YM-1 macrophages ( mice/group, from one experiment). Scale bars, . Error bars, mean SEM. -value, two-tailed unpaired t-test. (p) Organoid-derived primary tumor burden at d 40 . Error bars, mean SEM. -value, two-tailed unpaired t-test. (q) Flow cytometry analysis of cells among cancer cells (CD45-Epcam+) or macrophages (CD45+F4/80+) in d40 livers ( mice/group). Error bars, mean SEM.
Extended Data Fig. | Liver injury facilitates liver metastasis and induces immunosuppressive macrophage conversion. (a) Schematic diagram illustrating the APAP experiment timeline. (b) Representative H&E images of hepatic necroses at 24 hours post vehicle or APAP injection ( mice/ group, from one experiment). Scale bars, . (c,d) Representative ex vivo bioluminescence imaging (BLI) images (left) and relative tumor burden (right) of d5 (c) and d14 (d) livers (d5 mice/group, from one experiment; d14 control mice; APAP mice, from two experiments). Error bars, mean SEM. -value, two-tailed unpaired t-test. (e-g) Representative immunofluorescence images (e) and quantification of total (f) and CD74 and/or YM-1-expressing (g) macrophages (F4/80+) in d5 livers ( mice/group). Scale bars, . Error bars, mean SEM. -value, two-tailed unpaired t-test. (h) qPCR analysis of Arg1 in MoMs (F4/80+TIM4-) from d5 livers ( mice/group). Error bars, mean SEM.
-value, two-tailed unpaired t-test. (i-k) Representative immunofluorescence images (i) and quantification of total ( ) and cytotoxic granzyme T-cells in d5 livers ( mice/group). Arrowheads indicate cells. Scale bars, . Error bars, mean SEM. -value, two-tailed unpaired t-test. (I) Flow cytometry analysis of activated (CD69 ) cells in d5 livers ( mice/ group). Error bars, mean SEM. -value, two-tailed unpaired t-test. ( ) qPCR analysis of Arg1 in MoMs (F4/80+ TIM4-) from d14 livers ( mice/group). Error bars, mean SEM. -value, two-tailed unpaired t-test. ( ) Representative immunofluorescence images ( ) and quantification of total ( ) and (p) macrophages (F4/80+) ( mice/group). Arrowheads indicate macrophages.Scale bars, . Error bars, mean SEM. -value, two-tailed unpaired t-test.
Extended Data Fig. 7| Progranulin deficiency impairs lysosomal
acidification. (a) Schematic of mCherry-mPGRN constructs (upper) and representative fluorescence images (lower) of transduced, LysoSensor-labeled HEK293T cells (WT cells; GRNKO cells, experiment was performed twice with similar results). Scale bars, . (b) Quantification of LysoSensor intensity as depicted in (a). Error bars, mean SEM. -values, one-way ANOVA with Dunnet’s post-hoc test. (c) qPCR analysis of LXR -encoding gene in BMMs (20hrs). Error bars, mean SEM ( biological replicates/group). -values, two-way ANOVA with Sidak’s post-test. (d) Schematic diagram
illustrating the LXRi experiment timeline. (e) Representative ex vivo bioluminescence imaging (BLI) images (left) and relative tumor burden (right) of d14 livers ( mice/group, from one experiment). Error bars, mean SEM. -value, two-tailed unpaired t-test. (f) Representative Western blot image of IRF3 and loading control Histone H 3 levels in nuclear fractions of BMMs following 4-hour incubation with apoptotic thymocytes (experiment was performed three times with similar results). (g) qPCR analysis of Ifnb1 in BMMs following 4-hour incubation with apoptotic thymocytes ( biological replicates/group). Error bars, mean SEM. -value, two-way ANOVA with Sidak’s post-test.
Extended Data Fig. 8|CFTR blockade impairs efferocytosis-induced macrophage conversion. (a) Schematic of proximity ligation assay (PLA) for mCherry and CFTR (left) and representative fluorescence images (right) of PLA probe-bound fluorophore (PLA, green) in BMMs transduced with mCherry-tagged PGRN (experiment was performed three times with similar results). (b) qPCR analysis of in BMMs (20hrs). Error bars, mean SEM ( biological replicates/group). P-values, two-way ANOVA with Sidak’s post-test. (c) Representative fluorescence images of LysoSensor-labeled BMMs ( cells/group, experiment was performed twice with similar results) incubated with CellTrace-labeled apoptotic thymocytes (ApopT). (d) Quantification of LysoSensor intensity as depicted in (c). Error bars, mean SEM from one experiment. P-value, two-tailed unpaired t-test. (e) Representative Western blot image of Arginase 1 and loading control Cofilin levels in BMMs ( ,
experiment was performed three times with similar results). (f) Relative activation level of CD8 + T cells, measured as percentages of GzmB + cells, stimulated with anti-CD3/CD28-coupled Dynabeads and co-cultured with BMMs compared to Dynabeads-only control ( biological replicates/group from one experiment). Error bars, mean SEM. P-values, one-way ANOVA with Sidak’s posttest. (g) Flow cytometry analysis of activated (CD69+) CD8 + T-cells in d5 livers ( mice/group). Error bars, mean SEM. P -value, two-tailed unpaired t-test. (h) qPCR analysis of Arg1 in MoMs (F4/80 + TIM4-) from d14 livers ( mice/group). Error bars, mean SEM. P-value, two-tailed unpaired t-test. (i-k) Representative immunofluorescence images (i) and quantification of total (j) and YM-1+ (k) macrophages (F4/80+) in d14 livers. Arrowheads indicate YM-1+ macrophages ( mice/group, from one experiment). Scale bars, . Error bars, mean SEM. P -value, two-tailed unpaired t -test.
natureportfolio
Corresponding author(s): Michael C Schmid
Last updated by author(s): Dec 11, 2023
Reporting Summary
Nature Portfolio wishes to improve the reproducibility of the work that we publish. This form provides structure for consistency and transparency in reporting. For further information on Nature Portfolio policies, see our Editorial Policies and the Editorial Policy Checklist.
Statistics
For all statistical analyses, confirm that the following items are present in the figure legend, table legend, main text, or Methods section.
Confirmed
The exact sample size ( ) for each experimental group/condition, given as a discrete number and unit of measurement
A statement on whether measurements were taken from distinct samples or whether the same sample was measured repeatedly
The statistical test(s) used AND whether they are one- or two-sided
Only common tests should be described solely by name; describe more complex techniques in the Methods section.
A description of all covariates tested
A description of any assumptions or corrections, such as tests of normality and adjustment for multiple comparisons
X
A full description of the statistical parameters including central tendency (e.g. means) or other basic estimates (e.g. regression coefficient) AND variation (e.g. standard deviation) or associated estimates of uncertainty (e.g. confidence intervals)
For null hypothesis testing, the test statistic (e.g. ) with confidence intervals, effect sizes, degrees of freedom and value noted Give values as exact values whenever suitable.
For Bayesian analysis, information on the choice of priors and Markov chain Monte Carlo settings
For hierarchical and complex designs, identification of the appropriate level for tests and full reporting of outcomes
Estimates of effect sizes (e.g. Cohen’s , Pearson’s ), indicating how they were calculated
Our web collection on statistics for biologists contains articles on many of the points above.
Software and code
Policy information about availability of computer code
For manuscripts utilizing custom algorithms or software that are central to the research but not yet described in published literature, software must be made available to editors and reviewers. We strongly encourage code deposition in a community repository (e.g. GitHub). See the Nature Portfolio guidelines for submitting code & software for further information.
Data
Policy information about availability of data
All manuscripts must include a data availability statement. This statement should provide the following information, where applicable:
Accession codes, unique identifiers, or web links for publicly available datasets
A description of any restrictions on data availability
For clinical datasets or third party data, please ensure that the statement adheres to our policy
Mouse scRNAseq were submitted to the Gene Expression Omnibus (GEO) repository and can be accessed under GEO accession no. GSE215118. Human bulk RNAseq data are available from the authors upon reasonable request and subsequent Data Transfer Agreement to protect patients’ privacy.
Research involving human participants, their data, or biological material
Policy information about studies with human participants or human data. See also policy information about sex, gender (identity/presentation), and sexual orientation and race, ethnicity and racism.
Reporting on sex and gender
This information has not been collected
Reporting on race, ethnicity, or other socially relevant groupings
This information has not been collected
Population characteristics
Liver biopsy samples were collected from patients with treatment-naïve, advanced PDAC with pathologically confirmed liver metastasis. Blood samples were collected from patients with any stage of PDAC. Patients were 53-64 years old however age was not a consideration for sample collection.
Recruitment
Liver biopsy were part of diagnostic samples from consented patients with treatment-naïve, advanced PDAC at the Royal Liverpool University Hospital. Blood samples were collected from consented patients with any stage of PDAC. No biases were present.
Ethics oversight
Human studies were approved by the National Research Ethics Service (NRES). All individuals provided written informed consents for tissue donation on approved institutional protocol.
Note that full information on the approval of the study protocol must also be provided in the manuscript.
Field-specific reporting
Please select the one below that is the best fit for your research. If you are not sure, read the appropriate sections before making your selection.
X Life sciences Behavioural & social sciences Ecological, evolutionary & environmental sciences
All studies must disclose on these points even when the disclosure is negative.
Sample size
No statistical methods were used to pre-determine sample sizes but we used adequate numbers of samples that would provide statistically significant results based on our previous experience with the tumour models. At least 3 mice were analysed for each group in the animal studies.
Data exclusions
No data were excluded from the analyses.
Replication
Biological replicates are defined for each experiment in the figure legends. Animal studies were performed twice, with the exceptions of the MerTKi and Grn KO spontaneous liver metastasis studies, which were performed once. In vitro experiments were repeated three times unless otherwise specified in the figure legends.
Randomization
The experiments were not randomised, however mice with comparable age and body weight were assigned into control and experimental groups. The exception of this was the MerTKi study in spontaneous liver metastasis model where, prior to drug treatment, mice with comparable primary tumour burden were randomly assigned.
Blinding
The Investigators were not blinded to allocation during experiments and outcome assessment. Treatments, data collections, and analyses were performed by the same person so blinding was not possible. In some instances, imaging data were acquired by a different person who did not have knowledge of expected treatment outcome.
Behavioural & social sciences study design
All studies must disclose on these points even when the disclosure is negative.
Study description
N/A
Research sample
N/A
Sampling strategy
N/A
Data collection
N/A
Timing
N/A
Data exclusions
N/A
Non-participation
N/A
Randomization
N/A
Ecological, evolutionary & environmental sciences study design
All studies must disclose on these points even when the disclosure is negative.
Study description
N/A
Research sample
N/A
Sampling strategy
N/A
Data collection
N/A
Timing and spatial scale
N/A
Data exclusions
N/A
Reproducibility
N/A
Randomization
N/A
Blinding
N/A
Did the study involve field work?
We require information from authors about some types of materials, experimental systems and methods used in many studies. Here, indicate whether each material, system or method listed is relevant to your study. If you are not sure if a list item applies to your research, read the appropriate section before selecting a response.
Policy information about cell lines and Sex and Gender in Research
Cell line source(s)
Authentication
Mycoplasma contamination
Commonly misidentified lines
(See ICLAC register)
PDAC cells derived from KPC mice on C57BL/6 background were provided by Dr. David Tuveson at the Cold Spring Harbor Laboratory. Liver metastatic organoid cultures from KPC mice on C57BL/6 background were created by Michael Schmid lab, University of Liverpool, UK. HEK293T, THP-1, and Jurkat cells were obtained from ATCC.
KPC cells were authenticated by genotyping PCR. HEK293T, THP-1, and Jurkat cells were authenticated by the suppliers.
All cell lines were routinely tested negative for mycoplasma.
No commonly misidentified cell lines were used in this study.
Animals and other research organisms
Policy information about studies involving animals; ARRIVE guidelines recommended for reporting animal research, and Sex and Gender in Research
Laboratory animals
C57BL/6 mice were obtained from Charles River Laboratories. Grn-/- (B6(Cg)-Grntm1.1Aidi), Grnfl/fl (C57BL/6-Grntm1Aidi), and tdTomato+ mice (B6.129(Cg)-Gt(ROSA)26Sortm4(ACTB-tdTomato,-EGFP)Luo) on the C57BL/6 genetic background were purchased from the Jackson Laboratory. Tamoxifen inducible Csf1r-Cre mice (Csf1r-Mer-iCre-Mer) on the C57BL/6 background were provided by
Dr. Jeffrey W. Pollard at the University of Edinburgh.
Wild animals
No wild animals were used in the animal studies.
Reporting on sex
Female mice were used, except for the spontaneous liver metastasis study, which used male mice.
Field-collected samples
No field-collected samples were used in this study.
Ethics oversight
All animal procedures were conducted in accordance with the UK Home Office regulations under the project licence P16F36770. Maximum tumour burden limit of 1.5 cm mean diameter was not exceeded in the studies. In all animal studies, severity was limited to moderate.
Note that full information on the approval of the study protocol must also be provided in the manuscript.
Plants
Seed stocks
N/A
Novel plant genotypes
N/A
Authentication
N/A
Flow Cytometry
Plots
Confirm that:
The axis labels state the marker and fluorochrome used (e.g. CD4-FITC).
The axis scales are clearly visible. Include numbers along axes only for bottom left plot of group (a ‘group’ is an analysis of identical markers).
All plots are contour plots with outliers or pseudocolor plots.
A numerical value for number of cells or percentage (with statistics) is provided.
Methodology
Sample preparation
Single-cell suspensions from murine livers were prepared by mechanical and enzymatic disruption with Collagenase P (Roche) in Hanks Balanced Salt Solution (HBSS) at 37C for 30-40 minutes. Cells were then incubated with trypsin at 37C for 5 minutes. After removal of debris by filtering the cell suspension through a 70um strainer, red blood cells were removed using RBC Lysis Buffer (Biolegend).
Liver cell suspensions were then resuspended in MACS buffer ( BSA, 2 mM EDTA, PBS). Fc receptors were blocked using anti-mouse CD16/CD32 (BD Biosciences) for 10 minutes on ice. For cell surface staining, cells were then incubated with SYTOX Blue viability marker (Thermo Fisher) and fluorophore-conjugated antibodies (Biolegend, Supplementary Table 12). For the T cell activation assay, following Fc receptor blocking, cells were incubated LIVE/DEAD Fixable Aqua Dead Cell Stain Kit (Thermo Fisher) and fluorophore-conjugated CD8 antibody (Biolegend). Cells were then fixed using IC Fixation Buffer and permeabilised using Intracellular Staining Perm Wash Buffer (Biolegend) according to the manufacturer’s instructions, followed by staining with fluorophore-conjugated IFNg antibody.
For T cell activation assay, following Fc receptor blocking, cells were incubated LIVE/DEAD™ Fixable Aqua Dead Cell Stain Kit (Thermo Fisher) and fluorophore-conjugated CD8 antibody (Biolegend). Cells were then fixed using IC Fixation Buffer and permeabilised using Intracellular Staining Perm Wash Buffer (Biolegend) according to the manufacturer’s instructions, followed by staining with fluorophore-conjugated IFN and granzyme B antibodies (Biolegend, Supplementary Table 4).
Instrument
FACSCanto II
FACSAria III (for cell sorting)
Software
BD FACSDiva software
Cell population abundance
FACS-sorted cell abundance and purity was determined using FACSDiva software
Gating strategy
Single cells were gated based on FSC-A and FSC-H. Live cells were gated based on Sytox or LIVE/DEAD staining. Macrophages were gated based on CD45+ F4/80+ staining. CD8 T cells from in vivo samples were gated based on CD45+ CD3+ CD8+ staining. CD8 T cells from in vitro samples were gated based on CD8+.
Tick this box to confirm that a figure exemplifying the gating strategy is provided in the Supplementary Information.
Department of Molecular and Clinical Cancer Medicine, University of Liverpool, Liverpool, UK. Computational Biology Facility, University of Liverpool, Liverpool, UK. Cancer Research UK Scotland Institute, Glasgow, UK. School of Cancer Sciences, University of Glasgow, Glasgow, UK. Deceased: Jeffrey W. Pollard. e-mail: mschmid@liv.ac.uk