إعادة تقييم دور المساحات الخضراء الحضرية في التحكم في تلوث الهواء Reassessing the role of urban green space in air pollution control

المجلة: Proceedings of the National Academy of Sciences، المجلد: 121، العدد: 6
DOI: https://doi.org/10.1073/pnas.2306200121
PMID: https://pubmed.ncbi.nlm.nih.gov/38285938
تاريخ النشر: 2024-01-29

إعادة تقييم دور المساحات الخضراء الحضرية في التحكم في تلوث الهواء

زاندر س. فنتير (د)، أمير حسين حسني (د)، إريك ستانج (د)، فيليب شنايدر ، ونوريا كاستيل (د)حرره ماتي جورجيسكو، جامعة ولاية أريزونا، تمبي، أريزونا؛ استلم في 11 مايو 2023؛ تم قبوله في 14 ديسمبر 2023 من قبل عضو هيئة التحرير سوزان هانسون

الملخص

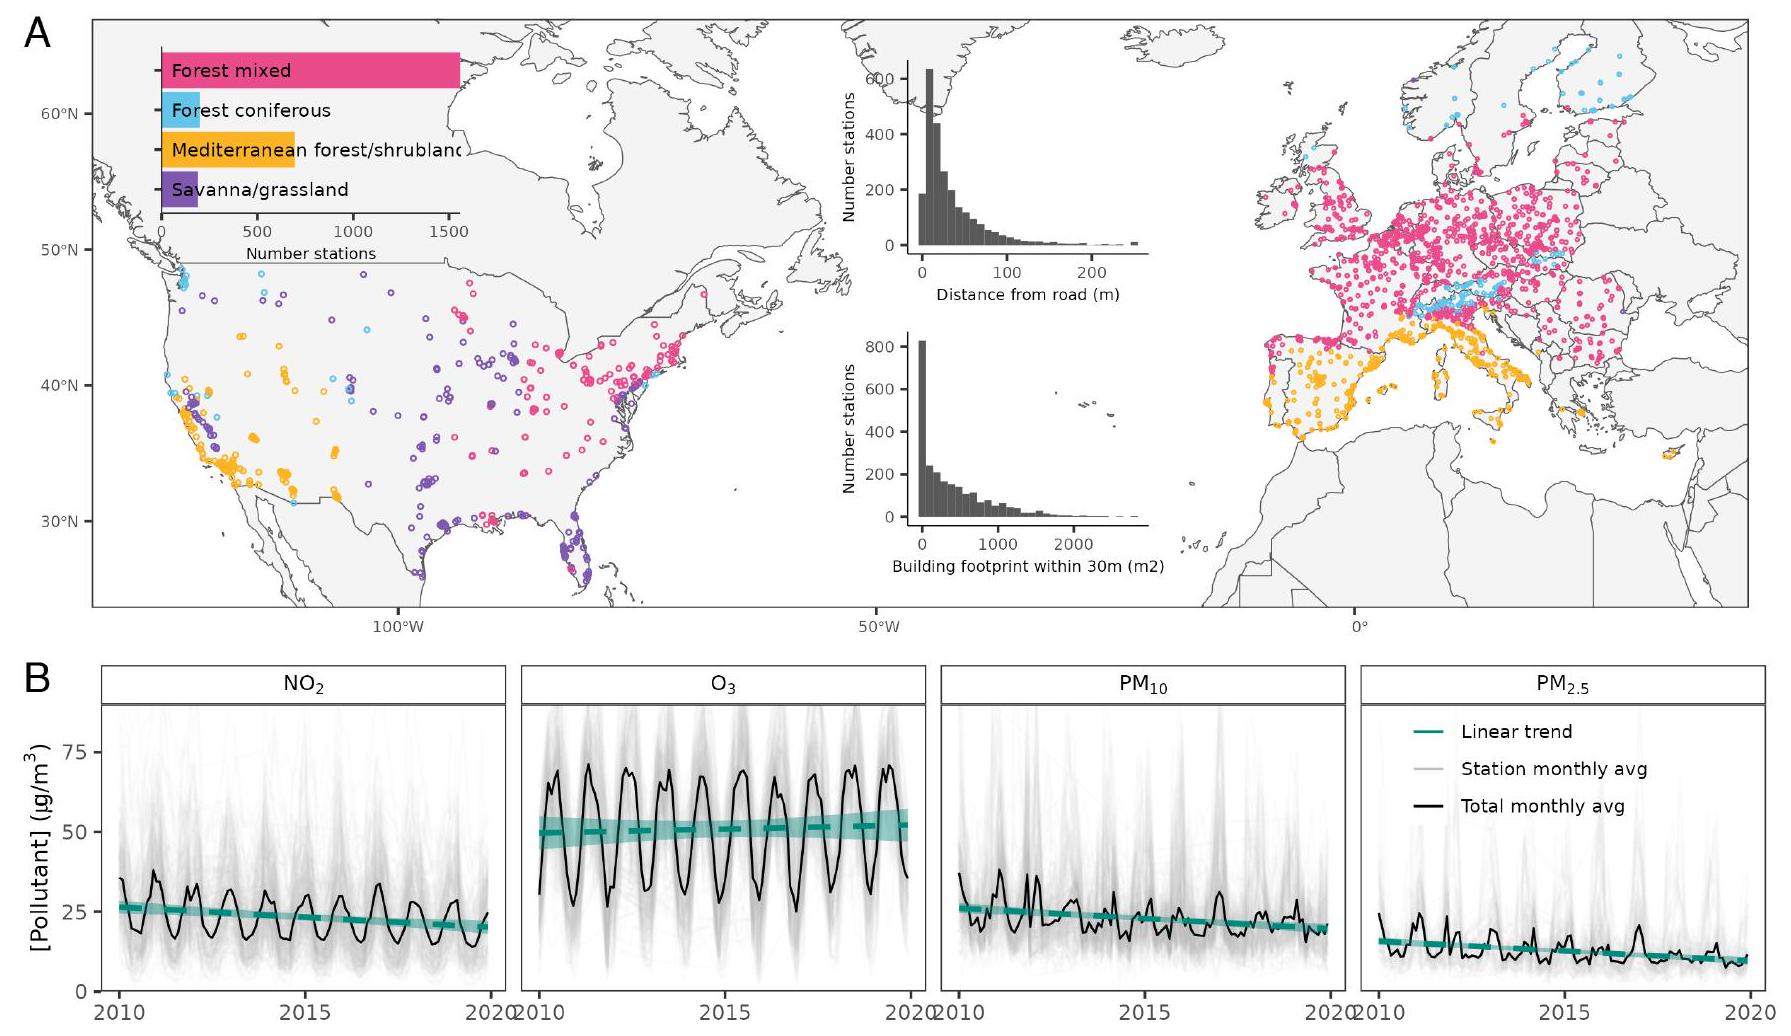
الافتراض بأن النباتات تحسن جودة الهواء شائع في الخطاب العلمي والشعبي والسياسي. ومع ذلك، تظهر الدراسات التجريبية والنمذجة أن تأثير المساحات الخضراء على تركيزات الملوثات الهوائية في البيئات الحضرية متغير للغاية ويعتمد على السياق. قمنا بإعادة زيارة الرابط بين النباتات وجودة الهواء باستخدام التغيرات المستمدة من الأقمار الصناعية للمساحات الخضراء الحضرية وتركيزات الملوثات الهوائية من 2,615 محطة مراقبة قائمة في أوروبا والولايات المتحدة. بين عامي 2010 و2019، سجلت المحطات انخفاضات في الهواء المحيط ، (جزيئات دقيقة) ، و (متوسط )، لكن ليس ، مما يشير إلى النجاح العام للتدخلات السياسية الأخيرة للحد من الانبعاثات البشرية. كان حجم تأثير المساحة الخضراء الكلية على تلوث الهواء ضعيفًا ومتغيرًا للغاية، خاصة على نطاق الشارع (15 إلى 60 مترًا) حيث يمكن أن تقيد النباتات التهوية. ومع ذلك، عند عزل التغيرات في تغطية الأشجار، وجدنا ارتباطًا سلبيًا مع تلوث الهواء على نطاقات الأحياء إلى المدينة (120 إلى ) خاصة بالنسبة لـ وPM. كان تأثير المساحة الخضراء أقل من تأثير ترسيب الملوثات وتشتتها الناتج عن العوامل الجوية بما في ذلك هطول الأمطار والرطوبة وسرعة الرياح. عند حسابها عبر النطاقات المكانية، أدى زيادة بمقدار انحراف معياري واحد في المساحة الخضراء إلى ( إلى ) انخفاض في تلوث الهواء. تشير نتائجنا إلى أنه بينما قد يحسن التشجير الحضري جودة الهواء على نطاق الأحياء إلى المدينة، فإن التأثير معتدل وقد يكون له آثار سلبية على مستوى الشارع اعتمادًا على العوامل الديناميكية الهوائية مثل نوع النباتات وشكل المدينة.

النباتات | التخطيط الحضري | البنية التحتية الخضراء | خدمات النظام البيئي | الصحة العامة
التعرض لتلوث الهواء يؤدي حاليًا إلى المزيد من الوفيات أكثر من الملاريا والسل وفيروس نقص المناعة البشرية/الإيدز مجتمعة (1). يُقدّر أن الجزيئات الدقيقة التي يقل قطرها عن تسبب ما يصل إلى 10 ملايين وفاة زائدة على مستوى العالم (2,3). وبالتالي، حددت منظمة الصحة العالمية تلوث الهواء كأكبر تهديد بيئي لصحة الإنسان (4). نظرًا لأن أكثر من من العبء الصحي العالمي الناتج عن تلوث الهواء يُعزى إلى الانبعاثات البشرية (3,5)، فإن الغالبية العظمى من السياسات لتحسين جودة الهواء تركز على تقليل الانبعاثات (6). تشمل أمثلة إجراءات تقليل الانبعاثات إنتاج الطاقة النظيفة، والمداخن الصناعية الفعالة، وتقليل الاعتماد على المركبات التي تعمل بالديزل، وممارسات الزراعة المستدامة. تتضمن مجموعة بديلة من الاستراتيجيات إزالة أو معالجة تلوث الهواء بعد انبعاثه، من خلال تقنيات التخفيف النشطة والسلبية (7). بينما تهيمن تقنيات التخفيف النشطة مثل الفلاتر الفيزيائية-الكيميائية على الأدبيات المتعلقة بتلوث الهواء الداخلي (8)، فإن طرق التخفيف السلبية – مثل استخدام النباتات – هي الأكثر شيوعًا في الأدبيات المتعلقة بتلوث الهواء الخارجي أو المحيط (9).
الافتراض بأن النباتات الحضرية، التي تُعرف أيضًا بالمساحات الخضراء أو البنية التحتية الخضراء، يمكن أن تحسن جودة الهواء هو اعتقاد واسع الانتشار في أدبيات الصحة العامة (10)، والتخطيط الحضري (11)، وخدمات النظام البيئي (12). تقترح وسائل الإعلام الشعبية (على سبيل المثال، المرجع 13) وحتى المعايير الدولية وأطر السياسات مثل نظام الأمم المتحدة للمحاسبة البيئية-الاقتصادية أن النباتات هي حل قائم على الطبيعة لتقليل تلوث الهواء (14). تشمل الآليات الرئيسية التي يمكن من خلالها تقليل تلوث الهواء بواسطة النباتات الترسيب والتشتت (15). يحدث الترسيب عندما تمتص الملوثات الهوائية على الأسطح النباتية، بينما ينطوي التشتت على تخفيف تركيزات الملوثات الهوائية بسبب التأثيرات الديناميكية الهوائية الناتجة عن هياكل النباتات. تتفوق تأثيرات التشتت على الترسيب بمقدار ترتيب (16). ومع ذلك، يمكن أن تزيد آليات تأثيرات التشتت أيضًا من تركيزات تلوث الهواء المحلية – اعتمادًا على هيكل النباتات (مثل الارتفاع، وكثافة الأوراق)، وسياق الموقع (مثل هندسة وادي الشارع، والمسافة إلى مصدر الانبعاث)، والطقس السائد (مثل سرعة الرياح واتجاهها) (11، 16). على سبيل المثال، يمكن أن تقلل مظلات الأشجار الكثيفة من التهوية في وديان الشوارع، ويمكن أن تزيد الحواجز النباتية المسامية في البيئات المفتوحة من تركيزات تلوث الهواء على جانب الطريق (9، 17). يمكن أن تنتج النباتات أيضًا مركبات عضوية متطايرة (VOC) التي، في حالات مثل لوس أنجلوس، تساهم في ربع الهباء العضوي الثانوي في الأيام الحارة (18).

الملخص

الأهمية تشير نتائجنا إلى أن العلاقة بين النباتات الحضرية وجودة الهواء أكثر تعقيدًا مما كان يُعتقد سابقًا. بينما للتشجير الحضري نتائج صحية إيجابية أخرى للسكان، تشير دراستنا إلى أنه قد لا يكون إجراءً فعالًا لتقليل تلوث الهواء. على الرغم من أننا وجدنا تأثيرات تحسين طفيفة للنباتات على نطاق الأحياء إلى المدينة، يمكن أن تعمل النباتات على مستوى الشارع على تفاقم تلوث الهواء. يجب أن يكون تقليل الانبعاثات البشرية بدلاً من التشجير الحضري هو التركيز الرئيسي لتحسين جودة الهواء.

الانتماءات المؤلفين: المعهد النرويجي لأبحاث الطبيعة، أوسلو 0855، النرويج؛ و معهد الأبحاث المناخية والبيئية NILU، كييلر 2027، النرويج
على الرغم من وجود أدلة على أن النباتات يمكن أن تخفف من تلوث الهواء في الظروف المناسبة، هناك أدلة تجريبية ونمذجة وفيرة على العكس ( ). قد يكون الصراع في الأدبيات العلمية هو السبب في أن الافتراض العام بأن المساحات الخضراء الحضرية تقلل من تلوث الهواء لا يزال شائعًا في الخطاب الشعبي. أحد التفسيرات المحتملة لفجوة المعرفة هو الطبيعة المحلية للدراسات التجريبية والنمذجة التي لا يمكن تعميمها بالضرورة عبر نطاقات مكانية أوسع.
هنا، نستخدم بيانات رصد إقليمية لاختبار الفرضية القائلة بأن التغيرات في تلوث الهواء المحيط مرتبطة بتغيرات في المساحات الخضراء الحضرية المحيطة. نستخدم شبكة قائمة من محطات جودة الهواء في أوروبا (من الوكالة الأوروبية للبيئة؛ EEA) والولايات المتحدة (من وكالة حماية البيئة؛ EPA) لاشتقاق سلاسل زمنية سنوية من ، و تركيزات بين عامي 2010 و2019. يتم قياس التغيرات في المساحات الخضراء حول كل محطة جودة هواء باستخدام (1) مؤشر الفرق الطبيعي للنباتات (NDVI) وتغطية الأشجار الجزئية من الأقمار الصناعية ذات الدقة المتوسطة و(2) التفسير البصري للصور الجوية عالية الدقة جدًا في مجموعة فرعية من محطات جودة الهواء. باستخدام نماذج التأثيرات المختلطة الخطية، نقوم بتقدير العلاقة بين المساحة الخضراء وجودة الهواء بعد التحكم في التغيرات في الانبعاثات البشرية والمناخ.

النتائج والمناقشة

تغيرات تلوث الهواء. كشفت بيانات من 2,615 محطة جودة هواء عن انخفاضات في الهواء المحيط ، و ، و بين عامي 2010 و2019 (الشكل 1). من حيث القيم المطلقة، يعادل هذا انخفاضًا متوسطًا في التركيز قدره ، و ، و . بالمقابل، زادت تركيزات بمقدار
. كانت الانخفاضات متسقة نسبيًا عبر الولايات المتحدة وأوروبا، على الرغم من أن الزيادات في تركيزات الملوثات كانت واضحة في جنوب أوروبا وغرب الولايات المتحدة، خاصة بالنسبة لـ PM (الملحق SI، الشكل S1). التغيرات في جودة الهواء التي وجدت هنا تتماشى بشكل عام مع الاتجاهات المبلغ عنها في الدراسات السابقة التي استخدمت كل من شبكات محطات المراقبة التنظيمية وكذلك أدوات الأقمار الصناعية (على سبيل المثال، المراجع 19-22). القيم الاتجاهية التي وجدت هنا أعلى قليلاً من حيث الحجم من ورقة حديثة جدًا تدرس اتجاهات جودة الهواء الأوروبية لفترة 2005 إلى 2019 بعد تصحيح تأثير الأرصاد الجوية (23). وجدت الأخيرة اتجاهات متوسطة قدرها لـ لـ ، و لـ للمحطات الحضرية/الضواحي. يجب ملاحظة أنه من حيث القيم المطلقة، فإن الانخفاضات التي وجدت في هذه الدراسة وكذلك في واكر وآخرون (23) (حوالي -4 إلى لـ إلى لـ ، و-4 إلى لـ ، جميعها لفترة 14 عامًا) أصغر بكثير من حيث الحجم مقارنةً بالتخفيضات التي تم العثور عليها على سبيل المثال في الصين [حوالي. و تقريباً بشكل عام لـ من 2013 إلى 2017، (24)]. ومع ذلك، يمكن أن تختلف الاتجاهات بشكل كبير مع فترة الدراسة المختارة وكذلك المنهجية المطبقة، وبالتالي فإن من الصعب مقارنتها مباشرة بين الدراسات المختلفة.
محركات تغيير تلوث الهواء. إلى حد كبير، فإن التحسينات الواسعة النطاق في جودة الهواء التي تم العثور عليها هنا هي نتيجة مباشرة لتقليص الانبعاثات الناجح المدفوع بالسياسات الذي تم تنفيذه في كل من أوروبا والولايات المتحدة خلال فترة الدراسة (25). وقد لوحظت نفس الاستجابات لتنظيمات الانبعاثات مؤخرًا في الصين (24). ومع ذلك، استكشفت طريقتنا ما إذا كانت العمليات المحلية مثل تغيير الغطاء النباتي وديناميات المناخ قد تفسر بعض التباين المكاني والزماني في تغييرات جودة الهواء. قمنا أولاً بتقسيم تحليل التغيير لدينا حسب النظام البيئي، نظرًا لأن أنواع الغطاء النباتي المحددة للنظام البيئي والمناخ السائد هي وسطاء مهمون لتأثيرات الغطاء النباتي على جودة الهواء. أظهرت المحطات التي تقع ضمن أنظمة الغابات انخفاضات أكبر مقارنة بتلك الموجودة في الأراضي الشجرية المتوسطية وأنظمة السافانا/المراعي، خاصة بالنسبة للجسيمات الدقيقة (SI Appendix،
الشكل 1. توزيع محطات مراقبة جودة الهواء عبر البيئات الحيوية في أوروبا ) والولايات المتحدة ( ) ( ). تُظهر الرسوم البيانية المرفقة قرب المحطات من الطرق ومساحة المباني ضمن 30 مترًا. تُظهر سلاسل زمنية لملوثات الهواء جنبًا إلى جنب مع الاتجاهات الخطية في .
الشكل S1). قد يكون هذا بسبب النقل بعيد المدى للغبار والدخان، والذي يكون أكثر شيوعًا في البيئات الجافة مثل منطقة البحر الأبيض المتوسط. وقد يكون أيضًا بسبب القدرة الأكبر على الترسيب والتشتت للنباتات الحرجية مقارنةً بالأراضي الشجرية في منطقة البحر الأبيض المتوسط. وجدنا أنه، بينما ، و كانت مرتبطة بشكل إيجابي مع بعضها البعض على مستوى المحطة، أظهر تباينًا أكبر وكان مرتبطًا سلبًا في أغلب الأحيان مع الملوثات الهوائية الأخرى (الملحق SI، الشكل S2). ويرجع ذلك إلى التفاعلات الكيميائية غير الخطية بين والمركبات العضوية المتطايرة (26). على سبيل المثال، تراجع الانبعاثات من ( يمكن أن يؤدي إلى تقليل التقدير المحلي لـ (تفاعل NO مع ).
استكشفنا العلاقة بين التغيرات في المساحات الخضراء وتلوث الهواء باستخدام نماذج مختلطة خطية تأخذ في الاعتبار تأثيرات الانبعاثات المحلية وتغيرات المناخ. تم اشتقاق تصنيفين للنباتات المحيطة بمحطات تلوث الهواء من الأقمار الصناعية، بما في ذلك المساحات الخضراء بشكل عام وتغطية الأشجار بشكل خاص. تم استخدام NDVI من أقمار لاندسات بدقة 30 مترًا لقياس إجمالي المساحات الخضراء لأنه يعتبر مؤشرًا مستخدمًا على نطاق واسع لالتقاط الديناميات في تغطية النباتات وإنتاجيتها. استخدمنا منتجًا تم تطويره بواسطة المسح الجيولوجي الأمريكي من جهاز التصوير بالأشعة تحت الحمراء المتوسطة الدقة (MODIS) بدقة 250 مترًا لقياس التغيرات في تغطية الأشجار. تم تجميع التغيرات في إجمالي المساحات الخضراء وتغطية الأشجار ضمن مناطق عازلة دائرية تحيط بمحطات تلوث الهواء بأشعة تتراوح من 15 إلى . لمساعدة التفسير، قمنا بتصنيف المقاييس المكانية على مستوى الشارع (15 إلى 60 م)، وعلى مستوى الحي (120 إلى ) ، ومستوى المدينة ( 2,000 إلى نظرًا للحدود المحدودة في الدقة المكانية لبيانات MODIS، لم نتمكن من تحديد التغيرات في تغطية الأشجار على مستوى الشارع، ومع ذلك تمكنا من ذلك باستخدام NDVI من لاندسات.
كان تأثير التغيرات في المساحة الخضراء الإجمالية على التغيرات في متوسط التلوث الهوائي السنوي والذروة ضئيلاً عند تجميعه عبر المقاييس المكانية (الشكل 2). يرجى ملاحظة أن “التأثير” هنا يشير إلى الاتجاه الإحصائي وحجم الارتباط بين المتغيرات التفسيرية والاستجابة ولا ينبغي تفسيره على أنه يدل على السببية. عند حسابه عبر الملوثات، كان الارتفاع بمقدار انحراف معياري واحد في المساحة الخضراء الإجمالية مرتبطاً بـ انخفاض في تركيزات الملوثات. على الرغم من عدم وجود تأثير شامل للمساحات الخضراء، إلا أن الزيادات في تغطية الأشجار كانت مرتبطة بانخفاضات في ، و عند حسابها عبر الملوثات، كان الزيادة بمقدار انحراف معياري واحد في تغطية الأشجار مرتبطة بـ انخفاض في تركيزات الملوثات. كان أكبر حجم تأثير لتغطية الأشجار بالنسبة لجزيئات PM حيث، في المتوسط، أدى زيادة واحدة في الانحراف المعياري في نسبة تغطية الأشجار إلى انخفاض في تركيزات الملوثات، يعادل (الشكل 2A). كانت أحجام تأثير المساحات الخضراء أقل من حيث الحجم مقارنة بالعوامل المناخية. على سبيل المثال، كان الزيادة بمقدار انحراف معياري واحد في الرطوبة النسبية مرتبطة بـ انخفاض في الذروة السنوية ، و (الشكل 2B). كانت الرطوبة وسرعة الرياح وهطول الأمطار مرتبطة سلبًا بجميع الملوثات باستثناء .
نظرًا لحجم التأثيرات الأكبر من المحركات المناخية، قد تهيمن الديناميات الجوية على التأثيرات الهامشية التي قد تمتلكها المساحات الخضراء عند التجميع عبر المقاييس المكانية. تتماشى نتائجنا مع توازن الأدلة من الدراسات الرصدية. على سبيل المثال، في تحليل مشابه عبر 31 مدينة عاصمة إقليمية في الصين، وجد هي وآخرون أن الأرصاد الجوية تفسر تباين تركيز الملوثات الحضرية. في دراسة أخرى في الصين بين عامي 2014 و2019، كانت سرعة الرياح وهطول الأمطار مرتبطة سلبًا بشكل كبير مع تركيزات تلوث الهواء الحضري في معظم المحطات البالغ عددها 896 (29). الإجماع العام هو أن التلوث الناتج عن حركة المرور أكثر انتشارًا في
الشكل 2. تقديرات تجريبية للعلاقة بين المتوسط السنوي والحد الأقصى تغيرات ملوثات الهواء، وتغيرات المساحات الخضراء، والانبعاثات، ومتغيرات التنبؤ بالمناخ. يتم الإشارة إلى التقديرات وفترات الثقة 95% بالنقاط وأشرطة الخطأ، ويتم التعبير عنها كنسب مئوية للتغيرات في تركيزات ملوثات الهواء لكل زيادة في المتغير التنبؤي. حجم النقطة يشير إلى مدى التأثير.
ظروف الطقس الراكدة والباردة في المناطق الحضرية. ومع ذلك، يمكن أن تختلف استجابة الجسيمات الدقيقة للرياح اعتمادًا على سرعة الرياح وتوجه وشكل الوادي الشارعي، بالإضافة إلى حجم الجسيمات. على سبيل المثال، يحدث ترسيب الجسيمات الخشنة على النباتات بشكل أكثر كفاءة عند سرعات الرياح العالية، بينما تتراكم الجسيمات فائقة الدقة بشكل أبطأ. باستثناء دراسة واحدة في الهند وجدت علاقات سلبية بين الجسيمات الدقيقة والرطوبة، تظهر مراجعات الأدبيات أن تأثير الرطوبة على جودة الهواء لم يتم دراسته بشكل كافٍ. تشير نتائجنا إلى وجود علاقة سلبية بين الرطوبة وتلوث الهواء، والتي قد تكون بسبب زيادة معدل امتصاص الجسيمات في الغلاف الجوي عند ارتفاع الرطوبة. كما أن الرطوبة مرتبطة ارتباطًا وثيقًا بالهطول، وقد تعمل هذه التركيبة كمنظف طبيعي من خلال زيادة ترسيب الجسيمات على جميع الأسطح.
في نماذجنا المجمعة مكانيًا، استكشفنا كل من متوسط التلوث السنوي (الشكل 2A) وذروة التلوث السنوي (الشكل 2B). كانت أحجام التأثير للمساحات الخضراء والانبعاثات والمتغيرات المناخية عبر الملوثات مشابهة عند النظر في التغيرات في المتوسط السنوي مقابل ذروة التركيزات (الشكل 2B). وهذا يشير إلى أن العلاقة بين الغطاء النباتي وتلوث الهواء غير متأثرة بشدة تركيزات الملوثات ضمن السنوات المدروسة. بعد ذلك، نركز على العلاقات مع متوسط تركيزات الملوثات السنوية، والتي غالبًا ما تستخدم كبديل للتعرض التراكمي في دراسات الوبائيات. .
تأثير المساحات الخضراء اختلف على مقاييس مكانية (الشكل 3A). أظهرت المساحة الخضراء الإجمالية ارتباطًا سلبيًا مع على مقاييس الأحياء، لكن التأثير كان ضئيلاً على مقاييس الشوارع والمدن. التأثير السلبي لتغطية الأشجار على ، و تم تعزيزها مع زيادة النطاق المكاني من مقاييس الأحياء إلى مقاييس المدن. دقيقة أظهرت استجابات متباينة للمساحات الخضراء على مستوى المدينة (الشكل 3A)؛ بينما كان لتغطية الأشجار تأثير سلبي، كان الإجمالي
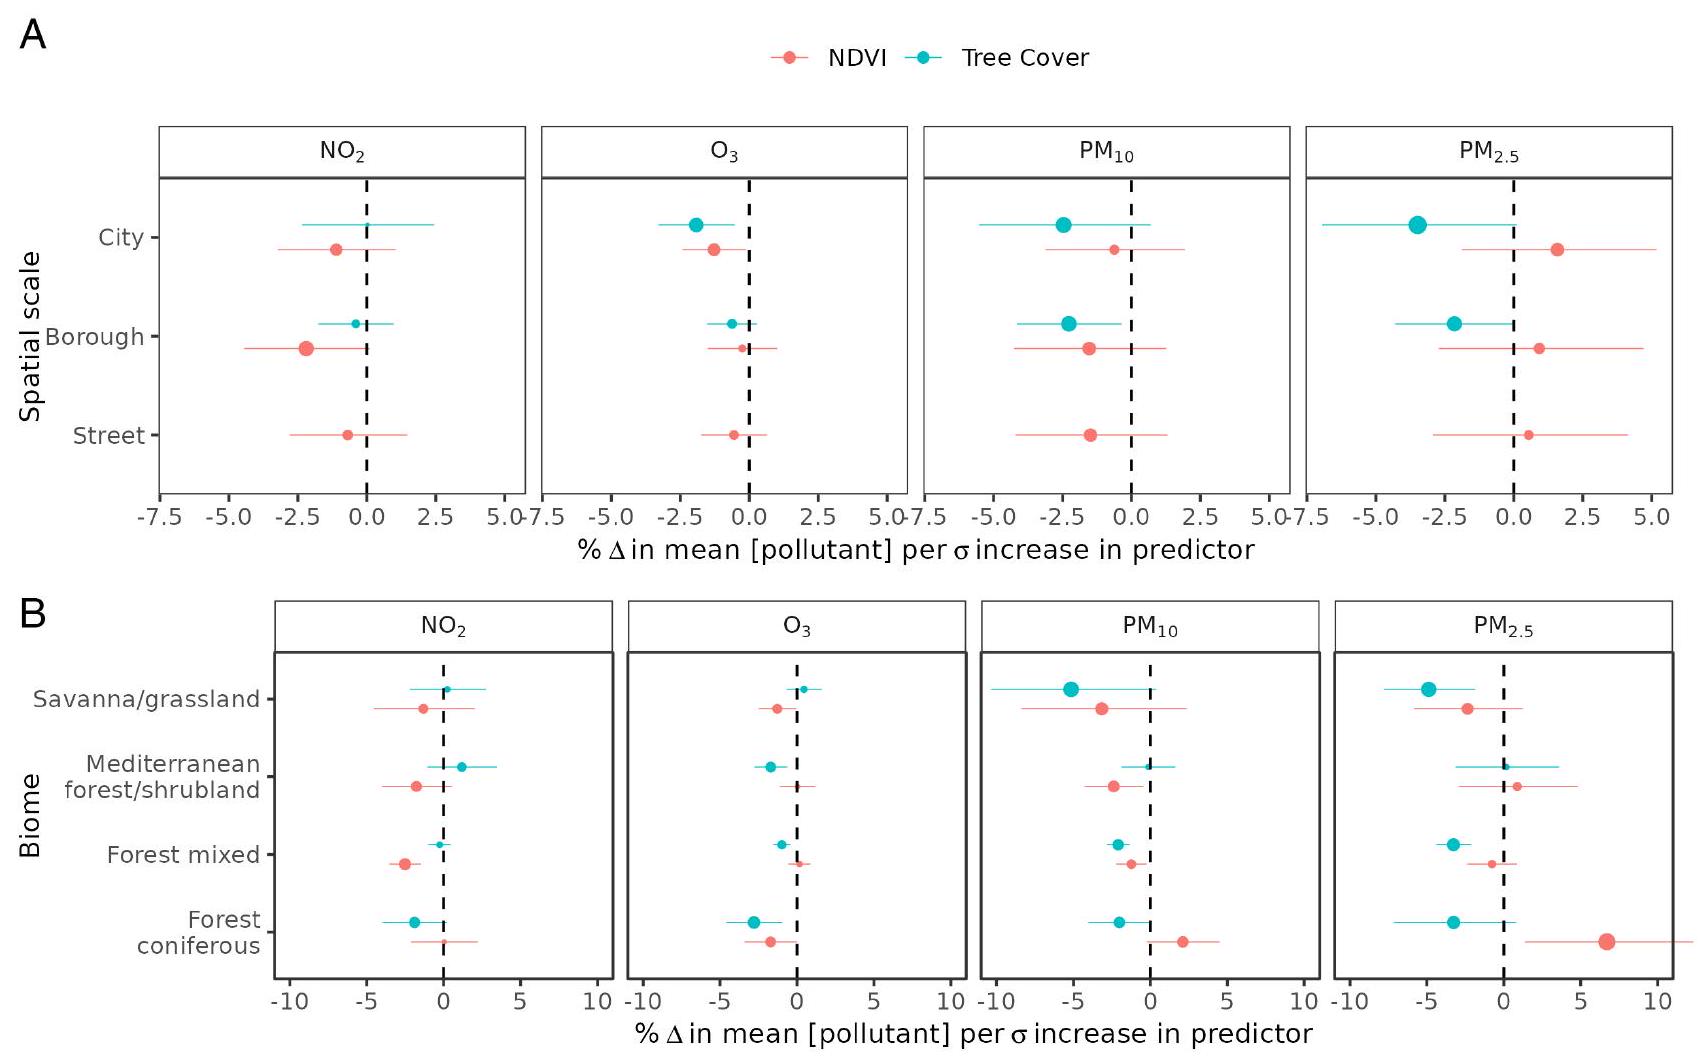
كان للمساحات الخضراء تأثير إيجابي. كانت التغيرات داخل بيئة الغابات الصنوبرية تدفع هذا الاستجابة المتباينة (الشكل 3B). بالمقابل، كان لكل من المساحات الخضراء الإجمالية وتغطية الأشجار تأثيرات سلبية على تركيزات الجسيمات الدقيقة في بيئات السافانا/المراعي، على الرغم من وجود تباين أكبر في تأثيرها كما هو موضح بواسطة فترة الثقة 95%.
لاختبار قوة اكتشافنا بأنه لا يوجد تأثير كبير لتغيرات المساحات الخضراء على مستوى الشارع على تغيرات الملوثات الهوائية، قمنا بإجراء تمرين تحقق يدوي لسلسلة زمنية من NDVI المستمدة من الأقمار الصناعية. قمنا بفحص تغيرات المساحات الخضراء في مجموعة فرعية من المحطات ضمن 60 مترًا من أجهزة مراقبة جودة الهواء. أولاً، قمنا بترتيب المحطات حسب حجم الاتجاه في NDVI لتحديد المحطات المرشحة للفحص اليدوي. ثم، استخدمنا التفسير البصري للصور التاريخية من الأقمار الصناعية في Google Earth Pro (أمثلة في الشكل 4) لإنتاج عينة من 37 محطة مع مكاسب مؤكدة في مدى المساحات الخضراء (متوسط المكسب من التغطية الكاملة غطاء الأشجار بشكل خاص) و65 محطة مع خسائر موثقة في المساحات الخضراء (متوسط خسارة 17.4% من الغطاء الكلي و6.7% من غطاء الأشجار). لم نجد فرقًا كبيرًا في تغييرات تركيز الملوثات بين المحطات التي شهدت زيادات وخسائر في المساحات الخضراء الكلية (الشكل 5A) أو غطاء الأشجار بشكل خاص (الشكل 5B). كانت هذه النتيجة المتسقة في عدم تأثير المساحات الخضراء موجودة عبر جميع الملوثات، مما يدعم النتائج المستخلصة من نماذجنا الإحصائية المعتمدة على الأقمار الصناعية. تتماشى النتيجة مع النتائج المستخلصة من تجارب ونمذجة على نطاق محلي تُظهر أن زراعة النباتات، خاصة النباتات الطويلة، بالقرب من مصادر الانبعاثات مثل جوانب الطرق يمكن أن تقلل من التهوية على المقياس الدقيق وبالتالي تزيد من مستويات التلوث البيئي. تحدد ظروف الموقع إلى حد كبير التأثير الديناميكي الهوائي للمساحات الخضراء على جودة الهواء على المقاييس المحلية. على سبيل المثال، يمكن أن تكون التأثيرات الديناميكية الهوائية مفيدة من حيث توجيه الملوثات بعيدًا عن المشاة.
الشكل 3. تقديرات تجريبية للعلاقة بين التغيرات السنوية في متوسط ملوثات الهواء، والتغيرات في متغيرات التنبؤ بالمساحات الخضراء بما في ذلك NDVI (إجمالي المساحات الخضراء) ونسبة تغطية الأشجار. تم تقدير نماذج وأحجام تأثير منفصلة لكل مقياس مكاني تم تجميع المساحات الخضراء عليه. ) وكل نظام بيئي توجد فيه المحطات تقديرات و مشار إليها بالنقاط وأشرطة الخطأ وتُعبر كنسب مئوية للتغيرات في تركيزات الملوثات الهوائية لكل انحراف معياري ( زيادة في المتغير التنبؤي. حجم النقطة يشير إلى مدى التأثير.
الشكل 4. مثال على زيادة شديدة ( ) و تقليل ( ) في المساحة الخضراء ضمن نطاق 60 متر (على مستوى الشارع) من محطتين لمراقبة جودة الهواء. تم عرض صور جوية من Google Earth Pro للرجوع إليها.
في الحالات التي تكون فيها هناك آثار هوائية ضارة، يمكن أن يكون تأثير انتشار المساحات الخضراء الحضرية غالبًا أقوى بكثير من قدرة النباتات على إزالة الملوثات من خلال الترسيب (16).
قيود الدراسة. نحن نعترف بأن تحليلنا هو ببساطة ارتباطي وأننا لا نستطيع توضيح الروابط السببية بين جودة الهواء ومحركاتها. ومع ذلك، عندما يوضع في سياق الدراسات التجريبية والنمذجة التي لا تجد نتائج متسقة
الشكل 5. التغيرات في تركيزات الملوثات الهوائية على مستوى الشارع (ضمن 60 م) بين عامي 2010 و2019 لمجموعة فرعية من محطات جودة الهواء التي حققت أكبر مكاسب ) والخسائر ( ) في المساحة الخضراء ( ) وتغطية الأشجار ( ) على نفس الفترة. -القيم المستمدة من نماذج التأثيرات المختلطة الخطية تظهر عدم وجود فرق ذو دلالة إحصائية ( ) في تغييرات ملوثات الهواء بين المحطات التي تشهد مكاسب وخسائر كبيرة في المساحات الخضراء.
تأثيرات الغطاء النباتي على جودة الهواء، تشير نتائجنا إلى أن الروابط السببية تعتمد على المقياس والسياق وليست قابلة للتعميم على نطاق واسع. بالإضافة إلى ذلك، حاولنا التحكم في العوامل المحتملة المؤثرة في نماذجنا الإحصائية بما في ذلك الانبعاثات البشرية والتغيرات المناخية. مع بيانات الانبعاثات ذات الدقة الأعلى مثل بيانات حركة المرور الخاصة بالطرق، قد نتوقع أن نشرح المزيد من التغير الزمني في تركيزات تلوث الهواء. وبالمثل، كانت التفاصيل التي تم التقاطها بواسطة بيانات الأقمار الصناعية التي استخدمناها محدودة، وبالتالي لم نتمكن من وصف التغير المكاني الزمني في خصائص الغطاء النباتي مثل الشكل والحجم والتمسّك، والتي تعتبر عوامل مهمة في ترسيب وتشتت الملوثات الهوائية. علاوة على ذلك، تلعب التضاريس وشكل المدينة دورًا رئيسيًا في الروابط بين سرعة الرياح وتهوية الشوارع. في دراستنا، لم يكن لدينا البيانات اللازمة لت quantifying التغيرات في شكل المدينة المحيطة بمحطات جودة الهواء. بخلاف العوامل الدقيقة لجودة الهواء، لم نتمكن من دمج الديناميات الكبيرة التي تعمل على المقاييس الإقليمية مثل النقل بعيد المدى للجسيمات، خاصة بالنسبة لجنوب أوروبا.
قد تكون سلسلة الصور الفضائية المستخدمة لت quantifying تغيير المساحات الخضراء في تحليلنا عرضة لتحيزات زمنية ناتجة عن عيوب الصور مثل تلوث السحب أو التداخل الجوي (34). للتخفيف من هذه العيوب، قمنا بإجراء معالجة مسبقة صارمة لبيانات الأقمار الصناعية وتحققنا يدويًا من تغييرات المساحات الخضراء في مجموعة فرعية من المواقع باستخدام التفسير البصري للصور الجوية. كانت المطابقة بين العينات هي لتغييرات في المساحة الخضراء الإجمالية و لتغيرات في تغطية الأشجار (الملحق SI، الجدول S1). أخيرًا، من المهم أن نلاحظ أن تركيزات الملوثات المطلقة في دراستنا منخفضة مقارنة بتلك الموجودة في الهند والصين. لذلك، من الممكن أن يظهر تأثير أكبر للنباتات على جودة الهواء عند تركيزات ملوثات أعلى بكثير من النطاق الذي تم التقاطه في بياناتنا.
الآثار والاستنتاجات. تضيف نتائجنا تفاصيل مهمة للاعتقاد السائد عمومًا في الأدبيات والنقاش العام بأن المساحات الخضراء تحسن جودة الهواء. وجدنا أن مدى تحسين المساحات الخضراء لجودة الهواء يختلف بشكل كبير بين نوع المساحة الخضراء (غطاء الأشجار مقابل المساحة الخضراء الكلية)، والمقياس المكاني، والبيئة الحيوية. وقد حددت المراجعات الأخيرة للأدبيات فجوة معرفية كبيرة بشأن كيفية تأثير المساحات الخضراء على تلوث الهواء التي تختلف عبر مجموعة من المقاييس المكانية. وجدنا أن المساحة الخضراء الإجمالية لم يكن لها تأثير كبير على مستوى الشارع، ومع ذلك، على نطاق الأحياء إلى المدينة، كانت تغطية الأشجار مرتبطة بانخفاضات في ، و . يتماشى هذا مع النظرية وأعمال النمذجة التي تقترح أنه على المقاييس المحلية، تكون آليات التشتت والديناميكا الهوائية هي السائدة وقد تعمل على تفاقم تلوث الهواء. ومع ذلك، على المقاييس الإقليمية، تكون آليات الترسيب هي السائدة وتعمل على التخفيف من تلوث الهواء. . في الواقع، في مراجعة للأدبيات التجريبية والنمذجة، أدت وجود النباتات في وديان الشوارع إلى زيادة متوسطة قدرها 20 إلى في تركيزات الملوثات عند مقارنتها بالأخاديد الشارعية التي تفتقر إلى الغطاء النباتي (9). على المستويات الحضرية والإقليمية، تقدر الدراسات النمذجة أن المساحات الخضراء يمكن أن تحسن جودة الهواء من خلال الترسيب، وإن كان ذلك بمعدلات بطيئة تتراوح بين 1 و على مدى فترات زمنية عقدية في تحليلنا الذي شمل قارتين، وجدنا تأثيرات أصغر حتى لمساحات الخضرة- انخفاض في تركيزات الملوثات على مدى 10 سنوات – عند المتوسط على المقاييس المكانية.
يصور المؤلفون بشكل روتيني دور النباتات الحضرية في تقليل تلوث الهواء كخدمة نظام بيئي مركزية في تنظيم البيئات الحضرية (38)، وأهم فائدة اقتصادية للأشجار الحضرية (39). وقد أدت هذه الافتراضات المتداولة إلى ظهور النباتات الحضرية وجودة الهواء بشكل بارز في المقترحات الخاصة بإنشاء حسابات اقتصادية بيئية، بما في ذلك الأمم المتحدة.
نظام المحاسبة البيئية-الاقتصادية يحسب المناطق الحضرية (14). تُستخدم أدوات النمذجة التي تركز على الترسيب [مثل i-Tree Eco (40)] وتلك التي تركز على التشتت (مثل نماذج الديناميكا السائلة التي تمت مراجعتها في المرجع 41) غالبًا لحساب الآثار المفيدة للنباتات الحضرية على جودة الهواء. بينما تُستخدم النماذج المستخدمة في محاسبة النظام البيئي مثل i-Tree Eco لتقدير تحسين جودة الهواء باستخدام نموذج ترسيب مركزي حول الأشجار، تحسب نماذج أخرى التقاط الملوثات بناءً على سرعات الترسيب المقدرة لفئات تغطية الأراضي المحددة بشكل عام (42). ومع ذلك، يجادل مؤيدو نماذج الترسيب بأن الأحجام المطلقة للترسيب على أسطح الأشجار تُترجم إلى “فوائد صحية كبيرة” (37). توفر نتائجنا مزيدًا من الأدلة على توافق متزايد بأن i-Tree Eco والنماذج المماثلة قد تفرط في تقدير كل من تأثير النباتات الحضرية في تحسين جودة الهواء والقيم الصحية البشرية المقابلة، خاصة عند تفسيرها على مقاييس محلية (43).
تثير عدة قضايا تساؤلات حول دقة وقابلية تعميم نماذج الترسيب التي لا تأخذ في الاعتبار ديناميات التشتت التي تقدمها النباتات على مستوى الشارع. أولاً، لا تأخذ هذه النماذج في الاعتبار السياق المكاني للنباتات من حيث تكوينها المكاني وقربها من البنية التحتية الحضرية الأخرى التي يمكن أن تعمل على تقليل أو زيادة التهوية. لقد أثبتت آثار التهوية والتخفيف قدرتها الأكبر بشكل ملحوظ على تقليل تركيزات التلوث مقارنةً بالترسيب (16، 44). ثانيًا، لا تأخذ نماذج الترسيب في الاعتبار أي جوانب من تشتت التلوث أو التغذية الراجعة المحتملة بين العمليات التي تستجيب للتغيرات في الكيمياء الجوية والترسيب الرطب (35). يمكن أن تؤدي المستويات المرتفعة من الترسيب الجاف على النباتات إلى تقليل الترسيب الرطب بما يكفي لتقليل أو تقريبًا إلغاء آثار الترسيب الجاف، خاصةً بالنسبة للمركبات التي تترسب ببطء مثل . ثالثًا، يتم توليد المعلمات لسرعة الترسيب المستخدمة في i-Tree Eco والنماذج المماثلة من عدد قليل من الدراسات التي تتضمن ظروفًا قد لا تكون قابلة للتعميم على مناطق أو أنواع أشجار أخرى (15).
نظرًا للاختلاف في تأثيرات النباتات على مستوى الشارع على جودة الهواء، وحجم التأثير العام الضئيل ( على مدى 10 سنوات) الذي لوحظ في دراستنا، هناك سبب للتشكيك في الفوائد الصحية المقدرة التي يُفترض أن تغطيها المساحات الخضراء الحضرية من خلال تحسين جودة الهواء. في مراجعتهم متعددة التخصصات، يبرز آيزنمان وآخرون (43) نقصًا ملحوظًا في الدعم التجريبي للروابط المزعومة بين التغطية الخضراء الحضرية والآثار الإيجابية على الصحة البشرية – مثل انخفاض انتشار الربو. مع استثناء واحد فقط (45)، تتعارض جميع الدراسات التجريبية القائمة على السكان التي تم تناولها في مراجعتهم إما مع أو تفشل في دعم الفوائد المزعومة للأشجار الحضرية في تقليل الربو. تجد العديد من التحقيقات إما عدم وجود رابط بين تغطية الأشجار الحضرية والربو لدى الأطفال أو تجد أن المناطق التي تحتوي على حبوب لقاح الأشجار المتزايدة يمكن أن تؤدي إلى ذروة موسمية أعلى في زيارات قسم الطوارئ، والقبول في المستشفيات، ووصفات أدوية الحساسية بين الأطفال والبالغين (48). على النقيض من استخدام نماذج ميكانيكية للتفاعلات الفيزيائية الحيوية للأشجار ومستويات تلوث الهواء، تبرز الأبحاث الوبائية التي تربط الأشجار بالأمراض التنفسية الآثار السلبية لإنتاج حبوب لقاح الأشجار – وليس فوائد تقليل التلوث (43).
بينما لا تدعم نتائجنا الفرضية القائلة بأن تأثيرات النباتات على تلوث الهواء ستؤدي إلى فوائد صحية عامة كبيرة، لا تزال هناك العديد من الأسباب المهمة لتضمين الأشجار في البيئات الحضرية. تعتبر الأشجار وغيرها من المساحات الخضراء الحضرية مكونات حيوية للأنظمة البيئية الحضرية والتنوع البيولوجي. إنها تخفف من التطرف في هيدرولوجيا المناطق الحضرية (كلا من الفيضانات والجفاف) وتساهم في تنظيم المناخ المحلي. من خلال تقليل تأثير جزيرة الحرارة، يمكن أن تقلل الأشجار من وفيات سكان المدن بسبب درجات الحرارة القصوى (49). يمكن أن تعزز المساحات الخضراء الحضرية أيضًا النشاط البدني، وتحسن الصحة العقلية
النتائج مثل المزاج والانتباه العقلي، مما يحسن في النهاية رفاهية المجتمع .
في ضوء الأدلة التي تشير إلى أن الأشجار الحضرية قد، في تكوينات معينة، تؤدي فعليًا إلى تدهور جودة الهواء، يقترح فوس وآخرون (16) تحولًا في النموذج، ينتقل من السؤال “كيف يمكن استخدام النباتات الحضرية لتحسين جودة الهواء المحلية؟” إلى “كيف يمكن استخدام النباتات الحضرية دون تدهور كبير في جودة الهواء المحلية؟”. تظهر المراجعات الأخيرة للأدبيات ( ) أن النباتات تؤدي بشكل أفضل عندما يكون لها تأثير محدود على تقليل تدفق الهواء. على سبيل المثال، يجب تجنب صفوف الأشجار الكثيفة بدون فجوات ومع وجود مظلات مغلقة في وديان الشوارع ذات الحركة المرورية العالية. في المناطق الأكثر انفتاحًا مع تدفق هواء أكبر، يمكن أن تعمل النباتات كحاجز بين مصدر الانبعاثات والمشاة ولكن ليس كجهاز لتصفية الهواء. تشمل المبادئ التوجيهية الأخرى للنباتات على جانب الطريق: i) تعتبر النباتات منخفضة المستوى مثل السياجات الأفضل لوادي الشارع طالما أنها مستمرة وكثيفة (منخفضة المسامية)، ويفضل أن تكون في موقع مركزي بدلاً من جانب الشارع؛ ii) تعتبر النباتات متوسطة إلى عالية المستوى مثل الأشجار مناسبة لبيئات الطرق المفتوحة (أي خارج وديان الشوارع) طالما أنها كثيفة ومستدامة تعمل كحواجز بين الطريق والمناطق المحيطة. يجب على مخططي المدن أيضًا أن يأخذوا في الاعتبار ما إذا كانت أنواع الأشجار قد تكون قادرة على إنتاج كميات كبيرة من حبوب اللقاح أو المركبات العضوية المتطايرة البيولوجية التي يمكن أن تقلل من جودة الهواء. قد تكون الحواجز الفيزيائية المصنوعة من مواد غير نباتية فعالة أيضًا في التخفيف من تلوث الهواء إذا تم اتباع الإرشادات المذكورة أعلاه. ومع ذلك، إذا كان التركيز على تخفيض تلوث الهواء على نطاق واسع مع أهمية للصحة العامة، تشير نتائجنا إلى أن استراتيجيات ما بعد الانبعاث مثل التشجير الحضري هي حلول غير كافية. من خلال الاستمرار في تعزيز القدرة المزعومة للنباتات على التخفيف من التلوث، نعرض مواردنا للخطر من الاستراتيجية الأكثر أهمية لتحسين جودة الهواء: تقليل الانبعاثات البشرية المنشأ.

المواد والأساليب

بيانات تلوث الهواء. جمعنا بيانات تاريخية ، و سلاسل زمنية يومية من محطات جودة الهواء التي تديرها وكالة حماية البيئة الأمريكية (53) والوكالة الأوروبية للبيئة (54) بين عامي 2010 و2019. اخترنا الملوثات الهوائية التي غالبًا ما يتم الإشارة إليها كعوامل خطر كبيرة للنتائج الصحية العامة السلبية والتي تُستخدم بشكل شائع في الدراسات التي تستكشف تأثيرات النباتات على جودة الهواء . احتوى مجموعة بيانات الوكالة الأوروبية للبيئة على 6,569 محطة واحتوى مجموعة بيانات وكالة حماية البيئة على 2,871 محطة سجلت تركيزات للملوثات التي اخترناها خلال فترة الدراسة. استخدمنا طبقات الاستيطان البشري العالمية التي نشرتها المفوضية الأوروبية (57) لتحديد المحطات الواقعة ضمن المناطق الحضرية والضواحي. هنا، تم تعريف المناطق الحضرية على أنها خلايا شبكية ذات كثافة سطح مبني أكبر من 50%، وكثافة لا تقل عن 300 نسمة وإجمالي عدد سكان لا يقل عن 5,000. كانت أحجام العينات بعد تصفية المحطات الحضرية 4,791 للوكالة الأوروبية للبيئة و1,421 لوكالة حماية البيئة. لتوصيف الاختلاف بشكل أفضل في السياق الحضري الذي تغطيه المحطات، استخدمنا بيانات OpenStreetMap لحساب المسافة إلى أقرب طريق وبصمة المبنى ضمن دائرة نصف قطرها 30 متر لكل محطة.
تم تجميع سلاسل زمنية المحطات أولاً إلى متوسطات شهرية. من سلاسل الوقت الشهرية، استخرجنا متوسطات سنوية وحدود قصوى، نظرًا لأننا كنا مهتمين بكيفية ارتباط المساحات الخضراء بالتغيرات بين السنوات في تلوث الهواء. على الرغم من أن المتوسطات السنوية تتيح لنا استكشاف التأثير التراكمي للمساحات الخضراء على مدار العام، إلا أن الحد الأقصى السنوي يسمح لنا باختبار ما إذا كانت المساحات الخضراء قد يكون لها تأثير أكبر على الأشهر التي تشهد تركيزات ملوثة مرتفعة. تم تجميع سلاسل زمنية الملوثات الخام بشكل تكراري من الساعات إلى الأيام ثم إلى الأشهر وأخيرًا إلى الزيادات السنوية باستخدام معيار استبعاد البيانات بنسبة 25% لكل زيادة زمنية كما طبقته الوكالة الأوروبية للبيئة وسولبرغ وآخرون. يعني معيار استبعاد البيانات أنه تم استبعاد فترة زمنية إذا كان هناك أكثر من قراءات مفقودة خلال تلك الفترة. وبالمثل، استبعدنا سلاسل زمنية للمحطات التي تحتوي على أكثر من 3 سنوات من البيانات المفقودة بين عامي 2010 و2019 (~25% من سلسلة البيانات التي تمتد لعشر سنوات). بعد تصفية سلاسل البيانات الزمنية، شمل مجموعة البيانات لدينا 2,127 محطة EEA و488 محطة EPA، مما أسفر عن 5,558 سلسلة زمنية فريدة للملوثات من 2,615 محطة.
بيانات المساحات الخضراء الحضرية. قمنا باشتقاق مقياسين قائمين على الأقمار الصناعية للمساحات الخضراء بما في ذلك NDVI (59) ونسبة تغطية الأشجار. الأول يسمح لنا باستكشاف التغيرات في المساحات الخضراء بشكل عام، بينما يركز الثاني على تغطية الأشجار بشكل خاص. يُعتبر NDVI مؤشراً جيداً لنسبة تغطية النباتات، وتتناسب ديناميكياته الزمنية مع التغيرات في هيكل الإنتاجية النباتية بمرور الوقت (27). الأشجار هي موضوع معظم دراسات التخفيف من تلوث الهواء، وبالتالي من المتوقع أن يكون لتغيرات تغطية الأشجار أكبر الأثر على تركيزات الملوثات مقارنة بالعشب أو الشجيرات. قمنا بحساب NDVI من أرشيف الأقمار الصناعية للاقمار الصناعية لاندسات بدقة 30 م وتغطية الأشجار الجزئية من مجموعة بيانات Terra MODIS Vegetation Continuous Fields التي أنتجتها هيئة المسح الجيولوجي الأمريكية بدقة 250 م. تم استخراج بيانات الأقمار الصناعية لمجموعة من مناطق العزل (بين 15 م و 16,000 م) حول كل محطة جودة هواء بين عامي 2010 و 2019. نظرًا للحد من الدقة المكانية لبيانات تغطية الأشجار MODIS، ونظرًا لعدم توفر أي بيانات زمنية عالية الدقة لتغطية الأشجار حاليًا، لم نتمكن من استخراج تغييرات تغطية الأشجار إلا لمقاسات عزل أكبر من 120 م. تم اختيار نطاق مناطق العزل بناءً على أكثر المقاييس المكانية شيوعًا المستخدمة في نماذج انتشار تلوث الهواء في الأدبيات. قمنا أيضًا بتصنيف المناطق إلى مقاييس مكانية على مستوى الشارع (15 إلى 60 م)، وعلى مستوى الحي (120 إلى… ) ، ومستوى المدينة ( 2,000 إلى ).
بينما تم حساب بيانات تغطية الأشجار من MODIS مسبقًا، قمنا بتوليد NDVI من صور الانعكاس السطحي لـ Landsat 7 و 8 التي تمت معالجتها في بيئة الحوسبة السحابية لـ Google Earth Engine لاستبعاد البكسلات المغطاة بالسحب والثلوج باستخدام حزمة “pixel_qa”. نظرًا لأننا كنا نعمل عبر مستشعرين من Landsat، فقد طبقنا معاملات المعايرة المتقاطعة المنشورة لتوحيد قيم الانعكاس لـ Landsat 7 و 8 لضمان الاتساق في الاستجابات الطيفية على مر الزمن. قمنا بحساب قيم NDVI السنوية المتوسطة لكل بكسل من Landsat داخل مناطق العازلة حول كل محطة. تم استخدام الوسيط السنوي لتجنب التأثير غير المبرر من قيم NDVI الشاذة. تم حساب متوسط قيم البكسل عبر كل منطقة عازلة لكل عام في سلسلة الزمن. يتم تسليم منتج تغطية الأشجار من MODIS كمتوسطات سنوية؛ لذلك، لم يكن هناك حاجة لتجميع زمني.
لتكملة تحليل NDVI وتغطية الأشجار على نطاق واسع، قمنا بإجراء فحص يدوي للتغيرات الشديدة في المساحات الخضراء حيث من المتوقع أن نجد أكبر التأثيرات على جودة الهواء. للقيام بذلك، قمنا بحساب الاتجاه الخطي في NDVI لكل محطة جودة هواء بين عامي 2010 و2019. تم تصنيف المحطات المرشحة وفقًا لحجم التغير في NDVI، وتم اختيار 125 محطة بأكبر الزيادات والانخفاضات في NDVI للفحص اليدوي. تم تقسيم المحطات المرشحة عشوائيًا بين خمسة جامعين (مؤلفي الورقة) الذين استخدموا التفسير البصري لصور جوجل إيرث الجوية التاريخية لتقدير التغيرات النسبية في المساحات الخضراء ضمن تم تعريف المساحة الخضراء على أنها أي سطح مزروع لم يتم زراعته، بما في ذلك الحدائق، وحواف الطرق، والأحزمة الخضراء، والأشجار، والأسطح الخضراء. بالإضافة إلى التغيرات في إجمالي المساحة الخضراء، ميز بروتوكول جمع البيانات التغيرات في الأشجار مقابل العشب/الشجيرات. اخترنا 60 مترًا لأنه مسافة متوسطة تم الإبلاغ عنها في الأدبيات حول انتشار تلوث الهواء على المقياس الدقيق، والتي تمثل تأثيرات على مستوى الشارع، وكان من العملي تقدير التغيرات في المساحة الخضراء من خلال التفسير البصري للصور الجوية. بعد تصفية المحطات التي كانت الصور الجوية مفقودة فيها في عام 2010 أو 2019 أو كانت غير واضحة جدًا لاتخاذ قرار مستنير بشأن تغيير المساحة الخضراء، تبقى لدينا عينة نهائية من 37 محطة مع زيادات مؤكدة في المساحة الخضراء و65 محطة مع انخفاضات مؤكدة في المساحة الخضراء.
لإجراء التحقق المتبادل من الفحص اليدوي، تم تفسير تغييرات المساحات الخضراء في مجموعة عشوائية من 15 محطة بواسطة أربعة من نفس المراقبين. قمنا بتحديد مدى التوافق بين تفسيرات تغييرات المساحات الخضراء من خلال تقسيمها إلى ثلاث فئات: مستقرة (تغيير )، الربح والخسارة (تغيير ثم قمنا بحساب الدقة المتوازنة من مصفوفة الارتباك التي تم بناؤها من تفسيرات عينة تلو الأخرى (الملحق SI، الجدول S1). تم تعريف الدقة المتوازنة على أنها متوسط الحساسية (معدل الإيجابيات الحقيقية) والخصوصية (معدل السلبيات الحقيقية) ويتم التعبير عنها كنسبة مئوية.
بيانات الانبعاثات. استخدمنا بيانات الانبعاثات العالمية للغازات الدفيئة (GHG) من EDGARv6، النسخة 6(63)، كمصدر لبيانات الانبعاثات البشرية للغازات الدفيئة على مستوى العالم – موزعة بواسطة ECCAD-AERIS؛ انبعاثات المركبات الجوية وتجميع البيانات المساعدة – مركز بيانات وخدمات الغلاف الجوي.https://eccad3.sedoo.fr/metadata/601، تم الوصول إليه في أبريل 2023). على وجه التحديد، جمعنا بيانات الانبعاثات السنوية حول ، و بدقة مكانية شبكية تبلغ من 2010 حتى 2018. انبعاثات
تم استخدامها في و نماذج. قمنا بمعالجة البيانات لتجميع الانبعاثات من جميع القطاعات. تم استخراج سلاسل زمنية لخلايا الشبكة التي تتقاطع مع محطات مراقبة تلوث الهواء. للأسف، لم تكن بيانات عام 2019 متاحة من مجموعة بيانات EDGARv6 الأصلية. لتقدير الانبعاثات لعام 2019، استخدمنا طريقة الاستقراء الخطي لتقدير معدلات انبعاث الملوثات الفردية من عام 2013 حتى عام 2018. تم ذلك في كل محطة لمراقبة تلوث الهواء. وهذا أتاح لنا تقدير الانبعاثات لعام 2019 بناءً على الاتجاه الذي لوحظ في السنوات السابقة.
بيانات المناخ. للتحكم في واستكشاف تأثيرات التغيرات الجوية على تركيزات الملوثات الهوائية، استخدمنا بيانات إعادة تحليل المناخ ERA5-Land من خدمات كوبرنيكوس لتغير المناخ (64). ERA5-Land هو مجموعة بيانات مصفوفة تحتوي على قمنا باستخراج المتوسطات الشهرية لدرجة حرارة الهواء على ارتفاع 2 متر فوق سطح الأرض، وإجمالي هطول الأمطار، وسرعة الرياح، والرطوبة النسبية للخلايا الشبكية التي تتقاطع مع مواقع محطات تلوث الهواء. ثم تم تجميع السلاسل الزمنية الشهرية إلى متوسطات سنوية لكل محطة.
التحليل الإحصائي. تم إجراء التحليل الإحصائي في ثلاثة أجزاء: i) استخدمنا نماذج التأثيرات المختلطة الخطية (65) لتقدير اتجاه وحجم التغيرات في تركيزات الملوثات الجوية عبر مجموعة محطات جودة الهواء بالكامل بين عامي 2010 و2019. تم تضمين السنة كعامل ثابت، بينما تم تعيين محطة جودة الهواء كعامل عشوائي في النموذج للتحكم في
  1. جي. ليليفلد وآخرون، فقدان متوسط العمر المتوقع بسبب تلوث الهواء مقارنة بعوامل الخطر الأخرى: منظور عالمي. أبحاث القلب والأوعية الدموية 116، 1910-1917 (2020).
  2. R. Burnett وآخرون، تقديرات عالمية للوفيات المرتبطة بالتعرض طويل الأمد لجزيئات الهواء الدقيقة الخارجية. وقائع الأكاديمية الوطنية للعلوم في الولايات المتحدة الأمريكية 115، 9592-9597 (2018).
  3. س. تشودري وآخرون، العبء الصحي العالمي لجزيئات PM2.5 في الهواء والمساهمة من الكربون الأسود الناتج عن الأنشطة البشرية والهباء العضوي. البيئة الدولية 159، 107020 (2022).
  4. منظمة الصحة العالمية، “إرشادات جودة الهواء العالمية من منظمة الصحة العالمية. الجسيمات الدقيقة (PM2.5 و PM10)، الأوزون، ثاني أكسيد النيتروجين، ثاني أكسيد الكبريت وأول أكسيد الكربون” (منظمة الصحة العالمية (WHO)، 2021).
  5. جي. ليليفلد وآخرون، آثار إزالة انبعاثات الوقود الأحفوري والانبعاثات البشرية الكلية على الصحة العامة والمناخ. وقائع الأكاديمية الوطنية للعلوم في الولايات المتحدة الأمريكية 116، 7192-7197 (2019).
  6. برنامج الأمم المتحدة للبيئة، “إجراءات جودة الهواء: ملخص عالمي للسياسات والبرامج للحد من تلوث الهواء” (برنامج الأمم المتحدة للبيئة (UNEP)، 2021).
  7. J. González-Martín، N. J. R. Kraakman، C. Pérez، R. Lebrero، R. Muñoz، مراجعة متقدمة حول تلوث الهواء الداخلي واستراتيجيات السيطرة على تلوث الهواء الداخلي. Chemosphere 262، 128376 (2021).
  8. X. يوي وآخرون، التخفيف من تلوث الهواء الداخلي: مراجعة للتقدمات الحديثة في مواد الامتزاز والأكسدة الحفزية. مجلة المواد الخطرة 405، 124138 (2021).
  9. K. V. أبهيجيث وآخرون، أداء تقنيات البنية التحتية الخضراء في تقليل تلوث الهواء في بيئات الطرق المفتوحة والأزقة المبنية – مراجعة. أتموس. إنفيرون. 162، 71-86 (2017).
  10. A. دينر، P. مودي، كيف يمكن للنباتات أن تحمينا من تلوث الهواء؟ مراجعة نقدية حول قدرات المساحات الخضراء في التخفيف من الجسيمات المحمولة جواً من منظور الصحة العامة – مع تداعيات على التخطيط الحضري. Sci. Total Environ. 796، 148605 (2021).
  11. Y. Huang وآخرون، مراجعة لاستراتيجيات التخفيف من تلوث الهواء على جوانب الطرق في الأودية الحضرية. تلوث البيئة. 280، 116971 (2021).
  12. C. J. فيركامب وآخرون، مراجعة للدراسات التي تقيم خدمات النظام البيئي المقدمة من البنية التحتية الخضراء والزرقاء الحضرية. خدمات النظام البيئي 52، 101367 (2021).
  13. V. Traverso، أفضل الأشجار لتقليل تلوث الهواء. بي بي سي، 13 مارس 2023، (2020).https://www.bbc. com/future/article/20200504-which-trees-reduce-air-pollution-best. تم الوصول إليه في 20 سبتمبر 2023.
  14. الأمم المتحدة، “نظام المحاسبة البيئية-الاقتصادية – محاسبة النظام البيئي (SEEA EA)” (منشور ذو غلاف أبيض، 2021).https://seea.un.org/content/system-environmental-economic-accounting-ecosystem-accounting-white-cover-version. تم الوصول إليه في 20 سبتمبر 2023.
  15. س. يانهيل، مراجعة حول الغطاء النباتي الحضري وتلوث الهواء بالجسيمات – الترسيب والتشتت. أتموس. إنفيرون. 105، 130-137 (2015).
  16. بي. إي. ج. فوس، ب. مايهو، ج. فankerkom، س. يانسن، تحسين جودة الهواء المحلية في المدن: هل نزرع الأشجار أم لا؟ التلوث البيئي. 183، 113-122 (2013).
  17. Y. Barwise, P. Kumar، تصميم حواجز نباتية للحد من تلوث الهواء في المدن: مراجعة عملية لاختيار الأنواع النباتية المناسبة. npj Clim. Atmos. Sci. 3، 1-19 (2020).
  18. سي. إم. نوسباومر، آر. سي. كوهين، تأثير الأيروسولات العضوية على الاعتماد الحراري لجزيئات PM 2.5 في حوض لوس أنجلوس. علوم البيئة والتكنولوجيا 55، 3549-3558 (2021).
  19. C. B. B. Guerreiro، V. Foltescu، F. de Leeuw، حالة وجودة الهواء والاتجاهات في أوروبا. Atmos. Environ. 98، 376-384 (2014).
  20. ب. شنايدر، و. أ. لاهوز، ر. فان دير أ، الاتجاهات الحديثة لثاني أكسيد النيتروجين في الطبقة السفلى من الغلاف الجوي المستندة إلى الأقمار الصناعية فوق التجمعات الحضرية الكبيرة في جميع أنحاء العالم. أتموس. كيم. فيز. 15، 1205-1220 (2015).
  21. بي. شنايدر، ر. فان دير إيه، تحليل عالمي باستخدام مستشعر واحد لاتجاهات ثاني أكسيد النيتروجين في الطبقة السفلى من الغلاف الجوي من 2002 إلى 2011 كما لوحظ من الفضاء. مجلة أبحاث الجيوفيزياء. الغلاف الجوي 117، D16309 (2012).
  22. ل. ن. لامسال وآخرون، اتجاهات NO2 في الولايات المتحدة (2005-2013): بيانات نظام جودة الهواء التابع لوكالة حماية البيئة (EPA) مقابل الملاحظات المحسنة من أداة مراقبة الأوزون (OMI). أتموس. إنفيرون. 110، 130-143 (2015).
  23. س.-إي. ووكر، س. سولبرغ، ب. شنايدر، ج. غويريرو، نموذج اتجاه وتنبؤ جودة الهواء AirGAM 2022 r 1. تطوير نماذج علوم الأرض 16، 573-595 (2023).
  24. ق. تشانغ وآخرون، عوامل تحسين جودة الهواء من PM2.5 في الصين من 2013 إلى 2017. وقائع الأكاديمية الوطنية للعلوم في الولايات المتحدة الأمريكية 116، 24463-24469 (2019).
  25. ك. وانغ، م. يان، ي. وانغ، ج.-ب. تشانغ، تأثير صرامة سياسة البيئة على جودة الهواء. أتموس. إنفيرون. 231، 117522 (2020).
  26. ج. جون، ب. أ. كول، أ. زانوبتي، ب. كوتراكيس، تأثير انخفاض تركيز أكاسيد النيتروجين على اتجاهات الأوزون في الولايات المتحدة الأمريكية. جودة الهواء. صحة الغلاف الجوي 8، 283-292 (2015).
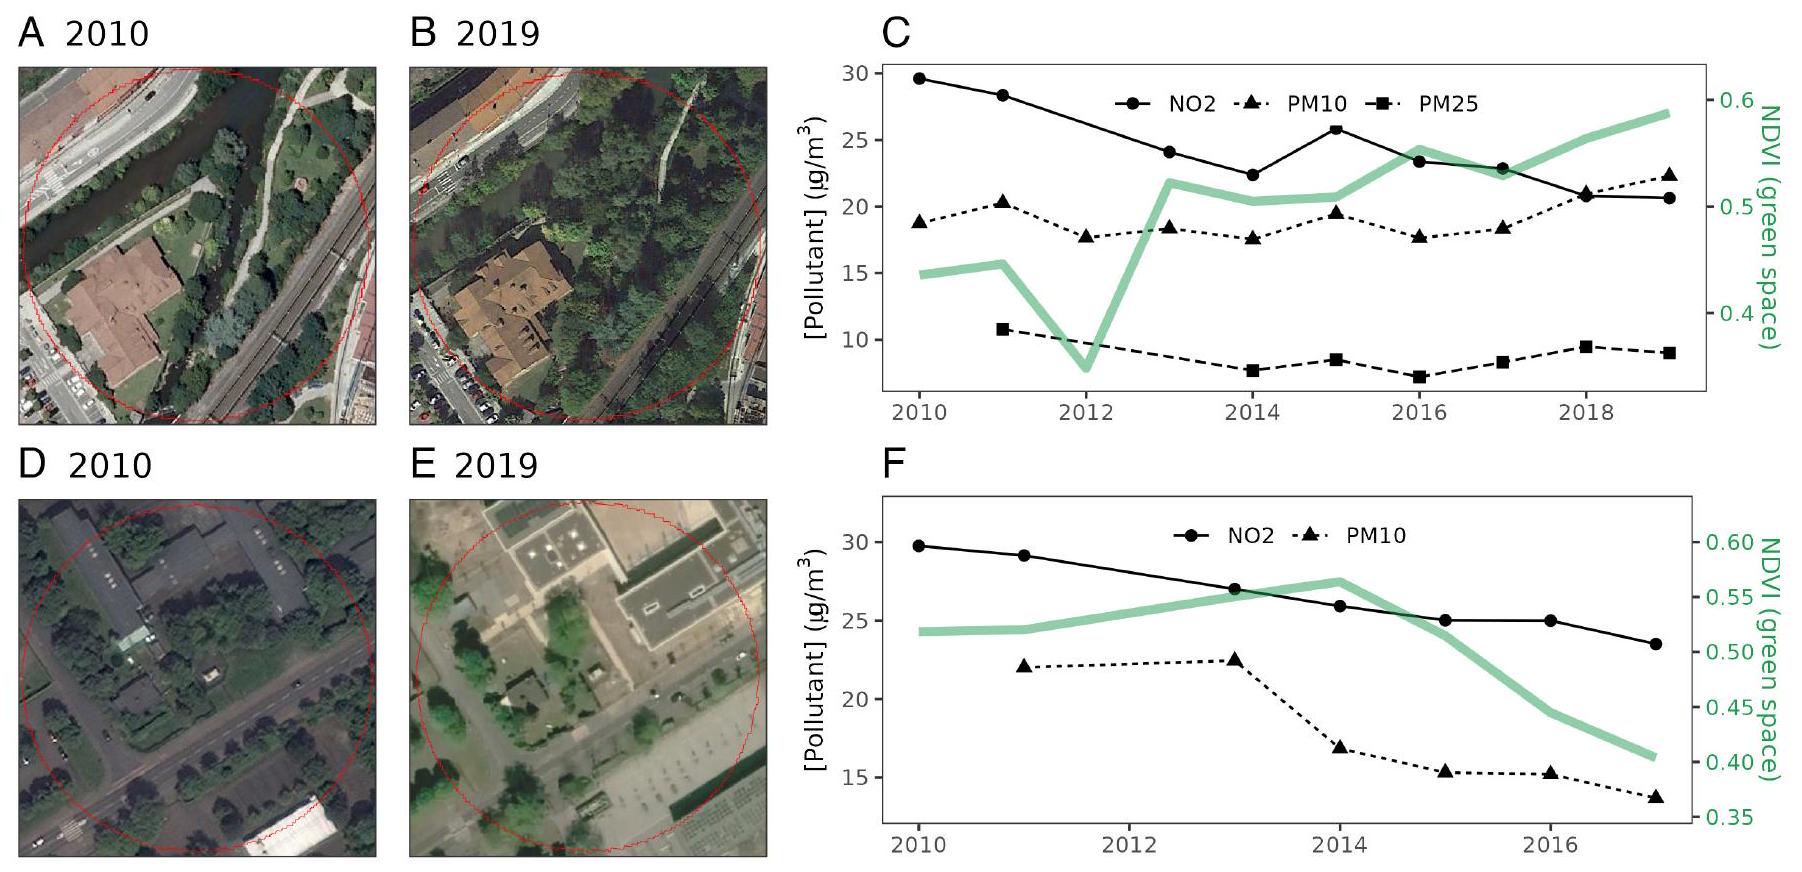
    أي تأثيرات محددة للنموذج. تم تحويل تركيزات الملوثات الهوائية إلى لوغاريتمات لضمان توزيع المتبقيات بشكل طبيعي. ii) لت quantifying العلاقة بين المساحات الخضراء وتركيز الملوثات الهوائية على مر الزمن مع التحكم في تأثير الانبعاثات والمتغيرات المناخية، قمنا بتطبيق نفس هيكل النموذج الموصوف أعلاه، باستثناء إضافة المساحات الخضراء (NDVI وتغطية الأشجار) والانبعاثات والمتغيرات المناخية كأثر ثابت. تم تطبيق نماذج منفصلة لكل بيئة ولكل منطقة عازلة استخدمت لتجميع المساحات الخضراء حول المحطات. iii) تم استخدام المحطات التي تم فحصها يدويًا والتي شهدت تغييرات شديدة في NDVI لتطبيق نماذج مختلطة لاختبار ما إذا كانت الانخفاضات في تلوث الهواء أكبر في المحطات التي شهدت زيادة في المساحات الخضراء مقارنة بالمحطات التي شهدت انخفاضًا في المساحات الخضراء. تم تضمين الاتجاهات الخطية في المتغيرات المناخية وكسب/فقدان تصنيفي في المساحات الخضراء كأثر ثابت، بينما تم تضمين العينة كأثر عشوائي للتحكم في أي تحيزات محددة للعينة في تفسير الصور الجوية.
    توفر البيانات والمواد والبرمجيات. الشيفرة التي تدعم التحليل:https://github.com/zanderVenter/greenspace-air-pollutionتم استخدام بيانات منشورة سابقًا لهذا العمل وتم الاستشهاد بها في قسم الطرق.
    الشكر والتقدير. نشكر مجلس البحث النرويجي على التمويل (رقم المنحة 326641). كما نشكر بامتنان على التمويل الإضافي من خلال مشروع SIS-EO (NILU #B121004). شكر خاص لسورانغسو تشودري على مساهمته في التصور وجمع البيانات.
  27. Z. S. Venter، S. L. Scott، P. G. Desmet، M. T. Hoffman، تطبيق اتجاهات الغطاء النباتي المستمدة من لاندسات في جنوب أفريقيا: الإمكانية لرصد تدهور الأراضي واستعادتها. مؤشرات بيئية 113، 106206 (2020).
  28. جي. هي وآخرون، خصائص تلوث الهواء وعلاقتها بالظروف الجوية خلال 2014-2015 في المدن الكبرى الصينية. تلوث البيئة. 223، 484-496 (2017).
  29. Y. Liu، Y. Zhou، J. Lu، استكشاف العلاقة بين تلوث الهواء والظروف الجوية في الصين تحت إدارة البيئة. Sci. Rep. 10، 14518 (2020).
  30. R. Jayamurugan، B. Kumaravel، S. Palanivelraja، M. Chockalingam، تأثير درجة الحرارة والرطوبة النسبية والتغيرات الموسمية على جودة الهواء المحيط في منطقة حضرية ساحلية. المجلة الدولية لعلوم الغلاف الجوي 2013، 264046 (2013).
  31. H. تشين وآخرون، التعرض طويل الأمد لتلوث الهواء المرتبط بحركة المرور ووفيات القلب والأوعية الدموية. علم الأوبئة 24، 35-43 (2013).
  32. بي. كومار وآخرون، العلاقة بين تلوث الهواء والبنية التحتية الخضراء وصحة الإنسان. البيئة الدولية 133، 105181 (2019).
  33. V. جينينغز، C. E. ريد، C. H. فولر، يمكن أن تحد البنية التحتية الخضراء من الظلم الناتج عن تلوث الهواء ولكنها لا تحله. نات. كوميون. 12، 4681 (2021).
  34. N. E. يونغ وآخرون، دليل البقاء لمعالجة بيانات لاندسات. علم البيئة 98، 920-932 (2017).
  35. E. نيميتز وآخرون، الإمكانيات والقيود في تخفيف تلوث الهواء بواسطة النباتات وعدم اليقين في التقييمات المعتمدة على الترسيب. فلسفة. ترانس. ر. سوس. أ 378، 20190320 (2020).
  36. م. تاليس، ج. تايلور، د. سينيه، ب. فري-سميث، تقدير إزالة تلوث الجسيمات الجوية بواسطة مظلة الأشجار الحضرية في لندن، تحت الظروف الحالية والمستقبلية. تخطيط المناظر الطبيعية والمدن. 103، 129-138 (2011).
  37. دي. جي. نواك، إس. هيرابايشي، أ. بودين، إي. غرينفيلد، تأثيرات الأشجار والغابات على جودة الهواء وصحة الإنسان في الولايات المتحدة. تلوث البيئة. 193، 119-129 (2014).
  38. W. Y. تشين، “الطبيعة الحضرية وخدمات النظام البيئي الحضري” في مدن خضراء: الأشكال والوظائف، ب. تان، ج. جيم، محرران. (سبرينجر، سنغافورة، 2017)، الصفحات 181-199.
  39. X. P. Song، P. Y. Tan، P. Edwards، D. Richards، الفوائد الاقتصادية والتكاليف للأشجار في إدارة الغابات الحضرية: مراجعة منهجية. الغابات الحضرية. الأخضر الحضري. 29، 162-170 (2018).
  40. س. هيرابايشي، ج. ن. كرول، د. ج. نواك، أوصاف نموذج الترسيب الجاف i-Tree Eco (سايتسير، برينستون، نيو جيرسي، 2012).
  41. م. لطيف وآخرون، حول استخدام النمذجة العددية لتشتت الملوثات في الحقول القريبة في البيئات الحضرية – مراجعة. تلوث البيئة 208، 271-283 (2016).
  42. R. P. ريم، م. شروتر، ل. هاين، تطوير محاسبة بيئية مكانية للعديد من خدمات النظام البيئي. خدمات النظام البيئي 10، 6-18 (2014).
  43. ت. س. آيزنمان وآخرون، الأشجار الحضرية، جودة الهواء، والربو: مراجعة متعددة التخصصات. تخطيط المناظر الطبيعية والحضرية. 187، 47-59 (2019).
  44. تي. في. كوككونن وآخرون، تأثير الخصائص الشكلية الحضرية على التباين المكاني لجودة الهواء PM2.5 في وسط مدينة نانجينغ. علوم البيئة. الغلاف الجوي 1، 481-497 (2021).
  45. أ. ألكوك وآخرون، تغطية الأرض وتلوث الهواء مرتبطان بدخول المستشفى بسبب الربو: دراسة مقطعية. البيئة الدولية 109، 29-41 (2017).
  46. م. أ. بيلات وآخرون، تأثير غطاء الأشجار والنباتات على حدوث الربو لدى الأطفال في المناطق الإحصائية الحضرية في تكساس. هورت تكنول. 22، 631-637 (2012).
  47. جي. إس. لوفاسي وآخرون، غطاء الأشجار الحضرية والربو، الصفير، التهاب الأنف، والحساسية تجاه حبوب لقاح الأشجار في مجموعة ولادة في مدينة نيويورك. وجهات نظر الصحة البيئية 121، 494-500 (2013).
  48. S.P. جاروالا وآخرون، العلاقة بين عدد حبوب لقاح الأشجار وزيارات قسم الطوارئ بسبب الربو في مركز حضري ذو كثافة سكانية عالية. مجلة الربو 48، 442-448 (2011).
  49. Z. S. فنتير، N. H. كروغ، D. N. بارتون، ربط البنية التحتية الخضراء بالحرارة الحضرية وتخفيف مخاطر صحة الإنسان في أوسلو، النرويج. Sci. Total Environ. 709، 136193 (2020).
  50. أ. س. لي، ر. ماهيسواران، الفوائد الصحية للمساحات الخضراء الحضرية: مراجعة للأدلة. مجلة الصحة العامة 33، 212-222 (2011).
  51. M. C. كوند، J. M. فلوهر، T. مككيون، C. C. براناس، المساحات الخضراء الحضرية وتأثيرها على صحة الإنسان. المجلة الدولية للبحوث البيئية والصحة العامة 15، 445 (2018).
  52. أ. تيواري وآخرون، اعتبارات لتقييم تأثيرات البنية التحتية الخضراء في نماذج انتشار تلوث الهواء على المقياس الصغير والكبير. العلوم. البيئة الكاملة 672، 410-426 (2019).
  53. وكالة حماية البيئة الأمريكية، “نظام بيانات جودة الهواء [قاعدة بيانات على الإنترنت]”. https:// www.epa.gov/بيانات-جودة-الهواء-الخارجي. تم الوصول إليه في 14 أبريل 2023.
  54. الوكالة الأوروبية للبيئة، “سلاسل زمنية لجودة الهواء (مجموعات بيانات E1a و E2a)”.https://www.eea. europa.eu/data-and-maps/data/aqereporting-9/estatistics-e1a-e2a. تم الوصول إليه في 14 أبريل 2023.
  55. سي. جي. موري وآخرون، العبء العالمي لـ 87 عامل خطر في 204 دول وأقاليم، 1990-2019: تحليل منهجي لدراسة العبء العالمي للأمراض 2019. ذا لانسيت 396، 1223-1249 (2020).
  56. م. غرانستروم، هـ. بلييل، تأثير محدود لنباتات الأشجار الحضرية على و تركيزات بالقرب من مسار حركة المرور. تلوث البيئة. 189، 73-76 (2014).
  57. م. شيافينا، م. ميلكيوري، م. بيساريزي، “طبقات تسوية GHS-SMOD R2023A، تطبيق منهجية درجة التحضر (المرحلة الأولى) على GHS-POP R2023A وGHS-BUILT-S R2023A، متعددة الزمن (1975-2030)”. المفوضية الأوروبية، المركز المشترك للبحوث (JRC) [مجموعة بيانات] doi:https://doi.org/10.2905/A0DF7A6F-49DE-46EA-9BDE-563437A6E2BAمعرف العملية: http://data. europa.eu/89h/a0df7abf-49de-46ea-9bde-563437abe2ba. تم الوصول إليه في 20 سبتمبر 2023.
  58. س. سولبرغ، س.-إي. ووكر، ب. شنايدر، ج. غويريرو، قياس تأثير تدابير الإغلاق بسبب كوفيد-19 على مستويات ثاني أكسيد النيتروجين في جميع أنحاء أوروبا. الغلاف الجوي 12، 131 (2021).
  59. سي. جي. تاكر، التركيبات الخطية الحمراء والأشعة تحت الحمراء الضوئية لمراقبة الغطاء النباتي. الاستشعار عن بعد. البيئة 8، 127-150 (1979).
  60. سي. إم. دي ميسيلي وآخرون، الحقول المستمرة للنباتات العالمية الآلية السنوية (MOD44B) بدقة مكانية 250 م لسنوات البيانات بدءًا من اليوم 65 (الإصدار 6، جامعة ماريلاند، كوليج بارك، ماريلاند، 2017)، الصفحات 2000-2010.
  61. N. غورليك وآخرون، محرك جوجل الأرض: تحليل جغرافي مكاني على مستوى الكوكب للجميع. الاستشعار عن بعد. البيئة 202، 18-27 (2017).
  62. دي. بي. روي وآخرون، توصيف طول الموجة الانعكاسية للاقمار الصناعية لاندسات-7 إلى لاندسات-8 واستمرارية مؤشر الفرق النباتي المعدل. الاستشعار عن بعد. البيئة 185، 57-70 (2016).
  63. م. كريبا وآخرون، انبعاثات ثاني أكسيد الكربون والغازات الدفيئة من جميع دول العالم (مكتب نشر الاتحاد الأوروبي، لوكسمبورغ، 2019).
  64. J. Muñoز-Sاباطر وآخرون، ERA5-Land: مجموعة بيانات إعادة تحليل عالمية متطورة لتطبيقات الأراضي. بيانات علوم الأرض 13، 4349-4383 (2021).
  65. دي. بيتيز، تركيب نماذج مختلطة خطية في R. أخبار R 5، 27-30 (2005).

  1. مساهمات المؤلفين: صمم ز.س.ف.، أ.هـ.، إ.س.، ب.س.، و ن.س. البحث؛ أجرى ز.س.ف. البحث؛ قام ز.س.ف. و أ.هـ. بتحليل البيانات؛ و كتب ز.س.ف.، أ.هـ.، إ.س.، ب.س.، و ن.س. الورقة.
    يعلن المؤلفون عدم وجود مصالح متنافسة.
    هذه المقالة هي تقديم مباشر إلى PNAS. م.غ. هو محرر ضيف تم دعوته من قبل هيئة التحرير.
    حقوق الطبع والنشر © 2024 المؤلف(ون). نُشر بواسطة PNAS. يتم توزيع هذه المقالة المفتوحة الوصول بموجب ترخيص المشاع الإبداعي للاستخدام المنسوب 4.0 (CC BY).
    على الرغم من أن PNAS تطلب من المؤلفين الالتزام بتسميات الأمم المتحدة للخرائط (https://www.un.org/الجغرافيا المكانية/الخرائط الجغرافية)، سياستنا هي نشر الخرائط كما قدمها المؤلفون.
    إلى من يمكن توجيه المراسلات. البريد الإلكتروني:زاندير.فينتر@نينا.no.
    تحتوي هذه المقالة على معلومات داعمة على الإنترنت فيhttps://www.pnas.org/lookup/suppl/doi:10.1073/pnas. 2306200121/-/DCSupplemental.
    نُشر في 29 يناير 2024.

Journal: Proceedings of the National Academy of Sciences, Volume: 121, Issue: 6
DOI: https://doi.org/10.1073/pnas.2306200121
PMID: https://pubmed.ncbi.nlm.nih.gov/38285938
Publication Date: 2024-01-29

Reassessing the role of urban green space in air pollution control

Zander S. Venter (D), Amirhossein Hassani (D), Erik Stange (D), Philipp Schneider , and Núria Castell (D)Edited by Matei Georgescu, Arizona State University, Tempe, AZ; received May 11, 2023; accepted December 14, 2023 by Editorial Board Member Susan Hanson

Abstract

The assumption that vegetation improves air quality is prevalent in scientific, popular, and political discourse. However, experimental and modeling studies show the effect of green space on air pollutant concentrations in urban settings is highly variable and context specific. We revisited the link between vegetation and air quality using satellite-derived changes of urban green space and air pollutant concentrations from 2,615 established monitoring stations over Europe and the United States. Between 2010 and 2019, stations recorded declines in ambient , (particulate matter) , and (average of ), but not , pointing to the general success of recent policy interventions to restrict anthropogenic emissions. The effect size of total green space on air pollution was weak and highly variable, particularly at the street scale ( 15 to 60 m radius) where vegetation can restrict ventilation. However, when isolating changes in tree cover, we found a negative association with air pollution at borough to city scales ( 120 to ) particularly for and PM. The effect of green space was smaller than the pollutant deposition and dispersion effects of meteorological drivers including precipitation, humidity, and wind speed. When averaged across spatial scales, a one SD increase in green space resulted in a ( to ) decline in air pollution. Our findings suggest that while urban greening may improve air quality at the borough-to-city scale, the impact is moderate and may have detrimental street-level effects depending on aerodynamic factors like vegetation type and urban form.

vegetation | urban planning | green infrastructure | ecosystem service | public health
Exposure to air pollution currently results in more deaths than malaria, tuberculosis, and HIV/AIDS combined (1). Particulate matter with a diameter of less than is estimated to cause up to 10 million excess deaths globally ( 2,3 ). Consequently, the World Health Organization has identified air pollution as the single biggest environmental threat to human health (4). Given that over of the global health burden from air pollution is attributable to anthropogenic emissions ( 3,5 ), the majority of policies to improve air quality are focused on cutting emissions (6). Examples of emission abatement actions include cleaner energy production, efficient industrial smokestacks, reduced reliance on diesel vehicles, and sustainable agriculture practices. An alternative set of strategies involve removing or remediating air pollution after it has been emitted, through both active and passive abatement technologies (7). While active abatement technologies such as physical-chemical filters dominate the literature on indoor air pollution (8), passive abatement methods-such as utilizing vegetation-are most prevalent in the literature on outdoor or ambient air pollution (9).
The assumption that urban vegetation, also referred to as green space or green infrastructure, can improve air quality is widely held in the public health (10), urban planning (11), and ecosystem service (12) literature. Popular media (e.g., ref. 13) and even international standards and policy frameworks such as the UN System of Environmental-Economic Accounting propose vegetation as a nature-based solution to decrease air pollution (14). The primary mechanisms through which air pollution may be reduced by vegetation include deposition and dispersion (15). Deposition occurs when air pollutants adsorb to vegetative surfaces, whereas dispersion involves the dilution of air pollutant concentrations due to aerodynamic effects induced by vegetation structures. Dispersion effects outweigh deposition by an order of magnitude (16). However, the mechanisms of dispersion effects can also increase local air pollution concentrations-depending on the structure of the vegetation (e.g., height, leaf density), site context (e.g., street canyon geometry, distance to emission source), and prevailing weather (e.g., wind speed and direction) (11, 16). For instance, dense tree canopies can reduce ventilation in street canyons, and porous vegetation barriers in open-road settings can exacerbate roadside air pollution concentrations (9, 17). Vegetation can also produce volatile organic compounds (VOC) that, in cases like Los Angeles, contribute to a quarter of the secondary organic aerosol on hot days (18).

Abstract

Significance Our findings indicate that the relationship between urban vegetation and air quality is more complex than previously thought. While urban greening has other positive health outcomes for residents, our study suggests that it may not be an efficient abatement measure for air pollution. Although we found minor amelioration effects of vegetation at the borough to city scale, street-level vegetation can act to exacerbate air pollution. Reducing anthropogenic emissions instead of urban greening should be the primary focus for improving air quality.

Author affiliations: Norwegian Institute for Nature Research, Oslo 0855, Norway; and The Climate and Environmental Research Institute NILU, Kjeller 2027, Norway
Although there is evidence that vegetation can ameliorate air pollution under the right circumstances, there is ample experimental and modeling evidence to the contrary ( ). The conflict in the scientific literature is perhaps why the blanket assumption that urban green space reduces air pollution remains widespread in popular discourse. One possible explanation for the knowledge gap is the local nature of experimental and modeling studies that are not necessarily generalizable across broader spatial scales.
Here, we use regional observational data to test the hypothesis that changes in ambient air pollution are associated with changes in surrounding urban green space. We use an established network of air quality stations over Europe (from the European Environmental Agency; EEA) and the United States (from the Environmental Protection Agency; EPA) to derive annual time series of , and concentrations between 2010 and 2019. Green space changes around each air quality station are measured using (1) the normalized difference vegetation index (NDVI) and fractional tree cover from moderate resolution satellites and (2) visual interpretation of very high-resolution aerial imagery at a sub-set of air quality stations. Using linear mixed-effects models, we estimate the association between green space and air quality after controlling for changes in anthropogenic emissions and climate.

Results and Discussion

Air Pollution Changes. Data from 2,615 air quality stations revealed declines in ambient , , and between 2010 and 2019 (Fig. 1). In absolute terms, this equates to an average decline in concentration of , and . In contrast, increased in concentration by . Declines were relatively consistent across the United States and Europe, although increases in pollutant
concentrations were evident in Southern Europe and Western United States, especially for PM (SI Appendix, Fig. S1). The changes in air quality found here are broadly consistent with the trends reported in earlier studies using both the regulatory monitoring station networks as well as satellite instruments (e.g., refs. 19-22). The trend values found here are slightly higher in magnitude than a very recent paper studying European air quality trends for the 2005 to 2019 period after correcting for the impact of meteorology (23). The latter found median trends of for for , and for for urban/ suburban stations. It should be noted that in absolute terms the reductions found in this study as well as in Walker et al. (23) (ca. -4 to for to for , and -4 to for , all for the 14-y period) are substantially smaller in magnitude compared to reductions found for example in China [ca. and ca. overall for for 2013 to 2017, (24)]. However, trends can vary significantly with the selected study period as well as the applied methodology and are thus challenging to directly compare between different studies.
Drivers of Air Pollution Change. To a large extent, the broadscale improvements in air quality found here are a direct result of successful policy-driven emissions reductions that have been carried out in both Europe and the United States over the study period (25). The same responses to emission regulations have recently been observed in China (24). However, our approach explored whether local-scale processes such as vegetation change and climate dynamics might explain some of the spatial and temporal variation in air quality changes. We first stratified our change analysis by biome, given that biome-specific vegetation types and dominant climate are important mediators of vegetation’s effects on air quality. Stations falling within the forest biomes exhibited greater declines compared to those in the Mediterranean shrubland and savanna/grassland biomes, particularly for PM (SI Appendix,
Fig. 1. Distribution of the air quality-monitoring stations across biomes in Europe ( ) and the United States ( ) ( ). Inset histograms show the proximity of stations to roads and the building footprint within 30 m . Air pollutant time series along with linear trends are shown in .
Fig. S1). This is possibly due to the long-range aerosol transport of dust and smoke, which is more prevalent in arid environments such as the Mediterranean. It is also possibly due to the greater deposition and dispersion capacity of forest vegetation compared to Mediterranean shrubland. We found that, while , and were positively correlated with each other at the station level, showed greater variability and was most often negatively correlated with the other air pollutants (SI Appendix, Fig. S2). This is due to nonlinear chemical interactions between and VOCs (26). For instance, the emission decline of ( ) can lead to reduced local titration of (reaction of NO with ).
We explored the association between changes in green space and air pollution using linear mixed models that controlled for the effects of local emissions and climate changes. Two characterizations of vegetation surrounding air pollution stations were derived from satellites including green space in general and tree cover in particular. NDVI from the Landsat satellites at 30 m resolution was used to quantify total green space because it is a widely used proxy for capturing dynamics in vegetation cover and productivity (27). We used a product developed by the United States Geological Survey from the Moderate Resolution Imaging Spectroradiometer (MODIS) at 250 m resolution to quantify changes in tree cover. Changes in total green space and tree cover were aggregated within circular buffer zones surrounding air pollution stations with radii ranging from 15 to . To aid interpretation, we categorized spatial scales of street-level ( 15 to 60 m ), borough-level ( 120 to ), and city-level ( 2,000 to . Due to the limited spatial resolution in MODIS data, we were not able to characterize changes in tree cover at street-level, yet we were able to using Landsat NDVI.
The effect of changes in total green space on mean annual and peak air pollution changes was negligible when aggregated across spatial scales (Fig. 2). Please note that “effect” here refers to the statistical direction and magnitude of association between explanatory and response variables and should not be interpreted as indicating causality. When averaged across pollutants, a one SD increase in total green space was associated with a decrease in pollutant concentrations. Despite the lack of an overall green space effect, increases in tree cover in particular were associated with declines in , and . When averaged across pollutants, a one SD increase in tree cover was associated with a decrease in pollutant concentrations. The largest tree cover effect size was for PM where, on average, one SD increase in percentage tree cover resulted in a decline in pollutant concentrations, equating to (Fig. 2A). The effect sizes of green space were smaller in magnitude than climatic drivers. For example, one SD increase in relative humidity was associated with an decrease in peak annual , and (Fig. 2B). Humidity, wind speed, and precipitation also had negative associations with all pollutants except for .
Given the larger effect sizes from climatic drivers, meteorological dynamics may dominate the marginal effects that green space may have when aggregating across spatial scales. Our finding aligns with the balance of the evidence from observational studies. For instance, in a similar analysis across 31 provincial capital cities in China, He et al. (28) found that meteorology explains of the variance in urban pollutant concentration reduction. In another study in China between 2014 and 2019, wind speed and precipitation were significantly negatively correlated with urban air pollution concentrations at most of the 896 stations (29). The general consensus is that traffic-induced pollution is more prevalent in
Fig. 2. Empirical estimates of the association between annual mean and maximum air pollutant changes, and changes in green space, emissions, and climate predictor variables. Estimates and 95% CI are indicated with points and error bars and are expressed as percentage changes in air pollutant concentrations per increase in the predictor variable. The size of the point indicates the magnitude of the effect.
stagnant, cold weather conditions in urban areas. However, the response of PM to wind can vary depending on wind speed and street canyon orientation and form-as well as particle size. For example, coarse particle deposition on vegetation occurs more efficiently at high wind speeds, while ultrafine particles accumulate more slowly (15). Apart from one study in India finding negative correlations between PM and humidity (30), reviews of the literature show that the effect of humidity on air quality is understudied (11). Our findings suggest a negative relationship between humidity and air pollution, which might be due to an increased rate of absorption of particulates in the atmosphere at elevated humidity. Humidity is also highly correlated to precipitation and this combination may act as a natural scrubber through increased particle deposition on all surfaces.
In our spatially aggregated models, we explored both annual mean (Fig. 2A) and annual peak (Fig. 2B) pollution concentrations. The effect sizes of green space, emissions, and climate variables across pollutants were similar when considering changes in annual mean versus peak concentrations (Fig. 2B). This suggests that the association between vegetation and air pollution is unaffected by the severity of pollutant concentrations within the years considered. Hereafter, we focus on associations with mean annual pollutant concentrations which is often used a proxy for cumulative exposure in epidemiology studies .
The effect of green space varied over spatial scales (Fig. 3A). Total green space exhibited a negative association with at borough scales, but the effect was minimal at street and city scales. The negative effect of tree cover on , and was enhanced with increasing spatial extent from borough to city scales. Fine exhibited divergent responses to green space at the city scale (Fig. 3A); while tree cover had a negative effect, total
green space had a positive effect. Changes within the coniferous forest biome were driving this divergent response (Fig. 3B). In contrast, both total green space and tree cover in particular had negative effects on PM concentrations in the savanna/grassland biomes, albeit with greater variation in their effect as indicated by 95% CI.
To test the robustness of our finding that there is little effect of street-scale changes in green space on air pollutant changes, we performed a manual verification exercise of the satellite-derived NDVI time series. We screened the green space changes at a subset of stations within 60 m of air quality monitors. We first ranked stations by the magnitude of their trend in NDVI to identify candidate stations for manual screening. Then, we used visual interpretation of historical satellite imagery in Google Earth Pro (examples in Fig. 4) to produce a sample of 37 stations with verified gains in green space extent (mean gain of total cover and tree cover in particular) and 65 stations with verified green space losses (mean loss of 17.4% total cover and 6.7% tree cover). We found no significant difference in pollutant concentration changes between stations with gains and losses of total green space (Fig. 5A) or tree cover in particular (Fig. 5B). This lack of green space effect was consistent across all pollutants, thereby corroborating the results from our satellite-based statistical models. The result aligns with findings from local-scale experiments and modeling work demonstrating that planting vegetation, especially tall vegetation, close to emission sources such as along roadsides can reduce microscale ventilation and consequently exacerbate ambient pollution levels ( ). Site conditions largely dictate the aerodynamic effect of green space on air quality at local scales. For example, aerodynamic effects can be beneficial in terms of channeling pollutants away from pedestrians (15).
Fig. 3. Empirical estimates of the association between annual mean air pollutant changes, and changes in green space predictor variables including NDVI (total green space) and fractional tree cover. Separate models and effect sizes were estimated for each spatial scale over which green space was aggregated ( ) and each biome within which stations were located . Estimates and are indicated with points and error bars and are expressed as percentage changes in air pollutant concentrations per SD ( ) increase in the predictor variable. The size of the point indicates the magnitude of the effect.
Fig. 4. Example of an extreme increase ( ) and decrease ( ) in green space within a 60-m buffer (street-level) of two air quality-monitoring stations. Aerial photographs from Google Earth Pro shown for reference.
In cases where there are detrimental aerodynamic effects, however, the dispersion effect of urban green space can often be considerably stronger than the pollutant removal capacity of vegetation via deposition (16).
Study Limitations. We acknowledge that our analysis is purely correlative and that we cannot elucidate causal links between air quality and its drivers. Nevertheless, when placed in the context of experimental and modeling studies which do not find consistent
Fig. 5. Changes in air pollutant concentrations at street-level (within 60 m ) between 2010 and 2019 for a sub-set of air quality stations with the greatest gains ( ) and losses ( ) in green space ( ) and tree cover ( ) over the same period. -values derived from linear mixed-effects models are shown to indicate no significant difference ( ) in air pollutant changes between stations with extreme gains and losses of green space.
effects of vegetation on air quality, our results suggest the causal links are scale- and context-specific and not widely generalizable. In addition, we attempted to control for potential confounders in our statistical models including anthropogenic emissions and climatic variations. With higher resolution emissions data such as road-specific traffic time series, we might expect to explain more of the temporal variation in air pollution concentrations. Similarly, the detail captured by the satellite data we used was limited, and thus we could not characterize spatio-temporal variation in vegetation characteristics such as shape, size, and porosity which are important determinants of air pollutant deposition and dispersion (16, 33). Further, topography and urban form play a key role in associations between wind speed and street canyon ventilation. In our study, we did not have the data to quantify changes in urban form surrounding air quality stations. Apart from microscale determinants of air quality, we could not incorporate macroscale dynamics that operate at regional scales such as longrange transport of aerosols, particularly for Southern Europe.
The satellite time series used to quantify green space change in our analysis may be subject to temporal biases caused by image artifacts like cloud contamination or atmospheric interference (34). To mitigate these artifacts, we performed rigorous satellite data pre-processing and manually verified green space changes at a subset of sites using visual interpretation of aerial imagery. The correspondence between samplers was for changes in total green space and for changes in tree cover (SI Appendix, Table S1). Finally, it is important to note that the absolute pollutant concentrations in our study are low compared to those found in India and China. Therefore, it is possible that a greater vegetation effect on air quality emerges at substantially higher pollutant concentrations than the range that was captured in our data.
Implications and Conclusions. Our findings add important nuance to the assumption generally held in the literature and public discourse that green space improves air quality. We found that the extent to which green space ameliorates air quality varies widely between green space type (tree cover versus total green space), spatial scale, and biome. Recent reviews of the literature have identified a significant knowledge gap regarding how green space impacts on air pollution vary across a range of spatial scales . We found that total green space had no significant effect at street-level, yet at borough to city scales, tree cover in particular was associated with declines in , and . This aligns with theory and modelling work which suggest that at local scales, dispersion and aerodynamic mechanisms are dominant and may act to exacerbate air pollution. However, at regional scales, deposition mechanisms are dominant and act to mitigate air pollution . Indeed, in a review of experimental and modeling literature, the presence of vegetation in street canyons led to an average rise of 20 to in pollutant concentrations when compared to street canyons lacking vegetation (9). At city and regional scales, modeling studies estimate that green space can ameliorate air quality via deposition, albeit at slow rates of between 1 and over decadal time frames ( ). In our analysis spanning two continents, we found even smaller effects of green space- decrease in pollutant concentrations over 10 y -when averaging over spatial scales.
Authors routinely portray the role of urban vegetation in reducing air pollution as a central ecosystem service in regulating urban environments (38), and the most cited economic benefit of urban trees (39). These widely held assumptions have resulted in urban vegetation and air quality featuring prominently in proposals for generating environmental economic accounts, including the UN
System for Environmental-Economic Accounting accounts for urban areas (14). Modeling tools which focus on deposition [e.g., i-Tree Eco (40)] and those that focus on dispersion (e.g., fluid dynamic models reviewed in ref. 41) are often used to account for the beneficial effects of urban vegetation on air quality. While models used in ecosystem accounting like i-Tree Eco estimate air quality improvement with a tree-centric deposition model, other models calculate pollutant capture based on estimated deposition velocities of broadly defined land cover categories (42). Nonetheless, proponents of deposition models contend that the absolute volumes of deposition on tree surfaces translate into “substantial health benefits” (37). Our results provide further evidence to a growing consensus that i-Tree Eco and similar models may substantially overestimate both the effect urban vegetation has in providing air quality improvements and corresponding human health values, particularly when interpreted at local scales (43).
Several issues raise questions about the accuracy and generalizability of deposition models which do not account for the dispersion dynamics introduced by vegetation at the street-level. First, these models do not account for the spatial context of vegetation in terms of its spatial configuration and proximity to other urban infrastructure which can act to reduce or increase ventilation. Such ventilation and dilution effects have demonstrably greater capacity to reduce pollution concentrations than deposition (16, 44). Second, deposition models do not account for any aspects of pollution dispersion or potential feedback between processes that respond to changes in atmospheric chemistry and wet deposition (35). Elevated levels of dry deposition on vegetation can reduce wet deposition enough to substantially reduce or nearly negate dry deposition effects, particularly for slowly depositing compounds like . Third, the parameters for deposition velocity used in i-Tree Eco and similar models are generated from a small number of studies involving conditions that may not generalizable to other regions or tree species (15).
Given the variation in street-level vegetation effects on air quality, and the overall minor effect size ( over 10 y ) observed in our study, there is reason for skepticism about the estimated health benefits that urban green cover supposedly generates via improving air quality. In their interdisciplinary review, Eisenman et al. (43) highlight a conspicuous lack of empirical support for the purported links between urban green cover and positive effects on human health-such as a lower prevalence of asthma. With only one exception (45), all population-based empirical human health studies covered in their review either contradict or fail to support the purported benefits of urban trees in reducing asthma. Many investigations either find no link between urban tree cover and childhood asthma or find that areas with increased tree pollen can lead to higher seasonal peaks in emergency department visits, hospitalizations and allergy medicine prescriptions among both children and adults (48). In contrast to using mechanistic models of the biophysical interactions of trees and air pollution levels, the epidemiological research linking trees to respiratory illness highlights negative effects of trees’ pollen pro-duction-not the benefits of pollution reduction (43).
While our results do not support the hypothesis that the vegetation effects on air pollution would lead to substantial public health benefits, there are still many important reasons for including trees in urban environments. Trees and other urban greenery are vital components of urban ecosystems and biodiversity. They ameliorate extremes in urban area hydrology (both flooding and drought) and contribute to microclimate regulation. Through reducing the heat-island effect, trees can reduce urban residents’ mortality from extreme temperatures (49). Urban green spaces can also promote physical activity, and improve mental health
outcomes such as mood and mental attention, which ultimately improve community wellbeing .
In light of the evidence that urban trees may, in certain configurations, actually worsen air quality, Vos et al. (16) propose a paradigm shift, moving from asking “How to use urban vegetation to improve local air quality?” to “How can urban vegetation be used without significantly deteriorating the local air quality?”. Recent reviews of the literature ( ) show that vegetation performs best when it has a limited impact on decreasing airflow. For example, dense rows of trees without gaps and with closed canopies should be avoided in street canyons with high traffic. In more open areas with greater airflow, vegetation can serve as a barrier between an emission source and pedestrians but not as an air filtration device. Other guiding principles for road-side vegetation include: i) low-level vegetation like hedges are best for street canyons so long as they are continuous, dense (low-porosity), and preferably centrally located as opposed to alongside the street; ii) mid- to high-level vegetation like trees are appropriate for open road environments (i.e., outside street canyons) so long as they are dense and continuous acting as barriers between the road and surrounds. Urban planners should also consider whether the tree species may be capable of producing large amounts of either pollen or biogenic VOC that can decrease air quality. Physical barriers constructed from non-vegetative material may also be effective at mitigating air pollution if the above guidelines are followed. However, if the focus is on large-scale air pollution abatement with significance for public health, our results suggest that post-emission strategies such as urban greening are inadequate solutions. By continuing to promote vegetation’s purported capacity to mitigate pollution, we risk diverting resources from the most important strategy for improving air quality: reducing anthropogenic emissions.

Materials and Methods

Air Pollution Data. We collected historical , and daily time series from air quality stations managed by the United States EPA (53) and the EEA (54) between 2010 and 2019. We chose air pollutants that are most often cited as significant risk factors for negative public health outcomes and that are most commonly used in studies exploring the effects of vegetation on air quality . The EEA dataset contained 6,569 stations and the EPA dataset 2,871 stations that recorded concentrations for our selected pollutants during the study period. We used the Global Human Settlement Layers published by the European Commission (57) to identify stations located within urban and suburban areas. Here, urban was defined as grid cells with a density of built-up surface greater than 50%, and a density of at least 300 inhabitants and a minimum total population of 5,000. The sample sizes after filtering for urban stations were 4,791 for EEA and 1,421 for EPA. To better characterize the variation in urban context covered by the stations, we used OpenStreetMap data to calculate the distance to the closest road and the building footprint within a 30 m radius for each station.
Station time series were first aggregated to monthly averages. From the monthly time series, we derived annual averages and maximums, given that we were interested in how green space is associated with inter-annual changes in air pollution. Although annual averages allow us to explore the cumulative effect of green space throughout the year, the annual maximum allows us to test whether green space might have a larger effect size on months with peak pollutant concentrations. Raw pollutant time series were iteratively aggregated from hourly to daily to monthly and finally annual increments using a data exclusion criterion of 25% for each temporal increment as applied by the EEA and Solberg et al. (58). The data exclusion criterion meant that a time period was excluded if there were more than missing readings during that period. Similarly, we excluded station time series with more than 3 y of missing data between 2010 and 2019(~25% of the 10-y time series). Following the time series filtering, our dataset included 2,127 EEA stations and 488 EPA stations, resulting in 5,558 unique pollutant time series from 2,615 stations.
Urban Green Space Data. We derived two satellite-based measures of green space including the NDVI (59), and fractional tree cover. The former allows us to explore changes in green space in general, while the latter focusses on tree cover in particular. NDVI is a good proxy for fractional vegetation cover, and its temporal dynamics correspond to changes in vegetation structure and productivity over time (27). Trees are the object of most air quality mitigation studies and therefore changes in tree cover are expected to have the largest effects on pollutant concentrations relative to grass or shrubs . We calculated NDVI from the Landsat satellite archive at 30 m resolution and fractional tree cover from the Terra MODIS Vegetation Continuous Fields dataset produced by the United States Geological Survey at 250 m resolution (60). Satellite data were extracted for a range of buffer zones (between 15 m and 16,000 m radii) around each air quality station between 2010 and 2019. Due to the limited spatial resolution of the MODIS tree cover data, and given no other high-resolution tree cover time series data are currently available, we were only able to extract tree cover changes for buffer sizes greater than 120 m . The range of buffer zones was chosen based on the most common spatial scales employed in air pollution dispersion models in the literature (52). We further categorized the zones into spatial scales of street-level ( 15 to 60 m ), borough-level ( 120 to ), and city-level ( 2,000 to ).
While the MODIS tree cover data were pre-computed, we generated NDVI from Landsat 7 and 8 surface reflectance images which were processed in the Google Earth Engine cloud-computing environment (61) to exclude cloud- and snow-covered pixels using the “pixel_qa” band. Given we were working across two Landsat sensors, we applied published cross-calibration coefficients to harmonize Landsat 7 and 8 reflectance values to ensure consistency in spectral responses over time (62). We calculated annual median NDVI values for each Landsat pixel within the station buffer zones around each station. The annual median was used to avoid undue influence from NDVI outlier values. The pixel values were averaged across each buffer zone for each year in the time series. The MODIS tree cover product is delivered as annual averages; therefore, no temporal aggregation was necessary.
To supplement the large-scale NDVI and tree cover analysis, we conducted a manual screening for extreme changes in green space where one would expect to find the largest effects on air quality. To do, this we calculated the linear trend in NDVI for each air quality station between 2010 and 2019. Candidate stations were ranked according to the magnitude of change in NDVI, and 125 stations with the greatest increases and decreases in NDVI were chosen for manual screening. Candidate stations were randomly split between five samplers (the authors of the paper) who used visual interpretation of Google Earth historical aerial imagery to estimate percentage changes in green space within a buffer of each station (see examples in Fig. 3). Green space was defined as any vegetated surface that was not cultivated including parks, road verges, green belts, trees, and green roofs. In addition to changes in total green space, the data collection protocol differentiated changes in trees versus grass/shrubs. We chose 60 m because it is an intermediate distance reported in the literature on microscale air pollution dispersion representing street-scale effects (52), and it was practical to estimate changes in green space through visual interpretation of aerial imagery. After filtering out stations where aerial imagery was missing in 2010 or 2019 or was too blurry to make an informed decision about green space change, we were left with a final sample of 37 stations with confirmed increases in green space and 65 with confirmed declines in green space.
To cross-validate the manual screening, green space changes at a random subset of 15 stations were interpreted by four of the same samplers. We quantified the correspondence between interpretations of changes in green space by grouping into three categories of stable (change ), gain and loss (change ). We then calculated the balanced accuracy from a confusion matrix built from sampler-by-sampler interpretations (SI Appendix, Table S1). Balanced accuracy was defined as the average of the sensitivity (True Positive Rate) and specificity (True Negative Rate) and is expressed as a percentage.
Emissions Data. We used EDGARv6 global GHG (greenhouse gas) gridded anthropogenic emissions version 6(63) as our source of data on anthropogenic GHG emissions worldwide-distributed by ECCAD-AERIS; Emissions of atmospheric Compounds and Compilation of Ancillary Data – An atmosphere Data and Service Centre (https://eccad3.sedoo.fr/metadata/601, accessed April 2023). Specifically, we collected annual emission data on , and at a gridded spatial resolution of from 2010 until 2018. emissions
were used in and models. We processed the data to aggregate emissions from all sectors. Time series were extracted for grid cells intersecting air pollution-monitoring stations. Unfortunately, 2019 data were not available from the original EDGARv6 dataset. To estimate emissions for 2019, we used a linear extrapolation method to estimate individual pollutants’ emission rates from 2013 until 2018. This was done at each air pollution-monitoring station. This allowed us to estimate emissions for 2019 based on the trend observed in previous years.
Climate Data. To control for and explore the effects of meteorological changes on air pollutant concentrations, we used the ERA5-Land climate reanalysis data from the Copernicus Climate Change services (64). ERA5-Land is a gridded dataset with a resolution. We extracted monthly means of air temperature 2 m above the ground, total precipitation, wind speed, and relative humidity for the grid cells intersecting the location of air pollution stations. Monthly time series were then aggregated up to annual averages for each station.
Statistical Analysis. The statistical analysis took place in three parts: i) We used linear mixed-effects models (65) to estimate the direction and magnitude of the changes in air pollutant concentrations over the entire set of air quality stations between 2010 and 2019. Year was included as a fixed-effect, while air quality station was assigned as a random effect in the model to control for
  1. J. Lelieveld et al., Loss of life expectancy from air pollution compared to other risk factors: A worldwide perspective. Cardiovasc. Res. 116, 1910-1917 (2020).
  2. R. Burnett et al., Global estimates of mortality associated with long-term exposure to outdoor fine particulate matter. Proc. Natl. Acad. Sci. U.S.A. 115, 9592-9597 (2018).
  3. S. Chowdhury et al., Global health burden of ambient PM2. 5 and the contribution of anthropogenic black carbon and organic aerosols. Environ. Int. 159, 107020 (2022).
  4. World Health Organization, “WHO global air quality guidelines. Particulate matter (PM2.5 and PM10), ozone, nitrogen dioxide, sulfur dioxide and carbon monoxide” (World Health Organization (WHO), 2021).
  5. J. Lelieveld et al., Effects of fossil fuel and total anthropogenic emission removal on public health and climate. Proc. Natl. Acad. Sci. U.S.A. 116, 7192-7197 (2019).
  6. United Nations Environment Programme, “Actions on air quality: A global summary of policies and programmes to reduce air pollution” (United Nations Environment Programme (UNEP), 2021).
  7. J. González-Martín, N. J. R. Kraakman, C. Pérez, R. Lebrero, R. Muñoz, A state-of-the-art review on indoor air pollution and strategies for indoor air pollution control. Chemosphere 262, 128376 (2021).
  8. X. Yue et al., Mitigation of indoor air pollution: A review of recent advances in adsorption materials and catalytic oxidation. J. Hazard. Mater. 405, 124138 (2021).
  9. K. V. Abhijith et al., Air pollution abatement performances of green infrastructure in open road and built-up street canyon environments-A review. Atmos. Environ. 162, 71-86 (2017).
  10. A. Diener, P. Mudu, How can vegetation protect us from air pollution? A critical review on green spaces’ mitigation abilities for air-borne particles from a public health perspective-With implications for urban planning Sci. Total Environ. 796, 148605 (2021).
  11. Y. Huang et al., A review of strategies for mitigating roadside air pollution in urban street canyons. Environ. Pollut. 280, 116971 (2021).
  12. C. J. Veerkamp et al., A review of studies assessing ecosystem services provided by urban green and blue infrastructure. Ecosyst. Serv. 52, 101367 (2021).
  13. V. Traverso, The best trees to reduce air pollution. BBC, 13 March 2023, (2020). https://www.bbc. com/future/article/20200504-which-trees-reduce-air-pollution-best. Accessed 20 September 2023.
  14. United Nations, “System of Environmental-Economic Accounting-Ecosystem Accounting (SEEA EA)” (White cover publication, 2021). https://seea.un.org/content/system-environmental-economic-accounting-ecosystem-accounting-white-cover-version. Accessed 20 September 2023.
  15. S. Janhäll, Review on urban vegetation and particle air pollution-Deposition and dispersion. Atmos. Environ. 105, 130-137 (2015).
  16. P. E. J. Vos, B. Maiheu, J. Vankerkom, S. Janssen, Improving local air quality in cities: To tree or not to tree? Environ. Pollut. 183, 113-122 (2013).
  17. Y. Barwise, P. Kumar, Designing vegetation barriers for urban air pollution abatement: A practical review for appropriate plant species selection. npj Clim. Atmos. Sci. 3, 1-19 (2020).
  18. C. M. Nussbaumer, R. C. Cohen, Impact of OA on the temperature dependence of PM 2.5 in the Los Angeles Basin. Environ. Sci. Technol. 55, 3549-3558 (2021).
  19. C. B. B. Guerreiro, V. Foltescu, F. de Leeuw, Air quality status and trends in Europe. Atmos. Environ. 98, 376-384 (2014).
  20. P. Schneider, W. A. Lahoz, R. van der A, Recent satellite-based trends of tropospheric nitrogen dioxide over large urban agglomerations worldwide. Atmos. Chem. Phys. 15, 1205-1220 (2015).
  21. P. Schneider, R. Van der A, A global single-sensor analysis of 2002-2011 tropospheric nitrogen dioxide trends observed from space. J. Geophys. Res. Atmos. 117, D16309 (2012).
  22. L. N. Lamsal et al., U.S. NO2 trends (2005-2013): EPA Air Quality System (AQS) data versus improved observations from the Ozone Monitoring Instrument (OMI). Atmos. Environ. 110, 130-143 (2015).
  23. S.-E. Walker, S. Solberg, P. Schneider, C. Guerreiro, The AirGAM 2022 r 1 air quality trend and prediction model. Geosci. Model Dev. 16, 573-595(2023).
  24. Q. Zhang et al., Drivers of improved PM2.5 air quality in China from 2013 to 2017. Proc. Natl. Acad. Sci. U.S.A. 116, 24463-24469 (2019).
  25. K. Wang, M. Yan, Y. Wang, C.-P. Chang, The impact of environmental policy stringency on air quality. Atmos. Environ. 231, 117522 (2020).
  26. I. Jhun, B. A. Coull, A. Zanobetti, P. Koutrakis, The impact of nitrogen oxides concentration decreases on ozone trends in the USA. Air Qual. Atmos. Health 8, 283-292 (2015).
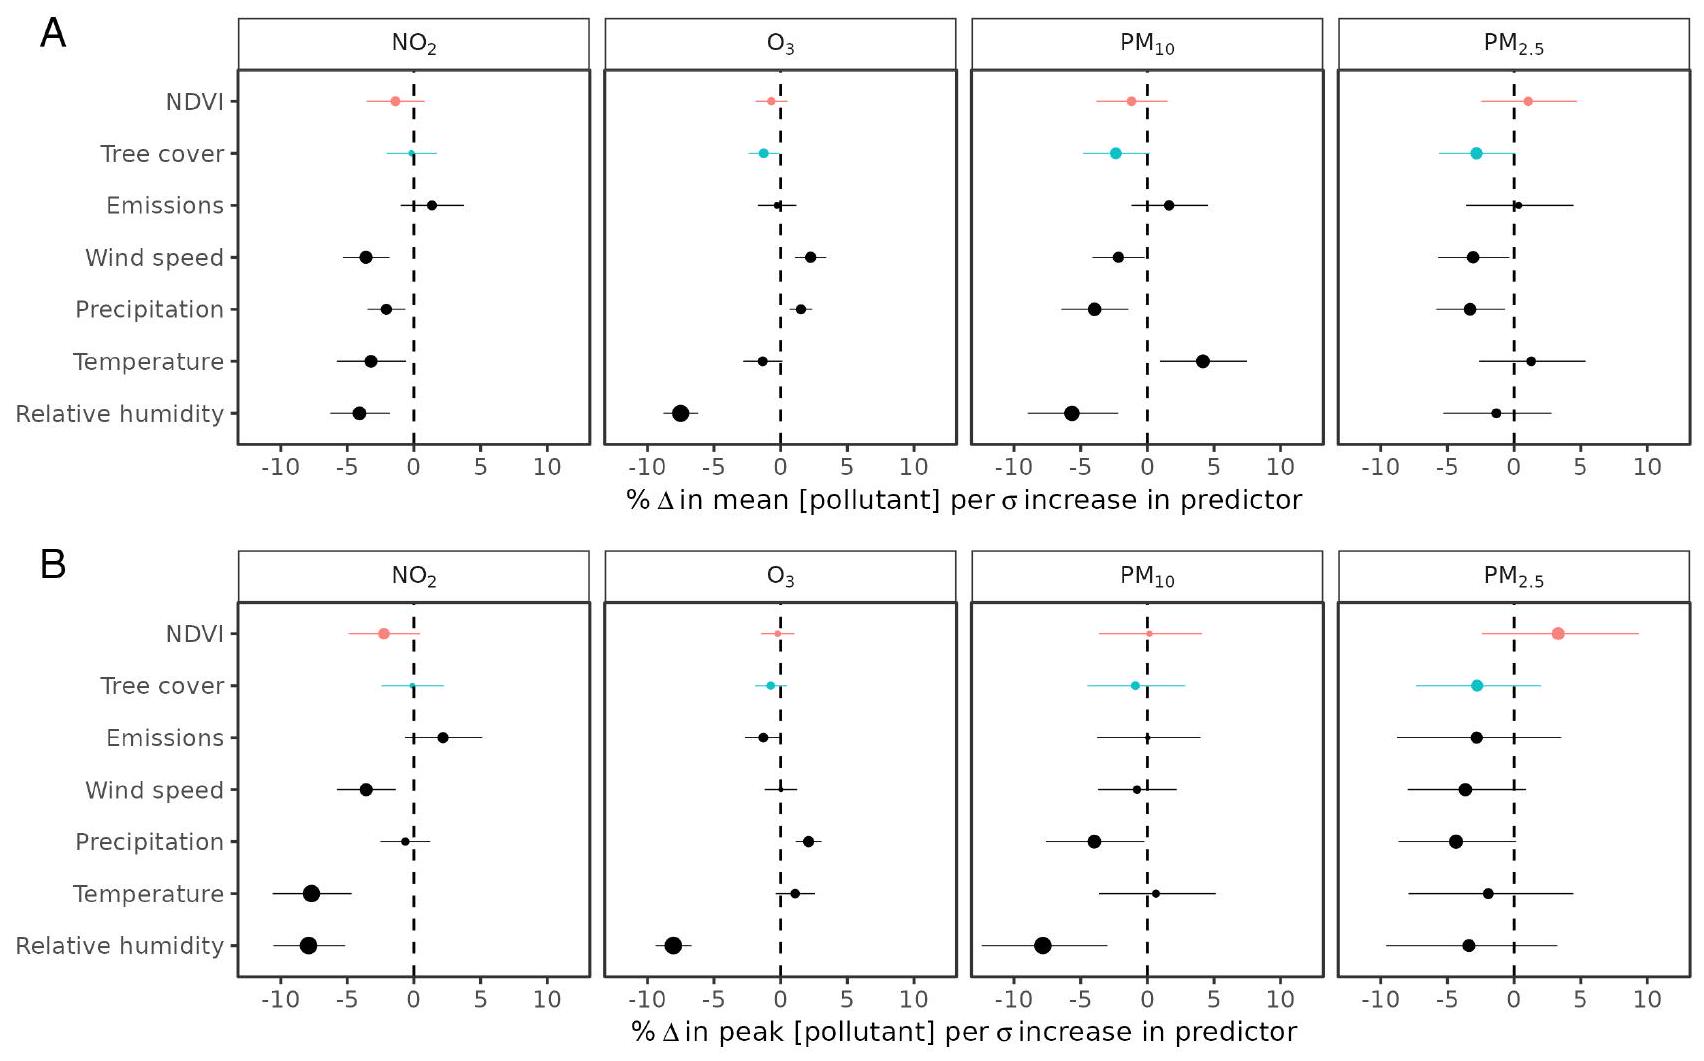
    any model-specific effects. Air pollutant concentrations were log-transformed to ensure residuals were normally distributed. ii) To quantify the association between green space and air pollution concentration over time while controlling for the effect of emissions and climate variables, we fitted the same model structure described above, except adding green space (NDVI and tree cover), emissions, and climate covariates as fixed-effects. Separate models were fit for each biome and each buffer zone used to aggregate green space around the stations. iii) The manually screened stations with extreme NDVI changes were used to fit mixed-effects models to test whether air pollution declines were greater at stations with gains in green space than at stations with losses in green space. Linear trends in climate variables and a categorical gain/loss in green space were included as fixed effects, while sampler was included as a random effect to control for any sampler-specific biases in interpretation of aerial imagery.
    Data, Materials, and Software Availability. Code supporting the analysis: https://github.com/zanderVenter/greenspace-air-pollution. Previously published data were used for this work and are cited in the methods section.
    acknowledgments. We acknowledge funding from the Research Council of Norway (grant number 326641). Additional funding through the project SIS-EO (NILU #B121004) is gratefully acknowledged. Thanks to Sourangsu Chowdhury for input into the conceptualization and data collection.
  27. Z. S. Venter, S. L. Scott, P. G. Desmet, M. T. Hoffman, Application of Landsat-derived vegetation trends over South Africa: Potential for monitoring land degradation and restoration. Ecol. Indicators 113, 106206 (2020).
  28. J. He et al., Air pollution characteristics and their relation to meteorological conditions during 2014-2015 in major Chinese cities. Environ. Pollut. 223, 484-496 (2017).
  29. Y. Liu, Y. Zhou, J. Lu, Exploring the relationship between air pollution and meteorological conditions in China under environmental governance. Sci. Rep. 10, 14518 (2020).
  30. R. Jayamurugan, B. Kumaravel, S. Palanivelraja, M. Chockalingam, Influence of temperature, relative humidity and seasonal variability on ambient air quality in a coastal urban area. Int. J. Atmos. Sci. 2013, 264046 (2013).
  31. H. Chen et al., Long-term exposure to traffic-related air pollution and cardiovascular mortality. Epidemiology 24, 35-43 (2013).
  32. P. Kumar et al., The nexus between air pollution, green infrastructure and human health. Environ. Int. 133, 105181 (2019).
  33. V. Jennings, C. E. Reid, C. H. Fuller, Green infrastructure can limit but not solve air pollution injustice. Nat. Commun. 12, 4681 (2021).
  34. N. E. Young et al., A survival guide to Landsat preprocessing. Ecology 98, 920-932 (2017).
  35. E. Nemitz et al., Potential and limitation of air pollution mitigation by vegetation and uncertainties of deposition-based evaluations. Philos. Trans. R Soc. A 378, 20190320 (2020).
  36. M. Tallis, G. Taylor, D. Sinnett, P. Freer-Smith, Estimating the removal of atmospheric particulate pollution by the urban tree canopy of London, under current and future environments. Landscape Urban Plann. 103, 129-138 (2011).
  37. D. J. Nowak, S. Hirabayashi, A. Bodine, E. Greenfield, Tree and forest effects on air quality and human health in the United States. Environ. Pollut. 193, 119-129 (2014).
  38. W. Y. Chen, “Urban nature and urban ecosystem services” in Greening Cities: Forms and Functions, P. Tan, C. Jim, Eds. (Springer, Singapore, 2017), pp. 181-199.
  39. X. P. Song, P. Y. Tan, P. Edwards, D. Richards, The economic benefits and costs of trees in urban forest stewardship: A systematic review. Urban Forest. Urban Green. 29, 162-170 (2018).
  40. S. Hirabayashi, C. N. Kroll, D. J. Nowak, i-Tree Eco Dry Deposition Model Descriptions (Citeseer, Princeton, NJ, 2012).
  41. M. Lateb et al., On the use of numerical modelling for near-field pollutant dispersion in urban environments-A review. Environ. Pollut. 208, 271-283 (2016).
  42. R. P. Remme, M. Schröter, L. Hein, Developing spatial biophysical accounting for multiple ecosystem services. Ecosyst. Serv. 10, 6-18 (2014).
  43. T. S. Eisenman et al., Urban trees, air quality, and asthma: An interdisciplinary review. Landscape Urban Plann. 187, 47-59 (2019).
  44. T.V. Kokkonen et al., The effect of urban morphological characteristics on the spatial variation of PM2.5 air quality in downtown Nanjing. Environ. Sci. Atmos. 1, 481-497 (2021).
  45. I. Alcock et al., Land cover and air pollution are associated with asthma hospitalisations: A crosssectional study. Environ. Int. 109, 29-41 (2017).
  46. M. A. Pilat et al., The effect of tree cover and vegetation on incidence of childhood asthma in metropolitan statistical areas of Texas. HortTechnol. 22, 631-637 (2012).
  47. G. S. Lovasi et al., Urban tree canopy and asthma, wheeze, rhinitis, and allergic sensitization to tree pollen in a New York City birth cohort. Environ. Health Perspect. 121, 494-500 (2013).
  48. S.P. Jariwala et al., Association between tree pollen counts and asthma ED visits in a high-density urban center. J. Asthma 48, 442-448 (2011).
  49. Z. S. Venter, N. H. Krog, D. N. Barton, Linking green infrastructure to urban heat and human health risk mitigation in Oslo, Norway. Sci. Total Environ. 709, 136193 (2020).
  50. A. C. Lee, R. Maheswaran, The health benefits of urban green spaces: A review of the evidence. J. Public Health 33, 212-222 (2011).
  51. M. C. Kondo, J. M. Fluehr, T. McKeon, C. C. Branas, Urban green space and its impact on human health. Int. J. Environ. Res. Public Health 15, 445 (2018).
  52. A. Tiwari et al., Considerations for evaluating green infrastructure impacts in microscale and macroscale air pollution dispersion models. Sci. Total Environ. 672, 410-426 (2019).
  53. US Environmental Protection Agency, “Air quality system data mart [internet database]”. https:// www.epa.gov/outdoor-air-quality-data. Accessed 14 April 2023.
  54. European Environmental Agency, “Air quality time series (E1a & E2a data sets)”. https://www.eea. europa.eu/data-and-maps/data/aqereporting-9/estatistics-e1a-e2a. Accessed 14 April 2023.
  55. C. J. Murray et al., Global burden of 87 risk factors in 204 countries and territories, 1990-2019: A systematic analysis for the Global Burden of Disease Study 2019. The Lancet 396, 1223-1249 (2020).
  56. M. Grundström, H. Pleijel, Limited effect of urban tree vegetation on and concentrations near a traffic route. Environ. Pollut. 189, 73-76 (2014).
  57. M. Schiavina, M. Melchiorri, M. Pesaresi, “GHS-SMOD R2023A-GHS settlement layers, application of the degree of urbanisation methodology (stage I) to GHS-POP R2023A and GHS-BUILT-S R2023A, multitemporal (1975-2030)”. European Commission, Joint Research Centre (JRC) [Dataset] doi: https://doi.org/10.2905/A0DF7A6F-49DE-46EA-9BDE-563437A6E2BA PID: http://data. europa.eu/89h/a0df7abf-49de-46ea-9bde-563437abe2ba. Accessed 20 September 2023.
  58. S. Solberg, S.-E. Walker, P. Schneider, C. Guerreiro, Quantifying the impact of the Covid-19 lockdown measures on nitrogen dioxide levels throughout Europe. Atmosphere 12, 131 (2021).
  59. C. J. Tucker, Red and photographic infrared linear combinations for monitoring vegetation. Remote Sens. Environ. 8, 127-150 (1979).
  60. C. M. DiMiceli et al., Annual Global Automated MODIS Vegetation Continuous Fields (MOD44B) at 250 m Spatial Resolution for Data Years Beginning Day 65 (Version 6, University of Maryland, College Park, MD, 2017), pp. 2000-2010.
  61. N. Gorelick et al., Google earth engine: Planetary-scale geospatial analysis for everyone. Remote Sens. Environ. 202, 18-27 (2017).
  62. D. P. Roy et al., Characterization of Landsat-7 to Landsat-8 reflective wavelength and normalized difference vegetation index continuity. Remote Sens. Environ. 185, 57-70 (2016).
  63. M. Crippa et al., Fossil CO and GHG Emissions of All World Countries (Publication Office of the European Union, Luxemburg, 2019).
  64. J. Muñoz-Sabater et al., ERA5-Land: A state-of-the-art global reanalysis dataset for land applications. Earth Syst. Sci. Data 13, 4349-4383 (2021).
  65. D. Bates, Fitting linear mixed models in R. R News 5, 27-30 (2005).

  1. Author contributions: Z.S.V., A.H., E.S., P.S., and N.C. designed research; Z.S.V. performed research; Z.S.V. and A.H. analyzed data; and Z.S.V., A.H., E.S., P.S., and N.C. wrote the paper.
    The authors declare no competing interest.
    This article is a PNAS Direct Submission. M.G. is a guest editor invited by the Editorial Board.
    Copyright © 2024 the Author(s). Published by PNAS. This open access article is distributed under Creative Commons Attribution License 4.0 (CC BY).
    Although PNAS asks authors to adhere to United Nations naming conventions for maps (https://www.un.org/ geospatial/mapsgeo), our policy is to publish maps as provided by the authors.
    To whom correspondence may be addressed. Email: zander.venter@nina.no.
    This article contains supporting information online at https://www.pnas.org/lookup/suppl/doi:10.1073/pnas. 2306200121/-/DCSupplemental.
    Published January 29, 2024.