DOI: https://doi.org/10.1057/s41599-024-02639-9
تاريخ النشر: 2024-01-24
إعادة دراسة منحنى كوزنتس البيئي (EKC) لانبعاثات الكربون والبصمة البيئية في 147 دولة: مسألة الحماية التجارية
الملخص
لقد أثر تدهور البيئة بشكل عميق على كل من المجتمع البشري والنظم البيئية. يسلط منحنى كوزنتس البيئي (EKC) الضوء على العلاقة المعقدة بين النمو الاقتصادي والانحدار البيئي. ومع ذلك، فإن الزيادة الأخيرة في الحماية التجارية قد زادت من عدم اليقين الاقتصادي العالمي، مما يشكل تهديدًا خطيرًا لاستدامة البيئة العالمية. يهدف هذا البحث إلى دراسة المسارات المعقدة التي تؤثر من خلالها الحماية التجارية، التي تم تقييمها من خلال بيانات انفتاح التجارة المتاحة، على العلاقة بين النمو الاقتصادي وتدهور البيئة. من خلال الاستفادة من بيانات بانل عالمية شاملة تغطي 147 دولة من 1995 إلى 2018، تفحص هذه الدراسة بدقة الديناميات غير الخطية بين التجارة والاقتصاد والبيئة، مع التركيز بشكل خاص على التحقق من صحة فرضية EKC. تشمل هذه الدراسة انحدارات بيانات عالمية وبانل شاملة مصنفة عبر أربع مجموعات دخل. تؤكد الأبحاث صحة فرضية EKC ضمن حدود هذه التحقيق. مع ارتفاع مستويات الدخل، يتزايد تأثير النمو الاقتصادي على تدهور البيئة في البداية قبل أن يظهر اتجاهًا متناقصًا. بالإضافة إلى ذلك، تظهر الحماية التجارية كعائق أمام تحسين جودة البيئة العالمية. تظهر تداعيات الحماية التجارية تباينات دقيقة عبر شرائح الدخل. في الدول ذات الدخل المرتفع، يبدو أن الحماية التجارية تساهم في التخفيف من تدهور البيئة. على العكس من ذلك، ضمن فئات الدخل الأخرى، يكون التأثير المحفز للحماية التجارية على الضغط البيئي أكثر وضوحًا. بعبارة أخرى، تعزز الحماية التجارية تدهور البيئة، مما يؤثر بشكل خاص على الدول ذات الدخل المنخفض، مما يتماشى مع مفهوم ملاذات التلوث. تسلط نتائج الدراسة الضوء على عتبات دقيقة في العلاقة بين التجارة والنمو الاقتصادي وتدهور البيئة عبر مجموعات الدخل، مما يبرز التأثيرات غير المتجانسة والآليات الأساسية. توفر هذه النتائج رؤى قيمة لصانعي السياسات، مما يحث على جهود تعاونية بين الدول لتحقيق توازن متناغم بين التقدم الاقتصادي والحفاظ على البيئة على نطاق عالمي.
المقدمة
تغطي الفترة من 1995 إلى 2018: (1) ضمن نطاق دراسة هذه الدراسة، هل تدعم الأدلة التجريبية فرضية EKC؟ (2) في نموذج النمو الاقتصادي-تدهور البيئة، ما هو دور تدابير الحماية التجارية؟ هل هناك آثار غير خطية ملحوظة متأصلة في هذه العلاقة؟ (3) إلى أي مدى يختلف التأثير الملحوظ بين الدول، اعتمادًا على مستويات دخلها؟
مراجعة الأدبيات
وطريقة التسبب في اللوحة غير المتجانسة. كشفت النتائج عن علاقة على شكل حرف U مقلوب بين النمو الاقتصادي والبصمة البيئية. باستخدام إطار المعادلات المتزامنة، درس يين وآخرون (2021) العلاقة السببية بين الاستثمار الأجنبي المباشر،
في اقتصاديات الطاقة. استخدم وانغ وشاو (2019) تقنية الانحدار العتبي اللوحي لمراقبة التأثير غير الخطي للتنظيمات البيئية الرسمية وغير الرسمية على النمو الأخضر لمجموعة العشرين بين عامي 2001 و2015. بالإضافة إلى ذلك، درس تشو ولي (2020) التأثير غير الخطي لإعادة هيكلة الصناعة على النمو الاقتصادي وانبعاثات ثاني أكسيد الكربون في 32 دولة. استكشف لي وآخرون (2022) انبعاثات الكربون في صناعة النقل عبر 30 مقاطعة في الصين، مستخدمين منهجية تجمع بين مؤشر فك الارتباط وتحليل العتبة اللوحي. فحص زيتون وغويد (2021) العلاقة غير الخطية بين الملكية الأجنبية وقرارات الرفع المالي للشركات، مستقصين ما إذا كانت العتبات على مستويات الملكية الأجنبية تعدل تأثيرات محددات هيكل رأس المال. استخدمت دراسة أخرى نماذج خطية وغير خطية لاستكشاف العوامل المؤثرة على انبعاثات الكربون (لي وآخرون 2021). لتلخيص ذلك، فإن نموذج العتبة اللوحي ناضج ومعترف به من قبل العلماء من دول مختلفة. تبحث هذه الورقة في التأثيرات غير الخطية للتجارة على الاقتصاد والبيئة، ومن المناسب والموثوق تطبيق هذا النموذج.
انبعاثات الكربون، كاشفين أن التجارة، والاستثمار الأجنبي المباشر، والاستثمار الأجنبي المباشر الخارجي تسهم في زيادة انبعاثات الكربون الإقليمية. درس وانغ وآخرون (2021) آلية تأثير الاستثمار الأجنبي المباشر على انبعاثات الكربون من خلال كثافة الطاقة، وكشفت النتائج أن الاستثمار الأجنبي المباشر هو أحد أسباب زيادة الانبعاثات في الصين في هذه المرحلة، ويمكن أن يزيد الاستثمار الأجنبي المباشر أيضًا من انبعاثات الكربون بشكل غير مباشر من خلال زيادة كثافة الطاقة. درس فيرال (2020) تأثيرات الإنتاج والتجارة والطاقة المتجددة وغير المتجددة على انبعاثات الكربون في دول أفريقيا جنوب الصحراء. تشير النتائج التجريبية على المدى الطويل إلى أن الطاقة غير المتجددة والتجارة تسهم في زيادة انبعاثات الكربون. درس ليو وآخرون (2022) تأثير تطوير السياحة، والنمو الاقتصادي، واستهلاك الطاقة، وانفتاح التجارة، والاستثمار الأجنبي المباشر على البصمة البيئية في باكستان باستخدام منحنى كوزنتس البيئي. كشفت النتائج أن التجارة لها بصمة بيئية وأن الاستثمار الأجنبي المباشر يسهم في تدهور البيئة. درس عبيد وآخرون (2022) العلاقة بين استهلاك الطاقة المتجددة والبصمة البيئية في المملكة العربية السعودية، مؤكدين أن رأس المال وانفتاح التجارة هما عاملان يسهمان في تدهور البيئة. صاغ ياسمين وآخرون (2022) ثلاث معادلات متزامنة لتقييم تأثير تدفق الاستثمار الأجنبي المباشر، والابتكار التكنولوجي، والموارد الطبيعية، وكثافة السكان على استهلاك الطاقة الحيوية والبصمة البيئية. كشفت النتائج التجريبية أن الاستثمار الأجنبي المباشر لم يؤد إلى تحسين البيئة في منطقة الحزام والطريق. درس ناثانيال وخان (2020) العلاقة بين التحضر، والطاقة المتجددة، والتجارة، والبصمة البيئية في دول الآسيان، مؤكدين دور التجارة في تدهور البيئة. درست دراسة أخرى كيف أن العولمة واستهلاك الكهرباء يدفعان الطلب البشري في غانا على الموارد البيئية. تشير الأدلة إلى أن العولمة لها تأثير كبير على البصمة البيئية (لانجنيل وأميغافي 2020).
في أعلى 15 دولة من حيث الانبعاثات. كشفت طريقة تقدير مجموعة المتوسطات المعززة (AMG) أن الانفتاح التجاري، والتنمية المالية، والطاقة المتجددة لها تأثير كبير على التغلب على تدهور البيئة. طبق زفار وآخرون (2019) نموذج ARDL لدراسة تأثير الموارد الطبيعية، ورأس المال البشري، والاستثمار الأجنبي المباشر على البصمة البيئية. أظهرت النتائج أن الاستثمار الأجنبي المباشر يقلل بشكل كبير من البصمة البيئية للولايات المتحدة.
بيانات وطرق
لكل وحدة مقطع عرضي؛ أي أن معامل الانحدار للحد الأول من مصطلح التأخير لكل سلسلة زمنية مقطعية طويلة يجب أن يكون هو نفسه.
| معنى | الوسيط | ماكس | من | سد | الانحراف | التفرطح |
|
|
| LnCO2 | 0.6002 | 0.8753 | 3.4174 | -4.1158 | 1.5402 | -0.6555 | ٢.٦٥٤٦ | ٣٥٢٨ |
| LnPGDP | 8.4380 | 8.3684 | ١١.٣٨٤٩ | ٥.٣٩٠٠ | 1.4085 | 0.0753 | ٢.١٢٧٣ | ٣٥٢٨ |
| LnTRA | ٤.٠٣٤٠ | ٤.٠٢٠٠ | 5.8391 | ٢.٠٥٤٩ | 0.5167 | 0.0663 | ٣.٠٤٥٦ | 3528 |
| LnEF | 0.9253 | 0.9093 | 2.6328 | -0.7132 | 0.6944 | 0.0002 | ٢.٠٢٤٧ | ٣٥٢٨ |
| LnIS | ٣.٢٤٤٠ | ٣.٢٤٣٣ | ٤.٤٤٠٢ | 2.0167 | 0.3788 | 0.0582 | 3.3783 | ٣٥٢٨ |
| في | ٤.٩٥٣٦ | 2.7169 | ٤٤٩٫٠٨٢٨ | -40.0811 | 15.8228 | 17.0032 | 375.0253 | ٣٥٢٨ |
| LnGI | ٤.٠٣٥٨ | ٤.٠٤٧٧ | ٤.٥٠٧٩ | ٣.١٠٦٨ | 0.2773 | -0.3582 | 2.6082 | ٣٥٢٨ |
النتائج التجريبية
| تجميع | معنى | الوسيط | ماكس | من | سد | الانحراف | التفرطح | ن | |
| مجموعة الدخل المرتفع | LnCO2 | ٢.٠٧٦٣ | 2.0820 | 3.4174 | 0.3008 | 0.5079 | -0.3146 | ٣.٥٩٥٦ | ١٠٥٦ |
| LnEF | 1.7042 | 1.7043 | 2.6328 | 0.2300 | 0.2958 | 0.0765 | ٤.١٦٧٠ | ١٠٥٦ | |
| LnTRA | ٤.١٥٩٠ | ٤.٠٩٣٨ | 5.8391 | ٢.٦٤٢٤ | 0.5479 | 0.2220 | ٣.١٢٣٥ | ١٠٥٦ | |
| LnPGDP | 10.1431 | 10.3116 | 11.3849 | 8.5043 | 0.6124 | -0.3312 | 2.3036 | 1056 | |
| LnIS | ٣.٢٦٧٤ | ٣.٢٤٣٣ | ٤.٣٠٥٦ | ٢.٢٢٥٦ | 0.3569 | 0.4236 | 3.9657 | ١٠٥٦ | |
| فل | 7.8374 | ٣.٠٦٠٩ | ٤٤٩٫٠٨٢٨ | -40.0811 | 27.7358 | 10.2126 | 128.5140 | ١٠٥٦ | |
| LnGI | ٤.٣٠٩٥ | ٤.٣٥٦٩ | ٤.٥٠٧٩ | ٣.٧٩٤٥ | 0.1570 | -1.1440 | ٣.٥٨٣٤ | ١٠٥٦ | |
| مجموعة الدخل المتوسط الأعلى | LnCO2 | 1.0627 | 1.0592 | 2.7112 | -0.7548 | 0.6772 | 0.0337 | ٢.٦١٤٦ | 1008 |
| LnEF | 0.9421 | 0.9475 | 1.9145 | 0.0715 | 0.3409 | 0.0708 | ٢.٦٣٧٤ | 1008 | |
| LnTRA | ٤.٠٨٥٨ | ٤.١٠٣٢ | 5.2581 | 2.1977 | 0.4686 | -0.3437 | 3.3909 | 1008 | |
| LnPGDP | 8.5477 | 8.5533 | 9.6078 | 6.6450 | 0.4780 | -0.5741 | ٣.٥٦٩٢ | 1008 | |
| LnIS | 3.3188 | 3.2962 | ٤.٤٤٠٢ | ٢.٤٠٧٧ | 0.3592 | 0.2536 | ٢.٩٥١٤ | 1008 | |
| في | ٤.٤٠٦٢ | 3.4140 | ٥٥٫٠٧٠٣ | -10.2567 | ٤.٨٩٩٩ | ٣.٤٥٢١ | ٢٨.٩٨٥٤ | 1008 | |
| LnGI | ٤.٠٤٥٣ | ٤.٠٦٩٩ | ٤.٣٩٩٣ | ٣.٤٢١٢ | 0.1869 | -0.5764 | 2.8420 | 1008 | |
| مجموعة الدخل المنخفض المتوسط | LnCO2 | -0.2764 | -0.2515 | ٢.٠٦٤٧ | -2.5626 | 0.9598 | 0.2237 | ٢.٨٤٦٩ | ١٠٨٠ |
| LnEF | 0.4372 | 0.3315 | ٢.٣٦٤٦ | -0.7132 | 0.5309 | 0.8286 | 3.7528 | ١٠٨٠ | |
| LnTRA | ٣.٩٩٧٠ | 3.9822 | ٥.٢٧٨٠ | ٢.٧٦٦٨ | 0.5018 | -0.0569 | ٢.٤٥٠٤ | ١٠٨٠ | |
| LnPGDP | 7.4291 | 7.4414 | 8.6330 | 5.9496 | 0.5634 | -0.1226 | ٢.٣٦٢٦ | ١٠٨٠ | |
| LnIS | ٣.٢٥٤٣ | 3.2677 | ٤.٢٨٦٦ | 2.0167 | 0.3702 | -0.3570 | ٣.٩٢٥٧ | ١٠٨٠ | |
| في | ٣.٢٧٧٤ | ١.٩٨٤٢ | ٤٣.٩١٢١ | -37.1727 | ٤.٦٠٧٩ | ٢.٦٣٦٧ | ٢٧.٥٧٤٥ | ١٠٨٠ | |
| LnGI | ٣.٨٨٠٢ | 3.9010 | ٤.٣١٤٦ | ٣.١٥٧٠ | 0.2075 | -0.5916 | ٣.٢٧٤٩ | ١٠٨٠ | |
| مجموعة ذوي الدخل المنخفض | LnCO2 | -2.2075 | -2.3806 | 0.1303 | -4.1158 | 0.8320 | 0.4815 | 3.2927 | 384 |
| LnEF | 0.1121 | 0.0575 | 0.9523 | -0.6762 | 0.3022 | 0.3645 | ٢.٥٥٩٤ | 384 | |
| LnTRA | ٣.٦٥٨٤ | ٣.٦٥١٦ | ٤.٥٩٨١ | ٢.٠٥٤٩ | 0.3864 | -0.1449 | 3.1788 | 384 | |
| LnPGDP | 6.2988 | 6.2833 | 7.9093 | ٥.٣٩٠٠ | 0.4838 | 1.2422 | 5.4287 | 384 | |
| LnIS | ٢.٩٥٤٣ | 2.8688 | ٣.٩٦٦٥ | ٢.٢٢٣٥ | 0.3801 | 0.5897 | 2.8517 | 384 | |
| فل | ٣.١٧٤٤ | 2.1037 | ٤٦.٢٧٥٢ | -5.1118 | 5.3631 | ٤.١٣٣٠ | 25.6464 | 384 | |
| LnGI | 3.6960 | 3.7133 | ٣.٩٨٨٩ | ٣.١٠٦٨ | 0.1903 | -0.6852 | ٣.٠٩٠٤ | 384 | |
| التجميع | LnCO2 | LnEF | LnTRA | LnPGDP | LnIS | في | LnGI | ||
| عالمي | شركة ذات مسؤولية محدودة | مستوى | -1.5151* | -1.3727* | -5.2113*** | -2.0586** | -3.7848*** | -8.1952*** | -20.9845* |
|
|
-21.9756*** | -23.3730*** | -26.1267*** | -16.7324*** | -23.0929*** | -28.2324*** | -16.9986*** | ||
| نظام تحديد المواقع الداخلي | مستوى | ٤٫٢٧٠٥ | -0.0850 | -3.2912*** | 7.7419 | -1.6851** | -12.1151*** | -8.8335*** | |
|
|
-25.1832*** | -30.5066*** | -28.7285*** | -18.5245*** | -25.5569*** | -35.0238*** | -21.9993*** | ||
| مجموعة الدخل المرتفع | شركة ذات مسؤولية محدودة | مستوى | 1.58975 | 0.3096 | -3.9189*** | -6.2679*** | -3.0327*** | -4.1623*** | -13.3297*** |
|
|
-10.8512*** | -13.7932*** | -17.3535*** | -12.2076*** | -14.4835*** | -14.8399*** | -13.8794*** | ||
| نظام تحديد المواقع الداخلي | مستوى | ٣.٥٨٣٧ | 1.3037 | -1.5992* | -0.3689 | -0.1752 | -7.0497*** | -6.6802*** | |
|
|
-14.0676*** | -17.1413*** | -15.8293*** | -10.7254*** | -15.1854*** | -18.6725*** | -14.2162*** | ||
| مجموعة الدخل المتوسط الأعلى | شركة ذات مسؤولية محدودة | مستوى | -3.3229*** | -3.1226*** | -2.1038** | -1.9991** | -2.0498** | -5.6241*** | -13.1403*** |
|
|
-14.4875*** | -12.5038*** | -13.7813*** | -9.3888*** | -12.1044*** | -15.7143*** | -7.0174*** | ||
| نظام تحديد المواقع الداخلي | مستوى | -0.3412 | -3.6305*** | -1.5797* | ٤.٨٣٦٣ | -1.2069 | -7.1434*** | -6.2053*** | |
|
|
-14.4603*** | -16.1859*** | -15.6977*** | -10.7313*** | -11.8744*** | -19.0199*** | -10.1499*** | ||
| مجموعة الدخل المنخفض المتوسط | شركة ذات مسؤولية محدودة | مستوى | -0.8635 | -0.0192 | -3.2901*** | 1.8218 | -0.6548 | -3.7609*** | -9.6961*** |
|
|
-10.0075*** | -9.7364*** | -13.7099*** | -5.8446*** | -11.0891*** | -15.4811*** | -5.8504*** | ||
| نظام تحديد المواقع الداخلي | مستوى | 3.6113 | 1.9531 | -2.2660** | 8.1468 | -0.6334 | -5.5920*** | -2.9512*** | |
|
|
-12.8022*** | -15.7484*** | -16.1752*** | -8.3137*** | -13.7475*** | -19.5200*** | -10.3563*** | ||
| مجموعة ذوي الدخل المنخفض | شركة ذات مسؤولية محدودة | مستوى | 0.3151 | 1.2570 | 0.0938 | -1.2919* | -1.6084* | -2.6184*** | -4.7603*** |
|
|
-8.1311*** | -11.0318*** | -5.1347*** | -5.4419*** | -7.7659*** | -9.5113*** | -7.1226*** | ||
| نظام تحديد المواقع الداخلي | مستوى | 1.4979 | 0.1872 | -0.9643 | 2.5799 | -1.7995** | -4.0796*** | -0.6943 | |
|
|
-8.1057*** | -11.4075*** | -8.2687*** | -7.0341*** | -9.9892*** | -11.6435*** | -9.2941*** | ||
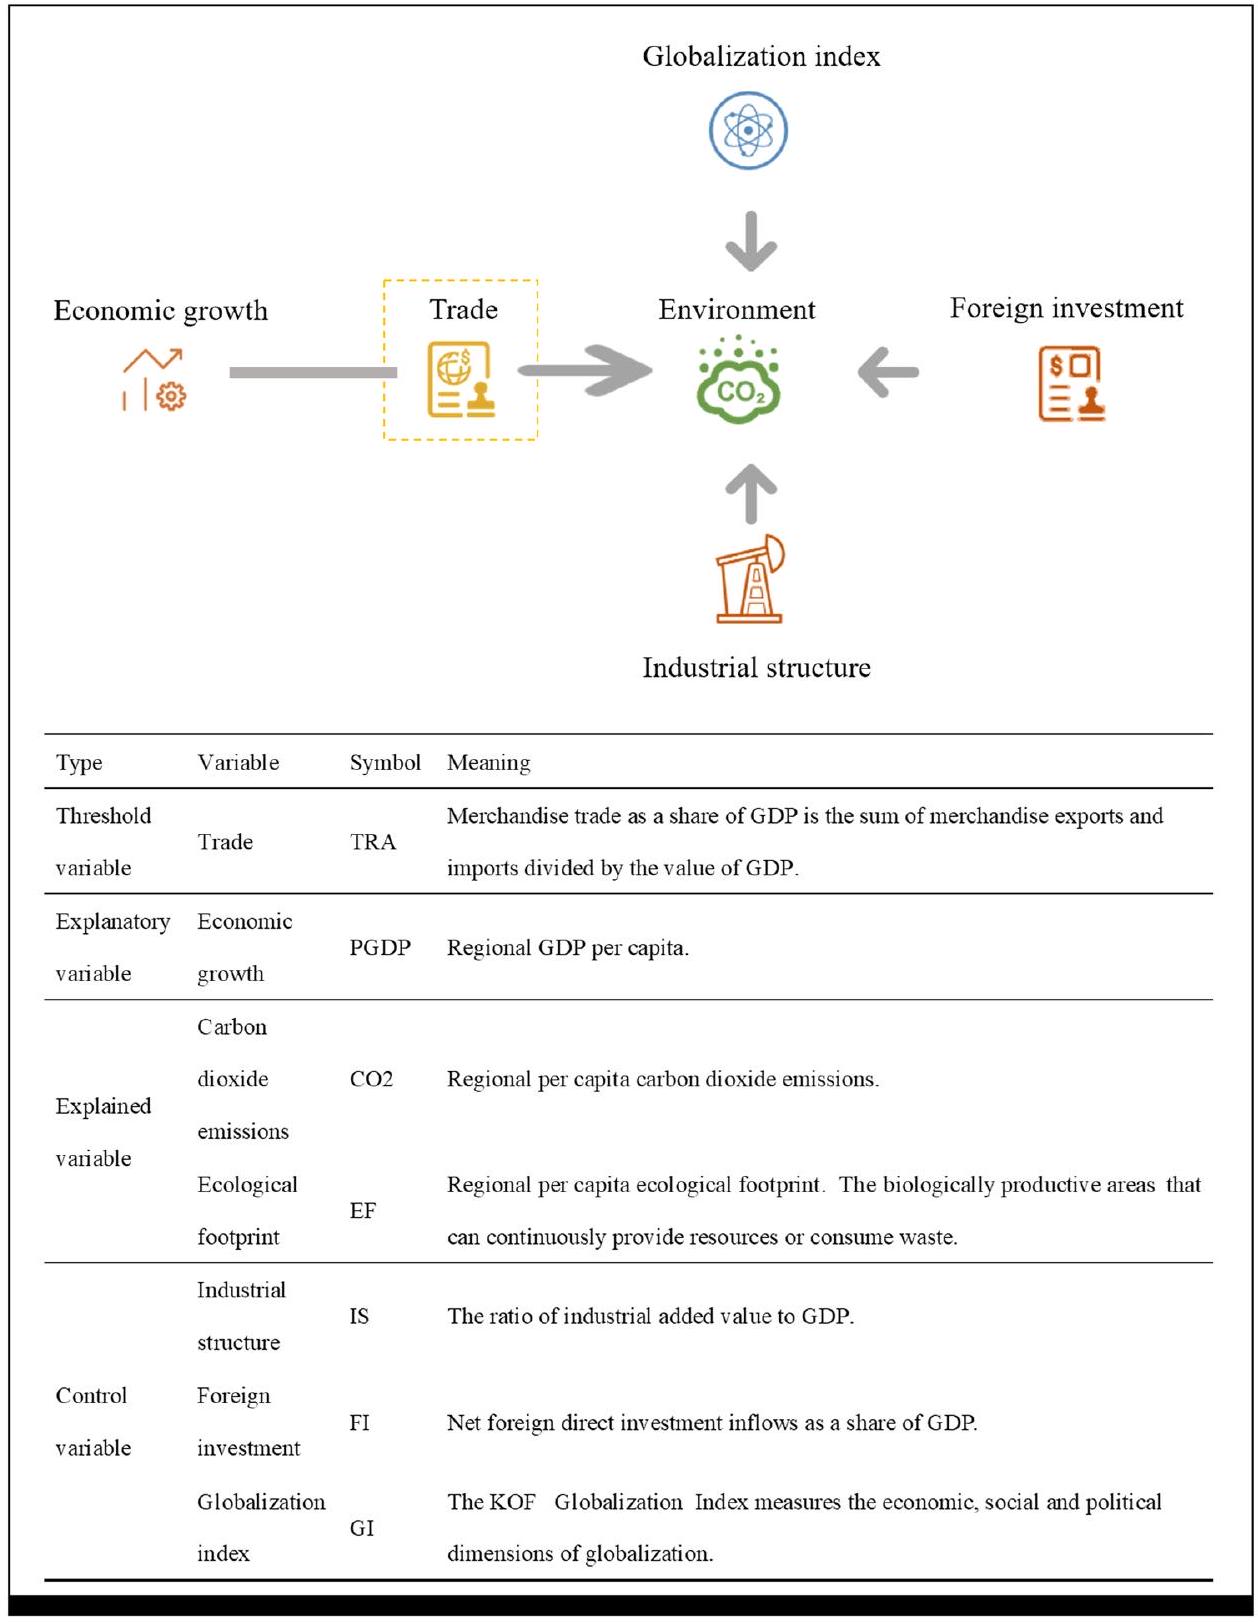
أن استخدام التجارة كمتغير عتبة يقسم تأثير النمو الاقتصادي على انبعاثات الكربون إلى ثلاثة فترات. عندما يكون LnTRA أقل من 4.188، يكون معامل تأثير الناتج المحلي الإجمالي للفرد على ثاني أكسيد الكربون 0.3845. عندما يكون LnTRA بين 4.188 و 5.019، يكون معامل الانحدار 0.3766. عندما يكون LnTRA أكبر من 5.019، يكون المعامل 0.3613. التأثير الإيجابي لـ
يتناقص النمو الاقتصادي على انبعاثات الكربون تدريجياً مع عبور التجارة العتبتين. للتجارة تأثير إيجابي على تحسين الجودة البيئية العالمية. كما أن التأثير غير الخطي للتجارة على نموذج الناتج المحلي الإجمالي للفرد – البصمة البيئية له ثلاث مراحل أيضاً. عندما تكون التجارة أقل من
| السلسلة: LnCO2، LnTRA، LnPGDP، FI، LnGI، LnIS | ||||||
| تجميع | إحصائية | قيمة P | إحصائية | قيمة P | ||
| عالمي | إحصائية اللوحة v | -4.1635 | 1.0000 | إحصاء المجموعة رو | 9.1996 | 1.0000 |
| إحصائية بانل رهو | ٤٫٥٧٠٠ | 1.0000 | مجموعة PP-الإحصائيات | -7.9447*** | 0.0000 | |
| لوحة PP-الإحصائيات | -7.8948*** | 0.0000 | مجموعة ADF-الإحصائية | -8.3655*** | 0.0000 | |
| إحصائية ADF للوحة | -8.4703*** | 0.0000 | ||||
| دخل مرتفع | إحصائية اللوحة v | -2.2600 | 0.9881 | إحصاء المجموعة رو | 5.2669 | 1.0000 |
| إحصائية بانل رو | 1.7863 | 0.9630 | مجموعة PP-الإحصائيات | -3.6072*** | 0.0002 | |
| لوحة PP-الإحصائيات | -6.7003*** | 0.0000 | مجموعة ADF-الإحصائيات | -2.6794*** | 0.0037 | |
| إحصائية ADF للوحة | -6.4451*** | 0.0000 | ||||
| دخل متوسط أعلى | إحصائية اللوحة v | -3.2288 | 0.9994 | إحصاء المجموعة رو | ٤.٢٩٣٤ | 1.0000 |
| إحصائية بانل رهو | 1.6090 | 0.9462 | مجموعة PP-الإحصائيات | -5.0498*** | 0.0000 | |
| لوحة PP-الإحصائيات | -5.8643*** | 0.0000 | مجموعة ADF-الإحصائية | -5.2018*** | 0.0000 | |
| إحصائية ADF للوحة | -7.3357*** | 0.0000 | ||||
| الدخل المتوسط المنخفض | إحصائية اللوحة v | -3.6238 | 0.9999 | إحصاء المجموعة رهو | 6.5462 | 1.0000 |
| إحصائية بانل رهو | ٤.٨٠١٠ | 1.0000 | مجموعة PP-الإحصائيات | -7.2087*** | 0.0000 | |
| لوحة PP-الإحصائيات | -3.9794*** | 0.0000 | مجموعة ADF-الإحصائيات | -6.8838*** | 0.0000 | |
| إحصائية ADF للوحة | -3.3952*** | 0.0003 | ||||
| دخل منخفض | إحصائية اللوحة v | -4.0565 | 1.0000 | إحصائية المجموعة رهو | 6.1567 | 1.0000 |
| إحصائية بانل رهو | ٤.٦٥٥٦ | 1.0000 | مجموعة PP-الإحصائيات | -8.2960*** | 0.0000 | |
| لوحة PP-الإحصائيات | -1.9222** | 0.0273 | مجموعة ADF-الإحصائيات | -1.9399** | 0.0262 | |
| إحصائية ADF للوحة | -2.8809*** | 0.0020 | ||||
| الجدول 5 نتائج اختبار التكامل المتبقي لبدورني (EF). | ||||||
| السلاسل: LnEF، LnTRA، LnPGDP، FI، LnGI، LnIS | ||||||
| تجميع | إحصائية | قيمة P | إحصائية | قيمة P | ||
| عالمي | إحصائية اللوحة v | -2.1190 | 0.9830 | إحصاء المجموعة رهو | 7.3062 | 1.0000 |
| إحصائية بانل رهو | ٤.٧٤٩٤ | 1.0000 | مجموعة PP-الإحصائيات | -18.3612*** | 0.0000 | |
| لوحة PP-الإحصائيات | -7.2941*** | 0.0000 | مجموعة ADF-الإحصائية | -15.0766*** | 0.0000 | |
| إحصائية ADF للوحة | -8.2713*** | 0.0000 | ||||
| دخل مرتفع | إحصائية اللوحة v | -1.0009 | 0.8416 | إحصاء المجموعة رو | ٤٫٧٠٠٩ | 1.0000 |
| إحصائية بانل رهو | 1.9205 | 0.9726 | مجموعة PP-الإحصائيات | -11.3476*** | 0.0000 | |
| لوحة PP-الإحصائيات | -6.7122*** | 0.0000 | مجموعة ADF-الإحصائيات | -8.5196*** | 0.0000 | |
| إحصائية ADF للوحة | -7.4156*** | 0.0000 | ||||
| دخل متوسط أعلى | إحصائية اللوحة v | -1.0212 | 0.8464 | إحصاء المجموعة رهو | ٣.٢٣٠٣ | 0.9994 |
| إحصائية بانل رو | 1.1110 | 0.8667 | مجموعة PP-الإحصائيات | -11.3459*** | 0.0000 | |
| لوحة PP-الإحصائيات | -6.6471*** | 0.0000 | مجموعة ADF-الإحصائية | -10.2345*** | 0.0000 | |
| إحصائية ADF للوحة | -7.6193*** | 0.0000 | ||||
| الدخل المتوسط المنخفض | إحصائية اللوحة v | -2.2089 | 0.9864 | إحصاء المجموعة رو | ٤.٤١٠٦ | 1.0000 |
| إحصائية بانل رهو | ٤.١٨٨٢ | 1.0000 | مجموعة PP-الإحصائيات | -9.3047*** | 0.0000 | |
| لوحة PP-الإحصائيات | -2.5286*** | 0.0057 | مجموعة ADF-الإحصائيات | -8.5867*** | 0.0000 | |
| إحصائية ADF للوحة | -5.9406*** | 0.0000 | ||||
| دخل منخفض | إحصائية اللوحة v | -0.5564 | 0.7110 | إحصاء المجموعة رو | 3.1306 | 0.9991 |
| إحصائية بانل رهو | 1.7173 | 0.9570 | مجموعة PP-الإحصائيات | -7.4826*** | 0.0000 | |
| لوحة PP-الإحصائيات | -4.8723*** | 0.0000 | مجموعة ADF-الإحصائية | -5.7020*** | 0.0000 | |
| إحصائية ADF للوحة | -5.0736*** | 0.0000 | ||||
| المتغير المفسر | رقم العتبة | قيمة F | قيمة P | القيمة الحرجة | ||
| 1% | 5٪ | 10٪ | ||||
| LnCO2 | عازب | 27.950** | 0.024 | ٣٥.٤٩٤ | ٢٢.٣٦٧ | 16.305 |
| مزدوج | 25.891* | 0.074 | ٥٦.٩٨٤ | ٣٢.١٦٢ | 21.469 | |
| LnEF | أعزب | 16.506* | 0.086 | 32.685 | 20.723 | 15.265 |
| مزدوج | 10.655* | 0.060 | 42.533 | 11.564 | 8.629 | |
البصمة هي 0.2818. المعاملات هي 0.2727 و 0.2915 عندما يتجاوز LnTRA عتبتين (2.979 و 5.540). يتبع تغيير المعامل نمطًا على شكل حرف U. من ناحية أخرى، فإن القيمة المقدرة للعتبة الثانية أكبر، والبيانات المتعلقة بالتجارة التي تتجاوز العتبة الثانية أقل. نتيجة لذلك، تقلل التجارة من التأثير الإيجابي للنمو الاقتصادي على تدهور البيئة. يتم تصوير اتجاه تغيير المعامل الناتج عن تأثير العتبة في الشكل 2. من المنظور الجديد للتجارة كمتغير عتبة، نجد أن هناك تأثيرًا واضحًا للتجارة في تخفيف الضغط البيئي.
| المتغير المفسر | قيمة العتبة المقدرة | فترة الثقة 95% | |
| LnCO2 |
|
٤.١٨٨ | [4.173, 4.230] |
|
|
٥.٠١٩ | [4.864, 5.040] | |
| LnEF |
|
2.979 | [٢.٧٨٧، ٣.٠٦٢] |
|
|
٥.٥٤٠ | [٢.٧٨٧، ٥.٥٤٠] |
| تجميع | المتغير المفسر | رقم العتبة |
|
قيمة P | القيمة الحرجة | ||
| 1% | 5% | 10٪ | |||||
| دخل مرتفع | LnCO2 | أعزب | 82.643*** | 0.002 | ٤٧.٢٥٩ | ٣٢.٥٧٧ | ٢٢.٤٣٢ |
| مزدوج | 21.324** | 0.032 | ٢٩.٣١٧ | 19.484 | ١٣.٣٨٨ | ||
| LnEF | أعزب | ٢٩.٦٢٧* | 0.058 | ٤٨.٨٤٧ | 31.238 | ٢٢.٦٧٧ | |
| دخل متوسط أعلى | LnCO2 | أعزب | 32.382** | 0.018 | ٤٥.٠١٤ | ٢٢٫٠٨٣ | 16.643 |
| مزدوج | 10.029* | 0.084 | ٢٦.٥٣٩ | 13.535 | 9.074 | ||
| LnEF | أعزب | 12.980*** | 0.078 | ٢٩.١٥٣ | 15.584 | 11.028 | |
| دخل منخفض متوسط | LnCO2 | أعزب | ٢٤.٦٤٩* | 0.052 | 42.945 | ٢٤.٧٥٧ | 17.284 |
| مزدوج | 17.696** | 0.٠٤٤ | ٣٣.١٤٧ | 16.088 | 11.822 | ||
| LnEF | عازب | 38.759*** | 0.000 | ٢٣.٤٢٨ | 14.125 | 9.757 | |
| مزدوج | 22.013*** | 0.010 | ٢٢.٦٠٧ | 12.679 | 9.407 | ||
| دخل منخفض | LnCO2 | أعزب | 11.954** | 0.048 | 18.933 | 11.860 | 8.748 |
| مزدوج | 9.827* | 0.090 | 21.744 | 13.648 | 9.162 | ||
| LnEF | عازب | 12.469** | 0.034 | 21.609 | ١١.٣٥٠ | 8.684 | |
| مزدوج | 6.990** | 0.024 | 9.613 | 5.637 | ٤.٠٨٢ | ||
| التجميع | المتغير المفسر | قيمة العتبة المقدرة | فترة الثقة 95% | |
| دخل مرتفع | LnCO2 |
|
٤.٠٧٥ | [٤.٠٥٠، ٤.٠٨٣] |
|
|
٤.٩٢٥ | [4.862, 4.931] | ||
| LnEF |
|
٤.٩٣١ | [٤.٩١٢، ٥.٠٢٥] | |
| الطبقة المتوسطة العليا | LnCO2 |
|
3.675 | [3.652, 3.695] |
| دخل |
|
٤.٠٢٢ | [3.698, 4.295] | |
| LnEF |
|
٣.٧٠٦ | [2.880, 4.841] | |
| الطبقة المتوسطة الدنيا | LnCO2 |
|
٣.٢٦٧ | [3.164, 4.417] |
| دخل |
|
٤.٧١٤ | [٤.٦٥٣، ٤.٧٥٦] | |
| LnEF |
|
٣.٤٩٦ | [3.354, 3.594] | |
|
|
٤.٩٥٧ | [4.892, 4.974] | ||
| دخل منخفض | LnCO2 |
|
٣.١٤٢ | [٢.٩٦٤، ٣.٢٦٩] |
|
|
٣.٨١١ | [٢.٩٦٤، ٣.٨٨٠] | ||
| LnEF |
|
٣.٥٦٢ | [3.541, 3.568] | |
|
|
٣.٥٩٥ | [2.964, 4.558] |
| متغير | نموذج العتبة (LnCO2) | نموذج العتبة (LnEF) |
| LnPGDP |
|
0.2818*** (
|
|
|
0.2727*** | |
|
|
|
|
| LnIS |
|
0.1133*** (6.38) |
| في | 0.0004 (1.43) | -0.0001 (-0.51) |
| LnGI | 0.4987*** (10.76) | 0.0270 (0.86) |
| ثابت | -5.6015*** (-36.23) | -1.8545*** (-17.64) |
| R2_w | 0.3438 | 0.2002 |
| اختبار F | 258.12 | ١٤٤.٨١ |
| إن جي | 147 | 147 |
| ن | ٣٥٢٨ | ٣٥٢٨ |
نقاش
| متغير | دخل مرتفع | دخل متوسط أعلى | دخل متوسط أدنى | دخل منخفض | ||||
| (LnCO2) | (LnEF) | (LnCO2) | (LnEF) | (LnCO2) | (LnEF) | (LnCO2) | (LnEF) | |
| LnPGDP
|
0.0609** (1.98) | 0.2754*** (8.83) | 0.4941*** (13.47) | 0.3252*** (12.46) | 0.7340*** (15.37) | 0.2579*** (8.60) | 0.6716*** (8.73) | 0.1732*** (5.02) |
| LnPGDP | 0.0545* (1.78) | 0.5109*** (13.86) | 0.7502*** (15.65) | 0.2687*** (8.91) | 0.6459*** (8.41) | 0.1898*** (5.43) | ||
| (
|
||||||||
| LnPGDP(
|
0.0362 (1.17) | 0.2645*** (8.43) |
|
0.3315*** (12.63) | 0.7766*** (15.98) | 0.2979*** (9.77) | 0.6619*** (8.81) | 0.1794*** (5.24) |
| LnIS | 0.6717*** | 0.6682*** | -0.2754*** | -0.0012 | 0.2036*** (4.14) | -0.0314 (-1.01) | 0.1827*** (2.90) | -0.0596** (-2.01) |
| FI | 0.0003* (1.85) | -0.0001 (-0.79) | 0.0092*** (6.18) | 0.0068*** (6.44) | -0.0029* (-1.76) | -0.0010 (-1.00) | 0.0040* (1.69) | 0.0041*** (3.69) |
| LnGI | 0.4353*** (5.70) | 0.2398*** (3.13) | -0.1945** (-2.18) | -0.1388** (-2.20) | 0.3780*** (4.14) | 0.2230*** (3.90) | 0.3938*** (3.89) | -0.3101*** (-6.64) |
| ثابت | -2.5618*** (-7.69) | -4.2931*** (-13.06) | -1.5864*** (-5.92) | -1.3449*** (-7.11) | -7.9765*** (-30.30) | (-13.99) | -8.3337*** (-22.24) |
|
| R2_w | 0.2902 | 0.2979 | 0.3844 | 0.3259 | 0.5391 | 0.3409 | 0.5173 | 0.1544 |
| اختبار F | 216.05 | 60.41 | 273.32 | 125.64 | 225.62 | 204.94 | 113.47 | 200.62 |
| N | 1056 | 1056 | 1008 | 1008 | 1080 | 1080 | 384 | 384 |
| NG | 16 | 16 | ||||||
(ط) فرضية منحنى كوزنتس البيئي صحيحة ضمن نطاق الدراسة. تم تصنيف 147 دولة تم تحليلها في هذه الورقة إلى أربع مجموعات دخل بناءً على معايير البنك الدولي. تشير البلدان ذات الدخل المنخفض عادةً إلى تلك التي لديها اقتصادات غير متطورة نسبيًا. في نتائج الانحدار لنموذج العتبة، يقع المعامل الإيجابي للنمو الاقتصادي لمجموعات الدخل المنخفض على انبعاثات الكربون بين 0.6 و 0.7. مع زيادة مستوى الدخل، في البلدان ذات الدخل المتوسط الأدنى، يصبح المعامل الإيجابي للنمو الاقتصادي على انبعاثات الكربون أكثر قوة، ويتراوح بين 0.7 و 0.8. بعد أن يتجاوز مستوى الدخل نقطة الانعطاف لمنحنى كوزنتس البيئي، يتناقص المعامل. معامل الانحدار للنمو الاقتصادي على انبعاثات الكربون في مجموعة الدخل المتوسط الأعلى حوالي 0.5. تظهر البلدان ذات الدخل المرتفع، التي تتميز باقتصاد متطور نسبيًا، أقل تأثير إيجابي للاقتصاد على تدهور البيئة، مع معامل أقل من 0.07. بشكل عام، تعرض التغييرات في المعاملات نمط منحنى على شكل حرف U. بعبارة أخرى، مع تحسن مستوى التنمية الاقتصادية، يتدهور الجودة البيئية في البداية ثم تتحسن تدريجيًا. يتم ملاحظة هذا الاتجاه أيضًا عندما تكون المتغير المفسر هو البصمة البيئية. تؤكد النتائج وجود منحنى كوزنتس البيئي، مما يتماشى مع نتائج الأبحاث السابقة (فاروق وآخرون 2022). تميل التنمية الاقتصادية في البلدان ذات الدخل المنخفض إلى الاعتماد بشكل أكبر على استغلال الموارد الطبيعية، بما في ذلك التعدين وإزالة الغابات والزراعة. تساهم هذه الهيكلية الاقتصادية في الاستغلال المفرط للموارد والأضرار البيئية. بالإضافة إلى ذلك، غالبًا ما تفتقر هذه البلدان إلى سياسات بيئية قوية وأنظمة تنظيمية (إيامو وآخرون 2020). قد تواجه البلدان ذات الدخل المتوسط تدهورًا بيئيًا أكثر وضوحًا مقارنة بالبلدان ذات الدخل المنخفض. عادةً ما تحقق هذه البلدان مستوى معينًا من التنمية الاقتصادية، مع تسريع عمليات التصنيع والتحضر. وبالتالي، تؤدي الأنشطة الصناعية واسعة النطاق، وبناء البنية التحتية، والتوسع الحضري في البلدان ذات الدخل المتوسط إلى استهلاك كبير للموارد الطبيعية وتساهم بشكل كبير في الضغط البيئي والتلوث (مارتينيز زارزوسو وماروتي 2011). على الرغم من تحقيق بعض التنمية الاقتصادية، قد تظل البلدان ذات الدخل المتوسط متأخرة في التكنولوجيا البيئية والابتكار. بالإضافة إلى ذلك، قد يكون هناك تأخير زمني بين ظهور المشكلات البيئية وإدراك التدابير المقابلة بسبب قضايا التنمية الاقتصادية. عادةً ما تظهر البلدان ذات الدخل المرتفع جودة بيئية أعلى، ويرجع ذلك أساسًا إلى أنها تمتلك عادةً تكنولوجيا متقدمة وبنية تحتية قوية. وهذا يمكنها من تنفيذ تدابير فعالة لحماية البيئة ومراقبة التلوث (هوريه وآخرون 2021). علاوة على ذلك، تتمتع البلدان ذات الدخل المرتفع عادةً بهيكل اقتصادي متنوع، لا يعتمد فقط على استخراج الموارد الطبيعية ولكن أيضًا يركز على تطوير الصناعات الخدمية، والابتكار التكنولوجي، واقتصاد المعرفة. تساهم هذه الهيكلية الاقتصادية المتنوعة في تقليل الضغط البيئي، واستهلاك الموارد، وانبعاثات التلوث.
(ii) يعزز الحماية التجارية تدهور البيئة. يظهر تأثير حماية التجارة تأثيرات غير خطية في نموذج النمو الاقتصادي-تدهور البيئة (جي وآخرون 2022). في جوهرها، فإن الانفتاح التجاري مفيد لتحسين جودة البيئة العالمية
ممارسات الإدارة المتقدمة، وأفكار مبتكرة من دول أخرى، مما يعزز التقدم التكنولوجي والتنمية الاقتصادية. علاوة على ذلك، سهل الانفتاح التجاري التقدم في التكنولوجيا البيئية والمعايير. في مجال التجارة الدولية، تُجبر الدول على الالتزام بالمتطلبات والمعايير لـ
(iii) بالنسبة للدول ذات مستويات الدخل المتنوعة، يوجد تباين في التأثير غير الخطي لحماية التجارة على العلاقة بين الاقتصاد والبيئة. مع زيادة التجارة، يظهر معامل النمو الاقتصادي الإيجابي فيما يتعلق بانبعاثات الكربون والبصمة البيئية ضمن مجموعة الدخل المرتفع اتجاهًا متناقصًا. تمتلك التجارة القدرة على تحسين جودة البيئة في الدول ذات الدخل المرتفع. ومع ذلك، فإنها تساهم في تدهور البيئة بدرجات متفاوتة في الدول ذات الدخل المتوسط الأعلى، والدخل المتوسط الأدنى، والدخل المنخفض. تتماشى هذه النتائج مع فرضية ملاذ التلوث (Gyamfi et al. 2021). عندما تفرض دولة أو منطقة قوانين وأنظمة حماية بيئية أكثر صرامة، قد تنتقل الصناعات ذات التلوث العالي إلى دول أو مناطق ذات قوانين وأنظمة بيئية أقل صرامة، مما يؤدي إلى ما يُعرف عادةً بـ “ملاذ التلوث”. تميل الشركات في الصناعات كثيفة التلوث إلى تأسيس نفسها في دول أو مناطق ذات معايير بيئية أقل نسبيًا (Banerjee and Murshed 2020). تسهل التجارة الحرة نقل الصناعات عالية الكربون عبر الحدود، حيث تستفيد الدول المتقدمة وتحقق تحسينًا في جودة البيئة. على العكس من ذلك، تواجه الدول النامية، التي تعمل كدول مضيفة للاستثمار الأجنبي، غالبًا تدهورًا بيئيًا كنتيجة لذلك (Essandoh et al. 2020).
الاستنتاجات، الآثار، والقيود
حماية الصناعة، ومؤشرات البيئة عبر 147 دولة، مقسمة إلى أربع مجموعات دخل. وقد تم استخدام اختبار التكامل المشترك لبيدوني لتأكيد وجود علاقات مستقرة على المدى الطويل بين انبعاثات الكربون، والبصمة البيئية، ومتغيرات أخرى، مما أسس لأسس تحليلات الانحدار الدقيقة. ومن الجدير بالذكر أن الدراسة رائدة في استكشاف تأثيرات العتبة، كاشفة عن علاقات غير خطية بين التجارة، والنمو الاقتصادي، والنتائج البيئية عبر مجموعات الدخل. وقد كشفت توضيحات نماذج العتبة عن رؤى مثيرة، تظهر تأثيرات متفاوتة للتجارة على النمو الاقتصادي، وانبعاثات الكربون، والبصمات البيئية. وكانت العتبات المميزة التي تم تحديدها عبر مجموعات الدخل جديرة بالملاحظة، حيث تحدد التغيرات في العلاقات بين التجارة، والنمو الاقتصادي، والتأثيرات البيئية. وأكدت هذه النتائج الطبيعة الدقيقة لتأثير التنمية الاقتصادية على تدهور البيئة، داعمة نظريات مثل منحنى كوزنتس البيئي ضمن فئات دخل محددة بينما كشفت عن تباينات في أخرى.
(ط) دعمت الدراسة فرضية منحنى كوزنتس البيئي، كاشفة عن علاقة على شكل حرف U مقلوب بين النمو الاقتصادي وتدهور البيئة. درجة تلوث البيئة في البلدان ذات الدخل المنخفض منخفضة نسبيًا، ومعامل الانحدار للنمو الاقتصادي على تدهور البيئة صغير نسبيًا. تصبح قيم المعاملات أكبر بالنسبة للبلدان ذات الدخل المنخفض والمتوسط والبلدان ذات الدخل المتوسط المرتفع. بينما تمتلك البلدان ذات الدخل المرتفع أصغر المعاملات. وهذا يتوافق مع فرضية منحنى كوزنتس البيئي. مع زيادة مستوى الدخل، يزداد الضغط الناتج عن النمو الاقتصادي على البيئة أولاً ثم ينخفض.
(ii) كشفت الدراسة عن التأثير المعقد للحماية التجارية على تدهور البيئة. بينما عزز الانفتاح التجاري عالميًا جودة البيئة، كانت هناك آثار غير خطية واضحة في النماذج التي تفحص العلاقة بين النمو الاقتصادي وتدهور البيئة. لعبت التجارة دورًا محوريًا في تعزيز الابتكار التكنولوجي، ودعم التنمية الاقتصادية، ورفع المعايير البيئية. ومع ذلك، فإن الحفاظ على توازن مثالي أمر ضروري لتجنب الاستغلال المفرط للموارد.
(iii) كانت هناك تباينات في الآثار غير الخطية للحماية التجارية عبر مجموعات الدخل. بالنسبة لمجموعات الدخل المختلفة، فإن الانفتاح التجاري يقلل من تدهور البيئة في مجموعة الدخل المرتفع ولكنه له تأثير عكسي في مجموعتي الدخل العليا والمتوسطة الدنيا.
المجموعات، تدعم فرضية ملاذ التلوث. وهذا يبرز أهمية تنفيذ لوائح بيئية صارمة واعتماد استراتيجيات التنمية المستدامة لمواجهة الآثار البيئية الناتجة عن التجارة في الاقتصادات النامية.
يتكامل بشكل معقد بين التجارة والاقتصاد والبيئة، مما يساهم بشكل كبير في الأدبيات الأكاديمية الحالية. من خلال التعمق في طبقات أعمق من العلاقات غير الخطية، يعزز بشكل كبير فهمنا للتفاعل المعقد بين العوامل البيئية والنمو الاقتصادي. تم تصميم هذا النموذج خصيصًا لفحص تأثير التجارة على العلاقة بين الاقتصاد والبيئة من خلال تحليل بيانات اللوحات، ويقدم رؤى نظرية ذات صلة لاستكشاف تأثيرات العتبة عبر اقتصادات متنوعة. قد تمتد التحقيقات المستقبلية إلى تحويلات المتغيرات لكشف علاقات غير خطية إضافية بين مجموعة متنوعة من المتغيرات.
توفر البيانات
نُشر على الإنترنت: 24 يناير 2024
References
Adebayo TS, Kirikkaleli D (2021) Impact of renewable energy consumption, globalization, and technological innovation on environmental degradation in Japan: application of wavelet tools. Environ Dev Sustain 23(11):16057-16082
Ahmad M, Jiang P, Majeed A, Umar M, Khan Z, Muhammad S (2020) The dynamic impact of natural resources, technological innovations and economic growth on ecological footprint: an advanced panel data estimation. Resour Policy 69:101817
Akadırı SS, Alola AA, Usman O (2021) Energy mix outlook and the EKC hypothesis in BRICS countries: a perspective of economic freedom vs. economic growth. Environ Sci Pollut Res 28(7):8922-8926
Alola AA, Donve UT (2021) Environmental implication of coal and oil energy utilization in Turkey: is the EKC hypothesis related to energy? Manag Environ Qual 32:543-559
Balsalobre-Lorente D, Driha OM, Leitão NC, Murshed M (2021) The carbon dioxide neutralizing effect of energy innovation on international tourism in EU-5 countries under the prism of the EKC hypothesis. J Environ Manag 298:113513
Balsalobre-Lorente D, Ibáez-Luzón L, Usman M, Shahbaz M (2022) The environmental kuznets curve, based on the economic complexity, and the pollution haven hypothesis in PIIGS countries. Renew Energy 185:1441-1455
Barlow P, van Schalkwyk MC, McKee M, Labonté R, Stuckler D (2021) COVID-19 and the collapse of global trade: building an effective public health response. Lancet Planet Health 5(2):e102-e107
Bechtel MM, Bernauer T, Meyer R (2012) The green side of protectionism: environmental concerns and three facets of trade policy preferences. Rev Int Political Econ 19(5):837-866
Chen Z, Hao X, Zhou M (2022) Does institutional quality affect air pollution? Environ Sci Pollut Res 29(19):28317-28338
Copeland BR (2000) Trade and environment: policy linkages. Environ Dev Econ 5(4):405-432
Del Lo G, Marcelin I, Bassène T, Sène B (2022) The Russo-Ukrainian war and financial markets: the role of dependence on Russian commodities. Financ Res Lett 50:103194
Destek MA, Sarkodie SA (2019) Investigation of environmental kuznets curve for ecological footprint: the role of energy and financial development. Sci Total Environ 650:2483-2489
Dogan E, Inglesi-Lotz R (2020) The impact of economic structure to the environmental kuznets curve (EKC) hypothesis: evidence from European countries. Environ Sci Pollut Res 27(11):12717-12724
Essandoh OK, Islam M, Kakinaka M (2020) Linking international trade and foreign direct investment to CO2 emissions: any differences between developed and developing countries? Sci Total Environ 712:136437
Farooq S, Ozturk I, Majeed MT, Akram R (2022) Globalization and CO2 emissions in the presence of EKC: a global panel data analysis. Gondwana Res 106:367-378
Ge M, Kannaiah D, Li J, Khan N, Shabbir MS, Bilal K, Tabash MI (2022) Does foreign private investment affect the clean industrial environment? Nexus among foreign private investment, CO2 emissions, energy consumption, trade openness, and sustainable economic growth. Environ Sci Pollut Res 29:26182-26189
Global Foofprint Network (2022) Ecological footprint open data. https://data. footprintnetwork.org/
Grossman GM, Krueger AB (1991) Environmental impacts of a North American free trade agreement. National Bureau of economic research, Cambridge, Mass., USA
Grossman GM, Krueger AB (1995) Economic growth and the environment. Q J Econ 110(2):353-377
Guzel AE, Okumus İ (2020) Revisiting the pollution haven hypothesis in ASEAN-5 countries: new insights from panel data analysis. Environ Sci Pollut Res 27(15):18157-18167
Gyamfi BA, Bein MA, Udemba EN, Bekun FV (2021) Investigating the pollution haven hypothesis in oil and non-oil sub-Saharan Africa countries: evidence from quantile regression technique. Resour Policy 73:102119
Hansen BE (1999) Threshold effects in non-dynamic panels: estimation, testing, and inference. J Econ 93(2):345-368
Hao Y, Ba N, Ren S, Wu H (2021) How does international technology spillover affect China’s carbon emissions? A new perspective through intellectual property protection. Sustain Prod Consum 25:577-590
Hao Y, Guo Y, Guo Y, Wu H, Ren S (2020) Does outward foreign direct investment (OFDI) affect the home country’s environmental quality? The case of China. Struct Change Econ Dyn 52:109-119
Hoareau CE, Ahmad N, Nuid M, Khoi DN, Kristanti RA (2021) Sustainable technology in developed countries: waste municipal management. Industrial and Domestic. Waste Manag 1(1):48-55
Hu Y, Ren S, Wang Y, Chen X (2020) Can carbon emission trading scheme achieve energy conservation and emission reduction? Evidence from the industrial sector in China. Energy Econ 85:104590
Im KS, Pesaran MH, Shin Y (2003) Testing for unit roots in heterogeneous panels. J Econ 115(1):53-74
Isik C, Ongan S, Ozdemir D, Ahmad M, Irfan M, Alvarado R, Ongan A (2021) The increases and decreases of the environment kuznets curve (EKC) for 8 OECD countries. Environ Sci Pollut Res 28(22):28535-28543
Iyamu H, Anda M, Ho G (2020) A review of municipal solid waste management in the BRIC and high-income countries: a thematic framework for low-income countries. Habitat Int 95:102097
Jiang S, Mentel G, Shahzadi I, Jebli MB, Iqbal N (2022) Renewable energy, trade diversification and environmental footprints: evidence for Asia-Pacific Economic Cooperation (APEC). Renew Energy 187:874-886
Khan Z, Ali S, Umar M, Kirikkaleli D, Jiao Z (2020) Consumption-based carbon emissions and international trade in G7 countries: the role of environmental innovation and renewable energy. Sci Total Environ 730:138945
Koc S, Bulus GC (2020) Testing validity of the EKC hypothesis in South Korea: role of renewable energy and trade openness. Environ Sci Pollut Res 27(23):29043-29054
KOF Swiss Economic Institute (2022) KOF Globalisation Index Open Data. https:// mtec.ethz.ch/
Le HP, Ozturk I (2020) The impacts of globalization, financial development, government expenditures, and institutional quality on CO2 emissions in the presence of environmental kuznets curve. Environ Sci Pollut Res 27(18):22680-22697
Levin A, Lin C-F, Chu C-SJ (2002) Unit root tests in panel data: asymptotic and finite-sample properties. J Econ 108(1):1-24
Li R, Li L, Wang Q (2022) The impact of energy efficiency on carbon emissions: evidence from the transportation sector in Chinese 30 provinces. Sustain Cities Soc 82:103880
Li R, Wang Q, Guo J (2024) Revisiting the Environmental Kuznets Curve (EKC) Hypothesis of Carbon Emissions: Exploring the Impact of Geopolitical Risks, Natural Resource Rents, Corrupt Governance, and Energy Intensity. J Environ Manage 351:119663
Li R, Wang Q, Li L, Hu S (2023) Do natural resource rent and corruption governance reshape the environmental Kuznets curve for ecological footprint? Evidence from 158 countries. Resour Policy 85:103890
Li R, Wang Q, Liu Y, Jiang R (2021) Per-capita carbon emissions in 147 countries: the effect of economic, energy, social, and trade structural changes. Sustain Prod Consum 27:1149-1164
Liu X, Wahab S, Hussain M, Sun Y, Kirikkaleli D (2021) China carbon neutrality target: revisiting FDI-trade-innovation nexus with carbon emissions. J Environ Manag 294:113043
Liu Y, Mabee W, Zhang H (2021) Conserving fertilizer in China’s rural-agricultural development: the reversal shifts and the county-specific EKC evidence from Hubei. Clean Environ Syst 3:100050
Liu Y, Sadiq F, Ali W, Kumail T (2022) Does tourism development, energy consumption, trade openness and economic growth matters for ecological footprint: testing the environmental kuznets curve and pollution haven hypothesis for Pakistan. Energy 245:123208
Martínez-Zarzoso I, Maruotti A (2011) The impact of urbanization on CO2 emissions: evidence from developing countries. Ecol Econ 70(7):1344-1353
Muhammad S, Long X, Salman M, Dauda L (2020) Effect of urbanization and international trade on CO2 emissions across 65 belt and road initiative countries. Energy 196:117102
Murshed M, Nurmakhanova M, Elheddad M, Ahmed R (2020) Value addition in the services sector and its heterogeneous impacts on CO2 emissions: revisiting the EKC hypothesis for the OPEC using panel spatial estimation techniques. Environ Sci Pollut Res 27(31):38951-38973
Nathaniel S, Khan SAR (2020) The nexus between urbanization, renewable energy, trade, and ecological footprint in ASEAN countries. J Clean Prod 272:122709
Neves SA, Marques AC, Patrício M (2020) Determinants of CO2 emissions in European Union countries: does environmental regulation reduce environmental pollution? Econ Anal Policy 68:114-125
Ozcan B, Ulucak R (2021) An empirical investigation of nuclear energy consumption and carbon dioxide (CO2) emission in India: Bridging IPAT and EKC hypotheses. Nucl Eng Technol 53(6):2056-2065
Ozgur O, Yilanci V, Kongkuah M (2022) Nuclear energy consumption and CO2 emissions in India: Evidence from Fourier ARDL bounds test approach. Nucl Eng Technol 54(5):1657-1663
Panayotou T (1993) Empirical tests and policy analysis of environmental degradation at different stages of economic development. Pacific and Asian Journal of Energy 4(1)
Park Y, Meng F, Baloch MA (2018) The effect of ICT, financial development, growth, and trade openness on CO2 emissions: an empirical analysis. Environ Sci Pollut Res 25(30):30708-30719
Pata UK (2018) Renewable energy consumption, urbanization, financial development, income and CO2 emissions in Turkey: testing EKC hypothesis with structural breaks. J Clean Prod 187:770-779
Pata UK, Aydin M (2020) Testing the EKC hypothesis for the top six hydropower energy-consuming countries: evidence from Fourier Bootstrap ARDL procedure. J Clean Prod 264:121699
Pata UK, Caglar AE (2021) Investigating the EKC hypothesis with renewable energy consumption, human capital, globalization and trade openness for China: evidence from augmented ARDL approach with a structural break. Energy 216:119220
Pata UK, Samour A (2022) Do renewable and nuclear energy enhance environmental quality in France? A new EKC approach with the load capacity factor. Prog Nucl Energy 149:104249
Sarkis J (2019) Sustainable transitions: technology, resources, and society. One Earth 1(1):48-50
Scott D, Gössling S (2021) From Djerba to Glasgow: have declarations on tourism and climate change brought us any closer to meaningful climate action? J Sustain Tour 30(1):199-222
Shahbaz M, Gozgor G, Adom PK, Hammoudeh S (2019) The technical decomposition of carbon emissions and the concerns about FDI and trade openness effects in the United States. Int Econ 159:56-73
Sinha A, Sengupta T, Alvarado R (2020) Interplay between technological innovation and environmental quality: formulating the SDG policies for next 11 economies. J Clean Prod 242:118549
Tenaw D, Beyene AD (2021) Environmental sustainability and economic development in sub-Saharan Africa: a modified EKC hypothesis. Renew Sustain Energy Rev 143:110897
Tong Y, Zhou H, Jiang L (2021) Exploring the transition effects of foreign direct investment on the eco-efficiency of Chinese cities: based on multi-source data and panel smooth transition regression models. Ecol Indic 121:107073
Usman M, Makhdum MSA, Kousar R (2021) Does financial inclusion, renewable and non-renewable energy utilization accelerate ecological footprints and economic growth? Fresh evidence from 15 highest emitting countries. Sustain Cities Soc 65:102590
Vural G (2020) How do output, trade, renewable energy and non-renewable energy impact carbon emissions in selected Sub-Saharan African Countries? Resour Policy 69:101840
Wahab S, Zhang X, Safi A, Wahab Z, Amin M (2021) Does energy productivity and technological innovation limit trade-adjusted carbon emissions? Economic Res Ekonomska Istraživanja 34(1):1896-1912
Wang K, Zhu Y, Zhang J (2021) Decoupling economic development from municipal solid waste generation in China’s cities: Assessment and prediction based on Tapio method and EKC models. Waste Manag 133:37-48
Wang Q, Hu S, Li R (2023a) Could information and communication technology (ICT) reduce carbon emissions? The role of trade openness and financial development. Telecommun Policy: 102699. https://doi.org/10.1016/j.telpol. 2023.102699
Wang Q, Wang L, Li R (2023c) Trade openness helps move towards carbon neutrality-insight from 114 countries. Sustain Dev. https://doi.org/10.1002/ sd. 2720
Wang X, Shao Q (2019) Non-linear effects of heterogeneous environmental regulations on green growth in G20 countries: Evidence from panel threshold regression. Sci Total Environ 660:1346-1354
Wang Y, Liao M, Xu L, Malik A (2021) The impact of foreign direct investment on China’s carbon emissions through energy intensity and emissions trading system. Energy Econ 97:105212
Winning M, Price J, Ekins P, Pye S, Glynn J, Watson J, McGlade C (2019) Nationally determined contributions under the Paris Agreement and the costs of delayed action. Clim Policy 19(8):947-958
World Bank (2022) World Bank Open Data. https://data.worldbank.org/
Yasmeen R, Zhaohui C, Shah WUH, Kamal MA, Khan A (2022) Exploring the role of biomass energy consumption, ecological footprint through FDI and technological innovation in B&R economies: a simultaneous equation approach. Energy 244:122703
Yilanci V, Pata UK (2020) Investigating the EKC hypothesis for China: the role of economic complexity on ecological footprint. Environ Sci Pollut Res 27(26):32683-32694
Yin Y, Xiong X, Hussain J (2021) The role of physical and human capital in FDI-pollution-growth nexus in countries with different income groups: a simultaneity modeling analysis. Environ Impact Assess Rev 91:106664
Zafar MW, Zaidi SAH, Khan NR, Mirza FM, Hou F, Kirmani SAA (2019) The impact of natural resources, human capital, and foreign direct investment on the ecological footprint: the case of the United States. Resour Policy 63:101428
Zeitun R, Goaied M (2021) The nonlinear effect of foreign ownership on capital structure in Japan: A panel threshold analysis. Pac Basin Financ J 68:101594
Zhou A, Li J (2020) The nonlinear impact of industrial restructuring on economic growth and carbon dioxide emissions: a panel threshold regression approach. Environ Sci Pollut Res 27(12):14108-14123
شكر وتقدير
مساهمات المؤلفين
المصالح المتنافسة
الموافقة الأخلاقية
الموافقة المستنيرة
معلومات إضافية
ملاحظة الناشر: تظل شركة سبرينجر ناتشر محايدة فيما يتعلق بالمطالبات القضائية في الخرائط المنشورة والانتماءات المؤسسية.
© المؤلف(ون) 2024
كلية الاقتصاد والإدارة، جامعة شينجيانغ، وولوموتشي 830046، جمهورية الصين الشعبية. كلية الاقتصاد والإدارة، جامعة البترول الصينية (شرق الصين)، كينغداو 266580، جمهورية الصين الشعبية. معهد الصين للدراسات الحدودية والمحيطية، جامعة ووهان، ووهان 430072، جمهورية الصين الشعبية. قسم الاقتصاد أرندت-كوردن، مدرسة كراوفورد للسياسة العامة، الجامعة الوطنية الأسترالية، كانبيرا، ACT 2601، أستراليا.
البريد الإلكتروني:وانغ تشيانغ 7@upc.edu.cn; lirr@upc.edu.cn - ملاحظة: ***, **, * تمثل الدلالة عند مستوى الدلالة 1%، 5%، و10% على التوالي.
DOI: https://doi.org/10.1057/s41599-024-02639-9
Publication Date: 2024-01-24
Reinvestigating the environmental Kuznets curve (EKC) of carbon emissions and ecological footprint in 147 countries: a matter of trade protectionism
Abstract
Environmental degradation has profoundly impacted both human society and ecosystems. The environmental Kuznets curve (EKC) illuminates the intricate relationship between economic growth and environmental decline. However, the recent surge in trade protectionism has heightened global economic uncertainties, posing a severe threat to global environmental sustainability. This research aims to investigate the intricate pathways through which trade protection, assessed by available trade openness data, influences the nexus between economic growth and environmental degradation. Leveraging comprehensive global panel data spanning 147 countries from 1995 to 2018, this study meticulously examines the non-linear dynamics among trade, economy, and the environment, with a particular emphasis on validating the EKC hypothesis. This study encompasses exhaustive global and panel data regressions categorized across four income groups. The research substantiates the validity of the EKC hypothesis within the confines of this investigation. As income levels rise, the impact of economic growth on environmental degradation initially intensifies before displaying a diminishing trend. Additionally, trade protection manifests as a detriment to improving global environmental quality. The ramifications of trade protectionism display nuanced variations across income strata. In high-income nations, trade protection appears to contribute to mitigating environmental degradation. Conversely, within other income brackets, the stimulating effect of trade protection on environmental pressure is more conspicuous. In other words, trade protectionism exacerbates environmental degradation, particularly affecting lower-income countries, aligning with the concept of pollution havens. The study’s results illuminate nuanced thresholds in the relationship between trade, economic growth, and environmental degradation across income groups, emphasizing the heterogeneous impact and underlying mechanisms. These findings provide valuable insights for policymakers, urging collaborative efforts among nations to achieve a harmonious balance between economic advancement and environmental preservation on a global scale.
Introduction
spanning the period 1995 to 2018: (1) Within the ambit of the study’s scope, does empirical evidence lend support to the EKC hypothesis? (2) In the economic growth-environmental degradation model, what is the role of trade protection measures? Are there discernible nonlinear effects inherent in this relationship? (3) To what extent does the observed effect differ among countries, contingent upon their respective income levels?
Literature review
and the heterogeneous panel causality method. The results unveiled an inverted U-shaped relationship between economic growth and ecological footprint. Using the simultaneous equations framework, Yin et al. (2021) examined the causal relationship between FDI,
of energy economics. Wang and Shao (2019) employed a panel threshold regression technique to observe the non-linear impact of formal and informal environmental regulations on G20 green growth between 2001 and 2015. Additionally, Zhou and Li (2020) studied the non-linear impact of industrial restructuring on economic growth and carbon dioxide emissions in 32 countries. Li et al. (2022) explored carbon emissions in the transportation industry across 30 provinces in China, employing a methodology that combines the decoupling index and panel threshold analysis. Zeitun and Goaied (2021) examined the non-linear relationship between foreign ownership and firm leverage decisions, investigating whether thresholds on foreign ownership levels moderate the effects of capital structure determinants. Another study used linear and nonlinear models to explore factors affecting carbon emissions (Li et al. 2021). To sum up, the panel threshold model is mature and recognized by scholars from various countries. This paper investigates the non-linear effects of trade on the economy and the environment, and it is appropriate and reliable to apply this model.
carbon emissions, revealing that trade, FDI, and OFDI contribute to an increase in regional carbon emissions. Wang et al. (2021) investigated the mechanism of FDI’s effect on carbon emissions through energy intensity, and the results revealed that FDI is one of the reasons for the increase in emissions in China at this stage, and FDI can also increase carbon emissions indirectly through increasing energy intensity. Vural (2020) investigated the effects of output, trade, and renewable and non-renewable energy on carbon emissions in Sub-Saharan African countries. Long-term empirical findings suggest that nonrenewable energy and trade contribute to the increase in carbon emissions. Liu et al. (2022) investigated the impact of tourism development, economic growth, energy consumption, trade openness, and foreign direct investment on Pakistan’s ecological footprint using the EKC. The findings revealed that trade has an ecological footprint and that foreign direct investment contributes to environmental degradation. Abid et al. (2022) investigated the connection between renewable energy consumption and ecological footprint in Saudi Arabia, contending that capital and trade openness are factors contributing to environmental degradation. Yasmeen et al. (2022) formulated three simultaneous equations to evaluate the effects of Foreign Direct Investment (FDI) inflow, technological innovation, natural resources, and population density on biomass energy consumption and ecological footprint. The empirical findings revealed that FDI has not led to environmental improvement in the Belt and Road region. Nathaniel and Khan (2020) investigated the relationship between urbanization, renewable energy, trade, and ecological footprint in ASEAN countries, confirming the role of trade in environmental degradation. Another study investigated how globalization and electricity consumption are driving Ghana’s human demand for ecological resources. Evidence suggests that globalization has a significant impact on the environmental footprint (Langnel and Amegavi 2020).
in the 15 highest emitting countries. The Augmented Mean Group (AMG) estimation method revealed that trade openness, financial development, and renewable energy all have a significant impact on overcoming environmental degradation. Zafar et al. (2019) applied the ARDL model to examine the impact of natural resources, human capital, and foreign direct investment on the ecological footprint. The results showed that foreign direct investment significantly reduces the ecological footprint of the United States.
Data and methods
of each cross-section unit; that is, the regression coefficient of the first-order lag term of each longitudinal section time series must be the same.
| Mean | Median | Max | Min | Sd | Skewness | Kurtosis |
|
|
| LnCO2 | 0.6002 | 0.8753 | 3.4174 | -4.1158 | 1.5402 | -0.6555 | 2.6546 | 3528 |
| LnPGDP | 8.4380 | 8.3684 | 11.3849 | 5.3900 | 1.4085 | 0.0753 | 2.1273 | 3528 |
| LnTRA | 4.0340 | 4.0200 | 5.8391 | 2.0549 | 0.5167 | 0.0663 | 3.0456 | 3528 |
| LnEF | 0.9253 | 0.9093 | 2.6328 | -0.7132 | 0.6944 | 0.0002 | 2.0247 | 3528 |
| LnIS | 3.2440 | 3.2433 | 4.4402 | 2.0167 | 0.3788 | 0.0582 | 3.3783 | 3528 |
| FI | 4.9536 | 2.7169 | 449.0828 | -40.0811 | 15.8228 | 17.0032 | 375.0253 | 3528 |
| LnGI | 4.0358 | 4.0477 | 4.5079 | 3.1068 | 0.2773 | -0.3582 | 2.6082 | 3528 |
Empirical results
| Grouping | Mean | Median | Max | Min | Sd | Skewness | Kurtosis | N | |
| High income group | LnCO2 | 2.0763 | 2.0820 | 3.4174 | 0.3008 | 0.5079 | -0.3146 | 3.5956 | 1056 |
| LnEF | 1.7042 | 1.7043 | 2.6328 | 0.2300 | 0.2958 | 0.0765 | 4.1670 | 1056 | |
| LnTRA | 4.1590 | 4.0938 | 5.8391 | 2.6424 | 0.5479 | 0.2220 | 3.1235 | 1056 | |
| LnPGDP | 10.1431 | 10.3116 | 11.3849 | 8.5043 | 0.6124 | -0.3312 | 2.3036 | 1056 | |
| LnIS | 3.2674 | 3.2433 | 4.3056 | 2.2256 | 0.3569 | 0.4236 | 3.9657 | 1056 | |
| Fl | 7.8374 | 3.0609 | 449.0828 | -40.0811 | 27.7358 | 10.2126 | 128.5140 | 1056 | |
| LnGI | 4.3095 | 4.3569 | 4.5079 | 3.7945 | 0.1570 | -1.1440 | 3.5834 | 1056 | |
| Upper middle income group | LnCO2 | 1.0627 | 1.0592 | 2.7112 | -0.7548 | 0.6772 | 0.0337 | 2.6146 | 1008 |
| LnEF | 0.9421 | 0.9475 | 1.9145 | 0.0715 | 0.3409 | 0.0708 | 2.6374 | 1008 | |
| LnTRA | 4.0858 | 4.1032 | 5.2581 | 2.1977 | 0.4686 | -0.3437 | 3.3909 | 1008 | |
| LnPGDP | 8.5477 | 8.5533 | 9.6078 | 6.6450 | 0.4780 | -0.5741 | 3.5692 | 1008 | |
| LnIS | 3.3188 | 3.2962 | 4.4402 | 2.4077 | 0.3592 | 0.2536 | 2.9514 | 1008 | |
| FI | 4.4062 | 3.4140 | 55.0703 | -10.2567 | 4.8999 | 3.4521 | 28.9854 | 1008 | |
| LnGI | 4.0453 | 4.0699 | 4.3993 | 3.4212 | 0.1869 | -0.5764 | 2.8420 | 1008 | |
| Lower middle income group | LnCO2 | -0.2764 | -0.2515 | 2.0647 | -2.5626 | 0.9598 | 0.2237 | 2.8469 | 1080 |
| LnEF | 0.4372 | 0.3315 | 2.3646 | -0.7132 | 0.5309 | 0.8286 | 3.7528 | 1080 | |
| LnTRA | 3.9970 | 3.9822 | 5.2780 | 2.7668 | 0.5018 | -0.0569 | 2.4504 | 1080 | |
| LnPGDP | 7.4291 | 7.4414 | 8.6330 | 5.9496 | 0.5634 | -0.1226 | 2.3626 | 1080 | |
| LnIS | 3.2543 | 3.2677 | 4.2866 | 2.0167 | 0.3702 | -0.3570 | 3.9257 | 1080 | |
| FI | 3.2774 | 1.9842 | 43.9121 | -37.1727 | 4.6079 | 2.6367 | 27.5745 | 1080 | |
| LnGI | 3.8802 | 3.9010 | 4.3146 | 3.1570 | 0.2075 | -0.5916 | 3.2749 | 1080 | |
| Low income group | LnCO2 | -2.2075 | -2.3806 | 0.1303 | -4.1158 | 0.8320 | 0.4815 | 3.2927 | 384 |
| LnEF | 0.1121 | 0.0575 | 0.9523 | -0.6762 | 0.3022 | 0.3645 | 2.5594 | 384 | |
| LnTRA | 3.6584 | 3.6516 | 4.5981 | 2.0549 | 0.3864 | -0.1449 | 3.1788 | 384 | |
| LnPGDP | 6.2988 | 6.2833 | 7.9093 | 5.3900 | 0.4838 | 1.2422 | 5.4287 | 384 | |
| LnIS | 2.9543 | 2.8688 | 3.9665 | 2.2235 | 0.3801 | 0.5897 | 2.8517 | 384 | |
| Fl | 3.1744 | 2.1037 | 46.2752 | -5.1118 | 5.3631 | 4.1330 | 25.6464 | 384 | |
| LnGI | 3.6960 | 3.7133 | 3.9889 | 3.1068 | 0.1903 | -0.6852 | 3.0904 | 384 | |
| Grouping | LnCO2 | LnEF | LnTRA | LnPGDP | LnIS | FI | LnGI | ||
| Global | LLC | Level | -1.5151* | -1.3727* | -5.2113*** | -2.0586** | -3.7848*** | -8.1952*** | -20.9845* |
|
|
-21.9756*** | -23.3730*** | -26.1267*** | -16.7324*** | -23.0929*** | -28.2324*** | -16.9986*** | ||
| IPS | Level | 4.2705 | -0.0850 | -3.2912*** | 7.7419 | -1.6851** | -12.1151*** | -8.8335*** | |
|
|
-25.1832*** | -30.5066*** | -28.7285*** | -18.5245*** | -25.5569*** | -35.0238*** | -21.9993*** | ||
| High income group | LLC | Level | 1.58975 | 0.3096 | -3.9189*** | -6.2679*** | -3.0327*** | -4.1623*** | -13.3297*** |
|
|
-10.8512*** | -13.7932*** | -17.3535*** | -12.2076*** | -14.4835*** | -14.8399*** | -13.8794*** | ||
| IPS | Level | 3.5837 | 1.3037 | -1.5992* | -0.3689 | -0.1752 | -7.0497*** | -6.6802*** | |
|
|
-14.0676*** | -17.1413*** | -15.8293*** | -10.7254*** | -15.1854*** | -18.6725*** | -14.2162*** | ||
| Upper middle income group | LLC | Level | -3.3229*** | -3.1226*** | -2.1038** | -1.9991** | -2.0498** | -5.6241*** | -13.1403*** |
|
|
-14.4875*** | -12.5038*** | -13.7813*** | -9.3888*** | -12.1044*** | -15.7143*** | -7.0174*** | ||
| IPS | Level | -0.3412 | -3.6305*** | -1.5797* | 4.8363 | -1.2069 | -7.1434*** | -6.2053*** | |
|
|
-14.4603*** | -16.1859*** | -15.6977*** | -10.7313*** | -11.8744*** | -19.0199*** | -10.1499*** | ||
| Lower middle income group | LLC | Level | -0.8635 | -0.0192 | -3.2901*** | 1.8218 | -0.6548 | -3.7609*** | -9.6961*** |
|
|
-10.0075*** | -9.7364*** | -13.7099*** | -5.8446*** | -11.0891*** | -15.4811*** | -5.8504*** | ||
| IPS | Level | 3.6113 | 1.9531 | -2.2660** | 8.1468 | -0.6334 | -5.5920*** | -2.9512*** | |
|
|
-12.8022*** | -15.7484*** | -16.1752*** | -8.3137*** | -13.7475*** | -19.5200*** | -10.3563*** | ||
| Low income group | LLC | Level | 0.3151 | 1.2570 | 0.0938 | -1.2919* | -1.6084* | -2.6184*** | -4.7603*** |
|
|
-8.1311*** | -11.0318*** | -5.1347*** | -5.4419*** | -7.7659*** | -9.5113*** | -7.1226*** | ||
| IPS | Level | 1.4979 | 0.1872 | -0.9643 | 2.5799 | -1.7995** | -4.0796*** | -0.6943 | |
|
|
-8.1057*** | -11.4075*** | -8.2687*** | -7.0341*** | -9.9892*** | -11.6435*** | -9.2941*** | ||
that using trade as a threshold variable divides the effect of economic growth on carbon emissions into three intervals. When LnTRA is less than 4.188, the impact coefficient of per capita GDP on carbon dioxide is 0.3845 . When LnTRA is between 4.188 and 5.019, the regression coefficient is 0.3766 . When LnTRA is greater than 5.019 , the coefficient is 0.3613 . The positive effect of
economic growth on carbon emissions gradually diminishes as trade crosses the two thresholds. Trade has a positive impact on improving global environmental quality. The nonlinear impact of trade on the GDP per capita-ecological footprint model has three stages as well. When trade is less than
| Series: LnCO2, LnTRA, LnPGDP, FI, LnGI, LnIS | ||||||
| Grouping | Statistic | P-value | Statistic | P-value | ||
| Global | Panel v-Statistic | -4.1635 | 1.0000 | Group rho-Statistic | 9.1996 | 1.0000 |
| Panel rho-Statistic | 4.5700 | 1.0000 | Group PP-Statistic | -7.9447*** | 0.0000 | |
| Panel PP-Statistic | -7.8948*** | 0.0000 | Group ADF-Statistic | -8.3655*** | 0.0000 | |
| Panel ADF-Statistic | -8.4703*** | 0.0000 | ||||
| High Income | Panel v-Statistic | -2.2600 | 0.9881 | Group rho-Statistic | 5.2669 | 1.0000 |
| Panel rho-Statistic | 1.7863 | 0.9630 | Group PP-Statistic | -3.6072*** | 0.0002 | |
| Panel PP-Statistic | -6.7003*** | 0.0000 | Group ADF-Statistic | -2.6794*** | 0.0037 | |
| Panel ADF-Statistic | -6.4451*** | 0.0000 | ||||
| Upper Middle Income | Panel v-Statistic | -3.2288 | 0.9994 | Group rho-Statistic | 4.2934 | 1.0000 |
| Panel rho-Statistic | 1.6090 | 0.9462 | Group PP-Statistic | -5.0498*** | 0.0000 | |
| Panel PP-Statistic | -5.8643*** | 0.0000 | Group ADF-Statistic | -5.2018*** | 0.0000 | |
| Panel ADF-Statistic | -7.3357*** | 0.0000 | ||||
| Lower Middle Income | Panel v-Statistic | -3.6238 | 0.9999 | Group rho-Statistic | 6.5462 | 1.0000 |
| Panel rho-Statistic | 4.8010 | 1.0000 | Group PP-Statistic | -7.2087*** | 0.0000 | |
| Panel PP-Statistic | -3.9794*** | 0.0000 | Group ADF-Statistic | -6.8838*** | 0.0000 | |
| Panel ADF-Statistic | -3.3952*** | 0.0003 | ||||
| Low Income | Panel v-Statistic | -4.0565 | 1.0000 | Group rho-Statistic | 6.1567 | 1.0000 |
| Panel rho-Statistic | 4.6556 | 1.0000 | Group PP-Statistic | -8.2960*** | 0.0000 | |
| Panel PP-Statistic | -1.9222** | 0.0273 | Group ADF-Statistic | -1.9399** | 0.0262 | |
| Panel ADF-Statistic | -2.8809*** | 0.0020 | ||||
| Table 5 Pedroni residual cointegration test results (EF). | ||||||
| Series: LnEF, LnTRA, LnPGDP, FI, LnGI, LnIS | ||||||
| Grouping | Statistic | P-value | Statistic | P-value | ||
| Global | Panel v-Statistic | -2.1190 | 0.9830 | Group rho-Statistic | 7.3062 | 1.0000 |
| Panel rho-Statistic | 4.7494 | 1.0000 | Group PP-Statistic | -18.3612*** | 0.0000 | |
| Panel PP-Statistic | -7.2941*** | 0.0000 | Group ADF-Statistic | -15.0766*** | 0.0000 | |
| Panel ADF-Statistic | -8.2713*** | 0.0000 | ||||
| High Income | Panel v-Statistic | -1.0009 | 0.8416 | Group rho-Statistic | 4.7009 | 1.0000 |
| Panel rho-Statistic | 1.9205 | 0.9726 | Group PP-Statistic | -11.3476*** | 0.0000 | |
| Panel PP-Statistic | -6.7122*** | 0.0000 | Group ADF-Statistic | -8.5196*** | 0.0000 | |
| Panel ADF-Statistic | -7.4156*** | 0.0000 | ||||
| Upper Middle Income | Panel v-Statistic | -1.0212 | 0.8464 | Group rho-Statistic | 3.2303 | 0.9994 |
| Panel rho-Statistic | 1.1110 | 0.8667 | Group PP-Statistic | -11.3459*** | 0.0000 | |
| Panel PP-Statistic | -6.6471*** | 0.0000 | Group ADF-Statistic | -10.2345*** | 0.0000 | |
| Panel ADF-Statistic | -7.6193*** | 0.0000 | ||||
| Lower Middle Income | Panel v-Statistic | -2.2089 | 0.9864 | Group rho-Statistic | 4.4106 | 1.0000 |
| Panel rho-Statistic | 4.1882 | 1.0000 | Group PP-Statistic | -9.3047*** | 0.0000 | |
| Panel PP-Statistic | -2.5286*** | 0.0057 | Group ADF-Statistic | -8.5867*** | 0.0000 | |
| Panel ADF-Statistic | -5.9406*** | 0.0000 | ||||
| Low Income | Panel v-Statistic | -0.5564 | 0.7110 | Group rho-Statistic | 3.1306 | 0.9991 |
| Panel rho-Statistic | 1.7173 | 0.9570 | Group PP-Statistic | -7.4826*** | 0.0000 | |
| Panel PP-Statistic | -4.8723*** | 0.0000 | Group ADF-Statistic | -5.7020*** | 0.0000 | |
| Panel ADF-Statistic | -5.0736*** | 0.0000 | ||||
| Explained variable | Threshold number | F-value | P-value | Critical value | ||
| 1% | 5% | 10% | ||||
| LnCO2 | Single | 27.950** | 0.024 | 35.494 | 22.367 | 16.305 |
| Double | 25.891* | 0.074 | 56.984 | 32.162 | 21.469 | |
| LnEF | Single | 16.506* | 0.086 | 32.685 | 20.723 | 15.265 |
| Double | 10.655* | 0.060 | 42.533 | 11.564 | 8.629 | |
footprint is 0.2818 . The coefficients are 0.2727 and 0.2915 when LnTRA crosses two thresholds (2.979 and 5.540). The coefficient change follows a U-shaped pattern. The estimated value of the second threshold, on the other hand, is greater, and the data on trade crossing the second threshold is less. As a result, trade reduces the positive impact of economic growth on the environment degradation. The trend of coefficient change caused by the threshold effect is depicted in Fig. 2. From the new perspective of trade as a threshold variable, we find that it is the obvious effect of trade on mitigating environmental pressure.
| Explained variable | Estimated threshold value | 95% confidence interval | |
| LnCO2 |
|
4.188 | [4.173, 4.230] |
|
|
5.019 | [4.864, 5.040] | |
| LnEF |
|
2.979 | [2.787, 3.062] |
|
|
5.540 | [2.787, 5.540] |
| Grouping | Explained variable | Threshold number |
|
P-value | Critical value | ||
| 1% | 5% | 10% | |||||
| High income | LnCO2 | Single | 82.643*** | 0.002 | 47.259 | 32.577 | 22.432 |
| Double | 21.324** | 0.032 | 29.317 | 19.484 | 13.388 | ||
| LnEF | Single | 29.627* | 0.058 | 48.847 | 31.238 | 22.677 | |
| Upper middle income | LnCO2 | Single | 32.382** | 0.018 | 45.014 | 22.083 | 16.643 |
| Double | 10.029* | 0.084 | 26.539 | 13.535 | 9.074 | ||
| LnEF | Single | 12.980*** | 0.078 | 29.153 | 15.584 | 11.028 | |
| Lower middle income | LnCO2 | Single | 24.649* | 0.052 | 42.945 | 24.757 | 17.284 |
| Double | 17.696** | 0.044 | 33.147 | 16.088 | 11.822 | ||
| LnEF | Single | 38.759*** | 0.000 | 23.428 | 14.125 | 9.757 | |
| Double | 22.013*** | 0.010 | 22.607 | 12.679 | 9.407 | ||
| Low income | LnCO2 | Single | 11.954** | 0.048 | 18.933 | 11.860 | 8.748 |
| Double | 9.827* | 0.090 | 21.744 | 13.648 | 9.162 | ||
| LnEF | Single | 12.469** | 0.034 | 21.609 | 11.350 | 8.684 | |
| Double | 6.990** | 0.024 | 9.613 | 5.637 | 4.082 | ||
| Grouping | Explained variable | Estimated threshold value | 95% confidence interval | |
| High income | LnCO2 |
|
4.075 | [4.050, 4.083] |
|
|
4.925 | [4.862, 4.931] | ||
| LnEF |
|
4.931 | [4.912, 5.025] | |
| Upper middle | LnCO2 |
|
3.675 | [3.652, 3.695] |
| income |
|
4.022 | [3.698, 4.295] | |
| LnEF |
|
3.706 | [2.880, 4.841] | |
| Lower middle | LnCO2 |
|
3.267 | [3.164, 4.417] |
| income |
|
4.714 | [4.653, 4.756] | |
| LnEF |
|
3.496 | [3.354, 3.594] | |
|
|
4.957 | [4.892, 4.974] | ||
| Low income | LnCO2 |
|
3.142 | [2.964, 3.269] |
|
|
3.811 | [2.964, 3.880] | ||
| LnEF |
|
3.562 | [3.541, 3.568] | |
|
|
3.595 | [2.964, 4.558] |
| Variable | Threshold model (LnCO2) | Threshold model (LnEF) |
| LnPGDP |
|
0.2818*** (
|
|
|
0.2727*** | |
|
|
|
|
| LnIS |
|
0.1133*** (6.38) |
| FI | 0.0004 (1.43) | -0.0001 (-0.51) |
| LnGI | 0.4987*** (10.76) | 0.0270 (0.86) |
| Constant | -5.6015*** (-36.23) | -1.8545*** (-17.64) |
| R2_w | 0.3438 | 0.2002 |
| F-test | 258.12 | 144.81 |
| NG | 147 | 147 |
| N | 3528 | 3528 |
Discussion
| Variable | High Income | Upper Middle Income | Lower Middle Income | Low Income | ||||
| (LnCO2) | (LnEF) | (LnCO2) | (LnEF) | (LnCO2) | (LnEF) | (LnCO2) | (LnEF) | |
| LnPGDP
|
0.0609** (1.98) | 0.2754*** (8.83) | 0.4941*** (13.47) | 0.3252*** (12.46) | 0.7340*** (15.37) | 0.2579*** (8.60) | 0.6716*** (8.73) | 0.1732*** (5.02) |
| LnPGDP | 0.0545* (1.78) | 0.5109*** (13.86) | 0.7502*** (15.65) | 0.2687*** (8.91) | 0.6459*** (8.41) | 0.1898*** (5.43) | ||
| (
|
||||||||
| LnPGDP(
|
0.0362 (1.17) | 0.2645*** (8.43) |
|
0.3315*** (12.63) | 0.7766*** (15.98) | 0.2979*** (9.77) | 0.6619*** (8.81) | 0.1794*** (5.24) |
| LnIS | 0.6717*** | 0.6682*** | -0.2754*** | -0.0012 | 0.2036*** (4.14) | -0.0314 (-1.01) | 0.1827*** (2.90) | -0.0596** (-2.01) |
| FI | 0.0003* (1.85) | -0.0001 (-0.79) | 0.0092*** (6.18) | 0.0068*** (6.44) | -0.0029* (-1.76) | -0.0010 (-1.00) | 0.0040* (1.69) | 0.0041*** (3.69) |
| LnGI | 0.4353*** (5.70) | 0.2398*** (3.13) | -0.1945** (-2.18) | -0.1388** (-2.20) | 0.3780*** (4.14) | 0.2230*** (3.90) | 0.3938*** (3.89) | -0.3101*** (-6.64) |
| Constant | -2.5618*** (-7.69) | -4.2931*** (-13.06) | -1.5864*** (-5.92) | -1.3449*** (-7.11) | -7.9765*** (-30.30) | (-13.99) | -8.3337*** (-22.24) |
|
| R2_w | 0.2902 | 0.2979 | 0.3844 | 0.3259 | 0.5391 | 0.3409 | 0.5173 | 0.1544 |
| F-test | 216.05 | 60.41 | 273.32 | 125.64 | 225.62 | 204.94 | 113.47 | 200.62 |
| N | 1056 | 1056 | 1008 | 1008 | 1080 | 1080 | 384 | 384 |
| NG | 16 | 16 | ||||||
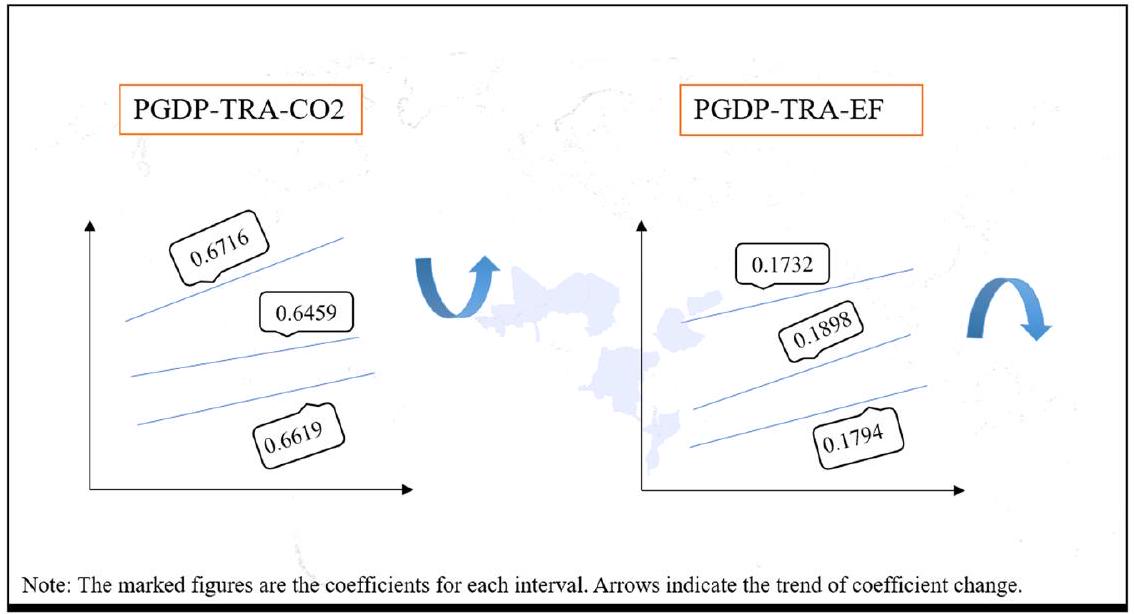
(i) The EKC assumption holds within the study’s scope. The 147 countries analyzed in this paper are categorized into four income groups based on World Bank criteria. Low-income countries typically denote those with relatively underdeveloped economies. In the regression results of the threshold model, the positive coefficient of economic growth for lowincome groups on carbon emissions falls between 0.6 and 0.7. As the income level increases, in lower-middle-income countries, the positive coefficient of economic growth on carbon emissions becomes more substantial, ranging from 0.7 to 0.8 . After the income level crosses the inflection point of the EKC, the coefficient diminishes. The regression coefficient of economic growth on carbon emissions in the upper-middle-income group is around 0.5 . High-income countries, characterized by a relatively developed economy, exhibit the smallest positive effect of the economy on environmental degradation, with a coefficient of less than 0.07 . Overall, the changes in the coefficients display a U-shaped curve pattern. In other words, as the level of economic development improves, environmental quality initially deteriorates and then gradually improves. This trend is also observed when the explained variable is the ecological footprint. The findings affirm the presence of the EKC, aligning with prior research findings (Farooq et al. 2022). Economic development in lowincome countries tends to rely more heavily on the exploitation of natural resources, including mining, deforestation, and agriculture. This economic structure contributes to the over-exploitation of resources and environmental damage. Additionally, these countries often lack robust environmental policies and regulatory systems (Iyamu et al. 2020). Middle-income countries may experience more pronounced environmental degradation compared to lowincome countries. Typically, these countries have achieved certain level of economic development, with accelerated industrialization and urbanization processes. Consequently, large-scale industrial activities, infrastructure construction, and urban sprawl in middle-income countries result in substantial consumption of natural resources and contribute significantly to environmental stress and pollution (MartínezZarzoso and Maruotti 2011). Despite achieving some economic development, middle-income countries may still fall behind in environmental technology and innovation. Additionally, there might be a time lag between the emergence of environmental problems and the realization of corresponding measures due to economic development issues. High-income countries generally exhibit higher environmental quality, primarily because they typically possess advanced technology and robust infrastructure. This enables them to implement effective environmental protection measures and pollution control (Hoareau et al. 2021). Furthermore, high-income countries typically boast a diversified economic structure, not solely dependent on natural resource extraction but also emphasizing the development of service industries, technological innovation, and the knowledge economy. This diversified economic structure contributes to a reduction in environmental pressure, resource consumption, and pollution emissions.
(ii) Trade protectionism exacerbates environmental degradation. The impact of trade protection exhibits non-linear effects in the economic growth-environmental degradation model (Ge et al. 2022). In essence, trade openness is beneficial for enhancing the quality of the global
advanced management practices, and innovative ideas from other countries, thereby promoting technological progress and economic development. Furthermore, trade openness has facilitated advancements in environmental technology and standards. In the realm of international trade, countries are compelled to adhere to requirements and standards for
(iii) For countries with diverse income levels, there exists heterogeneity in the non-linear impact of trade protection on the economy-environment relationship. As trade increases, the positive coefficient of economic growth in relation to carbon emissions and ecological footprint within the high-income group exhibits a declining trend. Trade has the potential to enhance environmental quality in highincome countries. However, it contributes to environmental degradation to varying extents in upper-middle-income, lower-middle-income, and low-income countries. These findings align with the pollution haven hypothesis (Gyamfi et al. 2021). When a country or region enforces more stringent environmental protection laws and regulations, high-pollution industries may relocate to countries or regions with less stringent environmental laws and regulations, giving rise to what is commonly known as a “pollution haven.” Enterprises in pollution-intensive industries tend to establish themselves in countries or regions with comparatively lower environmental standards (Banerjee and Murshed 2020). Free trade facilitates the transfer of high-carbon industries across borders, with developed countries benefiting and experiencing an improvement in environmental quality. Conversely, developing countries, acting as host nations for foreign investment, often face environmental degradation as a consequence (Essandoh et al. 2020).
Conclusions, implications, and limitation
protectionism, and environmental indicators across 147 countries, segmented into four income groups. The utilization of the Pedroni cointegration test further validated the existence of stable long-term correlations between carbon emissions, ecological footprint, and other variables, establishing the groundwork for nuanced regression analyses. Notably, the study pioneered the exploration of threshold effects, unveiling non-linear relationships between trade, economic growth, and environmental outcomes across income groups. The elucidation of threshold models revealed intriguing insights, showcasing varying impacts of trade on economic growth, carbon emissions, and ecological footprints. Particularly noteworthy were the distinct thresholds identified across income groups, delineating changes in the relationships between trade, economic growth, and environmental impacts. These findings underscored the nuanced nature of economic development’s impact on environmental degradation, supporting theories such as the EKC within specific income brackets while uncovering divergences in others.
(i) The study supported the EKC, revealing an inverted U-shaped relationship between economic growth and environmental degradation. The degree of environmental pollution in low-income countries is relatively low, and the regression coefficient of economic growth on environmental degradation is relatively small. The coefficient values become larger for lower-middle-income and upper-middleincome countries. High-income countries have the smallest coefficients. This corresponds to the EKC assumption. With the increase of income level, the pressure of economic growth on the environment first increases and then decreases.
(ii) The study revealed the nuanced impact of trade protectionism on environmental degradation. While trade openness globally enhanced environmental quality, nonlinear effects were evident in models examining the relationship between economic growth and environmental degradation. Trade played a pivotal role in promoting technological innovation, fostering economic development, and elevating environmental standards. However, maintaining an optimal balance is imperative to avoid the over-exploitation of resources.
(iii) Heterogeneity in the non-linear effects of trade protectionism was apparent across income groups. For different income groups, trade openness reduces environmental degradation in the high-income group but has the opposite effect in the upper-middle and lower middle-income
groups, supporting the pollution haven hypothesis. This underscores the importance of implementing stringent environmental regulations and adopting sustainable development strategies to counterbalance trade-induced environmental impacts in developing economies.
intricately integrates trade, economy, and the environment, making a significant contribution to existing scholarly literature. By delving into deeper layers of nonlinear relationships, it significantly enhances our understanding of the complex interplay between environmental factors and economic growth. Specifically designed for scrutinizing the impact of trade on the economyenvironment relationship through panel data analysis, this model provides theoretical insights relevant to exploring threshold effects across diverse economies. Future investigations may extend variable transformations to uncover additional nonlinear relationships among a myriad of variables.
Data availability
Published online: 24 January 2024
References
Adebayo TS, Kirikkaleli D (2021) Impact of renewable energy consumption, globalization, and technological innovation on environmental degradation in Japan: application of wavelet tools. Environ Dev Sustain 23(11):16057-16082
Ahmad M, Jiang P, Majeed A, Umar M, Khan Z, Muhammad S (2020) The dynamic impact of natural resources, technological innovations and economic growth on ecological footprint: an advanced panel data estimation. Resour Policy 69:101817
Akadırı SS, Alola AA, Usman O (2021) Energy mix outlook and the EKC hypothesis in BRICS countries: a perspective of economic freedom vs. economic growth. Environ Sci Pollut Res 28(7):8922-8926
Alola AA, Donve UT (2021) Environmental implication of coal and oil energy utilization in Turkey: is the EKC hypothesis related to energy? Manag Environ Qual 32:543-559
Balsalobre-Lorente D, Driha OM, Leitão NC, Murshed M (2021) The carbon dioxide neutralizing effect of energy innovation on international tourism in EU-5 countries under the prism of the EKC hypothesis. J Environ Manag 298:113513
Balsalobre-Lorente D, Ibáez-Luzón L, Usman M, Shahbaz M (2022) The environmental kuznets curve, based on the economic complexity, and the pollution haven hypothesis in PIIGS countries. Renew Energy 185:1441-1455
Barlow P, van Schalkwyk MC, McKee M, Labonté R, Stuckler D (2021) COVID-19 and the collapse of global trade: building an effective public health response. Lancet Planet Health 5(2):e102-e107
Bechtel MM, Bernauer T, Meyer R (2012) The green side of protectionism: environmental concerns and three facets of trade policy preferences. Rev Int Political Econ 19(5):837-866
Chen Z, Hao X, Zhou M (2022) Does institutional quality affect air pollution? Environ Sci Pollut Res 29(19):28317-28338
Copeland BR (2000) Trade and environment: policy linkages. Environ Dev Econ 5(4):405-432
Del Lo G, Marcelin I, Bassène T, Sène B (2022) The Russo-Ukrainian war and financial markets: the role of dependence on Russian commodities. Financ Res Lett 50:103194
Destek MA, Sarkodie SA (2019) Investigation of environmental kuznets curve for ecological footprint: the role of energy and financial development. Sci Total Environ 650:2483-2489
Dogan E, Inglesi-Lotz R (2020) The impact of economic structure to the environmental kuznets curve (EKC) hypothesis: evidence from European countries. Environ Sci Pollut Res 27(11):12717-12724
Essandoh OK, Islam M, Kakinaka M (2020) Linking international trade and foreign direct investment to CO2 emissions: any differences between developed and developing countries? Sci Total Environ 712:136437
Farooq S, Ozturk I, Majeed MT, Akram R (2022) Globalization and CO2 emissions in the presence of EKC: a global panel data analysis. Gondwana Res 106:367-378
Ge M, Kannaiah D, Li J, Khan N, Shabbir MS, Bilal K, Tabash MI (2022) Does foreign private investment affect the clean industrial environment? Nexus among foreign private investment, CO2 emissions, energy consumption, trade openness, and sustainable economic growth. Environ Sci Pollut Res 29:26182-26189
Global Foofprint Network (2022) Ecological footprint open data. https://data. footprintnetwork.org/
Grossman GM, Krueger AB (1991) Environmental impacts of a North American free trade agreement. National Bureau of economic research, Cambridge, Mass., USA
Grossman GM, Krueger AB (1995) Economic growth and the environment. Q J Econ 110(2):353-377
Guzel AE, Okumus İ (2020) Revisiting the pollution haven hypothesis in ASEAN-5 countries: new insights from panel data analysis. Environ Sci Pollut Res 27(15):18157-18167
Gyamfi BA, Bein MA, Udemba EN, Bekun FV (2021) Investigating the pollution haven hypothesis in oil and non-oil sub-Saharan Africa countries: evidence from quantile regression technique. Resour Policy 73:102119
Hansen BE (1999) Threshold effects in non-dynamic panels: estimation, testing, and inference. J Econ 93(2):345-368
Hao Y, Ba N, Ren S, Wu H (2021) How does international technology spillover affect China’s carbon emissions? A new perspective through intellectual property protection. Sustain Prod Consum 25:577-590
Hao Y, Guo Y, Guo Y, Wu H, Ren S (2020) Does outward foreign direct investment (OFDI) affect the home country’s environmental quality? The case of China. Struct Change Econ Dyn 52:109-119
Hoareau CE, Ahmad N, Nuid M, Khoi DN, Kristanti RA (2021) Sustainable technology in developed countries: waste municipal management. Industrial and Domestic. Waste Manag 1(1):48-55
Hu Y, Ren S, Wang Y, Chen X (2020) Can carbon emission trading scheme achieve energy conservation and emission reduction? Evidence from the industrial sector in China. Energy Econ 85:104590
Im KS, Pesaran MH, Shin Y (2003) Testing for unit roots in heterogeneous panels. J Econ 115(1):53-74
Isik C, Ongan S, Ozdemir D, Ahmad M, Irfan M, Alvarado R, Ongan A (2021) The increases and decreases of the environment kuznets curve (EKC) for 8 OECD countries. Environ Sci Pollut Res 28(22):28535-28543
Iyamu H, Anda M, Ho G (2020) A review of municipal solid waste management in the BRIC and high-income countries: a thematic framework for low-income countries. Habitat Int 95:102097
Jiang S, Mentel G, Shahzadi I, Jebli MB, Iqbal N (2022) Renewable energy, trade diversification and environmental footprints: evidence for Asia-Pacific Economic Cooperation (APEC). Renew Energy 187:874-886
Khan Z, Ali S, Umar M, Kirikkaleli D, Jiao Z (2020) Consumption-based carbon emissions and international trade in G7 countries: the role of environmental innovation and renewable energy. Sci Total Environ 730:138945
Koc S, Bulus GC (2020) Testing validity of the EKC hypothesis in South Korea: role of renewable energy and trade openness. Environ Sci Pollut Res 27(23):29043-29054
KOF Swiss Economic Institute (2022) KOF Globalisation Index Open Data. https:// mtec.ethz.ch/
Le HP, Ozturk I (2020) The impacts of globalization, financial development, government expenditures, and institutional quality on CO2 emissions in the presence of environmental kuznets curve. Environ Sci Pollut Res 27(18):22680-22697
Levin A, Lin C-F, Chu C-SJ (2002) Unit root tests in panel data: asymptotic and finite-sample properties. J Econ 108(1):1-24
Li R, Li L, Wang Q (2022) The impact of energy efficiency on carbon emissions: evidence from the transportation sector in Chinese 30 provinces. Sustain Cities Soc 82:103880
Li R, Wang Q, Guo J (2024) Revisiting the Environmental Kuznets Curve (EKC) Hypothesis of Carbon Emissions: Exploring the Impact of Geopolitical Risks, Natural Resource Rents, Corrupt Governance, and Energy Intensity. J Environ Manage 351:119663
Li R, Wang Q, Li L, Hu S (2023) Do natural resource rent and corruption governance reshape the environmental Kuznets curve for ecological footprint? Evidence from 158 countries. Resour Policy 85:103890
Li R, Wang Q, Liu Y, Jiang R (2021) Per-capita carbon emissions in 147 countries: the effect of economic, energy, social, and trade structural changes. Sustain Prod Consum 27:1149-1164
Liu X, Wahab S, Hussain M, Sun Y, Kirikkaleli D (2021) China carbon neutrality target: revisiting FDI-trade-innovation nexus with carbon emissions. J Environ Manag 294:113043
Liu Y, Mabee W, Zhang H (2021) Conserving fertilizer in China’s rural-agricultural development: the reversal shifts and the county-specific EKC evidence from Hubei. Clean Environ Syst 3:100050
Liu Y, Sadiq F, Ali W, Kumail T (2022) Does tourism development, energy consumption, trade openness and economic growth matters for ecological footprint: testing the environmental kuznets curve and pollution haven hypothesis for Pakistan. Energy 245:123208
Martínez-Zarzoso I, Maruotti A (2011) The impact of urbanization on CO2 emissions: evidence from developing countries. Ecol Econ 70(7):1344-1353
Muhammad S, Long X, Salman M, Dauda L (2020) Effect of urbanization and international trade on CO2 emissions across 65 belt and road initiative countries. Energy 196:117102
Murshed M, Nurmakhanova M, Elheddad M, Ahmed R (2020) Value addition in the services sector and its heterogeneous impacts on CO2 emissions: revisiting the EKC hypothesis for the OPEC using panel spatial estimation techniques. Environ Sci Pollut Res 27(31):38951-38973
Nathaniel S, Khan SAR (2020) The nexus between urbanization, renewable energy, trade, and ecological footprint in ASEAN countries. J Clean Prod 272:122709
Neves SA, Marques AC, Patrício M (2020) Determinants of CO2 emissions in European Union countries: does environmental regulation reduce environmental pollution? Econ Anal Policy 68:114-125
Ozcan B, Ulucak R (2021) An empirical investigation of nuclear energy consumption and carbon dioxide (CO2) emission in India: Bridging IPAT and EKC hypotheses. Nucl Eng Technol 53(6):2056-2065
Ozgur O, Yilanci V, Kongkuah M (2022) Nuclear energy consumption and CO2 emissions in India: Evidence from Fourier ARDL bounds test approach. Nucl Eng Technol 54(5):1657-1663
Panayotou T (1993) Empirical tests and policy analysis of environmental degradation at different stages of economic development. Pacific and Asian Journal of Energy 4(1)
Park Y, Meng F, Baloch MA (2018) The effect of ICT, financial development, growth, and trade openness on CO2 emissions: an empirical analysis. Environ Sci Pollut Res 25(30):30708-30719
Pata UK (2018) Renewable energy consumption, urbanization, financial development, income and CO2 emissions in Turkey: testing EKC hypothesis with structural breaks. J Clean Prod 187:770-779
Pata UK, Aydin M (2020) Testing the EKC hypothesis for the top six hydropower energy-consuming countries: evidence from Fourier Bootstrap ARDL procedure. J Clean Prod 264:121699
Pata UK, Caglar AE (2021) Investigating the EKC hypothesis with renewable energy consumption, human capital, globalization and trade openness for China: evidence from augmented ARDL approach with a structural break. Energy 216:119220
Pata UK, Samour A (2022) Do renewable and nuclear energy enhance environmental quality in France? A new EKC approach with the load capacity factor. Prog Nucl Energy 149:104249
Sarkis J (2019) Sustainable transitions: technology, resources, and society. One Earth 1(1):48-50
Scott D, Gössling S (2021) From Djerba to Glasgow: have declarations on tourism and climate change brought us any closer to meaningful climate action? J Sustain Tour 30(1):199-222
Shahbaz M, Gozgor G, Adom PK, Hammoudeh S (2019) The technical decomposition of carbon emissions and the concerns about FDI and trade openness effects in the United States. Int Econ 159:56-73
Sinha A, Sengupta T, Alvarado R (2020) Interplay between technological innovation and environmental quality: formulating the SDG policies for next 11 economies. J Clean Prod 242:118549
Tenaw D, Beyene AD (2021) Environmental sustainability and economic development in sub-Saharan Africa: a modified EKC hypothesis. Renew Sustain Energy Rev 143:110897
Tong Y, Zhou H, Jiang L (2021) Exploring the transition effects of foreign direct investment on the eco-efficiency of Chinese cities: based on multi-source data and panel smooth transition regression models. Ecol Indic 121:107073
Usman M, Makhdum MSA, Kousar R (2021) Does financial inclusion, renewable and non-renewable energy utilization accelerate ecological footprints and economic growth? Fresh evidence from 15 highest emitting countries. Sustain Cities Soc 65:102590
Vural G (2020) How do output, trade, renewable energy and non-renewable energy impact carbon emissions in selected Sub-Saharan African Countries? Resour Policy 69:101840
Wahab S, Zhang X, Safi A, Wahab Z, Amin M (2021) Does energy productivity and technological innovation limit trade-adjusted carbon emissions? Economic Res Ekonomska Istraživanja 34(1):1896-1912
Wang K, Zhu Y, Zhang J (2021) Decoupling economic development from municipal solid waste generation in China’s cities: Assessment and prediction based on Tapio method and EKC models. Waste Manag 133:37-48
Wang Q, Hu S, Li R (2023a) Could information and communication technology (ICT) reduce carbon emissions? The role of trade openness and financial development. Telecommun Policy: 102699. https://doi.org/10.1016/j.telpol. 2023.102699
Wang Q, Wang L, Li R (2023c) Trade openness helps move towards carbon neutrality-insight from 114 countries. Sustain Dev. https://doi.org/10.1002/ sd. 2720
Wang X, Shao Q (2019) Non-linear effects of heterogeneous environmental regulations on green growth in G20 countries: Evidence from panel threshold regression. Sci Total Environ 660:1346-1354
Wang Y, Liao M, Xu L, Malik A (2021) The impact of foreign direct investment on China’s carbon emissions through energy intensity and emissions trading system. Energy Econ 97:105212
Winning M, Price J, Ekins P, Pye S, Glynn J, Watson J, McGlade C (2019) Nationally determined contributions under the Paris Agreement and the costs of delayed action. Clim Policy 19(8):947-958
World Bank (2022) World Bank Open Data. https://data.worldbank.org/
Yasmeen R, Zhaohui C, Shah WUH, Kamal MA, Khan A (2022) Exploring the role of biomass energy consumption, ecological footprint through FDI and technological innovation in B&R economies: a simultaneous equation approach. Energy 244:122703
Yilanci V, Pata UK (2020) Investigating the EKC hypothesis for China: the role of economic complexity on ecological footprint. Environ Sci Pollut Res 27(26):32683-32694
Yin Y, Xiong X, Hussain J (2021) The role of physical and human capital in FDI-pollution-growth nexus in countries with different income groups: a simultaneity modeling analysis. Environ Impact Assess Rev 91:106664
Zafar MW, Zaidi SAH, Khan NR, Mirza FM, Hou F, Kirmani SAA (2019) The impact of natural resources, human capital, and foreign direct investment on the ecological footprint: the case of the United States. Resour Policy 63:101428
Zeitun R, Goaied M (2021) The nonlinear effect of foreign ownership on capital structure in Japan: A panel threshold analysis. Pac Basin Financ J 68:101594
Zhou A, Li J (2020) The nonlinear impact of industrial restructuring on economic growth and carbon dioxide emissions: a panel threshold regression approach. Environ Sci Pollut Res 27(12):14108-14123
Acknowledgements
Author contributions
Competing interests
Ethical approval
Informed consent
Additional information
Publisher’s note Springer Nature remains neutral with regard to jurisdictional claims in published maps and institutional affiliations.
© The Author(s) 2024
School of Economics and Management, Xinjiang University, Wulumuqi 830046, PR China. School of Economics and Management, China University of Petroleum (East China), Qingdao 266580, PR China. China Institute of Boundary and Ocean Studies, Wuhan University, Wuhan 430072, PR China. Arndt-Corden Department of Economics, Crawford School of Public Policy, The Australian National University, Canberra, ACT 2601, Australia.
email: wangqiang7@upc.edu.cn; lirr@upc.edu.cn - Note: ***, **, * represent significance at the significance level of 1%, 5%, and 10% respectively.