DOI: https://doi.org/10.1016/j.rser.2024.114517
تاريخ النشر: 2024-05-10
إنتاج الأمونيا الخضراء باستخدام تقنيات التحليل الكهربائي الحالية والناشئة
مراجعات الطاقة المتجددة والمستدامة
10.1016/j.rser.2024.114517
2024
نسخة الناشر بصيغة PDF، والمعروفة أيضًا باسم النسخة المسجلة
اقتباس (APA):
إنتاج الأمونيا الخضراء باستخدام تقنيات التحليل الكهربائي الحالية والناشئة
معلومات المقال
الكلمات المفتاحية:
الأمونيا الزرقاء
الهيدروجين الأخضر
الطاقة إلى الأمونيا
SOEC مضغوط
الالكتروليزر القلوي عالي الحرارة
الملخص
تدرس هذه الدراسة استخدام الهيدروجين المنتج من خلال التحليل الكهربائي للماء لإنتاج الأمونيا الخضراء. يتم تقييم الطرق بناءً على استخدام إما التحليل الكهربائي القلوي (AEC) أو التحليل الكهربائي للأكسيد الصلب (SOEC). يتم نمذجة كل من التقنيات الحالية والتحسينات المحتملة لتقنيات AEC وSOEC المرتبطة بعملية هابر-بوش لتخليق الأمونيا. يتم تقدير تكلفة الأمونيا الخضراء مع الأخذ في الاعتبار تكلفة المحللات الكهربائية لكل من التقديرات الحالية والمستقبلية، ويتم مقارنتها بتكلفة الأمونيا “التي تعتمد على الوقود الأحفوري” التي يتم تخليقها من الغاز الطبيعي. العتبة
1. المقدمة
الاهتمام بإنتاج الأمونيا الخضراء. مقارنة بالهيدروجين، تمتلك الأمونيا بعض المزايا. من الأسهل بكثير تسييلها وتخزينها عند درجات حرارة أعلى (-33 مقابل.
| تسمية | M | الكتلة المولية (كغ/كمول) | |
|
|
معدل تدفق الكتلة (كغ/ث) | ||
| اختصارات | ن | عدد الإلكترونات | |
| مجموعة دول الآسيان | التحليل الكهربائي القلوي |
|
معدل تدفق المولات (كمول/ثانية) |
| جامعة ولاية أريزونا | وحدة فصل الهواء | ن | رقم |
| تعويض | ضاغط | P | الضغط (بار) |
| كوند | مكثف |
|
نسبة ضغط الضاغط |
| مسافة | عمود التقطير |
|
معدل نقل الحرارة (كيلووات) |
| ELH | سخان كهربائي |
|
ثابت الغاز (
|
| HBL | حلقة هابر-بوش | س | الإنتروبيا (كجول/كمول ك) |
| HEX | مبادل حراري | سوف | عامل استخدام البخار |
| HT-SOEC SOEC عالي الحرارة في الغلاف الجوي | ت | درجة الحرارة (ك) | |
| HTP-AEC | ضغط AEC عالي الحرارة |
|
الطاقة (كيلووات) |
| SOEC منخفض الحرارة في الأجواء LT | |||
| ضغط AEC منخفض الحرارة LTP-AEC | الحروف اليونانية | ||
| مزيج | خلاط |
|
فائض الجهد (فولت) |
| SOEC | التحليل الكهربائي للأكسيد الصلب |
|
السماكة (م) |
| SPL | مقسم |
|
عامل ما قبل الأسية (1/ثانية) |
|
|
المقاومية
|
||
| الحروف اللاتينية | |||
| أ | مساحة نقل الحرارة | الأسفل | |
| إل | الحياة الاقتصادية | أ | أنود |
| النفقات الرأسمالية | تكلفة الاستثمار الرأسمالي ($) | فعل | تفعيل |
| CF | عامل السعة | ج | الكاثود |
| CRF | عامل استرداد رأس المال | مؤتمر | تركيز |
|
|
معامل الانتشار الفعال (
|
السيرة الذاتية | حجم التحكم |
| e | الإكسيجي الفيزيائي المحدد (كج/كمول) | D | تدمير |
| E | الجهد (فولت) | e | إلكتروليت |
|
|
معدل الإكسيرجي (كيلووات) |
|
تدفق ساخن |
| ف | ثابت فاراداي
|
أنا | مدخل |
| ج | طاقة غيبس الحرة (
|
0 | مخرج |
| ح | enthalpy النوعية (كجم/كمول) | أوم | أوميك |
| H | enthalpy (kJ)” – “enthalpy (كيلوجول) | ف | جسدي |
| أنا | معدل الفائدة (%) | ر | قابل للعكس |
| ج | كثافة التيار (
|
مرجع | مرجع |
|
|
كثافة التيار المتبادل (
|
tn | محايد حرارياً |
| تكلفة الطاقة المتكاملة | تكلفة الكهرباء الموحدة | 0 | الظروف المحيطة |
تحتاج إلى الهيدروجين أو توصيل الهيدروجين المنتج مباشرة من تحلل الأمونيا. أظهر النظام المقترح كفاءات طاقة وكفاءة إكسرجي تبلغ
أن إضافة سعة تيارات المد والجزر إلى سعة الرياح تقلل من متطلبات تخزين الهيدروجين بـ
مراجعة الأدبيات حول إنتاج الأمونيا الخضراء.
| مرجع | مصدر الطاقة |
|
تكلفة الطاقة المتكاملة | تكلفة الأمونيا (الحد الأدنى) | كفاءة النظام (%) | ملاحظات حول النتائج الرئيسية والافتراضات الأساسية | ||||||||
| [22] | الطاقة الشمسية + الرياح | مجموعة دول الآسيان |
|
500 دولار/طن | لا | تغير الطاقة الخضراء هو المحرك الرئيسي للتكاليف للطاقة الخضراء
|
||||||||
| شمسي | PEMEC
|
لا | لا |
|
||||||||||
| [23] | الطاقة الشمسية + الرياح + السدود الهيدروليكية | PEMEC | 18 يورو/ميغاوات ساعة | – | لا |
|
||||||||
| [24] | شمسي | مجلس التعاون الاقتصادي وPEMEC | لا | 718 دولار/طن | ٣٧.٤ |
|
||||||||
| [25] | شمسي | PEMEC | لا | لا |
|
خلال فترة الطلب المنخفض، يتم استخدام الطاقة الزائدة التي تنتجها الألواح الكهروضوئية لتخليق الأمونيا، وخلال فترة الذروة في الطلب، يتم تغذية الأمونيا إلى خلية الوقود لتوليد الطاقة. | ||||||||
| [14] | لا | SOEC | 73 دولار/ميغاوات ساعة | >550 دولار/طن | 74 % | يستنتج أن تحويل الطاقة إلى الأمونيا ليس تنافسيًا حاليًا مع طرق تحويل الكتلة الحيوية إلى الأمونيا. | ||||||||
| [26] | الطاقة الشمسية + الرياح + الطاقة المائية | PEMEC | لا | 431-528 يورو/طن | لا | يمكن أن تكون تقنية تحويل الطاقة إلى الأمونيا تنافسية من حيث التكلفة إذا كان سعر الغاز الطبيعي أو
|
||||||||
| [27] | شمسي | PEC
|
لا | 840 دولار/طن | 5-9.6
|
|
||||||||
| [28] | لا |
|
|
|
لا | قيم ثابتة من
|
||||||||
| [29] | الطاقة الشمسية + الرياح البرية | PEMEC |
|
|
لا | يمكن أن يوفر إمكانات الأمونيا الخضراء في الهند الطلب العالمي على الأمونيا حاليًا،
|
2. التحليل النظري ووصف النموذج
2.1. تطوير النظام والنمذجة الرياضية
2.1.1. تقنيات التحليل الكهربائي
2.1.1.1. التحليل الكهربائي للأكسيد الصلب (SOEC). يعمل SOEC بكفاءة مقارنةً بالمحللات الكهربائية الأخرى المتاحة ، خاصةً عندما يكون هناك تكامل حراري بين المحلل الكهربائي و HBL. يمكن توفير جزء من الحرارة الخارجية المطلوبة لتفكيك الماء من مصادر الحرارة المهدرة المتاحة في HBL لزيادة كفاءة النظام الكلية.
أنظمة التحليل الكهربائي المختلفة التي تم نمذجتها في هذه الدراسة.
| التكنولوجيا | الاسم | ظروف التشغيل |
| AEC | LTP-AEC | تعمل الكومة عند
|
| يتم إنتاج الهيدروجين عند ضغط 30 بار | ||
| HTP-AEC | تعمل الكومة عند
|
|
| يتم إنتاج الهيدروجين عند ضغط 30 بار | ||
| SOEC | LP-SOEC | يتم إنتاج الهيدروجين عند ضغط 1 بار |
| HP-SOEC | يتم إنتاج الهيدروجين عند ضغط 30 بار | |
| تعمل الكومة عند
|
2.1.1.2. التحليل الكهربائي القلوي (AEC). حاليًا ، AEC هي التكنولوجيا المستخدمة بشكل أساسي لإنتاج الهيدروجين الأخضر على نطاق واسع ، حيث إنها أكثر تقنيات التحليل الكهربائي تطورًا ونضجًا [41]. ومع ذلك ، فإن المقاومة الداخلية العالية نسبيًا للخلية تقلل من الكفاءة العامة للنظام. بالنسبة لـ AEC ، يمكن تحديد نقطة التشغيل المثلى من خلال توازن بين CAPEX و OPEX ، كما هو موضح في المرجع [31].
معادلات نمذجة SOEC.
| الوصف | المعادلة الحاكمة |
| جهد الدائرة المفتوحة (OCV) [35] |
|
| طاقة غيبس الحرة [36] |
|
| معادلة باتلر-فولمر (BV) [37] |
|
| كثافة تيار تبادل الأنود [37] |
|
| كثافة تيار تبادل الكاثود [37] |
|
| فائض تركيز الأنود [38] |
|
| فائض تركيز الكاثود [38] |
|
| فائض مقاوم [37] |
|
| نموذج الغاز الغباري (DGM) التدفقات [39] |
|
|
|
|
| معامل الانتشار الثنائي [40] |
|
| معامل انتشار كوندن [36] |
|
| معامل الانتشار الفعال |
|
2.1.2. حلقة هابر-بوش (HBL)
البيانات المدخلة والافتراضات التي تم أخذها بعين الاعتبار لنمذجة HBL [47].
| معامل | قيمة | معامل | قيمة |
| درجة حرارة مدخل السرير الأول (
|
٣١٠ | درجة حرارة مدخل السرير الأول (
|
٣٨٠ |
| ضغط تشغيل المفاعل (بار) | ٢٠٠ | كفاءة الضاغط الإيزنتروبيكية (%) | ٨٠ |
| نسبة تحويل السرير الأول (%) | ٢٠.٧ | انخفاض ضغط المفاعل (بار) | 1.5 |
| نسبة تحويل السرير الثاني (%) | 6.5 | نهج الحد الأدنى من درجات الحرارة
|
10 |
| نسبة تحويل السرير الثالث (%) | 7.2 | درجة حرارة تشغيل الفاصل (
|
40 |
| تيار التغذية
|
3:1 | فعالية مبادل الحرارة (%) |
|
2.2. كفاءة النظام
3. التحليل التكنولوجي الاقتصادي
يمكن العثور على نفقات مختلفة في الأدبيات المتعلقة بالمحللات الكهربائية. ومع ذلك، من الشائع أن تكلفة مجموعة التحليل الكهربائي من المتوقع أن تنخفض بشكل كبير على مر السنين. ويرجع ذلك إلى التطور المتوقع لتقنيات التحليل الكهربائي، وبشكل خاص، الانخفاضات المتوقعة في التكاليف نتيجة التصنيع الضخم. من المتوقع أن تشهد تقنية SOEC الأقل نضجًا أكبر انخفاض نسبي في التكاليف. يُفترض عمومًا أن مصنع HBL ووحدة فصل الهواء (ASU) هما تقنيتان ناضجتان ولا يُتوقع أن تخضعا لتغييرات كبيرة من حيث النفقات الرأسمالية (CAPEX) في المستقبل القريب.
أين
وظائف التكلفة للمكونات الرئيسية. تكاليف وحدات التحليل الكهربائي هي تقديرات “جاهزة” على مستوى المصنع وتشمل بذلك مكونات توازن المصنع والتكاليف الإضافية كما هو موضح في المرجع [31].
| مكون | النفقات الرأسمالية [وحدة] | شرط | مرجع |
| LP-SOEC | 2020:
|
لتيار الحمل المرجعي | [31] |
| ٢٠٣٠
|
كثافة
|
||
| 2050:
|
LP-SOEC و 1.25 A/
|
||
| إل تي بي – إيه إي سي | 2020:
|
للكثافة الحالية المرجعية
|
[31] |
| ٢٠٣٠
|
|||
| [م€/ميغاوات] | |||
| 2050:
|
|||
| HEX |
|
– | [50] |
| HBL | النفقات الرأسمالية
|
– | [26] |
| جامعة ولاية أريزونا | النفقات الرأسمالية
|
– | [26] |
| كوند | النفقات الرأسمالية
|
– | [51] |
|
|
|||
| تعويض |
|
|
[52] |
حيث،
بالإضافة إلى تقدير النفقات الرأسمالية الموزعة، من الضروري تقدير النفقات التشغيلية للنظام من حيث €/سنة. يجب أن تشمل هذه التكاليف المتعلقة باستهلاك الكهرباء، وصيانة النظام بالكامل، وتكاليف التصنيع. يُفترض أن تكون تكلفة الصيانة السنوية هي
نفقات رأس المال المستهلكة + نفقات التشغيل
بيانات الإدخال للتحليل الاقتصادي.
| معامل | قيمة | ||
| تكلفة استبدال مجموعة SOEC (% من النفقات الرأسمالية) [31] | 2020: 23.5 | ||
| ٢٠٣٠: ١٣.٥ | |||
| 2050: 9.5 | |||
| تكلفة استبدال مجموعة AEC (% من النفقات الرأسمالية) [31] | 2020: 50 | ||
| ٢٠٣٠: ٤٨ | |||
| 2050: 44 | |||
| عمر مجموعة SOEC (سنة) [31] | ٥ | ||
| عمر مجموعة AEC (سنة) [31] | 10 | ||
| تكلفة الطاقة المستوى (€/MWh) | 10-60 | ||
| إل (سنة) | ٢٥ | ||
| عامل سعة المحطة (ساعات تشغيل المحطة في 8760 ساعة) (%) | 50 | ||
| متوسط سعر صرف اليورو مقابل الدولار | 1.12 | ||
|
|
٨ | ||
| تكلفة التصنيع [53]: | |||
| تكلفة التصنيع المباشرة
|
|||
| – تكلفة العمالة (
|
|
||
| – العمل الإشرافي المباشر والعملي الكتابي |
|
||
| – رسوم المختبر |
|
||
| تكلفة التصنيع الثابتة
|
|||
| – الضرائب المحلية |
|
||
| – تكاليف المصنع |
|
||
|
|
|||
| تكلفة التصنيع العامة (€/سنة): | |||
| – التوزيع |
|
||
| – البحث والتطوير |
|
||
| – الإدارة |
|
||
4. النتائج والمناقشة
4.1. تخطيطات النظام
- يتم استخدام الحرارة المهدرة من مبردات الضاغط متعدد المراحل (COMP1) لتوليد البخار لنظام LP-SOEC في المسخن (PH). ومع ذلك، فإن الحرارة من المبردات ستكون قادرة فقط على تسخين مياه التغذية (دون تبخيرها) لنظام HP-SOEC، حيث يحدث التبخر عند
(بخار مشبع عند 30 بار). - يتم أيضًا استخدام محتوى الحرارة في غاز المفاعل (REAC2 و REAC3) لتبخير جزء من مياه التغذية باستخدام مولد بخار استرداد الحرارة 1 و 2 (HRSG1 و HRSG2).
- علاوة على ذلك، يتم استخدام محتوى الحرارة في غاز المصنع SOEC لتبخير أي مياه متبقية في التغذية ولتسخين البخار الناتج إذا أمكن.
الفرق. يمكن للمرء أيضًا أن يعمل مع الأكسجين عند نفس الضغط مثل
4.2. النتائج الديناميكية الحرارية
4.3. نتائج تحليل التكلفة
بسبب التشغيل بكفاءة وتقليل CAPEX المتوقع لـ SOEC، ويرجع ذلك أساسًا إلى تطوير التكنولوجيا وزيادة حجم الإنتاج. يتم مناقشة فوائد التكلفة لدمج SOEC في أنظمة الأمونيا الخضراء لاحقًا من خلال حساب LCOEs وعوامل السعة المطلوبة لضمان التنافسية الاقتصادية.
النتائج الفنية لنمذجة الديناميكا الحرارية للأنظمة (تم اعتبار القيمة الحرارية المنخفضة 120 و 18.6 ميغا جول/كغم للهيدروجين والأمونيا، على التوالي).
| نظام التحليل الكهربائي | مجموعة دول الآسيان | SOEC | ||
| LTPAEC | HTPAEC | LP-SOEC | HPSOEC | |
| سعة النظام (
|
٤٣٠ | ٤٣٠ | ٤٣٠ | ٤٣٠ |
| الطاقة المستهلكة بواسطة وحدة التحليل الكهربائي (
|
8.81 | ٧.٤٧ | 6.07 +
|
|
| الطاقة المستهلكة بواسطة وحدة فصل الهواء (MWh/tNH3) | 0.13 | 0.13 | 0.13 | 0.13 |
| الطاقة المستهلكة بواسطة HBL (
|
0.23 | 0.23 | 0.23 | 0.23 |
| إجمالي الطاقة المستهلكة (ميغاوات ساعة/
|
9.17 | 7.83 | 7.4 | 7.3 |
| البخار الناتج من حرارة النفايات لمبردات الهواء و | – | – | 1.43 | 0.77 |
| تكامل الحرارة الحرارية بين المحلل الكهربائي و HBL (ميغاوات ساعة/طن NH3) | – | – | 1.08 | 0.86 |
| كفاءة المحلل الكهربائي المعتمد على LHV (%) | ٦٦.٧ | 78.6 | ٨٣.١ | 84.1 |
| الكفاءة العامة المعتمدة على LHV (%) | ٥٦.٤ | 66.0 | 69.7 | 70.4 |
- 0.70 و
هي الكهرباء المستهلكة بواسطة ELH1 في الأنظمة المصممة بناءً على LP-SOEC و HP-SOEC، على التوالي. 6.07 ميغاوات ساعة/طن NH3 هي الكهرباء المستهلكة بواسطة الوحدات وهي نفسها في كلا الحالتين.
**هو الطاقة الإضافية المستهلكة لزيادة ضغط الهيدروجين بعد الـ LP-SOEC. الطاقة المستهلكة لزيادة ضغط المواد الخام لنظام HBL هي أعلى بالنسبة للنظام المصمم بناءً على LPSOEC.
يمكن تحقيقه باستخدام النظام الذي يستفيد من HP-SOEC كمصدر للهيدروجين الأخضر.
4.4. الأمونيا المستندة إلى الوقود الأحفوري
4.4.1. الانبعاثات
تقريبًا
4.4.2. تكلفة الأمونيا الرمادية والحد الأدنى
4.4.3. تكلفة الأمونيا الزرقاء
تكلفة الهيدروجين الرمادي والأمونيا المنتجة من الغاز الطبيعي كدالة لسعر الغاز الطبيعي (LCOE
| سعر الغاز الطبيعي (€/MWh) | 10 (~0.115 | 30 (~0.345 |
|
|
|
|
| التكلفة المتعلقة بالرمادي
|
155 | ٣٣٠ |
| نفقات رأس المال الأخرى (
|
50 | |
| الصيانة (
|
10 | |
| الكهرباء
|
10 | |
| تكلفة التصنيع (
|
50 | |
| تكلفة
|
٢٧٥ | ٤٥٠ |
- بحلول عام 2020، يمكن أن تنافس الأمونيا الخضراء المعتمدة على الطاقة المتجددة الأمونيا الزرقاء فقط عند اعتبار قيمة “منخفضة” من
كنسبة تكلفة الطاقة المتكاملة. - بحلول عام 2030، سيكون تكلفة الأمونيا الخضراء (استنادًا إلى تقنيتي AEC و SOEC) أقل من تكلفة الأمونيا الزرقاء عند اعتبار تكاليف الطاقة المستوية أقل من 15 يورو/ميغاوات ساعة.
- بحلول عام 2050، سيكون الأمونيا الأخضر القائم على SOEC اقتصاديًا مفضلًا مقارنة بالأمونيا الزرقاء لأسعار تكلفة الطاقة أقل من 35 يورو/ميغاوات ساعة.
4.5. تحليل الحساسية
4.5.1. آثار تكلفة الكهرباء الموحدة (LCOE)
تكلفة الأمونيا الزرقاء (LCOE
| سعر الغاز الطبيعي (يورو/ميغاوات ساعة) | 10 (
|
30 (
|
||||
| سنة | ٢٠٢٠ | ٢٠٣٠ | ٢٠٥٠ | ٢٠٢٠ | ٢٠٣٠ | ٢٠٥٠ |
| تكلفة CCS (
|
١٣٣ | ١٠٧ | 87 | ١٣٣ | ١٠٧ | 87 |
| تكلفة CCS (€
|
128 | ١٠٣ | 84 | 128 | ١٠٣ | 84 |
| نسبة تكلفة CCS في تكلفة الأمونيا الزرقاء (%) | 32 | 27 | 23 | ٢٢ | 19 | 16 |
| تكلفة الأمونيا الرمادية بدون
|
٢٧٥ | ٢٧٥ | ٢٧٥ | ٤٥٠ | ٤٥٠ | ٤٥٠ |
| تكلفة الأمونيا الزرقاء بدون
|
٤٠٣ | 378 | 359 | 578 | 553 | 534 |
الكمية المنتجة من الهيدروجين). وبالتالي، فإن النظام المزود بـ HP-SOEC لديه أداء اقتصادي أفضل قليلاً.
4.5.2. آثار عامل السعة
4.5.3. آثار النفقات الرأسمالية المقدرة
حتى أكثر من ذلك.
كما هو موضح في الشكل 11(أ)، في عام 2050، بافتراض عامل سعة
5. الخاتمة
- الكفاءة العامة لـ
و يتم الحصول على ذلك للنظام المصمم بناءً على LTP-AEC و HTP-AEC و LP-SOEC و HPSOEC، على التوالي.
- على الرغم من أن SOEC يعمل بكفاءة مقارنةً بـ AEC، فإن استخدام هذه التكنولوجيا لإنتاج الأمونيا الخضراء ليس مجديًا اقتصاديًا قبل أن يتم خفض تكلفة SOEC إلى
(بافتراض عامل سعة تكلفة الطاقة المتكاملة ورأس المال الاستثماري لـ AEC ) من خلال، على سبيل المثال، تصنيع متقدم. - بحلول عام 2030 و2050، من المتوقع أن تؤدي تحسينات التصنيع والتكنولوجيا إلى خفض تكلفة SOEC. لذلك، يبدو أن استخدام SOEC في نظام إنتاج الأمونيا الخضراء هو أمر اقتصادي ملائم لـ AEC في هذا التحليل.
- بحلول عام 2050، بافتراض تكلفة الطاقة المتكاملة
ومعدل قدرة يبلغ 50%، من المتوقع أن تكون تكلفة الأمونيا الخضراء 495 يورو/طن، المنتجة بنظام قائم على خلايا كهربائية تعمل بالتحليل الكهربائي تحت الضغط.
- مع تكلفة مستوى الطاقة المولدة (LCOE) قدرها
عامل السعة من وسعر NG من ، ضريبة مطلوب لجعل الأمونيا الخضراء قابلة للمقارنة من حيث التكلفة مع الأمونيا الرمادية. - بحلول عام 2050، مع
كما هو متوقع لسعر الغاز الطبيعي، تنفيذ ضريبة سوف تجعل الأمونيا الخضراء المعتمدة على SOEC تنافسية من حيث التكلفة حتى لقيمة LCOE تصل إلى 60 يورو/ميغاوات ساعة. - بحلول عام 2050، مع افتراض سعر الغاز الطبيعي المتوقع
وعامل سعة بالنسبة لمصنع الأمونيا الخضراء، ستكون تكلفة الأمونيا الخضراء المنتجة باستخدام نظام SOEC تنافسية مع الأمونيا الرمادية والزرقاء لقيم LCOE أقل من 25 و ، على التوالي.
- بحلول عام 2050، لقيم LCOE التي تزيد عن
، ينتج النظام القائم على (LP-SOEC) الأمونيا بتكلفة أقل، حتى مع افتراض نفقات رأس المال الأعلى (600 يورو/كيلووات) لـ LP-SOEC و خفض النفقات الرأسمالية لـ LTP-AEC ) مقارنة بقيم الحالة الأساسية. - بحلول عام 2050، زيادة عامل السعة من 30 إلى
يقلل من تكلفة الأمونيا الخضراء بنسبة تقارب .
يجب إجراء تحليل اقتصادي مفصل في مواقع محددة ذات ملفات مناخية مميزة، حيث قد تؤثر هذه العوامل على الاستنتاجات الاقتصادية المقدمة هنا. لذلك، يجب اعتبار هذه التقييمات الاقتصادية كإرشادات فقط. قد تنشأ الخطأ المحتمل في هذه الدراسة من القيم المتوقعة لرأس المال الاستثماري لعامي 2030 و2050 لتقنيات التحليل الكهربائي الناشئة. ومع ذلك، من الجدير بالذكر أنه نظرًا لأن تكلفة الكهرباء المستهلكة تحدد إلى حد كبير سعر الأمونيا الخضراء، فقد لا يؤثر هذا العامل بشكل كبير على الاستنتاجات الاقتصادية المقدمة في هذا البحث.
بيان مساهمة مؤلفي CRediT
إعلان عن تضارب المصالح
توفر البيانات
الشكر والتقدير
الملحق. نموذج الخلية لـ SOEC
المعلمات المستخدمة في نمذجة SOEC
| المعلمة | القيمة | ||
| درجة حرارة التشغيل [72] (
|
750 | ||
| ضغط التشغيل [72] (بار) |
|
||
| كسر المول من الهيدروجين عند مدخل الكاثود [72] | 0.5 | ||
| كسر المول من الأكسجين عند مدخل الأنود [72] | 1 | ||
| ارتفاع قطب الأنود (م) |
|
||
| ارتفاع قطب الكاثود (م) |
|
||
| متوسط قطر المسام لقطب الأنود [36] (م) |
|
||
| متوسط قطر المسام لقطب الكاثود [36] (م) |
|
||
| عدد الإلكترونات المتبادلة في التفاعلات [37] | 2 | ||
| نفاذية الأقطاب [36] (م2) | 10-13 |
here,
القيم المثلى للمعلمات الملائمة
| المعلمة | القيمة – الخلية القديمة | القيمة – الخلية الجديدة |
| ثابت العامل المسبق المستخدم لكثافة التيار المتبادل للأنود (
|
|
|
| ثابت العامل المسبق المستخدم لكثافة التيار المتبادل للكاثود (
|
|
|
| طاقة التفعيل المستخدمة لكثافة التيار المتبادل للأنود (
|
|
|
| طاقة التفعيل المستخدمة لكثافة التيار المتبادل للكاثود (
|
|
|
| معامل نقل الشحنة لتفاعل الأنود (
|
0.6573 | 0.8303 |
| معامل نقل الشحنة لتفاعل الكاثود (
|
0.5000 | 0.7725 |
| قوة الضغط الجزئي للأكسجين المستخدمة لكثافة التيار المتبادل للأنود (م) | 0.1853 | 0.1825 |
| قوة الضغط الجزئي للهيدروجين المستخدمة لكثافة التيار المتبادل للكاثود (أ) | -0.2154 | -0.0583 |
| قوة الضغط الجزئي للبخار المستخدمة لكثافة التيار المتبادل للكاثود (ب) | 0.3143 | 0.4881 |
| عامل التصحيح لمعاملات الانتشار للأنواع في وسائط الأنود المسامية (
|
0.0995 | 0.1996 |
| عامل التصحيح لمعاملات الانتشار للأنواع في وسائط الكاثود المسامية (
|
0.0201 | 0.1695 |
| ثابت محدد المادة المستخدم للجهد الزائد الأوم (
|
|
|
| طاقة التفعيل المستخدمة للجهد الزائد الأوم (
|
|
|
References
[2] Li G, et al. Research progress in green synthesis of ammonia as hydrogen-storage carrier under ‘hydrogen 2.0 economy. Clean Energy 2023;7(1):116-31. https:// doi.org/10.1093/ce/zkac095.
[3] Laval Alfa, Hafnia Haldor, Topsoe Vestas, Gamesa Siemens. Ammonfuel-an industrial view of ammonia as a marine fuel. Hafnia 2020;(August):1-59.
[4] Bartels JR. A feasibility study of implementing an Ammonia Economy. Ames: Digital Repository @ Iowa State University; 2008. https://doi.org/10.31274/etd-180810-1374.
[5] Kurien C, Mittal M. Review on the production and utilization of green ammonia as an alternate fuel in dual-fuel compression ignition engines. Energy Convers Manag 2022;251(August 2021):114990. https://doi.org/10.1016/j. enconman.2021.114990.
[6] Aziz M, Wijayanta AT, Nandiyanto ABD. Ammonia as effective hydrogen storage: a review on production, storage and utilization. Energies Jun. 2020;13(12):3062. https://doi.org/10.3390/en13123062.
[7] Cesaro Z, Ives M, Nayak-Luke R, Mason M, Bañares-Alcántara R. Ammonia to power: Forecasting the levelized cost of electricity from green ammonia in largescale power plants. Appl Energy Jan. 2021;282:116009. https://doi.org/10.1016/ J.APENERGY.2020.116009.
[8] Wang Y, Zhou X, Liu L. Theoretical investigation of the combustion performance of ammonia/hydrogen mixtures on a marine diesel engine. Int J Hydrogen Energy Apr. 2021;46(27):14805-12. https://doi.org/10.1016/j.ijhydene.2021.01.233.
[9] Mallouppas G, Ioannou C, Yfantis EA. A review of the latest trends in the Use of green ammonia as an energy carrier in maritime industry. Energies 2022;15(4). https://doi.org/10.3390/en15041453.
[10] Campion N, Nami H, Swisher P, Vang Hendriksen P, Münster M. Techno-economic assessment of green ammonia production with different wind and solar potentials. SSRN Electron J 2022. https://doi.org/10.2139/SSRN. 4154006.
[11] Florez J, AlAbbad M, Vazquez-Sanchez H, Morales MG, Sarathy SM. Optimizing islanded green ammonia and hydrogen production and export from Saudi Arabia. Int J Hydrogen Energy Feb. 2024;56:959-72. https://doi.org/10.1016/J. IJHYDENE. 2023.12.075.
[12] Frattini D, Cinti G, Bidini G, Desideri U, Cioffi R, Jannelli E. A system approach in energy evaluation of different renewable energies sources integration in ammonia production plants. Renew Energy Dec. 2016;99:472-82. https://doi.org/10.1016/ j.renene.2016.07.040.
[13] Mortensen AW, Mathiesen BV, Hansen AB, Pedersen SL, Grandal RD, Wenzel H. The role of electrification and hydrogen in breaking the biomass bottleneck of the renewable energy system – a study on the Danish energy system. Appl Energy Oct. 2020;275:115331. https://doi.org/10.1016/j.apenergy.2020.115331.
[14] Zhang H, Wang L, Van herle J, Maréchal F, Desideri U. Techno-economic comparison of green ammonia production processes. Appl Energy Feb. 2020;259: 114135. https://doi.org/10.1016/j.apenergy.2019.114135.
[15] Bicer Y, Dincer I. Life cycle assessment of nuclear-based hydrogen and ammonia production options: a comparative evaluation. Int J Hydrogen Energy Aug. 2017; 42(33):21559-70. https://doi.org/10.1016/j.ijhydene.2017.02.002.
[16] Al-Zareer M, Dincer I, Rosen MA. Transient analysis and evaluation of a novel pressurized multistage ammonia production system for hydrogen storage purposes. J Clean Prod Sep. 2018;196:390-9. https://doi.org/10.1016/j. jclepro.2018.06.022.
[17] Nowicki DA, Agnew GD, Irvine JTS. Green ammonia production via the integration of a solid oxide electrolyser and a Haber-Bosch loop with a series of solid electrolyte oxygen pumps. Energy Convers Manag Mar. 2023;280:116816. https:// doi.org/10.1016/j.enconman.2023.116816.
[18] Egerer J, Grimm V, Niazmand K, Runge P. The economics of global green ammonia trade – ‘Shipping Australian wind and sunshine to Germany. Appl Energy Mar. 2023;334:120662. https://doi.org/10.1016/j.apenergy.2023.120662.
[19] Hatton L, Bañares-Alcántara R, Sparrow S, Lott F, Salmon N. Assessing the impact of climate change on the cost of production of green ammonia from offshore wind. Int J Hydrogen Energy Jan. 2024;49:635-43. https://doi.org/10.1016/J. IJHYDENE. 2023.10.117.
[20] Driscoll H, Salmon N, Bañares-Alcántara R. Technoeconomic evaluation of offshore green ammonia production using tidal and wind energy: a case study. Energy Sources, Part A Recovery, Util Environ Eff Aug. 2023;45(3):7222-44. https://doi. org/10.1080/15567036.2023.2220670.
[21] Armijo J, Philibert C. Flexible production of green hydrogen and ammonia from variable solar and wind energy: case study of Chile and Argentina. Int J Hydrogen Energy Jan. 2020;45(3):1541-58. https://doi.org/10.1016/j. ijhydene.2019.11.028.
[22] Ozturk M, Dincer I. An integrated system for ammonia production from renewable hydrogen: a case study. Int J Hydrogen Energy Jan. 2020. https://doi.org/ 10.1016/j.ijhydene.2019.12.127.
[23] Fúnez Guerra C, Reyes-Bozo L, Vyhmeister E, Jaén Caparrós M, Salazar JL, Clemente-Jul C. Technical-economic analysis for a green ammonia production plant in Chile and its subsequent transport to Japan. Renew Energy Sep. 2020;157: 404-14. https://doi.org/10.1016/j.renene.2020.05.041.
[24] Osman O, Sgouridis S, Sleptchenko A. Scaling the production of renewable ammonia: a techno-economic optimization applied in regions with high insolation. J Clean Prod Oct. 2020;271:121627. https://doi.org/10.1016/j. jclepro.2020.121627.
[25] Siddiqui O, Dincer I. A new solar energy system for ammonia production and utilization in fuel cells. Energy Convers Manag Mar. 2020;208:112590. https://doi. org/10.1016/j.enconman.2020.112590.
[26] Ikäheimo J, Kiviluoma J, Weiss R, Holttinen H. Power-to-ammonia in future North European 100 % renewable power and heat system. Int J Hydrogen Energy Sep. 2018;43(36):17295-308. https://doi.org/10.1016/j.ijhydene.2018.06.121.
[27] Bicer Y, Dincer I. Exergoeconomic analysis and optimization of a concentrated sunlight-driven integrated photoelectrochemical hydrogen and ammonia production system. Int J Hydrogen Energy Jul. 2019;44(34):18875-90. https:// doi.org/10.1016/j.ijhydene.2018.10.074.
[28] Lee B, Lim D, Lee H, Lim H. Which water electrolysis technology is appropriate?: Critical insights of potential water electrolysis for green ammonia production. Renew Sustain Energy Rev Jun. 2021;143:110963. https://doi.org/10.1016/J. RSER.2021.110963.
[29] Pawar ND, et al. Potential of green ammonia production in India. Int J Hydrogen Energy Aug. 2021;46(54):27247-67. https://doi.org/10.1016/J. IJHYDENE. 2021.05.203.
[30] Morgan ER. Techno-economic feasibility study of ammonia plants powered by offshore wind. Amherst: University of Massachusetts; 2013. https://doi.org/ 10.7275/11KT-3F59.
[31] Nami H, Rizvandi OB, Chatzichristodoulou C, Hendriksen PV, Frandsen HL. Techno-economic analysis of current and emerging electrolysis technologies for green hydrogen production. Energy Convers. Manag. Oct. 2022;269:116162. https://doi.org/10.1016/J.ENCONMAN.2022.116162.
[32] AlZahrani AA, Dincer I. Thermodynamic and electrochemical analyses of a solid oxide electrolyzer for hydrogen production. Int J Hydrogen Energy Aug. 2017;42 (33):21404-13. https://doi.org/10.1016/j.ijhydene.2017.03.186.
[33] Ni M, Leung MKH, Leung DYC. Energy and exergy analysis of hydrogen production by solid oxide steam electrolyzer plant. Int J Hydrogen Energy Dec. 2007;32(18): 4648-60. https://doi.org/10.1016/j.ijhydene.2007.08.005.
[34] Mohammadi A, Mehrpooya M. Thermodynamic and economic analyses of hydrogen production system using high temperature solid oxide electrolyzer integrated with parabolic trough collector. J Clean Prod Mar. 2019;212:713-26. https://doi.org/10.1016/j.jclepro.2018.11.261.
[35] Navasa M, Miao XY, Frandsen HL. A fully-homogenized multiphysics model for a reversible solid oxide cell stack. Int J Hydrogen Energy 2019;44(41):23330-47. https://doi.org/10.1016/j.ijhydene.2019.06.077.
[36] Navasa M, Graves C, Chatzichristodoulou C, Løye Skafte T, Sundén B, Lund Frandsen H. A three dimensional multiphysics model of a solid oxide electrochemical cell: a tool for understanding degradation. Int J Hydrogen Energy 2018;43(27):11913-31. https://doi.org/10.1016/j.ijhydene.2018.04.164.
[37] Leonide A, Apel Y, Ivers-Tiffee E. SOFC modeling and parameter Identification by means of impedance Spectroscopy. ECS Trans 2019;19(20):81-109. https://doi. org/10.1149/1.3247567.
[38] Ni M, Leung MKH, Leung DYC. Parametric study of solid oxide steam electrolyzer for hydrogen production. Int J Hydrogen Energy Sep. 2007;32(13):2305-13. https://doi.org/10.1016/j.ijhydene.2007.03.001.
[39] Liu S, Kong W, Lin Z. Three-dimensional modeling of planar solid oxide fuel cells and the rib design optimization. J Power Sources 2009;194(2):854-63. https://doi. org/10.1016/j.jpowsour.2009.06.056.
[40] Bernadet L, Gousseau G, Chatroux A, Laurencin J, Mauvy F, Reytier M. Influence of pressure on solid oxide electrolysis cells investigated by experimental and modeling approach. Int J Hydrogen Energy 2015;40(38):12918-28. https://doi. org/10.1016/j.ijhydene.2015.07.099.
[41] Tremel A. Electricity-based fuels. In: SpringerBriefs in applied Sciences and technology. Cham: Springer International Publishing; 2018. https://doi.org/ 10.1007/978-3-319-72459-1.
[42] Zeng K, Zhang D. Recent progress in alkaline water electrolysis for hydrogen production and applications. Prog Energy Combust Sci Jun. 2010;36(3):307-26. https://doi.org/10.1016/J.PECS.2009.11.002.
[43] Marini S, et al. Advanced alkaline water electrolysis. Electrochim Acta Nov. 2012; 82:384-91. https://doi.org/10.1016/J.ELECTACTA.2012.05.011.
[44] HyProvide large-scale Al-kaline electrolyser (MW), EUDP 11-II, 64011-0105. 2016.
[45] Economic and Efficient Electrolytic Hydrogen production (2017-2021) – DTU Energy – ELE.” Accessed: Jul. 08, 2021. [Online]. Available: https://www.ele.ene rgy.dtu.dk/Projects/EEEHy.
[46] Frattini D, Cinti G, Bidini G, Desideri U, Cioffi R, Jannelli E. A system approach in energy evaluation of different renewable energies sources integration in ammonia production plants. Renew Energy Dec. 2016;99:472-82. https://doi.org/10.1016/ J.RENENE.2016.07.040.
[47] Flórez-Orrego D, de Oliveira Junior S. Modeling and optimization of an industrial ammonia synthesis unit: an exergy approach. Energy Oct. 2017;137:234-50. https://doi.org/10.1016/J.ENERGY.2017.06.157.
[48] Rao KP, Ramesh Bhat N, Jönsson J. First industrial experience – Safe start-up of KM 111 at Mangalore chemicals and fertilizers limited. Ammonia Plant Safety and Related Facilities 2017;2017:247-56.
[49] Schmidt O, Gambhir A, Staffell I, Hawkes A, Nelson J, Few S. Future cost and performance of water electrolysis: an expert elicitation study. Int J Hydrogen Energy Dec. 2017;42(52):30470-92. https://doi.org/10.1016/j. ijhydene.2017.10.045.
[50] Akrami E, Ameri M, Rocco MV, Sanvito FD, Colombo E. Thermodynamic and exergo-economic analyses of an innovative semi self-feeding energy system synchronized with waste-to-energy technology. Sustain Energy Technol Assessments Aug. 2020;40:100759. https://doi.org/10.1016/j.seta.2020.100759.
[51] Nami H, Mahmoudi SMS, Nemati A. Exergy, economic and environmental impact assessment and optimization of a novel cogeneration system including a gas
turbine, a supercritical CO2 and an organic Rankine cycle (GT-HRSG/SCO2). Appl Therm Eng Jan. 2017;110:1315-30. https://doi.org/10.1016/j. applthermaleng.2016.08.197.
[52] Bejan A, Tsatsaronis G. Thermal design and optimization. John Wiley & Sons; 1996.
[53] Turton R, Bailie RC, Whiting WB, Shaeiwitz JA. Analysis, synthesis and design of chemical processes. fourth ed. Prentice Hall: Prentice Hall international series in the physical and chemical engineering sciences; 2012.
[54] Rizvandi OB, Frandsen HL. Modeling of single- and double-sided high-pressure operation of solid oxide electrolysis stacks. Int J Hydrogen Energy Sep. 2023;48 (77):30102-19. https://doi.org/10.1016/J.IJHYDENE.2023.04.169.
[55] Nayak-Luke RM, Bañares-Alcántara R. Techno-economic viability of islanded green ammonia as a carbon-free energy vector and as a substitute for conventional production. Energy Environ Sci 2020;13(9):2957-66. https://doi.org/10.1039/ d0ee01707h.
[56] International Energy Agency (IEA). The future of hydrogen. Paris: IEA; 2019. https://doi.org/10.1787/1e0514c4-en. https://www.iea.org/reports/the-future-of -hydrogen.
[57] Ammonia production causes
[58] Yadav D, Banerjee R. Economic assessment of hydrogen production from solar driven high-temperature steam electrolysis process. J Clean Prod May 2018;183: 1131-55. https://doi.org/10.1016/j.jclepro.2018.01.074.
[59] Dotzauer E. Greenhouse gas emissions from power generation and consumption in a nordic perspective. Energy Pol Feb. 2010;38(2):701-4. https://doi.org/10.1016/ j.enpol.2009.10.066.
[60] EU Natural Gas | 2022 Data | 2023 Forecast | 2010-2021 Historical | Price | Quote.” Accessed: Jan. 26, 2022. [Online]. Available: https://tradingeconomics.co m/commodity/eu-natural-gas.
[61] Arnaiz del Pozo C, Cloete S. Techno-economic assessment of blue and green ammonia as energy carriers in a low-carbon future. Energy Convers Manag 2022; 255(January):115312. https://doi.org/10.1016/j.enconman.2022.115312.
[62] International Energy Agency (IEA), “The Role of E-fuels in Decarbonising Transport.” Accessed: Feb. 01, 2024. [Online]. Available: https://iea.blob.core. windows.net/assets/9e0c82d4-06d2-496b-9542-f184ba803645/TheRoleofE-fuel sinDecarbonisingTransport.pdf.
[63] T. Brown, “Carbon intensity of fossil ammonia in a net-zero world.” Accessed: May 30, 2022. [Online]. Available: https://www.ammoniaenergy.org/articles/carbon -intensity-of-fossil-ammonia-in-a-net-zero-world/.
[64] Haugen HA, Eldrup NH, Fatnes AM, Leren E. Commercial capture and transport of CO2 from production of ammonia. In: Energy Procedia. Elsevier; Jul. 2017. p. 6133-40. https://doi.org/10.1016/j.egypro.2017.03.1750.
[65] Næss-Schmidt S, Jensen HN, Münier LL, Lutz J. CO2-TAXES, FUEL PRICES AND LEARNING RATES Contribution from Copenhagen economics to the MarE-fuel project. 2021.
[66] International Renewable Energy Agency. Renewable power generation costs in 2020. ISBN 978-92-9260-348-9. Abu Dhabi: International Renewable Energy Agency; 2021.
[67] International Energy Agency (IEA). Levelised cost of electricity calculator. Paris: IEA and NEA; 2020. https://www.iea.org/articles/levelised-cost-of-electricity-calc ulator.
[68] International energy Agency (IEA), sectoral electricity price distributions. Paris: IEA; 2019. https://www.iea.org/data-and-statistics/charts/sectoral-electricity-pri ce-distributions-2019.
[69] International Energy Agency (IEA), Industry end-user electricity prices in selected OECD countries. Paris: IEA; 2019. https://www.iea.org/data-and-statistics/charts /industry-end-user-electricity-prices-in-selected-oecd-countries-2019.
[70] Campion NJB, Backer M, Swisher PR, Münster M. MarE-fuel: LCOE and optimal electricity supply strategies for P2X plants. 2021.
[71] International Energy Agency (IEA). Projected costs of generating electricity 2020 edition. 2020. https://doi.org/10.1787/9789264008274-en.
[72] Jensen SH, Sun X, Ebbesen SD, Knibbe R, Mogensen M. Hydrogen and synthetic fuel production using pressurized solid oxide electrolysis cells. Int J Hydrogen Energy 2010;35(18):9544-9. https://doi.org/10.1016/j.ijhydene.2010.06.065.
[73] Sun X, Hendriksen PV, Mogensen MB, Chen M. Degradation in solid oxide electrolysis cells during long term Testing. Fuel Cell Dec. 2019;19(6):740-7. https://doi.org/10.1002/fuce. 201900081.
[74] Jensen SH, Sun X, Ebbesen SD, Chen M. Pressurized operation of a planar solid oxide cell stack. Fuel Cell Apr. 2016;16(2):205-18. https://doi.org/10.1002/ fuce. 201500180.
[75] Henke M, Willich C, Kallo J, Friedrich KA. Theoretical study on pressurized operation of solid oxide electrolysis cells. Int J Hydrogen Energy Aug. 2014;39(24): 12434-9. https://doi.org/10.1016/j.ijhydene.2014.05.185.
- General rights
Copyright and moral rights for the publications made accessible in the public portal are retained by the authors and/or other copyright owners and it is a condition of accessing publications that users recognise and abide by the legal requirements associated with these rights.- Users may download and print one copy of any publication from the public portal for the purpose of private study or research.
- You may not further distribute the material or use it for any profit-making activity or commercial gain
- You may freely distribute the URL identifying the publication in the public portal
If you believe that this document breaches copyright please contact us providing details, and we will remove access to the work immediately and investigate your claim. - Corresponding author. Department of Energy Conversion and Storage, Technical University of Denmark (DTU), Building 310, Fysikvej, DK-2800, Lyngby, Denmark.
E-mail address: hon@igt.sdu.dk (H. Nami).Proton Exchange Membrane Electrolyzer.
with solar radiation of .
photoelectrochemical water splitting.
This is solar energy to ammonia efficiency.
DOI: https://doi.org/10.1016/j.rser.2024.114517
Publication Date: 2024-05-10
Green ammonia production using current and emerging electrolysis technologies
Renewable and Sustainable Energy Reviews
10.1016/j.rser.2024.114517
2024
Publisher’s PDF, also known as Version of record
Citation (APA):
Green ammonia production using current and emerging electrolysis technologies
ARTICLE INFO
Keywords:
Blue ammonia
Green hydrogen
Power-to-ammonia
Pressurized SOEC
High-temperature alkaline electrolyzer
Abstract
This study investigates utilizing hydrogen produced via water electrolysis to produce green ammonia. Routes are benchmarked based on employing either alkaline electrolysis (AEC) or solid oxide electrolysis (SOEC). Both existing and possible improvements are modeled for the AEC and SOEC technologies coupled with the HaberBosch process to synthesize ammonia. The cost of green ammonia is estimated considering the cost of electrolyzers for both today and future projections and are compared with that of “fossil” ammonia synthesized from natural gas. Threshold
1. Introduction
interest in green ammonia production. Compared with hydrogen, ammonia has some advantages. It is much easier to liquefy and store at higher temperatures ( -33 vs.
| Nomenclature | M | molar mass (kg/kmol) | |
|
|
mass flow rate (kg/s) | ||
| Abbreviationss | n | number of electrons | |
| AEC | alkaline electrolysis |
|
mol flow rate (kmol/s) |
| ASU | air separation unit | N | number |
| Comp | compressor | P | pressure (bar) |
| Cond | condenser |
|
compressor pressure ratio |
| Dist | distillation column |
|
heat transfer rate (kW) |
| ELH | electrical heater |
|
gas constant (
|
| HBL | Haber-bosch loop | s | entropy (kJ/kmol K) |
| HEX | heat exchanger | SUF | steam utilization factor |
| HT-SOEC high-temperature atmospheric SOEC | T | temperature (K) | |
| HTP-AEC | high-temperature pressurized AEC |
|
power (kW) |
| LT-SOEC low-temperature atmospheric SOEC | |||
| LTP-AEC low-temperature pressurized AEC | Greek letters | ||
| MIX | mixer |
|
overpotential (V) |
| SOEC | solid oxide electrolysis |
|
thickness (m) |
| SPL | splitter |
|
pre-exponential factor (1/s) |
|
|
resistivity (
|
||
| Latin letters | |||
| A | heat transfer area | Subscripts | |
| EL | economic life | a | anode |
| CAPEX | capital investment cost ($) | act | activation |
| CF | capacity factor | c | cathode |
| CRF | capital recovery factor | conc | concentration |
|
|
effective diffusion coefficient (
|
cv | control volume |
| e | specific physical exergy (kJ/kmol) | D | destruction |
| E | potential (V) | e | electrolyte |
|
|
exergy rate (kW) |
|
hot flow |
| F | Faraday constant (
|
i | inlet |
| G | Gibbs free energy (
|
0 | outlet |
| h | specific enthalpy (kJ/kmol) | ohm | ohmic |
| H | enthalpy (kJ) | ph | physical |
| i | interest rate (%) | r | reversible |
| J | current density (
|
ref | reference |
|
|
exchange current density (
|
tn | thermo-neutral |
| LCOE | levelized cost of electricity | 0 | ambient conditions |
need the hydrogen or deliver hydrogen directly produced from ammonia decomposition. The proposed system demonstrated energy and exergy efficiencies of
that the addition of tidal stream capacity to wind capacity decreases the hydrogen storage requirement by
Literature review of green ammonia production.
| Reference | Energy source |
|
LCOE | (Min) ammonia cost | (Max) System efficiency (%) | Remarks on main findings and key assumptions | ||||||||
| [22] | Solar + Wind | AEC |
|
500 $/t | na | Green power variability is the major cost driver for green
|
||||||||
| Solar | PEMEC
|
na | na |
|
||||||||||
| [23] | Solar + Wind + hydraulic dams | PEMEC | 18 €/MWh | – | na |
|
||||||||
| [24] | Solar | AEC & PEMEC | na | 718 $/t | 37.4 |
|
||||||||
| [25] | Solar | PEMEC | na | na |
|
During the low demand period, extra power produced by the photovoltaic is utilized to synthesize ammonia and during the peak demand period, the ammonia is fed to the fuel cell to generate power | ||||||||
| [14] | na | SOEC | 73 $/MWh | >550 $/t | 74 % | It is concluded that power-to-ammonia is currently not competitive with biomass-to-ammonia routes. | ||||||||
| [26] | Solar + Wind + hydropower | PEMEC | na | 431-528 €/t | na | Power-to-ammonia technology can be cost-competitive if the natural gas price or
|
||||||||
| [27] | Solar | PEC
|
na | 840 $/t | 5-9.6
|
|
||||||||
| [28] | na |
|
|
|
na | Fixed values of
|
||||||||
| [29] | PV + Onshore wind | PEMEC |
|
|
na | India’s green ammonia potential can supply global ammonia demand Currently, a
|
2. Theoretical analysis and model description
2.1. System development and mathematic modeling
2.1.1. Electrolysis technologies
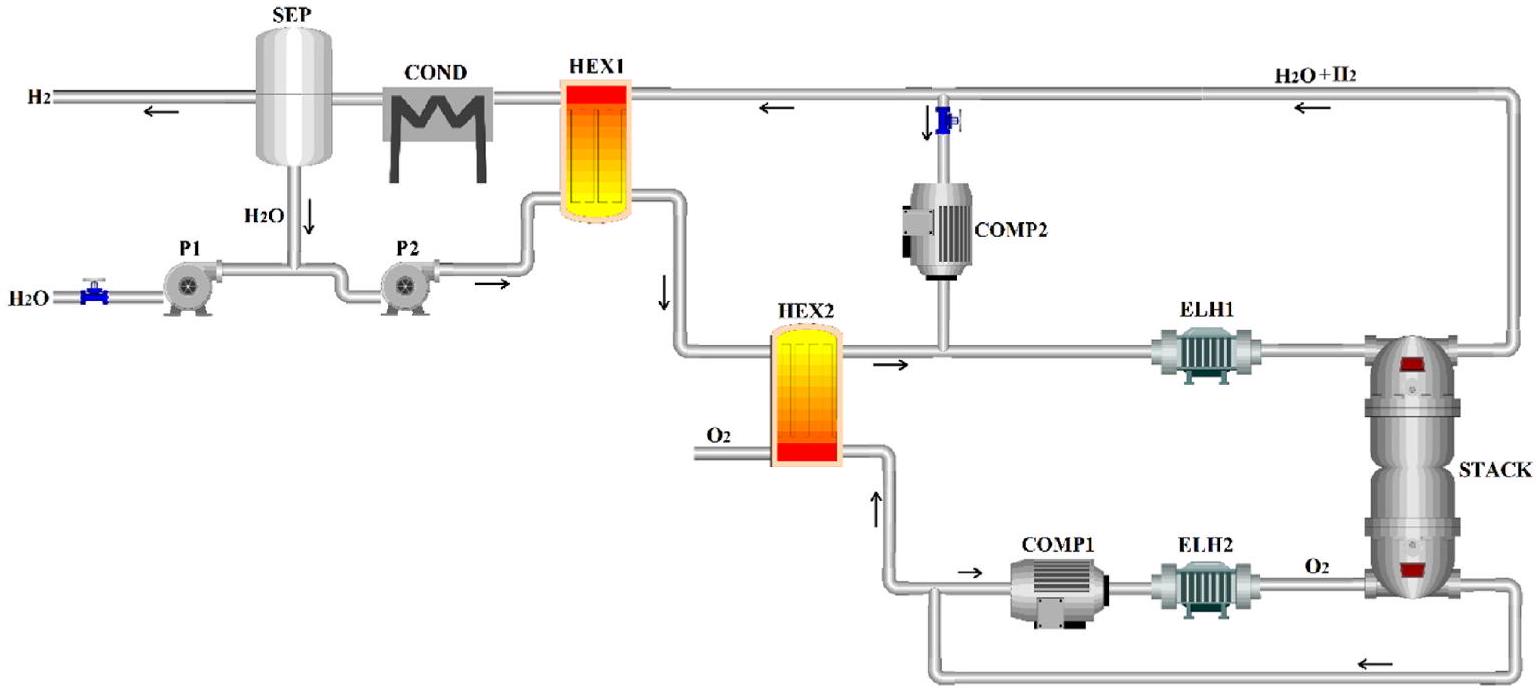
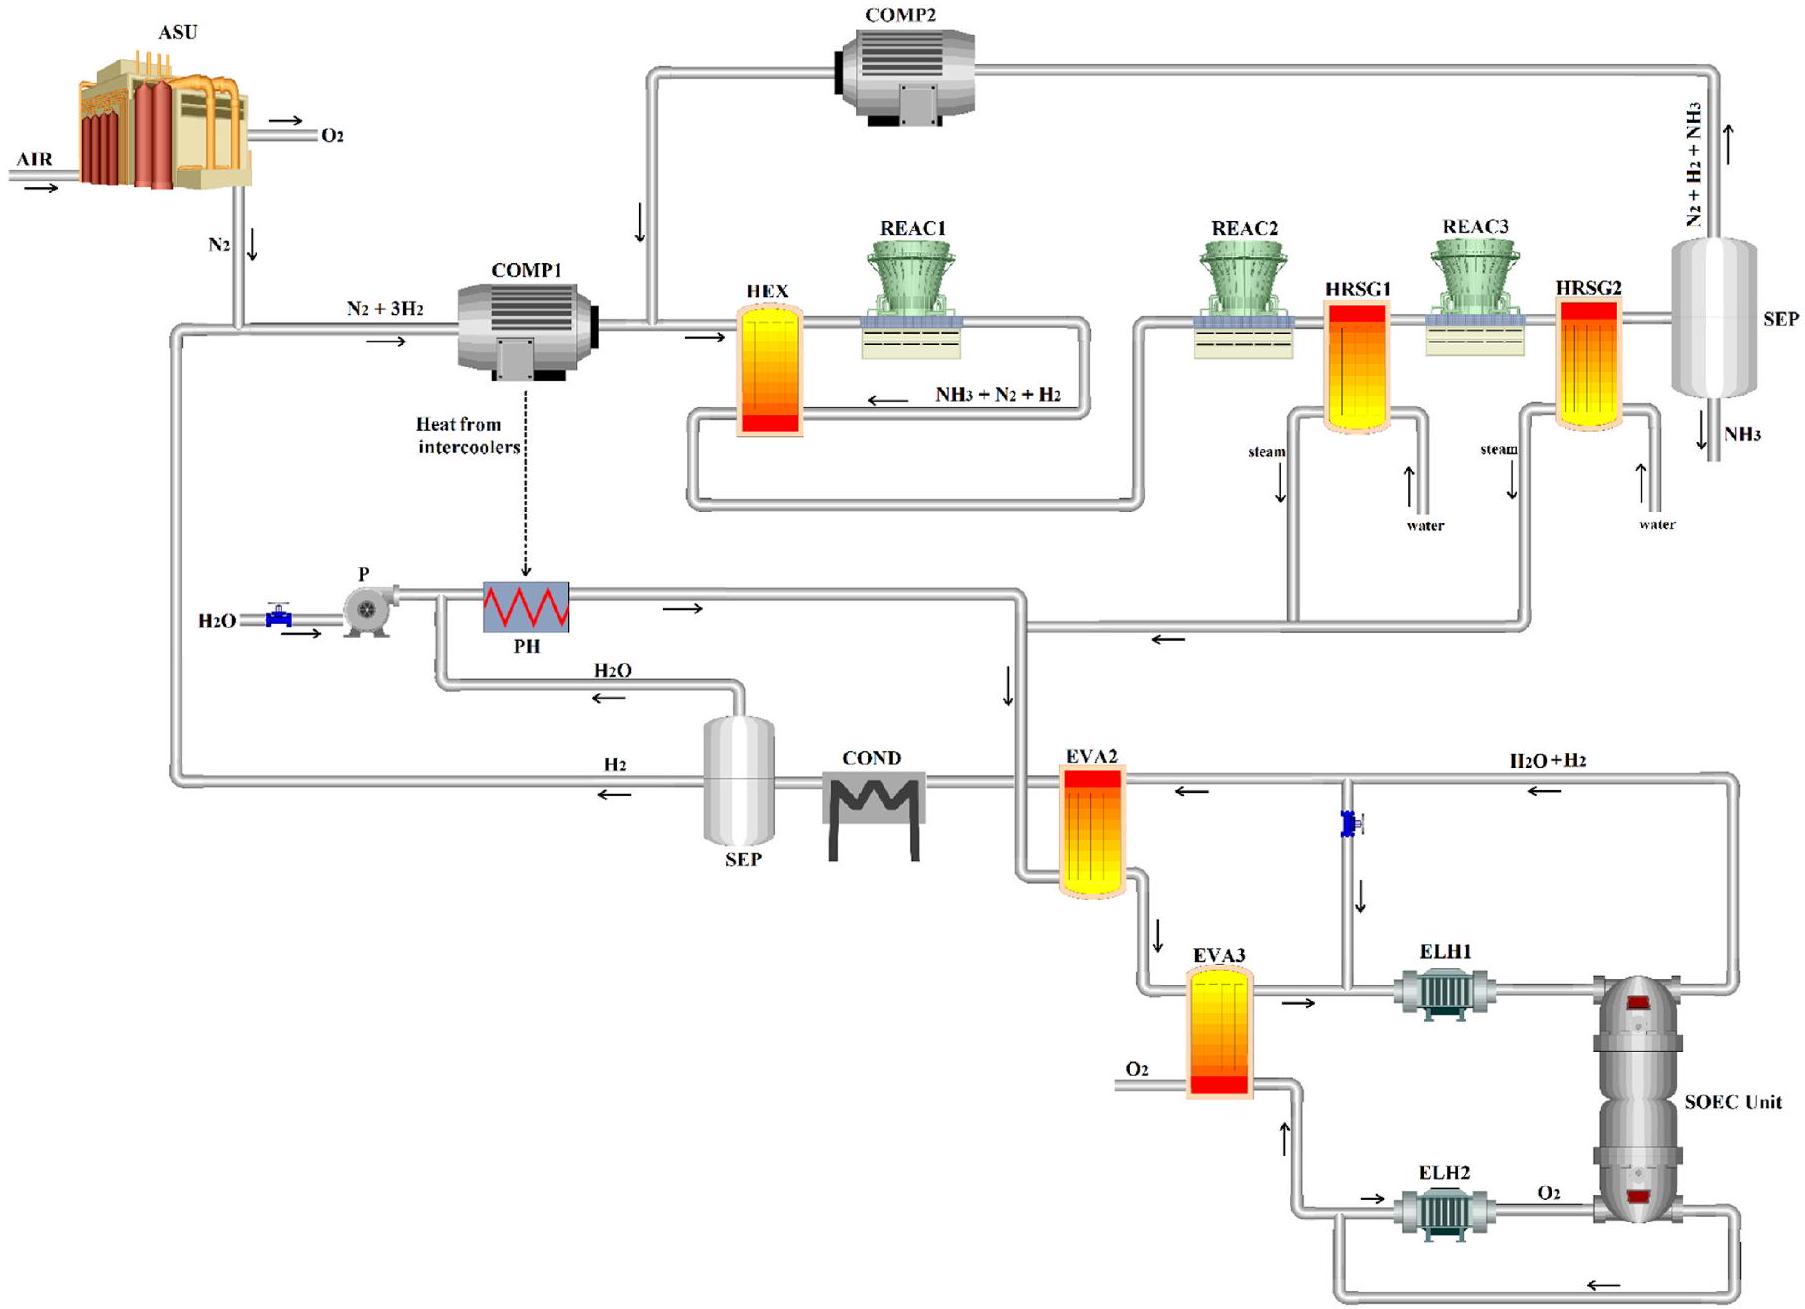
2.1.1.1. Solid oxide electrolysis (SOEC). SOEC performs efficiently compared with other available electrolyzers, especially when there is a heat integration between the electrolyzer and HBL. Part of the required external heat for water splitting can be supplied from waste heat sources available in the HBL to increase the overall system efficiency.
Different electrolysis systems modeled in this study.
| Technology | Naming | Operating conditions |
| AEC | LTP-AEC | Stack is operating at
|
| Hydrogen is produced at 30 bar | ||
| HTP-AEC | Stack is operating at
|
|
| Hydrogen is produced at 30 bar | ||
| SOEC | LP-SOEC | Hydrogen is produced at 1 bar |
| HP-SOEC | Hydrogen is produced at 30 bar | |
| Stack is operating at
|
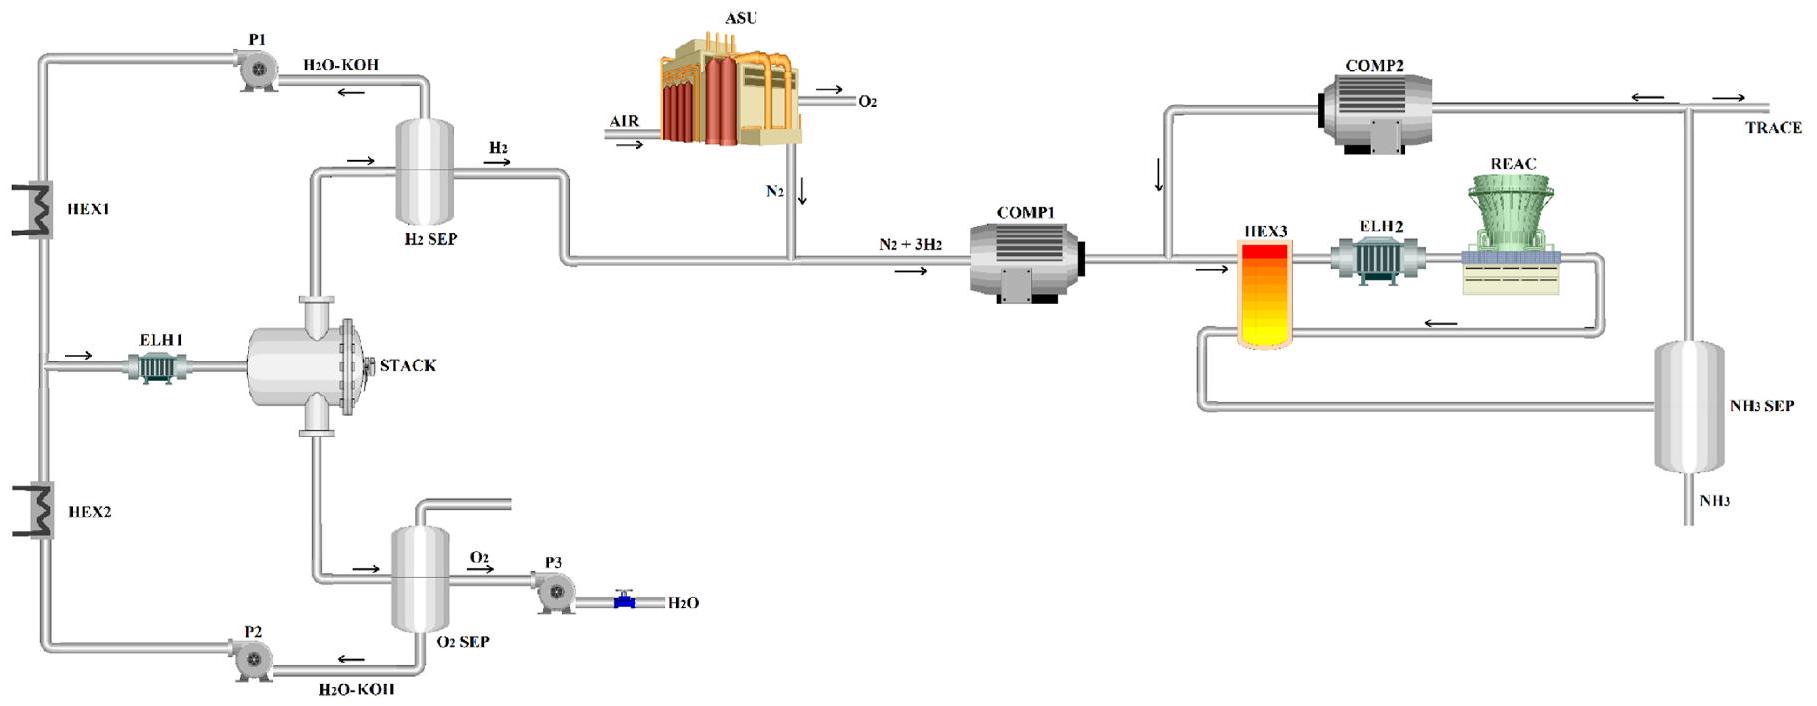
2.1.1.2. Alkaline electrolysis (AEC). Currently, AEC is the primarily employed technology for large-scale green hydrogen production, as it is the most developed and mature electrolysis technology [41]. However, relatively high internal cell resistance decreases the overall efficiency of the system. For AEC, the optimum operating point can be determined through a balance between CAPEX and OPEX, as shown in Ref. [31].
SOEC modeling equations.
| Description | Governing equation |
| Open-circuit voltage (OCV) [35] |
|
| Gibbs free energy [36] |
|
| Butler-Volmer (BV) [37] |
|
| Anode exchange current density [37] |
|
| Cathode exchange current density [37] |
|
| Anode concentration overpotential [38] |
|
| Cathode concentration overpotential [38] |
|
| Ohmic overpotential [37] |
|
| Dusty-gas model (DGM) fluxes [39] |
|
|
|
|
| Binary diffusion coefficient [40] |
|
| Knudsen diffusion coefficient [36] |
|
| Effective diffusion coefficient |
|
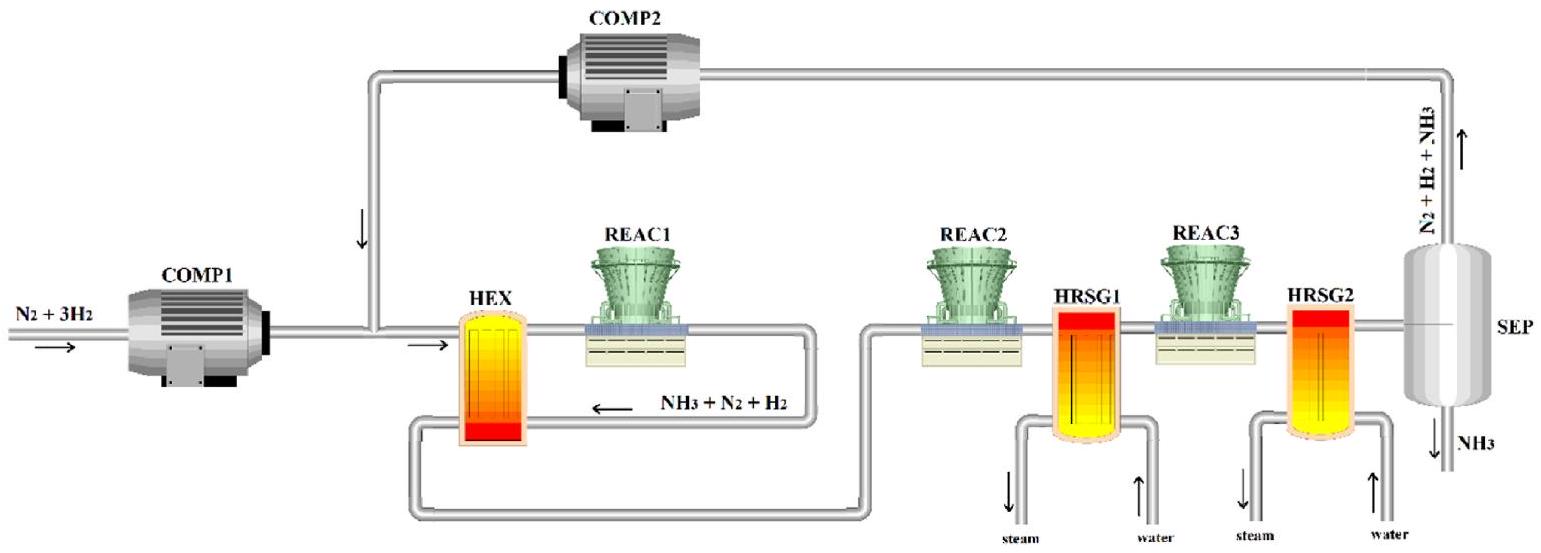
2.1.2. Haber-Bosch loop (HBL)
Input data and assumptions considered to model the HBL [47].
| Parameter | Value | Parameter | Value |
| First bed inlet temperature (
|
310 | First bed inlet temperature (
|
380 |
| Reactor operating pressure (bar) | 200 | Compressor isentropic efficiency (%) | 80 |
| First bed conversion (%) | 20.7 | Reactor pressure drop (bar) | 1.5 |
| Second bed conversion (%) | 6.5 | Minimum temperature approach (
|
10 |
| Third bed conversion (%) | 7.2 | Separator operating temperature (
|
40 |
| Feed stream
|
3:1 | Heat exchanger effectiveness (%) |
|
2.2. System efficiency
3. Techno-economic analysis
Different expenses can be found in the literature for electrolyzers. Common is, however, that the electrolysis stack cost is expected to drop significantly over the years. This is due to the expected development of electrolysis technologies and, in particular, the expected cost reductions from mass manufacturing. SOEC with the lowest maturity is expected to experience the highest relative cost reduction [49]. It is generally assumed that the HBL plant and ASU are mature technologies and are not expected to undergo significant changes in terms of CAPEX in the foreseeable future.
where
Cost functions of the main components. The costs of the electrolysis units are “tun key” estimates at plant level and includes thus balance of plant components and additional costs as outlined in Ref. [31].
| Component | CAPEX [unit] | Condition | Reference |
| LP-SOEC | 2020:
|
For a reference load current | [31] |
| 2030:
|
density of
|
||
| 2050:
|
LP-SOEC and 1.25 A/
|
||
| LTP-AEC | 2020:
|
For a reference load current density of
|
[31] |
| 2030:
|
|||
| [M€/MW] | |||
| 2050:
|
|||
| HEX |
|
– | [50] |
| HBL | CAPEX
|
– | [26] |
| ASU | CAPEX
|
– | [26] |
| Cond | CAPEX
|
– | [51] |
|
|
|||
| Comp |
|
|
[52] |
where,
In addition to estimating the amortized CAPEX, it is necessary to estimate the OPEX of the system in terms of €/year. This should include costs related to electricity consumption, maintenance of the entire system, and manufacturing costs. The annual maintenance cost is assumed to be
amortized CAPEX + OPEX
Input data for the economic analysis.
| Parameter | Value | ||
| SOEC stack replacement cost (% CAPEX) [31] | 2020: 23.5 | ||
| 2030: 13.5 | |||
| 2050: 9.5 | |||
| AEC stack replacement cost (% CAPEX) [31] | 2020: 50 | ||
| 2030: 48 | |||
| 2050: 44 | |||
| SOEC Stack lifetime (year) [31] | 5 | ||
| AEC Stack lifetime (year) [31] | 10 | ||
| LCOE (€/MWh) | 10-60 | ||
| EL (year) | 25 | ||
| Plant capacity factor (plant operation hours in 8760 h ) (%) | 50 | ||
| Average € to $ exchange rate | 1.12 | ||
|
|
8 | ||
| Manufacturing cost [53]: | |||
| Direct manufacturing cost (
|
|||
| – Labor cost (
|
|
||
| – Direct supervisory and clerical labor |
|
||
| – Laboratory charges |
|
||
| Fixed manufacturing cost (
|
|||
| – Local taxes |
|
||
| – Plant overhead |
|
||
|
|
|||
| General manufacturing cost (€/year): | |||
| – Distribution |
|
||
| – R&D |
|
||
| – Administration |
|
||
4. Results and discussion
4.1. System layouts
- Waste heat from the multi-stage compressor (COMP1) intercoolers is utilized to generate steam for the LP-SOEC system in the preheater (PH). However, the heat from the intercoolers will only be able to preheat the feed water (without vaporizing it) for the HP-SOEC system, as evaporation occurs at
(saturated steam at 30 bar). - The heat content in the reactor off-gas (REAC2 and REAC3) is also used to evaporate part of the feed water using the heat recovery steam generator 1 and 2 (HRSG1 and HRSG2).
- Furthermore, the heat content in the SOEC plant off-gas is utilized to vaporize any remaining water in the feed and to superheat the generated steam if possible.
difference. One could also operate with the oxygen at the same pressure as the
4.2. Thermodynamic results
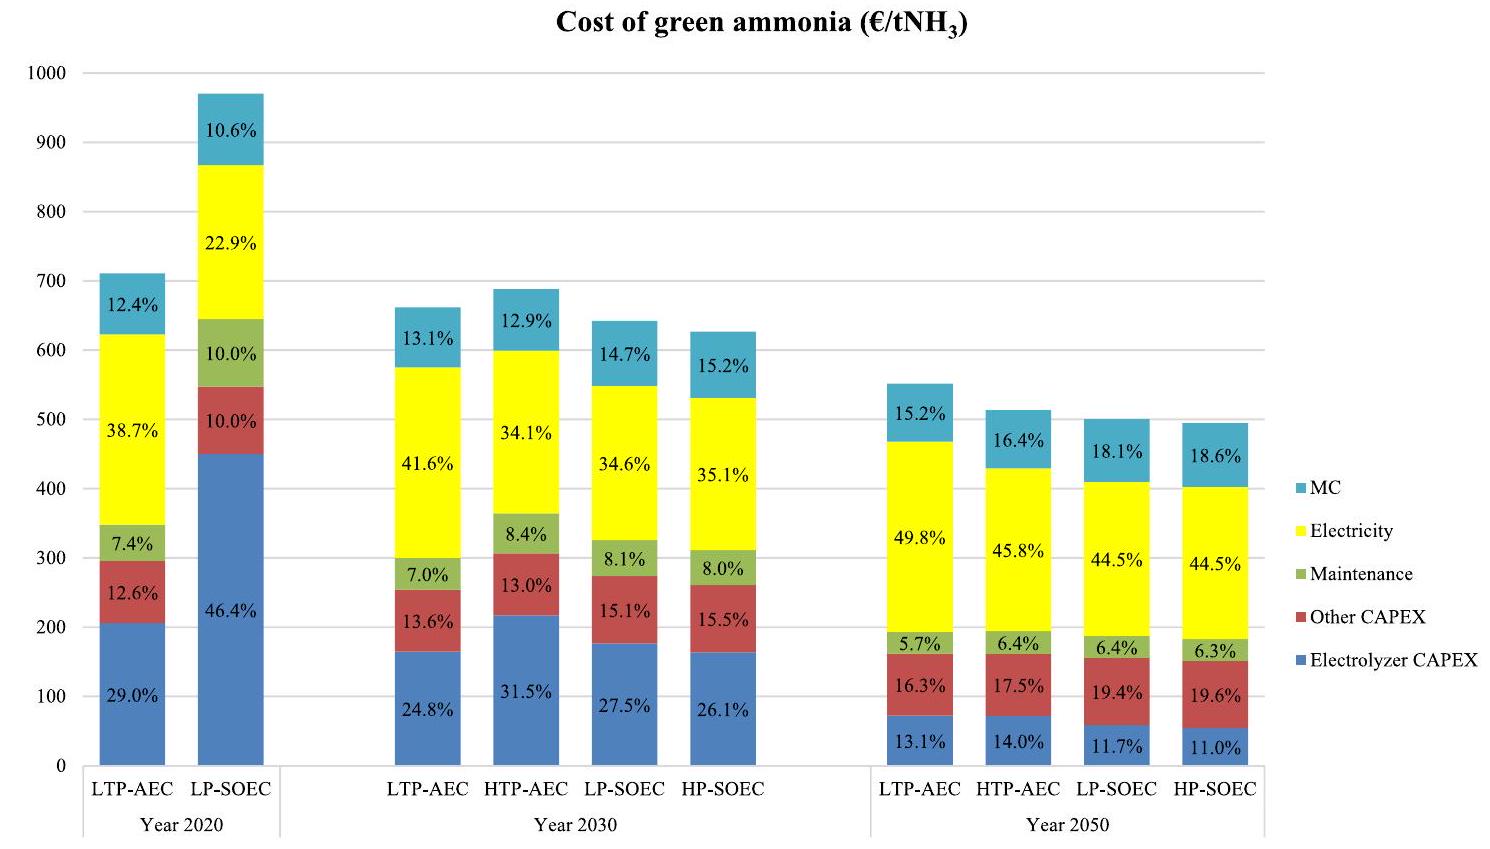
4.3. Cost breakdown results
decrease due to operating efficiently and the anticipated CAPEX reduction for SOEC, mainly due to technology development and scaling up of production volumes. The cost benefits of incorporating SOEC in green ammonia systems are further discussed later by calculating the LCOEs and needed capacity factors to ensure economic competitiveness.
Technical results of the systems thermodynamic modeling (LHV of 120 and 18.6 MJ/kg are considered for hydrogen and ammonia, respectively).
| Electrolysis system | AEC | SOEC | ||
| LTPAEC | HTPAEC | LP-SOEC | HPSOEC | |
| System capacity (
|
430 | 430 | 430 | 430 |
| Power consumed by the electrolysis unit (
|
8.81 | 7.47 | 6.07 +
|
|
| Power consumed by the ASU (MWh//tNH3) | 0.13 | 0.13 | 0.13 | 0.13 |
| Power consumed by the HBL (
|
0.23 | 0.23 | 0.23 | 0.23 |
| Total consumed power (MWh/
|
9.17 | 7.83 | 7.4 | 7.3 |
| Generated steam from intercoolers waste heat and | – | – | 1.43 | 0.77 |
| Thermal heat integration between electrolyzer and HBL (MWh/tNH3) | – | – | 1.08 | 0.86 |
| LHV-based electrolyzer efficiency (%) | 66.7 | 78.6 | 83.1 | 84.1 |
| LHV-based overall efficiency (%) | 56.4 | 66.0 | 69.7 | 70.4 |
- 0.70 and
are the consumed electricity by ELH1 in the systems designed based on LP-SOEC and HP-SOEC, respectively. 6.07 MWh/tNH3 is the consumed electricity by the stacks and is the same for both cases.
**is the extra consumed power for the extra pressurization of the hydrogen after the LP-SOEC. Consumed power for feedstock pressurization for the HBL is higher for the system designed based on LPSOEC.
could be achieved with the system that utilizes HP-SOEC as the source of the green hydrogen.
4.4. Fossil-based ammonia
4.4.1. Emissions
approximately
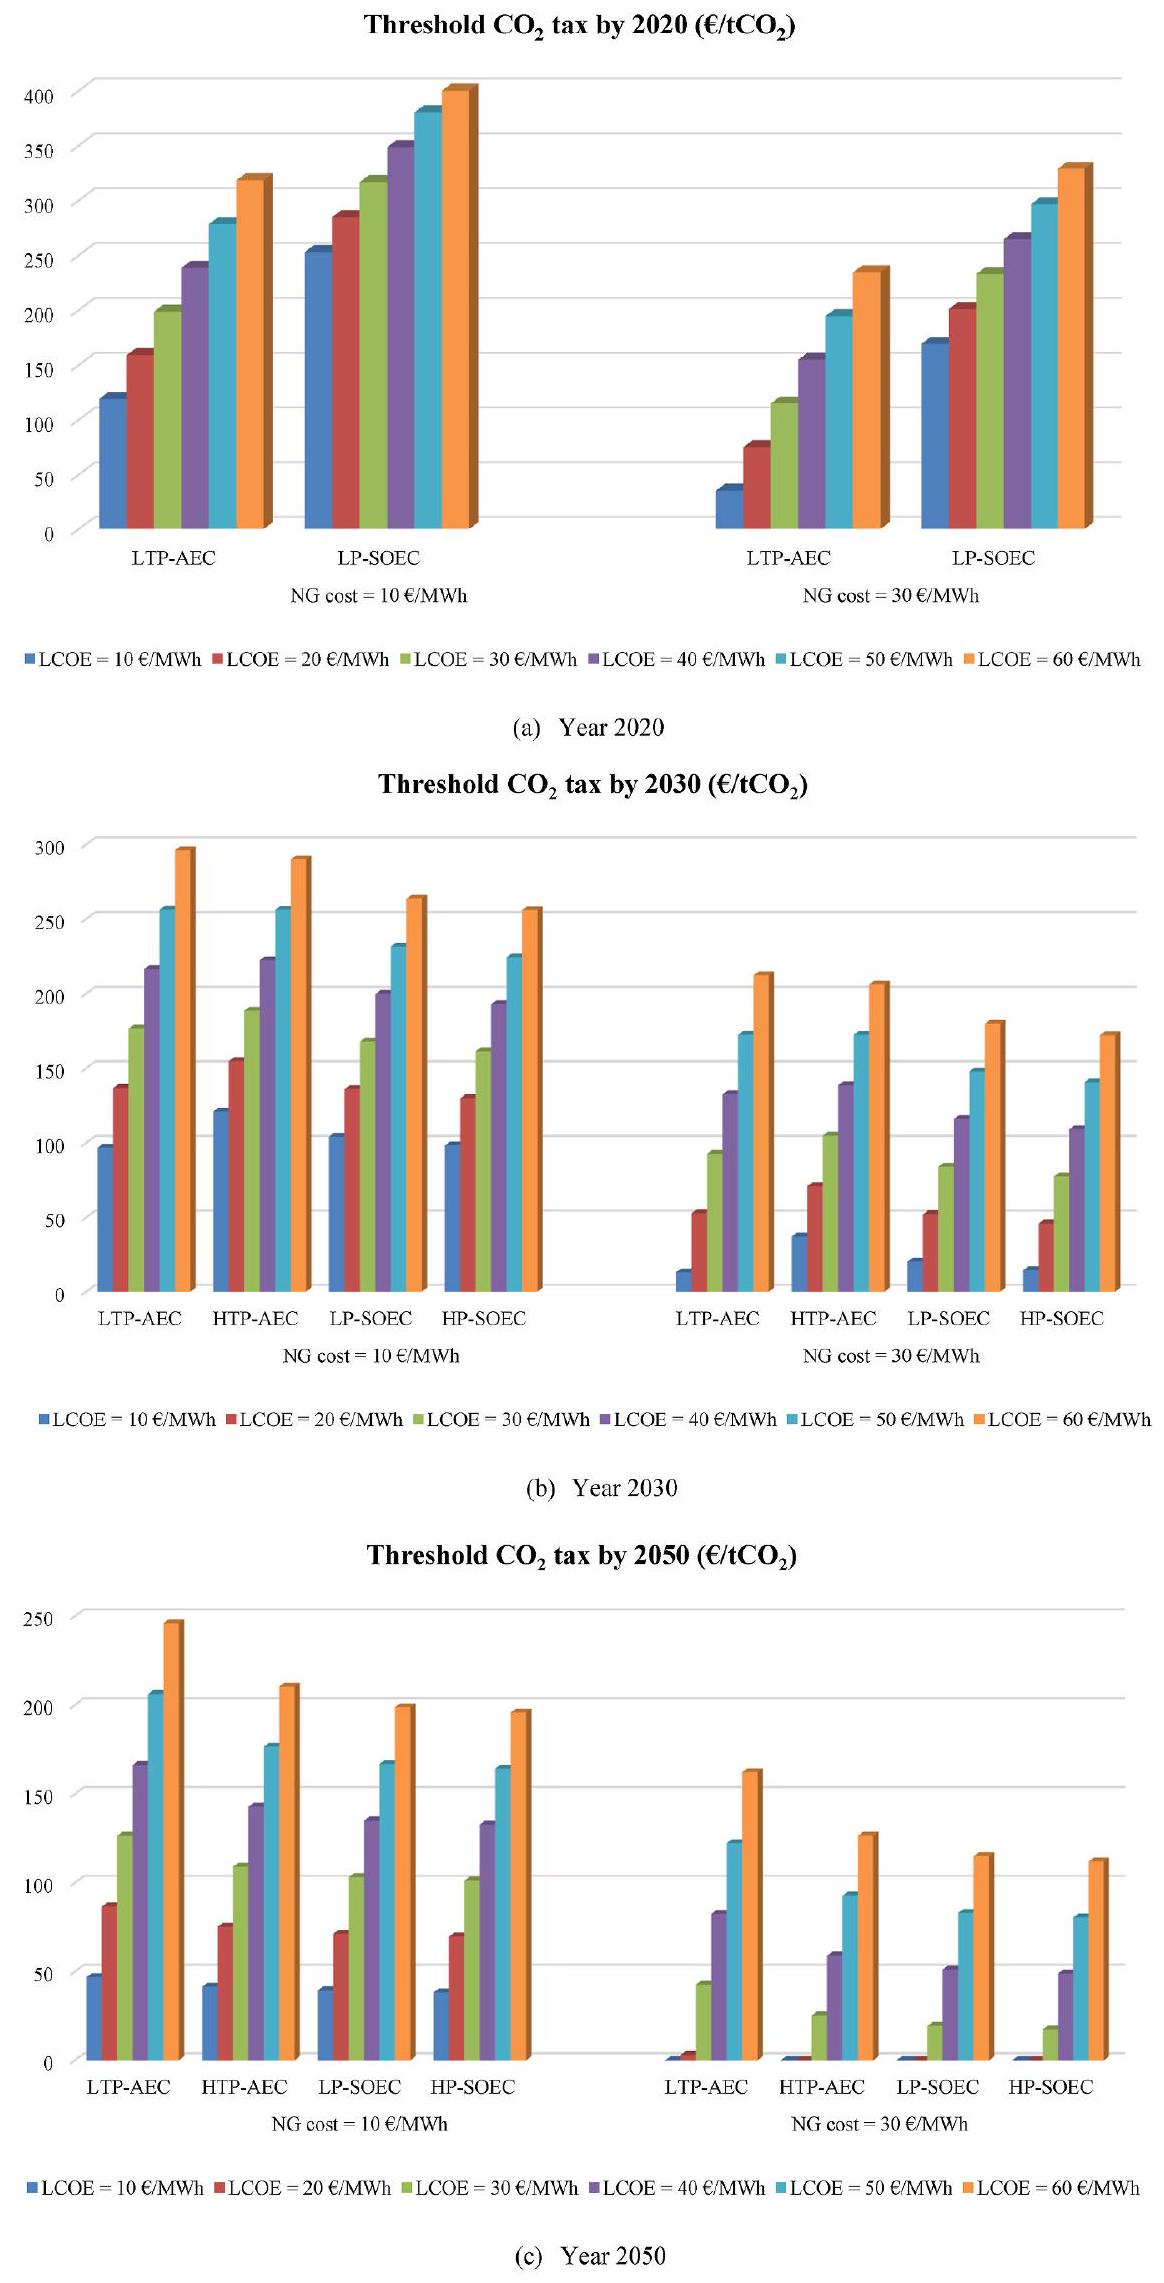
4.4.2. Cost of grey ammonia and threshold
4.4.3. Cost of blue ammonia
Cost of grey hydrogen and ammonia produced from natural gas as a function of natural gas price (LCOE
| NG price (€/MWh) | 10 (~0.115 | 30 (~0.345 |
|
|
|
|
| Cost related to grey
|
155 | 330 |
| Other CAPEX (
|
50 | |
| Maintenance (
|
10 | |
| Electricity (
|
10 | |
| Manufacturing cost (
|
50 | |
| Cost of
|
275 | 450 |
- By 2020, only AEC-based green ammonia can compete with blue ammonia when considering a “low” value of
as LCOE. - By 2030, the cost of green ammonia (based on both AEC and SOEC technologies) will be lower than that of blue ammonia when considering LCOEs below 15 €/MWh.
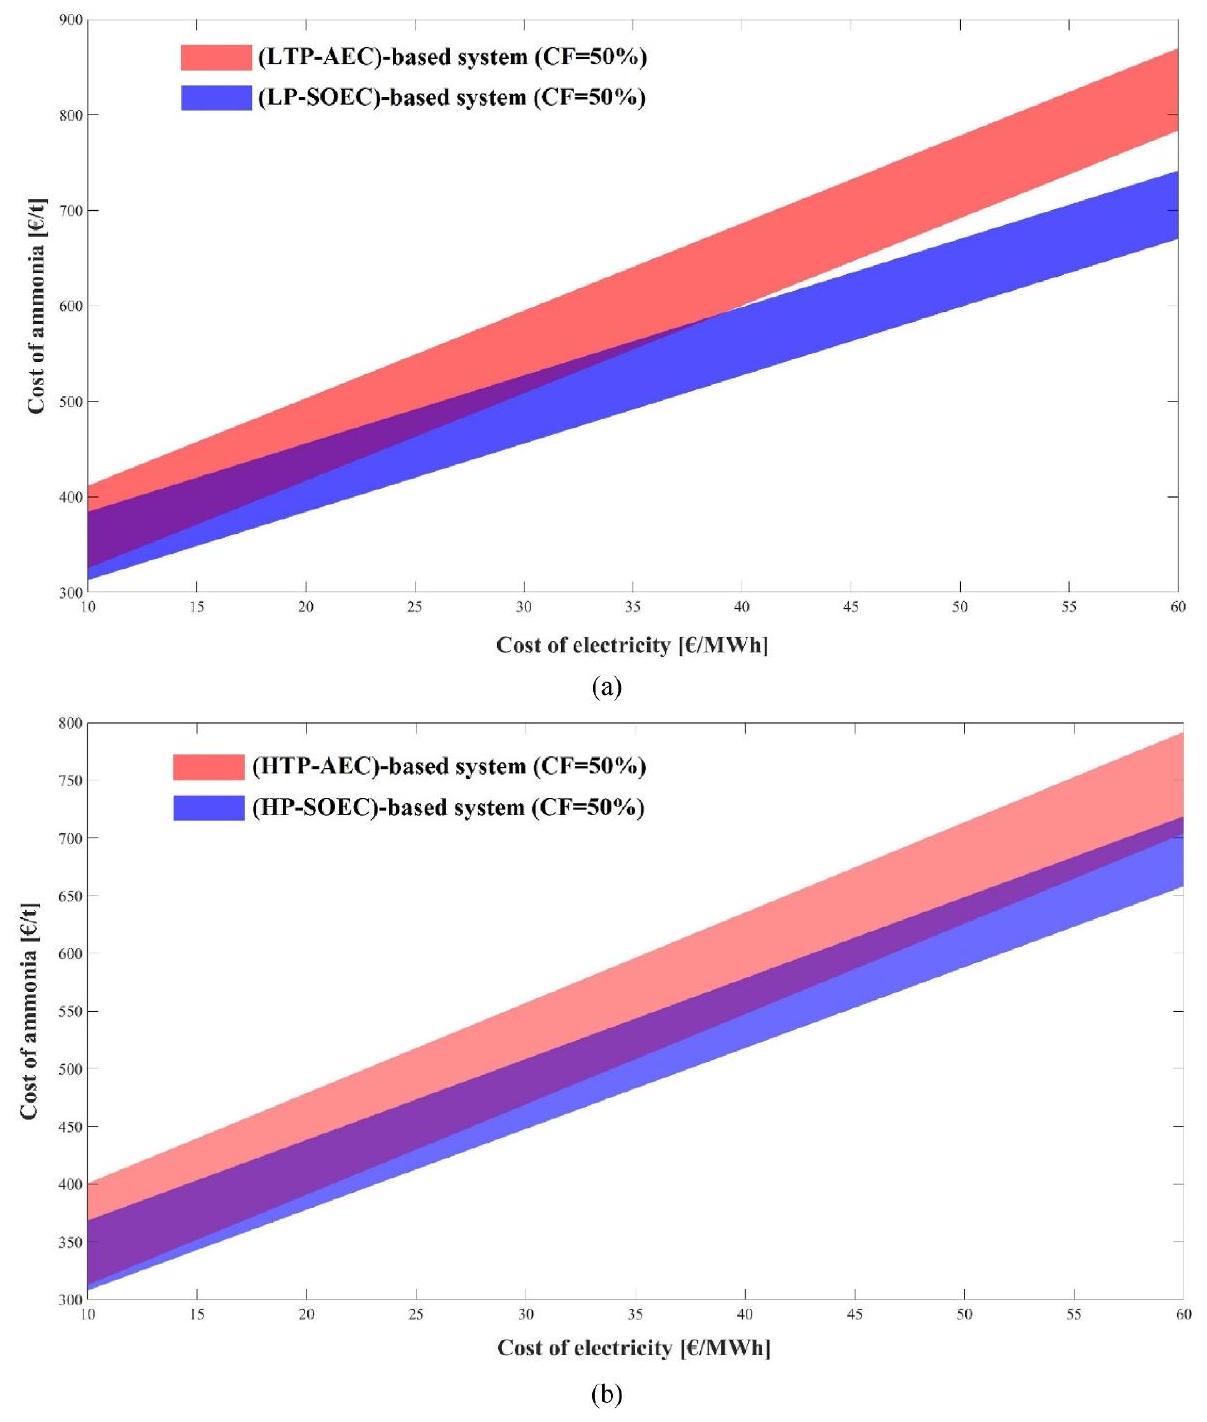
- By 2050, SOEC-based green ammonia is economically favorable compared with blue ammonia for LCOEs below 35 €/MWh.
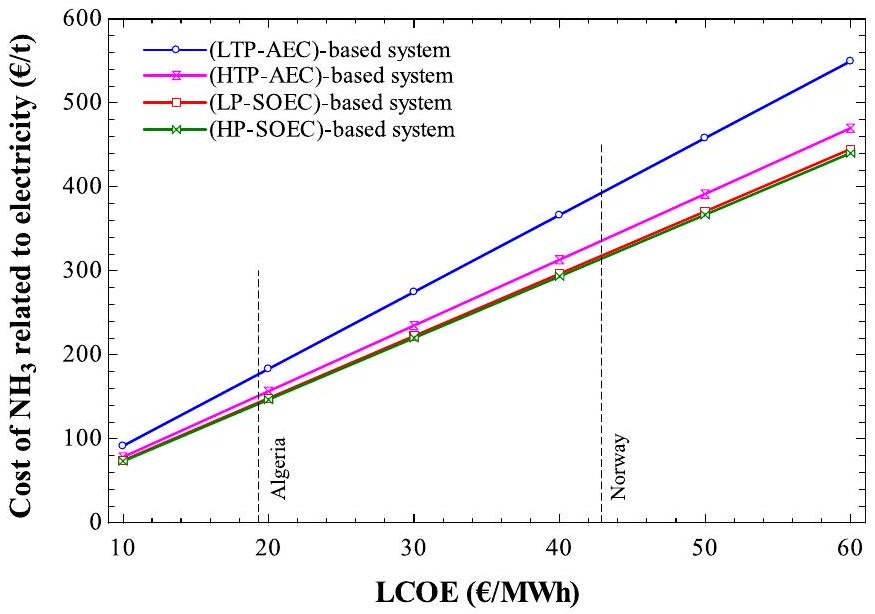
4.5. Sensitivity analysis
4.5.1. Effects of levelized cost of electricity (LCOE)
Cost of blue ammonia (LCOE
| NG price (€/MWh) | 10 (
|
30 (
|
||||
| Year | 2020 | 2030 | 2050 | 2020 | 2030 | 2050 |
| CCS cost (
|
133 | 107 | 87 | 133 | 107 | 87 |
| CCS cost ( €
|
128 | 103 | 84 | 128 | 103 | 84 |
| Share of CCS cost in the cost of blue ammonia (%) | 32 | 27 | 23 | 22 | 19 | 16 |
| Cost of grey ammonia without
|
275 | 275 | 275 | 450 | 450 | 450 |
| Cost of blue ammonia without
|
403 | 378 | 359 | 578 | 553 | 534 |
produced amount of hydrogen). Consequently, the system equipped with HP-SOEC has slightly better economic performance.
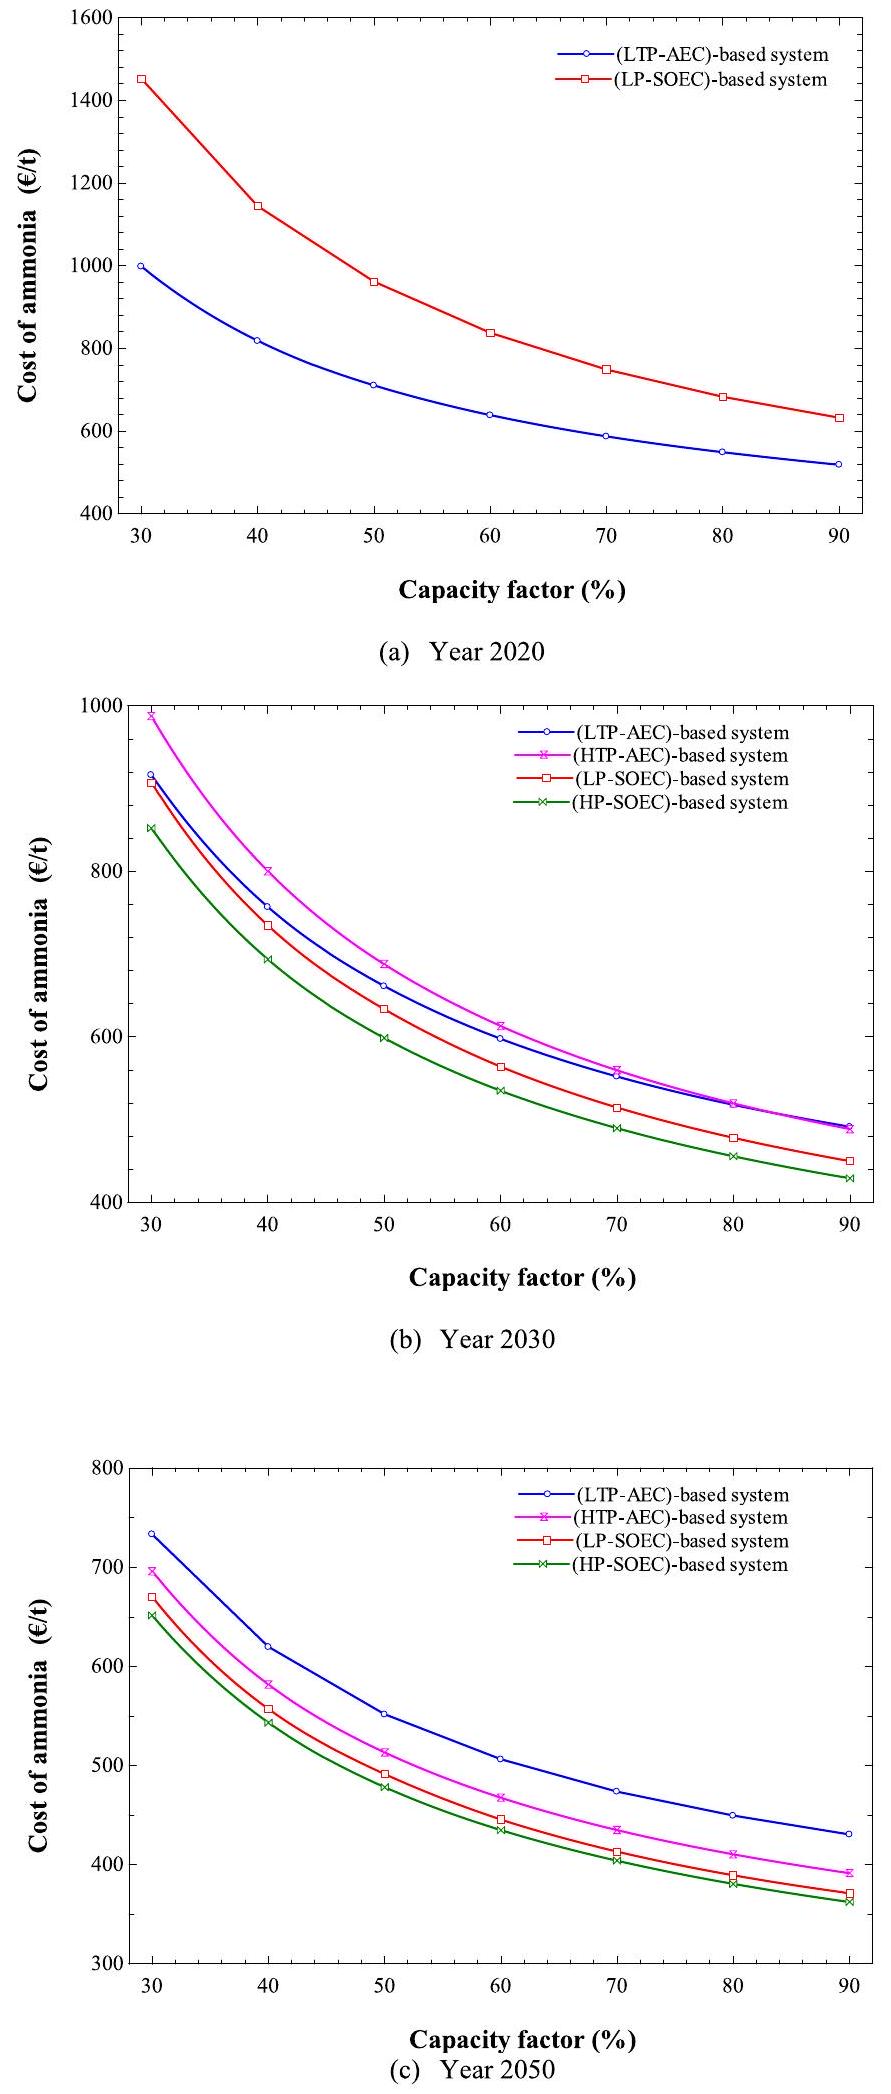
4.5.2. Effects of capacity factor
4.5.3. Effects of the estimated CAPEX
even more so.
As shown in Fig. 11(a), in 2050, assuming a capacity factor of
5. Conclusion
- The overall efficiency of
and is obtained for the system designed based on LTP-AEC, HTP-AEC, LP-SOEC and HPSOEC, respectively.
- Although SOEC performs efficiently compared with AEC, employing this technology to produce green ammonia is not economically favorable before the cost of SOEC is decreased to
(assuming a capacity factor of , LCOE of and AEC CAPEX of ) through, e.g., upscaled manufacturing. - By 2030 and 2050, upscaled manufacturing and technology improvements are expected to decrease the cost of the SOEC. Therefore, employing SOEC in a green ammonia producing system appears to be economically favorable to the AEC in this analysis.
- By 2050, assuming a LCOE of
and a capacity factor of 50 %, a green ammonia cost of 495 €/ton is projected, produced with a pressurized SOEC-based system.
- With a LCOE of
, a capacity factor of and a NG price of , a tax of is required for green ammonia to be cost comparable with grey ammonia. - By 2050, with
as the projected NG price, implementing a tax of would make SOEC-based green ammonia cost-competitive even for a LCOE value as high as 60 €/MWh. - By 2050, assuming a projected NG price of
and a capacity factor of for green ammonia plant, the cost of green ammonia produced with the SOEC-based system will be competitive with grey and blue ammonia for LCOE values lower than 25 and , respectively.
- By 2050, for LCOE values of higher than
, the (LP-SOEC)based system produces cheaper ammonia, even assuming higher CAPEX (600 €/kW) for LP-SOEC and lower CAPEX for LTP-AEC ( ) compared to the base case values. - By 2050 , increasing the capacity factor from 30 to
decreases the cost of green ammonia by almost .
detailed economic analysis should be undertaken at specific sites with distinct weather profiles, as these factors may influence the economic conclusions presented herein. Therefore, these economic assessments should be regarded only as guidelines. The potential error in this investigation might arise from the projected 2030 and 2050 CAPEX values for emerging electrolysis technologies. However, it is noteworthy that since the cost of consumed electricity largely determines the green ammonia price, this factor may not significantly alter the economic conclusions presented in this research.
CRediT authorship contribution statement
Declaration of competing interest
Data availability
Acknowledgments
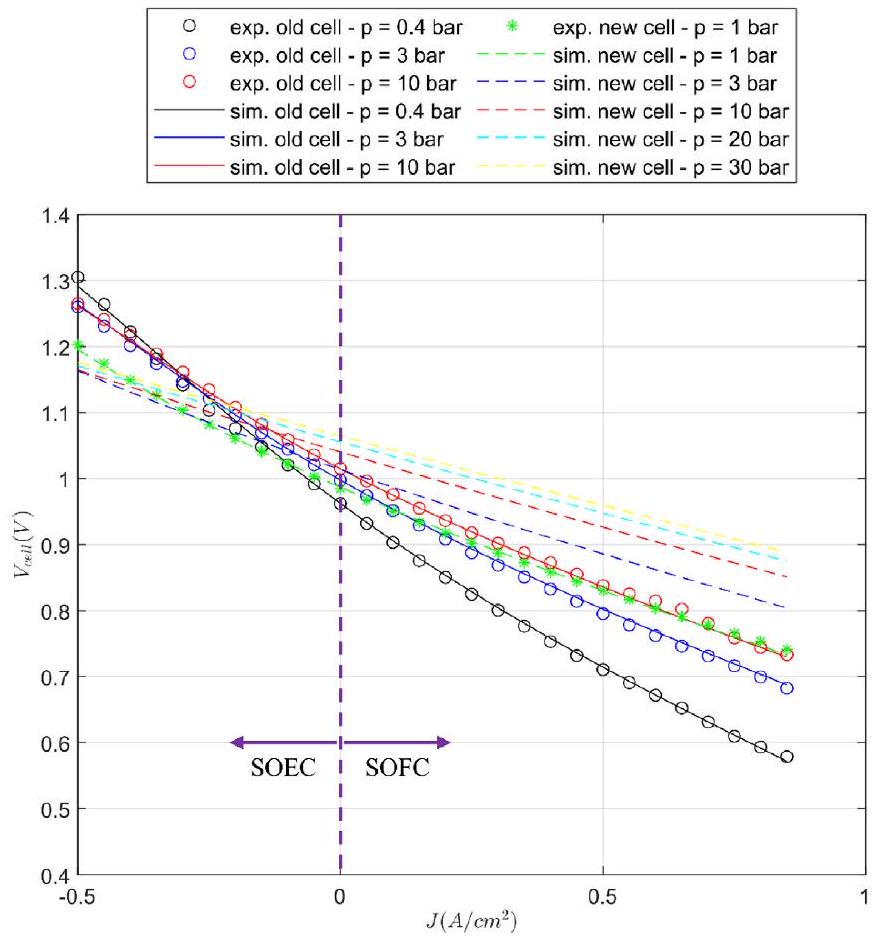
Appendix. Cell model for the SOEC
Parameters utilized in SOEC modeling
| Parameter | Value | ||
| Operating temperature [72] (
|
750 | ||
| Operating pressure [72] (bar) |
|
||
| Hydrogen mole fraction at the cathode inlet [72] | 0.5 | ||
| Oxygen mole fraction at the anode inlet [72] | 1 | ||
| Height of the anode electrode (m) |
|
||
| Height of the cathode electrode (m) |
|
||
| Mean pore diameter of the anode electrode [36] (m) |
|
||
| Mean pore diameter of the cathode electrode [36] (m) |
|
||
| Number of exchanged electrons in the reactions [37] | 2 | ||
| Permeability of the electrodes [36] (m2) | 10-13 |
here,
Optimum values of the fitting parameters
| Parameter | Value – old cell | Value – new cell |
| Constant of the prefactor used for the anode exchange current density (
|
|
|
| Constant of the prefactor used for the cathode exchange current density (
|
|
|
| Activation energy used for the anode exchange current density (
|
|
|
| Activation energy used for the cathode exchange current density (
|
|
|
| Charge transfer coefficient of the anode reaction (
|
0.6573 | 0.8303 |
| Charge transfer coefficient of the cathode reaction (
|
0.5000 | 0.7725 |
| Power of the oxygen partial pressure used for the anode exchange current density (m) | 0.1853 | 0.1825 |
| Power of the hydrogen partial pressure used for the cathode exchange current density (a) | -0.2154 | -0.0583 |
| Power of the steam partial pressure used for the cathode exchange current density (b) | 0.3143 | 0.4881 |
| Correction factor for the diffusion coefficients of the species in the anode porous media (
|
0.0995 | 0.1996 |
| Correction factor for the diffusion coefficients of the species in the cathode porous media (
|
0.0201 | 0.1695 |
| Material-specific constant used for the ohmic overpotential (
|
|
|
| Activation energy used for the ohmic overpotential (
|
|
|
References
[2] Li G, et al. Research progress in green synthesis of ammonia as hydrogen-storage carrier under ‘hydrogen 2.0 economy. Clean Energy 2023;7(1):116-31. https:// doi.org/10.1093/ce/zkac095.
[3] Laval Alfa, Hafnia Haldor, Topsoe Vestas, Gamesa Siemens. Ammonfuel-an industrial view of ammonia as a marine fuel. Hafnia 2020;(August):1-59.
[4] Bartels JR. A feasibility study of implementing an Ammonia Economy. Ames: Digital Repository @ Iowa State University; 2008. https://doi.org/10.31274/etd-180810-1374.
[5] Kurien C, Mittal M. Review on the production and utilization of green ammonia as an alternate fuel in dual-fuel compression ignition engines. Energy Convers Manag 2022;251(August 2021):114990. https://doi.org/10.1016/j. enconman.2021.114990.
[6] Aziz M, Wijayanta AT, Nandiyanto ABD. Ammonia as effective hydrogen storage: a review on production, storage and utilization. Energies Jun. 2020;13(12):3062. https://doi.org/10.3390/en13123062.
[7] Cesaro Z, Ives M, Nayak-Luke R, Mason M, Bañares-Alcántara R. Ammonia to power: Forecasting the levelized cost of electricity from green ammonia in largescale power plants. Appl Energy Jan. 2021;282:116009. https://doi.org/10.1016/ J.APENERGY.2020.116009.
[8] Wang Y, Zhou X, Liu L. Theoretical investigation of the combustion performance of ammonia/hydrogen mixtures on a marine diesel engine. Int J Hydrogen Energy Apr. 2021;46(27):14805-12. https://doi.org/10.1016/j.ijhydene.2021.01.233.
[9] Mallouppas G, Ioannou C, Yfantis EA. A review of the latest trends in the Use of green ammonia as an energy carrier in maritime industry. Energies 2022;15(4). https://doi.org/10.3390/en15041453.
[10] Campion N, Nami H, Swisher P, Vang Hendriksen P, Münster M. Techno-economic assessment of green ammonia production with different wind and solar potentials. SSRN Electron J 2022. https://doi.org/10.2139/SSRN. 4154006.
[11] Florez J, AlAbbad M, Vazquez-Sanchez H, Morales MG, Sarathy SM. Optimizing islanded green ammonia and hydrogen production and export from Saudi Arabia. Int J Hydrogen Energy Feb. 2024;56:959-72. https://doi.org/10.1016/J. IJHYDENE. 2023.12.075.
[12] Frattini D, Cinti G, Bidini G, Desideri U, Cioffi R, Jannelli E. A system approach in energy evaluation of different renewable energies sources integration in ammonia production plants. Renew Energy Dec. 2016;99:472-82. https://doi.org/10.1016/ j.renene.2016.07.040.
[13] Mortensen AW, Mathiesen BV, Hansen AB, Pedersen SL, Grandal RD, Wenzel H. The role of electrification and hydrogen in breaking the biomass bottleneck of the renewable energy system – a study on the Danish energy system. Appl Energy Oct. 2020;275:115331. https://doi.org/10.1016/j.apenergy.2020.115331.
[14] Zhang H, Wang L, Van herle J, Maréchal F, Desideri U. Techno-economic comparison of green ammonia production processes. Appl Energy Feb. 2020;259: 114135. https://doi.org/10.1016/j.apenergy.2019.114135.
[15] Bicer Y, Dincer I. Life cycle assessment of nuclear-based hydrogen and ammonia production options: a comparative evaluation. Int J Hydrogen Energy Aug. 2017; 42(33):21559-70. https://doi.org/10.1016/j.ijhydene.2017.02.002.
[16] Al-Zareer M, Dincer I, Rosen MA. Transient analysis and evaluation of a novel pressurized multistage ammonia production system for hydrogen storage purposes. J Clean Prod Sep. 2018;196:390-9. https://doi.org/10.1016/j. jclepro.2018.06.022.
[17] Nowicki DA, Agnew GD, Irvine JTS. Green ammonia production via the integration of a solid oxide electrolyser and a Haber-Bosch loop with a series of solid electrolyte oxygen pumps. Energy Convers Manag Mar. 2023;280:116816. https:// doi.org/10.1016/j.enconman.2023.116816.
[18] Egerer J, Grimm V, Niazmand K, Runge P. The economics of global green ammonia trade – ‘Shipping Australian wind and sunshine to Germany. Appl Energy Mar. 2023;334:120662. https://doi.org/10.1016/j.apenergy.2023.120662.
[19] Hatton L, Bañares-Alcántara R, Sparrow S, Lott F, Salmon N. Assessing the impact of climate change on the cost of production of green ammonia from offshore wind. Int J Hydrogen Energy Jan. 2024;49:635-43. https://doi.org/10.1016/J. IJHYDENE. 2023.10.117.
[20] Driscoll H, Salmon N, Bañares-Alcántara R. Technoeconomic evaluation of offshore green ammonia production using tidal and wind energy: a case study. Energy Sources, Part A Recovery, Util Environ Eff Aug. 2023;45(3):7222-44. https://doi. org/10.1080/15567036.2023.2220670.
[21] Armijo J, Philibert C. Flexible production of green hydrogen and ammonia from variable solar and wind energy: case study of Chile and Argentina. Int J Hydrogen Energy Jan. 2020;45(3):1541-58. https://doi.org/10.1016/j. ijhydene.2019.11.028.
[22] Ozturk M, Dincer I. An integrated system for ammonia production from renewable hydrogen: a case study. Int J Hydrogen Energy Jan. 2020. https://doi.org/ 10.1016/j.ijhydene.2019.12.127.
[23] Fúnez Guerra C, Reyes-Bozo L, Vyhmeister E, Jaén Caparrós M, Salazar JL, Clemente-Jul C. Technical-economic analysis for a green ammonia production plant in Chile and its subsequent transport to Japan. Renew Energy Sep. 2020;157: 404-14. https://doi.org/10.1016/j.renene.2020.05.041.
[24] Osman O, Sgouridis S, Sleptchenko A. Scaling the production of renewable ammonia: a techno-economic optimization applied in regions with high insolation. J Clean Prod Oct. 2020;271:121627. https://doi.org/10.1016/j. jclepro.2020.121627.
[25] Siddiqui O, Dincer I. A new solar energy system for ammonia production and utilization in fuel cells. Energy Convers Manag Mar. 2020;208:112590. https://doi. org/10.1016/j.enconman.2020.112590.
[26] Ikäheimo J, Kiviluoma J, Weiss R, Holttinen H. Power-to-ammonia in future North European 100 % renewable power and heat system. Int J Hydrogen Energy Sep. 2018;43(36):17295-308. https://doi.org/10.1016/j.ijhydene.2018.06.121.
[27] Bicer Y, Dincer I. Exergoeconomic analysis and optimization of a concentrated sunlight-driven integrated photoelectrochemical hydrogen and ammonia production system. Int J Hydrogen Energy Jul. 2019;44(34):18875-90. https:// doi.org/10.1016/j.ijhydene.2018.10.074.
[28] Lee B, Lim D, Lee H, Lim H. Which water electrolysis technology is appropriate?: Critical insights of potential water electrolysis for green ammonia production. Renew Sustain Energy Rev Jun. 2021;143:110963. https://doi.org/10.1016/J. RSER.2021.110963.
[29] Pawar ND, et al. Potential of green ammonia production in India. Int J Hydrogen Energy Aug. 2021;46(54):27247-67. https://doi.org/10.1016/J. IJHYDENE. 2021.05.203.
[30] Morgan ER. Techno-economic feasibility study of ammonia plants powered by offshore wind. Amherst: University of Massachusetts; 2013. https://doi.org/ 10.7275/11KT-3F59.
[31] Nami H, Rizvandi OB, Chatzichristodoulou C, Hendriksen PV, Frandsen HL. Techno-economic analysis of current and emerging electrolysis technologies for green hydrogen production. Energy Convers. Manag. Oct. 2022;269:116162. https://doi.org/10.1016/J.ENCONMAN.2022.116162.
[32] AlZahrani AA, Dincer I. Thermodynamic and electrochemical analyses of a solid oxide electrolyzer for hydrogen production. Int J Hydrogen Energy Aug. 2017;42 (33):21404-13. https://doi.org/10.1016/j.ijhydene.2017.03.186.
[33] Ni M, Leung MKH, Leung DYC. Energy and exergy analysis of hydrogen production by solid oxide steam electrolyzer plant. Int J Hydrogen Energy Dec. 2007;32(18): 4648-60. https://doi.org/10.1016/j.ijhydene.2007.08.005.
[34] Mohammadi A, Mehrpooya M. Thermodynamic and economic analyses of hydrogen production system using high temperature solid oxide electrolyzer integrated with parabolic trough collector. J Clean Prod Mar. 2019;212:713-26. https://doi.org/10.1016/j.jclepro.2018.11.261.
[35] Navasa M, Miao XY, Frandsen HL. A fully-homogenized multiphysics model for a reversible solid oxide cell stack. Int J Hydrogen Energy 2019;44(41):23330-47. https://doi.org/10.1016/j.ijhydene.2019.06.077.
[36] Navasa M, Graves C, Chatzichristodoulou C, Løye Skafte T, Sundén B, Lund Frandsen H. A three dimensional multiphysics model of a solid oxide electrochemical cell: a tool for understanding degradation. Int J Hydrogen Energy 2018;43(27):11913-31. https://doi.org/10.1016/j.ijhydene.2018.04.164.
[37] Leonide A, Apel Y, Ivers-Tiffee E. SOFC modeling and parameter Identification by means of impedance Spectroscopy. ECS Trans 2019;19(20):81-109. https://doi. org/10.1149/1.3247567.
[38] Ni M, Leung MKH, Leung DYC. Parametric study of solid oxide steam electrolyzer for hydrogen production. Int J Hydrogen Energy Sep. 2007;32(13):2305-13. https://doi.org/10.1016/j.ijhydene.2007.03.001.
[39] Liu S, Kong W, Lin Z. Three-dimensional modeling of planar solid oxide fuel cells and the rib design optimization. J Power Sources 2009;194(2):854-63. https://doi. org/10.1016/j.jpowsour.2009.06.056.
[40] Bernadet L, Gousseau G, Chatroux A, Laurencin J, Mauvy F, Reytier M. Influence of pressure on solid oxide electrolysis cells investigated by experimental and modeling approach. Int J Hydrogen Energy 2015;40(38):12918-28. https://doi. org/10.1016/j.ijhydene.2015.07.099.
[41] Tremel A. Electricity-based fuels. In: SpringerBriefs in applied Sciences and technology. Cham: Springer International Publishing; 2018. https://doi.org/ 10.1007/978-3-319-72459-1.
[42] Zeng K, Zhang D. Recent progress in alkaline water electrolysis for hydrogen production and applications. Prog Energy Combust Sci Jun. 2010;36(3):307-26. https://doi.org/10.1016/J.PECS.2009.11.002.
[43] Marini S, et al. Advanced alkaline water electrolysis. Electrochim Acta Nov. 2012; 82:384-91. https://doi.org/10.1016/J.ELECTACTA.2012.05.011.
[44] HyProvide large-scale Al-kaline electrolyser (MW), EUDP 11-II, 64011-0105. 2016.
[45] Economic and Efficient Electrolytic Hydrogen production (2017-2021) – DTU Energy – ELE.” Accessed: Jul. 08, 2021. [Online]. Available: https://www.ele.ene rgy.dtu.dk/Projects/EEEHy.
[46] Frattini D, Cinti G, Bidini G, Desideri U, Cioffi R, Jannelli E. A system approach in energy evaluation of different renewable energies sources integration in ammonia production plants. Renew Energy Dec. 2016;99:472-82. https://doi.org/10.1016/ J.RENENE.2016.07.040.
[47] Flórez-Orrego D, de Oliveira Junior S. Modeling and optimization of an industrial ammonia synthesis unit: an exergy approach. Energy Oct. 2017;137:234-50. https://doi.org/10.1016/J.ENERGY.2017.06.157.
[48] Rao KP, Ramesh Bhat N, Jönsson J. First industrial experience – Safe start-up of KM 111 at Mangalore chemicals and fertilizers limited. Ammonia Plant Safety and Related Facilities 2017;2017:247-56.
[49] Schmidt O, Gambhir A, Staffell I, Hawkes A, Nelson J, Few S. Future cost and performance of water electrolysis: an expert elicitation study. Int J Hydrogen Energy Dec. 2017;42(52):30470-92. https://doi.org/10.1016/j. ijhydene.2017.10.045.
[50] Akrami E, Ameri M, Rocco MV, Sanvito FD, Colombo E. Thermodynamic and exergo-economic analyses of an innovative semi self-feeding energy system synchronized with waste-to-energy technology. Sustain Energy Technol Assessments Aug. 2020;40:100759. https://doi.org/10.1016/j.seta.2020.100759.
[51] Nami H, Mahmoudi SMS, Nemati A. Exergy, economic and environmental impact assessment and optimization of a novel cogeneration system including a gas
turbine, a supercritical CO2 and an organic Rankine cycle (GT-HRSG/SCO2). Appl Therm Eng Jan. 2017;110:1315-30. https://doi.org/10.1016/j. applthermaleng.2016.08.197.
[52] Bejan A, Tsatsaronis G. Thermal design and optimization. John Wiley & Sons; 1996.
[53] Turton R, Bailie RC, Whiting WB, Shaeiwitz JA. Analysis, synthesis and design of chemical processes. fourth ed. Prentice Hall: Prentice Hall international series in the physical and chemical engineering sciences; 2012.
[54] Rizvandi OB, Frandsen HL. Modeling of single- and double-sided high-pressure operation of solid oxide electrolysis stacks. Int J Hydrogen Energy Sep. 2023;48 (77):30102-19. https://doi.org/10.1016/J.IJHYDENE.2023.04.169.
[55] Nayak-Luke RM, Bañares-Alcántara R. Techno-economic viability of islanded green ammonia as a carbon-free energy vector and as a substitute for conventional production. Energy Environ Sci 2020;13(9):2957-66. https://doi.org/10.1039/ d0ee01707h.
[56] International Energy Agency (IEA). The future of hydrogen. Paris: IEA; 2019. https://doi.org/10.1787/1e0514c4-en. https://www.iea.org/reports/the-future-of -hydrogen.
[57] Ammonia production causes
[58] Yadav D, Banerjee R. Economic assessment of hydrogen production from solar driven high-temperature steam electrolysis process. J Clean Prod May 2018;183: 1131-55. https://doi.org/10.1016/j.jclepro.2018.01.074.
[59] Dotzauer E. Greenhouse gas emissions from power generation and consumption in a nordic perspective. Energy Pol Feb. 2010;38(2):701-4. https://doi.org/10.1016/ j.enpol.2009.10.066.
[60] EU Natural Gas | 2022 Data | 2023 Forecast | 2010-2021 Historical | Price | Quote.” Accessed: Jan. 26, 2022. [Online]. Available: https://tradingeconomics.co m/commodity/eu-natural-gas.
[61] Arnaiz del Pozo C, Cloete S. Techno-economic assessment of blue and green ammonia as energy carriers in a low-carbon future. Energy Convers Manag 2022; 255(January):115312. https://doi.org/10.1016/j.enconman.2022.115312.
[62] International Energy Agency (IEA), “The Role of E-fuels in Decarbonising Transport.” Accessed: Feb. 01, 2024. [Online]. Available: https://iea.blob.core. windows.net/assets/9e0c82d4-06d2-496b-9542-f184ba803645/TheRoleofE-fuel sinDecarbonisingTransport.pdf.
[63] T. Brown, “Carbon intensity of fossil ammonia in a net-zero world.” Accessed: May 30, 2022. [Online]. Available: https://www.ammoniaenergy.org/articles/carbon -intensity-of-fossil-ammonia-in-a-net-zero-world/.
[64] Haugen HA, Eldrup NH, Fatnes AM, Leren E. Commercial capture and transport of CO2 from production of ammonia. In: Energy Procedia. Elsevier; Jul. 2017. p. 6133-40. https://doi.org/10.1016/j.egypro.2017.03.1750.
[65] Næss-Schmidt S, Jensen HN, Münier LL, Lutz J. CO2-TAXES, FUEL PRICES AND LEARNING RATES Contribution from Copenhagen economics to the MarE-fuel project. 2021.
[66] International Renewable Energy Agency. Renewable power generation costs in 2020. ISBN 978-92-9260-348-9. Abu Dhabi: International Renewable Energy Agency; 2021.
[67] International Energy Agency (IEA). Levelised cost of electricity calculator. Paris: IEA and NEA; 2020. https://www.iea.org/articles/levelised-cost-of-electricity-calc ulator.
[68] International energy Agency (IEA), sectoral electricity price distributions. Paris: IEA; 2019. https://www.iea.org/data-and-statistics/charts/sectoral-electricity-pri ce-distributions-2019.
[69] International Energy Agency (IEA), Industry end-user electricity prices in selected OECD countries. Paris: IEA; 2019. https://www.iea.org/data-and-statistics/charts /industry-end-user-electricity-prices-in-selected-oecd-countries-2019.
[70] Campion NJB, Backer M, Swisher PR, Münster M. MarE-fuel: LCOE and optimal electricity supply strategies for P2X plants. 2021.
[71] International Energy Agency (IEA). Projected costs of generating electricity 2020 edition. 2020. https://doi.org/10.1787/9789264008274-en.
[72] Jensen SH, Sun X, Ebbesen SD, Knibbe R, Mogensen M. Hydrogen and synthetic fuel production using pressurized solid oxide electrolysis cells. Int J Hydrogen Energy 2010;35(18):9544-9. https://doi.org/10.1016/j.ijhydene.2010.06.065.
[73] Sun X, Hendriksen PV, Mogensen MB, Chen M. Degradation in solid oxide electrolysis cells during long term Testing. Fuel Cell Dec. 2019;19(6):740-7. https://doi.org/10.1002/fuce. 201900081.
[74] Jensen SH, Sun X, Ebbesen SD, Chen M. Pressurized operation of a planar solid oxide cell stack. Fuel Cell Apr. 2016;16(2):205-18. https://doi.org/10.1002/ fuce. 201500180.
[75] Henke M, Willich C, Kallo J, Friedrich KA. Theoretical study on pressurized operation of solid oxide electrolysis cells. Int J Hydrogen Energy Aug. 2014;39(24): 12434-9. https://doi.org/10.1016/j.ijhydene.2014.05.185.
- General rights
Copyright and moral rights for the publications made accessible in the public portal are retained by the authors and/or other copyright owners and it is a condition of accessing publications that users recognise and abide by the legal requirements associated with these rights.- Users may download and print one copy of any publication from the public portal for the purpose of private study or research.
- You may not further distribute the material or use it for any profit-making activity or commercial gain
- You may freely distribute the URL identifying the publication in the public portal
If you believe that this document breaches copyright please contact us providing details, and we will remove access to the work immediately and investigate your claim. - Corresponding author. Department of Energy Conversion and Storage, Technical University of Denmark (DTU), Building 310, Fysikvej, DK-2800, Lyngby, Denmark.
E-mail address: hon@igt.sdu.dk (H. Nami).Proton Exchange Membrane Electrolyzer.
with solar radiation of .
photoelectrochemical water splitting.
This is solar energy to ammonia efficiency.