الري هو ممارسة لإدارة الأراضي لها تأثيرات بيئية كبيرة. ومع ذلك، لا تزال استهلاك الطاقة العالمي وانبعاثات الكربون الناتجة عن الري غير معروفة. نقوم بتقييم استهلاك الطاقة العالمي وانبعاثات الكربون المرتبطة بالري، بينما نقوم أيضًا بقياس التخفيضات المحتملة في الطاقة والكربون التي يمكن تحقيقها من خلال اعتماد ممارسات ري فعالة ومنخفضة الكربون. حاليًا، يساهم الري بـ 216 مليون طن متري منالانبعاثات وتستهلك 1896 بيتاجول من الطاقة سنويًا، مما يمثل 15% من انبعاثات غازات الدفيئة والطاقة المستخدمة في العمليات الزراعية. على الرغم من أن فقطالزراعة المروية تعتمد على مصادر المياه الجوفية، وتضخ المياه الجوفية يمثلمن إجمالي استهلاك الطاقة في الري. تشير التوقعات إلى أن التوسع المستقبلي في الري قد يؤدي إلىزيادة في استهلاك الطاقة. إن اعتماد طرق الري عالية الكفاءة ومنخفضة الكربون لديه القدرة على تقليل استهلاك الطاقة إلى النصف وتقليلانبعاثات بواسطة. ومع ذلك، بالنظر إلى جدوى خيارات التخفيف الخاصة بكل بلد، العالميةقد ترى الانبعاثات فقط الخفض. تقدم أبحاثنا رؤى شاملة حول استهلاك الطاقة وانبعاثات الكربون المرتبطة بالري، مما يوفر معلومات قيمة يمكن أن توجه التقييمات حول جدوى الري في تعزيز القدرة التكيفية داخل القطاع الزراعي.
سبعون في المئة من سحوبات المياه على مستوى العالم ومن استهلاك المياه يُنسب إلى الزراعة المرويةتلعب الري دورًا محوريًا في ضمان الأمن الغذائي العالمي، مما يساهم فيإنتاج الغذاء العالمي مع استخدام فقطمن المناطق المزروعة على الكوكبمع تزايد التحديات الناتجة عن الاحتباس الحراري ونمو السكان، مما يزيد من القلق بشأن الأمن المائي والغذائي، تبرز الري كإجراء تكيفي حاسم لمعالجة أزمات الغذاء المستقبلية وآثار تغير المناخ..
حالياً، تعتمد الري على الطاقة المستندة إلى الوقود الأحفوري لضخ المياه، مما يؤدي إلى انبعاث غازات الدفيئة (GHGs).لقد قامت العديد من الدراسات بتحديد انبعاثات غازات الدفيئة ضمن الزراعة وأنظمة الغذاء، تغطي جوانب مثل استخدام الأراضيإنتاج واستخدام الأسمدة النيتروجينية الاصطناعيةالتخمير المعوي من إنتاج الثروة الحيوانيةوكل طيف إنتاج الغذاء، والنقل، والاستهلاكقدمت الدراسات السابقة مجموعات بيانات عالمية وإقليمية توضح انبعاثات غازات الدفيئة المتعلقة بالزراعة.. بالإضافة إلى ذلك، قامت الأبحاث السابقة بتقييم انبعاثات غازات الدفيئة غير المباشرة المرتبطة بالريمثل انبعاثات الميثان من الخزانات، والخنادق، والقنوات المستخدمة للريانبعاثات الميثان وأكسيد النيتروز من حقول الأرزوانبعاثات أكسيد النيتروز تحت كفاءات استخدام النيتروجين في الأسمدة المختلفة.
علاوة على ذلك، قدرت الدراسات السابقة استهلاك الطاقة للري وانبعاثات غازات الدفيئة الناتجة عن الري في الصين.الهندالمنطقة المتوسطيةباكستان، والولايات المتحدةومع ذلك، هناك فجوة ملحوظة في الدراسات التي تقدم تغطية عالمية لانبعاثات غازات الدفيئة المتعلقة بالطاقة الناتجة عن الري. وبالتالي، فإن مدى مساهمة انبعاثات غازات الدفيئة من الري في إجمالي انبعاثات غازات الدفيئة الزراعية، ودورها في جهود التخفيف من آثار تغير المناخ العالمية، لا يزال غير معروف إلى حد كبير. إن إجراء تحليل شامل وموزع عالميًا لاستهلاك الطاقة وانبعاثات غازات الدفيئة المرتبطة بأنظمة الري والضخ أمر ضروري لوضع استراتيجيات تخفيف فعالة نحو تحقيق الزراعة بصافي انبعاثات صفرية..
بينما كانت الجهود الرامية إلى تقليل انبعاثات غازات الدفيئة تركز بشكل أساسي على أنظمة الطاقة والصناعةالدراسات التي تتناول تقليل انبعاثات غازات الدفيئة في الزراعة، التي تمثلمن إجمالي انبعاثات غازات الدفيئة (ما يعادل في السنة، وقد حظيت باهتمام قليل نسبيًا. علاوة على ذلك، كان التركيز بشكل أساسي على تحسين كفاءة مياه الريبدلاً من تقليل استهلاك الطاقة بشكل نشط والانبعاثات. وبالتالي، هناك حاجة ملحة للتنمية المستدامة للزراعة المروية، تهدف إلى تعزيز إنتاج الغذاء مع تقليل الاعتماد على المياه والطاقة وانبعاثات غازات الدفيئة..
هنا، نقوم بت quantifying استهلاك الطاقة العالمي وانبعاثات الري التي تمتد من عام 2000 إلى 2010، مع معالجة الفجوة الحالية في فهم طاقة المزارع و الانبعاثات. نقوم بإجراء تحليل مكاني دقيق للطاقة وانبعاثات من كل من ضخ المياه السطحية والجوفية على نطاق عالمي، باستخدام دقةتتضمن تقييماتنا قياس استخدام الطاقة عبر أنظمة الري المختلفة – الري السطحي، والري بالرش، والري بالتنقيط – بالإضافة إلى أنظمة الضخ، بما في ذلك الضخ الكهربائي وضخ الديزل. ثم يتم تجميع النتائج مكانيًا لتحديد الطاقة على مستوى الدول وعلى المستوى العالمي. الانبعاثات المرتبطة بالري. ثانياً، نستكشف الظاهرة التي يحدث فيها أن المياه الجوفية، عند ضخها، قد تصبح مشبعة بشكل مفرط بالكربونات بالنسبة للضغط الجوي، مما يؤدي إلى فقدان الغاز بشكل مباشر الانبعاثات في الحقول المروية. وبالتالي، نقوم بت quantifyingالانبعاثات الناتجة عن تفريغ المياه الجوفية ومقارنة هذه الانبعاثات بتلك المتعلقة بالطاقة الناتجة عن الضخ. ثالثًا، تتناول دراستنا تقدير الطاقة المستقبلية والانبعاثات الناتجة عن توسيع الري المستدام في سيناريو فعال في استخدام المياه ومنخفض الكربون لعام 2050. يعتمد هذا التوسع على تلبية توفر المياه المحلية لطلب مياه الري تحت سيناريوهات الاحترار العالمي.رابعًا، نقيم فعالية التدخلات المختلفة للتخفيف ونقيم جدواها في تحقيق تقليل في الانبعاثات داخل أنظمة الري. أخيرًا، نقيم الطاقة وشدة الري، مقارنتها مع عمليات الزراعة الأخرى مثل الأسمدة والآلات.
النتائج
الطاقة وشدة انبعاثات الري
كثافة الطاقة وتظهر كثافة الانبعاثات المرتبطة بالري تباينات كبيرة عبر الدول والقارات (الشكل 1أ، ج). القيم المتوسطة لكثافة الطاقة وشدة الانبعاثات لكل وحدة من مساحة الري تبلغ و ها، على التوالي (الشكل 1أ، ج). تسجل آسيا أعلى كثافة للطاقة ( ) و كثافة الانبعاثات لكل هكتار )، تليها أفريقيا ( أمريكا الجنوبية، ) أمريكا الشمالية ( أوقيانوسيا ) وأوروبا ( ) (الشكل 1أ، ج).
تحليلنا يكشف أن متوسط استخدام الطاقة وشدة انبعاثات الري بالرش هي الأعلى )، تليها الري بالتنقيط ( ) والري السطحي ( ) (الشكل 1ب، د). بالإضافة إلى ذلك، استخدام الطاقة وشدة انبعاثات ضخ الديزل ) يتجاوز ذلك من الضخ الكهربائي ( ، ) (الشكل 1ب، د).
استهلاك الطاقة وانبعاثات من الري في 2000-2010
فحصنا لاستهلاك الطاقة وتظهر الانبعاثات الناتجة عن الري بين عامي 2000 و2010 تفاوتات كبيرة بين الدول والقارات (الشكل 2 والشكل التكميلي 4). إن استهلاك الطاقة العالمي المنسوب إلى الري هو 1896 بيجا جول، حيث تمثل آسيا وأمريكا الشمالية و على التوالي (الشكل 2 أ والشكل التكميلي 4 أ). في آسيا، تبرز الهند كأكبر مستهلك للطاقة بمقدار 535 بيجا جول، تليها الصين (299 بيجا جول)، باكستان (135 بيجا جول)، وإيران (121 بيجا جول)، مما يشكل، و من إجمالي استهلاك الطاقة في آسيا من الري، على التوالي (الشكل 2أ). في أمريكا الشمالية، تبرز الولايات المتحدة كأكبر مستهلك للطاقة بمقدار 205 بيجا جول، تليها المكسيك بمقدار 50 بيجا جول، مما يمثل و من استهلاك الطاقة في أمريكا الشمالية من الري، على التوالي (الشكل 2أ). ومن الجدير بالذكر أن خمس دول – الهند، الصين، الولايات المتحدة، باكستان، وإيران – تساهم بشكل جماعي فيمن استهلاك الطاقة العالمي من الري (الشكل 2أ).
العامالانبعاثات المرتبطة بالري تنبع من استهلاك الطاقة المتجسدة وإزالة الغازات من المياه الجوفية – إزالة المواد المذابةمن الماء من خلال إزالة الغازات (الشكل 2ب والأشكال التكميلية 4ب و5أ). تشير تقديراتنا إلى أن الإجمالي العالميانبعاثات الري تصل إلىفي السنة، معالناشئة من استهلاك الطاقة (الشكل 2ب) ومن إزالة الغازات من المياه الجوفية (الشكل التكميلي 5a). تظهر آسيا وأمريكا الشمالية كالمساهمين الرئيسيين فيانبعاثات، ينبعث و على التوالي، تشكل معًامن الإجمالي العالمي الانبعاثات. في المقابل، تساهم أوروبا وأفريقيا وأوقيانوسيا وأمريكا الجنوبية بمجموع إجمالي من فيما يتعلق بالري الانبعاثات (الشكل 2ب). بالإضافة إلى ذلك، فإن أعلى خمس دول لديها أعلى الانبعاثات الناتجة عن الري بسبب استهلاك الطاقة هي الهند، الصين، الولايات المتحدة، إيران، وباكستان، حيث تصدر، و سنويًا، على التوالي، تمثل عالميانبعاثات من استهلاك الطاقة.
عند النظر فيانبعاثات من تفريغ المياه الجوفية، تبرز الهند والولايات المتحدة كأكبر المساهمين، حيث تصدران 2.9 وعلى التوالي (الشكل التوضيحي 5أ). ومن الجدير بالذكر أنه في المناطق الرئيسية التي تستهلك كميات كبيرة من المياه للري في الولايات المتحدة والهند وباكستان وإيران والسعودية،تساهم انبعاثات من تفريغ المياه الجوفية بأكثر منمن الإجماليانبعاثات من الري (الشكل التوضيحي التكميلي 5ب).
استهلاك الطاقة في المستقبل وانبعاثات
الري المستدام هو ممارسات الري التي لا تستنزف مخزونات المياه الجوفية ولا تضر بالنظم البيئية للمياه العذبة.مع زيادة الاحتباس الحراري وطلب الغذاء، فإن توسيع الري المستدام يعد حلاً تكيفياً مهماً لأزمات الغذاء المستقبلية وتغير المناخ.إن توسيع نظام الري يؤدي حتمًا إلى استهلاك الطاقة والقضايا المتعلقة بالطاقة.الانبعاثات. لذلك، قمنا أيضًا بإجراء تقدير للطاقة و الانبعاثات المرتبطة بتوسع الري في المستقبل. افتراضنا هو أن الري سيتوسع في المناطق التي من المتوقع أن يتوفر فيها الماء محليًا لتلبية الطلب على مياه الري في مناخ يكون أكثر دفئًا – مستوى الاحترار المتوقع تحت سيناريوهات العمل كالمعتادنفترض أن كفاءة استخدام مياه الري المحددة لكل بلد، والتي تشمل أنظمة الري بالتنقيط والرش والري السطحي، تظل ثابتة في السيناريو المتوقع لتوسع الري المستدام في المستقبل. تشير تقديراتنا إلى أن الاستهلاك الإضافي للطاقة العالمية للري في المستقبل بسبب التوسع المستدام سيكون 536 بيجا جول، مما يمثل 28% من إجمالي استهلاك الطاقة للري في الفترة من 2000 إلى 2010 (الشكل 2أ والشكل التوضيحي 6أ).
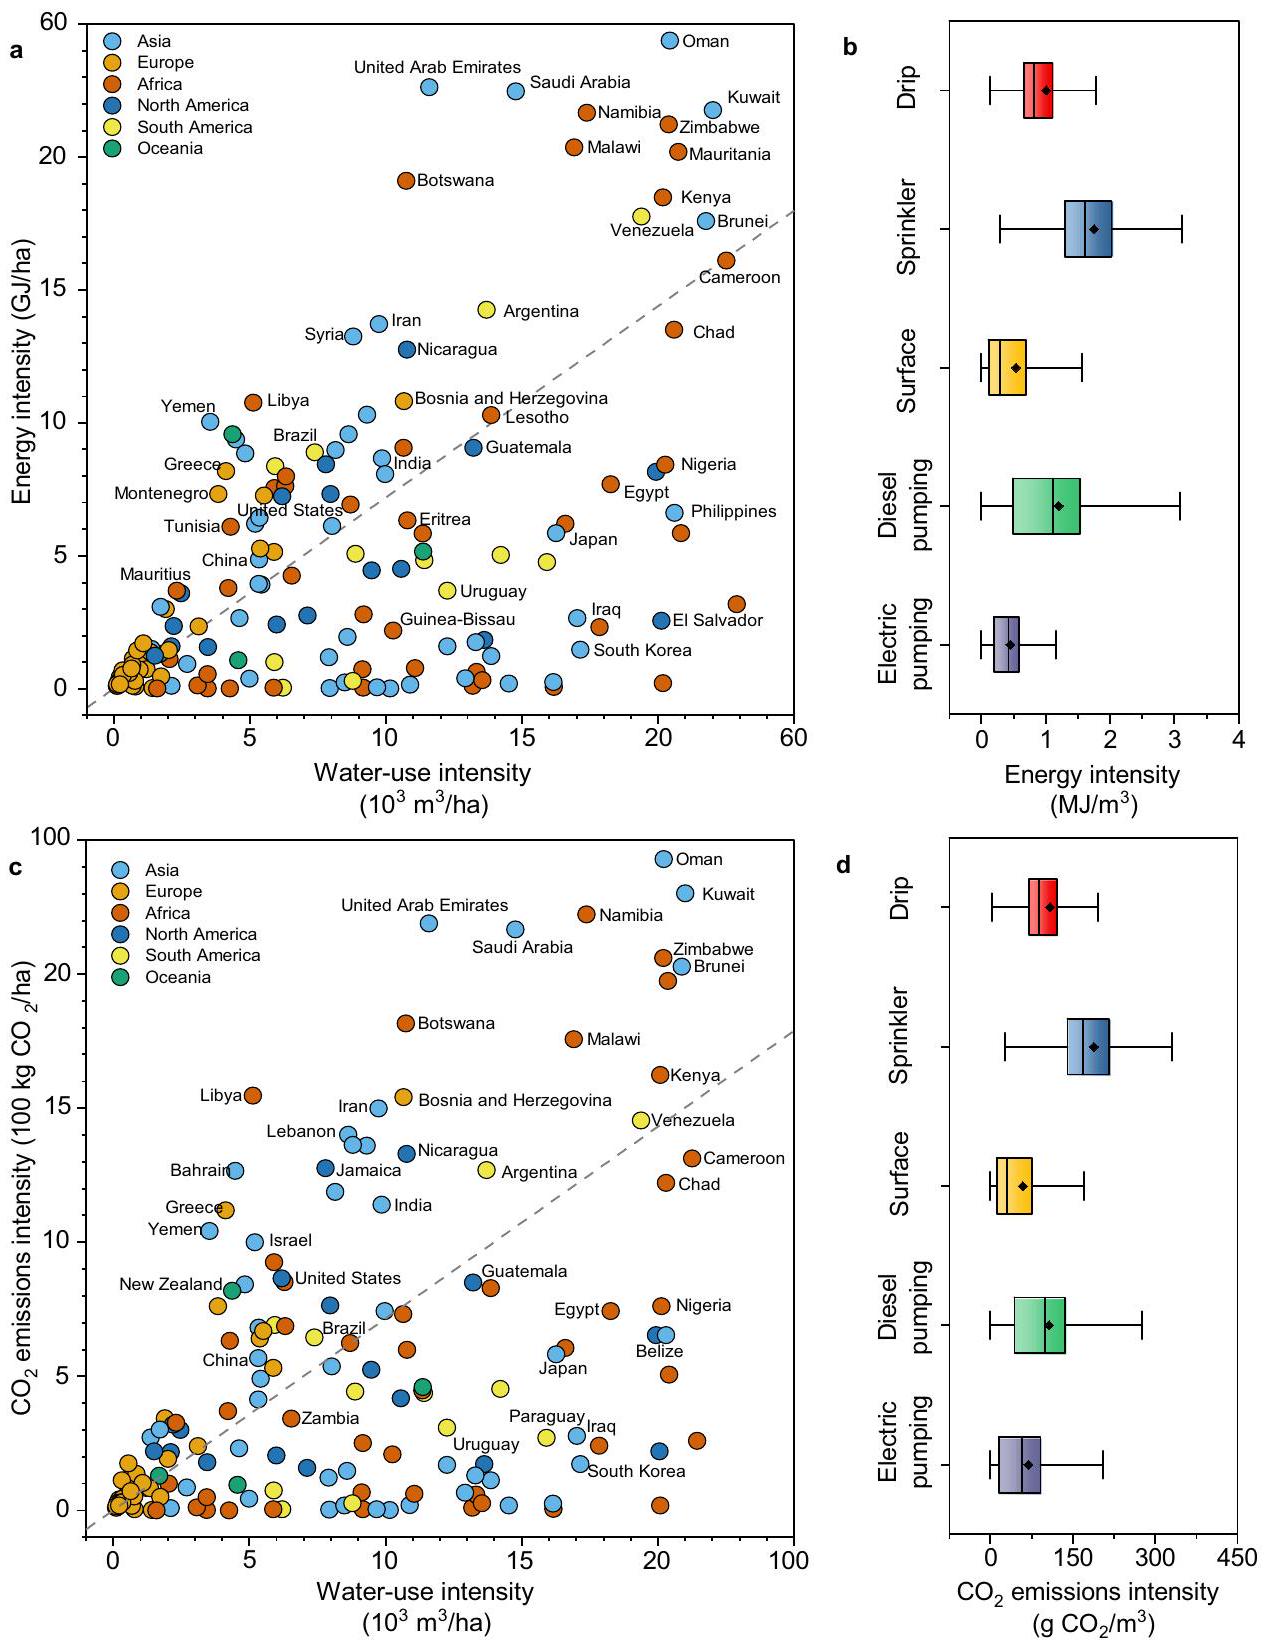
الشكل 1 | كثافة الطاقة وانبعاثات ثاني أكسيد الكربون كدالة لكثافة استخدام المياه لـ 159 دولة. يوضح الشكل مقارنة الطاقة وشدة الانبعاثات لأنظمة الري والمضخات المختلفة. أ يتم التعبير عن كثافة الطاقة كنسبة الطاقة المستهلكة للري إلى المساحة المروية في بلد ما (جيجا جول/هكتار). ب كثافة الطاقة لكل نظام ري (التنقيط، الرش، والسطحي) أو نظام مضخات (مضخات الديزل والمضخات الكهربائية).يمثل ( ) استهلاك الطاقة لخمس أنظمة ري وضخ مختلفة لضخ وتوصيل متر مكعب واحد من الماء.شدة الانبعاثات هي معبرًا عنه كنسبة لثاني أكسيد الكربون المنبعث من الري إلى المساحة المروية في بلد ( ). د الـتُعبر كثافة الانبعاثات لكل نظام ري أو نظام ضخ بنفس الطريقة التي تُعبر بها كثافة الطاقة (غ) ). الطاقة و تعكس كثافة الانبعاثات المستوى المتوسط خلال فترة 2000-2010. تُظهر القيم المتوسطة في الرسم البياني الصندوقي بالألماس، بينما تُظهر القيم الوسيطة بالخطوط الوسطى. تُستخدم الخطوط المتقطعة في الشكل لتمييز الدول التي تتجاوز أو تقل عن الوسيط في الطاقة وشدة الانبعاثات لكل وحدة من استخدام المياه.
في أمريكا الشمالية وأفريقيا وأمريكا الجنوبية، من المتوقع أن يتطلب استهلاك الطاقة الناتج عن توسيع الري المستدام 139 PJ و63 PJ و60 PJ إضافية، على التوالي، حيث يتجاوز كل منها 50% من استهلاكها الحالي للطاقة (الشكل 2a). ومن الجدير بالذكر أن أوروبا تتوقع استهلاك طاقة إضافي من توسيع الري المستدام يبلغ 148 PJ، وهو ما يعادل ضعف استهلاكها الحالي للطاقة (الشكل 2a). وتُعتبر الولايات المتحدة والهند وروسيا والبرازيل والمكسيك من بين الدول الأعلى في استهلاك الطاقة الناتج عن توسيع الري المستدام، حيث تساهم بـ 97 PJ و49 PJ و39 PJ و39 PJ و18 PJ، على التوالي، مما يمثل مجتمعة
45% من إجمالي استهلاك الطاقة من توسيع الري المستدام (الشكل 2أ).
افتراض الاعتماد الكامل على المضخات الكهربائية وكثافة الكربون الإقليمية المتوقعة للكهرباء فيالطاقة الإضافية المتعلقة بـتُقدَّر الانبعاثات الناتجة عن توسيع الري المستدام بـسنويًا، تشكل 7% من إجمالي الطاقة المتعلقة بالفترة من 2000 إلى 2010 الانبعاثات (الشكل 2ب والشكل التوضيحي 6ب). تظهر الهند وروسيا كأهم المساهمين في انبعاثات من توسيع الري المستدام، emitting 3 وسنويًا، على التوالي.
الشكل 2 | استهلاك الطاقة العالمي وانبعاثات ثاني أكسيد الكربون من الري. استهلاك الطاقة على مستوى الدول وتستند الانبعاثات إلى إحصائيات مجموع البكسل. استهلاك الطاقة (PJ سنويًا) خلال الفترة من 2000 إلى 2010 وتوسيع الري المستدام فيمناخ أكثر دفئًا. انبعاثات ثاني أكسيد الكربون (سنويًا) من استهلاك الطاقة بين 2000-2010 وتوسيع الري المستدام لـ مناخ أكثر دفئًا. اخترنا أفضل 20 دولة ذات أعلى استهلاك للطاقة و الانبعاثات. تمثل الرسوم البيانية الفرعية في الزاوية العليا اليمنى ملخصًا لاستهلاك الطاقة وانبعاثات حسب المناطق وكذلك على مستوى العالم. تم توفير خرائط التوزيع الجغرافي في الأشكال التكميلية 4 و 6.
توزيع الطاقة وانبعاثات
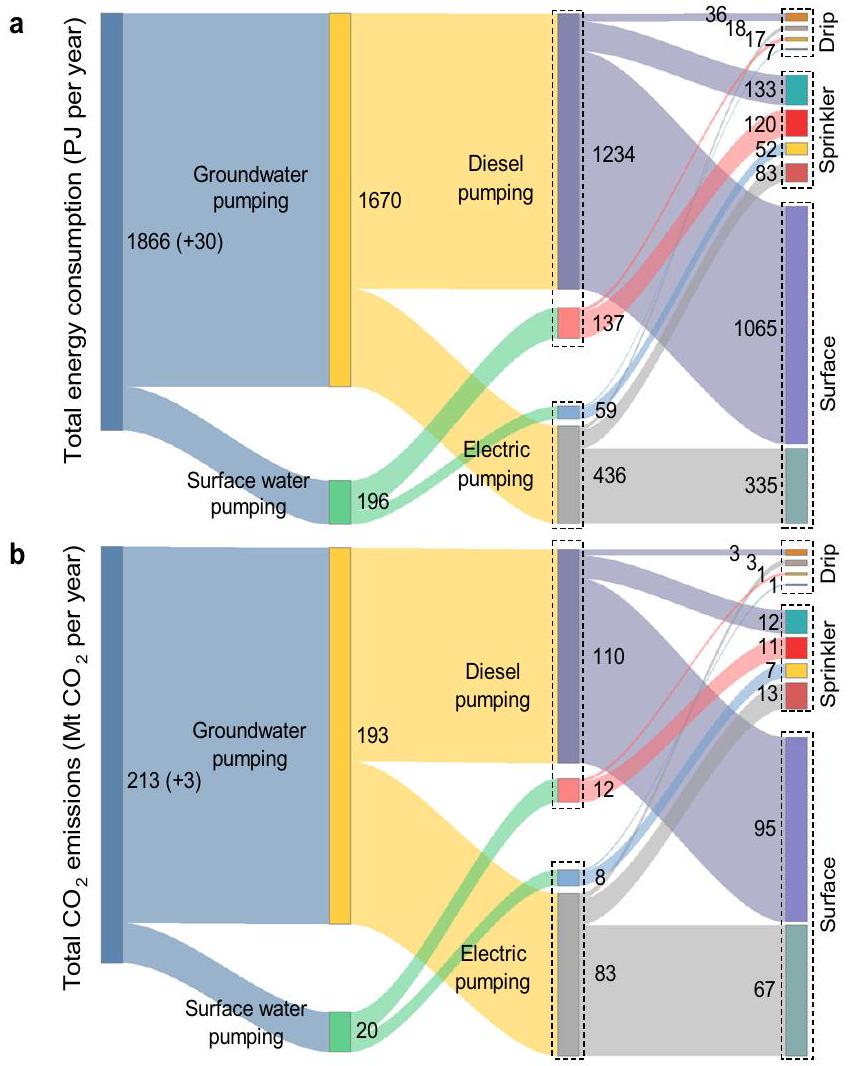
توضح الشكل 3 تدفق توزيع استهلاك الطاقة والطاقة المتعلقة على مستوى العالم الانبعاثات المدمجة في أنظمة الري وضخ المياه، إلى جانب مصادر مياه الري. على الرغم من أن فقط الزراعة المروية التي يتم تزويدها بالمياه الجوفيةيعتبر استهلاك الطاقة من ضخ المياه الجوفية (1670 بيجا جول في السنة) من إجمالي استهلاك الطاقة (الشكل 3أ). ضمن هذا، (1234 PJ سنويًا) من استهلاك الطاقة يُعزى إلى ضخ الديزل، بينما يساهم الضخ الكهربائي في تشكل أنظمة الري السطحي 75% (1400 بيجا جول في السنة) من إجمالي استهلاك الطاقة، حيث يمثل استهلاك الطاقة من أنظمة الري بالرش والري بالتنقيط 21% (388 بيجا جول في السنة) و4% (78 بيجا جول في السنة) على التوالي. ومن الجدير بالذكر أن جزءًا كبيرًا من استهلاك الطاقة ينشأ من استخراج المياه الجوفية باستخدام مضخات الديزل المدمجة مع نظام الري السطحي، مما يساهم في 57% (1065 بيجا جول في السنة) من إجمالي استهلاك الطاقة.
من حيثانبعاثاتسنوياً) تُنسب إلى ضخ المياه الجوفية، مع ضخ الديزل المساهمة ( سنويًا) والمضخات الكهربائية تساهم ( سنويًا) (الشكل 3ب).انبعاثات أنظمة الري السطحي تمثل ( سنويًا) من إجمالي الطاقة المتعلقة بـانبعاثات، مع ( سنويًا) التي تساهم بها مضخات الديزل و ( سنويًا) بواسطة المضخات الكهربائية. على العكس من ذلك،انبعاثات من الري بالرش والري بالتنقيط تشكل فقط ( سنويًا) و سنويًا)، على التوالي. بالإضافة إلى ذلك، انبعاثات من استخراج المياه الجوفية باستخدام مضخات الديزل المدمجة مع أنظمة الري السطحي تساهم فيمن إجمالي الطاقة المتعلقةانبعاثات.
خيارات التخفيف لتقليل استهلاك الطاقة وانبعاثات
حيث إن تنفيذ أنظمة الري وضخ المياه يساهم بشكل مباشر في استهلاك الطاقة، وبالتالي في الأمور المتعلقة بالطاقة الانبعاثات، يجب أن تتناول تدابير التخفيف كفاءة معدات الري وكثافة الكربون للطاقة. لاستكشاف خيارات قابلة للتطبيق لتقليل الطاقة والانبعاثات، نفحص سيناريوهين رئيسيين، وهما تحسين أنظمة الري لتقليل المياه-
الشكل 3 | مخطط سانكي لتوزيع استهلاك الطاقة وانبعاثات ثاني أكسيد الكربون المرتبطة بالطاقة من الري. أ استهلاك الطاقة (PJ سنويًا) خلال 2000-2010. ب انبعاثات ثاني أكسيد الكربون من استهلاك الطاقة المتجسدة (سنويًا). في الشكل، استهلاك الطاقة الإجمالي ولا تشمل الانبعاثات تلك (القيم بين الأقواس) من ضخ الغاز الطبيعي. تم توفير خرائط التوزيع الجغرافي في الأشكال التكميلية 7-13.
استخدم شدة وأنظمة ضخ متغيرة للانتقال إلى الضخ الكهربائي مع الاستفادة من الكهرباء منخفضة الكربون (انظر الطرق).
تظهر الشكل 4 الطاقة العالمية و الانبعاثات تحت هذه السيناريوهات المتميزة. بالمقارنة مع فترة 2000-2010، فإن استهلاك الطاقة والموارد المتعلقة بالطاقة تُخفض الانبعاثات الناتجة عن الري إلى النصف في سيناريو الري بالتنقيط (الشكل 4). ومع ذلك، فإن سيناريو الرش يؤدي إلى زيادة بنسبة 39% (743 بيجا جول سنويًا) في استهلاك الطاقة و الانبعاثات (الشكل 4أ). يؤدي تحويل جميع مضخات الديزل إلى مضخات كهربائية إلى تقليل استهلاك الطاقة بنسبة 51% (966 بيجا جول سنويًا) (الشكل 4أ). علاوة على ذلك، في سيناريو المضخات الكهربائية، حيث تشمل مصادر الكهرباء مزيج الكهرباء من 2000-2010، والطاقة الشمسية، وطاقة الرياح، والطاقة النووية، والطاقة الكهرومائية، ومزيج الكهرباء المتوقع في 2050، فإن الطاقة المتعلقة بـتُخفَّض الانبعاثات الناتجة عن الري إلى، و سنويًا، على التوالي (الشكل 4ب). من الجدير بالذكر أن الإمكانية لـ تخفيف الانبعاثات يتجاوزتحت سيناريوهات الكهرباء منخفضة الكربون ومحدود بـتحت سيناريو مزيج الكهرباء من 2000 إلى 2010 (الشكل 4ب).
جدوى الحلول لتقليل استهلاك الطاقة و الانبعاثات من خلال فحصنا للحلول التي تهدف إلى تقليل الطاقة و الانبعاثات، نوضح أن كل من استهلاك الطاقة ويمكن تقليل الانبعاثات بشكل كبير في سيناريوهات الري بالتنقيط وضخ الكهرباء. ومن الجدير بالذكر أنه في سيناريو ضخ الكهرباء، يحدث انخفاض كبير فييمكن تحقيق الانبعاثات فقط عندما تكون الكهرباء منخفضة الكربون (الشكل 4). ونتيجة لذلك، ستلعب نسبة الكهرباء منخفضة الكربون في عام 2050 دورًا محوريًا في تحديد مدىيمكن تقليل الانبعاثات الناتجة عن الري. تصبح جدوى اعتماد الري بالتنقيط عاملاً حاسماً في اختيار الاستراتيجيات. للطاقة وخفض الانبعاثات. على سبيل المثال، نظرًا لأن الري بالتنقيط غير قابل للتطبيق على زراعة الأرز، وليس جميع الدول ستتبنى الكهرباء منخفضة الكربون بحلولتخفيضات كبيرة فيقد لا تكون الانبعاثات قابلة للتحقيق. وبالتالي، يركز هذا القسم على تحليل جدوى الحلول التي تهدف إلى تقليلانبعاثات.
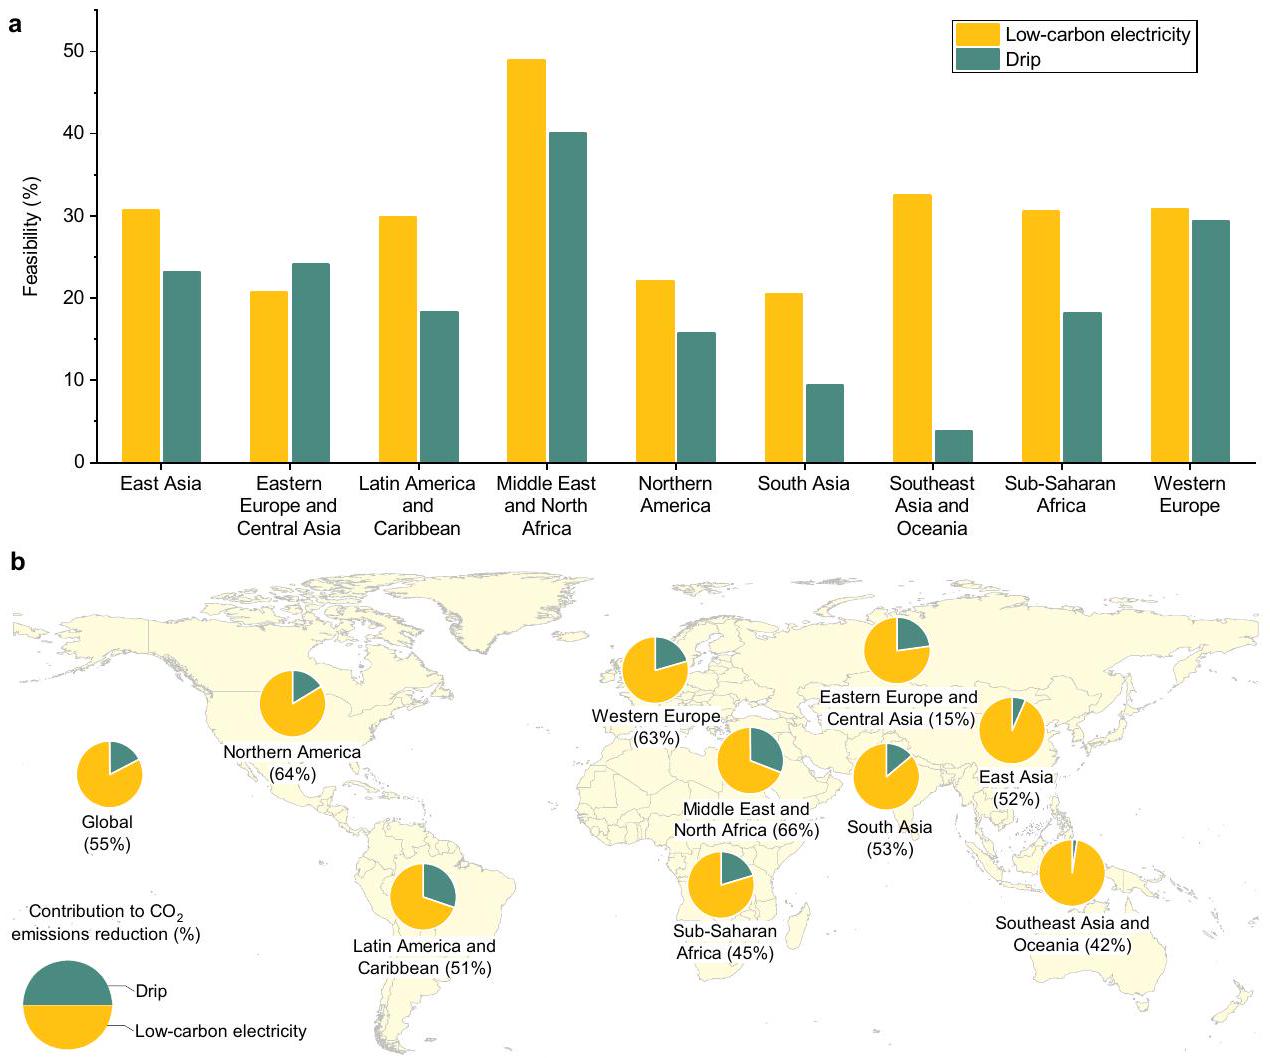
تظهر الشكل 5 جدوى الري بالتنقيط والكهرباء منخفضة الكربون، فضلاً عن المساهمة المحتملة في تقليل الطاقة المتعلقة بـانبعاثات كل دولة. جدوى الكهرباء منخفضة الكربون أكبر من الري بالتنقيط. منطقة الشرق الأوسط وشمال أفريقيا وغرب أوروبا لديها جدوى أعلى للري بالتنقيط، مع و على التوالي (الشكل 5أ). تتمتع منطقة الشرق الأوسط وشمال إفريقيا، وجنوب شرق آسيا وأوقيانوسيا، وأوروبا الغربية، وأفريقيا جنوب الصحراء الكبرى، وشرق آسيا، وأمريكا اللاتينية ومنطقة البحر الكاريبي بإمكانية أعلى للكهرباء منخفضة الكربون، حيث تتجاوز النسبة 30% في كلا الحالتين (الشكل 5أ).
تحدد جدوى الكهرباء منخفضة الكربون، أي مقدار الزيادة في حصة الكهرباء منخفضة الكربون بحلول عام 2050 مقارنةً بالفترة من 2000 إلى 2010، مقداريمكن تقليل الانبعاثات بحلول عام 2050. توضح الشكل 5ب أن 55% من الطاقة العالمية المتعلقة بـتُخفَّض الانبعاثات من خلال مزيج من الكهرباء منخفضة الكربون والري بالتنقيط، معمن التخفيض الذي تسهم فيه الكهرباء منخفضة الكربون وعن طريق الري بالتنقيط. يمكن أن تحقق منطقة الشرق الأوسط وشمال أفريقيا، وأمريكا الشمالية، وأوروبا الغربية أكثر منخفض في الطاقة المتعلقة الانبعاثات، مع مساهمة الري بالتنقيط من الانخفاض في الشرق الأوسط وشمال إفريقيا (الشكل 5ب). في جنوب آسيا وشرق آسيا مع الري المكثف، أكثر من المتعلقة بالطاقةتُخفَّض الانبعاثات من خلال مزيج من الكهرباء منخفضة الكربون والري بالتنقيط (الشكل 5ب). ومع ذلك، في شرق أوروبا وآسيا الوسطى، فقطالمتعلقة بالطاقةتُخفَّض الانبعاثات من خلال مزيج من الكهرباء منخفضة الكربون والري بالتنقيط (الشكل 5ب).
مساهمة الري في استخدام الطاقة في المزرعة
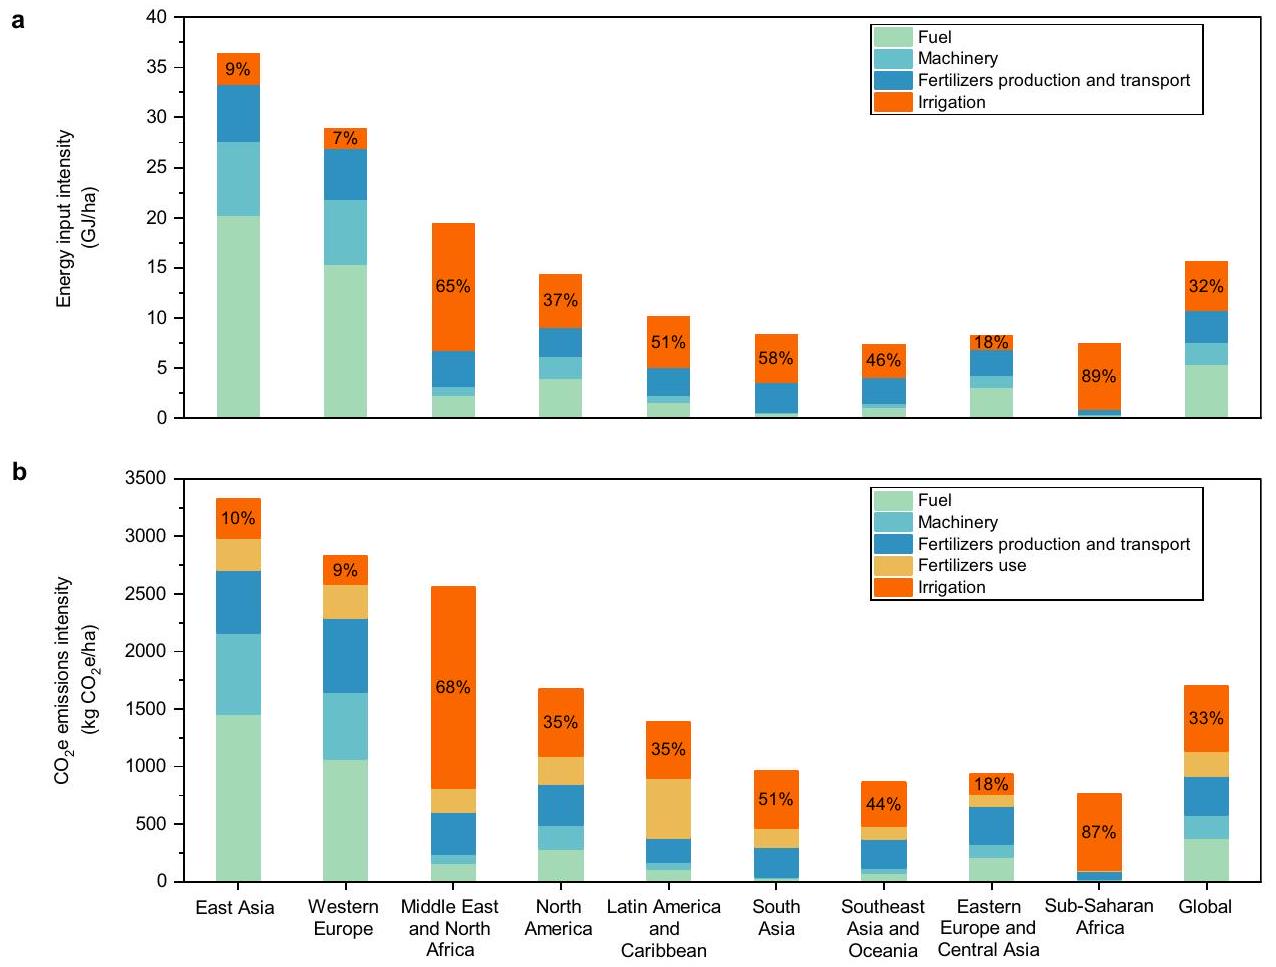
استنادًا إلى تحليل كثافة الطاقة وشدة انبعاثات الري على المستوى الوطني (الشكل 1أ، ج)، نقوم بمزيد من تحليل مساهمة الري في استخدام الطاقة في المزارع. يوضح الشكل 6 مقارنة بين مدخلات الطاقة وشدة انبعاثات الكربون للري مع إجمالي مدخلات الطاقة وشدة انبعاثات الكربون في المزارع في المناطق الفرعية حول العالم. على مستوى العالم، تمثل شدة مدخلات الطاقة للري 32% من شدة مدخلات الطاقة العالمية، وأكثر من 50% في منطقة جنوب الصحراء الكبرى، والشرق الأوسط وشمال أفريقيا، وجنوب آسيا، وأمريكا اللاتينية ومنطقة البحر الكاريبي (الشكل 6أ). بناءً على ذلك،شدة انبعاثات الري تمثلعالميشدة الانبعاثات، وأكثر منفي أفريقيا جنوب الصحراء الكبرى، والشرق الأوسط وشمال أفريقيا، وجنوب آسيا (الشكل 6ب). بالإضافة إلى ذلك، فإن أكبر كثافة لإدخال الطاقة وشدة الانبعاثات في أمريكا الشمالية تأتي أيضًا من الري.
استنادًا إلى مساحة الأراضي الزراعية من FAOSTATنحن نقدر استهلاك الطاقة العالمي (PJ) والانبعاثات الكربونية المقابلة (Mt ) من الأسمدة والآلات والوقود (الجدول التكميلية 8). نجد أن استهلاك الطاقة وانبعاثات الكربون من الري تمثل حوالي من إجمالي استهلاك الطاقة وانبعاثات الكربون في الزراعة (الجدول التكميلي 8).
نقاش
منذ الثورة الخضراء في الستينيات، زادت الإنتاجية الزراعية العالمية بمقدار 3.7 مرة.بسبب تكثيف وت mechanization وتحديث الأنظمة الزراعية. ومع ذلك، فإن الزيادة في العائد قد جاءت بتكلفة كبيرة من حيث زيادة مدخلات الطاقة وبصمة بيئية كبيرةتطوير الري، باعتباره تجسيدًا مركّزًا للتكثيف الزراعي، تضمن استهلاكًا عاليًا للطاقة، وأدى إلى الاعتماد على الوقود الأحفوري، والانبعاثات (الشكل 2). بالإضافة إلى ذلك، تساهم مدخلات الطاقة والانبعاثات الكربونية من الري بشكل كبير في إجمالي استهلاك الطاقة والانبعاثات الكربونية في الزراعة (الشكل 6 والجدول التكميلي 8).
إن إدخال الطاقة العالية والبصمة الكربونية للري قد يهدد بدوره نمو واستقرار إنتاج الغذاء على مستوى العالم، خاصة في المناطق التي تعتمد بشكل كبير على الوقود الأحفوري..
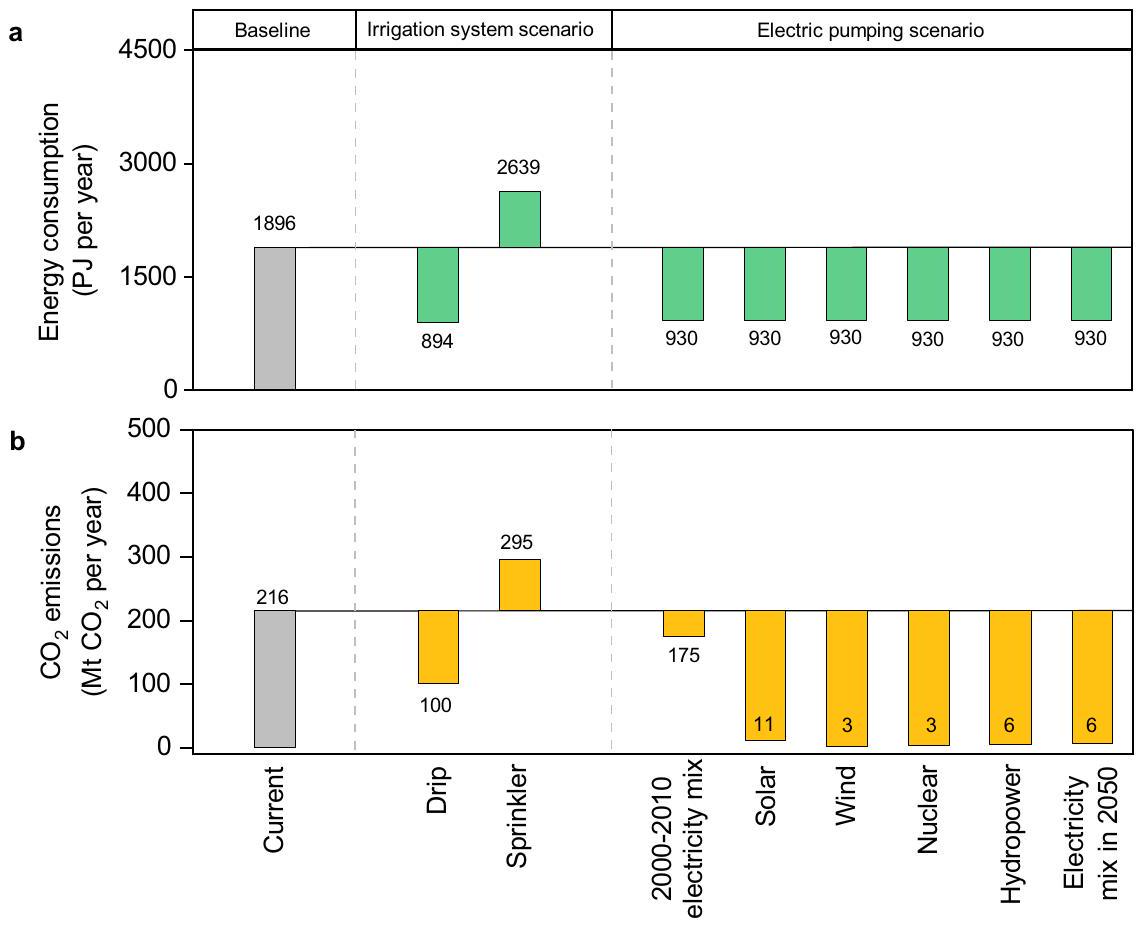
الشكل 4 | إمكانيات التخفيف من استخدام الطاقة وانبعاثات ثاني أكسيد الكربون تحت سيناريوهات مختلفة. أ سيناريو الرش وسيناريو التنقيط لهما كثافات استخدام مياه مختلفة. بالنسبة لسيناريو الضخ الكهربائي، فإن استهلاك الطاقة للري لا يتغير معشدة الكهرباء.في سيناريوهات الرش والتقطير،تظل شدة الطاقة (الكهرباء خلال 2000-2010) دون تغيير. في سيناريوهات الضخ الكهربائي، تأتي الكهرباء من مزيج الكهرباء خلال 2000-2010، الطاقة الشمسية، الرياح، الطاقة النووية، الطاقة المائية، أو مزيج من الأربعة مصادر للكهرباء منخفضة الكربون.
وفقًا لتوقعات وكالة الطاقة الدولية لتحقيق صافي انبعاثات صفرية بحلول عام 2050سيناريو الأساس يعكس استهلاك الطاقة والموارد المتعلقة بالطاقةالانبعاثات خلال 2000-2010. يمثل مزيج الكهرباء في 2000-2010 هيكل إنتاج الكهرباء في 2000-2010، حيث تأتي الكهرباء من الوقود الأحفوري، والطاقة النووية، والطاقة المائية، والطاقة الحرارية الأرضية، والطاقة الشمسية، وطاقة الرياح، والطاقة المدية، وطاقة الأمواج، والبحرية، والوقود الحيوي.تُقدم خرائط التوزيع الجغرافي في الأشكال التكميلية 14-16.
علاوة على ذلك، فإن المدخلات العالية للطاقة في الري تزيد أيضًا من الضغط على نظام إمدادات الطاقة والمنافسة على الطاقة من قطاعات أخرى. في باكستان وبنغلاديش، تمثل استهلاك الطاقة للري وحدهمن إجمالي إمدادات الطاقة في 2000-2010 (الشكل التوضيحي 19أ). مع التوسع المستدام المستقبلي في الري (الشكل 2)، ستضيف الزيادة في استهلاك الطاقة للري ضغطًا على إمدادات الطاقة في الدول الأفريقية والأوروبية (الشكل التوضيحي 19ب).
نحن نقدم حلولًا لتحقيق استهلاك منخفض للطاقة وانبعاثات الكربون بالإضافة إلى استخدام مياه عالي الكفاءة في الزراعة المروية (الأشكال 4 و 5). يمثل نظاما الري بالتنقيط والرش نظامين فعالين في استخدام المياه. ومع ذلك، تظهر نتائجنا أن نظام الري بالرش لديه استهلاك طاقة أعلى وشدة الانبعاثات أقل من الري السطحي ولا تقلل من استخدام الطاقة وانبعاثات الري على مستوى العالم (الأشكال 1ب، د و4). لذلك، يجب إعطاء الأولوية لنظام الري بالتنقيط في نشر البنية التحتية الزراعية. الاستثناء هو عندما يؤدي التحول من الري بالجاذبية إلى الري بالتنقيط إلى زيادة استهلاك الطاقة وانبعاثات الري، حيث يوجد تبادل بين توفير المياه وتقليل الطاقة وانبعاثاتكما يتضح من السودان وإثيوبيا (الأشكال التكميلية 4 و 14). في هذه الحالة، يجب دمج تحليل الفوائد والتكاليف في المقايضة. إذا تم اعتبار انبعاثات الكربون أيضًا كتكلفة استثمار، فإن الزيادة في التكاليف الناتجة عن اعتماد أنظمة الري بالتنقيط تشمل الاستثمار الرأسمالي الأولي للمعدات مع الفوائد على مدار دورة الحياة، والتي عادة ما تتراوح بين 15-25 عامًا، وتكلفة الطاقة المحولة، وضرائب الكربون.تشمل العوائد الاقتصادية من الاستثمارات في تكنولوجيا الري بالتنقيط تحسين الإنتاج، وتغيير في دورة المحاصيل، وتوفير في المياه والأسمدة.إذا كانت الفوائد أكبر من التكاليف، يمكن اعتبار الاستثمار في أنظمة الري بالتنقيط مجديًا اقتصاديًا في دول مثل السودان وإثيوبيا.
تحليل التكلفة والفائدة ينطبق أيضًا على دول أخرى حول العالم.
من المRemarkably، فإن نظام الري بالتنقيط لا ينطبق على جميع المحاصيل (الجدول التكميلي 6)، ومساهمته في تقليل العالميةانبعاثات الري محدودة (الأشكال 4ب و5ب). حل آخر في دراستنا هو التحول من الديزل المكثف للطاقة إلى الضخ الكهربائي الفعال (الشكل 1ب) واستخدام الكهرباء منخفضة الكربون. تضخ المضخات الكهربائية منخفضة الكربون تأثيرًا كبيرًا في تقليلانبعاثات الري (الأشكال 4ب و5ب)، ولها نفس الفعالية مثل الري بالتنقيط في تقليل استهلاك الطاقة للري (الشكل 4أ). الكهرباء منخفضة الكربون تجلب فوائد كبيرة على المدى الطويل للبلد، مثل تقليل الاعتماد على الوقود الأحفوري.. ومع ذلك، من منظور المزارع، فإن تقليل انبعاثات الكربون ليست أولوية. قد يسهل سعر الكربون المقدم اعتماد الكهرباء منخفضة الكربون، لكنه قد يؤدي أيضًا إلى تآكل الربحية النسبية لإنتاج المحاصيل المروية.. لذلك، يجب بذل الجهود في تطوير الكهرباء منخفضة الكربون وتقليل التكاليف للدول في جميع أنحاء العالم في المستقبل. من ناحية أخرى، فإن استهلاك الطاقة العالمي وتهيمن انبعاثات الري على ضخ المياه الجوفية (الشكل 3). في هذه الحالة، يُوصى بإعطاء الأولوية لاستخدام المياه السطحية والمياه الجوفية الضحلة للري. في الوقت نفسه، يجب تعزيز إدارة موارد المياه الجوفية لمنع انخفاض مستويات المياه الجوفية من تعويض مكاسب كفاءة الطاقة الناتجة عن اعتماد أنظمة الري بالتنقيط..
حالياً، لا تزال التقديرات المحددة مكانيًا لسحب المياه العالمية للري قبل، مما يمنع دراستنا من تقديم التحليل الأكثر حساسية للوقت لاستهلاك الطاقة العالمي وانبعاثات الري. ومع ذلك، أظهرت الدراسات السابقة أن سحب مياه الري مدفوع بمساحة الأراضي المروية.. وبالتالي، لا يزال بإمكاننا تقديم فهم محدث لاستهلاك الطاقة العالمي وانبعاثات الري بعد عام 2010
الشكل 5 | جدوى الحلول لتقليل انبعاثات ثاني أكسيد الكربون من الري على مستوى الدولة. أ جدوى (%) للري بالتنقيط والكهرباء منخفضة الكربون. ب المساهمة المحتملة (%) للري بالتنقيط والكهرباء منخفضة الكربون في الطاقة المتعلقة بـخفض الانبعاثات بناءً على تحليل الجدوى. يوضح الرسم البياني الدائري نسبة مساهمة الكهرباء منخفضة الكربون والري بالتنقيط في الطاقة المتعلقة بـخفض الانبعاثات.
تمثل القيم في أسفل الرسم البياني الدائري إجمالي المساهمة الناتجة عن مزيج من الحلين. لمقارنة أكثر تفصيلاً للاختلافات الإقليمية، قمنا بتقسيم القارات الست إلى تسع مناطق فرعية (انظر بيانات المصدر لتبرير التصنيف). يتم تقديم جدوى الكهرباء بالتنقيط والكهرباء منخفضة الكربون على مستوى الدول في الشكل التوضيحي 18. GS (2016) 1966. بافتراض أن جميع الظروف الأخرى باستثناء المناطق المروية تبقى كما كانت في 2000-2010. استنادًا إلى الطاقة وشدة الانبعاثات لكل وحدة من المساحة المروية (الشكل 1 أ، ج) والمساحة المروية المحددة حسب البلد المستمدة من FAO AQUASTATفي عام 2020، استهلاك الطاقة العالمي وزادت انبعاثات الري بنحو 14% في عام 2020 مقارنةً بالفترة من 2000 إلى 2010، مع زيادات ملحوظة في بعض الدول الأفريقية (الشكل التوضيحي 23).
تسلط دراستنا الضوء على الأراضي غير المستكشفة سابقًا في استهلاك الطاقة العالمي والانبعاثات الكربونية المرتبطة بالري. لا توفر هذه البحث فهمًا شاملاً لاستخدام الطاقة المباشرة العالمية فحسب، بل أيضًا…انبعاثات من الري ولكن أيضًا ترسم مسارًا للمضي قدمًا يهدف إلى تقليل المياه والطاقة والانبعاثات في الزراعة المروية. علاوة على ذلك، أظهرت الأعمال السابقة الحدود البيوفيزيائية للري، موضحةً الأماكن التي يتوفر فيها الماء محليًا لتلبية احتياجات المحاصيل من المياه.. ومع ذلك، فإن الري لا يتأثر فقط بتوافر المياه ولكن أيضًا بالعوامل الاجتماعية والاقتصادية، وهي ظاهرة تعرف بندرة المياه الاقتصادية الزراعيةتسمح لنا خريطة الطاقة وانبعاثات الكربون من الري بدقة عالية بفهم الأماكن التي ستكون فيها الطاقة عائقًا أمام الري. توفر دراستنا معلومات مفصلة عن استخدام الطاقة من الري ويمكن أن تُفيد في تقييم جدوى الري لزيادة القدرة التكيفية في القطاع الزراعي.
طرق
استهلاك الطاقة والطاقة المتعلقةتقديرات الانبعاثات
استخدام الطاقة في الري هو دالة لحجم مياه الري وارتفاع الضغط الكلي.تأثرت بشكل حاسم بأنظمة الري (الري بالتنقيط، والري بالرش، والري السطحي)، وأنظمة الضخ (الديزل مضخات المياه (المضخات اليدوية والمضخات الكهربائية) ومصدر مياه الري (سطحية أو جوفية) (الجدول التكميلي 1). تم اشتقاق مجموعات بيانات عمق مستوى المياه الجوفية العالمية من فان وآخرون.تم أخذ نسبة المياه السطحية والمياه الجوفية للري من سيبرت وآخرون.تم الحصول على مجموعات البيانات على مستوى الدول حول نسبة الري بالتنقيط والري بالرش والري السطحي من Jägermeyr وآخرون.تم إعادة بناء مجموعات بيانات سحب مياه الري استنادًا إلى النموذج الهيدرولوجي العالمي LPJmL خلال الفترة من 2000 إلى 2010، وهي مستمدة من هوانغ وآخرون.التي تم معايرتها والتحقق منها باستخدام البيانات المبلغ عنها من منظمة الأغذية والزراعة AQUASTATو USGSتم إعادة عينة بيانات عمق مستوى المياه الجوفية وبيانات سحب مياه الري من دقة 30 ثانية قوسية و30 دقيقة قوسية إلى دقة 5 دقائق قوسية باستخدام طريقة الجار الأقرب لمطابقة البيانات مكانيًا بناءً على نسبة مصدر مياه الري.
نفترض أن الضغوط التشغيلية النموذجية للري السطحي، والري بالتنقيط، والري بالرش هي (هذا مضبوط على 0 لمصادر المياه السطحية)، 1 بار و 3 بارعلى التوالي. إن خسائر الاحتكاك التشغيلية لنظام توزيع الأنابيب تساوي 0.69 بار لجميع الأنظمة المستمدة من براون وآخرون.بشكل محدد، يمكن حساب متطلبات الطاقة باستخدام المعادلتين (1) و (2):
أينهو متطلبات الطاقة؛هو حجم مياه الري؛هو إجمالي ضغط الماء المحسوب كمجموع الرفع من مستوى المياه إلى سطح الأرض، وعمق السحب.
الشكل 6 | مساهمة كثافة مدخلات الطاقة للري في كثافة المدخلات الطاقية الإجمالية ومقارنة كثافة انبعاثات ثاني أكسيد الكربون الناتجة عن كثافة مدخلات الطاقة خلال الفترة من 2000 إلى 2010. أ تأتي كثافة مدخلات الطاقة من الري والأسمدة (، و الإنتاج والنقل، الآلات (تشمل الجرارات، الحاصدات، والفرازات) ) التصنيع، واستهلاك الوقود للآلات. ب بالإضافة إلى انبعاثات غازات الدفيئة الناتجة عن مدخلات الطاقة الأربعة، التربة يتم اعتبار الانبعاثات الناتجة عن استخدام الأسمدة النيتروجينية. يُفترض أن العمر الافتراضي للآلات هو متوسط 20 عامًا. الوقود المستخدم في الآلات يعتمد بشكل رئيسي على الغاز البترولي المسال، والبنزين، وزيوت الغاز-ديزل. تشمل الانبعاثات الأخرى للغازات الدفيئة (مثل… و ) الناتجة عن مدخلات الطاقة يتم تحويلها إلى مكافئات ثاني أكسيد الكربون ( )، باستخدام قيم القدرة على الاحترار العالمي (GWP) من تقرير الهيئة الحكومية الدولية المعنية بتغير المناخ AR5 دون تأثيرات المناخ (GWP-CH4 ; GWP- . (د، كلاهما من مخروط الاكتئاب وسحب إضافي من كفاءة البئر)، ضغط التشغيل ( ) وخسائر الاحتكاك في الأنبوب ( ); تمثل كفاءة المضخة والمحرك الرئيسي (%)، وتعتمد كفاءة المحرك الرئيسي على مصدر الطاقة (بشكل رئيسي الديزل والكهرباء). يتم تمثيل معلمة الرفع بعمق مستوى المياه الجوفية. نظرًا لعدم وجود معلومات عالمية على مستوى الدول حول نسبة مضخات الري (الديزل والكهرباء)، قمنا بتقدير نسبة المضخات الكهربائية إلى مضخات الديزل من خلال تقدير تغطية الشبكة في المناطق المروية على مستوى البكسل بشكل غير مباشر. وفقًا لأفضل البيانات الإحصائية، تم استخدام معلومات مضخات الري على مستوى المقاطعة (مضخات الديزل والكهرباء والغاز الطبيعي) بشكل منفصل للولايات المتحدة (قسم الطرق التكميلية 1.4). تم وصف تقديرات عمق السحب وكفاءة المضخة والمحرك الرئيسي والنسبية لمضخات الري بالتفصيل في قسم الطرق التكميلية 1.1 و1.2 و1.3.
المتعلقة بالطاقةيمكن حساب انبعاثات الري على أنها متطلبات الطاقة للري مضروبة في عامل انبعاث الكربون. المتعلقة بالطاقةيمكن حساب الانبعاثات من الري باستخدام المعادلة (3):
أين هو انبعاثات؛هو استهلاك الطاقة؛ ( ) هو عامل انبعاث استهلاك الطاقة. تم اشتقاق بيانات كثافة الكربون على المستوى الوطني للكهرباء خلال الفترة من 2000 إلى 2010 من وكالة الطاقة الدولية.وعالمنا في البياناتالذي يعتمد على مصدر الكهرباء. لأن كثافة انبعاثات الكربون للكهرباء تتأثر بتجارة الكهرباء، أخذنا في الاعتبار تأثير تجارة الكهرباء (قسم الطريقة التكميلية 1.5).انبعاثات من الديزل لإنتاج 1 كيلووات ساعة من الطاقة تعادلقسم المناقشة التكميلية 2.1 يقدم تحليلًا لدقة نتائجنا.
انبعاثات من تفريغ المياه الجوفية
المياه الجوفية عادة ما تكون مشبعة بشكل زائد في مقارنة بالغلاف الجوي العلوي، ويؤدي هذا التدرج بين الماء والهواء إلى إزالة الغازات عندما يتم ضخ المياه الجوفية إلى السطح. إزالة الغازات من المياه الجوفية هي مصدر لـانبعاثات من الري. ومع ذلك، انبعاثات من تفريغ المياه الجوفية الناتجة عن الري لم يتم قياسها.يمكن حساب الانبعاثات الناتجة عن تفريغ المياه الجوفية بسبب الري باستخدام المعادلة (4):
أين هو انبعاثات من تفريغ المياه الجوفية الناتج عن الري؛هو حجم المياه الجوفية الناتج عن الري ); هو نسبة سحب المياه الجوفية للري إلى إجمالي سحب المياه الجوفية؛ هو تركيز في المياه الجوفية. استخدمنا مجموعات بيانات ضخ المياه الجوفية العالمية المتوسطة السنوية خلال الفترة من 2000 إلى 2009 بدقةمستمد من دول وآخرون.تستند مجموعات البيانات إلى نموذج WaterGAP 2.2 المدمج مع ملاحظات الآبار المحلية أو ملاحظات الأقمار الصناعية GRACE، مما يمكن أن يقلل بشكل كبير من عدم اليقين المتأصل في الطريقة المعتمدة على التدفق.يتم استخدام المياه الجوفية بشكل رئيسي في الري والاستخدامات المنزلية والصناعية، والنسبة المئوية لاستخدام المياه الجوفية في القطاعين المنزلي والصناعي التي اقترحها دول وآخرون. هو و ، على التوالي. تم الحصول على مجموعات بيانات سحب المياه القطاعية المعاد بناؤها من هوانغ وآخرون.استطلاع لجودة المياه لمياه جوفية في الولايات المتحدة يظهر أن و نسب تركيز البيكربونات هي و على التوالينفترض أن تركيز البيكربونات العالمي في المياه الجوفية من المحتمل أن يكون مشابهًا لذلك الذي تم قياسه في الولايات المتحدة. يتم تحويل هذا بعد ذلك إلى التركيز وفقًا للمعادلة (5):
أخيرًا،تركيز المياه الجوفية يتراوح منإلى.
الطاقة وكثافة الانبعاثات
استنادًا إلى تقدير الطاقة و الانبعاثات، قمنا بمقارنة الفروق في كثافة استخدام الطاقة ( ) و كثافة الانبعاثاتبين الدول. باستخدام المعلومات الجغرافية المكانية من أنظمة الري وأنظمة الضخ، قمنا بمقارنة الفروق المكانية الواضحة في الطاقة والانبعاثات لكل وحدة من استخدام المياه بين أنظمة الري والمضخات المختلفة.
يأتي استهلاك الطاقة للري مباشرة من ضخ وتوصيل المياه، مع استهلاك الديزل والكهرباء والانبعاثات غير المباشرة لثاني أكسيد الكربون. ومع ذلك، فإن الطاقة وشدة انبعاثات نفس نظام الري وضخ المياه تختلف بسبب اختلاف مصدر مياه الري (المياه السطحية والمياه الجوفية) وعمق مستوى المياه الجوفية. علاوة على ذلك، فإن الاختلافات في ضغط التشغيل وكفاءة الضخ (قسم الطرق التكميلية 1.2) تجعل متوسط الطاقة واختلاف كثافة الانبعاثات بين أنظمة الري وأنظمة الضخ.
وضع سيناريوهات لخيارات التخفيف
لاختبار تأثير خيارات التخفيف، تم تعريف حالة 2000-2010 كخط أساس. علاوة على ذلك، اخترنا خيارين رئيسيين لتقليل الطاقة والانبعاثات وأُنشئت سيناريوهات متعددة تحت كل خيار.
السيناريو الأول هو ترقية أنظمة الري الزراعي. تعكس أنظمة الري المختلفة كفاءة ري مختلفة، مما يعني كفاءة توفير مياه مختلفة. على مستوى العالم، سيوفر الري بالتنقيط و سحب مياه الري مقارنةً مع الري بالرش والري السطحي، على التوالي، في حين أن الرشاشات ستوفرسحب مياه الري مقارنة بالري السطحي كما اقترحه ياجرمير وآخرون. (الجدول التكميلي 4). لذلك، استنادًا إلى نظام الري الحالي، يتم تمثيل سيناريوهين أكثر كفاءة في الري من خلال ترقية الري السطحي إلى الرش والري بالتنقيط. قمنا بتعريف السيناريو الأول كسيناريو رش والسيناريو الثاني كسيناريو تنقيط (الجدول التكميلي 5). علاوة على ذلك، اختبرنا تأثيرات كفاءة الري بالتنقيط والرش على استهلاك الطاقة والانبعاثات من خلال تغيير كفاءة توفير المياه بنسبة 5% (القسم 1.10 من الطريقة التكميلية والجدول 7 التكميلية).
الخيار الآخر هو تقليلانبعاثات الكهرباء منخفضة الكربون، التي تأتي من الطاقة الشمسية، وطاقة الرياح، والطاقة النووية، والطاقة المائية، ومزيج من هذه المصادر الأربعة من الكهرباء منخفضة الكربون بحلول عام 2050. ومع ذلك، فإن استخراج وتطبيق مياه الري لا يعتمد فقط على الضخ الكهربائي؛ حيث يمثل الضخ بالديزل أيضًا نسبة كبيرة في الزراعة المروية (الجدول التكميلي 3). لذلك، قمنا بتحويل جميع الضخ بالديزل إلى ضخ كهربائي (سيناريو الضخ الكهربائي). البصمة الكربونية للطاقة الشمسية، وطاقة الرياح، والطاقة النووية، والطاقة المائية بناءً على تقييم دورة الحياة هي، و كيلووات ساعة، على التواليالبصمة الكربونيةيتم تقدير مزيج الكهرباء بناءً على البصمة الكربونية بالإضافة إلى توليد الكهرباء بحلول عام 2050 من هذه القوى الأربعة (قسم الطريقة التكميلية 1.6). وبالمثل، قمنا بتقييم عدم اليقين في البصمة الكربونية للطاقة الشمسية وطاقة الرياح والطاقة النووية والطاقة المائية على إمكانيات التخفيف (قسم الطريقة التكميلية 1.10 والجدول التكميلية 7).
جدوى خيارات التخفيف
استنادًا إلى إعداد السيناريو لتقليل الطاقة وانبعاثات، قمنا بتحليل جدوى خيارات التخفيف بشكل أكبر. أولاً، قمنا بتقييم جدوى الري بالتنقيط والكهرباء منخفضة الكربون، بالإضافة إلى المساهمة المحتملة للري بالتنقيط والكهرباء منخفضة الكربون. يمكن حساب جدوى ومساهمة الري بالتنقيط والكهرباء منخفضة الكربون باستخدام المعادلات (6) – (9):
أينهو جدوى الري بالتنقيط؛هو استهلاك مياه الري للمحاصيل التي يمكن أن تعتمد على الري بالتنقيط (الجدول التكميلي 6)؛ هو إجمالي استهلاك مياه الري لـ 26 محصولًا؛ الري بالتنقيط هو النسبة الحالية للري بالتنقيط. في هذه الدراسة، تم حساب استهلاك مياه الري لـ 26 محصولًا من 2000-2010 استنادًا إلى نموذج WATNEEDS. (قسم الطرق التكميلية 1.7). الـهو جدوى الكهرباء منخفضة الكربون؛هو نصيب الكهرباء منخفضة الكربون بواسطة; هو حصة الكهرباء منخفضة الكربون خلال الفترة من 2000 إلى 2010.يمثل المساهمة المحتملة للري بالتنقيط؛يمثل مساهمةخفض الانبعاثات تحت سيناريو التنقيط.يمثل المساهمة المحتملة للكهرباء منخفضة الكربون؛يمثل المتوسط المساهمة في سيناريو الضخ الكهربائي حيث تأتي الكهرباء من الرياح والطاقة الشمسية والطاقة النووية والطاقة المائية. استخدمنا أهداف الكهرباء منخفضة الكربون الإقليمية (أوروبا، آسيا، إفريقيا، الشرق الأوسط، أمريكا الشمالية، أمريكا اللاتينية، دول الكومنولث المستقلة، والمحيط الهادئ) لعام 2050، والتي يمكن بموجبها تحقيق أهداف الانبعاثات الحالية للالتزامات الوطنية المحددة (NDC) لعام 2030 بنجاح، بالإضافة إلى استمرار الجهود المتسقة بعد عام 2030.
لقيمة المساهمة في مزيج من الكهرباء منخفضة الكربون والري بالتنقيط،يمكن حساب تقليل الانبعاثات باستخدام المعادلة (10):
تكون جدوى الكهرباء منخفضة الكربون محددة بـ 0، عندما يتجاوز الحصة الوطنية للكهرباء منخفضة الكربون للفترة من 2000 إلى 2010 الأهداف الإقليمية المتوقعة بحلول عام 2050 (قسم المناقشة التكميلية 2.3).
مدخلات الطاقة الأخرى وانبعاثات
من قاعدة بيانات الفاوستات، حصلنا على الأسمدة (، و ) استخدم ( ) وبيانات مساحة الأراضي الزراعية لكل دولة خلال الفترة من 2000 إلى 2010. تم استخدام مساحات الأراضي الزراعية لحساب المدخلات لكل هكتار. كما حصلنا على بيانات الآلات (عدد الجرارات، الحاصدات، والفرازات) من قاعدة بيانات الفاوستات خلال الفترة من 2000 إلى 2005.. علاوة على ذلك، قمنا بتحويل الكميات الفيزيائية إلى وحدات الطاقة (جيجا جول/ هكتار) باستخدام عوامل تحويل الطاقة المتغيرة مع الزمن، والتي يمكن العثور عليها في بيليجريني وآخرون.. بالنسبة للآلات، افترضنا متوسط عمر يبلغ 20 عامًا مع عامل تحويل الطاقة من استنادًا إلى بيليجريني وآخرون.
قمنا أيضًا بتحويل كثافة مدخلات الطاقة ( ) إلى شدة الانبعاثاتها) باستخدام عوامل انبعاث الكربون من الأدبيات. لإنتاج ونقل، و الأسمدة، استخدمنا البيانات الإقليمية (أوروبا الغربية، أوروبا الشرقية، أمريكا الوسطى والجنوبية، آسيا، أستراليا، نيوزيلندا، والعالمية) عوامل انبعاث (متوسط لبقية الدول). علاوة على ذلك، استخدمنا عوامل الانبعاث الإقليمية (أفريقيا، شرق آسيا، أوروبا، أمريكا اللاتينية، أمريكا الشمالية، أوقيانوسيا، جنوب آسيا، رابطة الدول المستقلة، والمتوسط العالمي لبقية الدول) لاستخدام الأسمدة النيتروجينية (الانبعاثات المباشرة من التربة). بالنسبة للآلات، استخدمنا عامل انبعاث متوسط قدره لثلاثة آلات (قسم الطرق الإضافية 1.9). نظرًا لعدم توفر معلومات حول أنواع ونسب الوقود المستهلك من قبل الآلات، افترضنا أن الوقود المستهلك من قبل هذه الأنواع الثلاثة من الآلات يأتي بشكل رئيسي من الغاز البترولي المسال، والبنزين، وزيوت الغاز والديزل، التي تطلق ، و ، واستخدم عامل الانبعاثات المتوسط للوقود الثلاثة من الهيئة الحكومية الدولية المعنية بتغير المناخ. ثم استخدمنا إجمالي مساحة الأراضي الزراعية من FAOSTATلتقدير إجمالي مدخلات الطاقة وانبعاثات غازات الدفيئة من الأسمدة والآلات والوقود خلال الفترة من 2000 إلى 2010. بسبب نقص البيانات الموثوقة للمبيدات.لم تأخذ تحليلاتنا في الاعتبار مدخلات الطاقة لمبيدات الآفات.
تحذيرات
تؤدي نسبة المياه السطحية والمياه الجوفية دورًا حاسمًا في تقدير استهلاك الطاقة العالمي بدقة وانبعاثات الري. في هذه الدراسة، كانت متوسط سحب مياه الري السنوي العالميخلال الفترة من 2000 إلى 2010، وهو ما يتفق مع النتائج (في عام 2012) الذي أبلغت عنه منظمة الفاو AQUASTAT. ومع ذلك، بسبب بيانات نسبة مصادر مياه الري المقدمة من سيبرت وآخرين. وبيانات سحب مياه الري المقدمة من هوانغ وآخرون. لا تتطابق تمامًا من الناحية المكانية؛ فقطالمياه متورطة في تقدير الطاقة والانبعاثات. لذلك، فإن النتائج في دراستنا هي تقدير أدنى لـانبعاثات من الري.
نظرًا لعدم توفر معلومات على مستوى الدولة حول مضخات الري، استخدمنا نسبة المساحة المروية الإجمالية التي تغطيها شبكة الشبكة العالمية كنسبة للمضخات الكهربائية، بينما استخدمت بقية المناطق المروية التي ليست متصلة بالشبكة مضخات الديزل. على الرغم من أن نتائج تقديراتنا تتماشى نسبيًا مع نتائج الدراسات الأدبية السابقة في ثماني دول (الشكل التكميلي 21 والجدول التكميلي 3)، لا تزال هناك بعض الشكوك.
عندما حسبنا إمكانيات التخفيف من انبعاثات الكربون للكهرباء منخفضة الكربون لـ الانبعاثات، تم افتراض قيم نموذجية للبصمات الكربونية للطاقة الشمسية وطاقة الرياح والطاقة النووية والطاقة المائية. ومع ذلك، أدت الفروق في مستويات التكنولوجيا بين الدول والنطاقات الواسعة للبصمات الكربونية للكهرباء منخفضة الكربون على مدار دورة الحياة إلى عدم اليقين في إمكانيات التخفيف من آثار الكهرباء منخفضة الكربون على انبعاثات الري (الجدول التكميلي 7). بالنظر إلى توفر البيانات، نستخدم عوامل تحويل إقليمية أو ثابتة عند تقدير مدخلات الطاقة والانبعاثات الكربونية المقابلة لعمليات المزرعة الأخرى، مثل عوامل الانبعاث لاستخدام الغاز البترولي المسال، والبنزين، وزيوت الديزل، والتي تؤثر بشكل غير مباشر على نسبة مدخلات الطاقة للري في إجمالي مدخلات الطاقة في المزارع.
في ضوء السياسات الطموحة للطاقة المتجددة التي تم الإبلاغ عنها في مؤتمر COP28 (المؤتمر الثامن والعشرون للأطراف في اتفاقية الأمم المتحدة الإطارية بشأن تغير المناخ) والتي تهدف إلى تحقيق أهداف انبعاثات صافية صفرية بحلولقد تكون نتائجنا قد تقلل من تقدير الإمكانيات لتقليل انبعاثات الكربون من الري بحلول عام 2050. ومن الجدير بالذكر أن الدول الكبرى المستهلكة لطاقة الري – الهند، الصين، باكستان، وإيران – لم تلتزم بزيادة الطاقة النووية ثلاثة أضعاف أو زيادة قدرة توليد الطاقة المتجددة ثلاثة أضعاف بحلول عام 2030. وبالتالي، بينما من المتوقع أن تنخفض انبعاثات الكربون العالمية من قطاع الطاقة بشكل كبير بحلول عام 2050، فإن تقليل انبعاثات الكربون من الري سيتطلب من هذه الدول تقديم التزامات أكبر نحو اعتماد الطاقة المتجددة. علاوة على ذلك، فإن السياسات المتعلقة بالطاقة المتجددة التي تم تحديدها في COP28 لا توضح النسبة المتوقعة من الكهرباء منخفضة الكربون بحلول عام 2050 للدول أو القارات الفردية، مما يعيق التقديرات الدقيقة للإمكانات. خفض انبعاثات الكربون الناتجة عن الري. تقدم دراستنا إطارًا لتقييم الإمكانية المحتملة لتقليل انبعاثات الكربون المرتبطة بالري، مما يتيح تحديث نتائجنا مع توفر بيانات جديدة.
ملخص التقرير
معلومات إضافية حول تصميم البحث متاحة في ملخص تقارير مجموعة ناتشر المرتبط بهذه المقالة.
توفر البيانات
استخدم هذا العمل بيانات تم جمعها من مجموعة متنوعة من الأدبيات والمصادر المتاحة للجمهور، والتي سيتم سردها في النص الرئيسي والمواد التكميلية. جميع التحليلات تعتمد على هذه المجموعات البيانية المجمعة. النتائج من جميع التحليلات متاحة في بيانات المصدر كجداول بيانات Excel بجانب الورقة. البيانات الخاصة بالنتائج الرئيسية لهذه الدراسة متاحة للجمهور منhttps://doi.org/10.5281/zenodo. 10118986. تم توفير بيانات المصدر مع هذه الورقة.
توفر الشيفرة
تم تحليل البيانات باستخدام برنامج الإحصاء MATLAB وOrigin. النص البرمجي متاح للجمهور منhttps://doi.org/10.6084/m9.figshare.25392874.v1.
References
Gleick, P. H., Cooley, H., Morikawa, M., Morrison, J. & Cohen, M. J. The world’s water 2008-2009: The biennial report on freshwater resources. Available online at: https://islandpress.org/books/ worlds-water-2008-2009#contents. Accessed 4th March 2023.
Portmann, F. T., Siebert, S. & Döll, P. MIRCA2000-Global monthly irrigated and rainfed crop areas around the year 2000: A new highresolution data set for agricultural and hydrological modeling. Glob. Biogeochem. Cycle. 24, GB1011 (2010).
Rosa, L. Adapting agriculture to climate change via sustainable irrigation: Biophysical potentials and feedbacks. Environ. Res. Lett. 17, 063008 (2022).
Rosa, L. et al. Potential for sustainable irrigation expansion in a 3 C warmer climate. Proc. Natl. Acad. Sci 117, 29526-29534 (2020).
Liu, Y. et al. Global and regional evaluation of energy for water. Environ. Sci. Technol. 50, 9736-9745 (2016).
Rosa, L. et al. Energy implications of the 21st century agrarian transition. Nat. Commun. 12, 1-9 (2021).
Rothausen, S. G. & Conway, D. Greenhouse-gas emissions from energy use in the water sector. Nat. Clim. Chang. 1, 210-219 (2011).
Rosa, L. & Gabrielli, P. Achieving net-zero emissions in agriculture: a review. Environ. Res. Lett. 18, 63002 (2023).
Hong, C. et al. Global and regional drivers of land-use emissions in 1961-2017. Nature. 589, 554-561 (2021).
Tonelli, D., Rosa, L., Gabrielli, P., Parente, A. & Contino, F. Costcompetitive decentralized ammonia fertilizers production can increase food security. Nat. Food. In Press. https://www. researchsquare.com/article/rs-3392837/v1 (2023).
Rosa, L. & Gabrielli, P. Energy and food security implications of transitioning synthetic nitrogen fertilizers to net-zero emissions. Environ. Res. Lett. 18, 14008 (2022).
Chang, J. et al. Revisiting enteric methane emissions from domestic ruminants and their source signature. Nat. Commun. 10, 1-14 (2019).
Crippa, M. et al. Food systems are responsible for a third of global anthropogenic GHG emissions. Nat. Food. 2, 198-209 (2021).
Li, M. et al. Global food-miles account for nearly of total foodsystems emissions. Nat. Food. 3, 445-453 (2022).
Food and Agriculture Organization of the United Nations. FAOSTAT database. http://www.fao.org/faostat/en/ Accessed 4th March 2023.
Yang, Y. et al. Sustainable irrigation and climate feedbacks. Nat. Food. 4, 654-663 (2023).
Aguilera, E. et al. Methane emissions from artificial waterbodies dominate the carbon footprint of irrigation: a study of transitions in the food-energy-water-climate nexus (Spain, 1900-2014). Environ. Sci. Technol. 53, 5091-5101 (2019).
Kuang, W., Gao, X., Tenuta, M. & Zeng, F. A global meta-analysis of nitrous oxide emission from drip-irrigated cropping system. Glob. Change Biol. 27, 3244-3256 (2021).
Zou, X. et al. Greenhouse gas emissions from agricultural irrigation in China. Mitig. Adapt. Strateg. Glob. Chang. 20, 295-315 (2015).
Rajan, A., Ghosh, K. & Shah, A. Carbon footprint of India’s groundwater irrigation. Carbon Manag 11, 265-280 (2020).
Daccache, A., Ciurana, J. S., Rodriguez Diaz, J. A. & Knox, J. W. Water and energy footprint of irrigated agriculture in the Mediterranean region. Environ. Res. Lett. 9, 124014 (2014).
Siyal, A. W. & Gerbens-Leenes, P. W. The water-energy nexus in irrigated agriculture in South Asia: Critical hotspots of irrigation water use, related energy application, and greenhouse gas emissions for wheat, rice, sugarcane, and cotton in Pakistan. Front. Water. 4, 941722 (2022).
Driscoll, A. W., Conant, R. T., Marston, L. T., Choi, E. & Mueller, N. D. Greenhouse gas emissions from US irrigation pumping and implications for climate-smart irrigation policy. Nat. Commun. 15, 675 (2024).
Gabrielli, P. et al. Net-zero emissions chemical industry in a world of limited resources. One Earth 6, 682-704 (2023).
Davis, S. J. et al. Net-zero emissions energy systems. Science 360, eaas9793 (2018).
Jägermeyr, J. et al. Water savings potentials of irrigation systems: global simulation of processes and linkages. Hydrol. Earth Syst. Sci. 19, 3073-3091 (2015).
D’Odorico, P. et al. The Global Food-Energy-Water Nexus. Rev. Geophys. 56, 456-531 (2018).
Wood, W. W. & Hyndman, D. W. Groundwater Depletion: A Significant Unreported Source of Atmospheric Carbon Dioxide. Earth’s Future 5, 1133-1135 (2017).
Rosa, L. et al. Closing the yield gap while ensuring water sustainability. Environ. Res. Lett. 13, 104002 (2018).
Rosa, L., Chiarelli, D. D., Tu, C., Rulli, M. C. & D’Odorico, P. Global unsustainable virtual water flows in agricultural trade. Environ. Res. Lett. 14, 114001 (2019).
Siebert, S., Henrich, V., Frenken, K. & Burke, J. Update of the digital global map of irrigation areas to version 5. (Rheinische Friedrich-Wilhelms-Universität, Bonn, Germany and Food and Agriculture Organization of the United Nations, Rome, Italy, 2013).
Pellegrini, P. & Fernández, R. J. Crop intensification, land use, and on-farm energy-use efficiency during the worldwide spread of the green revolution. Proc. Natl. Acad. Sci 115, 2335-2340 (2018).
Mushtaq, S., Maraseni, T. N., Maroulis, J. & Hafeez, M. Energy and water tradeoffs in enhancing food security: A selective international assessment. Energy Policy 37, 3635-3644 (2009).
Maraseni, T. N., Mushtaq, S. & Reardon-Smith, K. Climate change, water security and the need for integrated policy development: the case of on-farm infrastructure investment in the Australian irrigation sector. Environ. Res. Lett. 7, 34006-34012 (2012).
Mushtaq, S., Maraseni, T. N. & Reardon-Smith, K. Climate change and water security: Estimating the greenhouse gas costs of achieving water security through investments in modern irrigation technology. Agric. Syst. 117, 78-89 (2013).
Maraseni, B. T. & Cockfield, G. Including the costs of water and greenhouse gas emissions in a reassessment of the profitability of irrigation. Agric. Water Manage. 103, 25-32 (2012).
Bundschuh, J. et al. Geothermal, wind and solar energy applications in agriculture and aquaculture. (CRC Press, 2017).
Maraseni, T., An-Vo, D. A., Mushtaq, S. & Reardon-Smith, K. Carbon smart agriculture: An integrated regional approach offers significant potential to increase profit and resource use efficiency, and reduce emissions. J. Clean Prod. 282, 124555 (2020).
McCarthy, B. et al. Trends in Water Use, Energy Consumption, and Carbon Emissions from Irrigation: Role of Shifting Technologies and Energy Sources. Environ. Sci. Technol. 54, 15329-15337 (2020).
Smidt, S. J. et al. Complex water management in modern agriculture: Trends in the water-energy-food nexus over the High Plains Aquifer. Sci. Total Environ. 566, 988-1001 (2016).
McDermid, S., Nocco, M. & Lawston-Parker, P. Irrigation in the Earth system. Nat. Rev. Earth Environ. 4, 435-453 (2023).
Puy, A., Borgonovo, E., Piano, S. L. & Levin, S. Irrigated areas drive irrigation water withdrawals. Nat. Commun. 12, 4525 (2021).
Rosa, L., Chiarelli, D. D., Rulli, M. C., Dell’Angelo, J. & D’Odorico, P. Global agricultural economic water scarcity. Sci. Adv. 6, eaaz6031 (2020).
Fan, Y., Li, H. & Miguez-Macho, G. Global patterns of groundwater table depth. Science. 339, 940-943 (2013).
Siebert, S. et al. Groundwater use for irrigation-a global inventory. Hydrol. Earth Syst. Sci. 14, 1863-1880 (2010).
Huang, Z. et al. Reconstruction of global gridded monthly sectoral water withdrawals for 1971-2010 and analysis of their spatiotemporal patterns. Hydrol. Earth Syst. Sci. 22, 2117-2133 (2018).
Dieter, C. A. et al. Estimated use of water in the United States in 2015: U.S. Geological Survey Circular 1441. https://pubs.usgs.gov/ circ/1441/circ1441.pdf (2018). Accessed 10th June 2023.
Hanson, B. & Putnam, D. Flood irrigation of alfalfa: how does it behave. In: Proceedings 34th California Alfalfa & 2004 13-15 (National Alfalfa Symposium, San Diego, CA, 2023) Accessed 8th April 2023.
Brown, G. O. The history of the Darcy-Weisbach equation for pipe flow resistance. In Environmental and Water Resources History, 34-43 Available online at: https://doi.org/10.1061/40650(2003)4 Accessed 4th June 2023.
IEA. emissions from fuel combustion highlights. (International Energy Agency, 2012).
Wang, J. et al. China’s water-energy nexus: greenhouse-gas emissions from groundwater use for agriculture. Environ. Res. Lett. 7, 14035 (2012).
Döll, P., Müller Schmied, H., Schuh, C., Portmann, F. T. & Eicker, A. Global-scale assessment of groundwater depletion and related groundwater abstractions: Combining hydrological modeling with
information from well observations and GRACE satellites. Water Resour. Res. 50, 5698-5720 (2014).
Wada, Y. Modeling Groundwater Depletion at Regional and Global Scales: Present State and Future Prospects. Surv. Geophys. 37, 419-451 (2016).
Desimone, L. A. Quality of water from domestic wells in principal aquifers of the United States, 1991-2004. (U.S. Geological Survey, 2009).
UNECE. Carbon neutrality in the UNECE region: integrated life-cycle assessment of electricity source. (Geneva: United Nations, 2022).
Ubierna, M., Santos, C. D. & Mercier-Blais, S. Water Security and Climate Change: Hydropower Reservoir Greenhouse Gas Emissions. (Water Security Under Climate Change, 2022).
Chiarelli, D. D. et al. The green and blue crop water requirement WATNEEDS model and its global gridded outputs. Sci. Data. 7, 273 (2020).
FAO. Global Database of GHG Emissions Related to Feed Crops: Methodology. Version 1. Livestock Environmental Assessment and Performance Partnership. (FAO, Rome, Italy, 2017).
Menegat, S., Ledo, A. & Tirado, R. Greenhouse gas emissions from global production and use of nitrogen synthetic fertilisers in agriculture. Sci Rep 12, 14490 (2022).
Saunders, C. M., Barber, A. & Taylor, G. J. Food miles-comparative energy/emissions performance of New Zealand’s agriculture industry. (Lincoln Univ, Canterbury, New Zealand, 2006).
Stout, B. A. Handbook of energy use for world agriculture. (Pergamon Press, 1990).
Eggleston, H., Buendia, L., Miwa, K., Ngara, T. & Tanabe, K. 2006 IPCC guidelines for national greenhouse gas inventories. (Institute for Global Environmental Strategies Hayama, Japan, 2006).
Audsley, E., Stacey, K., Parsons, D. J. & Williams, A. G. Estimation of the greenhouse gas emissions from agricultural pesticide manufacture and use. (Cranfield University Press, 2009).
UNFCCC. Summary of global climate action at COP28. (UNFCCC: Dubai, the United Arab Emirates, 2023)
شكر وتقدير
تم دعم W.D. من قبل المؤسسة الوطنية للعلوم الطبيعية في الصين (رقم المنحة 42488201، 42122004)، ومؤسسة West Light التابعة للأكاديمية الصينية للعلوم (رقم المنحة xbzg-zdsys-202208)، وبرنامج تدريب المواهب Tianshan (رقم المنحة 2023TSYCLJ0050). نشكر ستيفان سيبرت على تقديم الاقتراحات حول مسودة المخطوطة.
مساهمات المؤلفين
ساهمت J.Q. و W.D. في وضع المفهوم، والمنهجية، ومراجعة الكتابة وتحريرها؛ وساهم W.D. و Y.C. في الإشراف، والتمويل. الاستحواذ، مراجعة الكتابة والتحرير؛ ساهم س.ز. في الإشراف، مراجعة الكتابة والتحرير؛ ساهم و.هـ. في الإشراف، مراجعة الكتابة والتحرير؛ ساهم ل.ر. في التصور، المنهجية، الإشراف، مراجعة الكتابة والتحرير. جميع المؤلفين وافقوا على النسخة النهائية من هذه المخطوطة.
المصالح المتنافسة
يعلن المؤلفون عدم وجود مصالح متنافسة.
معلومات إضافية
معلومات إضافية النسخة الإلكترونية تحتوي على المواد التكميلية متاحة على https://doi.org/10.1038/s41467-024-47383-5. يجب توجيه المراسلات والطلبات للحصول على المواد إلى ويلي دوآن.
معلومات مراجعة الأقران تشكر مجلة Nature Communications أنتوني كيندال والمراجعين الآخرين المجهولين على مساهمتهم في مراجعة هذا العمل. يتوفر ملف مراجعة الأقران.
المختبر الوطني الرئيسي لعلم البيئة الصحراوية والواحات، المختبر الرئيسي لسلامة البيئة والتنمية المستدامة في الأراضي الجافة، معهد شينجيانغ لعلم البيئة والجغرافيا، الأكاديمية الصينية للعلوم، أورومتشي 830011، الصين.جامعة الأكاديمية الصينية للعلوم، بكين 100049، الصين.محطة أكيسو الوطنية للمراقبة والبحث لنظام الزراعة البيئية للواحات، أكيسو، شينجيانغ 843017، الصين.جامعة شمال الصين لموارد المياه والطاقة الكهربائية، تشنغتشو 450046، الصين.قسم علم البيئة العالمي، مؤسسة كارنيجي للعلوم، ستانفورد، كاليفورنيا 94025، الولايات المتحدة الأمريكية.
Irrigation is a land management practice with major environmental impacts. However, global energy consumption and carbon emissions resulting from irrigation remain unknown. We assess the worldwide energy consumption and carbon emissions associated with irrigation, while also measuring the potential energy and carbon reductions achievable through the adoption of efficient and low-carbon irrigation practices. Currently, irrigation contributes 216 million metric tons of emissions and consumes 1896 petajoules of energy annually, representing 15% of greenhouse gas emissions and energy utilized in agricultural operations. Despite only of irrigated agriculture relies on groundwater sources, groundwater pumping accounts for of the total energy consumption in irrigation. Projections indicate that future expansion of irrigation could lead to a increase in energy usage. Embracing highly efficient, low-carbon irrigation methods has the potential to cut energy consumption in half and reduce emissions by . However, considering country-specific feasibility of mitigation options, global emissions may only see a reduction. Our research offers comprehensive insights into the energy consumption and carbon emissions associated with irrigation, contributing valuable information that can guide assessments of the viability of irrigation in enhancing adaptive capacity within the agricultural sector.
Seventy percent of worldwide water withdrawals and of water consumption are attributed to irrigated agriculture . Irrigation plays a pivotal role in ensuring global food security, contributing to of global food production while utilizing only of the planet’s cultivated areas . As the challenges of global warming and population growth intensify, exacerbating concerns about water and food security, irrigation emerges as a crucial adaptive measure to address future food crises and the impacts of climate change .
Presently, irrigation relies on fossil fuel-based energy for pumping, resulting in the emission of greenhouse gases ( GHGs. Numerous studies have quantified GHG emissions within
agriculture and food systems , covering aspects like land use , the production and utilization of synthetic nitrogen fertilizers enteric fermentation from livestock production , and the entire spectrum of food production, transportation, and consumption . Previous studies have provided global and regional datasets detailing GHG emissions related to agriculture . Additionally, prior research has assessed indirect GHG emissions linked to irrigation , such as methane emissions from reservoirs, ditches, and channels used for irrigation , methane and nitrous oxide emissions from rice fields , and nitrous oxide emissions under different fertilizer nitrogen use efficiencies .
Furthermore, earlier studies have estimated irrigation energy consumption and GHG emissions specifically from irrigation in China , India , the Mediterranean region , Pakistan , and the United States . However, there is a notable gap in studies providing global coverage of energy-related GHG emissions stemming from irrigation. Consequently, the extent to which GHG emissions from irrigation contribute to overall agricultural GHG emissions, and its role in global climate mitigation efforts, remains largely unknown. A comprehensive, globally distributed analysis of energy consumption and GHG emissions inherent to irrigation and pumping systems is imperative for devising effective mitigation strategies toward achieving agriculture with netzero emissions .
While endeavors to diminish GHG emissions have primarily centered around energy and industrial systems , studies addressing GHG reductions in agriculture, which accounts for of total GHG emissions ( equivalent per year) , have garnered comparatively little attention. Moreover, the emphasis has predominantly been on enhancing the efficiency of irrigation water rather than actively reducing energy consumption and emissions. Consequently, there is a pressing need for the sustainable development of irrigated agriculture, aiming to enhance food production with reduced reliance on water, energy, and GHG emissions .
Here, we quantify global energy consumption and emissions from irrigation spanning the years 2000-2010, addressing the current gap in understanding farm energy and emissions. We undertake a spatially explicit analysis of energy and emissions from both surface and groundwater pumping on a global scale, utilizing a resolution of . Our assessment involves quantifying energy use across different irrigation systems-surface, sprinkler, and drip irrigation-as well as pumping systems, encompassing electricity and diesel pumping. The results are then aggregated spatially to quantify countryspecific and global energy and emissions associated with irrigation. Secondly, we explore the phenomenon where groundwater, when pumped, may become supersaturated in carbonate relative to atmospheric pressure, leading to degassing and direct emissions in irrigated fields . Consequently, we quantify emissions originating from groundwater degassing and compare these emissions with those related to energy from pumping . Third, our study delves into estimating future energy and emissions resulting from sustainable irrigation expansion in a 2050 water-efficient and low-carbon scenario. This expansion is contingent on local water availability meeting irrigation water demand under global warming scenarios . Fourth, we evaluate the efficacy of various mitigation interventions and assess their feasibility in achieving a reduction in emissions within irrigation systems. Finally, we assess the energy and intensity of irrigation, comparing it with other farm operations such as fertilizers and machinery.
Results
Energy and emissions intensity of irrigation
The energy intensity and emissions intensity associated with irrigation exhibit significant variations across countries and continents (Fig. 1a, c). Median values for energy intensity and emissions intensity per unit of irrigation area stand at and ha, respectively (Fig. 1a, c). Asia registers the highest energy intensity ( ) and emissions intensity per hectare ( ), trailed by Africa ( ), South America ( , ), North America ( ), Oceania ( ), and Europe ( ) (Fig. 1a, c).
Our analysis reveals that the average energy use and emissions intensity of sprinkler irrigation is the highest ), followed by drip irrigation ( ), and surface irrigation ( ) (Fig. 1b, d). Additionally, the energy use and emissions intensity of diesel pumping ( ) exceeds that of electric pumping ( , ) (Fig. 1b, d).
Energy consumption and emissions from irrigation in 2000-2010
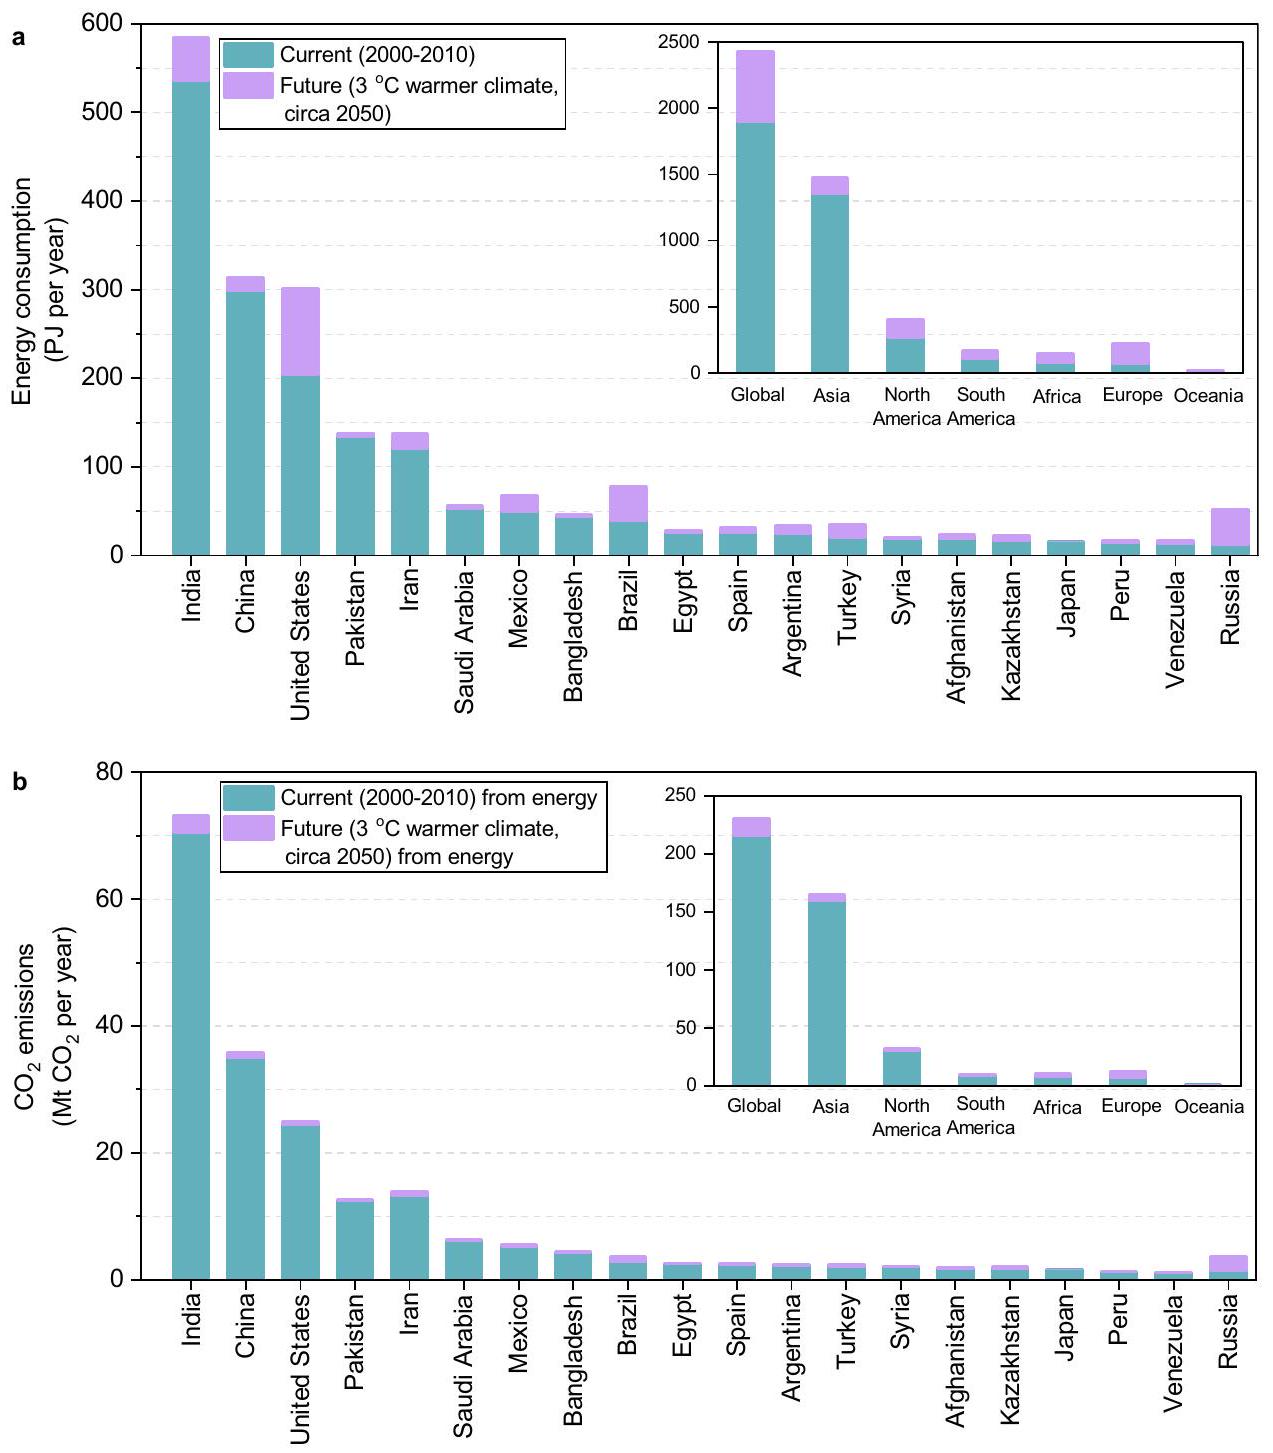
Our examination of energy consumption and emissions from irrigation between 2000 and 2010 reveals significant disparities among countries and continents (Fig. 2 and Supplementary Fig. 4). The global energy consumption attributed to irrigation is 1896 PJ, with Asia and North America accounting for and , respectively (Fig. 2a and Supplementary Fig. 4a). In Asia, India stands out the largest energy consumer with 535 PJ, followed by China ( 299 PJ), Pakistan ( 135 PJ), and Iran ( 121 PJ), constituting , and of Asia’s total energy consumption from irrigation, respectively (Fig. 2a). In North America, the United States emerges as the foremost energy consumer with 205 PJ, trailed by Mexico with 50 PJ, accounting for and of North America’s energy consumption from irrigation, respectively (Fig. 2a). Notably, five countries-India, China, the United States, Pakistan, and Iran-collectively contribute to of the global energy consumption from irrigation (Fig. 2a).
The overall emissions associated with irrigation stem from both embodied energy consumption and groundwater degassing – the removal of dissolved from water through degasification (Fig. 2b and Supplementary Figs. 4b and 5a). Our estimation indicates that the global total emissions from irrigation amount to per year, with originating from energy consumption (Fig. 2b) and from groundwater degassing (Supplementary Fig. 5a). Asia and North America emerge as the primary contributors to emissions, emitting and , respectively, collectively constituting of global total emissions. In contrast, Europe, Africa, Oceania, and South America contribute a combined total of in irrigation-related emissions (Fig. 2b). Additionally, the top five countries with the highest emissions from irrigation due to energy consumption are India, China, the United States, Iran, and Pakistan, emitting , and per year, respectively, accounting for of global emissions from energy consumption.
When considering emissions from groundwater degassing, India and the United States stand out the major contributors, emitting 2.9 and , respectively (Supplementary Fig. 5a). Notably, in major irrigation-intensive regions of the United States, India, Pakistan, Iran, and Saudi Arabia, emissions from groundwater degassing account for more than of total emissions from irrigation (Supplementary Fig. 5b).
Future energy consumption and emissions
Sustainable irrigation is irrigation practices that do not deplete groundwater stocks and impair freshwater ecosystems . As global warming and food demand increases, sustainable irrigation expansion is an important adaptation solution to future food crises and climate change . The expansion of irrigation inevitably leads to energy consumption and energy-related emissions. Therefore, we have also conducted an estimation of the energy and emissions associated with future irrigation expansion. Our assumption is that irrigation will expand in regions where water is expected to be locally available to meet the demand for irrigation water in a climate that is warmer-a projected warming level under business-as-usual scenarios . We presuppose that the existing country-specific efficiency of irrigation water usage, encompassing drip, sprinkler, and surface irrigation systems, remains constant in the envisioned scenario of sustainable irrigation expansion in the future. Our estimate indicates that the global additional energy consumption for future irrigation due to sustainable expansion would be 536 PJ, representing 28% of the total irrigation energy consumption in 2000-2010 (Fig. 2a and Supplementary Fig. 6a).
Fig. 1 | Energy and CO2 emissions intensity as a function of water-use intensity for 159 countries. The figure shows the comparison of energy and emissions intensity of different irrigation and pumping systems. a Energy intensity is expressed as the ratio of the energy consumed by irrigation to the irrigated area in a country (GJ/ha). b The energy intensity of each irrigation system (drip, sprinkler, and surface) or pumping system (diesel pumping and electric pumping) ( ) represents the energy consumption of five different irrigation and pumping system to pump and deliver one cubic meter of water. emissions intensity is
expressed as the ratio of the carbon dioxide emitted by irrigation to the irrigated area in a country ( ). d The emissions intensity of each irrigation system or pumping system is expressed in the same way as the energy intensity (g ). Energy and emissions intensity reflect the average level during the 2000-2010 period. Mean values in the boxplot are shown with diamonds and median values are shown with midlines. Dashed lines in the figure are used to distinguish countries that are above or below the median energy and emissions intensity per unit of water use.
In North America, Africa, and South America, the energy consumption arising from sustainable irrigation expansion is projected to require an additional 139 PJ, 63 PJ, and 60 PJ, respectively, each exceeding 50% of their current energy consumption (Fig. 2a). Notably, Europe anticipates an additional energy consumption from sustainable irrigation expansion of 148 PJ, which is twice its current energy consumption (Fig. 2a). The United States, India, Russia, Brazil, and Mexico are identified as the top countries with the highest energy consumption from sustainable irrigation expansion, contributing 97 PJ, 49 PJ, 39 PJ, 39 PJ, and 18 PJ, respectively, collectively accounting for
45% of the total energy consumption from sustainable irrigation expansion (Fig. 2a).
Assuming the full adoption of electric pumps and the projected regional carbon intensity of electricity in , the additional energyrelated emissions resulting from sustainable irrigation expansion are estimated to be per year, constituting 7% of the 20002010 total energy-related emissions (Fig. 2b and Supplementary Fig. 6b). India and Russia emerge as the most significant contributors to emissions from sustainable irrigation expansion, emitting 3 and per year, respectively.
Fig. 2 | Global energy consumption and CO2 emissions from irrigation. Countrylevel energy consumption and emissions are based on pixel sum statistics. a Energy consumption (PJ per year) under 2000-2010 and sustainable irrigation expansion in warmer climate. b CO2 emissions ( per year) from energy consumption under 2000-2010 and sustainable irrigation expansion of
warmer climate. We selected the top 20 countries with the highest energy consumption and emissions. The upper right subgraphs represent a summary of energy consumption and emissions by regions as well as globally. Geospatial distribution maps are provided in Supplementary Figs. 4 and 6.
Distribution of energy and emissions
Figure 3 illustrates the global distribution flow of energy consumption and energy-related emissions embedded in irrigation and pumping systems, along with irrigation water sources. Despite only of irrigated agriculture being supplied by groundwater , energy consumption from groundwater pumping constitutes ( 1670 PJ per year) of total energy consumption (Fig. 3a). Within this, ( 1234 PJ per year) of the energy consumption is attributed to diesel pumping, while electric pumping contributes to ( 436 PJ per year) of the energy usage (Fig. 3a). Energy consumption from surface irrigation systems constitutes 75% (1400 PJ per year) of the overall energy consumption, with energy consumption from sprinkler and drip irrigation accounting for only 21% ( 388 PJ per year) and 4% ( 78 PJ per year), respectively. Notably, a significant portion of energy consumption arises from groundwater extraction using diesel pumps combined with surface irrigation system, contributing to 57% ( 1065 PJ per year) of the total energy consumption.
In terms of emissions, per year) are attributed to groundwater pumping, with diesel pumping
contributing ( per year) and electric pumping contributing ( per year) (Fig. 3b). emissions from surface irrigation systems account for ( per year) of the total energy-related emissions, with ( per year) contributed by diesel pumps and ( per year) by electric pumps. Conversely, emissions from sprinkler and drip irrigation constitute only ( per year) and per year), respectively. Additionally, emissions from groundwater extraction using diesel pumps combined with surface irrigation systems contribute to of the total energy-related emissions.
Mitigation options to reduce energy use and emissions
As the implementation of irrigation and pumping systems directly contributes to energy consumption and, consequently, energy-related emissions, mitigation measures must address both the efficiency of irrigation equipment and the carbon intensity of energy. To explore viable options for reducing energy and emissions, we examine two main scenarios, namely enhancing irrigation systems to reduce water-
Fig. 3 | Sankey diagram of the distribution of energy consumption and energyrelated CO2 emissions from irrigation. a Energy consumption (PJ per year) during 2000-2010. b CO2 emissions from embodied energy consumption ( per year). In the figure, the total energy consumption and emissions do not include those (values in parentheses) from natural gas pumping. Geospatial distribution maps are provided in Supplementary Figs. 7-13.
use intensity and transitioning pumping systems to electric pumping while utilizing low-carbon electricity (see Methods).
Figure 4 shows global energy and emissions under these distinct scenarios. In comparison to the 2000-2010 period, both energy consumption and energy-related emissions from irrigation are cut in half under the drip irrigation scenario (Fig. 4). However, the sprinkler scenario results in an increase of 39% (743 PJ per year) in energy consumption and emissions (Fig. 4a). Shifting all diesel pumping to electric pumping leads to a 51% ( 966 PJ per year) reduction in energy consumption (Fig. 4a). Furthermore, under the electric pumping scenario, where the electricity sources include 2000-2010 electricity mix, solar, wind, nuclear, hydropower, and projected electricity mix in 2050, the energy-related emissions from irrigation are reduced to , and per year, respectively (Fig. 4b). Notably, the potential for emissions mitigation exceeds under low-carbon electricity scenarios and is limited to under the 2000-2010 electricity mix scenario (Fig. 4b).
Feasibility of solutions to reduce energy use and emissions Through our examination of solutions aimed at reducing energy and emissions, we demonstrate that both energy consumption and emissions can be significantly diminished under drip and electric pumping scenarios. Notably, in the electric pumping scenario, a substantial reduction in emissions is achievable only when electricity is low-carbon (Fig. 4). As a result, the proportion of low-carbon electricity in 2050 will play a pivotal role in determining the extent to which emissions from irrigation can be reduced. The feasibility of adopting drip irrigation becomes a crucial factor in selecting strategies
for energy and emissions reduction. For instance, given that drip irrigation is not applicable to rice cultivation, and not all countries will adopt low-carbon electricity by , significant reductions in emissions may not be attainable. Consequently, this section focuses on analyzing the feasibility of solutions aiming at reducing emissions.
Figure 5 shows the feasibility of drip irrigation and low-carbon electricity, as well as the potential contribution to reducing energyrelated emissions for each country. The feasibility of low-carbon electricity is greater than drip irrigation. The Middle East and North Africa and Western Europe have higher feasibility of drip irrigation, with and , respectively (Fig. 5a). The Middle East and North Africa, Southeast Asia and Oceania, Western Europe, Sub-Saharan Africa, East Asia, and Latin America and the Caribbean have higher feasibility of low-carbon electricity, both exceeding 30% (Fig. 5a).
The feasibility of low-carbon electricity, that is, how much the share of low-carbon electricity can increase by 2050 compared with 2000-2010, determines how much emissions can be reduced by 2050. Figure 5b shows that 55% of global energy-related emissions are reduced through a combination of low-carbon electricity and drip, with of the reduction being contributed by low-carbon electricity and by drip irrigation. Middle East and North Africa, Northern America, and Western Europe can achieve over reduction in energy-related emissions, with drip irrigation contributing of the reduction in the Middle East and North Africa (Fig. 5b). In South Asian and East Asia with intensive irrigation, over of energyrelated emissions are reduced through a combination of lowcarbon electricity and drip (Fig. 5b). However, in Eastern Europe and Central Asia, only of energy-related emissions are reduced through a combination of low-carbon electricity and drip (Fig. 5b).
Irrigation contribution to on farm energy use
Based on the analysis of energy intensity and emissions intensity of irrigation at the national scale (Fig. 1a,c), we further analyze irrigation contribution to farm energy use. Figure 6 shows the comparison of energy input and carbon emissions intensity of irrigation with total energy input and carbon emissions intensity on farm in sub-regions worldwide. Globally, energy input intensity of irrigation accounts for 32% of global energy input intensity, and over 50% in the sub-Saharan Africa, Middle East and North Africa, South Asia, and Latin America and the Caribbean (Fig. 6a). Accordingly, emissions intensity of irrigation accounts for of global emissions intensity, and over in sub-Saharan Africa, Middle East and North Africa, and South Asia (Fig. 6b). In addition, the largest energy input intensity and emission intensity of North America also come from irrigation.
Based on the cropland area from FAOSTAT , we estimate global energy consumption (PJ) and the corresponding carbon emissions (Mt ) from fertilizers, machinery, and fuel (Supplementary Table 8). We find that energy consumption and carbon emissions from irrigation account for approximately of the total energy consumption and carbon emissions in agriculture (Supplementary Table 8).
Discussion
Since the Green Revolution of the 1960s, global crop production has increased by 3.7 times due to the intensification, mechanization, and modernization of agricultural systems . However, gains in yield have come at a considerable cost in terms of increased energy input and considerable environmental footprint . Irrigation development, as the concentrated embodiment of agricultural intensification, involved high energy consumption, led to reliance on fossil fuel, and emissions (Fig. 2). In addition, energy input and carbon emissions from irrigation contribute significantly to total energy consumption and carbon emissions in agriculture (Fig. 6 and Supplementary Table 8).
High energy input and carbon footprint of irrigation in turn would potentially threaten the growth and stability of food production worldwide, especially in regions heavily dependent on fossil fuels .
Fig. 4 | Mitigation potentials of energy use and CO2 emissions under different scenarios. a The sprinkler scenario and drip scenario have different water-use intensities. For the electric pumping scenario, the energy consumption of irrigation does not change with the intensity of electricity. In sprinkler and drip scenarios, intensity of energy (electricity during 2000-2010) remains unchanged. In electric pumping scenarios, electricity comes from 2000-2010 electricity mix, solar, wind, nuclear, hydropower, or a mix of the four low-carbon electricity
according to IEA net-zero by 2050 projections . The baseline scenario reflects energy consumption and energy-related emissions during 2000-2010. The 2000-2010 electricity mix represents the electricity production structure in 20002010, where the electricity comes from fossil fuels, nuclear, hydro, geothermal, solar, wind, tide, wave, ocean and biofuels . Geospatial distribution maps are provided in Supplementary Figs. 14-16.
Furthermore, the high energy input of irrigation also increases the pressure on the energy supply system and competition for energy from other sectors. In Pakistan and Bangladesh, the energy consumption of irrigation alone accounts for of the total energy supply in 2000-2010 (Supplementary Fig. 19a). With future sustainable irrigation expansion (Fig. 2), the additional energy consumption of irrigation will add pressure on the energy supply in African and European countries (Supplementary Fig. 19b).
We provide solutions for achieving low energy consumption and carbon emissions as well as highly efficient water use in irrigated agriculture (Figs. 4 and 5). Drip and sprinkler represent two waterefficient irrigation systems. Still, our results show that sprinkler irrigation system has higher energy and emissions intensity than surface irrigation and does not reduce energy use and emissions of irrigation globally (Figs. 1b, d and 4). Therefore, priority should be given to drip irrigation system in the deployment of farm infrastructure. The exception is when switching from gravity irrigation to drip irrigation increases energy consumption and emissions of irrigation, where there is a trade-off between water savings and reductions of energy and emissions , as exemplified by Sudan and Ethiopia (Supplementary Figs. 4 and 14). In this case, a benefit-cost analysis should be incorporated into the trade-off. If carbon emissions are also considered as an investment cost, then the cost increase induced by the adoption of drip irrigation systems includes the initial capital investment of equipment with benefits throughout the life cycle, usually 15-25 years, the converted cost of energy input, and carbon taxes . The economic returns from investments in drip irrigation technology include improvement in production, a shift in cropping rotation, and water and fertilizer savings . If the benefits are greater than the costs, the investment in drip irrigation systems can be treated as economically viable in countries like Sudan and Ethiopia.
The benefit-cost analysis also applies to other countries around the world.
Remarkably, drip irrigation is not applicable to all crops (Supplementary Table 6), and its contribution to reducing global emissions of irrigation is limited (Figs. 4b and 5b). Another solution in our study is to switch from energy-intensive diesel to efficient electric pumping (Fig. 1b) and use low-carbon electricity. Low-carbon electric pumps have a significant effect on reducing emissions of irrigation (Figs. 4b and 5b), and have the same efficacy as drip irrigation in reducing energy consumption of irrigation (Fig. 4a). Low-carbon electricity brings substantial long-term benefits to the country, such as reducing reliance on fossil fuels . However, from farmer’s perspective, the reduction of emissions is not a priority. An introduced carbon price may facilitate the adoption of low-carbon electricity, but it may also erode the relative profitability of irrigated crop production . Therefore, efforts should be put into the development of low-carbon electricity and cost reduction for countries worldwide in the future. On the other hand, global energy consumption and emissions from irrigation are dominated by groundwater pumping (Fig. 3). In this case, it is recommended to give priority to the use of surface water and shallow groundwater for irrigation. Meanwhile, the management of groundwater resources should be strengthened to prevent the decline in groundwater levels from offsetting the energy efficiency gains from the adoption of drip irrigation systems .
Currently, spatially explicit estimates of global irrigation water withdrawals for irrigation are still before , which prevents our study from providing the most time-sensitive analysis of global energy consumption and emissions of irrigation. However, previous studies have shown that irrigation water withdrawal is driven by irrigated area . Thus, we still can provide an updated understanding of global energy consumption and emissions of irrigation after 2010,
Fig. 5 | Feasibility of solutions to reduce CO2 emissions of irrigation on a country-level scale. a Feasibility (%) of drip and low-carbon electricity. b Potential contribution (%) of drip and low-carbon electricity to energy-related emissions reduction based on the feasibility analysis. The pie chart shows the contribution ratio of low-carbon electricity and drip to energy-related emissions reduction.
The values at the bottom of the pie chart represent the total contribution due to a combination of the two solutions. For a more detailed comparison of regional differences, we further divided the six continents into nine sub-regions (See Source Data for the rationale of the classification). Country-level feasibility of drip and lowcarbon electricity is provided in Supplementary Fig. 18. GS (2016) 1966.
assuming all other conditions except irrigated areas remain as in 20002010. Based on energy and emissions intensity per unit of irrigated area (Fig. 1 a,c) and country-specific irrigated area derived from FAO AQUASTAT in 2020, global energy consumption and emissions of irrigation increased by about 14% in 2020 compared to 2000-2010, with significant increases in some African countries (Supplementary Fig. 23).
Our study sheds light on the previously uncharted territory of global energy consumption and carbon emissions associated with irrigation. This research not only provides a comprehensive understanding of global direct energy use and associated emissions from irrigation but also charts a path forward aiming for less water, energy, and emissions in irrigated agriculture. Furthermore, previous work showed biophysical limits to irrigation showing where water is locally available to meet crop water demand . However, irrigation is not only influenced by water availability but also socioeconomic factors, a phenomenon known as agricultural economic water scarcity . Mapping at high resolution the energy and carbon emissions from irrigation allows us to understand where energy will be a barrier to irrigation. Our study provides detailed information on energy usage from irrigation and can inform on the feasibility of irrigation to increase adaptive capacity in the agricultural sector.
Methods
Energy consumption and energy-related emissions estimates
Irrigation energy use is a function of the volume of irrigation water and of the total pressure head crucially affected by irrigation systems (drip, sprinkler, and surface irrigation), pumping systems (diesel
pumping and electric pumping), and irrigation water source (surface or groundwater) (Supplementary Table 1). Global groundwater table depth datasets are derived from Fan et al. . The percentage of surface water and groundwater for irrigation is taken from Siebert et al. . Country-level datasets on the proportion of drip, sprinkler, and surface irrigation are obtained from Jägermeyr et al. . Irrigation water withdrawal datasets reconstructed based on the global hydrological model LPJmL during 2000-2010 are derived from Huang et al. , which are calibrated and validated by using reported data from FAO AQUASTAT and USGS . The groundwater table depth and irrigation water withdrawal datasets were resampled from 30 arc-second and 30 arc-minutes to a 5 arc-minutes resolution using the nearest neighbor method to spatially match the datasets on the proportion of irrigation water source.
We assume that typical operating pressures for surface, drip, and sprinkler irrigation are (this is set to 0 for surface water sources), 1 bar and 3 bar , respectively. The operating friction losses of the piped distribution system are equal to 0.69 bar for all systems derived from Brown et al. . Specifically, the energy requirement can be calculated using Eqs. (1) and (2):
where is energy requirement; is irrigation water volume; is the total water pressure head calculated as the sum of the lift from the water table to the ground surface, drawdown depth
Fig. 6 | Contribution of irrigation energy input intensity to total energy input intensity and comparison of CO2 emissions intensity generated by energy inputs intensity during 2000-2010. a Energy inputs intensity comes from irrigation, fertilizers ( , and ) production and transport, machinery (includes tractors, harvesters, and threshers ) manufacturing, and fuel consumption of machines. b Besides GHG emissions generated by the four energy inputs, soil
emissions from N fertilizers use are considered. The useful life of machinery is assumed to be a 20-year average. The fuel used in the machinery mainly considers liquefied petroleum gas, motor gasoline, and gas-diesel oils. Other greenhouse gas emissions (e.g. and ) generated by energy inputs are converted to carbon dioxide equivalents ( ), using global warming potential (GWP) values of the IPCC AR5 with no climate feedback (GWP-CH4 ; GWP- .
(D, both from cone of depression and additional drawdown from well efficiency), operating pressure ( ) and friction losses of pipe ( ); represent the efficiency of the pump and prime mover (%). The prime mover efficiency depends on energy source (mainly diesel and electricity). The lift parameter is represented by groundwater table depth. Due to the lack of global country-level information on the proportion of irrigation pumps (diesel and electric), we estimated the ratio of electric to diesel pumps by indirectly estimating grid coverage in irrigated areas at the pixel scale. According to the best statistical data, county-scale irrigation pump information (diesel, electricity, and natural gas pumps) was used separately for the United States (Supplementary Methods Section 1.4). Estimations of drawdown depth, the efficiency of the pump and prime mover, and proportionality for irrigation pumps are described in detail in Supplementary Methods Section 1.1, 1.2, and 1.3.
The energy-related emission of irrigation can be calculated as the energy requirement of irrigation multiplied by the carbon emission factor. The energy-related emission from irrigation can be calculated using Eq. (3):
where is emissions; is energy consumption; ( ) is emission factor of energy consumption. The national-scale carbon intensity of electricity datasets during 2000-2010 are derived from IEA and Our World in Data , which depends on the source of electricity. Because the carbon emission intensity of electricity is influenced by the electricity trade, we considered the influence of the electricity trade (Supplementary Method Section 1.5). emissions from diesel to produce 1 kWh of
energy are equivalent to . Supplementary Discussion Section 2.1 provides an analysis of the precision of our results.
emissions from groundwater degassing
Groundwater water is generally supersaturated in compared to the overlying atmosphere, and this water-air gradient leads to degassing when groundwater is pumped to the surface. Groundwater degassing is a source of emissions from irrigation . However, emissions from groundwater degassing caused by irrigation were unquantified. The emissions from groundwater degassing caused by irrigation can be calculated using Eq. (4):
where is emissions from groundwater degassing caused by irrigation; is groundwater volume due to irrigation ( ); is the ratio of groundwater withdrawal for irrigated to total groundwater withdrawal; is concentration in groundwater. We used global average annual groundwater pumping datasets during 2000-2009 with a resolution of derived from Döll et al. . The datasets are based on the WaterGAP 2.2 model combined with local well observation or GRACE satellite observation, which can largely reduce uncertainty inherent in flux-based method . Groundwater is mainly used for irrigation, domestic and manufacturing, and the proportion of groundwater use in the domestic and manufacturing sectors suggested by Döll et al. is and , respectively. Reconstructed sectoral water withdrawals datasets were obtained from Huang et al. . A survey of water quality for groundwater aquifer of the United States shows that the and quantiles of bicarbonate concentration are and , respectively . We assume that the global bicarbonate concentration of groundwater is likely like that measured
in the United States. This is subsequently converted to concentration according to Eq. (5):
Finally, the concentration of groundwater ranges from to .
Energy and emissions intensity
Based on the estimation of energy and emissions, we compared the differences in energy use intensity ( ) and emissions intensity ( ) between countries. Using geospatial information from irrigation systems and pumping systems, we compared spatially explicit differences in energy and emissions per unit of water use between different irrigation and pumping systems.
The energy consumption for irrigation comes directly from the pumping and delivery of water, with diesel and electricity consumption and indirect emissions of carbon dioxide. However, the energy and emissions intensity of the same irrigation and pumping system is different due to the difference in irrigation water source (surface water and groundwater) and groundwater table depth. Furthermore, differences in operating pressure and pumping efficiency (Supplementary Methods Section 1.2) make the average energy and emissions intensity different between irrigation systems and pumping systems.
Setting scenarios for mitigation options
To test the impact of mitigation options, the 2000-2010 condition is defined as a baseline. Furthermore, we selected two main options for reducing energy and emissions and established multiple scenarios under each option.
The first scenario is to upgrade the agricultural irrigation systems. Different irrigation systems reflect different irrigation efficiency, implying different water-saving efficiency. Globally, drip irrigation will save and of irrigation water withdrawal compared with sprinkler and surface irrigation, respectively, whereas sprinklers will save of irrigation water withdrawal compared to surface irrigation as proposed by Jägermeyr et al. (Supplementary Table 4). Therefore, based on the current irrigation system, two more efficient irrigation scenarios are represented by upgrading surface irrigation to sprinklers and to drip irrigation. We defined the first scenario as a sprinkler scenario and the second scenario as a drip scenario (Supplementary Table 5). Furthermore, we tested the effects of drip and sprinkler irrigation efficiency on energy consumption and emissions by changing water-saving efficiency by 5% (Supplementary Method Section 1.10 and Supplementary Table 7).
The other option is to reduce emissions by low-carbon electricity, which comes from solar, wind, nuclear, hydropower, and a mix of the four low-carbon electricity sources by 2050 . However, the abstraction and application of irrigation water do not depend solely on electric pumping; diesel pumping also accounts for a considerable proportion in irrigated agriculture (Supplementary Table 3). Therefore, we converted all diesel pumping to electric pumping (electric pumping scenario). The carbon footprint of solar, wind, nuclear, and hydropower based on lifecycle assessment is , and kWh , respectively . The carbon footprint ( ) of electricity mix is estimated based on the carbon footprint as well as electricity generation by 2050 of these four powers (Supplementary Method Section 1.6). Likewise, we evaluated the uncertainty of carbon footprint for solar, wind, nuclear, and hydropower on mitigation potential (Supplementary Method Section 1.10 and Supplementary Table 7).
Feasibility of mitigation options
Based on the scenario setting for reducing energy and emissions, we further analyzed the feasibility of mitigation options. First, we evaluated the feasibility of drip irrigation and low-carbon electricity, as well as the potential contribution of drip and low-carbon electricity. The feasibility and potential contribution of drip irrigation and lowcarbon electricity can be calculated using Eqs. (6) – (9):
where is the feasibility of drip irrigation; is the irrigation water consumption of crops that can adopt drip irrigation (Supplementary Table 6); is the total irrigation water consumption for 26 crops; Drip is the current ratio of drip. In this study, the irrigation water consumption of 26 crops from 2000-2010 is calculated based on the WATNEEDS model (Supplementary Method Section 1.7). The is the feasibility of low-carbon electricity; is the share of low-carbon electricity by ; is the share of low-carbon electricity during 2000-2010. represents the potential contribution of drip; represents the contribution of emissions reduction under the drip scenario. represents the potential contribution of low-carbon electricity; represents the average contribution under the electric pumping scenario where electricity comes from wind, solar, nuclear, and hydropower. We used regional (Europe, Asia, Africa, Middle-East, North America, Latin America, Commonwealth of Independent States (CIS), and Pacific) low-carbon electricity targets for 2050, under which current NDC’s (Nationally Determined Contributions) emission targets for 2030 can successfully achieve, as well as a continuation of consistent efforts post-2030.
For a combination of low-carbon electricity and drip irrigation, the contribution value of emissions reduction can be calculated using Eq. (10):
The feasibility of low-carbon electricity is set to 0, when the 2000-2010 national share of low-carbon electricity exceeds the projected regional targets by 2050 (Supplementary Discussion Section 2.3).
Other energy inputs and emissions
From the FAOSTAT database , we obtained fertilizers ( , and ) use ( ) and cropland area data for each country during 2000-2010. Cropland areas were used to calculate inputs per hectare. We also obtained machinery (number of tractors, harvesters and threshers) data from the FAOSTAT database during 2000-2005 . Furthermore, we converted the physical quantities to energy units (GJ/ ha) by using time-varying energy conversion factors, which can be found in Pellegrini et al. . For machinery, we assumed an average lifespan of 20 years with an energy conversion factor of based on Pellegrini et al. .
We further converted energy input intensity ( ) to emissions intensity ( ha) by using carbon emissions factors from the literature. For the production and transport of , and fertilizers, we used the regional (Western Europe, Eastern Europe, Central and South America, Asia, Australia, New Zealand, and global
average for the rest of the countries) emission factors ( . Furthermore, we used the regional (Africa, East Asia, Europe, Latin America, North America, Oceania, South Asia, CIS, and global average for the rest of the countries) emission factors for N fertilizers use (direct soil emissions) . For machinery, we used an average emission factor of for the three machineries (Supplementary Method Section 1.9). Due to the lack of information on the types and corresponding proportions of fuel consumed by machinery, we assumed that the fuel consumed by these three kinds of machinery is mainly derived from liquefied petroleum gas, motor gasoline, and gasdiesel oils, which emit , and , and used average emission factor for the three fuels from the IPCC . Then, we used the total cropland area from FAOSTAT to estimate total energy inputs and GHG emissions from fertilizers, machinery and fuel during 2000-2010. Due to the lack of reliable data for pesticides , our analysis did not consider the energy input of pesticides.
Caveats
The proportion of surface water and groundwater plays a crucial role in accurately estimating global energy consumption and emission for irrigation. In this study, the global average annual irrigation water withdrawals were during 2000-2010, which agrees with the results ( in 2012) reported by FAO’s AQUASTAT . However, because the irrigation water sources proportion data provided by Siebert et al . and irrigation water withdrawal data provided by Huang et al . do not completely match spatially; only of water are involved in the estimation of energy and emissions. Therefore, the results in our study are a lower-bound estimate of emissions from irrigation.
Due to the lack of country-level information on irrigation pumps, we used the proportion of the total irrigated area covered by the global grid network as the proportion of the electric pump, and the rest of the irrigated areas that are not connected to the grid used diesel pumps. Although our estimation results are relatively consistent with the results of previous literature surveys in eight countries (Supplementary Fig. 21 and Supplementary Table 3), there are still uncertainties.
When we calculated the mitigation potential of low-carbon electricity to emissions, typical values of carbon footprints of solar, wind, nuclear, and hydropower were assumed. However, differences in technology levels between countries and wide ranges of carbon footprints for low-carbon electricity throughout the life cycle led to uncertainties in the mitigation potential of low-carbon electricity on emissions of irrigation (Supplementary Table 7). Considering the availability of data, we use regional or fixed conversion factors when estimating energy inputs and corresponding carbon emissions of other farm operations, such as emission factors for the use of liquefied petroleum gas, motor gasoline, and gas-diesel oils, which indirectly affects the proportion of irrigation energy input in the total energy input on farms.
In light of the ambitious renewable energy policies reported at COP28 (28th Conference of the Parties to the United Nations Framework Convention on Climate Change) aimed at achieving net-zero emissions targets by , our findings may underestimate the potential for carbon emissions reduction from irrigation by 2050. Notably, major consumer of irrigation energy-India, China, Pakistan, and Iran-have not committed to tripling nuclear energy nor increasing renewable power generation capacity threefold by 2030 . Consequently, while global carbon emissions from the energy sector are projected to significantly decrease by 2050, reducing carbon emissions from irrigation will necessitate these countries to make greater commitments towards renewable energy adoption. Furthermore, the renewable energy policies outlined at COP28 do not delineate the proportion of low-carbon electricity expected by 2050 for individual countries or continents, hindering precise estimations of the potential
reduction in irrigation carbon emissions. Our study offers a framework for evaluating the potential reduction in irrigation-related carbon emissions, enabling updates to our findings as new data becomes available.
Reporting summary
Further information on research design is available in the Nature Portfolio Reporting Summary linked to this article.
Data availability
This work used data collected from a variety of literatures and publicly available sources, which are be listed in the main text and Supplementary material. All analyses are based on these collected datasets. Results from all analyses are available in Source data as Excel spreadsheets alongside the paper. Data for the main results of this study are publicly available from https://doi.org/10.5281/zenodo. 10118986. Source data are provided with this paper.
Code availability
The data were analyzed with the statistical software MATLAB and Origin. The script is publicly available from https://doi.org/10.6084/ m9.figshare.25392874.v1.
References
Gleick, P. H., Cooley, H., Morikawa, M., Morrison, J. & Cohen, M. J. The world’s water 2008-2009: The biennial report on freshwater resources. Available online at: https://islandpress.org/books/ worlds-water-2008-2009#contents. Accessed 4th March 2023.
Portmann, F. T., Siebert, S. & Döll, P. MIRCA2000-Global monthly irrigated and rainfed crop areas around the year 2000: A new highresolution data set for agricultural and hydrological modeling. Glob. Biogeochem. Cycle. 24, GB1011 (2010).
Rosa, L. Adapting agriculture to climate change via sustainable irrigation: Biophysical potentials and feedbacks. Environ. Res. Lett. 17, 063008 (2022).
Rosa, L. et al. Potential for sustainable irrigation expansion in a 3 C warmer climate. Proc. Natl. Acad. Sci 117, 29526-29534 (2020).
Liu, Y. et al. Global and regional evaluation of energy for water. Environ. Sci. Technol. 50, 9736-9745 (2016).
Rosa, L. et al. Energy implications of the 21st century agrarian transition. Nat. Commun. 12, 1-9 (2021).
Rothausen, S. G. & Conway, D. Greenhouse-gas emissions from energy use in the water sector. Nat. Clim. Chang. 1, 210-219 (2011).
Rosa, L. & Gabrielli, P. Achieving net-zero emissions in agriculture: a review. Environ. Res. Lett. 18, 63002 (2023).
Hong, C. et al. Global and regional drivers of land-use emissions in 1961-2017. Nature. 589, 554-561 (2021).
Tonelli, D., Rosa, L., Gabrielli, P., Parente, A. & Contino, F. Costcompetitive decentralized ammonia fertilizers production can increase food security. Nat. Food. In Press. https://www. researchsquare.com/article/rs-3392837/v1 (2023).
Rosa, L. & Gabrielli, P. Energy and food security implications of transitioning synthetic nitrogen fertilizers to net-zero emissions. Environ. Res. Lett. 18, 14008 (2022).
Chang, J. et al. Revisiting enteric methane emissions from domestic ruminants and their source signature. Nat. Commun. 10, 1-14 (2019).
Crippa, M. et al. Food systems are responsible for a third of global anthropogenic GHG emissions. Nat. Food. 2, 198-209 (2021).
Li, M. et al. Global food-miles account for nearly of total foodsystems emissions. Nat. Food. 3, 445-453 (2022).
Food and Agriculture Organization of the United Nations. FAOSTAT database. http://www.fao.org/faostat/en/ Accessed 4th March 2023.
Yang, Y. et al. Sustainable irrigation and climate feedbacks. Nat. Food. 4, 654-663 (2023).
Aguilera, E. et al. Methane emissions from artificial waterbodies dominate the carbon footprint of irrigation: a study of transitions in the food-energy-water-climate nexus (Spain, 1900-2014). Environ. Sci. Technol. 53, 5091-5101 (2019).
Kuang, W., Gao, X., Tenuta, M. & Zeng, F. A global meta-analysis of nitrous oxide emission from drip-irrigated cropping system. Glob. Change Biol. 27, 3244-3256 (2021).
Zou, X. et al. Greenhouse gas emissions from agricultural irrigation in China. Mitig. Adapt. Strateg. Glob. Chang. 20, 295-315 (2015).
Rajan, A., Ghosh, K. & Shah, A. Carbon footprint of India’s groundwater irrigation. Carbon Manag 11, 265-280 (2020).
Daccache, A., Ciurana, J. S., Rodriguez Diaz, J. A. & Knox, J. W. Water and energy footprint of irrigated agriculture in the Mediterranean region. Environ. Res. Lett. 9, 124014 (2014).
Siyal, A. W. & Gerbens-Leenes, P. W. The water-energy nexus in irrigated agriculture in South Asia: Critical hotspots of irrigation water use, related energy application, and greenhouse gas emissions for wheat, rice, sugarcane, and cotton in Pakistan. Front. Water. 4, 941722 (2022).
Driscoll, A. W., Conant, R. T., Marston, L. T., Choi, E. & Mueller, N. D. Greenhouse gas emissions from US irrigation pumping and implications for climate-smart irrigation policy. Nat. Commun. 15, 675 (2024).
Gabrielli, P. et al. Net-zero emissions chemical industry in a world of limited resources. One Earth 6, 682-704 (2023).
Davis, S. J. et al. Net-zero emissions energy systems. Science 360, eaas9793 (2018).
Jägermeyr, J. et al. Water savings potentials of irrigation systems: global simulation of processes and linkages. Hydrol. Earth Syst. Sci. 19, 3073-3091 (2015).
D’Odorico, P. et al. The Global Food-Energy-Water Nexus. Rev. Geophys. 56, 456-531 (2018).
Wood, W. W. & Hyndman, D. W. Groundwater Depletion: A Significant Unreported Source of Atmospheric Carbon Dioxide. Earth’s Future 5, 1133-1135 (2017).
Rosa, L. et al. Closing the yield gap while ensuring water sustainability. Environ. Res. Lett. 13, 104002 (2018).
Rosa, L., Chiarelli, D. D., Tu, C., Rulli, M. C. & D’Odorico, P. Global unsustainable virtual water flows in agricultural trade. Environ. Res. Lett. 14, 114001 (2019).
Siebert, S., Henrich, V., Frenken, K. & Burke, J. Update of the digital global map of irrigation areas to version 5. (Rheinische Friedrich-Wilhelms-Universität, Bonn, Germany and Food and Agriculture Organization of the United Nations, Rome, Italy, 2013).
Pellegrini, P. & Fernández, R. J. Crop intensification, land use, and on-farm energy-use efficiency during the worldwide spread of the green revolution. Proc. Natl. Acad. Sci 115, 2335-2340 (2018).
Mushtaq, S., Maraseni, T. N., Maroulis, J. & Hafeez, M. Energy and water tradeoffs in enhancing food security: A selective international assessment. Energy Policy 37, 3635-3644 (2009).
Maraseni, T. N., Mushtaq, S. & Reardon-Smith, K. Climate change, water security and the need for integrated policy development: the case of on-farm infrastructure investment in the Australian irrigation sector. Environ. Res. Lett. 7, 34006-34012 (2012).
Mushtaq, S., Maraseni, T. N. & Reardon-Smith, K. Climate change and water security: Estimating the greenhouse gas costs of achieving water security through investments in modern irrigation technology. Agric. Syst. 117, 78-89 (2013).
Maraseni, B. T. & Cockfield, G. Including the costs of water and greenhouse gas emissions in a reassessment of the profitability of irrigation. Agric. Water Manage. 103, 25-32 (2012).
Bundschuh, J. et al. Geothermal, wind and solar energy applications in agriculture and aquaculture. (CRC Press, 2017).
Maraseni, T., An-Vo, D. A., Mushtaq, S. & Reardon-Smith, K. Carbon smart agriculture: An integrated regional approach offers significant potential to increase profit and resource use efficiency, and reduce emissions. J. Clean Prod. 282, 124555 (2020).
McCarthy, B. et al. Trends in Water Use, Energy Consumption, and Carbon Emissions from Irrigation: Role of Shifting Technologies and Energy Sources. Environ. Sci. Technol. 54, 15329-15337 (2020).
Smidt, S. J. et al. Complex water management in modern agriculture: Trends in the water-energy-food nexus over the High Plains Aquifer. Sci. Total Environ. 566, 988-1001 (2016).
McDermid, S., Nocco, M. & Lawston-Parker, P. Irrigation in the Earth system. Nat. Rev. Earth Environ. 4, 435-453 (2023).
Puy, A., Borgonovo, E., Piano, S. L. & Levin, S. Irrigated areas drive irrigation water withdrawals. Nat. Commun. 12, 4525 (2021).
Rosa, L., Chiarelli, D. D., Rulli, M. C., Dell’Angelo, J. & D’Odorico, P. Global agricultural economic water scarcity. Sci. Adv. 6, eaaz6031 (2020).
Fan, Y., Li, H. & Miguez-Macho, G. Global patterns of groundwater table depth. Science. 339, 940-943 (2013).
Siebert, S. et al. Groundwater use for irrigation-a global inventory. Hydrol. Earth Syst. Sci. 14, 1863-1880 (2010).
Huang, Z. et al. Reconstruction of global gridded monthly sectoral water withdrawals for 1971-2010 and analysis of their spatiotemporal patterns. Hydrol. Earth Syst. Sci. 22, 2117-2133 (2018).
Dieter, C. A. et al. Estimated use of water in the United States in 2015: U.S. Geological Survey Circular 1441. https://pubs.usgs.gov/ circ/1441/circ1441.pdf (2018). Accessed 10th June 2023.
Hanson, B. & Putnam, D. Flood irrigation of alfalfa: how does it behave. In: Proceedings 34th California Alfalfa & 2004 13-15 (National Alfalfa Symposium, San Diego, CA, 2023) Accessed 8th April 2023.
Brown, G. O. The history of the Darcy-Weisbach equation for pipe flow resistance. In Environmental and Water Resources History, 34-43 Available online at: https://doi.org/10.1061/40650(2003)4 Accessed 4th June 2023.
IEA. emissions from fuel combustion highlights. (International Energy Agency, 2012).
Wang, J. et al. China’s water-energy nexus: greenhouse-gas emissions from groundwater use for agriculture. Environ. Res. Lett. 7, 14035 (2012).
Döll, P., Müller Schmied, H., Schuh, C., Portmann, F. T. & Eicker, A. Global-scale assessment of groundwater depletion and related groundwater abstractions: Combining hydrological modeling with
information from well observations and GRACE satellites. Water Resour. Res. 50, 5698-5720 (2014).
Wada, Y. Modeling Groundwater Depletion at Regional and Global Scales: Present State and Future Prospects. Surv. Geophys. 37, 419-451 (2016).
Desimone, L. A. Quality of water from domestic wells in principal aquifers of the United States, 1991-2004. (U.S. Geological Survey, 2009).
UNECE. Carbon neutrality in the UNECE region: integrated life-cycle assessment of electricity source. (Geneva: United Nations, 2022).
Ubierna, M., Santos, C. D. & Mercier-Blais, S. Water Security and Climate Change: Hydropower Reservoir Greenhouse Gas Emissions. (Water Security Under Climate Change, 2022).
Chiarelli, D. D. et al. The green and blue crop water requirement WATNEEDS model and its global gridded outputs. Sci. Data. 7, 273 (2020).
FAO. Global Database of GHG Emissions Related to Feed Crops: Methodology. Version 1. Livestock Environmental Assessment and Performance Partnership. (FAO, Rome, Italy, 2017).
Menegat, S., Ledo, A. & Tirado, R. Greenhouse gas emissions from global production and use of nitrogen synthetic fertilisers in agriculture. Sci Rep 12, 14490 (2022).
Saunders, C. M., Barber, A. & Taylor, G. J. Food miles-comparative energy/emissions performance of New Zealand’s agriculture industry. (Lincoln Univ, Canterbury, New Zealand, 2006).
Stout, B. A. Handbook of energy use for world agriculture. (Pergamon Press, 1990).
Eggleston, H., Buendia, L., Miwa, K., Ngara, T. & Tanabe, K. 2006 IPCC guidelines for national greenhouse gas inventories. (Institute for Global Environmental Strategies Hayama, Japan, 2006).
Audsley, E., Stacey, K., Parsons, D. J. & Williams, A. G. Estimation of the greenhouse gas emissions from agricultural pesticide manufacture and use. (Cranfield University Press, 2009).
UNFCCC. Summary of global climate action at COP28. (UNFCCC: Dubai, the United Arab Emirates, 2023)
Acknowledgements
W.D. was supported by the National Natural Science Foundation of China (grant no. 42488201, 42122004), the West Light Foundation of the Chinese Academy of Sciences (grant no. xbzg-zdsys-202208), and the Tianshan Talent Training Program (grant no. 2023TSYCLJ0050). We thank Stefan Sibert for providing suggestions on the draft manuscript.
Author contributions
J.Q. and W.D. contributed to conceptualization, methodology, writing review & editing; W.D. and Y.C. contributed to supervision, funding
acquisition, writing-review & editing; S.Z. contributed to supervision, writing – review & editing; W.H. contributed to supervision, writingreview & editing; L.R. contributed to conceptualization, methodology, supervision, writing-review & editing. All authors approved the final version of this manuscript.
Competing interests
The authors declare no competing interests.
Additional information
Supplementary information The online version contains
supplementary material available at https://doi.org/10.1038/s41467-024-47383-5.
Correspondence and requests for materials should be addressed to Weili Duan.
Peer review information Nature Communications thanks Anthony Kendall and the other, anonymous, reviewer(s) for their contribution to the peer review of this work. A peer review file is available.
State Key Laboratory of Desert and Oasis Ecology, Key Laboratory of Ecological Safety and Sustainable Development in Arid Lands, Xinjiang Institute of Ecology and Geography, Chinese Academy of Sciences, Urumqi 830011, China. University of Chinese Academy of Sciences, Beijing 100049, China. Akesu National Sation of Observation and Research for Oasis Agro-ecosystem, Akesu, Xinjiang 843017, China. North China University of Water Resources and Electric Power, Zhengzhou 450046, China. Department of Global Ecology, Carnegie Institution for Science, Stanford, CA 94025, USA.