نقص المياه الجوفية هو تحدٍ عالمي حرج، خاصة في الأراضي الجافة المزروعة بشكل مكثف، مع وجود حالات موثقة قليلة من التعافي الناجح. هنا، نبلغ عن عكس لافت لانخفاض المياه الجوفية على المدى الطويل في سهل شمال الصين، وهو واحد من أكثر الخزانات المائية استنزافًا في العالم. استنادًا إلى تحليل شامل لمستويات المياه الجوفية من أكثر من 2000 بئر مراقبة على مدى العقدين الماضيين، نظهر أن مستويات المياه الجوفية قد ارتفعت بمعدل متوسط قدرهسنةمنذ عام 2020، متجاوزة مستويات عام 2005 بحلول عام 2024. هذه الانتعاش مدفوع بمزيج من تحويل المياه السطحية على نطاق واسع من الجنوب الرطب وتنظيمات صارمة لضخ المياه الجوفية، مما زاد من تأثيرها سنوات الرطوبة (مثل عام 2021). من عام 2005 إلى عام 2023، أدت هذه السياسات إلى تقليل سحب المياه الجوفية السنوي بـ وزيادة تخصيصات المياه البيئية إلى أكثر من منذ عام 2021، نقوم بتعزيز إعادة شحن المياه الجوفية واستعادة التدفقات البيئية. تظهر نتائجنا أن استعادة المياه الجوفية بسرعة وعلى نطاق واسع يمكن تحقيقها من خلال إدارة المياه المتكاملة والتدخلات السياسية المستهدفة عبر مناطق واسعة..
نضوب المياه الجوفية هو تحدٍ عالمي حاسم، لا سيما في الأراضي الجافة المزروعة بشكل مكثفستؤدي الانخفاضات المستمرة في مستويات المياه الجوفية إلى تأثيرات واسعة النطاق، بما في ذلك هبوط الأرض.تجفيف الأنهار والمستنقعاتت intrusión de agua de marضغط اقتصادي شديد على المجتمعات الريفيةوتهديدات لاستدامة الإمدادات الغذائية العالميةلتخفيف استنزاف المياه الجوفية، تم تنفيذ استراتيجيات متنوعة في جميع أنحاء العالم، مثل تقليل سحب المياه الجوفية.استبدال المياه الجوفية ضخ المياه السطحية من الخزاناتإعادة شحن المياه الجوفية المدارة (MAR)وتحويلات المياه بين الأحواض. على الرغم من هذه الجهود، وجدت دراسة حديثة أن مستويات المياه الجوفية تتراجع بسرعة (سنةتظل شائعة، مع ظهور علامات على التعافي في نسبة صغيرة فقط من المياه الجوفية المنتجة عالميًا (المياه الجوفية التي تظهر اتجاهات صاعدة)سنةتشكلعلى مدى العقدين الماضيينتكون حالات استعادة المياه الجوفية، عند الإبلاغ عنها، غالبًا محدودة مكانيًا وتظهر فقط معدلات استعادة متواضعة (على سبيل المثال،
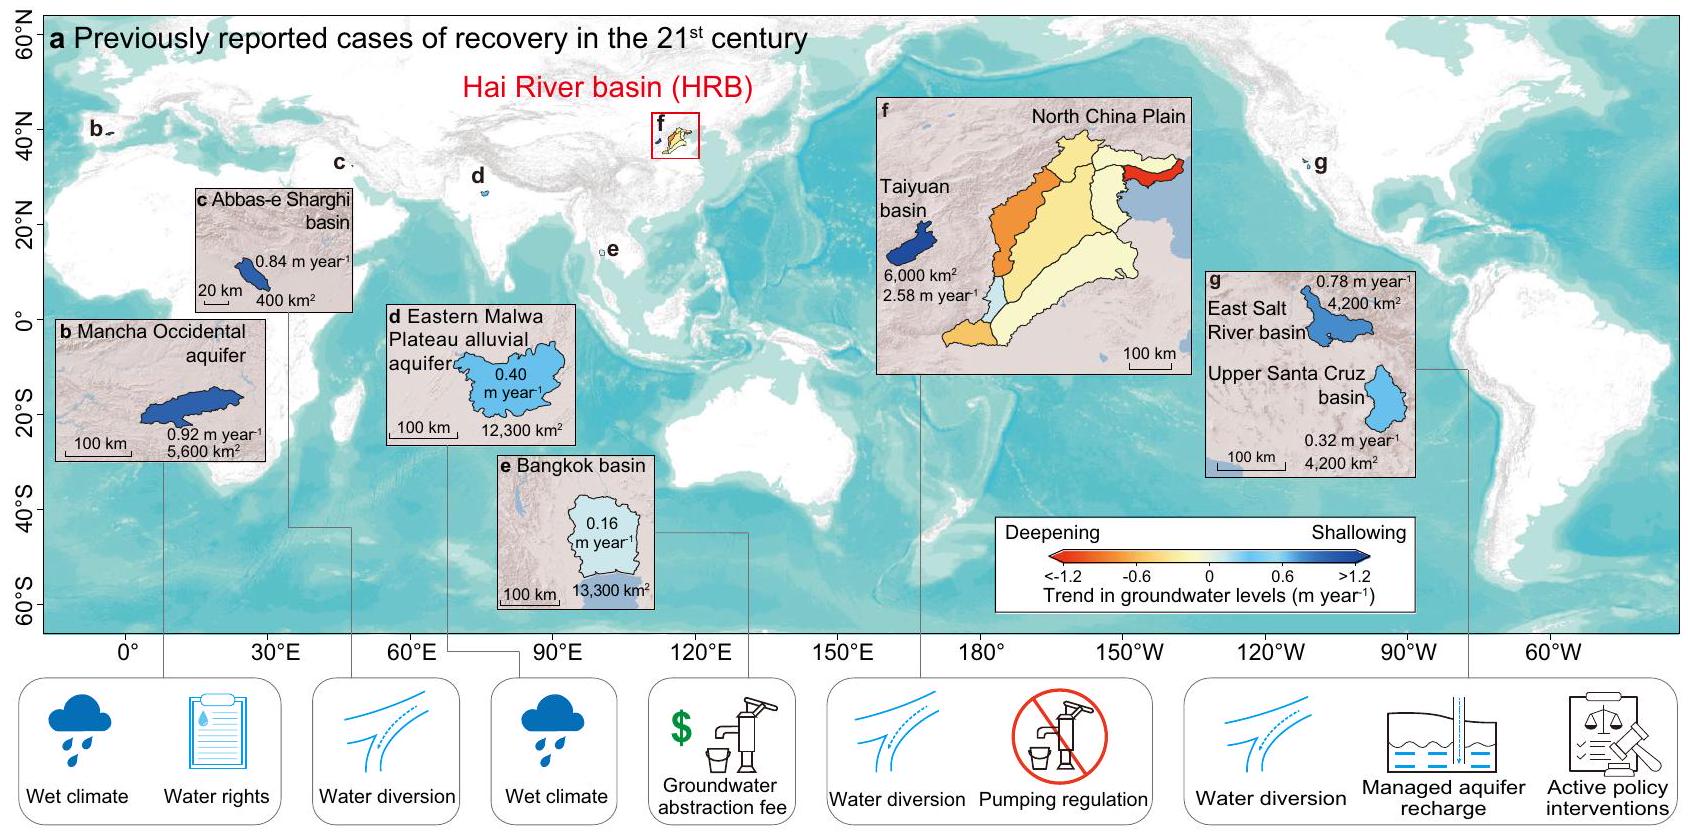
مياه جوفية مانشا أوكسيدنتال (إسبانيا)حوض عباس الشرقي (إيران)خزان المياه الجوفية الطينية في هضبة مالوا الشرقية (الهند)حوض بانكوك (تايلاند)حوض تاييوان (الصين)وأجزاء من كاليفورنيا وأريزونا (الولايات المتحدة); الشكل 1). الأراضي الجافة المزروعة معرضة بشكل خاص لانخفاض مستويات المياه الجوفية بسرعة وبشكل متسارع بسبب استراتيجيات الإدارة غير الكافية. . في هذا السياق، سهل شمال الصين (NCP)، منطقة زراعية مكثفة تمتديقدم دراسة حالة مثيرة. هنا، نستخدم NCP كمثال لإظهار جدوى تحقيق استعادة سريعة للمياه الجوفية.سنةعلى نطاق مكاني غير مسبوق من خلال التدخل البشري المستمر.
تم تحديد منطقة NCP، التي تشكل الجزء السهل من حوض نهر هاي (HRB)، كنقطة ساخنة عالمية لنضوب المياه الجوفية.. هذه المنطقة، التي تتحمل مسؤولية إنتاج الحبوب في الصين، يدعم سكانًا منمليون شخص وتتميز بموارد مائية محدودة بشدة، معمن الموارد المائية المتجددة المتاحة للفرد سنويًالتلبية المطالب المتزايدة للتنمية الاجتماعية والاقتصادية، تم استغلال المياه الجوفية في منطقة NCP بشكل كبير. بحلول أوائل العقد الأول من القرن الحادي والعشرين، كانت المياه الجوفية تشكلمن إجمالي إمدادات المياه، حيث تمثل الريمن إجمالي استخدام المياه. ونتيجة لذلك، انخفضت مستويات المياه الجوفية في منطقة NCP بمعدلسنةبنهاية القرن العشرين، مما يؤدي إلى تقدير استنفاد تراكمي قدرهمن الستينيات إلىاستجابةً لنقص المياه الحاد في شمال الصين، تم بدء مشروع تحويل المياه من الجنوب إلى الشمال (SNWD) في عام 2002، حيث يتم تحويل المياه من حوض نهر اليانغتسي الرطب. وقد تم استخدام المياه المحولة عالية الجودة بشكل أساسي لتعويض ضخ المياه الجوفية لأغراض بلدية وصناعية.. بالإضافة إلى ذلك، تم استخدام المياه الزائدة الموجهة لتجديد الأنهار والبحيرات وزيادة تخزين المياه الجوفية من خلال إدارة الموارد المائية. إلى جانب السياسات الصارمة لضخ المياه الجوفية (مثل إيقاف الآبار وتقييد ضخ المياه الجوفية للري عندما تكون المياه السطحية متاحة)، ساهمت هذه التدابير في استقرار واستعادة مستويات المياه الجوفية محليًا في منطقة NCP.. بينما أظهرت النماذج المفاهيمية والعددية إمكانية استعادة المياه الجوفية عبر منطقة NCPالمدى الفعلي لهذا لقد ظلت عملية التعافي غير مؤكدة بسبب نقص الملاحظات في الموقع، والتي غالبًا ما تعيقها التناقضات المكانية والزمانية بين سجلات آبار المراقبة.
في هذه الدراسة، قمنا بتجميع وتحليل أكثر مجموعة بيانات شاملة لقياسات مستوى المياه الجوفية في الموقع حتى الآن عبر منطقة NCP، من 2005 إلى 2024، معقياسات من أكثر من 2000 بئر. تكشف تحليلاتنا عن اتجاه استعادة ملحوظ، حيث ترتفع مستويات المياه الجوفية بـسنةفي المتوسط عبر NCP خلال 2020-2024. يُعزى هذا التعافي بشكل أساسي إلى تحويلات المياه وسياسات استعادة المياه الجوفية النشطة. تتحدى هذه النتائج دراسة سابقةالتي قد تكون قد قللت من تقدير مدى استعادة المياه الجوفية (الشكل 1f). بشكل عام، توفر نتائجنا رؤى حاسمة حول الإمكانية لمعالجة استنزاف المياه الجوفية في الأراضي الجافة المزروعة على مستوى العالم.
النتائج
عكس استنزاف المياه الجوفية عبر سهل شمال الصين
لتحقيق استعادة المياه الجوفية في منطقة NCP، قمنا بتجميع مجموعة بيانات شاملة من قياسات مستويات المياه الجوفية في الموقع من كل من المياه الجوفية غير المحصورة والمحاصرة في المناطق الحضرية والريفية داخل NCP. أدى إنشاء مشروع المراقبة الوطنية للمياه الجوفية في الصين في عام 2018 إلى تحسين كبير في التغطية المكانية والزمنية وجودة القياسات في الموقع. قبل عام 2018، كانت هناك العديد من الانقطاعات الزمنية في بيانات المراقبة، ولكن ظهور نظام المراقبة التلقائي بعد ذلك قدم بيانات مستمرة. بعد عام 2018، كان هناك زيادة ملحوظة في كثافة آبار المراقبة في NCP، لا سيما في الأجزاء الجنوبية الشرقية وفي المياه الجوفية المحصورة (الشكل التكميلي 1). بالنسبة للمياه الجوفية غير المحصورة، كانت مستويات المياه الجوفية في أعمق نقطة ( ) في سهل البييدمونت في الجزء الغربي من NCP وأقل عمقًا ( ) في الجزء الشرقي من NCP (الشكل التوضيحي التكميلي 1a-d). بالنسبة للمياه الجوفية المحصورة، كانت رؤوس المياه الجوفية في أعمق مستوياتها ( ) في مدن تيانجين، كانغتشو، وهينغشوي (الشكل التوضيحي التكميلي 1e-h). تم ملاحظة اتجاهات سريعة في ارتفاع منسوب المياه الجوفية عبر منطقة NCP في كل من المياه الجوفية غير المحصورة والمحاصرة (الشكل 2). قمنا بحساب انحدارات ثايل-سين لعمق المياه الجوفية في آبار المراقبة خلال الفترة من 2020 إلى 2024 (الشكل 2m) لأن
الشكل 1 | مقارنات مع الحالات المبلغ عنها سابقًا للتعافي. أ الاتجاهات المبلغ عنها سابقًا لاستعادة المياه الجوفية في القرن الحادي والعشرينبما في ذلك خزان مانشا أوكسيدنتال في إسبانيا (ب)، حوض عباس الشرقي في إيران (ج)، خزان الأنهار الطينية في هضبة مالوا الشرقية في الهند (د)، حوض بانكوك في تايلاند (هـ)، حوض تاييوان في الصين (و)، حوض نهر الملح الشرقي وحوض سانتا كروز العلوي في الولايات المتحدة (ز). الـ تُبرز الاتجاهات التي تم الإبلاغ عنها سابقًا لسهول شمال الصين أيضًا في (f). تشير الاتجاهات الإيجابية (باللون الأزرق) إلى تراجع مستوى المياه الجوفية، بينما تشير الاتجاهات السلبية (باللون الأحمر) إلى تعمق مستوى المياه الجوفية. العوامل الرئيسية لكل حالة من حالات التعافيمُعَلَّمَة أيضًا.
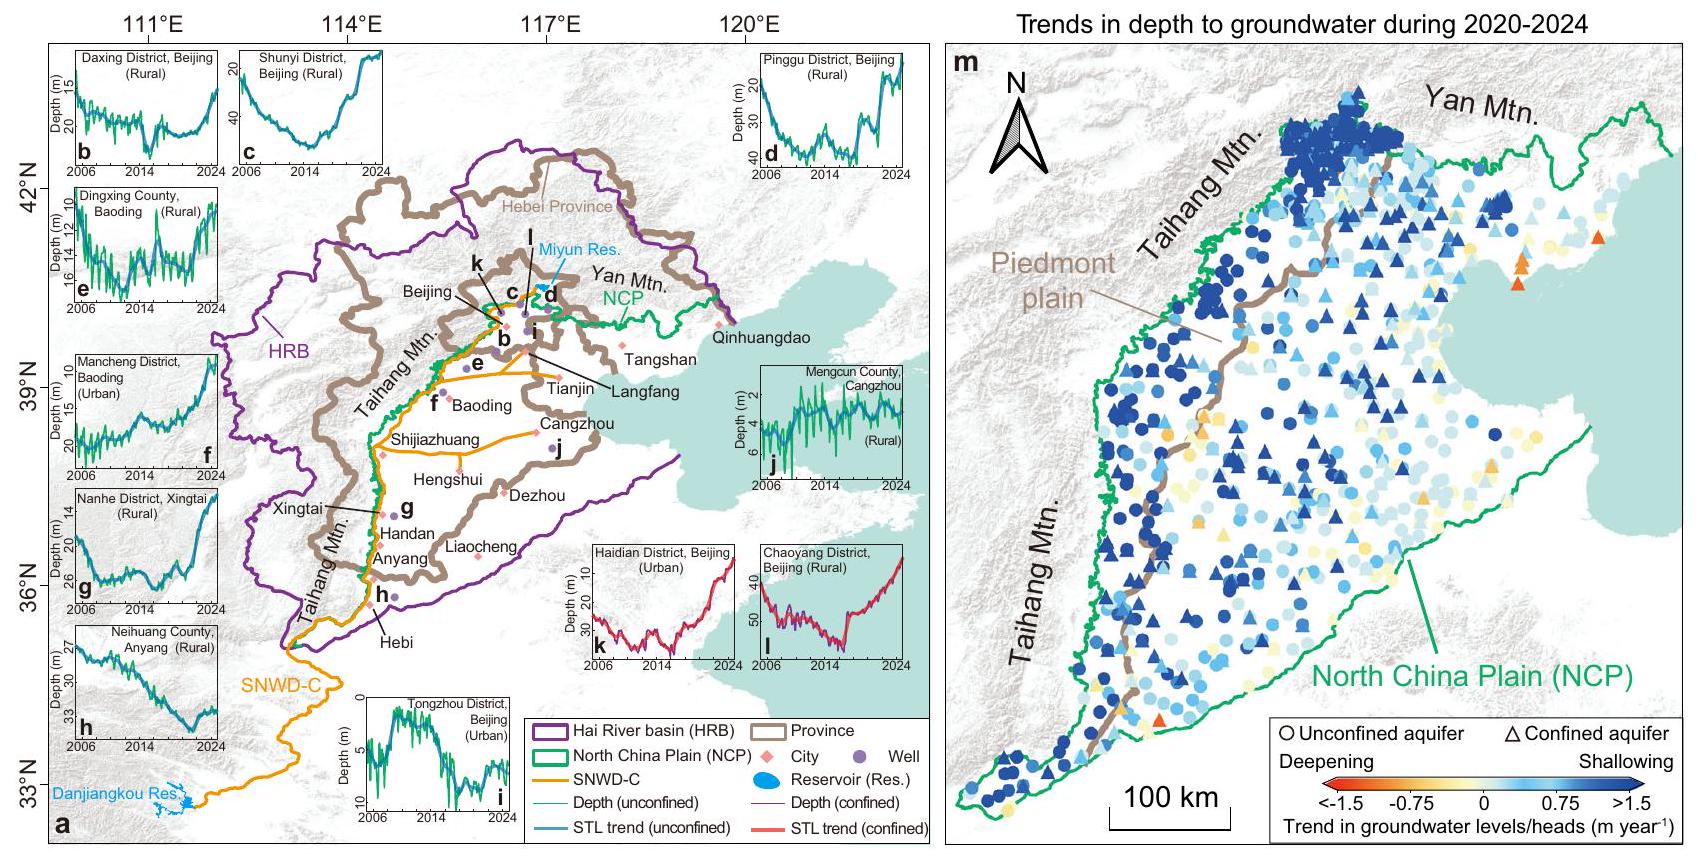
الشكل 2 | الاتجاهات في أعماق المياه الجوفية عبر آبار المراقبة في سهل شمال الصين والمقارنات مع الحالات المبلغ عنها سابقًا للتعافي.
نظرة عامة على حوض نهر هاي (HRB). الخط الأرجواني يمثل حدود HRB. الخط الأخضر يمثل الحدود الشمالية والغربية سهل شمال الصين (NCP)، وهو الجزء السهلي من HRB. الخطوط البرتقالية تمثل المسار المركزي لتحويل المياه من الجنوب إلى الشمال (SNWD-C). الأشكال الزرقاء تمثل الخزانات. الخطوط البنية تمثل حدود مقاطعة خبي والبلديات على مستوى المقاطعة في بكين وتيانجين (المقاطعة). الماس الأحمر يمثل المدن الكبرى. الدوائر الأرجوانية تمثل مواقع آبار المراقبة (b-l). b-j حالات قياسات عمق المياه الجوفية المستمرة في
المياه الجوفية غير المحصورة خلال 2005-2024. الخطوط الخضراء تمثل عمق المياه الجوفية. الخطوط الزرقاء السميكة توضح الاتجاهات طويلة الأجل المستمدة من تحليل STL. k، 1 حالات قياسات عمق المياه الجوفية المستمرة في المياه الجوفية المحصورة خلال 2005-2024. الخطوط الأرجوانية تمثل عمق المياه الجوفية. الخطوط الحمراء السميكة توضح الاتجاهات طويلة الأجل المستمدة من تحليل STL.اتجاهات مستويات المياه الجوفية والرؤوس في الآبار الفردية خلال 2020-2024. الدوائر تشير إلى المياه الجوفية غير المحصورة، بينما تمثل دلتا المياه الجوفية المحصورة. الاتجاهات الإيجابية (زرقاء) تشير إلى تراجع المياه الجوفية، بينما الاتجاهات السلبية (حمراء) تشير إلى تعميق المياه الجوفية.
سجل عام 2020 نقطة التحول في متوسط عمق المياه الجوفية في NCP. في المياه الجوفية غير المحصورة، تم العثور على أكثر التحولات وضوحًا في مستويات المياه الجوفية في السهل الجبلي في الجزء الغربي من NCP، مع اتجاهات تتجاوز 1.5 م سنويًاخلال 2020-2024. في المياه الجوفية المحصورة، كانت هناك اتجاهات سريعة في تراجع رؤوس المياه الجوفية (سنة) كانت واضحة في المناطق الجبلية، وكذلك في مدن تيانجين، كانغتشو، وهينغشوي. بالإضافة إلى ذلك، أظهرت الآبار التي تحتوي على قياسات مستمرة تعافيًا في كل من المناطق الحضرية والريفية (الشكل 2b-l).
تشير بيانات مستوى المياه الجوفية إلى أن عكس الاتجاهات العميقة في متوسط عمق المياه الجوفية الشاذة في كل من المياه الجوفية غير المحصورة والمحاصرة حدث حوالي عام 2020 (الشكل 3a). بحلول نهاية عام 2024، كان متوسط عمق المياه الجوفيةوفي المياه الجوفية غير المحصورة والمحاصرة، على التوالي. بشكل عام، تكون أعماق المياه الجوفية في المياه الجوفية غير المحصورة والمحاصرة أكبر في الصيف وأصغر في الشتاء، مدفوعة بشكل أساسي بتأثيرات ضخ المياه الجوفية للري (تصل إلى ذروتها في الربيع) وإعادة الشحن من الأمطار (هطول الأمطار الموسمية الصيفية يمثل% من إجمالي هطول الأمطار السنوي). التغيرات الموسمية في عمق المياه الجوفية خلال العام هيفي المياه الجوفية غير المحصورة وفي المياه الجوفية المحصورة. للتخفيف من تأثير التغيرات الموسمية، قمنا بعزل الاتجاهات طويلة الأجل في سلسلة زمنية شذوذ عمق المياه الجوفية بعد إزالة التغيرات الموسمية باستخدام تحليل STL. تظهر تحليلاتنا أن معدل تعميق عمق المياه الجوفية في المياه الجوفية غير المحصورة تباطأ قبل التحول في عام 2020 مقارنةً بالاتجاه العميق في أواخر القرن العشرين. تاريخيًا، انخفضت مستويات المياه الجوفية في المياه الجوفية غير المحصورة في السهل الجبلي بمعدلسنةخلال 1984-2005. انخفض الاتجاه العميق إلى 0.2 م سنويًاخلال 2005-2019، مع ظروف رطبة نسبيًا في 2012 و2016 ساهمت في تعافيات طفيفة. بعد التحول في عام 2020، حدث معدل تعافي سريع قدره
0.7 م سنويًاخلال 2020-2024، مع اقتراب متوسط شذوذ عمق المياه الجوفية في المياه الجوفية غير المحصورة في عام 2024 من المستويات التي شوهدت آخر مرة في عام 2005. بالنسبة للمياه الجوفية المحصورة، وجدنا اتجاهًا عميقًا قدرهسنةخلال 2005-2019، تلاه تعافي قدرهخلال 2020-2024. بحلول عام 2024، كانت رأس المياه الجوفية قد عادت إلى مستويات مقارنة بتلك الموجودة في عام 2013. ومن الجدير بالذكر أن معدلات التعافي لكل من المياه الجوفية غير المحصورة والمحاصرة انخفضت بعد عام 2021. بالإضافة إلى ذلك، أشارت العديد من المصادر إلى تعافي مستويات المياه الجوفية، كما يتضح من التخفيف من هبوط الأرض وظهور الينابيع في مناطق مثل بكين وشينغتاي (انظر الطرق).
شهدت بكين أول تحول في تعميق مستويات المياه الجوفية في المياه الجوفية غير المحصورة، تلاها مدن أخرى في NCP (الشكل 3b). أظهرت بيانات المراقبة من بكين، المدينة التي تحتوي على أعلى جودة بيانات في NCP، أول تحول في عام 2016، تلاه معدل تعافي قدره 1 م سنويًاخلال 2016-2024. منذ عام 2021، كانت مستوى المياه الجوفية في بكين أقل من ما كانت عليه في عام 2005. في باودينغ، حدث التحول في عام 2020، مع معدل تعافي قدره 1.5 م سنويًاخلال 2020-2024. بحلول عام 2024، كانت مستوى المياه الجوفية في باودينغ أقل من عام 2005. كان تعافي مستويات المياه الجوفية في هينغشوي وتانغشان مستمرًا منذ عام 2021، وإن كان بمعدل أبطأ قدره 0.4 م سنويًاو0.3 م سنويًاعلى التوالي. إن انخفاض عدم اليقين في متوسط شذوذ عمق المياه الجوفية لبكين وNCP، مقارنةً بباودينغ وهينغشوي وتانغشان، يبرز أهمية شبكات المراقبة الكثيفة في الموقع والتحليل الإقليمي الشامل في تحسين موثوقية تقييمات المياه الجوفية.
حددنا وحللنا الاتجاهات في عمق المياه الجوفية في الآبار المراقبة باستمرار خلال 2005-2017 و2018-2024 (الشكل 3c). تم تصنيف بئر يظهر اتجاه تعميق أحادي متبوعًا بانتعاش أحادي على أنه يحتوي على تحول في
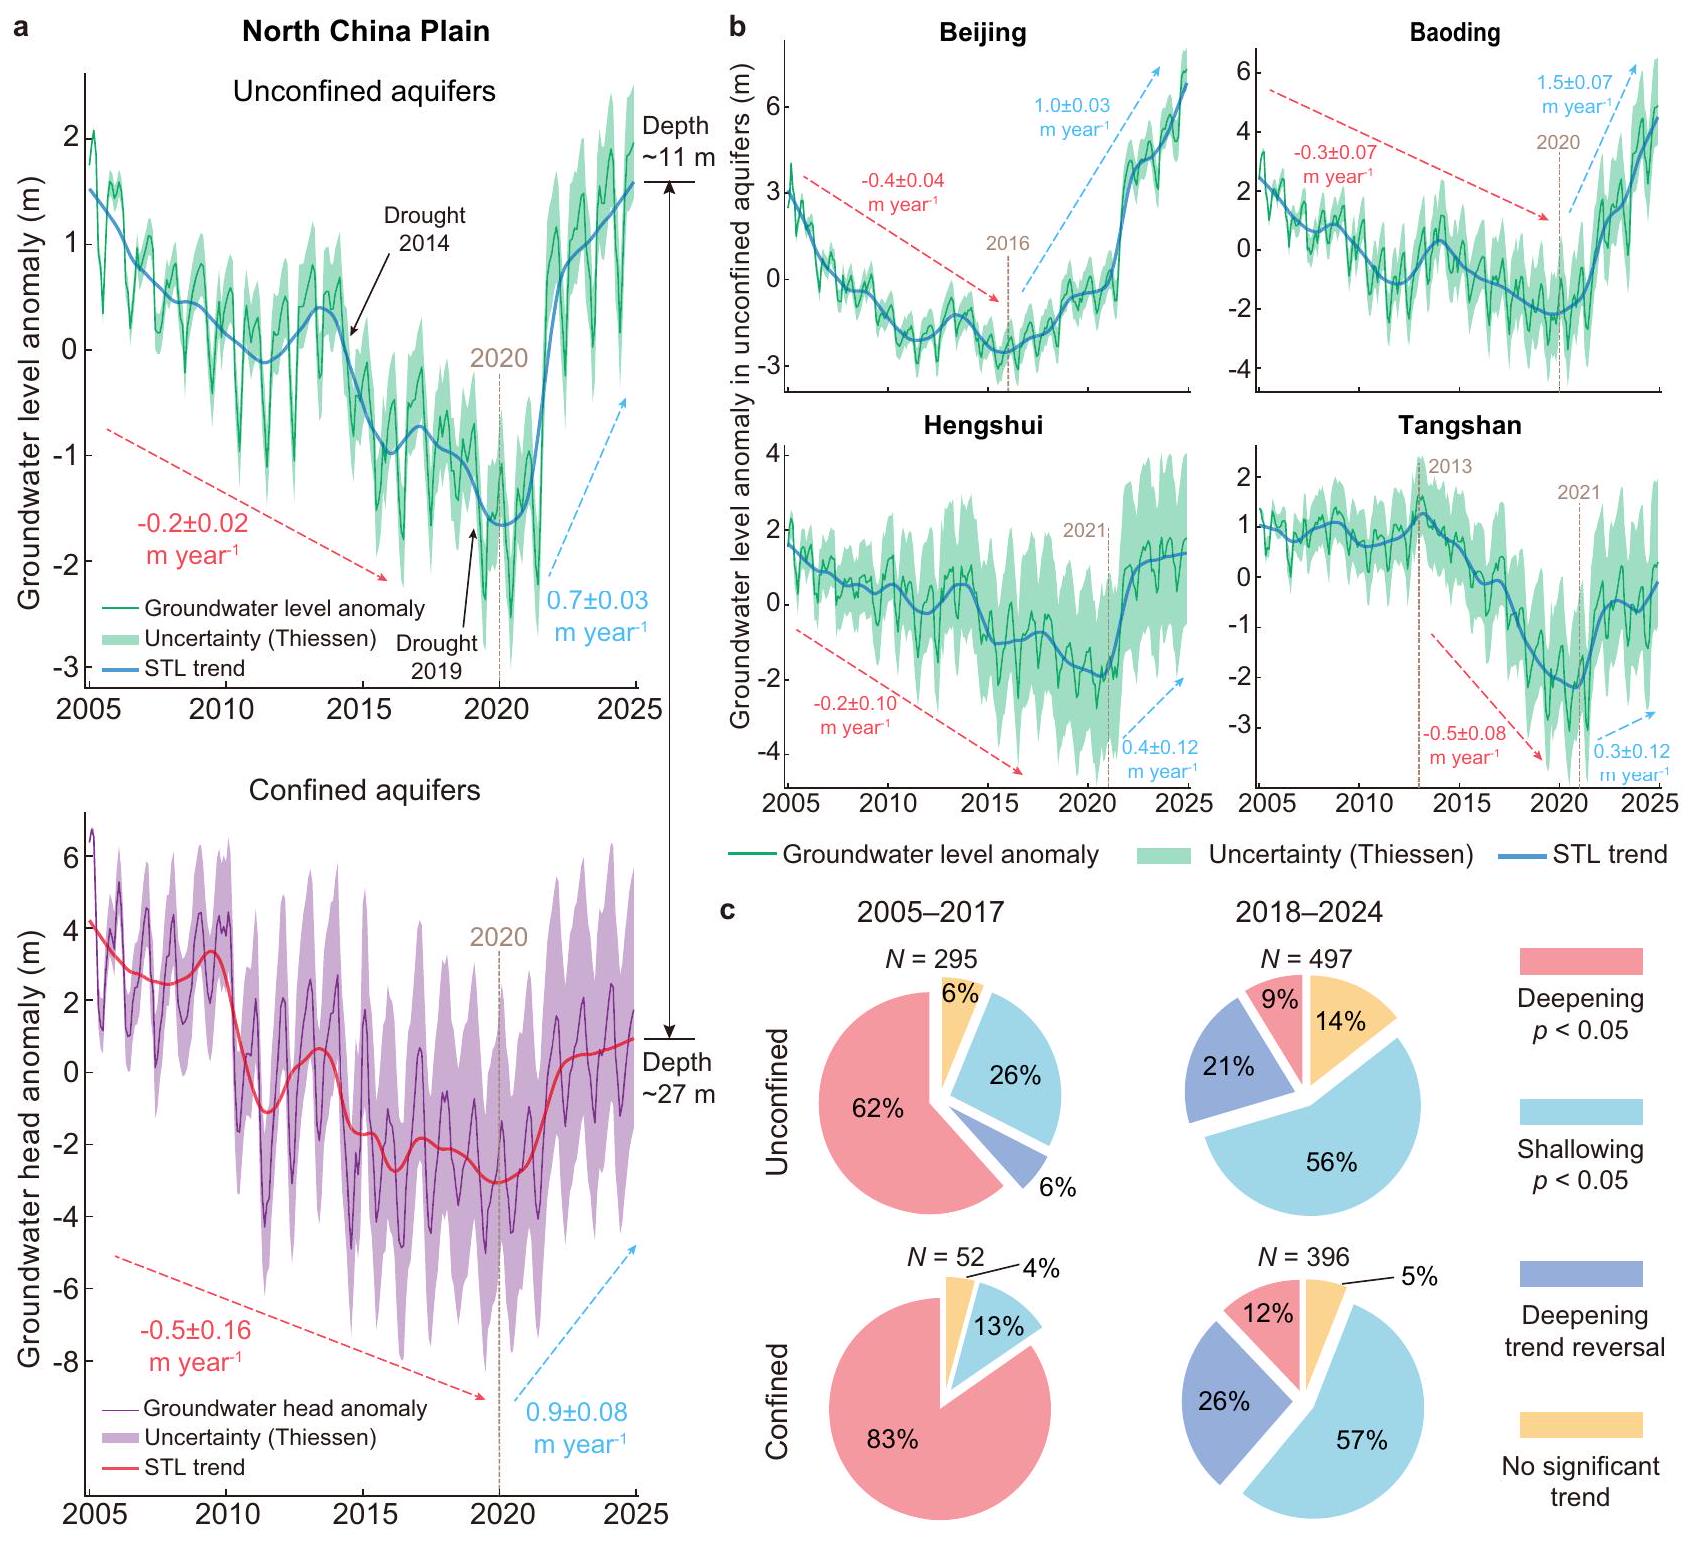
الشكل 3 | السلاسل الزمنية والاتجاهات في أعماق المياه الجوفية عبر سهل شمال
الصين. أ سلاسل زمنية لشذوذ متوسط مستوى المياه الجوفية في المياه الجوفية غير المحصورة ومتوسط شذوذ رأس المياه الجوفية في المياه الجوفية المحصورة. تمثل الخطوط الخضراء والأرجوانية متوسط مستوى المياه الجوفية وشذوذ الرأس في المياه الجوفية غير المحصورة والمحاصرة، على التوالي. توضح الخطوط الزرقاء والحمراء السميكة الاتجاهات طويلة الأجل في المياه الجوفية غير المحصورة والمحاصرة المستمدة من تحليل STL، على التوالي. تمثل الظلال الخضراء والأرجوانية
عدم اليقين المرتبط بالتوزيع المكاني لشبكة المراقبة وتطبيق طريقة مضلع ثيسن في المياه الجوفية غير المحصورة والمحاصرة، على التوالي. تمثل الخطوط البنية المنقطة توقيت التحولات. ب شذوذ متوسط مستوى المياه الجوفية في المياه الجوفية غير المحصورة على مستوى المدينة. نفس الأسطورة كما في (أ). ج نسبة الآبار المراقبة التي تظهر تعميق (، أحمر)، تراجع (، أزرق فاتح)، تحول (أزرق داكن)، وعدم وجود اتجاه ملحوظ (برتقالي) خلال 2005-2017 و2018-2024.
الاتجاه العميق. بالنسبة للآبار الأخرى، قمنا بتقييم ما إذا كان هناك اتجاه عميق أو تراجع ملحوظ (، اختبار MK). تظهر نتائجنا أن الاتجاهات العميقة الملحوظة كانت سائدة خلال 2005-2017، بينما أصبحت الاتجاهات التراجعية الملحوظة سائدة خلال 2018-2024. حواليومن الآبار المراقبة في المياه الجوفية غير المحصورة والمحاصرة تظهر اتجاهات عميقة ملحوظة خلال 2005-2017، على التوالي. حواليمن الآبار المراقبة في المياه الجوفية غير المحصورة، بشكل رئيسي في بكين، شهدت تحولًا في الاتجاه العميق خلال هذه الفترة. في المقابل، خلال 2018-2024، أظهرت أكثر من نصف الآبار المراقبة اتجاهًا تراجعيًا ملحوظًا، وحوالي ربع أظهرت علامات على تحول في الاتجاه العميق. تتماشى هذه النتائج مع أول تحول لوحظ في بكين في عام 2016 والتحول العام على مستوى NCP في عام 2020.
إمدادات المياه واستخدامها في حوض نهر هاي
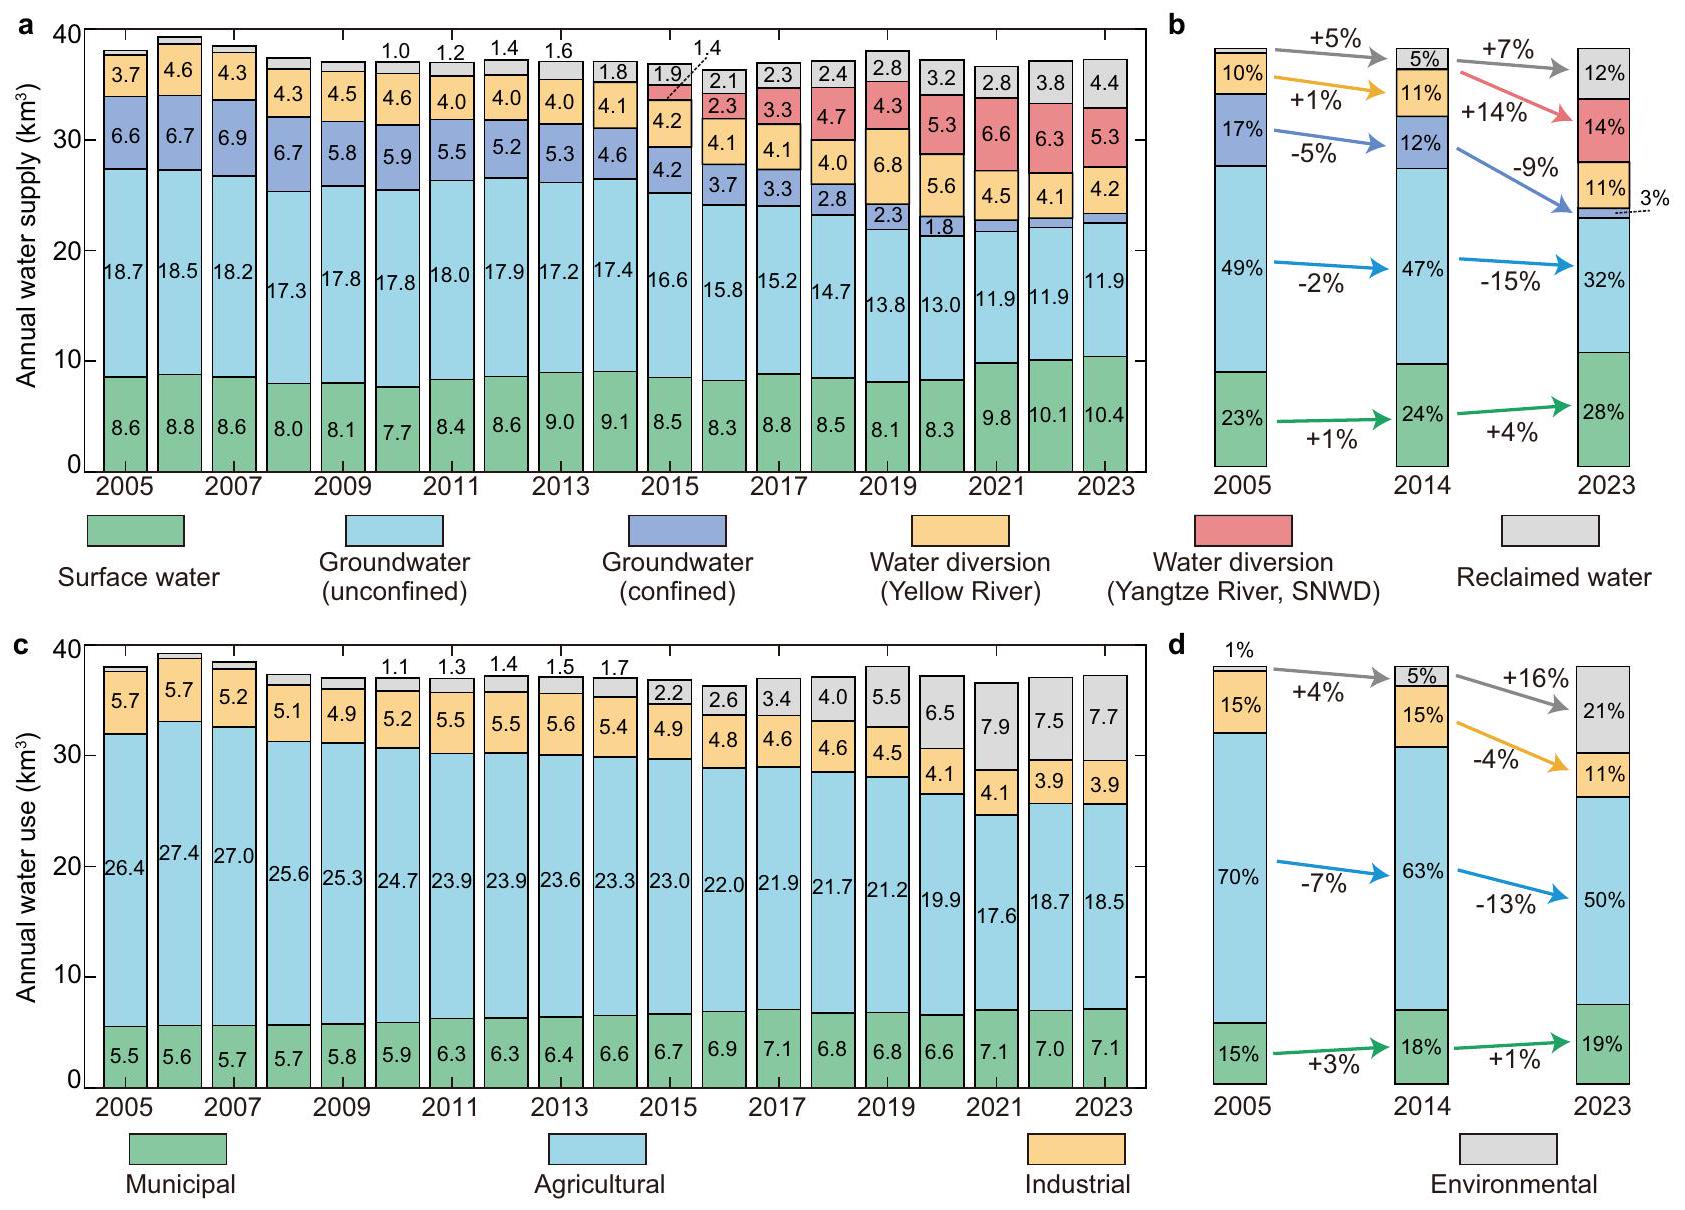
ظل إجمالي إمداد المياه في HRB مستقرًا نسبيًا من 2005 إلى 2023، بمتوسطسنويًا، لكن مساهمة مصادر المياه المختلفة قد تغيرت بشكل كبير (الشكل 4a، b). في عام 2005، كانت المياه الجوفية تمثل حوالي ثلثي إجمالي إمداد المياه، حيث كانت المياه الجوفية غير المحصورة توفر، ما يقرب من ثلاثة أضعافالذي توفره المياه الجوفية المحصورة. حوالي عام 2009، بدأ استخراج المياه الجوفية من المياه الجوفية المحصورة في الانخفاض، حيث وفرتأقل في عام 2014 مقارنةً بالحجم المقدم في عام 2005، مع تعويض المياه المعاد تدويرها لمعظم هذا الانخفاض. في الوقت نفسه، زادت إمدادات المياه السطحية من الخزانات () خلال 2005-2023 والآن تشكل أكثر من ربع إجمالي إمداد المياه. ظلت المياه المنقولة من نهر هوانغ مستقرًا عندسنويًا، تمثل 10% من إجمالي إمداد المياه، باستثناء ارتفاع في عام 2019
الشكل 4 | إمدادات المياه السنوية واستخدامها في حوض نهر هاي. أ إمدادات المياه السنوية من مصادر مختلفةبما في ذلك المياه السطحية من الخزانات، والمياه الجوفية من الطبقات غير المحصورة والمحصورة، وتحويل المياه من نهر الأصفر، وتحويل المياه من نهر اليانغتسي (المياه من الجنوب إلى الشمال)
التحويل، SNWD)، والمياه المعاد استخدامها. ب نسب إمدادات المياه الإجمالية في 2005، 2014، و2023. ج الاستخدام السنوي للمياه عبر قطاعات مختلفة (كم³)، بما في ذلك الاستخدامات البلدية والزراعية والصناعية والبيئية. د نسب الاستخدام الإجمالي للمياه في 2005، 2014، و2023. واستخدام المياه المعاد تدويرها نما بشكل مستمر، ليصل إلىبحلول عام 2023 وأخذًا في الاعتبارمن إجمالي إمدادات المياه في عام 2023. يتم استخدام المياه المعاد تدويرها بشكل أساسي لتجديد الأنهار والبحيرات، بالإضافة إلى الصرف الصحي، وري المناظر الطبيعية، والصناعة. على الرغم من المبادرات التي تعزز التحلية، إلا أن استخدام مياه البحر المحلاة في منطقة HRB ظل ضئيلاً، بسعة سنوية قدرهافي عام 2023، مساهمًاإلى إجمالي إمدادات المياه.
تم تشغيل المسار المركزي لمشروع تحويل المياه من الجنوب إلى الشمال (SNWDC) في ديسمبر 2014، مما أدخل تنوعًا كبيرًا في هيكل إمدادات المياه في حوض النهر الأصفر. تم تصميم SNWD-C لتحويلمياه عالية الجودة سنويًا من خزان دانجيانغكو على نهر هان، أكبر رافد لنهر اليانغتسي، إلى شمال الصين. المسار الشرقي لمشروع نقل المياه من الجنوب إلى الشمال (SNWD-E)، الذي يحول المياه من جيانغدو بالقرب من نهر اليانغتسي، يزود كمية صغيرة من المياه (سنة ) إلى الأجزاء الجنوبية الشرقية من NCP، مع استفادة معظم المناطق في مقاطعة شاندونغ خارج NCP. في عام 2023، قدمت SNWD من الماء، مما يمثلمن إجمالي الإمدادات، مما يجعله المصدر الثالث الأكبر بعد المياه الجوفية غير المحصورة ( ) ومياه السطح من الخزانات ( ).
استخدام المياه الجوفية فيكان تقريبًا نصف ما كان عليه فيمع انخفاض أكثر حدة في المياه الجوفية المحصورةتقليل) مقارنة بالمياه الجوفية غير المحصورة (الخفض) من 2005 إلى 2023. بحلول عام 2023، انخفض الضخ من المياه الجوفية المحصورة إلى، مما يمثل فقطمن إجمالي إمدادات المياه. يُعزى هذا الانخفاض الأكبر في استخدام المياه الجوفية المحصورة إلى استبدالها بشكل أكبر. من المياه من مشروع SNWD. تاريخياً، كانت المياه الجوفية من الطبقات المحصورة، التي تُقدَّر لجودتها العالية، مصدرًا رئيسيًا للاستخدام البلدي، خاصة لأن الطبقات غير المحصورة أكثر عرضة للتلوث. مع إدخال المياه من مشروع SNWD، تم استبدال المياه الجوفية من الطبقات المحصورة التي كانت تُستخدم للإمدادات البلدية بشكل متزايد، مما أدى إلى تقليل ضخ المياه الجوفية. ومع ذلك، فإن إمدادات SNWD تتأثر بظروف الجفاف في مناطق مصدرها. على سبيل المثال، أدت ظروف الجفاف upstream من خزان دانجيانغكو إلى تقليل إمدادات SNWD بمقدارمن 2022 إلى 2023 (منإلى ).
على الرغم من الاستقرار العام في إجمالي استخدام المياه، فإن التحول نحو زيادة تخصيص التدفقات البيئية قد أدى إلى تقليل إجمالي الاستخدام البلدي والزراعي والصناعي، منفي عام 2005 إلىفي عام 2023 (الشكل 4c، d). استخدام المياه الزراعية، الذي شكلمن الإجمالي في عام 2005، قد انخفض بشكل مستمر إلىبحلول عام 2023. بالإضافة إلى انخفاض في مساحة الأراضي الزراعية (الشكل التوضيحي 2)، يُعزى هذا الانخفاض إلى السياسات التي تهدف إلى التخفيف من نقص المياه والحد من استخراج المياه الجوفية، بما في ذلك التعديلات على ممارسات الزراعة، والزراعة في الأراضي الجافة، والراحة الموسمية، واستخدام الأغطية البلاستيكية للحفاظ على رطوبة التربة.زيادة استخدام المياه البلدية بـخلال الفترة من 2005 إلى 2023، مدفوعًا بنمو السكان، في حين انخفض استخدام المياه الصناعية بنسبة مماثلة بسبب جهود الحفاظ على المياه.استخدام المياه البيئية، الذي يشمل ري الأشجار والمراعي بالإضافة إلى إعادة ملء البحيرات والأنهارقد انتهىمنذ عام 2021، أصبحت ثاني أكبر استخدام للمياه
الشكل 5 | استجابة عمق المياه الجوفية في الخزانات غير المحصورة لتقلبات الهطول. أ الهطول السنوي في حوض نهر هاي (HRB، الأعمدة البيضاء) ومتوسط شذوذ عمق المياه الجوفية في الخزانات غير المحصورة عبر سهل شمال الصين (NCP). تشير الظلال الخلفية إلى سنوات جافة (برتقالي)، عادية (رمادي)، ورطبة (أزرق). الخط الأحمر يظهر الاتجاه طويل الأمد في متوسط شذوذ عمق المياه الجوفية، المستمد من تحليل STL. ب مخطط انتشار يربط بين متوسط الهطول لمدة 12 شهرًا (Pr) في HRB والتغير المقابل في اتجاه STL. مكون من شذوذ عمق المياه الجوفية في NCP. كلا المحورين يستخدمان مقاييس لوغاريتمية. تشير ألوان النقاط إلى الأشهر، وتدل التسميات مثل “2014Q2” على السنة والربع التقويمي. تشير السهم الأحمر إلى التحولات نحو اليسار التي لوحظت خلال فترات الجفاف. تشير الخطوط الرمادية المتقطعة إلى اتجاه مستقر. ج نفس الشيء كما في (أ)، ولكن لبكين: هطول الأمطار السنوي وشذوذ عمق المياه الجوفية في المياه الجوفية غير المحصورة. د نفس الشيء كما في (ب)، ولكن لبكين: علاقات اتجاه هطول الأمطار والمياه الجوفية بناءً على تحليل STL. قطاع (من الإجمالي) بعد الزراعة. المياه المعالجة، إلى جانب المياه الم diverted من نهري الأصفر ويانغتسي والمياه السطحية من الخزاناتتلعب دورًا حاسمًا في دعم هذه التدفقات البيئية.
توجهات تحويل المياه وسياسات استعادة المياه الجوفية تدفع نحو استعادة المياه الجوفية
يعود الانتعاش الملحوظ للمياه الجوفية في منطقة NCP بشكل أساسي إلى التدخل البشري المستمر، حيث توفر السنوات الرطبة (مثل عام 2021) تعزيزًا إضافيًا ولكنه مؤقت (الشكل 5). كانت إحدى التدابير الأساسية هي استبدال ضخ المياه الجوفية بالمياه من SNWD-C. في البداية، في عام 2015، تلقت بكين الجزء الأكبر من المياه المنحرفة.خارج منتم توصيلها إلى حوض نهر النيل)، مما أدى إلى انتعاش مبكر لمستويات المياه الجوفية بدءًا من عام 2016. وقد ظل هذا الانتعاش قويًا حتى خلال فترات الجفاف في عامي 2019 و2022 (الشكل 5c). بعد عام 2020، توسعت توصيلات SNWD-C إلى أجزاء أخرى من حوض نهر النيل، لتصل إلى أكثر منسنويًا ودعم عكس أوسع لانخفاضات المياه الجوفية الإقليمية (الشكل 5أ).
يركز الربط بين هطول الأمطار وشذوذ عمق المياه الجوفية بشكل أكبر على تأثير هذه التدخلات (الشكل 5ب، د). تشير التحولات النظامية نحو اليسار في مخططات تشتت هطول الأمطار والمياه الجوفية إلى ظروف مياه جوفية أكثر ضحالة، حتى تحت ظروف هطول أمطار مماثلة. تكون هذه التحولات ملحوظة بشكل خاص خلال سنوات الجفاف (السهم الأحمر في الشكل 5ب)، مما يشير إلى أن التدخلات قد غيرت توازن المياه الجوفية وعززت مرونة النظام. يُلاحظ نمط مشابه في بكين (الشكل 5د)، حيث تحسنت أعماق المياه الجوفية بشكل كبير في عام 2024 مقارنة بعام 2005. على الرغم من أن هطول الأمطار الشديد في عام 2021 قد تسارع مؤقتًا من تعافي المياه الجوفية، إلا أن تأثيره كان قصير الأمد، حيث عادت رطوبة التربة إلى مستوياتها الأساسية بحلول أوائل عام 2022 (الشكل التكميلي 3). في المقابل، تستمر ارتفاعات المياه الجوفية. في بكين (2016-2020) والتعافي المستمر على مستوى البلاد منذ عام 2022 يسلطان الضوء على فعالية واستدامة جهود استعادة المياه الجوفية المدفوعة بالسياسات.
تعتبر استراتيجيات إعادة تغذية المياه الجوفية وتقليل الضخ المرتبط بالري من الاستراتيجيات الحيوية لاستعادة المياه الجوفية المستنزفة (الشكل 6 أ-ج). على مدى سنوات، جفت الأنهار في منطقة نهر الشمال بسبب اعتراض الخزانات upstream وانخفاض مستويات المياه الجوفية. بدأت تجارب إعادة ملء الأنهار في عام 2018 في أنهار فويانغ وهوتو وجوما. منذ ذلك الحين، أكثر منتم تخصيص كمية من المياه من مشروع SNWD لاستعادة الأنهار عبر NCP بحلول عام 2024. جاءت مساهمات إضافية من تحويلات نهر الأصفر والخزانات المحلية، مما أفاد الأنهار (مثل نهر يونغدينغ) والبحيرات (مثل بحيرة باييانغديان). لقد جددت هذه الجهود الأنهار الجافة، واستعادت النظم البيئية النهرية، وزادت من إعادة شحن المياه الجوفية. أظهرت الآبار القريبة من الأنهار المعاد شحنها معدلات استعادة مياه جوفية أسرع (الشكل 6ب)، مما يؤكد فعالية MAR المعتمد على الأنهار. تم استخدام طرق MAR أخرى، بما في ذلك برك إعادة الشحن التي تستعيد الفيضانات وآبار الحقن التي تستهدف المياه الجوفية المحصورة، ولكن على نطاقات أصغر. بالتوازي، ساهمت التغييرات في ممارسات الري أيضًا في الاستعادة الجزئية. يتطلب نظام الزراعة المزدوجة السائد في NCP (دورة القمح الشتوي والذرة الصيفية) ريًا مكثفًا في الربيع، والذي تم الحفاظ عليه تاريخيًا من خلال ضخ المياه الجوفية. بين عامي 2013 و2018، انخفضت المساحة المزروعة بالزراعة المزدوجة بنسبة . في المناطق الريفية بين بكين ولانغفانغ، حيث كان الانخفاض الأكبر ، بدأت استعادة المياه الجوفية في وقت مبكر من 2013-2014 (الشكل 6ج). منذ عام 2018، تباطأ الانخفاض الإضافي في مساحة الزراعة المزدوجة، حيث سمح الماء المحول بتوجيه المياه السطحية المحلية للري . في المقابل، احتفظت المنطقة الجنوبية الشرقية من NCP بأنماط زراعية مستقرة بسبب الاعتماد على تحويلات نهر الأصفر. على الرغم من التعديلات الزراعية، ارتفع إنتاج الغذاء الإقليمي في بكين وتيانجين وهيبي من مليون طن في عام 2005 إلى ~42 مليون طن في عام 2023 (المكمل
الشكل 6 | approaches الهندسية والسياسية لعكس استنزاف المياه الجوفية. أ تحويل المياه وتجديد الأنهار في سهل شمال الصين (NCP). يمثل الخط الأخضر حدود NCP. تمثل الأشكال الزرقاء البحيرات والخزانات. تمثل الخطوط الزرقاء والبرتقالية والحمراء الداكنة الأنهار، والمسار المركزي لتحويل المياه من الجنوب إلى الشمال (SNWD-C)، والمسار الشرقي لتحويل المياه من الجنوب إلى الشمال (SNWD-E)، على التوالي. ب عمق المياه الجوفية في المياه الجوفية غير المحصورة بالقرب من الأنهار المعاد شحنها. تتوافق الخطوط الخضراء والبنفسجية والرمادية والحمراء مع أربعة آبار مراقبة تقع بين نهري شا وهوتو من 2018 إلى 2024. ج عمق المياه الجوفية في المياه الجوفية غير المحصورة في المناطق التي انخفضت فيها المساحة المزروعة بالزراعة المزدوجة بشكل كبير بين 2013 و2017. تمثل الخطوط الخضراء والبنفسجية
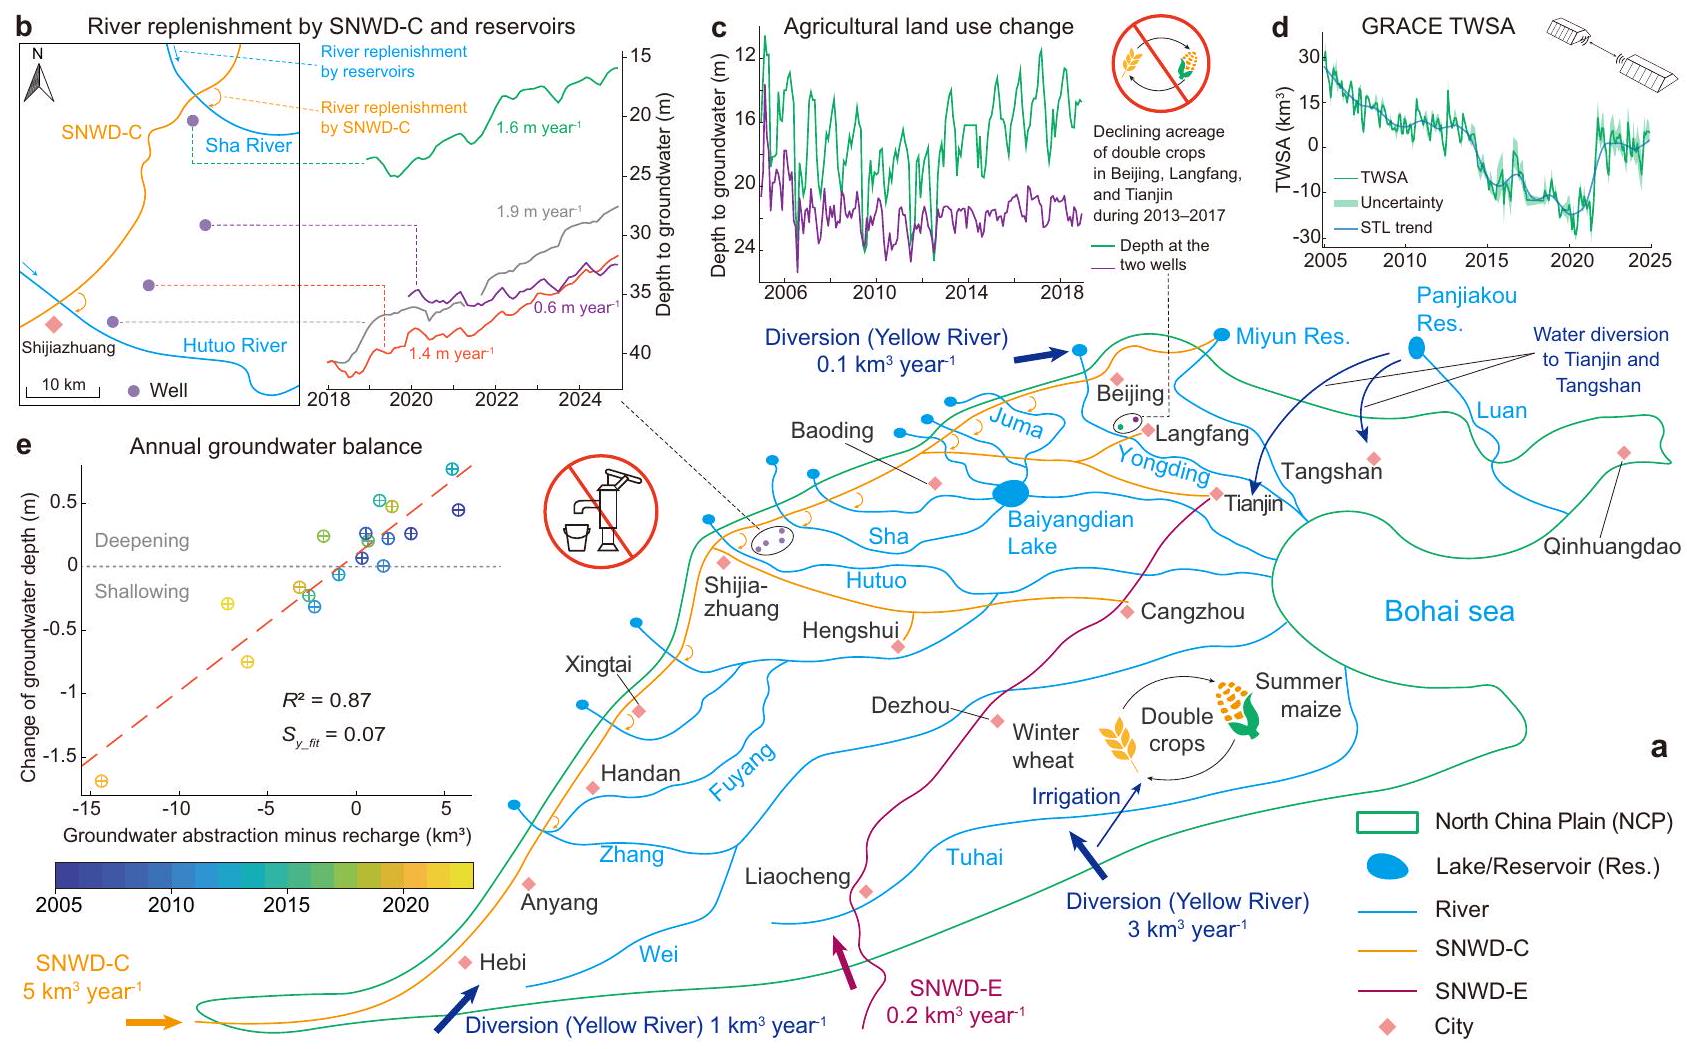
تمثل آبار المراقبة التمثيلية. د الشذوذات المستمدة من GRACE في إجمالي تخزين المياه (TWSA) في NCP. يظهر الخط الأخضر متوسط منتجات JPL وCSR mascon؛ تُظهر المنطقة الخضراء المظللة انتشارها. يمثل الخط الأزرق السميك الاتجاه (استنادًا إلى تحليل STL). هـ توازن المياه الجوفية السنوي في NCP من 2005 إلى 2023. يظهر المحور صافي استخراج المياه الجوفية (الاستخراج ناقص إعادة الشحن) استنادًا إلى نشرات موارد مياه نهر هاي . يمثل المحور التغير السنوي في الاتجاه في عمق المياه الجوفية (استنادًا إلى تحليل STL) في المياه الجوفية غير المحصورة، مع الخط الرمادي المتقطع الذي يشير إلى اتجاه مستقر. يشير إلى العائد المحدد الملائم المستمد من ميل العلاقة بين التوازن والعمق.
الشكل 4) ، مدعومًا بزيادة العائد لكل وحدة مساحة، مما يساعد على ضمان الأمن الغذائي المحلي.
تمت ملاحظة استعادة عمق المياه الجوفية في آبار المراقبة بما يتماشى مع تقديرات توازن المياه المستندة إلى الأقمار الصناعية (الشكل 6د، هـ). تظهر التغيرات بين السنوات في عمق المياه الجوفية في المياه الجوفية غير المحصورة علاقة خطية قوية ( ) مع عجز توازن المياه الصافي، المحسوب على أنه استخراج المياه الجوفية السنوي ناقص إعادة الشحن من نشرات موارد مياه نهر هاي (الشكل 6هـ). يتطابق العائد المحدد الملائم ( ) البالغ 0.07 عمومًا مع القيم المبلغ عنها من في السهول الجبلية و في مناطق أخرى من ، مما يدعم موثوقية نهج توازن المياه (انظر الطرق). تظهر الملاحظات الساتلية من GRACE وGRACE-FO استعادة في إجمالي الشذوذات في تخزين المياه (TWSA) بدءًا من حوالي عام 2020 (الشكل 6د)، ومع ذلك، فإن هذه الانتعاش تعوض فقط عن حوالي نصف من إجمالي استنزاف تخزين المياه بين 2005 و2019. استنادًا إلى انخفاض بمقدار 3 أمتار في مستوى المياه الجوفية والتقدير ، انخفض تخزين المياه الجوفية غير المحصورة وحده بمقدار خلال هذه الفترة. ساهمت المياه الجوفية المحصورة، التي تتميز بمعاملات تخزين أصغر بكثير (0.0004-0.004)، بشكل نسبي ضئيل في الاستنزاف الإجمالي، مما يشير إلى أن الغالبية العظمى من فقدان المياه الجوفية حدث في الأنظمة غير المحصورة . من المحتمل أن تنشأ الفجوات بين بيانات GRACE TWSA والاتجاهات في المياه الجوفية في الموقع من التباينات في تخزين التربة والمياه السطحية، وعدم اليقين في العائد المحدد ومعاملات التخزين، أو القيود الجوهرية في دقة GRACE. إن نسبة كاملة من هذه الاختلافات تتجاوز نطاق هذه الدراسة.
المناقشة
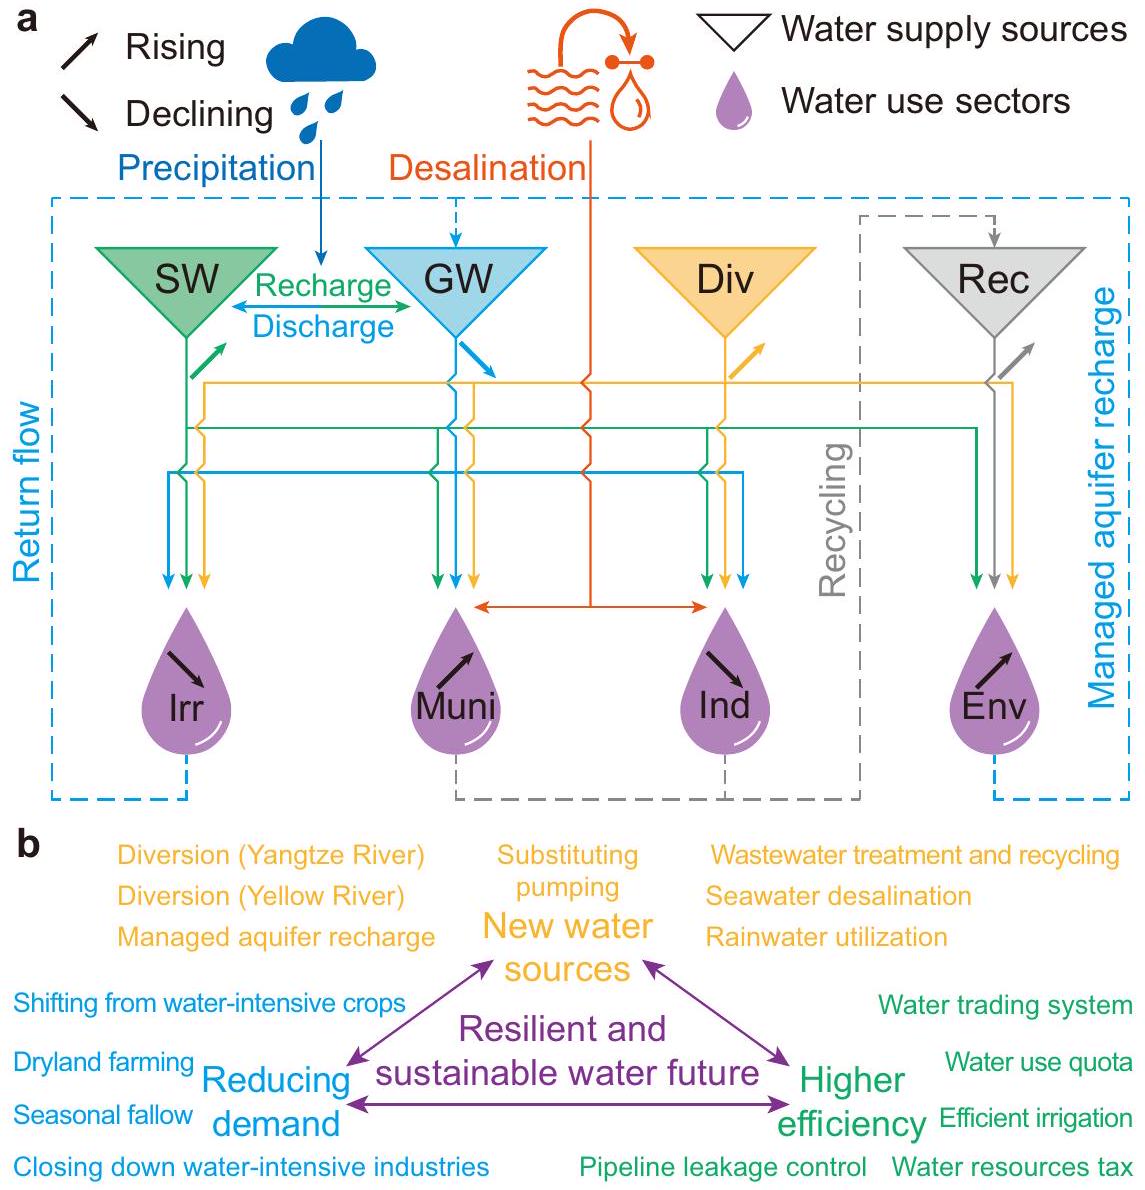
لقد نجح التدخل البشري في عكس استنزاف المياه الجوفية في NCP من خلال مجموعة من مصادر المياه الجديدة، وتقليل الطلب على المياه، وزيادة كفاءة استخدام المياه مع تنظيمات صارمة لضخ المياه الجوفية (الشكل 7). تضمنت الاستراتيجيات الرئيسية تحويل المياه وإعادة تدوير المياه العادمة، مما أدى إلى تنويع إمدادات المياه وتقليل الاعتماد على المياه الجوفية المستغلة بشكل مفرط. تم استخدام المياه الزائدة لتجديد المسطحات المائية وMAR، مما ساهم في استعادة المياه الجوفية وزيادة مرونة النظام ضد الجفاف المستقبلي. لتقليل الطلب على المياه الزراعية، تم تنفيذ عدة طرق، بما في ذلك التحول من المحاصيل التي تتطلب مياه كثيرة (مثل الانتقال من دورات القمح والذرة إلى زراعة الذرة الفردية التي تتزامن مع موسم الأمطار الصيفية )، وتوسيع الزراعة الجافة، وإدخال فترات فلاح موسمية. بالإضافة إلى ذلك، تم إلغاء الصناعات التي تتطلب مياه كثيرة (مثل مصانع الصلب وصناعة الورق). كما حسنت الحلول الهندسية، مثل أنظمة الري الموفرة للمياه والتحكم في تسرب الأنابيب، كفاءة استخدام المياه بشكل أكبر. تم أيضًا تقديم أدوات إدارة فعالة، مثل ضرائب موارد المياه، وحصص استخدام المياه (مثل حصص استخدام المياه السنوية لبكين ()، وتيانجين ()، وهيبي ()), وأنظمة تداول المياه، لتحسين استخدام موارد المياه النادرة، مما يحفز الاستخدام الأكثر كفاءة . نتيجة لذلك، زادت إنتاجية المياه في NCP من ثلاثة إلى أربعة أضعاف بين 2005 و2023. في عام 2023، بلغ الناتج الاقتصادي لكل وحدة من استخدام المياه استنادًا إلى الناتج المحلي الإجمالي (GDP) و استنادًا إلى القيمة المضافة الصناعية
الشكل 7 | إمدادات المياه واستخدامها وسط التدخل البشري في حوض نهر هاي. أ مخطط توضيحي لإمدادات المياه واستخدامها، مع دلتا تمثل مصادر المياه الرئيسية: المياه السطحية (SW)، المياه الجوفية (GW)، المياه المحولة (Div، بما في ذلك تحويل المياه من الجنوب إلى الشمال وتحويل المياه من نهر الأصفر)، والمياه المعاد استخدامها (Rec). تشير القطرات البنفسجية إلى قطاعات استخدام المياه: الري (Irr)، الاستخدام البلدي (Muni)، الصناعة (Ind)، والاستخدام البيئي (Env). تربط الخطوط الصلبة
مصادر المياه وقطاعات استخدام المياه، بينما تمثل الخطوط المتقطعة الطرق المحتملة لإعادة المياه المستخدمة كموارد. توضح الأسهم الاتجاهات المتزايدة والمتناقصة على مدى العقدين الماضيين. ب السياسات والنهج الهندسية المطبقة: تشير الألوان الصفراء والزرقاء والخضراء إلى النهج المتعلقة بمصادر المياه الجديدة، وتقليل الطلب على المياه، وتحسين كفاءة استخدام المياه، على التوالي.
القيمة، مقارنةً بـ و ، على التوالي، في عام 2005 (جميع القيم تم تعديلها لتتوافق مع أسعار عام 2023) . انخفضت كثافة الري السنوية بأكثر من من إلى 2023 . جنبًا إلى جنب مع تنظيمات الضخ الصارمة (مثل إغلاق الآبار بحلول عام 2023 وفقًا لوزارة الموارد المائية)، فإن هذه الأنشطة قد كبحوا بشكل فعال الإمكانية لحدوث مفارقة جيفونس، حيث كان من الممكن أن تؤدي الكفاءة المتزايدة إلى زيادة استهلاك المياه بشكل عام . تقدم هذه الاستعادة الناجحة رؤى قيمة لاستعادة المياه الجوفية المستنزفة في نقاط ساخنة عالمية أخرى تواجه تحديات مماثلة، بما في ذلك مناطق في إيران ، العراق ، تركيا ، لبنان ، الأردن ، وسط جنوب إفريقيا ، وادي كاليفورنيا المركزي وسهول الجنوب والوسط العليا في الولايات المتحدة، وسهول الهندو-غانجتيك .
لقد لعب تحويل المياه دورًا محوريًا، وإن لم يكن حصريًا، في تخفيف ندرة المياه واستعادة المياه الجوفية المستغلة بشكل مفرط، لا سيما في المناطق شبه الرطبة إلى شبه الجافة ذات الكثافة السكانية العالية والتي تتمتع بري واسع. مشاريع مثل مشروع نقل المياه من شمال الصين، ومشروع وسط أريزونانظام توصيل المياه في كاليفورنيا (مشروع وادي الوسط ومشاريع المياه الحكومية، وتحويل المياه من بحيرة طبريا في إسرائيلقد حلت محل ضخ المياه من المياه الجوفية المحلية، مما ساهم في استعادة تخزين المياه الجوفية. بالإضافة إلى ذلك، فإن تحويلات المياه في شرق جنوب إفريقيا ومنطقة توشكا في مصرعلى الرغم من أنها لم تكن مخصصة بشكل أساسي لاستعادة المياه الجوفية، إلا أنها ساعدت أيضًا في تقليل الضخ في هذه المناطق النامية بسرعة والمعرضة لنضوب المياه الجوفية.. ومع ذلك، حتى مع هذه المشاريع لتحويل المياه، تظل التحديات قائمة. على سبيل المثال، على الرغم من الجهود المبذولة في وادي كاليفورنيا المركزي للتخفيف من عجز المياهتوقفت الآبار عن العمل خلال الجفاف الأخيرعلى الرغم من أن قنوات الري الواسعة زادت من تخزين المياه الجوفية من خلال زيادة إعادة الشحن في أوائل القرن العشرينيمكن أن يؤدي زيادة الري من مشروع ربط الأنهار في الهند إلى تقليل هطول الأمطار في سبتمبر في المناطق التي تعاني بالفعل من نقص المياه بسبب تفاعل الأرض مع الغلاف الجوي.وتؤدي إلى زيادة ضخ المياه الجوفية. هذه الحالات تبرز الحاجة إلى التحكم في الطلب على المياه حتى عندما تكون هناك مياه إضافية متاحة.
يجب أن تعمل السياسات والحلول الهندسية جنبًا إلى جنب لمعالجة استنزاف المياه الجوفية. تم تطبيق تدابير مشابهة لتلك التي تم تنفيذها في منطقة نهر كولورادو، مثل تحويل المياه من نهر كولورادو، وفرض تنظيمات الضخ، وتحديد استخدام مياه الري، وزيادة استخدام المياه المعاد تدويرها، في مناطق الإدارة النشطة في أريزونا، مما أدى إلى استعادة ناجحة لتخزين المياه الجوفية.لقد استفادت عكس انخفاض مستويات المياه الجوفية في طبقة المياه الجوفية في سهل إسرائيل الساحلي خلال أواخر الستينيات من تحويل المياه، وإعادة استخدام المياه العادمة، وتقليل الضخ.مار، عملية إعادة شحن المياه بشكل اصطناعي إلى الطبقات السفلية، تدعم الاستخدام المشترك للمياه السطحية والمياه الجوفية، مما يزيد من مرونة النظام تجاه الظروف المناخية المتطرفة.لقد ساهمت MAR في عكس اتجاهات استنزاف المياه الجوفية في NCP ووادي كاليفورنيا المركزي وAMAs في أريزونا.مع إمكانيات تطبيق إضافية في الهندأفريقياوأوروباتواجه تحلية المياه تحديات، مثل إدارة نفايات المحلول الملحي.وتكاليف أعلى مقارنة بالمياه العادمة إعادة التدويرم limiting its application. ومع ذلك، فإن إعادة تدوير مياه الصرف الصحي، كما هو موضح في برنامج NCP وAMAs في أريزونايمكن أن يخفف بشكل كبير من ندرة المياه مع الفائدة الإضافية المتمثلة في تحسين جودة المياه. تظهر نتائجنا أن استعادة المياه الجوفية بسرعة عبر منطقة واسعة (NCP: ) يمكن تحقيقه من خلال تحويلات المياه والتدخلات السياسية، مما يقدم مثالاً قيماً لمديري موارد المياه على مستوى العالم.
طرق
جمع بيانات مستوى المياه الجوفية
أدى إصلاح نظام مراقبة المياه الجوفية في الصين حوالي عام 2018 إلى انقطاع في توفر بيانات عمق المياه الجوفية لمنطقة السهول الشمالية الوسطى، حيث شملت معظم الدراسات بيانات قبل ذلك.أو بعدمنذ عام 2005، نشر المعهد الصيني لمراقبة البيئة الجيولوجية سنوياته حول مستويات المياه الجوفية، مما وفر أول مجموعة بيانات شاملة ومتاحة للجمهور حول عمق المياه الجوفية في جميع أنحاء الصين. ومع ذلك، قبل إنشاء مشروع المراقبة الوطنية للمياه الجوفية في عام 2018، كانت آبار المراقبة نادرة، وكانت جودة البيانات غير متسقة، ولم يكن هناك سوى عدد محدود من الآبار التي توفر بيانات مستمرة، حيث كانت فترات المراقبة تتراوح من يومي إلى شهري. منذ عام 2018، بدأت الآبار الجديدة المثبتة بتسجيل عمق المياه الجوفية تلقائيًا فيفترات زمنية مدتها ساعة، مما أدى إلى بيانات سلسلة زمنية مستمرة وزيادة موثوقية المتوسطات الشهرية المستخدمة في هذه الدراسة. تم رقمنة بيانات متوسط عمق المياه الجوفية من عام 2005 إلى 2017 من سنويّات مستويات المياه الجوفية المطبوعة، بينما تم الحصول على البيانات من عام 2018 إلى 2024 من المنصة الإلكترونية لمعهد الصين لمراقبة البيئة الجيولوجية.https://geocloud.cgs.gov.cn).
معالجة البيانات المسبقة
تم تطبيق إجراءات مراقبة الجودة والتداخل قبل تجميع بيانات عمق المياه الجوفية على نطاقات إقليمية. تم تحديد ثلاثة معايير للمعالجة المسبقة: (1) الحد الأقصى المسموح به للفجوة للتداخل الخطي (intrplGapالشهور)، (2) الحد الأدنى لطول سلسلة البيانات المطلوبة (minLenالأشهر)، و(3) حجم النافذة المتحركة لاكتشاف القيم الشاذة (windowOLأولاً، تم تطبيق الاستيفاء الخطي على الفجوات الداخلية في البيانات التي لا تتجاوز intrplGap. ثانياً، تم استبعاد الآبار التي تحتوي على أقل من minLen شهراً من الملاحظات الصالحة من التحليل. ثالثاً، تم استخدام فلتر المتوسط المتحرك بطول نافذة windowOL شهراً لتحديد وإخفاء القيم الشاذة، والتي تم تعريفها على أنها القيم التي تنحرف بأكثر من ثلاث انحرافات معيارية عن المتوسط المتحرك. تم اختيار هذه العتبات بناءً على خصائص البيانات والتحليلات الأولية للحساسية لضمان تغطية مكانية وزمنية قوية مع تقليل تأثير القيم الشاذة.
تحليلات عمق المياه الجوفية في منطقة NCP
عادةً ما تُقسم المياه الجوفية الرباعية في منطقة NCP إلى أربعة خزانات، حيث يكون الأعمق غير محصور، بينما الثلاثة الأخرى محصورة.في سهل البيدمونت، يتم ضخ المياه بشكل أساسي من المياه الجوفية غير المحصورة، بينما في مناطق أخرى، تأتي المياه بشكل رئيسي من المياه الجوفية المحصورة بسبب وجود المياه المالحة والماء المالح في المياه الجوفية غير المحصورة..
هدفنا إلى تطوير فهم متسق لديناميات عمق المياه الجوفية عبر مقاييس إقليمية مختلفة على مدى العقدين الماضيين، لا سيما تحت نظام مراقبة المياه الجوفية المعاد تشكيله حول عام 2018. أولاً، قمنا بحساب التغير في عمق المياه الجوفية بين الأشهر المتتالية وطبقنا متوسطًا مرجحًا لتغيرات عمق المياه الجوفية في كل بئر مراقبة متاحة، باستخدام المناطق المقابلة لبوليجونات ثيسن كأساس للوزن:
أين و تمثل عمق المياه الجوفية بالأشهر و في كل بئر مراقبة، هو مساحة مضلع ثيسن المرتبط بالبئر، و هو مساحة المنطقة المستهدفة (كان كل بئر مرتبطًا مضلعًا فريدًا). تعني هذه المعادلة أن الآبار التي تحتوي على قياسات عمق المياه الجوفية الصالحة في كلا الشهرين فقط و تم تضمينها في المتوسط المكاني. ثانياً، قمنا بجمع التغييرات للحصول على التغيير التراكمي:
تم حساب شذوذ عمق المياه الجوفية كشذوذ للتغير التراكمي ( ). أخيرًا، استخدمنا تحليل التباين الموسمي والاتجاه باستخدام لويس (STL) لتفكيك سلسلة العمق المتوسطة إلى مكونات الاتجاه والموسمية والباقي. ميل ثايل-سين تم استخدامه لتقييم الاتجاهات في مكونات STL لأنه قوي ضد القيم الشاذة وفعال في تحليل الاتجاهات في عمق المياه الجوفية..
تظهر نتائجنا أن اختيار معلمات المعالجة المسبقة أثر بشكل طفيف على النتائج الرئيسية (الشكل التوضيحي التكميلي 5 أ، ب). لتقييم عدم اليقين الذي تم إدخاله، اختبرنا مجموعة من القيم: intrplGap من 1 إلى 5، و minLen و windowOL من“، و 60 ، مما يضمن أن windowOL لم يتجاوز minLen. على الرغم من أن تجميع التغيرات الشهرية في عمق المياه الجوفية أدخل بعض عدم اليقين، إلا أن تأثير اختيارات المعالجة المسبقة ظل محدودًا، كما هو موضح في المناطق المظللة في الشكل التوضيحي 5a و 5b. زاد عدد آبار المراقبة المتاحة بشكل كبير بعد عام 2018 (الشكل التوضيحي 5c). بالنسبة للمياه الجوفية غير المحصورة، ارتفعت تغطية الآبار من حوالي 400 إلى حوالي 500 في عام 2010 إلىإلىفي عام 2018. بالنسبة للمياه الجوفية المحصورة، زاد العدد منآبار قبل 2018 إلىبعد عام 2018. قمنا بتحليل التغيرات في عمق المياه الجوفية بدلاً من المستويات المطلقة، مما قلل من حساسية الاتجاهات الإقليمية لثغرات البيانات أو عدم التناسق في استمرارية الآبار. تبعت رؤوس المياه الجوفية في طبقات المياه الجوفية المحصورة المختلفة نمطين عامين (الشكل التكميلي 5d). أولاً، كانت الطبقات الأعمق عادةً لها أعماق أكبر إلى المياه الجوفية. ثانياً، بسبب الضخ المكثف والتسرب العمودي عبر الطبقات العازلة، كانت رؤوس المياه الجوفية عبر الطبقات غالبًا ما تكون متشابهة. لم نقم بتحليل ديناميات رؤوس المياه الجوفية عبر الطبقات المحصورة المختلفة على المستوى الإقليمي، وذلك أساسًا بسبب العدد المحدود من آبار المراقبة في الطبقتين المحصورتين الثانية والثالثة، خاصة قبل عام 2018.
قمنا بتقييم عدم اليقين المرتبط بالتوزيع المكاني لشبكة المراقبة وتطبيق طريقة مضلع ثيسن باستخدام محاكاة مونت كارلو. في كل واحدة من 10,000 محاكاة،تم اختيار عدد من آبار المراقبة المتاحة بشكل عشوائي لحساب متوسط عمق المياه الجوفية الشهري. تأخذ هذه الطريقة في الاعتبارالتقلب من شهر لآخر في توفر الآبار.
من نتائج المحاكاةقمنا بحسابفترة الثقة (CI) والانحراف المعياري () كما يلي:
حيث أنويمثلان النسب المئوية الخامسة والتسعين من مجموعة المحاكاة.
تم تقييم دلالة الاتجاه باستخدام اختبار مان-كيندال عند مستوى دلالة(ذو طرفين). بالنسبة للآبار الفردية (الشكل 2b-l)، تم تقدير الاتجاهات باستخدام ميل ثايل-سين المطبق على بيانات السلاسل الزمنية الخام لاستيعاب انقطاع البيانات. على مستوى المدينة (الشكل 3b)، اخترنا أربع مدن، بكين، باودينغ، هينغشوي، وتانغشان بناءً على توفر البيانات الكافية لإنشاء سلاسل زمنية مستمرة قبل وبعد عام 2018. لتصنيف الاتجاهات على مستوى البئر (الشكل 3c)، اعتبرنا فقط الآبار التي تحتوي على بيانات كاملة لكل من فترات 2005-2017 و2018-2024. تم تحديد “عكس” اتجاه تعميق المياه الجوفية فقط عندما تلا انخفاض أحادي الاتجاه انتعاش أحادي الاتجاه. تم تصنيف الآبار ذات أنماط التعافي غير الأحادية على أنها “تخفيف”.
العلاقة بين هطول الأمطار والتغيرات في عمق المياه الجوفية
قمنا بتحليل العلاقة بين هطول الأمطار والتغيرات في عمق المياه الجوفية لتقييم تأثير التدخل البشري على استعادة المياه الجوفية. لعرض هطول الأمطار (المحاور الرأسية في الشكل 5b، d)، استخدمنا المتوسط المتحرك لمدة 12 شهرًا، حيث يمكن أن يكون تأثيره على إعادة شحن المياه الجوفية طويل الأمد:
حيث أنهو المتوسط المتحرك لهطول الأمطار لمدة 12 شهرًا للشهروهو هطول الأمطار في الشهر.
لتمثيل التغيرات في عمق المياه الجوفية (المحاور الأفقية في الشكل 5b، d)، استخدمنا الفرق من شهر لآخر في مكون الاتجاه من شذوذ عمق المياه الجوفية المجمعة:
حيث أنهو التغير في مكون الاتجاه STL لشذوذ عمق المياه الجوفية للشهروهو مكون الاتجاه STL نفسه للشهر.
تقدير العائد المحدد المتوسط
تم تقدير العائد المحدد المتوسط في منطقة نهر الشمال باستخدام طريقة ميزان المياهالتي تستخدم العلاقة بين التغيرات في عمق المياه الجوفية داخل المياه الجوفية غير المحصورة وسحب المياه الجوفية مطروحًا منها إعادة الشحن. تم تطبيق المعادلة التالية:
حيث أنهو التغير السنوي في عمق المياه الجوفية في المياه الجوفية غير المحصورة،هو العائد المحدد الملائم،هو مساحة منطقة نهر الشمال، وهو ثابت.
أدلة أخرى على استعادة المياه الجوفية
بالإضافة إلى الاستعادة في عمق المياه الجوفية، استقرت أيضًا هبوط الأرض في منطقة نهر الشمال أو بدأت في التعافي. لقد تفاقم هبوط الأرض في
منطقة نهر الشمال منذلكن كانت هناك حالات من الاستقرار والتعافي في بكينوتيانجينوكانغتشو. ظهرت الينابيع مرة أخرى في منتوجو في بكين (https://www. beijing.gov.cn/renwen/jrbj/202304/t20230419_3059190.html) وفي ينابيع باي في شينغتاي (http://slt.hebei.gov.cn/a/2022/07/22/ 7BACE2B982F842A387544296E12E9A0F.html). من المحتمل أن يكون تكثيف المنطقة غير المشبعة بسبب النضوب قد قلل بشكل كبير من إعادة الشحنلذا فإن التعافي في مستويات المياه الجوفية قد يؤدي إلى زيادة إعادة الشحن.
القيود
على الرغم من استخدام أفضل البيانات المتاحة في الموقع لعمق المياه الجوفية في منطقة نهر الشمال، لا تزال هناك عدة قيود. أولاً، كانت الملاحظات المستمرة متاحة لعدد محدود فقط من الآبار، خاصة قبل عام 2018. كانت البيانات قبل عام 2017 غالبًا غير منتظمة، مع تكرارات قياس متغيرة وتغطية مكانية نادرة، خاصة في جنوب شرق منطقة نهر الشمال. هذه القيود في مراقبة المياه الجوفية تقدم عدم اليقين عند تطبيق الاستيفاء المكاني باستخدام طريقة مضلع ثيسن. في المناطق ذات البيانات النادرة، تتلقى الآبار أوزانًا مرتفعة بشكل غير متناسب، مما قد يؤثر على تمثيل وموثوقية التقديرات الإقليمية. ثانيًا، تم ملاحظة تعافي أسرع في المناطق الحضرية مقارنة بالمناطق الريفية، مدفوعًا إلى حد كبير باستبدال ضخ المياه الجوفية البلدية بالمياه من مشروع SNWD، مما قد يقدم تحيزًا عندما يكون توزيع الآبار غير متساوٍ. لتقليل عدم اليقين الناتج عن التجميع المكاني، اعتمدنا طريقة مضلع ثيسن غير المعلمية. على الرغم من أن هذه الطريقة تتضمن وزنًا مكانيًا، إلا أنها لا تزال حساسة لتوزيع الآبار غير المتساوي. ثالثًا، بسبب غياب معلمات هيدروجيولوجية مفصلة، لم نتمكن من تقدير التغيرات في تخزين المياه الجوفية بدقة مكانية دقيقة. هذا مهم بشكل خاص بالنسبة للمياه الجوفية المحصورة، حيث قد يتأخر التعافي بسبب آثار الانضغاط على المدى الطويل وإعادة الشحن العمودي المحدودة. أخيرًا، ركزت هذه الدراسة فقط على منطقة نهر الشمال بسبب الجهد المكثف المطلوب لجمع ورقمنة البيانات من كتب الهيدروجيولوجيا المطبوعة. سيتطلب توسيع هذا التحليل إلى مناطق أخرى استثمارًا مشابهًا في جمع البيانات ومراقبة الجودة. ومع ذلك، تشير تحليل عدم اليقين لدينا (الشكل 3a، b) إلى أن هذه القيود لا تضر بالنتيجة الأساسية المتعلقة بالتعافي السريع والمهم إقليميًا للمياه الجوفية في منطقة نهر الشمال.
تمت معالجة البيانات وتحليلها باستخدام MATLAB. يمكن العثور على الكود ذي الصلة على زينودو (https://doi.org/10.5281/zenodo..
References
Scanlon, B. R. et al. Global water resources and the role of groundwater in a resilient water future. Nat. Rev. Earth Environ. 4, 87-101 (2023).
Döll, P. et al. Global-scale assessment of groundwater depletion and related groundwater abstractions: Combining hydrological modeling with information from well observations and GRACE satellites. Water Resour. Res. 50, 5698-5720 (2014).
Gleeson, T., Wada, Y., Bierkens, M. F. P. & van Beek, L. P. H. Water balance of global aquifers revealed by groundwater footprint. Nature 488, 197-200 (2012).
Wada, Y. et al. Global depletion of groundwater resources. Geophys. Res. Lett. 37, L20402 (2010).
Jasechko, S. et al. Rapid groundwater decline and some cases of recovery in aquifers globally. Nature 625, 715-721 (2024).
Ao, Z. et al. A national-scale assessment of land subsidence in China’s major cities. Science 384, 301-306 (2024).
Herrera-García, G. et al. Mapping the global threat of land subsidence. Science 371, 34-36 (2021).
de Graaf, I. E. M., Gleeson, T., van Beek, L. P. H., Sutanudjaja, E. H. & Bierkens, M. F. P. Environmental flow limits to global groundwater pumping. Nature 574, 90-94 (2019).
Condon, L. E. & Maxwell, R. M. Simulating the sensitivity of evapotranspiration and streamflow to large-scale groundwater depletion. Sci. Adv. 5, eaav4574 (2019).
Werner, A. D. et al. Seawater intrusion processes, investigation and management: Recent advances and future challenges. Adv. Water Resour. 51, 3-26 (2013).
Deines, J. M. et al. Transitions from irrigated to dryland agriculture in the Ogallala Aquifer: Land use suitability and regional economic impacts. Agric. Water Manag. 233, 106061 (2020).
Tillman, F. D. & Flynn, M. E. Arizona Groundwater Explorer: interactive maps for evaluating the historical and current groundwater conditions in wells in Arizona, USA. Hydrogeol. J. 32, 645-661 (2024).
Buapeng, S. & Foster, S. Controlling groundwater abstraction and related environmental degradation in metropolitan Bangkok Thailand. Report number: GW-MATe Case Profile Collection 20Affiliation: World Bank (Washington DC) www.worldbank.org/ gwmat (2008).
Karimi, H. & Alimoradi, S. Impacts of water transfer from Karkheh Dam on rising of groundwater in Dasht-e-Abass Plain, Ilam Province. Res. Earth Sci. 8, 33-44 (2017).
Alam, S., Gebremichael, M., Li, R., Dozier, J. & Lettenmaier, D. P. Can managed aquifer recharge mitigate the groundwater overdraft in California’s central valley?. Water Resour. Res. 56, e2020WRO27244 (2020).
Ulibarri, N., Escobedo Garcia, N., Nelson, R. L., Cravens, A. E. & McCarty, R. J. Assessing the feasibility of managed aquifer recharge in California. Water Resour. Res. 57, e2020WR029292 (2021).
Long, D. et al. South-to-north water diversion stabilizing Beijing’s groundwater levels. Nat. Commun. 11, 3665 (2020).
Scanlon, B. R., Reedy, R. C., Faunt, C. C., Pool, D. & Uhlman, K. Enhancing drought resilience with conjunctive use and managed aquifer recharge in California and Arizona. Environ. Res. Lett. 11, 035013 (2016).
Tang, W. et al. Land subsidence and rebound in the Taiyuan basin, northern China, in the context of inter-basin water transfer and groundwater management. Remote Sens. Environ. 269, 112792 (2022).
Martínez-Santos, P., Castaño-Castaño, S. & Hernández-Espriú, A. Revisiting groundwater overdraft based on the experience of the Mancha Occidental Aquifer, Spain. Hydrogeol. J. 26, 1083-1097 (2018).
Monir, M. M. & Sarker, S. C. Analyzing post-2000 groundwater level and rainfall changes in Rajasthan, India, using well observations and GRACE data. Heliyon 10, e24481 (2024).
Zheng, C. et al. Can China cope with its water crisis?-Perspectives from the North China Plain. Groundwater 48, 350-354 (2010).
Liu, J., Zheng, C., Zheng, L. & Lei, Y. Ground water sustainability: methodology and application to the North China plain. Groundwater 46, 897-909 (2008).
Yang, H. et al. Evolution of groundwater level in the North China Plain in the past 40 years and suggestions on its overexploitation treatment. Geol. China 48, 1142-1155 (2021).
Cao, G., Zheng, C., Scanlon, B. R., Liu, J. & Li, W. Use of flow modeling to assess sustainability of groundwater resources in the North China Plain. Water Resour. Res. 49, 159-175 (2013).
Yang, W. et al. Human intervention will stabilize groundwater storage across the north China plain. Water Resour. Res. 58, e2021WRO30884(2022).
Zhang, C. et al. Sub-regional groundwater storage recovery in North China Plain after the South-to-North water diversion project. J. Hydrol. 597, 126156 (2021).
Zhang, C. et al. The Effectiveness of the South-to-North water diversion middle route project on water delivery and groundwater recovery in north china plain. Water Resour. Res. 56, e2019WRO26759 (2020).
Li, X., Ye, S.-Y., Wei, A.-H., Zhou, P.-P. & Wang, L.-H. Modelling the response of shallow groundwater levels to combined climate and water-diversion scenarios in Beijing-Tianjin-Hebei Plain, China. Hydrogeol. J. 25, 1733-1744 (2017).
Dong, L. et al. Shifting agricultural land use and its unintended water consumption in the North China Plain. Sci. Bull. 69, 3968-3977 (2024).
Chen, Y., Yin, G. & Liu, K. Regional differences in the industrial water use efficiency of China: the spatial spillover effect and relevant factors. Resour. Conserv. Recycl. 167, 105239 (2021).
Chen, F., Ding, Y., Tang, S., Ding, L. & Yang, Y. Practice and effect analysis of river-lake ecological water supplement and groundwater recharge in the North China region. China Water Resour. 7, 36-39 (2021).
National Bureau of Statistics. China rural statistical yearbook (2005-2024).
Butler, J. J. Jr, Whittemore, D. O., Wilson, B. B. & Bohling, G. C. A new approach for assessing the future of aquifers supporting irrigated agriculture. Geophys. Res. Lett. 43, 2004-2010 (2016).
Zheng, H., Liu, Y. & Zhao, J. Understanding water rights and water trading systems in China: a systematic framework. Water Secur. 13, 100094 (2021).
Hai River basin Water Authority. Hai River Water Resources Bulletin (2005-2023).
Pérez-Blanco, C. D., Loch, A., Ward, F., Perry, C. & Adamson, D. Agricultural water saving through technologies: a zombie idea. Environ. Res. Lett. 16, 114032 (2021).
Noori, R. et al. Anthropogenic depletion of Iran’s aquifers. Proc. Natl. Acad. Sci. 118, e2024221118 (2021).
Alattar, M. H. Mapping groundwater dynamics in Iraq: integrating multi-data sources for comprehensive analysis. Model. Earth Syst. Environ. 10, 4375-4385 (2024).
Caló, F. et al. DInSAR-based detection of land subsidence and correlation with groundwater depletion in Konya Plain, Turkey. Remote Sens. 9, 83 (2017).
Massoud, E. C., Liu, Z., Shaban, A. & Hage, M. E. Groundwater depletion signals in the Beqaa Plain, Lebanon: evidence from GRACE and Sentinel-1 data. Remote Sens. 13, 915(2021).
Brückner, F. et al. Causes and consequences of long-term groundwater overabstraction in Jordan. Hydrogeol. J. 29, 2789-2802 (2021).
van Rooyen, J. D., Watson, A. P. & Miller, J. A. Combining quantity and quality controls to determine groundwater vulnerability to depletion and deterioration throughout South Africa. Environ. Earth Sci. 79, 255 (2020).
Jasechko, S. & Perrone, D. California’s central valley groundwater wells run dry during recent drought. Earth’s. Future 8, e2019EF001339 (2020).
Scanlon, B. R. et al. Groundwater depletion and sustainability of irrigation in the US high plains and central valley. Proc. Natl. Acad. Sci. 109, 9320-9325 (2012).
Butler, J. J. Jr, Whittemore, D. O., Wilson, B. B. & Bohling, G. C. Sustainability of aquifers supporting irrigated agriculture: a case study of the High Plains aquifer in Kansas. Water Int. 43, 815-828 (2018).
MacDonald, A. M. et al. Groundwater quality and depletion in the Indo-Gangetic Basin mapped from in situ observations. Nat. Geosci. 9, 762-766 (2016).
Faunt, C. C. et al. Groundwater sustainability and land subsidence in California’s central valley. Water 16, 1189 (2024).
Furman, A. & Abbo, H. In Water Policy in Israel: Context, Issues and Options (ed Nir Becker) 125-136 (Springer Netherlands, 2013).
Shumilova, O., Tockner, K., Thieme, M., Koska, A. & Zarfl, C. Global water transfer megaprojects: a potential solution for the water-food-energy nexus? Front. Environ. Sci. 6, https://doi.org/10.3389/ fenvs.2018.00150 (2018).
MacAllister, D. J., Krishan, G., Basharat, M., Cuba, D. & MacDonald, A. M. A century of groundwater accumulation in Pakistan and northwest India. Nat. Geosci. 15, 390-396 (2022).
Chauhan, T., Devanand, A., Roxy, M. K., Ashok, K. & Ghosh, S. River interlinking alters land-atmosphere feedback and changes the Indian summer monsoon. Nat. Commun. 14, 5928 (2023).
Tillman, F. D. & Leake, S. A. Trends in groundwater levels in wells in the active management areas of Arizona, USA. Hydrogeol. J. 18, 1515-1524 (2010).
Jacobs, K. L. & Holway, J. M. Managing for sustainability in an arid climate: lessons learned from 20 years of groundwater management in Arizona, USA. Hydrogeol. J. 12, 52-65 (2004).
Ganguly, S. & Ganguly, S. Implementation of managed aquifer recharge techniques in India. Curr. Sci. 121, 641-650 (2021).
Ebrahim, G. Y., Lautze, J. F. & Villholth, K. G. Managed aquifer recharge in africa: taking stock and looking forward. Water 12, 1844 (2020).
Standen, K., Costa, L. R. D. & Monteiro, J.-P. In-channel managed aquifer recharge: a review of current development worldwide and future potential in Europe. Water 12, 11 (2020).
Jones, E., Qadir, M., van Vliet, M. T. H., Smakhtin, V. & Kang, S. -m The state of desalination and brine production: a global outlook. Sci. Total Environ. 657, 1343-1356 (2019).
Smith, K., Liu, S., Hu, H.-Y., Dong, X. & Wen, X. Water and energy recovery: the future of wastewater in China. Sci. Total Environ. 637638, 1466-1470 (2018).
Nan, T. et al. Evaluation of shallow groundwater dynamics after water supplement in North China Plain based on attention-GRU model. J. Hydrol. 625, 130085 (2023).
Bai, L. et al. Quantifying the influence of long-term overexploitation on deep groundwater resources across Cangzhou in the North China Plain using InSAR measurements. J. Hydrol. 605, 127368 (2022).
Sen, P. K. Estimates of the regression coefficient based on Kendall’s Tau. J. Am. Stat. Assoc. 63, 1379-1389 (1968).
Theil, H. In Henri Theil’s Contributions to Economics and Econometrics: Econometric Theory and Methodology (eds. Baldev Raj & Johan Koerts) 345-381(Springer Netherlands, 1992).
Mann, H. B. Nonparametric tests against trend. Econometrica 13, 245-259 (1945).
Su, G. et al. Spatiotemporal evolution characteristics of land subsidence caused by groundwater depletion in the North China plain during the past six decades. J. Hydrol. 600, 126678 (2021).
Yu, X., Wang, G., Hu, X., Liu, Y. & Bao, Y. Land Subsidence in Tianjin, China: Before and after the South-to-North Water Diversion. Remote Sensing 15, 1647 (2023).
Guo, H. et al. Land subsidence and its affecting factors in Cangzhou, North China Plain. Front. Environ. Sci. 10 (2022).
Cao, G., Scanlon, B. R., Han, D. & Zheng, C. Impacts of thickening unsaturated zone on groundwater recharge in the North China plain. J. Hydrol. 537, 260-270 (2016).
Xu, Y., Long, D. & Cui, Y. Unprecedented large-scale aquifer recovery through human intervention. https://doi.org/10.5281/ zenodo. 15797080 (2025).
شكر وتقدير
تم دعم هذه الدراسة من قبل البرنامج الوطني الرئيسي للبحث والتطوير في الصين (رقم المنحة 2021 YFB3900604 لد. ل. و ي. ج.)، ومؤسسة العلوم الطبيعية الوطنية في الصين (أرقام المنح 52325901 لد. ل. و 52079065 لد. ل.)، وبرنامج البنك الدولي لمياه الصين PASA لد. ل.
مساهمات المؤلفين
طور د. ل.، ي. إكس.، و ي. ج. مفهوم ومنهجية هذه الدراسة. قام د. ل.، ي. إكس.، و ي. ج. بمعالجة البيانات وتحليلها بدعم من جميع المؤلفين الآخرين. ناقش د. ل.، ي. إكس.، ي. ج.، ي. هـ. ج.، ج. ج. ب.، ل. د.، ل. و.، د. ي. ل.، ي. و.، ل. هـ.، ج. ب.، ب. ل.، س. و.، إكس. ن.، ي. ج.، ج. ج.، ي. م.، ي. ق.، ج. و.، هـ. و.، و ب. ر. س. النتائج وحسنوا كتابة هذه المخطوطة.
ملاحظة الناشر تظل Springer Nature محايدة فيما يتعلق بالمطالبات القضائية في الخرائط المنشورة والانتماءات المؤسسية.
الوصول المفتوح هذه المقالة مرخصة بموجب رخصة المشاع الإبداعي للاستخدام غير التجاري، والتي تسمح بأي استخدام غير تجاري، ومشاركة، وتوزيع، وإعادة إنتاج في أي وسيلة أو صيغة، طالما أنك تعطي الائتمان المناسب للمؤلفين الأصليين والمصدر، وتوفر رابطًا لرخصة المشاع الإبداعي، وتوضح إذا كنت قد قمت بتعديل المادة المرخصة. ليس لديك إذن بموجب هذه الرخصة لمشاركة المواد المعدلة المشتقة من هذه المقالة أو أجزاء منها. الصور أو المواد الأخرى من طرف ثالث في هذه المقالة مشمولة في رخصة المشاع الإبداعي للمقالة، ما لم يُشار إلى خلاف ذلك في سطر الائتمان للمادة. إذا لم تكن المادة مشمولة في رخصة المشاع الإبداعي للمقالة واستخدامك المقصود غير مسموح به بموجب اللوائح القانونية أو يتجاوز الاستخدام المسموح به، ستحتاج إلى الحصول على إذن مباشرة من صاحب حقوق الطبع والنشر. لعرض نسخة من هذه الرخصة، قم بزيارة http:// creativecommons.org/licenses/by-nc-nd/4.0/.
(ج) المؤلفون 2025
المختبر الوطني الرئيسي لعلوم المياه والهندسة، قسم الهندسة الهيدروليكية، جامعة تسينغhua، بكين، الصين. المختبر الرئيسي لعلوم الهيدروسفير بوزارة الموارد المائية، جامعة تسينغhua، بكين، الصين. المسح الجيولوجي في كانساس، جامعة كانساس، لورانس، كنساس، الولايات المتحدة الأمريكية. المعهد الصيني لمراقبة البيئة الجيولوجية، بكين، الصين. قسم العلوم البيولوجية والبيئية والهندسة، جامعة الملك عبد الله للعلوم والتقنية، ثول، المملكة العربية السعودية. كلية علوم المياه، جامعة بكين العادية، بكين، الصين. مركز هيدرولوجيا بكين، بكين، الصين. معهد علوم وتكنولوجيا المياه في بكين، بكين، الصين. معهد بكين لمراقبة البيئة الجيولوجية، بكين، الصين. كلية الهندسة المدنية والعمارة، جامعة قوانغشي، ناننينغ، الصين. مركز المعلومات، وزارة الموارد المائية، بكين، الصين. شركة تحويل المياه من الجنوب إلى الشمال في الصين المحدودة، بكين، الصين. المختبر الوطني الرئيسي لدورة المياه وأمن المياه، المعهد الصيني للموارد المائية والبحوث الهيدروليكية، بكين، الصين. مكتب الجيولوجيا الاقتصادية، مدرسة جاكسون لعلوم الأرض، جامعة تكساس في أوستن، أوستن، تكساس، الولايات المتحدة الأمريكية. ساهم هؤلاء المؤلفون بالتساوي: د. ل.، يوانتشينغ شيو، يينغجيه كوي. البريد الإلكتروني: dlong@tsinghua.edu.cn
Groundwater depletion is a critical global challenge, particularly in intensively cultivated drylands, with few documented cases of successful recovery. Here, we report a striking reversal of long-term groundwater decline in the North China Plain, one of the world’s most severely depleted aquifers. Based on a comprehensive analysis of groundwater levels from over 2000 monitoring wells spanning the past two decades, we show that groundwater levels have risen at an average rate of year since 2020, surpassing 2005 levels by 2024. This recovery is driven by a combination of large-scale surface water diversion from the humid south and stringent groundwater pumping regulations, further amplified by wet years (e.g., 2021). From 2005 to 2023, these policies reduced annual groundwater abstraction by and increased environmental water allocations to over since 2021, promoting aquifer recharge and restoring environmental flows. Our findings demonstrate that rapid, large-scale groundwater recovery is achievable through integrated water management and targeted policy interventions across extensive regions .
Groundwater depletion is a critical global challenge , particularly in intensively cultivated drylands . Continued declines in groundwater levels will have wide-ranging impacts, including land subsidence , the desiccation of rivers and wetlands , seawater intrusion , intense economic pressure on rural communities , and threats to the viability of global food supplies . To mitigate groundwater depletion, various strategies have been implemented worldwide, such as reduced groundwater abstraction , substitution of groundwater
pumping with surface water from reservoirs , managed aquifer recharge (MAR) , and inter-basin water diversions . Despite these efforts, a recent study found that rapid groundwater level declines ( year ) remain widespread, with only a small fraction of globally productive aquifers showing signs of recovery (aquifers with rising trends year constituting over the past two decades) . Cases of groundwater recovery, when reported, are often spatially limited and exhibit only modest rates of recovery (e.g.,
Mancha Occidental aquifer (Spain) , Abbas-e Sharghi basin (Iran) , Eastern Malwa Plateau alluvial aquifer (India) , Bangkok basin (Thailand) , Taiyuan basin (China) , and parts of California and Arizona (US) ; Fig. 1). Cultivated drylands are particularly vulnerable to rapid and accelerating groundwater level declines due to inadequate management strategies . In this context, the North China Plain (NCP), an intensively cultivated region spanning , presents a compelling case study. Here, we use the NCP as an example to demonstrate the feasibility of achieving rapid groundwater recovery year at an unprecedented spatial scale through ongoing human intervention.
The NCP, which forms the plain portion of the Hai River basin (HRB), has been identified as a global hotspot for groundwater depletion . This region, which is responsible for of China’s grain production, supports a population of million people and is characterized by severely limited water resources, with of renewable water resources available per capita annually . To meet the escalating demands of socioeconomic development, groundwater in the NCP has been heavily exploited. By the early 2000s, groundwater constituted of the total water supply, with irrigation accounting for of the total water usage. As a result, groundwater levels in the NCP declined at a rate of year by the end of the 20th century , leading to an estimated cumulative depletion of from the 1960s to . In response to the acute water shortage in North China, the South-to-North Water Diversion (SNWD) project was initiated in 2002, diverting water from the humid Yangtze River basin. The high-quality diverted water has primarily been used to replace groundwater pumping for municipal and industrial purposes . Additionally, excess diverted water has been used to replenish rivers and lakes and increase aquifer storage through MAR. Alongside strict groundwater pumping policies (e.g., shutting off wells and restricting groundwater pumping for irrigation when surface water is available), these measures have contributed to the stabilization and local recovery of groundwater levels in the NCP . While conceptual and numerical models have indicated the potential for groundwater recovery across the NCP , the actual extent of this
recovery has remained uncertain due to a lack of in-situ observations, which are often further hampered by spatiotemporal inconsistencies among monitoring well records.
In this study, we compiled and analyzed the most comprehensive dataset of in-situ groundwater level measurements to date across the NCP, from 2005 to 2024, with measurements from over 2000 wells. Our analysis reveals a significant recovery trend, with groundwater levels rising by year on average across the NCP during 2020-2024. This recovery is primarily attributed to water diversions and active aquifer restoration policies. These findings challenge a previous study , which may have underestimated the extent of groundwater recovery (Fig. 1f). Overall, our results provide critical insights into the potential for addressing groundwater depletion in cultivated drylands globally.
Results
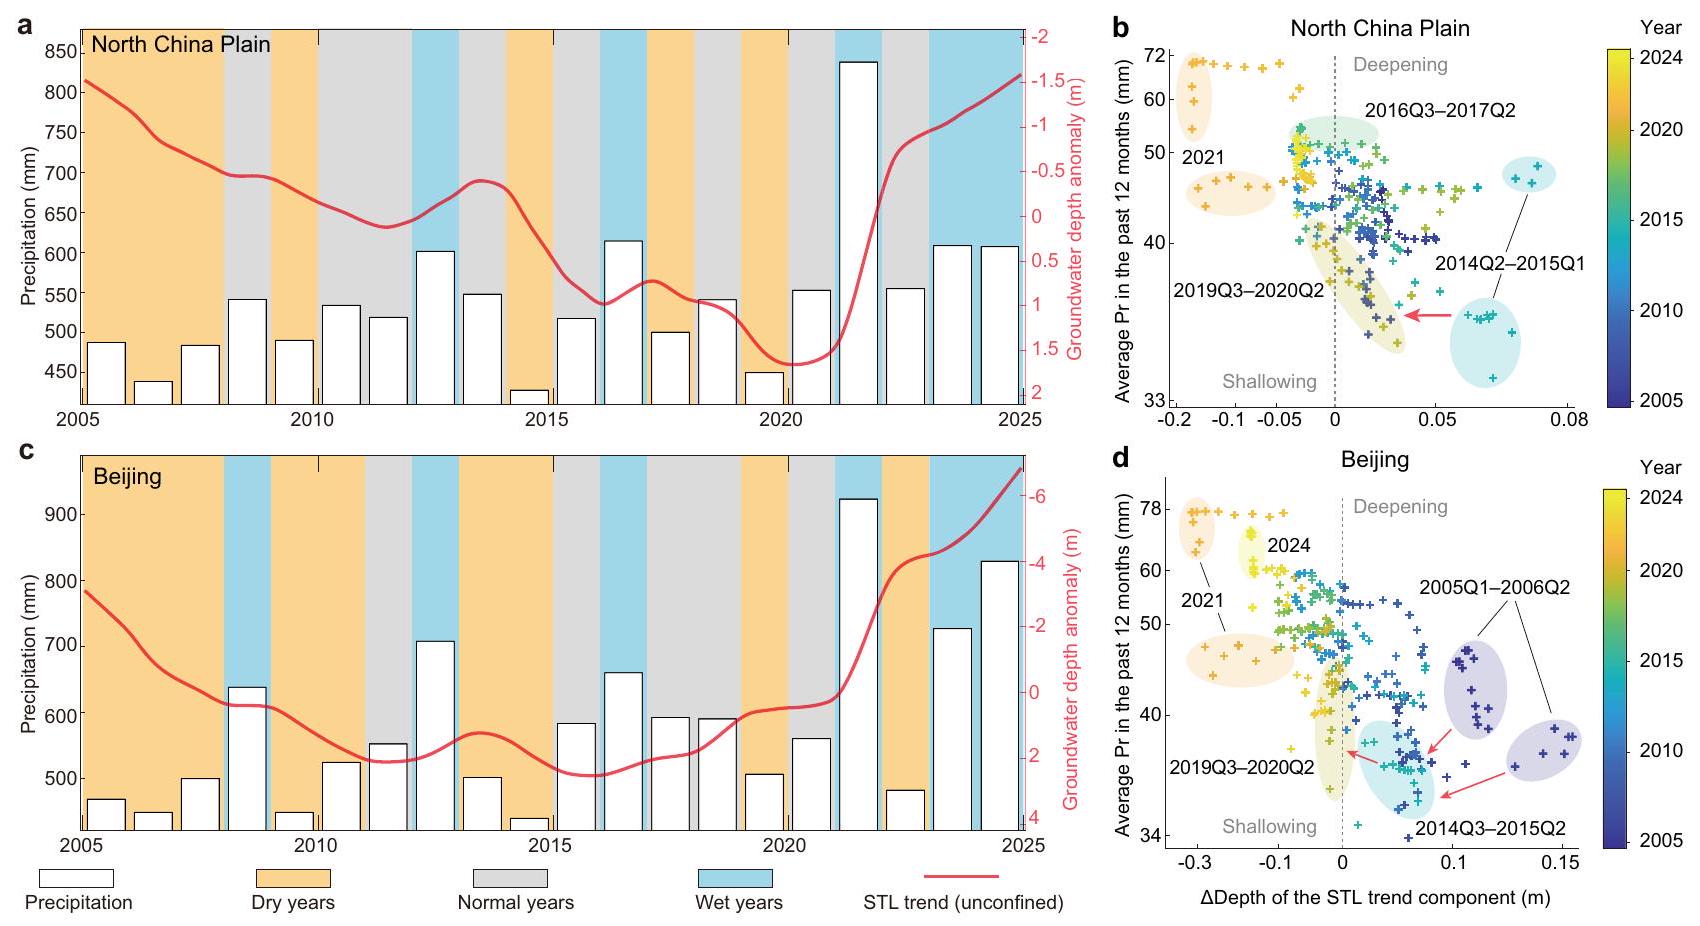
Reversing groundwater depletion across the North China Plain
To investigate groundwater recovery in the NCP, we compiled an extensive dataset of in-situ groundwater level measurements from both unconfined and confined aquifers in urban and rural areas within the NCP. The establishment of China’s national groundwater monitoring project in 2018 markedly improved the spatiotemporal coverage and quality of in situ measurements. Prior to 2018, there were many temporal discontinuities in the monitoring data, but the advent of an automatic monitoring system thereafter provided continuous data. Post-2018, there was a notable increase in monitoring well density in the NCP, particularly in the southeastern portions and in confined aquifers (Supplementary Fig. 1). For unconfined aquifers, groundwater levels were deepest ( ) in the piedmont plain in the western portion of the NCP and shallowest ( ) in the eastern portion of the NCP (Supplementary Fig. 1a-d). For confined aquifers, groundwater heads were deepest ( ) in the cities of Tianjin, Cangzhou, and Hengshui (Supplementary Fig. 1e-h). Rapid shallowing trends have been observed across the NCP in both unconfined and confined aquifers (Fig. 2). We calculated Theil-Sen slopes for depth to groundwater at monitoring wells during 2020-2024 (Fig. 2m) because
Fig. 1 | Comparisons with previously reported cases of recovery. a Previously reported groundwater recovery trends in the 21st century , including the Mancha Occidental aquifer in Spain (b), Abbas-e Sharghi basin in Iran (c), Eastern Malwa Plateau alluvial aquifer in India (d), Bangkok basin in Thailand (e), Taiyuan basin in China (f), East Salt River and Upper Santa Cruz basins in the United States (g). The
trends previously reported for the North China Plain are also highlighted in (f) . Positive trends (blue) indicate shallowing groundwater, while negative trends (red) indicate deepening groundwater. The main drivers for each recovery case are also labeled.
Fig. 2 | Trends in groundwater depths across monitoring wells in the North China Plain and comparisons with previously reported cases of recovery.
a Overview of the Hai River basin (HRB). The purple line represents the boundary of the HRB. The green line represents the northern and western boundary of the North China Plain (NCP), which is the plain portion of the HRB. Orange lines represent the central route of the South-to-North Water Diversion (SNWD-C). Blue polygons represent reservoirs. Brown lines represent the boundaries of Hebei Province and the provincial-level municipalities of Beijing and Tianjin (Province). Red diamonds represent major cities. Purple circles represent the locations of monitoring wells (b-l). b-j Instances of continuous depth to groundwater measurements in
unconfined aquifers during 2005-2024. Green lines represent the depth to groundwater. Thick blue lines illustrate the long-term trends derived from STL decomposition. k, 1 Instances of continuous depth to groundwater measurements in confined aquifers during 2005-2024. Purple lines represent the depth to groundwater. Thick red lines illustrate the long-term trends derived from STL decomposition. Trends in groundwater levels and heads at individual wells during 2020-2024. Circles indicate unconfined aquifers, while Deltas represent confined aquifers. Positive trends (blue) indicate shallowing groundwater, while negative trends (red) indicate deepening groundwater.
2020 marked the point of reversal in the average groundwater depth in the NCP. In unconfined aquifers, the most pronounced reversal in groundwater levels was found in the piedmont plain in the western portion of the NCP, with trends exceeding 1.5 m year during 2020-2024. In confined aquifers, rapid shallowing trends in groundwater heads ( year ) were evident in the piedmont areas, as well as in the cities of Tianjin, Cangzhou, and Hengshui. Additionally, wells with continuous measurements indicated recovery in both urban and rural areas (Fig. 2b-l).
The groundwater level data indicate that the reversal of deepening trends in the average groundwater depth anomalies in both unconfined and confined aquifers occurred around 2020 (Fig. 3a). By the end of 2024, the average groundwater depth was and in unconfined and confined aquifers, respectively. In general, depths to groundwater in unconfined and confined aquifers are greatest in summer and smallest in winter, driven primarily by the combined effects of groundwater pumping for irrigation (peaking in spring) and recharge from precipitation (summer monsoonal rainfall accounting for of annual precipitation). Seasonal variability in groundwater depth within a year is in unconfined aquifers and in confined aquifers. To mitigate the impact of seasonal variability, we isolated the long-term trends in the groundwater depth anomaly time series after removing the seasonal variability using STL decomposition. Our analysis shows that the rate of deepening in groundwater depth in unconfined aquifers slowed before the reversal in 2020 compared to the deepening trend in the late 20th century. Historically, groundwater levels in unconfined aquifers in the Piedmont Plain declined at a rate of year during 1984-2005 . The deepening trend decreased to 0.2 m year during 2005-2019, with relatively humid conditions in 2012 and 2016 contributing to mild recoveries. After the reversal in 2020, a rapid recovery rate of
0.7 m year occurred during 2020-2024, with the average groundwater depth anomaly in unconfined aquifers in 2024 nearing levels last seen in 2005. For confined aquifers, we found a deepening trend of year during 2005-2019, followed by a recovery of during 2020-2024. By 2024, the average groundwater head had returned to levels comparable to those in 2013. Notably, the recovery rates for both unconfined and confined aquifers decreased after 2021. Additionally, numerous sources have indicated a recovery in groundwater levels, as shown by the mitigation of land subsidence and re-emergence of springs in regions such as Beijing and Xingtai (see Methods).
Beijing experienced the first reversal of deepening groundwater levels in unconfined aquifers, followed by other cities in the NCP (Fig. 3b). Monitoring data from Beijing, the city with the highest quality data in the NCP, indicated the earliest reversal in 2016, followed by a recovery rate of 1 m year during 2016-2024. Since 2021, Beijing’s groundwater level has been shallower than it was in 2005. In Baoding, the reversal occurred in 2020, with a recovery rate of 1.5 m year during 2020-2024. By 2024, the groundwater level in Baoding was shallower than in 2005. The recovery of groundwater levels in Hengshui and Tangshan has been ongoing since 2021, albeit at a slower rate of 0.4 m year and 0.3 m year , respectively. The lower uncertainty in average groundwater depth anomalies for Beijing and the NCP, compared to Baoding, Hengshui, and Tangshan, underscores the importance of dense in-situ monitoring networks and comprehensive regional analysis in improving the reliability of groundwater assessments.
We identified and analyzed trends in groundwater depth at continuously monitored wells during 2005-2017 and 2018-2024 (Fig. 3c). A well displaying a monotonic deepening trend followed by a monotonic rebound was labelled as having a reversal of the
Fig. 3 | Time series and trends in groundwater depths across the North
China Plain. a Time series of average groundwater level anomalies in unconfined and average groundwater head anomalies in confined aquifers. The green and purple lines represent the average groundwater level and head anomalies in unconfined and confined aquifers, respectively. The thick blue and red lines illustrate long-term trends in unconfined and confined aquifers derived from STL decomposition, respectively. The green and purple shadows represent the
uncertainty associated with the spatial distribution of the monitoring network and the application of the Thiessen polygon method in unconfined and confined aquifers, respectively. The dashed brown lines represent the timing of reversals. b Average groundwater level anomalies in unconfined aquifers at the city scale. Same legend as in (a). c Proportion of monitoring wells exhibiting deepening ( , red), shallowing ( , light blue), reversing (dark blue), and no significant trend (orange) during 2005-2017 and 2018-2024.
deepening trend. For other wells, we assessed whether there was a significant deepening or shallowing trend ( , MK test). Our findings show that significant deepening trends were predominant during 2005-2017, whereas significant shallowing trends became prevalent during 2018-2024. Approximately and of the monitoring wells in unconfined and confined aquifers show significant deepening trends during 2005-2017, respectively. Approximately of the monitoring wells in unconfined aquifers, mainly in Beijing, experienced a reversal of the deepening trend during this period. In contrast, during 2018-2024, over half of the monitoring wells exhibited a significant shallowing trend, and about a quarter showed signs of a deepening trend reversal. These results align with the first reversal observed in Beijing in 2016 and the overall reversal at the NCP scale in 2020.
Water supply and usage in the Hai River basin
The total water supply in the HRB has remained relatively stable from 2005 to 2023, averaging annually, but the contribution of different water sources has shifted significantly (Fig. 4a, b). In 2005, groundwater accounted for about two-thirds of the total water supply, with unconfined aquifers providing , nearly three times the supplied by confined aquifers. Around 2009, groundwater extraction from confined aquifers began to decline, providing less in 2014 relative to the volume provided in 2005, with reclaimed water compensating for most of this reduction. Meanwhile, surface water supply from reservoirs increased ( ) during 2005-2023 and now constitutes over a quarter of the total water supply. Water diverted from the Yellow River remained stable at annually, representing 10% of the total water supply, except for a spike in 2019
Fig. 4 | Annual water supply and usage in the Hai River basin. a Annual water supply from various sources , including surface water from reservoirs, groundwater from unconfined and confined aquifers, water diversion from the Yellow River, water diversion from the Yangtze River (South-to-North Water
Diversion, SNWD), and reclaimed water. b Proportions of total water supply in 2005, 2014, and 2023. c Annual water use across different sectors (km³), including municipal, agricultural, industrial, and environmental water usage. d Proportions of total water use in 2005, 2014, and 2023.
and 2020. Reclaimed water use grew steadily, reaching by 2023 and accounting for of the total water supply in 2023. Reclaimed water is primarily used for river and lake replenishment, as well as for sanitation, landscape irrigation, and industry. Despite initiatives promoting desalination, the use of desalinated seawater in the HRB has remained minimal, with an annual capacity of in 2023, contributing to the total water supply.
The central route of the South-to-North Water Diversion (SNWDC), which began operations in December 2014, introduced significant diversification into the water supply structure of the HRB. The SNWD-C was designed to divert of high-quality water annually from the Danjiangkou Reservoir on the Han River, the largest tributary of the Yangtze River, to northern China. The eastern route of the SNWD (SNWD-E), which diverts water from Jiangdu near the Yangtze River, supplies a small amount of water ( year ) to the southeastern parts of the NCP, with the majority benefiting areas in Shandong Province outside the NCP. In 2023, the SNWD provided of water, accounting for of the total supply, making it the third largest source after unconfined aquifers ( ) and surface water from reservoirs ( ).
Groundwater usage in was nearly half of what it was in , with a steeper decline in confined aquifers reduction) than in unconfined aquifers ( reduction) from 2005 to 2023. By 2023, pumping from confined aquifers decreased to , accounting for only of the total water supply. This greater reduction in confined aquifer use is largely attributed to its greater substitution
by water from the SNWD project. Historically, confined aquifers, valued for their high water quality, have been a primary source for municipal use, particularly because unconfined aquifers are more vulnerable to contamination. With the introduction of water from the SNWD project, groundwater from confined aquifers that had been used for municipal supplies has increasingly been replaced, thereby reducing groundwater pumping. However, the SNWD supply is affected by drought conditions in its source areas. For example, drought conditions upstream of the Danjiangkou Reservoir led to the SNWD supply being decreased by from 2022 to 2023 (from to ).
Despite generally stable total water use, a shift towards increased allocation to environmental flows has led to a reduction in total municipal, agricultural, and industrial use, from in 2005 to in 2023 (Fig. 4c, d). Agricultural water use, which accounted for of the total in 2005, has steadily declined to by 2023. In addition to a decrease in cropland area (Supplementary Fig. 2), this reduction is attributed to policies aimed at mitigating water shortages and curbing groundwater extraction, including adjustments to cultivation practices, dryland farming, seasonal fallow, and use of plastic mulch to conserve soil moisture . Municipal water use increased by during 2005-2023, driven by population growth, while industrial water use decreased by a similar percentage due to conservation efforts . Environmental water use, which includes watering trees and grasslands as well as replenishing lakes and rivers , has been over since 2021, becoming the second-largest water use
Fig. 5 | Groundwater depth response in unconfined aquifers to precipitation variability. a Annual precipitation in the Hai River basin (HRB, white bars) and average groundwater depth anomalies in unconfined aquifers across the North China Plain (NCP). Background shading denotes dry (orange), normal (gray), and wet (blue) years. The red line shows the long-term trend in average groundwater depth anomalies, derived via STL decomposition. b Scatter plot relating 12-month average precipitation (Pr) in the HRB to the corresponding change in the STL trend
component of groundwater depth anomalies in the NCP. Both axes use logarithmic scales. Point colors indicate months, and labels such as “2014Q2” denote the year and calendar quarter. The red arrow indicates the leftward shifts observed during droughts. The dashed gray line indicates a stable trend. c Same as (a), but for Beijing: annual precipitation and groundwater depth anomalies in unconfined aquifers. d Same as (b), but for Beijing: precipitation-groundwater trend relationships based on STL decomposition.
sector ( of the total) after agriculture. Reclaimed water, along with water diverted from the Yellow and Yangtze rivers and surface water from reservoirs , plays a crucial role in supporting these environmental flows .
Water diversion and aquifer restoration policies drive groundwater recovery
The observed groundwater recovery in the NCP is primarily attributable to sustained human intervention, with wet years (e.g., 2021) providing additional but temporary reinforcement (Fig. 5). A pivotal measure was the substitution of groundwater pumping with water from SNWD-C. Initially, in 2015, Beijing received the bulk of diverted water ( out of delivered to the NCP), which led to an early recovery of groundwater levels beginning in 2016. This recovery remained resilient even during droughts in 2019 and 2022 (Fig. 5c). After 2020, SNWD-C deliveries expanded to other parts of the NCP, reaching over per year and supporting a broader reversal of regional groundwater declines (Fig. 5a).
The coupling between precipitation and groundwater depth anomalies further highlights the impact of these interventions (Fig. 5b, d). A systematic leftward shift in precipitation-groundwater scatter plots indicates increasingly shallow groundwater conditions, even under similar rainfall conditions. These shifts are particularly pronounced during drought years (the red arrow in Fig. 5b), suggesting that the interventions have altered the groundwater balance and strengthened the system’s resilience. A similar pattern is observed in Beijing (Fig. 5d), where 2024 groundwater depths significantly improved compared to 2005. Although the extreme rainfall in 2021 temporarily accelerated groundwater recovery, its effect was short-lived, as soil moisture returned to baseline levels by early 2022 (Supplementary Fig. 3). In contrast, the continued groundwater rises
in Beijing (2016-2020) and the ongoing NCP-wide recovery since 2022 underscore the effectiveness and durability of policy-led groundwater restoration efforts.
MAR and reduced irrigation-related pumping are critical strategies for restoring depleted aquifers (Fig. 6a-c). For years, rivers in the NCP had dried up due to upstream reservoir interception and declining groundwater levels. Experimental river replenishment began in 2018 in the Fuyang, Hutuo, and Juma rivers. Since then, over of water from the SNWD project has been allocated to restore rivers across the NCP by 2024. Additional contributions came from Yellow River diversions and local reservoirs, benefiting rivers (e.g., the Yongding River) and lakes (e.g., the Baiyangdian Lake). These efforts have rejuvenated drying rivers, restored riparian ecosystems, and enhanced aquifer recharge. Wells near replenished rivers exhibited more rapid groundwater recovery rates (Fig. 6b), confirming the effectiveness of river-based MAR. Other MAR methods, including flood-restoring recharge ponds and injection wells targeting confined aquifers, were employed but at smaller scales. In parallel, changes in irrigation practices also contributed to partial recovery. The NCP’s dominant double cropping system (winter wheat and summer maize rotation) requires intensive spring irrigation, historically sustained by groundwater pumping. Between 2013 and 2018, the area under double cropping declined by . In rural areas between Beijing and Langfang, where the reduction was the greatest , groundwater recovery began as early as 2013-2014 (Fig. 6c). Since 2018, further decline in double-cropped area has slowed, as diverted water has allowed local surface water to be redirected for irrigation . In contrast, the southeastern NCP retained stable cropping patterns due to reliance on Yellow River diversions. Despite the cropping adjustments, regional food production in Beijing, Tianjin, and Hebei rose from million tons in 2005 to ~42 million tons in 2023 (Supplementary
Fig. 6 | Engineering and policy approaches for reversing groundwater depletion. a Water diversion and river replenishment in the North China Plain (NCP). The green line represents the boundary of the NCP. Blue polygons represent lakes and reservoirs. Blue, orange, and dark red lines represent rivers, the central route of the South-to-North Water Diversion (SNWD-C), and the eastern route of the South-toNorth Water Diversion (SNWD-E), respectively. b Groundwater depth in unconfined aquifers near replenished rivers. Green, purple, gray, and red lines correspond to four monitoring wells located between the Sha and the Hutuo rivers from 2018 to 2024. c Groundwater depth in unconfined aquifers in areas where double-cropped acreage declined substantially between 2013 and 2017. Green and purple lines
represent two representative monitoring wells. d GRACE-derived total water storage anomalies (TWSA) in the NCP. The green line shows the average of the JPL and CSR mascon products; the shaded green area shows their spread. The thick blue line represents the trend (based on STL decomposition). e Annual groundwater balance in the NCP from 2005 to 2023. The axis shows net groundwater abstraction (abstraction minus recharge) based on Hai River Water Resources Bulletins . The axis represents the annual change in the trend in groundwater depth (based on STL decomposition) in unconfined aquifers, with the dashed gray line indicating a stable trend. indicates the fitted specific yield derived from the slope of the balance-depth relationship.
Fig. 4) , aided by increased yield per unit area, helping to ensure local food security.
Groundwater depth recovery observed in monitoring wells is consistent with both satellite-based and water balance estimates (Fig. 6d, e). Interannual changes in groundwater depth in unconfined aquifers show a strong linear relationship ( ) with net water balance deficits, calculated as annual groundwater abstraction minus recharge from the Hai River Water Resources Bulletins (Fig. 6e). The fitted specific yield ( ) of 0.07 generally matches reported values of in the piedmont plains and in other regions of the , supporting the reliability of the water balance approach (see Methods). Satellite observations from GRACE and GRACE-FO show a recovery in total water storage anomalies (TWSA) beginning around 2020 (Fig. 6d), yet this rebound compensates for only about half of the of total water storage depletion between 2005 and 2019. Based on a 3 m decline in groundwater level and the estimated , unconfined aquifer storage alone decreased by during this period. Confined aquifers, characterized by much smaller storage coefficients (0.0004-0.004), contributed relatively little to the total depletion, indicating that the majority of groundwater loss occurred in unconfined systems . Discrepancies between GRACE TWSA data and in-situ groundwater trends likely stem from variations in soil and surface water storage, uncertainties in specific yield and storage coefficients, or inherent limitations in GRACE resolution. A full attribution of these differences is beyond the scope of this study.
Discussion
Human intervention has successfully reversed groundwater depletion in the NCP through a combination of new water sources, reduced water demand, and enhanced water use efficiency with strict groundwater pumping regulations (Fig. 7). Key strategies included water diversion and wastewater recycling, which diversified the water supply and reduced reliance on overexploited aquifers. Excess water has been utilized for replenishing water bodies and MAR, contributing to aquifer restoration and enhancing system resilience against future droughts. To reduce agricultural water demand, several approaches were implemented, including shifting from water-intensive crops (e.g., transitioning from wheat-maize rotations to single maize crops that coincide with the summer rainy season ), expanding dryland farming, and introducing seasonal fallow periods. Additionally, water-intensive industries (e.g., steel and papermaking plants) were phased out. Engineering solutions, such as water-saving irrigation systems and pipeline leakage control, further improved water use efficiency. Effective management tools, such as water resources taxes, water use quotas (e.g., annual water use quotas for Beijing ( ), Tianjin ( ), and Hebei ( )), and water trading systems, were also introduced to optimize scarce water resources, stimulating more efficient usage . As a result, water productivity in the NCP has increased three to four times between 2005 and 2023. In 2023, economic output per unit of water use reached based on gross domestic product (GDP) and based on industrial added
Fig. 7 | Water supply and use amid human intervention in the Hai River basin. a Schematic diagram of water supply and use, with Deltas representing major water sources: surface water (SW), groundwater (GW), diverted water (Div, including the South-to-North Water Diversion and diversion from the Yellow River), and reclaimed water (Rec). Purple droplets indicate water use sectors: irrigation (Irr), municipal use (Muni), industry (Ind), and environmental use (Env). Solid lines link
water sources and water use sectors, while dashed lines represent potential ways for used water to be returned as resources. Arrows depict rising and declining trends over the past two decades. b Policy and engineering approaches applied: yellow, blue, and green indicate approaches related to new water sources, reducing water demand, and improving water use efficiency, respectively.
value, compared to just and , respectively, in 2005 (all values adjusted to 2023 constant prices) . Annual irrigation intensity decreased by more than from to 2023 . Together with stringent pumping regulations (e.g., closure of wells by 2023 according to the Ministry of Water Resources), these activities effectively curbed the potential for the Jevons Paradox, where increased efficiency could have led to higher overall water consumption . This successful recovery offers valuable insights for restoring depleted aquifers in other global hotspots facing similar challenges, including regions in Iran , Iraq , Turkey , Lebanon , Jordan , central South Africa , California’s Central Valley and the Southern and Central High Plains of the United States, and the Indo-Gangetic Plain .
Water diversion has played a pivotal, though not exclusive, role in alleviating water scarcity and restoring overexploited aquifers, particularly in densely populated semi-humid to semiarid regions with extensive irrigation. Projects such as the SNWD, Central Arizona Project , California’s water-delivery system (Central Valley Project and State Water Projects , and the water diversion from the Sea of Galilee in Israel have substituted for local aquifer pumping, contributing to groundwater storage recovery. Additionally, water diversions in eastern South Africa and the Toshka District of Egypt , though not primarily intended for aquifer restoration, have also helped reduce pumping in these rapidly developing areas vulnerable to groundwater depletion . However, even with these water diversion projects,
challenges remain. For instance, despite efforts in California’s Central Valley to mitigate water deficits , wells have run dry during recent droughts . Although vast irrigation canals increased groundwater storage through increased recharge in the early 20th century , increased irrigation from India’s river interlinking project could reduce rainfall in September in already water-stressed regions due to landatmosphere feedback and lead to increased groundwater pumping. These cases underscore the need to control water demand even when additional diverted water is available.
Policy and engineering solutions must work in tandem to tackle groundwater depletion. Measures similar to those implemented in the NCP, such as diverting water from the Colorado River, enforcing pumping regulations, limiting irrigation water use, and increasing the use of reclaimed water, have been applied in Arizona’s active management areas (AMAs), leading to successful groundwater storage recovery . The reversal of groundwater level declines in Israel’s coastal plain aquifer during the late 1960s also benefited from water diversion, wastewater reclamation, and reduction of pumping . MAR, the process of artificially recharging water into the subsurface, supports the conjunctive use of surface water and groundwater, increasing system resilience to climate extremes . MAR has contributed to reversing groundwater depletion trends in the NCP, California’s Central Valley, and Arizona’s AMAs , with further potential applications in India , Africa , and Europe . Desalination faces challenges, such as managing brine waste and higher costs compared to wastewater
recycling , limiting its application . However, wastewater recycling, as demonstrated in the NCP and Arizona’s AMAs , could significantly alleviate water scarcity with the added co-benefit of improved water quality. Our results demonstrate that rapid groundwater recovery across a vast area (NCP: ) is feasible through water diversions and policy interventions, offering a valuable example for water resource managers globally.
Methods
Groundwater level data collection
The reform of China’s groundwater monitoring system around 2018 led to a discontinuity in the availability of depth to groundwater data for the NCP, with most studies only including data before or after . Since 2005, the China Institute for Geo-Environment Monitoring published the Yearbooks of Groundwater Levels, providing the first publicly available and most comprehensive dataset of groundwater depth across China. However, before the establishment of the national groundwater monitoring project in 2018, monitoring wells were sparse, data quality was inconsistent, and only a limited number of wells provided continuous data, with observation intervals varying from daily to monthly. Since 2018, newly installed monitoring wells have automatically recorded groundwater depth at hour intervals, resulting in continuous time series data and improving the reliability of monthly averages used in this study. Monthly average groundwater depth data for 2005-2017 were digitized from the printed Yearbooks of Groundwater Levels, while data from 2018 to 2024 were obtained from the China Institute for Geo-Environment Monitoring’s online platform (https://geocloud.cgs.gov.cn).
Data preprocessing
Quality control and interpolation procedures were applied before aggregating groundwater depth data at regional scales. Three parameters were defined for preprocessing: (1) maximum allowable gap for linear interpolation (intrplGap months), (2) minimum length of time series required (minLen months), and (3) moving window size for outlier detection (windowOL months). First, linear interpolation was applied to internal data gaps not exceeding intrplGap. Second, wells with fewer than minLen months of valid observations were excluded from the analysis. Third, a moving average filter with a window length of windowOL months was used to identify and mask outliers, defined as values deviating by more than three standard deviations from the moving average. These thresholds were selected based on data characteristics and preliminary sensitivity analyses to ensure robust spatiotemporal coverage while minimizing the influence of outliers.
Analyses of depth to groundwater in the NCP
The Quaternary aquifers in the NCP are typically divided into four aquifers, with the shallowest being unconfined and the remaining three confined . In the piedmont plain, water is primarily pumped from the unconfined aquifer, whereas in other regions, it mainly comes from the confined aquifers because of the presence of saline and brackish water in the unconfined aquifer .
We aimed to develop a consistent understanding of groundwater depth dynamics across various regional scales over the past two decades, particularly under the reformed groundwater monitoring system around 2018. First, we calculated the change in groundwater depth between consecutive months and applied a weighted average to the groundwater depth changes at each available monitoring well, using the corresponding areas of Thiessen polygons as the basis for weighting:
where and represent the groundwater depth in months and at each monitoring well, is the area of the Thiessen polygon associated with the well, and is the area of the target region (each well was associated with a unique polygon). This equation means that only wells with valid groundwater depth measurements in both months and were included in the spatial averaging. Second, we summed the changes to obtain the cumulative change:
Groundwater depth anomalies were then calculated as anomalies of the cumulative change ( ). Finally, we employed the Seasonal and Trend decomposition using Loess (STL) to decompose the average depth series into trend, seasonal, and remainder components. The Theil-Sen slope was used to assess the trends in the STL components because it is robust against outliers and effective for analyzing trends in groundwater depth .
Our results show that the selection of preprocessing parameters minimally impacted the main findings (Supplementary Fig. 5a, b). To assess the uncertainty introduced, we tested a range of values: intrplGap from 1 to 5 , and minLen and windowOL of , and 60 , ensuring that windowOL did not exceed minLen. Although aggregating monthly changes in groundwater depth introduced some uncertainty, the influence of preprocessing selections remained limited, as indicated by the shaded areas in Supplementary Fig. 5a, b. The number of monitoring wells available increased significantly after 2018 (Supplementary Fig. 5c). For unconfined aquifers, well coverage rose from ~400 to ~500 in 2010 to to in 2018. For confined aquifers, the number increased from wells before 2018 to after 2018. We analyzed changes in groundwater depth rather than absolute levels, which reduced the sensitivity of regional trends to data gaps or inconsistencies in well continuity. Groundwater heads in different confined aquifer layers followed two general patterns (Supplementary Fig. 5d). First, deeper layers typically had greater depths to groundwater. Second, due to intensive pumping and vertical leakage through aquitards, groundwater heads across layers were often similar. We did not analyze the dynamics of groundwater heads across different confined layers at the regional scale, primarily due to the limited number of monitoring wells in the second and third confined layers, particularly before 2018.
We assessed the uncertainty associated with the spatial distribution of the monitoring network and the application of the Thiessen polygon method using Monte Carlo simulations. In each of the 10,000 simulations, of available monitoring wells were randomly selected to calculate the monthly average groundwater depth. This approach accounts for the month-to-month fluctuation in well availability.
From the simulation results , we computed the confidence interval (CI) and standard deviation ( ) as follows:
where and represent the 5th and 95th percentiles of the simulation ensemble.
Trend significance was evaluated using the Mann-Kendall test at a significance level of (two-tailed) . For individual wells (Fig. 2b-l), trends were estimated using the Theil-Sen slope applied to raw time series data to accommodate data discontinuities. At the city scale (Fig. 3b), we selected four cities, Beijing, Baoding, Hengshui, and Tangshan based on data availability sufficient to generate continuous time series before and after 2018. For trend classification at the well level (Fig. 3c), we considered only wells with complete data for both
the 2005-2017 and 2018-2024 periods. A “reversal” of the groundwater deepening trend was identified only when a monotonic decline was followed by a monotonic rebound. Wells with non-monotonic recovery patterns were categorized as “shallowing”.
Statistic data of water resources
We compiled data on precipitation, renewable groundwater resources, water productivity, and water supply and use from the Hai River Water Resources Bulletins (http://www.hwcc.gov.cn/wwgj/xxgb/szygb/) and the China Water Resources Bulletins (http://mwr.gov.cn/sj/tjgb/szygb/). The data include detailed breakdowns of water sources, except for certain years where some information was missing. For example, the breakdown of diverted water in 2016 and 2017 was interpolated based on data from adjacent years, considering the relatively stable water diversion from the Yellow River. Regional data were collected from the Water Resources Bulletins of Beijing (https://swj.beijing.gov.cn/zwgk/ szygb/index.html), Tianjin (https://swj.tj.gov.cn/zwgk_17147/xzfxxgk/ fdzdgknr1/tjxx/), Hebei (http://slt.hebei.gov.cn/a/zfxxgk/), and Shandong (http://wr.shandong.gov.cn/zwgk_319/fdzdgknr/tjsj/szygb/). Economic output values of water use were adjusted to 2023 constant prices using GDP deflator data from the World Bank (https://data.worldbank. org/indicator) and Producer Price Index (PPI) data from the National Bureau of Statistics of China (https://www.stats.gov.cn/sj/). Additionally, desalination capacity data were obtained from the National Seawater Use Bulletin (https://www.mnr.gov.cn/sj/sjfw/).
Relationship between precipitation and changes in groundwater depth
We analyzed the relationship between precipitation and changes in groundwater depth to assess the impact of human intervention on groundwater recovery. To present precipitation (vertical axes of Fig. 5b, d), we used the 12-month moving average, as its influence on aquifer recharge can be long-lasting:
where is the 12-month moving average precipitation for month , and is the precipitation in month .
To represent changes in groundwater depth (horizontal axes in Fig. 5b, d), we used the month-to-month difference in the trend component of aggregated groundwater depth anomalies:
where is the change in the STL trend component of groundwater depth anomalies for month , and is the STL trend component itself for month .
Estimation of average specific yield
The average specific yield in the NCP was estimated with a water balance method that uses the relationship between changes in groundwater depth within unconfined aquifers and groundwater abstraction minus recharge. The following equation was applied:
where is the annual groundwater depth change in unconfined aquifers, is the fitted specific yield, is the area of the NCP, and is a constant.
Other evidence of groundwater recovery
In addition to the recovery in groundwater depth, land subsidence in the NCP has also stabilized or begun to recover. Land subsidence in the
NCP has worsened since the , but there have been instances of stabilization and recovery in Beijing , Tianjin , and Cangzhou . Springs have re-emerged in Mentougou in Beijing (https://www. beijing.gov.cn/renwen/jrbj/202304/t20230419_3059190.html), and in Bai Springs in Xingtai (http://slt.hebei.gov.cn/a/2022/07/22/ 7BACE2B982F842A387544296E12E9A0F.html). The thickening of the unsaturated zone due to depletion has likely significantly reduced recharge , so a recovery in groundwater levels could potentially lead to increased recharge.
Limitations
Despite using the best available in situ groundwater depth data for the NCP, several limitations remain. First, continuous observations were available for only a limited number of wells, particularly prior to 2018. Data before 2017 were often irregular, with varying measurement frequencies and sparse spatial coverage, particularly in the southeastern NCP. These limitations in groundwater monitoring introduce uncertainty when applying spatial interpolation using the Thiessen polygon method. In areas with sparse data, wells receive disproportionately high weights, which may affect the representativeness and reliability of regional estimates. Second, more rapid recovery observed in urban areas compared to rural regions, largely driven by the replacement of municipal groundwater pumping with water from the SNWD project, could introduce bias when well distribution is uneven. To minimize uncertainty from spatial aggregation, we adopted the non-parametric Thiessen polygon method. While this approach incorporates spatial weighting, it remains sensitive to uneven well distribution. Third, due to the absence of detailed hydrogeological parameters, we were unable to estimate changes in groundwater storage at fine spatial resolutions. This is particularly relevant for confined aquifers, where recovery may be delayed due to long-term compaction effects and limited vertical recharge. Finally, this study focused solely on the NCP due to the intensive effort required to collect and digitize data from printed hydrogeological yearbooks. Expanding this analysis to other regions would require a similar investment in data acquisition and quality control. Nonetheless, our uncertainty analysis (Fig. 3a, b) suggests that these limitations do not compromise the core finding of rapid and regionally significant groundwater recovery in the NCP.
Data processing and analysis were conducted using MATLAB. The related code can be found on Zenodo (https://doi.org/10.5281/zenodo. .
References
Scanlon, B. R. et al. Global water resources and the role of groundwater in a resilient water future. Nat. Rev. Earth Environ. 4, 87-101 (2023).
Döll, P. et al. Global-scale assessment of groundwater depletion and related groundwater abstractions: Combining hydrological modeling with information from well observations and GRACE satellites. Water Resour. Res. 50, 5698-5720 (2014).
Gleeson, T., Wada, Y., Bierkens, M. F. P. & van Beek, L. P. H. Water balance of global aquifers revealed by groundwater footprint. Nature 488, 197-200 (2012).
Wada, Y. et al. Global depletion of groundwater resources. Geophys. Res. Lett. 37, L20402 (2010).
Jasechko, S. et al. Rapid groundwater decline and some cases of recovery in aquifers globally. Nature 625, 715-721 (2024).
Ao, Z. et al. A national-scale assessment of land subsidence in China’s major cities. Science 384, 301-306 (2024).
Herrera-García, G. et al. Mapping the global threat of land subsidence. Science 371, 34-36 (2021).
de Graaf, I. E. M., Gleeson, T., van Beek, L. P. H., Sutanudjaja, E. H. & Bierkens, M. F. P. Environmental flow limits to global groundwater pumping. Nature 574, 90-94 (2019).
Condon, L. E. & Maxwell, R. M. Simulating the sensitivity of evapotranspiration and streamflow to large-scale groundwater depletion. Sci. Adv. 5, eaav4574 (2019).
Werner, A. D. et al. Seawater intrusion processes, investigation and management: Recent advances and future challenges. Adv. Water Resour. 51, 3-26 (2013).
Deines, J. M. et al. Transitions from irrigated to dryland agriculture in the Ogallala Aquifer: Land use suitability and regional economic impacts. Agric. Water Manag. 233, 106061 (2020).
Tillman, F. D. & Flynn, M. E. Arizona Groundwater Explorer: interactive maps for evaluating the historical and current groundwater conditions in wells in Arizona, USA. Hydrogeol. J. 32, 645-661 (2024).
Buapeng, S. & Foster, S. Controlling groundwater abstraction and related environmental degradation in metropolitan Bangkok Thailand. Report number: GW-MATe Case Profile Collection 20Affiliation: World Bank (Washington DC) www.worldbank.org/ gwmat (2008).
Karimi, H. & Alimoradi, S. Impacts of water transfer from Karkheh Dam on rising of groundwater in Dasht-e-Abass Plain, Ilam Province. Res. Earth Sci. 8, 33-44 (2017).
Alam, S., Gebremichael, M., Li, R., Dozier, J. & Lettenmaier, D. P. Can managed aquifer recharge mitigate the groundwater overdraft in California’s central valley?. Water Resour. Res. 56, e2020WRO27244 (2020).
Ulibarri, N., Escobedo Garcia, N., Nelson, R. L., Cravens, A. E. & McCarty, R. J. Assessing the feasibility of managed aquifer recharge in California. Water Resour. Res. 57, e2020WR029292 (2021).
Long, D. et al. South-to-north water diversion stabilizing Beijing’s groundwater levels. Nat. Commun. 11, 3665 (2020).
Scanlon, B. R., Reedy, R. C., Faunt, C. C., Pool, D. & Uhlman, K. Enhancing drought resilience with conjunctive use and managed aquifer recharge in California and Arizona. Environ. Res. Lett. 11, 035013 (2016).
Tang, W. et al. Land subsidence and rebound in the Taiyuan basin, northern China, in the context of inter-basin water transfer and groundwater management. Remote Sens. Environ. 269, 112792 (2022).
Martínez-Santos, P., Castaño-Castaño, S. & Hernández-Espriú, A. Revisiting groundwater overdraft based on the experience of the Mancha Occidental Aquifer, Spain. Hydrogeol. J. 26, 1083-1097 (2018).
Monir, M. M. & Sarker, S. C. Analyzing post-2000 groundwater level and rainfall changes in Rajasthan, India, using well observations and GRACE data. Heliyon 10, e24481 (2024).
Zheng, C. et al. Can China cope with its water crisis?-Perspectives from the North China Plain. Groundwater 48, 350-354 (2010).
Liu, J., Zheng, C., Zheng, L. & Lei, Y. Ground water sustainability: methodology and application to the North China plain. Groundwater 46, 897-909 (2008).
Yang, H. et al. Evolution of groundwater level in the North China Plain in the past 40 years and suggestions on its overexploitation treatment. Geol. China 48, 1142-1155 (2021).
Cao, G., Zheng, C., Scanlon, B. R., Liu, J. & Li, W. Use of flow modeling to assess sustainability of groundwater resources in the North China Plain. Water Resour. Res. 49, 159-175 (2013).
Yang, W. et al. Human intervention will stabilize groundwater storage across the north China plain. Water Resour. Res. 58, e2021WRO30884(2022).
Zhang, C. et al. Sub-regional groundwater storage recovery in North China Plain after the South-to-North water diversion project. J. Hydrol. 597, 126156 (2021).
Zhang, C. et al. The Effectiveness of the South-to-North water diversion middle route project on water delivery and groundwater recovery in north china plain. Water Resour. Res. 56, e2019WRO26759 (2020).
Li, X., Ye, S.-Y., Wei, A.-H., Zhou, P.-P. & Wang, L.-H. Modelling the response of shallow groundwater levels to combined climate and water-diversion scenarios in Beijing-Tianjin-Hebei Plain, China. Hydrogeol. J. 25, 1733-1744 (2017).
Dong, L. et al. Shifting agricultural land use and its unintended water consumption in the North China Plain. Sci. Bull. 69, 3968-3977 (2024).
Chen, Y., Yin, G. & Liu, K. Regional differences in the industrial water use efficiency of China: the spatial spillover effect and relevant factors. Resour. Conserv. Recycl. 167, 105239 (2021).
Chen, F., Ding, Y., Tang, S., Ding, L. & Yang, Y. Practice and effect analysis of river-lake ecological water supplement and groundwater recharge in the North China region. China Water Resour. 7, 36-39 (2021).
National Bureau of Statistics. China rural statistical yearbook (2005-2024).
Butler, J. J. Jr, Whittemore, D. O., Wilson, B. B. & Bohling, G. C. A new approach for assessing the future of aquifers supporting irrigated agriculture. Geophys. Res. Lett. 43, 2004-2010 (2016).
Zheng, H., Liu, Y. & Zhao, J. Understanding water rights and water trading systems in China: a systematic framework. Water Secur. 13, 100094 (2021).
Hai River basin Water Authority. Hai River Water Resources Bulletin (2005-2023).
Pérez-Blanco, C. D., Loch, A., Ward, F., Perry, C. & Adamson, D. Agricultural water saving through technologies: a zombie idea. Environ. Res. Lett. 16, 114032 (2021).
Noori, R. et al. Anthropogenic depletion of Iran’s aquifers. Proc. Natl. Acad. Sci. 118, e2024221118 (2021).
Alattar, M. H. Mapping groundwater dynamics in Iraq: integrating multi-data sources for comprehensive analysis. Model. Earth Syst. Environ. 10, 4375-4385 (2024).
Caló, F. et al. DInSAR-based detection of land subsidence and correlation with groundwater depletion in Konya Plain, Turkey. Remote Sens. 9, 83 (2017).
Massoud, E. C., Liu, Z., Shaban, A. & Hage, M. E. Groundwater depletion signals in the Beqaa Plain, Lebanon: evidence from GRACE and Sentinel-1 data. Remote Sens. 13, 915(2021).
Brückner, F. et al. Causes and consequences of long-term groundwater overabstraction in Jordan. Hydrogeol. J. 29, 2789-2802 (2021).
van Rooyen, J. D., Watson, A. P. & Miller, J. A. Combining quantity and quality controls to determine groundwater vulnerability to depletion and deterioration throughout South Africa. Environ. Earth Sci. 79, 255 (2020).
Jasechko, S. & Perrone, D. California’s central valley groundwater wells run dry during recent drought. Earth’s. Future 8, e2019EF001339 (2020).
Scanlon, B. R. et al. Groundwater depletion and sustainability of irrigation in the US high plains and central valley. Proc. Natl. Acad. Sci. 109, 9320-9325 (2012).
Butler, J. J. Jr, Whittemore, D. O., Wilson, B. B. & Bohling, G. C. Sustainability of aquifers supporting irrigated agriculture: a case study of the High Plains aquifer in Kansas. Water Int. 43, 815-828 (2018).
MacDonald, A. M. et al. Groundwater quality and depletion in the Indo-Gangetic Basin mapped from in situ observations. Nat. Geosci. 9, 762-766 (2016).
Faunt, C. C. et al. Groundwater sustainability and land subsidence in California’s central valley. Water 16, 1189 (2024).
Furman, A. & Abbo, H. In Water Policy in Israel: Context, Issues and Options (ed Nir Becker) 125-136 (Springer Netherlands, 2013).
Shumilova, O., Tockner, K., Thieme, M., Koska, A. & Zarfl, C. Global water transfer megaprojects: a potential solution for the water-food-energy nexus? Front. Environ. Sci. 6, https://doi.org/10.3389/ fenvs.2018.00150 (2018).
MacAllister, D. J., Krishan, G., Basharat, M., Cuba, D. & MacDonald, A. M. A century of groundwater accumulation in Pakistan and northwest India. Nat. Geosci. 15, 390-396 (2022).
Chauhan, T., Devanand, A., Roxy, M. K., Ashok, K. & Ghosh, S. River interlinking alters land-atmosphere feedback and changes the Indian summer monsoon. Nat. Commun. 14, 5928 (2023).
Tillman, F. D. & Leake, S. A. Trends in groundwater levels in wells in the active management areas of Arizona, USA. Hydrogeol. J. 18, 1515-1524 (2010).
Jacobs, K. L. & Holway, J. M. Managing for sustainability in an arid climate: lessons learned from 20 years of groundwater management in Arizona, USA. Hydrogeol. J. 12, 52-65 (2004).
Ganguly, S. & Ganguly, S. Implementation of managed aquifer recharge techniques in India. Curr. Sci. 121, 641-650 (2021).
Ebrahim, G. Y., Lautze, J. F. & Villholth, K. G. Managed aquifer recharge in africa: taking stock and looking forward. Water 12, 1844 (2020).
Standen, K., Costa, L. R. D. & Monteiro, J.-P. In-channel managed aquifer recharge: a review of current development worldwide and future potential in Europe. Water 12, 11 (2020).
Jones, E., Qadir, M., van Vliet, M. T. H., Smakhtin, V. & Kang, S. -m The state of desalination and brine production: a global outlook. Sci. Total Environ. 657, 1343-1356 (2019).
Smith, K., Liu, S., Hu, H.-Y., Dong, X. & Wen, X. Water and energy recovery: the future of wastewater in China. Sci. Total Environ. 637638, 1466-1470 (2018).
Nan, T. et al. Evaluation of shallow groundwater dynamics after water supplement in North China Plain based on attention-GRU model. J. Hydrol. 625, 130085 (2023).
Bai, L. et al. Quantifying the influence of long-term overexploitation on deep groundwater resources across Cangzhou in the North China Plain using InSAR measurements. J. Hydrol. 605, 127368 (2022).
Sen, P. K. Estimates of the regression coefficient based on Kendall’s Tau. J. Am. Stat. Assoc. 63, 1379-1389 (1968).
Theil, H. In Henri Theil’s Contributions to Economics and Econometrics: Econometric Theory and Methodology (eds. Baldev Raj & Johan Koerts) 345-381(Springer Netherlands, 1992).
Mann, H. B. Nonparametric tests against trend. Econometrica 13, 245-259 (1945).
Su, G. et al. Spatiotemporal evolution characteristics of land subsidence caused by groundwater depletion in the North China plain during the past six decades. J. Hydrol. 600, 126678 (2021).
Yu, X., Wang, G., Hu, X., Liu, Y. & Bao, Y. Land Subsidence in Tianjin, China: Before and after the South-to-North Water Diversion. Remote Sensing 15, 1647 (2023).
Guo, H. et al. Land subsidence and its affecting factors in Cangzhou, North China Plain. Front. Environ. Sci. 10 (2022).
Cao, G., Scanlon, B. R., Han, D. & Zheng, C. Impacts of thickening unsaturated zone on groundwater recharge in the North China plain. J. Hydrol. 537, 260-270 (2016).
Xu, Y., Long, D. & Cui, Y. Unprecedented large-scale aquifer recovery through human intervention. https://doi.org/10.5281/ zenodo. 15797080 (2025).
Acknowledgements
This study was supported by the National Key Research and Development Program of China (Grant No. 2021 YFB3900604 to D.L. and Y.C.), the National Natural Science Foundation of China (Grant Nos. 52325901 to D.L. and 52079065 to D.L.), and the World Bank China Water PASA program to D.L.
Author contributions
D.L., Y.X., and Y.J.C. developed the concept and methodology of this study. D.L., Y.X., and Y.J.C. performed the data processing and analysis with support from all other authors. D.L., Y.X., Y.J.C., Y.H.C., J.J.B., L.D., L.W., D.Y.L., Y.W., L.H., G.B., B.L., S.W., X.N., Y.C., C.C., Y.M., Y.Q., J.W., H.W., and B.R.S. discussed the results and improved the writing of this manuscript.
Correspondence and requests for materials should be addressed to Di Long.
Peer review information Nature Communications thanks Juan Antonio Torres-Martinez, lan Holman and the other anonymous reviewer(s) for their contribution to the peer review of this work. A peer review file is available.
Publisher’s note Springer Nature remains neutral with regard to jurisdictional claims in published maps and institutional affiliations.
Open Access This article is licensed under a Creative Commons Attribution-NonCommercial-NoDerivatives 4.0 International License, which permits any non-commercial use, sharing, distribution and reproduction in any medium or format, as long as you give appropriate credit to the original author(s) and the source, provide a link to the Creative Commons licence, and indicate if you modified the licensed material. You do not have permission under this licence to share adapted material derived from this article or parts of it. The images or other third party material in this article are included in the article’s Creative Commons licence, unless indicated otherwise in a credit line to the material. If material is not included in the article’s Creative Commons licence and your intended use is not permitted by statutory regulation or exceeds the permitted use, you will need to obtain permission directly from the copyright holder. To view a copy of this licence, visit http:// creativecommons.org/licenses/by-nc-nd/4.0/.
(c) The Author(s) 2025
State Key Laboratory of Hydroscience and Engineering, Department of Hydraulic Engineering, Tsinghua University, Beijing, China. Key Laboratory of Hydrosphere Sciences of the Ministry of Water Resources, Tsinghua University, Beijing, China. Kansas Geological Survey, University of Kansas, Lawrence, KS, USA. China Institute of Geo-Environment Monitoring, Beijing, China. Biological and Environmental Science and Engineering Division, King Abdullah University of Science and Technology, Thwal, Saudi Arabia. College of Water Sciences, Beijing Normal University, Beijing, China. Beijing Hydrology Center, Beijing, China. Beijing Water Science and Technology Institute, Beijing, China. Beijing Institute of Geological Environment Monitoring, Beijing, China. College of Civil Engineering and Architecture, Guangxi University, Nanning, China. Information Center, Ministry of Water Resources, Beijing, China. China South-to-North Water Diversion Corporation Limited, Beijing, China. State Key Laboratory of Water Cycle and Water Security, China Institute of Water Resources and Hydropower Research, Beijing, China. Bureau of Economic Geology, Jackson School of Geosciences, University of Texas at Austin, Austin, TX, USA. These authors contributed equally: Di Long, Yuancheng Xu, Yingjie Cui. e-mail: dlong@tsinghua.edu.cn