استكشاف إمكانيات الانبعاثات السلبية للفحم الحيوي لتحقيق هدف الحياد الكربوني في الصين Exploring negative emission potential of biochar to achieve carbon neutrality goal in China

المجلة: Nature Communications، المجلد: 15، العدد: 1
DOI: https://doi.org/10.1038/s41467-024-45314-y
PMID: https://pubmed.ncbi.nlm.nih.gov/38316787
تاريخ النشر: 2024-02-05

استكشاف إمكانيات الانبعاثات السلبية للفحم الحيوي لتحقيق هدف الحياد الكربوني في الصين

تاريخ الاستلام: 11 نوفمبر 2022
تاريخ القبول: 19 يناير 2024
تاريخ النشر على الإنترنت: 05 فبراير 2024
(أ) تحقق من التحديثات

شو دينغ © , فيي تنغ ( , مينبينغ تشين © , تشانغليو دو , بين وانغ , رينكيانغ لي & بان وانغ

الملخص

تقييد الاحترار العالمي ضمن قد يتطلب نشر تقنيات الانبعاثات السلبية المبكرة على نطاق واسع مع آثار سلبية محتملة على أهداف التنمية المستدامة الرئيسية. تم اقتراح البيوتشار كتقنية مثبتة لاحتجاز الكربون مع فوائد مشتركة من حيث جودة التربة وإنتاج المحاصيل. ومع ذلك، فإن الشكوك الكبيرة الموجودة في الإمكانيات والتكاليف واستراتيجيات النشر لأنظمة البيوتشار على المستوى الوطني تمنع نشرها في الصين. هنا، نقوم بإجراء تحليل مكاني محدد للتحقيق في إمكانيات الانبعاثات السلبية والاقتصاديات ومواقع النشر ذات الأولوية للبيوتشار المستمد من مصادر متعددة في الصين. تظهر النتائج أن البيوتشار لديه إمكانيات انبعاث سلبية تصل إلى 0.92 مليار طن من سنويًا بتكلفة صافية متوسطة تبلغ دولار أمريكي لكل طن من بطريقة مستدامة، مما قد يلبي الطلبات على الانبعاثات السلبية في معظم سيناريوهات التخفيف المتوافقة مع هدف الصين للحياد الكربوني بحلول عام 2060.

الضغط البشري تسبب في احترار قدره خلال الفترة 2010-2019 مقارنة بالفترة ما قبل الصناعية ، مما يكشف عن حجم التحدي المتزايد في تحقيق أهداف المناخ الدافئ 1.5 أو المحددة في اتفاقية باريس . لتحقيق الأهداف المناخية المذكورة، تعتمد استراتيجيات التخفيف بشكل متزايد على تقنيات الانبعاثات السلبية (NETs) التي يمكن أن تزيل من الغلاف الجوي . على سبيل المثال، لكي تصل الصين إلى الحياد الكربوني، من المتوقع أن توفر تقنيات NETs انبعاثات سلبية تتراوح بين 0.01-2.91 مليار طن من سنويًا ( ) بين عامي 2050 و2060، وفقًا لسيناريوهات التخفيف المناخي المستندة إلى نماذج التقييم المتكاملة الرائدة (IAMs) . بالإضافة إلى خزانات الكربون من إعادة التحريج والتشجير، تشير هذه السيناريوهات إلى أن مثل هذه الطلبات العالية على NET تعتمد في الغالب على الطاقة الحيوية مع احتجاز الكربون وتخزينه (BECCS) أو احتجاز الكربون من الهواء المباشر وتخزينه (DACCS) . ومع ذلك، فإن كل من BECCS وDACCS تواجه عقبات مالية وتكنولوجية يجب التغلب عليها قبل أن يمكن تنفيذها على نطاق واسع . على وجه التحديد، يمكن أن تتجاوز تكاليف NET
(التكلفة المستوية لكل طن من المزالة) 100 دولار أمريكي لكل طن من بالنسبة لـ BECCS و بالنسبة لـ DACCS ، بينما تحد القيود الموارد والجغرافية من نشرها بشكل أكبر . علاوة على ذلك، تتنافس BECCS مع إنتاج المحاصيل على كل من الأرض والمياه، مما قد يهدد أهداف التنمية المستدامة الأخرى مثل الأمن الغذائي . لذلك، قبل معالجة الحواجز الرئيسية التي تواجه NET المذكورة، هناك حاجة ماسة إلى حلول بديلة لتشكيل محفظة NET قابلة للتطبيق قادرة على تحقيق الأهداف المناخية بأمان واستدامة .
يمثل البيوتشار حلاً مثبتًا تقنيًا لتحقيق الانبعاثات السلبية، مع فوائد مشتركة من حيث خصوبة التربة وإنتاجية المحاصيل . للبيوتشار أصول قديمة في الأراضي الزراعية في الأمازون وقد وُجد لقرون ، على الرغم من أنه حصل على اعتراف في مجال التخفيف من تغير المناخ فقط في العقدين الماضيين . عند درجات حرارة تتراوح بين 350 و ، يحول التحلل البطيء الكتلة الحيوية إلى بيوتشير أقل قابلية للتحلل، مع
منتجات ثانوية مثل الغاز الاصطناعي . يمكن بعد ذلك إرجاع البيوتشار إلى التربة، مما يساعد على احتجاز الكربون، وتجنب انبعاث غازات الدفيئة من التربة، وتحسين جودة التربة وإنتاج المحاصيل . تعطي الصين أهمية خاصة للاستخدام العملي للبيوتشار وقد تم إجراء عدد من المشاريع التجريبية منذ أوائل . في السنوات الأخيرة، شاركت أكثر من 100 شركة في الصين في أعمال البيوتشار، مع اختيار مواقع عرض عبر المناطق الرئيسية لإنتاج المحاصيل . ومع ذلك، تم اعتبار البيوتشار إلى حد كبير كتقنية زراعية خضراء فقط يمكن أن تقلل من مدخلات الأسمدة، وتبني جودة التربة، وتزيد من إنتاج المحاصيل، وتم تجاهل دوره من حيث التخفيف المناخي إلى حد كبير.
لقد أكدت التقييمات العالمية لإمكانات البيوتشار على وظيفته الحرجة كتقنية انبعاثات سلبية . ومع ذلك، للاستفادة الكاملة من فوائده، من الضروري تقييم إمكانيات الانبعاثات السلبية والجدوى الاقتصادية للبيوتشار على المستويات الإقليمية. هناك حاجة إلى تحليل مكاني شامل يدمج أحدث المعرفة حول دور البيوتشار في الانبعاثات السلبية لتوفير رؤى قابلة للتنفيذ لنشره في السعي لتحقيق الحياد الكربوني. من ناحية، تميل التجارب الحالية إلى التركيز بشكل ضيق على خصائص أنواع البيوتشار المحددة أو تحليلها المقارن دون تقدير دقيق لإمكاناتها للانبعاثات السلبية وتأثيرها الاقتصادي. من ناحية أخرى، غالبًا ما تفشل الدراسات الإقليمية في أخذ تنوع موارد الكتلة الحيوية وخصائص البيوتشار في الاعتبار، مما يؤدي إلى أساس معيب لاستراتيجيات النشر.
في الصين، تركز التقديرات المتعلقة بالبيوتشار بشكل أساسي على بقايا الزراعة ، متجاهلة المساهمات الكبيرة من بقايا الغابات والأعشاب، فضلاً عن المحاصيل الطاقية المحتملة. تؤدي هذه السهو إلى تقدير مزمن غير كاف لإمكانات البيوتشار الإجمالية في البلاد. علاوة على ذلك، يتم عادةً تجاهل التباينات في الخصائص الفيزيائية والكيميائية للبيوتشار المستمد من موارد الكتلة الحيوية المختلفة ، مما يؤدي إلى عدم دقة في التقييمات الاقتصادية والانبعاثات. كما يتم تجاهل تباين العوامل المكانية، مثل نسيج التربة، مما يؤدي إلى تقديرات متحيزة لفوائد إنتاج المحاصيل وتقييمات اقتصادية معيبة. تتيح التقدمات الأخيرة في توفر البيانات من التجارب الميدانية ، ومنهجيات التقييم ، ودقة البيانات المكانية الآن تضمين الكتلة الحيوية والتباين المكاني في التقييمات، مما يسهل تقييمًا مفصلًا ومحدد الموقع لإمكانات الانبعاثات السلبية للبيوتشار وآثاره الاقتصادية. تستفيد دراستنا من أحدث التقدم العلمي لتقديم تحليل مكاني محدد لإمكانات البيوتشار في الصين. يعترف هذا التحليل بتنوع
أنواع الكتلة الحيوية والتوزيع المكاني، معالجًا التقدير المنخفض السائد لإمكانات البيوتشار ويوفر إطار عمل تفصيلي وقابل للتنفيذ لصانعي السياسات لتوجيه نشر البيوتشار.
في هذه الدراسة، نحقق في إمكانيات الانبعاثات السلبية للبيوتشار المنتج من مصادر متعددة ونحدد أكثر أنواع الكتلة الحيوية ومواقع النشر فعالية من حيث التكلفة في الصين. أولاً، نقيم حجم الكتلة الحيوية المتاحة لإنتاج البيوتشار، بما في ذلك بقايا الكتلة الحيوية من الزراعة والغابات والأراضي العشبية والمحاصيل الطاقية المحتملة في الأراضي الهامشية (كما هو موضح في قسم “الطرق”)، ونطور ثلاثة سيناريوهات بناءً على افتراضات مختلفة حول توفر الكتلة الحيوية. ثم، نقوم بتحديد إمكانيات الانبعاثات السلبية للبيوتشار باستخدام إطار تجريبي موحد، يأخذ في الاعتبار خصائص البيوتشار ومعلمات التحلل. ثانيًا، من خلال دمج البيانات المستندة إلى الأدبيات وبيانات المسح العملية، نقوم بإجراء تحليل للتكلفة والفائدة ونبني منحنيات العرض للانبعاثات السلبية للبيوتشار المستمد من مصادر متعددة. أخيرًا، نقوم بإجراء تحليل مكاني محدد لإمكانات الانبعاثات السلبية والاقتصاديات لتحديد أولويات نشر البيوتشار. تظهر النتائج أن البيوتشار يمكن أن يحقق إمكانيات انبعاث سلبية تصل إلى بتكلفة متوسطة تبلغ حوالي بطريقة مستدامة. يمكن أن تلبي هذه الإمكانيات للبيوتشار الطلبات على الانبعاثات السلبية في معظم سيناريوهات التخفيف المتوافقة مع هدف الصين للحياد الكربوني بحلول عام 2060. علاوة على ذلك، نكتشف أن مصادر الكتلة الحيوية والمناطق الفرعية ذات الإمكانيات العالية للانبعاثات السلبية والاقتصاديات العالية تتداخل إلى حد كبير، مما يمكن أن يوفر توجيهًا لنشر البيوتشار بشكل منهجي في الصين.

النتائج

إمكانات الانبعاثات السلبية للبيوتشار

نقوم بإنشاء ثلاثة سيناريوهات لتقدير الإمكانية المحتملة للفحم الحيوي للعمل كتقنية انبعاث سلبية بناءً على افتراضات مختلفة حول توفر الكتلة الحيوية (يرجى الرجوع إلى قسم “الطرق” والجدول 1). السيناريو الأول، الذي يُطلق عليه ‘الإمكانات النظرية القصوى’، يتضمن استغلال الأراضي الهامشية لزراعة المحاصيل الطاقية والاستخدام الكامل للكتلة الحيوية المتاحة لإنتاج الفحم الحيوي، مما يعمل كمعيار مقارنة مع دراسات أخرى تبحث في إمكانيات الكتلة الحيوية في الصين. في المقابل، يحد سيناريو ‘الإمكانات التقنية الحالية’ من الوصول إلى الكتلة الحيوية إلى المواد الخام القابلة للحصاد من خلال التقنيات والممارسات الحالية دون التنافس مع الاستخدامات الحالية مثل علف الماشية واستهلاك الطاقة الريفية. أخيرًا، يتوقع سيناريو ‘الإمكانات التقنية المستدامة’ زراعة
الجدول 1 | إمكانيات المواد الخام المتاحة من الكتلة الحيوية تحت سيناريوهات مختلفة
السيناريوهات الإمكانات النظرية القصوى الإمكانات التقنية المستدامة الإمكانات التقنية الحالية
الوصف الحد الأقصى من كمية المواد الخام المتاحة من الكتلة الحيوية الإمكانات النظرية مطروحًا منها الاستخدام لعلف الماشية، وما إلى ذلك، مع الحفاظ على البيئة المواد الخام المتاحة من الكتلة الحيوية محدودة بالتكنولوجيا والممارسات الحالية
المخلفات الزراعية
100% من 16 نوعًا من مخلفات المحاصيل 95% من مخلفات المحاصيل التي لا تُستخدم كعلف، أو مادة خام 88% من المخلفات التي لا تُستخدم كعلف، أو مادة خام
مخلفات الغابات
100% من 10 أنواع من مخلفات الغابات 80% من 10 أنواع من مخلفات الغابات 28% من 10 أنواع من مخلفات الغابات
مخلفات العشب
100% من إنتاج التبن في المراعي الطبيعية إنتاج التبن في المراعي الطبيعية غير المستخدم كعلف غير متاح تحت التكنولوجيا الحالية
محاصيل الطاقة
الحد الأقصى من الإمكانات الإنتاجية لمحاصيل الطاقة المخصصة؛
تشير الأراضي الهامشية إلى الأراضي الشجرية، والمنطقة المدية، والأراضي المنخفضة، والأراضي غير المستخدمة
إمكانات الإنتاج المحدودة لمحاصيل الطاقة المخصصة؛
تشير الأراضي الهامشية إلى الأراضي غير المستخدمة والأراضي الشجرية
غير متاح تحت التكنولوجيا الحالية
إجمالي المواد الخام من الكتلة الحيوية
الشكل 1 | المواد الخام المتاحة من الكتلة الحيوية وإمكانات الانبعاث السلبية للفحم الحيوي في الصين. أ إمكانيات المواد الخام المتاحة من الكتلة الحيوية تحت سيناريوهات مختلفة، وهي الإمكانات النظرية القصوى، والإمكانات التقنية المستدامة، والإمكانات التقنية الحالية. تشمل هذه المواد الخام المخلفات الزراعية، ومخلفات الغابات، ومخلفات العشب، والمحاصيل الطاقية المحتملة المخصصة. الانبعاث السلبي
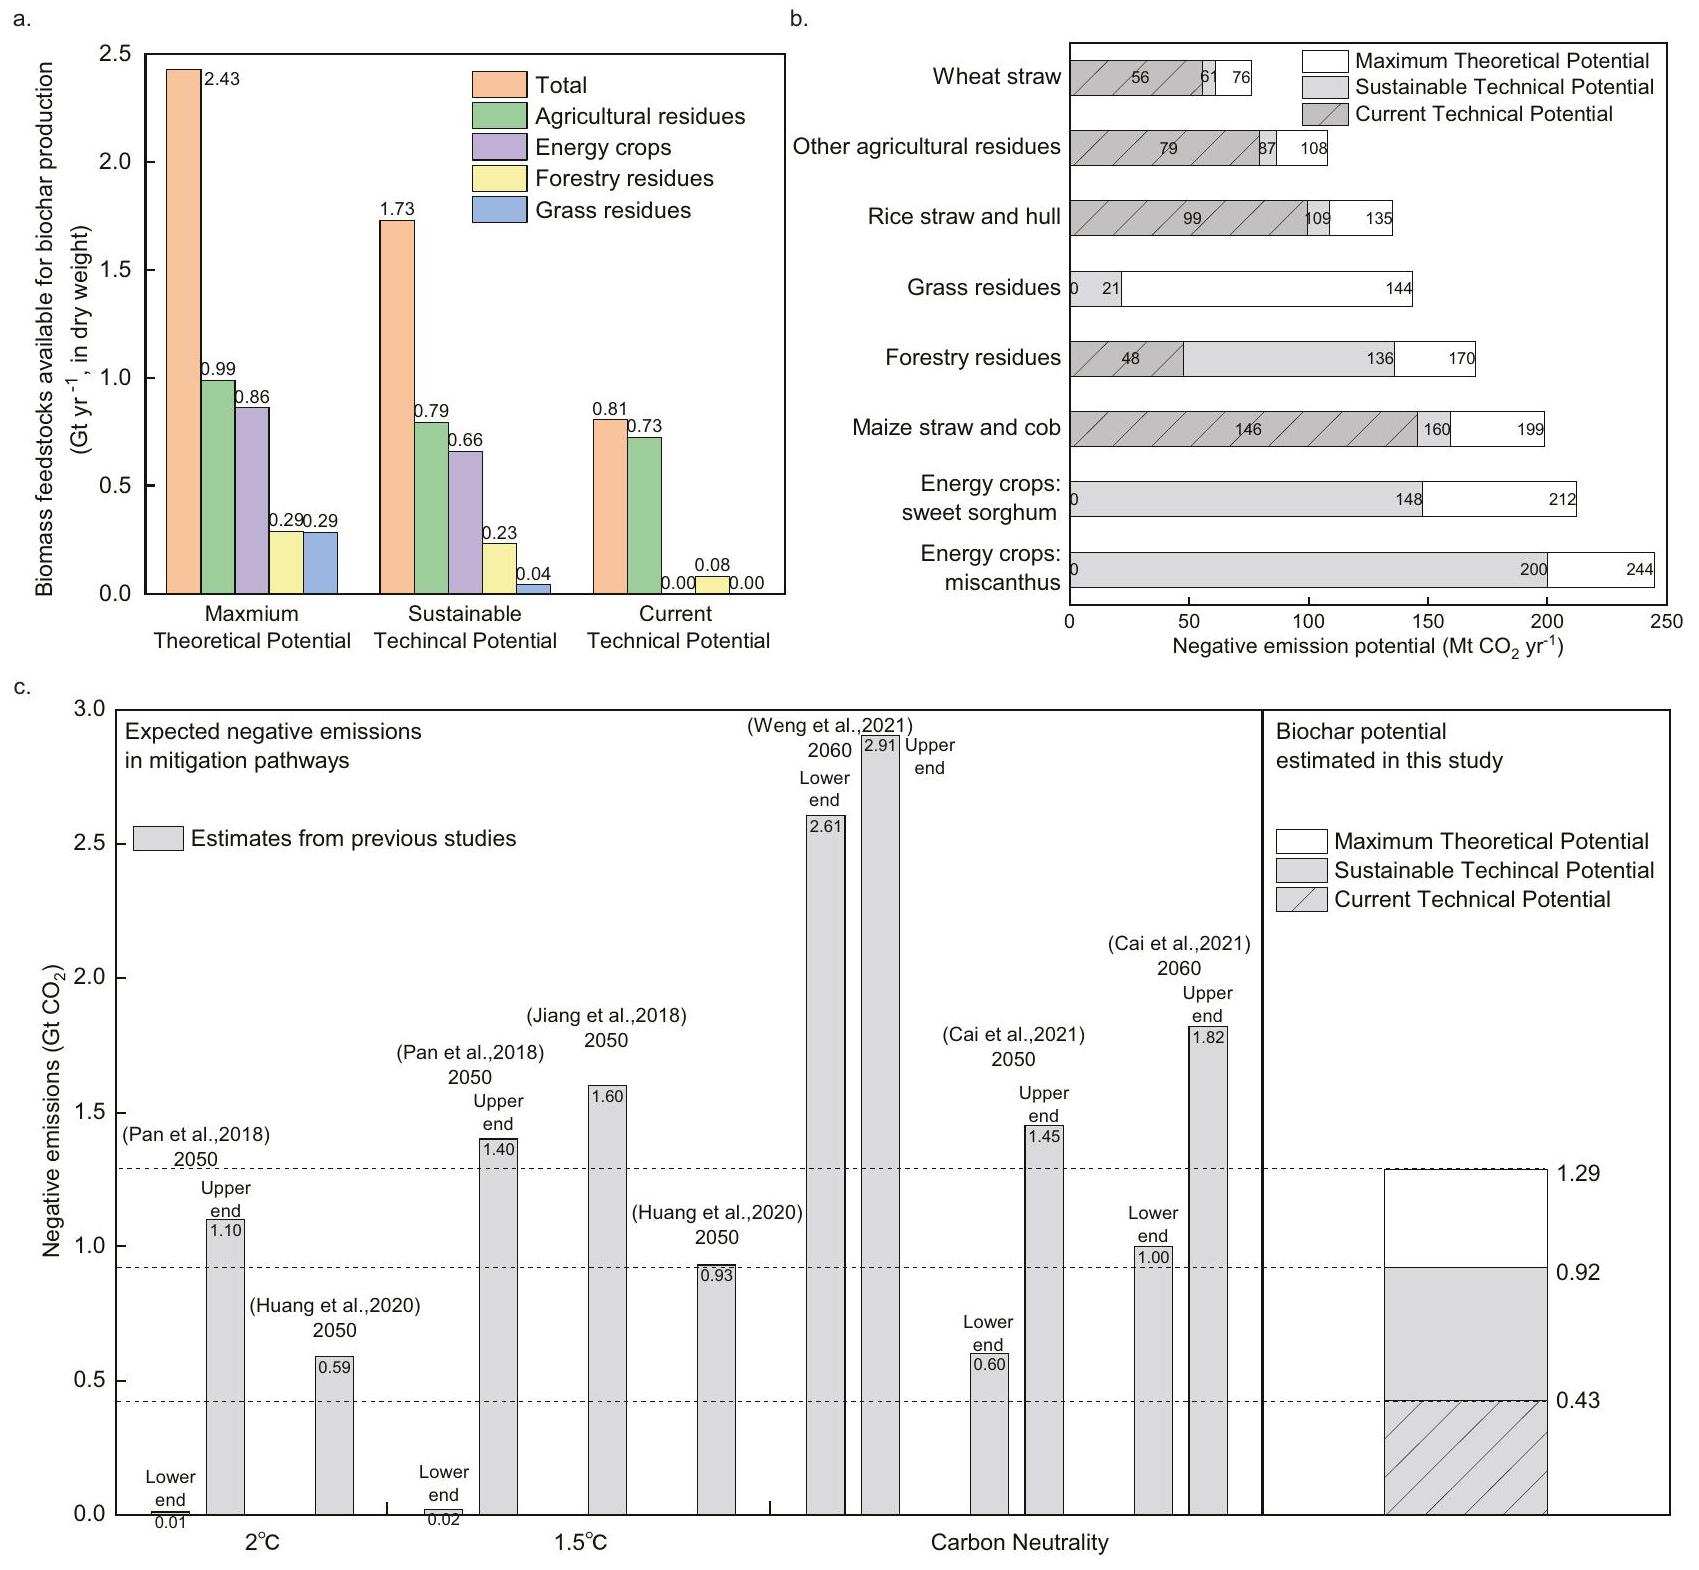
إمكانات الفحم الحيوي المنتج من أنواع مختلفة من المواد الخام. لاحظ أن ‘المخلفات الزراعية الأخرى’ تشير إلى مخلفات 13 نوعًا آخر من المحاصيل باستثناء الأرز، والقمح، والذرة. ج مقارنة بين متطلبات الانبعاث السلبي في مسارات التخفيف من الدراسات السابقة، وإمكانات الانبعاث السلبي للفحم الحيوي المقدرة في هذه الدراسة. يتم توفير بيانات المصدر كملف بيانات مصدر.
محاصيل الطاقة على الأراضي الهامشية، ومعدل حصاد المخلفات الأكثر كفاءة الناتج عن التقدم التكنولوجي والسياسي، مع الحفاظ على أنماط استخدام الكتلة الحيوية الحالية. لذلك، يقدم سيناريو ‘التقنية الحالية’ و’التقنية المستدامة’ حدودًا قصوى قريبة الأجل ومستدامة لإمكانات الانبعاث السلبي للفحم الحيوي دون المساس بالأمن الغذائي أو المواطن. ومع ذلك، من الضروري ملاحظة أن كلا السيناريوهين يتطلبان اتخاذ إجراءات سياسية تقدمية لتعزيز توفر الكتلة الحيوية بما يتجاوز الممارسات الحالية. نطاق إمكانات الانبعاث السلبي المبلغ عنها في هذه الورقة يتعلق فقط بالسيناريوهات المدروسة ولا يعكس القيود المفروضة من السياسات الواقعية.
تشير نتائجنا إلى أن الإمكانات النظرية القصوى لمواد الكتلة الحيوية في الصين يمكن أن تصل إلى (الشكل 1أ). تساهم المخلفات الزراعية، التي تتكون بشكل أساسي من قش الذرة وسبائكها، وقش الأرز وقشوره، وقش القمح، بنسبة أو من إجمالي المواد الخام (الشكل التكميلية 9). بالإضافة إلى ذلك، من
إجمالي المواد الخام، ما يعادل , تأتي من محاصيل الطاقة المخصصة مثل الميسكانثوس والدخن الحلو المزروعة في الأراضي الهامشية. تساهم مخلفات الغابات والمراعي بالتساوي في إجمالي المخلفات، حيث تقدم كل منهما . مقارنة بالدراسات الحالية , فإن تقديرنا للإمكانات النظرية القصوى للمواد الخام المتاحة هو تقدير محافظ، لأننا نعتبر فقط المخلفات في الزراعة والكتلة الحيوية للغابات، والعشب في المراعي باستثناء المحميات الطبيعية، والمحاصيل الطاقية المحتملة المحدودة بالأراضي الهامشية والظروف المناخية. ومع ذلك، فإن وفرة مواد الكتلة الحيوية توفر ثقة كبيرة في إعداد الفحم الحيوي.
بالنظر إلى المنافسة على الكتلة الحيوية من الاستخدامات الحالية، مثل علف الماشية، جنبًا إلى جنب مع القيود البيئية، فإن إجمالي المواد الخام المتاحة من الكتلة الحيوية تحت سيناريو ‘الإمكانات التقنية المستدامة’ يتقلص إلى . على وجه التحديد، عند أخذ معدل الحصاد في الاعتبار وطرح المواد الخام المستخدمة لعلف الماشية، واستهلاك الطاقة الريفية، والمواد الخام، يتم حساب كميات المخلفات المتاحة
من الزراعة والغابات لإنتاج الفحم الحيوي عند و ، على التوالي (يرجى الرجوع إلى الملاحظة التكميلية 1). تظهر مخلفات العشب، المستخدمة بشكل واسع كعلف للماشية (انظر قسم “الطرق”)، انخفاضًا ملحوظًا في التوفر. تظهر نتائجنا أن المخلفات العشبية المتبقية قد انخفضت إلى ، مما يمثل فقط من الإمكانات النظرية القصوى. علاوة على ذلك، لتجنب الأضرار البيئية، تفترض هذه الدراسة أن زراعة محاصيل الطاقة المخصصة محظورة في المناطق المدية، والأراضي المنخفضة، وبعض الأراضي الشجرية المعينة من قبل الحكومة. وبالتالي، فإن المساحة الناتجة لزراعة محاصيل الطاقة هي ، مما ينتج . تتماشى هذه الأرقام مع التقديرات الحالية، التي تتراوح من للمساحة و0.01 إلى أكثر من للإنتاج. أخيرًا، تحت سيناريو ‘الإمكانات التقنية الحالية’، تبلغ المواد الخام المتاحة من الكتلة الحيوية ، تتكون من من الكتلة الحيوية الزراعية و من مخلفات الغابات.
بعد التحلل الحراري، سيتم احتجاز جزء من الكربون من الكتلة الحيوية داخل الفحم الحيوي والحفاظ عليه لمئات السنين (الملاحظة التكميلية 3). يمكن أن تصل الإمكانية للانبعاثات السلبية إلى تحت السيناريو النظري الأقصى. هذه القدرة تكاد تلبي متطلبات الانبعاث السلبي عبر جميع مسارات إزالة الكربون العميقة بما يتماشى مع هدف (انظر الشكل 1ب، ج). تحت السيناريو التقني الحالي، تبلغ إمكانات الانبعاث السلبي ، مما يقدم فرص تخفيف كبيرة على المدى القريب. بينما يمكن أن تلبي الإمكانية تحت السيناريو التقني المستدام طلبًا على الانبعاث السلبي قدره . نظرًا لأن التوقع الوسيط لمتطلبات الانبعاث السلبي في الصين هو في 2050 أو 2060 (انظر الشكل 1ج)، جنبًا إلى جنب مع كون مصيدة الكربون في الغابات المدارة هي ، فإن الفحم الحيوي يمكن أن يلعب دورًا كبيرًا في تحقيق الانبعاثات السلبية وفقًا لهدف والحياد الكربوني، دون نشر تقنيات الانبعاث السلبية المبكرة مثل BECCS وDACCS.
بعيدًا عن توفير الانبعاثات السلبية من خلال احتجاز الكربون، فإن تطبيق الفحم الحيوي له تأثير أكبر على تقليل إجمالي الانبعاثات، على سبيل المثال، من خلال تعويض انبعاثات الكربون الأحفوري من خلال استخدام الغاز الاصطناعي، بالإضافة إلى تجنب انبعاثات غازات الدفيئة من التربة (الملاحظة التكميلية 6). تشير دراستنا إلى أن الجزء الإجمالي من التجنب هو حوالي 1.5 مرة أكبر من جزء الإزالة (الشكل التكميلية 12)، مما يشير إلى أن الفحم الحيوي يمكن أن يلعب دورًا أكبر في التخفيف من آثار المناخ. كما أجرينا تحليل عدم اليقين لإظهار التأثير طويل الأجل لتغير المناخ على تقدير إمكانات الفحم الحيوي. دون اعتبار إضافي لنمط استخدام الأراضي، يشير تحليل مونت كارلو إلى نمو طفيف في إمكانات الانبعاث السلبي للفحم الحيوي تحت جميع السيناريوهات. يعود هذا النمو بشكل أساسي إلى زيادة مخلفات الغابات، التي تتأثر بتغير المناخ المتوقع في النصف الثاني من القرن الحادي والعشرين (الجدول التكميلية 13). تؤثر العوامل الاجتماعية والاقتصادية أيضًا على إنتاج المحاصيل في المستقبل، وبالتالي، على توفر مخلفات المحاصيل، مما يظهر تباينات كبيرة (الملاحظة التكميلية 7).

اقتصاديات الانبعاثات السلبية من الفحم الحيوي

ثم نقوم بإجراء تحليل التكلفة والفائدة على الاحتراق البطيء (كما هو موضح في قسم “الطرق”) ونبني منحنيات العرض للتكاليف والتكاليف الصافية (مع المنتجات الثانوية والعوائد التي تزيد من الفوائد المشتركة كدخل) للانبعاثات السلبية التي يوفرها الفحم الحيوي (الشكل 2 أ، ب). متوسط تكلفة الانبعاثات السلبية الصافية للفحم الحيوي في الصين هو يتراوح من للفحم الحيوي المستخرج من مخلفات الزراعة والغابات إلى للكربون الحيوي المشتق من المحاصيل الطاقية وبقايا الأعشاب. وبناءً عليه، يتم تحديد التكلفة الصافية للانبعاثات السلبية للكربون الحيوي من بقايا الزراعة والغابات عند في الصين، بينما التكلفة الصافية لـ BECCS عادة ما تكون بين 30-400 على الرغم من أن الفحم الحيوي الناتج عن محاصيل الطاقة وبقايا الأعشاب أكثر تكلفة بسبب ارتفاع تكلفة شراء الكتلة الحيوية، إلا أنه لا يزال لديه ميزة اقتصادية على تقنيات إزالة الكربون الأخرى، مثل الوقود
) ، DACCS ( ) والطحالب الدقيقة ( قد تكون أكثر تكلفة حتى تكنولوجيا إنتاج الفحم الحيوي، وخاصة تكنولوجيا غازification الكتلة الحيوية لإنتاج الفحم الحيوي والغاز الاصطناعي التي يتم الترويج لها في الصين (الملاحظة التكميلية 2)، ناضجة تجارياً وتنافسية اقتصادياً، كما يتضح من نتائجنا، مما يشير إلى أن الفحم الحيوي يمكن اعتباره NET فعال من حيث التكلفة نسبياً وأن لديه القدرة على لعب دور رئيسي في استراتيجيات التخفيف من آثار المناخ.
يتم تحقيق التكلفة الصافية المنخفضة نسبيًا للبيوتشار بفضل بيع المنتجات الثانوية من الغاز التخليقي والفوائد المشتركة من تحسين الغلات (النصف الأيسر من الشكل 2c). تهيمن مبيعات الغاز التخليقي على إجمالي الإيرادات وتخفف من إلى من إجمالي التكاليف. الفوائد المستمدة من مبيعات المنتجات الثانوية هي الأقل بالنسبة لمخلفات الغابات ومخلفات الأرز. محتوى الكربون في الفحم الحيوي المستند إلى مخلفات الغابات مرتفع، مما يشير إلى أن المزيد من الكربون والحرارة يتم احتجازه في الفحم الحيوي بدلاً من المنتجات الثانوية. قيمة التسخين لمخلفات الأرز وقش الأرز منخفضة، مما يشير إلى إنتاج أقل للغاز الاصطناعي مقارنة بالمواد الخام الأخرى (الملاحظة التكميلية 2). في المشاريع التجريبية الحالية، يتم استخدام الغاز الاصطناعي لتوليد الحرارة الصناعية أو الكهرباء في المنشآت القريبة من مواقع التجارب (الجدول التكميلية 9). لذلك، من الضروري توسيع وتعزيز البنية التحتية ذات الصلة، مثل تحسين الاتصال بشبكات الغاز والطاقة، لزيادة الإيرادات من مبيعات الغاز الاصطناعي. كما أن الفحم الحيوي يقدم حوافز تطبيق إضافية من خلال قدرته على تعزيز غلات المحاصيل. ومع ذلك، فإن الفوائد المشتركة المقدرة من تحسين الغلات في دراستنا ضئيلة، حيث تعوض فقط 1% إلى 23% من التكاليف. قد يكون ذلك بسبب تطبيق الأسمدة بمعدل مرتفع السائد في الحقول الصينية، مما يجعل تأثير تعزيز الغلة للفحم الحيوي أقل أهمية مقارنة بما تقترحه الدراسات الدولية. على سبيل المثال، تشير أحدث التحليلات الشاملة إلى أن تطبيق الفحم الحيوي يحسن فقط غلات المحاصيل الرئيسية في الصين بحوالي ، وهو رقم أقل بكثير من المتوسط العالمي لـ . على العكس، فإن تأثير تحسين العائد يكون أكثر وضوحًا بالنسبة للفحم الحيوي القائم على الأعشاب مثل تلك المشتقة من الميسكانثوس.
بدون النظر في الإيرادات الناتجة عن تحسين العائدات ومبيعات المنتجات الثانوية، ستنخفض الجاذبية الاقتصادية للفحم الحيوي بشكل كبير، مع ارتفاع تكاليف الانبعاثات السلبية إلى 142-273 \ \mathrm{t}^{-1} \mathrm{CO}_{2}$ (الشكل 2b). تختلف تكلفة الانبعاثات السلبية للفحم الحيوي المستمد من مصادر مختلفة بشكل كبير بسبب الاختلافات في تكلفة شراء المواد الخام، ومعدل التحويل من المواد الخام إلى الفحم الحيوي، ومحتوى الكربون في الفحم الحيوي. أولاً، الفحم الحيوي المستمد من المحاصيل الطاقية أكثر تكلفة لأن سعر شراء المحاصيل الطاقية أعلى من سعر بقايا المحاصيل، حيث أن الأخيرة لا تشمل الإيرادات الناتجة عن إنتاج المحاصيل. ثانياً، يساهم معدل التحويل المنخفض من الكتلة الحيوية إلى الفحم الحيوي أو محتوى الكربون المنخفض في الفحم الحيوي في ارتفاع التكلفة الإجمالية لكل وحدة من الانبعاثات السلبية. على سبيل المثال، معدلات التحويل من المحاصيل الطاقية إلى الفحم الحيوي هي <25% (الجدول التكميلي 6)، مما يؤدي إلى ارتفاع تكاليف الانبعاثات السلبية لديها لأكثر من . بالمقابل، فإن معدلات تحويل بقايا الأرز والذرة والقمح إلى الفحم الحيوي مرتفعة تحت نفس ظروف التحلل الحراري، وتكاليف انبعاثاتها السلبية هي 158 و162 و على التوالي. نظرًا لارتفاع محتوى الكربون في الفحم الحيوي المشتق من الغابات (77.2%)، فإن تكلفة الانبعاثات السلبية لمخلفات الغابات هي والتي تظل الأدنى بين جميع أنواع البيوكربون. نظرًا للاحتياجات الأولية العالية والعوائد غير المؤكدة، يمكن أن تبدأ تطبيقات البيوكربون بجمع المخلفات الزراعية والغابية التي تتميز بمحتوى عالٍ من الكربون ومعدلات تحويل مرتفعة.

التحليل المكاني لإمكانات الفحم الحيوي

لتحديد المناطق المناسبة لنشر الفحم الحيوي، يتم إجراء تحليل مكاني لإمكانات الانبعاثات السلبية تحت سيناريو ‘الإمكانات التقنية المستدامة’ (انظر قسم “الطرق”) ويتم تقسيم المقاطعات إلى ست مناطق، كما هو موضح في الشكل 3. نظرًا لأن المواد الخام غير موزعة بشكل موحد في جميع المناطق، يتم تقديم أنماط توزيع متنوعة بشكل كبير لإمكانات الانبعاثات السلبية. تهيمن بقايا المحاصيل الزراعية والمحاصيل الطاقية على
الشكل 2 | اقتصاديات الانبعاثات السلبية من الفحم الحيوي. أ منحنى التكلفة ( ) من الانبعاثات السلبية للفحم الحيوي المستمد من مصادر غذائية متنوعة. تتكون التكاليف من تكلفة شراء المواد الخام، وتخزين المواد الخام، والاستثمار، والتشغيل والصيانة، ونقل الكتلة الحيوية والفحم الحيوي، وتطبيق الفحم الحيوي. الشبكة
منحنى التكلفة ( ) من الانبعاثات السلبية للفحم الحيوي المستمد من مصادر غذائية متنوعة. تشير التكلفة الصافية إلى الفرق بين التكاليف والإيرادات. تتكون الإيرادات من زيادة دخل المحصول ودخل الغاز الاصطناعي. ج مكونات التكاليف والإيرادات لأنواع مختلفة من الفحم الحيوي. يتم توفير بيانات المصدر كملف بيانات المصدر.
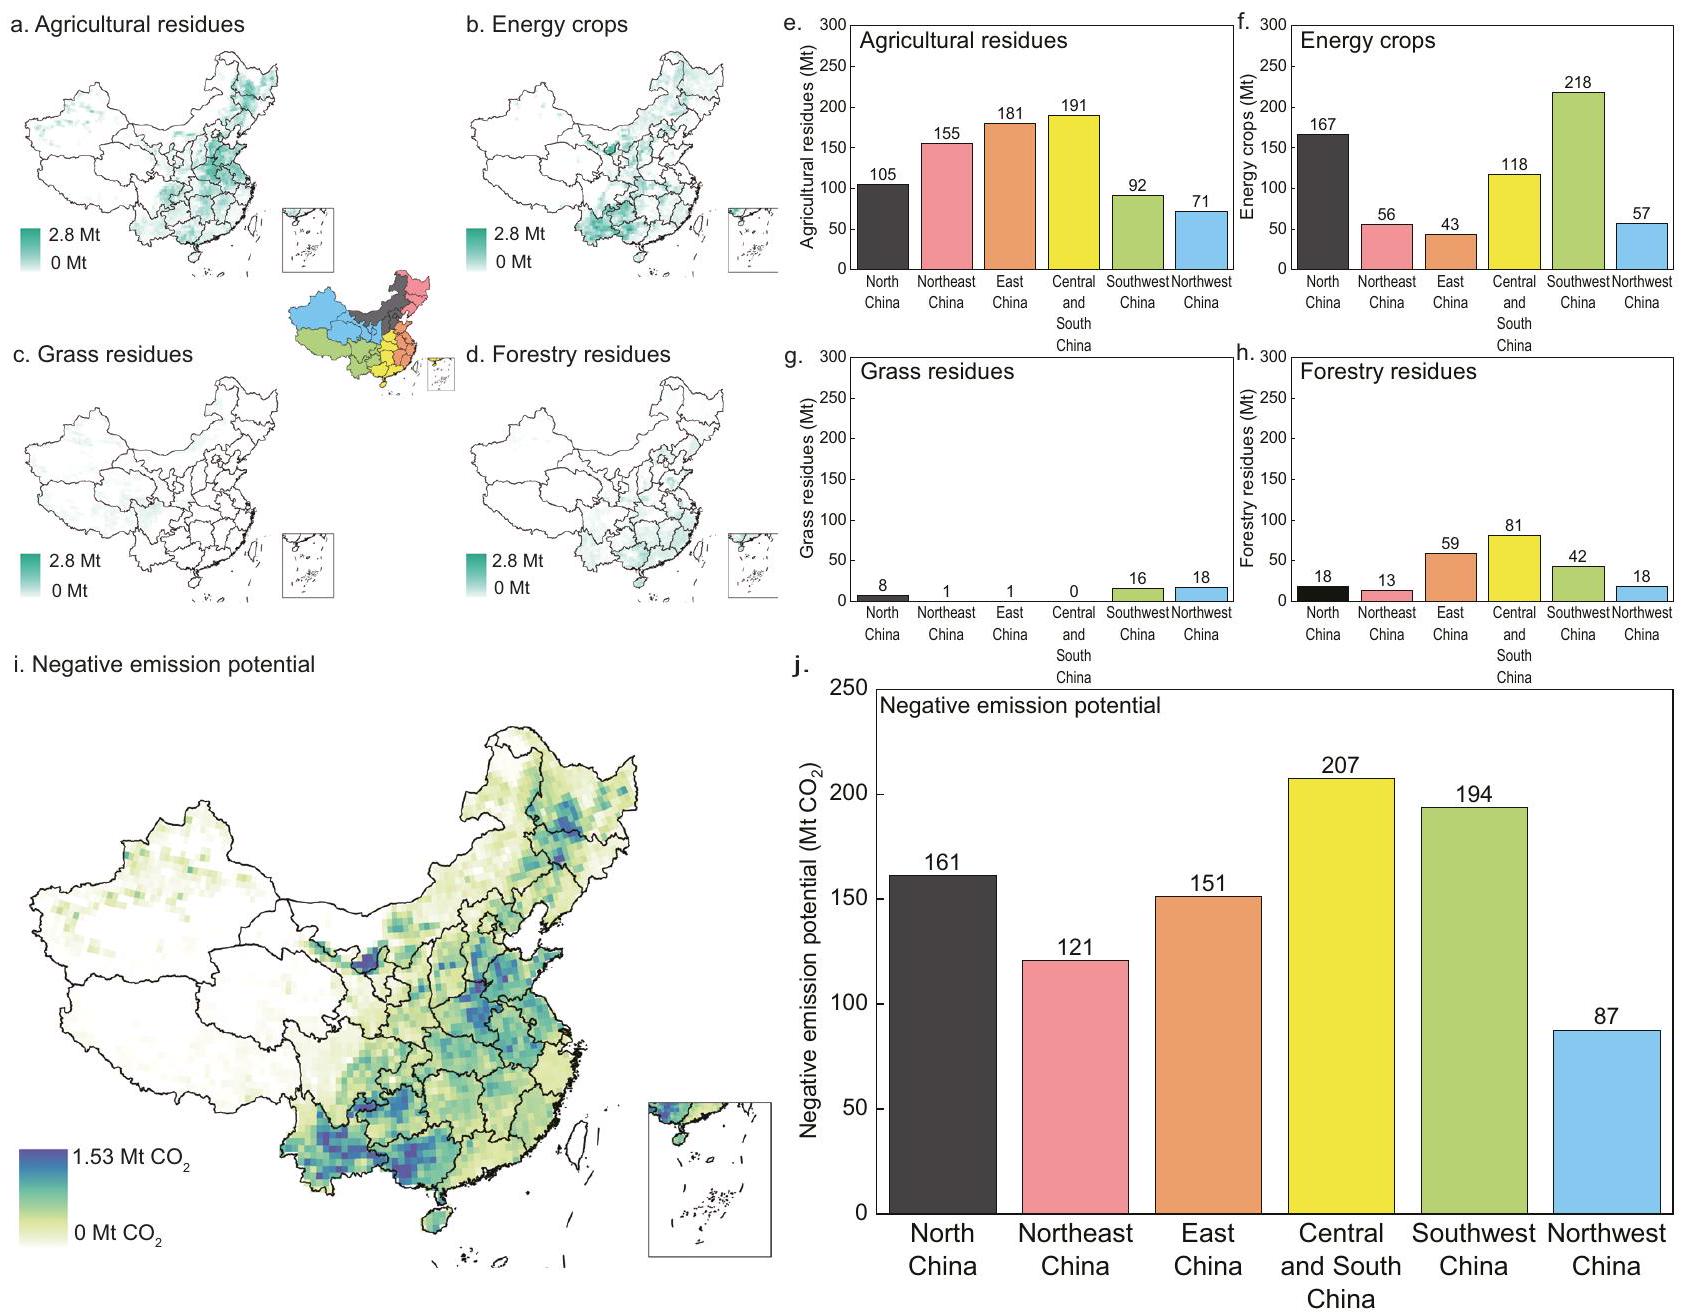
أنماط التوزيع لأنها أكثر مصادر الكتلة الحيوية وفرة. يتم توزيع المخلفات الزراعية بشكل أساسي في وسط وجنوب الصين. )، في حين أن المحاصيل الطاقية تتوزع بشكل أساسي في شمال الصين ( ) وجنوب غرب الصين ( 218 مليون طن . تمتلك شمال غرب الصين إمكانيات سلبية أقل بكثير من المناطق الأخرى بسبب النسبة الكبيرة من الأراضي العشبية وغياب بقايا الزراعة. لذلك، تمتلك وسط وجنوب الصين أكبر إمكانيات سلبية. تليها جنوب غرب الصين ) وشمال الصين ( (شكل 3j). تمتلك شمال غرب الصين أدنى إمكانات الانبعاثات السلبية، والتي هي .
تختلف تكاليف الانبعاثات السلبية للفحم الحيوي بشكل كبير على المستوى الإقليمي من 12 إلى 150. (الشكل 4أ) الناتج عن أنواع مختلفة من المواد الخام، وفرة الكتلة الحيوية، وأنواع التربة ودرجة الحموضة (انظر قسم “الطرق”). أولاً، يعتبر الفحم الحيوي المشتق من مخلفات الغابات والزراعة الخيار الأرخص لإزالة الكربون. وبالتالي، فإن تكلفة الفحم الحيوي أقل في المناطق الغنية بمخلفات الزراعة الحراجية (الشكل 4ب، ج). على سبيل المثال، فإن حصة مخلفات الزراعة الحراجية في إجمالي المواد الخام المتاحة من الكتلة الحيوية هي في شرق الصين و في وسط وجنوب الصين، مع انخفاض
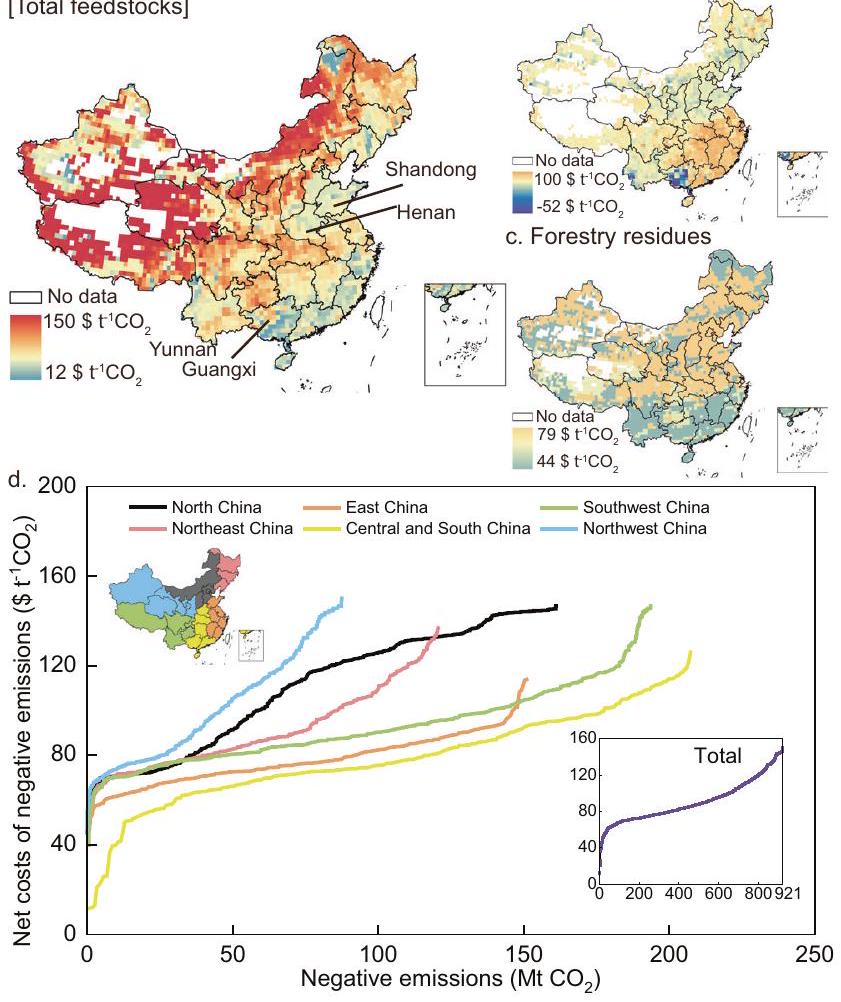
متوسط التكاليف 77.8 و “، على التوالي (الشكل 4د). من المRemarkably، يمكن أن يؤدي الفحم الحيوي المشتق من المصادر الزراعية إلى فوائد صافية في بعض المناطق (الشكل 4ب). ويعزى ذلك بشكل أساسي إلى الفوائد الكبيرة في زيادة الإنتاجية عند استخدام الفحم الحيوي لمحاصيل الحبوب عالية الإنتاجية في شاندونغ وهينان، أو محاصيل عالية الإنتاجية أخرى مثل قصب السكر في قوانغشي. بينما تساهم المحاصيل ذات القيمة الاقتصادية مثل التبغ في يونان في تقليل التكاليف، تشهد جنوب غرب الصين تكلفة متوسطة عالية من الانبعاثات السلبية الناتجة عن الفحم الحيوي ( )، حيث تتكون موارد الكتلة الحيوية في هذه المنطقة بشكل أساسي من محاصيل الطاقة والعشب. لنفس السبب، فإن متوسط التكلفة في شمال الصين هو الأعلى، يصل إلى ثانيًا، كلما كانت موارد الكتلة الحيوية أقل كثافة، زادت تكلفة الانبعاثات السلبية للفحم الحيوي. وذلك لأن نفس مصانع التحلل الحراري تعالج كميات أقل من الكتلة الحيوية، مما يؤدي إلى زيادة تكلفة الاستثمار لكل وحدة (الشكل التوضيحي 4). وبالتالي، فإن تكلفة الانبعاثات السلبية للفحم الحيوي في شمال غرب الصين مرتفعة، بمتوسط (الخط الأزرق في الشكل 4d). أخيرًا، فإن فوائد تعزيز العائد تكون أكثر أهمية على كل من التربة ذات القوام الخشن (البكسلات الزرقاء، الشكل التوضيحي 5) والتربة ذات القوام الناعم (البكسلات البنية، الشكل التوضيحي 5) مقارنة بالتربة ذات القوام المتوسط. علاوة على ذلك،
الشكل 3 | توزيع المواد الخام البيولوجية وإمكانات الانبعاثات السلبية تحت سيناريو ‘التقنية المستدامة’. أ-د توزيع بقايا الزراعة، بقايا الغابات، بقايا الأعشاب، والمحاصيل الطاقية على شبكة. الصين مقسمة إلى ست مناطق: الأسود لشمال الصين، الأحمر لشمال شرق الصين، البرتقالي لشرق الصين، الأصفر لوسط وجنوب الصين، الأخضر لجنوب غرب الصين، والأزرق لشمال غرب الصين. لم تكن هونغ كونغ وماكاو وتايوان ضمن
مدرج في تحليلنا. الكتلة الحيوية المتاحة في المناطق الست. إمكانيات الانبعاثات السلبية عند شبكة. إمكانات الانبعاثات السلبية في المناطق الست. تم توفير بيانات المصدر كملف بيانات مصدر. تم اقتباس ملف الشكل للحدود الوطنية والإقليمية من خدمة الكتالوج الوطني للمعلومات الجغرافية، المتاحة علىwww.webmap.cn.
التربة الحمضية (البكسلات البنية في الشكل التوضيحي 6) توفر فوائد أكبر من التربة القلوية وبناءً عليه، قد تستفيد المناطق في الجنوب أكثر من تحسين العائد.
باختصار، تتمتع مناطق وسط وجنوب الصين وشرق الصين بموارد غنية من الكتلة الحيوية بالإضافة إلى تكاليف أقل (الخطوط الصفراء والبرتقالية في الشكل 4d)، ويمكن اختيارها بشكل تفضيلي كمناطق تجريبية لتطبيق الفحم الحيوي. مع الأخذ في الاعتبار كل من التكلفة والإمكانات، يمكن أن تكون مقاطعة قوانغشي ومقاطعة خنان في وسط وجنوب الصين، ومقاطعة شاندونغ في شرق الصين مناطق أولوية لنشر تجريبي للفحم الحيوي. علاوة على ذلك، يمكن أن تبدأ التجارب في هذه المناطق بجمع بقايا الزراعة والغابات نظرًا للتكلفة المنخفضة المرتبطة بإنتاج الفحم الحيوي.

نقاش

مع تزايد الحاجة إلى الانبعاثات السلبية في السعي لتحقيق أهداف المناخ الصارمة، من الضروري استكشاف الخيارات البديلة لتقنيات الانبعاثات السلبية المبكرة. إن الحالة لصالح الفحم الحيوي، الذي لديه أكثر من عقد من العمل العملي في الصين، مثيرة للاهتمام بشكل خاص. تؤكد دراستنا ليس فقط الفرص القريبة الأجل ولكن أيضًا الآفاق المستدامة للفحم الحيوي كأحد تقنيات الانبعاثات السلبية المعتمدة في تحقيق هدف الصين للحياد الكربوني. نجد أن الفحم الحيوي يقدم إمكانات كبيرة للانبعاثات السلبية داخل الصين، مع التقنية الحالية.
وإمكانات الانبعاثات السلبية التقنية المستدامة تبلغ 0.43 و سنويًا، على التوالي. يبلغ متوسط التكلفة الصافية لإنتاج الفحم الحيوي حوالي يتراوح من الفحم الحيوي المستند إلى مخلفات الغابات إلى من الفحم الحيوي المستند إلى بقايا العشب. يبرز تحليلنا المكاني أن المناطق ذات الإمكانات العالية وانبعاثات الكربون السلبية المنخفضة التكلفة تتداخل إلى حد كبير، وخاصة في شرق الصين ووسط وجنوب الصين. ومن المRemarkable، أن بعض المناطق لديها القدرة على تحقيق عوائد إيجابية بسبب ارتفاع غلات المحاصيل أو قيمة المحاصيل. من خلال تقديم تقديرات لإمكانات الانبعاثات السلبية والاقتصاديات المتعلقة بالفحم الحيوي، يمكن لدراستنا تقديم توصيات للنشر المنظم والتكامل التدريجي للفحم الحيوي، وتوفير معلومات إقليمية لتكامل تكنولوجيا الفحم الحيوي في نماذج التقييم المتكاملة.
في معظم المناطق، على الرغم من أن تكلفة الانبعاثات السلبية للبيوچار أقل من غيرها من تقنيات الانبعاثات السلبية، إلا أنها لا تزال أعلى من أسعار الكربون في السوق الوطنية الصينية، مما يجعل من الصعب تعزيز تطبيقات البيوچار في المدى القريب من خلال آليات التعويض. ومع ذلك، تم رؤية مبادرات واعدة في الولايات المتحدة وفنلندا وما وراء ذلك، حيث أنشأت منظمات منصات طوعية لإزالة الكربون تتضمن البيوچار وبدأت في استكشاف منهجيات التحقق والرصد. . توفر هذه المشاريع رؤى قيمة لتنفيذ الفحم الحيوي
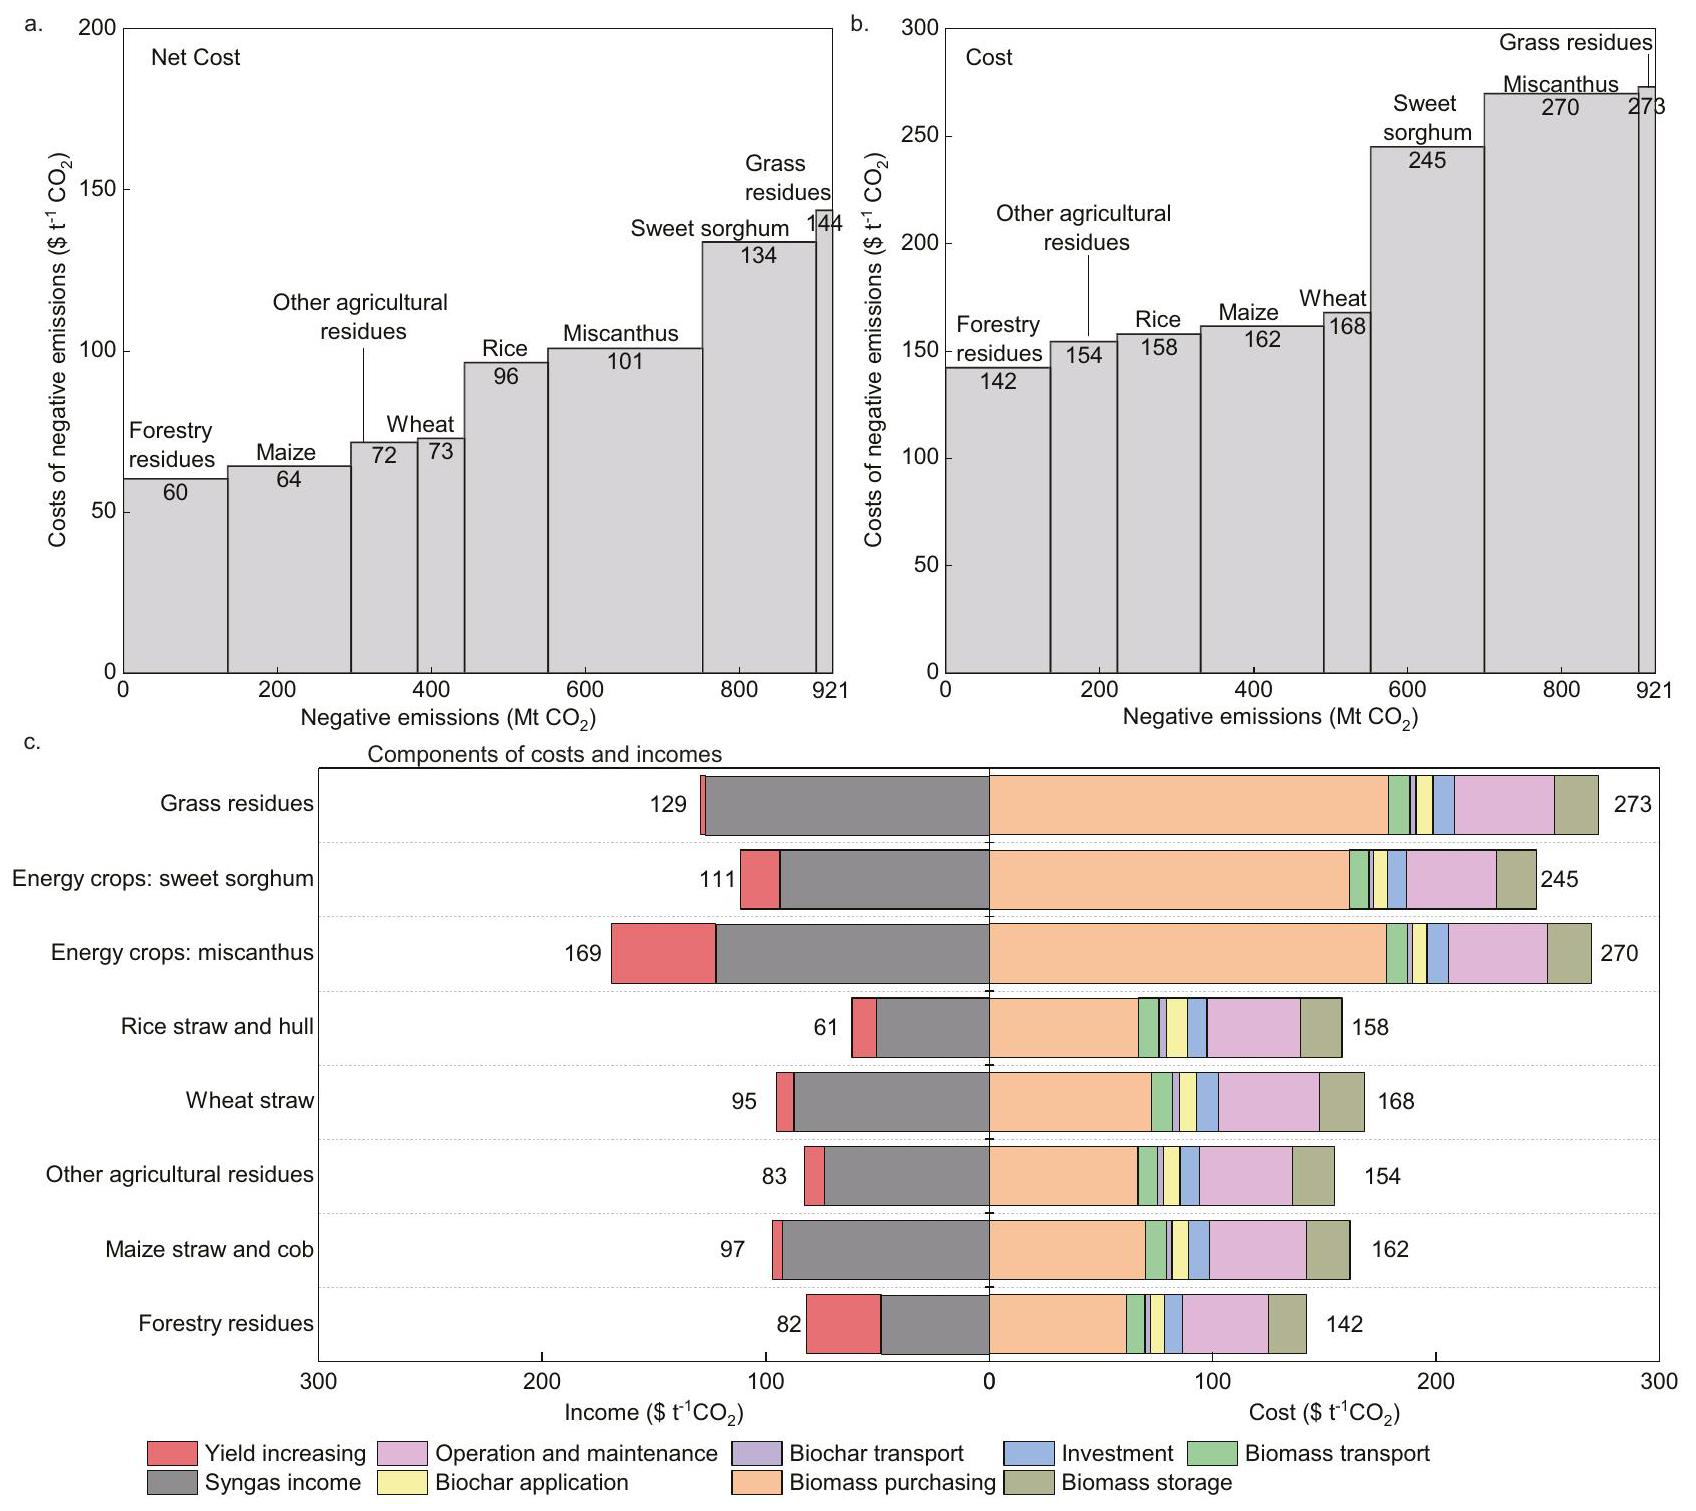
أ. التكاليف الصافية للانبعاثات السلبية
الشكل 4 | توزيع التكلفة الصافية للانبعاثات السلبية تحت ‘الاستدامة’
سيناريو ‘الإمكانات التقنية’. أ-ج التكلفة الصافية للانبعاثات السلبية على الشبكة. يتم حساب التكاليف كمتوسط مرجح لمختلف المواد الخام ضمن نفس الشبكة. لاحظ أن هذه التقديرات الصافية للتكاليف تختلف عن تلك الموجودة في الشكل 3 بسبب تطبيق ظروف التربة المحددة للموقع وموارد الكتلة الحيوية في التحليل المكاني، في حين أن القيم في الشكل 3 تستند إلى المتوسطات الوطنية. منحنى التكلفة الصافية للانبعاثات السلبية لمناطق مختلفة. يتم توفير بيانات المصدر كملف بيانات مصدر. تم اقتباس ملف الشكل للحدود الوطنية والإقليمية من الخدمة الوطنية لفهرسة المعلومات الجغرافية، المتاحة على www.webmap.cn.
التكنولوجيا في الصين. تم تضمين الفحم الحيوي في تعديل 2019 لإرشادات IPCC لعام 2006 لجرد الغازات الدفيئة الوطنية. . ومع ذلك، لا يزال تطوير طرق محاسبة شفافة ومتكيفة محليًا قيد التقدم ويتطلب مزيدًا من الاستكشاف. من أجل تحقيق أهداف أكثر طموحًا في خفض الانبعاثات الصافية، من الضروري دمج الفحم الحيوي في أنظمة تجارة الانبعاثات الوطنية والمادة 6 من اتفاق باريس. سيسهل ذلك التبني الأوسع والاستخدام الفعال لتقنيات الفحم الحيوي لتحقيق الانبعاثات السلبية.
بينما تستخدم هذه الدراسة إطارًا قويًا وتدمج بيانات من أحدث الأدبيات التجريبية والمشاريع التجريبية، لا يزال هناك قدر كبير من عدم اليقين بشأن إمكانيات الفحم الحيوي. ينشأ هذا عدم اليقين بشكل أساسي من عدة عوامل: توفر موارد الكتلة الحيوية، خصائص أنواع الفحم الحيوي المختلفة، تقنيات وظروف التحلل الحراري، وتأثير تطبيق الفحم الحيوي على غلة المحاصيل. لتقييم هذا عدم اليقين، نقوم بإجراء تحليل مونت كارلو (انظر الملاحظة التكميلية 7). التقدير المتوسط لإمكانات انبعاث الفحم الحيوي السلبية هو تحت السيناريوهات التقنية المستدامة، تتراوح من 0.68 إلى متوسط تكلفة الانبعاثات السلبية للبيوتشار هو “، مع نطاق من -13 إلى . من بين جميع المعايير، فإن تلك المتعلقة بدخل المنتجات الثانوية وتكاليف شراء المواد الخام هي الأكثر حساسية، مع القدرة على تغيير تكلفة الفحم الحيوي بحوالي (الأشكال التكميلية 13 و 14). علاوة على ذلك، فإن الإمكانات السلبية لانبعاثات البيوكربون لا تشمل تخفيضات الانبعاثات الناتجة عن إنتاج الطاقة الحيوية لتعويض انبعاثات الوقود الأحفوري، وتجنب
انبعاثات التربة من الميثان وأكسيد النيتروز. كلاهما مختلفان من الناحية المفاهيمية عن إمكانات الانبعاثات السلبية ولكنهما عوامل مهمة يجب أخذها في الاعتبار عند تقييم انبعاثات دورة حياة الفحم الحيوي. تشير النتائج إلى أن إمكانات التخفيف أكبر بمقدار 1.5 مرة من إمكانات الانبعاثات السلبية، والتي تم عرضها في الملاحظات التكميلية 4 و 6. على وجه الخصوص، فإن إمكانات الانبعاثات السلبية وإمكانات التخفيف من بقايا الزراعة تحت السيناريو الفني المستدام تصل إلى و ، متجاوزة التقديرات في الدراسات الحالية ( ، ويرجع ذلك أساسًا إلى اعتبارنا مجموعة أوسع من أنواع المحاصيل. لقد حظي التأثير الانفجاري لتحفيز التربة الناتج عن تحلل المادة العضوية الأصلية بسبب الفحم الحيوي أيضًا باهتمام، لكنه لا يزال موضوعًا للنقاش الشديد، كما هو موضح في الملاحظة التكميلية 4.
لدراستنا بعض القيود. أولاً، تحليلنا لا يشمل جميع أنواع موارد الكتلة الحيوية. نحن نركز على مواد خام محددة، متجاهلين أخرى مثل مخلفات الماشية. التي أثبتت قدرتها على إنتاج الفحم الحيوي. علاوة على ذلك، فإن تقنية إنتاج الفحم الحيوي التي استخدمناها، رغم أنها اقتصادية، لا تعطي الأولوية لتعظيم إنتاج الفحم الحيوي. مع تزايد القيود على ميزانيات الكربون، يصبح التوازن بين الانبعاثات السلبية وقيمة الطاقة في إنتاج الفحم الحيوي يتطلب اعتبارًا دقيقًا. قد تؤدي هذه العناصر إلى تقدير غير دقيق لقدرات الانبعاثات السلبية في دراستنا. ثانيًا، لا تأخذ أبحاثنا في الاعتبار بالكامل التأثيرات الديناميكية مثل التقدم التكنولوجي، واقتصادات الحجم، وتطور أسعار الكربون، والتي يمكن أن تؤثر جميعها على الجدوى الاقتصادية للفحم الحيوي وقد تؤدي إلى خفض تكلفته المستقبلية. أخيرًا، لا تتناول تحليلاتنا بالكامل التبادلات البيئية والاجتماعية والاقتصادية المرتبطة بالنشر الواسع النطاق للفحم الحيوي. قد يؤدي زيادة الطلب على الكتلة الحيوية إلى انبعاثات ناتجة عن تغييرات استخدام الأراضي، وزيادة المنافسة مع إنتاج الغذاء، وانخفاض التنوع البيولوجي. في الوقت نفسه، يمكن أن يوفر استخدام الفحم الحيوي أيضًا فوائد إضافية، مثل تحسين امتصاص المعادن الثقيلة في التربة. على الرغم من هذه القيود، تظل نتيجتنا الرئيسية أن الفحم الحيوي هو خيار واعد للتقنيات السلبية لامتصاص الكربون لتحقيق أهداف الحياد الكربوني في الصين ويجب أن يُدرج في أدوات التخفيف من تغير المناخ. يمكن أن تهدف الأبحاث المستقبلية إلى استكشاف هذه التبادلات المحتملة والفوائد المشتركة، مما يوفر فهماً أكثر شمولاً لدور الفحم الحيوي في التخفيف من تغير المناخ. .

طرق

النهج العام

قمنا بتقدير إمكانيات الانبعاثات السلبية والاقتصاديات للبيوچار في الصين باستخدام الخطوات التالية. أولاً، قمنا بحساب المواد الخام الحيوية لـ 16 نوعًا من بقايا المحاصيل الزراعية، و10 أنواع من بقايا الغابات، وبقايا الأعشاب، والمحاصيل الطاقية المحتملة في الصين استنادًا إلى البيانات الإحصائية والمكانية، والتي تم تجميعها على شكل ثم قمنا بتطوير ثلاثة سيناريوهات تقدم الإمكانات النظرية القصوى، والإمكانات التقنية المستدامة، والإمكانات التقنية الحالية لمصادر الكتلة الحيوية المتاحة، على التوالي. ثانياً، قمنا بتقدير إمكانات الانبعاثات السلبية للفحم الحيوي بناءً على إطار تجريبي موحد يميز خصائص الفحم الحيوي المستمد من أنواع مختلفة من مصادر الكتلة الحيوية. ثالثاً، من خلال دمج البيانات من أحدث التجارب في الأدبيات والمشاريع التجريبية، قمنا بحساب اقتصاديات الفحم الحيوي وبناء منحنى العرض للفحم الحيوي. أخيراً، مع الأخذ في الاعتبار عوامل مثل نسيج التربة ومستوى pH التي قد تؤثر على فعالية تطبيق الفحم الحيوي، قمنا بإجراء تحليل مكاني محدد للإمكانات السلبية للانبعاثات واقتصاديات الفحم الحيوي، وحددنا المواقع المناسبة لنشر الفحم الحيوي. تم عرض إطار عمل نهجنا في الشكل التوضيحي التكميلي 10.

المخلفات الزراعية

بالإشارة إلى نيي وآخرون. وزانغ وآخرون تم اعتماد طريقة ‘نسبة المتبقي إلى المنتج’ في دراستنا لدقتها في تحديد
التوزيع المكاني للمحاصيل، الذي تضمن استخدام بيانات مكانية عن أنواع المحاصيل، ونسبة المخلفات إلى المنتج الخاصة بكل محصول، ومعايرة النتيجة بناءً على الإحصائيات الوطنية. هنا، تم اعتبار مخلفات 16 نوعًا من المحاصيل الزراعية. تم الحصول على بيانات مكانية عن أنواع مختلفة من المحاصيل من Harvard Dataverse 2010 مع قرار التي تم رسم خرائطها ومعايرتها بعد ذلك على أساس غلات المحاصيل المأخوذة من الدليل الإحصائي الصيني لعام 2018. يمكن العثور على الصيغ والبيانات ذات الصلة في الملاحظة التكميلية 1.

مخلفات الغابات

لتوضيح المخلفات الحرجية المتاحة وتوزيعها المكاني، بدأنا من الإحصائيات المتعلقة بالمناطق المزروعة والإنتاج على مستوى عام 2018. واعتمدت الطريقة التي طورها فو وآخرون لحساب 10 أنواع من المخلفات الحرجية المتاحة باستخدام معاملات المعالجة والتقليم لمختلف أنواع المخلفات الحرجية. . ثم تم تخصيص المخلفات الحرجية المتاحة إلى الشبكات بناءً على نوع استخدام الأراضي وإنتاجية الكتلة الحيوية الصافية الموزعة (NPP) في عام 2018. تم اختيار البيانات المكانية للأراضي الحرجية والأراضي الحرجية الأخرى من مركز علوم وبيانات الموارد والبيئة (RESDC) بدقة تم الحصول على NPP عند مستوى 2018 من منتج جهاز التصوير الطيفي ذو الدقة المتوسطة (MODIS) – MOD17A3HGF.006 – بدقة يمكن العثور على الصيغة ومصادر البيانات في الملاحظة التكميلية 1.

بقايا العشب

أولاً، قمنا بجمع بيانات إحصائية عن بقايا الأعشاب المتاحة من المراعي الطبيعية في جميع أنحاء البلاد من التقرير السنوي لعام 2018 حول تنمية الغابات والمراعي في الصين. . ثم، تم تخصيص بقايا العشب لكل شبكة بناءً على NPP الذي تم الحصول عليه من MOD17A3HGF.006 وتم الوصول إلى بيانات نوع استخدام الأراضي المكانية للمراعي ذات التغطية العالية والمتوسطة والمنخفضة من RESDC أخيرًا، تم استبعاد المواد الخام في المحميات الطبيعية الوطنية (NNRs). يمكن رؤية المعادلة المستخدمة لحساب بقايا العشب في الملاحظة التكميلية 1.

محاصيل الطاقة

تم تحديد مواقع الزراعة وإنتاج المحاصيل الطاقية بناءً على مساحة الأراضي الهامشية، نوع المحصول، والعوائد المقابلة. في هذه الدراسة، تشير الأراضي الهامشية إلى أراضي الشجيرات، المنطقة المدية، الأراضي المنخفضة، والأراضي غير المستخدمة التي تشمل الأراضي الرملية، والصحراوية، والمالحة، والأراضي المستنقعية، والأراضي العارية، والأراضي الصخرية العارية. تم تحديد هذه المناطق على شبكة نوع استخدام الأرض مع استبعاد NNRs. تم اختيار نباتات C4 مثل الدخن الحلو، وعشب السويتغراس، والميسكانثوس كمحاصيل طاقة محتملة ليتم زراعتها في المستقبل. تم تحديد مواقع الزراعة المناسبة لكل محصول طاقة بناءً على الظروف البيئية التي شملت درجة الحرارة، والانحدار، وهطول الأمطار. تم اعتماد غلات كل محصول طاقة على المستوى الإقليمي من دراسات سابقة. أخيرًا، تم تراكب خرائط الأراضي الهامشية وثلاثة أنواع من محاصيل الطاقة مع معلومات عن مواقع الزراعة المناسبة والعوائد المحتملة لتحديد أفضل إمكانيات التكنولوجيا للشبكات الفردية. وبالتالي، تم استبعاد عشب السويتشغراس بسبب العائد المنخفض نسبيًا. يمكن العثور على الخرائط والبيانات والمصادر ذات الصلة في الملاحظة التكميلية 1.

تطوير السيناريوهات على مصادر الكتلة الحيوية المتاحة

في هذه الدراسة، قمنا بتطوير ثلاثة سيناريوهات استنادًا إلى افتراضات مختلفة حول توافر الكتلة الحيوية: الحد الأقصى من الإمكانيات النظرية، الإمكانيات التقنية المستدامة، والإمكانيات التقنية الحالية. يمثل سيناريو ‘الحد الأقصى من الإمكانيات النظرية’ الحد الأقصى من الكتلة الحيوية القابلة للتحصيل، استنادًا إلى افتراض أن جميع موارد الكتلة الحيوية يمكن حصادها وعدم استخدامها لأغراض أخرى. يشير سيناريو ‘الإمكانيات التقنية الحالية’ إلى المواد الخام المتاحة ضمن قيود التقنيات والممارسات الحالية، مع افتراض أن جزءًا فقط من
يمكن جمع المخلفات الزراعية والغابية – على وجه التحديد، 88% من المخلفات الزراعية و من مخلفات الغابات استنادًا إلى الحالة الراهنة. بالمقابل، فإن سيناريو ‘الإمكانات التقنية المستدامة’ يقع بين الإمكانات النظرية القصوى والإمكانات التقنية الحالية. يأخذ هذا السيناريو في الاعتبار الإمكانات النظرية القصوى التي تم تقليلها بسبب الكتلة الحيوية المطلوبة للماشية والوقود التقليدي مع الحفاظ على التوازن البيئي. هنا، يُفترض أن 95% من المخلفات الزراعية و يمكن جمع بقايا الغابات، بعد ذلك يتم خصم الاستخدامات الأساسية بالنسبة للمناطق التي تكون فيها السعة النظرية لحمل الماشية على المراعي أقل من الحمولة الفعلية للماشية، لم يُفترض أن يتم الاستفادة من بقايا العشب المتاحة لإنتاج الفحم الحيوي (يرجى الرجوع إلى الملاحظة التكميلية 1 للحصول على حسابات مفصلة). تأخذ الترتيبات لمحاصيل الطاقة على الأراضي الهامشية في الاعتبار الأراضي غير المستخدمة وأراضي الشجيرات. تم استبعاد المنطقة الساحلية والأراضي المنخفضة لإعطاء الأولوية للحفاظ على البيئة. تم تخفيض عائد محاصيل الطاقة المخصصة بناءً على بيانات جودة التربة من قاعدة بيانات التربة العالمية الموحدة v1.2. (ملاحظة إضافية 1).

التحلل الحراري البطيء

افترضنا نشر مصانع التحلل الحراري في مركز كل شبكة، لإنتاج كل من الفحم الحيوي والغاز الاصطناعي. لتوحيد الناتج المستمد من أنواع مختلفة من الكتلة الحيوية، اعتمدنا إطار محاسبة موحد تم تطويره بواسطة وولف وآخرين. ، مع الأساس التجريبي المتجذر في الأدبيات الحالية. استخدمنا الخصائص الفيزيائية والكيميائية لمختلف أنواع الكتلة الحيوية كمدخلات، وحددنا درجة حرارة التحلل الحراري عند لهذه الدراسة. علاوة على ذلك، اعتمدنا تقنية غازification الكتلة الحيوية التي تنتج في نفس الوقت الفحم الحيوي والغاز الاصطناعي، كما هو موضح في المشاريع التجريبية والأدبيات التجريبية. تم حساب قيمة تسخين الفحم الحيوي بناءً على التحليلات التجريبية التي أجراها تشيان وآخرون. تم حساب إنتاج الغاز الاصطناعي من خلال متابعة توازن الطاقة، وتم استخدامه بعد ذلك لتوليد البخار الصناعي. يمكن العثور على الصيغ والبيانات ذات الصلة في الملاحظة التكميلية 2.

إمكانات الانبعاثات السلبية

في هذه الدراسة، يشير إمكان الانبعاث السلبي للبيوچار إلى تم تثبيت الكتلة الحيوية من الغلاف الجوي من خلال عملية التمثيل الضوئي، ثم تم نقلها والحفاظ عليها بشكل دائم في الفحم الحيوي. تم تحديد القيمة بناءً على كمية المواد الخام الحيوية المتاحة، ومعدل تحويل الوزن من المواد الخام إلى الفحم الحيوي، ومحتوى الكربون في الفحم الحيوي، ومعدل الديمومة للفحم الحيوي خلال 100 عام، والتي تم حسابها بناءً على الإطار المحاسبي الذي وضعه وولف وآخرون. وتركيبها الفيزيائي الكيميائي للمحاصيل المزروعة في الصين. يمكن العثور على الصيغ والبيانات ذات الصلة في الملاحظات التكميلية 2 و 3.

زيادة العائد

قمنا بحساب فوائد تحسين العائد الناتج عن استخدام الفحم الحيوي بمعدل تطبيق مثالي من خلال ضرب عائد المحاصيل الموزعة على الشبكة. أسعار المحاصيل، ومعدل زيادة الإنتاج . بعد ذلك، قمنا بحساب الفوائد التي جلبها الفحم الحيوي بمعدل التطبيق الفعلي، الذي تم تحديده من خلال غلات المحاصيل ومعدل تحويل الوزن من الكتلة الحيوية إلى الفحم الحيوي، باستخدام نسبة المعدل الفعلي إلى المعدل الأمثل للتطبيق. لأغراض التقدير الحذرة، قمنا بتحديد المعدل الأمثل لتطبيق الفحم الحيوي عند يمكن العثور على الصيغ والبيانات ذات الصلة في الملاحظة التكميلية 4.

التحليل الاقتصادي

تم اعتماد تحليل التكلفة والفائدة لتحليل اقتصاديات الفحم الحيوي، وهو أحد الأساليب المالية الشائعة المستخدمة لتقييم قيمة المشروع من خلال مقارنة التكاليف والفوائد. هنا، تم تعريف حدود النظام على أنها شراء المواد الخام، النقل، التخزين، التحلل الحراري، نقل الفحم الحيوي، التطبيق، وفعاليته على المحاصيل. وتم الافتراض أن المواد الخام ستُنقل إلى مصنع التحلل الحراري الواقع في مركز كل شبكة، بينما سيتم إعادة الفحم الحيوي إلى الحقول التي
تم حصاد المواد الخام. أولاً، تم حساب القيمة الحالية الصافية (NPV) لمشروع مصنع التحلل الحراري الذي يمتد لعشرين عامًا. تشمل القيمة الحالية الصافية الاستثمار الأولي، والتدفقات النقدية السنوية الداخلة والخارجة. كانت التدفقات النقدية السنوية الداخلة تتكون من زيادة دخل العائد ودخل الغاز الاصطناعي المحسوب بناءً على السعر والإنتاج. بينما كانت التدفقات النقدية السنوية الخارجة تتكون من تكلفة شراء المواد الخام، وتخزين المواد الخام، والتشغيل والصيانة، ونقل الكتلة الحيوية والفحم الحيوي، وتطبيق الفحم الحيوي. بعد ذلك، يمكن تعريف تكلفة الانبعاثات السلبية على أنها الاستثمار الأولي والتدفقات النقدية الخارجة الموزعة على كل وحدة من المحتجز في الفحم الحيوي خلال الفترة بأكملها. يمكن اعتبار التكلفة الصافية للانبعاثات السلبية كعكس القيمة الحالية الصافية المخصصة لكل وحدة من يمكن العثور على الصيغ والبيانات ذات الصلة في الملاحظة التكميلية 5.

تحليل مكاني محدد

قمنا بإجراء تحليل مكاني محدد لإمكانات الانبعاثات السلبية والاقتصاديات. بالإضافة إلى توضيح أنماط توزيع المواد الخام، تم أخذ قوام التربة، ودرجة الحموضة، ووفرة الكتلة الحيوية في مناطق مختلفة بعين الاعتبار. أولاً، تم اعتماد بيانات قوام التربة ومستوى درجة الحموضة من قاعدة بيانات التربة العالمية المتناغمة الإصدار 1.2. بالإشارة إلى سينغ وآخرون. وانغ وآخرون تم افتراض أن تطبيق الفحم الحيوي على التربة ذات القوام الخشن والناعم أو الحموضة كان أكثر فعالية في تحسين غلات المحاصيل، كما هو موضح في الملاحظة التكميلية 4. علاوة على ذلك، أثرت وفرة الكتلة الحيوية على تكاليف الاستثمار المخصصة لكل وحدة من المواد الخام المحترقة، أي أن الاستثمار في مصانع التحلل الحراري في المناطق ذات الكتلة الحيوية المنخفضة اعتُبر أقل فعالية من حيث التكلفة، كما هو موضح في الشكل التكميلية 4.

تحليل عدم اليقين

باستخدام محاكاة مونت كارلو، قمنا بإجراء تحليل عدم اليقين على إمكانيات الانبعاثات السلبية والاقتصاديات. تم توليد قيم عشوائية وفقًا للتوزيع الثلاثي والتوزيع الطبيعي. أبلغنا عن عدم اليقين كنطاق بعد 10,000 تكرار. كما قمنا بإجراء تحليل الحساسية على المعلمات الرئيسية التي قد تؤثر على إمكانيات الانبعاثات السلبية والاقتصاديات. يمكن العثور على مزيد من التفاصيل في الملاحظة التكميلية 7.

ملخص التقرير

معلومات إضافية حول تصميم البحث متاحة في ملخص تقارير مجموعة ناتشر المرتبط بهذه المقالة.

توفر البيانات

تم إيداع بيانات المصدر في زينودو و GitHub [https:// github.com/DXDX97/Biochar_code_and_data. البيانات التي تدعم النتائج الرئيسية لهذه الدراسة متاحة في الجداول التكميلية 1-13. البيانات الخام حول التوزيع المكاني للمحاصيل، والتربة، ونوع استخدام الأراضي، وإنتاجية الكتلة الحيوية الصافية المستخدمة في هذه الدراسة متاحة في Harvard Dataverse. قاعدة بيانات التربة العالمية المتناغمة الإصدار 1.2 RESDC ، وناسا على التوالي. تتوفر بيانات أخرى من المؤلف المقابل عند الطلب المعقول. يتم تقديم بيانات المصدر مع هذه الورقة.

توفر الشيفرة

الكود المستخدم لإجراء تحليل البيانات متاح على زينودو و GitHub [https://github.com/DXDX97/Biochar_code_and_data].

References

  1. Gillett, N. P. et al. Constraining human contributions to observed warming since the pre-industrial period. Nat. Clim. Chang 11, 207-212 (2021).
  2. IPCC. Climate Change 2014: Mitigation of Climate Change (Cambridge University Press, 2014).
  3. IPCC. Global Warming of . An IPCC Special Report on the Impacts of Global Warming of above Pre-industrial Levels and Related Global Greenhouse Gas Emission Pathways, in the Context of Strengthening the Global Response to the Threat of Climate
Change, Sustainable Development, and Efforts to Eradicate Poverty (Cambridge University Press, 2018).
4. Muratori, M. et al. EMF-33 insights on bioenergy with carbon capture and storage (BECCS). Clim. Change 163, 1621-1637 (2020).
5. Huang, X., Chang, S., Zheng, D. & Zhang, X. The role of BECCS in deep decarbonization of China’s economy: a computable general equilibrium analysis. Energy Econ. 92, 104968 (2020).
6. Jiang, K., He, C., Dai, H., Liu, J. & Xu, X. Emission scenario analysis for China under the global target. Carbon Manag. 9, 481-491 (2018).
7. Pan, X., Chen, W., Wang, L., Lin, L. & Li, N. The role of biomass in China’s long-term mitigation toward the Paris climate goals. Environ. Res. Lett. 13, 124028 (2018).
8. Weng, Y., Cai, W. & Wang, C. Evaluating the use of BECCS and afforestation under China’s carbon-neutral target for 2060. Appl. Energy 299, 117263 (2021).
9. Cai, B., Li, Q. & Zhang, X. China Carbon Dioxide Capture Utilization and Storage (CCUS) Annual Report (2021) – China CCUS Pathway Study (Chinese Academy of Environmental Planning, 2021).
10. Galik, C. S. A continuing need to revisit BECCS and its potential. Nat. Clim. Chang. 10, 2-3 (2020).
11. Babin, A., Vaneeckhaute, C. & Iliuta, M. C. Potential and challenges of bioenergy with carbon capture and storage as a carbon-negative energy source: a review. Biomass Bioenergy 146, 105968 (2021).
12. Fuss, S. et al. Negative emissions-Part 2: Costs, potentials and side effects. Environ. Res. Lett. 13, 063002 (2018).
13. Hepburn, C. et al. The technological and economic prospects for utilization and removal. Nature 575, 87-97 (2019).
14. Keith, D. W., Holmes, G., Angelo, D. S. & Heidel, K. A process for capturing from the atmosphere. Joule 2, 1573-1594 (2018).
15. Lane, J., Greig, C. & Garnett, A. Uncertain storage prospects create a conundrum for carbon capture and storage ambitions. Nat. Clim. Chang 11, 925-936 (2021).
16. Popp, A. et al. Land-use transition for bioenergy and climate stabilization: model comparison of drivers, impacts and interactions with other land use based mitigation options. Clim. Change 123, 495-509 (2014).
17. Anderson, K. & Peters, G. The trouble with negative emissions. Science 354, 182-183 (2016).
18. Woolf, D., Amonette, J. E., Street-Perrott, F. A., Lehmann, J. & Joseph, S. Sustainable biochar to mitigate global climate change. Nat. Commun. 1, 56 (2010).
19. Cernansky, R. Agriculture: state-of-the-art soil. Nature 517, 258-260 (2015).
20. Sohi, S. P. Carbon storage with benefits. Science 338, 1034-1035 (2012).
21. Wu, P. et al. A scientometric review of biochar research in the past 20 years (1998-2018). Biochar 1, 23-43 (2019).
22. Kurniawan, T. A. et al. Challenges and opportunities for biochar to promote circular economy and carbon neutrality. J. Environ. Manag. 332, 117429 (2023).
23. Peters, J. F., Iribarren, D. & Dufour, J. Biomass pyrolysis for biochar or energy applications? A life cycle assessment. Environ. Sci. Technol. 49, 5195-5202 (2015).
24. Lehmann, J. et al. Biochar in climate change mitigation. Nat. Geosci. 14, 883-892 (2021).
25. Ministry of Agriculture and Rural Affairs of the People’s Republic of China. Notice of the General Office of the Ministry of Agriculture on the Promotion and Release of the Top Ten Patterns of Straw for Agricultural Use (Ministry of Agriculture and Rural Affairs of the People’s Republic of China, 2017).
26. Meng, J. et al. Development of the straw biochar returning concept in China. Biochar 1, 139-149 (2019).
27. Roe, S. et al. Contribution of the land sector to a world. Nat. Clim. Chang 9, 817-828 (2019).
28. Werner, C., Lucht, W., Gerten, D. & Kammann, C. Potential of landneutral negative emissions through biochar sequestration. Earth’s Future 10, e2021EF002583 (2022).
29. Ippolito, J. A. et al. Feedstock choice, pyrolysis temperature and type influence biochar characteristics: a comprehensive meta-data analysis review. Biochar 2, 421-438 (2020).
30. Hassan, M. et al. Influences of feedstock sources and pyrolysis temperature on the properties of biochar and functionality as adsorbents: a meta-analysis. Sci. Total Environ. 744, 140714 (2020).
31. Xia, L. et al. Integrated biochar solutions can achieve carbon-neutral staple crop production. Nat. Food 4, 236-246 (2023).
32. Yang, Q. et al. Country-level potential of carbon sequestration and environmental benefits by utilizing crop residues for biochar implementation. Appl. Energy 282, 116275 (2021).
33. Yang, Q. et al. Prospective contributions of biomass pyrolysis to China’s 2050 carbon reduction and renewable energy goals. Nat. Commun. 12, 1698 (2021).
34. Wang, Y., Hu, Y., Zhao, X., Wang, S. & Xing, G. Comparisons of biochar properties from wood material and crop residues at different temperatures and residence times. Energy Fuels 27, 5890-5899 (2013).
35. He, X. et al. Effects of pyrolysis temperature on the physicochemical properties of gas and biochar obtained from pyrolysis of crop residues. Energy 143, 746-756 (2018).
36. Singh, H., Northup, B. K., Rice, C. W. & Prasad, P. V. V. Biochar applications influence soil physical and chemical properties, microbial diversity, and crop productivity: a meta-analysis. Biochar 4, 8 (2022).
37. Wang, Y., Villamil, M. B., Davidson, P. C. & Akdeniz, N. A quantitative understanding of the role of co-composted biochar in plant growth using meta-analysis. Sci. Total Environ. 685, 741-752 (2019).
38. Joseph, S. et al. How biochar works, and when it doesn’t: A review of mechanisms controlling soil and plant responses to biochar. GCB Bioenergy 13, 1731-1764 (2021).
39. Woolf, D. et al. Greenhouse gas inventory model for biochar additions to soil. Environ. Sci. Technol. 55, 14795-14805 (2021).
40. Nie, Y. et al. Spatial distribution of usable biomass feedstock and technical bioenergy potential in China. GCB Bioenergy 12, 54-70 (2020).
41. Xing, X. et al. Spatially explicit analysis identifies significant potential for bioenergy with carbon capture and storage in China. Nat. Commun. 12, 3159 (2021).
42. Qaseem, M. F. & Wu, A.-M. Marginal lands for bioenergy in China; an outlook in status, potential and management. GCB Bioenergy 13, 21-44 (2021).
43. Qin, Z. et al. Biomass and biofuels in China: toward bioenergy resource potentials and their impacts on the environment. Renew. Sustain. Energy Rev. 82, 2387-2400 (2018).
44. Zhang, B., Hastings, A., Clifton-Brown, J. C., Jiang, D. & Faaij, A. P. C. Modeled spatial assessment of biomass productivity and technical potential of Miscanthus giganteus, Panicum virgatum L., and Jatropha on marginal land in China. GCB Bioenergy 12, 328-345 (2020).
45. Jiang, D., Hao, M., Fu, J., Liu, K. & Yan, X. Potential bioethanol production from sweet sorghum on marginal land in China. J. Clean. Prod. 220, 225-234 (2019).
46. Nie, Y. et al. Assessment of the potential and distribution of an energy crop at resolution from 2010 to 2100 in China – The case of sweet sorghum. Appl. Energy 239, 395-407 (2019).
47. Xue, S., Lewandowski, I., Wang, X. & Yi, Z. Assessment of the production potentials of Miscanthus on marginal land in China. Renew. Sustain. Energy Rev. 54, 932-943 (2016).
48. Lu, N. et al. Biophysical and economic constraints on China’s natural climate solutions. Nat. Clim. Chang. 12, 847-853 (2022).
49. Jin, J. et al. Stand carbon storage and net primary production in China’s subtropical secondary forests are predicted to increase by 2060. Carbon Balance Manag. 17, 6 (2022).
50. Zhou, L. et al. Carbon dynamics in woody biomass of forest ecosystem in China with forest management practices under future climate change and rising concentration. Chin. Geogr. Sci. 23, 519-536 (2013).
51. Lauri, P. et al. Global woody biomass harvest volumes and forest area use under different SSP-RCP scenarios. JFE 34, 285-309 (2019).
52. Fawzy, S., Osman, A. I., Yang, H., Doran, J. & Rooney, D. W. Industrial biochar systems for atmospheric carbon removal: a review. Environ. Chem. Lett. 19, 3023-3055 (2021).
53. IPCC. 2019 Refinement to the 2006 IPCC Guidelines for National Greenhouse Gas Inventories (IPCC, 2019).
54. Woolf, D., Lehmann, J., Fisher, E. M. & Angenent, L. T. Biofuels from pyrolysis in perspective: trade-offs between energy yields and soilcarbon additions. Environ. Sci. Technol. 48, 6492-6499 (2014).
55. Heck, V., Gerten, D., Lucht, W. & Popp, A. Biomass-based negative emissions difficult to reconcile with planetary boundaries. Nat. Clim. Chang 8, 151-155 (2018).
56. Smith, P. et al. Which practices co-deliver food security, climate change mitigation and adaptation, and combat land degradation and desertification? Glob. Change Biol. 26, 1532-1575 (2020).
57. Frank, S. et al. Reducing greenhouse gas emissions in agriculture without compromising food security? Environ. Res. Lett. 12, 105004 (2017).
58. Zhang, B., Xu, J., Lin, Z., Lin, T. & Faaij, A. P. C. Spatially explicit analyses of sustainable agricultural residue potential for bioenergy in China under various soil and land management scenarios. Renew. Sustain. Energy Rev. 137, 110614 (2021).
59. International Food Policy Research Institute. Global SpatiallyDisaggregated Crop Production Statistics Data for 2010 Version 2.0. Harvard Dataverse. https://doi.org/10.7910/DVN/ PRFF8V (2020).
60. National Forestry and Grassland Administration. China Forest Resources Report 2014-2018 (China Forestry Publishing House, 2019).
61. Ministry of Agriculture and Rural Affairs of the People’s Republic of China. 2018 China Agricultural Yearbook (China Academic Journal Electronic Publishing House, 2019).
62. Fu, T., Ke, J. H., Zhou, S. & Xie, G. H. Estimation of the quantity and availability of forestry residue for bioenergy production in China. Resour. Conserv. Recycl. 162, 104993 (2020).
63. Xu, X. et al. China’s multi-period land use land cover remote sensing monitoring dataset (CNLUCC). RESDC https://doi.org/10. 12078/2018070201 (2018).
64. Running, S. & Zhao, M. MOD17A2HGF MODIS/Terra Gross Primary Productivity Gap-Filled 8-Day L4 Global 500 m SIN Grid VOO6. NASA EOSDIS Land Processes Distributed Active Archive Center. https://doi.org/10.5067/MODIS/MOD17A2HGF. 006 (2019).
65. National Forestry and Grassland Administration. 2018 Annual Report on China’s Forestry and Grassland Development (National Forestry and Grassland Administration, 2020).
66. Zhang, X., Fu, J., Lin, G., Jiang, D. & Yan, X. Switchgrass-based bioethanol productivity and potential environmental impact from marginal lands in China. Energies 10, 260 (2017).
67. Ministry of Agriculture and Rural Affairs of the People’s Republic of China. National Report on the Comprehensive Utilization of Crop Straw (Ministry of Agriculture and Rural Affairs of the People’s Republic of China, 2022).
68. Fischer, G. et al. Global Agro-ecological Zones Assessment for Agriculture (GAEZ 2008). Harmonized World Soil Database v1.2. https://www.fao.org/soils-portal/data-hub/soil-maps-and-databases/harmonized-world-soil-database-v12/en/ (2008).
69. Qian, C. et al. Prediction of higher heating values of biochar from proximate and ultimate analysis. Fuel 265, 116925 (2020).
70. Deng, X. et al. DXDX97/Biochar_code_and_data: potential of Biochar in China. Zenodo https://doi.org/10.5281/zenodo. 10369112 (2023).

شكر وتقدير

نحن نعترف بالدعم المالي من البرنامج الوطني الرئيسي للبحث والتطوير في الصين (رقم 2022YFE0209200)، ومؤسسة العلوم الطبيعية الوطنية في الصين (72140003، 71673162)، وبرنامج البحث العلمي المبادرة من جامعة تسينغhua.

مساهمات المؤلفين

تخيل X.D. و F.T. فكرة العمل. قاد F.T. هذه الدراسة. جمع X.D. البيانات، وبنى منهجية البحث، وأجرى جميع الحسابات. قدم F.T. و M.C. توجيهات مهمة حول تطوير الإطار. قدم Z.D. توجيهات مهمة حول جمع البيانات من الأدبيات والمشاريع التجريبية. قدم R.L. و P.W. الدعم والتوجيه في حساب المواد الخام للكتلة الحيوية. ناقش X.D. و F.T. و M.C. و Z.D. و B.W. النتائج وساهموا في كتابة الورقة.

المصالح المتنافسة

يعلن المؤلفون عدم وجود مصالح متنافسة.

معلومات إضافية

معلومات إضافية النسخة الإلكترونية تحتوي على
المواد التكميلية متاحة على
https://doi.org/10.1038/s41467-024-45314-y.
يجب توجيه المراسلات والطلبات للحصول على المواد إلى فيي تنغ.
معلومات مراجعة الأقران تشكر مجلة Nature Communications تونّي أغوستينو كورنياوان والمراجعين المجهولين الآخرين على مساهمتهم في مراجعة الأقران لهذا العمل. يتوفر ملف مراجعة الأقران.
معلومات إعادة الطباعة والتصاريح متاحة على
http://www.nature.com/reprints
ملاحظة الناشر: تظل شركة سبرينغر ناتشر محايدة فيما يتعلق بالمطالبات القضائية في الخرائط المنشورة والانتماءات المؤسسية.
الوصول المفتوح هذه المقالة مرخصة بموجب رخصة المشاع الإبداعي النسب 4.0 الدولية، التي تسمح بالاستخدام والمشاركة والتكيف والتوزيع وإعادة الإنتاج بأي وسيلة أو صيغة، طالما أنك تعطي الائتمان المناسب للمؤلفين الأصليين والمصدر، وتوفر رابطًا لرخصة المشاع الإبداعي، وتوضح إذا ما تم إجراء تغييرات. الصور أو المواد الأخرى من طرف ثالث في هذه المقالة مشمولة في رخصة المشاع الإبداعي الخاصة بالمقالة، ما لم يُشار إلى خلاف ذلك في سطر الائتمان للمادة. إذا لم تكن المادة مشمولة في رخصة المشاع الإبداعي الخاصة بالمقالة وكان استخدامك المقصود غير مسموح به بموجب اللوائح القانونية أو يتجاوز الاستخدام المسموح به، فستحتاج إلى الحصول على إذن مباشرة من صاحب حقوق الطبع والنشر. لعرض نسخة من هذه الرخصة، قم بزيارةhttp://creativecommons.org/رخصة/بواسطة/4.0/.
© المؤلف(ون) 2024

  1. معهد الطاقة والبيئة والاقتصاد، جامعة تسينغhua، بكين 100084، الصين. كلية الاقتصاد الزراعي والتنمية الريفية، جامعة الشعب الصينية، بكين 100872، الصين. كلية الموارد وعلوم البيئة، جامعة الزراعة الصينية، بكين 100193، الصين. معهد البيئة والتنمية المستدامة في الزراعة، الأكاديمية الصينية للعلوم الزراعية، بكين 100081، الصين. مختبر رئيسي لمراقبة ونمذجة شبكة النظام البيئي، معهد العلوم الجغرافية وبحوث الموارد الطبيعية، الأكاديمية الصينية للعلوم، بكين 100101، الصين. البريد الإلكتروني: tengfei@tsinghua.edu.cn
  2. تمثل السيناريوهات الحد الأقصى من الإمكانيات النظرية، والإمكانات التقنية المستدامة، والإمكانات التقنية الحالية، على التوالي؛ تشمل المواد الخام الحيوية بقايا الزراعة، وبقايا الغابات، وبقايا الأعشاب، والمحاصيل الطاقية المخصصة المحتملة، على التوالي.

Journal: Nature Communications, Volume: 15, Issue: 1
DOI: https://doi.org/10.1038/s41467-024-45314-y
PMID: https://pubmed.ncbi.nlm.nih.gov/38316787
Publication Date: 2024-02-05

Exploring negative emission potential of biochar to achieve carbon neutrality goal in China

Received: 11 November 2022
Accepted: 19 January 2024
Published online: 05 February 2024
(A) Check for updates

Xu Deng © , Fei Teng ( , Minpeng Chen © , Zhangliu Du , Bin Wang , Renqiang Li & Pan Wang

Abstract

Limiting global warming to within might require large-scale deployment of premature negative emission technologies with potentially adverse effects on the key sustainable development goals. Biochar has been proposed as an established technology for carbon sequestration with co-benefits in terms of soil quality and crop yield. However, the considerable uncertainties that exist in the potential, cost, and deployment strategies of biochar systems at national level prevent its deployment in China. Here, we conduct a spatially explicit analysis to investigate the negative emission potential, economics, and priority deployment sites of biochar derived from multiple feedstocks in China. Results show that biochar has negative emission potential of up to 0.92 billion tons of per year with an average net cost of US per ton of in a sustainable manner, which could satisfy the negative emission demands in most mitigation scenarios compatible with China’s target of carbon neutrality by 2060 .

Anthropogenic forcing caused warming of during 2010-2019 relative to the preindustrial period , revealing the scale of the growing challenge in meeting the 1.5 or warming climate goals specified in the Paris Agreement . To achieve the stated climate goals, mitigation strategies increasingly rely on negative emission technologies (NETs) that can remove from the atmosphere . For example, for China to reach carbon neutrality, NETs are expected to provide negative emissions of 0.01-2.91 billion tons of per year ( ) between 2050 and 2060, according to climate mitigation scenarios based on leading integrated assessment models (IAMs) . In addition to the carbon sinks of reforestation and afforestation, these scenarios suggest that such high NET demands rely mostly on bioenergy with carbon capture and storage (BECCS) or direct air carbon capture and storage (DACCS) . However, both BECCS and DACCS have financial and technological obstacles that must be overcome before they can be implemented on a broad scale . Specifically, NET costs
(levelized cost per ton of removed) can exceed US$100 per ton of for BECCS and for DACCS , while resource and geological constraints further limit their deployment . Moreover, BECCS competes with crop production for both land and water, thereby potentially compromising other sustainable development goals such as food security . Therefore, prior to addressing the major barriers confronting mentioned NETs, alternative solutions are urgently needed to form a feasible NET portfolio capable of achieving climate targets safely and sustainably .
Biochar represents a technically proven solution for realizing negative emissions, together with co-benefits in terms of soil fertility and crop productivity . Biochar has ancient origins in Amazonian farmlands and it has existed for centuries , although it has gained recognition in the field of climate change mitigation in only the previous two decades . At temperatures between 350 and , slow pyrolysis converts biomass into less-degradable biochar, together with
by-products such as syngas . Biochar can then be returned to the soil, which helps sequester carbon, avoid emission of soil greenhouse gases, and improve soil quality and crop yields . China accords particular importance to practical use of biochar and a number of pilot projects have been conducted since the early . In recent years, more than 100 companies in China have participated in the biochar business, with demonstration sites selected across the major cropproduction areas . However, biochar has largely been viewed as only a green agricultural technology that can reduce fertilizer input, build soil quality, and increase crop yields, and its role in terms of climate mitigation has largely been ignored.
Global evaluations of biochar’s potential have underscored its critical function as a negative emission technology . However, to fully harness its benefits, it is crucial to evaluate the negative emissions potential and economic viability of biochar at regional levels. A comprehensive spatial analysis integrating the latest knowledge on biochar’s role in negative emissions is in need to provide actionable insights for its deployment in the pursuit of carbon neutrality. On one hand, existing experiments tends to narrowly focus on the properties of specific biochar types or their comparative analysis without a granular estimation of their potential for negative emissions and economic impact. On the other hand, regional studies often fail to account for the diversity of biomass resources and biochar properties, leading to a flawed foundation for deployment strategies.
In China, estimates on biochar have predominantly focused on agricultural residues , neglecting significant contributions from forestry and grass residues, as well as potential energy crops. This oversight results in a chronic underestimation of the country’s total biochar potential. Furthermore, variations in the physicochemical properties of biochar derived from different biomass resources are typically overlooked, leading to inaccuracies in economic and emissions assessments. The heterogeneity of spatial factors, such as soil texture, is also commonly disregarded, resulting in biased crop yield benefit estimates and flawed economic evaluations. Recent advancements in data availability from field experiments , assessment methodologies , and spatial data resolution now permit the inclusion of biomass and spatial heterogeneity in assessments, facilitating a detailed and location-specific evaluation of biochar’s negative emissions potential and economic implications. Our study leverages the latest scientific progress to present a spatially explicit analysis of biochar potential in China. This analysis recognizes the diversity in
biomass types and spatial distribution, addressing the prevalent underestimation of biochar’s potential and providing a detailed, actionable framework for policymakers to guide biochar deployment.
In this study, we investigate the negative emission potential of biochar produced from multiple feedstocks and identify the most costeffective biomass types and deployment locations in China. First, we evaluate the magnitude of available biomass feedstocks for biochar production, including biomass residues from agriculture, forest, grassland, and potential energy crops in the marginal land (as shown in the “Methods” section), and develop three scenarios based on various assumptions of biomass availability. Then, we quantify the negative emission potential of biochar using a uniform empirical framework, which takes into account biochar properties and pyrolysis parameters. Second, incorporating both literature-based and practical survey data, we conduct a cost-benefit analysis and construct supply curves of the negative emissions for biochar derived from multiple feedstocks. Finally, we make the spatially explicit analysis of the negative emission potential and economics to prioritize biochar deployment. Results show that biochar can achieve negative emission potential of up to with an average cost of approximately in a sustainable manner. Such potential of biochar could satisfy the negative emission demands in most mitigation scenarios compatible with China’s target of carbon neutrality by 2060. Furthermore, we discover that feedstocks and subregions with high negative emission potential and high economics largely overlap, which could provide guidance for systematic deployment of biochar in China.

Results

Negative emission potential of biochar

We construct three scenarios to estimate the potential for biochar to act as a negative emission technology based on various assumptions of biomass availability (refer to the “Methods” section and Table 1). The first scenario, designated as the ‘Maximum Theoretical Potential’, entails the exploitation of marginal lands for energy crop cultivation and full utilization of available biomass for biochar production, serving as a benchmark compared with other studies investigating biomass potential in China. The ‘Current Technical Potential’ scenario, in contrast, limits biomass access to feedstocks harvestable through current technologies and practices without competing with current usages such as livestock feed and rural energy consumption. Lastly, the ‘Sustainable Technical Potential’ scenario foresees the cultivation of
Table 1 | Potentials of available biomass feedstocks under various scenarios
Scenarios Maximum theoretical potential Sustainable technical potential Current technical potential
Description Maximum amount of available biomass feedstocks Theoretical potential minus use for livestock, etc., while maintaining ecology Available biomass feedstocks limited by current technology and practice
Agricultural residues
100% of 16 types of crop residues 95% of crop residues those are not used as feed, substrate and raw material 88% of residues those are not used as feed, substrate and raw material
Forestry residues
100% of 10 types of forestry residues 80% of 10 types of forestry residues 28% of 10 types of forestry residues
Grass residues
100% of hay production in natural grasslands Hay production in natural grasslands not used as feed Not available under current technology
Energy crops
Maximum production potential of dedicated energy crops;
Marginal land refers to shrub land, the intertidal zone, bottomland, and unused land
Limited production potential of dedicated energy crops;
Marginal land refers to unused land and shrub land
Not available under current technology
Total biomass feedstocks
Fig. 1 | Available biomass feedstocks and negative emission potential of biochar in China. a Potentials of available biomass feedstocks under various scenarios, namely, maximum theoretical potential, sustainable technical potential, and current technical potential. These feedstocks include agricultural residues, forestry residues, grass residues, and potential dedicated energy crops. Negative emission
potential of biochar produced from various types of feedstocks. Note that ‘other agricultural residues’ refers to the residues of 13 other types of crops excluding rice, wheat, and maize. c Comparison between negative emission demands in mitigation pathways from previous studies, and the negative emission potential of biochar estimated in this study. Source data are provided as a Source data file.
energy crops on marginal lands, a more efficient residue harvesting rate brought about by technological and policy progress, while maintaining current biomass use patterns. Therefore, the ‘Current Technical’ and ‘Sustainable Technical’ scenarios present near-term and sustainable upper limits of biochar’s negative emission potential without compromising food security or habitats. However, it’s crucial to note that both scenarios necessitate progressive policy action to enhance biomass availability beyond current practices. The range of negative emission potentials reported in this paper pertains solely to the scenarios considered and does not reflect constraints imposed by real-world policies.
Our results indicate that the maximum theoretical potential of biomass feedstocks in China could reach as high as (Fig. 1a). Agricultural residues, predominantly composed of maize straw and cob, rice straw and hull, and wheat straw, contribute or of the total feedstocks (Supplementary Fig. 9). In addition, of the
total feedstocks, equivalent to , originate from dedicated energy crops such as miscanthus and sweet sorghum grown in marginal lands. Forestry and grassland contribute equally to the total residues, each offering . Compared to existing studies , our estimation on the maximum theoretical potential of available feedstocks is conservative, because we consider only residues in agriculture and forest biomass, grass in grassland excluding nature reserves, and potential energy crops limited by marginal lands and climatic conditions. Nonetheless, the abundance of biomass feedstocks provides great confidence for biochar preparation.
Considering the competition for biomass from current uses, such as livestock feed, along with ecological constraints, the total available biomass feedstocks under the ‘Sustainable Technical Potential’ scenario are diminished to . Specifically, upon factoring in the harvesting rate and subtracting feedstocks utilized for livestock, rural energy consumption, and raw materials, the residue amounts available
from agriculture and forestry for biochar production are calculated at and , respectively (refer to Supplementary Note 1). Grass residues, extensively used as livestock feed (see the “Methods” section), exhibit a notable reduction in availability. Our results demonstrate that the remaining grass residues have declined to , representing only of the maximum theoretical potential. Furthermore, to avoid ecological harm, this study assumes that dedicated energy crop cultivation is prohibited in intertidal zones, bottomlands, and certain government-designated shrublands. Consequently, the ensuing area for energy crop cultivation is , yielding . These figures align with existing estimates, which range from for area and 0.01 to over for production. Finally, under the ‘Current Technical Potential’ scenario, the available biomass feedstocks amount to , comprised of from agricultural biomass and from forestry residues.
After pyrolysis, a portion of carbon from the biomass will be sequestered within the biochar and preserved for hundreds of years (Supplementary Note 3). The potential for negative emissions could reach under the maximum theoretical scenario. This capacity nearly fulfils the negative emission requirements across all deep decarbonization pathways in line with the target (see Fig. 1b, c). Under the current technical scenario, the negative emission potential amounts to , thereby presenting significant near-term mitigation opportunities. The potential under sustainable technical scenario, meanwhile, could fulfill a negative emission demand of . Given that the median projection for negative emission demands in China is in 2050 or 2060 (see Fig. 1c), combined with the carbon sink in managed forests being , biochar stands to play a significant role in achieving negative emissions in accordance with the target and carbon neutrality, without deploying premature NETs such as BECCS and DACCS.
Beyond providing negative emissions through carbon sequestration, biochar application has greater impact on the reduction in total emissions, e.g., by offsetting fossil carbon emissions through use of syngas, as well as avoiding soil greenhouse gas emissions (Supplementary Note 6). Our study suggests that the total avoidance part is approximately 1.5 times greater than the removal part (Supplementary Fig. 12), which indicates that biochar could play a greater role in climate mitigation. We also conducted the uncertainty analysis to show the long-term impact of climate change on the estimation of biochar potential. Without additional consideration for land use pattern, the Monte Carlo analysis suggests a slight growth of the negative emission potential of biochar under all scenarios. This growth is primarily attributable to the rise in forestry residues, which are affected by climate change expected in the second half of the 21st century (Supplementary Table 13). Socio-economic factors also influence future crop production and, consequently, the availability of crop residues, showing significant variations (Supplementary Note 7).

Economics of negative emissions from biochar

Then, we conduct the cost-benefit analysis on the slow pyrosis (as shown in the “Methods” section) and construct the supply curves for costs and net costs (with by-products and yields increasing co-benefits as income) of negative emissions provided by biochar (Fig. 2a, b). The average net negative emission cost of biochar in China is , ranging from for biochar derived from agricultural and forestry residues to for biochar derived from energy crops and grass residues. Accordingly, the net cost of negative emissions for biochar from agricultural and forestry residues is capped at in China, while the net cost for BECCS is typically 30-400 . Although biochar from energy crops and grass residues is more expensive due to high biomass purchasing cost, they still has an economic advantage over other NETs, such as fuels (
), DACCS ( ), and microalgae ( ) that might be even more costly . Biochar production technology, particularly the technology of biomass gasification for biochar and syngas co-production that is promoted in China (Supplementary Note 2), is both commercially mature and economically competitive, as evidenced by our results, suggesting that biochar could be regarded as a relatively cost-effective NET and that it has potential to play a key role in climate mitigation strategies.
The relatively low net cost of biochar is achieved owing to the sale of by-products syngas and the co-benefits from improved yields (left half of Fig. 2c). Syngas sales dominate the total revenue and offsets to of total costs. The benefits derived from by-product sales are least for forestry and rice residues. The carbon content of forestry-residue-based biochar is high, indicating that more carbon and heat are sequestered in the biochar rather than in the by-products. The heating value of rice straw and husk is low, indicating less syngas production when compared to other feedstocks (Supplementary Note 2). In current pilot projects, syngas is used for industrial heat or electricity generation in facilities near the pilot sites (Supplementary Table 9). Therefore, to scale-up the revenues from syngas sales, the expansion and enhancement of related infrastructure, such as improved gas and power grid connectivity, are crucial. Biochar also offers additional application incentives through its ability to bolster crop yields. However, the estimated co-benefits from yield improvements in our study are minor, offsetting only 1% to 23% of costs. This may be due to the prevalent high-rate fertilizer application in Chinese fields, which makes the yield enhancement impact of biochar comparatively less significant than suggested by international studies. For instance, the latest meta-analysis indicates that biochar application only improves major crop yields in China by approximately , a figure significantly lower than the global average of . Conversely, the yield improvement effect is more noticeable for herbaceous-based biochars , such as those derived from miscanthus.
Without considering the revenue from yield improvements and by-product sales, the economic attractiveness of biochar would be greatly reduced, with negative emission costs rising to 142-273 mathrm{t}^{-1} mathrm{CO}_{2}$ (Fig. 2b). The negative emission cost of biochar derived from different feedstocks varies widely owing to differences in the cost of purchasing feedstock, the conversion rate from feedstock to biochar, and the carbon content in the biochar. First, biochar derived from energy crops is more expensive because the purchasing price of energy crops is higher than that of crop residues, since the latter does not include revenue from crop production. Second, a lower conversion rate from biomass to biochar or a lower carbon content in the biochar contributes to a higher total cost per unit of negative emission. For example, the conversion rates from energy crops to biochar are <25% (Supplementary Table 6), resulting in their high negative emission costs of over . In contrast, the conversion rates of rice, maize, and wheat residues to biochar are high under the same pyrolysis conditions, and their negative emission costs are 158, 162, and , respectively. Owing to the high carbon content of forestderived biochar (77.2%), the negative emission cost of forestry residues is , which remains the lowest in all biochar types. Given the high upfront input and uncertain returns, biochar applications could begin with the collection of agricultural and forestry residues characterized by high carbon content and conversion rates.

Spatial analysis of biochar potential

To identify areas suitable for biochar deployment, spatial analysis of negative emission potential under ‘Sustainable Technical Potential’ scenario is performed (see the “Methods” section) and the provinces are divided into six regions, as shown in Fig. 3. Because the feedstocks are not distributed uniformly throughout the regions, substantially diverse distribution patterns for negative emission potential are presented. Agricultural residues and energy crops dominate the
Fig. 2 | Economics of negative emissions from biochar. a The cost curve ( ) of the negative emissions of biochar derived from various feedstocks. Costs consist of the cost of feedstock purchasing, feedstock storage, investment, operation and maintenance, transport of biomass and biochar, and biochar application. The net
cost curve ( ) of the negative emissions of biochar derived from various feedstocks. Net cost refers to the difference between costs and incomes. Incomes consist of increased yield income and syngas income. c Components of costs and incomes for various types of biochar. Source data are provided as a Source data file.
distribution patterns because they are the most abundant biomass feedstocks. Agricultural residues are primarily distributed in Central and South China ( ), whereas energy crops are primarily distributed in North China ( ) and Southwest China ( 218 Mt ). Northwest China has a significantly lower negative emission potential than other regions because of its large proportion of grassland and absence of agricultural residues. Therefore, Central and South China has the greatest negative emission potential of , followed by Southwest China ( ) and North China ( ) (Fig. 3j). Northwest China has the lowest negative emission potential, which is .
Negative emission costs of biochar vary greatly at the regional level from 12-150 (Fig. 4a) resulting from different feedstock types, biomass abundance, and soil types and PH (see “Methods” section). First, biochar derived from forestry and agricultural residues is the cheapest option for carbon removal. Thus, the cost of biochar is lower in regions rich in agroforestry residues (Fig. 4b, c). For example, the share of agroforestry residue in total available biomass feedstocks is in East China and in Central and South China, with low
average costs of 77.8 and , respectively (Fig. 4d). Remarkably, biochar derived from agricultural sources can even result in net benefits in certain regions (Fig. 4b). This is primarily driven by the substantial yield enhancement benefits when biochar is utilized for high-yield cereals in Shandong and Henan, or other high-yield crops like sugarcane in Guangxi. While economically valuable crops such as tobacco in Yunnan contribute to reduced costs, Southwest China sees a high average cost of negative emissions from biochar ( ), as this region’s biomass resource predominantly consists of energy crops and grass. For the same reason, the average cost in North China is highest, up to . Second, the sparser the biomass resource is, the higher the negative emission cost of biochar is. This is because the same pyrolysis plants process less biomass, resulting in a higher unit investment cost (Supplementary Fig. 4). Consequently, the negative emission cost of biochar in Northwest China is high, averaging (blue line in Fig. 4d). Finally, yield enhancement co-benefits are more substantial on both coarse-textured (blue pixels, Supplementary Fig. 5) and fine-textured soils (brown pixels, Supplementary Fig. 5) compared to medium-textured soils. Furthermore,
Fig. 3 | Distribution of biomass feedstocks and negative emission potential under ‘Sustainable Technical’ scenario. a-d The distribution of agricultural residues, forestry residues, grass residues, and energy crops on a grid. China is divided into six regions: black for North China, red for Northeast China, orange for East China, yellow for Central and South China, green for Southwest China, and blue for Northwest China. Hongkong, Macau, and Taiwan were not
included in our analysis. Available biomass feedstock in the six regions. i Negative emission potential at a grid. Negative emission potential in the six regions. Source data are provided as a Source data file. The shapefile of national and provincial boundaries is quoted from the National Catalogue Service For Geographic Information, accessible at www.webmap.cn.
acidic soils (brown pixels in Supplementary Fig. 6) yield greater benefits than alkaline soils . Accordingly, regions in the south might benefit most from yield enhancement.
In summary, Central and South China and East China not only are rich in biomass resources but also have lower costs (yellow and orange lines in Fig. 4d), and could be preferentially selected as pilot areas for biochar application. Taking both cost and potential into consideration, Guangxi Province and Henan Province in Central and South China, and Shandong Province in East China could be priority regions for pilot deployment of biochar. Moreover, pilots in these regions could start with collection of agroforestry residues owing to the associated low cost of producing biochar.

Discussion

As the need for negative emissions intensifies in the pursuit of rigorous climate targets, it is imperative to investigate the alternative options to premature NETs. The case for biochar, which has over a decade of practical groundwork in China, is particularly compelling. Our study underscores not only the near-term opportunities but also the sustainable prospects of biochar as an established NET in attaining China’s carbon neutrality target. We find that biochar presents considerable negative emission potential within China, with the current technical
and sustainable technical negative emission potential being 0.43 and per annum, respectively. The average net cost of biochar production stands at around , ranging from of forestry-residue-based biochar to of grass-residue-based biochar. Our spatially explicit analysis highlights that region with high potential and low-cost negative emissions largely coincide, primarily in East China and Central and South China. Remarkably, a few areas have the potential to achieve positive returns due to high crop yields or crop value. By offering estimations of the negative emission potential and the economics of biochar, our study can provide recommendations for structured deployment and graded integration of biochar, and provide regional information for the integration of biochar technology into IAMs.
In most regions, although the negative emission cost of biochar is lower than other NETs, it remains higher than the carbon prices in the Chinese national carbon market, making it challenging to promote biochar applications in the near term through offset mechanisms. Yet, promising initiatives have been seen in the United States, Finland, and beyond, where organizations have established voluntary carbon removal platforms that incorporate biochar and have started to explore validation and monitoring methodologies . These undertakings provide valuable insights for implementing biochar
a. Net costs of negative emissions
Fig. 4 | Distribution of net cost of negative emissions under ‘Sustainable
Technical Potential’ scenario. a-c Net cost of negative emissions on a grid. Costs are calculated as the weighted average of various feedstocks within the same grid. Note that these net cost estimates differ from those in Fig. 3 owing to the application of site-specific soil conditions and biomass resource in the spatial analysis, whereas the values in Fig. 3 are based on national averages. Net cost curve of negative emissions for various regions. Source data are provided as a Source data file. The shapefile of national and provincial boundaries is quoted from the National Catalogue Service For Geographic Information, accessible at www. webmap.cn.
technology in China. Biochar was included in the 2019 Refinement to the 2006 IPCC Guidelines for National Greenhouse Gas Inventories . However, the development of transparent and locally adapted accounting methods is still in progress and requires further exploration. In order to achieve more ambitious net emission reduction targets, it is imperative to incorporate biochar into national emission trading schemes and Article 6 of the Paris Agreement. This would facilitate the more extensive adoption and effective utilization of biochar technologies for negative emissions.
While this study employs a robust framework and incorporates data from the latest experimental literature and pilot projects, the potential of biochar remains subject to considerable uncertainty. This uncertainty primarily originates from several factors: availability of biomass resources, properties of various biochar types, pyrolysis techniques and conditions, and the impact of biochar application on crop yield. To evaluate this uncertainty, we conduct a Monte Carlo analysis (refer to Supplementary Note 7). The mean estimate of biochar’s negative emission potential is under the sustainable technical scenarios, ranging from 0.68 to . The mean negative emission cost of biochar is , with a range from -13 to . Of all the parameters, those related to byproduct income and feedstock purchasing costs are the most sensitive, with the potential to alter biochar cost by approximately (Supplementary Figs. 13 and 14). Furthermore, the negative emission potential of biochar does not include emission reductions attributable to bioenergy production to offset fossil fuel emissions, and avoidance
of soil emissions of methane and nitrous oxide. Both are conceptually different from the negative emission potential but are important factors to consider when assessing the life cycle emissions of biochar. Results indicate that the mitigation potential is 1.5 times greater than the negative emission potential, which are displayed in Supplementary Note 4 and 6. In particular, the negative emission potential and mitigation potential of agricultural residues under the sustainable technical scenario amount to and , exceeding the estimates in existing studies ( , mainly due to our consideration of a wider range of crop types. The explosive effect of soil priming caused by the mineralization of native organic matter due to biochar has also received attention but remains highly debated, as discussed in Supplementary Note 4.
Our study has some limitations. First, our analysis does not encompass all types of biomass resources. We focus on specific feedstocks, leaving out others like livestock manures , which have proven potential for biochar production. Moreover, the biochar coproduction technology we employed, while economically viable, does not prioritize biochar yield maximization. As carbon budgets become more restrictive, the balance between negative emissions and energy value in biochar production warrants careful consideration. These elements might lead to a potential underestimation of negative emission capacities in our study. Second, our research does not fully account for dynamic influences such as technological advancements, economies of scale, and evolving carbon prices, which could all affect biochar’s economic viability and potentially lower its future cost. Lastly, our analysis does not fully address the environmental and socioeconomic trade-offs associated with the large-scale deployment of biochar. Increasing biomass demand could potentially result in emissions stemming from land-use changes, intensified competition with food production, and a decline in biodiversity . Simultaneously, the application of biochar can also offer additional co-benefits, such as enhanced heavy metal adsorption in soils . Despite these limitations, our key finding remains that biochar is a promising NET option for achieving carbon neutrality goals in China and should be included in the climate change mitigation toolbox. Future research could aim to explore these potential trade-offs and co-benefits, offering a more holistic understanding of biochar’s role in climate change mitigation .

Methods

Overall approach

We estimated the negative emission potential and economics of biochar in China using the following steps. First, we calculated the biomass feedstock of 16 types of agricultural residues, 10 types of forestry residues, grass residues, and potential energy crops in China based on statistical and spatial data, which were then aggerated on a grid. Then, we developed three scenarios that present maximum theoretical potential, sustainable technical potential, and current technical potential of available biomass feedstocks, respectively. Second, we estimated the negative emission potential of the biochar based on a unified empirical framework distinguishing property of biochar derived from various types of biomass feedstocks. Third, incorporating data from latest experiments in literature and pilot projects, we calculated the economics of biochar and constructed the supply curve of biochar. Finally, considering factors such as soil texture and pH level that might influence the effectiveness of biochar application, we conducted spatially explicit analysis of the negative emission potential and economics of biochar, and identified the locations suitable for biochar deployment. The framework of our approach has been shown in Supplementary Fig. 10.

Agricultural residues

With reference to Nie et al. and Zhang et al. , the ‘residue-to-product ratio’ method was adopted in our study for its accuracy in determining
the spatial distribution of crops, which incorporated the use of spatial data on crop types, the crop-specific residue-to-product ratio, and the calibration of the result based on national statistics. Here, the residues of 16 types of agricultural crops were considered. Spatial data on various types of crops were obtained from the Harvard Dataverse 2010 with resolution , which were then mapped and calibrated to the crop yields taken from the 2018 China Statistical Yearbook. Relevant formulas and data can be found in Supplementary Note 1.

Forestry residues

To clarify the available forestry residues and their spatial distribution, we started from the statistics on planted areas and production at 2018 level , and adopted method developed by Fu et al. to calculate 10 types of available forestry residues using processing and trimming coefficients of various types of forestry residues . Then, available forestry residues were assigned to grids based on land use type and gridded Net Primary Productivity (NPP) in 2018. The spatial data of wooded and other wooded land were selected from the Resource and Environment Science and Data Center (RESDC) with resolution of . NPP at the 2018 level was obtained from the Moderate-resolution Imaging Spectroradiometer (MODIS) product-MOD17A3HGF.006-with resolution of . The formula and data sources can be found in Supplementary Note 1.

Grass residues

First, we sourced statistical data on available grass residues from natural grasslands across the country from the 2018 Annual Report on China’s Forestry and Grassland Development . Then, grass residues was assigned to each grid based on NPP that was obtained from MOD17A3HGF.006 and spatial land use type data of high-, middle-, and low-coverage grassland were accessed from RESDC . Finally, feedstocks in National Nature Reserves (NNRs) were excluded. The formula used for calculation of grass residues can be seen in Supplementary Note 1.

Energy crops

Planting sites and production of energy crops were determined based on the area of marginal land, crop type, and corresponding yields. In this study, marginal lands refer to shrub land, the intertidal zone, bottomland, and unused land that includes sandy, Gobi, saline, marshland, bare land, and bare rocky land. These areas were identified on a grid of land use type with NNRs excluded. C4 plantssweet sorghum, switchgrass, and miscanthus-were chosen as potential energy crops to be planted in the future. Suitable planting sites for each energy crop were determined based on environmental conditions that included temperature, slope, and precipitation. Yields of each energy crop at the provincial level were adopted from earlier studies . Finally, maps of the marginal land and three types of energy crops with information of suitable planting sites and potential yields were overlain to determine the best technology potential for individual grids. Consequently, switchgrass was eliminated because of the relatively low yield. The relevant maps, data, and data sources can be found in Supplementary Note 1.

Scenarios development on available biomass feedstocks

In this study, we developed three scenarios based on different assumptions on biomass availability: the maximum theoretical potential, sustainable technical potential, and current technical potential. The ‘Maximum Theoretical Potential’ scenario represents the maximum amount of attainable biomass feedstocks, premised on the assumption that all biomass resources can be harvested and not used for other purposes. The ‘Current Technical Potential’ scenario signifies the feedstocks available within the constraints of current technologies and practices, with the assumption that only a fraction of
agricultural and forestry residues can be collected-specifically, 88% of agricultural residues and of forestry residues based on the current state of affairs. Contrastingly, the ‘Sustainable Technical Potential’ scenario falls between the maximum theoretical and current technical potentials. This scenario considers the maximum theoretical potential reduced by the biomass required for livestock and traditional fuels while preserving ecological balance. Here, it is assumed that 95% of agricultural residues and of forestry residues can be collected, after which essential uses are deducted . For regions where theoretical livestock carrying capacity on grasslands is lower than the actual livestock load, no available grass residues were assumed to be harnessed for biochar (refer to Supplementary Note 1 for detailed calculations). The provision for energy crops on marginal land considers unused land and shrub land. The intertidal zone and bottomland are excluded to prioritize ecological conservation. The yield of dedicated energy crops was discounted based on soil quality data from the Harmonized World Soil Database v1.2 (Supplementary Note 1).

Slow pyrolysis

We assumed the deployment of pyrolysis plants at the center of each grid, producing both biochar and syngas. To standardize the output derived from varying types of biomass, we adopted a unified accounting framework developed by Woolf et al. , with the empirical foundation rooted in the existing literature. We used the physicochemical properties of various biomass types as inputs, and sets the pyrolysis temperature at for this study. Further, we adopted the biomass gasification technology that co-produces biochar and syngas, as generalized in pilot projects and experimental literature. Biochar’s heating value was calculated based on the empirical analyses conducted by Qian et al. Syngas production was calculated by following energy balance and was subsequently used for industrial steam generation. Relevant formulas and data can be found in Supplementary Note 2.

Negative emission potential

In this study, the negative emission potential of biochar refers to the fixed in biomass from the atmosphere through photosynthesis, and then transferred and permanently preserved in biochar. The value was determined based on the quantity of available biomass feedstocks, the weight conversion rate from feedstock to biochar, the carbon content of biochar, and the permanence rate of biochar during 100 years, which were calculated based on accounting framework developed by Woolf et al. and physicochemical composition of crops planted in China. Relevant formulas and data can be found in Supplementary Notes 2 and 3.

Yield increasing

We calculated the benefits of yield improvement brought by biochar at optimal application rate by multiplying gridded crop yield , crop prices, and the rate of yield increase . Subsequently, we computed the benefits brought by biochar at actual application rate, which was determined by the crop yields and the weight conversion rate from biomass to biochar, using the ratio of the actual to the optimal application rate. For conservative estimation purposes, we set the optimal biochar application rate at . Relevant formulas and data can be found in Supplementary Note 4.

Economic analysis

Cost-benefit analysis was adopted to analyze the economics of biochar, which is one of the commonly used financial assessment method to evaluate the project value by comparing the costs and benefits. Here, the system boundaries were defined as feedstock purchasing, transportation, storage, pyrolysis, biochar transport, application, and effectiveness on crops. It was assumed that feedstock would be transported to a pyrolysis plant located in the center of each grid, while biochar would be returned to the fields in which
the feedstock was harvested. First, net present value (NPV) of 20-year project of pyrolysis plant was calculated. NPV includes the initial investment, annual cash inflows and outflows. Annual cash inflows consisted of increasing yield income and syngas income calculated based on the price and production. Annual cash outflows consisted of the cost of feedstock purchasing, feedstock storage, operation and maintenance, transport of biomass and biochar, and biochar application. Then, the cost of negative emission can be defined as the initial investment and cash outflows apportioned to each unit of captured in biochar during the whole period. The net cost of negative emission can be considered as the opposite of the NPV apportioned to each unit of . Relevant formulas and data can be found in Supplementary Note 5.

Spatially explicit analysis

We performed spatially explicit analysis of the negative emission potential and economics. In addition to clarifying the patterns of feedstock distribution, soil texture, PH and biomass abundance in different regions were considered. First, data on soil texture and PH level were adopted from the Harmonized World Soil Database v1.2 . With reference to Singh et al. and Wang et al. , biochar applied to soil with either coarse and fine texture or acidity was assumed more effective in improving crop yields, as shown in Supplementary Note 4. Furthermore, biomass abundance influenced the investment costs allocated to each pyrolyzed feedstock unit, that is, investing in pyrolysis plants in areas with low biomass was considered less costeffective, as shown in Supplementary Fig. 4.

Uncertainty analysis

Using Monte Carlo simulation, we performed uncertainty analysis on the negative emission potential and economics. Random values were generated according to the triangular distribution and normal distribution. We reported uncertainty as a range after 10,000 iterations. We also performed sensitivity analysis on key parameters that might influence the negative emission potential and economics. Further details can be found in Supplementary Note 7.

Reporting summary

Further information on research design is available in the Nature Portfolio Reporting Summary linked to this article.

Data availability

Source data have been deposited in Zenodo and GitHub [https:// github.com/DXDX97/Biochar_code_and_data]. The data that support the main findings of this study are available in Supplementary Tables 1-13. Raw data on crop spatial distribution, soil, land use type, and NPP used in this study are available in Harvard Dataverse , Harmonized World Soil Database v1.2 , RESDC , and NASA , respectively. Other data are available from the corresponding author upon reasonable request. Source data are provided with this paper.

Code availability

The code used to perform the data analysis is available on Zenodo and GitHub [https://github.com/DXDX97/Biochar_code_and_data].

References

  1. Gillett, N. P. et al. Constraining human contributions to observed warming since the pre-industrial period. Nat. Clim. Chang 11, 207-212 (2021).
  2. IPCC. Climate Change 2014: Mitigation of Climate Change (Cambridge University Press, 2014).
  3. IPCC. Global Warming of . An IPCC Special Report on the Impacts of Global Warming of above Pre-industrial Levels and Related Global Greenhouse Gas Emission Pathways, in the Context of Strengthening the Global Response to the Threat of Climate
Change, Sustainable Development, and Efforts to Eradicate Poverty (Cambridge University Press, 2018).
4. Muratori, M. et al. EMF-33 insights on bioenergy with carbon capture and storage (BECCS). Clim. Change 163, 1621-1637 (2020).
5. Huang, X., Chang, S., Zheng, D. & Zhang, X. The role of BECCS in deep decarbonization of China’s economy: a computable general equilibrium analysis. Energy Econ. 92, 104968 (2020).
6. Jiang, K., He, C., Dai, H., Liu, J. & Xu, X. Emission scenario analysis for China under the global target. Carbon Manag. 9, 481-491 (2018).
7. Pan, X., Chen, W., Wang, L., Lin, L. & Li, N. The role of biomass in China’s long-term mitigation toward the Paris climate goals. Environ. Res. Lett. 13, 124028 (2018).
8. Weng, Y., Cai, W. & Wang, C. Evaluating the use of BECCS and afforestation under China’s carbon-neutral target for 2060. Appl. Energy 299, 117263 (2021).
9. Cai, B., Li, Q. & Zhang, X. China Carbon Dioxide Capture Utilization and Storage (CCUS) Annual Report (2021) – China CCUS Pathway Study (Chinese Academy of Environmental Planning, 2021).
10. Galik, C. S. A continuing need to revisit BECCS and its potential. Nat. Clim. Chang. 10, 2-3 (2020).
11. Babin, A., Vaneeckhaute, C. & Iliuta, M. C. Potential and challenges of bioenergy with carbon capture and storage as a carbon-negative energy source: a review. Biomass Bioenergy 146, 105968 (2021).
12. Fuss, S. et al. Negative emissions-Part 2: Costs, potentials and side effects. Environ. Res. Lett. 13, 063002 (2018).
13. Hepburn, C. et al. The technological and economic prospects for utilization and removal. Nature 575, 87-97 (2019).
14. Keith, D. W., Holmes, G., Angelo, D. S. & Heidel, K. A process for capturing from the atmosphere. Joule 2, 1573-1594 (2018).
15. Lane, J., Greig, C. & Garnett, A. Uncertain storage prospects create a conundrum for carbon capture and storage ambitions. Nat. Clim. Chang 11, 925-936 (2021).
16. Popp, A. et al. Land-use transition for bioenergy and climate stabilization: model comparison of drivers, impacts and interactions with other land use based mitigation options. Clim. Change 123, 495-509 (2014).
17. Anderson, K. & Peters, G. The trouble with negative emissions. Science 354, 182-183 (2016).
18. Woolf, D., Amonette, J. E., Street-Perrott, F. A., Lehmann, J. & Joseph, S. Sustainable biochar to mitigate global climate change. Nat. Commun. 1, 56 (2010).
19. Cernansky, R. Agriculture: state-of-the-art soil. Nature 517, 258-260 (2015).
20. Sohi, S. P. Carbon storage with benefits. Science 338, 1034-1035 (2012).
21. Wu, P. et al. A scientometric review of biochar research in the past 20 years (1998-2018). Biochar 1, 23-43 (2019).
22. Kurniawan, T. A. et al. Challenges and opportunities for biochar to promote circular economy and carbon neutrality. J. Environ. Manag. 332, 117429 (2023).
23. Peters, J. F., Iribarren, D. & Dufour, J. Biomass pyrolysis for biochar or energy applications? A life cycle assessment. Environ. Sci. Technol. 49, 5195-5202 (2015).
24. Lehmann, J. et al. Biochar in climate change mitigation. Nat. Geosci. 14, 883-892 (2021).
25. Ministry of Agriculture and Rural Affairs of the People’s Republic of China. Notice of the General Office of the Ministry of Agriculture on the Promotion and Release of the Top Ten Patterns of Straw for Agricultural Use (Ministry of Agriculture and Rural Affairs of the People’s Republic of China, 2017).
26. Meng, J. et al. Development of the straw biochar returning concept in China. Biochar 1, 139-149 (2019).
27. Roe, S. et al. Contribution of the land sector to a world. Nat. Clim. Chang 9, 817-828 (2019).
28. Werner, C., Lucht, W., Gerten, D. & Kammann, C. Potential of landneutral negative emissions through biochar sequestration. Earth’s Future 10, e2021EF002583 (2022).
29. Ippolito, J. A. et al. Feedstock choice, pyrolysis temperature and type influence biochar characteristics: a comprehensive meta-data analysis review. Biochar 2, 421-438 (2020).
30. Hassan, M. et al. Influences of feedstock sources and pyrolysis temperature on the properties of biochar and functionality as adsorbents: a meta-analysis. Sci. Total Environ. 744, 140714 (2020).
31. Xia, L. et al. Integrated biochar solutions can achieve carbon-neutral staple crop production. Nat. Food 4, 236-246 (2023).
32. Yang, Q. et al. Country-level potential of carbon sequestration and environmental benefits by utilizing crop residues for biochar implementation. Appl. Energy 282, 116275 (2021).
33. Yang, Q. et al. Prospective contributions of biomass pyrolysis to China’s 2050 carbon reduction and renewable energy goals. Nat. Commun. 12, 1698 (2021).
34. Wang, Y., Hu, Y., Zhao, X., Wang, S. & Xing, G. Comparisons of biochar properties from wood material and crop residues at different temperatures and residence times. Energy Fuels 27, 5890-5899 (2013).
35. He, X. et al. Effects of pyrolysis temperature on the physicochemical properties of gas and biochar obtained from pyrolysis of crop residues. Energy 143, 746-756 (2018).
36. Singh, H., Northup, B. K., Rice, C. W. & Prasad, P. V. V. Biochar applications influence soil physical and chemical properties, microbial diversity, and crop productivity: a meta-analysis. Biochar 4, 8 (2022).
37. Wang, Y., Villamil, M. B., Davidson, P. C. & Akdeniz, N. A quantitative understanding of the role of co-composted biochar in plant growth using meta-analysis. Sci. Total Environ. 685, 741-752 (2019).
38. Joseph, S. et al. How biochar works, and when it doesn’t: A review of mechanisms controlling soil and plant responses to biochar. GCB Bioenergy 13, 1731-1764 (2021).
39. Woolf, D. et al. Greenhouse gas inventory model for biochar additions to soil. Environ. Sci. Technol. 55, 14795-14805 (2021).
40. Nie, Y. et al. Spatial distribution of usable biomass feedstock and technical bioenergy potential in China. GCB Bioenergy 12, 54-70 (2020).
41. Xing, X. et al. Spatially explicit analysis identifies significant potential for bioenergy with carbon capture and storage in China. Nat. Commun. 12, 3159 (2021).
42. Qaseem, M. F. & Wu, A.-M. Marginal lands for bioenergy in China; an outlook in status, potential and management. GCB Bioenergy 13, 21-44 (2021).
43. Qin, Z. et al. Biomass and biofuels in China: toward bioenergy resource potentials and their impacts on the environment. Renew. Sustain. Energy Rev. 82, 2387-2400 (2018).
44. Zhang, B., Hastings, A., Clifton-Brown, J. C., Jiang, D. & Faaij, A. P. C. Modeled spatial assessment of biomass productivity and technical potential of Miscanthus giganteus, Panicum virgatum L., and Jatropha on marginal land in China. GCB Bioenergy 12, 328-345 (2020).
45. Jiang, D., Hao, M., Fu, J., Liu, K. & Yan, X. Potential bioethanol production from sweet sorghum on marginal land in China. J. Clean. Prod. 220, 225-234 (2019).
46. Nie, Y. et al. Assessment of the potential and distribution of an energy crop at resolution from 2010 to 2100 in China – The case of sweet sorghum. Appl. Energy 239, 395-407 (2019).
47. Xue, S., Lewandowski, I., Wang, X. & Yi, Z. Assessment of the production potentials of Miscanthus on marginal land in China. Renew. Sustain. Energy Rev. 54, 932-943 (2016).
48. Lu, N. et al. Biophysical and economic constraints on China’s natural climate solutions. Nat. Clim. Chang. 12, 847-853 (2022).
49. Jin, J. et al. Stand carbon storage and net primary production in China’s subtropical secondary forests are predicted to increase by 2060. Carbon Balance Manag. 17, 6 (2022).
50. Zhou, L. et al. Carbon dynamics in woody biomass of forest ecosystem in China with forest management practices under future climate change and rising concentration. Chin. Geogr. Sci. 23, 519-536 (2013).
51. Lauri, P. et al. Global woody biomass harvest volumes and forest area use under different SSP-RCP scenarios. JFE 34, 285-309 (2019).
52. Fawzy, S., Osman, A. I., Yang, H., Doran, J. & Rooney, D. W. Industrial biochar systems for atmospheric carbon removal: a review. Environ. Chem. Lett. 19, 3023-3055 (2021).
53. IPCC. 2019 Refinement to the 2006 IPCC Guidelines for National Greenhouse Gas Inventories (IPCC, 2019).
54. Woolf, D., Lehmann, J., Fisher, E. M. & Angenent, L. T. Biofuels from pyrolysis in perspective: trade-offs between energy yields and soilcarbon additions. Environ. Sci. Technol. 48, 6492-6499 (2014).
55. Heck, V., Gerten, D., Lucht, W. & Popp, A. Biomass-based negative emissions difficult to reconcile with planetary boundaries. Nat. Clim. Chang 8, 151-155 (2018).
56. Smith, P. et al. Which practices co-deliver food security, climate change mitigation and adaptation, and combat land degradation and desertification? Glob. Change Biol. 26, 1532-1575 (2020).
57. Frank, S. et al. Reducing greenhouse gas emissions in agriculture without compromising food security? Environ. Res. Lett. 12, 105004 (2017).
58. Zhang, B., Xu, J., Lin, Z., Lin, T. & Faaij, A. P. C. Spatially explicit analyses of sustainable agricultural residue potential for bioenergy in China under various soil and land management scenarios. Renew. Sustain. Energy Rev. 137, 110614 (2021).
59. International Food Policy Research Institute. Global SpatiallyDisaggregated Crop Production Statistics Data for 2010 Version 2.0. Harvard Dataverse. https://doi.org/10.7910/DVN/ PRFF8V (2020).
60. National Forestry and Grassland Administration. China Forest Resources Report 2014-2018 (China Forestry Publishing House, 2019).
61. Ministry of Agriculture and Rural Affairs of the People’s Republic of China. 2018 China Agricultural Yearbook (China Academic Journal Electronic Publishing House, 2019).
62. Fu, T., Ke, J. H., Zhou, S. & Xie, G. H. Estimation of the quantity and availability of forestry residue for bioenergy production in China. Resour. Conserv. Recycl. 162, 104993 (2020).
63. Xu, X. et al. China’s multi-period land use land cover remote sensing monitoring dataset (CNLUCC). RESDC https://doi.org/10. 12078/2018070201 (2018).
64. Running, S. & Zhao, M. MOD17A2HGF MODIS/Terra Gross Primary Productivity Gap-Filled 8-Day L4 Global 500 m SIN Grid VOO6. NASA EOSDIS Land Processes Distributed Active Archive Center. https://doi.org/10.5067/MODIS/MOD17A2HGF. 006 (2019).
65. National Forestry and Grassland Administration. 2018 Annual Report on China’s Forestry and Grassland Development (National Forestry and Grassland Administration, 2020).
66. Zhang, X., Fu, J., Lin, G., Jiang, D. & Yan, X. Switchgrass-based bioethanol productivity and potential environmental impact from marginal lands in China. Energies 10, 260 (2017).
67. Ministry of Agriculture and Rural Affairs of the People’s Republic of China. National Report on the Comprehensive Utilization of Crop Straw (Ministry of Agriculture and Rural Affairs of the People’s Republic of China, 2022).
68. Fischer, G. et al. Global Agro-ecological Zones Assessment for Agriculture (GAEZ 2008). Harmonized World Soil Database v1.2. https://www.fao.org/soils-portal/data-hub/soil-maps-and-databases/harmonized-world-soil-database-v12/en/ (2008).
69. Qian, C. et al. Prediction of higher heating values of biochar from proximate and ultimate analysis. Fuel 265, 116925 (2020).
70. Deng, X. et al. DXDX97/Biochar_code_and_data: potential of Biochar in China. Zenodo https://doi.org/10.5281/zenodo. 10369112 (2023).

Acknowledgements

We acknowledge the financial support of National Key R&D Program of China (No. 2022YFE0209200), the National Natural Science Foundation of China (72140003,71673162), and Tsinghua University Initiative Scientific Research Program.

Author contributions

X.D. and F.T. conceived the idea for the work. F.T. guided this study. X.D. collected the data, built the research methodology and performed all calculations. F.T. and M.C. gave important guidance on the framework development. Z.D. gave important guidance on the data collection from literatures and pilot projects. R.L. and P.W. offered support and guidance on the calculation of biomass feedstocks. X.D., F.T., M.C., Z.D., and B.W. discussed the results and contributed to writing the paper.

Competing interests

The authors declare no competing interests.

Additional information

Supplementary information The online version contains
supplementary material available at
https://doi.org/10.1038/s41467-024-45314-y.
Correspondence and requests for materials should be addressed to Fei Teng.
Peer review information Nature Communications thanks Tonni Agustiono Kurniawan and the other anonymous reviewers for their contribution to the peer review of this work. A peer review file is available.
Reprints and permissions information is available at
http://www.nature.com/reprints
Publisher’s note Springer Nature remains neutral with regard to jurisdictional claims in published maps and institutional affiliations.
Open Access This article is licensed under a Creative Commons Attribution 4.0 International License, which permits use, sharing, adaptation, distribution and reproduction in any medium or format, as long as you give appropriate credit to the original author(s) and the source, provide a link to the Creative Commons licence, and indicate if changes were made. The images or other third party material in this article are included in the article’s Creative Commons licence, unless indicated otherwise in a credit line to the material. If material is not included in the article’s Creative Commons licence and your intended use is not permitted by statutory regulation or exceeds the permitted use, you will need to obtain permission directly from the copyright holder. To view a copy of this licence, visit http://creativecommons.org/ licenses/by/4.0/.
© The Author(s) 2024

  1. Institute of Energy, Environment and Economy, Tsinghua University, Beijing 100084, China. School of Agricultural Economics and Rural Development, Renmin University of China, Beijing 100872, China. College of Resources and Environmental Sciences, China Agricultural University, Beijing 100193, China. Institute of Environment and Sustainable Development in Agriculture, Chinese Academy of Agricultural Sciences, Beijing 100081, China. Key Laboratory of Ecosystem Network Observation and Modelling, Institute of Geographic Sciences and Natural Resources Research, Chinese Academy of Sciences, Beijing 100101, China. e-mail: tengfei@tsinghua.edu.cn
  2. The scenarios represent the maximum theoretical potential, sustainable technical potential, and current technical potential, respectively; the biomass feedstocks include agricultural residues, forestry residues, grass residues, and potential dedicated energy crops, respectively.