التحويل على نطاق واسع لـ و إلى (المراجع 1، 2) على محفزات الحديد والروثينيوم يحدث إنتاج الأسمدة من خلال عملية هابر-بوش، التي اعتُبرت أهم اختراع علمي في القرن العشرين.المكون النشط من المحفز الذي يمكّن من التحويل كان يُعتبر بشكل مختلف هو الأكسيدنيتريدالطور المعدني أو نيتريد السطح، وقد تم ربط الخطوة المحددة لمعدل التفاعل بـانفصالتفاعل النيتروجين الممتصوأيضًاإزالة الامتصاصتعكس هذه المجموعة من الآراء أن عملية هابر-بوش تعمل عند درجات حرارة وضغوط عالية، في حين أن التقنيات الحساسة للسطح التي قد تميز بين الاقتراحات الميكانيكية المختلفة تتطلب ظروف فراغ. وبالتالي، كانت الدراسات الميكانيكية محدودة منذ فترة طويلة على الحسابات النظرية.. هنا نستخدم مطياف الإلكترونات الضوئية بالأشعة السينية – القادر على كشف الحالة الكيميائية للأسطح الحفازة والذي تم تكييفه مؤخرًا للتحقيقات في ظروف التشغيلالميثانولوتخليق فيشر-تروبش-لتحديد التركيب السطحي لمحفزات الحديد والروثينيوم أثناءالإنتاج عند ضغوط تصل إلى 1 بار ودرجات حرارة تصل إلى 723 كلفن. نجد أنه، على الرغم من أن الأسطح المسطحة والمُدرّجة من الحديد والأسطح البلورية المفردة من الروثينيوم تظل جميعها معدنية، إلا أن الأخيرة تكاد تكون خالية من المواد الممتصة، في حين أن المحفزات الحديدية تحتفظ بكمية صغيرة من النيتروجين الممتص وتطور عند درجات حرارة أقل الأمينات العالية.التغطيات على الأسطح المتدرجة. تشير هذه الملاحظات إلى أن الخطوة المحددة للسرعة على Ru هي دائمًاالانفصال. على المحفزات الحديدية، على العكس من ذلك وكما تنبأت النظريةالهدرجة لذرات النيتروجين الماصة تكون أقل كفاءة إلى الحد الذي يتغير فيه الخطوة المحددة لمعدل التفاعل بعد انخفاض درجة الحرارة منالانفصال إلى هدرجة الأنواع السطحية.
الشكل 1أ يوضح كيفية قياس طيف الإلكترونات الضوئية الحساسة للسطح (XPS) أثناء العملية مع الكشف عن نواتج التفاعل خلال عملية هابر-بوش في جهاز POLARIS.XPS هي تقنية قوية للتحقيق في الحالة الكيميائية للأسطح الحفازة من خلال تحولات المستوى الأساسي التي كانت تتطلب تقليديًا ظروف فراغ، ولكن يمكن إجراء دراسات في حالة التشغيل باستخدام نظام ضخ تفاضلي.تُركب أسطح البلورات المفردة من الحديد والروثينيوم أمام مطياف الإلكترونات مع وجود فجوة منوتُغذى الغازات من خلال المخروط الأمامي للعدسة الإلكترونية، مما يخلق مفاعلًا تحفيزيًا افتراضيًا محليًا بضغط مرتفع مع تدفق غاز سريع.الضغط التشغيلي النموذجي لتخليق الأمونيا هو 50-200 بار (مرجع 18)، حيث يتم تحويل توازن الغاز بشكل كبير نحو المنتج، مما يعطي تحويلًا نهائيًا عاليًا إلى الأمونيا. ومع ذلك، خلال المرحلة الأولية من عملية هابر-بوش، عندما لم يتم إنتاج الكثير من الأمونيا بعد، تستمر التفاعل أيضًا بمعدل مرتفع عند ضغوطنا التشغيلية التي تصل إلى 1 بار (المراجع 19، 20).
تم ضبط الأشعة السينية الواردة على طاقة قدرها وزاوية السقوط تحت الانعكاس الكلي، مما يسمح بحساسية سطحية عالية على الرغم من الكشف عن الإلكترونات ذات الطاقة الحركية العالية. ستدخل الفوتوإلكترونات المنبعثة إلى المطياف من خلال فتحات في المخروط الأمامي وسيتم الكشف عنها في محلل نصف كروي. يوضح الشكل المرفق في الشكل 1a مثالاً لطيف N1s لنسبة 1:3.الغازات عند 1 بار عند 673 كلفن، تشير إلى (أزرق)، (أرجواني)، NH (أحمر)، سطح N (أخضر) ومكونات سطح النيتريد (أصفر). تم إجراء القياسات عند تدفق فوتوني لم يكن بالإمكان رؤية أي تغييرات ناتجة عن شعاع الأشعة السينية خلال عملية هابر-بوش (انظر الطرق لمزيد من التفاصيل).
لتتبع إنتاجتمت مراقبة الكتل 15 و 16 في مطياف الكتلة (انظر الطرق)، كما هو موضح في الشكل 1ب. تم تحديد التفاعلات الكيميائية النسبية الموضحة في الشكل 1ج من خلال قياس إشارة الأمونيا في مطياف الكتلة بالنسبة لإشارة جميع المكونات لحساب عدد جزيئات الأمونيا المتكونة في الثانية لكل موقع سطحي، والتي يتم بعد ذلك تطبيعها إلى
الشكل 1 | إعداد التجربة وقياسات معدل الدوران النسبي. أ، يواجه العينة مجموعة من الفتحات التي توصل غاز التفاعل بينما تجمع في الوقت نفسه المنتجات والإلكترونات المنبعثة. تدخل أشعة X بزاوية مائلة من اليسار، مما ينتج إلكترونات ضوئية. يتم فصل مزيج الغاز والإلكترونات بواسطة عدسة كهربائية وتحليله في محلل إلكتروني ومطياف الكتلة. يوضح الشكل الفرعي طيف XPS للحالة الكيميائية للنيتروجين عند 200 مللي بار فوق الـسطح معنسبة الغاز. ب، الكتلة
قراءة مطياف الكتلة للكتل 15 و 16 التي تت correspond إلىالإنتاج مع تغير نسبة الغاز من 150 ملبار نقية (المنطقة الزرقاء تظهر التدفق) إلى (المنطقة الخضراء تظهر التدفق) فوق Ru عند 673 كلفن. لاحظ أن تدفقات الغازات موضحة ككتل مملوءة مرسومة على المحور الأيسر. ج، تم حساب إشارات مطياف الكتلة المعززة كمتوسط زمني خلال فترة خليط لتقدير التفاعل الكيميائي النسبي. وحدات عشوائية. أعلى نشاط يظهره أي سطح عند أي درجة حرارة (انظر الطرق لمزيد من التفاصيل). معدل التفاعل يزداد مع زيادة درجة الحرارة ويكون أعلى للسطح المتدرج.من المسطحالسطح، بما يتماشى مع الدراسات السابقة في مفاعلات الضغط العالي. يتم رؤية أعلى معدل لـ السطح، كما هو متوقع بناءً على الدراسات متعددة البلورات التي تظهر أن الروثينيوم لديه نشاط أعلى من الحديد (المرجع 21). معدل الحد الأقصى للروثينيوم ليس عند أعلى درجة حرارة 723 كلفن، كما هو الحال مع أسطح الحديد، ولكن عند 623 كلفن، وهو أيضًا متوافق مع دراسات المفاعل الحفاز.. عند التعرض للمواد النقيةغاز عند 150 ملبار، تظهر السطحان الحديديان زيادة متأخرة ولكن سريعة في شدة N1s، مما يدل على تكوين نيتريد الكتلة (الشكل 2أ، ب). استنادًا إلى موضع طاقة الربط لقمم N1s في الطيف، فإن هذا يتوافق مع تكوين-نيتريد و-نيتريد بالإضافة إلى كمية صغيرة من ذرات النيتروجين الممتصة كيميائيًا على سطح الحديد العاري (انظر الجدول 1 في البيانات الموسعة). تكون عملية تشكيل النيتريد أسرع علىالسطح، تحديداً-نيتريد، بينما على الـالسطح، هناك كمية متساوية من النيتريدين ونمو أبطأ. سماكات طبقات النيتريد أكبر من عشر طبقات أحادية؛ التحديد الدقيق يعتمد على وقت التفاعل، حيث يستمر السطح في التطور حتى بعد ساعات من المراقبة (انظر الطرق للحصول على تفاصيل حول حسابات الطبقات الأحادية). نحن نعزو النمو الأسرع علىوجهة نظر لاحتمالية أعلى لـالانفصال على السطح المتدرجعند درجات حرارة أقل من 523 كلفن، لا يُلاحظ تكوين النيتريد. يتفاعل Ru(10113) بشكل مختلف تمامًا. تقريبًا على الفور بعدعند التعرض، تتشبع شدة N1s وتبقى ثابتة، مما يتوافق مع تغطية تبلغ 5% من طبقة أحادية، ولا يحدث تشكيل نيتريد في الكتلة عند 623 كلفن (الشكل 2c). التغطية قابلة للمقارنة مع الأعمال السابقة، التي تتنبأ بـ 17% من طبقة أحادية عند 500 كلفن وضغط 100 ملبار (المرجع 23). الكمية الصغيرة منعلى سطح Ru يشير إلى تفاعل أضعف بكثير بين N والمعادن مقارنة بـ Fe، كما هو متوقع من التنبؤات النظرية.. العنصران عند 397.4 إلكترون فولت و 397.9 إلكترون فولت، ونقوم بشكل مؤقت بتعيينهما إلى Nadsorbed على الشرفات والدرجات، على التوالي (الشكل 1 من البيانات الموسعة). من المثير للاهتمام أن يتم رؤية ميزة ضعيفة وعريضة تقريبًا عندمع طاقة ربط تتماشى مع الامتصاص (المرجع 24)؛ انظر الشكل 1 من البيانات الموسعة.
عندما يكون النقيالغاز يتم استبداله بنسبة 1:1عند 300 مللي بار، يحدث تغيير ملحوظ على سطحي الحديد خلال المسح الطيفي الأول (90 ثانية)، كما هو موضح في أسفل الشكل 2a,b. تختفي النيتريدات على الفور ولا يتبقى سوى كمية صغيرة من ذرات النيتروجين الممتصة بتغطية تبلغ 2% من طبقة أحادية علىو 5% علىيبقى. في نفس الوقت الذي يتم فيه إدخال خليط الغاز،يتم اكتشافه بواسطة مطياف الكتلة. إن الإزالة السريعة للنترات تظهر القدرة القوية على الاختزال لـ. النمو البطيء للنيتريدات ( ) مقارنة مع الانخفاض السريع ( ) يظهر الفرق في المعدلات لـ و الانفصال. كما أن تغطية ذرات النيتروجين الممتصة تنخفض بشكل كبير على سطح Ru(1013) بعد إدخال النسبة 1:1خليط عند 300 مللي بار وينخفض من 5% إلى أقل من 0.05% من طبقة أحادية كمايتم إنتاجه.
بعد ذلك، نتناول مسألة عدم تقليل الأكاسيد المحتمل على الحديد تحت ظروف التشغيل بسبب التلوثات الطفيفة من الماء أوفي الطور الغازيمن المعروف أن الحديد يتأكسد في كميات ضئيلة من الماء أوفي درجة حرارة الغرفة، ومع ذلك فإن أكسيد الحديد لا يتم اختزاله بسهولة دون 500 كلفن، ونتيجة لذلك، حتى في وجود الهيدروجين النقي، سيتأكسد الحديد بتدفقات عالية (انظر الطرق لوصف مفصل). الشكل 3 يظهر البيانات التي تم جمعها فيودرجات حرارة مختلفة. الـالقمم في الشكل 3أ من الحديد المعدني عند 706.5 إلكترون فولت و707.4 إلكترون فولت مقسومة بسبب التفاعلات التبادلية مع الإلكترونات التكافؤية المغناطيسية، وهناك قمة واسعة لأكسيد الحديد عند، كما هو موضح في المستطيل الرمادي. الـالعينة مخفضة بالكامل عندما تصل درجة الحرارة إلى 523 كلفن عند 500 مللي بار وتتطلب السطح درجة حرارة أعلى تبلغ 573 كلفن، كما هو موضح في الشكل 3ب. يحتاج Fe(210) إلى درجة حرارة أعلى بسبب الربط الأقوى للأكسجين على السطح المتدرج. يعتبر الروثينيوم معدنيًا في جميع الظروف. جميع الأسطح في حالة معدنية خلال عملية هابر-بوش، كما هو متوقع بسبب التركيز العالي للهيدروجين الممتص (الشكل 3ج). لاحظ أن هذه القياسات تم جمعها في نفس الوقت مع البيانات في الشكل 4.
الشكل 2 | تشكيل النيتريد واستنفاده. يتم عرض تشكيل النيتريد واستنفاده على سطح كل محفز كدالة للوقت. في الأعلى،يتم إدخال الغاز بضغط إجمالي قدره 150 ملبار وتبدأ عملية جمع الطيف. ثم، بعد أن يبدأ النيتريد في الاستقرار،يتم إدخال الغاز على الفور بنسبة 1:1 معبضغط إجمالي قدره 300 ملبار، مما يقلل من السطح
داخل إطار الكاشف. بجانب كل سلسلة زمنية توجد طيفيات مثاليات تم تطبيعها بالنسبة للخلفية، مع سهم رمادي يوضح الإطار الذي تمثله. أ، البيانات عند 673 كلفن على. ب، البيانات لـ 673 ك على . ج، البيانات لـ 623 ك على . بالنسبة للرو، الطيف المعروض هو مجموع السلسلة الزمنية بأكملها. لاحظ الفرق في -محور المقياس في الأشكال الطيفية.
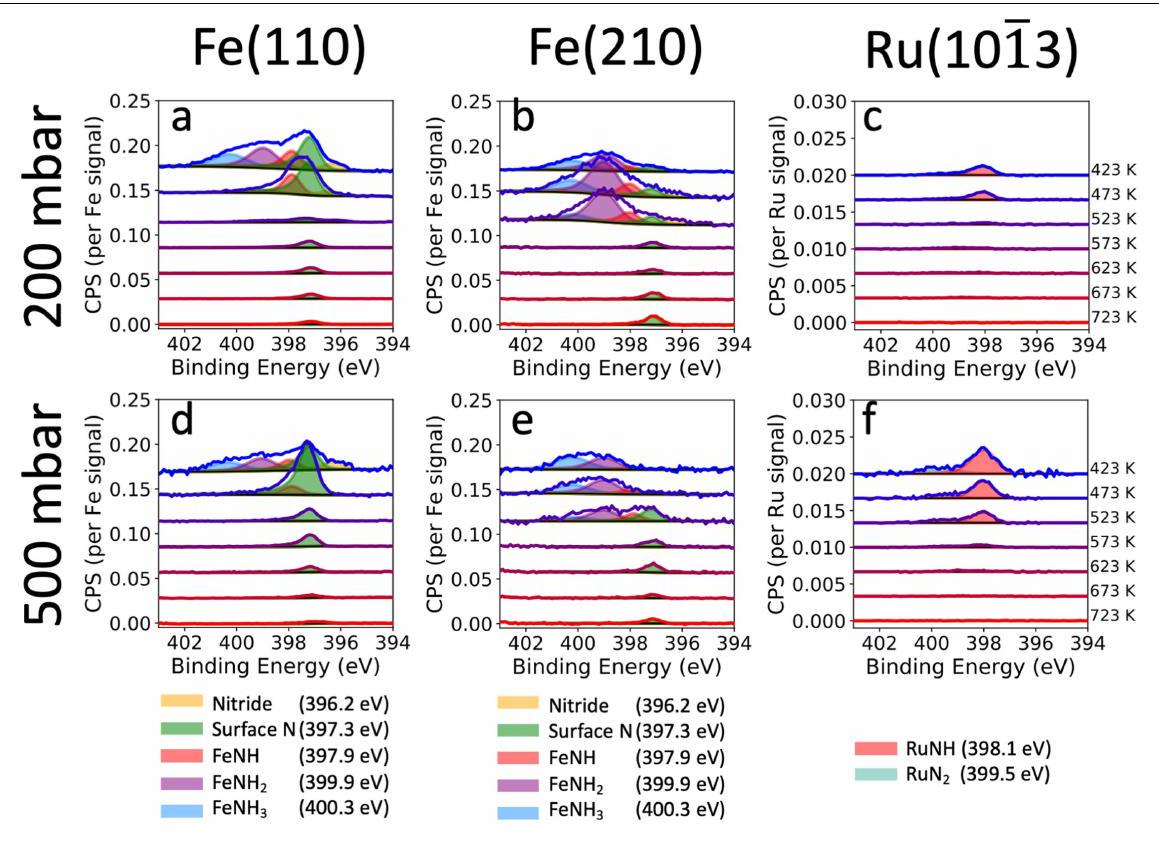
يمكن قياس الأنواع النيتروجينية الممتصة أثناء التشغيل كـ يتم إنتاجه. أولاً، مع التركيز على سطوح البلورات المفردة من الحديد (الشكل 4a، b)، نلاحظ فقط ذرات النيتروجين الممتصة على السطح عند طاقة ربط تبلغ 397.4 إلكترون فولت، وهو ما يتماشى مع التجارب السابقة في علم السطح في الفراغ بمجرد أخذ تأثير الارتداد للذرات المنبعثة في الاعتبار (انظر الجدول 1 في البيانات الموسعة). الجزيئات الممتصة لم يكن بالإمكان اكتشافه وكان سيتم ملاحظته فيأو 405.9 إلكترون فولت (الجدول البياني الممتد 1)، اعتمادًا على موقع الامتصاص ونوع الربط. تغطية النيتروجين الممتص هيعند 200 ملبار وعند 500 مللي بار علىالسطح ويزداد علىسطح إلى و على التوالي. يرتبط التغطية الأعلى على السطح المتدرج بتوافر الروابط الأقوى للمواقع غير المنسقة.ما هو الأكثر إثارة للدهشة هو أن التغطية لا تزداد عند الضغوط الأعلى؛ على العكس، فإن التغطية تنخفض قليلاً مع زيادة الضغط. عند فحص طيف N1s في الشكل 4d، المقاس عند 1 بار و 673 كلفن، فإن القمة بالكاد يمكن تمييزها عن الضوضاء، مما يشير إلى تغطية أقل. سيكون من المغري توقع زيادة في تغطية النيتروجين مع زيادة الضغط لأن معدل الاصطدامتزداد جزيئات الهيدروجين، ولكن من الواضح أن معدل امتصاص الهيدروجين يزداد أيضًا. على الرغم من أننا لا نستطيع تحديد تغطية الهيدروجين باستخدام تقنية XPS، تشير بياناتنا إلى أن قدرة الهيدروجنة على السطح تزداد مع الضغط الكلي؛ وهذا قد يفسر تفاعلًا أكثر كفاءة للذرات الممتصة من النيتروجين. عند الاستقراء إلى الكثير تحت ضغوط أعلى، نتوقع أن تكون سطح الحديد معدنًا شبه نقي في ظل ظروف واقعية. الحقيقة أنه لا توجد أمينات ( ) أو يتم ملاحظتها عند درجة حرارة التفاعل 673 كلفن مما يشير إلى أن الخطوة المحددة لمعدل التفاعل بعدالانفصال هو هدرجة النيتروجين الممتص، ومعدلات خطوات الهدرجة الأخرى لـ NH وبالإضافة إلىالامتزاز أسرع بكثير. عند درجات الحرارة العالية، تكون سطح الروديوم (الشكل 4 ج) قد امتصت النيتروجين عند 397.4 إلكترون فولت وتكون تغطية الممتزات شبه معدومة، معطبقة أحادية من كل من NH والأنواع، مستقلة عن الضغط ضمن حد الضوضاء. هنا تكون السطح نظيفًا تقريبًا من أي نوع في ظروف معدل التفاعل العالي.
عند 523 كلفن، حيث تسير التفاعل ببطء شديد، يتغير عدد المواد الممتصة. هناك زيادة طفيفة في النيتروجين الممتص علىعند 500 مللي بار إلىلطبقة أحادية (الشكل 4د). تظهر سطح Fe(210) اختلافات كبيرة مقارنةً بطيف درجات الحرارة الأعلى (الشكل 4هـ). تظهر قمم إضافية عندوتم تشكيل 400.2 إلكترون فولت، مما يتوافق مع و كما تحدده دراسات الفراغ السابقة باستخدام XPSوحُسِبَت مواقع الذروة النسبية (البيانات الموسعة الجدول 1). لاحظ أن الذروة عند 399 إلكترون فولت ليست مرتبطة بالامتصاص.لأن دراسات XPS خارج الموقع لاحظت الذروة عندما تم تبريد محفز الحديد إلى درجة حرارة الغرفة في خليط التفاعل وانتقل إلى فراغ، حيث جميع الجزيئاتسوف يتم إزالة. نحن نلاحظ تغطية نسبية عالية من (24.8%)، ممتص ،
الشكل 3| الأكاسيد والمعادن. بسبب التلوثات الطفيفة في الغازات، يمكن أن تتشكل الأكاسيد على الأسطح. أ، حالتان تتشكل فيهما أكسيد سميك عند درجات حرارة منخفضة وضغط 500 ملبار في نسبة 1:3خليط الغاز، لكن الأكسيد يخف ويختفي مع زيادة درجة الحرارة. المستطيل الرمادي يوضح المنطقة التي توجد فيها قمم أكسيد الحديد. ب، نسبة الأكسيد إلى المعدن كدالة للضغط ودرجة الحرارة لمحفزات الحديد.هو رمادي، بينما
ال هو أزرق. الخط المستقيم يُظهر بيانات الضغط المنخفض عند 200 مللي بار، بينما الخط المتقطع هو بيانات الضغط العالي عند 500 مللي بار؛ لم يتم أكسدة محفز الروثينيوم في أي نقطة. ج، أمثلة على طيف القمم المعدنية خلال التشكيل عند 623 كلفن، يظهر قمة معدنية فريدة لجميع المحفزات. وحدات عشوائية.
الشكل 4 | تأثيرات درجة الحرارة والضغط على المواد الممتزة. يتم عرض عدد الأنواع N الثابت على السطح لكل محفز عند 200 مللي بار و500 مللي بار عند 523 كلفن و673 كلفن فيخليط الغاز. يتم تطبيع وتصحيح كل مجموعة من الأطياف وفقًا لمقطع العرض المقابل للركيزة المعدنية.البيانات حول و عند 523 ك
و عند 200 ملبار. هناك اعتماد طفيف على الضغط، والذي – على وجه الخصوص – يقل إلى. من الواضح أن هناك ظروفًا توجد فيها النيتروجين الممتص وتُمتص الأنواع بقوة على مواقع الخطوات بسبب معدل الهدرجة المنخفض بشكل كبير. عند خفض درجة الحرارة أكثر إلى 423 كلفن، يتم امتصاص و تظهر علىالسطح. تُلاحظ هذه الاتجاهات عبر 423 إلى 623 كيلفن (الشكل البياني الإضافي 2). عند درجة حرارة 523 كلفن وضغط 500 ملبار (الشكل 4ج)، لا زلنا نرى تغطيات منخفضة جداً، على الرغم من أن تغطية النيتروجين الممتص عند الخطوات قد زادت إلىبالإضافة إلى الممتصإلىوالممتصإلىحوالي 400 إلكترون فولت. تزداد إشارة NH مع الضغط، لكن تقدير تغطية النيتروجين لهذه النتائج يكاد يكون ضمن هامش الخطأ. إذا كان هناك زيادة في التغطية مع الضغط بالنسبة للروثينيوم، فقد يشير ذلك إلى أن-تفاعل المعدن مع الروديوم أضعف منه مع الحديد، مما قد يؤدي إلى تغطيات أعلى عند الضغوط التشغيلية. الأنواع الممتصة من النيتروجين أكثر تفاعلية بكثير على الروديوم مقارنة بالحديد، مما يدعم التوقعات النظرية السابقة.. يمكننا التمييز بين الفرضيات المقترحة المختلفة وتقديم أفكار تتماشى مع البيانات حول الحالة الكيميائية للعوامل المساعدة وآلية التفاعل من حيث الخطوات المحددة للسرعة. لقد أظهرنا أن تكوين النيتريد أبطأ بكثير من اختزال النيتريد وأن حالات السطح كلها معدنية مع تغطيات منخفضة من النيتروجين الذري. لا توجد أدلة على وجود النيتروجين البيني، أو الأكسيدات، أو تغطية عالية لأي نوع من النيتروجين، خاصةً على أكثر العوامل المساعدة نشاطًا. من المثير للاهتمام مقارنة تفاعلات الهدرجة لـ CO و، والتي هي جزيئات متساوية الإلكترونات. في حالة تفاعل فيشر-تروبش على يتكون كربيد سميكبينما في عملية هابر-بوش، يتم توليد مرحلة معدنية نقية فقط على نفس السطح. من الواضح أن الفرق في كسر الروابط لـجزيء بالنسبة إلىوتلعب قوة الكربون والنيتروجين الممتصين دورًا أساسيًا.
خطوات التفاعل المختلفة فيتم اقتراح التركيب على النحو التالي :
على التوالي. د، البيانات علىعند 673 كلفن وعند 1 بار. على سبيل المثال، البيانات حول و عند 673 كلفن، على التوالي. لاحظ التغيير في المقياس بسبب بيانات الروثينيوم في و تغطية النيتروجين لأنواع النيتروجين على سطح الروثينيوم منخفضة للغاية.
حيث * تعني الأنواع السطحية وتشير إلى المواقع الفارغة المتاحة للربط.
أبسط حالة هيالسطح، الذي يمكننا من خلاله أن نشرح مباشرة أن الخطوات 3-6 سريعة للغاية دون تراكم للوسطاء، مما يشير إلى 1 و2 كخطوات محددة للسرعة. نلاحظ أن عدد الجزيئات الممتصةمنخفض للغاية عند درجات الحرارة العالية. يتم ملاحظة الحالة الجزيئية الممتصة بالفعل عند درجة حرارة التفاعل المنخفضة 523 كلفن، حيث تحدد تفككها التفاعل. نستنتج أن الخطوة المحددة لمعدلالإنتاج هو تفكك المادة الممتصةمتماشياً تماماً مع التقديرات النظريةحتى عند درجات الحرارة المنخفضة، تكون السطح خالية في الغالب من المواد الممتصة، مع وجود القليل من المواد الممتصة.رُؤي، بسبب الترابط القوي مع مواقع الخطوات مقارنةً بذرات الشرفةعلى الرغم من أننا لم نلاحظ اعتماد الضغط بشكل حاسم في مجموعة النيتروجين الممتص، فمن المحتمل أن تصبح مواقع الخطوات أكثر اكتظاظًا ولكن من المتوقع أن تظل دون طبقة أحادية.
في الحديد، من المعروف جيدًا أن الخطوات المحددة بمعدل التفاعل هي الانفصال الجزيئي.، مدعومًا بالارتباط بين معدل الإنتاج ومعامل الالتصاق الانفصالي لأسطح البلورات المفردة المختلفة. ومع ذلك، تظهر النتائج هنا أنه، في جميع درجات الحرارة، عامل حوالي 100 مرة أعلى يتم ملاحظة عدد الجزيئات الممتصة بالمقارنة مع سطح الروثينيوم المتدرج، ولا يمكننا بعد الآن الافتراض أن التفاعل يسير بمعدل مرتفع بعد خطوات الانفصال الجزيئي. علاوة على ذلك، لا توجد علامات على الامتصاص الجزيئي.حتى عند أدنى درجات الحرارة، تشير إلى معدل أعلى بكثير من الخطوة 1ب. فوق 573 كلفن، نلاحظ أن النيتروجين الممتص أكثر تواجدًا على البلورة المتدرجة، مما يشير إلى أن خطوة الهدرجة 3 تتحكم أيضًا جزئيًا في المعدل..
تقل تغطية الأنواع N على أسطح الحديد مع زيادة الضغط الكلي عند ثباتنسبة، مما يعني أنخطوة الانفصال أبطأ من خطوة الهدرجةمن المرجح أن تغطية الهيدروجين الممتص تزداد مع الضغط، مما يؤدي إلى تسريع عملية الهيدروجنة. لأن تغطيةمن المتوقع أن تكون درجات حرارة التفاعل منخفضة، يمكننا أن نفترض أنه لا يوجد تثبيط لـالانفصال الناتج عن الهيدروجين الممتص.
تظهر مجموعة الوسطاء أنه مع انخفاض درجة حرارة التفاعل، يتحول الخطوة المحددة للسرعة لتصبح هدرجة N و NH و بالإضافة إلى إزالة الامتصاص (الخطوات 3-6)، مما يظهر الفروق في الروابط في مواقع الحديد ذات التنسيق العالي والمنخفض المختلفة. وهذا يتفق مع الملاحظات السابقة حول أن طاقة التنشيط للهدرجة أعلى بكثير منانفصالوالفرق في حواجز هذين الخطوتين يصبح بارزًا عند درجات الحرارة المنخفضة: على الرغم من أنمعدل التفكك عند درجات الحرارة العالية منخفض بسبب معامل الالتصاق المنخفض الذي يحد منالامتزازنرى عددًا كبيرًا من الأمينات و على الحديد عند درجات حرارة منخفضة. هذه الاتجاه، الذي لم يُلاحظ مع الروثينيوم، يشير إلى أن خطوات الهدرجة تؤثر على المعدل العام على الحديد. عند الضغوط الأعلى التي يتم فيها المزيد من يتم تحويله و إذا كانت المحتويات أعلى، فقد تصبح ردود الفعل الخلفية مهمة. في الواقع، تم التنبؤ نظريًا بأن تغطية أنواع النيتروجين قد تصبح أعلى بشكل ملحوظ بالنسبة للروثينيوم..
في الختام، نلاحظ أنه على الرغم من المخاوف بشأن الأثر البيئي لتخليق الأمونيا، فقد أثارت هذه المخاوف اهتمامًا بالبدائل ذات الضغط المنخفض، وقد تكون هذه البدائل بالفعل قابلة للتطبيق.من المتوقع أن تظل عملية هابر-بوش الطريقة الرئيسية لإنتاج الأمونيا لسنوات عديدة قادمة. قد يساعد فهم أفضل للآلية المعنية في تحسين الكفاءة بشكل أكبر، وبالتالي تقليل الأثر البيئي لهذه العملية الصناعية الهامة. نتوقع أن تسهم طريقتنا في الدراسات التشغيلية في هذا الجهد، من خلال جعل من الممكن استكشاف كيمياء السطح المرتبطة بتكوين الأمونيا في وجود المحفزات، ومن خلال جعل من الممكن، بمجرد إجراء القياسات عند ضغوط أعلى ومع مستوى أعلى منالمحتوى قابل للتطبيق، لاستكشاف تأثير تفاعل العودة لتفكك الأمونيا.
المحتوى عبر الإنترنت
أي طرق، مراجع إضافية، ملخصات تقارير Nature Portfolio، بيانات المصدر، بيانات موسعة، معلومات تكميلية، شكر وتقدير، معلومات مراجعة الأقران؛ تفاصيل مساهمات المؤلفين والمصالح المتنافسة؛ وبيانات توفر البيانات والرموز متاحة علىhttps://doi.org/10.1038/s41586-023-06844-5.
2. إرتل، ج. الطريق الشاق إلى عملية هابر-بوش. ز. أنورغ. ألغ. كيم. 638، 487-489 (2012). 3. ميتاش، أ. وفرانكنبورغ، و. دراسات مبكرة عن المحفزات متعددة المكونات. تقدم في التحفيز 2، 81-104 (1950). 4. سميل، ف. مفجر الانفجار السكاني. الطبيعة 400، 415-415 (1999). 5. عربتشوك، و.، ياسينسكا، إ. ولوبكوفسكي، ك. خصائص سطح المحفز الحديدي لتخليق الأمونيا. رياكت. كينيت. كاتال. ليتر. 83، 385-392 (2004). 6. كانديمير، ت.، شتروسر، م. إ.، سينيشين، أ.، بيهرنز، م. وشلوجل، ر. إعادة النظر في عملية هابر-بوش: حول الهيكل الحقيقي واستقرار “حديد الأمونيا” تحت ظروف العمل. أنجيو. كيم. إنترناشونال. إيد. 52، 12723-12726 (2013). 7. ستولتز، ب. ونورسكو، ج. ك. سد الفجوة ‘الضغط’ بين فيزياء السطح في الفراغ العالي جدًا وعلوم التحفيز تحت الضغط العالي. فيز. ريف. ليتر. 55، 2502 (1985). 8. إرتل، ج.، لي، س. ب. ووايس، م. امتصاص النيتروجين على أسطح الحديد (111) و(100) المعززة بالبوتاسيوم. علوم السطح 114، 527-545 (1982). 9. سُمُرْجَاي، ج. أ. وماتيرر، ن. هياكل السطح في تخليق الأمونيا. توب. كاتال. 1، 215-231 (1994). 10. إرتل، ج. علم السطح والحفز – دراسات حول آلية تخليق الأمونيا: خطاب جائزة ب. هـ. إيميت. مراجعات الحفز. 21، 201-223 (2006). 11. سبنسر، م. س. حول الخطوة المحددة للسرعة ودور البوتاسيوم في التخليق الحفزي للأمونيا. كاتال. ليت. 13، 45-53 (1992). 12. هونكالا، ك. وآخرون. تخليق الأمونيا من حسابات المبادئ الأولى. ساينس 307، 555-558 (2005). 13. أمان، ب. وآخرون. جهاز طيف الكترونيات الأشعة السينية تحت الضغط العالي لدراسات التفاعلات الحفازة ذات الصلة بالصناعة عند ضغوط تصل إلى عدة بار. مراجعة. أدوات. 90، 103102 (2019). 14. أمان، ب. وآخرون. حالة الزنك في تخليق الميثانول علىمحفز نموذج. العلوم 376، 603-608 (2022). 15. شيبيلين، م. وآخرون. تحقيق حساس للسطح في الموقع لعدة مراحل كربونية على Fe(110) في تخليق فيشر-تروبش. ACS Catal. 12، 7609-7621 (2022). 16. ميدفورد، أ. ج. وآخرون. تقييم موثوقية معدلات تخليق الأمونيا المحسوبة. العلوم 345، 197-200 (2014). 17. سالمرون، م. وشلوجل، ر. طيف الإلكترونات الضوئية تحت الضغط المحيط: أداة جديدة لعلوم السطح وتكنولوجيا النانو. تقارير علوم السطح 63، 169-199 (2008).
18. همفريز، ج.، لان، ر. وتاو، س. التطوير والتقدم الأخير في محفزات تخليق الأمونيا لعملية هابر-بوش. أدف. إنرجي سستين. ريس. 2، 2000043 (2021).
19. إرتل، ج. وثيلي، ن. دراسات XPS مع محفزات تخليق الأمونيا. أبليد. سيرف. ساي. 3، 99-112 (1979).
20. دال، س.، لوغادوتير، أ.، جاكوبسن، ج. ج. هـ. ونورسكو، ج. ك. العوامل الإلكترونية في التحفيز: منحنى البركان وتأثير الترويج في تخليق الأمونيا التحفيزي. أبليد. كاتال. أ جن. 222، 19-29 (2001).
21. ساداتجو، ن.، جعفري، أ. وسهبدلفار، س. محفزات نانوية من الروثينيوم لتخليق الأمونيا: مراجعة. كيم. إنج. كوميوني. 202، 420-448 (2014).
22. بان، س.، لي، ي.، جيانغ، و. وليو، هـ. تأثيرات ظروف التفاعل على أداء محفز الروثينيوم ومحفز الحديد لتخليق الأمونيا. تشاين. ج. كيم. إنج. 19، 273-277 (2011).
23. دال، س. وآخرون. دور الخطوات في التفعيل على Ru(0001). فيز. ريف. ليت. 83، 1814 (1999).
24. أمباخ، إ. هياكل الأقمار الصناعية في طيف الانبعاث الضوئي من أنواع مختلفة من الممتصات. سيرف. ساي. 117، 482-502 (1982).
25. غرنزي، م. وآخرون. روابط π- على : السلف للتفكك. فيز. ريف. ليت. 53، 850 (1984).
26. كيشي، ك. وروبرتس، م. و. امتصاص النيتروجين والأمونيا بواسطة أسطح الحديد متعددة البلورات في نطاق درجات حرارة 80-290 كلفن المدروسة بواسطة طيف الإلكترون. سيرف. ساي. 62، 252-266 (1977).
27. إرتل، ج. الخطوات الأولية في التخليق التحفيزي للأمونيا. ج. فاك. ساي. تكنولوجي. أ 1، 1247-1253 (1983).
28. لوغادوتير، أ. ونورسكو، ج. ك. تخليق الأمونيا على سطح Ru(0001) المدروس بواسطة حسابات الكثافة الوظيفية. ج. كاتال. 220، 273-279 (2003).
29. فويفوديتش، أ. وآخرون. استكشاف الحدود: عملية هابر-بوش تحت ضغط منخفض ودرجة حرارة منخفضة. كيم. فيز. ليت. 598، 108-112 (2014).
ملاحظة الناشر: تظل Springer Nature محايدة فيما يتعلق بالمطالبات القضائية في الخرائط المنشورة والانتماءات المؤسسية.
تم جمع جميع بيانات XPS باستخدام أشعة X الانعكاسية الكلية وتم تطبيعها على مستويات النواة للركيزة. تمر الإلكترونات الضوئية المنبعثة والغازات إلى الطيف من خلال فتحات في المخروط الأمامي ليتم اكتشافها في محلل نصف كروي. كانت الدقة العامة في القياس 0.2 إلكترون فولت، وتم تطبيع جميع الأطياف بالنسبة إلى أو مستويات النواة ما لم يُذكر خلاف ذلك وتُعرض الأطياف في العد في الثانية (c.p.s.).
POLARIS هو مطياف إلكتروني للأشعة السينية تحت ضغط محيط يعمل مع عدة اختلافات رئيسية عن أنظمة XPS تحت ضغط محيط النموذجية. يتم الاقتراب من العينة إلى من مجموعة من الفتحات ذات القطر التقريبي التي تؤدي إلى المحلل؛ الأشعة السينية المستخدمة هي في النطاق اللطيف 4.6 كيلو فولت لجميع البيانات المجمعة. الأهم من ذلك، هو أن الغاز يتم توصيله من خلال المخروط الأمامي مباشرة إلى العينة، مما يجعل خلية ضغط افتراضية حيث يتم ضغط العينة وفتحة المحلل فقط. لتحقيق حساسية السطح، يتم استخدام أشعة X بزاوية مائلة ضمن نطاق الانعكاس الكلي الخارجي للحديد و للروثينيوم. تسمح هذه الهندسة بحساسية السطح على الرغم من الكشف عن الإلكترونات ذات الطاقة الحركية العالية؛ أعماق الاستكشاف هي و للحديد والروثينيوم، على التوالي . مطياف الإلكترون هو محلل نصف كروي HiPP-2 تم تصنيعه بواسطة Scienta Omicron؛ انظر المرجع 13 لمزيد من التفاصيل. يتم تثبيت العينات أحادية البلورة (مختبر إعداد السطح، نقاء 99.99%) في حامل عينة فولاذي ويتم تسخينها من الجانب الخلفي بواسطة سخان مقاوم. يتم قياس درجة حرارة العينة باستخدام كابل حراري من النوع C مضغوط بين العينة والسخان. يتم الحفاظ على المسافة بين العينة والفتحات ثابتة بواسطة تغذية راجعة PID بناءً على الضغط فوق العينة . تم استخدام مقياس الطيف الثنائي البلورة ASi(311)، مما أدى إلى عرض نطاق طاقة الفوتون بحوالي 130 ميلي إلكترون فولت، وفتحة دخول منحنية 0.8 مم و100 طاقة مرور تم استخدامها في محلل الإلكترون.
تظهر البيانات الموسعة الشكل 1a مثالاً لطيف N1s لغازات 1:3 عند 200 مللي بار والعينة عند 423 كلفن، مما يشير إلى ذرات النيتروجين الممتصة على السطح. تم إجراء القياسات عند تدفق فوتوني لم يكن هناك تغييرات ملحوظة ناتجة عن شعاع الأشعة السينية. تم جمع الأطياف الفردية لمدة 30 إلى 300 دقيقة دون تغييرات طيفية ملحوظة عند وجود الهيدروجين في الطور الغازي. تظهر البيانات الموسعة الشكل 3 مثالاً لفترة زمنية مدتها ساعتان فوق عند 423 كلفن و500 مللي بار في خليط غاز 1:3 . تظهر البيانات الموسعة الشكل 3a,b البيانات على مدى هذا الوقت لقطع الكتلة و18، مع وبدون معالجة. تظهر البيانات الموسعة الشكل 3c تطور أطياف XPS مع الوقت وتظهر البيانات الموسعة الشكل 3d النتائج المتوسطة الزمنية. من هذه، من الواضح أن التغيير الوحيد الملحوظ مع الوقت هو انخفاض إشارة الماء بسبب التحسن البطيء في ظروف الفراغ تحت ظروف الهيدروجين الثابتة.
معالجة بيانات XPS
تم قياس جميع الأطياف المقدمة بواسطة عدد المسحات ووقت الإقامة لكل نقطة بيانات. يتم إجراء مزيد من القياس بناءً على المقطع العرضي النسبي للمواد، كما هو مذكور في النص الرئيسي. لتناسب الأطياف، تم استخدام CasaXPS مع خلفيات خطية أو شيرلي حسب الحاجة. تم ضبط القمم باستخدام أشكال خطية معدلة من دالة فويت (LA)، مما يسمح باللامتماثل. تم ضبط اللامتماثل لكل مكون.
إعداد العينة
تم تنظيف العينة بواسطة تفريغ الأيونات باستخدام للحديد و1 كيلو فولت للروثينيوم. تم تسخين العينات إلى 900 كلفن للحديد و للروثينيوم. تم إجراء التنظيف الكيميائي حسب الحاجة عن طريق تعريض العينة إما للهيدروجين أو الأكسجين عند درجات حرارة مرتفعة لإزالة الأكسجين أو الكربون، على التوالي. كانت هناك تلوثات صغيرة من الكبريت والسيليكون، لكن التركيب الذري تم الحفاظ عليه عند أو أقل من 1%.
التغطية
لنمذجة تغطية الأسطح، تم استخدام النيتريدات وRuN كتمثيل مادي للأنواع السطحية. على الرغم من أنها ليست نموذجًا مثاليًا، فإن بيانات المرجع للنيتريدات التجارية تؤكد أن مكونات السطح متشابهة في الترابط الذري. استخدمنا الطريقة التي تم تأسيسها سابقًا وصيغة تغطية XPS النموذجية لحساب التغطيات. تم أخذ بيانات المقطع العرضي العنصري من المرجع 33.
لحساب عمق الاستكشاف، يجب دمج المسار الحر المتوسط للأشعة السينية والإلكترونات؛ يتم ذلك عن طريق حساب مجال الأشعة السينية في المادة عند زاوية معينة واستخدام المسار الحر المتوسط للإلكترون TTP2M لتحديد شدة إشارة الإلكترون كدالة للعمق داخل العينة. ثم يتم تقييم التكامل على جميع الأعماق لتحديد عمق الاستكشاف الفعال. بمجرد تحديد عمق الاستكشاف، يتم حساب التغطية على أساس نسبة شدة الركيزة إلى الأنواع السطحية موزونة بشدة المقطع العرضي والكثافات الذرية .
مطيافية الكتلة
لتحديد كمية التي تتكون بواسطة المحفز، تم توصيل مطياف الكتلة المضغوط تفاضليًا (Hiden HAL/3F RC 301 PIC system) بالمرحلة الأولى من الضخ التفاضلي لمحلل XPS. من خلال تسرب كمية صغيرة من الغاز من مرحلة الضخ إلى مطياف الكتلة، تم تحديد تركيبة الغاز فوق العينة. لتحديد تركيبة الغاز، تم مراقبة قطع الكتلة لجميع القمم ذات الصلة. كانت الشوائب في غازات و بشكل أساسي و. هذه المساهمات في تم طرح الشظايا على أساس النسبة المقاسة للغاز النقي إلى الملوث. نظرًا للتداخل الملحوظ بين الماء و أنماط التأين، و 16 تم استخدامها كعلامات لـ . يتم إجراء مزيد من التنعيم باستخدام فلتر سافيتسكي-غولاي من الدرجة الثالثة على نافذة مدتها 1 ثانية. تظهر نتيجة هذا التحليل في الشكل 1. نظرًا لأن مطياف الكتلة حساس للغاية، هناك إشارة قبل أي تجربة من الغرفة عند جميع الكتل، بما في ذلك الكتل 15 و 16، على الأرجح بسبب الهيدروكربونات. مع ظروف التدفق العالي المطلوبة لتأسيس الضغط لقياسات XPS، فإن كمية الأمونيا في تيار الغاز إلى مطياف الكتلة صغيرة وتصبح الإشارة مشوشة. لذلك، لإجراء قياس أكثر دقة لـ الإنتاج، تم إجراء تكامل زمني بين مستوى الخلفية في النقي وذاك من النقي. تم طرح الخلفية من التكامل الزمني أثناء إنتاج الأمونيا. الشكل 4a من البيانات الموسعة يظهر مثالاً على تتبع الزمن لمطياف الكتلة حيث يكون هناك إنتاج ضئيل لـ ، مما يظهر كيف أن تغيير الخلفية مع تدفق الغاز يقع ضمن ضجيج القياس وبالتالي يتطلب تكامل زمني. نظرًا للتصميم المحدد للخلايا الافتراضية ذات التدفق العالي، لا يمكن لجزيئات الغاز غير المرغوب فيها الناتجة عن تفاعلات حامل العينة أو السخان الوصول إلى منطقة سطح البلورة المفردة التي يتم فحصها من خلال الفتحة إلى مطياف الإلكترون. وبالتالي، فإن جميع ظروف القياس ثابتة. الزيادة في إنتاج الأمونيا عند درجات حرارة أعلى كما هو متوقع وفقًا للمراجع 9،21،22، مما يوفر مزيدًا من الثقة في أن الأمونيا تُنتج.
تم حساب النشاط الكيميائي النسبي (RCA) باستخدام المعادلة التالية. تم حساب متوسط الوقت لـ من كمية الإشارة من الأمونيا كما هو موضح أعلاه لكل إشارة إجمالية من مطياف الكتلة. الحجم () من الغاز هو الحجم الإجمالي للغاز المستخدم أثناء القياس، الضغط فوق العينة، درجة الحرارة للعينة، الثابت الغازي ، الوقت هو مدة الوقت التي كان من الممكن أن يتم فيها إنتاج الأمونيا، هو عدد أفوجادرو والمواقع هي عدد المواقع النشطة تحت منطقة الضغط العالي. أخيرًا، أعلى نشاط على أي سطح هو تطبيع إلى الحد الأقصى لأي سطح. يتم التطبيع لأخذ الأخطاء النظامية في الاعتبار، مثل حقيقة أن معظم حجم الغاز المستخدم لا يمر فوق العينة أو حقيقة أن ليس كل المواقع في منطقة الضغط العالي تحت المخروط الأمامي سيتم فحصها بواسطة مطياف الكتلة.
مع وجود أداة تعرضت للعديد من الغازات على مر السنين، هناك إشارات عند جميع الكتل، بما في ذلك الكتل 15 و 16، قبل إجراء أي تجربة لتخليق الأمونيا، بسبب الانفصال عن جدران الغرفة. من المحتمل أن يأتي هذا الانفصال في المرحلة الأولى من الضخ التفاضلي من الهيدروكربونات. في مطياف الكتلة، من الممكن أن تؤثر التداخلات بين القنوات أو الأخطاء الأخرى للأداة على الإشارة. هذا صحيح بشكل خاص عندما تكون الإشارة قريبة جدًا من مستوى الضجيج، كما هو الحال في العمل المقدم هنا. الشكل 3 من البيانات الموسعة يظهر الكتل 15 و 16 و 17 و 18. الكتلة 17، التي تتوافق مع الأمونيا، تتأثر بشدة بإنتاج الماء من التفاعل مع جدران الغرفة ومطياف الكتلة نفسه، مما يجعل التحليل الكمي مستحيلًا. لتقليل احتمال أن تكون إشارة الأمونيا ناتجة عن أخطاء للأداة، يتم تضمين كل من الكتلتين 16 و 15 في إشارة الأمونيا. كما تم مناقشته أعلاه، لا يتم تضمين الكتلة 17 بسبب الإشارة الكبيرة للماء. الشكل 3a و b من البيانات الموسعة يظهر تأثير كل من المعالجة وأوقات الاكتساب الطويلة. العينة هي نسبة. هنا يمكننا أن نرى أن وحدات الكتلة الذرية لكل من 15 و 16 هي باستمرار فوق إشارة الخلفية من الهيدروكربونات أو الماء. في الوقت نفسه، الكتلة 17 ليست كذلك، بسبب التداخل القوي بين OH و الكتل. لاحظ أن إشارة الخلفية التي تمت إزالتها في هذه المرحلة من المعالجة لا تأخذ في الاعتبار جميع إشارات الخلفية. كما هو موضح أعلاه، لتحديد النشاط الكيميائي النسبي، يتم أخذ إشارة الأمونيا (الكتل 15 و 16) فوق إشارة الخلفية في إما النقي أو النقي. ثم تتم مقارنة تلك الإشارة بالأشارة الإجمالية في مطياف الكتلة خلال نفس الفترة الزمنية. بهذه الطريقة، لا تزيل البيانات المرسومة جميع إشارات الخلفية، ومع ذلك، عندما تتم معالجة البيانات من أجل النشاط الكيميائي النسبي، تتم إزالة الخلفية بالكامل.
يتم تقدير خطأ النشاط الكيميائي النسبي على أساس نسبة الإشارة إلى الضجيج لخلفية إشارة الأمونيا. جزء من الحساب هو طرح الخلفية، كما هو موضح في الشكل 1b، بين الأوقات 15 و 23 دقيقة؛ يمكن أن يكون للتقلبات في الخلفية تأثير ملحوظ على حساب محتوى الأمونيا. لتحديد الخطأ المقدر، تم إدخال فترة الثقة 95% من متوسط الضجيج والانحراف المعياري على مدى الوقت المجموع كأحد مصادر الخطأ في المعادلة الخاصة بالنشاط الكيميائي النسبي. نظرًا لأن إشارة الخلفية والضجيج متشابهة لجميع التجارب، فإن الخطأ المقدر المدخل يكون أيضًا مشابهًا. يُقصد بالنشاط الكيميائي النسبي أن يكون وصفًا شبه كمي لوفرة الأمونيا، فقط كوصف مقارن لهذه الأنظمة المماثلة، ولإظهار أن الاتجاهات تتبع قياسات النشاط الأكثر مطلقة السابقة. الشكل 4a من البيانات الموسعة يظهر مثالاً عندما لا يحدث إنتاج الأمونيا عند أدنى درجة حرارة مع أقل محفز نشط، عند . هنا يمكننا أن نرى أن إنتاج الأمونيا يحدث بشكل ضئيل للغاية ومن المحتمل أن يكون هذا هو مستوى الخلفية. الشكل 4b من البيانات الموسعة، على النقيض من ذلك، يظهر نفس السطح والتجربة عند درجة حرارة أعلى تبلغ 673 كلفن ويظهر بوضوح أن إنتاج الأمونيا يزداد مع زيادة درجة الحرارة.
تأثيرات الشعاع
لتحديد تأثير شدة شعاع الأشعة السينية على الأنواع المرصودة، تم إجراء نوعين من اختبارات تلف الشعاع، التخفيف والطيف المظلم، وكلاهما تم إجراؤه عند ومزيج 3:1 من و . تم إجراء الطيف المظلم عن طريق محاذاة العينة وجمع الطيف المخفف بشدة، ثم إغلاق الضوء، وتنظيف العينة بالهيدروجين، ثم فتح الغالق والحصول على طيف جديد. أظهرت النتيجة عدم وجود تغيير بسبب مقدار الوقت الذي تعرضت فيه العينة للأشعة السينية. تم إجراء الاختبار الثاني عن طريق زيادة شدة الشعاع تدريجيًا لتحديد ما إذا كان
أي تلف للشعاع سيتراكم؛ هنا لم يُلاحظ أي تغيير في الطيف بمجرد تطبيعها إلى عامل التخفيف.
تظهر طيف النيتروجين المجمعة خارج ظروف التفاعل (أي، بدون هيدروجين)، مثل تلك المعروضة في الشكل 2، لا تظهر فقط التغيرات الكيميائية المتأصلة في التفاعل ولكن أيضًا تراكم التأثيرات الناتجة عن الشعاع. إن تراكم تشكيل النيتريد الناتج عن الشعاع أبطأ من النشاط الكيميائي ولكن لا يمكن تجنبه بالكامل. لهذا السبب، لا يتم إجراء أي محاولة لتحديد معدل تشكيل النيتريدات المختلفة. النتيجة الرئيسية للورقة هي الافتقار الواضح للنيتروجين على السطح أثناء التفاعل وبطء تشكيل النيتريد مقارنة بالتقليل السريع الناتج عن الهيدروجين. إن تشكيل النيتريد الناتج عن الشعاع يخدم فقط لزيادة تشكيل النيتروجين. لذلك، فإن تأثيرات الشعاع لا تغير أي استنتاجات حول نشاط مقارنة بـ ولكن تعزز من النتيجة.
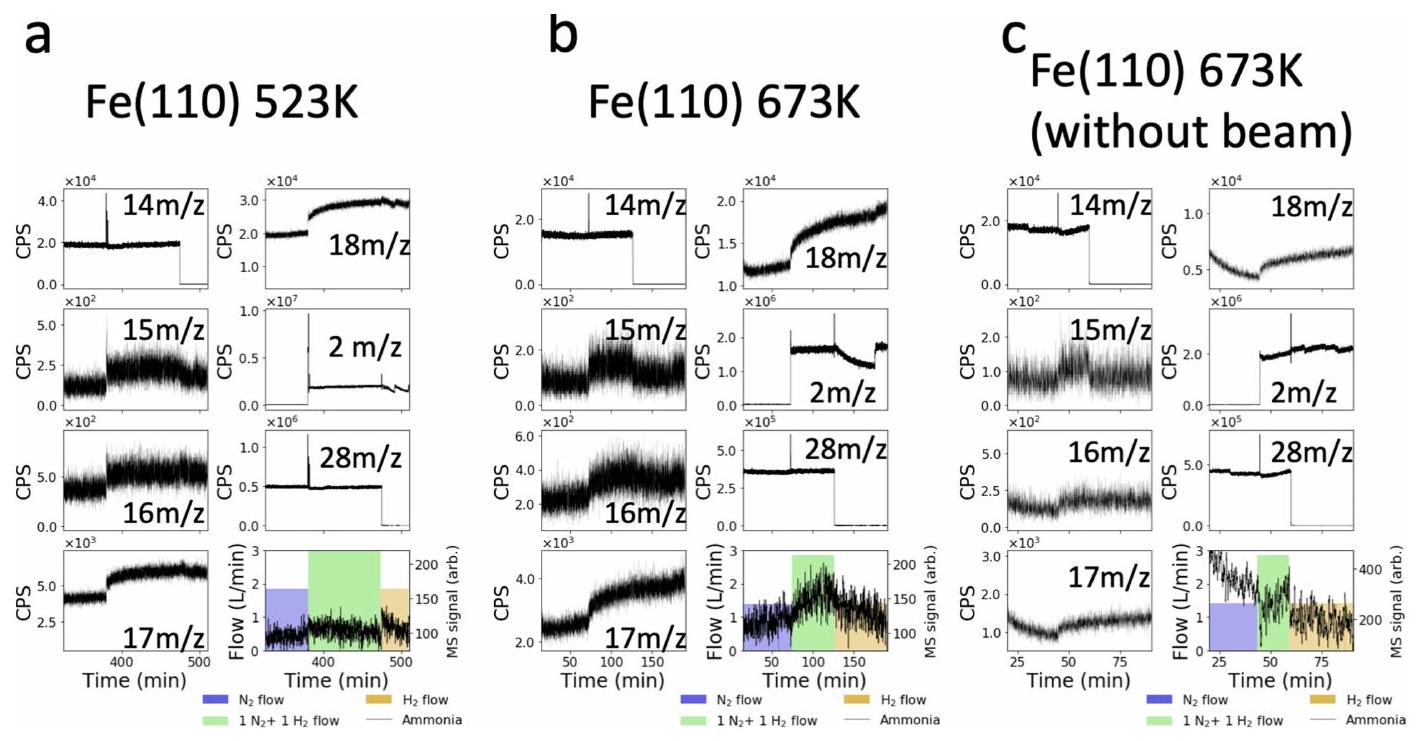
لتحديد ما إذا كان للشعاع أي تأثير على نتائج مطياف الكتلة، تم إجراء تجربتين لتبديل الغاز (حيث تعرضت العينة للغاز النقي ثم ثم الغاز النقي ) مع ضوء الأشعة السينية وبدون. الشكل 4b و c من البيانات الموسعة يظهر شظايا الكتلة لجميع الأنواع ذات الصلة لهذه التجارب. بالنسبة لهذه البيانات، كانت العينة عند 673 كلفن. تُظهر البيانات الموسعة الشكل 4 ب القياس باستخدام الشعاع، بينما تم جمع القياس في البيانات الموسعة الشكل 4 ج بدون شعاع. على الرغم من وجود بعض الاختلافات الطفيفة في إشارة الأمونيا بين مجموعتي البيانات، إلا أن أيًا من التغييرات ليست كما كان متوقعًا من تأثيرات الشعاع. من المتوقع أن تؤدي تأثيرات الشعاع في مطياف الكتلة إلى زيادة أو نقصان صارم في إشارة الأمونيا. التغيير في النشاط الكيميائي النسبي بين الاختبار الذي تم إجراؤه مع وبدون شعاع هو حوالي 2% وداخل خطأ التجربة. من هذا، من الواضح أن شعاع الأشعة السينية ليس له أي تأثير على نتائج مطياف الكتلة.
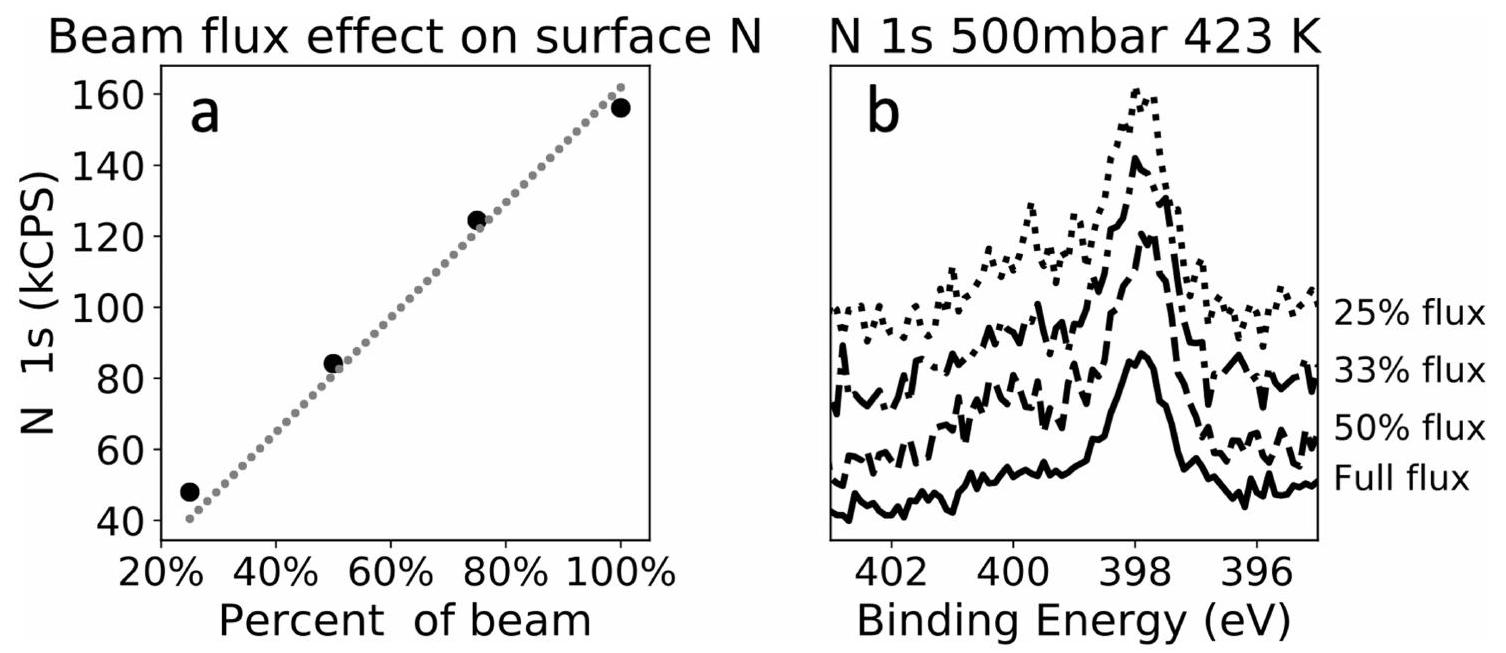
الشكل 5a من البيانات الموسعة يظهر تأثير تدفق الفوتونات على محتوى النيتروجين. لاحظ أن خط أفضل ملاءمة الموضح باللون الرمادي له تقاطع مفروض عند الصفر. الشكل 5b من البيانات الموسعة يظهر تأثير التدفق على تصنيف النيتروجين، حيث لا يظهر أي تغيير في مكونات طيف N1s. تم جمع هذه الأطياف عند ضغط 500 مللي بار في نسبة غاز 1:3 عند 423 كلفن فوق الروديوم، وهي الظروف المتوقعة أن تكون الأكثر حساسية لتلف الشعاع. تم إجراء اختبارات مكافئة لجميع المحفزات.
تتبع التلوثات
على الرغم من استخدام غاز عالي النقاء (5N للنيتروجين والهيدروجين) مع منقيات كيميائية متصلة مباشرةرقم الطراز MC45-804؛غاز، رقم الطراز MC45-904، مجموعة SAES)، لا تزال الشوائب الضئيلة موجودة؛ استنادًا إلى بيانات مطياف الكتلة، حوالي 6 جزء في المليون من الماء و3 جزء في المليون مننظرًا للتدفقات العالية المستخدمة، يمكن أن تتفاعل هذه الملوثات الصغيرة وتتراكم على السطح على الفور. علاوة على ذلك، ستتفاعل الجزيئات بسهولة مع الحديد لتكوين أكاسيد الحديد؛ وهذا ليس صحيحًا بالنسبة للروديوم. ونتيجة لذلك، سيشكل سطح الحديد عند درجات حرارة منخفضة أكسيدًا جزئيًا، ولكن مع زيادة درجة الحرارة، يتفوق الاختزال بواسطة الهيدروجين على أكسدة الملوثات، مما يؤدي إلى الحصول على سطح معدني في الظروف ذات الصلة.
طاقة ارتباط أنواع النيتروجين
الجدول البياني الموسع 1 يقدم طاقات الربط المنشورة سابقًا والمحتسبة لمختلف الأنواع الأمينية والنيتروجينية على الحديد والروثينيوم. لاحظ أنه، للمقارنة مع الدراسات عند طاقة فوتون منخفضة، يجب أخذ تأثير الارتداد في الاعتبار، حيث أن طاقة الإلكترون تسبب ارتداد النواة، مما يؤدي إلى تقليل الطاقة الحركية للإلكترونات المنبعثة..
توفر البيانات
تم توليد البيانات التجريبية في منشأة PETRA III في مركز أبحاث DESY التابع لجمعية هيلمهولتز. تتوفر مجموعات البيانات الخام من المؤلفين المعنيين عند الطلب المعقول. 30. جودوين، سي. إم. وآخرون. هيكل الحالة النشطة للبلاتين أثناء أكسدة أول أكسيد الكربون الحفزية. مجلة الفيزياء الكيميائية رسائل 12، 4461-4465 (2021). 31. جودوين، سي. إم. وآخرون. طريقة جديدة للحفاظ على موضع العينة والضغط في الأنظمة المضغوطة تفاضليًا دون حد دقة تقنيات المجهر الضوئي. تطبيقات الطيفية 75، 137-144 (2021). 32. شارد، أ. ج. أدلة عملية لقياس طيف الإلكترونات الضوئية بالأشعة السينية: قياس XPS الكمي. مجلة علوم الفراغ والتكنولوجيا A 38، 041201 (2020). 33. ترزهاسكوفسكايا، م. ب. ويارزيمسكي، ف. ج. معلمات التأين الضوئي لديراك-فوك لتطبيقات HAXPES. بيانات ذرية جداول بيانات نووية 119، 99-174 (2018). 34. ستبانوف، س. أ. خادم الأشعة السينية: مورد عبر الإنترنت لمحاكاة حيود الأشعة السينية وتشتتها. إجراءات SPIE 5536، 16-26 (2004). 35. شينوتسكا، هـ.، تانوم، س.، باول، ج. ج. & بن، د. ر. حسابات المسارات الحرة المتوسطة غير المرنة للإلكترونات. X. بيانات لـ 41 مادة صلبة عنصرية في نطاق 50 eV إلى 200 keV باستخدام خوارزمية بن الكاملة النسبية. تحليل السطح والواجهة 47، 871-888 (2015). 36. تاكاتا، ي. وآخرون. تأثير الارتداد للإلكترونات الضوئية في حافة فيرمي للمعادن البسيطة. فيزيكال ريفيو ليترز 101، 137601 (2008). 37. جيانغ، ي، تشانغ، إكس، المهيدي، أ، يانغ، م. ووانغ، ج. طريقة لتقييمنسبة الحجم في مادة FeN الكتلية بواسطة XPS. Mater. Res. Express 2، 116103 (2015). 38. مورينو-أرمنتيا، م. ج.، دياز، ج.، مارتينيز-روي، أ. وسوتو، ج. تخليق نيتريد الروثينيوم المكعب بواسطة تبخر الليزر النبضي التفاعلي. مجلة الفيزياء الكيميائية للمواد الصلبة 68، 1989-1994 (2007). 39. Gröning, P.، Nowak, S. & Schlapbach, L. تعديلات السطح على الفولاذ المقاوم للصدأ المعالج بالبلازما النيتروجينية. علوم السطح التطبيقية 64، 265-273 (1993). 40. أوغاتا، ي.، أيكا، ك. آي. وأونيشي، ت. تفاعل توازن النظائر للنيتروجين الثنائي فوق الروديوم راني: أهمية العامل الهيكلي. مجلة الحفز 112، 469-477 (1988). 41. غرنزه، م. تفاعل الهيدرازين معسطح. علوم السطح. 81، 603-625 (1979). 42. إيجاوا، سي.، نايتو، إس. وتامارو، ك. امتصاص وتحلل NO وعلى أسطح Ru(001) و Ru(1,1,10). علوم السطح 138، 279-291 (1984).
الشكر والتقدير تم تمويل هذا البحث من قبل مجلس الأبحاث السويدي (Vetenskapsrådet، VR) تحت أرقام الجوائز VR 2013-8823 و2017-00559، بالإضافة إلى مؤسسة كنوت وأليس والينبرغ تحت رقم الجائزة KAW 2016.0042. نحن نشكر مختبر الإلكترونات الألماني DESY (هامبورغ، ألمانيا)، عضو في جمعية هيلمهولتز (HGF)، على توفير المرافق التجريبية. تم إجراء أجزاء من هذا البحث في PETRA III باستخدام خط الشعاع P22. تم تخصيص وقت الشعاع للاقتراحات I-20200291 EC وI-20200292 EC وII-20211048 EC. J.K.M. ممتن للدعم المالي من VILLUM FONDEN (منحة بحثية 41388).
مساهمات المؤلفين اقترح A.N. و C.M.G. الدراسة. طور C.S. خط الشعاع. طور C.M.G. و A.N. و D.D. و P.A. إعداد التجربة. قام C.M.G. و P.L. و D.D. و M.S. و P.A. و F.G.-M. و S.K. و B.D. و J.K.M. و R.R. بإجراء التجارب. قام C.M.G. بتحليل البيانات. قام G.L.S.R. بإجراء حسابات طاقة الربط. كتب A.N. و C.M.G. و B.D. المخطوطة.
تمويل تمويل الوصول المفتوح مقدم من جامعة ستوكهولم.
المصالح المتنافسة يعلن المؤلفون عدم وجود مصالح متنافسة.
معلومات إضافية
معلومات إضافية النسخة الإلكترونية تحتوي على مواد إضافية متاحة فيhttps://doi.org/10.1038/s41586-023-06844-5. يجب توجيه المراسلات والطلبات للحصول على المواد إلى كريستوفر م. جودوين أو أندرس نيلسون. تُعرب مجلة Nature عن شكرها لجورج بوسكوبوينك والمراجعين الآخرين المجهولين على مساهمتهم في مراجعة هذا العمل. تقارير مراجعي الأقران متاحة. معلومات إعادة الطباعة والتصاريح متاحة علىhttp://www.nature.com/reprints.
مقالة
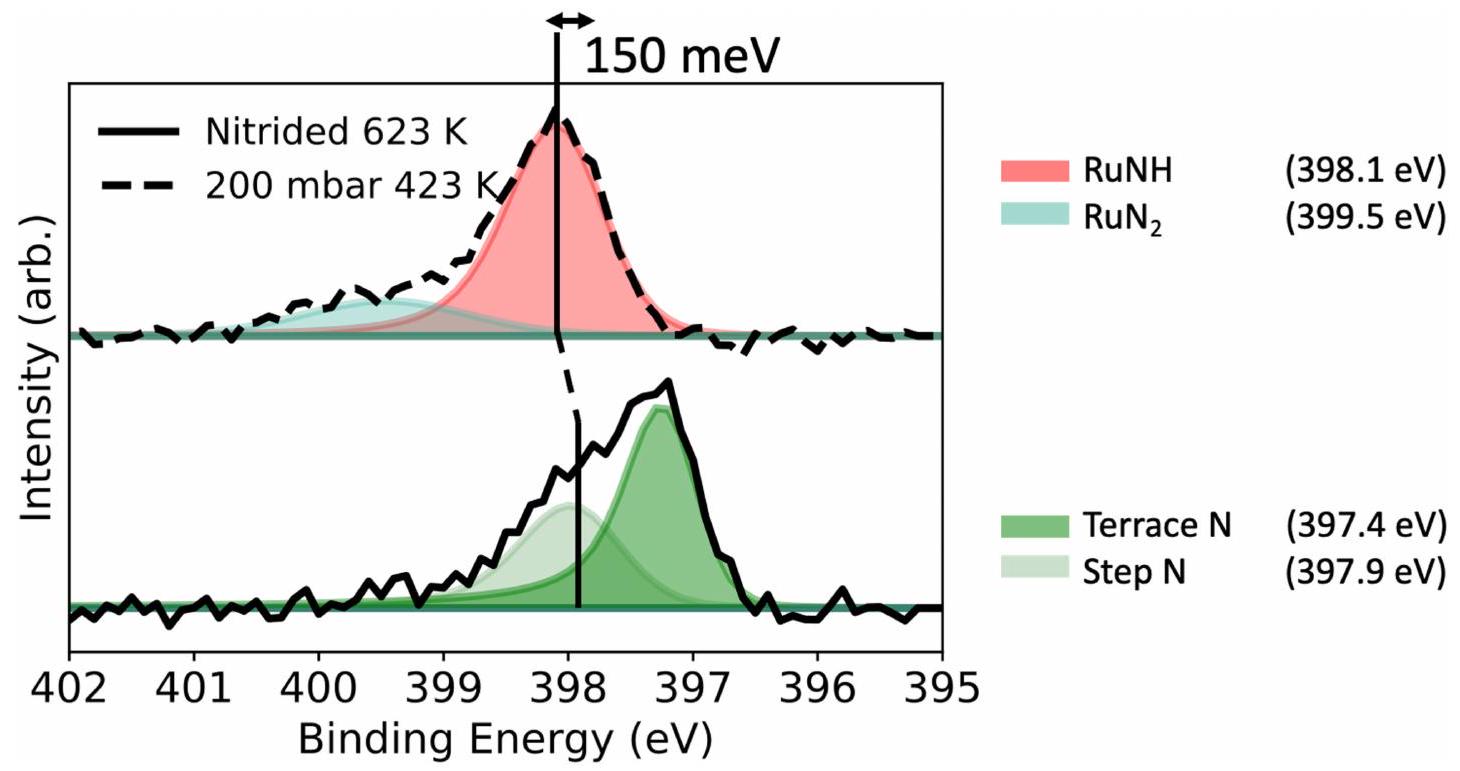
الشكل البياني الممتد 1|مقارنة بين N1s فوق الروثينيوم تحت النقاء وظروف الضغط المنخفض. طيف N 1 s على أقل من 200 ملليبار 1:3خليط الغاز عند 423 كلفن وأسمك فيلم نيتريد تم تصنيعه على نفس الشيء السطح عند 623 كلفن. الخطوط السوداء تظهر الفارق بين الأنواع NH باللون الأحمر في الطيف العلوي إلى N على التراسات واللون الأخضر الفاتح في الطيف السفلي الذي يتراكم إلى 150 مي electronvolt.
الشكل البياني الموسع 2 | بيانات N1s عند كل درجة حرارة وضغط. أ-ج،طيف النيتروجين فوق، و ، على التوالي. د-و، طيف النيتروجين فوق و ، على التوالي. تزداد درجة الحرارة من الأعلى إلى الأسفل، من 423 كلفن إلى 723 كلفن.
مقالة
الشكل البياني الممتد 3| استقرار أوقات الاكتساب الطويلة. أ، مجموعة بيانات مطياف الكتلة قبل أي معالجة تم جمعها على مدى 2 –نافذة. الاتجاه في الكتل 16 و 17 و 18 هو بسبب التحسن البطيء في ظروف الفراغ. ب، نفس البيانات كما في أ مع المعالجة كما هو موصوف في الطرق. طيف XPS المجمعة في نفس الوقت تم تطبيعها إلى إشارة الخلفية. مجموع الطيف مع القمم الملائمة الموضحة وفقًا لنظام الألوان المستخدم في جميع أنحاء الورقة.
الشكل 4 من البيانات الموسعة | تتبع الزمن لمقياس الكتلة مع وبدون إنتاج الأمونيا. أ، التجربة المعادلة لتلك المعروضة في
ضمان أن التفاعل النسبي يمثل عدم إنتاج الأمونيا. لاحظ أنه في (أ) يوجد خلل في خلفية مطياف الكتلة استجابةً لإزالةلكن من الواضح أن الكتلة 15 تتناقص في النقاءبعد التحويل. ج، التجربة المعادلة لـ ب ولكن تم تنفيذها دون أي أشعة سينية على العينة. أن الإطار الزمني أطول بكثير مما هو عليه في الشكل 1ب لضمان إحصائيات كافية،
مقالة
الشكل البياني الموسع 5| تأثير تدفق الشعاع على الأنواع السطحية. أ، اتجاه شدة N1s فوق Ru عند نسبة الغاز مع زيادة تدفق الشعاع، مع خط أفضل ملاءمة باللون الرمادي (تم ضبط التقاطع على الصفر) مما يظهر أن الشعاع لا
ليس له تأثير ملحوظ على التغطية الكلية.نفس التجربة التي تظهر أن طيف N1s تم جمعه بالتتابع من أدنى تدفق إلى تدفق كامل، مما يظهر عدم تغيير في الأنواع مع تدفق الشعاع.
الحالة الكيميائية
حديد
الحديد المحسوب (110)
روثينيوم
نيتريد
‘-نيتريد
397.9
-نيتريد
397.9
النيتروجين السطحي
397.3
397.4*
شرفة
405
399.3
NH
398.1
3998,17,24,27
399
4008,17,24,27
400.7
قسم الفيزياء، جامعة ستوكهولم، مركز ألبا نوفا الجامعي، ستوكهولم، السويد.قسم المواد والكيمياء البيئية، جامعة ستوكهولم، ستوكهولم، السويد.علوم الفوتون، سينكرون ديشيس الكترون الألماني DESY، هامبورغ، ألمانيا.معهد الكيمياء الفيزيائية، جامعة مونتان لوبيين، لوبيين، النمسا.العنوان الحالي: علوم المواد، منشأة الضوء السنكروتروني ألبا، سيردانيولا ديل فاييس، إسبانيا.العنوان الحالي: ساينتا أوميكرون AB، أوبسالا، السويد.البريد الإلكتروني: cgoodwin@cells.es; andersn@fysik.su.se
هابر، ف. و لو راسينول، ر. حول العرض الفني للأمونيا من العناصر. Z. Elektrochem. Angew. Phys. Chem. 19، 53-72 (1913).
*طاقة الربط المعايرة. استنادًا إلى الموقع المتوسط لكل من ذرتي النيتروجين في . المراجع 8،17،23-25،27،37-42.
Christopher M. Goodwin , Patrick Lömker , David Degerman , Bernadette Davies , Mikhail Shipilin , Fernando Garcia-Martinez , Sergey Koroidov , Jette Katja Mathiesen , Raffael Rameshan , Gabriel L. S. Rodrigues , Christoph Schlueter , Peter Amann & Anders Nilsson
Abstract
The large-scale conversion of and into (refs. 1,2) over Fe and Ru catalysts for fertilizer production occurs through the Haber-Bosch process, which has been considered the most important scientific invention of the twentieth century . The active component of the catalyst enabling the conversion was variously considered to be the oxide , nitride , metallic phase or surface nitride , and the rate-limiting step has been associated with dissociation , reaction of the adsorbed nitrogen and also desorption . This range of views reflects that the Haber-Bosch process operates at high temperatures and pressures, whereas surface-sensitive techniques that might differentiate between different mechanistic proposals require vacuum conditions. Mechanistic studies have accordingly long been limited to theoretical calculations . Here we use X-ray photoelectron spectroscopy-capable of revealing the chemical state of catalytic surfaces and recently adapted to operando investigations of methanol and Fischer-Tropsch synthesis -to determine the surface composition of Fe and Ru catalysts during production at pressures up to 1 bar and temperatures as high as 723 K . We find that, although flat and stepped Fe surfaces and Ru singlecrystal surfaces all remain metallic, the latter are almost adsorbate free, whereas Fe catalysts retain a small amount of adsorbed N and develop at lower temperatures high amine coverages on the stepped surfaces. These observations indicate that the rate-limiting step on Ru is always dissociation. On Fe catalysts, by contrast and as predicted by theory , hydrogenation of adsorbed N atoms is less efficient to the extent that the rate-limiting step switches following temperature lowering from dissociation to the hydrogenation of surface species.
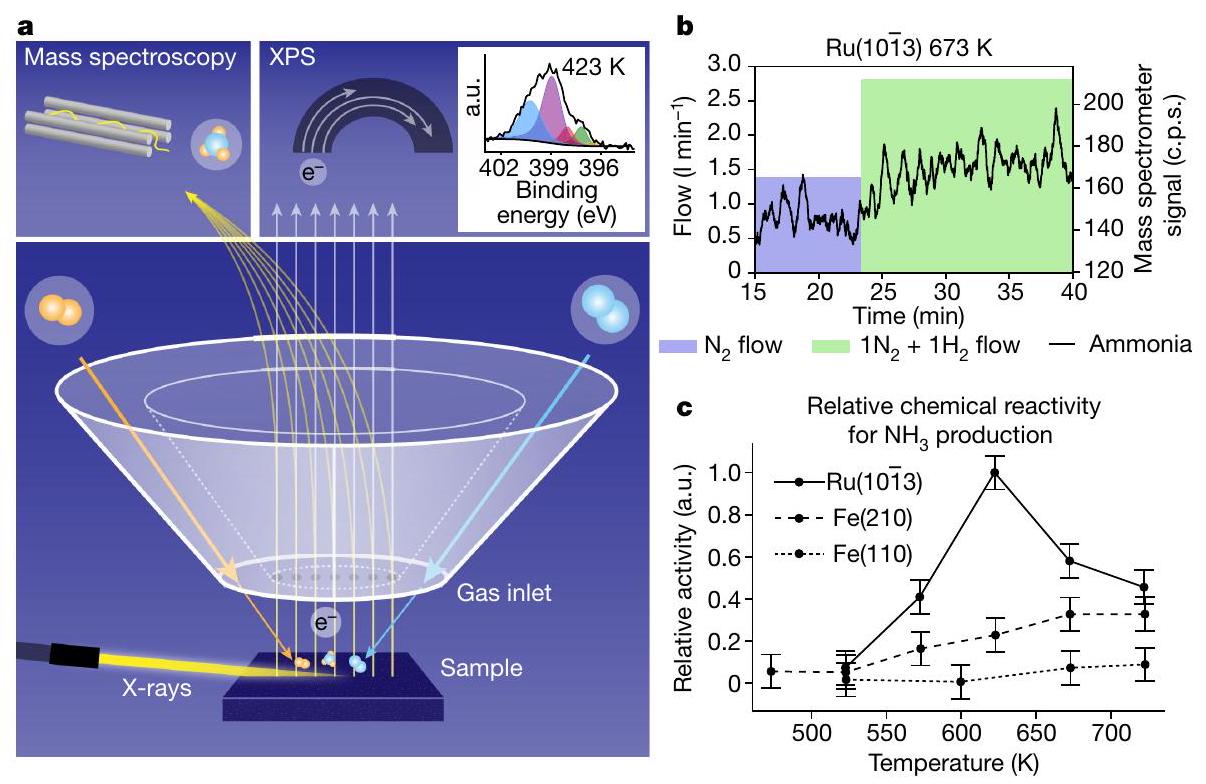
Figure 1a shows how surface-sensitive operando X-ray photoelectron spectroscopy (XPS) is measured together with reaction-product detection during the Haber-Bosch process in the POLARIS instrument . XPS is a powerful technique for investigating the chemical state of catalytic surfaces through core-level shifts that traditionally required vacuum conditions, but operando studies can be conducted using a differential pumping scheme . The Fe and Ru single-crystal surfaces are mounted in front of the electron spectrometer with a gap of and gases are fed through the front cone of the electron lens, creating a localized virtual catalytic reactor of elevated pressure with a rapid gas flow . The typical operational pressure for ammonia synthesis is 50-200 bar (ref. 18), at which the gas-phase equilibrium is strongly shifted towards the product, giving a high final conversion to ammonia. However, during the initial phase of the Haber-Bosch process, when not much ammonia has yet been produced, the reaction also proceeds with a high rate at our operational pressures of up to 1 bar (refs. 19,20).
The incoming X-rays were set to an energy of and the incidence at an angle below total reflection, allowing for high surface sensitivity despite high kinetic energy electron detection. The emitted photoelectrons will pass into the spectrometer through orifices in the front cone and be detected in a hemispherical analyser. The inset in Fig. 1a shows an example of an N1s spectrum of 1:3 gases at 1 bar at 673 K , indicating (blue), (purple), NH (red), surface N (green) and nitride surface (yellow) components. The measurements were conducted at a photon flux at which no detectable X-ray-beam-induced changes could be seen during the Haber-Bosch process (see Methods for further details).
To track the production of , masses 15 and 16 were monitored in the mass spectrometer (see Methods), as shown in Fig. 1b. The relative chemical reactivities shown in Fig. 1c were determined by measuring the mass spectrometer ammonia signal with respect to the signal of all constituents to compute the number of ammonia molecules formed per second per surface site, which is then further normalized to the
Fig.1|Experimental set-up and relative turnover-frequency measurements. a, The sample faces a set of apertures that deliver the reaction gas while simultaneously gathering products and emitted electrons. The grazing incidence X-rays enter from the left, producing photoelectrons. The mix of gas and electrons is separated by an electrostatic lens and analysed in an electron analyser and a mass spectrometer. The inset shows XPS spectra of the chemical state of N at 200 mbar over the surface with a gas ratio. b, Mass
spectrometer readout of masses 15 and 16 corresponding to production as the gas ratio changes from 150 mbar pure (blue region showing flow) to (green region showing flow) over Ru at 673 K . Note that the flows of the gases are shown as the filled blocks plotted on the left axis.c, The enhanced mass spectrometer signals were time averaged during the interval of the mixture to estimate the relative chemical reactivity. a.u., arbitrary units.
highest activity shown by any surface at any temperature (see Methods for further details). The reaction rate increases with increasing temperature and is higher for the stepped than the flat surface, in agreement with previous high-pressure-reactor studies . The highest rate is seen for the surface, as expected based on polycrystalline studies showing that Ru has higher activity than Fe (ref. 21). The maximum rate for Ru is not at the highest temperature of 723 K , as for the Fe surfaces, but at 623 K , also in accordance with catalytic-reactor studies .
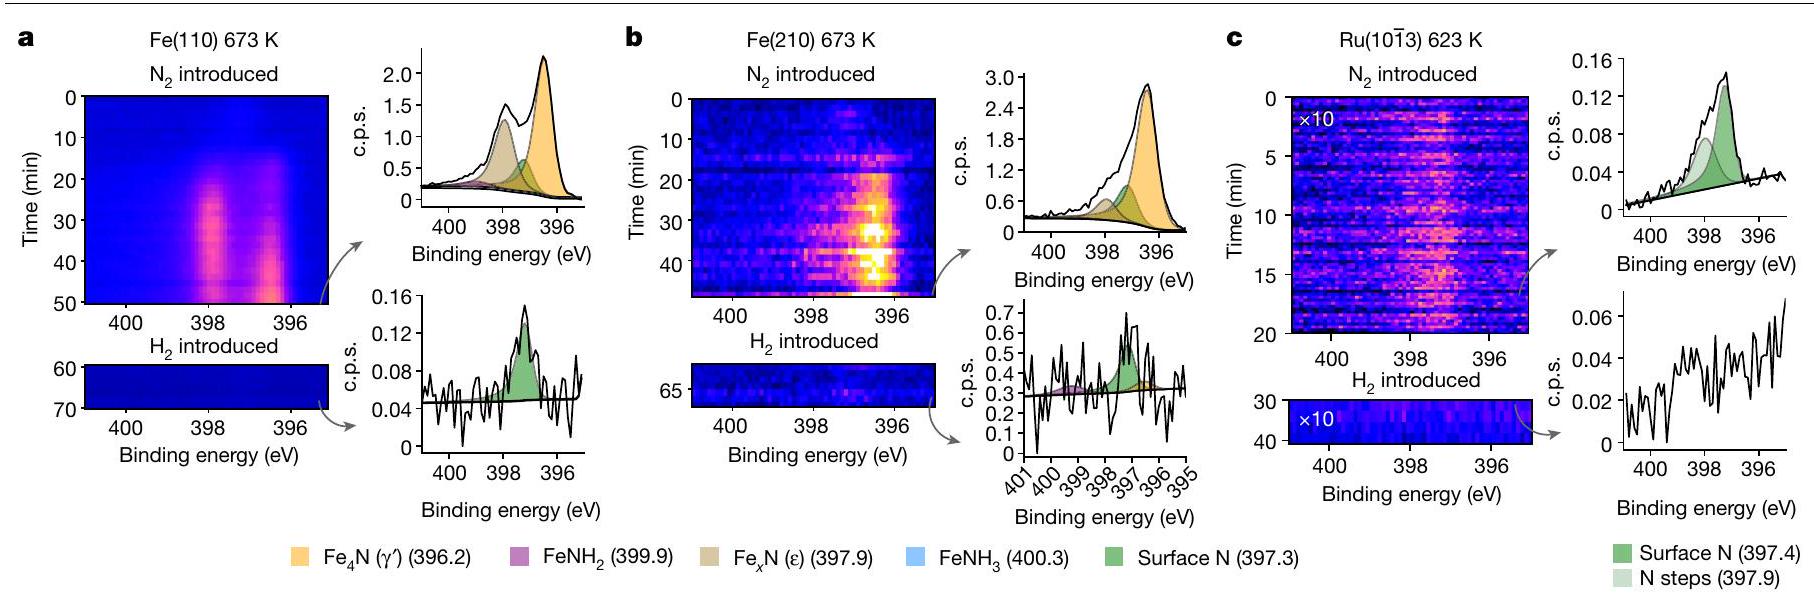
On exposure to pure gas at 150 mbar, the two Fe surfaces have a delayed but eventually rapid increase in the N1s intensity, showing bulk nitride formation (Fig. 2a,b). On the basis of the binding-energy position of the N1s peaks in the spectra, this corresponds to the formation of -nitride and -nitride plus some small amount of chemisorbed N atoms on the bare Fe surface (see Extended Data Table 1). The nitride formation is more rapid on the surface, specifically the -nitride, whereas on the surface, there is an equal amount of the two nitrides and slower growth. The thicknesses of the nitride layers are greater than ten monolayers; exact quantification depends on the reaction time, as the surface continues to evolve even after hours of observation (see Methods for details on monolayer calculations). We attribute the faster growth on the facet to the higher probability of dissociation on the stepped surface . At temperatures below 523 K , no nitride formation is observed.
The Ru(10113) reacts completely differently. Almost instantaneously after exposure, the N1s intensity saturates and remains constant, corresponding to a coverage of 5% of a monolayer, and there is no bulk nitride formation at 623 K (Fig. 2c). The coverage is comparable with previous work, which predicts17% of a monolayer at 500 K and a pressure of 100 mbar (ref. 23). The small amount of on the Ru surface indicates a much weaker N -metal interaction than on Fe , as expected from theoretical predictions . The two components are at 397.4 eV and 397.9 eV , and we tentatively assign these to Nadsorbed on terraces and steps, respectively (Extended Data Fig.1). It is interesting that a
weak, broad feature is seen at approximately , with a binding energy consistent with adsorbed (ref. 24); see Extended Data Fig. 1.
When the pure gas is replaced by 1:1 at 300 mbar, a marked change on the two Fe surfaces occurs within the first spectral sweep ( 90 s), shown at the bottom of Fig. 2a,b. The nitrides instantaneously disappear and only a small amount of adsorbed N atoms with a coverage of 2% of a monolayer on and 5% on remains. At the same time as the gas mixture is introduced, is detected by the mass spectrometer. The rapid removal of the nitrides shows the strong reduction ability of the . The slow growth of nitrides ( ) compared with the fast reduction ( ) shows the difference in rates of and dissociation. The adsorbed N atom coverage is also substantially lowered on the Ru(1013) surface following the introduction of the 1:1 mixture at 300 mbar and decreases from 5% to <0.05% of a monolayer as is produced.
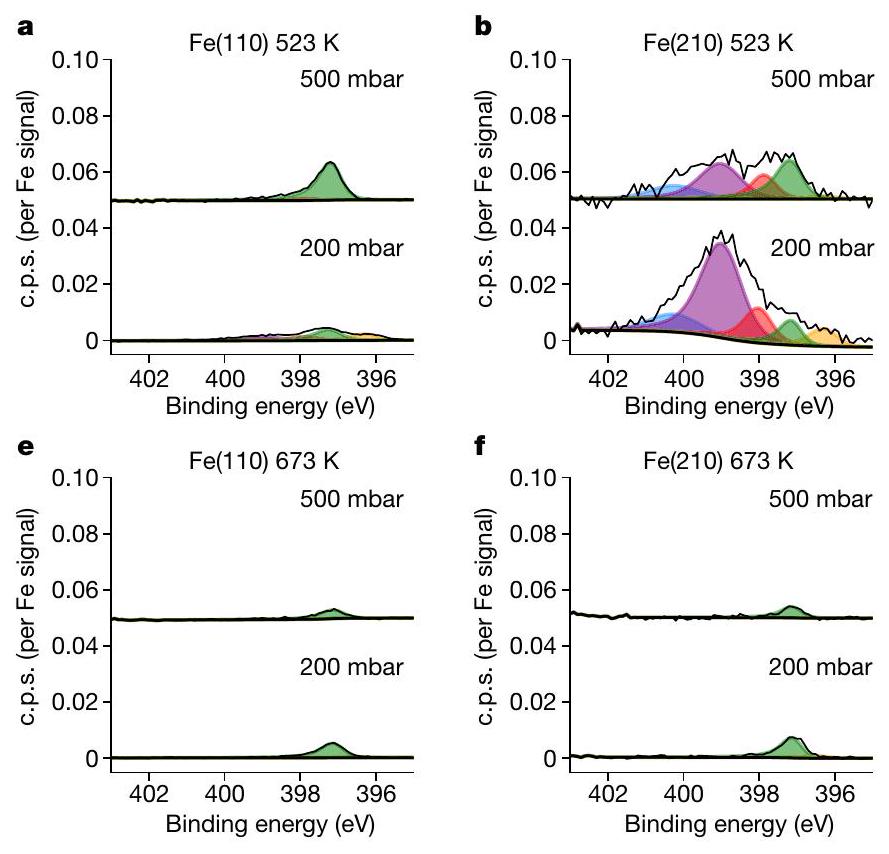
Next, we address the question of oxides potentially not being reduced on Fe under operando conditions owing to trace contaminations of water or in the gas phase . Iron is known to oxidize in trace amounts of water or at room temperature, yet iron oxide is not readily reduced below 500 K and, as a result, even under pure hydrogen, iron will oxidize with high flows (see Methods for a detailed description). Figure 3 shows data collected at and various temperatures. The peaks in Fig. 3a from metallic iron at 706.5 eV and 707.4 eV are split owing to exchange interactions with the ferromagnetic valence electrons, and there is a broad Fe oxide peak at , indicated by the grey rectangle. The sample is fully reduced as the temperature reaches 523 K at 500 mbar and the surface requires a higher temperature of 573 K , as seen in Fig. 3b. Fe(210) needs a higher temperature because of the stronger binding of oxygen on a stepped surface. Ru is metallic at all conditions. All surfaces are in a metallic state during the Haber-Bosch process, as expected because of the high concentration of adsorbed hydrogen (Fig.3c). Note that these measurements were gathered simultaneously with the data in Fig. 4.
Fig. 2 | Nitride formation and depletion. The formation and depletion of nitride on the surface of each catalyst are shown as a function of time. At the top, the gas is introduced with a total pressure of 150 mbar and spectral collection begins. Then, after the nitride begins to stabilize, gas is introduced immediately in a 1:1 ratio with with a total pressure of 300 mbar, reducing the surface
within the frame of the detector. Next to each time series are example spectra normalized to the background, with a grey arrow showing the frame it represents. a, The data for 673 K over . b, The data for 673 K over . c, The data for 623 K over . For Ru, the spectra shown are the summation of the entire time series. Note the difference in -axis scale in the spectral figures.
The adsorbed nitrogen species can be measured operando as is produced. First, focusing on the two Fe single-crystal surfaces (Fig. 4a,b), we observe only adsorbed N atoms on the surface at a binding energy of 397.4 eV , consistent with previous surface-science vacuum experiments once the recoil effect of the emitted atoms is considered (see Extended Data Table1). Adsorbed molecular could not be detected and would have been observed at or 405.9 eV (Extended Data Table 1), depending on the adsorption site and bonding type. The coverage of adsorbed N is at 200 mbar and at 500 mbar on the surface and increases on the surface to and , respectively. The higher coverage on the stepped surface is related to availability and stronger bonding of undercoordinated sites . What is most surprising is that the coverage is not increasing at higher pressures; on the contrary, the coverage decreases slightly with increased pressure. Inspecting the N1s spectra in Fig. 4d, measured at 1 bar and 673 K , the peak is barely distinguishable from the noise, implying an even lower coverage. It would be tempting to expect an increase in N coverage with increasing pressure because the impinging rate of molecules increases, but obviously also does the rate of H adsorption. Although we cannot determine the H coverage with XPS, our data suggest that the hydrogenation ability of the surface increases with the total pressure; this would explain a more efficient further reaction of the adsorbed N atoms. Extrapolating to much
higher pressures, we predict that the Fe surface is an almost pristine metal under realistic conditions. The fact that no amines ( ) or are observed at the reaction temperature of 673 K indicates that the rate-limiting step after dissociation is the hydrogenation of adsorbed N , and the rates of the other hydrogenation steps of NH and as well as desorption are much faster. At high temperatures, the Ru surface (Fig. 4 g ) has adsorbed N at 397.4 eV and the adsorbate coverage is almost negligible, with of a monolayer of both NH and species, independent of pressure within the noise limit. Here the surface is almost entirely clean of any species at conditions of high reaction rate.
At 523 K , for which the reaction proceeds very slowly, the population of the adsorbates changes. There is a slight increase of the adsorbed N on at 500 mbar to of a monolayer (Fig. 4d). The Fe(210) surface shows large differences compared with the higher-temperature spectra (Fig. 4e). Further peaks at and 400.2 eV formed, corresponding to and , as determined by previous XPS vacuum studies and calculated relative peak positions (Extended Data Table 1). Note that the peak at 399 eV is not related to adsorbed because ex situ XPS studies observed the peak when the Fe catalyst was cooled down to room temperature in the reaction mixture and moved to a vacuum, in which all molecular would desorb. We observe a relatively high coverage of (24.8%), adsorbed ,
Fig. 3| Oxides and metal. Owing to trace contaminations in the gases, the surfaces can form oxides. a, Two cases in which a thick oxide forms at low temperatures and 500 mbar in a 1:3 gas mixture, but the oxide thins and disappears as the temperature increases. The grey rectangle shows the region in which iron oxide peaks are present.b, The ratio of oxide to metal as a function of pressure and temperature for the Fe catalysts. The is grey, whereas
the is blue. The solid line shows the lower-pressure data at 200 mbar , whereas the dashed line is the higher-pressure data at 500 mbar ; at no point was the Ru catalyst oxidized. c, Example spectra of the metal peaks during formation at 623 K , showing a singular metallic peak for all catalysts. a.u., arbitrary units.
Fig. 4 | Effects on adsorbates of temperature and pressure. The steadystate population of the N species on the surface is shown for each catalyst at 200 mbar and 500 mbar at 523 K and 673 K in a gas mixture. Each set of spectra is normalized and corrected for the cross-section of the corresponding metal substrate. , The data over and at 523 K ,
and at 200 mbar. There is a slight pressure dependence, for which-in particular-the decreases to . Clearly, there exist conditions in which the adsorbed N and species are strongly adsorbed on step sites owing to a substantially lower hydrogenation rate. Decreasing the temperature further to 423 K , adsorbed and become visible on the surface. These trends are seen across 423 to 623 K (Extended Data Fig. 2).
On Ru at 523 K at 500 mbar (Fig. 4c), we still see very low coverages, although the coverage of adsorbed N at steps has increased to , as well as adsorbed to and adsorbed to at around 400 eV . The NH signal increases with pressure, but the nitrogen coverage quantification of these results is nearly within the margin of error. If there is an increase in coverage with pressure for Ru, it may indicate that the -metal interaction for Ru is weaker than for Fe, possibly leading to higher coverages at operational pressures. The adsorbed N species is much more reactive on Ru than Fe, supporting previous theoretical predictions .
We can discriminate the various proposed hypotheses and put forward ideas consistent with the data on the chemical state of the catalysts and reaction mechanism in terms of rate-limiting steps. We have shown that nitride formation is far slower than nitride reduction and that the surface states are all metallic with low coverages of atomic nitrogen. There is no evidence for interstitial nitrogen, oxides or high coverage of any species of nitrogen, especially over the most active catalysts. It is interesting to compare the hydrogenation reactions of CO and , which are isoelectronic molecules. In the case of the Fischer-Tropsch reaction on , a thick carbide is formed , whereas in the HaberBosch process, on the same surface, only a pristine metallic phase is generated. Clearly, the difference in the bond breaking of the ecule with respect to and the strength of the adsorbed C and N play an essential role.
The different reaction steps in synthesis have been proposed as the following :
respectively. d, The data over at 673 K and at 1 bar. e-g, The data over and at 673 K , respectively. Note the change in scale owing to the Ru data in and ; nitrogen coverage of N species on the Ru surface is incredibly low.
in which * means surface species and indicate empty sites available for bonding.
The simplest case is the surface, for which we can directly explain that steps 3-6 are extremely rapid with no build-up of intermediates, pointing to 1 and 2 as the rate-limiting steps. We observe that the population of adsorbed is extremely low at high temperatures. The adsorbed molecular state is indeed observed at the low reaction temperature of 523 K , at which its dissociation limits the reaction. We conclude that the rate-limiting step of production is the dissociation of the adsorbed , fully in line with theoretical estimations . Even at low temperatures, the surface is mostly adsorbate free, with little adsorbed seen, because of the strong bonding to step sites in comparison with terrace atoms . Although we have not observed definitive pressure dependence in the population of adsorbed N , it is plausible that the step sites will become more populated but are expected to remain well below a monolayer.
On Fe it is well established that the rate-limited steps is the molecular dissociation , supported by the correlation between the production rate and the dissociative sticking coefficient for the different single-crystal surface facets . However, the results here show that, at all temperatures, a factor of around 100 times higher
population of adsorbates is observed in comparison with the stepped Ru surface and we can no longer postulate that the reaction proceeds with a high rate after the molecular dissociative steps. Furthermore, there are no signs of molecularly adsorbed even at the lowest temperatures, indicative of a much higher rate of step 1b. Above 573 K , we observe adsorbed N that is more populated on the stepped crystal, indicating that the hydrogenation step 3 also partly controls the rate .
The coverage of N species on the Fe surfaces decreases with increasing total pressure at a constant ratio, implying that the dissociation step is slower than the hydrogenation step . Most likely, the coverage of adsorbed H increases with pressure, resulting in faster hydrogenation. Because the coverage of at the reaction temperatures is expected to be low, we can assume that there is no inhibition of dissociation caused by the adsorbed hydrogen .
The population of intermediates shows that, as the reaction temperature lowers, the rate-limiting step switches to become hydrogenation of N , NH and as well as desorption (steps 3-6), demonstrating differences in the bonding at different high and low coordinated Fe sites. This agrees with earlier observations of the activation energy for hydrogenation being much higher than for dissociation and the difference in the barriers of these two steps thus becoming prominent at low temperatures: although the dissociation rate at high temperatures is low owing to a low sticking coefficient that limits adsorption , we see a large population of amines and on Fe at low temperatures. This trend, not seen with Ru, points to the hydrogenation steps affecting the overall rate on Fe. At higher pressures at which more is converted and the content is higher, the back reaction may become important. Indeed, for Ru, it has been theoretically predicted that the coverage of nitrogen species may become substantially higher .
In closing, we note that, although concerns over the environmental impact of ammonia synthesis have spurned interest in low-pressure alternatives and these might indeed be feasible , the Haber-Bosch process looks set to remain the primary method of ammonia production for many years to come. A better understanding of the mechanism at play might help to further improve the efficiency and, thereby, lower the environmental impact of this important industrial process. We anticipate that our approach to operando studies will contribute to this endeavour, by making it possible to explore the surface chemistry associated with ammonia formation in the presence of promotors and by making it possible, once measurements at higher pressures and with a higher content are feasible, to explore the impact of the ammonia decomposition back reaction.
Online content
Any methods, additional references, Nature Portfolio reporting summaries, source data, extended data, supplementary information, acknowledgements, peer review information; details of author contributions and competing interests; and statements of data and code availability are available at https://doi.org/10.1038/s41586-023-06844-5.
2. Ertl, G. The arduous way to the Haber-Bosch process. Z. Anorg. Allg. Chem. 638, 487-489 (2012).
3. Mittasch, A. & Frankenburg, W. Early studies of multicomponent catalysts. Adv. Catal. 2, 81-104 (1950).
4. Smil, V. Detonator of the population explosion. Nature 400, 415-415 (1999).
5. Arabczyk, W., Jasińska, I. & Lubkowski, K. The surface properties of iron catalyst for ammonia synthesis. React. Kinet. Catal. Lett. 83, 385-392 (2004).
6. Kandemir, T., Schuster, M. E., Senyshyn, A., Behrens, M. & Schlögl, R. The Haber-Bosch process revisited: on the real structure and stability of “ammonia iron” under working conditions. Angew. Chem. Int. Ed. 52, 12723-12726 (2013).
7. Stoltze, P. & Nørskov, J. K. Bridging the ‘pressure gap’ between ultrahigh-vacuum surface physics and high-pressure catalysis. Phys. Rev. Lett. 55, 2502 (1985).
8. Ertl, G., Lee, S. B. & Weiss, M. Adsorption of nitrogen on potassium promoted Fe(111) and (100) surfaces. Surf. Sci. 114, 527-545 (1982).
9. Somorjai, G. A. & Materer, N. Surface structures in ammonia synthesis. Top. Catal. 1, 215-231 (1994).
10. Ertl, G. Surface science and catalysis-studies on the mechanism of ammonia synthesis: the P. H. Emmett Award address. Catal. Rev. 21, 201-223 (2006).
11. Spencer, M. S. On the rate-determining step and the role of potassium in the catalytic synthesis of ammonia. Catal. Lett. 13, 45-53 (1992).
12. Honkala, K. et al. Ammonia synthesis from first-principles calculations. Science 307, 555-558 (2005).
13. Amann, P. et al. A high-pressure x-ray photoelectron spectroscopy instrument for studies of industrially relevant catalytic reactions at pressures of several bars. Rev. Sci. Instrum. 90, 103102 (2019).
14. Amann, P. et al. The state of zinc in methanol synthesis over a model catalyst. Science 376, 603-608 (2022).
15. Shipilin, M. et al. In situ surface-sensitive investigation of multiple carbon phases on Fe(110) in the Fischer-Tropsch synthesis. ACS Catal. 12, 7609-7621 (2022).
16. Medford, A. J. et al. Assessing the reliability of calculated catalytic ammonia synthesis rates. Science 345, 197-200 (2014).
17. Salmeron, M. & Schlögl, R. Ambient pressure photoelectron spectroscopy: a new tool for surface science and nanotechnology. Surf. Sci. Rep. 63, 169-199 (2008).
18. Humphreys, J., Lan, R. & Tao, S. Development and recent progress on ammonia synthesis catalysts for Haber-Bosch process. Adv. Energy Sustain. Res. 2, 2000043 (2021).
19. Ertl, G. & Thiele, N. XPS studies with ammonia synthesis catalysts. Appl. Surf. Sci. 3, 99-112 (1979).
20. Dahl, S., Logadottir, A., Jacobsen, C. J. H. & Norskov, J. K. Electronic factors in catalysis: the volcano curve and the effect of promotion in catalytic ammonia synthesis. Appl. Catal. A Gen. 222, 19-29 (2001).
21. Saadatjou, N., Jafari, A. & Sahebdelfar, S. Ruthenium nanocatalysts for ammonia synthesis: a review. Chem. Eng. Commun. 202, 420-448 (2014).
22. Pan, C., Li, Y., Jiang, W. & Liu, H. Effects of reaction conditions on performance of Ru catalyst and iron catalyst for ammonia synthesis. Chin. J. Chem. Eng. 19, 273-277 (2011).
23. Dahl, S. et al. Role of steps in activation on Ru(0001). Phys. Rev. Lett. 83, 1814 (1999).
24. Umbach, E. Satellite structures in photoemission spectra from different types of absorbates. Surf. Sci. 117, 482-502 (1982).
25. Grunze, M. et al. п-bonded on : the precursor for dissociation. Phys. Rev. Lett. 53, 850 (1984).
26. Kishi, K. & Roberts, M. W. Adsorption of nitrogen and ammonia by polycrystalline iron surfaces in the temperature range 80-290 K studied by electron spectroscopy. Surf. Sci. 62, 252-266 (1977).
27. Ertl, G. Primary steps in catalytic synthesis of ammonia. J. Vac. Sci. Technol. A 1, 1247-1253 (1983).
28. Logadóttir, Á. & Nørskov, J. K. Ammonia synthesis over a Ru(0001) surface studied by density functional calculations. J. Catal. 220, 273-279 (2003).
29. Vojvodic, A. et al. Exploring the limits: a low-pressure, low-temperature Haber-Bosch process. Chem. Phys. Lett. 598, 108-112 (2014).
Publisher’s note Springer Nature remains neutral with regard to jurisdictional claims in published maps and institutional affiliations.
All XPS data are collected with total external reflection X-rays and normalized to core levels of the substrate. The emitted photoelectrons and gases pass into the spectrometer through orifices in the front cone to be detected in a hemispherical analyser. The overall resolution in the measurement was 0.2 eV , all spectra were normalized with respect to the or core levels unless stated otherwise and spectra are presented in counts per second (c.p.s.).
POLARIS is an ambient pressure X-ray photoelectron spectrometer that operates with several key differences from typical ambient pressure XPS systems. The sample is approached to from a set of roughly -diameter apertures that lead to the analyser; the X-rays used are in the tender range 4.6 keV for all data collected. Most importantly, though, is that the gas is delivered through the front cone directly to the sample, making a virtual pressure cell in which only the sample and aperture to the analyser are pressurized. To achieve surface sensitivity, grazing incidence X-rays are used within the total external reflection range for iron and for ruthenium. This geometry allows for surface sensitivity despite high kinetic energy electron detection; the probe depths are and for Fe and Ru, respectively . The electron spectrometer is a HiPP-2 hemispherical analyser manufactured by Scienta Omicron; see ref. 13 for more details. The single-crystal samples (Surface Preparation Laboratory, 99.99% purity) are mounted in a steel sample holder and heated from the back side with a resistive heater. The temperature of the sample is measured with a type C thermocouple pressed between the sample and the heater. The separation between the sample and the apertures is held constant by PID feedback based on the pressure over the sample . ASi(311) double-crystal monochromator was used, yielding a photon-energy bandwidth of approximately 130 meV , a 0.8 mm curved entry slit and 100 pass energy was used in the electron analyser.
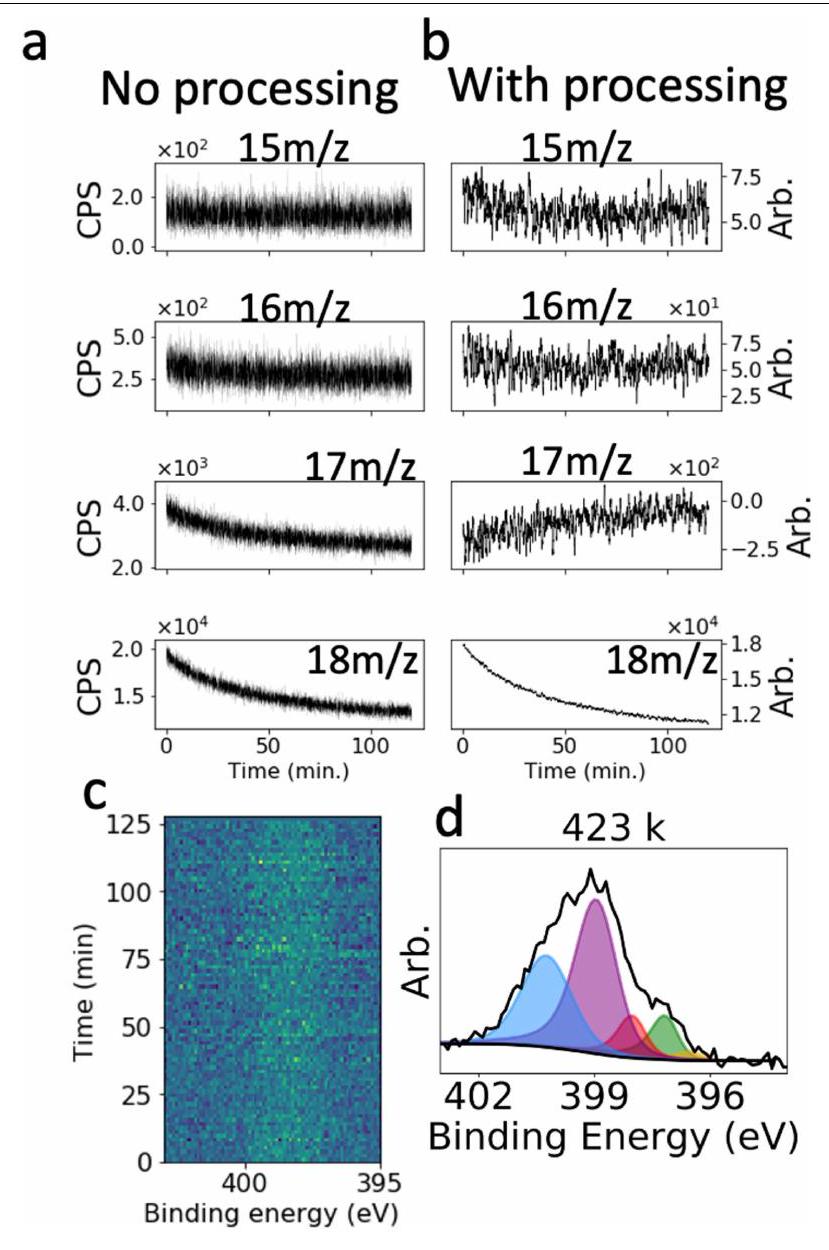
Extended Data Fig. 1a shows an example of an N1s spectrum of 1:3 gases at 200 mbar and the sample at 423 K , indicating adsorbed N atoms on the surface. The measurements were conducted at a photon flux at which no detectable X-ray-beam-induced changes could be seen. Individual spectra were gathered for 30 to 300 min with no decreeable spectral changes when hydrogen was present in the gas phase. Extended Data Fig. 3 shows an example time interval of 2 h over at 423 K and 500 mbar in 1:3 gas mixture. Extended Data Fig. 3a,b shows the data over this time for mass fragments and 18 , with and without processing. Extended Data Fig. 3c shows the XPS spectra evolution with time and Extended Data Fig. 3d shows the time-averaged results. From these, it is clear that the only change observed with time is the decrease in water signal owing to the slow improvement of vacuum conditions under constant hydrogen conditions.
XPS data processing
All presented spectra are scaled by the number of sweeps and dwell time per data point. Further scaling is done based on the relative cross-section of the materials, as mentioned in the main text. To fit the spectra, CasaXPS was used with linear or Shirley backgrounds as needed. Peaks were fitted with modified Voigt function (LA) line shapes, which allows for asymmetry. Asymmetry was tuned for each component.
Sample preparation
Sample cleaning was performed by ion sputtering with for iron and 1 keV for ruthenium. The samples were annealed to 900 K for Fe and for Ru. Chemical cleaning was performed as needed by exposing the sample to either hydrogen or oxygen at elevated temperatures to remove oxygen or carbon, respectively. Small contaminations of sulfur and silicon were present, but the atomic composition was maintained at or below 1%.
Coverage
To model the coverage of the surfaces, the and RuN nitrides were used as the physical representation of the surface species. Although not a perfect model, reference data of commercial nitrides verify that the surface constituents are similar in atomic bonding. We used the method previously established and typical XPS coverage formulation to calculate the coverages. Elemental cross-section data was taken from ref. 33.
To calculate the probe depth, the X-ray and electron mean free path need to be combined; this is done by calculating the X-ray field in the material at a given angle and using the TTP2M electron mean free path to determine the electron-signal intensity as a function of depth within the sample. Then the integral is evaluated over all depths to determine the effective probe depth. Once the probe depth is determined, the coverage is then calculated on the basis of the ratio of substrate to surface species intensity-weighted by the cross-sections and atomic densities .
Mass spectrometry
To determine the amount of formed by the catalyst, a differentially pumped mass spectrometer (Hiden HAL/3F RC 301 PIC system) was attached to the first differential pumping stage of the XPS analyser. By leaking a small amount of gas from the pumping stage to the mass spectrometer, the composition of the gas over the sample was determined. To ascertain the gas composition, mass fragments of all relevant peaks were monitored. Impurities in the and gases were predominantly and . These contributions to the fragments were subtracted on the basis of the measured ratio of pure gas to contaminate. Owing to the marked overlap of water and ionization patterns, and 16 were used as the markers for . Further smoothing is done with a third-order Savitzky-Golay filter over a window of 1 s . The result of this analysis is shown in Fig. 1. As the mass spectrometer is highly sensitive, there is signal before any experiment from the chamber at all masses, including masses 15 and 16, most likely because of hydrocarbons. With the high-flow conditions required to establish the pressure for the XPS measurements, the amount of ammonia in the gas stream into the mass spectrometer is small and the signal becomes noisy. Therefore, to make a more accurate measurement of the production, time integration was done between the background level in pure and that of pure . The background was subtracted from the time integration during ammonia production. Extended Data Fig. 4a shows an example mass spectrometer time trace in which there is negligible production, showing how the background change with gas flow is within the noise of the measurement and therefore requires time integration. Owing to the specific design of the high-flow virtual cell, unwanted gas molecules originating from reactions of the sample holder or heater cannot reach the single-crystal surface area that is examined by the opening into the electron spectrometer. Thereby, all measurement conditions are constant. The increase in ammonia production at higher temperatures is as expected according to refs. 9,21,22, providing further confidence that ammonia is produced.
The relative chemical activity (RCA) was calculated using the following equation. Time-averaged was calculated from the amount of signal from ammonia as described above per total signal from the mass spectrometer. Volume ( ) of gas is the total volume of gas used during the measurement, pressure over the sample, temperature of the sample, the gas constant , time is the duration of the time when ammonia could have been produced, is Avogadro’s number and sites is the number of active sites under the high-pressure area. Finally, the highest activity on any surface is a normalization to the maximum of any surface. The normalization is to account for systematic errors, such as the fact that most of the volume of gas used does not pass over the sample or the fact that not all sites in the high-pressure region under the front cone would be examined by the mass spectrometer.
With an instrument exposed to many gases over the years, there are signals at all masses, including masses 15 and 16, before any ammonia-synthesis experiment is performed, owing to desorption from the chamber walls. This desorption in the first differential pumping stage most likely comes from hydrocarbons. In the mass spectrometer, it is possible for crosstalk between channels or other instrumental errors to affect the signal. This is particularly true when the signal is very near the noise level, as in the work presented herein. Extended Data Fig. 3 shows the masses 15, 16, 17 and 18. Mass 17, corresponding to ammonia, is strongly affected by water production from interaction with the chamber walls and the mass spectrometer itself, making quantitative analysis impossible. To decrease the possibility of the ammonia signal originating from instrumental errors, both masses 16 and 15 are included in the signal of ammonia. As discussed above, mass 17 is not included because of the large water signal. Extended Data Fig. 3a,b shows the effect of both processing and long acquisition times. The sample is ratio. Here we can see that the atomic mass units of both 15 and 16 are constantly above the background signal from hydrocarbons or water. Meanwhile, mass 17 is not, owing to the strong overlap of OH and masses. Note that the background signal removed at this point in the processing does not account for all of the background signals. As described above, to determine the relative chemical activity, the signal of ammonia (masses 15 and 16) above the background signal in either pure or pure is taken. That ammonia signal is then compared with the total signal in the mass spectrometer over the same time period. By this method, the plotted data do not remove all of the background signals, yet when the data are processed for relative chemical activity, the entirety of the background is removed.
The error of the relative chemical activity is estimated on the basis of the signal-to-noise ratio of the background of the ammonia signal. Part of the calculation is to subtract the background, seen in Fig. 1b, between times 15 and 23 min ; the fluctuations in the background can have a notable effect on the calculation of ammonia content. To ascertain the estimated error, the 95% confidence interval of the noise average and standard deviation over the collected time were introduced as an error source in the equation for relative chemical activity. Because the background signal and noise are similar for all experiments, the estimated error introduced is also similar. The relative chemical activity is meant to be a semiquantitative description of the abundance of ammonia, only as a comparative description of these similar systems, and to demonstrate that the trends follow previous more absolute activity measurements. Extended Data Fig. 4a shows an example of when there is no ammonia production at the lowest temperature with the least active catalyst, at . Here we can see that extremely small ammonia production occurs and this is most likely the background level. Extended Data Fig. 4b, by contrast, shows the same surface and experiment at the higher temperature of 673 K and clearly shows that ammonia production increases with increasing temperature.
Beam effects
To determine the effect of the X-ray beam intensity on the observed species, two types of beam damage test were performed, attenuation and dark spectra, both carried out at and a 3:1 mixture of and . The dark spectra were performed by aligning the sample and gathering highly attenuated spectra, then closing off the light, cleaning the sample in hydrogen, then opening the shutter and obtaining a new spectrum. The result showed no change owing to the amount of time the sample was exposed to X-rays. The second test was done by gradually increasing the intensity of the beam to determine whether
any beam damage would accumulate; here no change in the spectra once normalized to the attenuation factor was observed.
Nitrogen spectra gathered outside reaction conditions (that is, without hydrogen), such as those shown in Fig. 2, show not only chemical changes inherent to the reaction but also accumulation of beam-induced effects. The build-up of beam-induced nitride formation is slower than chemical activity but is not possible to fully avoid. For this reason, no attempt is made to quantify the formation rate of the various nitrides. The main finding of the paper is the distinct lack of nitrogen on the surface during the reaction and the slow nitride formation compared with fast reduction caused by hydrogen. The beam-induced nitride formation only serves to increase nitrogen formation. Therefore, the beam effects do not alter any conclusions of the activity of compared with but rather strengthen the finding.
To determine whether the beam has any effect on the mass spectrometer findings, two experiments of gas switching (in which the sample was exposed to pure then then pure ) were performed with X-ray light and without. Extended Data Fig. 4b,c shows the mass fragments of all relevant species for these experiments. For these data, the sample was at 673 K . Extended Data Fig. 4 b shows the measurement with beam, whereas the measurement in Extended Data Fig. 4c was collected without beam. Although there are some minor differences in the ammonia signal between the two datasets, none of the changes are what would be expected from beam effects. It is expected that beam effects in the mass spectrometer would strictly cause an increase or decrease in ammonia signal. The change in the relative chemical activity between the test done with and without beam is approximately 2% and well within the error of the experiment. From this, it is clear that the X-ray beam does not have any effect on the mass spectrometer findings.
Extended Data Fig. 5a shows the effect of photon flux on the nitrogen content. Note that the line of best fit shown in grey has a forced intercept to zero. Extended Data Fig. 5b shows the effect of flux on nitrogen speciation, showing no change to the components of the N1s spectra. These spectra were gathered at 500 mbar in a 1:3 gas ratio at 423 K over Ru, the conditions expected to be the most sensitive to beam damage. Equivalent tests were performed for all catalysts.
Trace contaminations
Although highly pure gas (5N for nitrogen and hydrogen) was used with in-line chemical purifiers ( , model no. MC45-804; gas, model no. MC45-904, SAES Group), trace impurities are still present; on the basis of the mass spectrometer data, approximately 6 ppm of water and 3 ppm of . Owing to the high flows used, these small contaminants can react and build on the surface instantly. Furthermore, molecules will readily react with iron to form iron oxides; the same is not true for ruthenium. As a result, the iron surface at low temperatures will form a partial oxide but, as the temperature increases, the reduction by hydrogen outpaces the oxidation of the contaminants, yielding a metallic surface at relevant conditions.
Nitrogen species binding energies
Extended Data Table 1 presents previously published and computed binding energies for various amine and nitrogen species over iron and ruthenium. Note that, for comparison with studies at low photon energy, the recoil effect, in which the energy of the electron causes the nucleus to recoil, thereby decreasing the kinetic energy of the emitted electrons, needs to be considered .
Data availability
Experimental data were generated at the PETRA III facility at the DESY Research Centre of the Helmholtz Association. Raw datasets are available from the corresponding authors on reasonable request.
30. Goodwin, C. M. et al. The structure of the active Pd state during catalytic carbon monoxide oxidization. J. Phys. Chem. Lett. 12, 4461-4465 (2021).
31. Goodwin, C. M. et al. A novel method to maintain the sample position and pressure in differentially pumped systems below the resolution limit of optical microscopy techniques. Appl. Spectrosc. 75, 137-144 (2021).
32. Shard, A. G. Practical guides for x-ray photoelectron spectroscopy: quantitative XPS. J. Vac. Sci. Technol. A 38, 041201 (2020).
33. Trzhaskovskaya, M. B. & Yarzhemsky, V. G. Dirac-Fock photoionization parameters for HAXPES applications. At. Data Nucl. Data Tables 119, 99-174 (2018).
34. Stepanov, S. A. X-ray server: an online resource for simulations of x-ray diffraction and scattering. Proc. SPIE 5536, 16-26 (2004).
35. Shinotsuka, H., Tanuma, S., Powell, C. J. & Penn, D. R. Calculations of electron inelastic mean free paths. X. Data for 41 elemental solids over the 50 eV to 200 keV range with the relativistic full Penn algorithm. Surf. Interface Anal. 47, 871-888 (2015).
36. Takata, Y. et al. Recoil effect of photoelectrons in the Fermi edge of simple metals. Phys. Rev. Lett. 101, 137601 (2008).
37. Jiang, Y., Zhang, X., al Mehedi, A., Yang, M. & Wang, J. P. A method to evaluate volume ratio in FeN bulk material by XPS. Mater. Res. Express 2, 116103(2015).
38. Moreno-Armenta, M. G., Diaz, J., Martinez-Ruiz, A. & Soto, G. Synthesis of cubic ruthenium nitride by reactive pulsed laser ablation. J. Phys. Chem. Solids 68, 1989-1994 (2007).
39. Gröning, P., Nowak, S. & Schlapbach, L. Surface modifications of nitrogen-plasma-treated stainless steels. Appl. Surf. Sci. 64, 265-273 (1993).
40. Ogata, Y., Aika, K. I. & Onishi, T. Isotopic equilibration reaction of dinitrogen over Raney ruthenium: importance of the structural factor. J. Catal. 112, 469-477 (1988).
41. Grunze, M. The interaction of hydrazine with an surface. Surf. Sci. 81, 603-625 (1979).
42. Egawa, C., Naito, S. & Tamaru, K. Adsorption and decomposition of NO and on Ru(001) and Ru(1,1,10) surfaces. Surf. Sci. 138, 279-291 (1984).
Acknowledgements This research was financed by the Swedish Research Council (Vetenskapsrådet, VR) under award numbers VR 2013-8823 and 2017-00559, as well as the Knut and Alice Wallenberg Foundation under award number KAW 2016.0042. We acknowledge Deutsches Elektronen-Synchrotron DESY (Hamburg, Germany), a member of the Helmholtz Association (HGF), for the provision of experimental facilities. Parts of this research were carried out at PETRA III using beamline P22. Beamtime was allocated for proposals I-20200291 EC, I-20200292 EC and II-20211048 EC. J.K.M. is grateful for financial support from VILLUM FONDEN (research grant 41388).
Author contributions A.N. and C.M.G. proposed the study. C.S. developed the beamline. C.M.G., A.N., D.D. and P.A. developed the experimental set-up. C.M.G., P.L., D.D., M.S., P.A., F.G.-M., S.K., B.D., J.K.M. and R.R. performed the experiments. C.M.G. analysed the data. G.L.S.R. performed the binding-energy calculations. A.N., C.M.G. and B.D. wrote the manuscript.
Funding Open access funding provided by Stockholm University.
Competing interests The authors declare no competing interests.
Additional information
Supplementary information The online version contains supplementary material available at https://doi.org/10.1038/s41586-023-06844-5.
Correspondence and requests for materials should be addressed to Christopher M. Goodwin or Anders Nilsson.
Peer review information Nature thanks Jorge Boscoboinik and the other, anonymous, reviewer(s) for their contribution to the peer review of this work. Peer reviewer reports are available.
Reprints and permissions information is available at http://www.nature.com/reprints.
Article
Extended Data Fig. 1|Comparison of N1s over ruthenium under pure and low-pressure condition. The spectra of N 1 s on under 200 mbar 1:3 gas mixture at 423 K and the thickest nitride film made on the same
surface at 623 K . The black lines show the offset between the NH species in red in the top spectra to N on terraces and light green in the bottom spectra cumulating to 150 meV .
Extended Data Fig. 2 | N1s data at every temperature and pressure. a-c, nitrogen spectra over , and , respectively. d-f, nitrogen spectra over and , respectively. Temperature increases from top to bottom, from 423 K to 723 K .
Article
Extended Data Fig. 3| Stability of long acquisition times. a, The set of mass spectrometer data before any processing gathered over a 2 – window. The trend in masses 16, 17 and 18 are because of the slow improvement of the vacuum conditions. b, The same data as in a with processing as described in Methods.
c, XPS spectra gathered simultaneously normalized to background signal.
d, The sum of the spectra with the fitted peaks shown according to the colour scheme used throughout the paper.
Extended Data Fig. 4 | Mass spectrometer time trace with and without ammonia production. a, The equivalent experiment as for the data shown in
ensuring that the relative reactivity is representative of the lack of ammonia production. Note that, in a, there is a glitch in the mass spectrometer background as a response to the removal of , but it is clear that mass 15 is decreasing in pure after the switchover. c, The equivalent experiment as b but performed without any X-rays on the sample. that the timescale is far longer than in Fig. 1b to ensure sufficient statistics,
Article
Extended Data Fig. 5| Beam flux effect on surface species. a, The trend of N1s intensity over Ru at gas ratio as beam flux increased, with a line of best fit in grey (intercept set to zero) showing that the beam does
not have an appreciable effect on total coverage. , The same experiment showing that the N1s spectra gathered sequentially from lowest flux to full flux, showing no change in speciation with beam flux.
Chemical state
Iron
Calculated iron (110)
Ruthenium
Nitride
‘-nitride
397.9
-nitride
397.9
Surface N
397.3
397.4*
Terrace
405
399.3
NH
398.1
3998,17,24,27
399
4008,17,24,27
400.7
Department of Physics, Stockholm University, AlbaNova University Center, Stockholm, Sweden. Department of Materials and Environmental Chemistry, Stockholm University, Stockholm, Sweden. Photon Science, Deutsches Elektronen-Synchrotron DESY, Hamburg, Germany. Institute of Physical Chemistry, Montan University Leoben, Leoben, Austria. Present address: Materials Science, ALBA Synchrotron Light Facility, Cerdanyola del Vallés, Spain. Present address: Scienta Omicron AB, Uppsala, Sweden. e-mail: cgoodwin@cells.es; andersn@fysik.su.se
Haber, F. & le Rossignol, R. Über die technische Darstellung von Ammoniak aus den Elementen. Z. Elektrochem. Angew. Phys. Chem. 19, 53-72 (1913).
*Calibration binding energy. On the basis of the average position of both nitrogen atoms in . Refs. 8,17,23-25,27,37-42.