DOI: https://doi.org/10.1007/s44246-024-00117-0
تاريخ النشر: 2024-04-16
الأثر الديناميكي للطاقة غير المتجددة والمتجددة على انبعاثات ثاني أكسيد الكربون والبصمة البيئية في إندونيسيا
الملخص
الاتجاه العالمي لتدهور البيئة، الذي يتميز بزيادة مستويات ثاني أكسيد الكربون (
أهم النقاط
- الطاقة المتجددة هي قطاع رئيسي لتعزيز جودة البيئة في إندونيسيا.
- تستكشف هذه الدراسة العوامل المحتملة لتقليل
الانبعاثات والبصمة البيئية في إندونيسيا. - تم تطبيق طريقتي FMOLS و DOLS على بيانات السلاسل الزمنية، مدعومةً باختبار قوة باستخدام CCR.
- تقدم النتائج رؤية أوضح حول كيفية مساهمة الطاقة المتجددة في تقليل كل من
الانبعاثات والبصمة البيئية، في حين أن الطاقة غير المتجددة تفاقم هذه القضايا في إندونيسيا. - تقدم هذه الدراسة توصيات سياسية للمساعدة في تحقيق الاستدامة البيئية والحياد الكربوني.
1 المقدمة
تدهور البيئة على الرغم من مساهمتها في التنمية الاقتصادية (كارتال وآخرون 2023). تقع هذه الدراسة في سياق هذه المخاوف العالمية، مع تركيز خاص على إندونيسيا، وهي منطقة تجسد الصراع بين الطموحات التنموية واستدامة البيئة. تقع جنوب شرق آسيا، وخاصة إندونيسيا، عند مفترق طرق حاسم حيث يتزامن النمو الاقتصادي السريع مع زيادة الطلب على الطاقة، الذي يتم تلبيته بشكل أساسي من خلال مصادر غير متجددة مثل الفحم والنفط والغاز (منير وآخرون 2020؛ إيدروس وآخرون 2023ب؛ هاردي وآخرون 2024؛ كوستاكيس 2024). لا تساهم هذه النمط من استهلاك الطاقة فقط في ارتفاع
تخبر. كأمة تعاني من عجز بيولوجي، حيث يطغى البصمة البيئية على القدرة البيولوجية، تحتل إندونيسيا مرتبة بين أعلى الدول عالميًا بوجود بصمة بيئية كبيرة. تؤكد هذه الحالة على ضرورة التعمق أكثر في أنماط استهلاك الطاقة في البلاد وآثارها البيئية. ومع ذلك، هناك فجوة ملحوظة في الأدبيات الحالية تتمثل في نقص الدراسات الشاملة التي تتناول في الوقت نفسه الجانبين المزدوجين للأثر البيئي لـ
توسيعًا لخلفية الدراسة، تتناول العلاقة المعقدة بين استهلاك الطاقة والأثر البيئي، مع تركيز خاص على سياق جنوب شرق آسيا، ولا سيما إندونيسيا. تشهد هذه المنطقة، وسط النمو الاقتصادي والسكاني السريع، زيادة في الطلب على الطاقة، يتم تلبية معظمها من خلال الوقود الأحفوري. هذه الاعتماد ليس بدون عواقب، حيث يساهم بشكل كبير في زيادة البصمة البيئية.
علاوة على ذلك، تتفاقم التحديات البيئية في إندونيسيا بسبب بصمتها البيئية. يكشف مفهوم البصمة البيئية، الذي يقيس الطلب على نظم الأرض البيئية، أن إندونيسيا تواجه وضعًا من العجز البيولوجي. بصمتها البيئية
يتجاوز قدرته البيولوجية، مما يضعه بين أعلى عشرة دول على مستوى العالم من حيث البصمة البيئية (كرنياوان وآخرون 2023؛ باتا وآخرون 2021؛ بيرمانا وآخرون 2021؛ واكرناجل وبييرز 2019). هذه الحالة المقلقة تبرز الحاجة الملحة لإعادة تقييم وإصلاح أنماط استهلاك الطاقة والسياسات البيئية في البلاد. استجابةً لهذه التحديات، بدأت إندونيسيا اتخاذ تدابير للتخفيف من تأثيرها البيئي. يُبلغ معهد إصلاح الخدمات الأساسية عن هدف البلاد للوصول إلى ذروة متسارعة في الانبعاثات في قطاع الطاقة بحلول عام 2030، مع هدف طموح لتحقيق انبعاثات صفرية صافية بحلول عام 2050. تشمل الاستراتيجيات الرئيسية زيادة توليد الطاقة المتجددة إلى ما لا يقل عن
علاوة على ذلك، أضافت دراسة أجراها خان وآخرون (2023) في 41 دولة من دول جنوب الصحراء الأفريقية، حيث ركزت على التفاعل بين مصادر الطاقة المتجددة وغير المتجددة إلى جانب العوامل الاقتصادية في تشكيل جودة البيئة عبر المنطقة. تؤكد نتائجهم على الدور الحاسم للطاقة المتجددة في تحسين الظروف البيئية، مقارنةً بالتأثير الضار لاستهلاك الوقود الأحفوري على البيئة. أخيرًا، بحثت هذه الدراسة في دور جودة المؤسسات والطاقة المتجددة وغير المتجددة على البصمة البيئية لدول منظمة التعاون والتنمية الاقتصادية. وتقترح أن المؤسسات والطاقة المتجددة يمكن أن تعزز الاستدامة البيئية، مما يبرز أهمية الحوكمة والسياسات في إدارة البيئة (كريستوفوريديس وكاتراكيليديس 2021؛ تشانغ وآخرون 2024). كما هو موضح في الشكل 2، تظهر القدرة البيولوجية في إندونيسيا اتجاهًا متناقصًا بمرور الوقت، مصحوبًا بزيادة متناسبة في بصمتها البيئية.
تكمن أهمية هذا البحث في نهجه الشامل لتحليل التفاعل بين مصادر الطاقة المختلفة، والنمو الاقتصادي، والأثر البيئي في إندونيسيا. من خلال دراسة كل من مصادر الطاقة غير المتجددة والمتجددة، إلى جانب عوامل مثل النمو الاقتصادي وتكوين رأس المال، كان الهدف من الدراسة هو تقديم فهم أعمق لتأثيراتها على
التحديات نحو مستقبل يتم فيه تنسيق التنمية الاقتصادية مع الحفاظ على البيئة. كانت نتائج هذه الدراسة مهيأة للمساهمة بشكل كبير في الجهود العالمية لمكافحة تغير المناخ وتعزيز التنمية المستدامة، مما يجعلها نموذجًا محتملاً للسياسة البيئية وإدارة الطاقة.
2 مراجعة الأدبيات
بالنسبة لإندونيسيا، يصبح مشهد البحث أكثر تعقيدًا. أكد ماساجوني وبوديونو (2023) أن استهلاك الطاقة الأحفورية هو دافع رئيسي لـ
أظهرت الأبحاث الحديثة الروابط المعقدة بين مصادر الطاقة المتجددة وغير المتجددة، والبصمة البيئية، وعوامل اجتماعية واقتصادية متنوعة ضمن النقاش حول تأثير استهلاك الطاقة على البيئة. تلعب هذه الرؤى دورًا حيويًا في تحسين فهمنا للإدارة البيئية المستدامة عبر سياقات عالمية متنوعة. درس أديكوا وآخرون (2022) هذه العلاقة في الدول المصدرة والمستوردة للنفط. تناولت دراستهم كيف أن
الاعتماد على النفط، سواء كصادرات رئيسية أو واردات، أثر على الآثار البيئية لاستهلاك الطاقة. هذه الأبحاث مهمة في تسليط الضوء على التأثيرات البيئية المختلفة في الدول بناءً على حالة تجارتها النفطية، مما يوفر تداعيات سياسية حيوية لتحقيق توازن في مزيج الطاقة لإدارة بصماتها البيئية بشكل مستدام. لتوسيع نطاق هذا النقاش، قدم دوغان وآخرون (2022) دراسة تركز على اقتصادات جنوب آسيا، حيث فحصوا العلاقة بين البصمة البيئية، والبطالة، ونوعي استهلاك الطاقة. إن تضمينهم للبطالة كمتغير في تحليل التأثيرات البيئية يوفر منظورًا اجتماعيًا واقتصاديًا أوسع. تكشف هذه المقاربة عن التفاعل المعقد بين ديناميات سوق العمل وأنماط استهلاك الطاقة، مما يقدم رؤى حول التحديات المتعددة الأوجه التي تواجهها الاقتصادات النامية في المنطقة في سعيها نحو التنمية المستدامة. مكملة لهذه الدراسات، أجرت أمين وسونغ (2022) تحليلًا مقارنًا في دول جنوب شرق آسيا، حيث حللوا تأثير الطاقة المتجددة وغير المتجددة في تحقيق الحياد الكربوني. تبرز أعمالهم لتضمينها الشامل لعوامل مثل التجارة، والنمو الاقتصادي، والتحضر. تقدم هذه المقاربة المقارنة منظورًا إقليميًا حول استراتيجيات تحقيق الحياد الكربوني، مع التأكيد على كيفية معالجة مناطق آسيوية مختلفة للتحديات التي تطرحها استهلاك الطاقة، والتنمية الاقتصادية والحضرية في سعيها نحو الاستدامة البيئية.
في هذه الدراسات، تأخذ العلاقة بين الأنشطة الاقتصادية، واستهلاك الطاقة، وآثارها على البصمة البيئية مركز الصدارة. غاص ناثانيال (2021) في هذا التفاعل، كاشفًا كيف أن تدهور البيئة في إندونيسيا لم يكن فقط نتيجة للنمو الاقتصادي ولكن أيضًا لزيادة استهلاك الطاقة. تعتبر هذه الدراسة محورية في إثبات علاقة سببية أحادية الاتجاه حيث يؤدي النمو الاقتصادي مباشرة إلى تصعيد في البصمة البيئية. هذه النتيجة حاسمة لأنها تؤكد على التكلفة البيئية للتوسع الاقتصادي في دولة نامية مثل إندونيسيا. لتعميق هذا النقاش، استخدم تشين وآخرون (2023) نموذج ARDL الكمي لتفكيك تفاصيل هذه العلاقة. كشفت أبحاثهم أن تأثير النمو الاقتصادي على البصمة البيئية ليس موحدًا ولكنه يختلف عبر مستويات مختلفة من النشاط الاقتصادي. تقدم هذه العلاقة الإيجابية بين النمو الاقتصادي والبصمات البيئية عبر كوانتيلات مختلفة فهمًا أكثر تعقيدًا وتعددًا للمسألة، مما يشير إلى أن التأثير البيئي للنمو الاقتصادي قد يكون أكثر أهمية في مراحل معينة من التنمية الاقتصادية مقارنةً بأخرى. قدم كيرنياوان وآخرون (2023) منظورًا مختلفًا باستخدام تحليل نموذج تصحيح الخطأ المتجه (VECM). كشفت دراستهم عن تعديل سريع على المدى القصير في الأضرار البيئية في إندونيسيا، تم قياسه بـ
على الرغم من هذه الدراسات الشاملة، توجد فجوة ملحوظة في الفحص المتزامن لتأثيرات استهلاك الطاقة على كل من
البصمة البيئية، خاصة في إندونيسيا. تتطلب هذه الفجوة دراسة شاملة تدمج هذه الجوانب لتوفير فهم أكثر شمولية لتحديات البيئة في إندونيسيا. وبالتالي، فإن الفرضية هي أنه في إندونيسيا، نوع الطاقة المستهلكة – المتجددة أو غير المتجددة – له تأثير كبير ومختلف على كل من
3 المنهجية
3.1 ملخص البيانات والمتغيرات
3.2 الإطار النظري والنموذج التجريبي
| المتغيرات | الوصف واللوغاريتم الطبيعي | الوحدات | الأهداف | المصادر |
|
|
|
مليون طن | لتقييم التأثير البيئي من حيث حجم غازات الدفيئة المنبعثة في الغلاف الجوي نتيجة أنشطة مثل احتراق الوقود الأحفوري | OWID |
| EF | البصمة البيئية (InEF) | إجمالي البصمة البيئية | لتحديد الطلب على نظم الأرض البيئية وتقييم استدامة الاستهلاك من خلال قياس الموارد الطبيعية المستهلكة والنفايات المنتجة، بالإضافة إلى آثارها البيئية | GFN |
| فحم | فحم (InCOAL) | نسبة الطاقة الأولية (%) | OWID | |
| نفط | نفط (InOIL) | لتحديد مساهمات الفحم والنفط والغاز في قطاع الطاقة وعواقبها البيئية كمصادر هامة
|
||
| إعادة | الطاقة المتجددة (InRE) | نسبة الطاقة الأولية (%) | لفحص كيف يساهم اعتماد مصادر الطاقة المتجددة في تقليل الأثر البيئي، مقدماً بديلاً أكثر استدامة للوقود الأحفوري | OWID |
| الناتج المحلي الإجمالي | النمو الاقتصادي (في الناتج المحلي الإجمالي) | LCU ثابت | لقياس القيمة السوقية الإجمالية لجميع السلع والخدمات المنتجة داخل حدود الدولة على مدى فترة زمنية محددة | WDI |
| الاستثمار الثابت | تكوين رأس المال الثابت الإجمالي (InGFCF) | وحدة قياس مستمرة | لقياس القيمة الإجمالية للاستثمارات في الأصول الثابتة، مثل الآلات والبنية التحتية، داخل حدود الدولة على مدى فترة زمنية محددة | WDI |
تشير التكامل المشترك إلى أنه، على الرغم من التباينات القصيرة الأجل، هناك علاقة طويلة الأجل متسقة بين المتغيرات، وهو جانب حيوي لتحليلنا اللاحق ونمذجة التنبؤ في بيانات السلاسل الزمنية.
3.4 اختبارات ديناميكية باستخدام FMOLS و DOLS
3.3 اختبارات الجذر الأحادي والتكامل المشترك
3.5 اختبار القوة مع CCR
توظيف هذا الاختبار للمتانة أكد التزامنا بتحليل شامل ودقيق، مما يضمن أن الاستنتاجات المستخلصة من دراستنا ليست فقط ثاقبة ولكنها أيضًا ثابتة أمام الفحص الإحصائي الصارم.
3.6 السببية جرانجر الثنائية
تتضمن طريقة السببية جرانجر الثنائية اختبار كل زوج ممكن من المتغيرات في مجموعة البيانات الخاصة بنا لتحديد ما إذا كان يمكن استخدام متغير واحد للتنبؤ بمتغير آخر. هذه الطريقة مفيدة بشكل خاص في كشف الاعتماديات الديناميكية وآليات التأثير بين المتغيرات، والتي قد لا تكون واضحة من تحليل الارتباط القياسي أو اختبارات التكامل المشترك. يمكن أن توفر النتائج من هذه الاختبارات رؤى قيمة حول الأسبقية الزمنية ومسارات التأثير المحتملة بين المتغيرات، مما يعزز فهمنا للتفاعلات المعقدة داخل بيانات السلاسل الزمنية لدينا. كان دمج اختبارات السببية جرانجر الثنائية في دراستنا حاسمًا في رسم صورة أكثر شمولاً وعمقًا للعلاقات والتفاعلات التي تلعب دورًا في تحليلنا.
3.7 ملخص مراحل عملية التحليل
4 النتائج التجريبية
4.1 الإحصائيات الوصفية
المتغيرات استنادًا إلى 58 ملاحظة. أظهر التحليل الإحصائي الوصفي لمجموعة البيانات أن
4.2 نتائج اختبارات الجذر الأحادي والتكامل المشترك
| متغير | معنى | الوسيط | ماكس | من | الانحراف المعياري | ملاحظات |
| ثاني أكسيد الكربون |
|
|
|
٢٣,٣٧٤,٩٥٢ |
|
٥٨ |
| EF |
|
|
|
|
|
٥٨ |
| فحم | 12.43654 | 7.374517 | 44.80842 | 0.523673 | 12.21011 | ٥٨ |
| نفط | 60.43200 | 58.10882 | ٨٨.٩٢٣٦٣ | 31.35269 | 15.47422 | ٥٨ |
| غاز | ٢٢.٦٤٨٧٨ | ٢٤.٣١١١٧ | 33.86889 | 6.004779 | 7.763655 | ٥٨ |
| إعادة | ٤.٤٨٢٦٨٣ | ٣.٦٧٧٩٠٢ | ١١٫٥٧٠٦٧ | 1.140681 | ٢.٧٣٧١٩٣ | ٥٨ |
| الناتج المحلي الإجمالي |
|
|
|
|
|
٥٨ |
| الاستثمار الثابت |
|
|
|
|
|
٥٨ |
| المتغيرات | اختبار ديكي-فولر المعزز (ADF) | فيليبس-بيرون (P-P) | ||||||
| التقاطع الفردي | التقاطع الفردي والاتجاه | التقاطع الفردي | التقاطع الفردي والاتجاه | |||||
| t-إحصائية | احتمال | t-إحصائية | احتمال | t-إحصائية | احتمال | t-إحصائية | احتمال | |
| عند المستوى | ||||||||
| إنكو2 | -1.8963 | 0.3318 | -1.7282 | 0.7257 | -4.7479
|
0.0003 | -1.4114 | 0.8471 |
| إن إف | 0.1029 | 0.9633 | -4.5891
|
0.0027 | 0.9607 | 0.9957 | -4.3371
|
0.0056 |
| إنكوال | 0.0270 | 0.9569 | -2.3543 | 0.3988 | -0.0702 | 0.9474 | -2.4455 | 0.3532 |
| في النفط | 0.8576 | 0.9942 | -2.0076 | 0.5847 | 1.0733 | 0.9968 | -1.9711 | 0.6042 |
| إنغاس | -2.4672 | 0.1289 | -0.7630 | 0.9624 | -2.6867 | 0.0826 | -1.2769 | 0.8836 |
| فيما يتعلق بـ | -1.2621 | 0.6412 | -3.3824 | 0.0647 | -1.3879 | 0.5820 | -1.5308 | 0.8072 |
| في الناتج المحلي الإجمالي | -1.9728 | 0.2978 | -1.9982 | 0.5895 | -1.9728 | 0.2978 | -1.4727 | 0.8275 |
| InGFCF | -4.3292
|
0.0010 | -2.0383 | 0.5679 | -2.9312 | 0.0480 | -1.7386 | 0.7209 |
| في البداية الاختلاف | ||||||||
| إنكو2 | -7.5280
|
0.0000 | -8.0744
|
0.0000 | -7.5335
|
0.0000 |
|
0.0000 |
| إن إف |
|
0.0000 | -6.5320
|
0.0000 |
|
0.0000 | -15.580
|
0.0000 |
| إنكوال | -6.1195
|
0.0000 | -6.1880
|
0.0000 | -6.1309
|
0.0000 | -6.2028
|
0.0000 |
| في النفط | -7.5427
|
0.0000 | -7.7252
|
0.0000 | -7.5427
|
0.0000 | -7.7256
|
0.0000 |
| إنغاس | -4.7723
|
0.0003 | -5.6966
|
0.0001 | -7.4225
|
0.0000 | -9.1155
|
0.0000 |
| فيما يتعلق بـ | -8.0198
|
0.0000 | -8.4544
|
0.0000 | -7.9956
|
0.0000 |
|
0.0000 |
| في الناتج المحلي الإجمالي | -5.5416
|
0.0000 |
|
0.0001 | -5.5416
|
0.0000 | -5.8006
|
0.0001 |
| InGFCF | -5.1909
|
0.0001 | -6.4675
|
0.0000 | -5.2334
|
0.0001 | -5.4638
|
0.0002 |
4.3 نتائج اختبارات التشخيص وثبات المعلمات
| الفرضية الصفرية | إحصائية فيشر* (من اختبار الأثر) | احتمال | إحصائية فيشر* (من اختبار القيم الذاتية القصوى) | احتمال |
|
|
|
0.0000 |
|
0.0012 |
|
|
|
0.0001 | 41.8815 | 0.0624 |
|
|
|
0.0013 | ٣٣.٣٨٤١ | 0.1140 |
|
|
|
0.0076 | ٢٢.٥٧٨٩ | 0.3424 |
|
|
|
0.0110 | 19.1432 | 0.2069 |
|
|
|
0.0216 | 15.4178 | 0.1101 |
|
|
11.6551 | 0.0644 | 7.7867 | 0.1885 |
|
|
3.8684 | 0.0584 | 3.8684 | 0.0584 |
4.4 نتائج DOLS و FMOLS و CCR
4.4.1 FMOLS و DOLS لـ
نماذج. أ
4.4.2 FMOLS و DOLS للبصمة البيئية
| معتمد | تاو-ستات. | احتمال* | ز-ستات | احتمال* | ||||
| إنكو2 | -3.57 | 0.7459 | -21.53 | 0.7324 | ||||
| إن إف | -6.80 | 0.0036 | -96.24 | 0.0000 | ||||
| إنكوال | -3.62 | 0.7255 | -20.04 | 0.7961 | ||||
| في النفط | -2.30 | 0.9904 | -16.86 | 0.9028 | ||||
| إنغاس | -3.49 | 0.7771 | -23.69 | 0.6302 | ||||
| فيما يتعلق بـ | -4.17 | 0.4735 | -26.44 | 0.4935 | ||||
| في الناتج المحلي الإجمالي | -6.68 | 0.0049 | -99.17 | 0.0000 | ||||
| InGFCF | -4.91 | 0.1830 | -٣٦.١٩ | 0.1264 | ||||
| النتائج الوسيطة لاختبار التكامل المشترك لإنجل-غرانجر | ||||||||
| إنكو2 | إن إف | إنكوال | في النفط | إنغاس | فيما يتعلق بـ | في الناتج المحلي الإجمالي | InGFCF | |
| رو-1 | -0.38 | -1.00 | -0.35 | -0.30 | -0.42 | -0.46 | -1.04 | -0.63 |
| رو س.إ | 0.1058 | 0.1467 | 0.0971 | 0.1287 | 0.1190 | 0.1113 | 0.1560 | 0.1292 |
| عربة سكن متنقلة | 0.0039 | 0.0005 | 0.0788 | 0.0011 | 0.0224 | 0.0403 | 0.0006 | 0.0051 |
| العائد طويل الأجل | 0.0039 | 0.0016 | 0.0788 | 0.0011 | 0.0224 | 0.0403 | 0.0017 | 0.0051 |
|
|
0 | 1 | 0 | 0 | 0 | 0 | 1 | 0 |
|
|
٥٧ | ٥٦ | ٥٧ | ٥٧ | 57 | ٥٧ | ٥٦ | ٥٧ |
|
|
٨ | ٨ | ٨ | ٨ | ٨ | ٨ | ٨ | ٨ |
| اختبارات تشخيصية |
|
نموذج EF | قرار | ||
| معامل | احتمال | معامل | احتمال | ||
|
|
>0.9920 | – | >0.9948 | – | النموذج ملائم بشكل جيد |
|
|
>0.9914 | – | >0.9944 | – | النموذج ملائم بشكل جيد |
| جي-بي | ٤.٤٣١٣ | 0.1091 | 0.8924 | 0.2276 | المتبقيات موزعة بشكل طبيعي |
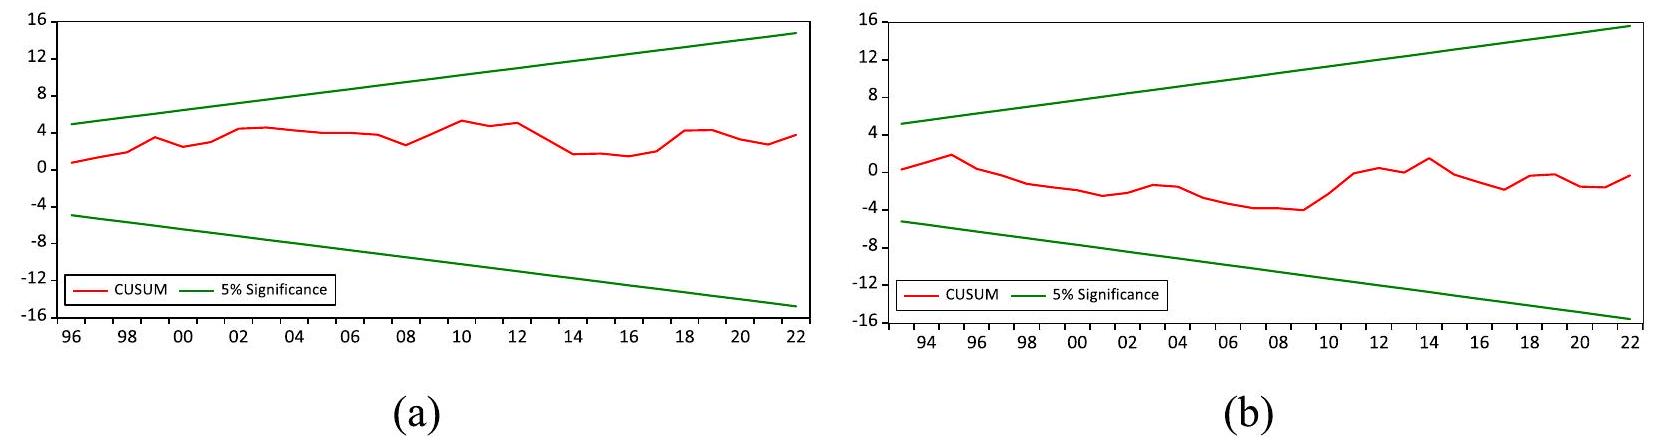
| كوسوم | – | <0.05 | – | <0.05 | النموذج مستقر |
| اختبار ب-جي إل إم | 1.6554 | 0.2113 | 1.8126 | 0.1819 | لا توجد علاقة تسلسلية |
| اختبار ب-ب-ج | 0.4639 | 0.9731 | 1.1401 | 0.3633 | لا توجد تباين غير متجانس |
| اختبار جليزر | 0.8330 | 0.6782 | 1.5865 | 0.1169 | لا توجد تباين غير متجانس |
| اختبار ARCH | 0.1737 | 0.6786 | 0.7391 | 0.3940 | لا توجد تباين غير متجانس |
| اختبار رامزي | 0.9115 | 0.3704 | 0.0720 | 0.9431 | النموذج محدد بشكل صحيح |
| متغير |
|
|||||
| النموذج 1 | النموذج 2 | موديل 3 | ||||
| FMOLS | دولز | FMOLS | دولز | FMOLS | دولز | |
| المعامل (إحصاء t) | المعامل (إحصاء t) | المعامل (إحصاء t) | المعامل (إحصاء t) | المعامل (إحصاء t) | المعامل (إحصاء t) | |
| إنكوال |
|
|
– | – | – | – |
| في النفط | – | -0.4259 (-1.2864) | -0.5192 (-0.9548) | – | – | |
| إنغاس | – | – | – |
|
|
|
| فيما يتعلق بـ |
|
|
|
|
|
-0.1328
|
| في الناتج المحلي الإجمالي |
|
|
|
|
|
|
| InGFCF | -0.0104 (-0.0926) | -0.0130 (-0.1055) | -0.0254 (-0.2096) | -0.0056 (-0.0382) |
|
|
| ج | -17.4618 | -16.5924 | -15.6480 | -14.0460 | -24.0117 | -24.7915 |
| متغير |
|
|||||
| النموذج 1 | النموذج 2 | موديل 3 | ||||
| FMOLS | دولز | FMOLS | دولز | FMOLS | دولز | |
| المعامل (إحصاء t) | المعامل (إحصاء t) | المعامل (إحصاء t) | المعامل (إحصاء t) | المعامل (إحصاء t) | المعامل (إحصاء t) | |
| إنكوال | 0.0110 (1.2148) | 0.0167 (1.4937) | – | – | – | – |
| في النفط | – | – |
|
|
– | – |
| إنغاس | – | – | – | – | -0.0118 (-0.6535) | 0.0053 (0.2157) |
| فيما يتعلق بـ |
|
-0.0444
|
-0.0084 (-0.7011) | -0.0137 (-0.9618) | -0.0232
|
|
| في الناتج المحلي الإجمالي |
|
|
|
|
|
|
| InGFCF | -0.2747
|
-0.2583
|
-0.2934
|
-0.2880
|
-0.2661
|
-0.2845
|
| ج | -1.0168 | -0.6839 | -4.2644 | -5.7548 | -1.4507 | -1.8610 |
4.4.3 اختبار المتانة باستخدام CCR لانبعاثات ثاني أكسيد الكربون والبصمة البيئية
البصمة البيئية. أكدت تحليل CCR قوة نتائج FMOLS و DOLS السابقة. على وجه التحديد، بالنسبة لـ
| متغير |
|
|
||||
| النموذج 1 | النموذج 2 | موديل 3 | النموذج 1 | النموذج 2 | موديل 3 | |
| المعامل (إحصاء t) | المعامل (إحصاء t) | المعامل (إحصاء t) | المعامل (إحصاء t) | المعامل (إحصاء t) | المعامل (إحصاء t) | |
| إنكوال |
|
– | – | 0.0114 (1.2412) | – | – |
| في النفط | – | -0.4266 (-1.1081) | – | – |
|
– |
| إنغاس | – | – |
|
– | – | -0.0098 (-0.5234) |
| فيما يتعلق بـ |
|
|
|
|
-0.0093 (-0.7490) | -0.0241
|
| في الناتج المحلي الإجمالي |
|
|
|
|
|
|
| InGFCF | -0.0042 (-0.0372) | -0.0191 (-0.1562) |
|
-0.2774
|
-0.2946
|
-0.2704
|
| ج | -17.5816 | -15.5905 | -24.0313 | -1.0400 | -4.1500 | -1.4871 |
إندونيسيا. إن اتساق نتائج CCR مع تحليلات FMOLS و DOLS عبر نماذج ومتغيرات مختلفة يمنح الثقة في الاستنتاجات المستخلصة حول تأثير استهلاك الطاقة، والنمو الاقتصادي، وتكوين رأس المال على
4.5 نتائج السببية جرانجر بالزوج
الانبعاثات إلى GFCF و RE، ومن GAS إلى
5 المناقشة
|
|
البصمة البيئية | ||||||
| الفرضية الصفرية: | إحصاء F | احتمال | نتيجة | الفرضية الصفرية: | إحصاء F | احتمال | نتيجة |
| إنكوال
|
1.2100 | 0.3198 |
|
إنكوال
|
0.4950 | 0.7394 | EF
|
|
|
1.7355 | 0.1588 | إن إف
|
1.3654 | 0.2610 | ||
| في النفط
|
0.5818 | 0.6774 |
|
في النفط
|
1.2860 | 0.2897 |
|
|
|
1.2029 | 0.3228 | إن إف
|
|
0.0461 | ||
|
|
|
0.0844 |
|
|
1.6981 | 0.1671 | EF
|
|
|
0.6507 | 0.6294 | إن إف
|
0.7301 | 0.5762 | ||
| فيما يتعلق بـ
|
0.9947 | 0.4203 |
|
|
|
0.0894 |
|
|
|
|
0.0240 | إن إف
|
|
0.0841 | ||
|
|
1.0717 | 0.3817 |
|
|
1.9162 | 0.1242 |
|
|
|
0.9231 | 0.4589 | إن إف
|
|
0.0772 | ||
|
|
0.4819 | 0.7489 |
|
|
1.2097 | 0.3199 |
|
|
|
|
0.0450 | إن إف
|
|
0.0225 | ||
5.1 الطاقة غير المتجددة،
هذه البدائل المستدامة. يجب على صانعي السياسات تنفيذ سياسات داعمة وحوافز لتسريع الانتقال نحو مصادر الطاقة المتجددة، مما يساهم في التخفيف من
5.2 الطاقة المتجددة،
السببية الثنائية الاتجاه بين البصمة البيئية والطاقة المتجددة، مما يظهر تفاعلًا تآزريًا. مع زيادة استخدام الطاقة المتجددة، تنخفض البصمة البيئية، مما يؤسس حلقة تغذية راجعة تعزز نفسها. تدعم هذه النتائج ما توصل إليه رادمهير وآخرون (2022)، كونغبواماي وآخرون (2021)، عثمان وحمر (2021)، وناثانيال وخان (2020).
5.3 النمو الاقتصادي،
5.4 تشكيل رأس المال،
6 الخاتمة، والآثار السياسية، والقيود
لعدم الامتثال يمكن أن يخفف بشكل فعال
تقدم هذه الدراسة رؤى قيمة حول التأثير الديناميكي لمصادر الطاقة، والنمو الاقتصادي، وتشكيل رأس المال على
الاختصارات
| ADF | اختبار ديكي-فولر الموسع |
| ARDL | تأخير ذاتي موزع |
| CO2 | انبعاثات ثاني أكسيد الكربون |
| COAL | فحم |
| CUSUM | المجموع التراكمي للبقايا التكرارية |
| CCR | الانحدار المتزامن الكنسي |
| DOLS | المربعات العادية الديناميكية |
| EF | البصمة البيئية |
| FMOLS | المربعات العادية المعدلة بالكامل |
| ESDM | وزارة الطاقة والموارد المعدنية |
| GAS | غاز |
| GDP | الناتج المحلي الإجمالي |
| GFCF | تشكيل رأس المال الثابت الإجمالي |
| GFN | شبكة البصمة العالمية |
| IEA | الوكالة الدولية للطاقة |
| IESR | معهد إصلاح الخدمات الأساسية |
| LCU | وحدة العملة المحلية |
| OIL | نفط |
| OWID | عالمنا في البيانات |
| P-P | فيليبس-بيرون |
| RE | الطاقة المتجددة |
| SEA | جنوب شرق آسيا |
| VECM | نموذج تصحيح الخطأ المتجه |
| WDI | مؤشر التنمية العالمية |
الشكر والتقدير
مساهمات المؤلفين
التمويل
توفر البيانات والمواد
الإعلانات
موافقة الأخلاقيات والموافقة على المشاركة
المصالح المتنافسة
تفاصيل المؤلف
نُشر على الإنترنت: 16 أبريل 2024
References
Acevedo-Ramos JA, Valencia CF, Valencia CD (2023) The Environmental Kuznets Curve Hypothesis for Colombia: Impact of Economic Development on Greenhouse Gas Emissions and Ecological Footprint. Sustainability 15:3738. https://doi.org/10.3390/su15043738
Acheampong AO, Adams S, Boateng E (2019) Do globalization and renewable energy contribute to carbon emissions mitigation in Sub-Saharan Africa? Sci Total Environ 677:436-446. https://doi.org/10.1016/j.scitotenv.2019. 04.353
Adekoya OB, Oliyide JA, Fasanya IO (2022) Renewable and non-renewable energy consumption – Ecological footprint nexus in net-oil exporting and net-oil importing countries: Policy implications for a sustainable environment. Renew Energy 189:524-534. https://doi.org/10.1016/j. renene.2022.03.036
Aderinto ER, Ogunro TT (2021) Population growth and environmental degradation in Nigeria: A comparative analysis of Carbon dioxide emissions and ecological footprint. Interdiscip J Appl Basics Subj 1:26-36
Afjal M, Kathiravan C, Dana LP, Nagarajan CD (2023) The Dynamic Impact of Financial Technology and Energy Consumption on Environmental Sustainability. Sustainability 15:9327. https://doi.org/10.3390/su15129327
Ali A, Radulescu M, Balsalobre-Lorente D (2023) A dynamic relationship between renewable energy consumption, nonrenewable energy consumption, economic growth, and carbon dioxide emissions: Evidence from Asian emerging economies. Energy Environ 34:3529-3552. https:// doi.org/10.1177/0958305X231151684
AlNemer HA, Hkiri B, Tissaoui K (2023) Dynamic impact of renewable and nonrenewable energy consumption on CO2 emission and economic growth
in Saudi Arabia: Fresh evidence from wavelet coherence analysis. Renew Energy 209:340-356. https://doi.org/10.1016/j.renene.2023.03.084
Alola AA, Bekun FV, Sarkodie SA (2019) Dynamic impact of trade policy, economic growth, fertility rate, renewable and non-renewable energy consumption on ecological footprint in Europe. Sci Total Environ 685:702-709. https://doi.org/10.1016/j.scitotenv.2019.05.139
Amin N, Song H (2022) The role of renewable, non-renewable energy consumption, trade, economic growth, and urbanization in achieving carbon neutrality: A comparative study for South and East Asian countries. Environ Sci Pollut Res 30:12798-12812. https://doi.org/10.1007/ s11356-022-22973-2
Ansari MA (2022) Re-visiting the Environmental Kuznets curve for ASEAN: A comparison between ecological footprint and carbon dioxide emissions. Renew Sustain Energy Rev 168:112867. https://doi.org/10.1016/j.rser. 2022.112867
Arshad Z, Robaina M, Botelho A (2020) Renewable and Non-renewable Energy, Economic Growth and Natural Resources Impact on Environmental Quality: Empirical Evidence from South and Southeast Asian Countries with CS-ARDL Modeling. Int J Energy Econ Policy. 10:368-383. https://doi.org/ 10.32479/ijeep. 9956
Ben Jebli M, Ben Youssef S, Ozturk I (2016) Testing environmental Kuznets curve hypothesis: The role of renewable and non-renewable energy consumption and trade in OECD countries. Ecol Indic 60:824-831. https:// doi.org/10.1016/j.ecolind.2015.08.031
Bhat JA (2018) Renewable and non-renewable energy consumption-impact on economic growth and CO2 emissions in five emerging market economies. Environ Sci Pollut Res 25:35515-35530. https://doi.org/10.1007/ s11356-018-3523-8
Chang Z, Shen G, Jiang K, Huang W, Zhao J, Luo Z, Men Y, Xing R, Zhao N, Pan B, Xing B, Tao S (2024) Environmental implications of residual pyrogenic carbonaceous materials from incomplete biomass combustion: a review. Carbon Res 3:15. https://doi.org/10.1007/s44246-024-00103-6
Chekouri SM, Chibi A, Benbouziane M (2023) The impact of natural resource abundance on ecological footprint: evidence from Algeria. Environ Sci Pollut Res 30:69289-69306. https://doi.org/10.1007/s11356-023-26720-z
Chen Y, Zhao J, Lai Z, Wang Z, Xia H (2019) Exploring the effects of economic growth, and renewable and non-renewable energy consumption on China’s CO2 emissions: Evidence from a regional panel analysis. Renew Energy 140:341-353. https://doi.org/10.1016/j.renene.2019.03.058
Chien F, Hsu C-C, Moslehpour M, Sadiq M, Tufail B, Ngo TQ (2023) A step toward sustainable development: the nexus of environmental sustainability, technological advancement and green finance: evidence from Indonesia. Environ Dev Sustain. https://doi.org/10.1007/ s10668-023-03424-5
Christoforidis T, Katrakilidis C (2021) The dynamic role of institutional quality, renewable and non-renewable energy on the ecological footprint of OECD countries: do institutions and renewables function as leverage points for environmental sustainability? Environ Sci Pollut Res 28:5388853907. https://doi.org/10.1007/s11356-021-13877-8
Destek MA, Sinha A (2020) Renewable, non-renewable energy consumption, economic growth, trade openness and ecological footprint: Evidence from organisation for economic Co-operation and development countries. J Clean Prod 242:118537. https://doi.org/10.1016/j.jclepro.2019. 118537
Dickey DA, Fuller WA (1979) Distribution of the Estimators for Autoregressive Time Series with a Unit Root. J Am Stat Assoc 74:427-431. https://doi.org/ 10.1080/01621459.1979.10482531
Engle RF, Granger CWJ (1987) Co-Integration and Error Correction: Representation, Estimation, and Testing. Econometrica 55(2):251-276. https://doi. org/10.2307/1913236
ESDM (2021) Indonesia: National Electricity Supply Business Plan (RUPTL) 2021-2030
GFN (2023) Global Footprint Network https://data.footprintnetwork.org/#/
Granger CWJ (1969) Investigating Causal Relations by Econometric Models and Cross-spectral Methods. Econometrica 37:424. https://doi.org/10. 2307/1912791
Hanif I, Aziz B, Chaudhry IS (2019) Carbon emissions across the spectrum of renewable and nonrenewable energy use in developing economies of Asia. Renew Energy 143:586-595. https://doi.org/10.1016/j.renene.2019.05.032
Hardi I, Idroes GM, Zulham T, Suriani S, Saputra J (2023) Economic Growth, Agriculture, Capital Formation and Greenhouse Gas Emissions in Indonesia: FMOLS, DOLS and CCR Applications. Ekon J Econ 1:82-91. https://doi. org/10.60084/eje.v1i2.109
Hardi I, Ray S, Attari MUQ, Ali N, Idroes GM (2024) Innovation and Economic Growth in the Top Five Southeast Asian Economies: A Decomposition Analysis. Ekon J Econ 2:1-14. https://doi.org/10.60084/eje.v2i1.145
He X, Adebayo TS, Kirikkaleli D, Umar M (2021) Consumption-based carbon emissions in Mexico: An analysis using the dual adjustment approach. Sustain Prod Consum 27:947-957. https://doi.org/10.1016/j.spc.2021.02.020
Idroes GM, Hardi I, Nasir M, Gunawan E, Maulidar P, Maulana ARR (2023a) Natural Disasters and Economic Growth in Indonesia. Ekon J Econ 1:33-39. https://doi.org/10.60084/eje.v1i1.55
Idroes GM, Hardi I, Noviandy TR, Sasmita NR, Hilal IS, Kusumo F, Idroes R (2023b) A Deep Dive into Indonesia’s CO2 Emissions: The Role of Energy Consumption, Economic Growth and Natural Disasters. Ekon J Econ 1:69-81. https://doi.org/10.60084/eje.v1i2.115
Idroes GM, Syahnur S, Majid MSA, Idroes R, Kusumo F, Hardi I (2023c) Unveiling the Carbon Footprint: Biomass vs. Geothermal Energy in Indonesia. Ekon J Econ 1:10-18. https://doi.org/10.60084/eje.v1i1.47
IEA (2022) Enhancing Indonesia’s Power System. https://www.iea.org/reports/ enhancing-indonesias-power-system
IESR (2022) Indonesia Energy Transition Outlook 2023. https://iesr.or.id/wp-conte nt/uploads/2022/12/Indonesia-Energy-Transition-Outlook_2023.pdf
Ito K (2017) CO2 emissions, renewable and non-renewable energy consumption, and economic growth: Evidence from panel data for developing countries. Int Econ 151:1-6. https://doi.org/10.1016/j.inteco.2017.02.001
Johansen S (1988) Statistical analysis of cointegration vectors. J Econ Dyn Control 12:231-254. https://doi.org/10.1016/0165-1889(88)90041-3
Kartal HM, Acaroğlu H, Garcia Marquez FP (2023) The Validity of the Environmental Kuznets Curve in Terms of the Ecological Foot Print and Energy Consumption Diversity: The Case of Turkey. In: García Márquez FP, Segovia Ramírez I, Bernalte Sánchez PJ, Muñoz del Río A (eds) IoT and Data Science in Engineering Management. CIO 2022. Lecture Notes on Data Engineering and Communications Technologies, vol 160. Springer, Cham. https://doi.org/10.1007/978-3-031-27915-7_49
Khan SAR, Zia-UI-Haq HM, Ponce P, Janjua L (2023) Re-investigating the impact of non-renewable and renewable energy on environmental quality: A roadmap towards sustainable development. Resour Policy 81:103411. https://doi.org/10.1016/j.resourpol.2023.103411
Koc S, Bulus GC (2020) Testing validity of the EKC hypothesis in South Korea: role of renewable energy and trade openness. Environ Sci Pollut Res 27:29043-29054. https://doi.org/10.1007/s11356-020-09172-7
Kongbuamai N, Bui Q, Nimsai S (2021) The effects of renewable and nonrenewable energy consumption on the ecological footprint: the role of environmental policy in BRICS countries. Environ Sci Pollut Res 28:27885-27899. https://doi.org/10.1007/s11356-021-12551-3
Kostakis I (2024) An empirical investigation of the nexus among renewable energy, financial openness, economic growth, and environmental degradation in selected ASEAN economies. J Environ Manage 354:120398. https://doi.org/10.1016/j.jenvman.2024.120398
Kurniawan R, Nugroho NAA, Fudholi A, Purwanto A, Sumargo B, Gio PU, Wongsonadi SK (2023) The ecological footprint of industrial value added and energy consumption in Indonesia. Int J Energy Sect Manag. https:// doi.org/10.1108/IJESM-05-2023-0006
Massagony A, Budiono, (2023) Is the Environmental Kuznets Curve (EKC) hypothesis valid on CO 2 emissions in Indonesia? Int J Environ Stud 80:20-31. https://doi.org/10.1080/00207233.2022.2029097
Maulidar P, Fitriyani F, Sasmita NR, Hardi I, Idroes GM (2024) Exploring Indonesia’s CO2 Emissions: The Impact of Agriculture, Economic Growth, Capital and Labor. Grimsa J Bus Econ Stud 1:43-55. https://doi.org/10.61975/ gjbes.v1i1.22
Munir Q, Lean HH, Smyth R (2020) CO2 emissions, energy consumption and economic growth in the ASEAN-5 countries: A cross-sectional dependence approach. Energy Econ 85:104571. https://doi.org/10.1016/j.eneco. 2019.104571
Nathaniel S, Khan SAR (2020) The nexus between urbanization, renewable energy, trade, and ecological footprint in ASEAN countries. J Clean Prod 272:122709. https://doi.org/10.1016/j.jclepro.2020.122709
Naveed M, Islam M, Usman M, Kamal M, Khan MF (2023) Demystifying the association between economic development, transportation, tourism, renewable energy, and ecological footprint in Bay of Bengal Initiative for Multi-Sectoral Technical and Economic Cooperation region during globalization mode. Environ Sci Pollut Res 30:120137-120154. https://doi. org/10.1007/s11356-023-30706-2
OWID (2023) Our World in Data. https://ourworldindata.org/#entries
Park JY (1992) Canonical Cointegrating Regressions. Econometrica 60:119. https://doi.org/10.2307/2951679
Pata UK (2021) Linking renewable energy, globalization, agriculture, CO2 emissions and ecological footprint in BRIC countries: A sustainability perspective. Renew Energy 173:197-208. https://doi.org/10.1016/j.renene. 2021.03.125
Phillips PCB, Hansen BE (1990) Statistical Inference in Instrumental Variables Regression with I(1) Processes. Rev Econ Stud 57:99. https://doi.org/10. 2307/2297545
Phillips PCB, Perron P (1988) Testing for a Unit Root in Time Series Regression. Biometrika 75:335. https://doi.org/10.2307/2336182
Pirmana V, Alisjahbana AS, Yusuf AA, Hoekstra R, Tukker A (2021) Environmental Cost in Indonesia Spillover Effect Between Consumption and Production. Front Sustain. 2. https://doi.org/10.3389/frsus.2021.720177
Pujiati A, Yanto H, Dwi Handayani B, Ridzuan AR, Borhan H, Shaari MS (2023) The detrimental effects of dirty energy, foreign investment, and corruption on environmental quality: New evidence from Indonesia. Front Environ Sci. 10. https://doi.org/10.3389/fenvs.2022.1074172
Radmehr R, Shayanmehr S, Ali EB, Ofori EK, Jasińska E, Jasiński M (2022) Exploring the Nexus of Renewable Energy, Ecological Footprint, and Economic Growth through Globalization and Human Capital in G7 Economics. Sustainability 14:12227. https://doi.org/10.3390/su141912227
Rahman MH, Majumder SC (2022) Empirical analysis of the feasible solution to mitigate the CO2 emission: evidence from Next-11 countries. Environ Sci Pollut Res 29:73191-73209. https://doi.org/10.1007/s11356-022-20908-5
Rahman MM (2022) Test and performance optimization of nozzle inclination angle and swirl combustor in a low-tar biomass gasifier: a biomass power generation system perspective. Carbon Resour Convers 5:139-149. https://doi.org/10.1016/j.crcon.2022.01.002
Rahman MM, Aravindakshan S, Hoque MA, Rahman MA, Gulandaz MA, Rahman J, Islam MT (2021a) Conservation tillage (CT) for climate-smart sustainable intensification: Assessing the impact of CT on soil organic carbon accumulation, greenhouse gas emission and water footprint of wheat cultivation in Bangladesh. Environ Sustain Indic 10:100106. https:// doi.org/10.1016/j.indic.2021.100106
Rahman MH, Voumik LC, Islam MJ, Halim MA, Esquivias MA (2022) Economic Growth, Energy Mix, and Tourism-Induced EKC Hypothesis: Evidence from Top Ten Tourist Destinations. Sustainability 14:16328. https://doi.org/ 10.3390/su142416328
Raihan A (2024) The interrelationship amid carbon emissions, tourism, economy, and energy use in Brazil. Carbon Res 3:11. https://doi.org/10. 1007/s44246-023-00084-y
Raihan A, Tuspekova A (2022) Dynamic impacts of economic growth, renewable energy use, urbanization, industrialization, tourism, agriculture, and forests on carbon emissions in Turkey. Carbon Res 1:20. https://doi.org/ 10.1007/s44246-022-00019-z
Saboori B, Sulaiman J (2013) Environmental degradation, economic growth and energy consumption: Evidence of the environmental Kuznets curve in Malaysia. Energy Policy 60:892-905. https://doi.org/10.1016/j.enpol. 2013.05.099
Saqib N (2022) Nexus between the renewable and nonrenewable energy consumption and carbon footprints: evidence from Asian emerging economies. Environ Sci Pollut Res 29:58326-58340. https://doi.org/10. 1007/s11356-022-19948-8
Stock JH, Watson MW (1993) A Simple Estimator of Cointegrating Vectors in Higher Order Integrated Systems. Econometrica 61:783. https://doi.org/ 10.2307/2951763
Usman M, Hammar N (2021) Dynamic relationship between technological innovations, financial development, renewable energy, and ecological footprint: fresh insights based on the STIRPAT model for Asia Pacific Economic Cooperation countries. Environ Sci Pollut Res 28:15519-15536. https://doi.org/10.1007/s11356-020-11640-z
Usman M, Makhdum MSA (2021) What abates ecological footprint in BRICS-T region? Exploring the influence of renewable energy, non-renewable energy, agriculture, forest area and financial development. Renew Energy 179:12-28. https://doi.org/10.1016/j.renene.2021.07.014
Voumik LC, Islam MA, Ray S, Mohamed Yusop NY, Ridzuan AR (2023) CO2 Emissions from Renewable and Non-Renewable Electricity Generation Sources in the G7 Countries: Static and Dynamic Panel Assessment. Energies 16:1044. https://doi.org/10.3390/en16031044
Wackernagel M, Beyers B (2019) Ecological footprint: Managing our biocapacity budget (New Society Publishers)
WDI (2023) WorldBank Development Indicator Databased. https://databank. worldbank.org/source/world-development-indicators
Yahya Y, Saleh SM, Majid MSA (2023) Effects of road infrastructure, energy consumption, and economic growth on CO2 emission in Indonesia. p 070014
Yusuf MS, Musibau HO, Dirie KA, Shittu WO (2023) Role of trade liberalization, industrialisation and energy use on carbon dioxide emissions in Australia: 1990 to 2018. Environ Sci Pollut Res 30:79481-79496. https://doi.org/10. 1007/s11356-023-27825-1
ملاحظة الناشر
- المحرر المسؤول: سو شيوينغ لام.
*المراسلة:
رينالدي إيدروس
rinaldi.idroes@usk.ac.id
تتوفر القائمة الكاملة لمعلومات المؤلف في نهاية المقال - *قيم p هي من ماكينون (1996). **عدد الاتجاهات العشوائية (stoc.) في التوزيع اللانهائي. تمثل Obs. الملاحظات، وتمثل RV تباين البقايا، وتمثل SE الخطأ المعياري
- b و
تشير إلى مستويات الدلالة عند و ، على التوالي و تشير إلى مستوى الدلالة عند و ، على التوالي. ( ) و ( ) تدل على السببية أحادية الاتجاه، ( ) تشير إلى السببية ثنائية الاتجاه، و( ) تشير إلى عدم وجود سببية
DOI: https://doi.org/10.1007/s44246-024-00117-0
Publication Date: 2024-04-16
The dynamic impact of non-renewable and renewable energy on carbon dioxide emissions and ecological footprint in Indonesia
Check for updates
Abstract
The global trend of environmental degradation, marked by escalating carbon dioxide (
Highlights
- Renewable energy is a key sector for enhancing environmental quality in Indonesia.
- This study explores the potential factors for reducing
emissions and ecological footprint in Indonesia. - The FMOLS and DOLS methods have been applied to time series data, supported by a robustness test using CCR.
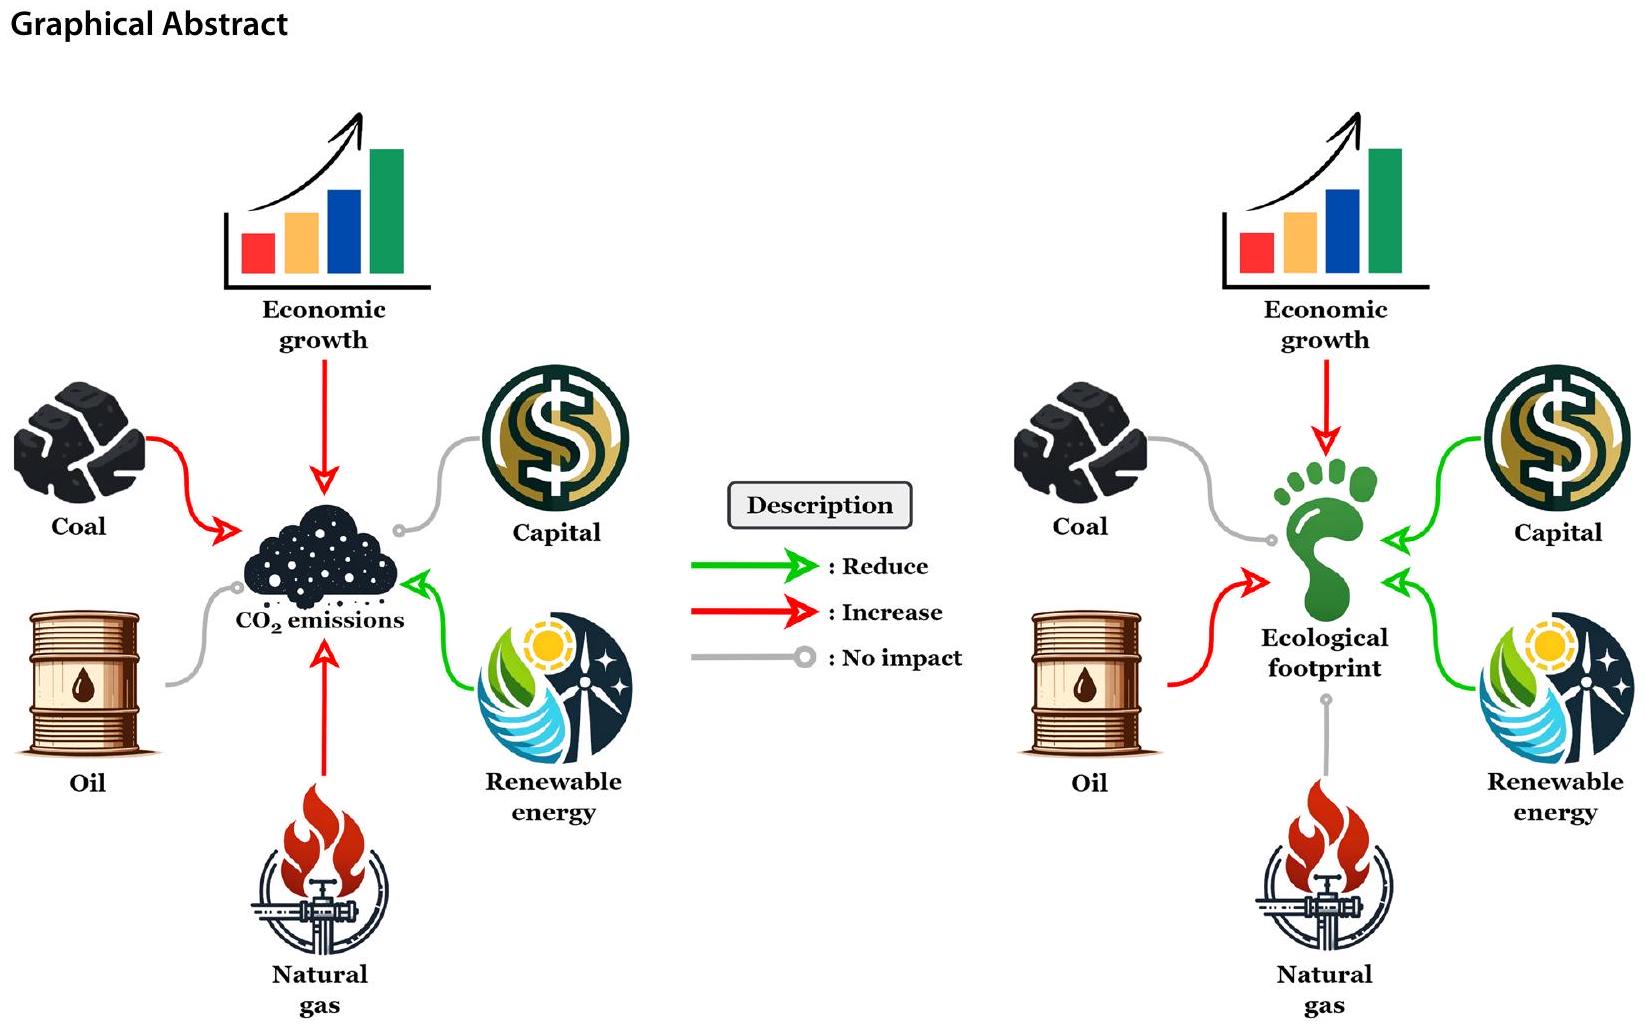
- The results provide a clearer insight into how renewable energy can help decrease both
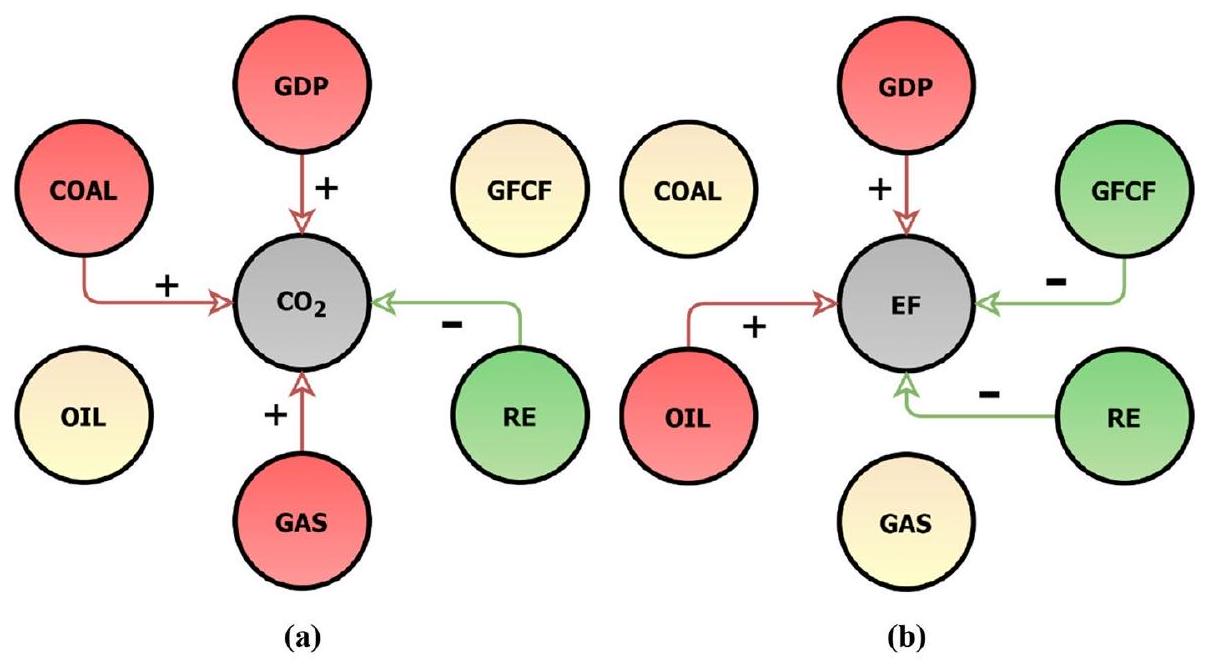
emissions and the ecological footprint, whereas non-renewable energy exacerbates these issues in Indonesia. - This study offers policy recommendations to help achieve environmental sustainability and carbon neutrality.
1 Introduction
environmental degradation despite their contribution to economic development (Kartal et al. 2023). This study situates itself within the context of these global concerns, with a focused lens on Indonesia, a region that epitomizes the struggle between developmental aspirations and environmental sustainability. Southeast Asia, particularly Indonesia, stands at a crucial juncture where rapid economic growth has been paralleled by an intensifying energy demand, predominantly met through non-renewable sources like coal, oil, and gas (Munir et al. 2020; Idroes et al. 2023b; Hardi et al. 2024; Kostakis 2024). This energy consumption pattern not only contributes to rising
telling. As a nation grappling with a bio-deficit, where the ecological footprint overshadows the bio-capacity, Indonesia ranks among the top countries globally with a significant ecological footprint. This situation underscores the urgency to delve deeper into the country’s energy consumption patterns and their environmental repercussions. However, a noticeable gap in the existing literature is the lack of comprehensive studies that simultaneously address the dual aspects of environmental impact of
Expanding upon the background of the study, it delves into the multifaceted relationship between energy consumption and environmental impact, with a special focus on the Southeast Asian context, particularly Indonesia. This region, amid rapid economic and population growth, is experiencing an increase in energy demands, predominantly met by fossil fuels. This reliance is not without consequence, as it substantially contributes to the growing ecological footprint and
Moreover, Indonesia’s environmental challenges are further compounded by its ecological footprint. The concept of the ecological footprint, which measures the demand on Earth’s ecosystems, reveals that Indonesia faces a bio-deficit situation. Its ecological footprint
exceeds its bio-capacity, placing it among the top ten countries globally with the highest ecological footprints (Kurniawan et al. 2023; Pata et al. 2021; Pirmana et al. 2021; Wackernagel and Beyers 2019). This alarming situation underscores the urgency to reevaluate and reform the country’s energy consumption patterns and environmental policies. In response to these challenges, Indonesia has initiated measures to mitigate its environmental impact. The Institute for Essential Services Reform reports on the country’s target to reach an accelerated peak in emissions in the power sector by 2030, with an ambitious goal of achieving net-zero emissions by 2050. Key strategies include increasing renewable energy generation to at least
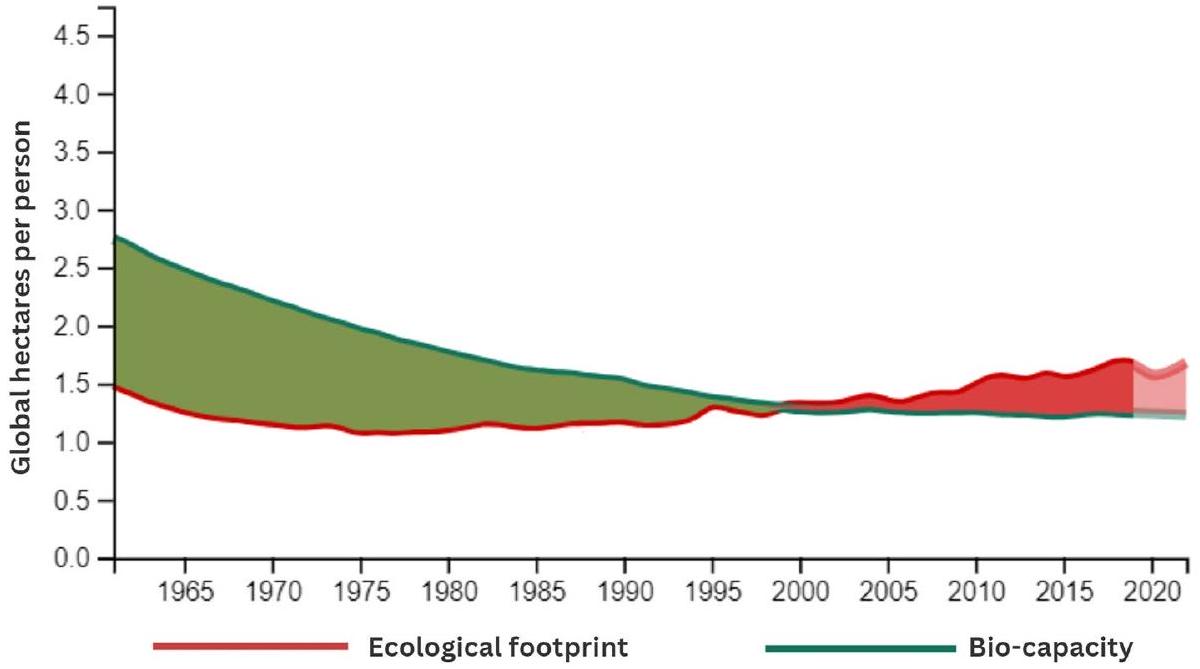
Furthermore, adding to the African perspective, a study by Khan et al. (2023) was conducted in 41 Sub-Saharan countries, focusing on the interplay of renewable and non-renewable energy sources alongside economic factors in shaping environmental quality across the region. Their findings underscore the pivotal role of renewable energy in enhancing environmental conditions, contrasting with the detrimental impact of fossil fuel consumption on the environment. Finally, this study investigated the role of institutional quality, renewable, and nonrenewable energy on the ecological footprint of OECD countries. It suggests that institutions and renewable energy can leverage environmental sustainability, emphasizing the importance of governance and policy in environmental management (Christoforidis and Katrakilidis 2021; Chang et al. 2024). As illustrated in Fig. 2, Indonesia’s bio-capacity exhibits a declining trend over time, accompanied by a corresponding increase in its ecological footprint.
The significance of this research lies in its comprehensive approach to analysing the interplay between various energy sources, economic growth, and environmental impact in Indonesia. By examining both non-renewable and renewable energy sources, alongside factors like economic growth and capital formation, the study aimed to provide a deeper understanding of their effects on
challenges-towards a future where economic development is harmonized with ecological preservation. The findings of this study were poised to contribute significantly to global efforts in combating climate change and promoting sustainable development, serving as a potential blueprint for environmental policy and energy management.
2 Literature review
Specific to Indonesia, the research landscape becomes more nuanced. Massagony and Budiono (2023) asserted that fossil energy consumption is a significant driver of
Recent research has illuminated the intricate links between renewable and non-renewable energy sources, ecological footprint, and various socio-economic factors within the discourse on energy consumption’s environmental impact. These insights play a vital role in refining our comprehension of sustainable environmental management across diverse global contexts. Adekoya et al. (2022) studied this nexus in net-oil exporting and importing nations. Their study delved into how the
reliance on oil, whether as a major export or import, influenced the ecological implications of energy consumption. This research is significant in highlighting the different environmental impacts in countries based on their oil trade status, offering vital policy implications for balancing energy mix to sustainably manage their ecological footprints. Further expanding the scope of this discussion, Dogan et al. (2022) presented a study focusing on South Asian economies, examining the relationship between ecological footprint, unemployment, and both types of energy consumption. Their inclusion of unemployment as a variable in analyzing environmental impacts provides a broader socio-economic perspective. This approach reveals the complex interplay between labor market dynamics and energy consumption patterns, offering insights into the multifaceted challenges faced by developing economies in the region in pursuing sustainable development. Complementing these studies, Amin and Song (2022) conducted a comparative analysis in SEA countries, analyzing the impact of renewable and non-renewable energy in achieving carbon neutrality. Their work stands out for its comprehensive inclusion of factors like trade, economic growth, and urbanization. This comparative approach offers a regional perspective on strategies for achieving carbon neutrality, emphasizing how different Asian regions are addressing the challenges posed by energy consumption, economic and urban development in their quest for environmental sustainability.
impacts. In these studies, the relationship between economic activities, energy consumption, and their effects on ecological footprint takes center stage. Nathaniel (2021) delved into this interplay, uncovering how environmental degradation in Indonesia was not only a consequence of economic growth but also of increased energy consumption. This study is pivotal in establishing a one-way causal relationship where economic growth directly leads to an escalation in the ecological footprint. This finding is critical as it emphasizes the environmental cost of economic expansion in a developing nation like Indonesia. Furthering this discourse, Chien et al. (2023) employed the Quantile ARDL Model to dissect the nuances of this relationship. Their research uncovered that the impact of economic growth on the ecological footprint is not uniform but varies across different levels of economic activity. This positive association between economic growth and ecological footprints across various quantiles presents a more complex and layered understanding of the issue, suggesting that the environmental impact of economic growth might be more significant at certain stages of economic development than others. Kurniawan et al. (2023) contributed a different perspective using Vector Error Correction Model (VECM) analysis. Their study revealed a rapid short-term adjustment in environmental damage in Indonesia, quantified at
Despite these extensive studies, there exists a notable gap in the simultaneous examination of the impacts of energy consumption on both
ecological footprint, especially in Indonesia. This gap necessitates a comprehensive study that integrates these aspects to provide a more holistic understanding of Indonesia’s environmental challenges. The hypothesis, therefore, is that in Indonesia, the type of energy con-sumed-renewable or non-renewable-has a significant and differential impact on both
3 Methodology
3.1 Data and variables summary
3.2 Theoretical framework and empirical model
| Variables | Desc & Log F | Units | Objectives | Sources |
|
|
|
Millon tonnes | To assess the environmental impact in terms of the volume of greenhouse gases released into the atmosphere due to activities such as fossil fuel combustion | OWID |
| EF | Ecological footprint (InEF) | Total ecological footprint | To quantify the demand on earth’s ecosystems and evaluate the sustainability of consumption by measuring the natural resources consumed and waste produced, along with its environmental implications | GFN |
| COAL | Coal (InCOAL) | Share of primary energy (%) | OWID | |
| OIL | Oil (InOIL) | To quantify the contributions of coal, oil, and gas to the energy sector and their environmental consequences as significant sources of
|
||
| RE | Renewable energy (InRE) | Share of primary energy (%) | To examine how the adoption of renewable energy sources contributes to the reduction of environmental impacts, offering a more sustainable alternative to fossil fuels | OWID |
| GDP | Economic growth (InGDP) | Constant LCU | To measure the total market value of all goods and services produced within a country’s borders over a specific time period | WDI |
| GFCF | Gross fixed capital formation (InGFCF) | Constant LCU | To measure the total value of investments in fixed assets, such as machinery and infrastructure, within a country’s borders over a specific time period | WDI |
cointegration suggested that, despite short-term discrepancies, there is a consistent long-term relationship between the variables, which is a vital aspect for our subsequent analysis and predictive modeling in time series data.
3.4 Dynamic tests with FMOLS and DOLS
3.3 Unit root and cointegration tests
3.5 The robustness test with CCR
of our FMOLS and DOLS estimations. Employing this robustness test underscored our commitment to a thorough and nuanced analysis, ensuring that the conclusions drawn from our study are not only insightful but also stand firm against rigorous statistical examination.
3.6 Pairwise Granger causality
The pairwise Granger causality approach involves testing each possible pair of variables in our dataset to determine whether one variable can be used to predict another. This method is particularly useful in uncovering the dynamic interdependencies and influence mechanisms among the variables, which might not be apparent from standard correlation analysis or cointegration tests. The results from these tests could provide valuable insights into the temporal precedence and potential influence pathways among the variables, thereby enriching our understanding of the complex interactions within our time series data. Integrating the pairwise Granger causality tests into our study was instrumental in drawing a more comprehensive and nuanced picture of the relationships and interactions at play in our analysis.
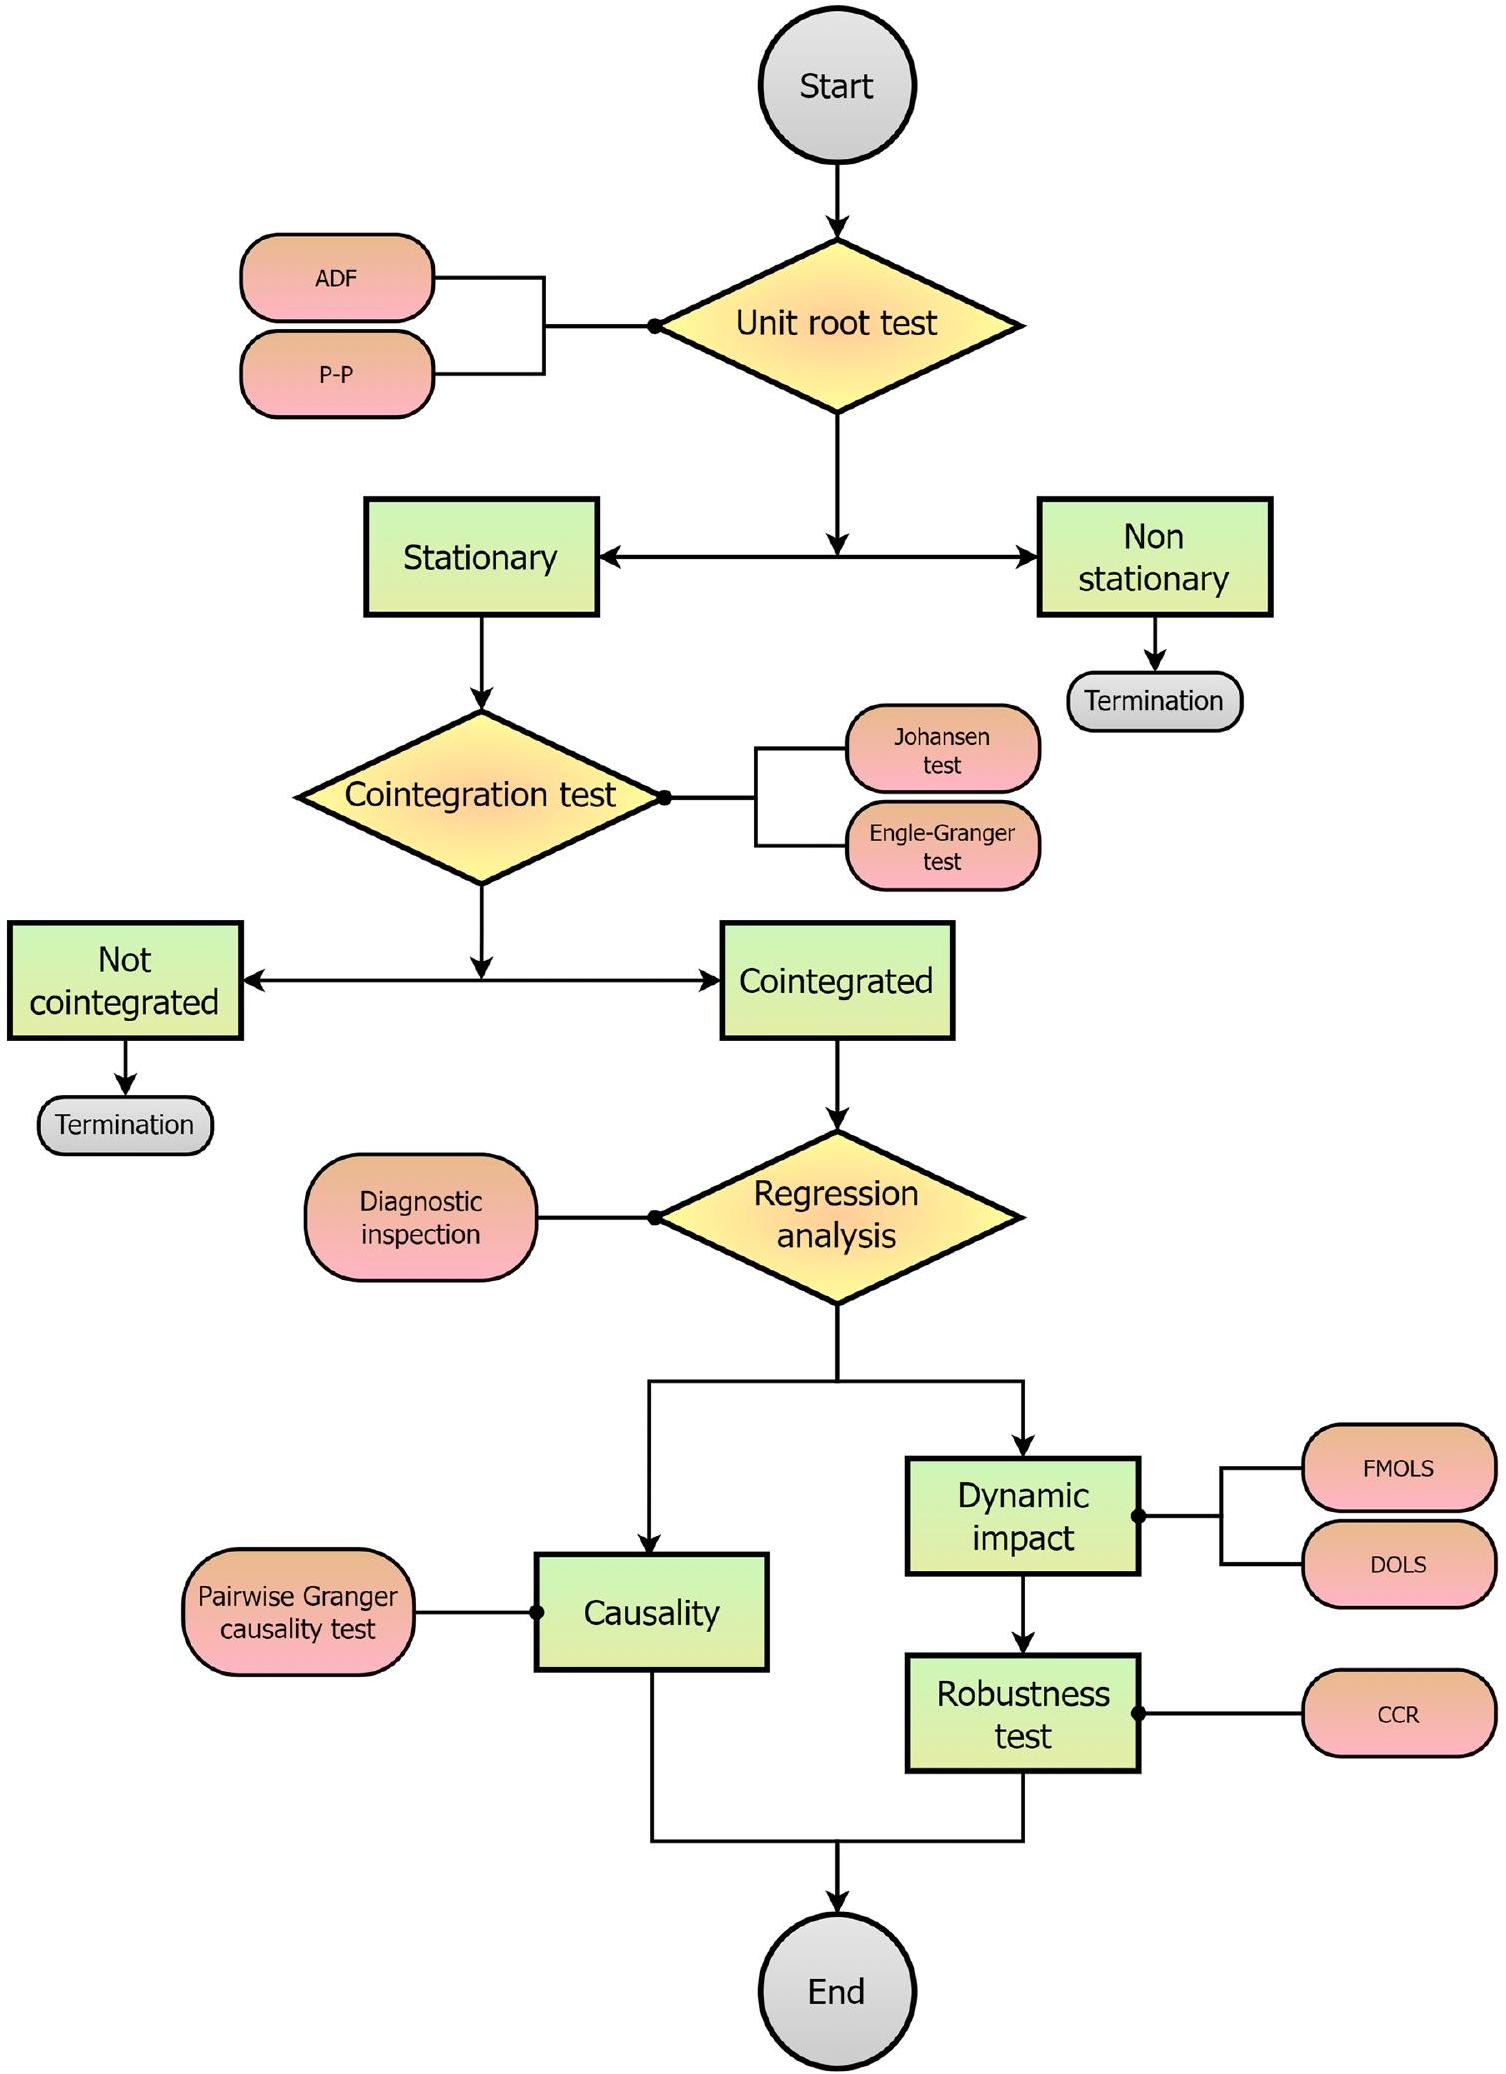
3.7 Summary of the stages of the analysis process
4 Empirical findings
4.1 Descriptive statistics
variables based on 58 observations. The descriptive statistical analysis of the dataset revealed that
4.2 The results of unit root and cointegration tests
| Variable | Mean | Median | Max | Min | Std. Dev. | Obs. |
| CO2 |
|
|
|
23,374,952 |
|
58 |
| EF |
|
|
|
|
|
58 |
| COAL | 12.43654 | 7.374517 | 44.80842 | 0.523673 | 12.21011 | 58 |
| OIL | 60.43200 | 58.10882 | 88.92363 | 31.35269 | 15.47422 | 58 |
| GAS | 22.64878 | 24.31117 | 33.86889 | 6.004779 | 7.763655 | 58 |
| RE | 4.482683 | 3.677902 | 11.57067 | 1.140681 | 2.737193 | 58 |
| GDP |
|
|
|
|
|
58 |
| GFCF |
|
|
|
|
|
58 |
| Variables | Augmented Dickey-Fuller (ADF) | Phillips-Perron (P-P) | ||||||
| Individual intercept | Individual intercept & trend | Individual intercept | Individual intercept & trend | |||||
| t-stat. | Prob. | t-stat. | Prob. | t-stat. | Prob. | t-stat. | Prob. | |
| At level | ||||||||
| InCO2 | -1.8963 | 0.3318 | -1.7282 | 0.7257 | -4.7479
|
0.0003 | -1.4114 | 0.8471 |
| InEF | 0.1029 | 0.9633 | -4.5891
|
0.0027 | 0.9607 | 0.9957 | -4.3371
|
0.0056 |
| InCOAL | 0.0270 | 0.9569 | -2.3543 | 0.3988 | -0.0702 | 0.9474 | -2.4455 | 0.3532 |
| InOIL | 0.8576 | 0.9942 | -2.0076 | 0.5847 | 1.0733 | 0.9968 | -1.9711 | 0.6042 |
| InGAS | -2.4672 | 0.1289 | -0.7630 | 0.9624 | -2.6867 | 0.0826 | -1.2769 | 0.8836 |
| InRE | -1.2621 | 0.6412 | -3.3824 | 0.0647 | -1.3879 | 0.5820 | -1.5308 | 0.8072 |
| InGDP | -1.9728 | 0.2978 | -1.9982 | 0.5895 | -1.9728 | 0.2978 | -1.4727 | 0.8275 |
| InGFCF | -4.3292
|
0.0010 | -2.0383 | 0.5679 | -2.9312 | 0.0480 | -1.7386 | 0.7209 |
| At first difference | ||||||||
| InCO2 | -7.5280
|
0.0000 | -8.0744
|
0.0000 | -7.5335
|
0.0000 |
|
0.0000 |
| InEF |
|
0.0000 | -6.5320
|
0.0000 |
|
0.0000 | -15.580
|
0.0000 |
| InCOAL | -6.1195
|
0.0000 | -6.1880
|
0.0000 | -6.1309
|
0.0000 | -6.2028
|
0.0000 |
| InOIL | -7.5427
|
0.0000 | -7.7252
|
0.0000 | -7.5427
|
0.0000 | -7.7256
|
0.0000 |
| InGAS | -4.7723
|
0.0003 | -5.6966
|
0.0001 | -7.4225
|
0.0000 | -9.1155
|
0.0000 |
| InRE | -8.0198
|
0.0000 | -8.4544
|
0.0000 | -7.9956
|
0.0000 |
|
0.0000 |
| InGDP | -5.5416
|
0.0000 |
|
0.0001 | -5.5416
|
0.0000 | -5.8006
|
0.0001 |
| InGFCF | -5.1909
|
0.0001 | -6.4675
|
0.0000 | -5.2334
|
0.0001 | -5.4638
|
0.0002 |
4.3 The results of diagnostic and parameters stability tests
| Null Hypothesis | Fisher Stat.* (from trace test) | Prob. | Fisher Stat.* (from maxeigen test) | Prob |
|
|
|
0.0000 |
|
0.0012 |
|
|
|
0.0001 | 41.8815 | 0.0624 |
|
|
|
0.0013 | 33.3841 | 0.1140 |
|
|
|
0.0076 | 22.5789 | 0.3424 |
|
|
|
0.0110 | 19.1432 | 0.2069 |
|
|
|
0.0216 | 15.4178 | 0.1101 |
|
|
11.6551 | 0.0644 | 7.7867 | 0.1885 |
|
|
3.8684 | 0.0584 | 3.8684 | 0.0584 |
4.4 The results of DOLS, FMOLS and CCR
4.4.1 FMOLS and DOLS of
models. A
4.4.2 FMOLS and DOLS of ecological footprint
| Dependent | Tau-stat. | Prob.* | z-stat | Prob.* | ||||
| InCO2 | -3.57 | 0.7459 | -21.53 | 0.7324 | ||||
| InEF | -6.80 | 0.0036 | -96.24 | 0.0000 | ||||
| InCOAL | -3.62 | 0.7255 | -20.04 | 0.7961 | ||||
| InOIL | -2.30 | 0.9904 | -16.86 | 0.9028 | ||||
| InGAS | -3.49 | 0.7771 | -23.69 | 0.6302 | ||||
| InRE | -4.17 | 0.4735 | -26.44 | 0.4935 | ||||
| InGDP | -6.68 | 0.0049 | -99.17 | 0.0000 | ||||
| InGFCF | -4.91 | 0.1830 | -36.19 | 0.1264 | ||||
| Intermediate results of the Engle-Granger cointegration test | ||||||||
| InCO2 | InEF | InCOAL | InOIL | InGAS | InRE | InGDP | InGFCF | |
| Rho-1 | -0.38 | -1.00 | -0.35 | -0.30 | -0.42 | -0.46 | -1.04 | -0.63 |
| Rho S.E | 0.1058 | 0.1467 | 0.0971 | 0.1287 | 0.1190 | 0.1113 | 0.1560 | 0.1292 |
| RV | 0.0039 | 0.0005 | 0.0788 | 0.0011 | 0.0224 | 0.0403 | 0.0006 | 0.0051 |
| Long-run R.V | 0.0039 | 0.0016 | 0.0788 | 0.0011 | 0.0224 | 0.0403 | 0.0017 | 0.0051 |
|
|
0 | 1 | 0 | 0 | 0 | 0 | 1 | 0 |
|
|
57 | 56 | 57 | 57 | 57 | 57 | 56 | 57 |
|
|
8 | 8 | 8 | 8 | 8 | 8 | 8 | 8 |
| Diagnostic tests |
|
EF model | Decision | ||
| Coeff. | Prob. | Coeff. | Prob. | ||
|
|
>0.9920 | – | >0.9948 | – | The model is well fitted |
|
|
>0.9914 | – | >0.9944 | – | The model is well fitted |
| J-B | 4.4313 | 0.1091 | 0.8924 | 0.2276 | Residuals are normally distributed |
| CUSUM | – | <0.05 | – | <0.05 | The model is stable |
| B-G LM test | 1.6554 | 0.2113 | 1.8126 | 0.1819 | No serial correlation exists |
| B-P-G test | 0.4639 | 0.9731 | 1.1401 | 0.3633 | No heteroscedasticity exists |
| Glejser test | 0.8330 | 0.6782 | 1.5865 | 0.1169 | No heteroscedasticity exists |
| ARCH test | 0.1737 | 0.6786 | 0.7391 | 0.3940 | No heteroscedasticity exists |
| Ramsey test | 0.9115 | 0.3704 | 0.0720 | 0.9431 | The model is properly specified |
| Variable |
|
|||||
| Model 1 | Model 2 | Model 3 | ||||
| FMOLS | DOLS | FMOLS | DOLS | FMOLS | DOLS | |
| Coeff. (t-stat.) | Coeff. (t-stat.) | Coeff. (t-stat.) | Coeff. (t-stat.) | Coeff. (t-stat.) | Coeff. (t-stat.) | |
| InCOAL |
|
|
– | – | – | – |
| InOIL | – | -0.4259 (-1.2864) | -0.5192 (-0.9548) | – | – | |
| InGAS | – | – | – |
|
|
|
| InRE |
|
|
|
|
|
-0.1328
|
| InGDP |
|
|
|
|
|
|
| InGFCF | -0.0104 (-0.0926) | -0.0130 (-0.1055) | -0.0254 (-0.2096) | -0.0056 (-0.0382) |
|
|
| C | -17.4618 | -16.5924 | -15.6480 | -14.0460 | -24.0117 | -24.7915 |
| Variable |
|
|||||
| Model 1 | Model 2 | Model 3 | ||||
| FMOLS | DOLS | FMOLS | DOLS | FMOLS | DOLS | |
| Coeff. (t-stat.) | Coeff. (t-stat.) | Coeff. (t-stat.) | Coeff. (t-stat.) | Coeff. (t-stat.) | Coeff. (t-stat.) | |
| InCOAL | 0.0110 (1.2148) | 0.0167 (1.4937) | – | – | – | – |
| InOIL | – | – |
|
|
– | – |
| InGAS | – | – | – | – | -0.0118 (-0.6535) | 0.0053 (0.2157) |
| InRE |
|
-0.0444
|
-0.0084 (-0.7011) | -0.0137 (-0.9618) | -0.0232
|
|
| InGDP |
|
|
|
|
|
|
| InGFCF | -0.2747
|
-0.2583
|
-0.2934
|
-0.2880
|
-0.2661
|
-0.2845
|
| C | -1.0168 | -0.6839 | -4.2644 | -5.7548 | -1.4507 | -1.8610 |
4.4.3 The robustness test with CCR of CO2 emissions and ecological footprint
ecological footprint. The CCR analysis reaffirmed the robustness of the earlier FMOLS and DOLS findings. Specifically, for
| Variable |
|
|
||||
| Model 1 | Model 2 | Model 3 | Model 1 | Model 2 | Model 3 | |
| Coeff. (t-stat.) | Coeff. (t-stat.) | Coeff. (t-stat.) | Coeff. (t-stat.) | Coeff. (t-stat.) | Coeff. (t-stat.) | |
| InCOAL |
|
– | – | 0.0114 (1.2412) | – | – |
| InOIL | – | -0.4266 (-1.1081) | – | – |
|
– |
| InGAS | – | – |
|
– | – | -0.0098 (-0.5234) |
| InRE |
|
|
|
|
-0.0093 (-0.7490) | -0.0241
|
| InGDP |
|
|
|
|
|
|
| InGFCF | -0.0042 (-0.0372) | -0.0191 (-0.1562) |
|
-0.2774
|
-0.2946
|
-0.2704
|
| C | -17.5816 | -15.5905 | -24.0313 | -1.0400 | -4.1500 | -1.4871 |
of Indonesia. The consistency of the CCR results with the FMOLS and DOLS analyses across different models and variables lends confidence to the conclusions drawn about the impact of energy consumption, economic growth, and capital formation on
4.5 The results pairwise Granger causality
emissions to GFCF and RE, and from GAS to
5 Discussion
|
|
Ecological footprint | ||||||
| Null hypothesis: | F-stat. | Prob. | Result | Null hypothesis: | F-stat. | Prob. | Result |
| InCOAL
|
1.2100 | 0.3198 |
|
InCOAL
|
0.4950 | 0.7394 | EF
|
|
|
1.7355 | 0.1588 | InEF
|
1.3654 | 0.2610 | ||
| InOIL
|
0.5818 | 0.6774 |
|
InOIL
|
1.2860 | 0.2897 |
|
|
|
1.2029 | 0.3228 | InEF
|
|
0.0461 | ||
|
|
|
0.0844 |
|
|
1.6981 | 0.1671 | EF
|
|
|
0.6507 | 0.6294 | InEF
|
0.7301 | 0.5762 | ||
| InRE
|
0.9947 | 0.4203 |
|
|
|
0.0894 |
|
|
|
|
0.0240 | InEF
|
|
0.0841 | ||
|
|
1.0717 | 0.3817 |
|
|
1.9162 | 0.1242 |
|
|
|
0.9231 | 0.4589 | InEF
|
|
0.0772 | ||
|
|
0.4819 | 0.7489 |
|
|
1.2097 | 0.3199 |
|
|
|
|
0.0450 | InEF
|
|
0.0225 | ||
5.1 Non-renewable energy,
these sustainable alternatives. Policymakers must implement supportive policies and incentives to accelerate the transition towards renewable energy sources, thereby mitigating
5.2 Renewable energy,
bidirectional causality between ecological footprint and renewable energy, showcasing a synergistic interplay. As renewable energy usage increases, the ecological footprint decreases, establishing a reinforcing feedback loop. These results support findings by Radmehr et al. (2022), Kongbuamai et al. (2021), Usman and Hammar (2021), and Nathaniel and Khan (2020).
5.3 Economic growth,
5.4 Capital formation,
6 Conclusion, policy implications, and limitations
for non-compliance can effectively mitigate
This study provides valuable insights into the dynamic impact of energy sources, economic growth, and capital formation on
Abbreviations
| ADF | Augmented Dickey-Fuller |
| ARDL | Autoregressive Distributed Lag |
| CO2 | Carbon dioxide emissions |
| COAL | Coal |
| CUSUM | Cumulative sum of recursive residuals |
| CCR | Canonical Cointegrating Regression |
| DOLS | Dynamic Ordinary Least Squares |
| EF | Ecological footprint |
| FMOLS | Fully Modified Ordinary Least Squares |
| ESDM | Ministry of energy and mineral resources |
| GAS | Gas |
| GDP | Gross domestic product |
| GFCF | Gross fixed capital formation |
| GFN | Global footprint network |
| IEA | International energy agency |
| IESR | Institute for essential services reform |
| LCU | Local currency unit |
| OIL | Oil |
| OWID | Our world in data |
| P-P | Phillips-Perron |
| RE | Renewable energy |
| SEA | Southeast Asia |
| VECM | Vector error correction model |
| WDI | World Development Indicator |
Acknowledgements
Authors’ contributions
Funding
Availability of data and materials
Declarations
Ethics approval and consent to participate
Competing interests
Author details
Published online: 16 April 2024
References
Acevedo-Ramos JA, Valencia CF, Valencia CD (2023) The Environmental Kuznets Curve Hypothesis for Colombia: Impact of Economic Development on Greenhouse Gas Emissions and Ecological Footprint. Sustainability 15:3738. https://doi.org/10.3390/su15043738
Acheampong AO, Adams S, Boateng E (2019) Do globalization and renewable energy contribute to carbon emissions mitigation in Sub-Saharan Africa? Sci Total Environ 677:436-446. https://doi.org/10.1016/j.scitotenv.2019. 04.353
Adekoya OB, Oliyide JA, Fasanya IO (2022) Renewable and non-renewable energy consumption – Ecological footprint nexus in net-oil exporting and net-oil importing countries: Policy implications for a sustainable environment. Renew Energy 189:524-534. https://doi.org/10.1016/j. renene.2022.03.036
Aderinto ER, Ogunro TT (2021) Population growth and environmental degradation in Nigeria: A comparative analysis of Carbon dioxide emissions and ecological footprint. Interdiscip J Appl Basics Subj 1:26-36
Afjal M, Kathiravan C, Dana LP, Nagarajan CD (2023) The Dynamic Impact of Financial Technology and Energy Consumption on Environmental Sustainability. Sustainability 15:9327. https://doi.org/10.3390/su15129327
Ali A, Radulescu M, Balsalobre-Lorente D (2023) A dynamic relationship between renewable energy consumption, nonrenewable energy consumption, economic growth, and carbon dioxide emissions: Evidence from Asian emerging economies. Energy Environ 34:3529-3552. https:// doi.org/10.1177/0958305X231151684
AlNemer HA, Hkiri B, Tissaoui K (2023) Dynamic impact of renewable and nonrenewable energy consumption on CO2 emission and economic growth
in Saudi Arabia: Fresh evidence from wavelet coherence analysis. Renew Energy 209:340-356. https://doi.org/10.1016/j.renene.2023.03.084
Alola AA, Bekun FV, Sarkodie SA (2019) Dynamic impact of trade policy, economic growth, fertility rate, renewable and non-renewable energy consumption on ecological footprint in Europe. Sci Total Environ 685:702-709. https://doi.org/10.1016/j.scitotenv.2019.05.139
Amin N, Song H (2022) The role of renewable, non-renewable energy consumption, trade, economic growth, and urbanization in achieving carbon neutrality: A comparative study for South and East Asian countries. Environ Sci Pollut Res 30:12798-12812. https://doi.org/10.1007/ s11356-022-22973-2
Ansari MA (2022) Re-visiting the Environmental Kuznets curve for ASEAN: A comparison between ecological footprint and carbon dioxide emissions. Renew Sustain Energy Rev 168:112867. https://doi.org/10.1016/j.rser. 2022.112867
Arshad Z, Robaina M, Botelho A (2020) Renewable and Non-renewable Energy, Economic Growth and Natural Resources Impact on Environmental Quality: Empirical Evidence from South and Southeast Asian Countries with CS-ARDL Modeling. Int J Energy Econ Policy. 10:368-383. https://doi.org/ 10.32479/ijeep. 9956
Ben Jebli M, Ben Youssef S, Ozturk I (2016) Testing environmental Kuznets curve hypothesis: The role of renewable and non-renewable energy consumption and trade in OECD countries. Ecol Indic 60:824-831. https:// doi.org/10.1016/j.ecolind.2015.08.031
Bhat JA (2018) Renewable and non-renewable energy consumption-impact on economic growth and CO2 emissions in five emerging market economies. Environ Sci Pollut Res 25:35515-35530. https://doi.org/10.1007/ s11356-018-3523-8
Chang Z, Shen G, Jiang K, Huang W, Zhao J, Luo Z, Men Y, Xing R, Zhao N, Pan B, Xing B, Tao S (2024) Environmental implications of residual pyrogenic carbonaceous materials from incomplete biomass combustion: a review. Carbon Res 3:15. https://doi.org/10.1007/s44246-024-00103-6
Chekouri SM, Chibi A, Benbouziane M (2023) The impact of natural resource abundance on ecological footprint: evidence from Algeria. Environ Sci Pollut Res 30:69289-69306. https://doi.org/10.1007/s11356-023-26720-z
Chen Y, Zhao J, Lai Z, Wang Z, Xia H (2019) Exploring the effects of economic growth, and renewable and non-renewable energy consumption on China’s CO2 emissions: Evidence from a regional panel analysis. Renew Energy 140:341-353. https://doi.org/10.1016/j.renene.2019.03.058
Chien F, Hsu C-C, Moslehpour M, Sadiq M, Tufail B, Ngo TQ (2023) A step toward sustainable development: the nexus of environmental sustainability, technological advancement and green finance: evidence from Indonesia. Environ Dev Sustain. https://doi.org/10.1007/ s10668-023-03424-5
Christoforidis T, Katrakilidis C (2021) The dynamic role of institutional quality, renewable and non-renewable energy on the ecological footprint of OECD countries: do institutions and renewables function as leverage points for environmental sustainability? Environ Sci Pollut Res 28:5388853907. https://doi.org/10.1007/s11356-021-13877-8
Destek MA, Sinha A (2020) Renewable, non-renewable energy consumption, economic growth, trade openness and ecological footprint: Evidence from organisation for economic Co-operation and development countries. J Clean Prod 242:118537. https://doi.org/10.1016/j.jclepro.2019. 118537
Dickey DA, Fuller WA (1979) Distribution of the Estimators for Autoregressive Time Series with a Unit Root. J Am Stat Assoc 74:427-431. https://doi.org/ 10.1080/01621459.1979.10482531
Engle RF, Granger CWJ (1987) Co-Integration and Error Correction: Representation, Estimation, and Testing. Econometrica 55(2):251-276. https://doi. org/10.2307/1913236
ESDM (2021) Indonesia: National Electricity Supply Business Plan (RUPTL) 2021-2030
GFN (2023) Global Footprint Network https://data.footprintnetwork.org/#/
Granger CWJ (1969) Investigating Causal Relations by Econometric Models and Cross-spectral Methods. Econometrica 37:424. https://doi.org/10. 2307/1912791
Hanif I, Aziz B, Chaudhry IS (2019) Carbon emissions across the spectrum of renewable and nonrenewable energy use in developing economies of Asia. Renew Energy 143:586-595. https://doi.org/10.1016/j.renene.2019.05.032
Hardi I, Idroes GM, Zulham T, Suriani S, Saputra J (2023) Economic Growth, Agriculture, Capital Formation and Greenhouse Gas Emissions in Indonesia: FMOLS, DOLS and CCR Applications. Ekon J Econ 1:82-91. https://doi. org/10.60084/eje.v1i2.109
Hardi I, Ray S, Attari MUQ, Ali N, Idroes GM (2024) Innovation and Economic Growth in the Top Five Southeast Asian Economies: A Decomposition Analysis. Ekon J Econ 2:1-14. https://doi.org/10.60084/eje.v2i1.145
He X, Adebayo TS, Kirikkaleli D, Umar M (2021) Consumption-based carbon emissions in Mexico: An analysis using the dual adjustment approach. Sustain Prod Consum 27:947-957. https://doi.org/10.1016/j.spc.2021.02.020
Idroes GM, Hardi I, Nasir M, Gunawan E, Maulidar P, Maulana ARR (2023a) Natural Disasters and Economic Growth in Indonesia. Ekon J Econ 1:33-39. https://doi.org/10.60084/eje.v1i1.55
Idroes GM, Hardi I, Noviandy TR, Sasmita NR, Hilal IS, Kusumo F, Idroes R (2023b) A Deep Dive into Indonesia’s CO2 Emissions: The Role of Energy Consumption, Economic Growth and Natural Disasters. Ekon J Econ 1:69-81. https://doi.org/10.60084/eje.v1i2.115
Idroes GM, Syahnur S, Majid MSA, Idroes R, Kusumo F, Hardi I (2023c) Unveiling the Carbon Footprint: Biomass vs. Geothermal Energy in Indonesia. Ekon J Econ 1:10-18. https://doi.org/10.60084/eje.v1i1.47
IEA (2022) Enhancing Indonesia’s Power System. https://www.iea.org/reports/ enhancing-indonesias-power-system
IESR (2022) Indonesia Energy Transition Outlook 2023. https://iesr.or.id/wp-conte nt/uploads/2022/12/Indonesia-Energy-Transition-Outlook_2023.pdf
Ito K (2017) CO2 emissions, renewable and non-renewable energy consumption, and economic growth: Evidence from panel data for developing countries. Int Econ 151:1-6. https://doi.org/10.1016/j.inteco.2017.02.001
Johansen S (1988) Statistical analysis of cointegration vectors. J Econ Dyn Control 12:231-254. https://doi.org/10.1016/0165-1889(88)90041-3
Kartal HM, Acaroğlu H, Garcia Marquez FP (2023) The Validity of the Environmental Kuznets Curve in Terms of the Ecological Foot Print and Energy Consumption Diversity: The Case of Turkey. In: García Márquez FP, Segovia Ramírez I, Bernalte Sánchez PJ, Muñoz del Río A (eds) IoT and Data Science in Engineering Management. CIO 2022. Lecture Notes on Data Engineering and Communications Technologies, vol 160. Springer, Cham. https://doi.org/10.1007/978-3-031-27915-7_49
Khan SAR, Zia-UI-Haq HM, Ponce P, Janjua L (2023) Re-investigating the impact of non-renewable and renewable energy on environmental quality: A roadmap towards sustainable development. Resour Policy 81:103411. https://doi.org/10.1016/j.resourpol.2023.103411
Koc S, Bulus GC (2020) Testing validity of the EKC hypothesis in South Korea: role of renewable energy and trade openness. Environ Sci Pollut Res 27:29043-29054. https://doi.org/10.1007/s11356-020-09172-7
Kongbuamai N, Bui Q, Nimsai S (2021) The effects of renewable and nonrenewable energy consumption on the ecological footprint: the role of environmental policy in BRICS countries. Environ Sci Pollut Res 28:27885-27899. https://doi.org/10.1007/s11356-021-12551-3
Kostakis I (2024) An empirical investigation of the nexus among renewable energy, financial openness, economic growth, and environmental degradation in selected ASEAN economies. J Environ Manage 354:120398. https://doi.org/10.1016/j.jenvman.2024.120398
Kurniawan R, Nugroho NAA, Fudholi A, Purwanto A, Sumargo B, Gio PU, Wongsonadi SK (2023) The ecological footprint of industrial value added and energy consumption in Indonesia. Int J Energy Sect Manag. https:// doi.org/10.1108/IJESM-05-2023-0006
Massagony A, Budiono, (2023) Is the Environmental Kuznets Curve (EKC) hypothesis valid on CO 2 emissions in Indonesia? Int J Environ Stud 80:20-31. https://doi.org/10.1080/00207233.2022.2029097
Maulidar P, Fitriyani F, Sasmita NR, Hardi I, Idroes GM (2024) Exploring Indonesia’s CO2 Emissions: The Impact of Agriculture, Economic Growth, Capital and Labor. Grimsa J Bus Econ Stud 1:43-55. https://doi.org/10.61975/ gjbes.v1i1.22
Munir Q, Lean HH, Smyth R (2020) CO2 emissions, energy consumption and economic growth in the ASEAN-5 countries: A cross-sectional dependence approach. Energy Econ 85:104571. https://doi.org/10.1016/j.eneco. 2019.104571
Nathaniel S, Khan SAR (2020) The nexus between urbanization, renewable energy, trade, and ecological footprint in ASEAN countries. J Clean Prod 272:122709. https://doi.org/10.1016/j.jclepro.2020.122709
Naveed M, Islam M, Usman M, Kamal M, Khan MF (2023) Demystifying the association between economic development, transportation, tourism, renewable energy, and ecological footprint in Bay of Bengal Initiative for Multi-Sectoral Technical and Economic Cooperation region during globalization mode. Environ Sci Pollut Res 30:120137-120154. https://doi. org/10.1007/s11356-023-30706-2
OWID (2023) Our World in Data. https://ourworldindata.org/#entries
Park JY (1992) Canonical Cointegrating Regressions. Econometrica 60:119. https://doi.org/10.2307/2951679
Pata UK (2021) Linking renewable energy, globalization, agriculture, CO2 emissions and ecological footprint in BRIC countries: A sustainability perspective. Renew Energy 173:197-208. https://doi.org/10.1016/j.renene. 2021.03.125
Phillips PCB, Hansen BE (1990) Statistical Inference in Instrumental Variables Regression with I(1) Processes. Rev Econ Stud 57:99. https://doi.org/10. 2307/2297545
Phillips PCB, Perron P (1988) Testing for a Unit Root in Time Series Regression. Biometrika 75:335. https://doi.org/10.2307/2336182
Pirmana V, Alisjahbana AS, Yusuf AA, Hoekstra R, Tukker A (2021) Environmental Cost in Indonesia Spillover Effect Between Consumption and Production. Front Sustain. 2. https://doi.org/10.3389/frsus.2021.720177
Pujiati A, Yanto H, Dwi Handayani B, Ridzuan AR, Borhan H, Shaari MS (2023) The detrimental effects of dirty energy, foreign investment, and corruption on environmental quality: New evidence from Indonesia. Front Environ Sci. 10. https://doi.org/10.3389/fenvs.2022.1074172
Radmehr R, Shayanmehr S, Ali EB, Ofori EK, Jasińska E, Jasiński M (2022) Exploring the Nexus of Renewable Energy, Ecological Footprint, and Economic Growth through Globalization and Human Capital in G7 Economics. Sustainability 14:12227. https://doi.org/10.3390/su141912227
Rahman MH, Majumder SC (2022) Empirical analysis of the feasible solution to mitigate the CO2 emission: evidence from Next-11 countries. Environ Sci Pollut Res 29:73191-73209. https://doi.org/10.1007/s11356-022-20908-5
Rahman MM (2022) Test and performance optimization of nozzle inclination angle and swirl combustor in a low-tar biomass gasifier: a biomass power generation system perspective. Carbon Resour Convers 5:139-149. https://doi.org/10.1016/j.crcon.2022.01.002
Rahman MM, Aravindakshan S, Hoque MA, Rahman MA, Gulandaz MA, Rahman J, Islam MT (2021a) Conservation tillage (CT) for climate-smart sustainable intensification: Assessing the impact of CT on soil organic carbon accumulation, greenhouse gas emission and water footprint of wheat cultivation in Bangladesh. Environ Sustain Indic 10:100106. https:// doi.org/10.1016/j.indic.2021.100106
Rahman MH, Voumik LC, Islam MJ, Halim MA, Esquivias MA (2022) Economic Growth, Energy Mix, and Tourism-Induced EKC Hypothesis: Evidence from Top Ten Tourist Destinations. Sustainability 14:16328. https://doi.org/ 10.3390/su142416328
Raihan A (2024) The interrelationship amid carbon emissions, tourism, economy, and energy use in Brazil. Carbon Res 3:11. https://doi.org/10. 1007/s44246-023-00084-y
Raihan A, Tuspekova A (2022) Dynamic impacts of economic growth, renewable energy use, urbanization, industrialization, tourism, agriculture, and forests on carbon emissions in Turkey. Carbon Res 1:20. https://doi.org/ 10.1007/s44246-022-00019-z
Saboori B, Sulaiman J (2013) Environmental degradation, economic growth and energy consumption: Evidence of the environmental Kuznets curve in Malaysia. Energy Policy 60:892-905. https://doi.org/10.1016/j.enpol. 2013.05.099
Saqib N (2022) Nexus between the renewable and nonrenewable energy consumption and carbon footprints: evidence from Asian emerging economies. Environ Sci Pollut Res 29:58326-58340. https://doi.org/10. 1007/s11356-022-19948-8
Stock JH, Watson MW (1993) A Simple Estimator of Cointegrating Vectors in Higher Order Integrated Systems. Econometrica 61:783. https://doi.org/ 10.2307/2951763
Usman M, Hammar N (2021) Dynamic relationship between technological innovations, financial development, renewable energy, and ecological footprint: fresh insights based on the STIRPAT model for Asia Pacific Economic Cooperation countries. Environ Sci Pollut Res 28:15519-15536. https://doi.org/10.1007/s11356-020-11640-z
Usman M, Makhdum MSA (2021) What abates ecological footprint in BRICS-T region? Exploring the influence of renewable energy, non-renewable energy, agriculture, forest area and financial development. Renew Energy 179:12-28. https://doi.org/10.1016/j.renene.2021.07.014
Voumik LC, Islam MA, Ray S, Mohamed Yusop NY, Ridzuan AR (2023) CO2 Emissions from Renewable and Non-Renewable Electricity Generation Sources in the G7 Countries: Static and Dynamic Panel Assessment. Energies 16:1044. https://doi.org/10.3390/en16031044
Wackernagel M, Beyers B (2019) Ecological footprint: Managing our biocapacity budget (New Society Publishers)
WDI (2023) WorldBank Development Indicator Databased. https://databank. worldbank.org/source/world-development-indicators
Yahya Y, Saleh SM, Majid MSA (2023) Effects of road infrastructure, energy consumption, and economic growth on CO2 emission in Indonesia. p 070014
Yusuf MS, Musibau HO, Dirie KA, Shittu WO (2023) Role of trade liberalization, industrialisation and energy use on carbon dioxide emissions in Australia: 1990 to 2018. Environ Sci Pollut Res 30:79481-79496. https://doi.org/10. 1007/s11356-023-27825-1
Publisher’s Note
- Handling editor: Su Shiung Lam.
*Correspondence:
Rinaldi Idroes
rinaldi.idroes@usk.ac.id
Full list of author information is available at the end of the article - *p-values are from MacKinnon (1996). **The number of stochastic (stoc.) Trends in the asymptotic distribution. Obs. represents observations, RV represents residual variance, and SE represents standard error
- b and
indicate significance levels at and , respectively and indicates significance level at and , respectively. ( ) and ( ) denote unidirectional causality, ( ) indicates bidirectional causality, and ( ) signifies that there is no causality