المجلة: Scientific Reports، المجلد: 14، العدد: 1
DOI: https://doi.org/10.1038/s41598-024-55603-7
PMID: https://pubmed.ncbi.nlm.nih.gov/38424443
تاريخ النشر: 2024-02-29
DOI: https://doi.org/10.1038/s41598-024-55603-7
PMID: https://pubmed.ncbi.nlm.nih.gov/38424443
تاريخ النشر: 2024-02-29
الأطلس العالمي للحشرات الصالحة للأكل: تحليل التنوع والسمات المشتركة التي تسهم في نظم الغذاء والاستدامة
مستقبل نظام الغذاء على الكوكب يواجه بشكل متزايد عدم اليقين الذي يمكن أن يُعزى إلى النمو السكاني وزيادة الطلب على الغذاء المغذي. من المتوقع أن تضع الممارسات الزراعية التقليدية ضغطًا على الإنتاج، فضلاً عن الموارد الطبيعية وخدمات النظام البيئي المقدمة، خاصة في ظل تغير المناخ. نظرًا لخصائصها الملحوظة، بما في ذلك بصمة بيئية منخفضة، ونسبة تحويل غذائي عالية، ونمو سريع وقيم غذائية، يمكن أن تلعب الحشرات الصالحة للأكل دورًا حيويًا في نظام الغذاء العالمي. ومع ذلك، لا تزال هناك فجوات معرفية كبيرة بشأن تنوعها، وتوزيعها العالمي، والخصائص المشتركة عبر المناطق، مما قد يعيق التوسع الفعال والوصول إلى الحشرات الصالحة للأكل. لذلك، قمنا بتجميع وتحليل قاعدة البيانات المجزأة حول الحشرات الصالحة للأكل وحددنا المحركات المحتملة التي توضح استهلاك الحشرات، على مستوى العالم، مع التركيز على تعزيز نظام غذائي مستدام. جمعنا البيانات من مصادر متنوعة، بما في ذلك الأدبيات لقائمة أنواع الحشرات الصالحة للأكل، ومرفق المعلومات العالمية للتنوع البيولوجي وiNaturalist للحضور الجغرافي للحشرات الصالحة للأكل، ومكتبة خدمة الأرض كوبيرنيكوس لتغطية الأرض العالمية، وFAOSTAT لمعايير السكان والدخل والأمن الغذائي. بعد ذلك، قمنا بإجراء سلسلة من التحليلات على مستوى الدول والمناطق والقارات. تحدد دراستنا 2205 نوعًا من الحشرات، يتم استهلاكها عبر 128 دولة على مستوى العالم. من بين القارات، تمتلك آسيا أكبر عدد من الحشرات الصالحة للأكل (932 نوعًا)، تليها أمريكا الشمالية (بشكل رئيسي المكسيك) وأفريقيا. الدول التي لديها أعلى استهلاك للحشرات هي المكسيك (450 نوعًا)، تايلاند (272 نوعًا)، الهند (262 نوعًا)، جمهورية الكونغو الديمقراطية (255 نوعًا)، الصين (235 نوعًا)، البرازيل (140 نوعًا)، اليابان (123 نوعًا)، والكاميرون (100 نوع). كما كشفت دراستنا عن بعض الممارسات الشائعة والمحددة المتعلقة بالوصول إلى الحشرات الصالحة للأكل واستخدامها بين الدول والمناطق. على الرغم من أن استهلاك الحشرات غالبًا ما يكون متجذرًا في الممارسات الثقافية، إلا أنه يظهر ارتباطات مع تغطية الأرض، والحضور الجغرافي للحشرات الصالحة للأكل المحتملة، وحجم سكان الدولة، ومستويات الدخل. ترتبط ممارسة تناول الحشرات بثقافة الناس في أفريقيا وآسيا وأمريكا اللاتينية، بينما تدفع زيادة الوعي والحاجة إلى استدامة الغذاء معظم الدول الأوروبية إلى تقييم تناول الحشرات. لذلك، أصبحت الحشرات الصالحة للأكل جزءًا متزايد الأهمية من مستقبل نظم الغذاء الكوكبية. لذلك، هناك حاجة إلى جهود أكثر نشاطًا لتعزيزها لمساهمتها الفعالة في تحقيق إنتاج غذائي مستدام.
أصبح الأمن الغذائي مصدر قلق عالمي مركزي لوجود الإنسان ويستمر في إثارة الأسئلة حول أبعاد نظم الغذاء المختلفة، بما في ذلك الجوانب الاقتصادية والاجتماعية والثقافية والسياسية
على الإنتاجية الزراعية. علاوة على ذلك، قد تمنع انبعاثات الكربون من نظم الغذاء العالمية الوصول إلى أهداف تغير المناخ المتمثلة في تقييد ارتفاع درجات الحرارة إلى
تظل البروتينات محركًا حاسمًا لنظم الغذاء الكوكبية
تواجه أفريقيا وآسيا عجزًا كبيرًا في تناول الغذاء الأساسي، وخاصة البروتين
لقد جذبت الحشرات الصالحة للأكل الانتباه كمصدر بروتين مستدام، حيث يتراوح محتوى البروتين الخام من 40 إلى
علاوة على ذلك، يمكن تربية الحشرات أو تدجينها بأعداد كبيرة، كما يُطلق عليها عادةً “المواشي الصغيرة”
علاوة على ذلك، تعتبر بعض الحشرات الأنسب للاقتصاد الدائري المستدام. على سبيل المثال، يمكن لذباب الجندي الأسود (BSF) Hermetia illucens L. (Diptera: Stratiomyidae) تحويل النفايات إلى سماد عضوي يُعاد تغذيته في الزراعة، بينما تعمل يرقاتها كمصدر بروتين لأعلاف الحيوانات
يعتبر أكثر من 1900 نوع من الحشرات جزءًا من النظام الغذائي التقليدي لما لا يقل عن ملياري شخص.
واحدة من التفسيرات الرئيسية لاستهلاك الحشرات هي أن الحشرات تمثل نصف جميع الكائنات الحية؛ فهي توجد في موائل متنوعة، مثل الغابات، والحقول الزراعية، وحتى النظم البيئية المائية، ومعظمها يعتمد على النباتات للبقاء. كانت تمثل المصدر الأرخص والأساسي للبروتين الحيواني خلال المراحل الأولى من البشرية قبل اختراع الزراعة. لذلك، افترضنا أنه قد يكون هناك ارتباط قوي بين تغطية الأرض، وتنوع النباتات والمناخ، وتنوع الحشرات الصالحة للأكل. ومع ذلك، لم يتم إثبات ذلك. ومع ذلك، فقد أظهرت بعض الأنواع من الحشرات الصالحة للأكل مؤخرًا أنها على وشك الانقراض.
في جميع أنحاء العالم، يحمل جمع الحشرات البرية، وتربيتها، ومعالجتها، وبيعها عبر الجنسين آفاقًا مشرقة لنظام الغذاء العالمي.
دعم التنمية الصناعية
دعم التنمية الصناعية
على الرغم من الفوائد الهائلة للحشرات الصالحة للأكل، قد تؤدي الوصمة المرتبطة بها كـ “طعام للفقراء” إلى الرفض التام من قبل بعض الأشخاص. دون فهم عميق للحشرات الصالحة للأكل من حيث ارتباطها بالتغذية ومؤشرات الصحة، والمساهمة في الدخل حسب الجنس، ونمو السكان والتنمية، والناتج المحلي الإجمالي، ستظل الترويج للحشرات الصالحة للأكل والحفاظ عليها مهمة شاقة. تصبح الرؤى حول التنوع العالمي وتوزيع الحشرات الصالحة للأكل عبر البلدان والقارات ذات أهمية خاصة في ظل زيادة الوعي والقبول لأنظمة الغذاء المستدامة. قد يساعد توفير معلومات موثوقة حول تنوع ووفرة الأنواع الصالحة للأكل على المستويات الوطنية والإقليمية والعالمية في دفع هذه الموارد الغذائية الطبيعية الثمينة والمستدامة إلى أعلى على الأجندات السياسية والاستثمارية والبحثية، على مستوى العالم.
تهدف هذه الورقة إلى تحليل التنوع البيولوجي العالمي للحشرات الصالحة للأكل لتوجيه السياسات المتعلقة بحفظها وتدجينها كمصادر غذائية وعلف مستدامة. وتصف العوامل التي تؤثر على توزيع الحشرات، والتشابهات على المستويات الإقليمية والوطنية، ومساهمة الحشرات في أنظمة الغذاء العالمية.
النتائج
أوامر وعائلات الحشرات الصالحة للأكل في العالم
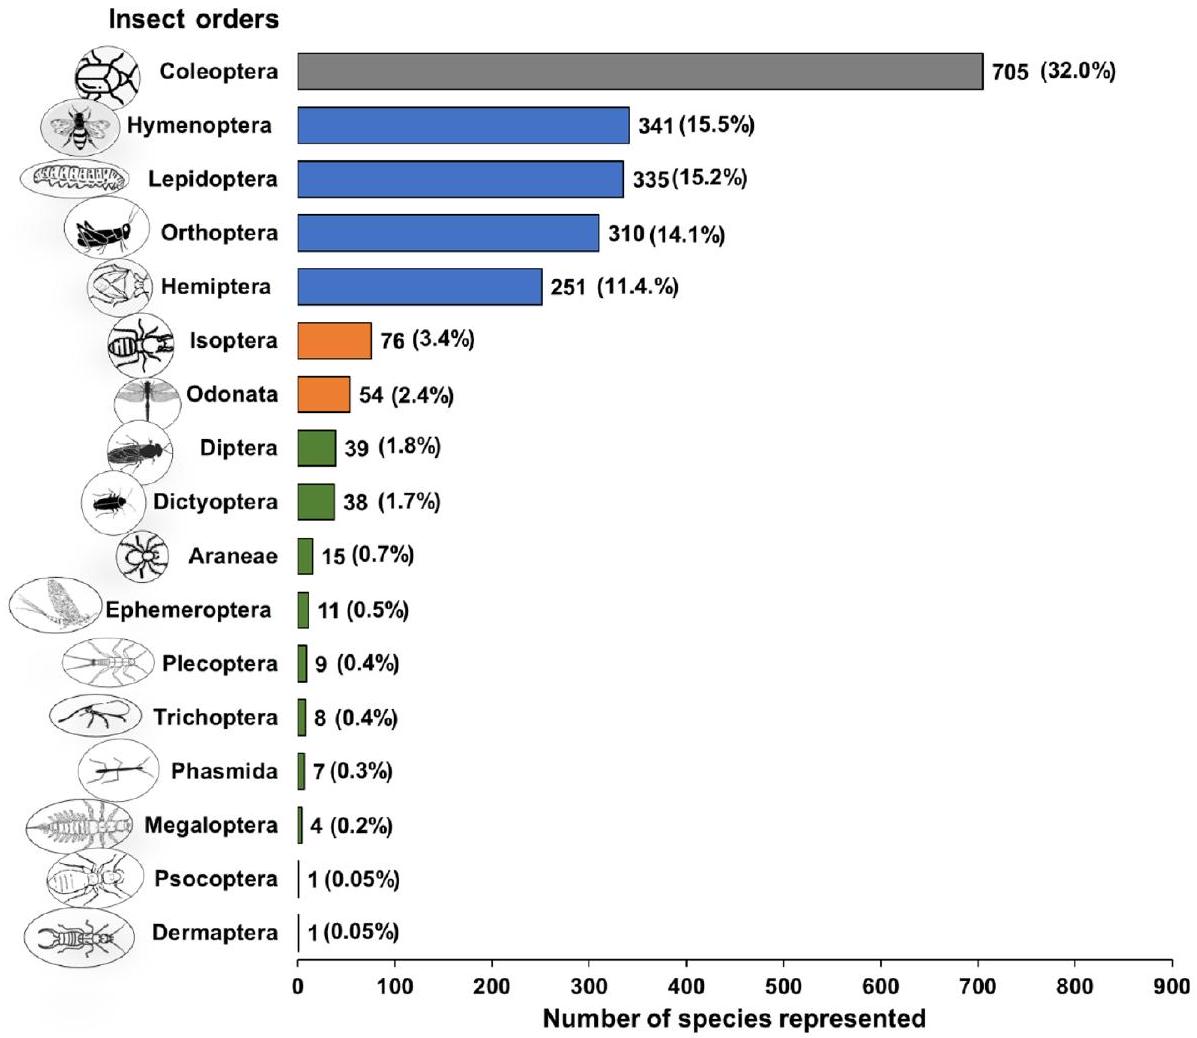
لقد حدد تحقيقنا الشامل 2205 نوعًا من الحشرات، من 25 رتبة متميزة، تم التأكيد على أنها صالحة للأكل (الشكل 1). تختلف هذه الرتب في هيمنتها العالمية بين أنواع الحشرات الصالحة للأكل. تشكل رتبة الخنافس (Coleoptera) الرتبة الأكثر انتشارًا، حيث تشكل
يتم تقديم توزيع أنواع الحشرات الصالحة للأكل، عبر الطلبات والعائلات، في الشكل 2، مما يكشف عن رؤى مثيرة حول تنوع الاستهلاك. ضمن طلبات الخنافس، تبرز تسع عائلات بارزة، تحتوي كل منها على أكثر من 10 أنواع: Scarabaeidae، Cerambycidae، Dytiscinae، Curculionidae، Passalidae، Lucanidae.
الشكل 1. التوزيع العالمي لأنواع الحشرات الصالحة للأكل حسب الرتبة التصنيفية. اللون الرمادي يمثل
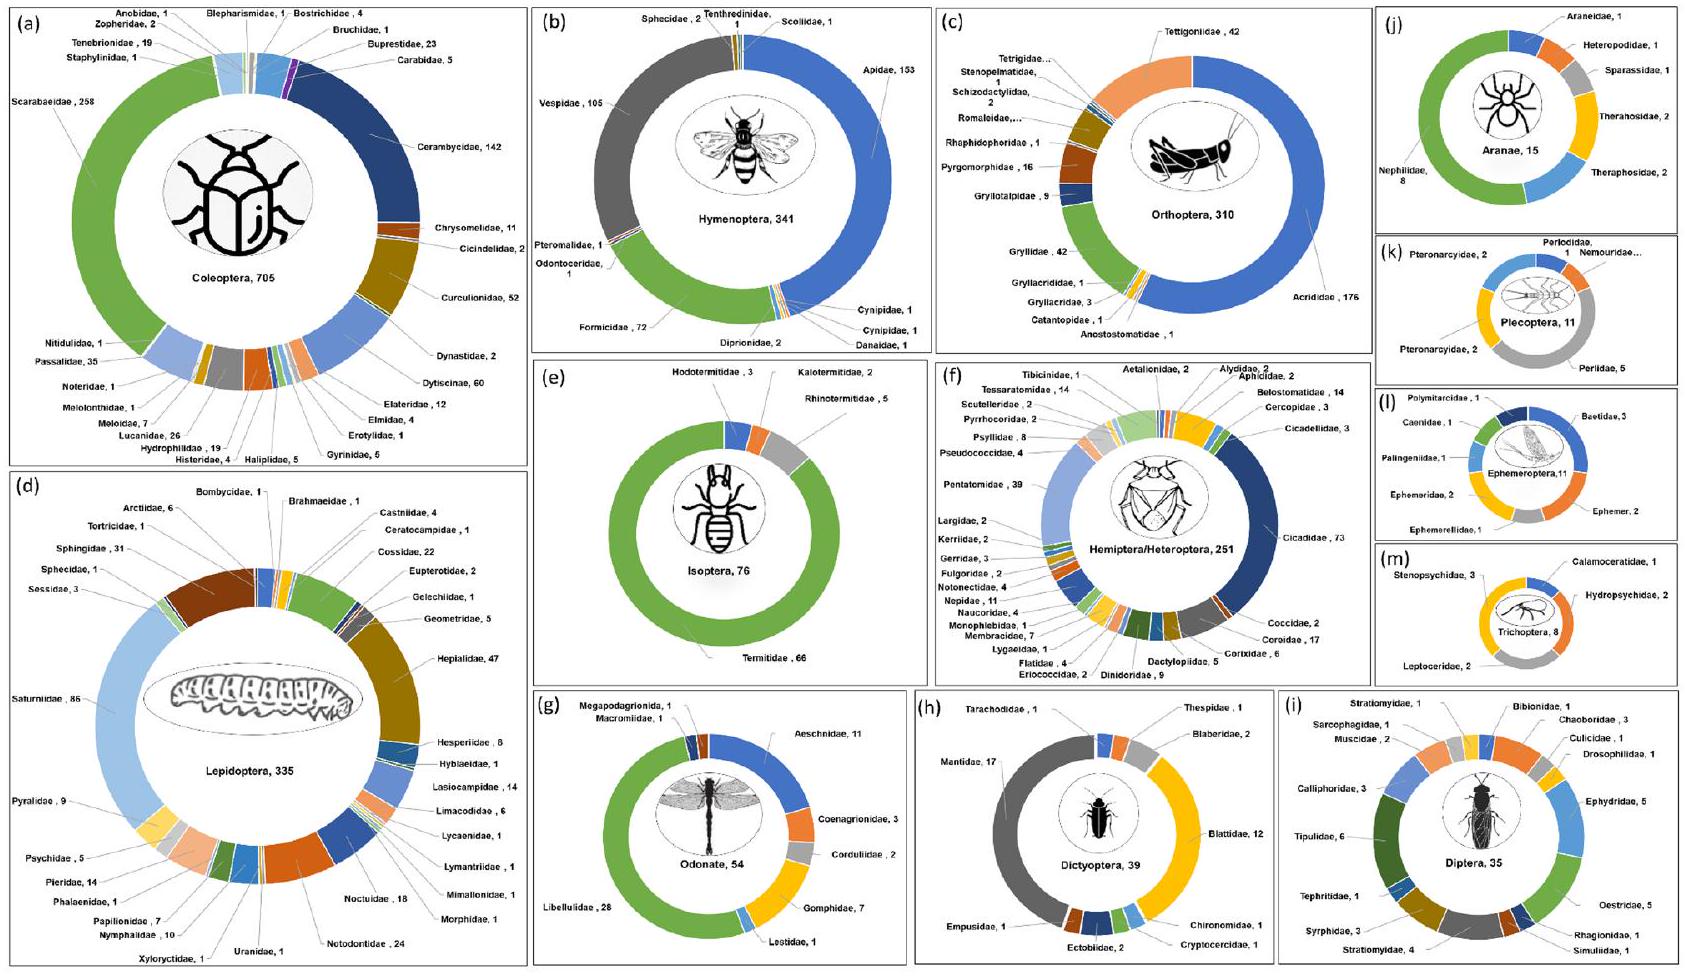
الشكل 2. عدد أنواع الحشرات الصالحة للأكل ممثلة بعائلتها وطلبها. طلبات الحشرات: غمديات الأجنحة (أ)، غشائيات الأجنحة (ب)، مستقيمات الأجنحة (ج)، حرشفيات الأجنحة (د)، متساويات الأجنحة (هـ)، نصفيات الأجنحة (و)، مجنحات (ز)، شبكيات الأجنحة (ح)، ذبابيات (ط)، عناكب (ي)، شائيات الأجنحة (ك)، عابرات الحياة (ل)، شعريات الأجنحة (م). الطلبات التي تحتوي على حشرات صالحة للأكل تنتمي إلى عائلة واحدة فقط وعدد قليل من الأنواع، مثل ذوات الأجنحة (Forficulidae)، عمالقة الأجنحة (Corydalidae)، حشرات الشبح (Phasmatidae)، وحشرات الصوف (Psocidae)، غير مدرجة في الشكل.
ببريستيداي، هيدروفيليداي، تينيبريونايداي، إيلاتيريداي وكريسوميليداي (الشكل 2أ). يتميز ترتيب الهيتيروبترا بعائلة السيكاديداي، بينتاتوميداي، كورييداي، بيلوسوماتيداي، تيساراتوميداي ونيبيداي كأكثر العائلات استهلاكًا (الشكل 2و). يتضمن ترتيب الهايمينوبترا عائلات الأبييداي، فورميكيداي وفيسبيداي (الشكل 2ب). تتكون عائلة التيرميتيداي من العديد من الأنواع (أكثر من 66) في ترتيب الإيزوبترا (الشكل 2هـ). تشمل الليمفيدرا عدة عائلات مستهلكة جيدًا، مثل ساتورنييداي، هيبياليداي، سفينغيداي، كوسيداي ونوكتويداي (الشكل 2د). تقدم الأودوناتا عائلتي ليبيلوليداي وآيشنيداي كعائلات بارزة (الشكل 2ز)، بينما يتميز ترتيب الأورثوبترا بعائلات أكريديداي، تيتغونييداي، غريليداي وروماليداي (الشكل 2ج). يتم تمثيل عدة ترتيبات بواسطة عائلة واحدة، بما في ذلك ديرمابترا (فورفيكوليداي، 1)، ميغالوبترا (كورياليداي، 4)، فاسميدا (فاسمتيداي، 4)، وبسوكوبترا (بسوكيداي، 1)، مما يعرض التنوع الواسع للحشرات الصالحة للأكل عبر مجموعات تصنيفية مختلفة.
ترتيب وعائلات الحشرات الصالحة للأكل عبر القارات
تحتوي آسيا على أكبر عدد من أنواع الحشرات الصالحة للأكل (932)، تليها أمريكا الشمالية (بما في ذلك المكسيك) (529)، وأفريقيا (464)، وأمريكا الجنوبية (300). في المقابل، تحتوي أوقيانوسيا على أقل عدد من الحشرات الصالحة للأكل (107) (الشكل 3).
أظهرت تنوع أنواع الحشرات الصالحة للأكل عبر القارات الخمس اختلافات حسب ترتيب الحشرات، فضلاً عن عدد الأوامر الموجودة في كل قارة، كما هو موضح في الشكل 4. في آسيا، كانت الأوامر الخمسة الأولى من حيث الاستهلاك هي: الخنافس (354)، الحشرات القشرية (128)، الجickets (121)، الفراشات (108)، والنحل (83). تضمنت الأوامر البارزة في أمريكا الشمالية الخنافس (181)، النحل (105)، الجickets (77)، الحشرات القشرية (68)، والفراشات (51). في أفريقيا، كانت الفراشات (137)، الجickets (109)، الخنافس (101)، الحشرات القشرية (42)، والحشرات الخشبية (30) هي الأوامر الأكثر استهلاكًا. في أمريكا الجنوبية، كانت الأوامر السائدة هي النحل (139)، الخنافس (75)، الجickets (23)، الفراشات (17)، والحشرات الخشبية (15). كانت نمط الاستهلاك في منطقة أوقيانوسيا يتميز بالخنافس (29)، الفراشات (28)، الحشرات القشرية (16)، النحل (14)، والجickets (7). تؤكد هذه النتائج على الاختلافات الإقليمية في تفضيلات الحشرات الصالحة للأكل وتبرز أهمية أوامر الحشرات في تشكيل الخيارات الغذائية عبر القارات.
عدد أنواع الحشرات الصالحة للأكل في كل دولة عبر القارات
يختلف استهلاك الحشرات بشكل كبير من دولة إلى أخرى، مما يعكس تفضيلات غذائية متنوعة (الشكل 5 أ-هـ). في أفريقيا، يتم استهلاك الحشرات في 48 دولة (الشكل 5 أ). جمهورية الكونغو الديمقراطية لديها أعلى تنوع في الحشرات (255 نوعًا). تشمل الدول الأخرى التي تستهلك الحشرات بشكل كبير الكاميرون (100 نوع)، وزامبيا (78 نوعًا)، وجمهورية أفريقيا الوسطى (62 نوعًا)، وجنوب أفريقيا (56 نوعًا)، وزيمبابوي (52 نوعًا). دول مثل بوتسوانا، جنوب السودان، أوغندا، غانا، السنغال، الغابون، موزمبيق، بوروندي، ليسوتو، ناميبيا، أنغولا، النيجر، كينيا، بوركينا فاسو، تنزانيا، نيجيريا، بنين، مالاوي، ومدغشقر تحتوي على ما بين 10 و50 نوعًا من الحشرات الصالحة للأكل. توغو، السودان، ساو تومي، غينيا الاستوائية، سيراليون.
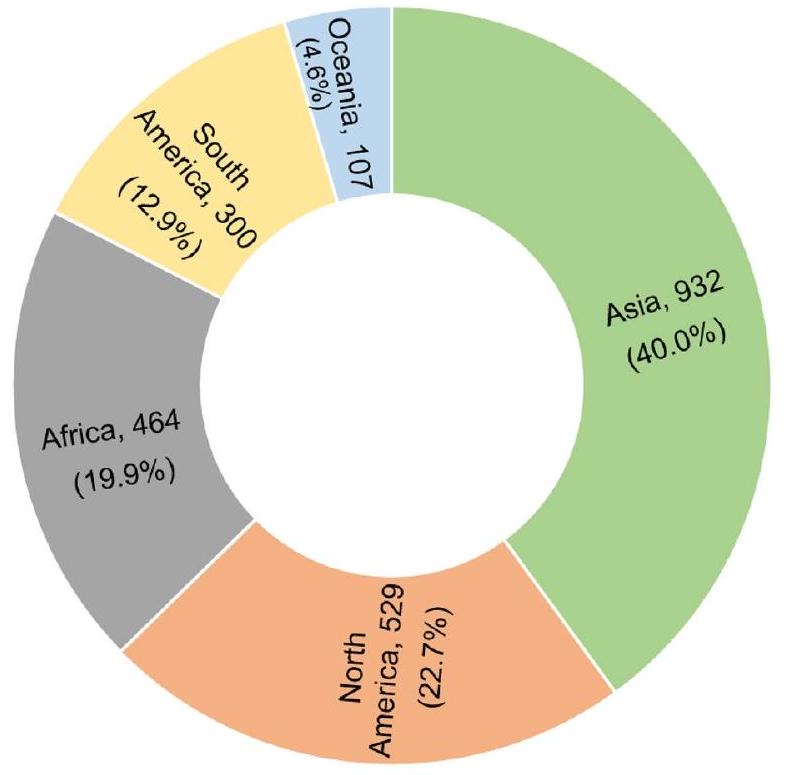
الشكل 3. عدد أنواع الحشرات الصالحة للأكل المستهلكة في أمريكا الشمالية والجنوبية، وأفريقيا، وآسيا، وأوقيانوسيا. تم تقديم النسبة المئوية للحشرات الصالحة للأكل بين قوسين.
الشكل 4. يتم تمثيل عدد الحشرات الصالحة للأكل المبلغ عنها من كل قارة بواسطة أوامر الحشرات وعدد الأنواع. تم استبعاد أوروبا لأن الحشرات ليست جزءًا تقليديًا من نظام غذاء الناس.
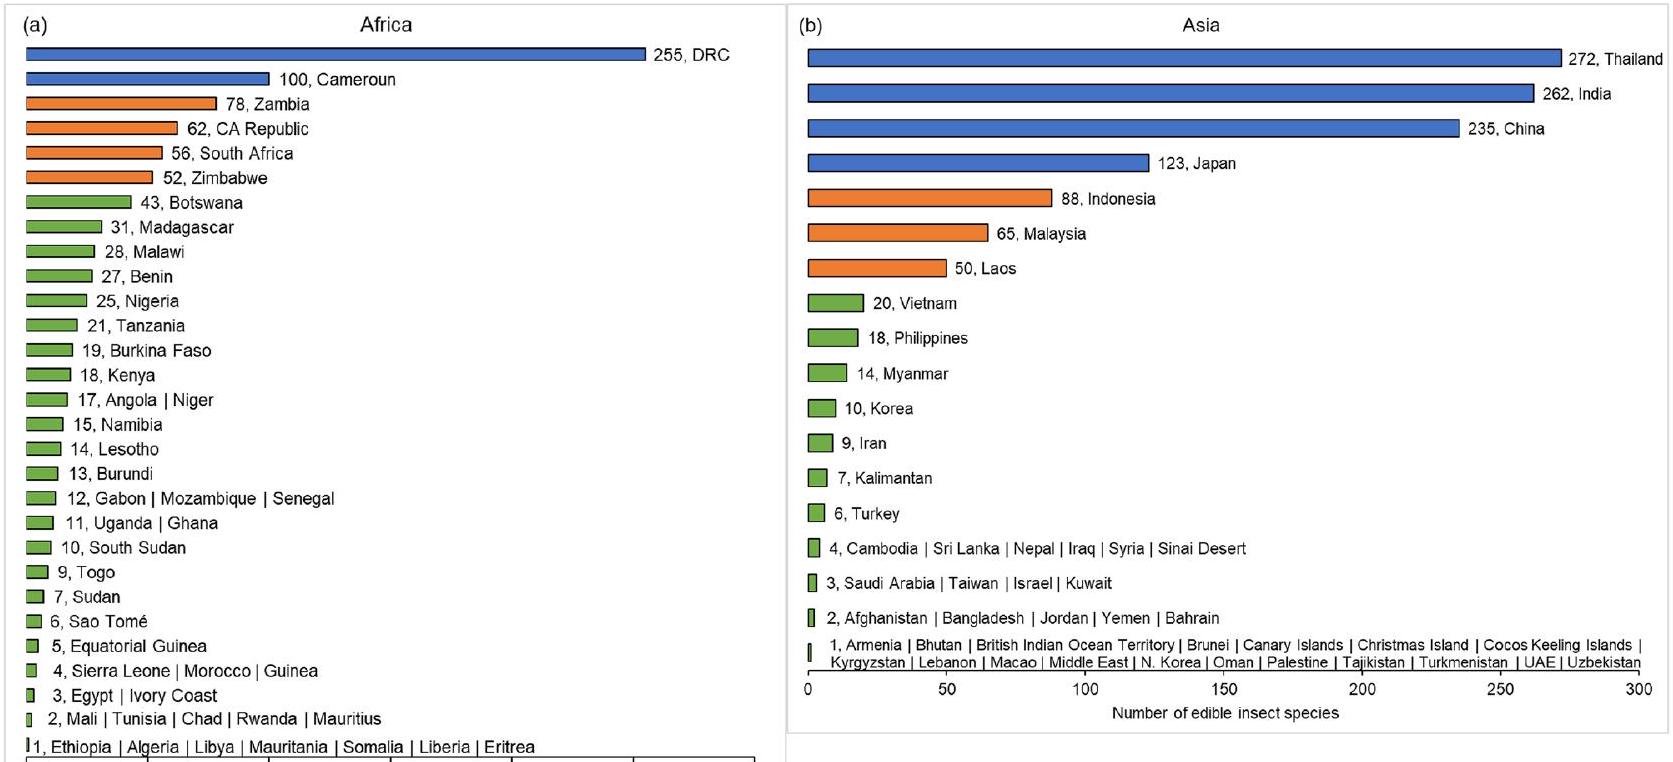
الشكل 5. تنوع أنواع الحشرات المستهلكة في كل بلد، مصنفة حسب المناطق.
تستهلك ليون والمغرب وغينيا ومصر وساحل العاج ومالي وتونس وتشاد ورواندا وموريشيوس وإثيوبيا والجزائر وليبيا وموريتانيا والصومال وليبيريا وإريتريا عددًا أقل من الحشرات الصالحة للأكل، يتراوح بين 1 إلى 9 أنواع.
في آسيا، تضم حوالي 52 دولة الحشرات في نظامها الغذائي (الشكل 5ب). تعتبر تايلاند والهند والصين من الدول الرائدة في استهلاك الحشرات، حيث تحتوي على 272 و262 و235 نوعًا على التوالي. كما أن اليابان لديها تنوع كبير في أنواع الحشرات الصالحة للأكل (123)، تليها إندونيسيا (88) وماليزيا (65) ولاوس (50). تستهلك كوريا الجنوبية وميانمار والفلبين وفيتنام العديد من الحشرات.
في أمريكا الجنوبية، تستهلك حوالي 15 دولة الحشرات (الشكل 5c). تتصدر البرازيل تنوع الحشرات، حيث تحتوي على 140 نوعًا، تليها الإكوادور (93 نوعًا)، كولومبيا (62 نوعًا) وفنزويلا (49 نوعًا). تستهلك الأرجنتين حوالي 18 نوعًا من الحشرات، بينما يتم استهلاك عدد أقل من الأنواع في بيرو، غيانا، بوليفيا، تشيلي، باراغواي، بنما، نيكاراغوا، سورينام، أوروغواي، وغواتيمالا.
تمتلك المكسيك أعلى عدد من أنواع الحشرات الصالحة للأكل (450) في أمريكا الشمالية (الشكل 5d). في المقابل، تستهلك الولايات المتحدة الأمريكية (USA) وكندا ستة وأربعة أنواع من الحشرات، على التوالي، بينما تمتلك نيكاراغوا وبنما كل منهما نوعين من الحشرات الصالحة للأكل. يتم استهلاك نوع واحد فقط من الحشرات الصالحة للأكل في غواتيمالا وجزر الهند الغربية.
في منطقة أوقيانوسيا، تتصدر أستراليا استهلاك الحشرات، حيث يوجد بها 62 نوعًا، تليها بابوا غينيا الجديدة (35 نوعًا) (الشكل 5e). تمتلك بابوا، كاليدونيا الجديدة، نيوزيلندا، وجزر سليمان أعدادًا أقل من الأنواع المسجلة من الحشرات الصالحة للأكل، تتراوح بين 1 إلى 7 أنواع. تؤكد هذه الاختلافات في استهلاك الحشرات الصالحة للأكل عبر القارات والدول على التنوع الغني للممارسات الغذائية وأهمية مراعاة التفضيلات المحلية في السياسات والمبادرات المتعلقة بالحشرات.
أعداد أنواع الحشرات الصالحة للأكل التي هي شائعة ومحددة للدول والقارات
توضح الأشكال النسبية لأنواع الحشرات القابلة للأكل المشتركة بين الدول داخل كل قارة في الشكل 6. ومن الجدير بالذكر أن العديد من أنواع الحشرات مشتركة بين الدول في آسيا وأفريقيا وأمريكا الجنوبية، مما يعكس الممارسات الغذائية الشائعة والتفضيلات الإقليمية.
في آسيا، تتمتع دول مثل تايلاند والهند والصين بأعلى عدد من الحشرات الصالحة للأكل، والتي تشاركها مع دول أخرى. بعض الأنواع الحشرية الأكثر شيوعًا الموجودة في خمس دول آسيوية على الأقل تشمل Sitophilus oryzae L. (Coleoptera: Curculionidae)، Schistocerca gregaria Forsskål (Orthoptera: Acrididae)، Cybister spp. (Coleoptera: Dytiscidae)، Hydrophilus hastatus L. (Coleoptera: Hydrophilidae)، Rhynchophorus ferrugineus Olivier (Coleoptera: Curculionidae)، Hydrophilus palpalis Brullé (Coleoptera: Hydrophilidae)، Gryllotalpa africana Palisot de Beauvois (Orthoptera: Gryllotalpidae)، Cybister tripunctatus Olivier (Coleoptera: Dytiscidae)، Eretes sticticus L. (Coleoptera: Dytiscidae)، Hydrophilus cavisternum Bedel (Coleoptera: Hydrophilidae)، Lethocerus indicus Lepeletier & Serville (Heteroptera: Belostomatidae)، Apis dorsata F. (Hymenoptera: Apidae)، Apis mellifera L. (Hymenoptera: Apidae)، Xylocopa sp. (Hymenoptera: Apidae)، Bombyx mori L. (Lepidoptera: Bombycidae) وTarbinskiellus portentosus L. (Orthoptera: Gryllidae).
في أمريكا الجنوبية، تمتلك البرازيل أعلى عدد من الحشرات الصالحة للأكل وتشارك بعض الأنواع مع دول مثل الإكوادور والأرجنتين وبوليفيا وتشيلي وبيرو وسورينام وأوروغواي وغويانا وكولومبيا. الإكوادور، الدولة الثانية في الترتيب، تشارك أنواعًا شائعة مع الأرجنتين وبوليفيا وتشيلي وباراغواي وبيرو. تشترك دول مثل غويانا وباراغواي وبيرو وسورينام وأوروغواي في العديد من القواسم المشتركة، بينما تمتلك حشرات صالحة للأكل فريدة من نوعها في مناطقها. بعض الحشرات التي تُشارك بشكل متكرر في ثلاث دول على الأقل في أمريكا الجنوبية تشمل Rhynchophorus palmarum L. (Coleoptera: Curculionidae)، Atta cephalotes L. (Hymenoptera: Formicidae)، Macrodontia cervicornis L. (Coleoptera: Cerambycidae)، Umbonia spinosa F. (Homoptera: Cicadellidae)، Trigona clavipes F. (Hymenoptera: Apidae)، Cephalotrigona capitata Smith (Hymenoptera: Apidae)، Tetragonisca angustula Latreille (Hymenoptera: Apidae)، وAtta sexdens L. (Hymenoptera: Formicidae).
في أفريقيا، برزت جمهورية الكونغو الديمقراطية والكاميرون وزامبيا كقادة رئيسيين في استهلاك الحشرات الصالحة للأكل. الحشرات التالية تُشارك بشكل شائع في خمس دول أفريقية على الأقل: Schistocerca gregaria Forsskål (Orthoptera: Acrididae)، Acanthacris ruficornis F. (Orthoptera: Acrididae)، Apis mellifera L. (Hymenoptera: Apidae)، Macrotermes spp. (Isoptera: Termitidae)، Cirina forda Westwood (Lepidoptera: Saturniidae)، Brachytrupes membranaceus Drury (Orthoptera: Gryllidae)، Bunaea alcinoë Stoll (Lepidoptera: Saturniidae)، Eumeta cervine Druce (Lepidoptera: Psychidae)، Nomadacris septemfasciata Audinet-Serville (Orthoptera: Acrididae)، Rhynchophorus phoenicis F. (Coleoptera: Curculionidae)، Carebara vidua Smith (Hymenoptera: Formicidae)، Carebara lignata Westwood (Hymenoptera: Formicidae)، Anaphe panda Boisduval (Lepidoptera: Notodontidae)، Cirina butyrospermi Vuillet (Lepidoptera: Saturniidae)، Dactyloceras lucina Drury (Lepidoptera: Brahmaeidae.)، Imbrasia ertli Rebel (Lepidoptera: Saturniidae)، Platysphinx stigmatica Mabille (Lepidoptera: Sphingidae)، Zonocerus variegatus L. (Orthoptera: Pyrgomorphidae)، Clania moddermanni Heylaerts (Lepidoptera: Psychidae)، Imbrasia epimethea Drury (Lepidoptera: Saturniidae)، Urota sinope
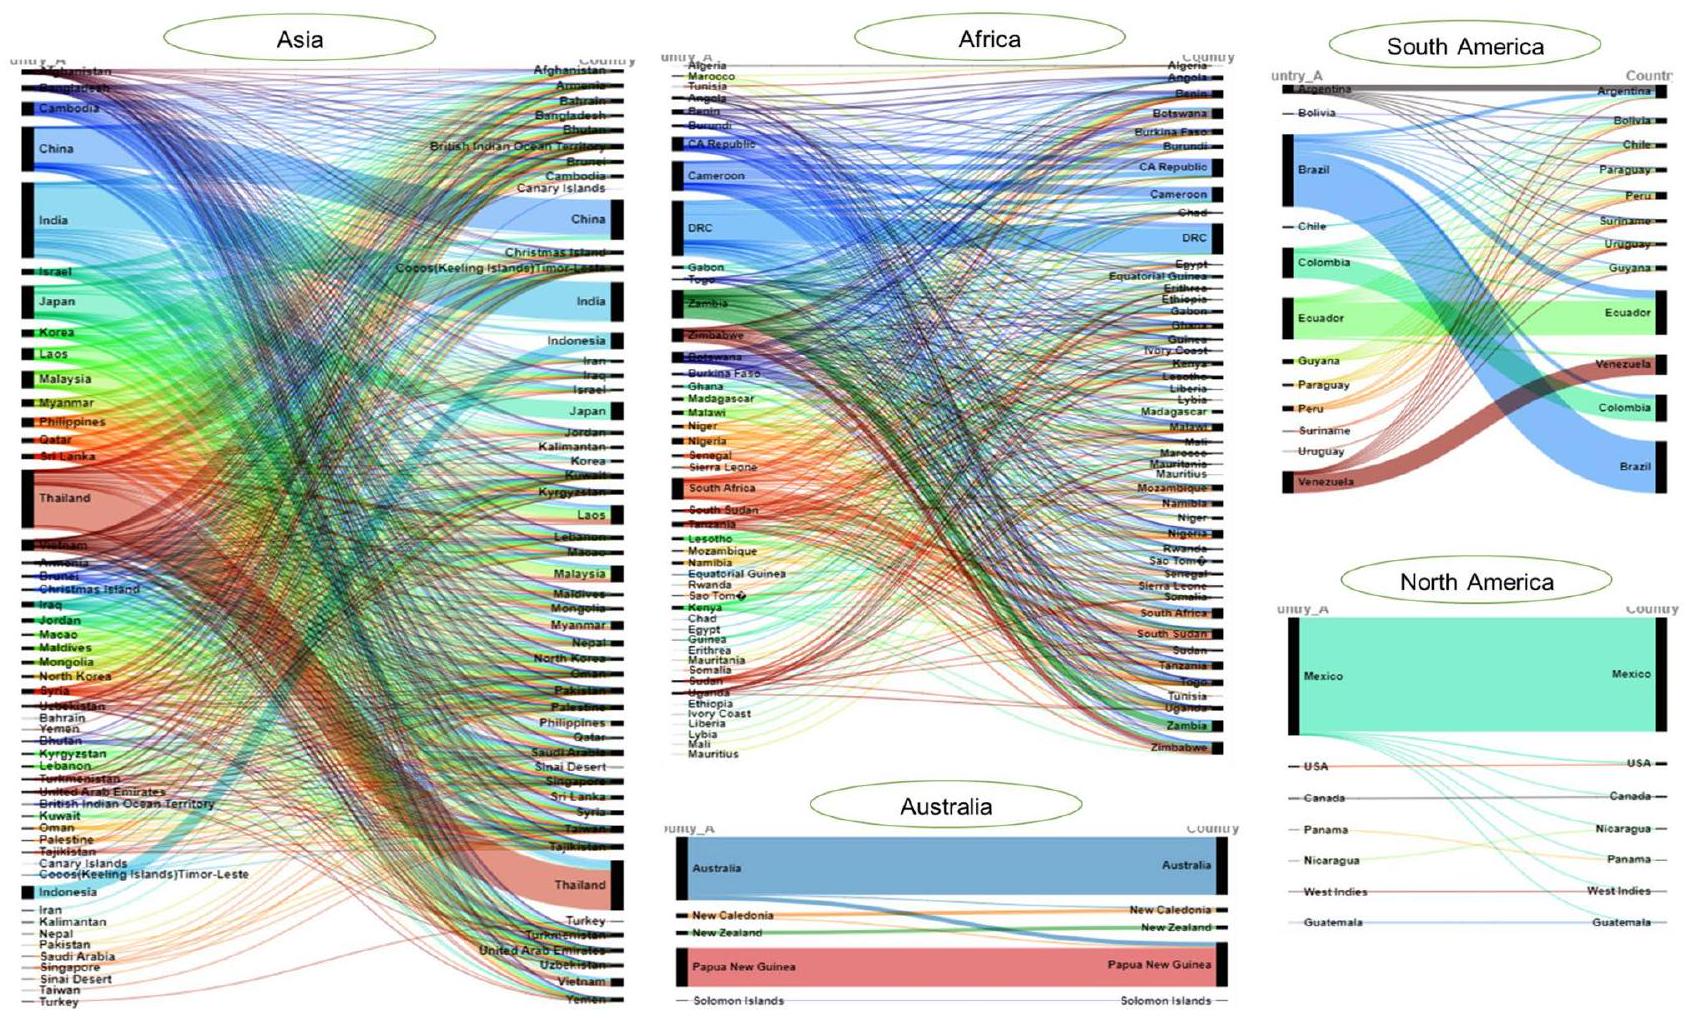
الشكل 6. شبكة الحشرات الصالحة للأكل العابرة للحدود التي يتم الحفاظ عليها ومشاركتها بين الدول في قارة. سمك الخط يساوي عدد الحشرات الشائعة المستهلكة داخل أو بين الدول.
Westwood (Lepidoptera: Saturniidae)، Phymateus viridipes brunneri Bolivar (Orthoptera: Pyrgomorphidae)، Ruspolia differens Serville (Orthoptera: Tettigoniidae)، Macrotermes (Bellicositermes) spp. (Blattodea: Termitidae)، Epanaphe carteri Walsingham (Lepidoptera: Notodontidae)، Imbrasia belina Westwood (Lepidoptera: Saturniidae)، Striphnopteryx edulis Boisduval (Lepidoptera: Eupterotidae)، Locusta migratoria migratorioides Fairmaire & Reiche (Orthoptera: Acrididae)، Locustana pardalina Walker (Orthoptera: Acrididae)، Oryctes boas Oryctes boas Fabricius (Coleoptera: Scarabaeidae)، Hypotrigona gribodoi Magretti (Hymenoptera: Apidae)، Meliponula bocandei Spinola (Hymenoptera: Apidae)، Bunaea caffraria Hübner (Lepidoptera: Saturniidae)، Gynanisa maja Klug (Lepidoptera: Saturniidae)، Heniocha dyops Maassen (Lepidoptera: Saturniidae)، Heniocha marnois Rogenhofer (Lepidoptera: Saturniidae)، Lophostethus demolinii Angas (Lepidoptera: Sphingidae)، Acanthacris ruficornis citrina Serville (Orthoptera: Acrididae)، Anacridium burri Dirsh (Orthoptera: Acrididae)، و Goliathus spp. (Coleoptera: Scarabaeidae). بشكل عام، العديد من الحشرات الصالحة للأكل الموجودة في جمهورية الكونغو الديمقراطية شائعة في دول وسط وجنوب وشرق وغرب أفريقيا. تشارك الكاميرون وزامبيا الحشرات الصالحة للأكل مع دول وسط أفريقيا والدول المجاورة. بالإضافة إلى ذلك، تُظهر جنوب أفريقيا العديد من القواسم المشتركة مع دول في المنطقة الجنوبية الأفريقية مثل زيمبابوي ومالاوي.
في أمريكا الشمالية وأوقيانوسيا، تُشارك عدد قليل نسبيًا من أنواع الحشرات الصالحة للأكل بين الدول. في منطقة أوقيانوسيا، الأنواع المشتركة بين دولتين على الأقل هي Mallodon costatus Montrouzier (Coleoptera: Cerambycidae)، Rhynchophorus bilineatus Montrouzier (Coleoptera: Curculionidae)، Oecophylla smaragdina F. (Hymenoptera: Formicidae)، و Teleogryllus commodus Walker (Orthoptera: Gryllidae). للحصول على قائمة شاملة من الحشرات الصالحة للأكل المشتركة بين الدول والقارات، يرجى الرجوع إلى الجدول التكميلي 1.
التوزيع العالمي للحشرات الصالحة للأكل: الوجود لا يعني الاستهلاك
يُظهر التوزيع العالمي لأنواع الحشرات الصالحة للأكل المحتملة في الشكل 7، مع توضيح وجودها في مناطق مختلفة، على مستوى العالم. ومع ذلك، من المهم ملاحظة أن مجرد وجود هذه الأنواع لا يعني بالضرورة استهلاكها، كما هو موضح في الشكل 8. بينما توجد أنواع الحشرات الصالحة للأكل المحتملة في كل ركن من أركان العالم تقريبًا، فإن عدد أنواع الحشرات التي تم تأكيد أنها صالحة للأكل محدود نسبيًا.
تُلاحظ أعلى كثافة لأنواع الحشرات الصالحة للأكل المحتملة بشكل أساسي في المناطق الاستوائية، حيث تتصدر المكسيك من حيث العدد، تليها الصين وجمهورية الكونغو الديمقراطية والهند وتايلاند والبرازيل. من المRemarkably، حتى تلك الدول التي لا تمتلك تقليدًا ثقافيًا لاستهلاك الحشرات تستضيف على الأقل من نوع إلى عشرة أنواع من الحشرات الصالحة للأكل المحتملة. من حيث التوزيع البيئي، تميل المناطق التي تتميز بالشجيرات والنباتات العشبية والغابات المغلقة المختلطة إلى استضافة أكبر مجموعة متنوعة من الحشرات الصالحة للأكل، كما هو موضح في الشكل 8. تسلط هذه الرؤية الضوء على أهمية مراعاة السياق البيئي عند تقييم الإمكانية لاستخدام الحشرات الصالحة للأكل في مناطق مختلفة حول العالم.
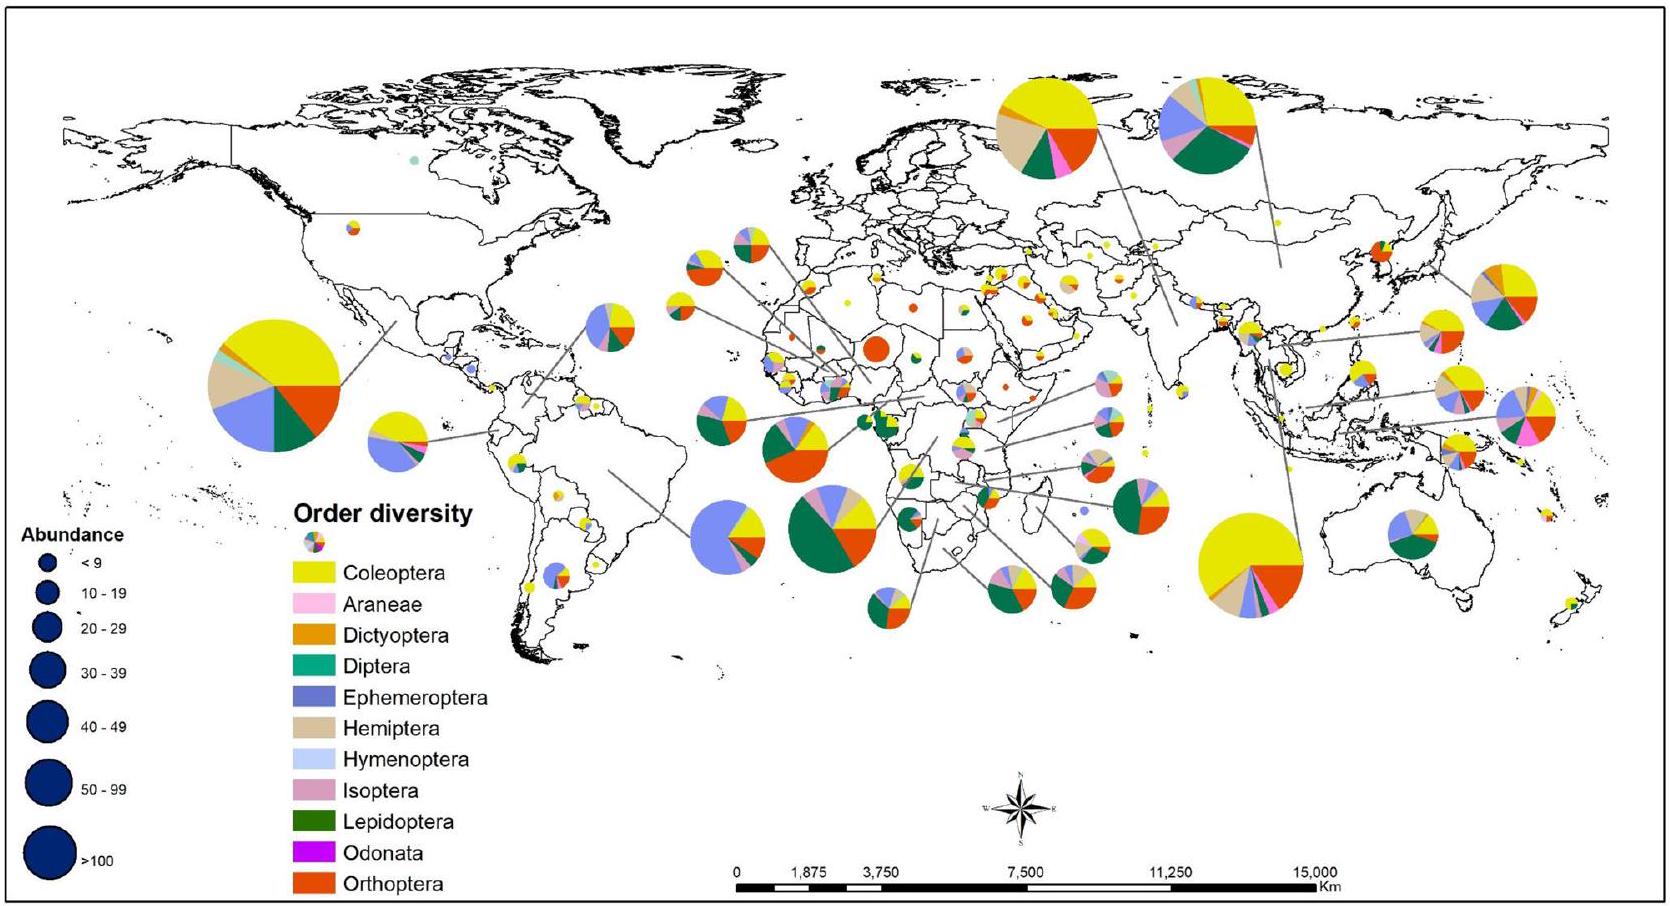
الشكل 7. التوزيع العالمي لأنواع الحشرات الصالحة للأكل ‘المؤكدة’. تشير أنواع الحشرات الصالحة للأكل المؤكدة إلى الأنواع التي تم الإبلاغ عنها في الأدبيات. تم إنشاء الشكل باستخدام برنامج نظم المعلومات الجغرافية QGIS الإصدار 3.34.3 (http://qgis.osgeo.org/).
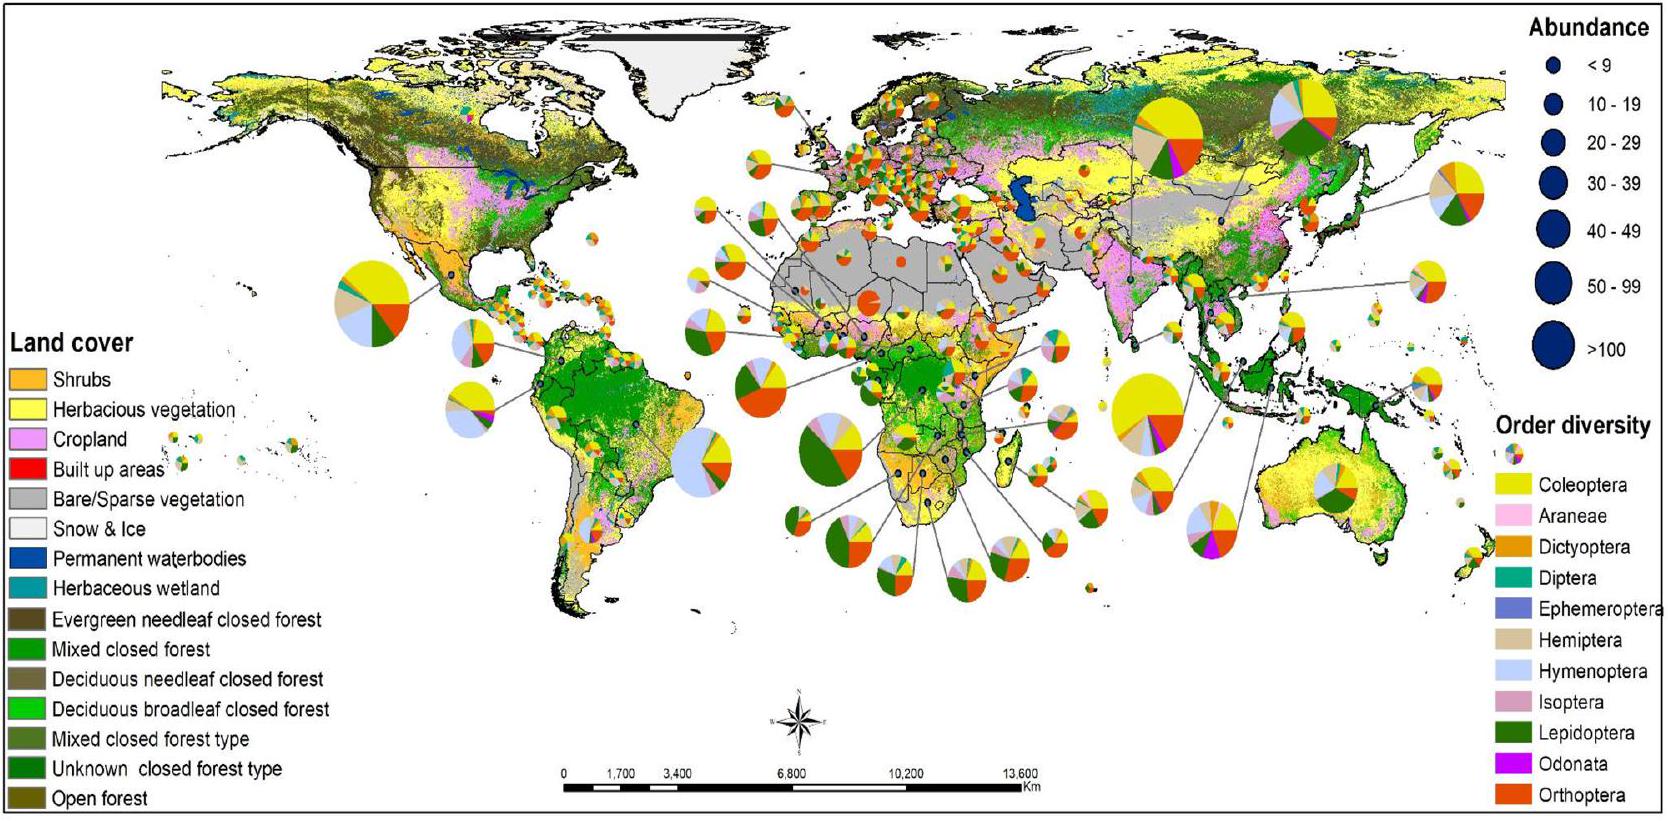
الشكل 8. التوزيع العالمي لأنواع الحشرات الصالحة للأكل المحتملة عبر تصنيفات تغطية الأراضي المختلفة. تشير أنواع الحشرات الصالحة للأكل المحتملة إلى كل من الحشرات الصالحة للأكل المؤكدة وغير المؤكدة. تم إنشاء الشكل باستخدام برنامج نظم المعلومات الجغرافية QGIS الإصدار 3.34.3 (http://qgis.osgeo.org/).
نسبة أنواع الحشرات المستهلكة لكل دولة
يمثل الشكل 9 تنوع ونسبة الحشرات ‘المؤكدة’ (المبلغ عنها في الأدبيات) و ‘غير المؤكدة’ (لا توجد تقارير أدبية) الصالحة للأكل في الدول التي تم الإبلاغ عن عشرة (10) أنواع على الأقل فيها. الدول التي لديها أعلى نسبة من أنواع الحشرات المستهلكة (
عوامل استهلاك الحشرات
لتحديد العلاقات بين التنوع واستخدام واستهلاك الحشرات الصالحة للأكل، على مستوى العالم، تم تقييم المتغيرات التالية.
أ. عدد الحشرات الصالحة للأكل المحتملة – كانت وفرة أنواع الحشرات الصالحة للأكل المؤكدة مرتبطة بشكل إيجابي وذو دلالة مع عدد أنواع الحشرات الصالحة للأكل المحتملة الموجودة في دولة (
ب. يرتبط عدد الحشرات الصالحة للأكل بشكل مباشر بحجم سكان الدول (
ج. انتشار انعدام الأمن الغذائي الشديد – لم يكن هناك ارتباط ذو دلالة بين وفرة أنواع الحشرات الصالحة للأكل المؤكدة ومعايير انعدام الأمن الغذائي/الأمن الغذائي، مثل انتشار انعدام الأمن الغذائي المعتدل إلى الشديد (
د. انتشار سوء التغذية – كان انتشار سوء التغذية مرتبطًا إيجابيًا بوجود الحشرات الصالحة للأكل، لكنه لم يكن ذا دلالة إحصائية.
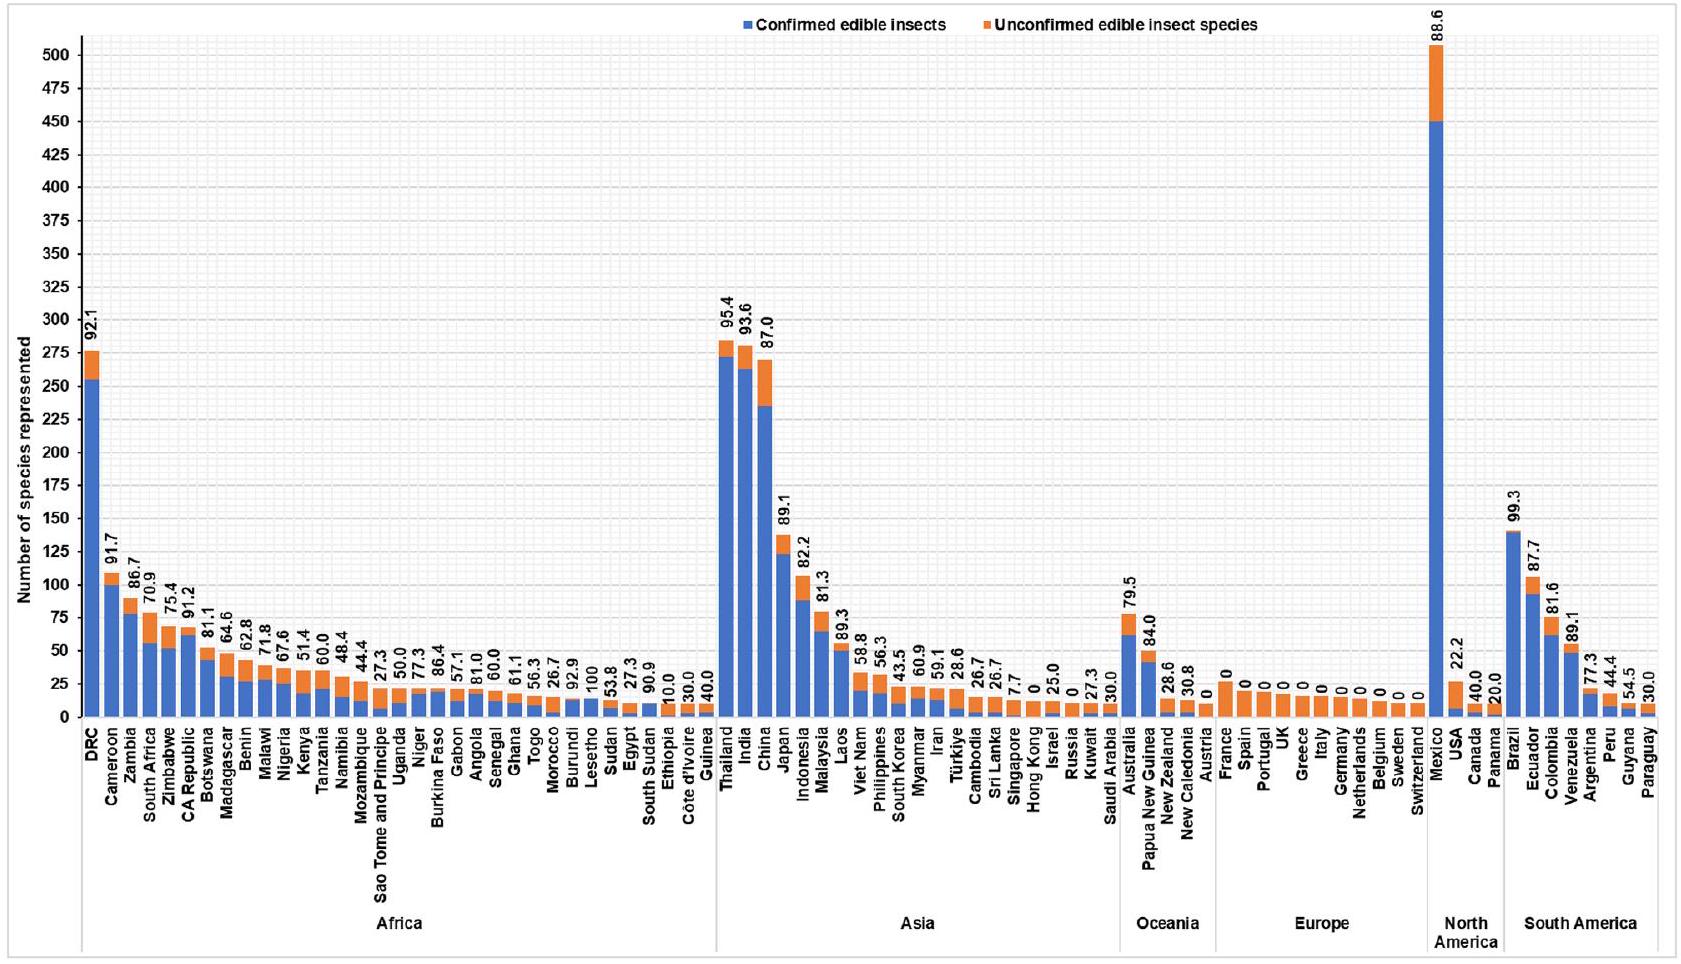
الشكل 9. عدد (تنوع) أنواع الحشرات القابلة للأكل المحتملة المستهلكة في أماكن أخرى (باللون البرتقالي) وأنواع الحشرات القابلة للأكل المؤكدة (باللون الأزرق) في كل دولة. تم تمثيل الدول التي تحتوي على أكثر من 10 أنواع حشرات قابلة للأكل محتملة هنا فقط. بالنسبة للقيم المقدمة أعلاه، تمثل الأعمدة النسب المئوية (%) لأنواع الحشرات القابلة للأكل، استنادًا إلى التقارير المنشورة.
هـ. نسبة الأطفال دون سن الخامسة المتأثرين بالهزال – الهزال لدى الأطفال، الذي يشير إلى الجسم النحيف الناتج عن فقدان الوزن السريع مؤخراً أو الفشل في زيادة الوزن، لم يرتبط بعدد الحشرات الصالحة للأكل المستهلكة.
ف. عدد الحشرات الصالحة للأكل والأطفال دون سن الخامسة الذين يعانون من زيادة الوزن – كان هناك ارتباط إيجابي كبير بين وفرة أنواع الحشرات الصالحة للأكل المؤكدة والأطفال دون سن 5 سنوات الذين يعانون من زيادة الوزن.
ج. كفاية الإمدادات الغذائية – فيما يتعلق بكفاية الإمدادات الغذائية، وهي مقياس للأمن الغذائي يأخذ في الاعتبار متوسط إمدادات السعرات الحرارية لاستهلاك الغذاء، كان عدد أنواع الحشرات الصالحة للأكل له ارتباط سلبي ولكنه غير ذي دلالة مع متوسط كفاية إمدادات الطاقة الغذائية.
الناتج المحلي الإجمالي للفرد – كان لعدد أنواع الحشرات الصالحة للأكل ارتباط سلبي ولكنه غير ذي دلالة مع الناتج المحلي الإجمالي للفرد (
أشارت الانحدارات المتعددة المتغيرات إلى أن عدد الحالات المؤكدة، والناتج المحلي الإجمالي للفرد كانا المتغيرين الوحيدين اللذين توقعا بشكل كبير ممارسة استهلاك الحشرات (الجدول 1).
نقاش
على الرغم من كونها تشكل جزءًا صغيرًا من الفئة، فإن الحشرات الصالحة للأكل تعد مكونًا رئيسيًا في النظام الغذائي العالمي ويمكن أن تعالج بشكل كبير انعدام الأمن الغذائي. يكشف جردنا الشامل عن استهلاك أكثر من 2205 نوعًا من 24 ترتيبًا مختلفًا من الحشرات وترتيب واحد من العنكبيات، عبر 128 دولة، متجاوزًا السجلات السابقة التي كانت تضم 1900 نوع في 113 دولة.
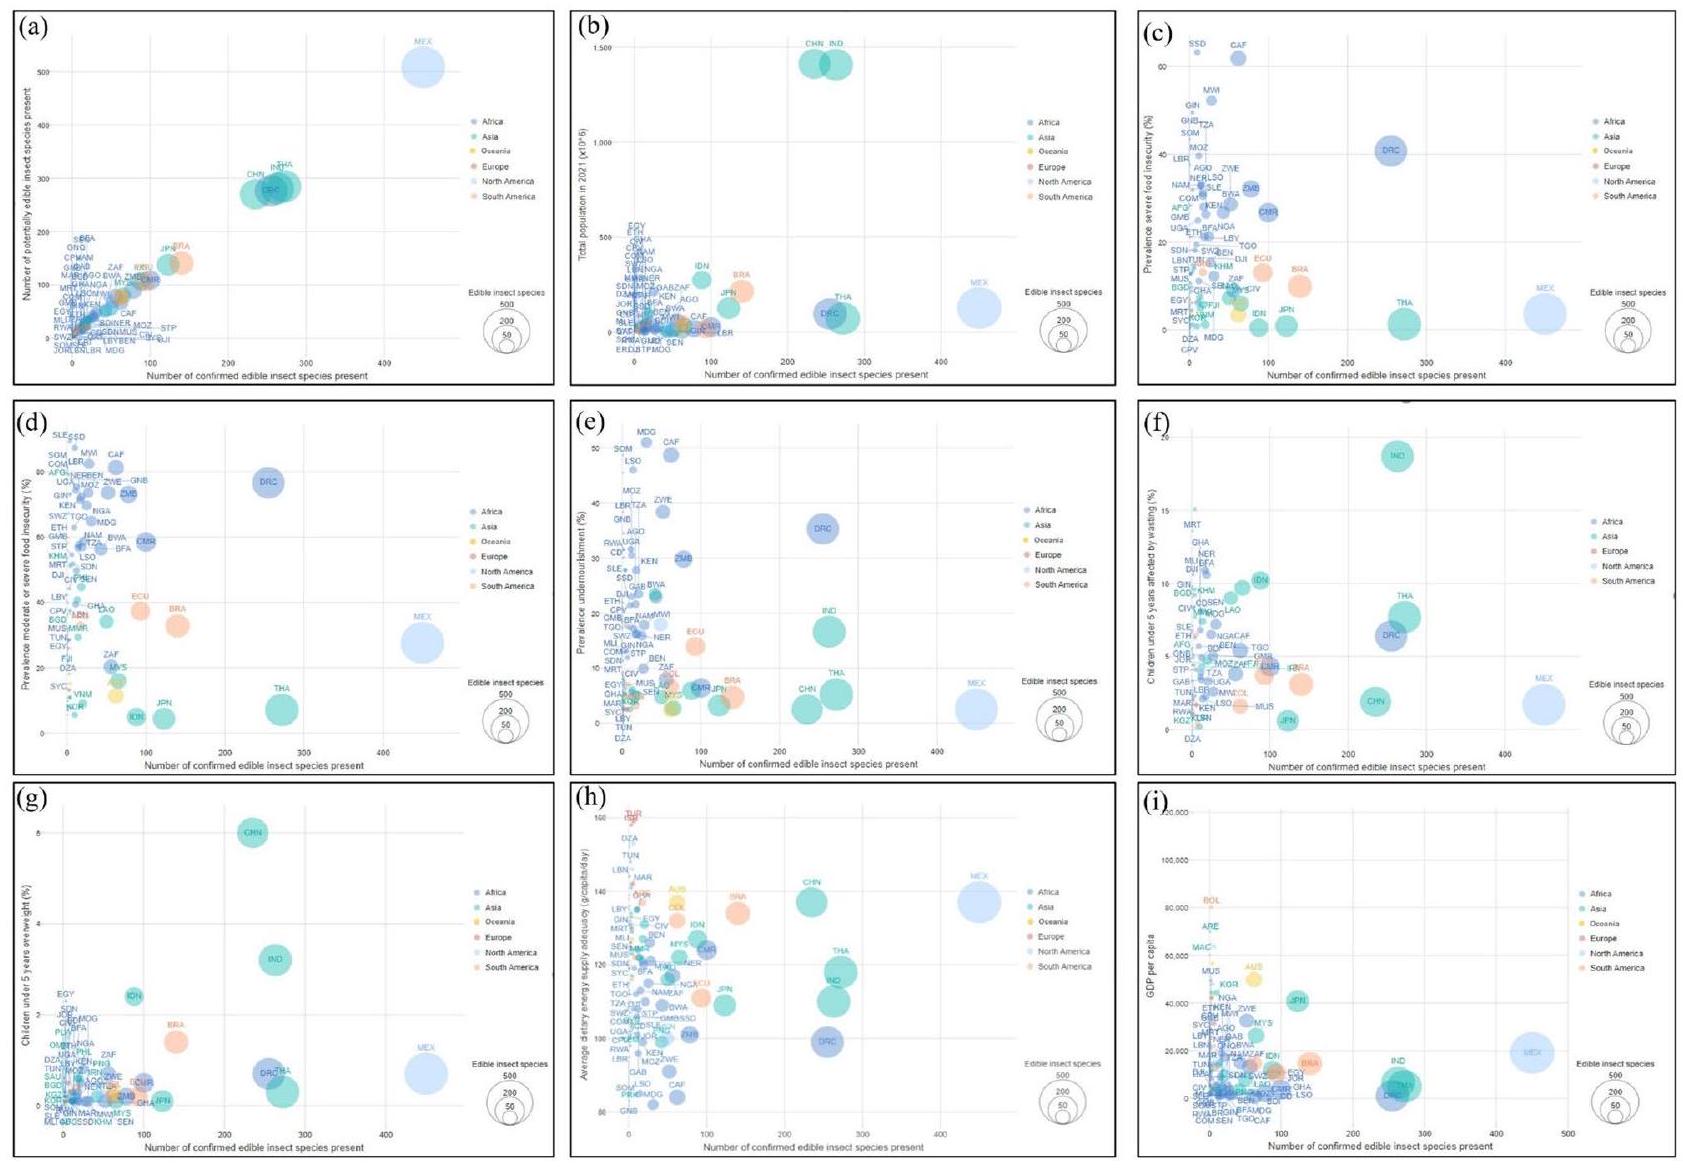
الشكل 10. العلاقات بين تنوع الحشرات الصالحة للأكل المؤكدة مع تنوع جميع الحشرات الصالحة للأكل المحتملة (أ)، حجم السكان (ب)، حالة انعدام الأمن الغذائي/الأمن الغذائي (ج-و)، إمدادات الطاقة الغذائية (ح) والناتج المحلي الإجمالي للفرد (ط).
| متغير | معامل التقدير (
|
خطأ معياري (
|
قيمة t | قيمة p |
| اعتراض | -2.0807 | 16.1721 | -0.129 | 0.898 |
| عدد أنواع الحشرات القابلة للأكل المحتملة | 0.9270 | 0.0104 | ٨٩.٣٨ | <0.001 |
| إجمالي السكان | 0.0200 | 0.0282 | 0.709 | 0.484 |
| الناتج المحلي الإجمالي للفرد | -0.0003 | 0.0001 | -2.389 | 0.023 |
| نسبة الأطفال الذين تقل أعمارهم عن 5 سنوات والذين يعانون من زيادة الوزن (%) | -4.0013 | ٤.٣٠٩٧ | -0.928 | 0.360 |
| الأطفال دون سن الخامسة المتأثرين بالهزال (%) | -0.0064 | 0.3502 | -0.018 | 0.986 |
| نسبة انتشار انعدام الأمن الغذائي المعتدل أو الشديد (%) | -0.0911 | 0.1090 | -0.836 | 0.410 |
| نسبة انتشار انعدام الأمن الغذائي الشديد (%) | 0.1153 | 0.1532 | 0.753 | 0.457 |
| انتشار نقص التغذية (%) | -0.1105 | 0.1972 | -0.560 | 0.579 |
| متوسط إمدادات الطاقة الغذائية (غرام/شخص/يوم) | 0.0150 | 0.1216 | 0.123 | 0.903 |
| معدل
|
الجدول 1. معاملات الانحدار لتوقع ممارسات استهلاك الحشرات (عدد الحشرات الصالحة للأكل المؤكدة).
كأهم مجموعة من الحشرات الصالحة للأكل. يمكن أن يُعزى بروز رتبة الخنافس أيضًا إلى مكانتها كأكثر الرتب بروزًا بين الحشرات، المعروفة بمحتواها من البروتين الخام.
وجدنا أن الأوامر التي تحتوي على أقل عدد من أنواع الحشرات المستهلكة كانت Hemiptera وIsoptera وOdonata وDiptera وDictyoptera وEphemeroptera وPlecoptera وTrichoptera وPhasmida وMegaloptera وDermaptera وPsocoptera. تم الإبلاغ عن أقل عدد من أنواع الحشرات القابلة للأكل تحت هذه الأوامر سابقًا
تظهر نتائجنا أن الحشرات القابلة للأكل موزعة على نطاق واسع وتوجد في جميع الظروف المناخية تقريبًا، بينما تدعم النباتات وجود أنواع الحشرات القابلة للأكل في معظم أنحاء العالم. وفقًا لفان هويز
في العديد من أجزاء العالم، يعتبر تناول الحشرات تراثًا ثقافيًا تم نقله من جيل إلى جيل، منذ ما قبل ظهور الحضارة الحديثة. تمتلك العديد من المجتمعات الاستوائية وشبه الاستوائية تقاليد طويلة في تناول الحشرات
تظهر نتائجنا أن الحشرات تُستهلك في جميع البلدان الإفريقية تقريبًا. من بين المناطق، وجدنا أعلى تنوع للحشرات المستهلكة في المنطقة الإفريقية الوسطى (جمهورية الكونغو الديمقراطية، الكاميرون، وجمهورية إفريقيا الوسطى)، تليها جنوب إفريقيا (زامبيا، جنوب إفريقيا، زيمبابوي، وبوتسوانا). وهذا يؤكد ما وجده كيليمو وآخرون.
وآخرون.
وآخرون.
في آسيا، وجدنا أن أكبر تنوع من الحشرات (أكثر من 50 نوعًا) يتم استهلاكه في تايلاند والهند والصين، تليها اليابان وإندونيسيا وماليزيا ولاوس. كانت الدول الخمس الأولى التي تحتوي على أعلى تنوع من أنواع الحشرات القابلة للأكل في أمريكا الجنوبية هي البرازيل والإكوادور وكولومبيا وفنزويلا والأرجنتين. في منطقة أوقيانوسيا، لوحظ أعلى تنوع من الحشرات القابلة للأكل في أستراليا وبابوا غينيا الجديدة. في أمريكا الشمالية، تعتبر المكسيك الأكثر بروزًا في استهلاك الحشرات (أكثر من 450 نوعًا)، بينما تحتوي الولايات المتحدة وكندا ونيكاراغوا وبنما وغواتيمالا وجزر الهند الغربية على ما بين 1 و6 أنواع من الحشرات القابلة للأكل فقط. وفقًا لفان هويز وآخرين.
بشكل عام، يتم استهلاك معظم أنواع الحشرات في المناطق الاستوائية الإفريقية، والمناطق الاستوائية الأمريكية (التي تشمل فقط المكسيك في أمريكا الشمالية، وأمريكا الوسطى، وجزر الكاريبي والنصف العلوي من أمريكا الجنوبية، بما في ذلك كولومبيا والإكوادور وبيرو وبوليفيا وكولومبيا وفنزويلا وغويانا وسورينام، والأجزاء الشمالية من تشيلي والأرجنتين وباراغواي والبرازيل) والمناطق الاستوائية الآسيوية (بنغلاديش وكمبوديا والهند وإندونيسيا وماليزيا والفلبين وسريلانكا وتايلاند وفيتنام). كما لاحظنا بعض الدول التي تحتوي على العديد من أنواع الحشرات القابلة للأكل في آسيا شبه الاستوائية (الصين) ودول إفريقيا شبه الاستوائية (جنوب إفريقيا وناميبيا) ودول أوقيانوسيا شبه الاستوائية. وجدنا أن هذه المناطق تتميز بوجود كثيف من الشجيرات والنباتات العشبية والغابات المغلقة المختلطة، والتي يمكن أن تحتضن أنواعًا متنوعة من الحشرات القابلة للأكل.
على الرغم من وجودها في معظم البلدان، لاحظنا أن أعداد أنواع الحشرات المؤكدة كصالح للأكل كانت منخفضة نسبياً، حيث لم تسجل بعض البلدان أي استهلاك للحشرات. على سبيل المثال، توجد 21 نوعاً محتملاً من الحشرات الصالحة للأكل في تركيا، مع الإبلاغ عن ستة أنواع فقط كصالح للأكل. في إيطاليا وألمانيا، يوجد حوالي 16 و15 نوعاً محتملاً من الحشرات الصالحة للأكل، على التوالي، دون الإبلاغ عن أي منها كصالح للأكل.
أظهرت نتائجنا تداخلات في أنواع الحشرات الصالحة للأكل بين البلدان، خاصة في آسيا وأفريقيا وأمريكا الجنوبية. تشمل الحشرات الـ 11 الأكثر تداخلاً على مستوى العالم Schistocerca gregaria Forskål (Orthoptera: Acrididae)، Gryllus bimaculatus De Geer (Orthoptera: Gryllidae)، Macrodontia cervicornis L. (Coleoptera: Cerambycidae)، Stenodontes damicornis L. (Coleoptera: Cerambycidae)، Cybister spp. (Coleoptera: Dytiscidae)، Oryctes rhinoceros L. (Coleoptera: Scarabaeidae)، Rhynchophorus ferrugineus Oliv. (Coleoptera: Curculionidae)، Rhynchophorus palmarum L. (Coleoptera: Curculionidae)، Nezara viridula L. (Hemiptera: Pentatomidae)، Macrotermes (Bellicositermes) sp. (Isoptera: Termitidae)، Nomadacris septemfasciata Serville (Orthoptera: Acrididae)، وGryllotalpa africana F. (Orthoptera: Gryllotalpidae). تسلط هذه النتائج الضوء على التداخلات والاختلافات العالمية والإقليمية في استهلاك الحشرات الصالحة للأكل وأهمية النظر في هذه الأنواع المشتركة في المناقشات المتعلقة بتنوع النظام الغذائي والممارسات الثقافية. يمكن أن يُعزى التداخل بين البلدان والقارات في أنواع الحشرات الصالحة للأكل إلى التشابهات المحتملة في التاريخ، والمجتمعات العرقية، وخصائص تغطية الأراضي، والظروف المناخية التي تفضل وجود أنواع معينة من الحشرات الصالحة للأكل.
يمكن أن تكون الحشرات الصالحة للأكل موضوع دخول رئيسي وموارد رئيسية لمعالجة الأمن الغذائي والتغذية. على سبيل المثال، تعتمد البلدان التي تعاني من انعدام الأمن الغذائي الحاد، مثل جنوب السودان، وجمهورية إفريقيا الوسطى ومالاوي، بشكل كبير على الحصاد الموسمي للحشرات الصالحة للأكل. يمكن ربط ذلك بالأزمات السياسية وفترات الجفاف الطويلة في تلك البلدان. ومع ذلك، لم يُعثر على علاقة بين استهلاك الحشرات وسوء التغذية، مما يؤكد الأبعاد الثقافية والدينية. مدغشقر، جمهورية إفريقيا الوسطى، الصومال، وليسوتو هي بعض البلدان التي تم تحديدها بأعلى معدلات سوء التغذية ولكنها تستهلك أقل من 100 نوع من الحشرات الصالحة للأكل. في الوقت نفسه، تتمتع جمهورية الكونغو الديمقراطية والهند بمعدل مرتفع نسبياً من سوء التغذية، ولكن مع أكثر من 100 نوع من الحشرات الصالحة للأكل. لم يكن هناك ارتباط كبير بين هزال الأطفال واستهلاك الحشرات، بينما كان هناك ارتباط إيجابي بين زيادة وزن الأطفال. تستهلك البلدان ذات معدلات هزال الأطفال الأعلى أقل من 50 نوعاً من الحشرات، مقارنة بالبلدان ذات معدلات هزال الأطفال الأقل التي تستهلك أكثر من 50 نوعاً من الحشرات. في بلدان مثل الهند وتايلاند، يكون هزال الأطفال مرتفعاً، ومع ذلك يتم استهلاك أكثر من 200 نوع صالح للأكل، بينما المكسيك لديها معدل هزال أطفال منخفض، ولكن مع أكثر من 400 نوع من الحشرات التي يتم تناولها. كما أن هزال الأطفال مرتفع في موريتانيا، وغانا، والنيجر، ومالي، وبوركينا فاسو، وجيبوتي، وغينيا، والسودان، ولكن يتم استهلاك أقل من 50 نوعاً من الحشرات.
من ناحية أخرى، وجدنا ارتباطاً إيجابياً كبيراً بين زيادة وزن الأطفال واستهلاك الحشرات. الصين، والهند، وإندونيسيا هي بعض البلدان التي لديها نسب مرتفعة نسبياً من الأطفال الذين يعانون من زيادة الوزن الحاد ويستهلكون أكثر من 200 نوع من الحشرات. بينما البلدان ذات النسبة المنخفضة من الأطفال الذين يعانون من زيادة الوزن الحاد (مثل جمهورية الكونغو الديمقراطية، وتايلاند، والمكسيك، واليابان، وغانا) تستهلك عددًا مرتفعًا نسبيًا من الحشرات. ومع ذلك، كانت هذه التحليلات تعتمد على بيانات متوسطات وطنية من FAOSTAT. قد يوفر مزيد من التحليل بناءً على معلومات زيادة وزن الأطفال في ولاية أو منطقة معينة من البلاد صورة أوضح.
يظهر الارتباط السلبي بين استهلاك الحشرات والناتج المحلي الإجمالي للفرد بشكل عام أن البلدان ذات الدخل المنخفض قد تبنت إلى حد كبير ثقافة “التهام الحشرات”؛ ومع ذلك، باستثناء بعض البلدان، مثل الصين، والهند، وإندونيسيا.
تستهلك البلدان ذات متوسط كفاية إمدادات الطاقة الغذائية الأعلى، مثل تركيا، وإسرائيل، وتونس، ولبنان، عددًا قليلاً من أنواع الحشرات الصالحة للأكل. البلدان التي تحتوي على أكبر عدد من أنواع الحشرات الصالحة للأكل لديها كفاية جيدة نسبيًا في إمدادات الطاقة الغذائية، مثل المكسيك، وتايلاند، والهند، وجمهورية الكونغو الديمقراطية، والصين. هذه النتيجة قابلة للنقاش وتظهر أن تناول الحشرات ليس مرتبطًا بالبدائية وغياب الحضارة. يمكن أن تمارس البلدان المتقدمة اقتصاديًا التراث الثقافي، مثل استهلاك الحشرات، بينما تطور تقنيات حديثة لتربية الحشرات الصالحة للأكل على نطاق واسع ومعالجتها بشكل متقدم. البلدان ذات أعلى إيرادات للفرد، مثل بوليفيا، والإمارات العربية المتحدة، وماكاو، وموريشيوس، وكوريا، تستهلك عددًا أقل من الحشرات، بينما البلدان ذات الإيرادات الأقل تستهلك المزيد من الحشرات. قد يُعزى نقص الاستهلاك إلى قلة التنوع وغياب عادات أو ثقافة تناول الحشرات. ومع ذلك، تستهلك بلدان مثل اليابان وأستراليا، التي لديها ناتج محلي إجمالي مرتفع نسبيًا، العديد من الحشرات الصالحة للأكل. تُعتبر الحشرات الصالحة للأكل مصدراً جديداً للبروتين، وليس بالضرورة للطاقة. ومع ذلك، في البلدان التي يعاني فيها الناس من نقص في إنتاج الأطعمة الغنية بالسعرات الحرارية (مثل الأساسيات والحشرات الصالحة للأكل)، يمكن أن تتوازن فرص سبل العيش مع الإنتاجية الزراعية. تُظهر دراستنا أن الحشرات هي مصدر غذائي قيم لكل من البلدان ذات الدخل المنخفض والعالي، في جميع أنحاء العالم. بالنظر إلى الظروف المناخية الملائمة والنباتات، يمكن تداول الحشرات الصالحة للأكل من البلدان ذات الدخل المنخفض إلى البلدان غير المستهلكة في نظام غذائي محسّن وسلسلة قيمة اقتصادية مستدامة.
الخاتمة
كانت الحشرات الصالحة للأكل جزءًا من النظام الغذائي التقليدي للعديد من الناس في المناطق الاستوائية وشبه الاستوائية. وجدنا أن أكثر من 2205 نوع من الحشرات يتم استهلاكها في 128 دولة، وأن الطلبات التي تحتوي على أكبر عدد من الأنواع الصالحة للأكل هي Coleoptera وHymenoptera وLepidoptera وOrthoptera. نبلغ أن أكثر من 932 و529 و464 و300 و107 نوع من الحشرات الصالحة للأكل توجد في آسيا وأمريكا الشمالية وأفريقيا وأمريكا الجنوبية وأوقيانوسيا، على التوالي. البلدان التي تحتوي على 100 نوع على الأقل من الحشرات الصالحة للأكل هي المكسيك (450)، وتايلاند (272)، والهند (262)، وجمهورية الكونغو الديمقراطية (255)، والصين (235)، والبرازيل (140)، واليابان (123)، والكاميرون (100). تحتوي معظم الحشرات الصالحة للأكل على تداخلات إقليمية، بينما تحتوي بعضها على تداخلات قارية، والتي يمكن أن ترتبط بالظروف المناخية، خاصة على طول المناطق الاستوائية وشبه الاستوائية، وخصائص تغطية الأراضي، وتاريخ التهام الحشرات بين المجموعات العرقية. على الرغم من وجود الحشرات الصالحة للأكل في بعض البلدان الغربية، إلا أن استهلاك الحشرات لا يزال منخفضًا نسبيًا. تتمتع الحشرات الصالحة للأكل بالعديد من الفوائد المتعلقة بالاحتياجات الغذائية والتغذوية، وسبل العيش، والتنمية الاقتصادية، والاندماج الاجتماعي، والبيئة، مما يساهم بشكل كبير في تحقيق تقريبًا جميع أهداف التنمية المستدامة للأمم المتحدة.
على الرغم من محاولتنا توثيق الحشرات الصالحة للأكل في العالم، فإن السؤال اللافت هو ما إذا كانت البيانات العلمية المتاحة حاليًا تمثل بدقة جميع أنواع الحشرات الصالحة للأكل التي يتم تناولها في جميع أنحاء العالم. على الرغم من وجود تحذيرات، فإننا نفترض أن العديد من الحشرات الصالحة للأكل الأخرى يتم تناولها، ولكن لم يتم تسجيلها في الأدبيات. لذلك، تقدم هذه الورقة رؤى حول تقديرات تنوع الحشرات الصالحة للأكل، وتوزيعها، وأوجه التشابه عبر البلدان والقارات والعالم. بينما تلقي هذه الدراسة بعض الضوء على بعض المحركات المحتملة لحدوث الحشرات، والتداخلات، وحالة الصلاحية للأكل لأنواع مختلفة من الحشرات، هناك أيضًا حاجة لتوثيق نسبة سكان البلاد الذين يتناولون الحشرات وتعزيز ثقافة تناول الحشرات.
المنهجية
مصادر البيانات
استندنا إلى مجموعة متنوعة من المصادر المنشورة لبناء جرد شامل للحشرات الصالحة للأكل على مستوى العالم. وقدمت هذه المصادر معًا نظرة غنية على تنوع الحشرات الصالحة للأكل عالميًا. بدأت عملية تجميع البيانات لدينا بمراجعة شاملة للأدبيات. استشرنا مجموعة متنوعة من الدراسات والمنشورات التي قامت بتوثيق الحشرات الصالحة للأكل في جميع أنحاء العالم. ومن المصادر البارزة التي تم الاستناد إليها كانت جونجيما.
جمع البيانات والتحقق منها
تم تنظيم وتسجيل مجموعات البيانات الناتجة، التي تشمل معلومات عن أنواع الحشرات القابلة للأكل، بالإضافة إلى تفاصيل البلدان التي توجد فيها، بشكل دقيق ومنظم من خلال استخدام تطبيق Microsoft Excel. تم تحديد وإزالة أي إدخالات مكررة خلال هذه العملية لضمان دقة البيانات وتناسقها. قمنا بإجراء عملية تحقق صارمة لتحديد وجود الأنواع الحشرية المدرجة في بلدان وأقاليم مختلفة. شملت هذه العملية بحثًا منهجيًا عن
مستودعات البيانات ذات السمعة الطيبة، مثل المرفق العالمي لمعلومات التنوع البيولوجي (GBIF) وiNaturalist. تُعرف هذه المنصات بمجموعاتها الواسعة والموثوقة من بيانات التنوع البيولوجي.
مستودعات البيانات ذات السمعة الطيبة، مثل المرفق العالمي لمعلومات التنوع البيولوجي (GBIF) وiNaturalist. تُعرف هذه المنصات بمجموعاتها الواسعة والموثوقة من بيانات التنوع البيولوجي.
تركيب البيانات، التحليل، والتصور
تمت معالجة مجموعات البيانات المجمعة، التي تم إثراؤها الآن بمعلومات الحضور الموثوقة، وتنسيقها في صيغ معلوماتية، بما في ذلك الرسوم البيانية والجداول. كانت هذه الخطوة تهدف إلى جعل البيانات أكثر سهولة في الوصول لتطبيق التحليلات. في هذا السياق، تم استخدام أدوات وتطبيقات متعددة. برنامج نظام المعلومات الجغرافية QGIS 3.34.3http://qgis.osgeo.org/تم استخدام ) لدمج بيانات توزيع أنواع الحشرات القابلة للأكل مع مجموعة بيانات تغطية الأرض العالمية، وإجراء التحليل العنقودي، وربط وجود الحشرات القابلة للأكل بأنواع معينة من تغطية الأرض والظروف البيئية. قبل هذا التحليل، قمنا بإجراء تصنيف، مع اعتبار بعض الأنواع قابلة للأكل بشكل محتمل. تفتقر هذه الحشرات إلى سجلات استهلاك موثقة في بلد أو إقليم معين ولكن تم الإبلاغ عنها كقابلة للأكل في دول أخرى. هذه التفرقة مهمة لأنها تسلط الضوء على الإمكانية لتوسيع الأنظمة الغذائية المعتمدة على الحشرات إلى المناطق التي لا يتم استهلاك هذه الأنواع فيها تقليديًا. من خلال هذا التحليل، قمنا بإنشاء خرائط، تساعد في تصور التوزيع الجغرافي للحشرات القابلة للأكل، مما يسمح لنا بتحديد المناطق التي يتم استهلاكها بشكل شائع وتلك التي قد تكون قابلة للتطبيق كمصادر غذائية مستقبلية.
قمنا بتبني نهج عام لتقييم انتشار الحشرات الصالحة للأكل في مناطق مختلفة لمساعدتنا على فهم مدى استهلاك الحشرات الصالحة للأكل بشكل شائع. حسبنا نسبة الحشرات الصالحة للأكل كنسبة من عدد أنواع الحشرات الصالحة للأكل المؤكدة، مقارنةً بإجمالي عدد الحشرات المحتمل أن تكون صالحة للأكل المسجلة في كل دولة (أو إقليم).
تم استخدام معامل ارتباط بيرسون لتقدير قوة واتجاه العلاقات بين المتغيرات. علاوة على ذلك، تم إجراء تحليل الانحدار المتعدد، باستخدام أعداد الحشرات الصالحة للأكل المبلغ عنها كمتغيرات مستقلة، بينما كانت حجم السكان، ومعايير انعدام الأمن الغذائي، والناتج المحلي الإجمالي هي المتغيرات التابعة. تم إجراء تحليل الارتباط والانحدار المتعدد باستخدام برنامج R.
لتصوير القواسم المشتركة والخصوصيات العابرة للحدود لأنواع الحشرات داخل القارات، استخدمنا أداة تصور البيانات RawGraphs.https://app.rawgraphs.io/). تمثل الرسوم البيانية سانكي التي تم إنشاؤها من خلال هذه المنصة بوضوح كيفية توزيع بعض أنواع الحشرات عبر القارات، مما يوفر رؤى حول الأنواع الصالحة للأكل المشتركة والفريدة ضمن هذه المناطق. لجعل العلاقات بين هذه المتغيرات أكثر سهولة، استخدمنا مخططات الفقاعات. تم إنشاء هذه التمثيلات الرسومية من خلال استخدام Displayr (https://westeurope.displayr.comوهي أداة لتصور البيانات عبر الإنترنت. تعرض الرسوم البيانية الفقاعية البيانات متعددة المتغيرات بشكل فعال باستخدام فقاعات بأحجام وألوان مختلفة لتمثيل متغيرات مختلفة، مما يسهل التعرف على الأنماط والاتجاهات والارتباطات.
توفر البيانات
تتوفر مجموعات البيانات التي تدعم نتائج هذه الدراسة عند الطلب من المؤلف المراسل.
تاريخ الاستلام: 20 يناير 2024؛ تاريخ القبول: 26 فبراير 2024
نُشر على الإنترنت: 29 فبراير 2024
تاريخ الاستلام: 20 يناير 2024؛ تاريخ القبول: 26 فبراير 2024
نُشر على الإنترنت: 29 فبراير 2024
References
- Leach, M. et al. Food politics and development. World Dev. 134, 105024 (2020).
- United Nations. The World Population Prospects, The 2017 Revision (2017).
- WHO. Workshop on Regulatory and Food Safety Aspects of Alternative Proteins for Conventional Animal Products (World Health Organization, 2021).
- Clark, M. A. et al. Global food system emissions could preclude achieving the 1.5 and
climate change targets. Science 370, 705-708 (2020). - Madzorera, I. et al. Food systems as drivers of optimal nutrition and health, complexities and opportunities for research and implementation. Curr. Dev. Nutr. 5, 062 (2021).
- Henchion, M., Hayes, M., Mullen, A. M., Fenelon, M. & Tiwari, B. Future protein supply and demand, strategies and factors influencing a sustainable equilibrium. Foods 6, 53 (2017).
- Ritchie, H. & Poser, M. Meat and Dairy Production. https://ourworldindata.org/meat-production (Accessed 23 September 2023) (2019).
- Pexas, G., Doherty, B. & Kyriazakis, I. The future of protein sources in livestock feeds, implications for sustainability and food safety. Front. Sustain. Food Syst. 7, 1188467 (2023).
- Alltech Global Feed Survey. The Global Feed Industry, Producing More Than 1 Billion Metric Tons. https://www.alltech.com/press-release/2018-alltech-global-feed-survey-estimates-world-feed-production-excess-1-billion (Accessed 23 September 2023) (2018).
- FAOSTAT. Food Security and Nutrition. https://www.fao.org/faostat/en/#data (Accessed 23 September 2023) (2022).
- FAO The state of the world’s biodiversity for food and agriculture. In FAO Commission on Genetic Resources for Food and Agriculture Assessments (eds Bélanger, J. & Pilling, D.) 572 (FAO, 2019).
- van Huis, A. et al. Edible Insects, Future Prospects for Food and Feed Security (No. 171) (Food and Agriculture Organization of the United Nations, 2013).
- Tang, C. et al. Edible insects as a food source, a review. Food Prod. Process. Nutr. 1, 1-13 (2019).
- Verner, D. et al. Mainstreaming Insect Farming, Insect and Hydroponic Farming in Africa, the New Circular Food Economy 1-240 (World Bank Group, 2021).
- Tanga, C. M. & Ekesi, S. Dietary and therapeutic benefits of edible insects: A global perspective. Annu. Rev. Entomol. 69, 303 (2023).
- Pereira, P. M. D. C. C. & Vicente, A. F. D. R. B. Meat nutritional composition and nutritive role in the human diet. Meat Sci. 93(3), 586-592 (2013).
- FAO. Protein Sources for the Animal Feed Industry. https://www.fao.org/3/y5019e/y5019e03.htm#bm03 (Accessed 21 September 2023) (2003).
- Nakagaki, B. J. & Defoliart, G. R. Comparison of diets for mass-rearing Acheta domesticus (Orthoptera: Gryllidae) as a novelty food, and comparison of food conversion efficiency with values reported for livestock. J. Econ. Entomol. 84, 891-896 (1991).
- van Huis, A. & Rumpold, B. Strategies to convince consumers to eat insects? A review. Food Qual. Prefer. 110, 104927 (2023).
- DeFoliart, G. R. Insects as food, why the Western attitude is important. Annu. Rev. Entomol. 44, 21-50 (1999).
- Yen, A. L. Insects as food and feed in the Asia Pacific region, current perspectives and future directions. J. Insects Food Feed 1, 33-55 (2015).
- Ocha, I. M., Ujah, M. O., Adeniyi, K. A., Ochuole, J. O. & Yahaya, A. W. The contribution of insects to sustainable food security, livelihoods and environment: A review. WATARI J. Multidiscip. Eng. Sci. Technol. 6, 100-113 (2022).
- Halloran, A., Roos, N., Eilenberg, J., Cerutti, A. & Bruun, S. Life cycle assessment of edible insects for food protein: A review. Agron. Sustain. Dev. 36, 1-13 (2016).
- Oonincx, D. G., van Broekhoven, S., van Huis, A. & van Loon, J. J. Correction, feed conversion, survival and development, and composition of four insect species on diets composed of food by-products. PLoS ONE 14, e0222043 (2019).
- Beesigamukama, D. et al. Low-cost technology for recycling agro-industrial waste into nutrient-rich organic fertilizer using black soldier fly. Waste Manag. 119, 183-194 (2021).
- World Bank Trends in Solid Waste Management. https://datatopics.worldbank.org/what-a-waste/trends_in_solid_waste_manag ement.html (Accessed 23 September 2023) (2023).
- Oonincx, D. G. et al. An exploration on greenhouse gas and ammonia production by insect species suitable for animal or human consumption. PLoS ONE 5, e14445 (2010).
- Rahman, S. Can the Caribbean Localize Its Food System? Exploring Strategies to Promote Circular Food Systems in the Caribbean Islands. Master’s thesis, University of Waterloo (2022).
- Smetana, S. Circularity and environmental impact of edible insects. J. Insects Food Feed. 9, 1111-1114 (2023).
- Kelemu, S. et al. African edible insects for food and feed, inventory, diversity, commonalities and contribution to food security. J. Insects Food Feed. 1, 103-119 (2015).
- Jongema, Y. List of Edible Insects of the World (Wageningen, 2017).
- van Huis, A. Edible insects: Challenges and prospects. Entomol. Res. 52, 161-177 (2022).
- Tao, J. & Li, Y. O. Edible insects as a means to address global malnutrition and food insecurity issues. Food Qual. Saf. 2, 17-26 (2018).
- van Huis, A. & Oonincx, D. G. The environmental sustainability of insects as food and feed: A review. Agron. Sustain. Dev. 37, 1-14 (2017).
- Morris, B. Insects and Human Life (Berg, 2004).
- Schabel, H. G. Forest Insects as Food: A Global Review. Forest Insects as Food, Humans Bite Back 37-64 (FAO, 2010).
- Niassy, S. et al. Safety, regulatory and environmental issues related to breeding and international trade of edible insects in Africa. Rev. Sci. Technol. 41, 117-131 (2022).
- Tanga, C. M. et al. Edible insect farming as an emerging and profitable enterprise in East Africa. Curr. Opin. Insect Sci. 48, 64-71 (2021).
- Cheung, T. L. & Moraes, M. S. Food innovation, edible insects for humans. Interações 17, 503-515 (2016).
- Mishyna, M., Chen, J. & Benjamin, O. Sensory attributes of edible insects and insect-based foods-Future outlooks for enhancing consumer appeal. Trends Food Sci. Technol. 95, 141-148 (2020).
- Goldstein, D. Edible Insect Market Growth (Insight Software Company, 2018).
- Bombe, K. Edible Insects Market Worth
Billion by 2030 (Meticulous Market Research, 2019). - Bernard, T. & Womeni, H. M. Entomophagy, insects as food. Insect Physiol. Ecol. 2017, 233-249 (2017).
- Latham, P. Edible Caterpillars and Their Food Plants in Bas-Congo (Mystole Publications, 2003).
- Meutchieye, F., Tsafo, K. E. C. & Niassy, S. Inventory of edible insects and their harvesting methods in the Cameroon centre region. J. Insects Food Feed 2, 145-152 (2016).
- Kim, S. K., Weaver, C. M. & Choi, M. K. Proximate composition and mineral content of five edible insects consumed in Korea. CYTA J. Food 15(1), 143-146 (2017).
- Bomolo, O. et al. Ecological diversity of edible insects and their potential contribution to household food security in Haut-Katanga Province, Democratic Republic of Congo. Afr. J. Ecol. 55, 640-653 (2017).
- Ngute, A. S. K. et al. Edible caterpillars in central Cameroon, host plants, value, harvesting, and availability. For. Trees Livelihoods 29(1), 16-33 (2020).
- Bomolo, O. et al. The value chain of the edible caterpillar Elaphrodes lactea Gaede (Lepidoptera: Notodontidae) in the Miombo forest of the Democratic Republic of the Congo. J. Ethnobiol. Ethnomed. 15, 39 (2019).
- Fombong, F. T. & Kinyuru, J. N. Termites as food in Africa. In Termites and Sustainable Management, Biology, Social Behaviour and Economic Importance Vol. 1 (eds Khan, M. A. & Ahmad, W.) 217-240 (Springer, 2018).
- Niassy, S. Eating Insects has Long Made Sense in Africa. The World Must Catch Up. https://theconversation.com/eating-insects-has-long-made-sense-in-africa-the-world-must-catch-up-70419 (Accessed 23 August 2023) (2017).
- Nsevolo, M. P., Kiatoko, N., Kambashi, M. B., Francis, F. & Megido, R. C. Reviewing entomophagy in the Democratic Republic of Congo: Species and host plant diversity, seasonality, patterns of consumption and challenges of the edible insect sector. J. Insects Food Feed 9, 225-244 (2023).
- Ishara, J. et al. Edible insect biodiversity and anthropo-entomophagy practices in Kalehe and Idjwi territories, DR Congo. J. Ethnobiol. Ethnomed. 19, 3 (2023).
- Jansson, A., Hunter, D. & Berggren, Å. Insects as food-An option for sustainable food production? SLU Future Food Rep. (2019).
- Egonyu, J. P. et al. Advances in insects for food and feed. Int. J. Trop. Insect Sci. 41, 1903-1911 (2021).
- Bairoch, P. & Goertz, G. Factors of urbanisation in the nineteenth century developed countries: A descriptive and econometric analysis. Urban Stud. 23, 285-305 (1986).
- Raheem, D. et al. Traditional consumption of and rearing edible insects in Africa, Asia and Europe. Crit. Rev. Food Sci. Nutr. 59(14), 2169-2188 (2019).
- Halloran, A. et al. Regulating edible insects: The challenge of addressing food security, nature conservation, and the erosion of traditional food culture. Food Secur. 7, 739-746 (2015).
- Papastavropoulou, K., Xiao, J. & Proestos, C. Edible insects, tendency or necessity (a review). eFood 4(1), e58 (2023).
- van Huis, A. Insects as food in sub-Saharan Africa. Int. J. Trop. Insect Sci. 23, 163-185 (2003).
- Ramos-Elorduy, J., Moreno, J. M. P. & Camacho, V. H. M. Edible aquatic Coleoptera of the world with an emphasis on Mexico. J. Ethnobiol. Ethnomed. 5, 1-13 (2009).
- Feng, Y., Zhao, M., Ding, W. F. & Chen, X. M. Overview of edible insect resources and common species utilisation in China. J. Insects Food Feed 6, 13-25 (2020).
- R Core Team. R: A Language and Environment for Statistical Computing. R Foundation for Statistical Computing (R Core Team, 2023).
مساهمات المؤلفين
تصور بواسطة E.R.O. و H.E.Z.T. و S.N.; المنهجية بواسطة E.R.O. و H.E.Z.T. و J.O. و S.M. و S.N.; التحليل الرسمي بواسطة E.R.O.; التصور بواسطة E.R.O. و E.K.; كتابة المسودة الأصلية بواسطة E.R.O. و S.N.; كتابة المراجعة والتحرير بواسطة H.E.Z.T. و A.A.Y. و H.M. و J.P.E. و S.F.M. و M.K. و S.V. و S.E. و S.N.
تمويل
يُعرب المؤلفون عن شكرهم للدعم المالي لهذا البحث من قبل المنظمات والوكالات التالية: وكالة التنمية الدولية الدنماركية (DANIDA)، وزارة الشؤون الخارجية الدنماركية، من خلال مشروع HEALTHYNSECT (تربية الحشرات من أجل الصحة وسبل العيش) (رقم المنحة: 19-08KU)؛ مؤسسة إنغفار كامبراد إلمتاريد أغونارييد (IKEA)؛ وكالة التعاون الدولي السويدية (Sida)؛ الوكالة السويسرية للتنمية والتعاون (SDC)؛ المركز الأسترالي للبحوث الزراعية الدولية (ACIAR)؛ الوكالة النرويجية للتعاون الإنمائي (Norad)؛ جمهورية إثيوبيا الفيدرالية الديمقراطية؛ وحكومة جمهورية كينيا. الآراء المعبر عنها هنا لا تعكس بالضرورة الرأي الرسمي للمانحين.
المصالح المتنافسة
يعلن المؤلفون عدم وجود مصالح متنافسة.
معلومات إضافية
معلومات إضافية النسخة الإلكترونية تحتوي على مواد إضافية متاحة علىhttps://doi.org/10.1038/s41598-024-55603-7.
يجب توجيه المراسلات والطلبات للحصول على المواد إلى S.N.
معلومات إعادة الطبع والتصاريح متاحة على www.nature.com/reprints.
ملاحظة الناشر: تظل Springer Nature محايدة فيما يتعلق بالمطالبات القضائية في الخرائط المنشورة والانتماءات المؤسسية.
معلومات إعادة الطبع والتصاريح متاحة على www.nature.com/reprints.
ملاحظة الناشر: تظل Springer Nature محايدة فيما يتعلق بالمطالبات القضائية في الخرائط المنشورة والانتماءات المؤسسية.
الوصول المفتوح: هذه المقالة مرخصة بموجب رخصة المشاع الإبداعي للاستخدام والتوزيع والتكيف وإعادة الإنتاج في أي وسيلة أو صيغة، طالما أنك تعطي الائتمان المناسب للمؤلفين الأصليين والمصدر، وتوفر رابطًا لرخصة المشاع الإبداعي، وتوضح ما إذا كانت هناك تغييرات قد تم إجراؤها. الصور أو المواد الأخرى من طرف ثالث في هذه المقالة مشمولة في رخصة المشاع الإبداعي للمقالة، ما لم يُذكر خلاف ذلك في سطر الائتمان للمادة. إذا لم تكن المادة مشمولة في رخصة المشاع الإبداعي للمقالة وكان استخدامك المقصود غير مسموح به بموجب اللوائح القانونية أو يتجاوز الاستخدام المسموح به، فسيتعين عليك الحصول على إذن مباشرة من صاحب حقوق الطبع والنشر. لعرض نسخة من هذه الرخصة، قم بزيارة http://creativecommons.org/licenses/by/4.0/.
© المؤلفون 2024
© المؤلفون 2024
المركز الدولي لفيزيولوجيا الحشرات وعلم البيئة (icipe)، صندوق بريد 30772-00100، نيروبي، كينيا. قسم علم الحيوان وعلم الحشرات، جامعة بريتوريا، صندوق خاص X20، هاتفيلد 0028، جنوب أفريقيا. كلية العلوم والتعليم، جامعة بوسيتما، تورورو، أوغندا. المجلس الفيتوساني الأفريقي للاتحاد الأفريقي (AU-IAPSC)، صندوق بريد 4170، ياوندي، الكاميرون. البريد الإلكتروني: NiassyS@africa-union.org
Journal: Scientific Reports, Volume: 14, Issue: 1
DOI: https://doi.org/10.1038/s41598-024-55603-7
PMID: https://pubmed.ncbi.nlm.nih.gov/38424443
Publication Date: 2024-02-29
DOI: https://doi.org/10.1038/s41598-024-55603-7
PMID: https://pubmed.ncbi.nlm.nih.gov/38424443
Publication Date: 2024-02-29
The global atlas of edible insects: analysis of diversity and commonality contributing to food systems and sustainability
The future of the food system on the planet is increasingly facing uncertainties that are attributable to population growth and a surge in demand for nutritious food. Traditional agricultural practices are poised to place strain on production, as well as natural resources and ecosystem services provided, particularly under a changing climate. Given their remarkable attributes, including a low environmental footprint, high food conversion ratio, rapid growth and nutritional values, edible insects can play a vital role in the global food system. Nonetheless, substantial knowledge gaps persist regarding their diversity, global distribution, and shared characteristics across regions, potentially impeding effective scaling and access to edible insects. Therefore, we compiled and analysed the fragmented database on edible insects and identified potential drivers that elucidate insect consumption, globally, focusing on promoting a sustainable food system. We collated data from various sources, including the literature for a list of edible insect species, the Global Biodiversity Information Facility and iNaturalist for the geographical presence of edible insects, the Copernicus Land Service library for Global Land Cover, and FAOSTAT for population, income, and nutritional security parameters. Subsequently, we performed a series of analytics at the country, regional and continental levels. Our study identifies 2205 insect species, consumed across 128 countries globally. Among continents, Asia has the highest number of edible insects ( 932 species), followed by North America (mainly Mexico) and Africa. The countries with the highest consumption of insects are Mexico ( 450 species), Thailand ( 272 species), India ( 262 species), DRC ( 255 species), China ( 235 species), Brazil ( 140 species), Japan ( 123 species), and Cameroon ( 100 species). Our study also revealed some common and specific practices related to edible insect access and utilisation among countries and regions. Although insect consumption is often rooted in cultural practices, it exhibits correlations with land cover, the geographical presence of potentially edible insects, the size of a country’s population, and income levels. The practice of eating insects is linked to the culture of people in Africa, Asia, and Latin America, while increased consciousness and the need for food sustainability are driving most of the European countries to evaluate eating insects. Therefore, edible insects are becoming an increasingly significant part of the future of planetary food systems. Therefore, more proactive efforts are required to promote them for their effective contribution to achieving sustainable food production.
Food security has emerged as a central global concern for human existence and continues raising questions about various dimensions of food systems, including economic, social, cultural, and political aspects
agricultural productivity. Further, global food system carbon emissions could preclude reaching climate change targets of restricting temperature increases to
Protein remains a critical driver of the planetary food systems
Africa and Asia face significant deficits in essential food intake, particularly protein
Edible insects have generated attention as a sustainable protein source, with crude protein content ranging from 40 to
Furthermore, insects can be reared or domesticated in numbers as, what is commonly called, “minilivestock”
Furthermore, some insects are best suited for a sustainable circular economy. For instance, the black soldier fly (BSF) Hermetia illucens L. (Diptera: Stratiomyidae) can convert waste into organic fertiliser that feeds back into agriculture, while their larvae serve as a protein source for animal feed
Over 1900 insect species are considered as forming part of the traditional diets of at least two billion people
One of the principal explanations for insect consumption is that insects represent half of all living organisms; they are found in various habitats, such as forests, agricultural fields, and even aquatic ecosystems, and most of them depend on plants to survive. They represented the cheapest and primary source of animal protein during the earliest stages of humankind before the invention of agriculture. We therefore hypothesised that there could be a strong linkage between land cover, plant diversity and climate, and the diversity of edible insects. Yet, this has not been demonstrated. However, most recently, some edible insect species were shown to be on the verge of extinction
All over the world, wild harvesting, rearing, processing, and selling of edible insects across genders holds bright prospects for the planetary food system
support industrial development
support industrial development
Despite the enormous benefits of edible insects, the stigma associated with them as “food for the poor” might result in outright rejection by some people. Without an in-depth understanding of edible insects in terms of their association with nutrition and health indices, gender-disaggregated income contribution, population growth and development, and Gross Domestic Product (GDP), the promotion of edible insects and their conservation will remain a formidable task. Insights into the global diversity and distribution of edible insects across countries and continents become pertinent in the advent of greater awareness and uptake for sustainable food systems. Providing validated information on the diversity and abundance of edible species at national, regional, and global levels might help to push these precious and sustainable natural food resources higher on political, investment and research agendas, worldwide.
This paper aims to analyse the global biodiversity of edible insects to guide policies on their conservation and domestication as sustainable food and feed sources. It describes factors influencing insect distribution, commonalities at regional and national levels, and the contribution of insects to the planetary food systems.
Results
Orders and families of edible insects in the world
Our comprehensive investigation identified 2205 insect species, from 25 distinct orders, that are confirmed as being edible (Fig. 1). These orders vary in their global dominance among the edible insect species. Coleoptera comprise the most prevalent order, constituting
The distribution of edible insect species, across orders and families, is presented in Fig. 2, revealing fascinating insights into the diversity of consumption. Within the orders Coleoptera, nine predominant families stand out, with over 10 species each: Scarabaeidae, Cerambycidae, Dytiscinae, Curculionidae, Passalidae, Lucanidae,
Figure 1. Global distribution of edible insect species by taxonomic order. Grey represents
Figure 2. The number of edible insect species represented by their family and order. Insect orders: Coleoptera (a), Hymenoptera (b), Orthoptera (c), Lepidoptera (d), Isoptera (e), Hemiptera (f), Odonata (g), Dictyoptera (h), Diptera (i), Araneae (j), Plecoptera (k), Ephemeroptera (l), Trichoptera (m). The orders with edible insects belonging to only one family and few species, such as Dermaptera (Forficulidae), Megaloptera (Corydalidae), Phasmida (Phasmatidae), and Psocoptera (Psocidae), are not included in the figure.
Buprestidae, Hydrophilidae, Tenebrionidae, Elateridae and Chrysomelidae (Fig. 2a). The order Heteroptera boasts the family Cicadidae, Pentatomidae, Coreidae, Belostomatidae, Tessaratomidae and Nepidae as being the most consumed (Fig. 2f). The order Hymenoptera features Apidae, Formicidae and Vespidae (Fig. 2b). Termitidae comprise one family with many species (over 66) in the order Isoptera (Fig. 2e). Lepidoptera encompass several well-consumed families, such as Saturniidae, Hepialidae, Sphingidae, Cossidae, and Noctuidae (Fig. 2d). Odonata present Libellulidae and Aeschnidae as notable families (Fig. 2g), while Orthoptera boasts Acrididae, Tettigoniidae, Gryllidae and Romaleidae (Fig. 2c). Several orders are represented by a family, including Dermaptera (Forficulidae, 1), Megaloptera (Corydalidae, 4), Phasmida (Phasmatidae, 4), and Psocoptera (Psocidae, 1 ), showcasing the diverse array of edible insects across various taxonomic groups.
Order and families of edible insects across continents
Asia has the largest number of edible insect species (932), followed by North America (including Mexico) (529), Africa (464), and South America (300). In contrast, Oceania has the least number of edible insects (107) (Fig. 3).
The diversity of edible insect species across the five continents exhibited variations by insect order, as well as the number of orders present in each continent, as depicted in Fig. 4. In Asia, the top five orders in terms of consumption were Coleoptera (354), Hemiptera (128), Orthoptera (121), Lepidoptera (108), and Hymenoptera (83). North America’s prominent orders included Coleoptera (181), Hymenoptera (105), Orthoptera (77), Hemiptera (68), and Lepidoptera (51). In Africa, Lepidoptera (137), Orthoptera (109), Coleoptera (101), Hemiptera (42), and Isoptera (30) were the most frequently consumed orders. South America featured Hymenoptera (139), Coleoptera (75), Orthoptera (23), Lepidoptera (17), and Isoptera (15) as its predominant orders. Consumption pattern in Oceania region was characterised by Coleoptera (29), Lepidoptera (28), Hemiptera (16), Hymenoptera (14), and Orthoptera (7). These findings underscore the regional variations in edible insect preferences and highlight the significance of insect orders in shaping dietary choices across continents.
Number of species of edible insects in each country across continents
The consumption of insects varies significantly by country, reflecting diverse dietary preferences (Fig. 5a-e). In Africa, insects are consumed in 48 countries (Fig. 5a). The Democratic Republic of Congo (DRC) has the highest insect diversity ( 255 species). Other countries with substantial insect consumption include Cameroon ( 100 species), Zambia ( 78 species), the Central African Republic ( 62 species), South Africa ( 56 species), and Zimbabwe ( 52 species). Countries such as Botswana, South Sudan, Uganda, Ghana, Senegal, Gabon, Mozambique, Burundi, Lesotho, Namibia, Angola, Niger, Kenya, Burkina Faso, Tanzania, Nigeria, Benin, Malawi, and Madagascar have between 10 and 50 edible insect species. Togo, Sudan. Sao Tomé, Equatorial Guinea, Sierra
Figure 3. The number of edible insect species consumed in North and South America, Africa, Asia, and Oceania. Provided in brackets are the proportion of edible insects.
Figure 4. The number of edible insects reported from each continent is represented by insect orders and the number of species. Europe has been excluded because insects are not traditionally part of people’s diets.
Figure 5. Diversity of insect species consumed in each country, grouped according to regions.
Leone, Morocco, Guinea, Egypt, Ivory Coast, Mali, Tunisia, Chad, Rwanda, Mauritius, Ethiopia, Algeria, Libya, Mauritania, Somalia, Liberia, and Eritrea consume fewer edible insects, ranging from 1 to 9 species.
In Asia, approximately 52 countries incorporate insects into their diets (Fig. 5b). Thailand, India, and China are the leaders in insect consumption, with 272,262 and 235 species, respectively. Japan also has a considerably diverse edible insect species (123), followed by Indonesia (88), Malaysia (65) and Laos (50). South Korea, Myanmar, the Philippines, and Vietnam consume many insects (
In South America, about 15 countries consume insects (Fig. 5c). Brazil leads in insect diversity, with 140 species, followed by Ecuador ( 93 species), Colombia ( 62 species) and Venezuela ( 49 species). Argentina consumes around 18 insect species, while fewer species are consumed in Peru, Guyana, Bolivia, Chile, Paraguay, Panama, Nicaragua, Suriname, Uruguay, and Guatemala.
Mexico has the highest number of edible insect species (450) in North America (Fig. 5d). In contrast, the United States of America (USA) and Canada consume six and four insect species, respectively, while Nicaragua and Panama each have two edible insect species. Only one edible insect species is consumed in Guatemala and the West Indies.
In the Oceania region, Australia leads in insect consumption, with 62 species, followed by Papua New Guinea ( 35 species) (Fig. 5e). Papua, New Caledonia, New Zealand, and the Solomon Islands have lower documented numbers of edible insect species, ranging from 1 to 7 species. These variations in edible insect consumption across continents and countries underscore the rich diversity of dietary practices and the importance of considering local preferences in insect-related policies and initiatives.
Numbers of edible insect species that are common and specific to countries and continents
The proportions of edible insect species shared among countries within each continent are illustrated in Fig. 6. Notably, many insect species are shared among countries in Asia, Africa, and South America, reflecting common dietary practices and regional preferences.
In Asia, countries such as Thailand, India and China have the highest number of edible insects, which they share with other countries. Some of the most widely shared insect species found in at least five Asian countries include Sitophilus oryzae L. (Coleoptera: Curculionidae), Schistocerca gregaria Forsskål (Orthoptera: Acrididae), Cybister spp. (Coleoptera: Dytiscidae), Hydrophilus hastatus L. (Coleoptera: Hydrophilidae), Rhynchophorus ferrugineus Olivier (Coleoptera: Curculionidae), Hydrophilus palpalis Brullé (Coleoptera: Hydrophilidae), Gryllotalpa africana Palisot de Beauvois (Orthoptera: Gryllotalpidae), Cybister tripunctatus Olivier (Coleoptera: Dytiscidae), Eretes sticticus L. (Coleoptera: Dytiscidae), Hydrophilus cavisternum Bedel (Coleoptera: Hydrophilidae), Lethocerus indicus Lepeletier & Serville (Heteroptera: Belostomatidae), Apis dorsata F. (Hymenoptera: Apidae), Apis mellifera L. (Hymenoptera: Apidae), Xylocopa sp. (Hymenoptera: Apidae), Bombyx mori L. (Lepidoptera: Bombycidae) and Tarbinskiellus portentosus L. (Orthoptera: Gryllidae).
In South America, Brazil has the highest number of edible insects and shares certain species with countries such as Ecuador, Argentina, Bolivia, Chile, Peru, Surinam, Uruguay, Guyana, and Colombia. Ecuador, the secondranking country, shares common species with Argentina, Bolivia, Chile, Paraguay, and Peru. Countries such as Guyana, Paraguay, Peru, Suriname, and Uruguay share many commonalities, while having specific edible insects unique to their regions. Some of the frequently shared insects in at least three countries in South America include Rhynchophorus palmarum L. (Coleoptera: Curculionidae), Atta cephalotes L. (Hymenoptera: Formicidae), Macrodontia cervicornis L. (Coleoptera: Cerambycidae), Umbonia spinosa F. (Homoptera: Cicadellidae), Trigona clavipes F. (Hymenoptera: Apidae), Cephalotrigona capitata Smith (Hymenoptera: Apidae), Tetragonisca angustula Latreille (Hymenoptera: Apidae), and Atta sexdens L. (Hymenoptera: Formicidae).
In Africa, the DRC, Cameroon, and Zambia emerged as being the primary leaders in edible insect consumption. The following insects are commonly shared in at least five African countries: Schistocerca gregaria Forsskål (Orthoptera: Acrididae), Acanthacris ruficornis F. (Orthoptera: Acrididae), Apis mellifera L. (Hymenoptera: Apidae), Macrotermes spp. (Isoptera: Termitidae), Cirina forda Westwood (Lepidoptera: Saturniidae), Brachytrupes membranaceus Drury (Orthoptera: Gryllidae), Bunaea alcinoë Stoll (Lepidoptera: Saturniidae), Eumeta cervine Druce (Lepidoptera: Psychidae), Nomadacris septemfasciata Audinet-Serville (Orthoptera: Acrididae), Rhynchophorus phoenicis F. (Coleoptera: Curculionidae), Carebara vidua Smith (Hymenoptera: Formicidae), Carebara lignata Westwood (Hymenoptera: Formicidae), Anaphe panda Boisduval (Lepidoptera: Notodontidae), Cirina butyrospermi Vuillet (Lepidoptera: Saturniidae), Dactyloceras lucina Drury (Lepidoptera: Brahmaeidae.), Imbrasia ertli Rebel (Lepidoptera: Saturniidae), Platysphinx stigmatica Mabille (Lepidoptera: Sphingidae), Zonocerus variegatus L. (Orthoptera: Pyrgomorphidae), Clania moddermanni Heylaerts (Lepidoptera: Psychidae), Imbrasia epimethea Drury (Lepidoptera: Saturniidae), Urota sinope
Figure 6. Web of transnational edible insects that are conserved and shared among countries in a continent. The thickness of a line equals the number of common insects consumed within or between countries.
Westwood (Lepidoptera: Saturniidae), Phymateus viridipes brunneri Bolivar (Orthoptera: Pyrgomorphidae), Ruspolia differens Serville (Orthoptera: Tettigoniidae), Macrotermes (Bellicositermes) spp. (Blattodea: Termitidae), Epanaphe carteri Walsingham (Lepidoptera: Notodontidae), Imbrasia belina Westwood (Lepidoptera: Saturniidae), Striphnopteryx edulis Boisduval (Lepidoptera: Eupterotidae), Locusta migratoria migratorioides Fairmaire & Reiche (Orthoptera: Acrididae), Locustana pardalina Walker (Orthoptera: Acrididae), Oryctes boas Oryctes boas Fabricius (Coleoptera: Scarabaeidae), Hypotrigona gribodoi Magretti (Hymenoptera: Apidae), Meliponula bocandei Spinola (Hymenoptera: Apidae), Bunaea caffraria Hübner (Lepidoptera: Saturniidae), Gynanisa maja Klug (Lepidoptera: Saturniidae), Heniocha dyops Maassen (Lepidoptera: Saturniidae), Heniocha marnois Rogenhofer (Lepidoptera: Saturniidae), Lophostethus demolinii Angas (Lepidoptera: Sphingidae), Acanthacris ruficornis citrina Serville (Orthoptera: Acrididae), Anacridium burri Dirsh (Orthoptera: Acrididae), and Goliathus spp. (Coleoptera: Scarabaeidae). Generally, many edible insects found in the DRC are common in Central, Southern, Eastern and West African countries. Cameroon and Zambia share edible insects with Central African countries and neighbouring nations. Additionally, South Africa exhibits several commonalities with countries in the southern African region such as Zimbabwe and Malawi.
In North America and Oceania, relatively few edible insect species are shared among countries. In the Oceania region, commonly shared species between at least two countries are Mallodon costatus Montrouzier (Coleoptera: Cerambycidae), Rhynchophorus bilineatus Montrouzier (Coleoptera: Curculionidae), Oecophylla smaragdina F. (Hymenoptera: Formicidae), and Teleogryllus commodus Walker (Orthoptera: Gryllidae). For a comprehensive list of commonly shared edible insects among countries and continents, please refer to Supplementary Table 1.
Worldwide distribution of edible insects: presence does not mean consumption
The global distribution of potentially edible insect species is illustrated in Fig. 7, showing their presence in various regions, worldwide. However, it is essential to note that the mere presence of these species does not necessarily equate to their consumption, as depicted in Fig. 8. While potentially edible insect species are found in nearly every corner of the globe, the numbers of insect species that have been confirmed as being edible are relatively limited.
The highest concentration of potentially edible insect species is primarily observed in tropical regions, with Mexico leading in number, followed by China, the DRC, India, Thailand, and Brazil. Remarkably, even those countries without a cultural tradition of insect consumption host at least one to ten potentially edible insect species. In terms of ecological distribution, areas characterised by shrubs, herbaceous vegetation and mixed closed forests tend to host the most abundant and diverse assortment of edible insects, as indicated in Fig. 8. This insight highlights the significance of considering the ecological context when evaluating the potential for edible insect utilisation in various regions worldwide.
Figure 7. Global distribution of ‘confirmed’ edible insect species. Confirmed edible insect species imply species that have been reported in the literature. The figure was generated using QGIS geographic information system software version 3.34.3 (http://qgis.osgeo.org/).
Figure 8. Global distribution of potentially edible insect species across different land cover classifications. Potentially edible insect species imply both confirmed and unconfirmed edible insects. The figure was generated using QGIS geographic information system software version 3.34 .3 (http://qgis.osgeo.org/).
Proportion of consumed insect species per country
Figure 9 represents the diversity and proportion of “confirmed” (reported in the literature) and “unconfirmed (no literature reports) edible insects in countries where at least ten (10) species are reported. Countries with the highest proportion of consumed insect species (
Determinants of insect consumption
In order to determine the relationships between the diversity and the use and consumption of edible insects, globally, the following variables were assessed.
a. Number of potentially edible insects-The abundance of confirmed edible insect species had a positive and significant correlation with the number of potentially edible insect species present in a country (
b. The number of edible insects directly correlates with countries’ population sizes (
c. Prevalence of severe food insecurity-there was no significant correlation between the abundance of confirmed edible insect species and food insecurity/security parameters, such as the prevalence of moderate to severe food insecurity (
d. Prevalence of undernourishment-The prevalence of undernourishment correlated positively with edible insect presence, but was not significant (
Figure 9. Number (diversity) of potentially edible insect species consumed elsewhere (orange) and confirmed (blue) edible insect species in each country. Only countries with more than 10 potentially edible insect species are represented here. For the values provided above, the bars represent the percentages (%) of edible insect species, based on published reports.
e. Percentage of children under five years affected by wasting-Child wasting, which refers to a thin body suffered as a result of recent rapid weight loss or failure to gain weight, did not correlate with the number of edible insects consumed (
f. Number of edible insects and children under five years overweight-There was a positive significant correlation between the abundance of confirmed edible insect species and children under 5 years who are overweight (
g. Dietary supply adequacy-Regarding dietary supply adequacy, which is a measure of food security that considers the average supply of calories for food consumption, the number of edible insect species had a negative but insignificant correlation with the average dietary energy supply adequacy (
h. GDP per capita-The number of edible insect species had a negative but insignificant correlation with GDP per capita (
The multivariate regression indicated that number of confirmed, and GDP per capita were the only variables that significantly predicted practice of insect consumption (Table 1).
Discussion
Despite constituting a small fraction of the class, edible insects are a key component of the global food system and could significantly address nutritional insecurities. Our extensive inventory reveals the consumption of over 2205 species from 24 distinct orders of insect and one order of arachnids, across 128 countries, surpassing earlier records of 1900 species in 113 countries
Figure 10. The relationships between the diversity of confirmed edible insects with the diversity of all potential edible insects (a), population size (b), food insecurity/security status (c-g), dietary energy supply (h) and GDP per capita (i).
| Variable | Estimated coefficient (
|
Standard error (
|
t-value | p-value |
| Intercept | -2.0807 | 16.1721 | -0.129 | 0.898 |
| Number of potentially edible insect species | 0.9270 | 0.0104 | 89.38 | <0.001 |
| Total population | 0.0200 | 0.0282 | 0.709 | 0.484 |
| GDP per capita | -0.0003 | 0.0001 | -2.389 | 0.023 |
| Children under 5 years overweight (%) | -4.0013 | 4.3097 | -0.928 | 0.360 |
| Children under 5 years affected by wasting (%) | -0.0064 | 0.3502 | -0.018 | 0.986 |
| Prevalence moderate or severe food insecurity (%) | -0.0911 | 0.1090 | -0.836 | 0.410 |
| Prevalence severe food insecurity (%) | 0.1153 | 0.1532 | 0.753 | 0.457 |
| Prevalence undernourishment (%) | -0.1105 | 0.1972 | -0.560 | 0.579 |
| Average dietary energy supply (g/capita/day) | 0.0150 | 0.1216 | 0.123 | 0.903 |
| Adjusted
|
Table 1. Regression coefficients for predicting insect consumption practices (number of confirmed edible insects).
as the key edible insect group. Coleoptera’s prominence could also be attributed to its status as being the most prominent order among insects, known for its crude protein content
We found that the orders with the least-consumed numbers of insect species were Hemiptera, Isoptera, Odonata, Diptera, Dictyoptera, Ephemeroptera, Plecoptera, Trichoptera, Phasmida, Megaloptera, Dermaptera and Psocoptera. The lowest numbers of edible insect species under these orders have been previously reported
Our results show that edible insects are widely distributed and found in almost all climatic conditions, while vegetation supports the existence of edible insect species in most parts of the world. According to van Huis
In many parts of the world, eating insects is a cultural heritage that has been transmitted from generation to generation, from before the advent of modern civilisation. Many tropical and sub-tropic communities have long traditions of entomophagy
Our findings show that insects are consumed in nearly all African countries. Among the regions, we found the highest diversity of consumed insects in the Central African region (the DRC, Cameroon, and the Central African Republic), followed by Southern Africa (Zambia, South Africa, Zimbabwe, and Botswana). This corroborates the finding of Kelemu et al.
et al.
et al.
In Asia, we found that the most considerable diversities of insects (more than 50 species) are consumed in Thailand, India, and China, followed by Japan, Indonesia, Malaysia, and Laos. The top five countries with the highest diversities of edible insect species in South America were Brazil, Ecuador, Colombia, Venezuela, and Argentina. In the Oceania region, the highest diversity of edible insects was observed in Australia and Papua New Guinea. In North America, Mexico is the most prominent for insect consumption (over 450 species), while the USA, Canada, Nicaragua, Panama, Guatemala, and West Indies have only between 1 and 6 edible insect species. According to Van Huis et al.
Generally, the majority of insect species are consumed in the African tropics, the American tropics (comprising only Mexico in North America, Central America, the Caribbean islands and the top half of South America, including Colombia, Ecuador, Peru, Bolivia, Colombia, Venezuela, Guyana and Suriname, and the northern portions of Chile, Argentina, Paraguay and Brazil) and the Asian tropics (Bangladesh, Cambodia, India, Indonesia, Malaysia, the Philippines, Sri Lanka, Thailand and Vietnam). We also observed some countries with many edible insect species in subtropical Asia (China), subtropical African countries (South Africa and Namibia), and subtropical Oceania countries. We found these areas to be characterised by a heavy presence of shrubs, herbaceous vegetation, and mixed closed forests, which can harbour diverse edible insect species.
Despite their presence in almost all countries, we observed that the numbers of insect species confirmed to be edible were comparatively low, with some countries having no record of insect consumption. For instance, 21 potential edible insect species are found in Türkiye, with only six species being reported as being edible. In Italy and Germany, about 16 and 15 potentially edible species are present, respectively, with none being reported as edible.
Our results showed overlaps in the species of edible insects between/among countries, especially in Asia, Africa, and South America. The top 11 insects with global overlaps include Schistocerca gregaria Forskål (Orthoptera: Acrididae), Gryllus bimaculatus De Geer (Orthoptera: Gryllidae), Macrodontia cervicornis L. (Coleoptera: Cerambycidae), Stenodontes damicornis L. (Coleoptera: Cerambycidae), Cybister spp. (Coleoptera: Dytiscidae), Oryctes rhinoceros L. (Coleoptera: Scarabaeidae), Rhynchophorus ferrugineus Oliv. (Coleoptera: Curculionidae), Rhynchophorus palmarum L. (Coleoptera: Curculionidae), Nezara viridula L. (Hemiptera: Pentatomidae), Macrotermes (Bellicositermes) sp. (Isoptera: Termitidae), Nomadacris septemfasciata Serville (Orthoptera: Acrididae), and Gryllotalpa africana F. (Orthoptera: Gryllotalpidae). These findings highlight the global and regional overlaps and variations in edible insect consumption and the importance of considering these shared species in discussions surrounding dietary diversity and cultural practices. Overlaps among countries and continents of edible insect species can be attributed to potential similarities in history, ethnic communities, land cover properties, and climatic conditions that favour the existence of certain species of edible insects. Niassy
Edible insects can be a key entry topic and major resource for addressing food and nutrition security. For instance, countries with acute food insecurities, such as South Sudan, the Central African Republic and Malawi, rely largely on seasonal harvesting of edible insects. This could be linked to the political crises and prolonged dry spells in those countries. However, insect consumption was not found to be related to undernourishment, confirming the cultural and religious dimensions. Madagascar, the Central African Republic, Somalia, and Lesotho are some of the countries identified with the highest prevalence of undernourishment but consumed fewer than 100 edible insect species. At the same time, the DRC and India have a relatively high prevalence of undernourishment, but with more than 100 edible insect species. Child wasting was not significantly correlated with insect consumption, whereas child overweight was positively correlated. Countries with higher childwasting rates consume fewer than 50 insect species, compared with countries with lower child-wasting rates that consume more than 50 insects. In countries such as India and Thailand, child wasting is high, yet over 200 edible species are consumed, whereas Mexico has low child wasting, but with more than 400 insect species being eaten. Child wasting is also high in Mauritania, Ghana, Niger, Mali, Burkina Faso, Djibouti, Guinea, and Sudan, but fewer than 50 insect species are consumed.
On the other hand, we found a positive significant correlation between overweight children and insect consumption. China, India, and Indonesia are some countries with relatively high percentages of acute children overweight and consuming more than 200 insect species. Whereas countries with low percentage of acute children overweight (e.g., DRC, Thailand, Mexico, Japan, Ghana) consumed relatively high number of insects. However, this analysis was based on national average data from FAOSTAT. Further analysis based on child overweight information on specific state or region of the country, may provide a clearer picture.
A negative correlation between insect consumption and GDP per capita generally shows that low-income countries have largely embraced the culture of “entomophagy”; however, except for some of the countries, such as China, India, and Indonesia.
Countries with a higher average dietary energy supply adequacy, e.g., Türkiye, Israel, Tunisia, and Lebanon, consume few edible insect species. Countries with the most edible insect species have relatively good dietary energy supply adequacy, e.g., Mexico, Thailand, India, the DRC, and China. This finding is debatable and demonstrates the point that the eating of insects is unrelated to archaism and lack of civilisation. Economically advanced countries could still practise cultural heritage, such as insect consumption, while developing modern technologies for edible insect mass rearing and advanced processing. Countries with the highest revenues per capita, e.g., Bolivia, the United Arab Emirates, Macao SAR, Mauritius, and Korea, consume fewer insects, whereas countries with the lowest revenues consume more insects. The lack of consumption could be attributable to low diversity and the absence of insect-eating habits or culture. However, countries such as Japan and Australia, with a relatively high GDP per capita, consume many edible insects. Edible insects are viewed as providing a new source of protein, not necessarily for energy. However, in countries where people are suffering from underproduction of calorie-rich foods (e.g., staples and edible insects), the livelihood opportunities could be balanced with agricultural productivity. Our study shows that insects are a valuable food source for both lowincome and high-income countries, across the globe. Given favourable climate conditions and vegetation, edible insects could be traded from low-income to non-consuming countries in an improved and sustainable food system and economic value chain.
Conclusion
Edible insects have been part of the traditional diet of many people in the tropics and subtropics. We found that over 2205 insect species are consumed in 128 countries, and the orders with the most-reported edible species are Coleoptera, Hymenoptera, Lepidoptera and Orthoptera. We report that over 932, 529, 464, 300 and 107 edible insect species are found in Asia, North America, Africa, South America, and Oceania, respectively. The countries with at least 100 reported edible insect species are Mexico (450), Thailand (272), India (262), the DRC (255), China (235), Brazil (140), Japan (123), and Cameroon (100). Most edible insects have regional overlaps, while some have continental overlaps, which can be associated with climatic conditions, especially along the tropics and subtropics, land cover properties, and the histories of entomophagy among ethnic groups. Despite the presence of edible insects in some Western countries, insect consumption remains comparatively low. Edible insects have many benefits related to food and nutrition needs, livelihoods, economic development, social integration, and the environment, contributing significantly to achieving nearly all United Nations Sustainable Development Goals.
Despite our attempt to document edible insects of the world, the striking question is as to whether the current scientifically available data accurately represents all species of edible insects eaten, worldwide. Albeit with caveats, we speculate that many or some other edible insects are being eaten, but which have not been recorded in the literature. Therefore, this paper provides insights into estimates of the diversity of edible insects, their distribution, and commonalities across countries, continents, and the globe. Whereas this study sheds some light on some of the potential drivers for the occurrence, overlaps, and edibility status of different insects, there is also a need to document proportion of country’s population that is “entomophagous” and promote culture of eating insects.
Methodology
Data sources
We drew upon various published sources to construct a comprehensive inventory of global edible insects. These sources collectively provided a rich overview of the global edible insect diversity. Our data collation process began with an extensive review of the literature. We consulted a variety of studies and publications that have catalogued edible insects, worldwide. Notable sources included Jongema
Data compilation and verification
The resulting datasets, encompassing information on potentially edible insect species, along with details of the countries where they are found, were meticulously organised and recorded in a structured format through using the Microsoft Excel application. Any duplicate entries were identified and eliminated throughout this process to ensure data accuracy and consistency. We undertook a rigorous verification process to determine the presence of the listed insect species in various countries and territories. This verification involved systematic searches of
reputable data repositories, such as the Global Biodiversity Information Facility (GBIF) and iNaturalist. These platforms are recognised for their extensive and reliable collections of biodiversity data.
reputable data repositories, such as the Global Biodiversity Information Facility (GBIF) and iNaturalist. These platforms are recognised for their extensive and reliable collections of biodiversity data.
Data synthesis, analysis, and visualisation
The compiled datasets, now enriched with verified presence information, were processed, and synthesised into informative formats, including graphs and tables. This step aimed to make the data more accessible for applying analytics. In this context, multiple tools and applications were used. Geographic information system QGIS 3.34.3 software (http://qgis.osgeo.org/) was used to combine the distribution data of potential edible insect species with the global land cover dataset, and carry out the clustered analysis, linking the presence of edible insects with specific land cover types and environmental conditions. Prior to this analysis, we conducted a categorisation, considering certain species as being potentially edible. These insects lack documented consumption records in a particular country or territory but have been reported as edible in other countries. This distinction is important as it highlights the potential for expanding insect-based diets to regions where these species are not traditionally consumed. Through this analysis, we generated maps, which help to visualise the geographical distribution of edible insects, allowing us to identify regions where they are commonly consumed and those where they are potentially viable as future food sources.
We employed a generic approach to assess the prevalence of edible insects in different regions to help us to understand the extent to which edible insects were commonly consumed. We calculated the percentage of edible insects as the proportion of confirmed edible insect species, over the total number of potentially edible insects recorded in each country (or territory).
Pearson’s correlation coefficient was used to estimate the strength and direction of relationships between variables. Further, a multivariate regression analysis was performed, using the numbers of reported edible insects as the predictors, with population size, food insecurity parameters and GDP constituted the dependent variable. Correlation and multivariate regression analysis was performed by using R Software
To visualise the transnational commonalities and specificities of insect species within continents, we employed the data visualisation tool RawGraphs (https://app.rawgraphs.io/). Sankey diagrams generated through this platform clearly represented how certain insect species are distributed across continents, offering insights into both shared and unique edible insect species within these regions. To render the relationships between these variables more accessible, we used bubble plots. These graphical representations were generated through using Displayr (https://westeurope.displayr.com), an online data visualisation tool. Bubble plots effectively display multivariate data using bubbles of varying sizes and colours to represent different variables, making it easier to identify patterns, trends, and correlations.
Data availability
The datasets that support the findings of this study are available on request to the corresponding author.
Received: 20 January 2024; Accepted: 26 February 2024
Published online: 29 February 2024
Received: 20 January 2024; Accepted: 26 February 2024
Published online: 29 February 2024
References
- Leach, M. et al. Food politics and development. World Dev. 134, 105024 (2020).
- United Nations. The World Population Prospects, The 2017 Revision (2017).
- WHO. Workshop on Regulatory and Food Safety Aspects of Alternative Proteins for Conventional Animal Products (World Health Organization, 2021).
- Clark, M. A. et al. Global food system emissions could preclude achieving the 1.5 and
climate change targets. Science 370, 705-708 (2020). - Madzorera, I. et al. Food systems as drivers of optimal nutrition and health, complexities and opportunities for research and implementation. Curr. Dev. Nutr. 5, 062 (2021).
- Henchion, M., Hayes, M., Mullen, A. M., Fenelon, M. & Tiwari, B. Future protein supply and demand, strategies and factors influencing a sustainable equilibrium. Foods 6, 53 (2017).
- Ritchie, H. & Poser, M. Meat and Dairy Production. https://ourworldindata.org/meat-production (Accessed 23 September 2023) (2019).
- Pexas, G., Doherty, B. & Kyriazakis, I. The future of protein sources in livestock feeds, implications for sustainability and food safety. Front. Sustain. Food Syst. 7, 1188467 (2023).
- Alltech Global Feed Survey. The Global Feed Industry, Producing More Than 1 Billion Metric Tons. https://www.alltech.com/press-release/2018-alltech-global-feed-survey-estimates-world-feed-production-excess-1-billion (Accessed 23 September 2023) (2018).
- FAOSTAT. Food Security and Nutrition. https://www.fao.org/faostat/en/#data (Accessed 23 September 2023) (2022).
- FAO The state of the world’s biodiversity for food and agriculture. In FAO Commission on Genetic Resources for Food and Agriculture Assessments (eds Bélanger, J. & Pilling, D.) 572 (FAO, 2019).
- van Huis, A. et al. Edible Insects, Future Prospects for Food and Feed Security (No. 171) (Food and Agriculture Organization of the United Nations, 2013).
- Tang, C. et al. Edible insects as a food source, a review. Food Prod. Process. Nutr. 1, 1-13 (2019).
- Verner, D. et al. Mainstreaming Insect Farming, Insect and Hydroponic Farming in Africa, the New Circular Food Economy 1-240 (World Bank Group, 2021).
- Tanga, C. M. & Ekesi, S. Dietary and therapeutic benefits of edible insects: A global perspective. Annu. Rev. Entomol. 69, 303 (2023).
- Pereira, P. M. D. C. C. & Vicente, A. F. D. R. B. Meat nutritional composition and nutritive role in the human diet. Meat Sci. 93(3), 586-592 (2013).
- FAO. Protein Sources for the Animal Feed Industry. https://www.fao.org/3/y5019e/y5019e03.htm#bm03 (Accessed 21 September 2023) (2003).
- Nakagaki, B. J. & Defoliart, G. R. Comparison of diets for mass-rearing Acheta domesticus (Orthoptera: Gryllidae) as a novelty food, and comparison of food conversion efficiency with values reported for livestock. J. Econ. Entomol. 84, 891-896 (1991).
- van Huis, A. & Rumpold, B. Strategies to convince consumers to eat insects? A review. Food Qual. Prefer. 110, 104927 (2023).
- DeFoliart, G. R. Insects as food, why the Western attitude is important. Annu. Rev. Entomol. 44, 21-50 (1999).
- Yen, A. L. Insects as food and feed in the Asia Pacific region, current perspectives and future directions. J. Insects Food Feed 1, 33-55 (2015).
- Ocha, I. M., Ujah, M. O., Adeniyi, K. A., Ochuole, J. O. & Yahaya, A. W. The contribution of insects to sustainable food security, livelihoods and environment: A review. WATARI J. Multidiscip. Eng. Sci. Technol. 6, 100-113 (2022).
- Halloran, A., Roos, N., Eilenberg, J., Cerutti, A. & Bruun, S. Life cycle assessment of edible insects for food protein: A review. Agron. Sustain. Dev. 36, 1-13 (2016).
- Oonincx, D. G., van Broekhoven, S., van Huis, A. & van Loon, J. J. Correction, feed conversion, survival and development, and composition of four insect species on diets composed of food by-products. PLoS ONE 14, e0222043 (2019).
- Beesigamukama, D. et al. Low-cost technology for recycling agro-industrial waste into nutrient-rich organic fertilizer using black soldier fly. Waste Manag. 119, 183-194 (2021).
- World Bank Trends in Solid Waste Management. https://datatopics.worldbank.org/what-a-waste/trends_in_solid_waste_manag ement.html (Accessed 23 September 2023) (2023).
- Oonincx, D. G. et al. An exploration on greenhouse gas and ammonia production by insect species suitable for animal or human consumption. PLoS ONE 5, e14445 (2010).
- Rahman, S. Can the Caribbean Localize Its Food System? Exploring Strategies to Promote Circular Food Systems in the Caribbean Islands. Master’s thesis, University of Waterloo (2022).
- Smetana, S. Circularity and environmental impact of edible insects. J. Insects Food Feed. 9, 1111-1114 (2023).
- Kelemu, S. et al. African edible insects for food and feed, inventory, diversity, commonalities and contribution to food security. J. Insects Food Feed. 1, 103-119 (2015).
- Jongema, Y. List of Edible Insects of the World (Wageningen, 2017).
- van Huis, A. Edible insects: Challenges and prospects. Entomol. Res. 52, 161-177 (2022).
- Tao, J. & Li, Y. O. Edible insects as a means to address global malnutrition and food insecurity issues. Food Qual. Saf. 2, 17-26 (2018).
- van Huis, A. & Oonincx, D. G. The environmental sustainability of insects as food and feed: A review. Agron. Sustain. Dev. 37, 1-14 (2017).
- Morris, B. Insects and Human Life (Berg, 2004).
- Schabel, H. G. Forest Insects as Food: A Global Review. Forest Insects as Food, Humans Bite Back 37-64 (FAO, 2010).
- Niassy, S. et al. Safety, regulatory and environmental issues related to breeding and international trade of edible insects in Africa. Rev. Sci. Technol. 41, 117-131 (2022).
- Tanga, C. M. et al. Edible insect farming as an emerging and profitable enterprise in East Africa. Curr. Opin. Insect Sci. 48, 64-71 (2021).
- Cheung, T. L. & Moraes, M. S. Food innovation, edible insects for humans. Interações 17, 503-515 (2016).
- Mishyna, M., Chen, J. & Benjamin, O. Sensory attributes of edible insects and insect-based foods-Future outlooks for enhancing consumer appeal. Trends Food Sci. Technol. 95, 141-148 (2020).
- Goldstein, D. Edible Insect Market Growth (Insight Software Company, 2018).
- Bombe, K. Edible Insects Market Worth
Billion by 2030 (Meticulous Market Research, 2019). - Bernard, T. & Womeni, H. M. Entomophagy, insects as food. Insect Physiol. Ecol. 2017, 233-249 (2017).
- Latham, P. Edible Caterpillars and Their Food Plants in Bas-Congo (Mystole Publications, 2003).
- Meutchieye, F., Tsafo, K. E. C. & Niassy, S. Inventory of edible insects and their harvesting methods in the Cameroon centre region. J. Insects Food Feed 2, 145-152 (2016).
- Kim, S. K., Weaver, C. M. & Choi, M. K. Proximate composition and mineral content of five edible insects consumed in Korea. CYTA J. Food 15(1), 143-146 (2017).
- Bomolo, O. et al. Ecological diversity of edible insects and their potential contribution to household food security in Haut-Katanga Province, Democratic Republic of Congo. Afr. J. Ecol. 55, 640-653 (2017).
- Ngute, A. S. K. et al. Edible caterpillars in central Cameroon, host plants, value, harvesting, and availability. For. Trees Livelihoods 29(1), 16-33 (2020).
- Bomolo, O. et al. The value chain of the edible caterpillar Elaphrodes lactea Gaede (Lepidoptera: Notodontidae) in the Miombo forest of the Democratic Republic of the Congo. J. Ethnobiol. Ethnomed. 15, 39 (2019).
- Fombong, F. T. & Kinyuru, J. N. Termites as food in Africa. In Termites and Sustainable Management, Biology, Social Behaviour and Economic Importance Vol. 1 (eds Khan, M. A. & Ahmad, W.) 217-240 (Springer, 2018).
- Niassy, S. Eating Insects has Long Made Sense in Africa. The World Must Catch Up. https://theconversation.com/eating-insects-has-long-made-sense-in-africa-the-world-must-catch-up-70419 (Accessed 23 August 2023) (2017).
- Nsevolo, M. P., Kiatoko, N., Kambashi, M. B., Francis, F. & Megido, R. C. Reviewing entomophagy in the Democratic Republic of Congo: Species and host plant diversity, seasonality, patterns of consumption and challenges of the edible insect sector. J. Insects Food Feed 9, 225-244 (2023).
- Ishara, J. et al. Edible insect biodiversity and anthropo-entomophagy practices in Kalehe and Idjwi territories, DR Congo. J. Ethnobiol. Ethnomed. 19, 3 (2023).
- Jansson, A., Hunter, D. & Berggren, Å. Insects as food-An option for sustainable food production? SLU Future Food Rep. (2019).
- Egonyu, J. P. et al. Advances in insects for food and feed. Int. J. Trop. Insect Sci. 41, 1903-1911 (2021).
- Bairoch, P. & Goertz, G. Factors of urbanisation in the nineteenth century developed countries: A descriptive and econometric analysis. Urban Stud. 23, 285-305 (1986).
- Raheem, D. et al. Traditional consumption of and rearing edible insects in Africa, Asia and Europe. Crit. Rev. Food Sci. Nutr. 59(14), 2169-2188 (2019).
- Halloran, A. et al. Regulating edible insects: The challenge of addressing food security, nature conservation, and the erosion of traditional food culture. Food Secur. 7, 739-746 (2015).
- Papastavropoulou, K., Xiao, J. & Proestos, C. Edible insects, tendency or necessity (a review). eFood 4(1), e58 (2023).
- van Huis, A. Insects as food in sub-Saharan Africa. Int. J. Trop. Insect Sci. 23, 163-185 (2003).
- Ramos-Elorduy, J., Moreno, J. M. P. & Camacho, V. H. M. Edible aquatic Coleoptera of the world with an emphasis on Mexico. J. Ethnobiol. Ethnomed. 5, 1-13 (2009).
- Feng, Y., Zhao, M., Ding, W. F. & Chen, X. M. Overview of edible insect resources and common species utilisation in China. J. Insects Food Feed 6, 13-25 (2020).
- R Core Team. R: A Language and Environment for Statistical Computing. R Foundation for Statistical Computing (R Core Team, 2023).
Author contributions
Conceptualisation by E.R.O., H.E.Z.T. and S.N.; Methodology by E.R.O., H.E.Z.T. and J.O., S.M. and S.N.; Formal analysis by E.R.O.; Visualisation by E.R.O. and E.K.; Writing-original draft by E.R.O. and S.N.; Writing-review & editing by H.E.Z.T., A.A.Y., H.M., J.P.E., S.F.M., M.K., S.V., S.E. and S.N.
Funding
The authors gratefully acknowledge the financial support for this research by the following organizations and agencies: Danish International Development Agency (DANIDA), Ministry of Foreign Affairs of Denmark, through the HEALTHYNSECT (Insect Farming for Health and Livelihoods) project (Grant Number: 19-08KU); The Ingvar Kamprad Elmtaryd Agunnaryd (IKEA) foundation; the Swedish International Development Cooperation Agency (Sida); the Swiss Agency for Development and Cooperation (SDC); the Australian Centre for International Agricultural Research (ACIAR); the Norwegian Agency for Development Cooperation (Norad); the Federal Democratic Republic of Ethiopia; and the Government of the Republic of Kenya. The views expressed herein do not necessarily reflect the official opinion of the donors.
Competing interests
The authors declare no competing interests.
Additional information
Supplementary Information The online version contains supplementary material available at https://doi.org/ 10.1038/s41598-024-55603-7.
Correspondence and requests for materials should be addressed to S.N.
Reprints and permissions information is available at www.nature.com/reprints.
Publisher’s note Springer Nature remains neutral with regard to jurisdictional claims in published maps and institutional affiliations.
Reprints and permissions information is available at www.nature.com/reprints.
Publisher’s note Springer Nature remains neutral with regard to jurisdictional claims in published maps and institutional affiliations.
Open Access This article is licensed under a Creative Commons Attribution 4.0 International License, which permits use, sharing, adaptation, distribution and reproduction in any medium or format, as long as you give appropriate credit to the original author(s) and the source, provide a link to the Creative Commons licence, and indicate if changes were made. The images or other third party material in this article are included in the article’s Creative Commons licence, unless indicated otherwise in a credit line to the material. If material is not included in the article’s Creative Commons licence and your intended use is not permitted by statutory regulation or exceeds the permitted use, you will need to obtain permission directly from the copyright holder. To view a copy of this licence, visit http://creativecommons.org/licenses/by/4.0/.
© The Author(s) 2024
© The Author(s) 2024
International Centre of Insect Physiology and Ecology (icipe), P.O. Box 30772-00100, Nairobi, Kenya. Department of Zoology and Entomology, University of Pretoria, Private Bag X20, Hatfield 0028, South Africa. Faculty of Science and Education, Busitema University, Tororo, Uganda. Inter-African Phytosanitary Council of African Union (AU-IAPSC), P.O Box 4170, Yaoundé, Cameroon. email: NiassyS@africa-union.org