أقطاب الكاثود الأكسجيني القابلة للاختزال، مثلتقدم كثافات طاقة أعلى من تلك المعتمدة على أكسدة المعادن الانتقالية فقط. ومع ذلك، فإنها غالبًا ما تظهر تلاشي الجهد، وهو انخفاض تدريجي في جهد التفريغ مع مرور الوقت. أظهرت الأبحاث الأخيرة أنه، في الشحن الأول، يحدث أكسدةأشكال الأيوناتالجزيئات المحبوسة في فراغات بحجم نانو داخل الهيكل، والتي يمكن تقليلها بالكامل إلىفي التفريغ اللاحق. هنا نوضح أن فقدان القدرة على الأكسدة والاختزال O أثناء الدورة وبالتالي تلاشي الجهد ينشأ من مجموعة من العوامل التي تشمل تقليل القابلية للعكس لـعملية الأكسدة والاختزالفقدان. الفراغات المغلقة التي تحبستنمو على ركوب الدراجات، مما يجعل المزيد من المحتجزغير نشط كيميائيًا. يؤدي حجم وكثافة الفراغات إلى تشقق الجسيمات وفتح الفراغات على السطوح، مما يؤدي إلى إطلاقتشير نتائجنا إلى القوة الديناميكية الحرارية لتشكيلكسبب جذرّي لهجرة المعادن الانتقالية، وتشكّل الفراغات، وبالتالي تلاشي الجهد في الكاثودات الغنية بالليثيوم.
يمكن أن توفر الكاثودات الغنية بالليثيوم سعات أعلى من الكاثودات المتوازنة (حتى ضد لـ )، مدعومًا بمشاركة كل من تفاعلات الأكسدة والاختزال للمعادن الانتقالية (TM) وتفاعلات الأكسدة والاختزال للأكسجين . ومع ذلك، فإن متوسط جهد التفريغ الأول (تتناقص تدريجياً وينمو منحنى الحمل ليأخذ شكل خطوة مع تكرار استخدام المادة. تؤدي هذه الظاهرة المعروفة باسم ‘تلاشي الجهد’ إلى فقدان مستمر لكثافة الطاقة مع تكرار الاستخدام، وهو عيب في تسويق هذه المواد.
أحد الجوانب المدروسة جيدًا لتلاشي الجهد هو التغير التدريجي في تفاعلات الأكسدة والاختزال على المعادن الانتقالية. خلال الدورة الأولى، و تُعتبر التفاعلات الأكسدة والاختزال الرئيسية في، مع بقاء المنغنيز في الغالب +4 (المراجع 6-9). على مدار الدورات، أفادت عدة دراسات بزيادة مشاركة الجهد المنخفض (المراجع 10-12) ومؤخراً (المرجع 13). يُلاحظ هذا الانخفاض الملحوظ في TM أيضًا بشكل عام عبر مجموعة من و الكاثودات وقد تم ربطها بهجرة المعادن الانتقالية خارج المستوى بشكل لا رجعة فيه وتلاشي الجهدبينما يبدو أن الزيادة في مساهمة أزواج أكسدة-اختزال TM ذات الجهد المنخفض ترافق تلاشي الجهد، لا يزال السبب الأساسي لتلاشي الجهد غير واضح حتى الآن.
خفض فيالانتشار أثناء الدورة، الناتج عن، على سبيل المثال، اضطراب الهيكل لتشكيل طبقات سطحية تشبه السبينل أو ملح الصخورقد يؤدي ذلك إلى تقليل جهد التفريغ تحت الظروف العادية للدورة الجلفانية بين حدود جهد ثابتة. ومع ذلك، سيكون هذا التخفيض زائدة حركية. أظهرت قياسات تقنية التتبع المتقطع الجلفاني أن تلاشي الجهد ليس في الغالب بسبب زيادة أكبر في الجهد، بل هو في الواقع خسارة جهد حرارية.فيما يتعلق بالتغيرات الهيكلية، أظهرت الدراسات السابقة أن إعادة تشكيل الهيكل الكلي أكثر حدة من السطح. تم تحديد تشكيل المسام النانوية في المواد المعالجة بالدورات بواسطة مجهر الإلكترون الناقل الماسح (STEM) والتصوير ثلاثي الأبعاد.وقد كشفت قياسات البيكنومترية عن انخفاض تدريجي في كثافة المادة مع التكراركما حدد تشابمان وزملاؤه نمو المسام النانوية داخل الكتلة أثناء الدورة باستخدام قياسات تشتت الأشعة السينية بزاوية صغيرة (SAXS)، لكن قياسات دالة توزيع الأزواج للأشعة السينية لم تتمكن من تحديد ما إذا كانت ممتلئة أو فارغة.. لقد أظهرنا مؤخرًا، عبر مجموعة من مركبات O-ريدكس، بما في ذلك أننتائج الأكسدة
في تشكيل الجزيئاتالذي يتم احتجازه بشكل أساسي في فراغات صغيرة في كتلة هذه المواد ويمكن تقليله مرة أخرى إلىعند الخروج. يتبع مباشرة مصير هذاإن الإفراط في الدراجات الهوائية أمر حاسم لفهم نمو المسام النانوية وفي النهاية لشرح أصل تلاشي الجهد.
في هذه المقالة، نتبع مباشرة ونقيس كميًا المحتجزتجاوز الدراجات باستخدام مطيافية تشتت الأشعة السينية غير المرنة الرنانة عالية الدقة (RIXS). نوضح أن كمية المحتجزيتشكل على الشحنة يتناقص تدريجياً مع الدورة وأن المحتجزالذي يتشكل يصبح من الصعب بشكل متزايد تقليله إلىعند التفريغ. كما أن الفراغات التي تحتوي علىينموتشير بيانات الرنين المغناطيسي النووي (NMR) إلى مناطق أكثر سمكًا من العزلشكل على الأسطح الفارغة، متسق معيصبح من الصعب بشكل متزايد تقليله.تكشف تقنية الرنين المغناطيسي النووي للزنك (Xe NMR) وطريقة بروناور-إيميت-تيلر (BET) عن زيادة كميات الفراغات المفتوحة عند أو بالقرب من السطوح مع مرور الوقت، مما يشير إلى أنه مع نمو الفراغات وكبر حجمها وضعف الميكروهيكل الجزيئي، تتشقق الجزيئات مما يؤدي إلى إطلاقمعًا، تراكم المواد غير النشطة كيميائيًافي الجسيمات وإطلاقمن فتح الفجوات بالقرب من السطح يؤدي إلى تقليل القدرة على الأكسدة والاختزال للأكسجين. فقدانسعة الأكسدة والاختزال، التي تحدث بشكل أساسي عند إمكانيات أكبر من 3 فولت، تفسر تلاشي الجهد الملحوظ.
خصائص تلاشي الجهد في
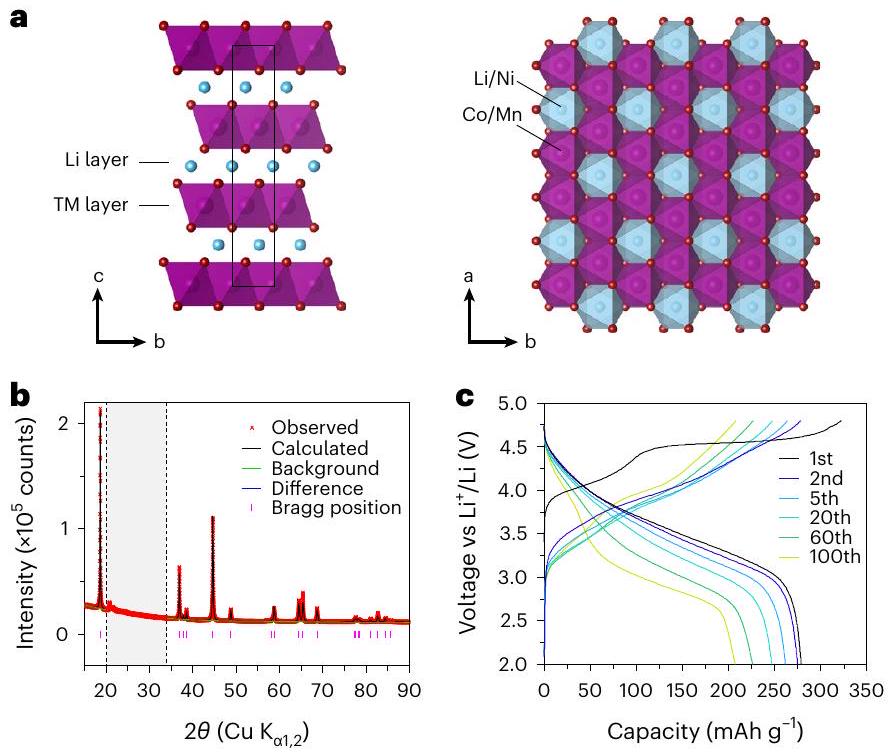
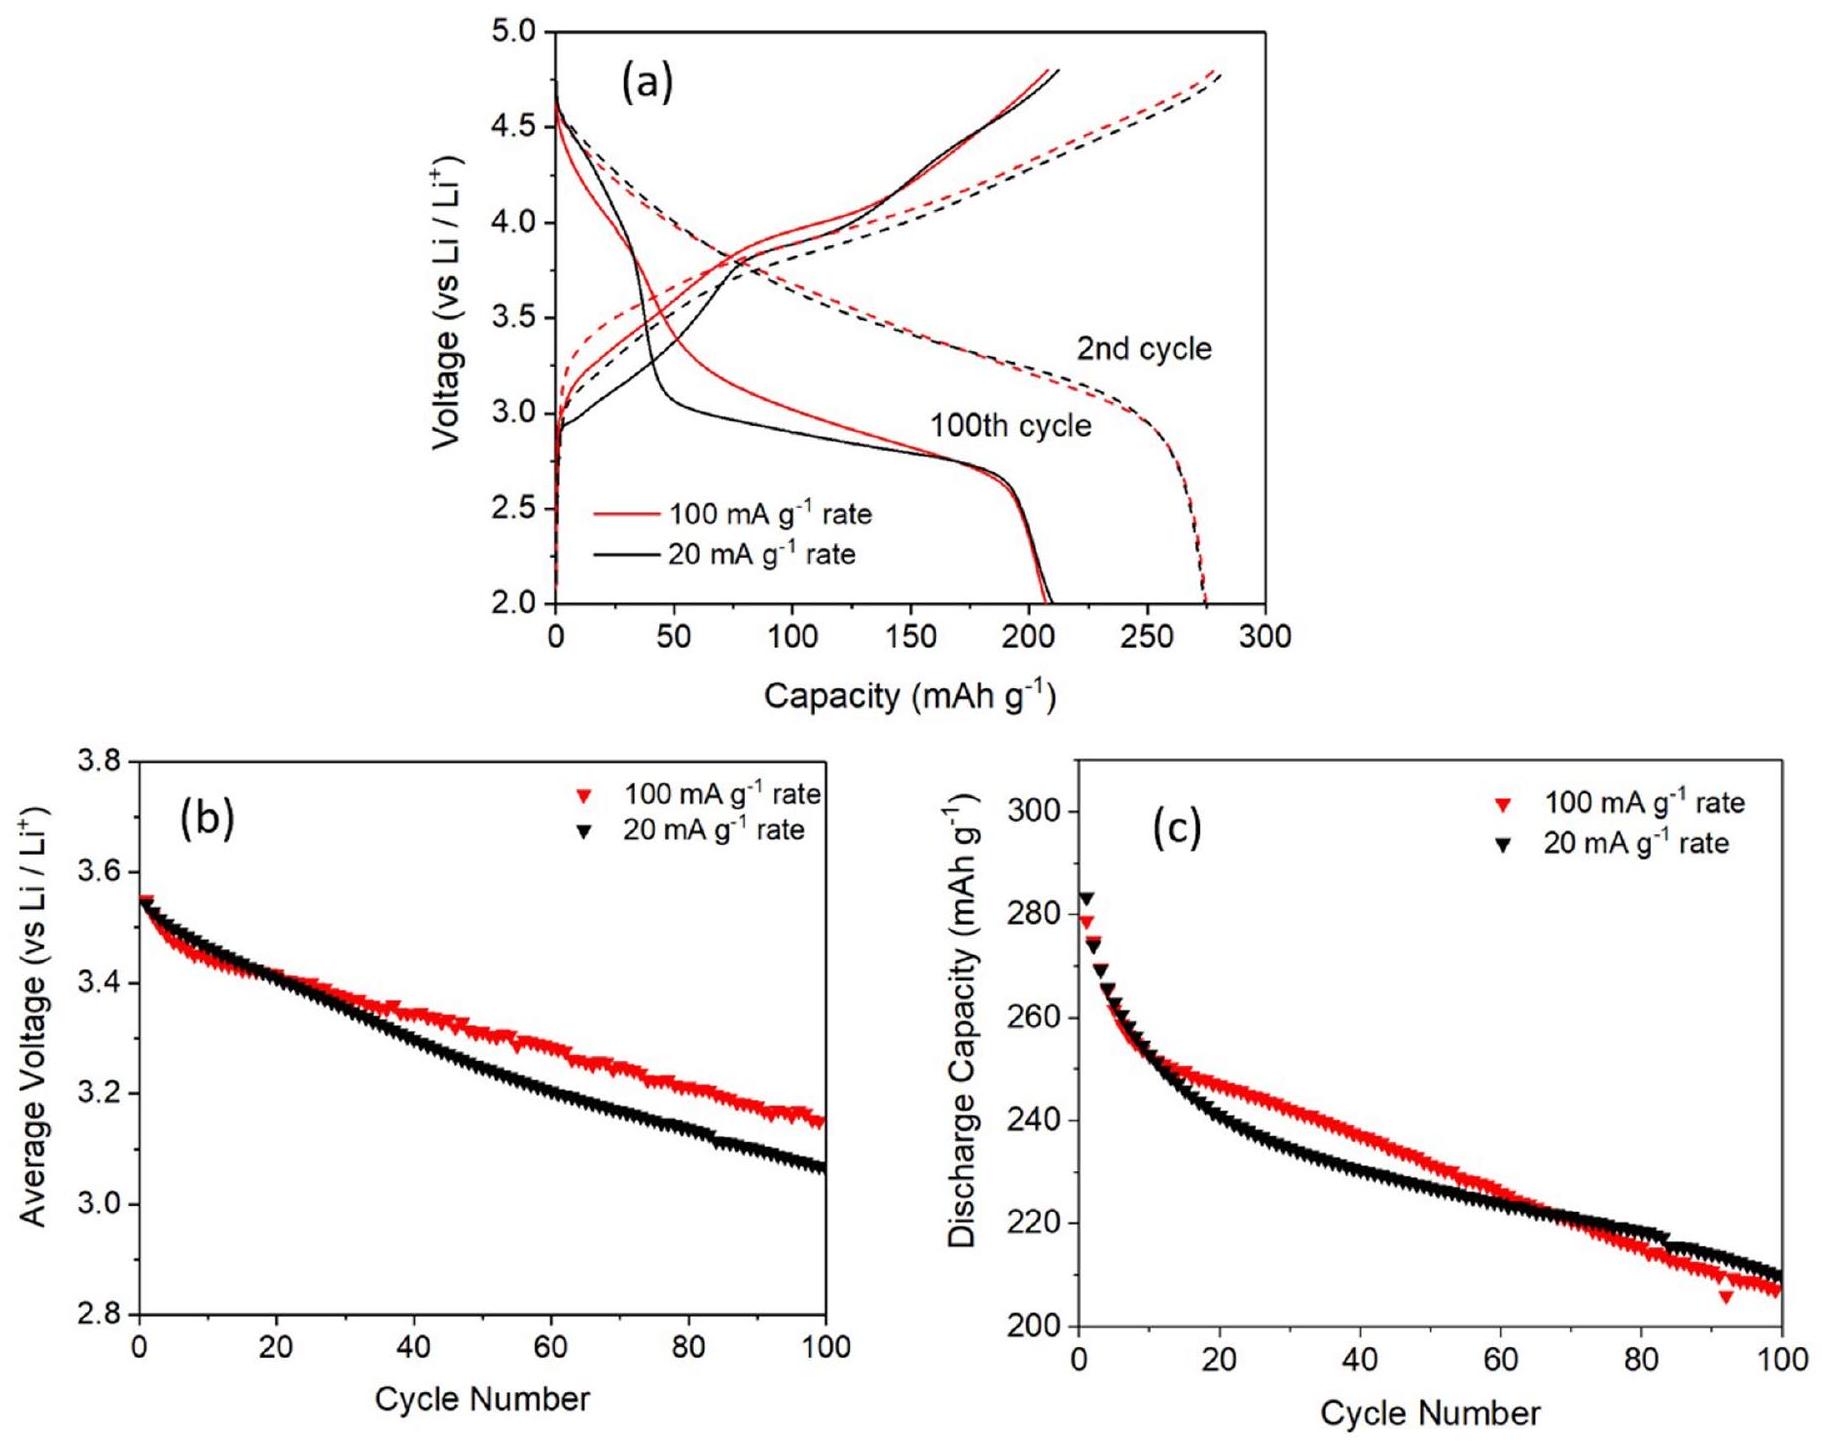
عينات منتم تحضيرها بواسطة تخليق الترسيب المشترك (الطرق). تم التحقق من التركيب بواسطة مطيافية الانبعاث الضوئي البلازمي المقترن بالحث (البيانات الموسعة الجدول 1) ومطيافية الأشعة السينية المشتتة للطاقة (البيانات الموسعة الأشكال 1 و 2)، والشكل بواسطة المجهر الإلكتروني الماسح (البيانات الموسعة الأشكال 1 و 2) والبنية بواسطة حيود الأشعة السينية بالمسحوق (PXRD؛ الشكل 1b والبيانات الموسعة الجدول 2). بنيةيتضمن تكديس من نوع O 3 لطبقات الأكسيد، مع ترتيب على شكل خلية نحل لأيونات المعادن الانتقالية والليثيوم في طبقة المعادن الانتقالية (الشكل 1أ). تم رسم منحنيات الحمل الكهروكيميائي من الدورة الأولى إلى الدورة المئة في الشكل 1ج. بعد الهضبة الجهدية التي لوحظت في الشحن الأول، يتطور منحنى الحمل إلى ملف جهد مائل ومستمر. لقد أظهرنا أن هذا التغيير الدراماتيكي مصحوب بفقدان لا رجعة فيه للترتيب على شكل خلية نحل لتشكيل تجمعات فراغية مدفوعة بتكوين الجزيئات. (ref.31). بحلول نهاية الدورة الأولى، هناك القليل من الأدلة على بقاء قمم الهيكل الفوقي على شكل خلية نحل في PXRD وشدة إشارة ضئيلة لمراقبتها على مدى دورات ممتدة. لهذا السبب، لم يتم تضمين قمم الهيكل الفوقي في تحسيناتنا هنا. من الدورة الثانية إلى الدورة المئة، تخضع منحنى الحمل لمزيد من التغييرات، مع نسبة أعلى من السعة عند جهد أقل أثناء التفريغ، أي، تلاشي الجهد (الشكل 1c). يتبع هذا الانخفاض في متوسط جهد التفريغ من الدورة الثانية إلى الدورة المئة نفس الاتجاه كما في التقارير السابقة عن تلاشي الجهد في مركبات مماثلة.تمت ملاحظة درجة من تلاشي السعة أيضًا، مشابهة للمواد التي تم الإبلاغ عنها سابقًا والتي تم تحضيرها بنفس الطريقة.تمت ممارسة ركوب الدراجات بمعدلطوال الدراسة. لتأكيد أن تلاشي الجهد والسعة الملحوظ لا ينشأ من قيود حركية، تم جمع بيانات الدورة أيضًا بمعدل أقل منأكثر من 100 دورة (الشكل 2 من البيانات الموسعة). تظهر هذه البيانات درجة مشابهة جدًا من تلاشي الجهد والسعة، مما يؤكد أن هذه الظواهر تنشأ من الخصائص الديناميكية الحرارية الكلية بدلاً من الحركيات.
تغيرات الأكسدة والاختزال أثناء الدورة
لقد أظهرنا سابقًا، باستخدام RIXS عالي الدقة والرنين المغناطيسي النووي، تلك الجزيئيةيتشكل خلالالأكسدة في الكاثودات الغنية بالليثيوملمتابعة التغيرات في كمية الجزيئاتالتي تتشكل عند الدوران، استخدمنا تقنية RIXS عالية الدقة الكمية عند حافة OK. في طيف RIXS عالي الدقة، هناك ميزتان رئيسيتان مرتبطتان بالجزيئات. : ميزة فقدان الطاقة في ، وسلسلة من قمم تقدم الاهتزازات التي تنتشر من قمة RIXS المرنة عند 0 إلكترون فولت. لتتبع الكمية النسبية من المساحة تحت الاهتزازي
الشكل 1 | التوصيف الهيكلي والبيانات الكهروكيميائية لـمع طبقاتالهيكل، الترتيب في المستوى و مما يؤدي إلى ترتيب الهيكل الفائق على شكل خلية نحل. تم تمثيل ذرات الليثيوم باللون الأزرق، والمعادن الانتقالية باللون الأرجواني، والأكسجين باللون الأحمر. ب، بيانات PXRD والتكرير إلى هيكل بلوري R3-m. ج، منحنيات التحميل لـتمت الدورة بين 2.0 فولت و 4.8 فولت عند 100 مللي أمبير لكل غرام لمدة 100 دورة.
تم دمج قمم التقدم (من 0.125 إلكترون فولت إلى 2.2 إلكترون فولت). تم اختيار هذه الميزة لأن شدة القمة تنشأ فقط من الجزيئات.، دون أي مساهمة من أيونات الأكسيد. التحليل المستخدم لتحديد كمية تم وصف الإفراط في ركوب الدراجات بمزيد من التفصيل في الطرق.
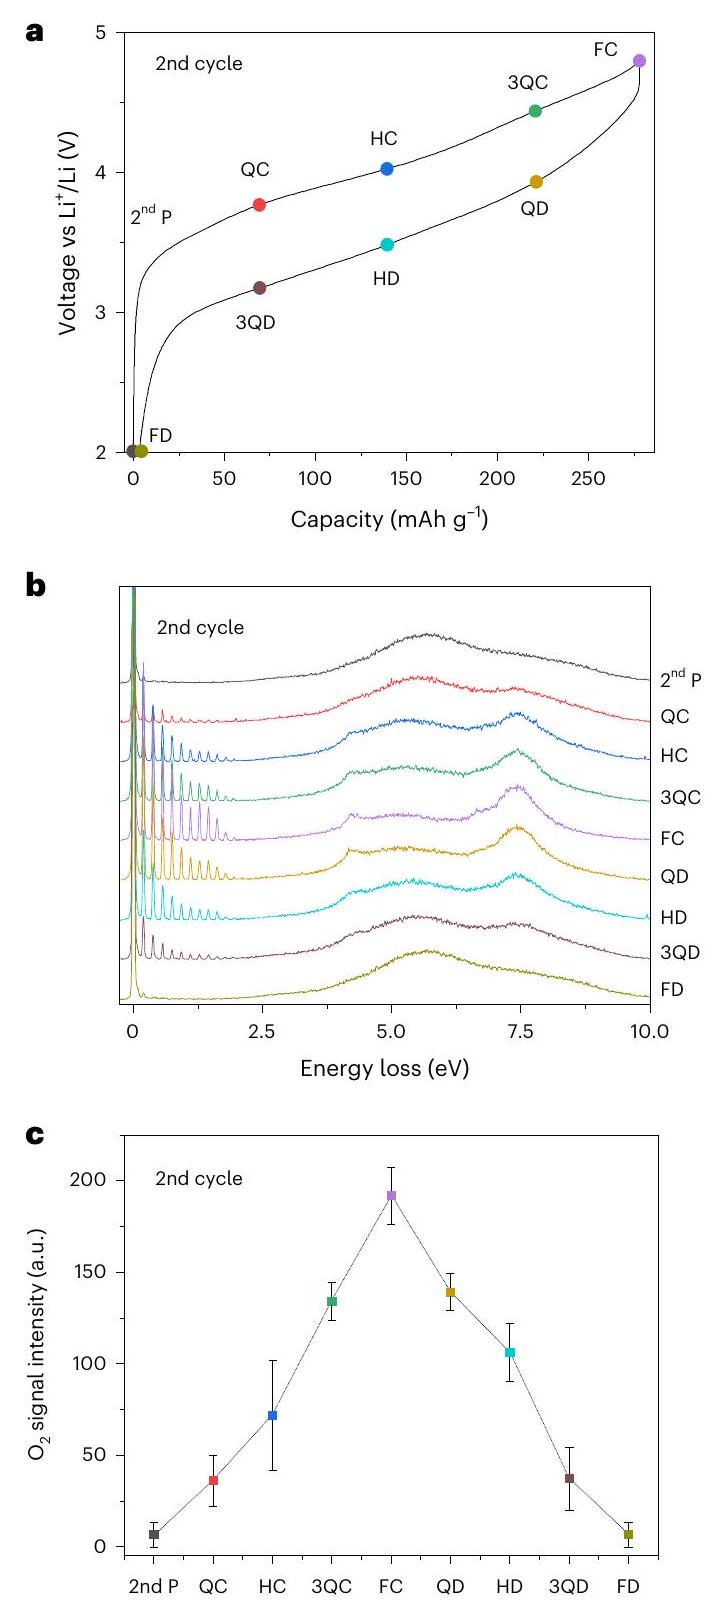
لهذه الدراسة،تم شحنها إلى نقاط محددة على الدورتين الثانية والمئة، تمثل ربع الشحن (QC)، نصف الشحن (HC)، ثلاثة أرباع الشحن (3QC)، الشحن الكامل (FC)، ربع التفريغ (QD)، نصف التفريغ (HD)، ثلاثة أرباع التفريغ (3QD) والتفريغ الكامل (FD) (الشكل 2a، d). تم تعريف هذه النقاط على أساس السعة الجزئية من إجمالي سعات الشحن/التفريغ للدورتين الثانية والمئة وفقًا لذلك. في كل حالة من حالات الشحن، تم أخذ عدة مسحات RIXS عبر مواقع عينة مختلفة لتقليل أي تأثير لعدم تجانس العينة، على الرغم من أننا نلاحظ أنه لم يكن هناك فرق كبير بين الأطياف (الشكل التمديدي 8). ثم تم حساب متوسط هذه المسحات ورسمها لكل من الدورتين الثانية والمئة (الشكل 2b، e). تم دمج شدة الإشارة تحت الـتم رسم قمم تقدم الاهتزاز كدالة للشحن والتفريغ (الشكل 2c، f).
لقد لاحظنا اختلافات كبيرة في نشاط الأكسجين خلال الدورة. خلال عملية الشحن في الدورة الثانية، كانت كميةيُلاحظ أنه يزداد باستمرار على مدى كامل نطاق الجهد، وهو ما ينعكس في الانخفاض فيعلى مدى التفريغ اللاحق (الشكل 2c). بالمقابل، بينما يبدو أن الشحنة المئوية تظهر زيادة مستمرة فيعند الخروجتقليل إلى يحدث بين نقاط FD و HD على منحنى الحمل. نقطة HD هي عند ، مما يشير إلى أن زوج الأكسدة والاختزال نشط بشكل أساسي فوق 3 فولت أثناء التفريغ، مما يترك بقية سعة التفريغ لتقليل المعادن الانتقالية. وهذا يتماشى مع دراسات أخرى تشير إلى زيادة مساهمة الجهد المنخفض. و أزواج الاختزال والأكسدة بعد الدورة. بينما الغالبية من يلاحظ أنه يتم تقليله فوق 3 فولت، وقد يتم تقليل كمية صغيرة عند الفولتية المنخفضة.
تم تتبع شدة إشارة الأكسجين كدالة لعدد الدورات عند الشحن الكامل والتفريغ الكامل (الشكل 3). تكشف البيانات في الشكل 3 عن فقدان عام في الكمية الإجمالية المحبوسة.في الكاثودات المشحونة خلال الدورة، معالخسارة من الـ FC الثاني إلى الـ FC المئة. علاوة على ذلك، فإن المبلغ من المتبقي في نهاية التفريغ يبدو أنه يزداد من الدورة الثانية إلى الدورة المئة (الشكل 3). تراكم في الـ
الشكل 2 | تطور النشاط الكهروكيميائي في الكتلة 0 – النشاط الأكسدة والاختزال على مدى الدورتين الثانية والمئة. أ، د، منحنيات التحميل لـ والدورة المئوية (د) لـ ، مع حالات الشحن المدروسة. ب، هـ، طيف RIXS عند 531.5 إلكترون فولت تم جمعه خلال الدورة الثانية (ب) والدورة المئة (هـ). ج، ف، تغير في شدة الجزيءإشارة في
طيف RIXS على الدورة الثانية (ج) والدورة المئة (و)، كما تم تحديده بواسطة تحليل المكونات الرئيسية (الطرق). يتم تقديم البيانات كمتوسطالانحراف المعياري مع حجم عينة يبلغ 15. ب، نقي.
نهاية إشارات التفريغ تشير إلى أن المحتجزيصبح غير نشط كهربائيًا بشكل متزايد. أخذ الفرق بين الـفي نهاية الشحن والتفريغ يكشف أن كمية سعة الأكسدة والاختزال تتناقص منلكل وحدة صيغة في الدورة الثانية إلىلكل وحدة صيغة في الدورة المئوية. كنسبة مئوية من إجمالي الشحنة المارة، يتناقص O-redox منفي الدورة الثانية إلىفي الدورة المئوية، يتم تعويض توازن السعة بواسطة TM redox. تنشأ خسارة سعة O-redox أثناء الدورة جزئيًا من تكوين مواد غير نشطة كيميائيًا.الذي لا يزال محاصرًا ولكن لا يمكن تقليله في كل دورة، ولكن أيضًا من الخسارة الإجمالية لـمن الجسيمات، المنعكسة فيفقدان في نهاية الشحن بعد 100 دورة (الشكل 3). السعة المتبقية النشطة للأكسدة والاختزال في الدورة المئة (يتماشى (لكل وحدة صيغة) مع الشحنة المارة بين FC و HD، أي الشحنة المارة فوق 3 فولت. بشكل عام، فإن فقدان نشاط الأكسدة والاختزال للأكسجين، من خلال مجموعة من العناصر غير النشطة كهربائيًا وإصدار من الجسيمات، يمكن أن تفسر
الشكل 3 | تطور كمية المحتجززيادة في ركوب الدراجات. تباين في شدة الجزيئاتإشارة من RIXS حول الدورة في الحالة المشحونة بالكامل (FC) والحالة المستنفدة بالكامل (FD). كميةتتقلص المواد المشحونة مع الدورة وهناك أدلة متزايدة علىالذي لا ينخفض عند التفريغ. تُعرض البيانات كمتوسطالانحراف المعياري مع حجم عينة قدره 15.
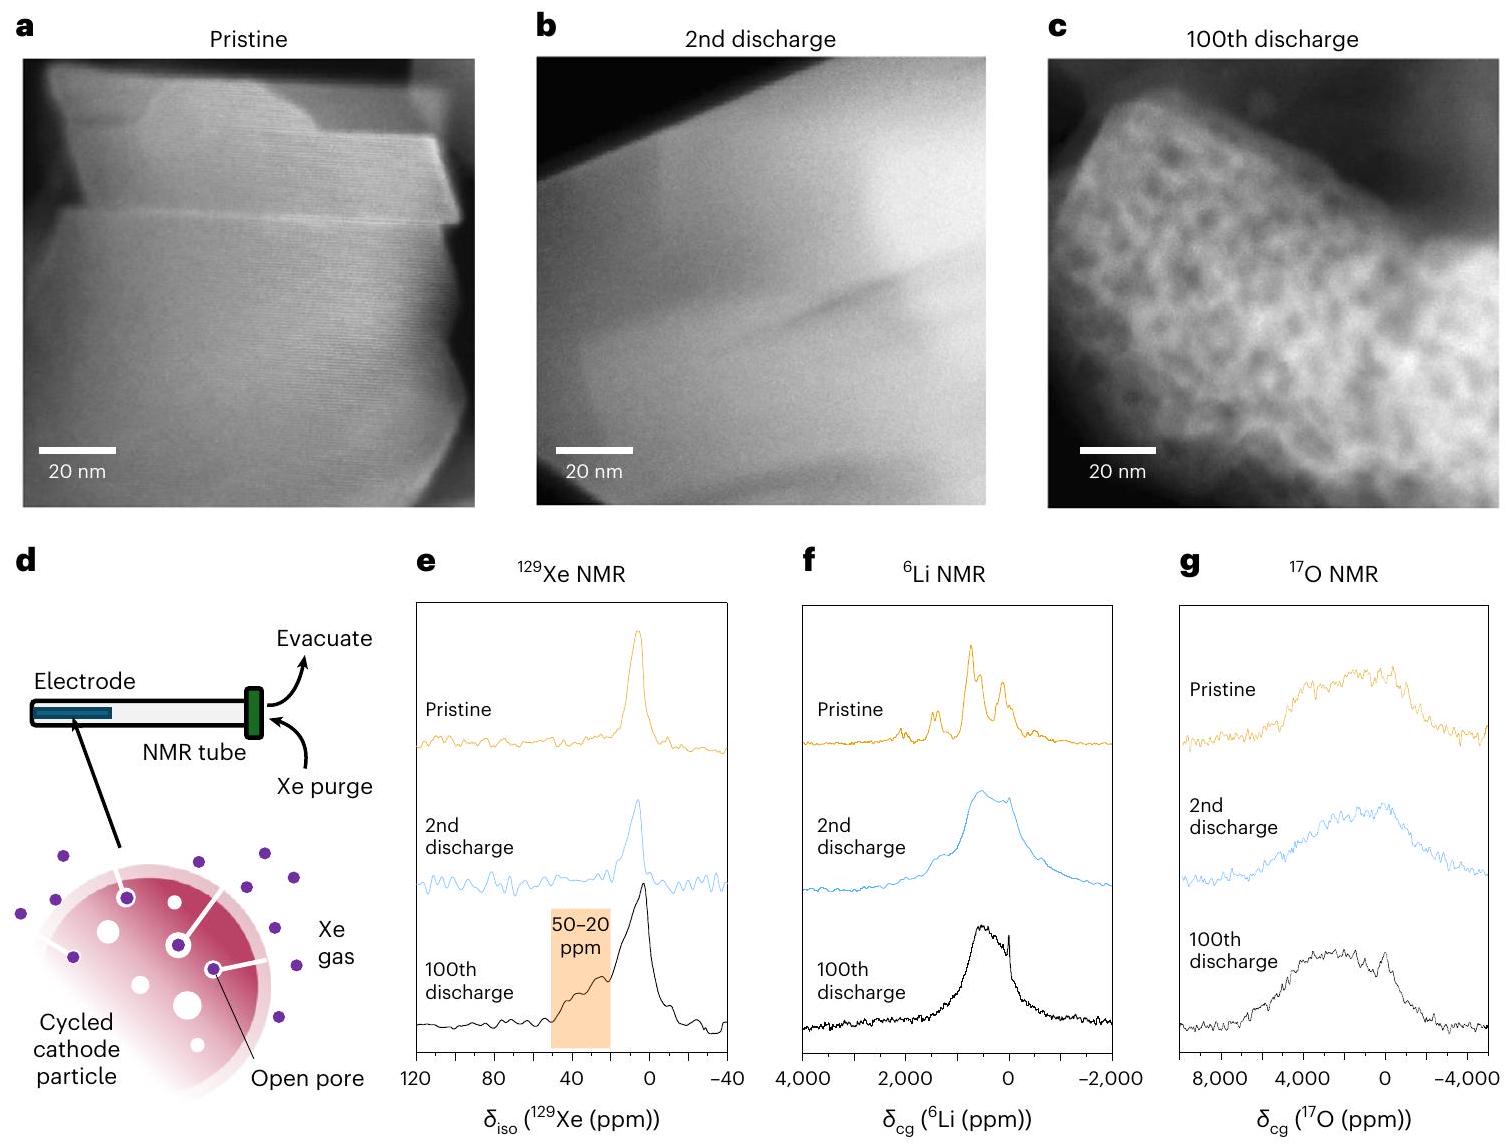
المنطقة البرتقالية المميزة تشير إلى وجود فراغات مفتوحة بقطر 17 نانومتر أو أكبر بعد 100 دورة.التحول الكيميائي المتساوي الاتجاه. و (g) NMR عزل البيئات البطيئة والسريعة الاسترخاء. القمم الحادة عند 0 جزء في المليون في وبطء مريحتشير طيفيات الرنين المغناطيسي النووي إلى تكوين مناطق كبيرة غير مغناطيسية غنية بالليثيوم بعد دورات طويلة.
الشكل 4 | تشكيل الفراغات ومناطق غنية بالليثيوم غير المغناطيسي الكبيرة خلال الدورة.صور ADF-STEM تظهر حبيبات فردية من المادة النقية (أ)، التفريغ الثاني (ب) والتفريغ المئة (ج) تظهر تشكيل الفراغات حولفي القطر خلال دورة ممتدة. د،تجارب الرنين المغناطيسي النووي. تم استخراج العينات من الخلايا وتم تسريبها بغاز الزينون لاستكشاف المسامية المفتوحة.تحليل الرنين المغناطيسي النووي للزينون للمواد النقية، والمواد بعد التفريغ الثاني، والمواد بعد التفريغ المئة. تقليل مساهمة الشحن فوق 3 فولت، مما يؤدي إلى تلاشي الجهد وفقدان كبير في السعة أثناء الدورة..
تكوين الفراغات أثناء الدورة
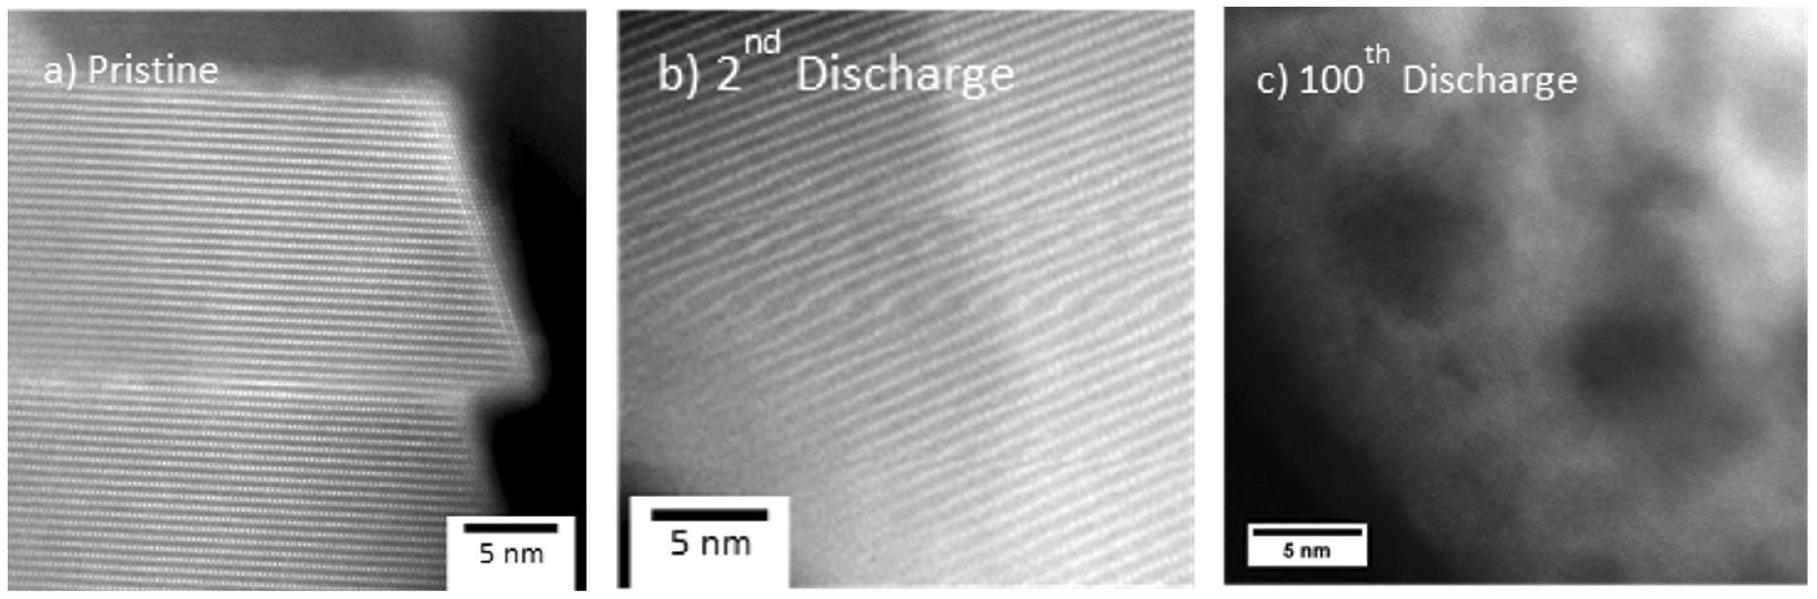
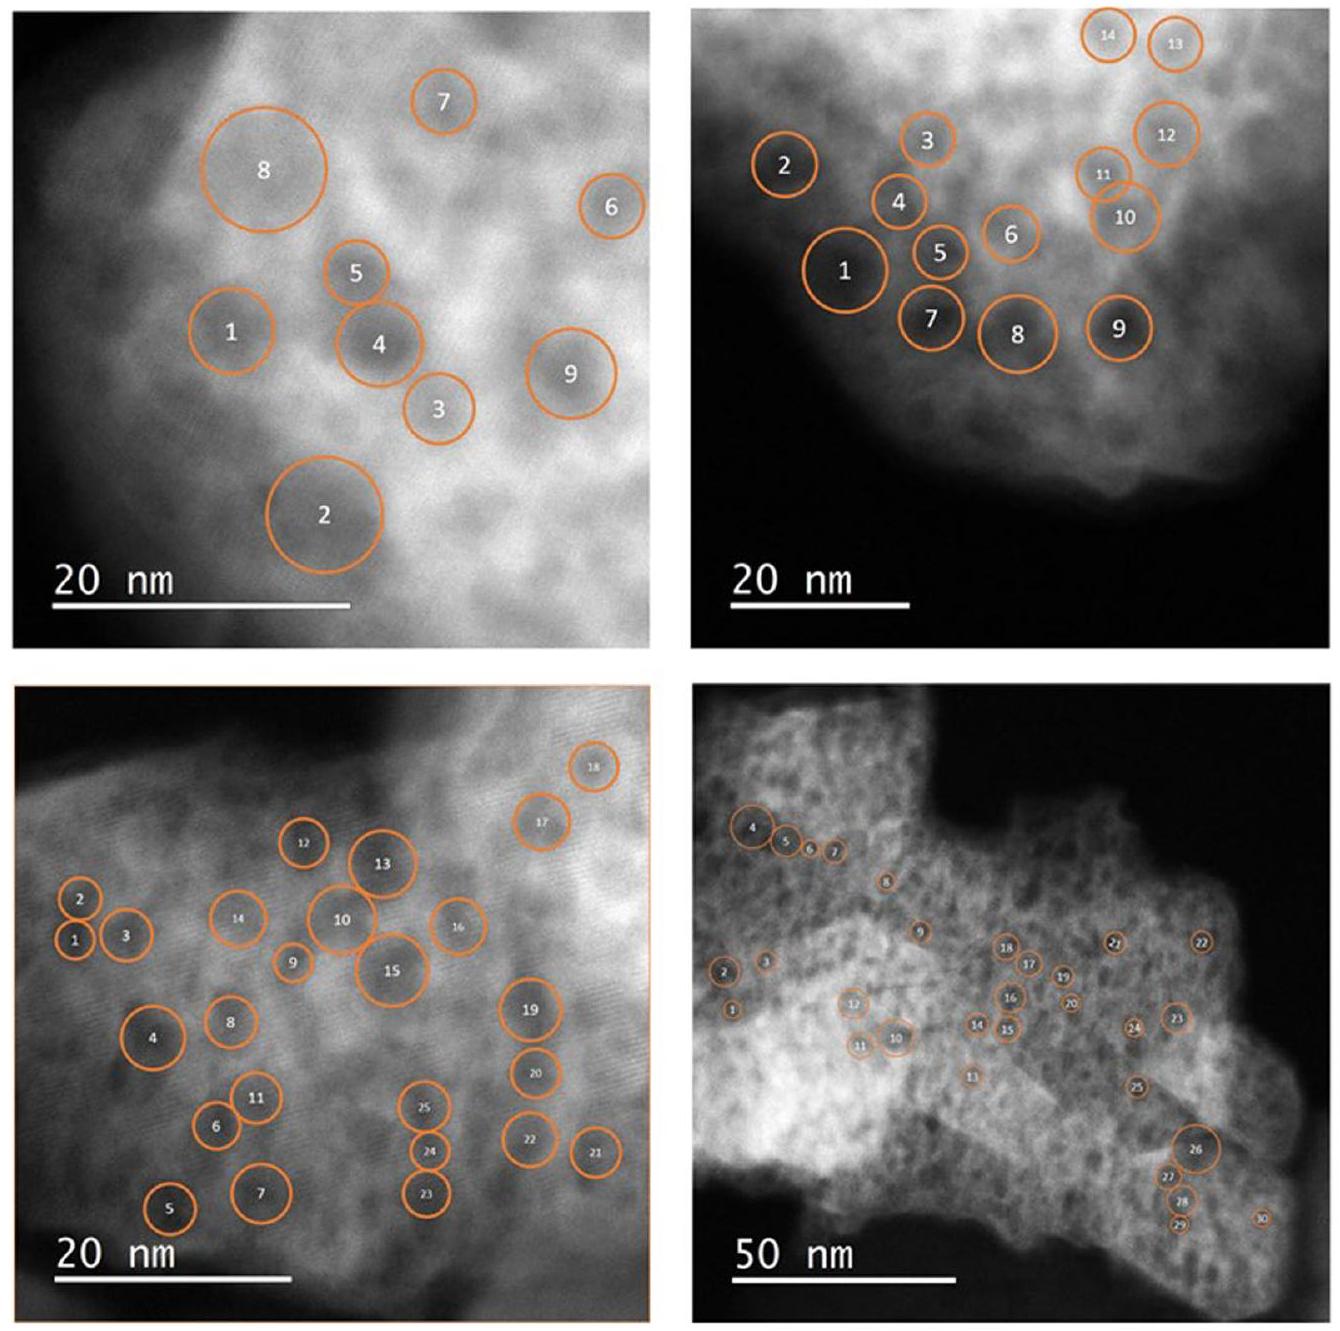
لفحص أصل التقلص في المدىتم إجراء التشكيل والتقليل مع الدورة، وتصوير مجال الظلام الحلقي (ADF)-STEM لاستكشاف التغيرات في الميكروهيكل للجسيمات. الصور المعروضة في الشكل 4a-c والأشكال الإضافية 4 و 5 توضح تغييرات كبيرة داخل الحبوب الفردية منبعد 100 دورة، بما يتماشى مع التقارير السابقة التي تحدد تشكيل الفجوات ونموها باستخدام SAXS وSTEM والتصوير المقطعي ثلاثي الأبعاد.مقارنة الصور للمرحلة الأولى والثانية من التفريغ مع التفريغ المئة توضح بوضوح تطور فراغات واسعة جداً مع كثافة عالية من الفراغات، كما يتضح من المناطق الداكنة. تتفاوت الفراغات من حواليفي الحجم ويبدو أنها موزعة في جميع أنحاء الجسيم. نظرًا للكثافة العالية للفراغات، من المحتمل أن تكون عدد من هذه الفراغات مترابطة مما يؤدي إلى مسام بأبعاد أكبر مما هو واضح من تقنية STEM.
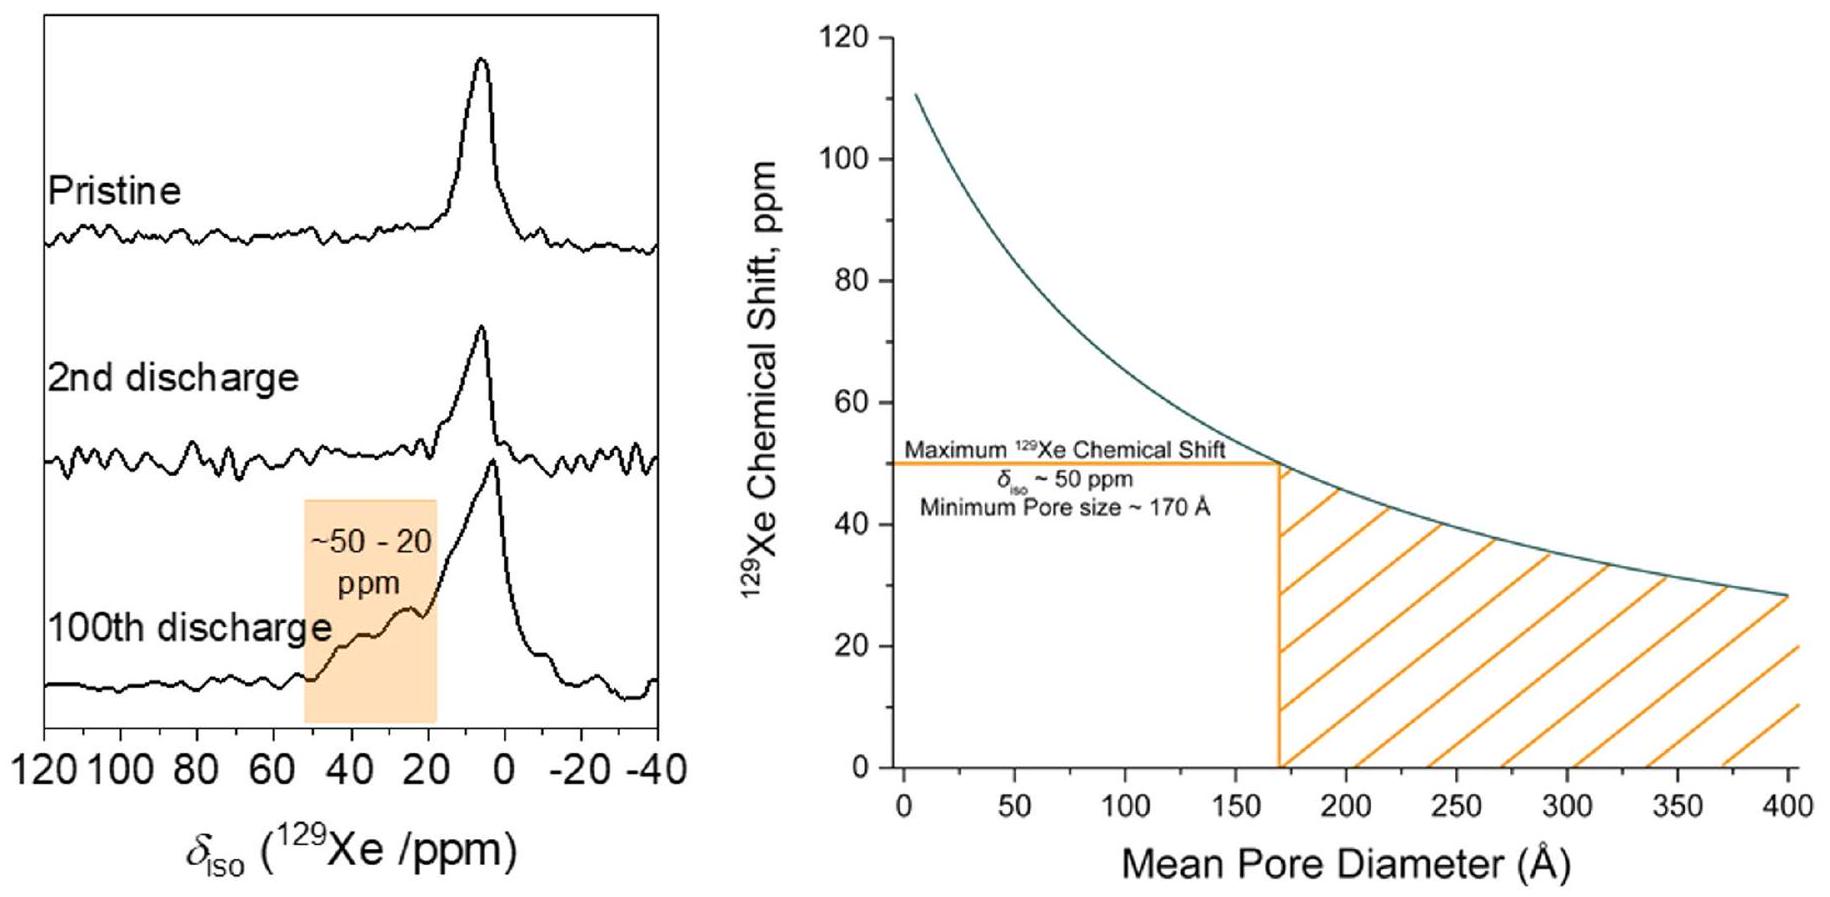
للتحقيق في مدى إغلاق أو فتح الفراغات،تم استخدام الرنين المغناطيسي النووي للزينون. زينون-129 ( ) هو غاز خامل ذو سحابة إلكترونية قطبية كبيرة، مما يمنح الزينون نطاق تحولات كيميائية واسع.. عندما يكون مقيدًا داخل فراغ، ويتلامس مع سطح الفراغ مما يتسبب في تشويه سحابة الإلكترون وملاحظة تحول كيميائي.. هذه التحول له علاقة معروفة بحجم الفراغ الذي تم تحديده تجريبيًا، كما هو موصوف في الشكل البياني الموسع 6 (المرجع 39).تم تفريغه أولاً تحت فراغ ديناميكي عالي لمدة 48 ساعة لتفريغ العينة، قبل أن يتم تدفقها بغاز الزينون (الشكل 4d). تظهر طيف الزينون لعينات المادة الأصلية، والمادة بعد التفريغ الثاني والمادة بعد التفريغ المئة في الشكل 4e جميعها ذبذبات مركزة عند، متسق مع توسيع الغاز الزينون الكثيف مغناطيسياً بسبب التفاعلات مع سطح مادة الكاثود. قد تنشأ الإشارة من كميات كبيرة ( ) فتح المسام على السطح، على الرغم من عدم وجود مثل هذه المسام في ADF-STEM. بعد 100 دورة، لوحظ زيادة في الكثافة الطيفية بين 20 جزء في المليون و 50 جزء في المليون في طيف NMR للزينون. هذه الإشارة غير موجودة في المادة الأصلية أو المادة التي تم تدويرها للمرة الثانية، مما يعني أن فراغات جديدة مفتوحة بحجم لا يقل عن 17 نانومتر تتشكل (الشكل 4e). هذه الإشارة الجديدة لن تظهر إذاقد فقدت مباشرة من السطح، فقط ذرات Xe في مسام جزئية محصورة مفتوحة على السطح تختبر تحولًا كيميائيًا، وبالتالي يجب أن يكون هناك زيادة في مسامية السطح. تدعم هذه الملاحظات باستخدام الرنين المغناطيسي النووي قياسات BET التي تظهر أيضًا زيادة في عدد المسام المفتوحة على السطح.في القطر بين الدورة الثانية والمئة (الشكل البياني الممتد 7). الأحجام الأكبر قليلاً من المسام من NMR وBET تتماشى مع بعض المسام التي تم رؤيتها في STEM والتي تكون مترابطة وبالتالي أكبر مما تقترحه صور STEM.
محتويات الفراغات المغلقة
بالإضافة إلى و تم استخدام تقنية الرنين المغناطيسي النووي (NMR) بتقنية الدوران بزاوية سحرية في الحالة الصلبة (MAS) للتحقيق في التغيرات خلال الدورة.يظهر التحليل الطيفي بالرنين المغناطيسي النووي للحالة الصلبة للمواد النقية (الشكل 4f) منطقتين من الرنين؛ الرنين الذي ينشأ من الليثيوم في طبقة المعادن الانتقالية هو عند
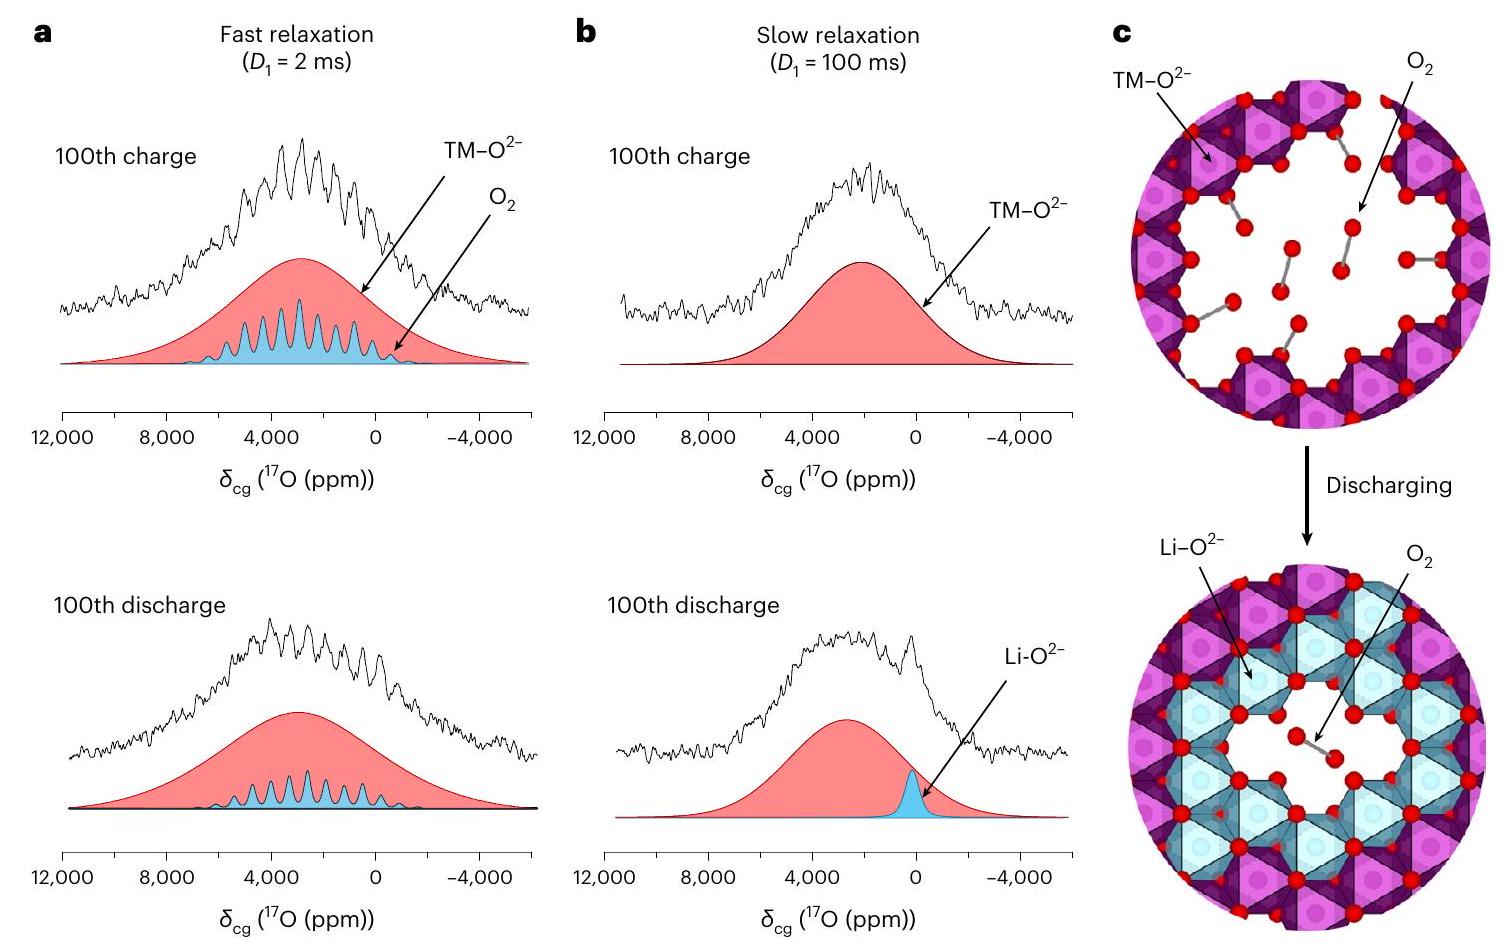
الشكل 5 | تقليل جزئي لـمحاصرون في الفراغات لتشكيل Li – المنسقفي التفريغ المئة. أ، ب،طيف NMR لعزل الاسترخاء السريع (أ) والبطيء (ب)البيئات. القمم الحادة فيمخصصة للجزيئات المحاصرة، الذي ينخفض في الشدة عند التفريغ. لا يزال هناك دليل على بعض الجزيئات المتبقيةفي العينة المفرغة،. في الاسترخاء البطيءتسيطر عليها بيئات أكسيد منسقة إلى أيونات المعادن الانتقالية البارامغناطيسية (TM-O ) ، . بعد الخروج، جديد تتشكل البيئة المحيطة بالأكسيد المحاط بالليثيوم (أي، ) تم إنشاؤه من خلال تقليل في الفراغات وإعادة الإدخال لـإلى الفراغات المنسقة بواسطةمركزًا فيتأخير الاسترخاء. ج، فراغات كبيرة تستوعبتم إعادة توطينها جزئيًا بواسطةعند الخروج. معظميتم تقليصه إلىلكن بعض المتبقييبقى. وهو متسق مع ترتيب خلية النحل المحدد جيدًا، وتلك التي تتراوح بين 400 جزء في المليون و900 جزء في المليون هي من الليثيوم في طبقات المعادن القلوية.. بعد دورتين، تم توسيع الإشارة وتحول كبير في مركز ثقل الرنين (منإلى ) يُلاحظ، بما يتماشى مع الاضطراب المحلي في الكاثود وتجمع الليثيوم في مناطق أكثر ديا مغناطيسية مع عدد أقل من الجيران من المعادن الانتقالية، وقد تم مناقشة هذه التغييرات سابقًا.بعد 100 دورة، لوحظ رنين حاد ملحوظ عند 0 جزء في المليون يتوافق مع الليثيوم في بيئة ديمغناطيسية موسعة.
المقابلتظهر طيفيات O MAS NMR (الشكل 4 ج) للمادة النقية شكل خط غير متبلور عريض مع دقة محدودة جداً. ويعزى ذلك إلى مجموعة من بيئات أيونات الأكسيد التي تم توسيعها بسبب التفاعلات البارامغناطيسية. بعد 100 دورة في نهاية التفريغ، انتقلت كثافة الطيف للرنين إلى تردد أعلى قليلاً، مما يشير إلى تكوين مناطق غنية بالمعادن الانتقالية، أي حيث تكون أيونات الأكسيد منسقة بواسطة عدة أيونات معدنية انتقالية. ). هناك أيضًا أدلة على تشكيل قمة عند . تظهر هذه الذرات من الأكسجين انزياحًا كيميائيًا غير مغناطيسي مشابهًا في طيف الرنين المغناطيسي النووي لليثيوم. كالمحاصريتم تقليصه مرة أخرى إلى، الـالأيونات المعاد إدخالها في الجسيمات المحيطة بـمما يؤدي إلى المناطق النانوية من (المراجع 31، 41). هذا يتماشى مع الدورة المئوية 100طيف ويمكن أن يُعزى إلى تكوين مناطق غنية بالليثيوم في الكاثود و ). معًا، الـ و تشير تقنية الرنين المغناطيسي النووي (NMR) إلى أن المواد تتجزأ إلى مناطق غنية بعناصر الانتقال ذات المغناطيسية العالية (TM) ومجموعات غنية بالليثيوم (Li) غير المغناطيسية على مدى دورات طويلة.
للبحث عن الجزيئاتعلى مدار الدورة المئة باستخدامتم جمع طيف ONMR السريع للاسترخاء (2 مللي ثانية) مقارنةً بتلك التي تم مناقشتها أعلاه (100 مللي ثانية) لتعزيز الأكسجينات التي تعاني من تعزيز الاسترخاء البارامغناطيسي بشكل كبير.من المتوقع أن تمتلك الجزيئات، التي تحتوي على إلكترونين غير متزاوجين، تعزيز استرخاء بارامغناطيسي أقوى بكثير من الأكاسيد. البيانات (الشكل 5) عرض بيئة كيميائية محددة جيدًا تتركز حول، حيث هو مركز ثقل الإزاحة الكيميائية، مع مجموعة من الحلقات الجانبية الدوارة، متسقة مع القياسات السابقة للجزيئات المحبوسة. (المراجع 31، 42). انخفاض في شدة الـيمكن رؤية الرنين بين الشحن والتفريغ المئة كـيتم تقليصه إلى؛ ومع ذلك، هناك أدلة على بعض المتبقيموجود في العينة الم discharged رقم 100. هذه النتائج تتماشى مع قياسات RIXS لدينا (الأشكال 2 و 3) وتشير إلى أنيتم تقليله جزئيًا فقط خلال الدورة المئوية. تكشف الأطياف البطيئة الاسترخاء المقابلة (الشكل 5ب) أنذروة مغناطيسية غير مغناطيسية ناتجة عنمحاط بشكل أساسي بـغير موجودة تمامًا في عينة الشحنة المئة. تدعم هذه الأدلة الاستنتاج بأن الفراغات المغلقة التي تم رؤيتها في ADF-STEM مليئة بـوعند التفريغ، يتم إعادة دمج هذا الأكسجين جزئيًا في الشبكة على أنهفي المناطق الغنية بالليثيوم الأيوني (الشكل 5c)، مصحوبة بإعادة إدخالالأيونات في الفراغ المنسق بواسطةكما وصفنا سابقًا.
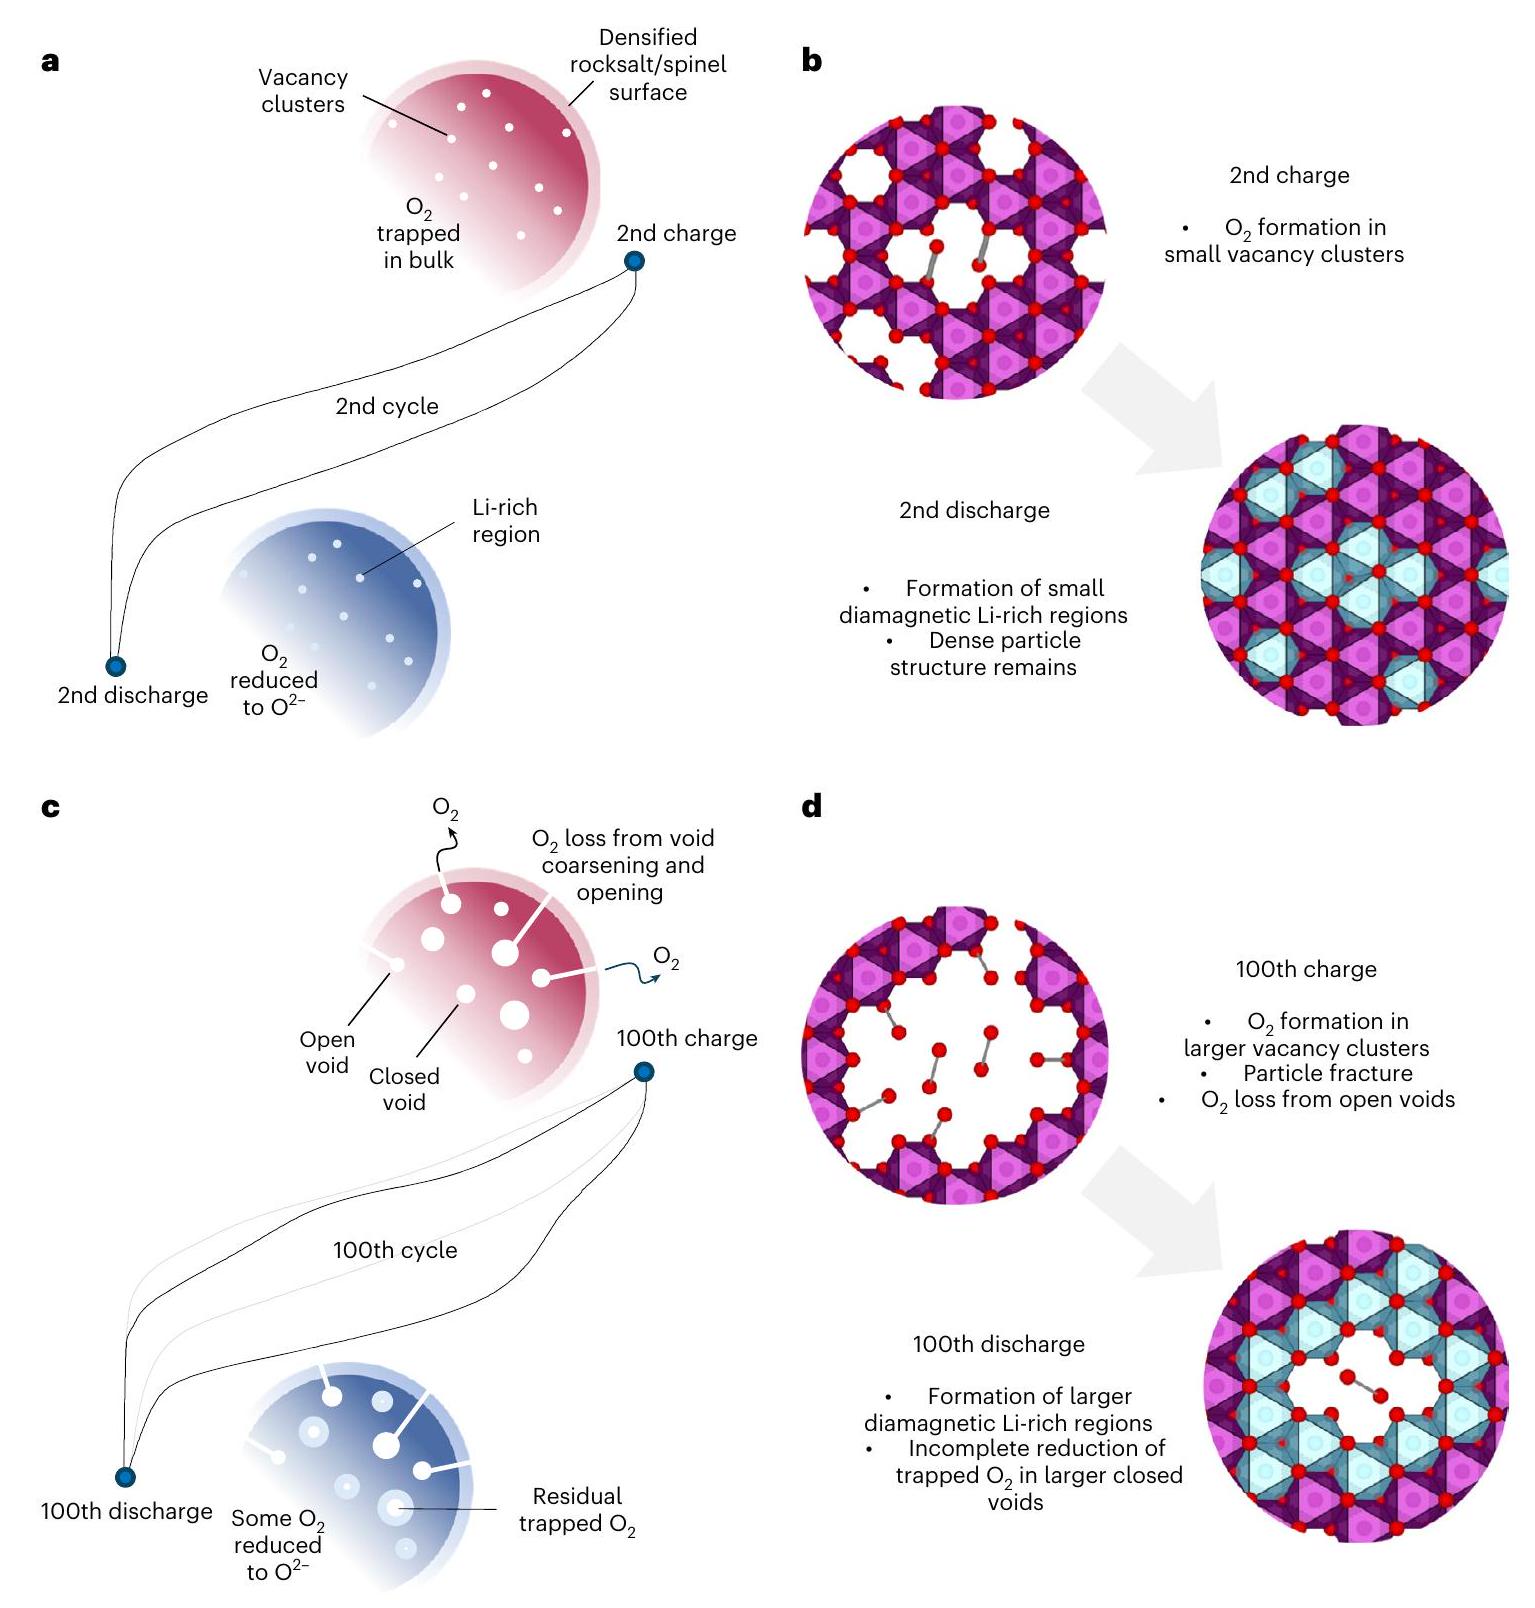
فقدان وبقايا محبوسةاشرح تلاشي الجهد
لقد أظهرنا مؤخرًا، باستخدام RIXS عالي الدقة و NMR، الذي في الدورة الأولى من O -redoxمادةيتأكسد إلىمع فقدان ترتيب خلية النحل TM وتكوين تجمعات فراغية صغيرة تحبس الـالجزيئات الموزعة في جميع أنحاء الجسيم. تشكيل المحبوسيحدث بسرعة عند الشحن كما يتضح من عدم وجود حالات الإلكترون والثقب علىالشبكة الفرعية. بحلول نهاية الدورة الأولى، تم احتجازتم تقليصه بالكامل إلى، مع الأخذ في الاعتبار السعة القابلة للعكس للأكسدة والاختزال O.
تظهر النتائج المقدمة هنا أنه، في الدورات اللاحقة، لا يكون آلية الأكسدة والاختزال ثابتة وتستمر في التطور، على الرغم من أنها تتطور بشكل أكثر تدريجياً. مع تكرار الدورات، يحدث تراكم متزايد لـ في نهاية التفريغ (الشكل 3)، مما يشير إلى أن ليس كل يتشكل عند الشحن ويقل عند التفريغ اللاحق، أي أن هناك انخفاضًا
يؤدي إلى تجمع وتكبير الكتل إلى فراغات أكبر مدفوعة بتكوين المزيد منتؤدي الفراغات الكبيرة وكثافتها العالية في الجسيمات إلى إضعاف الأخيرة، مما يسبب التشقق والإفراج. كما أنه من الأصعب تقليلفي الفراغات الأكبر.
الشكل 6 | آلية تلاشي الجهد. أ، ب، الدورة الثانية: يتضمن الأكسدة والاختزال القابل للعكس تكوين جزيئيمحاصر في تجمعات فراغية صغيرة في جميع أنحاء الجسيم.الجزيئات مخفضة بالكامل إلىعند التفريغ تتشكل مناطق صغيرة غنية بالليثيوم غير المغناطيسية. ج، د، الدورة المئوية: مزيد من هجرة المعادن الانتقالية. في قابلية العكس لـالتحول. الانخفاض في كميةمحاصر في قمة الشحن يشير أيضًا إلى فقدانمن الجسيمات. معًا، فقدانوتناقص القابلية للعكس لـالتحول يؤدي إلى فقدانلكل وحدة صيغة في سعة O-redox، مما يتوافق مع انخفاض في نسبة السعة بسبب O-redox منفي الدورة الثانية إلىفي الدورة المئة. كما أنيحدث الزوج فوق 3 فولت، حيث يؤدي فقدان سعة O-redox على حساب نسبة أعلى من سعة TM إلى فقدان الجهد الكلي أثناء الدورة. كما أن الانخفاض في سعة O-redox القابلة للعكس يتناسب أيضًا مع تلاشي السعة أثناء الدورة، أي أن فقدان السعة أثناء الدورة مرتبط بتقليل النشاط O-redox عند الف voltages الأعلى وجهد متوسط أقل.
مع فقدان القدرة على الأكسدة والاختزال، تظهر المواد الغنية بالليثيوم تغييرات ملحوظة في الميكروهيكل لجزيئات الكاثود. لقد تم الإبلاغ بالفعل عن عدد من الفجوات التي تتشكل أثناء الدورة.استخدام STEM، البتيغرافي و تبعثر الزاوية الصغيرةتظهر الفراغات أيضًا كخفض في كثافة الجسيمات المتوسطة، وهو ما تم ملاحظته مؤخرًا.تقدم صور ADF-STEM الخاصة بنا (الشكل 4 أ-ج والأشكال البيانية الممتدة 4 و5) دليلًا إضافيًا على ذلك، حيث تظهر الفراغات التي تتطور والتي تبلغ حواليفي القطر داخل الجسيمات الفردية بعد 100 دورة. اقترحت الدراسات السابقة تشكيل فراغات في الشحنة الأولى تتوافق مع عدد قليل من مواقع الكاتيون الشاغرة وبالتالي بقطر يقارب 1 نانومتر، مما يعني أن الفراغات تنمو مع الدورة.من المتوقع أن يكون محاصرًا في هذه الفراغات الأكبر أكثر صعوبة من الفراغات الأصغر بكثير الموجودة في الدورات الأولى والثانية. وهذا يتماشى مع ملاحظات RIXS في نهاية التفريغ التي تظهر كميات متزايدة من المواد غير المختزلة. فوق ركوب الدراجات و بواسطة الرنين المغناطيسي النووي، الذي يظهر أيضًا دليلًا على المتبقي في نهاية التفريغ المئة. علاوة على ذلك، فإننا تكشف دراسة NMR لعملية تفريغ الدورة المئوية أن، كما أن المحتجزيتم تقليصه إلىمغناطيسي غير مغناطيسيبيئات تشكلت لم تكن موجودة في العينة المشحونة، مما يدل علىفي الأيونية,
بيئات غنية بالليثيوم. تدعم هذه الأدلة الاستنتاج القائل بأن الفراغات المغلقة التي تتشكل أثناء الدورة تُملأ بـوعند التفريغ بعض منيتم تقليصه إلىالذي يتم إعادة دمجه في الشبكة مع الشحن المعوض المعاد إدخاله (الشكل 6). الطبيعة العازلة لهذهالمناطق التي ستتكون على جدران الفراغ حيث الإلكترونات للتقليليتم تقديم تفسير لسبب صعوبة تقليلفي الفراغات الأكبر.
التظهر بيانات NMR و BET أن جزيئات الكاثود تطور كثافة متزايدة من الفراغات المفتوحة.بقطر عند أسطح الجسيمات أثناء الدورة. هناك أيضًا مجموعة أوسع من الأدلة التي تظهر أن NMC الغني بالليثيوم يعاني من تشقق الجسيمات، والذي كان مرتبطًا عادةً بزيادة إجهاد الشبكة.. معًا، يشير هذا إلى أن الكثافة المتزايدة للفراغات الكبيرة نسبيًا المملوءة بـقد يؤدي التدوير إلى إضعاف الجسيمات وبالتالي كسرها، مما يؤدي إلى إطلاقمن الفراغات المفتوحة أو شبه المفتوحة عند أو بالقرب من أسطح الجسيمات وشرح فقدانها خلال إطلاق الدورة الممتدة (الشكل 6).
الآثار
قمع إصدارحماية السطح بطبقات واقية من الجسيمات تُعرف بأنها استراتيجية فعالة لمنع تدهور السعة في الكاثودات الغنية بالليثيوم، ويمكنها أيضًا تقليل تدهور الجهد إلى حد ما. ومع ذلك، فإن أحد النتائج الرئيسية لدراستنا هو أن الطلاءات السطحية لا يمكن أن تقضي على تدهور الجهد. يجب توجيه الجهود نحو استراتيجيات التخفيف في الكتلة مثل تجنبتشكيل وظهور الفراغات لصالح حالات الثقوب المستقرة على الأكسجين (المرجع 32).
عملية الأكسدة والاختزال للأكسجين، التي تتم من خلال تشكيل وتقليل المحتجزالجزيئات، تصبح أقل انتشارًا عند التدوير. عند الشحن، الـتكون محاصراً في فراغات مغلقة داخل الجسيمات. المحاصريصبح غير نشط كهربائيًا بشكل متزايد لأن زيادة حجم هذه الفراغات المغلقة تجعل نفق الإلكترونات بينوحواف الفراغات أكثر صعوبة. الفراغات عند السطح أو بالقرب منه، بما في ذلك أي أسطح كسر جديدة بسبب تشقق الجسيمات، مفتوحة ويمكن أن تطلق الهواء.. معًا، تؤدي هذان الآليتان إلى فقدان القدرة على الأكسدة والاختزال أثناء الدورة. الفقدان التدريجي لـالمشاركة في تفاعل تعويض الشحنات خلال دورات طويلة تقدم تفسيرًا لظاهرة تلاشي الجهد، والتي تجمع بين ملاحظات إعادة التنظيم الهيكلي، وتكوين الفراغات، وفتح الفراغات، وتقليل المعادن الانتقالية في آلية واحدة. مما يعني أن استراتيجيات التخفيف من تلاشي الجهد يجب أن تركز على الكتلة وكبح تكوين.
المحتوى عبر الإنترنت
أي طرق، مراجع إضافية، ملخصات تقارير Nature Portfolio، بيانات المصدر، بيانات موسعة، معلومات إضافية، شكر وتقدير، معلومات مراجعة الأقران؛ تفاصيل مساهمات المؤلفين والمصالح المتنافسة؛ وبيانات توفر البيانات والرموز متاحة علىhttps://doi.org/10.1038/s41563-024-01833-z.
References
Lu, Z., Beaulieu, L. Y., Donaberger, R. A., Thomas, C. L. & Dahn, J. R. Synthesis, structure, and electrochemical behavior of . J. Electrochem. Soc. 149, A778 (2002).
Dahn, J. R. Layered cathode materials for lithium-ion batteries. Electrochem. Solid-State Lett. 4, 4-8 (2001).
Thackeray, M. M. et al. -stabilized electrodes for lithium-ion batteries. J. Mater. Chem. 17, 3112-3125 (2007).
Johnson, C. S. et al. The significance of the component in ‘composite’ electrodes. Electrochem. Commun. 6, 1085-1091 (2004).
Lu, Z. & Dahn, J. R. Understanding the anomalous capacity of Li/ cells using in situ X-ray diffraction and electrochemical studies. J. Electrochem. Soc. 149, A815 (2002).
Oishi, M. et al. Direct observation of reversible oxygen anion redox reaction in Li -rich manganese oxide, , studied by soft X-ray absorption spectroscopy. J. Mater. Chem. A 4, 9293-9302 (2016).
Koga, H. et al. Reversible oxygen participation to the redox processes revealed for . J. Electrochem. Soc. 160, A786-A792 (2013).
Koga, H. et al. Operando X-ray absorption study of the redox processes involved upon cycling of the Li-rich layered oxide in Li ion batteries. J. Phys. Chem. C 118, 5700-5709 (2014).
Luo, K. et al. Charge-compensation in 3d-transition-metal-oxide intercalation cathodes through the generation of localized electron holes on oxygen. Nat. Chem. 8, 684-691 (2016).
Yabuuchi, N., Yoshii, K., Myung, S. T., Nakai, I. & Komaba, S. Detailed studies of a high-capacity electrode material for rechargeable batteries, . J. Am. Chem. Soc. 133, 4404-4419 (2011).
Ito, A. et al. In situ X-ray absorption spectroscopic study of Li-rich layered cathode material . J. Power Sources 196, 6828-6834 (2011).
Fu, F. et al. Structure dependent electrochemical performance of Li-rich layered oxides in lithium-ion batteries. Nano Energy 35, 370-378 (2017).
Hu, E. et al. Evolution of redox couples in Li- and Mn-rich cathode materials and mitigation of voltage fade by reducing oxygen release. Nat. Energy 3, 690-698 (2018).
Sathiya, M. et al. Origin of voltage decay in high-capacity layered oxide electrodes. Nat. Mater. 14, 230-238 (2015).
Dogan, F. et al. Re-entrant lithium local environments and defect driven electrochemistry of Li- and Mn-rich Li-ion battery cathodes. J. Am. Chem. Soc. 137, 2328-2335 (2015).
Eum, D. et al. Voltage decay and redox asymmetry mitigation by reversible cation migration in lithium-rich layered oxide electrodes. Nat. Mater. 19, 419-427 (2020).
Gent, W. E. et al. Coupling between oxygen redox and cation migration explains unusual electrochemistry in lithium-rich layered oxides. Nat. Commun. 8, 2091 (2017).
Mohanty, D. et al. Investigating phase transformation in the lithium-ion battery cathode during high-voltage hold ( 4.5 V ) via magnetic, X-ray diffraction and electron microscopy studies. J. Mater. Chem. A 1, 6249-6261 (2013).
Xu, B., Fell, C. R., Chi, M. & Meng, Y. S. Identifying surface structural changes in layered Li-excess nickel manganese oxides in high voltage lithium ion batteries: a joint experimental and theoretical study. Energy Environ. Sci. 4, 2223-2233 (2011).
Gu, M. et al. Formation of the spinel phase in the layered composite cathode used in Li-lon batteries. ACS Nano 7, 760-767 (2013).
Mohanty, D. et al. Unraveling the voltage-fade mechanism in high-energy-density lithium-ion batteries: origin of the tetrahedral cations for spinel conversion. Chem. Mater. 26, 6272-6280 (2014).
Wu, Y. et al. Probing the initiation of voltage decay in Li-rich layered cathode materials at the atomic scale. J. Mater. Chem. A 3, 5385-5391 (2015).
Hua, W. et al. Structural insights into the formation and voltage degradation of lithium- and manganese-rich layered oxides. Nat. Commun. 10, 1-11 (2019).
Koga, H. et al. Different oxygen redox participation for bulk and surface: a possible global explanation for the cycling mechanism of . J. Power Sources 236, 250-258 (2013).
Yu, Z. et al. Relationship between voltage hysteresis and voltage decay in lithium-rich layered oxide cathodes. J. Phys. Chem. C 125, 16913-16920 (2021).
Croy, J. R. et al. Examining hysteresis in composite cathode structures. J. Phys. Chem. C 117, 6525-6536 (2013).
Yan, P. et al. Injection of oxygen vacancies in the bulk lattice of layered cathodes. Nat. Nanotechnol. 14, 602-608 (2019).
Csernica, P. M. et al. Persistent and partially mobile oxygen vacancies in Li-rich layered oxides. Nat. Energy 6, 642-652 (2021).
Grenier, A. et al. Nanostructure transformation as a signature of oxygen redox in Li-rich 3d and 4d cathodes. J. Am. Chem. Soc. 143, 5763-5770 (2021).
House, R. A. et al. Covalency does not suppress formation in and Li-rich O-redox cathodes. Nat. Commun. 12, 1-7 (2021).
House, R. A. et al. First cycle voltage hysteresis in Li-rich 3d cathodes associated with molecular trapped in the bulk. Nat. Energy 5, 777-785 (2020).
House, R. A. et al. Superstructure control of first-cycle voltage hysteresis in oxygen-redox cathodes. Nature 577, 502-508 (2020).
Zhu, Z. et al. Gradient Li-rich oxide cathode particles immunized against oxygen release by a molten salt treatment. Nat. Energy 4, 1049-1058 (2019).
Qiu, B. et al. Gas-solid interfacial modification of oxygen activity in layered oxide cathodes for lithium-ion batteries. Nat. Commun. 7, 1-10 (2016).
Yin, W. et al. Structural evolution at the oxidative and reductive limits in the first electrochemical cycle of . Nat. Commun. 11, 1-11 (2020).
Liu, T. et al. Origin of structural degradation in Li-rich layered oxide cathode. Nature 606, 305-312 (2022).
Fraissard, J. & Ito, T. Xe n.m.r. study of adsorbed xenon: a new method for studying zeolites and metal-zeolites. Zeolites 8, 350-361 (1988).
Meersmann, T. & Brunner, E. Hyperpolarized Xenon-129 Magnetic Resonance (The Royal Society of Chemistry, 2015).
Terskikh, V. V. et al. A general correlation for the NMR chemical shift-pore size relationship in porous silica-based materials. Langmuir 18, 5653-5656 (2002).
Dogan, F. et al. Solid state NMR studies of and Li -rich cathode materials: proton insertion, local structure, and voltage fade. J. Electrochem. Soc. 162, A235-A243 (2015).
Gerothanassis, I. P., Momenteau, M. & Loock, B. Hydrogen-bond stabilization of dioxygen, conformation excitation, and autoxidation mechanism in hemoprotein models as revealed by 170 NMR spectroscopy. J. Am. Chem. Soc. 111, 7006-7012 (1989).
Sharifi-Asl, S. et al. Revealing grain-boundary-induced degradation mechanisms in Li-rich cathode materials. Nano Lett. 20, 1208-1217 (2020).
Publisher’s note Springer Nature remains neutral with regard to jurisdictional claims in published maps and institutional affiliations.
Open Access This article is licensed under a Creative Commons Attribution 4.0 International License, which permits use, sharing, adaptation, distribution and reproduction in any medium or format, as long as you give appropriate credit to the original author(s) and the source, provide a link to the Creative Commons licence, and indicate if changes were made. The images or other third party material in this article are included in the article’s Creative Commons licence, unless indicated otherwise in a credit line to the material. If material is not included in the article’s Creative Commons licence and your intended use is not permitted by statutory regulation or exceeds the permitted use, you will need to obtain permission directly from the copyright holder. To view a copy of this licence, visit http://creativecommons. org/licenses/by/4.0/.
(c) The Author(s) 2024
طرق
ترسيب مشترك
تم تحضير السلف بواسطة طريقة الترسيب المشترك.سيغما-ألدريتشسيغما-ألدريتش” و ، Sigma-Aldrich) تم إذابتها في ماء منزوع الأيونات بنسبة مولية 0.13:0.54:0.13 لتحضير محلول بتركيز 1.5 م. بالإضافة إلى ذلك، تم تحضير محلول بتركيز 1.5 م منتم تحضير محلول (ACS reagent، سيغما-ألدريتش). تم إضافة المحاليل قطرة قطرة إلى دورق تحت التحريك المستمر، عند درجة حرارة ثابتة من ودرجة الحموضة 7.6. بعد الإضافة الكاملة لمحلول TM، تم ترك الكوب مغطى طوال الليل مع التحريك. ثم تم غسل الخليط الناتج من الكربونات بالماء المنزوع الأيونات، وتم تصفيته وتجفيفه عند بين عشية وضحاها. ثم تم خلط سلف الكربونات المعدنية المختلطة المجففة مع ( مادة كيميائية من ACS، سيغما-ألدريش) باستخدام نسبة مولية من (Li:TM بمقدار 1:1.5) وتم تسخينها. لمدة 15 ساعة تحت ظروف مستمرة تدفق للحصول على المركب المطلوب. معدل التسخين والتبريد لـتم استخدامه خلال التخليق.تم إعداد العينات المسمّاة بنفس الطريقة باستثناء أن خطوة التكلس النهائية تمت تحت جو محكم.غاز (CortecNetذرة ).
التوصيف الكهروكيميائي
تم تحضير الأقطاب عن طريق دمج المادة الفعالة ( )، سوبر بي كربون ( ) ومواد الربط من بولي تترافلورو إيثيلين ( ) باستخدام المدقة والهاون. ثم تم لف الخليط إلى سمك حوالي لتشكيل أفلام ذاتية الدعم. تم تجميع الأقطاب الكهربائية في خلايا عملة باستخدام فواصل ألياف زجاجية من ووتمان وفي إلكتروليت كربونات الإيثيلين: كربونات ثنائي الميثيل بنسبة 50:50 (درجة بطارية، سيغما-ألدريتش)، مع قطب كهربائي من معدن الليثيوم. تحتوي خلية العملة النموذجية على تحميل كتلة نشطة منتم إجراء اختبار دورة الجلفانستاتيك باستخدام سلسلة Maccor 4000. تم إعداد وتجميع/تفكيك الخلايا والأقطاب في صندوق القفازات تحت جو خامل، وتم إجراء جميع دورات الاختبار لدراسات التوصيف باستخدام نفس الظروف. تم تدوير الخلايا بين 2.0 فولت و 4.8 فولت مقابلبمعدلدون احتفاظ بالجهد، أو فترات راحة، أو دورات تشكيل.
تحليل الطيف الضوئي بالتحليل الطيفي للانبعاث الضوئي باستخدام البلازما المقترنة بالحث
تم إذابة مادة الكاثود النقية في الماء الملكيقبل تخفيف المحلول للقياس. تم إنشاء منحنى المعايرة باستخدام محاليل قياسية. تم إجراء التحليل العنصري باستخدام مطياف الانبعاث الضوئي البلازمي المقترن بالأيونات باستخدام مطياف الانبعاث الضوئي البلازمي المقترن بالأيونات PerkinElmer Optima 7300DV.
PXRD
تم جمع بيانات الحيود على جهاز حيود Rigaku 9 kW SmartLab مزود بمصدر نحاسي ومزود بكاشف Hypix 2D.
ADF-STEM
تم قياس صور ADF-STEM باستخدام ميكروسكوب JEOL ARM 200 F المصحح للانحرافات والذي يعمل عند 200 كيلوفولت. تم استخدام زاوية تقارب نصفية قدرها 22 مللي راديان، مع زاوية جمع نصفية قدرها 69.6164.8 مللي راديان (ADF). تم التقاط مجموعات من الصور متعددة الإطارات بسرعة وتصحيحها من الانجراف وتشوهات المسح باستخدام SmartAlign43. لتجنب التعرض للهواء، تم نقل العينة إلى ميكروسكوب STEM باستخدام حقيبة نقل تحت الفراغ.
RIXS
تم جمع بيانات RIXS عالية الدقة باستخدام خط الشعاع I21 في مصدر الضوء الماسي.لإنتاج مجموعات البيانات للتحليل الكمي، تم تسجيل المسحات عند 531.5 إلكترون فولت في 15 موقع عينة مختلف وتمت متوسطة معًا، مع ملاحظة القليل من عدم التجانس في الإشارة (الشكل البياني الممتد 8). كانت بيانات المسح الخطي من 0.1 إلكترون فولت حتى 13.0 إلكترون فولت، باستثناء الإشارة من القمة المرنة، هي-سجل بواسطة تقسيم كل مسح على الانحراف المعياري الخاص به. ثم، تم دمج المساحة تحت تقدم ذروة الاهتزاز (من 0.13 إلكترون فولت إلى 2.2 إلكترون فولت) لقياس الكمية النسبية لـتم حساب متوسط المساحات لكل مسح لإنشاء مقياس لشدة الأكسجين، مع الأخطاء الناتجة عن الانحراف المعياري للمتوسط لكل مجموعة بيانات.
الحالة الصلبة و
كل و ماستم الانتهاء من الرنين المغناطيسي النووي للحالة الصلبة عند 9.45باستخدام مطياف Bruker Avance III HD ومسبار MAS مزدوج ب bearing هواء بقطر 1.9 مم، حيث هو تردد MAS و هو اللام أو التردد. و الطيف مرجعه إلى و على التوالي، عند 0 جزء في المليون. تم تسجيل جميع الطيف باستخدام جهاز هاهنيكو تسلسل، حيث هو و هو 250 كيلوهرتز؛ يتم معالجة الانحلال الحر الناتج كصدى نصف. الـتم الحصول على الأطياف مع تأخير إعادة التدوير قدره 300 مللي ثانية. تم إكمال هذه الأطياف بأوقات استرخاء قدرها 2 مللي ثانية (استرخاء سريع) و100 مللي ثانية (استرخاء بطيء).
الرنين المغناطيسي النووي الثابت لزينون
تم تفريغ أنبوب NMR من نوع AJ-Young الذي يحتوي على كاثود NMC الغني بالليثيوم تحت فراغ ديناميكي عالي باستخدام مضخة توربينية لمدة 48 ساعة، ثم تم ملؤه بغاز الزينون الطبيعي الوفرة (BOC) عند ضغط 1 ضغط جوي لمدة 48 ساعة.الرنين المغناطيسي النوويتم الانتهاء من الطيف عند 9.45 تسلا (باستخدام مسبار NMR في حالة المحلول بقطر 5 مم عند درجة حرارة مضبوطة تبلغ 298.1 كلفن. تم استخدام نبضة بتردد 25 كيلوهرتز لجميع التجارب مع تأخير إعادة التدوير قدره 0.5 ثانية. جميع الانزياحات مرجعية إلى زينون الطبيعي (غاز، 1 ضغط جوي و298.1 كلفن) عند 0 جزء في المليون.
رهان
تم إجراء تحليل امتصاص/إزالة النيتروجين باستخدام جهاز تحليل الامتصاص Micromeritics 3Flex. تم تجفيف العينات من خلال إزالة الغاز في الموقع عندلمدة 5 ساعات قبل القياس.
توفر البيانات
جميع البيانات التي تم توليدها أو تحليلها خلال هذه الدراسة مدرجة ضمن الورقة وأشكال وبيانات التمديد الخاصة بها. البيانات المصدرية متاحة من المؤلفين المقابلين عند الطلب المعقول.
References
Zhou, K-J. et al. I21: an advanced high-resolution resonant inelastic X-ray scattering beamline at Diamond Light Source. J. Synchrotron Radiat. 29, 563-580 (2022).
Terskikh, V. V., Mudrakovskii, I. L. & Mastikhin, V. M. nuclear magnetic resonance studies of the porous structure of silica gels. J. Chem. Soc. Faraday Trans. 89, 4239-4243 (1993).
شكر وتقدير
P.G.B. مدين لـ EPSRC ومعهد هنري رويز للمواد المتقدمة (EP/ROO661X/1، EP/SO19367/1، EP/RO10145/1 و EP/LO19469/1) ومؤسسة فاراداي (FIRGO16) للدعم المالي. R.A.H. يعترف بالتمويل من الأكاديمية الملكية للهندسة بموجب برنامج زمالة البحث. نحن نشكر مصدر الضوء الماسي على الوقت المخصص في I21 بموجب الاقتراح MM25785.
مساهمات المؤلفين
قام ج.-ج.م. بإجراء أعمال التخليق والتوصيف. قام ج.-ج.م. بإعداد الـ-عينات متسللة، أعدت R.A.H. -عينات موسومة وG.J.R. قام بأداء وتناسب MAS NMR. R.A.H. وJ.-J.M. بالتعاون الوثيق مع S.A. وM.G.-F. وK.-J.Z. أجروا قياسات RIXS. A.W.R. وJ.C. أجريا قياسات ADF-STEM. M.J. قام بإجراء قياسات BET. J.-J.M. وR.A.H. وP.G.B. كتبوا الورقة بمساهمات من جميع المؤلفين.
الشكل البياني الموسع 1 | صور SEM و EDX لـتوزيع العناصر. جزيئات كروية منيمكن رؤية قطر m، بينما تؤكد تحليل العناصر بواسطة EDX توزيعًا متجانسًا للمعادن داخل الحبوب.
الشكل البياني الممتد 2 | بيانات الدورة الكهروكيميائية عند معدلات مختلفة. (أ) بيانات الدورة التي تم جمعها عند معدلات تيار مختلفة تبلغ 100 و و يلاحظ انخفاض مماثل في الجهد (ب) والسعة (ج).
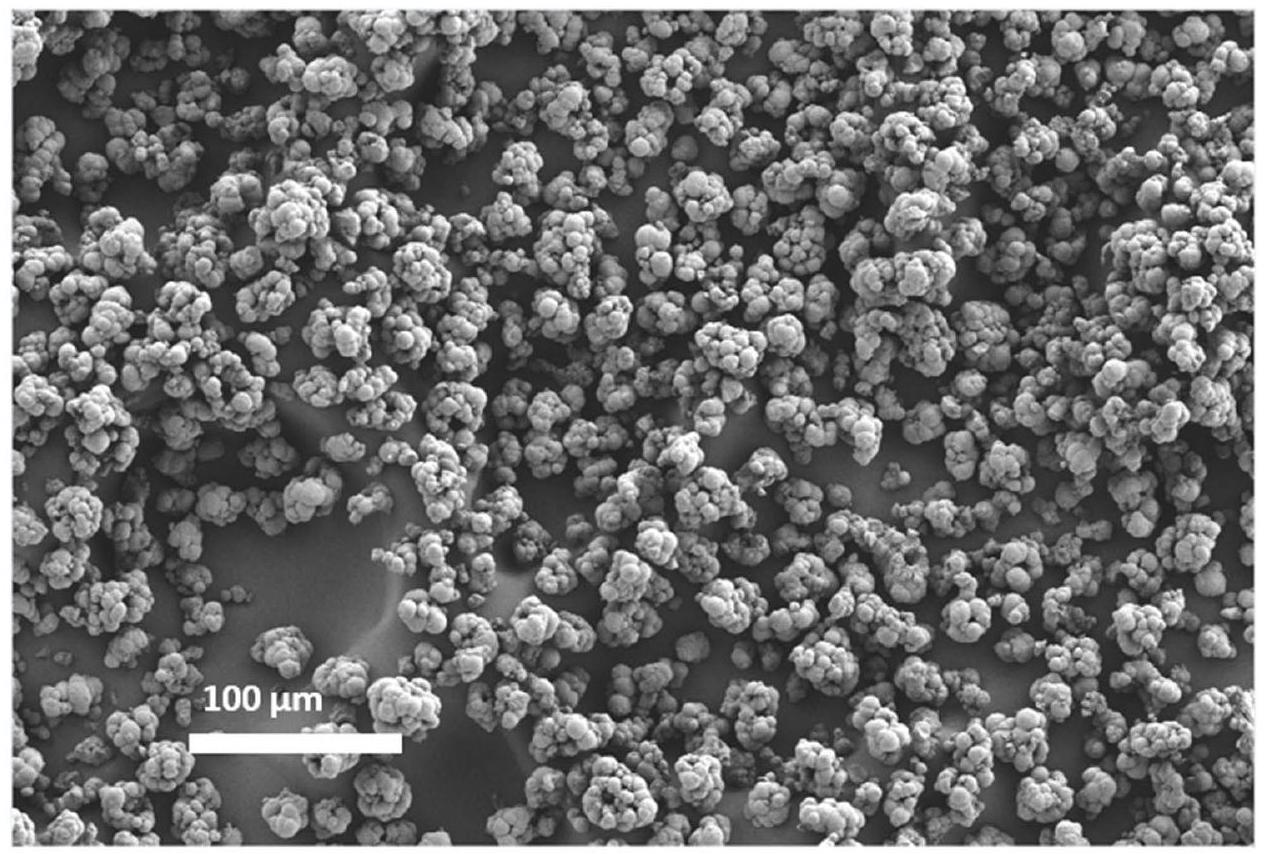
الشكل البياني الموسع 3 | SEM و EDX لمادة الكربونات المعدنية المختلطة. جزيئات كروية منيمكن رؤية القطر في المجهر الإلكتروني الماسح (SEM) ويظهر تحليل الطاقة المشتتة (EDX) توزيعًا متجانسًا للمعادن داخل الحبيبات وبين الجسيمات.
الشكل الإضافي 4 | صور ADF-STEM إضافية. (أ) بحالة نقية، (ب) دورة و (ج) دورة. مرة أخرى، يمكن رؤية طبقات ذرية محددة جيدًا داخل الحبوب في الحالة النقية و الدورات، بينما الصور من تسليط الضوء على وجود الفراغات.
الشكل البياني الموسعصور ADF-STEM للعينات المجمعة بعدالدورات. يتم تحديد الفراغات باللون البرتقالي وتتراوح أبعادها منإلىمن الواضح أن هناك ترابطًا محتملاً بين عدة من هذه الفراغات.
الشكل 6 من البيانات الموسعة |بيانات الرنين المغناطيسي النووي للزينون.بيانات NMR لعنصر Xe في مراحل مختلفة من الدورة جنبًا إلى جنب مع رسم لحجم الفراغ مقابل الإزاحة الكيميائيةحجم الفراغ الأدنى في العينات حوالي، كما تم أخذه من انزياح كيميائي أقصى قدره 50 جزء في المليون.
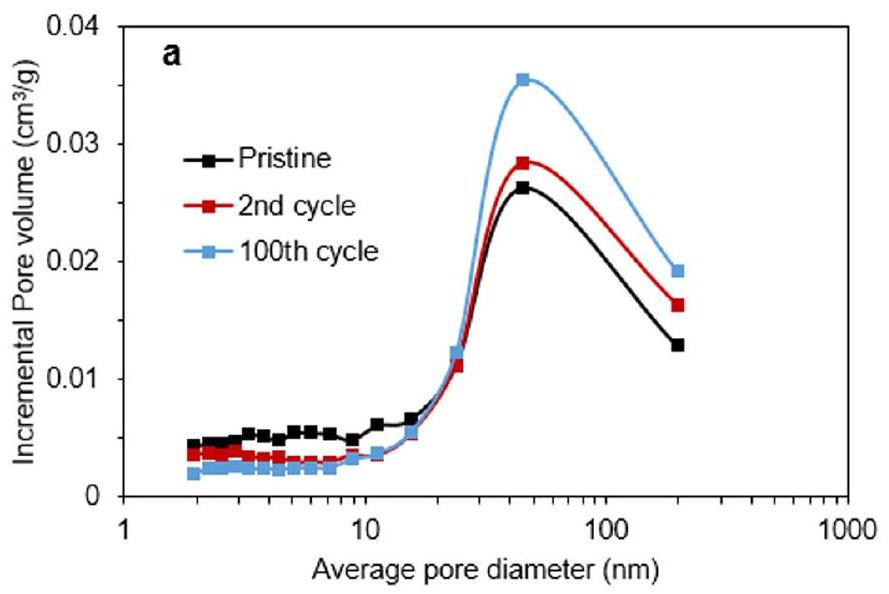
الشكل البياني الموسعبيانات BET. (أ) بيانات BET التي تظهر توزيعات حجم المسام للعينة النقية،دورة وعينات الدورة. لإزالة المساهمة من الكربون والرباط التي كانت موجودة في جميع العينات، تم طرح البيانات النقية من و تدوير البيانات لمراقبة التغيرات في مسامية جزيئات الكاثود بشكل أفضل، (ب).
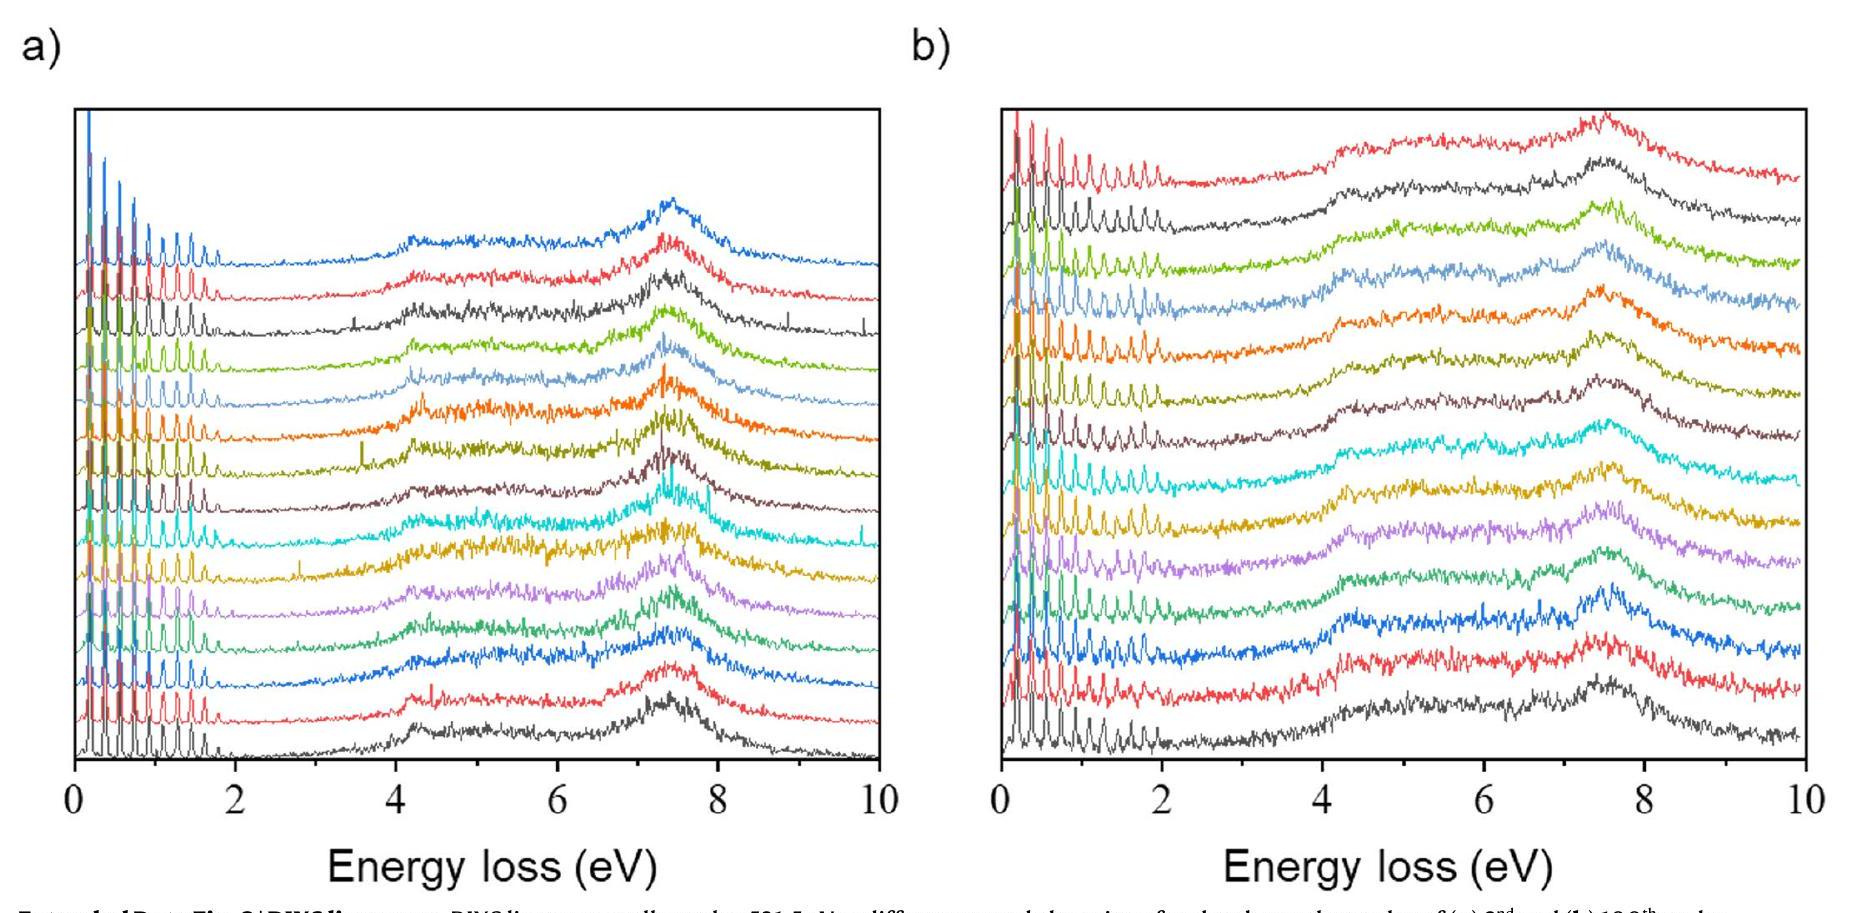
الشكل البياني الممتد 8 | مسح خطوط RIXS. تم جمع مسحات خطوط RIXS عند 531.5 eV في مواقع عينة مختلفة للعينات المشحونة من (أ) و (ب) دورات.
البيانات الموسعة الجدول 1 | بيانات ICP-OES لـ
لي
من
كو
ني
البيانات الموسعة الجدول 2 | معلمات تحسين ريتفيلد لبيانات حيود الأشعة السينية المسحوقة لـ
ذرة
مراكز وايكوف
x
ي
ز
الإشغال
ليام
3a
0.0
0.0
0.0
0.99
0.0240(1)
3أ
0.0
0.0
0.0
0.01
0.0121(1)
3ب
0.0
0.0
0.5
0.21
0.0241(1)
3ب
0.0
0.0
0.5
0.12
0.0122(1)
كو
3ب
0.0
0.0
0.5
0.13
0.0122(1)
من
3ب
0.0
0.0
0.5
0.54
0.0122(1)
أو
6c
0.0
0.0
0.2405(1)
1.0
0.0241(1)
مجموعة الفضاء R3-m،
قسم المواد، جامعة أكسفورد، أكسفورد، المملكة المتحدة.مؤسسة فاراداي، ديدكوت، المملكة المتحدة.مصدر ضوء الماس، ديدكوت، المملكة المتحدة. قسم الكيمياء، جامعة أكسفورد، أكسفورد، المملكة المتحدة.البريد الإلكتروني: robert.house@materials.ox.ac.uk; peter.bruce@materials.ox.ac.uk
Oxygen redox cathodes, such as , deliver higher energy densities than those based on transition metal redox alone. However, they commonly exhibit voltage fade, a gradually diminishing discharge voltage on extended cycling. Recent research has shown that, on the first charge, oxidation of ions forms molecules trapped in nano-sized voids within the structure, which can be fully reduced to on the subsequent discharge. Here we show that the loss of O -redox capacity on cycling and therefore voltage fade arises from a combination of a reduction in the reversibility of the redox process and loss. The closed voids that trap grow on cycling, rendering more of the trapped electrochemically inactive. The size and density of voids leads to cracking of the particles and open voids at the surfaces, releasing . Our findings implicate the thermodynamic driving force to form as the root cause of transition metal migration, void formation and consequently voltage fade in Li-rich cathodes.
Li-rich cathodes can deliver higher capacities than stoichiometric cathodes (up to versus for ), supported by the participation of both transition metal (TM) redox and O-redox . However, the average voltage of the first discharge ( ) gradually diminishes and the load curve develops a step-like profile as the material is cycled. This ‘voltage fade’ phenomenon leads to a continuous loss of energy density over cycling, a disadvantage for commercialization of these materials.
One well-studied aspect of voltage fade is the gradual change in the redox reactions on the TMs. Over the first cycle, and are accepted to be the primary TM redox reactions in , with Mn remaining predominantly +4 (refs. 6-9). Over cycling, several studies have reported the increasing participation of low voltage (refs. 10-12) and more recently (ref. 13). Such pronounced TM reduction is also more generally observed across a range of and cathodes and has been linked with irreversible out-of-plane TM migration and voltage fade . While it appears that the increasing contribution of lower-voltage TM redox couples accompanies voltage fade, so far the underlying cause of voltage fade remains unclear.
A reduction in diffusivity on cycling, induced by, for example, structure disordering to form spinel or rocksalt-like surface layers , could lead to a reduction in discharge voltage under the normal conditions of galvanostatic cycling between fixed voltage limits. However, such a reduction would be a kinetic overpotential. Galvanostatic intermittent titration technique measurements have shown that the voltage fade is predominantly not due to a larger overpotential, but is rather a thermodynamic voltage loss . In terms of structural changes, previous studies have shown that the bulk structural reconfiguration is even more severe than the surface. The formation of nanopores has been identified in cycled materials by scanning transmission electron microscopy (STEM) and three-dimensional tomography , and He pycnometry measurements have revealed a gradual decrease in the material density with cycling . Chapman and co-workers also identified the growth of nanopores within the bulk on cycling with small-angle X-ray scattering (SAXS) measurements, but X-ray pair distribution function measurements could not determine whether they were filled or empty . We showed recently, across a range of O -redox compounds, including , that oxidation results
in the formation of molecular that is primarily trapped in small voids in the bulk of these materials and can be reduced back to on discharge . Following directly the fate of this over cycling is critical to understanding the growth of nanopores and ultimately to explaining the origin of voltage fade.
In this Article, we follow directly and measure quantitatively the trapped over cycling using high-resolution resonant inelastic X-ray scattering (RIXS) spectroscopy. We show that the amount of trapped formed on charge gradually diminishes over cycling and that the trapped that is formed is increasingly difficult to reduce back to on discharge. As the voids containing grow, nuclear magnetic resonance (NMR) data indicate thicker regions of insulating form on the void surfaces, consistent with the becoming increasingly difficult to reduce. Xe NMR and Brunauer-Emmett-Teller (BET) reveal increasing amounts of open voids at or near the surfaces over cycling, suggesting that as the voids grow large and the particle microstructure weakens, the particles crack releasing . Together, the accumulation of electrochemically inactive in the particles and release of from the opening of voids near the surface leads to reduction in the O -redox capacity. The loss of redox capacity, which occurs primarily at potentials greater than 3 V , explains the observed voltage fade.
Voltage fade characteristics in
Samples of were prepared by a co-precipitation synthesis (Methods). The composition was checked by inductively coupled plasma optical emission spectroscopy (Extended Data Table1) and energy-dispersive X-ray spectroscopy (Extended Data Figs. 1 and 2), morphology by scanning electron microscopy (Extended Data Figs. 1 and 2) and structure by powder X-ray diffraction (PXRD; Fig. 1b and Extended Data Table 2). The structure of involves O 3 -type stacking of the oxide layers, with a honeycomb arrangement of the TM and Li ions in the TM layer (Fig. 1a). The electrochemical load curves from the 1st to the 100th cycle are plotted in Fig. 1c. After the voltage plateau seen on the first charge, the load curve develops a continuous, sloping voltage profile. We have shown that this dramatic change is accompanied by the irreversible loss of honeycomb ordering to form vacancy clusters driven by the formation of molecular (ref.31). By the end of the first cycle, there is little evidence of the honeycomb superstructure peaks remaining in PXRD and negligible signal intensity to monitor over extended cycling. For this reason, the superstructure peaks were not included in our refinements here. From the 2nd to the 100th cycle, the load curve undergoes further changes, with a higher proportion of capacity at lower voltage on discharge, that is, voltage fade (Fig. 1c). This lowering of the average discharge voltage from the 2nd to the 100th cycle follows the same trend as previous reports of voltage fade on similar compounds . A degree of capacity fade is also observed, similar to previously reported materials prepared in the same way . Cycling was performed at a rate of throughout the study. To confirm the voltage and capacity fade observed do not arise from kinetic limitations, cycling data were also collected at a lower rate of over 100 cycles (Extended Data Fig. 2). These data show a very similar degree of voltage and capacity fade, confirming that these phenomena arise from bulk thermodynamic properties rather than kinetics.
Redox changes on cycling
We showed previously, using high-resolution RIXS and NMR, that molecular is formed during oxidation in Li -rich cathodes . To follow the changes in the amount of molecular that is formed on cycling, we employed quantitative high-resolution RIXS at the OK edge. In the high resolution RIXS spectra, there are two main features associated with molecular : an energy loss feature at , and a series of vibrational progression peaks propagating from the elastic RIXS peak at 0 eV . To track the relative amount of , the area under the vibrational
Fig. 1 | Structural characterization and electrochemical data for with a layered structure, in-plane ordering of and giving rise to the honeycomb superstructure ordering. Li atoms are represented in blue, TM in purple and oxygen in red.b, PXRD data and refinement to the R3-m crystal structure.c, Load curves for , cycled between 2.0 V and 4.8 V at 100 mAg g for 100 cycles.
progression peaks (from 0.125 eV to 2.2 eV ) was integrated. This feature was chosen as the peak intensity arises solely from molecular , with no contribution from the oxide ions. The analysis used to determine the amount of over cycling is described in more detail in Methods.
For this study, was charged to specific points along the 2nd and 100th cycles, representing quarter charge (QC), half charge (HC), three-quarter charge (3QC), full charge (FC), quarter discharge (QD), half discharge (HD), three-quarter discharge (3QD) and full discharge (FD) (Fig. 2a,d). These points were defined on a fractional capacity basis of the total charge/discharge capacities of the 2nd and 100th cycles accordingly. At each state of charge, multiple RIXS scans were taken across different sample locations to minimize any effect of sample inhomogeneity, although we note there was little difference between the spectra (Extended Data Fig. 8). These scans were then averaged and plotted for both the 2nd and 100th cycles (Fig. 2b,e). The integrated signal intensity under the vibrational progression peaks was plotted as a function of charge and discharge (Fig. 2c,f).
We observed substantial differences in oxygen activity over cycling. Throughout the charging process on the second cycle, the amount of is seen to increase continuously over the full voltage range, which is mirrored by the decrease in over the subsequent discharge (Fig. 2c). In contrast, while the 100th charge appears to show a continuous increase in , on discharge reduction to occurs between the FD and HD points on the load curve. The HD point is at , suggesting that the redox couple is primarily active above 3 V on discharge, leaving the remainder of the discharge capacity to TM reduction. This accords with other studies reporting an increased contribution of lower-voltage and redox couples after cycling . While the majority of the is observed to be reduced above 3 V , a small amount may be reduced at lower voltages.
The intensity of the oxygen signal was tracked as a function of cycle number at FC and full discharge (Fig. 3). The data in Fig. 3 reveal an overall loss in the total amount of trapped in the charged cathodes over cycling, with a loss from the 2nd FC to the 100th FC. Furthermore, the amount of remaining at the end of discharge appears to increase from the 2nd to the 100th cycle (Fig. 3). The accumulation of at the
Fig. 2 | Evolution in bulk 0 -redox activity over 2 nd and 100 th cycles. a, d, Load curves for the and 100th (d) cycles for , with the states of charge studied. b,e, RIXS spectra at 531.5 eV collected over the 2nd (b) and 100th (e) cycles. c,f, Variation in intensity of the molecular signal in
the RIXS spectra over the 2 nd (c) and 100th (f) cycles, as determined by principal component analysis (Methods). Data are presented as mean standard deviation with a sample size of 15. P, pristine.
end of discharge signals that the trapped is becoming increasingly electrochemically inactive. Taking the difference between the at the end of charge and discharge reveals that the amount of O-redox capacity diminishes from per formula unit on the 2nd cycle to per formula unit on the 100th cycle. As a percentage of the total charge passed O-redox diminishes from on the 2nd cycle to on the 100th cycle, the balance of the capacity being made up by TM redox. The loss of O-redox capacity on cycling arises in part from the formation of electrochemically inactive that is still trapped but cannot be reduced on each cycle but also from the overall loss of from the particles, reflected in the loss of at the end of charge after 100 cycles (Fig. 3). The remaining active O -redox capacity on the 100th cycle ( per formula unit) aligns with the charge passed between FC and HD, that is, the charge passed above 3 V . Overall the loss of O-redox activity, through a combination of electrochemically inactive and release of from the particles, can account for the
Fig. 3 | Evolution in amount of trapped over cycling. Variation in intensity of the molecular signal from RIXS over cycling in the fully charged (FC) and fully discharged (FD) states. The amount of formed in the charged materials decreases with cycling and there is increasing evidence of that is not reduced on discharge. Data are presented as mean standard deviation with a sample size of 15 .
The orange region highlighted indicates the presence of open voids of 17 nm diameter and greater after 100 cycles. , isotropic chemical shift.fg, and (g) NMR isolating slow and fast relaxing environments. The sharp peaks at 0 ppm in the and slow relaxing NMR spectra indicate the formation of large diamagnetic Li-rich regions on extended cycling.
Fig. 4 | Formation of voids and large diamagnetic Li-rich regions over cycling. , ADF-STEM images showing single grains of the pristine (a), 2nd discharge (b) and 100th discharge (c) material showing the formation of voids about in diameter over extended cycling. d, NMR experiments. Samples were extracted from cells and infiltrated with Xe gas to probe the open porosity. e, Xe NMR of the pristine, 2nd discharge and 100th discharge materials.
reduced contribution of charge above 3 V , leading to voltage fade and much of the capacity loss on cycling .
Void formation on cycling
To examine the origin of the diminishing extent of formation and reduction with cycling, annular dark field (ADF)-STEM imaging was carried out to probe changes in the particle microstructure. The images shown in Fig. 4a-c and Extended Data Figs. 4 and 5 illustrate substantial changes within individual grains of after 100 cycles, consistent with previous reports identifying void formation and growth using SAXS, STEM and three-dimensional tomography . Comparing the images for the pristine and 2nd discharge with the 100th discharge clearly shows the development of very extensive voiding with a high density of voids, as seen by the darker areas. The voids vary from about in size and appear to be distributed throughout the particle. Given the high density of voids it is likely that a number of these voids are interconnected leading to pores of larger dimensions than is apparent from STEM.
To investigate the extent to which the voids are closed or open, Xe NMR was used. Xenon-129 ( ) is an inert gas with a large polarizable electron cloud, giving xenon a wide chemical shift range . When is constrained within a void, it comes into contact with the surface of the void causing the electron cloud to be distorted and a chemical shift to be observed . This shift has a well-known relationship with void size that has been experimentally determined, described in Extended Data Fig. 6 (ref. 39). was first degassed under
dynamic high vacuum for 48 h to evacuate the sample, before being flushed with xenon gas (Fig. 4d). The xenon spectra for samples of the pristine, 2nd and 100th discharge material in Fig. 4e all show resonances centred at , consistent with bulk xenon gas being paramagnetically broadened due to interactions with the surface of the cathode material. The signal could arise from large ( ) open pores at the surface, although no such pores are evident in the ADF-STEM. After 100 cycles, increased spectral density between 20 ppm and 50 ppm is observed in the Xe NMR spectra. This signal is not present in the pristine or second cycled material, meaning new open voids with a minimum size of 17 nm are forming (Fig. 4e). This new signal would not arise if had been lost directly from the surface, only Xe atoms in a partially confined pore open to the surface experience a chemical shift and so there must be increased surface porosity. These NMR observations are supported by BET measurements which also show there is an increase in the number of open pores at the surface, in diameter between the 2nd and 100th cycles (Extended Data Fig. 7). The somewhat larger pore sizes from NMR and BET are consistent with some of the pores seen in STEM being interconnected and hence larger than the STEM images suggest.
The contents of the closed voids
In addition to the and solid-state magic angle spinning (MAS) NMR were used to investigate changes over cycling. The solid-state MAS NMR of the pristine material (Fig. 4f) shows two regions of resonances; the resonance that arises from Li in the TM layer is at
Fig. 5 | Partial reduction of trapped in voids to form Li -coordinated on the 100th discharge. a,b, NMR spectra isolating fast (a) and slow (b) relaxing environments. The sharp peaks in are assigned to trapped molecular , which decrease in intensity on discharge. There is still evidence of some residual molecular in the discharged sample, . In the slow relaxation is dominated by oxide environments coordinated to
paramagnetic TM ions (TM-O ), . After discharge, a new environment is formed corresponding to oxide surrounded by Li (that is, ) created by the reduction of in the voids and reinsertion of into the voids coordinated by the , centred at , relaxation delay. c, Large voids accommodating are partially repopulated by on discharge. Most is reduced to but some residual remains. and is consistent with well-defined honeycomb ordering, and those between 400 ppm and 900 ppm are from Li in the alkali metal layers . After two cycles, broadening of the signal and substantial shift in the centre of gravity of the resonance (from to ) is observed, consistent with local disordering of the cathode and clustering of Li into more diamagnetic regions with a reduced number of TM neighbours, these changes have been discussed previously . After 100 cycles, a notable sharp resonance at 0 ppm is observed that is consistent with Li in an extended diamagnetic environment.
The corresponding O MAS NMR spectra (Fig. 4 g ) of the pristine material show a broad amorphous line shape with very limited resolution. This is attributed to a range of oxide-ion environments that are broadened due to paramagnetic interactions. After 100 cycles at the end of discharge, the spectral density of the resonance has shifted to a slightly higher frequency, suggesting TM-rich regions are forming, that is, where the oxide ions are coordinated by several TM ions ( ). There is also evidence of the formation of a peak at . These O atoms exhibit a similar diamagnetic chemical shift in the NMR spectrum to lithia, . As trapped is reduced back to , the ions reinserted into the particles surround the resulting in the nanoscopic regions of (refs. 31,41). This is consistent with the 100th cycle spectrum and can be attributed to the formation of Li -rich regions in the cathode ( and ). Together, the and NMR suggests that the materials segregates into regions of highly paramagnetic TM-rich and diamagnetic Li-rich clusters over extended cycling.
To probe for molecular over the 100th cycle using ONMR, fast relaxing spectra( 2 ms ), compared with those discussed above( 100 ms ), were collected to selectively enhance the oxygens which experience substantial paramagnetic relaxation enhancement. molecules, possessing two unpaired electrons, are expected to have a much stronger paramagnetic relaxation enhancement than oxides. The data (Fig. 5)
show a well-defined chemical environment centred at , where is the chemical shift centre of gravity, with a manifold of spinning sidebands, consistent with previous measurements of trapped molecular (refs. 31,42). A decrease in the intensity of the resonance can be seen between the 100 th charge and discharge as the is reduced to ; however, there is evidence of some residual present in the 100th discharged sample. These results are in accord with our RIXS measurements (Figs. 2 and 3 ) and indicate that is only partially reduced over the 100th cycle. The corresponding slow relaxing spectra (Fig. 5b) reveal that the diamagnetic peak arising from surrounded predominantly by , is completely absent in the 100th charge sample. This evidence supports the conclusion that the closed voids seen in ADF-STEM are filled with and that upon discharge this oxygen is partially reincorporated into the lattice as in ionic Li-rich regions (Fig. 5c), accompanied by the reinsertion of ions into the void space coordinated by the , as we have described previously .
loss and residual trapped explain voltage fade
We showed recently, using high-resolution RIXS and NMR, that on the first cycle of the O -redox material, is oxidized to with the loss of honeycomb TM ordering and formation of small vacancy clusters trapping the molecules distributed throughout the particle. The formation of trapped occurs quickly on charging as evidenced by the lack of electron-hole states on the sublattice. By the end of the first cycle, the trapped is completely reduced back to , accounting for the reversible O -redox capacity.
The results presented here show that, on subsequent cycling, the O-redox mechanism is not static and continues to evolve, although more gradually. On cycling, there is increasing accumulation of at the end of discharge (Fig. 3), indicating that not all formed on charge is reduced on the subsequent discharge, that is, there is a decrease
leads to agglomeration and coarsening of clusters into larger voids driven by the formation of more . The large voids and their high density in the particles lead to a weakening of the latter, cracking and release. It is also more difficult to reduce in larger voids.
Fig. 6 | Voltage fade mechanism. a,b, Second cycle: reversible O-redox involves the formation of molecular trapped in small vacancy clusters throughout the particle. molecules are fully reduced to on discharge forming small diamagnetic Li-rich regions. c,d, One-hundreth cycle: further TM migration
in the reversibility of the transformation. The decrease in the amount of trapped at the top of charge also signals a loss of from the particles. Together, the loss of and the decreasing reversibility of the transformation lead to a loss of per formula unit in O-redox capacity, corresponding to a reduction in the percentage of the capacity due to O-redox from on the 2nd cycle to on the 100th cycle. As the couple occurs above 3 V , the loss of O-redox capacity at the expense of a higher proportion of TM capacity leads to the overall voltage loss on cycling. The decrease in the reversible O-redox capacity is also commensurate with the capacity fading on cycling, that is, the capacity loss on cycling is associated with reduction in the O-redox activity at the higher voltages and a lower average voltage.
Accompanying the loss of O-redox capacity, Li-rich materials exhibit pronounced changes in the cathode particle microstructure. There have already been a number of reports of voids forming on cycling in using STEM, ptychography and
small-angle scattering . Voids also manifest as a reduction in average particle density, which has been recently observed . Our ADF-STEM images (Fig. 4a-c and Extended Data Figs. 4 and 5) provide additional evidence for this, showing voids develop that are about in diameter within individual particles after 100 cycles. Previous studies proposed void formation on the first charge corresponding to a few vacant cation sites and therefore approximately 1 nm in diameter, implying the voids grow on cycling. Reduction of trapped in these larger voids is expected to be more difficult than in the much smaller voids present on the first and second cycles. This is in accord with the RIXS observations at the end of discharge showing increasing amounts of unreduced over cycling and by NMR, which also shows evidence of residual at the end of the 100th discharge. Furthermore, our O NMR study of the 100th cycle discharge process reveals that, as the trapped is reduced to , diamagnetic environments form that were not present in the charged sample, indicative of in ionic,
Li-rich environments. This evidence further supports the conclusion that the closed voids formed on cycling are filled with and that on discharge some of the is reduced to , which is reincorporated into the lattice along with the charge compensating reinserted (Fig. 6). The insulating nature of these regions that will form on the walls of the void where the electrons to reduce on discharge are supplied offers an explanation for why it is increasingly difficult to reduce in larger voids.
The NMR and BET data show that the cathode particles develop increased density of open voids in diameter at the particle surfaces on cycling. There is also a wider body of evidence showing that Li-rich NMC suffers from particle cracking, which had commonly been associated with increased lattice strain . Together this suggests that the increased density of relatively large voids filled with upon cycling may result in weakening and hence fracturing of the particles, releasing from open or partially open voids at or near the surfaces of the particles and explaining its loss on extended cycling release (Fig. 6).
Implications
Suppressing the release of from particles by protecting the surface with coatings is known to be an effective strategy to prevent capacity fade in Li-rich cathodes and it can also suppress voltage fade to an extent. However, a key implication of our study is that surface coatings cannot eliminate voltage fade. Efforts must be directed towards bulk mitigation strategies such as avoiding formation and the appearance of voids in favour of stabilised hole states on O (ref. 32).
The oxygen redox process, which proceeds by the formation and reduction of trapped molecules, becomes less prevalent on cycling . On charging, the formed is trapped in closed voids within the particles. The trapped becomes increasingly electrochemically inactive because the growth in size of these closed voids makes electron tunnelling between the and the void edges more difficult. The voids at or near the surface, including any new fracture surfaces due to particle cracking, are open and can vent . Together these two mechanisms result in the loss of O-redox capacity on cycling. The gradual loss of participating in the charge compensation reaction over extended cycling offers an explanation for the voltage fade phenomenon which draws together the observations of structural reorganisation, void formation, void opening and TM reduction into a single mechanism. The implication is that voltage fade mitigation strategies should focus on the bulk and suppressing the formation of .
Online content
Any methods, additional references, Nature Portfolio reporting summaries, source data, extended data, supplementary information, acknowledgements, peer review information; details of author contributions and competing interests; and statements of data and code availability are available at https://doi.org/10.1038/s41563-024-01833-z.
References
Lu, Z., Beaulieu, L. Y., Donaberger, R. A., Thomas, C. L. & Dahn, J. R. Synthesis, structure, and electrochemical behavior of . J. Electrochem. Soc. 149, A778 (2002).
Dahn, J. R. Layered cathode materials for lithium-ion batteries. Electrochem. Solid-State Lett. 4, 4-8 (2001).
Thackeray, M. M. et al. -stabilized electrodes for lithium-ion batteries. J. Mater. Chem. 17, 3112-3125 (2007).
Johnson, C. S. et al. The significance of the component in ‘composite’ electrodes. Electrochem. Commun. 6, 1085-1091 (2004).
Lu, Z. & Dahn, J. R. Understanding the anomalous capacity of Li/ cells using in situ X-ray diffraction and electrochemical studies. J. Electrochem. Soc. 149, A815 (2002).
Oishi, M. et al. Direct observation of reversible oxygen anion redox reaction in Li -rich manganese oxide, , studied by soft X-ray absorption spectroscopy. J. Mater. Chem. A 4, 9293-9302 (2016).
Koga, H. et al. Reversible oxygen participation to the redox processes revealed for . J. Electrochem. Soc. 160, A786-A792 (2013).
Koga, H. et al. Operando X-ray absorption study of the redox processes involved upon cycling of the Li-rich layered oxide in Li ion batteries. J. Phys. Chem. C 118, 5700-5709 (2014).
Luo, K. et al. Charge-compensation in 3d-transition-metal-oxide intercalation cathodes through the generation of localized electron holes on oxygen. Nat. Chem. 8, 684-691 (2016).
Yabuuchi, N., Yoshii, K., Myung, S. T., Nakai, I. & Komaba, S. Detailed studies of a high-capacity electrode material for rechargeable batteries, . J. Am. Chem. Soc. 133, 4404-4419 (2011).
Ito, A. et al. In situ X-ray absorption spectroscopic study of Li-rich layered cathode material . J. Power Sources 196, 6828-6834 (2011).
Fu, F. et al. Structure dependent electrochemical performance of Li-rich layered oxides in lithium-ion batteries. Nano Energy 35, 370-378 (2017).
Hu, E. et al. Evolution of redox couples in Li- and Mn-rich cathode materials and mitigation of voltage fade by reducing oxygen release. Nat. Energy 3, 690-698 (2018).
Sathiya, M. et al. Origin of voltage decay in high-capacity layered oxide electrodes. Nat. Mater. 14, 230-238 (2015).
Dogan, F. et al. Re-entrant lithium local environments and defect driven electrochemistry of Li- and Mn-rich Li-ion battery cathodes. J. Am. Chem. Soc. 137, 2328-2335 (2015).
Eum, D. et al. Voltage decay and redox asymmetry mitigation by reversible cation migration in lithium-rich layered oxide electrodes. Nat. Mater. 19, 419-427 (2020).
Gent, W. E. et al. Coupling between oxygen redox and cation migration explains unusual electrochemistry in lithium-rich layered oxides. Nat. Commun. 8, 2091 (2017).
Mohanty, D. et al. Investigating phase transformation in the lithium-ion battery cathode during high-voltage hold ( 4.5 V ) via magnetic, X-ray diffraction and electron microscopy studies. J. Mater. Chem. A 1, 6249-6261 (2013).
Xu, B., Fell, C. R., Chi, M. & Meng, Y. S. Identifying surface structural changes in layered Li-excess nickel manganese oxides in high voltage lithium ion batteries: a joint experimental and theoretical study. Energy Environ. Sci. 4, 2223-2233 (2011).
Gu, M. et al. Formation of the spinel phase in the layered composite cathode used in Li-lon batteries. ACS Nano 7, 760-767 (2013).
Mohanty, D. et al. Unraveling the voltage-fade mechanism in high-energy-density lithium-ion batteries: origin of the tetrahedral cations for spinel conversion. Chem. Mater. 26, 6272-6280 (2014).
Wu, Y. et al. Probing the initiation of voltage decay in Li-rich layered cathode materials at the atomic scale. J. Mater. Chem. A 3, 5385-5391 (2015).
Hua, W. et al. Structural insights into the formation and voltage degradation of lithium- and manganese-rich layered oxides. Nat. Commun. 10, 1-11 (2019).
Koga, H. et al. Different oxygen redox participation for bulk and surface: a possible global explanation for the cycling mechanism of . J. Power Sources 236, 250-258 (2013).
Yu, Z. et al. Relationship between voltage hysteresis and voltage decay in lithium-rich layered oxide cathodes. J. Phys. Chem. C 125, 16913-16920 (2021).
Croy, J. R. et al. Examining hysteresis in composite cathode structures. J. Phys. Chem. C 117, 6525-6536 (2013).
Yan, P. et al. Injection of oxygen vacancies in the bulk lattice of layered cathodes. Nat. Nanotechnol. 14, 602-608 (2019).
Csernica, P. M. et al. Persistent and partially mobile oxygen vacancies in Li-rich layered oxides. Nat. Energy 6, 642-652 (2021).
Grenier, A. et al. Nanostructure transformation as a signature of oxygen redox in Li-rich 3d and 4d cathodes. J. Am. Chem. Soc. 143, 5763-5770 (2021).
House, R. A. et al. Covalency does not suppress formation in and Li-rich O-redox cathodes. Nat. Commun. 12, 1-7 (2021).
House, R. A. et al. First cycle voltage hysteresis in Li-rich 3d cathodes associated with molecular trapped in the bulk. Nat. Energy 5, 777-785 (2020).
House, R. A. et al. Superstructure control of first-cycle voltage hysteresis in oxygen-redox cathodes. Nature 577, 502-508 (2020).
Zhu, Z. et al. Gradient Li-rich oxide cathode particles immunized against oxygen release by a molten salt treatment. Nat. Energy 4, 1049-1058 (2019).
Qiu, B. et al. Gas-solid interfacial modification of oxygen activity in layered oxide cathodes for lithium-ion batteries. Nat. Commun. 7, 1-10 (2016).
Yin, W. et al. Structural evolution at the oxidative and reductive limits in the first electrochemical cycle of . Nat. Commun. 11, 1-11 (2020).
Liu, T. et al. Origin of structural degradation in Li-rich layered oxide cathode. Nature 606, 305-312 (2022).
Fraissard, J. & Ito, T. Xe n.m.r. study of adsorbed xenon: a new method for studying zeolites and metal-zeolites. Zeolites 8, 350-361 (1988).
Meersmann, T. & Brunner, E. Hyperpolarized Xenon-129 Magnetic Resonance (The Royal Society of Chemistry, 2015).
Terskikh, V. V. et al. A general correlation for the NMR chemical shift-pore size relationship in porous silica-based materials. Langmuir 18, 5653-5656 (2002).
Dogan, F. et al. Solid state NMR studies of and Li -rich cathode materials: proton insertion, local structure, and voltage fade. J. Electrochem. Soc. 162, A235-A243 (2015).
Gerothanassis, I. P., Momenteau, M. & Loock, B. Hydrogen-bond stabilization of dioxygen, conformation excitation, and autoxidation mechanism in hemoprotein models as revealed by 170 NMR spectroscopy. J. Am. Chem. Soc. 111, 7006-7012 (1989).
Sharifi-Asl, S. et al. Revealing grain-boundary-induced degradation mechanisms in Li-rich cathode materials. Nano Lett. 20, 1208-1217 (2020).
Publisher’s note Springer Nature remains neutral with regard to jurisdictional claims in published maps and institutional affiliations.
Open Access This article is licensed under a Creative Commons Attribution 4.0 International License, which permits use, sharing, adaptation, distribution and reproduction in any medium or format, as long as you give appropriate credit to the original author(s) and the source, provide a link to the Creative Commons licence, and indicate if changes were made. The images or other third party material in this article are included in the article’s Creative Commons licence, unless indicated otherwise in a credit line to the material. If material is not included in the article’s Creative Commons licence and your intended use is not permitted by statutory regulation or exceeds the permitted use, you will need to obtain permission directly from the copyright holder. To view a copy of this licence, visit http://creativecommons. org/licenses/by/4.0/.
(c) The Author(s) 2024
Methods
Co-precipitation synthesis
precursors were prepared by a coprecipitation route. , Sigma-Aldrich , Sigma-Aldrich) and , Sigma-Aldrich) were dissolved in de-ionized water with a molar ratio of 0.13:0.54:0.13 to prepare a 1.5 M solution. In addition, a 1.5 M solution of , ACS reagent, Sigma-Aldrich) was prepared. The solutions were added dropwise into a beaker under continuous stirring, at a constant temperature of and pH 7.6. After full addition of the TM solution, the beaker was left covered overnight under stirring. The resulting carbonate mix was then washed with de-ionized water, filtered and dried at overnight. The dried mixed metal carbonate precursor was then mixed with ( , ACS reagent, Sigma-Aldrich) using a mole ratio of (Li:TM of 1:1.5) and calcined at for 15 h under continuous flow to obtain the desired compound. A heating and cooling rate of was used during the synthesis. -labelled samples were prepared in the same way except the final calcination step was performed under a sealed atmosphere of gas (CortecNet atom ).
Electrochemical characterization
The electrodes were prepared by combining the active material ( ), Super P carbon ( ) and polytetrafluoroethylene binder ( ) using a mortar and pestle. The mixture was then rolled to a thickness of about to form self-supporting films. Electrodes were assembled into coin cells using Whatman glass fibre separators and in ethylene carbonate:dimethyl carbonate 50:50 (battery grade, Sigma-Aldrich) electrolyte, with a Li metal counter electrode. A typical coin cell has an active mass loading of . Galvanostatic cycle testing was carried out using Maccor Series 4000. The cells and electrodes were prepared and assembled/ disassembled in the glove box under an inert atmosphere and all cycling for the characterization studies was performed using the same conditions. Cells were cycled between 2.0 V and 4.8 V versus at a rate of without voltage holds, rests or formation cycling.
The pristine cathode material was dissolved in aqua regia ( ), before diluting the solution for measurement. A calibration curve was created using standard solutions. Elemental analysis was carried out by ion-coupled plasma optical emission spectroscopy using a PerkinElmer Optima 7300DV ion-coupled plasma optical emission spectroscope.
PXRD
Diffraction data were collected on a Rigaku 9 kW SmartLab Cu-source diffractometer equipped with a Hypix 2D detector.
ADF-STEM
ADF-STEM micrographs were measured using an aberration-corrected JEOL ARM 200 F microscope operated at 200 kV . A convergence semi-angle of 22 mrad was used, with a collection semi-angle of 69.6164.8 mrad (ADF). Sets of fast-acquisition multiframe images were taken and corrected for drift and scan distortions using SmartAlign43. To avoid the exposure to air, sample transfer to the STEM microscope was carried out with a vacuum transfer suitcase.
RIXS
High-resolution RIXS data were collected using the I21 beamline at Diamond Light Source . To produce the data sets for the quantitative analysis, scans at 531.5 eV were recorded at 15 different sample locations and averaged together, with little inhomogeneity in the signal observed (Extended Data Fig. 8). The line scan data from 0.1 eV up to 13.0 eV , excluding the signal from the elastic peak, were -scored by
dividing each scan by its standard deviation. Then, the area under the vibrational peak progression (from 0.13 eV to 2.2 eV ) was integrated to measure the relative amount of . The areas for each scan were averaged to create a measure of oxygen intensity, with errors coming from the standard deviation of the mean for each data set.
Solid-state and
All and MAS ( ) solid-state NMR were completed at 9.45 using a Bruker Avance III HD spectrometer and a 1.9 mm double air bearing MAS probe, where is the MAS frequency and is the Larm or frequency. and spectra are referenced to and , respectively, at 0 ppm . All spectra were recorded using a Hahnecho sequence, where is and is 250 kHz ; the resultant free induction decay is processed as a half echo. The spectra were achieved with a recycle delay of 300 ms . These spectra were completed with relaxation times of 2 ms (fast relaxation) and 100 ms (slow relaxation).
Xe static NMR
AJ-Young NMR tube containing the Li-rich NMC cathode, was degassed under dynamic high vacuum using a turbo pump for 48 h and then infilled with natural abundance xenon gas (BOC) at 1 atm of pressure for 48 h . The NMR spectrum were completed at 9.45 T ( ) using a 5 mm solution-state NMR probe at a controlled temperature of 298.1 K . A 25 kHz pulse was utilized for all experiments with a recycle delay of 0.5 s . All shifts are referenced to natural abundance Xe (gas, 1 atm and 298.1 K ) at 0 ppm .
BET
Nitrogen adsorption/desorption analysis was carried using a Micromeritics 3Flex Adsorption Analyser. Samples were dried via in situ degassing at for 5 h before measurement.
Data availability
All the data generated or analysed during this study are included within the paper and its Extended Data figures and tables. Source data are available from the corresponding authors upon reasonable request.
References
Zhou, K-J. et al. I21: an advanced high-resolution resonant inelastic X-ray scattering beamline at Diamond Light Source. J. Synchrotron Radiat. 29, 563-580 (2022).
Terskikh, V. V., Mudrakovskii, I. L. & Mastikhin, V. M. nuclear magnetic resonance studies of the porous structure of silica gels. J. Chem. Soc. Faraday Trans. 89, 4239-4243 (1993).
Acknowledgements
P.G.B. is indebted to the EPSRC, the Henry Royce Institute for Advanced Materials (EP/ROO661X/1, EP/SO19367/1, EP/RO10145/1 and EP/LO19469/1) and the Faraday Institution (FIRGO16) for financial support. R.A.H. acknowledges funding from the Royal Academy of Engineering under the Research Fellowship scheme. We acknowledge Diamond Light Source for time on I21 under proposal MM25785.
Author contributions
J.-J.M. conducted the synthesis and characterization work. J.-J.M. prepared the -infiltrated samples, R.A.H. prepared the -labelled samples and G.J.R. performed and fitted the MAS NMR. R.A.H. and J.-J.M. in close collaboration with S.A., M.G.-F. and K.-J.Z. conducted the RIXS measurements. A.W.R. and J.C. conducted the ADF-STEM measurements. M.J. performed the BET measurements. J.-J.M., R.A.H. and P.G.B. wrote the paper with contributions from all authors.
Correspondence and requests for materials should be addressed to Robert A. House or Peter G. Bruce.
Peer review information Nature Materials thanks William Chueh, Naoaki Yabuuchi and the other, anonymous, reviewer(s) for their contribution to the peer review of this work.
Extended Data Fig. 1 | SEM and EDX images for elemental distribution. Spherical particles of m in diameter can be seen, while the EDX elemental analysis confirms a homogenous distribution of metals within the grains.
Extended Data Fig. 2 | Electrochemical cycling data at different rates. (a) Cycling data collected at different current rates of 100 and and . A similar degree of voltage (b) and capacity (c) fade is observed.
Extended Data Fig. 3 | SEM and EDX for the mixed metal carbonate precursor. Spherical particles of diameter can be seen in the SEM and EDX shows a homogenous distribution of metals within grains and between particles.
Extended Data Fig. 4 | Additional ADF-STEM images. (a) Pristine, (b) cycle and (c) cycle. Again, well defined atomic layers can be seen within the grains in the pristine and cycles, while the images from the cycle highlight the presence of voids.
Extended Data Fig. |ADF-STEM images for samples collected after the cycle. Voids are outlined in orange and range in dimensions from to . The likely interconnection of several of these voids is apparent.
Extended Data Fig. 6 | Xe NMR data. Xe NMR data at different stages of cycling alongside a plot of void size vs chemical shift . The minimum void size in the samples is around , as taken from a maximum chemical shift of 50 ppm .
Extended Data Fig. BET data. (a) BET data showing the pore size distributions for the pristine, cycle and cycle samples. To remove the contribution from carbon and binder which were present in all samples, the pristine data were subtracted from the and cycle data to better observe the changes in cathode particle porosity, (b).
Extended Data Fig. 8 | RIXS line scans. RIXS line scans collected at 531.5 eV at different sample locations for the charged samples of (a) and (b) cycles.
Extended Data Table 1 | ICP-OES data for
Li
Mn
Co
Ni
Extended Data Table 2 | Rietveld Refinement parameters of powder X-ray diffraction data for
Atom
Wyckoff Positions
x
y
z
Occupancy
Liam
3a
0.0
0.0
0.0
0.99
0.0240(1)
3a
0.0
0.0
0.0
0.01
0.0121(1)
3b
0.0
0.0
0.5
0.21
0.0241(1)
3b
0.0
0.0
0.5
0.12
0.0122(1)
Co
3b
0.0
0.0
0.5
0.13
0.0122(1)
Mn
3b
0.0
0.0
0.5
0.54
0.0122(1)
O
6c
0.0
0.0
0.2405(1)
1.0
0.0241(1)
Space Group R3-m,
Department of Materials, University of Oxford, Oxford, UK. The Faraday Institution, Didcot, UK. Diamond Light Source, Didcot, UK. Department of Chemistry, University of Oxford, Oxford, UK. e-mail: robert.house@materials.ox.ac.uk; peter.bruce@materials.ox.ac.uk