الإيميدازول بروبيونات هو محرك وهدف علاجي في تصلب الشرايين Imidazole propionate is a driver and therapeutic target in atherosclerosis

المجلة: Nature، المجلد: 645، العدد: 8079
DOI: https://doi.org/10.1038/s41586-025-09263-w
PMID: https://pubmed.ncbi.nlm.nih.gov/40670786
تاريخ النشر: 2025-07-16

الإيميدازول بروبيونات هو محرك وهدف علاجي في تصلب الشرايين

https://doi.org/10.1038/s41586-025-09263-w
تم الاستلام: 1 يونيو 2023
تم القبول: 9 يونيو 2025
تم النشر على الإنترنت: 16 يوليو 2025
الوصول المفتوح
Annalaura Mastrangelo ${ }^{mathbf{1 , 3 0}}$, Iñaki Robles-Vera ${ }^{mathbf{1 , 3 0}}$, Diego Mañanes ${ }^{mathbf{1 , 2}}$, Miguel Galán ${ }^{mathbf{1 , 2}}$, Marcos Femenía-Muiña ${ }^{1,3}$, Ana Redondo-Urzainqui ${ }^{1,2}$, Rafael Barrero-Rodríguez ${ }^{1,2}$, Eleftheria Papaioannou ${ }^{4,5,6}$, Joaquín Amores-Iniesta ${ }^{1}$, Ana Devesa ${ }^{1,7,8}$, Manuel Lobo-González ${ }^{1}$, Alba Carreras ${ }^{9}$, Katharina R. Beck ${ }^{9}$, Sophie Ivarsson ${ }^{9}$, Anders Gummesson ${ }^{9,10}$, Georgios Georgiopoulos ${ }^{11,12,13}$, Manuel Rodrigo-Tapias ${ }^{1,14}$, Sarai Martínez-Cano ${ }^{mathbf{1 , 1 4}}$, Ivan Fernández-López ${ }^{mathbf{1}}$, Vanessa Nuñez ${ }^{mathbf{1}}$, Alessia Ferrarini ${ }^{mathbf{1}}$, Naohiro Inohara ${ }^{15}$, Kimon Stamatelopoulos ${ }^{11}$, Alberto Benguría ${ }^{1}$, Danay Cibrian ${ }^{1,8,16}$, Francisco Sánchez-Madrid ${ }^{1,8,16,17}$, Vanesa Alonso-Herranz ${ }^{18}$, Ana Dopazo ${ }^{1,8}$, Coral Barbas ${ }^{19}$, Jesús Vázquez ${ }^{1,8}$, Juan Antonio López ${ }^{1,8}$, Alicia González-Martín ${ }^{4,5,6}$, Gabriel Nuñez ${ }^{15,19,20}$, Konstantinos Stellos ${ }^{21,22,23,24}$, Göran Bergström ${ }^{9,25}$, Fredrik Bäckhed ${ }^{9,25,26,27}$, Valentín Fuster ${ }^{1,28}$, Borja Ibañez ${ }^{1,8,29}$ & David Sancho ${ }^{1 boxtimes text { ® }}$

الملخص

تصلب الشرايين هو السبب الرئيسي الكامن وراء الأمراض القلبية الوعائية. تعتمد الوقاية منه على الكشف عن عوامل الخطر القلبية الوعائية التقليدية وعلاجها . ومع ذلك، غالبًا ما تظل الأفراد المعرضين لخطر الإصابة بأمراض الأوعية الدموية المبكرة غير محددين . أظهرت الأبحاث الحديثة جزيئات جديدة في الفيزيولوجيا المرضية لتصلب الشرايين ، مما يبرز الحاجة إلى علامات بيولوجية بديلة للأمراض وأهداف علاجية لتحسين التشخيص المبكر وفعالية العلاج. هنا، لاحظنا أن البروبيونات الإيميدازول (ImP)، التي تنتجها الكائنات الدقيقة، مرتبطة بمدى تصلب الشرايين في الفئران وفي مجموعتين مستقلتين من البشر. علاوة على ذلك، كان إعطاء ImP للفئران المعرضة لتصلب الشرايين التي تتغذى على نظام غذائي عادي كافيًا لتحفيز تصلب الشرايين دون تغيير ملف الدهون، وكان مرتبطًا بتنشيط المناعة الفطرية والتكيفية المحلية والنظامية والالتهاب. على وجه التحديد، وجدنا أن ImP تسبب تصلب الشرايين من خلال مستقبل الإيميدازولين-1 (I1R، المعروف أيضًا باسم نيشارين) في خلايا النخاع. حجب هذا المحور ImP-I1R منع تطور تصلب الشرايين الناتج عن ImP أو نظام غذائي عالي الكوليسترول في الفئران. إن تحديد الارتباط القوي بين ImP وتصلب الشرايين النشط ومساهمة محور ImP-I1R في تقدم المرض يفتح آفاقًا جديدة لتحسين التشخيص المبكر والعلاج الشخصي لتصلب الشرايين.

تعتبر الأمراض القلبية الوعائية (CVD) من الأسباب الرئيسية للوفاة في جميع أنحاء العالم، حيث يعد تصلب الشرايين المحدد الرئيسي لها. على الرغم من التقدم في الوقاية والعلاج، فإن الزيادة في المراضة والوفيات المرتبطة بـ CVD تبرز الحاجة إلى تدخلات مبكرة في السكان الذين يبدو أنهم أصحاء. تصلب الشرايين هو مرض معقد متعدد العوامل تعتمد وقايته على درجات تعتمد على عوامل الخطر القلبية الوعائية التقليدية التي لا تحدد الأفراد المعرضين لخطر الإصابة بأمراض الأوعية الدموية التصلبية في المراحل المبكرة . علاوة على ذلك، فإن التدخلات الدوائية الرئيسية مرتبطة بعوامل الخطر المعروفة (أيض الدهون ومؤخراً الالتهاب ). وهذا يبرز الحاجة إلى استكشاف العلاجات التي تستهدف عوامل أخرى في الفيزيولوجيا المرضية لتصلب الشرايين ، وخاصة للمرضى الذين، على الرغم من العلاج الأمثل، لا يزال لديهم خطر قلبي وعائي متبقي كبير .
التواصل بين أيض الميكروبيوتا والمضيف يساهم في CVD . ومع ذلك، تم وصف عدد قليل فقط من المستقلبات المعتمدة على الميكروبيوتا التي تتوافق مع المراحل المتأخرة من المرض . سعينا لتحديد المستقلبات الميكروبية المرتبطة
بالمراحل المبكرة من مرض الأوعية الدموية التصلبية التي يمكن أن تساهم في تقدم تصلب الشرايين.
للكشف عن المستقلبات الميكروبية التي يمكن أن تؤثر على تقدم تصلب الشرايين، قمنا بإطعام الفئران المعرضة لتصلب الشرايين Apoe أنظمة غذائية مختلفة مع أو بدون علاج بالمضادات الحيوية لتقليل الميكروبيوتا (الشكل التمديدي 1a). أدت الأنظمة الغذائية عالية الكوليسترول (HC) إلى تصلب الشرايين، والذي تم منعه جزئيًا عند العلاج بالمضادات الحيوية مع نظام غذائي HC مدعوم بالكولين (HC/HC) (الشكل 1a). أظهر التحليل الأيضي غير المستهدف إعادة تشكيل كبيرة لمتغيرات البلازما (الشكل 1b,c) المرتبطة بتغير تكوين الميكروبيوتا المعوية (الشكل 1d,e والشكل التمديدي 1b) عند إدارة النظام الغذائي والمضادات الحيوية. أولاً، قمنا بالتحقق من صحة التحليل الأيضي من خلال إثبات أن المستقلب المشترك بين المضيف والميكروبات، ثلاثي ميثيل الأمين -أكسيد (TMAO) تم تحفيزه من خلال إضافة الكولين الغذائي ومرتبط
الشكل 1| يكشف التحليل الأيضي غير المستهدف عن ImP كمستقلب معتمد على الميكروبيوتا مرتبط بتصلب الشرايين. تم إطعام الفئران Apoe نظام غذائي عادي، نظام غذائي HC أو نظام غذائي HC/HC مع أو بدون مضادات حيوية (abx) في مياه الشرب. أ، قياس حجم آفة اللويحات التصلبية في قوس الشريان الأورطي بواسطة صبغة زيت أحمر O. تمثل كل نقطة فأرًا فرديًا ( لكل مجموعة لجميع الظروف، باستثناء الفئران التي تتغذى على نظام غذائي عادي وتم إعطاؤها مضادات حيوية والفئران التي تتغذى على HC/HC، ). ، مخططات الدرجات لتحليل التمييز الجزئي (PLS-DA) الذي تم إجراؤه على بيانات الكروماتوغرافيا السائلة-مطياف الكتلة (LC-MS) لعينات البلازما المجمعة عند نقطة النهاية (القتل الرحيم) ( لكل مجموعة) للأنظمة الغذائية الثلاثة (ب) والأنظمة الغذائية الثلاثة مع المضادات الحيوية (ج) وتحليل تسلسل 16S rDNA لعينات الساكنة المجمعة عند نقطة النهاية (عادي، HC، ;
HC/HC، ) (د). هـ، تحليل غنى Chao1 لتنوع الميكروبيوتا. و، ز، وفرة ImP النسبية في البلازما من الفئران الذكور عند نقطة النهاية تم قياسها بواسطة LC-MS غير المستهدف (ف) والارتباط مع آفة قوس الشريان الأورطي (ز). ح، مصفوفة الارتباط تظهر الارتباط بين ImP وأجناس الميكروبيوتا المعوية (>0.1% من الوفرة الكلية) في عينات الساكنة من الفئران Apoe التي تتغذى على أنظمة غذائية عادية، HC أو HC/HC لمدة 8 أسابيع. تم تجميع البيانات من تجربتين مستقلتين (عادي، HC، ; HC/HC، ). ز، ح، معامل الارتباط ( ) و القيم تم حسابها بواسطة اختبار ارتباط ترتيب سبيرمان. أ، هـ، ف، البيانات الفردية والمتوسط الحسابي ± s.e.m. لكل مجموعة موضحة. ANOVA أحادي الجانب ذو جانبين مع تصحيح توكي. .
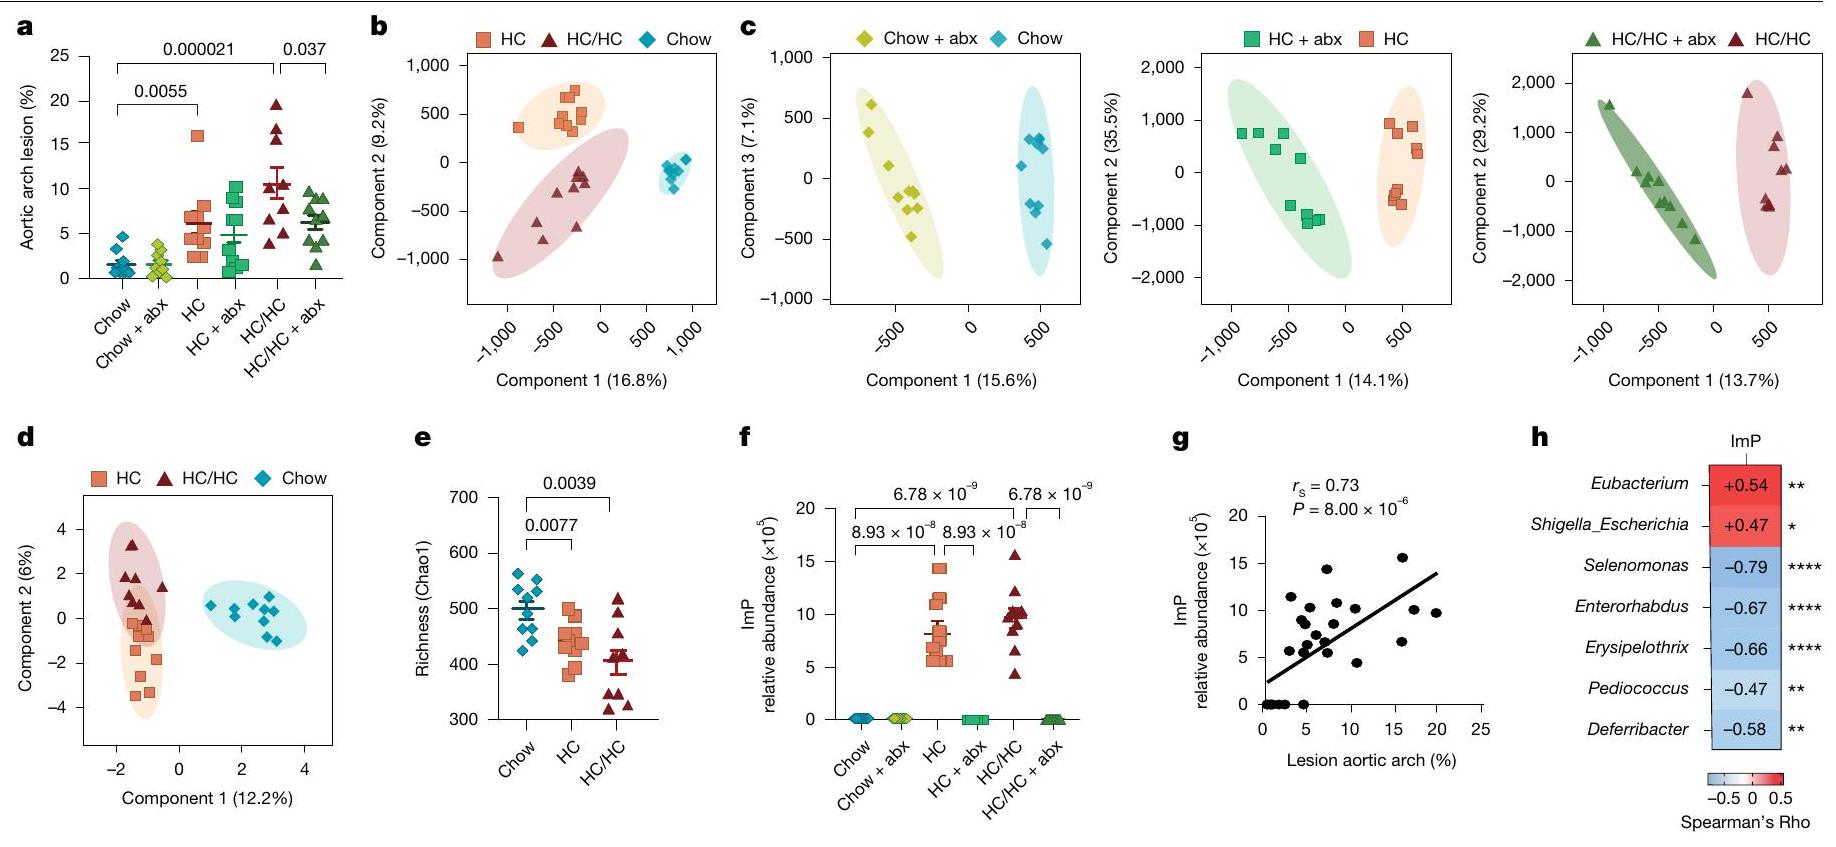
مع تصلب الشرايين بطريقة تعتمد على الميكروبيوتا (الشكل التمديدي 1c,d). من الجدير بالذكر أننا حددنا ImP، وهو مستقلب معتمد على الميكروبيوتا ، ليكون مرتبطًا بشدة بتصلب الشرايين عند التغذية بـ HC (الشكل 1f,g والشكل التمديدي 1e). كانت تركيزات ImP في البلازما مرتبطة أيضًا بتغيرات في بيئة الميكروبات المعوية عند التدخل الغذائي، وخاصة مع زيادة نسبية في الإشريكية القولونية وشيغيلة، أو الإيوباكتيريوم (الشكل 1h). ومع ذلك، يتطلب تحديد سلالات معينة لديها القدرة على إنتاج ImP مزيدًا من التحقيق.

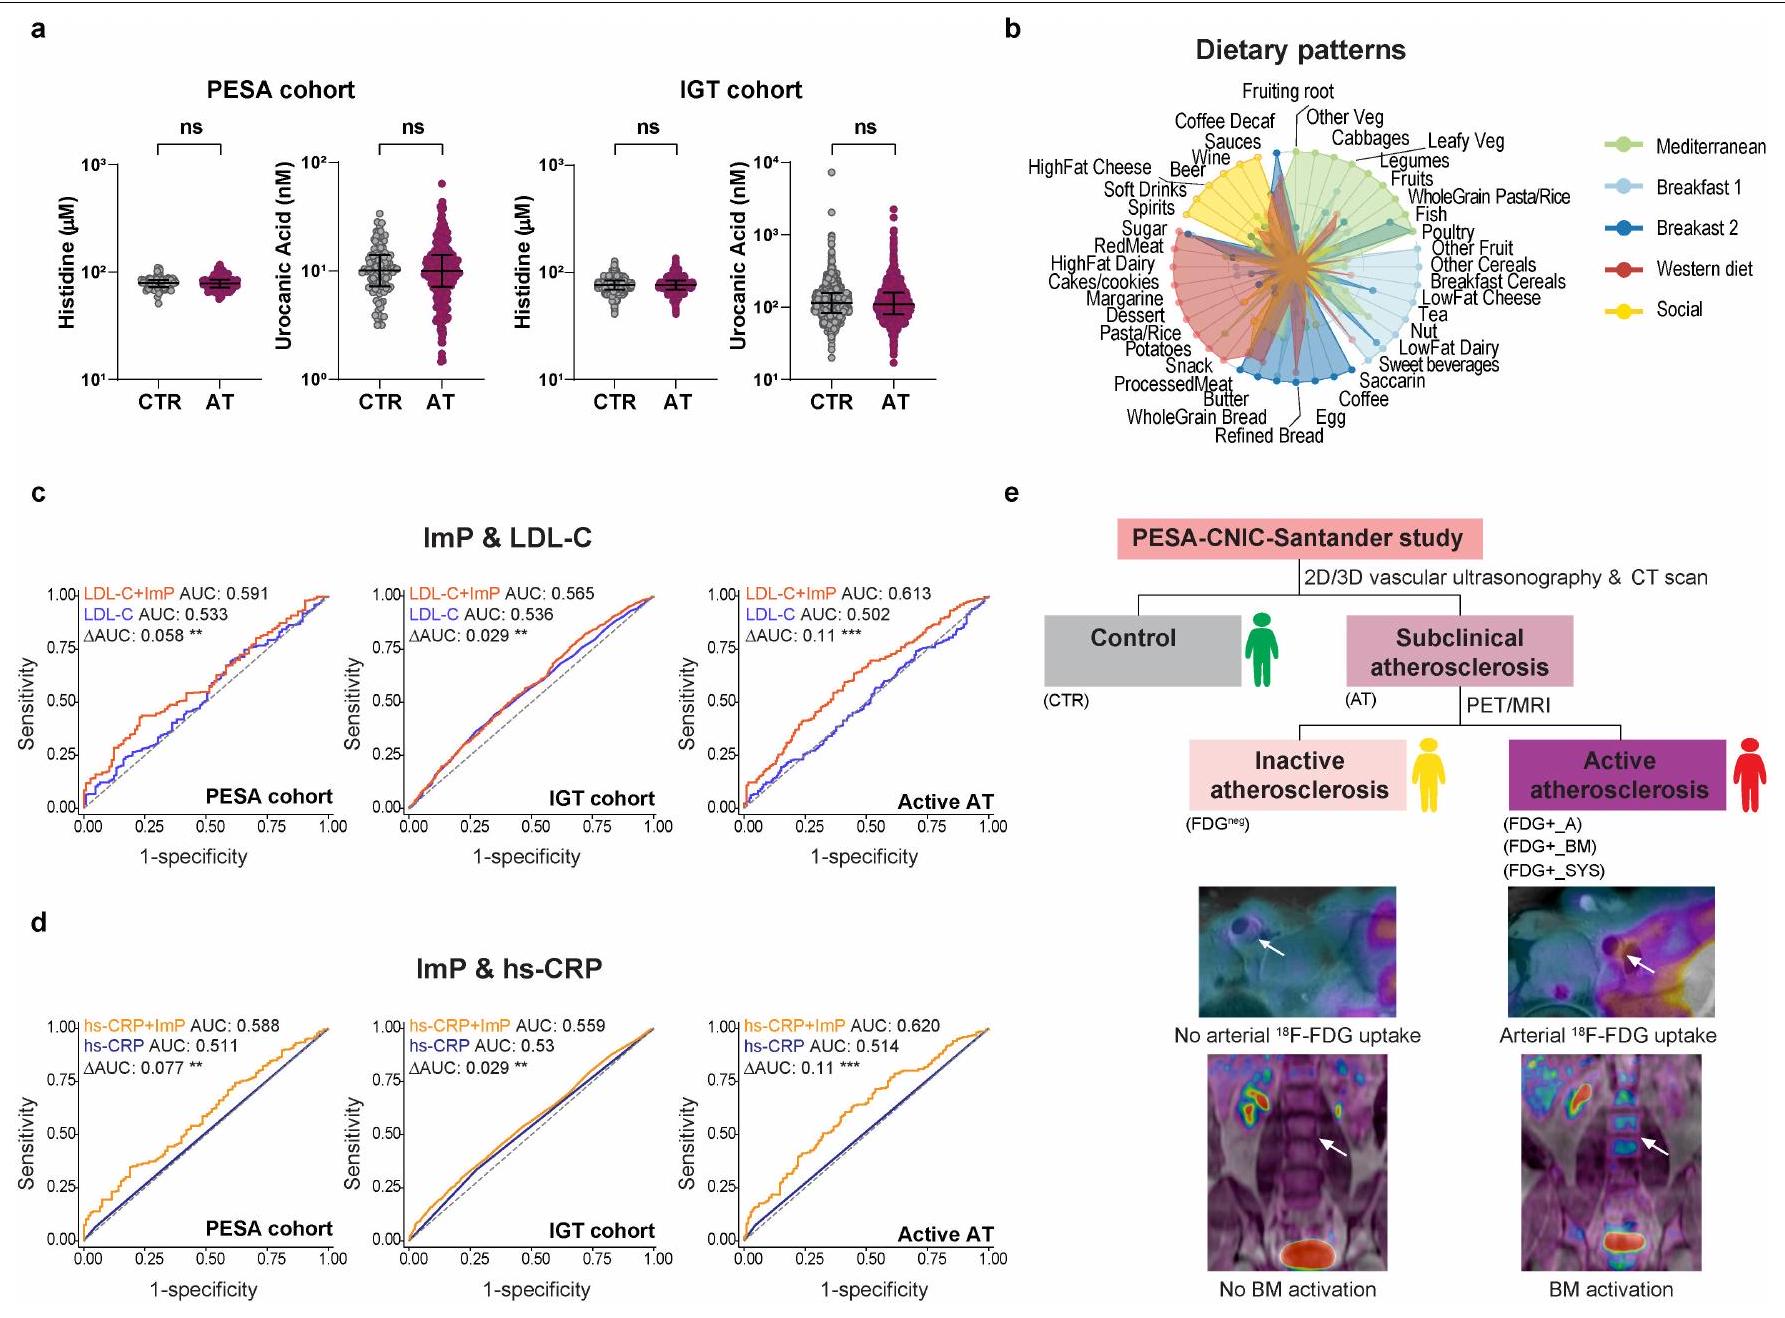
ImP مرتبط بتصلب الشرايين تحت السريري في البشر

بعد ذلك، هدفنا إلى التحقيق فيما إذا كانت زيادة تركيز ImP في البلازما مرتبطة أيضًا بتصلب الشرايين في البشر. قمنا بتجنيد 400 متطوع غير مصابين من دراسة تقدم تصلب الشرايين تحت السريري المبكر (PESA)-المركز الوطني للبحوث القلبية الوعائية (CNIC)-سانتاندر (المشار إليها لاحقًا بدراسة PESA) (الجدول التمديدي 1a,b). بناءً على التصوير متعدد المناطق ومتعدد الأنماط (الموجات فوق الصوتية الوعائية ثنائية الأبعاد أو ثلاثية الأبعاد والتصوير المقطعي المحوسب غير المتباين)، قمنا بتصنيف 295 مشاركًا يعانون من تصلب الشرايين تحت السريري و105 ضوابط بدون تصلب الشرايين. تم تعريف مدى تصلب الشرايين وفقًا لعدد المواقع الوعائية المتأثرة ودرجة الكالسيوم في الشريان التاجي (CAC). تم استخدام التحليل الأيضي المستهدف لقياس ImP ومستقلباته ذات الصلة (الهستيدين وحمض يوروكان) في عينات البلازما. كانت تركيزات ImP في البلازما، ولكن ليس الهستيدين أو حمض يوروكان، مرتفعة بشكل انتقائي في الأفراد الذين يعانون من تصلب الشرايين تحت السريري مقارنة بالضوابط (الشكل 2a والشكل التمديدي 2a). لوحظت ارتباطات خطية وغير خطية بين تركيزات ImP وتصلب الشرايين ومدى تصلب الشرايين، على التوالي
(الشكل 2b). تم قياس ImP بعد ذلك في مجموعة مستقلة، مجموعة تحمل تحمل الجلوكوز (IGT) (الجدول التمديدي 2a,b)، والتي تضم متطوعين غير مصابين، بما في ذلك 529 ضابطًا و1,315 فردًا يعانون من تصلب الشرايين تحت السريري . من الجدير بالذكر أن الارتباط بين ImP وتصلب الشرايين المبكر تم تأكيده (الشكل 2c,d والشكل التمديدي 2a).
استكشفنا أيضًا الارتباط بين ImP، أنماط النظام الغذائي وتكوين الميكروبيوتا. من بين خمسة أنماط غذائية رئيسية مشتقة من تحليل المكونات الرئيسية (PCA) في مجموعة PESA (الشكل التمديدي 2b)، كان ImP مرتبطًا عكسيًا بنمط غذائي إفطار1 ونمط غذائي متوسطي (الشكل 2e)، بما يتماشى مع النتائج السابقة تم الكشف عن تسلسل الحمض النووي الريبوسومي (rDNA) لعينات البراز عن وجود ارتباط مباشر بين ImP والوفرة النسبية لـ Veillonella و Acidaminococcus، وارتباط عكسي مع عائلتي Erysipelotrichaceae و Coriobacteriaceae (الشكل 2e)، والتي تتغير في الأفراد الذين يعانون من أمراض القلب والأوعية الدموية. .
بعد ذلك، قمنا بالتحقيق في العلاقة بين مستوى ImP في البلازما وعوامل الخطر القلبية الوعائية المعروفة. في كلا المجموعتين، كان هناك ارتباط مباشر بين ImP ومستوى الجلوكوز الصائم وملف القلب الأيضي السلبي، بما في ذلك زيادة بروتين سي التفاعلي عالي الحساسية (hs-CRP)، ومؤشر كتلة الجسم (BMI)، والدهون الحشوية، والخلل الدهني وارتفاع ضغط الدم، وانخفاض مستوى كوليسترول البروتين الدهني عالي الكثافة (HDL) (الشكل 2e، f والجداول التكميلية 1b و2b). كما زادت نسبة نقاط تصلب الشرايين ودرجة CAC عبر تيرتيلات ImP المتزايدة (الجداول التكميلية 1b و2b). بعد تعديل العوامل التقليدية في كلا المجموعتين، كانت مستويات ImP الأعلى مرتبطة بشكل مستقل بالنتائج الرئيسية لتصلب الشرايين (الشكل 2g والجدول التكميلية 3)، مما يشير إلى أن مستويات ImP العالية تعتبر مؤشراً على زيادة خطر تصلب الشرايين. ومن الجدير بالذكر أن ImP أظهر أيضاً قيمة إضافية عند إضافته إلى مؤشرات تصلب الشرايين المعتمدة على الدم مثل
الشكل 2 | مرتبط بتصلب الشرايين تحت السريري لدى البشر.
أ ، ج ، بلازما ImP في الأفراد الأصحاء (Ctrl) والأفراد الذين يعانون من تصلب الشرايين تحت السريري (AT) من PESA (أ ؛ Ctrl، و IGT(c; Ctrl، ; AT، ) المجموعات. ب، د، منحنيات الاستجابة للجرعة لتركيز ImP في البلازما والنقاط النهائية في مجموعات PESA (ب) و IGT (د). هـ، و، مصفوفات ارتباط سبيرمان بين ImP وخصائص تصلب الشرايين، النظام الغذائي والميكروبيوم في مجموعات PESA (هـ) و IGT (و). تم تعديل بنجاميني-هوشبرغ القيم. ALT، ألانين أمينوترانسفيراز؛ AST، أسبارتات أمينوترانسفيراز؛ BM، نخاع العظم؛ ECO2D، الموجات فوق الصوتية الوعائية ثنائية الأبعاد؛ ECO3D، الموجات فوق الصوتية الوعائية ثلاثية الأبعاد؛ F، عائلي؛ GFR، معدل تصفية الكلى؛ GGT، غاما-جلوتاميل ترانسفيراز؛ HTN، ارتفاع ضغط الدم. ج، نماذج الانحدار المعدلة لارتباط ImP بتصلب الشرايين (يسار) ومدى تصلب الشرايين (يمين) في PESA (أعلى، ) و IGT (أسفل، تم التحكم في تقديرات التأثير لعوامل مثل العمر، الجنس، التدخين، الكرياتينين، التاريخ العائلي لأمراض القلب والأوعية الدموية، الهيموجلوبين، ارتفاع ضغط الدم و LDL-C (مجموعة PESA) والعمر، التدخين، التاريخ العائلي لأمراض القلب والأوعية الدموية، ارتفاع ضغط الدم، LDL-C، Hb1Ac، hs-CRP و ALT (مجموعة IGT). أشرطة الخطأ
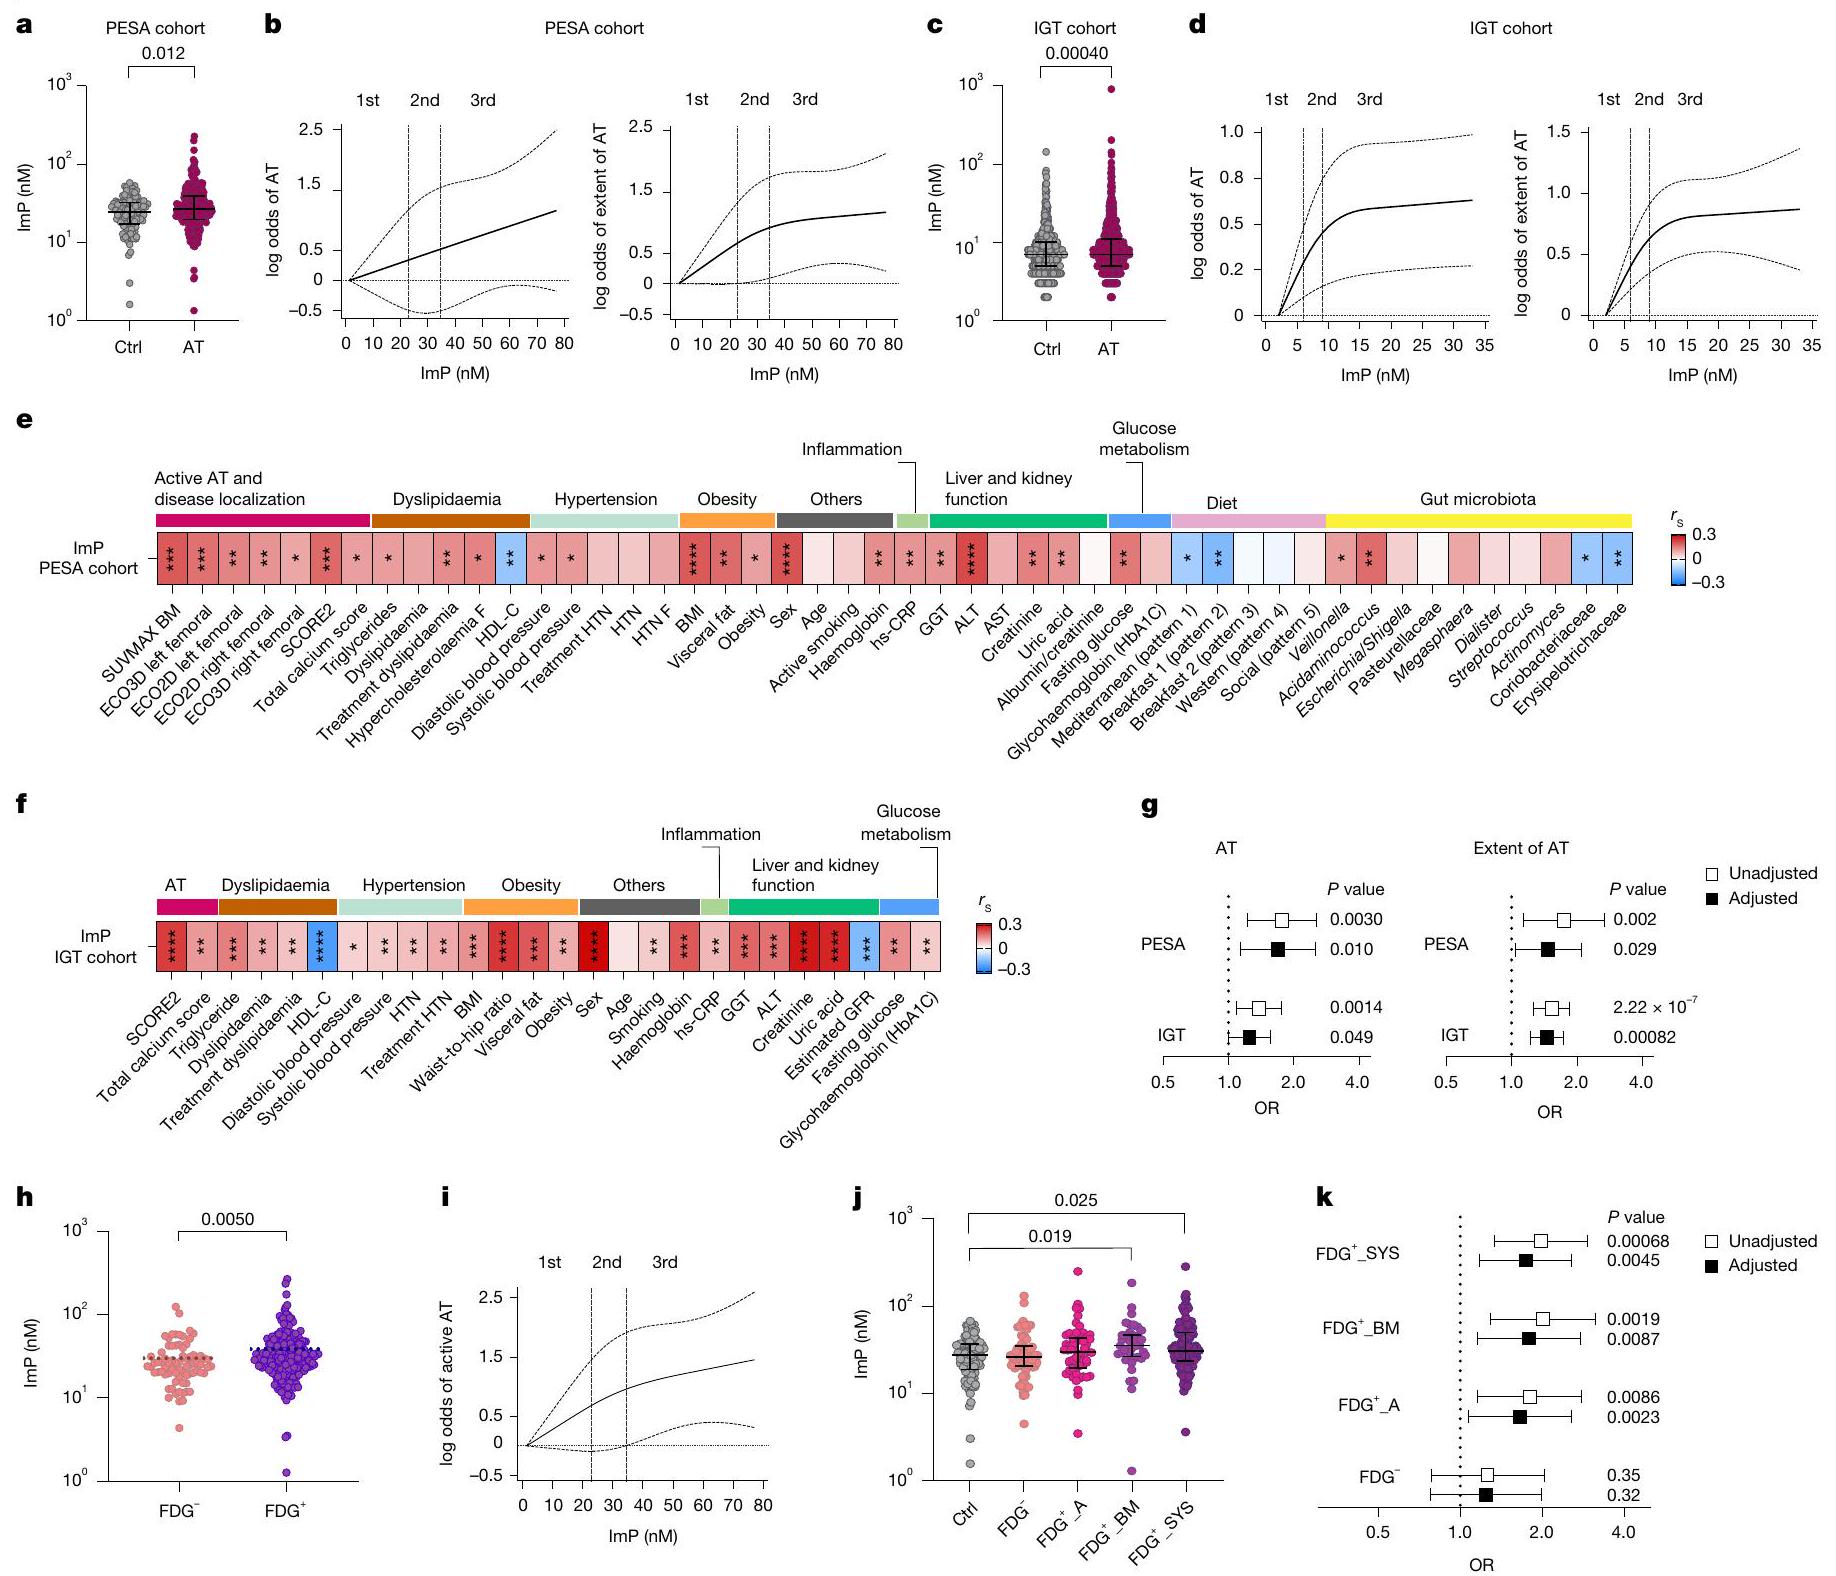
عرض فترات الثقة 95%. أو، نسبة الأرجحية. ج، مستوى ImP في البلازما لدى الأفراد الذين يعانون من تصلب الشرايين غير النشط (FDG ) وتصلب الشرايين النشط (FDG ، تم تصنيف الأفراد بشكل إضافي وفقًا للالتهاب الوعائي (الشرياني امتصاص F-FDG أ، تفعيل نخاع العظام امتصاص F-FDG في نخاع العظم، بي إم، ) والالتهاب الجهازي (التهاب الشرايين ونخاع العظام المتزامن امتصاص F-FDG، FDG نظام، ) (ج). FDG تشير إلى مجموعة من تصلب الشرايين غير النشط. أ، ج، ح، ج، الخط الأفقي يمثل الوسيط وأشرطة الخطأ تظهر النطاق الربعي (الجداول التكميلية 1أ، 2أ و4). اختبار مان-ويتني ذو الطرفين -اختبار. منحنى الاستجابة للجرعة لتأثير ImP في البلازما على تصلب الشرايين النشط لمجموعة PESA. ب، د، ي، تمثل الخطوط المتقطعة فترة الثقة؛ الخطوط الرأسية تحدد الثلثيات. ك، الانحدار اللوجستي المتعدد للصلابة تحت السريرية في مجموعات تصلب الشرايين ( _ _ أ و ) مقابل الضوابط وفقًا لمستوى ImP في البلازما. تم تعديل نسبة الأرجحية حسب العمر والجنس والتدخين والجلوكوز وhs-CRP وتركيز الهيموجلوبين. g، k، تشير الخطوط إلى فترات الثقة 95% (القيم في الجداول التكميلية 3 و 5). .
الكوليسترول منخفض الكثافة (LDL) و hs-CRP في تمييز انتشار تصلب الشرايين في كلا المجموعتين (الشكل البياني الموسع 2c، d).
في مجموعة PESA، تم تصنيف الأفراد الذين يعانون من تصلب الشرايين تحت السريري بشكل إضافي بواسطة -فلوروديوكسي جلوكوز ( امتصاص -FDG) في الشرايين و/أو تنشيط نخاع العظام في أولئك الذين لديهم عمليات أيضية
تصلب الشرايين النشط ( ) أو لا ( تمت ملاحظة زيادة في تركيز ImP في البلازما في مجموعة، تتبع ارتباطًا غير خطي مع النتيجة (الشكل 2h، i). مزيد من التصنيف حسب أظهر امتصاص F-FDG (الشكل البياني الموسع 2e والجدول التكميلي 4) تركيزًا أعلى من ImP في البلازما في المجموعات الفرعية للعظام
الشكل 3 | زيادة مستوى ImP المتداول تحفز تصلب الشرايين والالتهاب الجهازي في الفئران المعرضة لتصلب الشرايين التي تتغذى على الطعام العادي. أ، تم إعطاء ImP (lmP) أو عدم إعطائه (Ctrl) للفئران التي تتغذى على الطعام العادي. فئران. صبغة الزيت الأحمر O لقوس الشريان الأورطي (يسار، ) وصور تمثيلية للأبهر (يمين). ب-هـ، تم إعطاء ImP (lmP) أو عدم إعطائه (Ctrl) لـ Apoe الفئران. ب، الكمية (يسار) وصور تمثيلية (يمين) لصبغة زيت أحمر O لآفات جذر الشريان الأورطي. تشير رؤوس الأسهم إلى المناطق التي تحتوي على صبغة زيت أحمر O إيجابية. قضبان القياس، تحليل تدفق الخلايا لـ Ly6C وحيدات النواة و T-bet في CD4 خلايا T في الدم عند نقطة النهاية. صحيح، مخططات الكثافة التمثيلية لـ Ctrl و ImP. e، تقريب وتوقع متعدد الأبعاد (UMAP) (يسار) ونسب الخلايا (يمين) معلمة بنوع الخلايا المشتقة من الشريان الأورطي بالكامل، بناءً على الملفات التعبيرية. DCs، خلايا دندريتية؛ ECs، خلايا بطانية؛ FBs، ألياف؛ MFs، بلاعم؛ VSMCs، خلايا العضلات الملساء الوعائية. f، فئران تم تطعيمها بنخاع العظام من النوع البري (WT) (Ctrl، ) أو تصلب الشرايين بواسطة صبغة الزيت الأحمر O لفرع الشريان الأورطي (يسار) وممثل
صور الشريان الأورطي (يمين). ج، خريطة حرارية لتحليل المسار الجيني المقارن بين ImP والمجموعة الضابطة لخلايا البطانية، الألياف، والبلعميات من بيانات تسلسل RNA أحادي الخلية لـ Apoe فئران تم تغذيتها بنظام غذائي لمدة 4 أسابيع. EMT، الانتقال الظهاري-الم mesenchymal؛ NES، درجة الثراء المنظم. h، الوفرة العالمية للببتيدات (mTOR) والببتيدات الفوسفورية (p-mTOR) في BMDMs (يسار) أو MEFs (يمين) المعالجة بـ ImP لمدة 3 ساعات مع أو بدون AGN192403 (AGN). النسبة تتعلق بالظروف غير المحفزة. أنا، فئران تم تطعيمها بنخاع العظام من رابتور التحكم أو أبتور تحديد الكمية (يسار) وصور تمثيلية (i) لصبغة زيت الأحمر O للشريان الأورطي، تظهر تصلب الشرايين في قوس الشريان الأورطي. a-d,f,i، نقاط بيانات فردية ومتوسط ± انحراف معياري للخطأ على الأقل من تجربتين مستقلتين مجمعتين. a-d، اختبار t لعينات غير مرتبطة ذو طرفين. -اختبار. f,i، تحليل التباين الأحادي مع تصحيح توكي بعد الاختبار. g، اختبار كولموغوروف-سميرنوف ثنائي الاتجاه يقارن ImP مقابل غير المحفز. h، اختبار ويلكوكسون ذو الرتبة الموقعة ثنائي الاتجاه يقارن وفرة الببتيد والفوسفوببتيد في ImP مقابل ImP بالإضافة إلى علاجات AGN.
تنشيط النخاع _BM) والالتهاب الجهازي ( _SYS; الشكل 2j). من الجدير بالذكر أنه بعد التعديل لعوامل الخطر التقليدية، ظلت العلاقة بين ImP وزيادة المخاطر ذات دلالة إحصائية عبر جميع الفئات الفرعية من النشاط الأيضي. تصلب الشرايين (الشكل 2k والجدول التكميلي 5). بالإضافة إلى ذلك، أظهر ImP قدرة تمييز إضافية لتصلب الشرايين النشط مقارنةً بالكوليسترول LDL و hs-CRP بمفردهما (الشكل البياني الموسع 2c، d). تكشف هذه النتائج عن ارتباط قوي بين ImP وتصلب الشرايين، وخاصةً تصلب الشرايين النشط، مما يشير إلى إمكانية استخدامه كمؤشر على تصلب الشرايين النشط المبكر قبل أن تصبح الأمراض المصاحبة عوامل مشوشة.

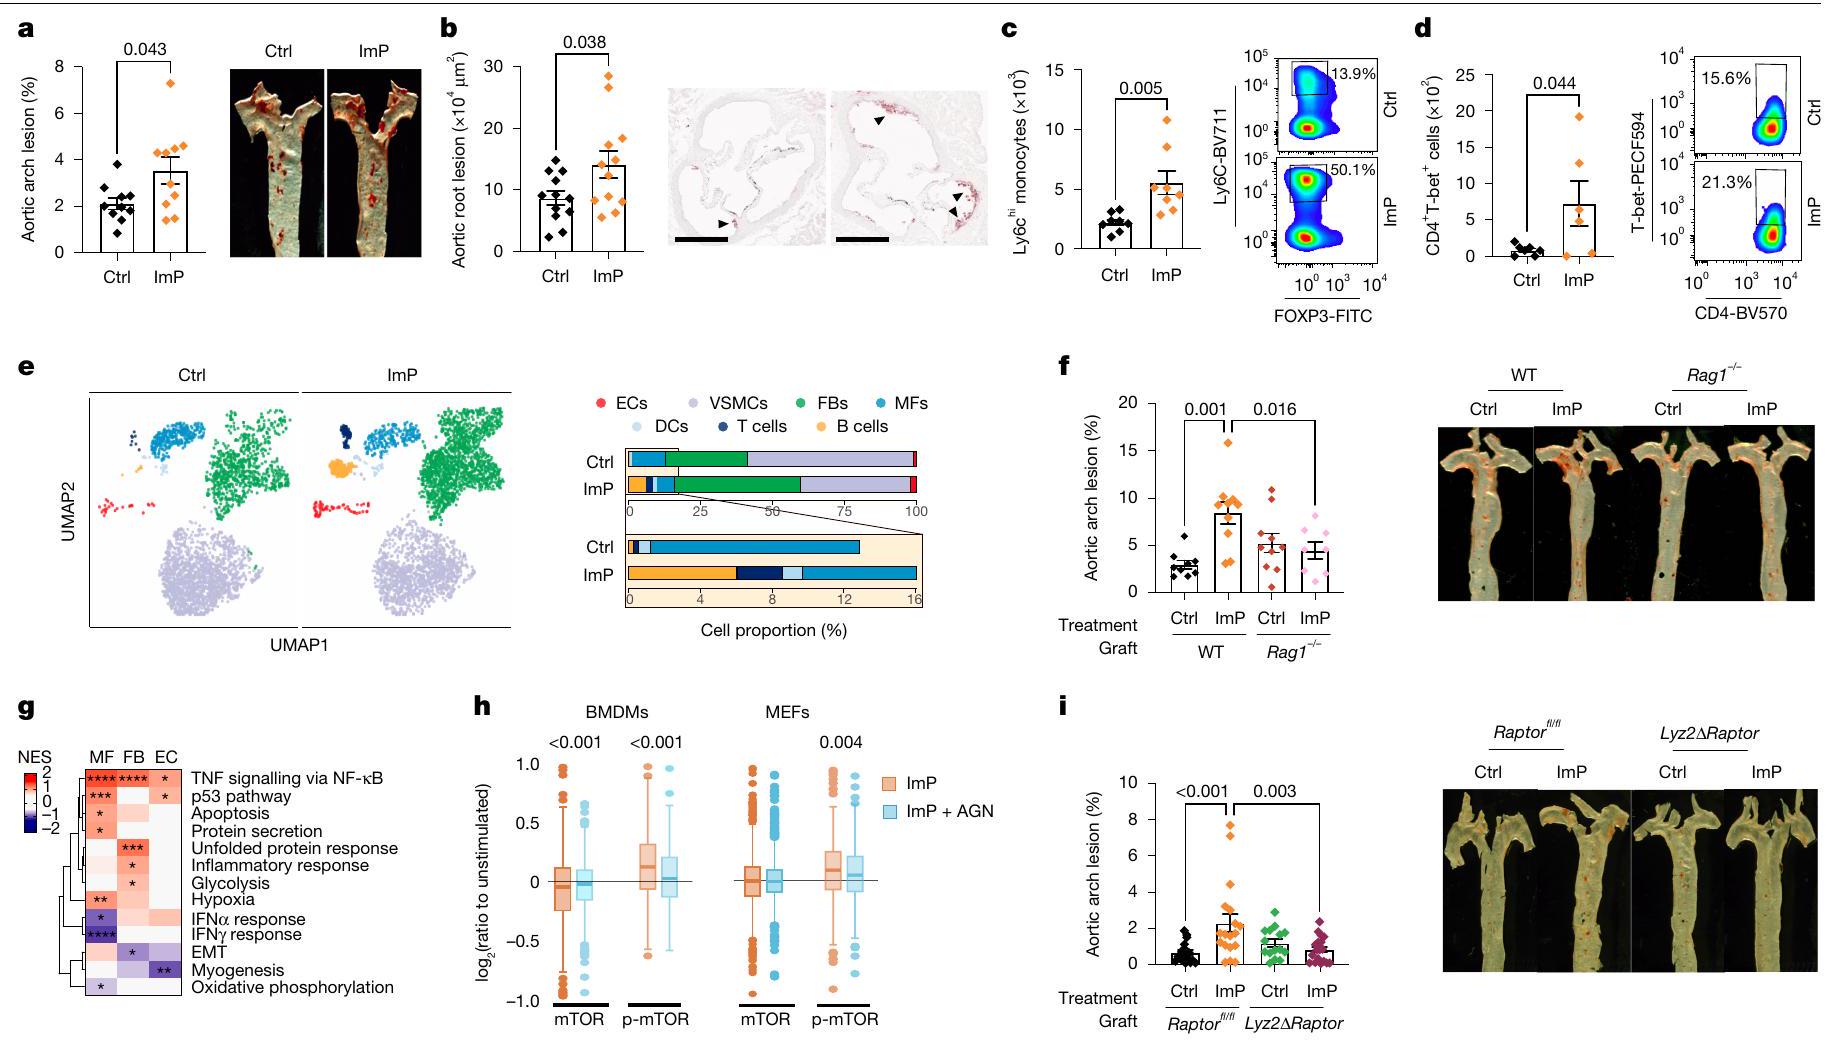
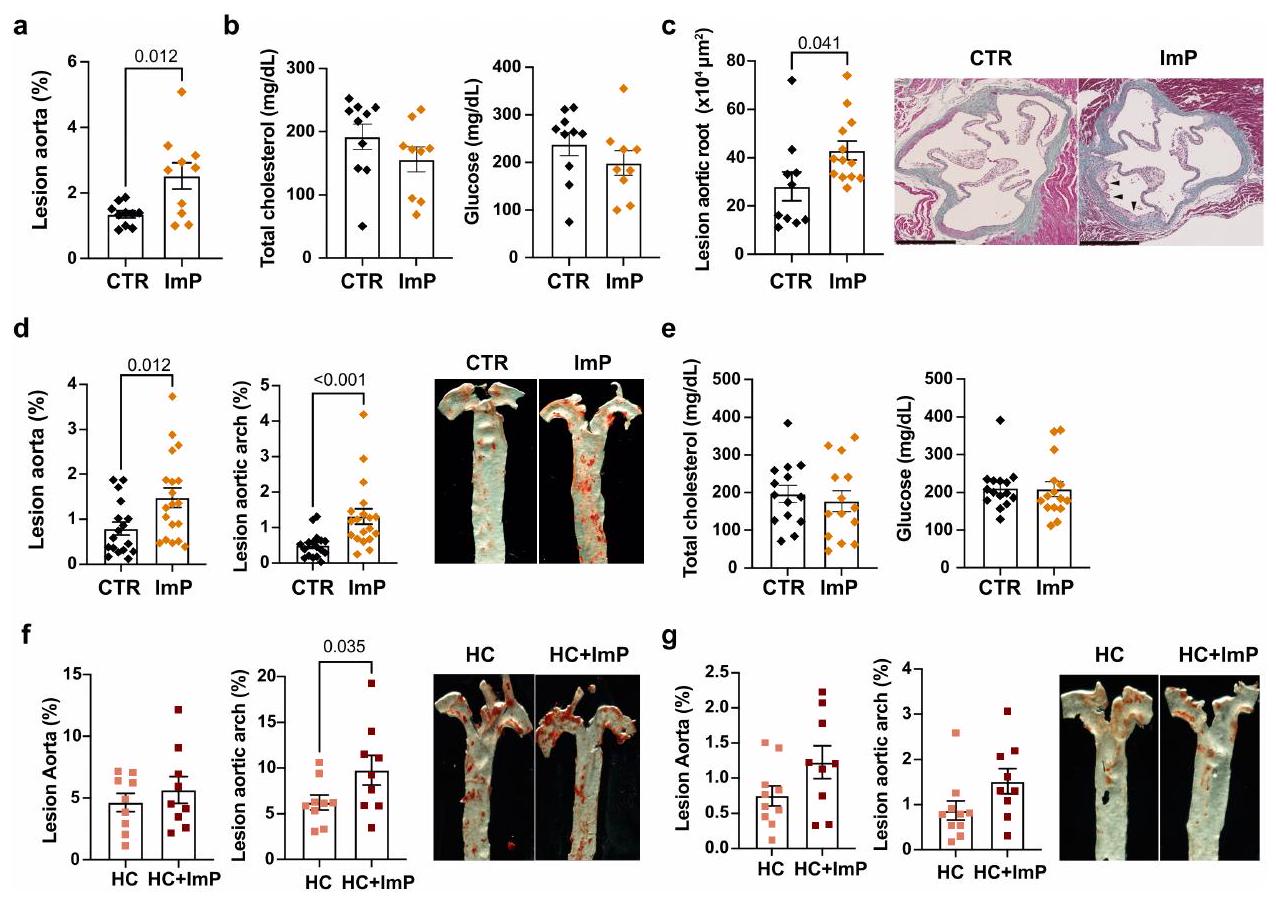
ImP يسبب تصلب الشرايين دون تغيير في مستوى الكوليسترول

لاستكشاف تأثير ImP على تصلب الشرايين بشكل أعمق وتحديد ما إذا كان له دور سببي في تطوير المراحل المبكرة من المرض، قمنا بإعطاء ImP في مياه الشرب لفئران معرضة لتصلب الشرايين، بما في ذلك تلك التي تتغذى على العلف. الفئران، التي عالجناها بـ ImP لمدة 12 أسبوعًا (الشكل 3 أ والشكل البياني الممتد 3 أ، ب) وتغذت على طعام عادي الفئران، التي عالجناها بـ ImP لمدة 8 أسابيع (الشكل 3ب)
و الشكل الإضافي للبيانات 3c-e). في كلا النموذجين، زادت مكملات ImP من تطور تصلب الشرايين في الشريان الأورطي وجذر الشريان الأورطي دون التأثير على تركيز الكوليسترول أو الجلوكوز في الدم (الشكل 3a,b والشكل الإضافي للبيانات 3a-e). أدى التغذية بنظام HC الغذائي وحده إلى إنتاج ImP (الشكل 1f). لم تؤدِ مكملات ImP الإضافية إلى تفاقم تصلب الشرايين بشكل كبير في المجموعة التي تغذت على HC. الفئران، على الرغم من أنها زادت من آفات تصلب الشرايين في الفئران (الشكل 3f، g من البيانات الموسعة). وبالتالي، لإقامة نموذج مباشر يعتمد على ImP لتصلب الشرايين من أجل التحقيقات اللاحقة، قمنا بإعطاء ImP حصريًا للفئران التي تتغذى على طعام عادي. ومن الجدير بالذكر، الفئران المعالجة بـ ImP لمدة ثمانية أسابيع أظهرت توسعًا في الخلايا الالتهابية البروتينية Ly6C الخلايا الوحيدة، وخلايا T المساعدة و خلايا T المساعدة الخلايا (الشكل 3ج، د والشكل التوضيحي الممتد 4أ) في الدم، المرتبطة ببيئة مؤيدة لتصلب الشرايين .
لفهم التغيرات المحددة التي يسببها ImP في الشريان الأورطي، قمنا بإجراء تحليل تسلسل RNA على مستوى الخلية الواحدة (scRNA-seq) للشريان الأورطي بالكامل من الفئران التي تتغذى على نظام غذائي عادي. الفئران التي تم إعطاؤها ImP لمدة أربعة أو ثمانية أسابيع (الشكل 4b-e من البيانات الموسعة). أظهرت الفئران المعالجة بـ ImP لمدة أربعة أسابيع زيادة طفيفة في تصلب الشرايين في قوس الأبهر (الشكل 4f من البيانات الموسعة)، وبعض التغيرات المحلية في
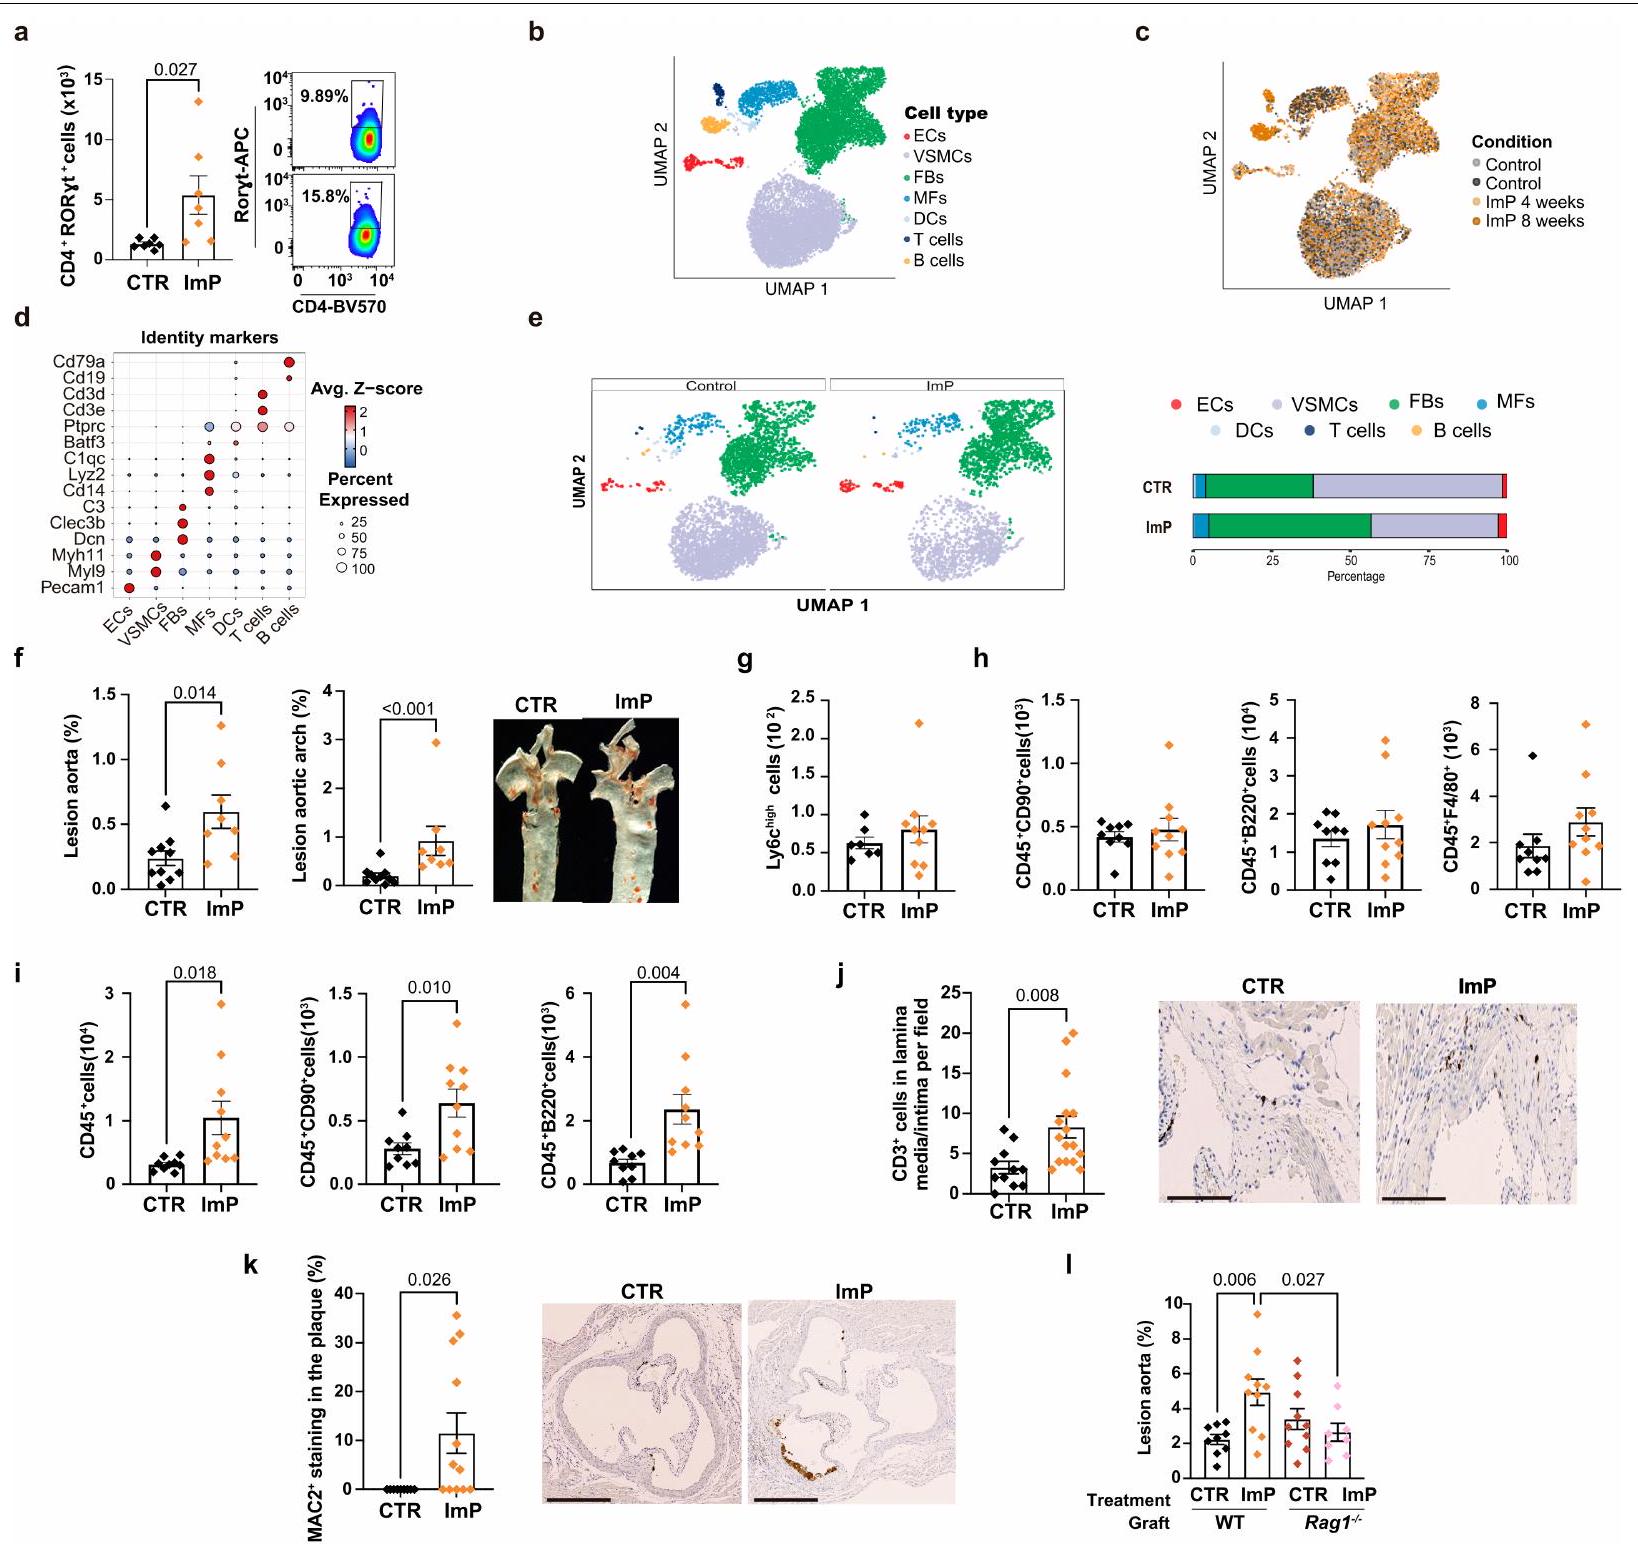
تكرار تجمع الخلايا في الشريان الأورطي (الشكل التوضيحي 4e)، دون تغييرات في الخلايا المناعية الدائرة (الشكل التوضيحي 4g، h). بالمقابل، أظهر تسلسل RNA أحادي الخلية للشرايين الأورطية من الفئران المعالجة بـ ImP لمدة ثمانية أسابيع زيادة في العدد النسبي للأرومات الليفية، والخلايا البطانية، والخلايا المناعية (الشكل 3e). تم تأكيد العدد المتزايد من الخلايا المناعية في الشريان الأورطي من خلال تحليل تدفق الخلايا (الشكل التوضيحي 4i) والتحليل النسيجي لجذر الشريان الأورطي، الذي أظهر زيادة في تسلل خلايا T في طبقة الإنتيما-ميديا وزيادة في صبغة MAC2 للماكروفاجات الالتهابية في لويحة التصلب العصيدي للفئران المعالجة بـ ImP مقارنة بالمجموعة الضابطة (الشكل التوضيحي 4j، k). من المRemarkably، كانت قدرة ImP على تحفيز تصلب الشرايين منخفضة بشكل ملحوظ في فئران مزروعة بـ نخاع العظام، الذي يفتقر إلى خلايا T و B (الشكل 3f والشكل 41 من البيانات الموسعة). تحدد هذه البيانات ImP كمساهم جديد في مسببات تصلب الشرايين في الفئران المعرضة لتصلب الشرايين، والذي يرتبط بتنشيط الاستجابة المناعية دون التأثير على تركيز الكوليسترول في مجرى الدم.

في الجسم الحي، يغير ImP التركيب الجيني للشريان الأورطي

لتحليل الأهداف الخلوية لمركب ImP في الشريان الأورطي، قمنا بدراسة التغيرات النسخية باستخدام تحليل scRNA-seq بعد أربعة أسابيع من العلاج. أظهر تحليل إثراء مجموعة الجينات (GSEA) لكل نوع خلية زيادة في المسارات النسخية المرتبطة بالالتهابات في البلعميات، والألياف، والخلايا البطانية بعد علاج ImP (الشكل 3g). أظهر إعادة تجميع كل نوع خلية في تحليلات مستقلة تحديد أربعة مجموعات فرعية من البلعميات، وخمس مجموعات فرعية من الألياف، وثلاث مجموعات فرعية من الخلايا البطانية (الشكل التمديدي 5a-c). أظهر تحليل تأثير ImP في هذه المجموعات الفرعية (بما في ذلك بيانات الأربعة والثمانية أسابيع) انخفاضًا في مجموعة MF1 المرتبطة بالجينات المنزلية. وزيادة في مجموعة MF3 التي تعبر عن الجينات المرتبطة بتمثيل الدهون، والالتهاب، وتنشيط البلعميات (الشكل البياني الممتد 5d، g). أدى زيادة ImP في الدورة الدموية إلى توسيع مجموعات FB2 وFB3 وFB4 في الشريان الأورطي، والتي تم تمييزها بتعبير الجينات المرتبطة باستجابة الأستيل كولين، والاستجابة المناعية، والالتهاب، وتنظيم المصفوفة خارج الخلوية، على التوالي (الشكل البياني الممتد 5e، g). أخيرًا، مجموعة EC1، التي أعربت عن جينات تنظم وظيفة الخلايا البطانية. علامات الميزانشيم وجينات تعزيز تكوين الأوعية الدموية تم إثراءه في الشريان الأورطي بعد علاج ImP (الشكل 5f، g من البيانات الموسعة).
متسقًا مع هذه النتائج، كان بإمكان ImP تنشيط الخلايا الليفية الجنينية الفأرية (MEFs) في المختبر من خلال تحفيز إنتاج بروتين كيميائي جاذب للوحيدات النواة النشط-1، الذي يزيد من تجنيد الوحيدات النواة (الشكل البياني الممتد 5h,i) المرتبط بتكوين تصلب الشرايين. علاوة على ذلك، أظهرت تحليل تسلسل RNA (RNA-seq) تحفيزًا سريعًا للعديد من المسارات الالتهابية ومسارات التنشيط بعد إعطاء ImP، لا سيما في البلعميات المشتقة من نخاع العظم (BMDMs) وفي خلايا الفيبروبلاست (MEFs)، ولكن ليس في خلايا بطانة الشريان الأورطي للفئران (MAECs) (الشكل التمديدي 5j)، مما يشير إلى أن البلعميات والفيبروبلاست قد يكونان الأهداف الرئيسية لـ ImP. ومن الجدير بالذكر أن تحليل الفوسفوبروتينات أظهر زيادة في الوفرة العالمية للفوسفوببتيدات التابعة لمسار mTOR في BMDMs وMEFs بعد علاج ImP (الشكل 3h والشكل التمديدي 5k). كانت هذه النتائج متوافقة مع النتائج السابقة في الخلايا الكبدية الأولية. وزيادة إشارة S6 الفسفورية (p-S6) (التي تشير إلى تنشيط mTOR) التي وجدناها في BMDMs و MEFs بعد علاج ImP (الشكل التوضيحي الممتد 51). علاوة على ذلك، فإن التحضين المسبق مع مثبط mTOR، الراباميسين، منع تحفيز إنتاج TNF بواسطة ImP في BMDMs و MEFs (الشكل التوضيحي الممتد 5m). Apoe الفئران التي تم تغذيتها بنظام غذائي من الشوفان وتم إعطاؤها ImP لمدة 8 أسابيع أظهرت أيضًا زيادة في p-S6 في البلعميات البريتونية (الشكل البياني الممتد 5n). ومن الجدير بالذكر أن الحذف الانتقائي لـ Raptor (المعروف أيضًا باسم Rptor؛ المرتبط بتنظيم mTOR) في الخلايا النخاعية لـ فئران تم تطعيمها بنخاع العظم من راaptor مقابل رابتور التحكم أخوة الأشقاء منعوا تحفيز تصلب الشرايين بواسطة ImP (الشكل 3i والشكل الإضافي 50). هذه البيانات تظهر أن ImP مباشرة
يُفعّل استجابة التهابية تعتمد على mTOR في الخلايا النخاعية، مما يساهم في تكوين اللويحات.

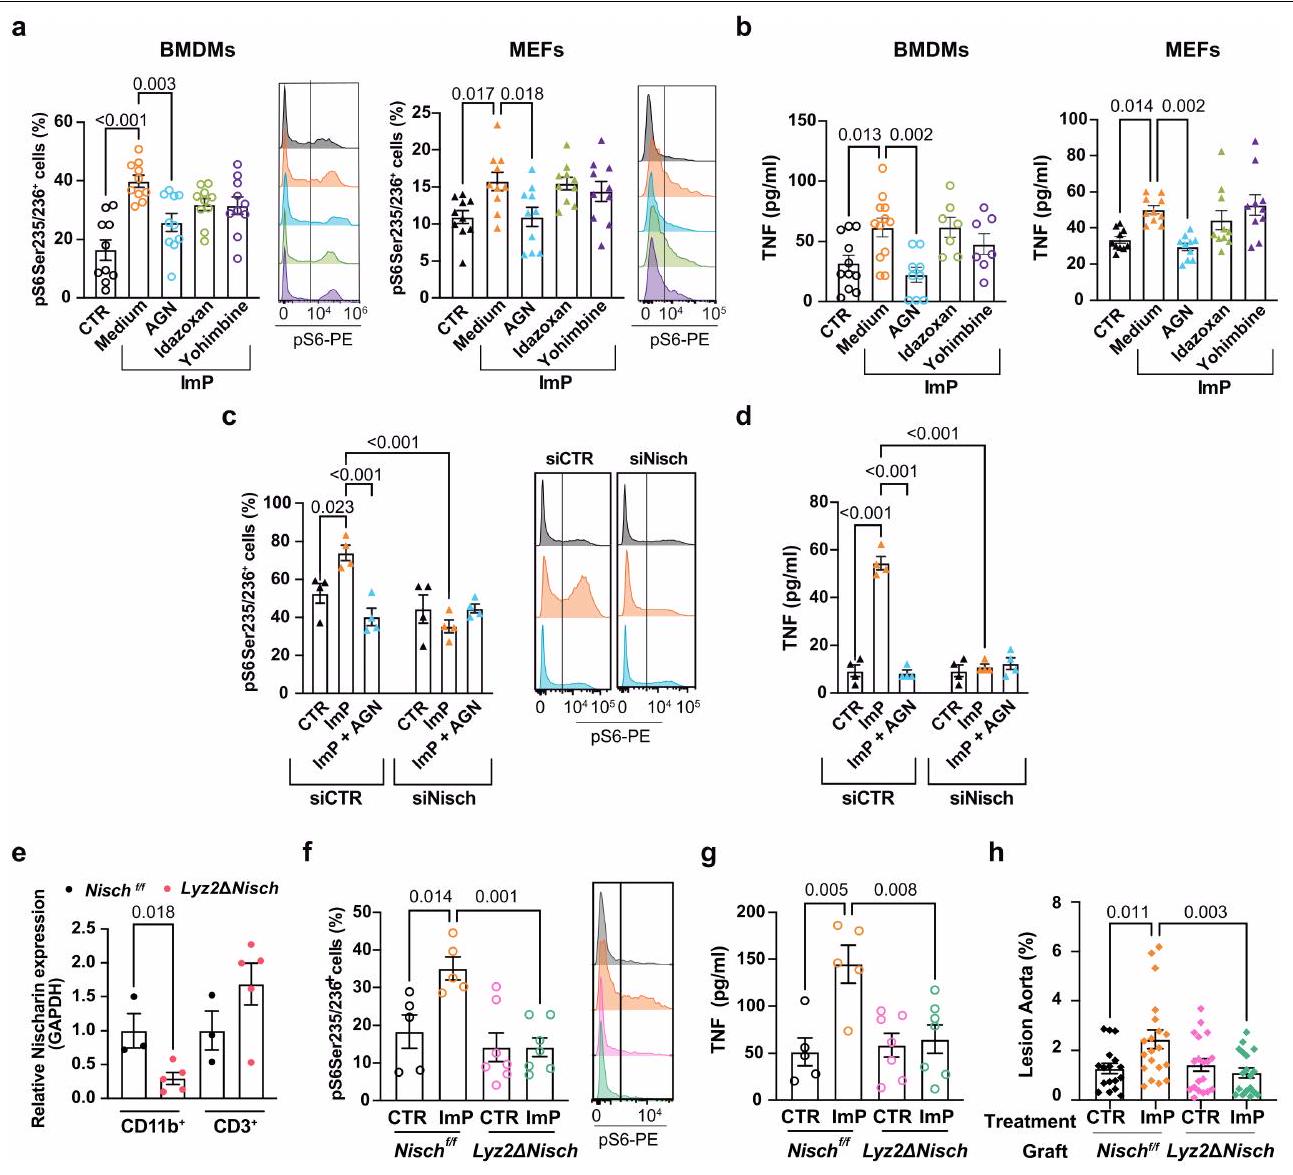
ImP يقود تصلب الشرايين عبر IIR في الخلايا النخاعية

نظرًا لأن ImP يحتوي على حلقة إيميدازول، افترضنا أنه يمكن أن يتم استشعاره بواسطة مستقبلات الإيميدازولين المعبر عنها بشكل شائع IIR و لذا قمنا بمعالجة BMDMs و MEFs بـ ImP في وجود AGN192403 (مضاد I1R) أو إيدازوكسين (مضاد لمستقبلات الإيميدازولين) . نظرًا لأن العديد من ligands مستقبلات الإيميدازولين قد ترتبط أيضًا -مستقبلات الأدرينالين (على سبيل المثال، إيدازوكسين)، قمنا بتضمين يوهيمبين (وهو مضاد لمستقبلات الأدرينالين مع تقارب منخفض لمستقبلات الإيميدازولين زيادة p-S6 وتحفيز TNF في BMDMs وMEFs، وكان هذا التأثير محجوزًا بشكل انتقائي بواسطة AGN192403 (الشكل التمديدي 6a، b). أكدت التحليلات الفوسفوبروتينية أن AGN192403 قام بتثبيط تنشيط مسار mTOR الناتج عن ImP (الشكل 3h). أدى إسكات IIR بواسطة RNAs مثبطة صغيرة (siRNAs) تستهدف Nisch في MEFs إلى حجب إنتاج p-S6 وTNF الناتج عن ImP، مما يكشف أن ImP يشير بشكل انتقائي من خلال I1R لهذه الوظائف الالتهابية. من الجدير بالذكر أن AGN192403 منع p-S6 أو TNF الناتج عن ImP في خلايا تم علاجها بـ siRNA التحكم، لكنه لم يكن له تأثير في الخلايا التي تم إسكات IIR فيها، مما يتماشى مع التأثير الانتقائي لهذا المثبط على محور ImP-I1R (الشكل التمديدي 6c، d).
لتحليل وظيفة ImP في خلايا النخاع الشوكي بشكل أعمق، قمنا بتزاوج فئران Lyz2-cre مع Nisch. فئران لتوليد فئران Lyz24Nisch. أظهر تحليل تعبير Nisch حذفًا انتقائيًا في خلايا النخاع العظمي الطحالية، على عكس الحفاظ على التعبير في خلايا فأر إيش مقارنة مع التحكم نيش الفئران (الشكل 6e من البيانات الموسعة). من الجدير بالذكر أن تحفيز p-S6 وإنتاج TNF بواسطة BMDMs المدفوع بـ ImP كان معتمدًا بالكامل على Nisch (الشكل 6f,g من البيانات الموسعة)، مما يؤكد IIR كالعائل. مستقبل. لتحديد ما إذا كان حجب محور ImP-IIR في الخلايا النخاعية سيمنع التأثيرات الأثيروجينية لـ ImP، قمنا بإعطاء ImP لـ Ldlr فئران CD45.1 المزروعة بنخاع العظم من أو غياب IIR في الخلايا النخاعية منع تصلب الشرايين الناتج عن ImP (الشكل 4 أ والشكل التمديدي 6 ح).
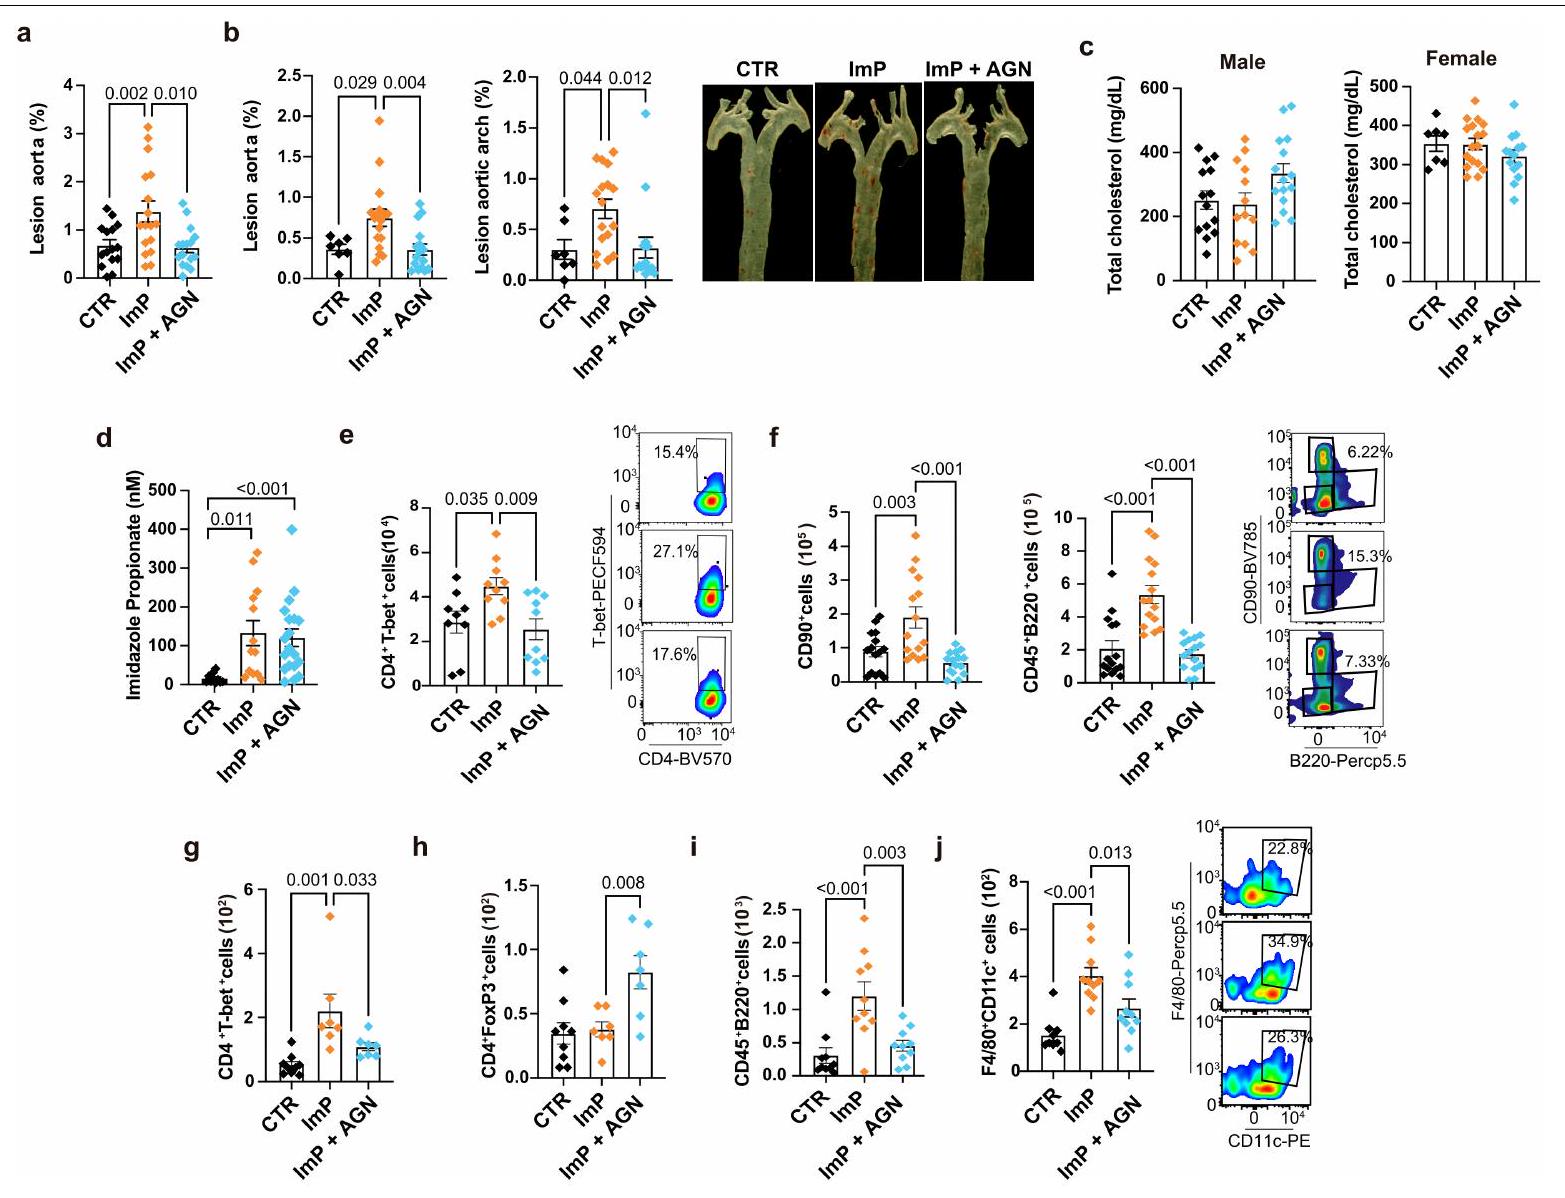
لتحليل الاستخدام المحتمل لـ AGN192403 لمنع تصلب الشرايين الناتج عن ImP، قمنا بإعطاء ImP و AGN192403 معًا في مياه الشرب لجرذان Apoe التي تتغذى على العلف. الفئران لمدة ثمانية أسابيع. لاحظنا أن العلاج بـ AGN192403 منع تكوين لويحات تصلب الشرايين الناتجة عن ImP في كل من الفئران الذكور والإناث (الشكل 4ب والشكل الإضافي 7أ، ب)، دون التأثير على إجمالي الكوليسترول أو تركيز ImP في البلازما (الشكل الإضافي 7ج، د). منع علاج AGN192403 التوسع الناتج عن ImP في Ly6C وحيدات النواة و الخلايا، إنتاج السيتوكينات المؤيدة للالتهابات، زيادة في الخلايا B و T الدائرة و p-S6 المعتمد على ImP في البلعميات البريتونية (الشكل 4c-e والشكل الإضافي 7f). علاوة على ذلك، أثر علاج AGN192403 على تسلل الخلايا المناعية في الشريان الأورطي، من خلال حجب القدرة المحلية لـ ImP على زيادة تنظيمي نسبة الخلايا (الشكل 4f والشكل الإضافي 7g، h) ومنع تسلل البلعميات المؤيدة للالتهاب والخلايا B الناتج عن ImP (الشكل 4g والشكل الإضافي 7i، j). تظهر هذه النتائج أن الحذف المحدد لـ IIR في الخلايا النخاعية وAGN192403 يمنع تصلب الشرايين الناتج عن ImP في الفئران المعرضة لتصلب الشرايين التي تتغذى على الطعام العادي.

حجب ImP-I1R يمنع تقدم تصلب الشرايين

لتقييم قدرة تثبيط محور ImP-IIR على علاج تصلب الشرايين، قمنا بتغذية تم تغذية الفئران على نظام غذائي عالي الدهون أو نظام غذائي HC لمدة ثمانية أسابيع وتم علاجها أو عدم علاجها بـ AGN192403 في الأسابيع الأربعة الأخيرة من نظام HC الغذائي. أدى نظام HC الغذائي إلى تحفيز تصلب الشرايين وإنتاج ImP، وكان العلاج بـ AGN192403 مثبطًا لتقدم تصلب الشرايين في الفئران الذكور والإناث، دون التأثير على تركيز ImP (الشكل 4 والبيانات الموسعة الشكل 8a-c). ومن الجدير بالذكر أن هذا العلاج قلل أيضًا من حجم اللويحات، وتمدد النواة النخرية وصبغة الكاسبيز-3 (الشكل 4i والبيانات الموسعة الشكل 8d)، مما يدل على تقليل تعقيد اللويحات في الفئران. . ومع ذلك، لم يؤثر هذا التأثير الوقائي على زيادة تركيز الكوليسترول
الشكل 4 | حجب IIR يمنع تحفيز تصلب الشرايين بواسطة ImP أو نظام غذائي عالي الكوليسترول. أ، فئران تم زراعتها بنخاع العظام من مجموعة التحكم نيش (Ctrl، ) أو Lyz2 نيش (Ctrl، ) وتم تغذيته بنظام غذائي من الشوفان لمدة 12 أسبوعًا. صبغة الزيت الأحمر O لقوس الأبهر (يسار) وصور تمثيلية للأبهر (يمين). ب-ج، تغذية بالشوفان تمت معالجة الفئران كما هو موضح. ب، صبغة الزيت الأحمر O لقوس الشريان الأورطي (يسار) وصور تمثيلية للشريان الأورطي (يمين). Ctrl، AGN، . ج، يسار، Ly6C وحيدات النوى في الدم عند نقطة النهاية ). صحيح، مخططات كثافة التمثيل. د، IFN و TNF في البلازما. . e، اليسار، صبغة p-S6 في البلعميات البريتونية. Ctrl، ; AGN . صحيح، الرسوم البيانية التمثيلية. ف، نسبة إلى خلايا مت infiltrated في الشريان الأورطي. خلايا مت infiltrated في الشريان الأورطي. يسار، بيانات فردية. يمين، مخططات كثافة تمثيلية. ح-م، أبوي تم إطعام الفئران نظام غذائي عادي أو نظام غذائي عالي الكربوهيدرات لمدة 8 أسابيع؛ تم إضافة AGN192403 إلى مجموعة النظام الغذائي العالي الكربوهيدرات (HC + AGN) في الأسابيع الأربعة الأخيرة.
صبغة قوس الأبهر (يسار) وصور تمثيلية للأبهر (يمين). تشاو، صبغة ماسون ثلاثية الألوان لجذور الشريان الأورطي. قياس الآفات في جذور الشريان الأورطي (يسار)، منطقة النواة النخرية (وسط) وصور تمثيلية (يمين). تشير الأسهم إلى المناطق النخرية. تشاو، شريط المقياس، البيانات الفردية (يسار) ومخططات الكثافة التمثيلية (يمين) لتحديد كمية Ly6C في الدم باستخدام تحليل تدفق الخلايا وحيدات النواة ; تشاو، ; HC، ; HC + AGN، ) و T-bet خلايا ( ; تشاو، ; HC، ; HC ). أنا، بلازما IFN و TNF. تشاو، ; HC، ; HC + AGN، . م، بيانات فردية (يسار؛ تشاو، ومخططات تمثيلية (يمين) لتلوين p-S6 في البلعميات البريتونية. أ-م، نقاط بيانات فردية ومتوسط ± خطأ معياري من على الأقل تجربتين مستقلتين مجمعتين. تحليل التباين أحادي الاتجاه مع تصحيح توكي بعد الاختبار.
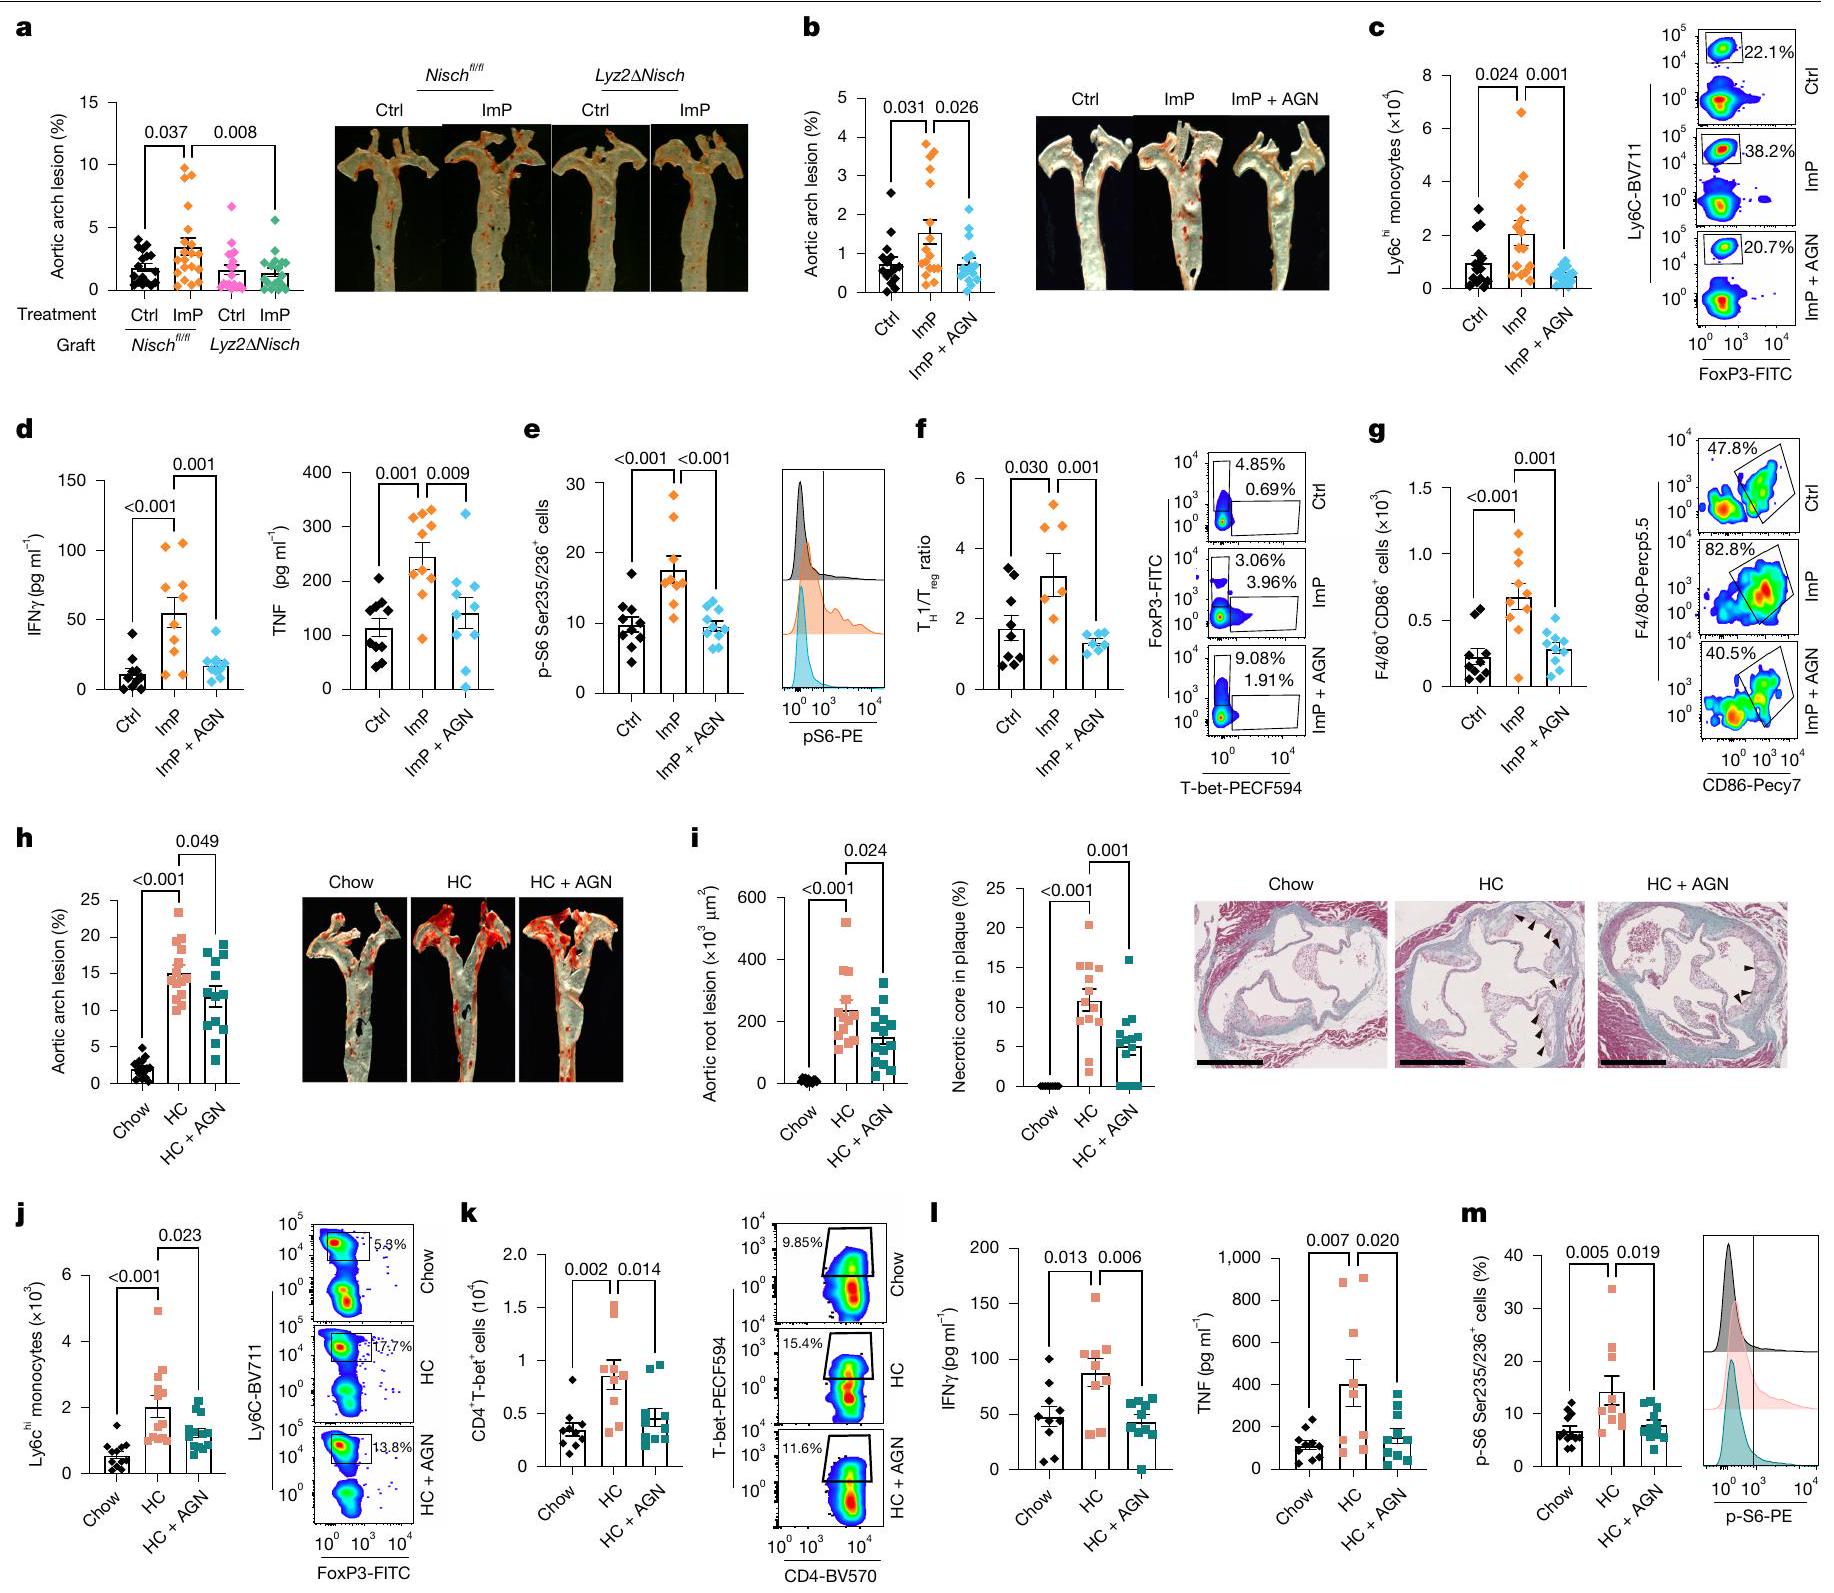
في الفئران التي تم تغذيتها بنظام HC الغذائي (الشكل التوضيحي الممتد 8e). علاوة على ذلك، فإن علاج AGN192403 منع التحفيز المعتمد على نظام HC الغذائي لمستويات Ly6C في الدم. وحيدات النواة، المناعة والسيتوكينات المؤيدة للالتهابات (الشكل 4j-1). كما أن العلاج أثر سلبًا على تحفيز p-S6 الناتج عن النظام الغذائي عالي الدهون في البلعميات البريتونية (الشكل 4m). تظهر هذه النتائج أن إعطاء AGN192403، الذي يثبط محور ImP-I1R، يمنع تصلب الشرايين المرتبط بتنشيط خلايا المناعة دون التأثير على
تركيز الكوليسترول في البلازما، مما يشير إلى نهج جديد لعلاج تصلب الشرايين.

نقاش

تسبب العوامل المعقدة لأمراض القلب والأوعية الدموية والطبيعة الصامتة لتصلب الشرايين تحديات في اكتشاف المراحل المبكرة من المرض.
ركزت الدراسات السابقة على ارتباطات ImP وغيرها من المستقلبات المعتمدة على الميكروبات بمراحل متقدمة من أمراض القلب والأوعية الدموية أو الوفيات. على وجه التحديد، تم ربط ImP بمرض السكري من النوع 2، والأمراض القلبية الأيضية لدى الأشخاص المصابين بفيروس نقص المناعة البشرية، ومرض الشريان التاجي، وفشل القلب. . هنا، نوضح أن ImP مرتبط بتقدم تصلب الشرايين في الفئران ومع تصلب الشرايين النشط تحت السريري في مجموعة صحية بخلاف ذلك، حيث يتم اكتشاف تصلب الشرايين فقط من خلال دراسات التصوير المتقدمة التي لا تتوفر في الممارسة السريرية لفحوصات السكان الكبيرة. . تم التحقق من هذه النتائج بشكل مستقل في مجموعة إضافية من مرضى تحمل الجلوكوز المختل، على الرغم من الاختلافات في تركيز ImP الوسيط في مجموعة PESA، مما يدعم العلاقة بين ImP وتصلب الشرايين المبكر ويقترح استخدامه كتشخيص مرافق وهدف علاجي للطب الشخصي. علاوة على ذلك، نوضح أن ImP يحفز تصلب الشرايين دون التأثير على تركيز الكوليسترول في الدم. يمكن أن تكون التأثيرات المؤيدة لتصلب الشرايين لـ ImP متعددة الأوجه وتؤثر على أنواع خلايا متعددة. لقد لاحظنا أن إدارة ImP أدت إلى زيادة محلية في النشاط النسخي في البلعميات، والألياف، وإلى حد أقل، الخلايا البطانية. كانت هذه التغيرات النسخية تتميز بزيادة تجنيد خلايا المناعة والالتهاب، مما قد يكون وراء تأثير ImP المسبب لتصلب الشرايين. بالإضافة إلى ذلك، قام ImP بتنشيط استجابات مناعية فطرية ومكتسبة مؤيدة لتصلب الشرايين، مما أدى إلى زيادة تسلل خلايا المناعة إلى جذور الشريان الأورطي، مما ساهم في تقدم تصلب الشرايين. ، مما يرتبط بشكل أكبر بالمضاعفات السريرية واللويحات غير المستقرة أو القابلة للكسر على الرغم من أن إدارة ImP لا تؤثر على تركيز الجلوكوز، وضغط الدم وبعض معايير وظائف الكلى والكبد، لا يمكننا استبعاد أن التأثيرات النظامية الأخرى قد تساهم في المرض، والتي سيتعين تناولها في الدراسات المستقبلية.
نحدد IIR كمستقبل لـ ImP الذي يحفز إنتاج p-S6 والسيتوكينات المؤيدة للالتهابات، بما يتماشى مع تنشيط mTOR في البلعميات الذي يساهم في تصلب الشرايين. نجد أن تصلب الشرايين الناتج عن ImP يعتمد بالكامل على تعبير IIR في الخلايا النخاعية. ومع ذلك، نظرًا لتعبير وتأثيرات النسخ لـ ImP في أنواع الخلايا الأخرى التي تساهم في تصلب الشرايين (الخلايا الليفية والخلايا البطانية)، قد يؤثر ImP أيضًا على هذه الخلايا من خلال تعزيز تصلب الشرايين. يمنع الحصار الدوائي لـ IIR تقدم تصلب الشرايين والاستجابة الالتهابية الناتجة عن نظام غذائي ImP أو HC، بغض النظر عن التغيرات في تركيز الكوليسترول ولكن يعتمد على حجب mTOR في البلعميات. ومن الجدير بالذكر أن حجب I1R قلل أيضًا من صبغة الكاسبيز-3 والنواة النخرية في اللويحة كقراءات لتعقيد اللويحة المرتبط باللويحات النشطة وغير المستقرة. الذي قد يكون أساسًا لارتباطه بفشل القلب تُستخدم العلاجات المخفضة للدهون حاليًا لمنع تقدم تصلب الشرايين. ومع ذلك، لا يزال معدل الأحداث القلبية الوعائية مرتفعًا حتى لدى المرضى الذين يتلقون علاجات مخفضة للدهون مناسبة. على الرغم من توفر علاجات أخرى، إلا أنها لم تُثبت بعد لعلاج تصلب الشرايين وعادة ما تكون مرتبطة بعوامل الخطر المعروفة. لذا، نقترح محور ImP-I1R في الخلايا النخاعية كهدف مستقل لعلاج تصلب الشرايين الذي قد يتعاون بشكل محتمل مع العلاجات الحالية.

المحتوى عبر الإنترنت

أي طرق، مراجع إضافية، ملخصات تقارير Nature Portfolio، بيانات المصدر، بيانات موسعة، معلومات تكميلية، شكر وتقدير، معلومات مراجعة الأقران؛ تفاصيل مساهمات المؤلفين والمصالح المتنافسة؛ وبيانات توفر البيانات والرموز متاحة علىhttps://doi.org/10.1038/s41586-025-09263-w.
4. براندتس، ج. وراي، ك. ك. علاجات جديدة ومستقبلية لتعديل الدهون للوقاية من أمراض القلب والأوعية الدموية. نات. ريف. كارديو. 20، 600-616 (2023).
5. ريدكر، ب. م. وآخرون. العلاج المضاد للالتهابات باستخدام كاناكنوماب لمرض تصلب الشرايين. نيو إنجلاند جورنال أوف ميديسين 377، 1119-1131 (2017).
6. نيلسون، ك.، فوستر، ف. & ريدكر، ب. م. الكولشيسين بجرعة منخفضة للوقاية الثانوية من مرض الشريان التاجي. مجلة الكلية الأمريكية لأمراض القلب 82، 648-660 (2023).
7. ساباتين، م. س. وآخرون. إيفولوكوماب والنتائج السريرية لدى المرضى الذين يعانون من أمراض القلب والأوعية الدموية. نيو إنجلند جورنال أوف ميديسين 376، 1713-1722 (2017).
8. كاسينبروود، ل. وآخرون. توزيع تقدير خطر الأحداث الوعائية المتكررة على مدى 10 سنوات والخطر المتبقي في مجموعة الوقاية الثانوية. الدورة الدموية 134، 1419-1429 (2016).
9. تشاكرون، ر. م.، أولسون، ل. م. وباكهيد، ف. إمكانيات تخصيص الميكروبيوم المعوي للوقاية من الأمراض القلبية الأيضية وعلاجها. نات. ريف. كارديو. 20، 217-235 (2023).
10. نيمت، إ. وآخرون. أطلس لمنتجات الميكروبات المعوية المستمدة من الأحماض الأمينية العطرية ومخاطر الأمراض القلبية الوعائية والوفيات. مجلة القلب الأوروبية 44، 3085-3096 (2023).
11. ويتكوفسكي، م.، ويكس، ت. ل. & هازن، س. ل. ميكروبيوتا الأمعاء وأمراض القلب والأوعية الدموية. دائرة. بحث. 127، 553-570 (2020).
12. نيمت، إ. وآخرون. مستقلب ميكروبي معوي مرتبط بأمراض القلب والأوعية الدموية يعمل عبر مستقبلات الأدرينالين. خلية 180، 862-877.e22 (2020).
13. مارتينيز-لوبيز، م. وآخرون. استشعار الميكروبيوتا بواسطة محور مينكل-سايك في الخلايا الشجرية ينظم إنتاج الإنترلوكين-17 و-22 ويعزز سلامة الحاجز المعوي. المناعة 50، 446-461.e9 (2019).
14. وانغ، ز. وآخرون. استقلاب فلورا الأمعاء للفوسفاتيديل كولين يعزز أمراض القلب والأوعية الدموية. نيتشر 472، 57-63 (2011).
15. كو، أ. وآخرون. الإيميدازول بروبيونات المنتج ميكروبيًا يعيق إشارات الأنسولين من خلال mTORC1. خلية 175، 947-961.e17 (2018).
16. رويير، ب. وآخرون. بروتيوميات البلازما لتوقع التكلسات الشريانية التاجية تحت السريرية في الوقاية الأولية. مجلة القلب الأمريكية 271، 55-67 (2024).
17. مولينارو، أ. وآخرون. تم زيادة بروبيونات الإيميدازول في مرض السكري وهو مرتبط بأنماط النظام الغذائي وبيئة الميكروبات المتغيرة. نات. كوميونيك. 11، 5881 (2020).
18. كوري، أ. وآخرون. الميكروبات الفموية والمعوية واللويحات في المرضى الذين يعانون من تصلب الشرايين. وقائع الأكاديمية الوطنية للعلوم 108، 4592-4598 (2011).
19. ترسيد، م.، أندرسن، ج. Ø.، بروخ، ك. & هوف، ج. ر. الميكروبيوم المعوي في مرض الشريان التاجي وفشل القلب: المعرفة الحالية والاتجاهات المستقبلية. إي بايو ميديسين 52، 102649 (2020).
20. فرنانديز-فرييرا، ل. وآخرون. الالتهاب الوعائي في تصلب الشرايين تحت السريري المكتشف بواسطة PET/MRI الهجين. مجلة الكلية الأمريكية لأمراض القلب 73، 1371-1382 (2019).
21. ديفيسا، أ. وآخرون. تنشيط نخاع العظام استجابةً لمتلازمة الأيض وتصلب الشرايين المبكر. مجلة القلب الأوروبية 43، 1809-1828 (2022).
22. ما، ج.، ليو، ج.، صن، ي. وزهاو، ز. السيتوكينات المرتبطة بالاستجابة المناعية في تصلب الشرايين. المجلة الأمريكية للبحوث الانتقالية 14، 6424-6444 (2022).
23. غولد، إي. إس. وآخرون. ATF3 يحمي من تصلب الشرايين عن طريق قمع تكوين أجسام الدهون المستحث بواسطة 25-هيدروكسي كوليسترول. ج. إكسب. ميد. 209، 807-817 (2012).
24. وكيليك، س. ك.، دنفي، ج.، هيراس-مورييلو، إ.، ماسترنغو، أ. وسانشو، د. استقلاب البلعميات النسيجية في التوازن والمرض. الخلية. المناعة الجزيئية. 19، 384-408 (2022).
25. تشين، ج. ي.، كورتيز، س. و فيريرا، ف. ب. بروبردين: جزيء متعدد الأوجه مرتبط بالالتهابات والأمراض. مناعة جزيئية 102، 58-72 (2018).
26. كيس، م. ج. وبايندر، س. ج. التأثير المتعدد الأوجه للمكمل على تصلب الشرايين. تصلب الشرايين 351، 29-40 (2022).
27. كان، هـ. وآخرون. تحليل النسخ الجيني على مستوى الخلية الواحدة يكشف عن تباين خلوي في الشرايين الأورطية الصاعدة للفئران العادية والفئران التي تتبع نظام غذائي عالي الدهون. التجارب. مول. ميد. 53، 1379-1389 (2021).
28. زهاو، ج. وآخرون. تقنيات النسخ الجيني على مستوى الخلية الواحدة تكشف عن مرونة البطانة خلال تكوين تصلب الشرايين السكري. Front. Cell Dev. Biol. 9، 689469 (2021).
29. غوتشيفا، ف.، تشين، إكس.، بيترز، سي.، رينهكل، تي. وجويس، ج. أ. حذف الكاتيبسين H يعيق التحول الوعائي، التوعية ونمو الأورام في نموذج فأر لسرطان خلايا جزر البنكرياس. الكيمياء الحيوية 391، 937-945 (2010).
30. شيه، س.-سي. وآخرون. بروتين L6 TM4SF1 حاسم لوظيفة الخلايا البطانية وتكوين الأوعية الدموية في الأورام. أبحاث السرطان 69، 3272-3277 (2009).
31. شنييلر، د. وآخرون. السيتوكين الشبيه 1 هو عامل جديد محفز لتكوين الأوعية يتم إفرازه بواسطة خلايا السلف البطانية ويقوم بوساطة وظائفها. دائرة. بحث. 124، 243-255 (2019).
32. داير، ل. أ.، بي، إكس. و باترسون، س. دور BMPs في وظيفة الخلايا البطانية وعدم وظيفتها. اتجاهات الغدد الصماء والتمثيل الغذائي 25، 472-480 (2014).
33. آييلو، ر. ج. وآخرون. بروتين كيميائي جذب وحيدات النوى-1 يسرع تصلب الشرايين في الفئران التي تفتقر إلى بروتين الأبوليبوبروتين E. علم الأوعية الدموية. 19، 1518-1525 (1999).
34. وانغ، ل.، لورانس، ج. س.، ستورغيل، ت. و. & هاريس، ت. إ. نشاط مركب الهدف الثديي من الراباميسين 1 (mTORC1) مرتبط بفوسفاتة الرابتور بواسطة mTOR. ج. كيمياء حيوية. 284، 14693-14697 (2009).
35. بوسكيه، ب.، هودسون، أ.، غارسيا-سيفيلا، ج. أ. ولي، ج.-إكس. نظام مستقبلات الإيميدازولين: الماضي، الحاضر، والمستقبل. مراجعة علم الأدوية 72، 50-79 (2020).
36. هيد، ج. أ. ومايوروف، د. ن. مستقبلات الإيميدازولين، عوامل جديدة والإمكانات العلاجية. عوامل الأدوية القلبية الوعائية والدموية. 4، 17-32 (2006).
37. زانغ، إكس. وآخرون. الأنظمة الغذائية الغنية بالبروتين تزيد من خطر الإصابة بأمراض القلب والأوعية الدموية من خلال تنشيط الماكرومير mTOR لقمع الميتوفاجي. نات. ميتاب. 2، 110-125 (2020).
38. مولينارو، أ. وآخرون. الإيميدازول بروبيونات المنتج ميكروبيًا مرتبط بفشل القلب والوفيات. مجلة جACC لفشل القلب. 11، 810-821 (2023).
39. زو، و. وآخرون. المستقلبات الميكروبية المعوية TMAO تعزز فرط تفاعل الصفائح الدموية وزيادة خطر thrombosis. خلية 165، 111-124 (2016).
40. وانغ، ز. وآخرون. ميكروبيوتا الأمعاء، وعوامل الالتهاب الدائرة، والمواد الأيضية، وتصلب الشرايين السباتية في عدوى فيروس نقص المناعة البشرية. ميكروبيوم 11، 119 (2023).
41. فان سون، ج. وآخرون. بروبيونات الإيميدازول في البلازما مرتبط إيجابيًا بضغط الدم لدى البشر الذين يعانون من زيادة الوزن والسمنة. المغذيات 13، 2706 (2021).
42. ترواسيد، م. وآخرون. التغيرات في ميكروبيوم الأمعاء ومستويات الإيميدازول بروبيونات المتداولة مرتبطة بمرض الشريان التاجي الانسدادي لدى الأشخاص المصابين بفيروس نقص المناعة البشرية. مجلة الأمراض المعدية 229، 898-907 (2024).
43. ناجيسواران، ف. وآخرون. المستقلبات الميكروبية المعوية إيميدازول بروبيونات تؤثر سلبًا على وظيفة الخلايا البطانية وتعزز تطور تصلب الشرايين. علم الأوعية الدموية. 45، 823-839 (2025).
44. ويست، ر. س. أ. وآخرون. تقنيات التصوير بالرنين المغناطيسي الناشئة لتصوير تصلب الشرايين. علم الأوعية الدموية. 39، 841-849 (2019).
45. جيمبرون، م. أ. وغارسيا-كاردينا، ج. خلل وظيفة الخلايا البطانية وعلم الأمراض المرتبط بتصلب الشرايين. دائرة. بحث. 118، 620-636 (2016).
46. روي، ب.، أوريكشوني، م. ولي، ك. كيف يشكل الجهاز المناعي تصلب الشرايين: أدوار المناعة الفطرية والتكيفية. نات. ريف. إيمونول. 22، 251-265 (2022).
47. فين، أ. ف.، ناكانو، م.، نارولا، ج.، كولودجي، ف. د. وفيرماني، ر. مفهوم اللويحة القابلة للخطر/ غير المستقرة. علم الأوعية الدموية والتخثر. 30، 1282-1292 (2010).
48. وولف، د. ولي، ك. المناعة والالتهاب في تصلب الشرايين. دائرة. بحث. 124، 315-327 (2019).
49. زانغ، إكس. وآخرون. تحديد تأثير العتبة الذي يتوسطه الليوسين والذي يحكم إشارة الماكرومول الماكرومول والمخاطر القلبية الوعائية. نات. ميتاب. 6، 359-377 (2024).
50. لويد-جونز، د. م. وآخرون. 2017 تحديث مركّز لمسار قرار الإجماع من خبراء ACC لعام 2016 حول دور العلاجات غير الستاتينية في خفض كوليسترول LDL في إدارة مخاطر مرض القلب والأوعية الدموية التصلبي: تقرير من مجموعة العمل التابعة للكلية الأمريكية لأمراض القلب حول مسارات قرار الإجماع من الخبراء. ج. أم. كول. كارد. 70، 1785-1822 (2017).
51. غوبتا، أ. وآخرون. الأحداث السلبية المرتبطة بالعلاج بالستاتين غير المموه، ولكن ليس مع العلاج المموه، في تجربة النتائج القلبية الأنجلو-سكندنافية – ذراع خفض الدهون (ASCOT-LLA): تجربة عشوائية مزدوجة التعمية خاضعة للرقابة الوهمية ومرحلتها غير العشوائية وغير المموهة. لانسيت 389، 2473-2481 (2017).
ملاحظة الناشر: تظل شركة سبرينغر ناتشر محايدة فيما يتعلق بالمطالبات القضائية في الخرائط المنشورة والانتماءات المؤسسية.
الوصول المفتوح هذه المقالة مرخصة بموجب رخصة المشاع الإبداعي النسبية-غير التجارية-بدون اشتقاقات 4.0 الدولية، التي تسمح بأي استخدام غير تجاري، ومشاركة، وتوزيع، وإعادة إنتاج في أي وسيلة أو صيغة، طالما أنك تعطي الائتمان المناسب للمؤلفين الأصليين والمصدر، وتوفر رابطًا لرخصة المشاع الإبداعي، وتوضح إذا قمت بتعديل المادة المرخصة. ليس لديك إذن بموجب هذه الرخصة لمشاركة المواد المعدلة المشتقة من هذه المقالة أو أجزاء منها. الصور أو المواد الأخرى من طرف ثالث في هذه المقالة مشمولة في رخصة المشاع الإبداعي الخاصة بالمقالة، ما لم يُشار إلى خلاف ذلك في سطر الائتمان للمادة. إذا لم تكن المادة مشمولة في رخصة المشاع الإبداعي الخاصة بالمقالة وكان استخدامك المقصود غير مسموح به بموجب اللوائح القانونية أو يتجاوز الاستخدام المسموح به، فستحتاج إلى الحصول على إذن مباشرة من صاحب حقوق الطبع والنشر. لعرض نسخة من هذه الرخصة، قم بزيارة http:// creativecommons.org/licenses/by-nc-nd/4.0/.
© المؤلفون 2025، نشر معدل 2025
¹المركز الوطني لأبحاث القلب والأوعية الدموية كارلوس الثالث (CNIC)، مدريد، إسبانيا. مدرسة الدكتوراه، الجامعة المستقلة في مدريد، مدريد، إسبانيا. مدرسة الدكتوراه، جامعة كومبلوتنسي بمدريد، مدريد، إسبانيا. معهد الأبحاث الحيوية سولس-موريال (IIBM)، المجلس الوطني الإسباني للبحث – جامعة مدريد المستقلة، مدريد، إسبانيا. قسم الكيمياء الحيوية، كلية الطب، جامعة مدريد المستقلة، مدريد، إسبانيا. مستشفى لا باز معهد أبحاث الصحة – إيديبا، مدريد، إسبانيا. مستشفى فاستر للقلب في جبل سيناء، كلية الطب في جبل سيناء، نيويورك، نيويورك، الولايات المتحدة الأمريكية. سيبر للأمراض القلبية الوعائية (CIBER-CV)، مدريد، إسبانيا. مختبر والينبرغ، قسم الطب الجزيئي والسريري، جامعة غوتنبرغ، غوتنبرغ، السويد. قسم الوراثة السريرية والجينوميات، مستشفى ساهلجرينسكا الجامعي، غوتنبرغ، السويد. قسم العلاجات السريرية، جامعة أثينا الوطنية وكابوديستريان، كلية الطب، أثينا، اليونان. مدرسة الهندسة الطبية الحيوية وعلوم التصوير، كلية كينغز لندن، لندن، المملكة المتحدة. قسم الفسيولوجيا، كلية الطب، جامعة باتراس، باتراس، اليونان. إنمونوتيك إس إل، ألكالا دي هيناريس، إسبانيا. قسم علم الأمراض، كلية الطب بجامعة ميتشيغان، آن آربر، ميشيغان، الولايات المتحدة الأمريكية. قسم المناعة، معهد الأبحاث الصحية بمستشفى الأميرات، مدريد، إسبانيا. قسم الطب، جامعة مدريد المستقلة (UAM)، مدريد، إسبانيا. مركز الميتابولوميات والتحليل الحيوي (CEMBIO)، كلية الصيدلة، جامعة سان بابلو-CEU، بوديلا ديل مونتي، إسبانيا. مركز روجيل للسرطان، كلية الطب بجامعة ميتشيغان، آن آربر، ميشيغان، الولايات المتحدة الأمريكية. مركز تعليم وبحوث الأمراض المعدية (CIDER)، جامعة أوساكا، أوساكا، اليابان. قسم أبحاث القلب والأوعية الدموية، المركز الأوروبي لعلوم الأوعية (ECAS)، كلية الطب مانهايم، جامعة هايدلبرغ، مانهايم، ألمانيا. المركز الألماني لأبحاث القلب والأوعية الدموية (DZHK)، موقع الشريك هايدلبرغ/مانهايم، مانهايم، ألمانيا. قسم الطب السادس، مركز جامعة مانهايم الطبي، جامعة هايدلبرغ، مانهايم، ألمانيا. معهد هلمهولتز للعلوم القلبية الوعائية الانتقالية (HI-TAC) في مركز ماكس ديلبروك للطب الجزيئي في جمعية هلمهولتز (MDC)، جامعة هايدلبرغ، مانهايم، ألمانيا. قسم الفيزيولوجيا السريرية، مستشفى ساهلجرينسكا الجامعي، غوتنبرغ، السويد. مبادرة صحة الميكروبيوم من مؤسسة نوفو نورديسك، الجامعة التقنية في الدنمارك، كونغنس لينغبي، الدنمارك. المعهد الوطني للغذاء، الجامعة التقنية في الدنمارك، كونغنس لينغبي، الدنمارك. معهد زينا ومايكل أ. وينر لأمراض القلب، كلية أيخان للطب في جبل سيناء، نيويورك، الولايات المتحدة الأمريكية. معهد أبحاث الصحة، مؤسسة خيمينيز دياث، الجامعة المستقلة في مدريد (IIS FJD-UAM)، مدريد، إسبانيا. ساهم هؤلاء المؤلفون بالتساوي: أنالورا ماسترنجيلو، إينياكي روبلز-فيرا. البريد الإلكتروني: dsancho@cnic.es

طرق

فئران

تم تربية الفئران والحفاظ عليها في مجموعات من خمسة حيوانات لكل قفص في CNIC تحت ظروف خالية من مسببات الأمراض المحددة. استخدمنا خلفية بروأثيروجينية B6.129P2-Apoe. فئران (مختبر جاكسون، السلالة 002052، Apoe ); B6.129S7-Ldlr فئران /J (مختبر جاكسون، السلالة 002207، Ldlr ) تم التهجين مع B6.SJL-Ptprc بيبك فئران /BoyJ التي تعبر عن علامة CD45.1 المتجانسة (مختبر جاكسون، السلالة 002014، B6 CD45.1)؛ B6.129S7-Rag1 فئران (مختبر جاكسون، السلالة 002216، Rag1 ); B6.Cg-Rptor فئران (مختبر جاكسون، السلالة 013188، راب ) تم تزاوجها مع B6.129P2-Lyz2 فئران (cre)Ifo/J (مختبر جاكسون، السلالة 004781، Lyz2-cre) لإنتاج Lyz2 رافتور (كري ) والتحكم في رابتور (كري الأشقاء من نفس الولادة استخدموا كضوابط. الحيوانات المنوية من B6.Nisch تم استخدام فئران /H (مركز ماري ليون في MRC هارويل، المملكة المتحدة؛ EM:08808) للتخصيب في المختبر لفئران ROSA-Flpe (Gt(ROSA)26Sor لإنشاء نيش فئران (tm1c). نيش تم تزاوج الفئران مع Lyz2-cre (B6.129P2-Lyz2 (cre)Ifo/J) فئران لتوليد Lyz20Nisch ( ) والتحكم في نيش تم استخدام أشقاء (Cre-) كضوابط. كانت الفئران تتراوح أعمارها بين 7 إلى 12 أسبوعًا عند بدء التجارب. تم تخصيص أشقاء من نفس الجنس عشوائيًا لمجموعات التجربة. كان الباحثون غير مدركين لتخصيص المجموعات أثناء جمع البيانات وتحليلها لتقليل التحيز. تمت الموافقة على الدراسات الحيوانية من قبل لجنة الأخلاقيات المحلية في CNIC وUAM ومجتمع مدريد، PROEX 300.4/21 وPROEX 119.6/22. كانت جميع إجراءات الحيوانات متوافقة مع توجيه الاتحاد الأوروبي 2010/63/EU وتوصية 2007/526/EC بشأن حماية الحيوانات المستخدمة لأغراض تجريبية وعلمية أخرى، والتي يتم تنفيذها بموجب القانون الإسباني بموجب المرسوم الملكي 53/2013. تم تغذية الفئران بأنظمة غذائية مختلفة، بما في ذلك العلف، HC (10% دهون، 0.75% كوليسترول، SSNIFF S9167-E011) وHC/HC (HC + 1% كولين، SSNIFF S9167-E016)، كما هو موضح في كل تجربة. لكل فأر في اليوم، تم إعطاء Biogen Cientifica BA-F-3185.0001 في مياه الشرب. AGN192403 ( تم إعطاء g لكل فأر في اليوم، Labclinics B6583-10) في مياه الشرب.

إعطاء المضادات الحيوية

لإزالة البكتيريا المعوية، مزيج من المضادات الحيوية من كل من الأمبيسيلين (نورمون)، النيومايسين سلفات (سيغما ألدريتش) والميترونيدازول (سانوفي)، فانكومايسين (نورمون) و تم استخدام السوكراوز (سيغما ألدريتش) المذاب في الماء وتم تجديده كل ثلاثة أيام كما هو موضح .

تحديد كمية الآفات في الشريان الأورطي

لقياس آفات تصلب الشرايين، أو تم إطعام ذكور أو إناث الفئران نظام غذائي عادي أو نظام غذائي عالي الكوليسترول لمدة 4 أو 8 أو 12 أسبوعًا، كما هو موضح في كل تجربة. تم جمع الدم من الفئران التي تم ثقبها تحت الفك. بعد ذلك، تم ضخ الفئران بـ 10 مل من محلول ملحي فوسفات (PBS) عبر ثقب قلبي لإزالة تلوث الدم من الأنسجة الوعائية. تم تشريح الشرايين الأورطية وتثبيتها في الفورمالدهيد. (PanReac، AppliChem) في درجة حرارة الغرفة طوال الليل. ثم، تم صبغ الشرايين الأورطية المعرضة لترسبات الدهون باستخدام زيت أحمر O (سيغما ألدريش) قبل تقييم الاختبار السطحي. باختصار، بعد التثبيت، تم غسل الشرايين الأورطية بـ إيزوبروبانول وتم صبغه لمدة ساعة مع من زيت أحمر O. بعد خطوتي غسيل لمدة 5 دقائق مع الإيزوبروبانول تم تخزين الشرايين الأورطية في PBS-أزيد 0.05%. تم التقاط الصور باستخدام كاميرا لايكا نيكون مع مكبر، وتم حساب آفات تصلب الشرايين في الأورطة من خلال حساب نسبة مساحة الآفة إلى المساحة السطحية الكلية. تم إجراء هذا القياس باستخدام طريقة آلية تقوم بت quantifying تراكم الدهون في الآفات من خلال تطبيق عتبة اللون على المناطق الإيجابية لصبغة الزيت الأحمر O. تم تحديد العتبة من قبل الباحث وظلت ثابتة ضمن نفس دفعة الصبغ، كما هو موضح. تم إجراء تحليل الصور باستخدام برنامج ImageJ.

علم الأنسجة لجذور الشريان الأورطي

تم تثبيت القلوب المروية بـ الفورمالديهايد لمدة 48 ساعة في درجة حرارة الغرفة. بالنسبة لتقطيع البارافين، تم حجز القلوب المثبتة في الإيثانول 70% طوال الليل وتم تضمينها في كتل البارافين. تم قطع مقاطع بسمك أربعة ميكرومترات من جذور الشريان الأورطي وتجفيفها طوال الليل في تم استخدام بروتوكول التريكروم القياسي لبروتوكول ماسون باستخدام هيماتوكسيليين ويغرت للنوى والأخضر الفاتح كصبغة للكولاجين. تم استخدام صبغة التريكروم لتحليل اللويحات والنواة النخرية (المحددة كمناطق غير مصبوغة داخل اللويحة). تم إجراء صبغ خلايا T في جذور الشريان الأورطي للقلب بواسطة الكيمياء المناعية باستخدام جسم مضاد CD3 (Invitrogen، MA1-90582). تم إجراء صبغ البلعميات في لويحة التصلب العصيدي بواسطة الكيمياء المناعية باستخدام جسم مضاد MAC2 (Invitrogen، 14-5302-85). تم إجراء صبغ كاسبيز-3 في جذور الشريان الأورطي للقلب باستخدام جسم مضاد مضاد كاسبيز-3 (Cell Signaling Technology، 9661). تم إجراء الصبغ في جهاز صبغ تلقائي (Autostainer Plus، Dako). كأجسام مضادة ثانوية، استخدمنا مضاد ضد الأرانب (Dako Envision K4003) لصبغ CD3 وكاسبيز-3 ومضاد ضد الأرانب ضد الجرذان (Abcam Ab6734) لصبغ MAC2. تم الحصول على الصور الرقمية باستخدام ماسح Carl Zeiss Axio Scan Z1. تم إجراء تحليل الصور باستخدام برنامج NDPview 2 وImageJ.

جمع محتوى القولون

خلال عملية الانتقاء، تم استئصال الأعور وغسله بمحلول PBS لجمع محتوياته، التي تم تخزينها في حتى معالجة العينة.

تحليل المصل

تم الحصول على عينات الدم عن طريق ثقب القلب. تم جمع المصل بعد الطرد المركزي للدم عند لمدة 10 دقائق ومجمد عند تم تحليل معايير السيروم البيوكيميائية باستخدام جهاز التحليل الآلي Dimension RxL Max في اليوم التالي للاستخراج. تم قياس محتوى الجلوكوز والبروتين باستخدام جهاز التحليل الآلي Dimension RxL Max.

التحليل الأيوني الكتلي السائل غير المستهدف

المواد. كان الأسيتونيتريل من درجة LC-MS من فلوكا التحليلية؛ الميثانول والماء من فيشر العلمية؛ الإيثانول من ميرك وحمض الفورميك من هوني ويل فلوكا.
تحضير العينة. عينات البلازما تم إعدادها كما هو موصوف باختصار، تم إزالة البروتينات عن طريق إضافة مادة باردة خليط من الميثانول: الإيثانول (1:1، حجماً) بنسبة (المذيب: العينة) ومن خلال تخزين العينات على الثلج لمدة 20 دقيقة. تم إعداد عينة فارغة باتباع نفس إجراء الاستخراج، مع إضافة المذيبات فقط إلى أنبوب إيبندورف سعة 1.5 مل. تم إعداد عينات مراقبة الجودة (QCs) عن طريق تجميع عينات البلازما من مستقلين الفئران واتباع نفس إجراءات الاستخراج. تم طرد العينات، ومعايير الجودة، والعينات الفارغة، في جهاز الطرد المركزي عند لـ وتم نقل السائل العلوي إلى أنبوب إيبندورف سعة 1.5 مل. تم تجفيف السوائل العلوية بعد ذلك في جهاز السرعة (مركز Savant SPD131DDA، فخ البخار المبرد Savant RVT5105 ومضخة التفريغ OFP400، Thermo Fisher Scientific) لمدة ساعتين في درجة حرارة الغرفة. قبل تحليل LC-MS، تم إعادة تعليق العينات المجففة وعينات الجودة في و من خليط مكون من الأسيتونيتريل: عن طريق الاهتزاز المستمر في لمدة 10 دقائق عند ثم تم الطرد المركزي عند لمدة 5 دقائق لإزالة المواد غير القابلة للذوبان. تم وضع الجزء القابل للذوبان في حاوية عينة جهاز LC-MS.
تحليل LC-MS. تم إجراء تحليل الميتابولوميات غير المستهدف باستخدام نظام HPLC Ultimate 3000 الذي يتكون من جهاز إزالة الغازات، ومضختين ثنائيتين، وجهاز أخذ عينات تلقائي مع منظم حرارة، تم الحفاظ عليه عند (ثيرمو فيشر ساينتيفيك) متصلة بجهاز مطياف الكتلة الهجين LTQ Orbitrap XL (ثيرمو فيشر ساينتيفيك). العينات تم حقنها على عمود Merck SeQuant ZIC-HILIC الذي تم الحفاظ عليه حرارياً عند ،
وتم فصل المستقلبات عند مع المذيب A المكون من الماء مع حمض الفورميك، والمذيب ب المكون من الأسيتونيتريل مع حمض الفورميك. بدأ التدرج من إلى من B في 15 دقيقة، مع الحفاظ على الثبات لمدة 3 دقائق والعودة إلى الظروف الابتدائية في 0.1 دقيقة، وأخيرًا مع الحفاظ على إعادة التوازن عند من B لمدة 11.9 دقيقة. تم جمع البيانات في وضع الأيونات الإيجابية ESI. عمل مطياف الكتلة في وضع المسح الكامل من 70 إلى بدقة 60,000. تم جمع طيف MS/MS في وضع يعتمد على البيانات عبر التفكك الناتج عن الاصطدام (CID) في فخ الأيونات. تم تحليل العينات بترتيب عشوائي. تم تحليل العينات المرجعية في البداية، وفي النهاية، وكل ست عينات.
معالجة البيانات. تم محاذاة البيانات المولدة أولاً باستخدام Compound Discoverer (Thermo Fisher Scientific)؛ تم استخراج الإشارات وتجميعها في ميزات (آثار نظيرية من محلل واحد في حالة شحن معينة) باستخدام عقدة Metaboprofiler في Compound Discoverer (إضافة مفتوحة المصدر متاحة مجانًا من OpenMS؛https://openms.de/كما هو موصوف . تم تصفية الميزات بعد ذلك حسب الوجود مع الاحتفاظ بالكيانات التي كانت موجودة في الأقل من العينات من نفس المجموعة. تم تعويض القيم المفقودة باستخدام -طريقة الجيران الأقرب أو عن طريق حد الكشف (LoD) (1/5 من الحد الأدنى للقيمة الإيجابية لكل متغير) وفقًا لنسبة القيم المفقودة للميزة داخل المجموعة في MetaboAnalyst الإصدار 5 (https://www.metaboanalyst.ca/MetaboAnalyst/home.xhtml) تمت معالجة البيانات بشكل تلقائي وتحويلها إلى لوغاريتمية. تم توضيح المستقلبات من خلال البحث عن كتلتها التجريبية الدقيقة مقابل وسيط الكتلة Ceu.http://ceumass.eps.uspceu.es/) ومصفوفة البيانات الناتجة التي تتعامل معها Turboputativehttps://proteomics.cnic.es/تيربو بيوتيتيف/ تم تأكيد تحديد ImP بعد ذلك باستخدام المعيار المرجعي (Sigma Aldrich 77951) في تحليل LC-MS/MS لاحقًا بعد التفكك الناتج عن الاصطدام عالي الطاقة باستخدام 50 eV كطاقة اصطدام.

تحليل تدفق الخلايا

بالنسبة لعينات الدم، تم صبغ التعليقات الخلوية المفردة لمدة 30 دقيقة عند مع مجموعة صبغة خلايا ميتة/حية القابلة للإصلاح Aqua (Life Technologies). بعد الغسل بمحلول PBS، تم صبغ الخلايا في محلول FACS يحتوي على مضاد CD16/32 (BioXcell)، 3% FBS و0.05% EDTA مع كوكتيل الأجسام المضادة المناسب لمدة 30 دقيقة على الثلج. تم صبغ الخلايا بكوكتيل من الأجسام المضادة ضد CD45-APCCy7 (Biolegend)، CD11b-BV605 (Biolegend)، CD11c-BV650 (Biolegend)، Ly6C-BV711 (Biolegend)، LY6G-APC (BD Biosciences)، CD8-PE (eBioscience)، CD90-BV785 (BD Biosciences)، MHCII-AF700 (Biolegend)، B220-PerCP5.5 (Biolegend)، SiglecH-FITC (eBioscience)، CD4-PeCy7 (Biolegend). في مجموعة أخرى من التجارب، تم صبغ الخلايا بـ CD45-APCCy7 (Biolegend)، LY6G-V450 (BD Biosciences)، CD11b-ef660 (eBioscience)، CD11c-PE (Biolegend)، B220-PerCP (Biolegend)، CD90-UV805 (Fisher scientific)، XCR1-BV785 (Biolegend)، CD206-eF450 (Biolegend)، MHCII-UV737 (BD Biosciences)، F4/80-PerCp5.5 (Biolegend)، Roryt-APC (Biolegend)، T-bet-PECF594 (BD Biosciences)، Ly6C-BV711 (Biolegend)، CD86-PECy7 (Biolegend)، FOXP3-FITC (Biolegend)، CD4-BV570 (Biolegend). تم غسل الخلايا مرة أخرى وإعادة تعليقها في محلول FACS لجمع البيانات باستخدام جهاز تحليل تدفق LSRFortessa SORP (Becton Dickinson) أو FACSymphony (Becton Dickinson) وتم تحليلها باستخدام برنامج FlowJo الإصدار 10 (TreeStar). استراتيجيات التصفية المستخدمة في هذه التحليلات مفصلة في الشكل التكميلية 1.
لإجراء تحليل تدفق الخلايا المصفاة للخلايا المتسللة إلى الشريان الأورطي، تم ضخ 10 مل من محلول فوسفات البفر (PBS) عبر ثقب قلبي لإزالة تلوث الدم من الأنسجة الوعائية. تم الاحتفاظ بالشرايين الأورطية في وسط دوبلكو المعدل (DMEM) البارد ليتم هضمها. تمت إزالة الدهون المحيطة بالأوعية وتم فتح الشريان الأورطي الصدري مع القوس طوليًا وقطعه إلى قطع أصغر تم حضنها لمدة 30 دقيقة في في حمام مائي في محلول هضم (كولاجيناز A) )، (روش/سيغما 10103586001)، ديسبايز II ( ), (روش/سيغما 04942078001)، DNase I (روش/سيغما 10104159001)
إيلاستاز ) و Libersase TL ( 0.2 وحدة وونش لكل مل , 5401119001)). بعد فترة الحضانة، تم خلط الأنسجة المهضومة عن طريق السحب، وتم تصفيتها من خلال منخل ودوران عند 400 جرام لمدة 5 دقائق تم صبغ الخلايا الفردية بمزيج من الأجسام المضادة ضد CD45-APCCy7 (Biolegend)، CD11b-BV605 (Biolegend)، CD11c-BV650 (Biolegend)، Ly6C-BV711 (Biolegend)، LY6G-APC (BD Biosciences)، CD8-PE (eBioscience)، CD90-BV785 (BD Biosciences)، MHCII-AF700 (Biolegend)، B220-PerCP5.5 (Biolegend)، SiglecH-FITC (eBioscience)، CD4-PeCy7 (Biolegend). اعتمادًا على الإعداد التجريبي، تم صبغ الخلايا بـ CD45-APCCy7 (Biolegend)، LY6G-V450 (BD Biosciences)، CD11b-ef660 (eBioscience)، CD45-APCCy7 (Biolegend)، LY6G-V450 (BD Biosciences)، CD11b-ef660 (eBioscience)، CD11c-PE (Biolegend)، B220-PerCP (Biolegend)، CD90-UV805 (Fisher scientific)، XCR1-BV785 (Biolegend)، CD206-eF450 (Biolegend)، MHCII-UV737 (BD Biosciences)، F4/80-PerCp5.5 (Biolegend)، Roryt-APC (Biolegend)، T-bet-PECF594 (BD Biosciences)، Ly6C-BV711 (Biolegend)، CD86-PECy7 (Biolegend)، FOXP3-FITC (Biolegend)، CD4-BV570 (Biolegend)، CD31-PE (Biolegend) و VCAM-AF594 (Biotechne). تم غسل الخلايا وإعادة تعليقها في محلول FACS لجمع البيانات باستخدام جهاز تحليل تدفق LSRFortessa SORP (Becton Dickinson) أو FACSymphony (Becton Dickinson) وتم تحليلها باستخدام برنامج FlowJo الإصدار 10 (TreeStar). استراتيجيات التصفية لـ خلايا، خلايا، و تظهر الخلايا في الشكل التوضيحي 2، وتظهر تلك الخاصة بمجموعة الماكروفاج في الشكل التوضيحي 3.

مجموعات الدراسة

مجموعة PESA. تم إجراء هذه الدراسة على مجموعة فرعية من المشاركين من دراسة PESA دراسة PESA-CNIC-Santander (NCT01410318) هي دراسة مستمرة للمراقبة من نوع المجموعة المستقبلية تشمل 4,184 موظفًا غير مصاب بأعراض من بنك سانتاندير في مدريد (تتراوح أعمارهم بين 40 و54 عامًا وخالٍ من أمراض القلب والأوعية الدموية المعروفة في البداية في عام 2009). بالإضافة إلى معايير الاستبعاد المتبعة في الدراسة الرئيسية. تم استبعاد المشاركين الذين تناولوا المضادات الحيوية في الأشهر الثلاثة التي سبقت جمع العينة، والذين لديهم داء السكري من النوع 2 المعروف أو الذين تم علاجهم من داء السكري و/أو الاضطرابات المعوية. وقد مكننا ذلك من إزالة التأثيرات المربكة المحتملة بسبب دور ImP في داء السكري ومقاومة الأنسولين. وتعديل ميكروبيوتا الأمعاء قد يؤثر على إنتاج ImP. تم تقييم تصلب الشرايين تحت السريري من خلال دراسات التصوير بما في ذلك الموجات فوق الصوتية الوعائية ثنائية وثلاثية الأبعاد للشرايين السباتية والوريد الفخذي، ووجود الكالسيوم في الشرايين التاجية الذي تم تقييمه بواسطة الأشعة المقطعية، كما تم وصفه سابقًا. خضع المشاركون الذين يعانون من تصلب الشرايين تحت السريرية لفحص كامل للجسم دراسة F-FDG PET/MRI لتوصيف الشرايين امتصاص F-FDG ونشاط الأيض في نخاع العظم، كما هو موصوف تضمن مقياس خطر القلب والأوعية الدموية المستخدم مقياس SCORE (تقييم المخاطر التاجية المنهجي) التابع للجمعية الأوروبية لأمراض القلب، والذي يحسب خطر الوفاة بسبب أمراض القلب والأوعية الدموية على مدى 10 سنوات. شملت اختبار الدم الصائم الكيمياء الحيوية وتحديد hs-CRP. في هذه الدراسة، تم تعريف ارتفاع ضغط الدم على أنه الانقباضي و/أو الانبساطي و/أو الأفراد الذين يتناولون أدوية خافضة لضغط الدم. تم تعريف اضطراب الدهون في الدم على أنه الكوليسترول الكلي الكوليسترول LDL -كوليسترول أو استخدام أدوية خافضة للدهون. تم إجراء تقييمات القياسات الجسمية وتحليل مقاومة الجسم الكهربائية خلال نفس الموعد لكل مشارك. تم قياس الطول والوزن باستخدام معدات معايرة (Tanita BC-545N) مع ارتداء المشاركين الملابس الداخلية وبدون أحذية. تم حساب مؤشر كتلة الجسم كوزن (بالكيلوجرام) مقسومًا على الطول (بالمتر) تربيعًا. تم تعريف مدى تصلب الشرايين بواسطة متغير ترتيبي مجموع يتم حسابه من عدد المواقع الوعائية المتأثرة إلى مجموع النقاط الكلي كما يلي: (1) تصلب الشرايين السباتية (نقاط: 0، لا توجد لويحات؛ 1، لويحة واحدة؛ 2، لويحتان؛ 3، 3 لويحات أو أكثر) كما تم تقديره بواسطة الموجات فوق الصوتية الوعائية ثلاثية الأبعاد ومجموعها لكل من الشريان السباتي الأيسر والأيمن؛ (2) تصلب الشرايين الفخذية (نقاط: 0، لا توجد لويحات؛ 1، لويحة واحدة؛ 2، لويحتان؛ 3، 3 لويحات أو أكثر) كما تم تقديره بواسطة الموجات فوق الصوتية الوعائية ثلاثية الأبعاد ومجموعها لكل من الشريان الفخذي الأيسر والأيمن؛ (3) وجود تكلس في الشريان الصاعد أو النازل.
الشريان الأورطي (نقاط: 0، لا؛ 1، نعم)؛ (4) درجة CAC (نقاط: 0، 0؛ 1، 0.1-99؛ 2، 100-399؛ 3، 400-الحد الأقصى). بالنسبة للتحليل الأيضي، تم جمع عينات الدم الطرفية بعد صيام ليلة كاملة وتمت عملية الطرد المركزي في في درجة حرارة الغرفة لمدة 10 دقائق للحصول على البلازما التي تم تقسيمها وتخزينها في لتحليل تسلسل جين الأمبليكون 16S rDNA، تم جمع البراز في أكواب جمع وتم تجميده على الفور في حتى يتم إجراء مزيد من التحليل. وافق لجنة الأخلاقيات المؤسسية على بروتوكول الدراسة، وتم تزويد جميع المشاركين بموافقة مستنيرة مكتوبة. تم إدراج خصائص المشاركين في الجداول التكميلية 1a و 1b و 3.
مجموعة IGT. للتحقق من النتائج المستخلصة من دراسة PESA، تم استخدام مجموعة فرعية من مجموعة IGT (الأخلاقيات 560-13). تم وصف تصميم الموضوع والطريقة من مجموعة التحقق في مكان آخر. باختصار، تتكون عينة الدراسة من رجال ونساء تتراوح أعمارهم بين سنوات من منطقة غوتنبرغ (السويد)، تم تجنيدهم على أساس عشوائي من سجل السكان السويدي وشملوا بناءً على حالة الجلوكوز لديهم. تضمنت معايير الاستبعاد المطبقة: السكري المعروف، الأمراض الالتهابية (مثل مرض كرون، التهاب القولون التقرحي أو الأمراض الروماتيزمية)، العلاج بالستيرويدات أو الأدوية المناعية، السرطان (ما لم يكن خالياً من الانتكاسات خلال السنوات الخمس السابقة)، ضعف الإدراك، العلاج من الأمراض المعدية واستخدام المضادات الحيوية في الأشهر الثلاثة الماضية، عدم القدرة على فهم اللغة السويدية المكتوبة والم spoken، بالإضافة إلى الأفراد المولودين خارج السويد. تم دعوة المشاركين عن طريق رسالة وقدموا جميع الموافقات المستنيرة. تم تقييم تصلب الشرايين بواسطة تصوير بالموجات فوق الصوتية لشرايين السبات، باستخدام بروتوكول موحد يتضمن جهاز الموجات فوق الصوتية Siemens Acuson S2000، ومن خلال وجود كلس الشرايين التاجية الذي تم تقييمه بواسطة الأشعة المقطعية، كما تم وصفه سابقاً. تم قياس ضغط الدم الانقباضي مرتين باستخدام جهاز تلقائي (Omron M10-IT، شركة أومرون للرعاية الصحية) وتم استخدام متوسط القياسات. تم استخدام استبيان لجمع معلومات مفصلة عن الأدوية والتاريخ العائلي. عينة دم وريدية تم جمعه من المشاركين بعد صيام ليلة كاملة واستخدم للتحليل البيوكيميائي الفوري للجلوكوز، والهيموجلوبين الجليكوزي، والكوليسترول الكلي. تم حساب SCORE2 (تقييم المخاطر التاجية المنهجي) كما هو موصوف. تم قياس وزن الجسم والطول ومحيط الخصر والورك باستخدام معدات معايرة مع المشاركين مرتدين ملابس خفيفة بدون أحذية ووفقًا لتوصيات منظمة الصحة العالمية الحالية. تم تعريف مدى تصلب الشرايين بواسطة متغير ترتيبي مجموع يتم حسابه من عدد المواقع الوعائية المتأثرة إلى مجموع النقاط الكلي كما يلي: (1) تصلب الشرايين السباتية (نقاط: 0، لا توجد لويحات؛ 1، على الأقل لويحة واحدة في أي من الشريان السباتي الأيسر أو الأيمن؛ 2، لويحات في كلا الوعائين)؛ (2) درجة CAC (نقاط: 0، 0؛ 1، 0.1-99؛ 2، 100-399؛ 3، 400-الحد الأقصى). يتم سرد خصائص المشاركين في الجدول التكميلي 2a، b.

الميتabolوميات المستهدفة

تم قياس مستويات البلازما من ImP وحمض يوروكانك والهستيدين باستخدام الكروماتوغرافيا السائلة عالية الأداء للغاية (UHPLC) المرتبطة بمطيافية الكتلة بالت tandem (LC-MS/MS). تم إجراء التحليلات في مختبرين مختلفين في إسبانيا (مجموعة PESA) وفي السويد (مجموعة IGT). استخدم كلا المختبرين طرق LC-MS/MS موثوقة بالكامل.
تحديد ImP في عينات البلازما من الفئران التي تم إطعامها نظام غذائي يحتوي على علف أو نظام غذائي عالي الكوليسترول مع وبدون جر ماوس في اليوم) و/أو AGN192403 ( تم إجراء (لكل فأر في اليوم) في مياه الشرب من خلال اتباع الطريقة الموضحة أدناه للدراسة البشرية، تحديدًا لفئة PESA.
حلول ومعايير عملية. بالنسبة لمجموعة PESA، تم إعداد حلول مخزنة فردية بتركيز 1000 جزء في المليون من ImP (سيغما ألدريتش 77951) وحمض يوروكان. (حمض يوروكان-1،2،3- ، سيغما ألدريتش، 709638) والهيستيدين (L-هيستيدين- كلوريد الهيدروجين أحادي الهيدرات، سيغما ألدريتش، 791318) تم تحضيره في ماء نقي للغاية وتم تخزينه في ثم تم تحضير تخفيفاتهم في الميثانول:الإيثانول (1:1، حجماً/حجماً) وتخزينها في
. بالنسبة لمجموعة IGT، الهيستيدين (الهيستيدين- مختبر نظائر كامبريدج)، ImP وحمض يوروكانك (ImP- و اليوروكانات- تم تحضيرها في الأسيتونيتريل.
تحديد كمية المستقلبات. بالنسبة لمجموعة PESA، من الميثانول: الإيثانول ( ) أضيفت إلى من عينة البلازما و من المعايير الداخلية الموسومة نظريًا في الميثانول: الإيثانول (حمض اليوروكان والهيستيدين). تم خلط العينات في جهاز الخلط لمدة 10 ثوانٍ ثم تم الطرد المركزي عند لمدة 20 دقيقة عند . تم أخذ مئة ميكرولتر من السائل الطافي ونقلها إلى قوارير كروماتوغرافيا سائلة للتحليل. تم تحديد كمية المستقلبات باستخدام نظام UHPLC من سلسلة 1290 Infinity المتصل بجهاز قياس الكتلة الثلاثي الرباعي (QqQ) 6460 من Agilent Technologies. باختصار، من العينة تم حقنها في عمود InfinityLab Poroshell 120 HILIC-Z ( ، Agilent Technologies) بمعدل تدفق قدره . احتوى الطور المتحرك A على 20 مليمول من أمونيوم الفورمات في الماء النقي عند pH 3، بينما احتوى الطور المتحرك B على 20 مليمول من أمونيوم الفورمات المائي عند pH 3 في الأسيتونيتريل: . كانت الشروط الأولية عند الزمن 0 هي ، تتناقص إلى عند 11.5 دقيقة. ثم تم زيادة التدرج إلى عند الزمن 12.0 دقيقة واستمر حتى الوقت الإجمالي للتشغيل 15 دقيقة. تم الحصول على بيانات قياس الكتلة في وضع التأين الإيجابي. تم التحقق من الإشارات الخام لانتقالات المراقبة التفاعلية المتعددة وتم دمج القمم التي تتوافق مع جميع المركبات المستهدفة بواسطة MassHunter Quantitative B.10.00 (Agilent Technologies). كانت انتقالات المراقبة التفاعلية المتعددة (طاقة الاصطدام، eV) كما يلي: و لـ ImP;139 >121(10) و 139>93 (26) لحمض اليوروكان؛ 142>124 (10) و (26) لحمض اليوروكان الموسوم؛ و ، للهيستيدين؛ و و للهيستيدين الموسوم. تم تحديد تركيز ImP من خلال إنشاء منحنى قياسي مع تركيزات معروفة من هذا المستقلب. تم تحديد كمية الهيستيدين وحمض اليوروكان بدلاً من ذلك باستخدام المعايير الداخلية المضافة إلى عينات البلازما كما هو مذكور أعلاه. تم تحليل معايير المستقلبات جنبًا إلى جنب مع عينات البلازما باستخدام طريقة LC-MS/MS. تم أخذ تخفيف البلازما أثناء إعداد العينة في الاعتبار أيضًا للتحديد الكمي.
بالنسبة لمجموعة IGT، تم تحديد مستويات ImP، اليوروكان والهيستيدين في البلازما كما هو موصوف سابقًا مع تعديلات طفيفة . باختصار، من عينات البلازما تم استخراجها باستخدام 6 أحجام من الأسيتونيتريل المحتوي على 100 نانومتر من المعايير الداخلية قبل تجفيف العينات تحت تدفق النيتروجين. ثم، تم إعادة تكوين العينات باستخدام في 1-بيوتانول، خضعت لـ -تحويل استر البوتيل وأخيرًا أعيد تكوينها في الماء: الأسيتونيتريل ، تم تحديد مستويات اليوروكان والهيستيدين بواسطة تحليل UHPLCMS/MS باستخدام مراقبة التفاعلات المتعددة للانتقالات و ، على التوالي. بالنسبة للمعايير الداخلية، تم استخدام الانتقالات و . كان النظام التحليلي يتكون من نظام Acquity UPLC I-class المتصل بجهاز قياس الكتلة الثلاثي الرباعي Xevo TQ-XS (Waters). تم حقن حجم العينة في عمود C18 BEH مع جزيئات، Waters) وتم فصلها باستخدام تدرج يتكون من الماء مع 0.1% حمض الفورميك (الطور A) والأسيتونيتريل مع 0.1% حمض الفورميك (الطور B). تم إجراء التحديدات باستخدام منحنى قياسي مع تركيزات معروفة من ImP، اليوروكان والهيستيدين.

استخراج الحمض النووي، تسلسل الأمبليكون 16S rDNA وتحليل بيانات الميكروبيوتا

بالنسبة لعينات أمعاء الفئران، تم استخراج الحمض النووي الكلي باستخدام مجموعة MasterPure Complete DNA & RNA Purification Kit (Epicentre) مع بعض التعديلات، كما هو موصوف سابقًا . تم تطبيع تركيزات الحمض النووي باستخدام مقياس الفلورية Qubit 2.0 (Life Technology) وتم إنتاج أمبليكون محدد لجين 16S rDNA (منطقة V3-V4) وفقًا لبروتوكول إعداد مكتبة تسلسل الميتاجينوم 16S من Illumina. تم إجراء خطوة التعدد باستخدام مجموعة Nextera XT Index Kit (Illumina) وتم التحقق من منتج الأمبليكون PCR على
شريحة bioanalyzer DNA1000 (Agilent Technologies). تم تجميع العينات بكميات متساوية وتم تسلسلها باستخدام مجموعة MiSeq Reagent v.3، على منصة MiSeq Illumina (خدمة تسلسل FISABIO).
بالنسبة للعينات البشرية، تم استخراج الحمض النووي البرازي باستخدام مجموعة متاحة تجاريًا (E.Z.N.A stool DNA kit، Omega Biotek) . بعد ذلك، تم إنتاج مكتبة الأمبليكون لمنطقة V4 داخل جين 16S rDNA وتم تسلسل كلا طرفي الشظايا باستخدام MiSeq Illumina بواسطة مركز الميكروبيوم في جامعة ميتشيغان .
في كلا الدراستين، لاستبعاد والتحكم في تلوث الكواشف المحتمل، تم أيضًا تسلسل الكواشف لاستخراج الحمض النووي وتكبير PCR كضوابط. لتحليل بيانات الميكروبيوتا من الفئران والبشر، تم تنسيق التسلسلات ذات الطرفين، وتجميعها في وحدات تصنيف تشغيلية عند مستوى الهوية، وتم التعليق عليها باستخدام إصدار SILVA باستخدام DADA2 لبيانات الفئران و وقواعد بيانات RDP الإصدار 18 باستخدام Mothur (v.1.40.5) كما هو موصوف سابقًا لبيانات البشر. تم تحديد معاملات ارتباط رتبة سبيرمان بين مستوى ImP ووفرة البكتيريا باستخدام وظيفة otu.association من Mothur .

تقييم نمط النظام الغذائي

تم جمع بيانات تناول الطعام عبر استبيان تكرار الطعام شبه الكمي المكون من 136 عنصرًا والذي تم التحقق منه للسكان الإسبان . تم تصنيف الأطعمة المبلغ عنها خلال تقييم النظام الغذائي إلى 44 مجموعة غذائية بناءً على تشابه ملف المغذيات، وتم حسابها على مدار الأيام لاشتقاق تناول عادات وتم تطبيعها حسب مؤشر كتلة الجسم لكل مشارك. بعد ذلك، تم إجراء تحليل PCA في SPSS V.23.0 (SPSS) لتحديد الأبعاد الأساسية المشتركة (العوامل أو الأنماط) لاستهلاك الطعام من خلال اشتقاق تحميلات العوامل لكل مجموعة غذائية محددة مسبقًا. تم تدوير العوامل بعد ذلك باستخدام إجراء Varimax للحفاظ على العوامل غير المرتبطة. تم استخدام تحليل القيم الذاتية، ورسم بياني للانحدار، وقابلية تفسير حل العامل لدعم القرار النهائي بشأن الاحتفاظ بحل مكون من 5 عوامل، حيث كان لكل عامل قيمة ذاتية . وفقًا لتحميلات العوامل الملاحظة لمجموعات الطعام، أطلقنا على العامل الأول نمط النظام الغذائي المتوسطي (المغذي بالخضروات والحبوب الكاملة والأسماك)، والعاملين الثاني والثالث كأنماط النظام الغذائي للإفطار (الإفطار1: المغذي بالحبوب، الشاي، الألبان قليلة الدسم، والإفطار2: يتكون أساسًا من الخبز، البيض والقهوة)، والعامل الرابع نمط النظام الغذائي الغربي (المغذي باللحوم الحمراء، السكر، الوجبات الخفيفة والحبوب المكررة) والعامل الخامس نمط النظام الغذائي الاجتماعي (المغذي بالمشروبات الغازية والمشروبات الروحية).

تسلسل scRNA-seq

تم علاج الفئران الذكور البالغة من العمر – أسبوع في مياه الشرب مع لكل فأر في اليوم) لمدة 4 أو 8 أسابيع. تم جمع الشرايين الأورطية وهضمها كما هو موصوف أعلاه. للحصول على عدد كافٍ من الخلايا، تم تجميع ثلاث شرايين لكل حالة. تم وضع علامة على كل عينة باستخدام أوليغو تعدد الخلايا (CMO) باستخدام بروتوكول وضع العلامات CMO لتسلسل scRNA-seq من 10X Genomics. تم غسل الخلايا المعلّمة بـ CMOs، ووضع علامة عليها بـ SytoxGreen وHoechst لضمان حيوية الخلايا، وتم فرز الخلايا الحية باستخدام جهاز فرز الخلايا FACs Aria. تم تجميع العينات وتم إجراء تسلسل scRNA-seq وفقًا لبروتوكول Chromium Next GEM Single Cell3’v.3.1 مع تقنية باركود الميزة لتعدد الخلايا (10x Genomics). باختصار، تم أولاً عد الخلايا والتحقق من حيويتها باستخدام عداد الخلايا Countess 3 (Thermofisher). بعد ذلك، تم تحميل الخلايا على شريحة 10X Genomics من جهاز Chromium Controller (10X Genomics). بعد تضخيم cDNA، تم إنتاج مكتبات التعبير الجيني وCMO وتم تسلسلها باستخدام جهاز تسلسل Illumina NextSeq 2000.
تم إجراء معالجة بيانات التسلسل الخام من ملف FASTQ من كل منفذ باستخدام Cell Ranger (v.6.1.2) مع المعلمات الافتراضية ومرجع جينوم الفأر mm10 (GRCm38.p6) المقدم من 10 X Genomics. تم تحميل مصفوفات العد الفريدة للمؤشرات الجزيئية (UMI) الصالحة للخلايا المرمزة لكل منفذ إلى R (v.4.1.2) لمزيد من التحليلات باستخدام حزم Bioconductor و Seurat (v.4.0.6) . أولاً، تم تصفية الخلايا وفقًا لعدد
إجمالي عد UMI ( و )، العدد الإجمالي للجينات المكتشفة ( و )، ونسبة عد UMI الميتوكوندريا ( ). ثم، تم فصل الخلايا الناتجة باستخدام حزمة R cellhash (v.1.0.2) باستخدام طرق htodemux و bff_cluster و gmm_demux و multiseq و dropletutils. تم استخدام تصنيف الإجماع لمزيد من التحليلات. بمجرد الحصول على المجموعة النهائية من الخلايا، تم تطبيع قيم التعبير النسخي إلى إجمالي عدد UMI لكل خلية مضروبًا في عامل مقياس قدره 10,000 وتم تحويله إلى لوغاريتم طبيعي (وظيفة NormalizeData). تم تعريف الجينات ذات التباين العالي باستخدام طريقة VST كما هو مطبق في إعداد Seurat. تم استخدام 2,000 جين ذو تباين عالي ونموذج PCA لتقليل هذه المساحة البُعدية بعد تطبيع قيم التعبير المحولة إلى لوغاريتم. في هذه الخطوة، تم التخلص من التباين المرتبط بإجمالي عدد العدادات باستخدام وظيفة ScaleData مع نماذج خطية. تم استخدام طريقة مخطط الكوع لتحديد عدد المكونات الرئيسية للتحليلات اللاحقة (25 مكونًا رئيسيًا). ثم، تم تجميع الخلايا باستخدام خوارزمية لوفيان وتم تصورها باستخدام خوارزمية تقريب الفضاء المتجانس والإسقاط لتقليل الأبعاد (UMAP) مع أول 25 مكونًا رئيسيًا كمدخلات. تم تحديد المجموعات الرئيسية باستخدام علامات معروفة وحساب الجينات المعبر عنها بشكل مختلف باستخدام اختبار مجموع الرتب ويلكوكسون باستخدام حزمة R presto (الإصدار 1.0.0) (الشكل الممتد 4). تم حساب نسب الخلايا لكل حالة في كل مجموعة خلوية، وتم استخدام اختبار Z لنسبتين باستخدام وظيفة prop.test في R لتحديد الدلالة.
تم إجراء تحليلات التعبير التفاضلي بين الظروف بشكل مستقل على كل مجموعة خلوية مقارنة بين ImP مقابل التحكم لكل نقطة زمنية (4 أو 8 أسابيع) باستخدام حزمة MAST R (الإصدار 1.20.0). تم تصنيف الجينات وفقًا لتغيرات اللوغاريتم المضاعف، وتم استخدام التصنيفات الناتجة كمدخلات لحزمة fgsea R جنبًا إلى جنب مع مجموعات الجينات الرئيسية من قاعدة بيانات التوقيع الجزيئي (MSigDB؛ https://www.gsea-msigdb.org/gsea/msigdb). من أجل تحديد مجموعات فرعية محددة من الخلايا داخل كل نوع عام من الخلايا، تم فصل كل مجموعة وتحليلها بشكل مستقل باستخدام نفس سير العمل الموضح أعلاه. تم تحديد المجموعات الفرعية باستخدام علامات معروفة وحساب الجينات المعبر عنها بشكل مختلف باستخدام حزمة R المعروفة باسم presto. أخيرًا، تم إجراء تحليل تمثيل زائد يأخذ في الاعتبار علامات الجينات لكل مجموعة فرعية محددة مع قاعدة بيانات GO (https://www.geneontology.org/) من أجل تفسير الحالة النسخية لكل مجموعة فرعية.

خطوط الخلايا

تم عزل MAECs من الشرايين الأورطية الصدرية للفئران كما هو موصوف تم زراعة الخلايا في الوسط 199 (جيبكو، تكنولوجيا الحياة إنفيتروجن) مصل جنين العجل + بنسلين/ستربتوميسين جلوتامين هيبز مكمل نمو الخلايا البطانية هيبارين ، جميعها من سيغما ألدريتش، تحت في تم عزل خطوط خلايا MEF من 13.5 يومًا بعد الإخصاب من الأجنة باستخدام بروتوكول قياسي. تم تشريح كل جنين في 10 مل من PBS معقم، مع إزالة أعضائه الداخلية ورأسه وساقيه. بعد 30 دقيقة من الحضانة مع هز خفيف في مع تريبسين، تم زراعة الخلايا في طبقين بحجم 100 مم وتم حضنها لمدة لتأسيس خطوط MEF المخلدة، تم زرع MEFs في مراحل مبكرة في أطباق 60 مم وتم إصابتها بـ فيروس Retrovirus معبأ يحمل جينات فيروس الورم الحليمي البشري (HPV) 16 E6/E7. تم إجراء الاختيار باستخدام من G418 لمدة 10 أيام.
تم زراعة خط خلايا L929 (ATCC CCL-1TM) المستخدم لإنتاج السائل الفائق M-CSF على قوارير زراعة الخلايا (ستيمسيل) معاد تعليقها في RPMI 1640 (سيغما) المدعمة بـ مصل جنين العجل المعطل حرارياً (FCS، سيغما)، 1 مللي مول من البيروفات (لونزا)، أحماض أمينية غير أساسية (ثيرمو فيشر ساينتيفيك)، 2 مللي مول من L-جلوتامين، البنسلين و ستربتوميسين (الثلاثة من لونزا)، هنا يسمى R10. تم الحصول على السوبرناتانت عن طريق ترشيح الثقافات التي استمرت 15 يومًا من خلال وحدات فلتر ستيريكوب (ميرك ميليبور) وتم استخدامها لاحقًا لتكملة الوسط من أجل توليد خلايا بون مارك ديريفيد ماكروفاج.
تم إنتاج بكتيريا ماوس BMDMs كما هو موضح مع بعض التعديلات. تم زراعة خلايا نخاع العظام من فئران WT C57BL/6J في وسط RPMI1640 مضاف إليه 30% M-CSF المستخلص من خط خلايا L929 و10% FBS، البنسلين ستربتوميسين، 10 مللي مولار هيبيس، 1 نانومولار صوديوم بايروفات (جميعها من جيبكو) لمدة 5 أيام في بيئة معقمة، ولكن ليست معالجة لزراعة الأنسجة، أطباق بتري.

تسلسل RNA بالجملة

تم زرع خلايا BMDMs و MEFs و MAECs المستنبتة بعدد متساوٍ وتركها للراحة طوال الليل. بشكل خاص، بالنسبة لخلايا BMDMs و MEFs، تم زراعة خلايا لكل بئر في أطباق 6 آبار الحجم النهائي، كورنينغ)، ولـ MAECs تم زراعة خلايا لكل بئر في p24 الحجم النهائي، كورنينغ). تم معالجة الخلايا في المختبر مع أو بدون ImP تم عزل RNA الكلي من BMDMs و MEFs (مجموعة أدوات QIAamp DNA Mini) و MAECs (مجموعة أدوات miRNeasy Micro). تم إجراء تجارب RNA-seq الجماعية في وحدة الجينوميات في CNIC. بالنسبة لعينات BMDM و MEF، تم إعداد مكتبات RNA-seq باستخدام مجموعة أدوات NEBNext Ultra II Directional RNA Library preparation (New England Biolabs) وفقًا لتعليمات الشركة المصنعة. بالنسبة لعينات MAECs، تم إعداد المكتبات باستخدام مجموعة أدوات NEBNext Single Cell/Low Input RNA Library Prep Kit for Illumina (New England Biolabs) وفقًا لتعليمات الشركة المصنعة. تم تسلسل جميع المكتبات في جهاز Nextseq 2000 (Illumina). تم الحصول على ملفات FastQ لكل عينة باستخدام برنامج bcl2fastq v. 22.20 (Illumina). كان عدد القراءات لكل عينة يتراوح بين 11 و 21 مليون. تم معالجة القراءات مسبقًا وفقًا لنوع إعداد المكتبة باستخدام cutadapt لقص المحولات و FastQC لتقييم جودة القراءة. في حالة قراءات RNA-seq الاتجاهية (BMDMs و MEFs)، تمت إزالة تسلسلات محولات Illumina، وتم الاحتفاظ فقط بالقراءات التي تزيد عن 30 نقطة أساسية كصالحة. بالنسبة لـ MAECs، بالإضافة إلى تسلسلات محولات Illumina، تم اكتشاف وإزالة المحولات من بروتوكول NEBNext منخفض الإدخال، وتم الاحتفاظ فقط بالقراءات التي تزيد عن 30 نقطة أساسية كصالحة. تم تعيين القراءات الناتجة إلى النسخة المرجعية من الجينوم GRCm38.102 باستخدام STAR. وتم تقدير مستويات التعبير الجيني باستخدام RSEM تم إجراء تحليلات إضافية باستخدام R (الإصدار 4.3.2). باختصار، تم حساب العد لكل مليون، وتم تحديد عوامل الحجم للتطبيع بين العينات باستخدام طريقة المتوسط المقصوص لقيم M. ثم، تم استخدام بيانات موحدة لوغاريتمياً مع الأخذ في الاعتبار فقط الجينات التي تحتوي على تم استخدام العد في 3 عينات لتحليل التعبير التفاضلي، مما سمح بإجراء جميع المقارنات الممكنة ضمن نفس نوع الخلايا باستخدام حزمة DESeq2 في R. تم إجراء تحليل إثراء مجموعة الجينات باستخدام حزمة R fgsea، مقارنةً بين 1 ساعة و 2 ساعة بعد تحفيز ImP مع 0 ساعة (غير المحفز) داخل كل نوع من الخلايا. تم ترتيب الجينات في كل مقارنة وفقًا لـ “، وتم استخدام fgsea جنبًا إلى جنب مع مجموعات الجينات Hallmark من قاعدة بيانات التوقيع الجزيئي (MSigDB؛https://www.gsea-msigdb.org/gsea/msigdb“). أخيرًا، تم تمثيل درجات الإثراء المنضبطة للمسارات المختارة المهمة كخريطة حرارية باستخدام حزمة R ComplexHeatmap. .

البروتيوميات والفوسفورتيوميات بواسطة الوسم المتساوي

تم زراعة BMDMs و MEFs في خلايا لكل بئر في أطباق 6 آبار (كورنينغ)، حجم نهائي 2 مل، وتمت الراحة طوال الليل في وسط RPMI 1%. تم معالجة الخلايا في المختبر مع أو بدون وتم حضنه مع AGN192403 أو لا المضاد) لمدة 180 دقيقة. تم غسل طبقات زراعة الخلايا بمحلول PBS، وتم الحصول على مستخلصات البروتين باستخدام محلول التحلل (50 مليمول/لتر تريس-هيدروكلوريد pH ثلاثي-(2-كربوكسي إيثيل) الفوسفين (TCEP) يحتوي على كوكتيلات مثبطات البروتياز والفوسفاتاز (Complete Mini خالية من EDTA وphosSTOP، روش). تم غلي العينات لمدة 5 دقائق وتم الاحتفاظ بها لمدة 20 دقيقة في درجة حرارة الغرفة لتذويب وتقليل البروتينات، وبعد ذلك تم الطرد المركزي عند لمدة 15 دقيقة، تم استرداد السائل العلوي، وتم تحديد تركيز البروتين باستخدام مجموعة اختبار بروتين RC DC (مختبرات بيو راد).
تم إجراء تحليلات البروتيوم والفوسفوبروتيوم باستخدام وسم TMT المتساوي الكثافة 18-بلكس كما هو موصوف التحليل الإحصائي لـ
تم إجراء البيانات الكمية باستخدام ، وتم إجراء التحليل المقارن بين الظروف باستخدام القيم المعيارية و ، والتي تمثل اللوغاريتم الثنائي للنسبة بين الوفرة في العينة و التحكم فيه للببتيد وبروتين ، على التوالي. GSEA يستخدم تم استخدام قيم الببتيدات لتقييم مستويات الفسفرة في بروتينات مسار إشارة mTOR بين الظروف (أي، الخلايا المحفزة بـ ImP مقابل غير المحفزة). بالإضافة إلى ذلك، تم إجراء اختبار ويلكوكسون للرتب الموقعة باستخدام وفرة الببتيدات الفسفورية المقترنة. قيم لتحديد تأثيرات AGN192403 في مستويات الفسفرة لمسار المTOR بين الخلايا المعالجة بـ ImP والمزودة أو غير المزودة بـ AGN192403.

تلوين p-S6 بواسطة تحليل تدفق الخلايا

تم زراعة خلايا MEFs و BMDMs المستنبتة بأعداد متساوية خلايا لكل بئر) في أطباق 6 آبار ( الحجم النهائي، كورنينغ) وترك ليلاً. تم معالجة الخلايا في المختبر مع أو بدون تم حضنه مع الراباميسين (10 نانومتر)، AGN192403 ( مضاد)، إيدازوكسان (0.29 نانومول، مستقبل إيميدازولين و مضاد مستقبلات الأدرينالين) أو يوهيمبين ( المضاد). بعد 24 ساعة، تم جمع الخلايا ووضع علامة عليها باستخدام جسم مضاد p-S6-PE (Cell Signalling 5316) وفقًا لبروتوكول الشركة المصنعة وتم قياس التنشيط بواسطة تحليل تدفق الخلايا.

جمع البلعميات البريتونية

تم عزل خلايا البريتوان عن طريق الغسل باستخدام 5 مل من PBS البارد. تم زرع الخلايا وتم غسل الخلايا غير الملتصقة بـ PBS بعد ساعة. تم تعريف الخلايا الملتصقة على أنها ماكروفاجات بريتوانية، والتي تم التحكم فيها بشكل روتيني بواسطة قياس التدفق الخلوي. تم تقييم صبغة p-S6 بواسطة قياس التدفق الخلوي كما هو موضح أعلاه.

قياس TNF

تم زراعة خلايا MEFs و BMDMs المستنبتة بأعداد متساوية خلايا لكل بئر) في أطباق 96 بئر ( الحجم النهائي، كورنينغ) وترك ليلاً. تم معالجة الخلايا في المختبر مع وبدون ImP ( ) وتم حضنه مع الراباميسين ( 10 نانومول )، AGN192403 ( مضاد)، إيدازوكسان (0.29 نانومتر، مستقبل إيميدازولين و مضاد) أو يوهيمبين ( المضاد). بعد 24 ساعة، تم جمع السائل الفائق، وتم قياس تركيز TNF باستخدام مجموعة ELISA TNF الفأري DuoSet (DY410) وفقًا لتعليمات الشركة المصنعة.

قياس MCP1

تم زرع خلايا MEFs المستنبتة ( خلايا لكل بئر) في أطباق 96 بئر ( الحجم النهائي، كورنينغ) وترك لمدة ليلة. تم معالجة الخلايا في المختبر مع وبدون بعد 24 ساعة، تم جمع السائل الفائق، وتم قياس تركيز MCP1 باستخدام مجموعة ELISA الخاصة بالفأر CCL2/JE/MCP1 DuoSet (DY479) وفقًا لتعليمات الشركة المصنعة.

ترانسويل

تم تقييم هجرة المونوسيتات الدائرة التي تحفزها خلايا الفيبروبلاست المولدة من الأنسجة (MEFs) في اختبار هجرة الترانسويل. تم الحصول على المونوسيتات الدائرة من فئران Apoe البالغة من العمر 8 أسابيع. تم فرز الفئران الذكور (CD3 سي دي 49 سيجل “). في البداية، تم وضع خلايا الفيبروبلاست الجنينية (MEFs) في الحجرة السفلية من الترانسويل مع DMEM 1% FBS. وتم وضع المونوسيتات المفروزة في الحجرة العلوية من الترانسويل مع RPMI 1% FBS. تم تحفيز خلايا الفيبروبلاست الجنينية (MEFs) بـ بعد 24 ساعة، تم جمع الوسط تحت الترانسويل وتم قياس عدد الخلايا في السائل الطافح باستخدام LSRFortessa SORP (بيكتون ديكنسون).

قياسات السيتوكينات في المصل

تم جمع الدم كما هو موضح أعلاه. كمية TNF و IFN تم قياس مستوى السيروم وفقًا لبروتوكول الشركة المصنعة باستخدام مجموعة ELISA ثنائية TNF للفئران (DY410) و IFN للفئران دوست ELISA (DY485)، على التوالي.

علاج ImP في الفئران المزروعة

تم تعريض فئران CD45.1 للإشعاع القاتل بجرعتين من 550 راد (5.5 غيغا)، تفصل بينهما مدة لا تقل عن 3 ساعات، ليكون إجمالي جرعة الإشعاع 1,100 راد، تلاها حقن وريدي بـ خلايا نخاع العظم من CD45.2+ راaptor أو التحكم في الراaptor أشقاء من نفس القمامة. في تجارب موازية، -خلايا مستقبلات الأدرينالين من أو تم نقل فئران C57BL/6J من النوع البري. في مجموعة أخرى من التجارب، تم تعريض فئران CD45.1 للإشعاع القاتل كما هو موضح أعلاه، تلا ذلك حقن وريدي لـ خلايا نخاع العظم من CD45.2 ليز2 نيش أو تحكم نيش أشقاء من نفس القمامة. تم حقن الفئران المزروعة بـ من سيفوفيتين تحت الجلد لمنع العدوى عند زراعة نخاع العظم. عند إعادة تكوين نخاع العظم بعد أيام، تم معالجة الفئران أو لم يتم معالجتها بـ لكل فأر في اليوم، بيجين ساينتيفيكا BA-F-3185.0001) لمدة 12 أسبوعًا في مياه الشرب.

تخفيض التعبير الجيني بواسطة siRNA I1R

تم إجراء كتم تعبير I1R في المختبر باستخدام siRNA Nisch (Santa Cruz sc-61202)، وهو مجموعة من 3 siRNAs محددة الهدف بطول 19-25 نيوكليوتيد مصممة لتقليل تعبير جين Nisch أو siRNA التحكم (Santa Cruz sc-36869) الذي يتكون من تسلسل مختلط مرتبط بـ 10-20 فلوريسئين والذي لا يؤدي إلى التحلل المحدد لأي mRNA خلوي. تم زراعة MEFs في طبق. خلايا لكل بئر) في لوحة زراعة الأنسجة ذات 6 آبار في 2 مل من وسط النمو العادي الخالي من المضادات الحيوية والمكمل بـ FBS. بعد 24 ساعة، تم غسل الخلايا بوسط نقل siRNA (سانتا كروز sc-3686860) وتم إضافة محلول ثنائي الشريطة siRNA (A + B) بعد الخلط بواسطة الماصة واحتضان المحلول المخلوط لمدة 30 دقيقة في درجة حرارة الغرفة (A: 60 بيكومول siRNA في وسط نقل siRNA; ب: مادة نقل siRNA (سانتا كروز sc-29528) إلى وسط نقل siRNA). تم حضانة خلايا MEFs مع المحلول المختلط. بعد 5 ساعات من النقل، تمت إزالة الوسط وأضيف 2 مل من RMPI 10% FBS مع المضادات الحيوية. بعد 24 ساعة، تم معالجة الخلايا في المختبر مع وبدون وتم حضانته مع AGN192403 أو بدونها الخصم).

تفاعل البوليميراز المتسلسل الكمي مع النسخ العكسي

لتحديد تعبير نيش، تم فرز خلايا الطحال كـ CD45 CD11b و الخلايا، وRNA المستخرج باستخدام مجموعة RNeasy Mini وتم تحويله عكسيًا باستخدام مجموعة تحويل النسخ العكسي cDNA عالية السعة مع سداسيات عشوائية وفقًا لتعليمات الشركة المصنعة. تم إجراء PCR الكمي باستخدام خليط GoTaq qPCR Master Mix في نظام PCR السريع الحقيقي 7900 HT. كانت تسلسلات البرايمرات المستخدمة في qPCR هي: Nisch sense 5′-TATGTTGTGGCACAGAAGATGG-3′; anti-sense -TTCAGGCAATGGATAGTGGAT-3′; Gapdh حساسية 5′-TG AAGCAGGCATCTGAGGG-3′; مضادة الحساسية 5′-CGAAGGTGGAAGAGTG GGAG-3′.

الإحصائيات

تم إجراء تحليل البيانات باستخدام برنامج GraphPad Prism الإصدار 9.0 (GraphPad Software) وإصدار Stata 18 (StataCorp). تم تقديم المتغيرات كمتوسط ± خطأ معياري أو متوسط ± انحراف معياري ما لم يُذكر خلاف ذلك. تم استخدام اختبار كولموغوروف-سميرنوف واختبار شابيرو-ويلك لتحديد التوزيع الطبيعي للعينات. تم تقديم المتغيرات الاسمية كنسب وتكرارات. تم إجراء المقارنات بين مجموعتين باستخدام اختبار الطالب غير المقترن ذو الطرفين. -اختبارات (التوزيع الطبيعي) أو مان-ويتني -اختبارات (توزيع غير طبيعي) للمتغيرات المستمرة أو اختبار فيشر الدقيق للمتغيرات الفئوية. ما لم يُذكر خلاف ذلك، تم تقييم المقارنات عبر مجموعات متعددة باستخدام تحليل التباين الأحادي (توزيع طبيعي) يليه اختبار توكي بعد ذلك، أو اختبار كروسكال-واليس (توزيع غير طبيعي) يليه اختبار دان كما هو موضح في كل أسطورة الشكل. تم مقارنة المتغيرات المستمرة عبر الثلثيات من ImP باستخدام تحليل التباين أو اختبارات كروسكال واليس غير المعلمية حسب الاقتضاء، بينما تم تطبيق المتغيرات الاسمية باستخدام اختبار كوهرا-أرمتيج (المتغيرات الثنائية) واختبار جونكهير-تيربسترا (المتغيرات الترتيبية) للاتجاه.
فقط الاختلافات الكبيرة موضحة. بالنسبة لبيانات الميتابولوميات غير المستهدفة، تم تصحيح القيم باستخدام طريقة بنجاميني-هوشبرغ بعد الاختبار ( ) وتم تطبيق تحليلات الإشراف (PLS-DA) لاختيار المتغيرات المسؤولة عن الفصل الذي أظهرته النماذج في MetaboAnalyst (https://www.metaboanalyst.ca/MetaboAnalyst/ home.xhtml) (الشكل 1ب، ج). تم التحقق من صحة النماذج إحصائيًا بواسطة أداة التحقق المتبادل، باستخدام نهج ترك 1/3 للخارج لاستبعاد الإفراط في ملاءمة النموذج.
بالنسبة لمجموعات البشر (PESA وIGT)، لم يتم إجراء حساب لحجم العينة، حيث تم جمع العينات بأثر رجعي من دراسات رصدية. بدلاً من ذلك، تم تحديد أحجام العينات بناءً على توفر مرضى موصوفين بشكل جيد مع بيانات سريرية وصور حيوية كاملة من دراسات رصدية مستقبلية جارية. تم تجميع المجموعات بهدف تعظيم العمق البيولوجي والظاهري بدلاً من استهداف حجم تأثير محدد مسبقًا. سمح تضمين مجموعتين مستقلتين ذات ظواهر تكاملية بإعادة التكرار والتحقق عبر مجموعات البيانات. أشارت اعتبارات القوة بعد الحدث إلى أن حجم عينة مجموعة الاشتقاق (مجموعة PESA، كان التحليل كافيًا عند مستوى 0.85 لاكتشاف فرق لا يقل عن 5 نانومول في مستويات ImP بين مجموعة الأفراد الذين لا يعانون من تصلب الشرايين والأفراد الذين يعانون من تصلب الشرايين. تم اختيار نسبة 1:3 بين المرضى الذين لا يعانون من تصلب الشرايين والذين يعانون منه لتعكس توزيع تصلب الشرايين في مجموعة PESA، وتم اشتقاق مقاييس التشتت (الانحراف المعياري) من مجموعة المشاركين الذين لا يعانون من تصلب الشرايين في مجموعة PESA. على التوالي، كانت مجموعة IGT بحجم كافٍ لاكتشاف فرق قدره 2 نانومول في مستويات ImP بين المشاركين الذين لا يعانون من تصلب الشرايين والذين يعانون منه بقوة 0.85. كانت اعتبارات القوة تستند إلى اختبار مان-ويتني لمجموعتين مستقلتين. تم تحديد خطأ النوع الأول مسبقًا عند 0.05 لحسابات القوة. تم إجراء تحليل القوة باستخدام G*Power 3.1.9.6 (جامعة كيل، ألمانيا). تم تطبيق الأشكال المكعبة المقيدة (الأشكال الطبيعية، RCS) مع ثلاثة عقد عبر توزيع ImP لإنتاج منحنيات الاستجابة للجرعة ولتشكيل نموذج مرن للارتباط غير الخطي المحتمل لـ ImP المستمر مع النقاط النهائية الرئيسية، كما تم وصفه سابقًا. . في كلا المجموعتين، تم تثبيت العقد الثلاثة لـ RCS عند النسبة المئوية العاشرة والخمسين والتسعين من توزيع ImP. تم اختيار عدد العقد بناءً على التحسين في احتمال اللوغاريتم بين نماذج الانحدار ذات 3 أو 4 عقد RCS. لتعزيز الوضوح البصري، تم قطع الرسوم البيانية التي تحتوي على RCS عند القيم التي تتجاوز النسبة المئوية الخامسة والتسعين من توزيع ImP. قمنا بتقييم العلاقات غير الخطية لـ ImP مع نسبة الأرجحية اللوغاريتمية للنتائج الرئيسية لتصلب الشرايين من خلال فحص (اختبار والد) للحدود غير الخطية (RCS). تم التحكم في منحنيات الاستجابة للجرعة في كلا المجموعتين لمجموعة من العوامل المربكة، التي تم بناؤها من خلال دمج الانحدار LASSO والمتغيرات ذات المصداقية البيولوجية. تم استخدام LASSO للانحدار اللوجستي لاختيار النموذج متعدد المتغيرات فيما يتعلق بوجود تصلب الشرايين. تم استخدام LASSO التكيفي مع التحقق المتبادل لاختيار قيمة معامل عقوبة LASSO (لامبدا). تم تقدير الفروق المعدلة في مستويات ImP عبر مجموعات الاهتمام من خلال تحليل الانحدار الخطي المتعدد المتغيرات. لتقييم العلاقة بين مستويات ImP ووجود ونشاط تصلب الشرايين ضمن مجموعة PESA، تم إجراء تحليل الانحدار اللوجستي المتعدد، وتم تعديل النموذج على مجموعة من العوامل المربكة (العمر، الجنس، حالة التدخين، مستوى الجلوكوز الصائم، hs-CRP وتركيز الهيموجلوبين) استنادًا إلى الأدلة السابقة. تم اختبار فرضية الأرجحية النسبية باستخدام اختبار برانت والد. تم التحقيق في تحليل الارتباط بين ImP وخصائص تصلب الشرايين وعوامل الخطر والميكروبيوم المعوي وأنماط النظام الغذائي باستخدام اختبار سبيرمان غير المعلمي والنتيجة الناتجة القيم المصححة باستخدام طريقة بنجاميني-هوشبرغ بعد الاختبار ( ). أخيرًا، تم تقييم القدرة التمييزية لمؤشر ImP لانتشار تصلب الشرايين تحت السريري أو النشط بالإضافة إلى عوامل الخطر التقليدية، بما في ذلك الكوليسترول LDL و hs-CRP، من خلال مقارنة المساحة تحت المنحنى من تحليل خصائص التشغيل المستقبلية المقابلة. تم مقارنة المساحات تحت المنحنى باستخدام اختبار دي لونغ. تم استخدام طريقة البوتستراب مع 1000 تكرار لاشتقاق
فترة الثقة المصححة من التحيز. كانت جميع الاختبارات ذات اتجاهين وكان مستوى الدلالة الإحصائية محددًا مسبقًا عند .

ملخص التقرير

معلومات إضافية حول تصميم البحث متاحة في ملخص تقارير مجموعة نيتشر المرتبط بهذه المقالة.

توفر البيانات

تم إيداع بيانات الميتابولوميات في منصة الميتابولوميات (ST003928، ST003929، ST003932 و ST003938). بيانات تسلسل RNA الكمي و RNA أحادي الخلية التي تم إنشاؤها في هذه الدراسة متاحة في قاعدة بيانات NCBI GEO تحت معرفات BioProject GSE297831 و GSE298392، على التوالي. تم إيداع بيانات البروتيوميات والفوسفورتيوميات في اتحاد ProteomeXchange عبر مستودع الشريك PRIDE مع معرف مجموعة البيانات PXD063955. تم توفير بيانات المصدر مع هذه الورقة.
52. راكوف-ناهوم، س.، باجلينو، ج.، إسلامي-فارزانه، ف.، إدبرغ، س. وميدزهيتوف، ر. التعرف على الميكروفلورا المتعايشة بواسطة مستقبلات شبيهة التول ضروري للحفاظ على توازن الأمعاء. خلية 118، 229-241 (2004).
53. سنتا، م.، كيتلهوت، د. ف. ج.، مالين، س. وجيسترا، أ. قياس تصلب الشرايين في الفئران. ج. فيس. إكسب.https://doi.org/10.3791/59828 (2019).
54. ماسترنجيلو، أ. وآخرون. مقاومة الأنسولين في الأطفال البدينين قبل البلوغ ترتبط بتغيرات الميتابولوم المبكرة المعتمدة على الجنس. المجلة الدولية للسمنة 40، 1494-1502 (2016).
55. لورينزو، سي. وآخرون. ALDH4A1 هو مستضد ذاتي للتصلب العصيدي يستهدفه الأجسام المضادة الواقية. ناتشر 589، 287-292 (2021).
56. بانغ، ز. وآخرون. استخدام MetaboAnalyst 5.0 لمعالجة طيف LC-HRMS، ودمج البيانات متعددة الأوميات، وضبط المتغيرات في بيانات الميتابولوميات العالمية. بروتوكولات الطبيعة 17، 1735-1761 (2022).
57. جيل دي لا فوانتي، أ. وآخرون. CEU Mass Mediator 3.0: أداة لتوصيف المستقلبات. مجلة أبحاث البروتينات 18، 797-802 (2019).
58. باريرو-رودريغيز، ر. وآخرون. TurboPutative: خادم ويب لمعالجة البيانات وتصنيف المستقلبات في علم المستقلبات غير المستهدفة. Front. Mol. Biosci. 9، 952149 (2022).
59. فرنانديز-أورتيز، أ. وآخرون. دراسة تقدم واكتشاف مبكر للتصلب العصيدي تحت السريري (PESA): الأساس والتصميم. مجلة القلب الأمريكية 166، 990-998 (2013).
60. سانغوينتي، إ. وآخرون. بصمات الميكروبيوم-الميتوبولوم في الفئران المعرضة وراثياً لتطوير الخرف، التي تتغذى على نظام غذائي عادي أو دهني. ساي. ريب. 8، 4907 (2018).
61. كاروسو، ر.، أونو، م.، بانكر، م. إ.، نونيز، ج. & إينوهارا، ن. تغييرات ديناميكية وغير متكافئة في المجتمعات الميكروبية بعد العيش المشترك في الفئران المخبرية. تقارير الخلايا 27، 3401-3412.e3 (2019).
62. كوزيتش، ج. ج.، ويستكوت، س. ل.، باكستر، ن. ت.، هايلاندر، س. ك. وشلوس، ب. د. تطوير استراتيجية تسلسل ذات فهرسين وخط أنابيب تنسيق لتحليل بيانات تسلسل الأمبليكون على منصة تسلسل ميسيك إلومينا. الميكروبيولوجيا البيئية التطبيقية 79، 5112-5120 (2013).
63. كالاها، ب. ج. وآخرون. DADA2: استنتاج عينة عالي الدقة من بيانات أمبليكون إيلومينا. نات. ميثودز 13، 581-583 (2016).
64. شلوس، ب. د. وآخرون. تقديم موثور: برنامج مفتوح المصدر، مستقل عن المنصات، مدعوم من المجتمع لوصف ومقارنة المجتمعات الميكروبية. تطبيقات. ميكروبيولوجيا البيئة. 75، 7537-7541 (2009).
65. دي لا فوانتي-أريلاج، سي.، رويز، ز. ف.، بيس-راسترويلو، م.، سامبسون، ل. ومارتينيز-غونزاليس، م. أ. قابلية إعادة إنتاج استبيان تكرار تناول الطعام تم التحقق منه في إسبانيا. التغذية والصحة العامة. 13، 1364-1372 (2010).
66. أميزكيتا، ر. أ. وآخرون. تنسيق تحليل الخلايا الفردية باستخدام بايكونداكتور. نات. ميثودز 17، 137-145 (2020).
67. هاو، ي. وآخرون. تحليل متكامل لبيانات الخلايا الفردية متعددة الأنماط. خلية 184، 3573-3587.e29 (2021).
68. بوغي، ج. ج. وآخرون. BFF وcellhashR: أدوات تحليل لتفكيك بيانات تجزئة الخلايا بدقة. المعلوماتية الحيوية 38، 2791-2801 (2022).
69. تورال، م. وآخرون. تنظيم نقل الكارنيتين بالميتويل بواسطة PPAR- يمنع خلل البطانية الناتج عن الدهون. العلوم السريرية 129، 823-837 (2015).
70. غارود، ج. وآخرون. التكيفات في سلسلة التنفس الميتوكوندرية في البلعميات تساهم في الدفاع المضاد للبكتيريا. نات. إيمونول. 17، 1037-1045 (2016).
71. دوبين، أ. وآخرون. ستار: محاذي تسلسل RNA عالمي فائق السرعة. المعلوماتية الحيوية 29، 15-21 (2013).
72. لي، ب. ودووي، س. ن. RSEM: تقدير دقيق لنسخ الجينات من بيانات RNA-seq مع أو بدون جينوم مرجعي. BMC Bioinformatics 12، 323 (2011).
73. لوف، م. آي.، هوبر، و. & أندرس، س. تقدير معتدل لتغير الطي والتشتت لبيانات RNA-seq باستخدام DESeq2. جينوم بيو. 15، 550 (2014).
74. Gu، ز.، Eils، ر. و Schlesner، م. الخرائط الحرارية المعقدة تكشف عن الأنماط والارتباطات في البيانات الجينومية متعددة الأبعاد. المعلوماتية الحيوية 32، 2847-2849 (2016).
75. روميرو-بيسيرا، ر. وآخرون. تغيير التنشيط يؤثر على النشاط الكهربائي القلبي ويهيئ لحدوث اضطرابات في نظم القلب البطيني. نات. أبحاث القلب والأوعية الدموية 2، 1204-1220 (2023).
76. رودريغيز، ج. م. وآخرون. iSanXoT: تطبيق مستقل لتحليل البيانات الكمية للبروتينات المستندة إلى مطيافية الكتلة. مجلة الحوسبة والهندسة الحيوية 23، 452-459 (2024).
77. سوبرا مانيان، أ. وآخرون. تحليل إثراء مجموعة الجينات: نهج قائم على المعرفة لتفسير ملفات التعبير الجينومي الشامل. وقائع الأكاديمية الوطنية للعلوم في الولايات المتحدة الأمريكية 102، 15545-15550 (2005).
78. ستاماتيلوبولوس، ك. وآخرون. أميلويد- ومعدل الوفيات لدى المرضى الذين يعانون من متلازمة الشريان التاجي الحادة غير المرتبطة بارتفاع مقطع ST. Ann. Intern. Med. 168، 855-865 (2018).
79. ستاماتيلوبولوس، ك. وآخرون. مستويات الكاتيبسين S والبقاء على قيد الحياة بين المرضى الذين يعانون من متلازمات الشريان التاجي الحادة غير المرتبطة بارتفاع مقطع ST. مجلة الكلية الأمريكية لأمراض القلب 80، 998-1010 (2022).
80. والد، أ. اختبارات متسلسلة للفرضيات الإحصائية. آن. ماث. ستات. 16، 117-186 (1945).
81. هاسي، ت.، تيبشيراني، ر. وواينرايت، م. التعلم الإحصائي مع الندرة: اللاسو والتعميمات (تشابمان وهال، 2015).
82. دي لونغ، إ. ر.، دي لونغ، د. م. وكلارك-بيرسون، د. ل. مقارنة المساحات تحت منحنيات خصائص التشغيل المستقبلي المرتبطة: نهج غير معلمي. البيومترية 44، 837-845 (1988).
شكر وتقدير يشكر المؤلفون م. س. كولادو على تحليل ميكروبيوم الأمعاء في الفئران؛ م. أ. غارمنديا على المساعدة في البيانات الوصفية من المتطوعين؛ أعضاء مختبر د. س. على المساعدة في المناقشات والقراءة النقدية للمخطوطة؛ ومرافق CNIC، وخاصة مرافق الحيوانات، والخلية، والأنسجة، والتمثيل الغذائي، والجينوم، والميكروسكوب، والتجارب السريرية، والمعلوماتية الحيوية، والموظفين على المساعدة. يتم تمويل إ. ر.-ف. من قبل FJC2021-048099-I الممول من MCIN/AEI/10.13039/501100011033 والاتحاد الأوروبي NextGenerationEU/PRTR. يتم تمويل د. م. من منحة PRE2020-092578 MCIN/AEI/10.13039/501100011033. يتم تمويل م. غ. من منحة تدريب المعلمين الجامعيين 20/01418. يتم تمويل م. ف.-م. من INPhINIT Retaining 2024 من مؤسسة كايسا LCF/BQ/DR24/12080010. يتم دعم أ. ر.-ع. من قبل مجتمع مدريد (PIPF-2022/SALGL-24581). يتم تمويل ر. ب.-ر. من منحة تدريب المعلمين الجامعيين 20/03365. يتم دعم أ. ديفيسا علمياً من قبل صندوق أبحاث ثراشر ويعترف بدعم الجمعية الإسبانية لأمراض القلب (منحة SEC/PRS-MOV-INT2O/OO2). يتم تمويل العمل في مختبر د. س. من قبل CNIC؛ برنامج أفق الاتحاد الأوروبي 2020 للبحث والابتكار بموجب اتفاقية منحة ERC-2016-Consolidator Grant 725091؛ وزارة العلوم والابتكار والجامعات (MICIU) PID2022-137712OB-I00، CPP2021-008310 و CPP2022-009762 MICIU/AEI/10.13039/501100011033 وكالة الدولة للبحث، الاتحاد الأوروبي NextGenerationEU/PRTR؛ مجتمع مدريد (P2O22/BMD-7333 INMUNOVAR-CM)؛ المؤسسة العلمية للجمعية الإسبانية لمكافحة السرطان (AECC-PRYGN246642SANC)؛ أبحاث السرطان العالمية WWCR-25-0080؛ الاتحاد الأوروبي ERC-2023-PoC؛ اتفاقية بحث مع Inmunotek S.L.؛ ومؤسسة لا كايسا (LCF/PR/HR23/52430012 و LCF/PR/HR22/52420019). يتم دعم العمل في مختبر ب. إ. من قبل المفوضية الأوروبية (H2O2O-HEALTH 945118 و ERC-CoG 819775)؛ PID2022-140176OB-IOO، PID2019-107332RB-IOO MCIN/AEI/10.13039/501100011033؛ ومجتمع مدريد RENIM P2022/BMD-7403. يتم تمويل ف. ب. من منح من مؤسسة القلب والرئة السويدية (20240882) وهو زميل وولنبرغ وحاصل على منحة ERC-Advanced 2022 (101096705-IMPACT). تم دعم ك. ستيلوس من قبل مؤسسة الأبحاث الألمانية (DFG، مشروع ID 394046768 – SFB1366 ‘التحكم الوعائي لوظيفة الأعضاء’ C07)، والمجلس الأوروبي للبحث (ERC) بموجب برنامج أفق الاتحاد الأوروبي 2020 للبحث والابتكار (MODVASC، اتفاقية منحة 759248)، والمركز الألماني للبحوث القلبية الوعائية (DZHK) ومعهد هيلمهولتز للعلوم القلبية الوعائية الانتقالية (HI-TAC) من مركز ماكس ديلبروك للطب الجزيئي في جمعية هيلمهولتز (MDC) في جامعة هايدلبرغ، هايدلبرغ، ألمانيا. يتم دعم منصة التمثيل الغذائي من قبل منحة NIH U2C-DK119886 ومنح OT2-ODO30544. يتم دعم CNIC من قبل معهد الصحة كارلوس الثالث (ISCIII)، وMICIU ومؤسسة Pro CNIC، وهو مركز تميز سيفيرو أوتشوا (CEX2020-001041-S الممول من MICIU/AEI/10.13039/501100011033). يتم تمويل دراسة PESA من قبل CNIC وبنك سانتاندير. تم تمويل هذه الدراسة جزئياً من قبل منحة داخلية CNIC-Severo Ochoa إلى ب. إ. ود. س.
مساهمات المؤلفين: قام أ.م.، إ.ر.-ف. و د.س. بتصميم الدراسة وتخطيطها. قام أ.م.، إ.ر.-ف.، د.م.، ج.أ.-إ.، س.م.-ك.، ف.ن.، إ.ف.-ل.، ن.إ.، أ.ب.، م.ج.، م.ر.-ت.، م.ف.-م.، أ.ر.-ع.، ر.ب.-ر.، ج.أ.ل.، س.إ.، ك.ر.ب. و ف.أ.-هـ. بإجراء التجارب وتحليل البيانات. دعم أ.س.، ك.ر.ب.، س.إ.، أ.ف.، إ.ف.-ل.، أ. دوبازو، ج.ب.، ج.ف.، ج.ن.، ف.ب.، إ.ب.، أ.ج.-م.، د.س. و ف.س.-م. التجارب وقدموا المعدات والمواد الكيميائية. طور ك. ستاماتيلوبولوس و ك. ستيلوس مجموعات سريرية، بما في ذلك تجنيد المرضى، وساعدوا في تحليل نتائجهم. ساهم ج.ج. في إجراء تحليلات دراسة المجموعة ومع أ.م.، ك. ستاماتيلوبولوس و ك. ستيلوس في تفسير النتائج البشرية. حصل د.س. و ب.إ. على التمويل. أشرف د.س. على المشروع. كتب أ.م.، إ.ر.-ف. و د.س. المخطوطة بمشاركة جميع المؤلفين. قام جميع المؤلفين بتحرير المخطوطة النهائية والموافقة عليها.
المصالح المتنافسة يتلقى F.B. تمويلًا بحثيًا من Biogaia AB وNovo Nordisk A/S، وهو مؤسس مشارك ومساهم في Roxbiosens Inc.، وعضو في المجلس الاستشاري العلمي لشركة Bactolife A/S. F.B. وK.R.B. وA.C. هم مؤسسون مشاركون ومساهمون في Implexion Pharma AB. A.M. وI.R.-V. وD.S. وB.I. وV.F. وD.M. هم مخترعون في طلب براءة اختراع بعنوان مضادات I1R للاستخدام في الوقاية و/أو علاج مرض التهابي ذاتي أو مرض مناعي ذاتي، رقم النشر WO2O25002914 (2025). المؤلفون الآخرون يعلنون عدم وجود مصالح متنافسة.

معلومات إضافية

معلومات إضافية النسخة الإلكترونية تحتوي على مواد إضافية متاحة فيhttps://doi.org/10.1038/s41586-025-09263-w.
يجب توجيه المراسلات والطلبات للحصول على المواد إلى ديفيد سانشو. تشكر مجلة Nature سُرَيّا طالب والمراجعين الآخرين المجهولين على مساهمتهم في مراجعة الأقران لهذا العمل. تقارير مراجعي الأقران متاحة.
معلومات إعادة الطبع والتصاريح متاحة علىhttp://www.nature.com/reprints.
الشكل البياني الموسع 1| الأنظمة الغذائية الغنية بالكوليسترول والمضادات الحيوية تعدل ميكروبيوم الأمعاء والمواد الأيضية في البلازما في Apo الفئران. أ، إعداد تجريبي يتوافق مع الشكل 1 والشكل الإضافي 1. ApoE تم تغذية الفئران بأنظمة غذائية مختلفة (علف، كوليسترول عالي (HC)، كوليسترول عالي وكولين عالي (HC/HC)) لمدة 8 أسابيع. بعد 4 أسابيع من بدء النظام الغذائي، تم معالجة الفئران أو عدم معالجتها بمزيج من المضادات الحيوية (abx) في مياه الشرب. عند التضحية، تم جمع وتحليل عينات من الشريان الأورطي، القلب، محتوى الأمعاء الغليظة وعينات البلازما. ب، مخططات شريطية مكدسة تظهر الوفرة النسبية لتسلسلات 16S rDNA، على مستوى الجنس. من الوفرة الإجمالية)، التي تختلف بشكل ملحوظ في عينات السيسم من المجموعات المحددة. الأجناس المعروضة تختلف جميعها بشكل ملحوظ بين حمية الشاو وحمية HC بواسطة اختبار كروسكال-واليس ثنائي الجانب مع تصحيح دُن. .
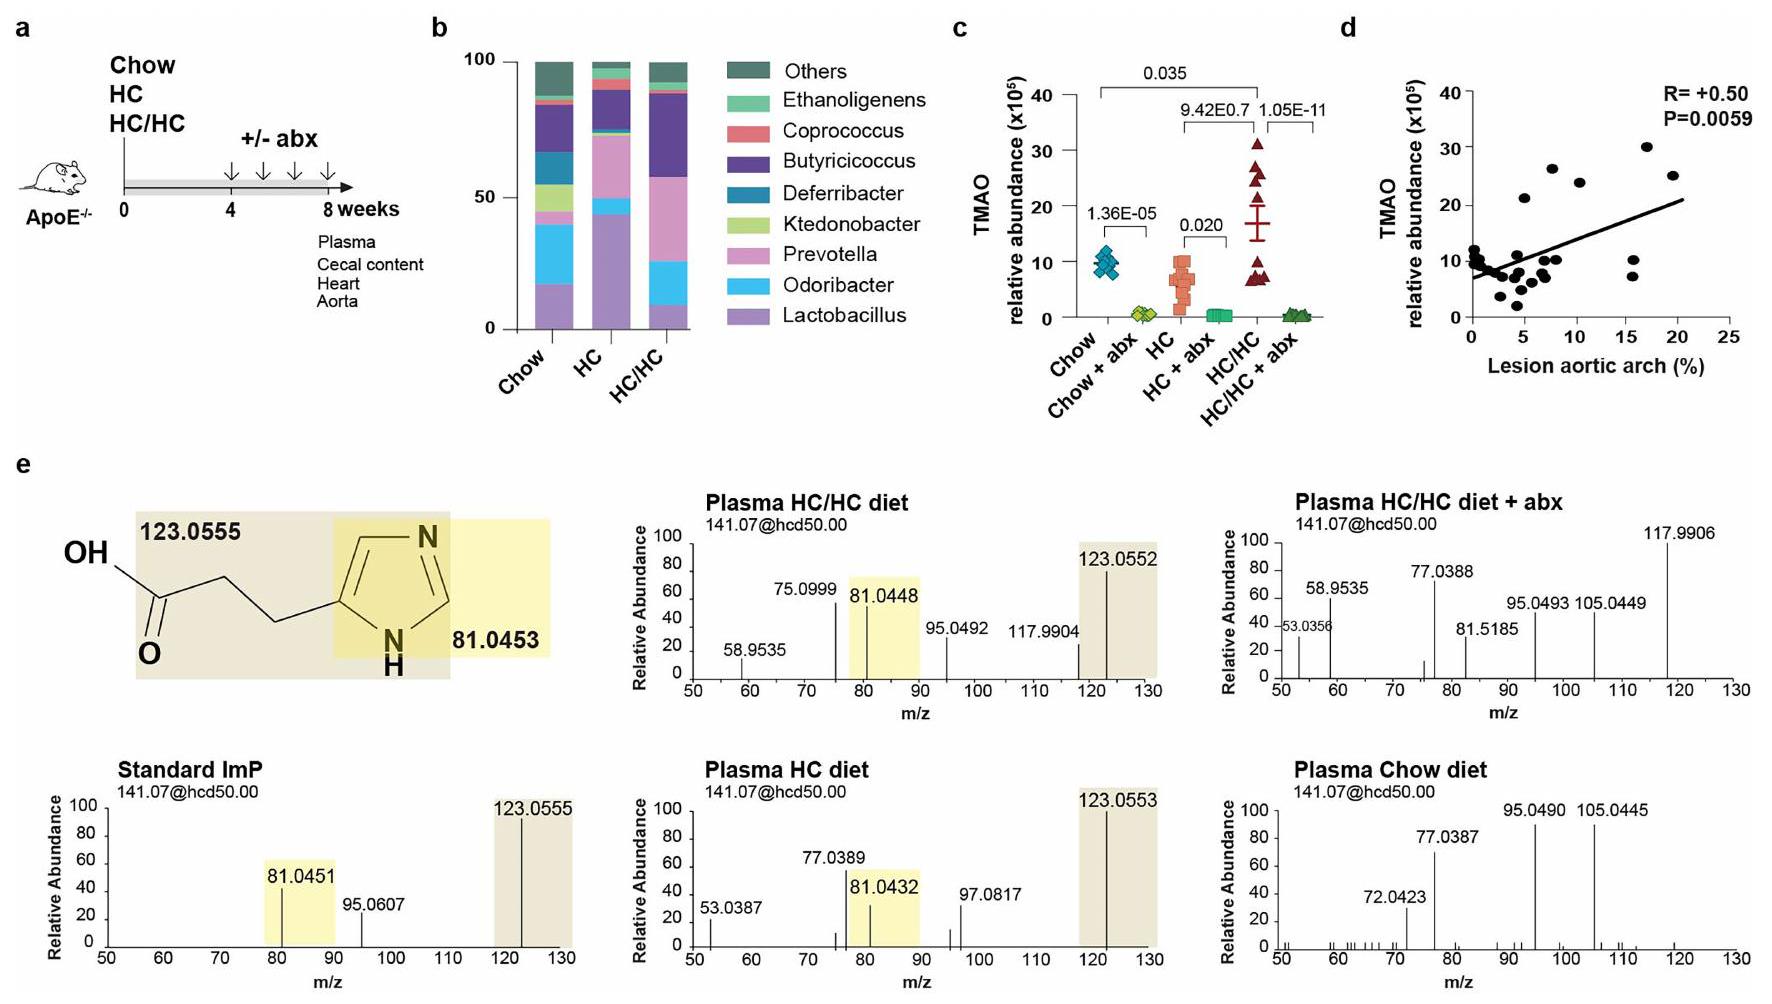
ج، الوفرة النسبية لـ TMAO في البلازما تم قياسها بواسطة LC-MS غير المستهدف. ارتباط وفرة TMAO النسبية بآفة قوس الأبهر. يتم حساب معامل الارتباط (R) وقيمة p كاختبار الارتباط البارامترى لبييرسون. (تشاو و و ). e، تحليل الطيف الكتلي الثنائي باستخدام تكسير الكتلة بواسطة التفكك الناتج عن الاصطدام عالي الطاقة (HCD) باستخدام 50 إلكترون فولت كطاقة اصطدام لمعيار إيميدازول بروبيونات (lmP) (يسار) ومواد داخلية الكتلة من البلازما لـ تم تغذية الفئران بأنظمة غذائية مختلفة كما هو موضح. ب-د، تم تجميع البيانات من تجربتين مستقلتين. ج، يتم عرض المتوسط الحسابي ± الانحراف المعياري لكل مجموعة. تم استخدام تحليل التباين أحادي الاتجاه ذو الجانبين مع تصحيح توكي بعد الاختبار.
الشكل البياني الموسع 2 | الميزات الأيضية والغذائية للمتطوعين غير المصابين بالأعراض من مجموعتي PESA وIGT. أ، تركيز البلازما من الهيستيدين وحمض اليوروكان في الأفراد الأصحاء (CTR) والأفراد الذين يعانون من تصلب الشرايين تحت السريري (AT) من مجموعة PESA (يسار، CTR n=105، AT n=295، تركيز البلازما لكلا المستقلبين) ومجموعة IGT (يمين، CTR n=529، AT تركيز البلازما لكلا المستقلبين). البيانات على مقياس لوغاريتمي أساسي 10. يتم عرض الوسيط مع النطاق الربعي لكل مجموعة. ns: غير دال. ب، رسم راداري لعوامل التحميل لكل نمط غذائي. ج، تحليل ROC للقيمة المضافة لـ ImP على LDL-C وحده لتمييز AT الكلي تحت السريري (يسار ووسط) وAT النشط (يمين). يسار، مجموعة PESA: AUC (CI: 0.524-0.639) مقابل AUC (CI: 0.488-0.590) الجامعة الأمريكية في القاهرة (CI: 0.01 . المركز، مجموعة IGT: (CI:0.535-0.590) مقابل (CI: 0.508-0.565)، (CI:0.014-0.05) . صحيح، AT النشطة: AUC ، (CI: 0.554-0.659) مقابل AUC (CI: تحليل القيمة المضافة لـ ImP بالإضافة إلى بروتين سي التفاعلي عالي الحساسية (hs-CPR) لتمييز AT المبكر (يسار ووسط) وAT النشط (يمين). يسار، PESA
مجموعة: AUC (CI:0.525-0.651) مقابل AUC (CI:0.501-0.532)، (CI 0.014-0.133، . المركز، مجموعة IGT: (CI:0.530-0.584) مقابل (CI:0.10-0.552)، (CI:0.06 . صحيح، نشط ، (CI: ) مقابل AUC (CI:0.501-0.536) الجامعة الأمريكية في القاهرة (CI 0.054-0.155) p = 0.00042 . e، تمثيل تخطيطي لتوزيع المتطوعين من دراسة PESA. استنادًا إلى التصوير متعدد المناطق/متعدد الأنماط (أي: الموجات فوق الصوتية الوعائية ثنائية وثلاثية الأبعاد والتصوير المقطعي المحوسب بدون تباين)، قمنا بتصنيف 295 مشاركًا يعانون من تصلب الشرايين تحت السريري و105 ضوابط بدون تصلب الشرايين (باللون الأخضر). تم تصنيف الأشخاص الذين يعانون من تصلب الشرايين تحت السريري بشكل إضافي وفقًا لامتصاصهم للفلوروديوكسي جلوكوز ( F-FDG): أولئك الذين لا يظهرون أي امتصاص يعتبرون تصلب الشرايين غير النشط (FDG اللون الأصفر)؛ أولئك الذين لديهم نشاط استقلابي في نخاع العظم (FDG + _BM، عدد = 40)، الشرايين (FDG +_A، عدد = 57)، أو في كلا الحيزين (FDG +_SYS، عدد = 124) يعتبرون تصلب شرايين نشط (FDG +، الأحمر). الصور هي صور تمثيلية للاحتفاظ في الشرايين ونخاع العظم.
الشكل البياني الممتد 3 | تحفيز تصلب الشرايين بواسطة مكملات ImP في الفئران المعرضة لتصلب الشرايين التي تتغذى على العلف مستقل عن التغيرات في تركيز الكوليسترول والجلوكوز. أ، ب، الفئران التي تتغذى على العلف تم إعطاء الفئران ImP (ImP) أو عدم إعطائها (CTR) في مياه الشرب لمدة 12 أسبوعًا، تلاها التضحية والتحليل. أ، صبغة زيت أحمر O على السطح الأمامي للشريان الأورطي تظهر تقدير الآفات التصلبية في الشريان الأورطي بالكامل (يسار) وصور تمثيلية (يمين). مجموع الكوليسترول وتركيز الجلوكوز في البلازما. CTR مُغذى بالشاو تم معالجة الفئران بـ ImP أو عدمه (CTR) في مياه الشرب لمدة 8 أسابيع. ج، صبغة ماسون ثلاثية الألوان لجذور الشريان الأورطي تظهر تقدير مساحة الآفة (يسار) وصور تمثيلية (يمين). حجم القضيب . د، قياس الآفات التصلبية بواسطة صبغة زيت أحمر O على السطح الأمامي للأبهر، موضحًا القياس في الأبهر (يسار)، قوس الأبهر (وسط) و
صور تمثيلية للأبهر (يمين). CTR=17؛ إجمالي الكوليسترول ( ) وتركيز الجلوكوز ( ) في البلازما. مدعوم من HC تم إعطاء الفئران أو لا (CTR) في مياه الشرب لمدة 12 أسبوعًا، زيت أحمر تلوين الواجهة للشريان الأورطي يظهر تقدير الآفات التصلبية في الشريان الأورطي (يسار) وصور تمثيلية (يمين). عدد العينة = 9. ج، تم تغذية Apoe بنظام غذائي غني بالدهون. تم إعطاء الفئران ImP (ImP) أو عدم إعطائها (CTR) في مياه الشرب لمدة 4 أسابيع، تلاها التضحية والتحليل باستخدام صبغة زيت أحمر O على السطح الأمامي للشريان الأورطي، مما يظهر تقدير الآفات التصلبية في الشريان الأورطي (يسار) وصور تمثيلية (يمين). بيانات فردية ومتوسط ± SEM من تجربتين مستقلتين على الأقل. أ، ب، ج، هـ، ز، اختبار t غير المقترن ذو الاتجاهين لطلاب. د، اختبار مان ويتني U ذو الاتجاهين. ف، اختبار t غير المقترن ذو الاتجاه الواحد.
الشكل البياني الممتد 4 | زيادة ImP في الدورة الدموية تحفز تصلب الشرايين والالتهاب الجهازي في الفئران المعرضة لتصلب الشرايين التي تتغذى على نظام غذائي عادي.
أ-ك، تغذية تشاو تم إعطاء الفئران ImP لمدة 4 أو 8 أسابيع كما هو موضح. أ، أعداد ROR في CD4 الخلايا في الدم عند التضحية. اليسار: . اليمين: مخططات كثافة تمثيلية لـ CTR (الأعلى) و ImP (الأسفل). ب، ج، تمثيلات UMAP لخلايا مستمدة من الشريان الأورطي تم تحليلها بواسطة scRNAseq ملونة حسب نوع الخلية، بغض النظر عن مدة العلاج (ب) وحسب العلاج والوقت (ج). د، مخطط نقطي لمؤشرات نوع الخلية المستخدمة لتحديد المجموعات الرئيسية من الخلايا. هـ، تمثيل UMAP (يسار) ونسب الخلايا (يمين) معلمة حسب نوع الخلية لخلايا مستمدة من الشريان الأورطي بناءً على الملفات التعريفية النسخية من النظام الغذائي المعتمد على العلف. الفئران بعد 4 أسابيع من الإدارة. تحديد كميات الآفات التصلبية بواسطة صبغة زيت أحمر O على السطح الأمامي للأبهر، موضحًا الكمية في الأبهر بالكامل (يسار)، قوس الأبهر (وسط) وصور تمثيلية (يمين) بعد 4 أسابيع من إدارة ImP. CTR = 10؛ ImP=8.g-i، أعداد خلايا Ly6C الدائرة. وحيدات النواة خلايا، الخلايا و ماكروفاجات CTR بعد 4 أسابيع من إدارة ImP
محدد بواسطة تحليل تدفق الخلايا. إجمالي أعداد CD45 الخلايا، CD90 خلايا T و تم تسلل الخلايا في الشريان الأورطي بعد 8 أسابيع من إدارة ImP بواسطة تحليل تدفق الخلايا. ; . تلوين الخلايا في طبقة الإنتيما/الميديا في جذور الشريان الأورطي تظهر التقدير (يسار) وصور تمثيلية (يمين) للخلايا التائية المتسللة بعد 8 أسابيع من إدارة ImP. CTR = 11؛ حجم القضيب . صبغة MAC2 داخل لويحة التصلب العصيدي تظهر تحديد المساحة (يسار) وصور تمثيلية (يمين) بعد 8 أسابيع من إدارة ImP. ; حجم القضيب تم إعطاؤه (ImP) أو لم يتم (CTR) إلى فئران تم تطعيمها بنخاع العظام من النوع البري (CTR ) أو Rag1 وتم تغذية النظام الغذائي لمدة 12 أسبوعًا. تم قياس آفات تصلب الشرايين بواسطة صبغة زيت أحمر O على السطح الأمامي للأبهر، مع عرض القياس في الأبهر بالكامل. f-I، بيانات فردية ومتوسط ± SEM من تجربتين مستقلتين على الأقل. a، f(يسار)، h-k، اختبار t غير المقترن ذو الاتجاهين. f(يمين)، g، h(يسار)، اختبار مان ويتني U ذو الاتجاهين. I، تحليل التباين الأحادي مع تصحيح توكي بعد الاختبار.
الشكل البياني الممتد 5|انظر الصفحة التالية للتعليق.

مقالة

الشكل البياني الموسع | ImP يسبب تغييرات في النسخ في الخلايا الليفية، البلعميات والخلايا البطانية. أ-ز، تغذية على نظام تشاو تم إعطاء الفئران ImP وتم تحليل الخلايا المشتقة من الشريان الأورطي باستخدام تسلسل RNA أحادي الخلية. أ-ج، رسم نقطي لمستويات التعبير لعوامل تحديد نوع الخلايا المستخدمة لتحديد تحت المجموعات الخلوية للبلاعم (MFs) (أ)، الألياف (FBs) (ب)، والخلايا البطانية (ECs) (ج). د-و، جدول لمصطلحات علم الجينات (GO) التمثيلية الغنية في تحت المجموعات من MFs (د)، FBs (هـ) و ECs (و). جميع مصطلحات GO المعروضة ذات دلالة إحصائية (قيمة p المعدلة ). ج، الوفرة النسبية (نسبة لوغاريتمية) لنسب خلايا تحت العنقود مقارنةً بمعالجة ImP مقابل CTR، بغض النظر عن مدة المعالجة. ح، تركيز MCP1 المقاس بواسطة ELISA في السائل الفائق لخلايا MEFs المعالجة بـ ImP لمدة 24 ساعة. ن = 10. ط، عدد أحادية النواة بعد الهجرة المجمعة في الحجرة السفلية استجابةً للسائل الفائق من (ح) والمقاسة بواسطة تحليل تدفق الخلايا. خريطة حرارة لتحليل إثراء مجموعة الجينات (GSEA) من تحليل RNAseq للماكروفاجات المشتقة من نخاع العظم (BMDMs) والألياف الجنينية للفئران (MEFs) وخلايا بطانة الشريان الأورطي للفئران (MAECs) مقارنةً بتحفيز ImP بعد 1 ساعة و2 ساعة مقابل الظروف غير المحفزة داخل كل نوع من الخلايا. k، مخططات إثراء GSEA للببتيدات الفسفورية المتعلقة بمسار المTOR من BMDMs (أعلى) وMEFs (أسفل) بعد معالجة ImP لمدة 180 دقيقة مقارنةً بالخلايا غير المحفزة. تم استخدام الوفرة العالمية لجميع الببتيدات المتعلقة بمسار المTOR للتحليل. 1، م، BMDMs (يسار) وMEFs
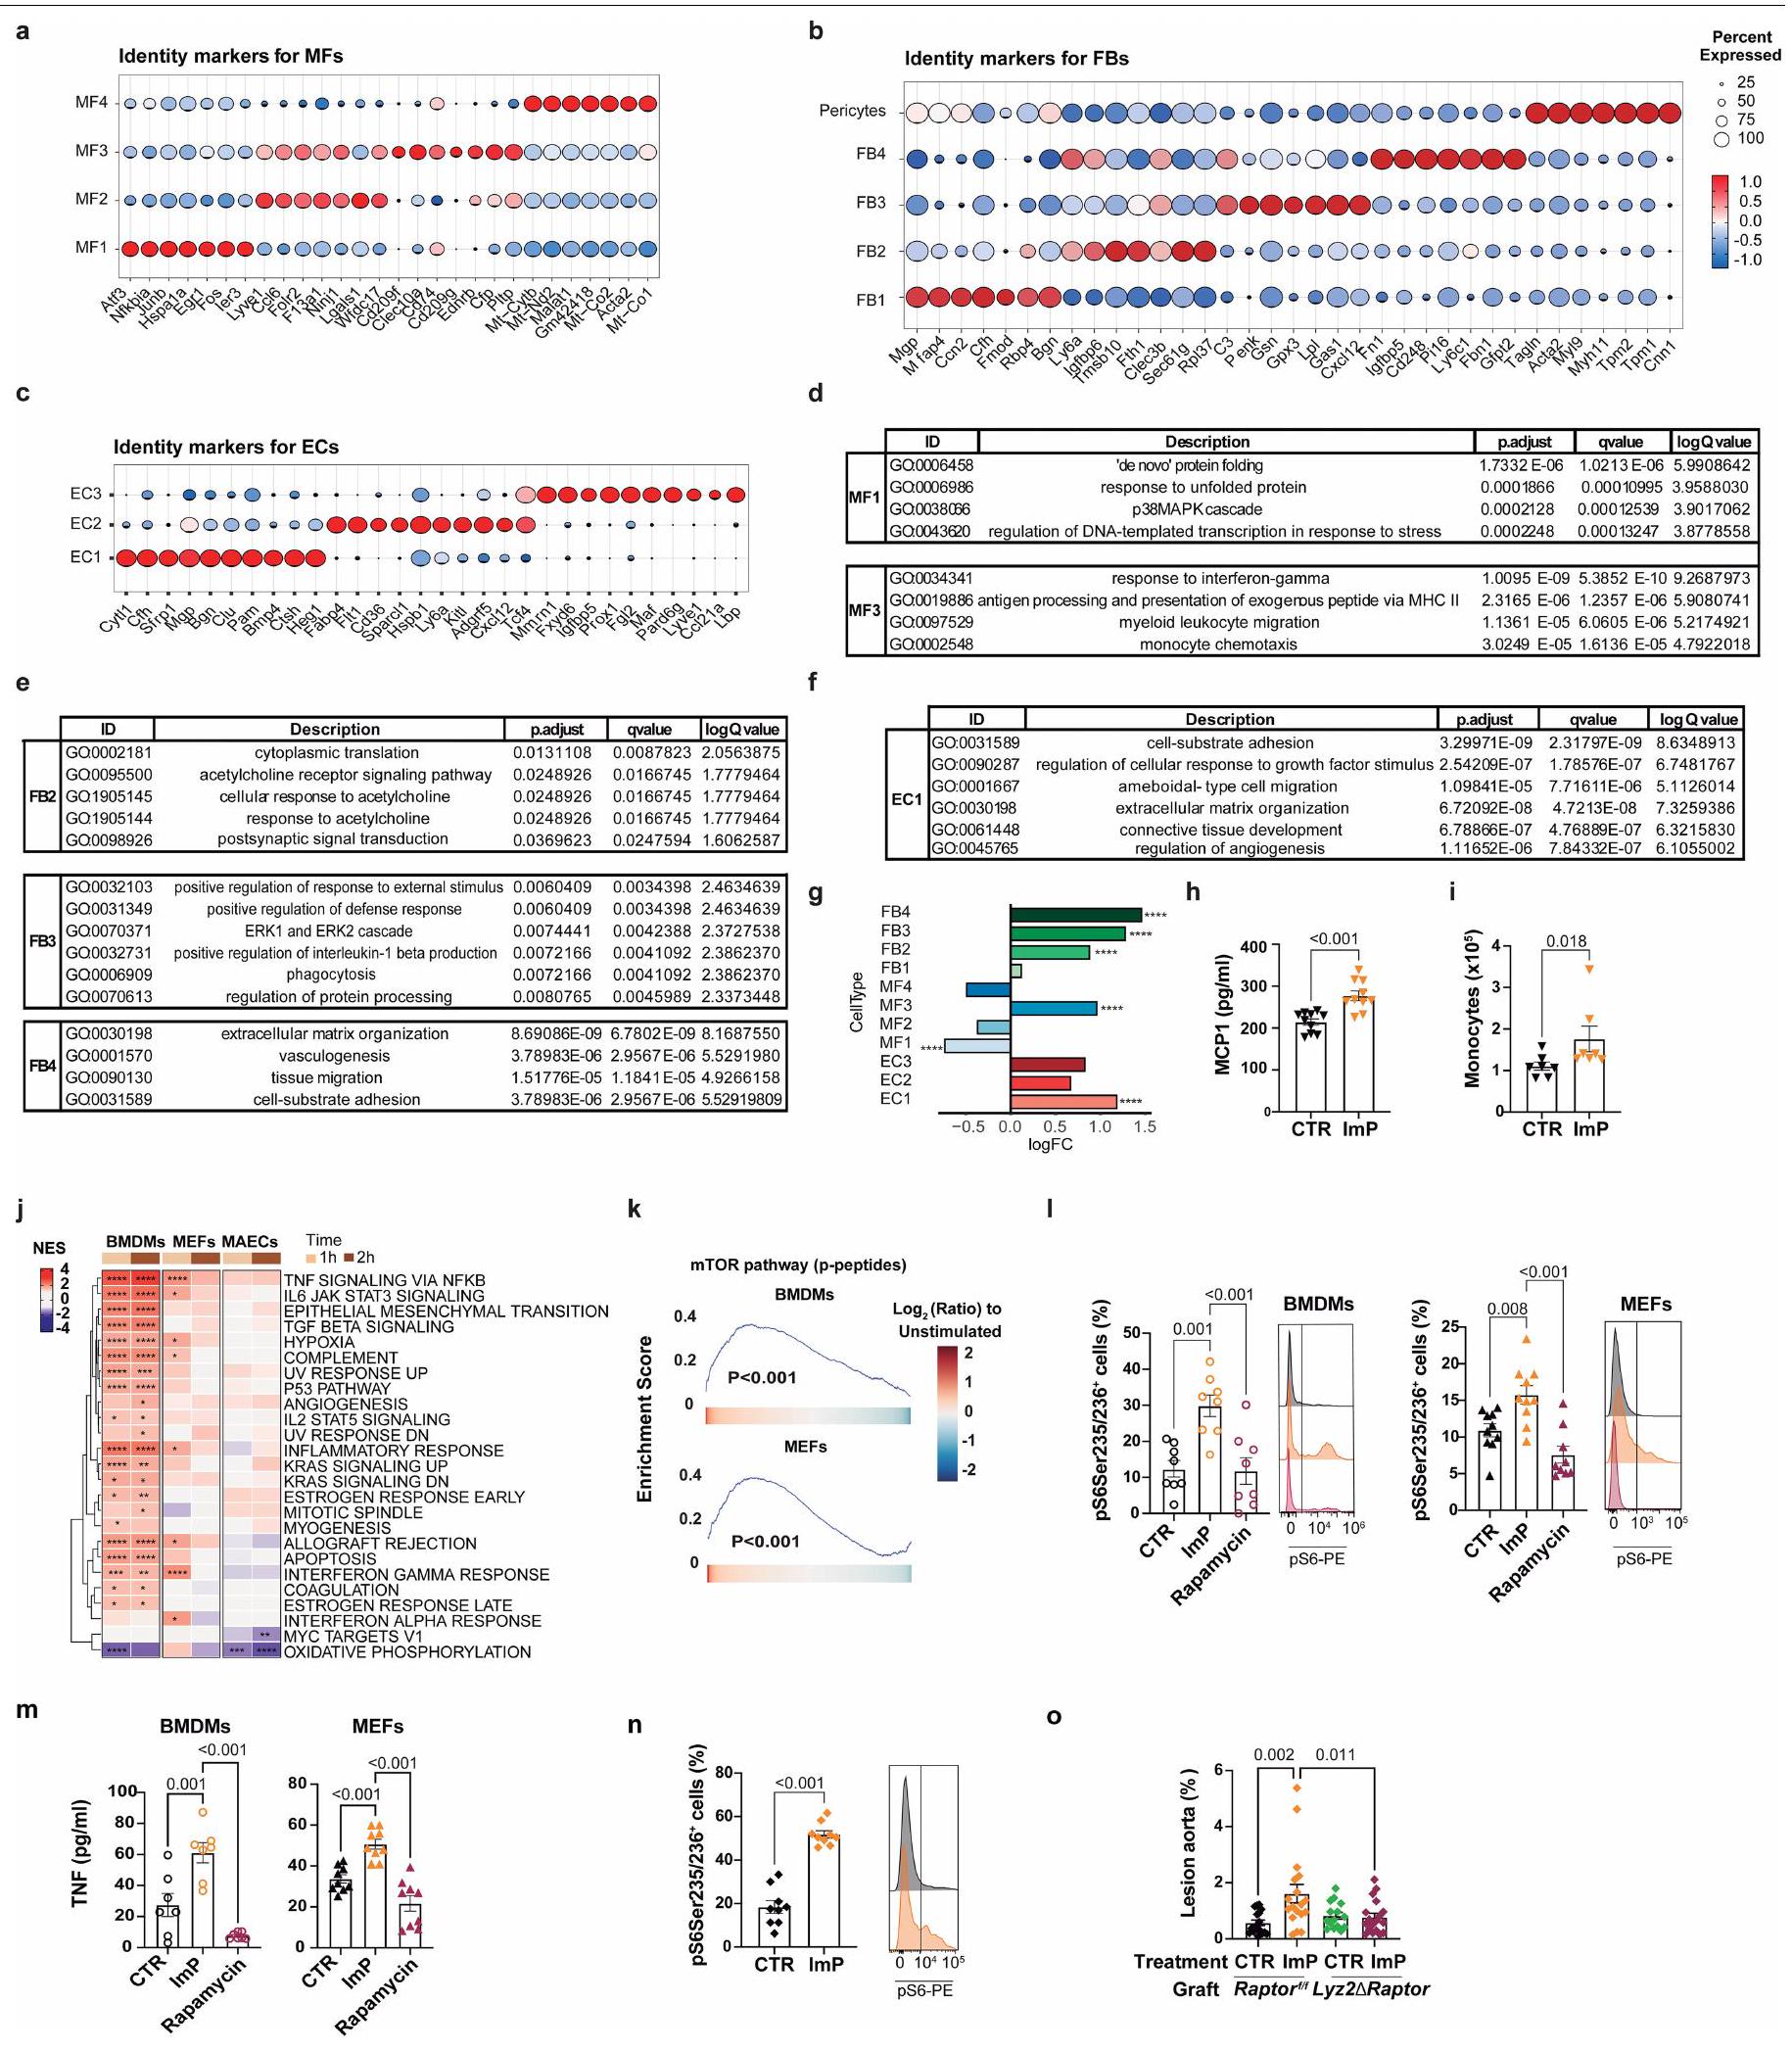
بعد تحفيز ImP لمدة 24 ساعة مع أو بدون تزامن مع الراباميسين. 1، صبغة تدفق الخلايا لبروتين ribosomal pS6. اليسار: BMDMn = 8؛ MEF CTR = 10؛ ImP = 10؛ ImP + AGN = 9؛ اليمين: هيستوجرامات تمثيلية لـ CTR (الأعلى)، ImP (الوسط) و ImP + راباميسين (الأسفل). m، إنتاج TNF تم قياسه بواسطة ELISA. BMDM ; MEF تلوين تدفق الخلايا للبروتين pS 6 في البلعميات البريتونية المجمعة من الفئران التي تتغذى على نظام غذائي عادي الفئران التي تم إعطاؤها ImP لمدة 8 أسابيع. اليسار: . اليمين: هيستوجرامات تمثيلية لمعدل النقر (الأعلى)، وImP (الأسفل). . تم إعطاؤه (ImP) أو لم يتم (CTR) لـ Ldlr فئران تم تطعيمها بنخاع العظام من رابتور التحكم أو رافتور ; ) وتم تغذيتها بنظام غذائي يحتوي على علف لمدة 12 أسبوعًا. قياس الآفات التصلبية بواسطة زيت أحمر تلوين الواجهة للشريان الأورطي، يظهر التقدير في الشريان الأورطي بالكامل. أ-ج، اختبار ويلكوكسون لمجموع الرتب مقارنةً بتجمعات الخلايا. قيمة p المعدلة < اختبار Z لعينتين. البيانات مجمعة من n = 7 تجارب مستقلة. اختبار t لطلاب غير المقترنين ذو طرفين. اختبار مان-ويتني U ذو طرفين. اختبار كولموغوروف-سميرنوف. تم حساب القيم الاحتمالية الاسمية باستخدام اختبار التبديل 1000. بيانات فردية (كل واحدة تمثل تجربة مستقلة) ومتوسط ± SEM. تحليل التباين الأحادي مع تصحيح توكي. بيانات فردية ومتوسط ± SEM لاثنين على الأقل من التجارب المستقلة المجمعة. اختبار t لطلاب غير المقترنين ذو طرفين بين CTR و ImP. .
الشكل 6 من البيانات الموسعة | مستقبل إيميدازولين-1 يتوسط الاستجابات الوظيفية التي تحفزها ImP. أ، ب، تم معالجة البلعميات المشتقة من نخاع العظام (BMDMs) والخلايا الليفية الجنينية الفأرية (MEFs) في المختبر باستخدام ImP (أو عدم استخدامه، CTR) وتمت زراعتها مع AGN192403 (AGN، مضاد I1R)، إيدازوكسان (IR ومستقبلات الأدرينالين ( مضاد) أو يوهيمبين ( المضاد). أ، صبغة تحليل تدفق الخلايا لـ pS6 (يسار، n=10) ورسوم بيانية تمثيلية (يمين) تتوافق مع كل علاج متطابقة حسب اللون. ب، إنتاج TNF في سوائل الثقافة بعد 24 ساعة بواسطة ELISA (BMDMs: CTR وسط ImP+idazoxan=7، ImP+yohimbine=7؛ MEF: لكل المجموعات). تم نقل MEFs بواسطة siRNA IIR (siNisch) أو siRNA التحكم (siCTR) وتم تحفيزها بـ ImP أو عدم تحفيزها (CTR) وتم احتضانها مع أو بدون AGN192403 (AGN) كما هو موضح. تلوين تدفق السيتومتر لـ pS6، مع عرض كمية النسبة المئوية للخلايا الإيجابية لـ pS6 (يسار، ) ورسوم بيانية تمثيلية (يمين) تتوافق مع كل علاج محدد ومتطابقة حسب اللون. د، إنتاج TNF في سوائل الثقافة بعد 24 ساعة بواسطة ELISA. و تم عزل خلايا الطحال لتحليل التعبير النسخي النسبي لـ Nisch بواسطة qRT-PCR. CD11b نيش Lyz2 ANisch ; CD3 نيش نيش تم إنتاج BMDMs من نيش أو
ليز2 نيسش الفئران ومعالجتها أو عدم معالجتها (CTR) مع ImP في المختبر. تلوين باستخدام قياس التدفق الخلوي لـ pS 6، يظهر تحديد نسبة الخلايا الإيجابية لـ pS 6 (يسار) والهيستوجرامات التمثيلية (يمين) التي تتوافق مع كل علاج متطابقة حسب اللون. نيسش نسبة النقر إلى الظهور نيش إم بي , لyz2 نيش سي تي آر , لyz2 نيش إنتاج TNF في سوائل الثقافة لمدة 24 ساعة بواسطة ELISA. نيش نسبة النقر إلى الظهور = 5، نيش ليز نسبة النقر على الظهور ليز نيش تم إعطاء (ImP) أو عدم إعطائه (CTR) لـ فئران تم تطعيمها بنخاع العظام من المجموعة الضابطة أو نظام غذائي نيش وعلبة طعام مغذية لمدة 12 أسبوعًا. قياس الآفات التصلبية في الشريان الأورطي بواسطة صبغة زيت أحمر O على السطح الأمامي للشريان الأورطي. أ، ب، المتوسط الحسابي ± SEM وبيانات فردية من النسخ البيولوجية. تحليل التباين الأحادي مع تصحيح توكي بعد الاختبار. ج، د، المتوسط الحسابي ± SEM وبيانات فردية من تجارب مستقلة مجمعة. تحليل التباين الأحادي مع تصحيح توكي بعد الاختبار. هـ، المتوسط الحسابي ± الخطأ المعياري للمتوسط والبيانات الفردية من النسخ البيولوجية. اختبار t لطلاب غير المقترنين ذو طرفين بين نيش و نيسش. ف، ج، المتوسط الحسابي SEM وبيانات فردية. تحليل التباين الأحادي مع تصحيح توكي بعد الاختبار، تحليل التباين الأحادي مع تصحيح توكي بعد الاختبار نيش. (CTR = 17، ImP=20) أو Lyz2 نيش (CTR = 19 في جميع اللوحات، تشير n إلى النسخ البيولوجية.
الشكل 7 من البيانات الموسعة | يمنع تثبيط محور ImP/I1R باستخدام AGN192403 الاستجابة المناعية والالتهابية الناتجة عن ImP دون التأثير على تركيز ImP والكوليسترول في الدم. أ-ي، تم إعطاء ImP (أو عدم إعطائه، CTR) في وجود AGN192403 (AGN) أو عدم وجوده (ImP) في مياه الشرب لـ فئران تم تغذيتها بنظام غذائي لمدة 8 أسابيع، تلاها التضحية والتحليل. أ، زيت أحمر تلوين الواجهة للشريان الأورطي يظهر تقدير الآفات التصلبية في الشريان الأورطي بالكامل في الفئران الذكور. CTR=15; ImP=17; . أحمر النفط تلوين الواجهة للأبهر يظهر تقدير الآفات التصلبية في الأبهر بالكامل (يسار)، قوس الأبهر (وسط) وصور تمثيلية (يمين) في إناث الفئران. CTR . ج، تركيز الكوليسترول الكلي في البلازما. ذكور الفئران (يسار)، CTR=14؛
والفئران الإناث (يمين)، تركيز إيميدازول بروبيونات في بلازما الفئران الذكور عند التضحية. CTR AGN . هـ، ف، عدد T-bet في CD4 خلايا T. (هـ)، وCD90 و B220 الخلايا (ف) في الدم عند التضحية بواسطة تحليل تدفق الخلايا. CTR = 9؛ AGN و عدد الشريان الأورطي المتسلل T-bet ث1. نسبة النقر إلى الظهور=9؛ و FoxP3 خلايا Treg CTR AGN (هـ)، B220 خلايا ب. (i) و F4/80 Cd11c الخلايا. CTR ; إمب ; AGN ( ) بواسطة تحليل تدفق الخلايا. يمين: مخططات كثافة تمثيلية لـ CTR (الأعلى)، ImP (الوسط) و ImP + AGN (الأسفل). المتوسط الحسابي ± SEM وبيانات فردية من تجربتين مستقلتين على الأقل. تحليل التباين الأحادي مع تصحيح توكي بعد الاختبار.
الشكل 8 من البيانات الموسعة | تثبيط محور ImP/I1R باستخدام AGN192403 يمنع تصلب الشرايين الناتج عن HC دون التأثير على تركيز ImP والكوليسترول في الدورة الدموية. أ-هـ، تم إطعام الفئران نظام غذائي عادي أو نظام غذائي عالي الكوليسترول (HC) لمدة 8 أسابيع. بعد 4 أسابيع من بدء النظام الغذائي، تم إعطاء AGN192403 (AGN) أو عدم إعطائه في مياه الشرب للفئران التي تتغذى على نظام HC حتى الأسبوع 8، تلا ذلك التضحية والتحليل. أ، صبغة زيت أحمر O على السطح الخارجي للشريان الأورطي في الفئران الذكور مع إظهار كمية الآفات التصلبية في الشريان الأورطي بالكامل. نظام عادي=15؛ HC=14؛ HC+AGN=13. ب، تركيز ImP في بلازما الفئران الذكور عند التضحية. نظام عادي . ج ، زيت أحمر O من الأمام
صبغة الشريان الأورطي في إناث الفئران تظهر تقدير الآفة التصلبية في الشريان الأورطي بالكامل (يسار)، قوس الشريان الأورطي (وسط) وصور تمثيلية (يمين). تشاو . د، صبغة الكاسباس 3 لجذور الشريان الأورطي. قياس الكاسباس-3+ (يسار) وصور تمثيلية لصبغة الكاسباس-3 (يمين). حجم الشريط . تركيز الكوليسترول الكلي في البلازما لدى الذكور (يسار) والفئران الإناث (يمين)، تشاو ، عند التضحية. أ-هـ، المتوسط الحسابي وبيانات فردية من تجربتين مستقلتين على الأقل. تحليل التباين الأحادي مع تصحيح توكي بعد الاختبار.

محفظة الطبيعة

المؤلف (المؤلفون) المراسلون:
ديفيد سانشو
آخر تحديث من المؤلفين: 3 يونيو 2025

ملخص التقرير

تتمنى Nature Portfolio تحسين قابلية تكرار الأعمال التي ننشرها. يوفر هذا النموذج هيكلًا للاتساق والشفافية في التقرير. لمزيد من المعلومات حول سياسات Nature Portfolio، يرجى الاطلاع على سياسات التحرير وقائمة مراجعة سياسة التحرير.

الإحصائيات

لجميع التحليلات الإحصائية، تأكد من أن العناصر التالية موجودة في أسطورة الشكل، أسطورة الجدول، النص الرئيسي، أو قسم الطرق.
غير متوفر
تم التأكيد

حجم العينة بالضبط لكل مجموعة/شرط تجريبي، معطاة كرقم منفصل ووحدة قياس

بيان حول ما إذا كانت القياسات قد أُخذت من عينات متميزة أو ما إذا كانت نفس العينة قد تم قياسها عدة مرات

اختبار(ات) الإحصاء المستخدمة وما إذا كانت أحادية الجانب أو ثنائية الجانب
يجب أن تُوصف الاختبارات الشائعة فقط بالاسم؛ واصفًا التقنيات الأكثر تعقيدًا في قسم الطرق.

وصف لجميع المتغيرات المشتركة التي تم اختبارها

وصف لأي افتراضات أو تصحيحات، مثل اختبارات الطبيعية والتعديل للمقارنات المتعددة

وصف كامل للمعلمات الإحصائية بما في ذلك الاتجاه المركزي (مثل المتوسطات) أو تقديرات أساسية أخرى (مثل معامل الانحدار) و التباين (مثل الانحراف المعياري) أو تقديرات مرتبطة بعدم اليقين (مثل فترات الثقة)

لاختبار الفرضية الصفرية، فإن إحصائية الاختبار (على سبيل المثال ) مع فترات الثقة، أحجام التأثير، درجات الحرية و قيمة ملحوظة أعطِ القيم كقيم دقيقة كلما كان ذلك مناسبًا.
□ لتحليل بايزي، معلومات حول اختيار القيم الأولية وإعدادات سلسلة ماركوف مونت كارلو

□ لتصميمات هرمية ومعقدة، تحديد المستوى المناسب للاختبارات والتقارير الكاملة عن النتائج

□ تقديرات أحجام التأثير (مثل حجم تأثير كوهين) بيرسون )، مما يشير إلى كيفية حسابها
تحتوي مجموعتنا على الويب حول الإحصائيات لعلماء الأحياء على مقالات تتناول العديد من النقاط المذكورة أعلاه.

البرمجيات والشيفرة

معلومات السياسة حول توفر كود الكمبيوتر
جمع البيانات
تم جمع بيانات الميتابولوميات غير المستهدفة بواسطة نظام HPLC Ultimate 3000 المتصل بجهاز LTQ Orbitrap XL. مقياس الطيف الكتلي الهجين Trap-Orbitrap. تم جمع بيانات الميتابولوميات المستهدفة لتقدير ImP لفئران APOEKO ولعينة PESA بواسطة نظام HPLC سلسلة 1290 Infinity المرتبط بمقياس الطيف الكتلي ثلاثي الأبعاد 6460، بينما لعينة IGT بواسطة نظام Acquity UPLC I-class المرتبط بمقياس الطيف الكتلي ثلاثي الأبعاد Xevo TQXS. تم جمع بيانات فرز الخلايا المعتمدة على الفلورسنت بواسطة LSRFortessa SORP (بيكتون ديكنسون) أو FACSymphony (بيكتون ديكنسون). تم جمع بيانات تسلسل الأمبليكون 16S rRNA بواسطة منصة MiSeq Illumina. تم جمع بيانات RNA أحادية الخلية وبيانات RNA الكتلية بواسطة جهاز تسلسل Illumina NextSeq 2000. تم جمع بيانات البروتيوميات والفوسفوبروتيوميات بواسطة الكروماتوغرافيا السائلة مع قياس الطيف الكتلي المت tandem (LC-MS/MS) باستخدام Q Exactive HF Orbitrap MS. تم جمع بيانات أخرى باستخدام Microsoft Excel 2019.
تحليل البيانات
تم إنشاء خريطة الحرارة وجميع الرسوم البيانية باستخدام برنامج GraphPad Prism الإصدار 9.0 (GraphPad Software، سان دييغو، كاليفورنيا). تم استخدام الإصدار 23.0 من SPSS والإصدار 18 من Stata (StataCorp LP، كوليدج ستيشن، تكساس) للتحليل الإحصائي. تم إجراء تحليل التمييز الجزئي (PLS-DA) وتحليل خصائص التشغيل المستقبلية (ROC) في MetaboAnalyst V5 (https://www.metaboanalyst.ca/MetaboAnalyst/home.xhtml) وStata. تم استخدام اختبار كولموغوروف-سميرنوف واختبار شابيرو-ويلك لتحديد التوزيع الطبيعي للعينات. تم تقديم المتغيرات الاسمية كنسب وتكرارات. تم إجراء المقارنات بين مجموعتين باستخدام اختبارات t لطلاب غير المقترنة ذات الذيلين (التوزيع الطبيعي) أو اختبارات مان-ويتني U (التوزيع غير الطبيعي) للمتغيرات المستمرة أو اختبار فيشر الدقيق للمتغيرات الفئوية. ما لم يُذكر خلاف ذلك، تم تقييم المقارنات عبر مجموعات متعددة باستخدام ANOVA أحادي الاتجاه (التوزيع الطبيعي) تليها اختبار توكي بعد ذلك، أو اختبار كروسكال-واليس (التوزيع غير الطبيعي) تليه اختبار دن كما هو موضح في كل أسطورة الشكل. تم مقارنة المتغيرات المستمرة عبر الثلثيات من ImP بواسطة ANOVA أو اختبارات كروسكال واليس غير المعلمية حسب الاقتضاء، بينما تم تطبيق المتغيرات الاسمية باستخدام اختبار كوهرا-أرمتيج (المتغيرات الثنائية) واختبار جونكهير-تيربسترا (المتغير الترتيبي) للاتجاه. تم تطبيق المنحنيات المكعبة المقيدة (المنحنيات الطبيعية، RCS) مع 3 عقد عبر توزيع ImP لإنتاج منحنيات الاستجابة للجرعة ولتشكيل نموذج مرن للارتباط غير الخطي المحتمل لـ ImP المستمر مع النقاط النهائية الرئيسية، كما تم وصفه سابقًا (PMID: 29799975؛ PMID: 36049808). في كلا العينتين، تم تثبيت 3 عقد لـ RCS عند النسبة المئوية العشرية، الخمسين والتسعين من ImP
محفظة الطبيعة | ملخص التقرير أبريل 2023
التوزيع. تم اختيار عدد العقد بناءً على التحسين في احتمال اللوغاريتم بين نماذج الانحدار مع 3 – أو 4 – عقد RCS. لتعزيز الوضوح البصري، تم قطع الرسوم البيانية مع RCS عند القيم التي تتجاوز النسبة المئوية 95 من التوزيع. قمنا بتقييم العلاقات غير الخطية لـ ImP مع نسبة الاحتمالات اللوغاريتمية (OR) للنتائج الرئيسية لتصلب الشرايين من خلال فحص (اختبار والد) المصطلحات غير الخطية (RCS). تم التحكم في منحنيات الاستجابة للجرعة في كلا العينتين لمجموعة من المتغيرات المربكة، تم بناؤها من خلال دمج انحدار LASSO والمتغيرات ذات الاحتمالية البيولوجية. تم استخدام LASSO للانحدار اللوجستي لاختيار نموذج متعدد المتغيرات فيما يتعلق بوجود تصلب الشرايين. تم استخدام LASSO التكيفي مع التحقق المتقاطع لاختيار قيمة معامل عقوبة Lasso. تم تقدير الفروق المعدلة في مستويات ImP عبر مجموعات الاهتمام بواسطة تحليل الانحدار الخطي متعدد المتغيرات. لتقييم العلاقة بين مستويات ImP ووجود ونشاط تصلب الشرايين داخل عينة PESA، تم تعديل الانحدار اللوجستي متعدد الحدود على مجموعة من المتغيرات المربكة (مثل العمر، الجنس، حالة التدخين، سكر الدم الصائم، بروتين سي التفاعلي عالي الحساسية (hs-CRP)، وتركيز الهيموجلوبين) بناءً على الأدلة السابقة (PMID: 35567559). تم اختبار فرضية النسب المتناسبة باستخدام اختبار برانت والد. تم تقييم القدرة التمييزية لـ ImP لانتشار تصلب الشرايين تحت السريري أو النشط بالإضافة إلى عوامل الخطر التقليدية، بما في ذلك كوليسترول LDL وبروتين سي التفاعلي عالي الحساسية، من خلال مقارنة المساحة تحت المنحنى (AUC) من تحليل خصائص التشغيل المستقبلية (ROC) المقابلة. تم مقارنة AUCs باستخدام اختبار دي لونغ (PMID: 3203132). تم استخدام تقنية Bootstrap مع 1,000 تكرار لاشتقاق فترة الثقة المصححة للانحياز (CI) حول AUCs. كانت جميع الاختبارات ذات ذيلين وكان مستوى الدلالة الإحصائية محددًا مسبقًا عند P<0.05.
بالنسبة لبيانات الميتابولوميات غير المستهدفة: تم محاذاة البيانات المولدة أولاً باستخدام Compound Discoverer (ThermoFisher Scientific)؛ تم استخراج الإشارات وتجميعها في ميزات (آثار نظيرية من مادة تحليلية واحدة في حالة شحنة معينة) باستخدام عقدة Metaboprofiler في Compound Discoverer (الإضافة مفتوحة المصدر المتاحة مجانًا من OpenMS، http://www.openms.de/downloads/). بالنسبة لبيانات الميتابولوميات المستهدفة: تم فحص الإشارات الخام لانتقالات المراقبة المتعددة (MRM) وتم دمج القمم التي تتوافق مع جميع المركبات المستهدفة بواسطة MassHunter Quantitative B. 10.00 (Agilent Technologies).
بالنسبة لتحليل تسلسل جين 16S rRNA من كل من عينات الفئران والبشر، تم تنسيق التسلسلات ذات الطرفين، وتجميعها في وحدات تصنيف تشغيلية عند مستوى هوية >97%، وتم التعليق باستخدام إصدار SILVA v. 132 باستخدام DADA2 لبيانات الفئران وإصدار v. 138 وقواعد بيانات RDP الإصدار 18 باستخدام Mothur (v.1.40.5) لبيانات البشر.
لتقييم نمط النظام الغذائي، تم إجراء تحليل عامل في SPSS V.23.0 (SPSS Inc.، أرمونك، نيويورك، الولايات المتحدة الأمريكية) لتحديد الأبعاد الأساسية المشتركة (العوامل أو الأنماط) لاستهلاك الطعام من خلال اشتقاق تحميلات العوامل لكل مجموعة غذائية محددة مسبقًا. تم بعد ذلك تدوير العوامل باستخدام إجراء Varimax للحفاظ على العوامل غير المرتبطة. تم استخدام تحليل القيم الذاتية، ورسم بياني للانحدار، وقابلية تفسير حل العامل لدعم القرار النهائي بشأن الاحتفاظ بحل 5 عوامل، حيث كان لكل عامل قيمة ذاتية .
بالنسبة لبيانات تسلسل RNA أحادية الخلية، تم إجراء معالجة بيانات التسلسل الخام من ملف FASTQ من كل منفذ باستخدام Cell Ranger (v6.1.2) مع المعلمات الافتراضية ومرجع جينوم الفئران mm 10 (GRCm38.p6) المقدم من 10x Genomics. تم تحميل مصفوفات العد الفريدة للمؤشرات الجزيئية (UMI) للخلايا المعتمدة الصالحة لكل منفذ إلى (v4.1.2) لمزيد من التحليلات باستخدام حزم Bioconductor وSeurat (v4.0.6). تم تجميع الخلايا باستخدام خوارزمية لوفيان لتحسين التماسك باستخدام رسم بياني KNN كمدخل وتم تصورها باستخدام خوارزمية تقليل الأبعاد UMAP مع أول 25 مكونًا رئيسيًا كمدخل. تم تحديد المجموعات الرئيسية باستخدام علامات معروفة وحساب الجينات المعبر عنها بشكل مختلف باستخدام اختبار مجموع رتب ويلكوكسون باستخدام حزمة R presto (v1.0.0)). تم حساب نسب الخلايا لكل حالة ونقطة زمنية في كل مجموعة خلوية، وتم اختيار اختبار Z لنسب الخلايا باستخدام دالة prop.test() R لتحديد الدلالة. تم إجراء تحليلات التعبير التفاضلي بين الحالات باستخدام حزمة R MAST (v1.20.0). تم تصنيف الجينات وفقًا لـ logFCs المحسوبة، وتم استخدام الرتب الناتجة كمدخل لخوارزمية FGSEA جنبًا إلى جنب مع مجموعات الجينات Hallmark من قاعدة بيانات التوقيع الجزيئي (MSigDB؛ https:// www.gsea-msigdb.org/gsea/msigdb). أخيرًا، تم إجراء تحليل الإفراط في التمثيل جنبًا إلى جنب مع قاعدة بيانات GO (www.geneontology.org/).
بالنسبة لبيانات RNA-seq، تم رسم القراءات الناتجة على الجينوم المرجعي GRCm38.102 باستخدام STAR25 وتم تقدير مستويات التعبير الجيني باستخدام RSEM26. تم إجراء تحليلات إضافية في (v 4.3.2). باختصار، تم حساب العد لكل مليون (CPM)، وتم تحديد عوامل الحجم للتطبيع بين العينات باستخدام طريقة المتوسط المقصوص للقيم (TMM). ثم، تم استخدام البيانات المعيارية اللوغاريتمية مع الأخذ في الاعتبار الجينات فقط مع تم استخدام العد في ثلاث عينات لتحليل التعبير التفاضلي، مما يجعل جميع المقارنات الممكنة ضمن نفس نوع الخلايا باستخدام حزمة R DESeq2. تم إجراء تحليل إثراء مجموعة الجينات باستخدام حزمة R fgsea مقارنةً بين 1 ساعة و 2 ساعة بعد تحفيز ImP مع Oh (غير المحفز) ضمن كل نوع من الخلايا. تم تصنيف الجينات في كل مقارنة وفقًا لـ logFC، وتم استخدام fgsea جنبًا إلى جنب مع مجموعات الجينات الرئيسية من قاعدة بيانات التوقيع الجزيئي (MSigDB; https://www.gsea-msigdb.org/gsea/msigdb). أخيرًا، تم تمثيل درجات الإثراء المنضبطة للمسارات المهمة المختارة كخريطة حرارية باستخدام حزمة R ComplexHeatmap. تم إنجاز تحليلات البروتيوم والبروتيوم الفوسفوري باستخدام وسم TMT 18-plex كما هو موضح سابقًا. تم إجراء التحليل الإحصائي للبيانات الكمية باستخدام iSanXoT، وتم إجراء التحليل المقارن بين الظروف باستخدام القيم المنضبطة و ، والتي تمثل اللوغاريتم الثنائي للنسبة بين الوفرة في العينة وضبطها للتحكم للببتيد وبروتين q، على التوالي. تم استخدام تحليل إثراء مجموعة الجينات (GSEA) باستخدام قيم الببتيدات لتقييم مستويات الفسفرة في البروتينات من مسار إشارة mTOR بين الظروف (أي الخلايا المحفزة بـ ImP مقابل غير المحفزة). بالإضافة إلى ذلك، تم إجراء اختبار رتبة ويلكوكسون الموقعة باستخدام قيم وفرة الفوسفوببتيد المقترنة X_p لتحديد تأثيرات AGN192403 في مستويات الفسفرة لمسار mTOR بين الخلايا المعالجة بـ ImP والمشاركة أو عدم المشاركة مع AGN192403.
للمخطوطات التي تستخدم خوارزميات أو برامج مخصصة تكون مركزية للبحث ولكن لم يتم وصفها بعد في الأدبيات المنشورة، يجب أن تكون البرامج متاحة للمحررين والمراجعين. نشجع بشدة على إيداع الشيفرة في مستودع مجتمعي (مثل GitHub). راجع إرشادات Nature Portfolio لتقديم الشيفرة والبرامج لمزيد من المعلومات.

البيانات

معلومات السياسة حول توفر البيانات

يجب أن تتضمن جميع المخطوطات بيانًا حول توفر البيانات. يجب أن يوفر هذا البيان المعلومات التالية، حيثما ينطبق:
  • رموز الوصول، معرفات فريدة، أو روابط ويب لمجموعات البيانات المتاحة للجمهور
  • وصف لأي قيود على توفر البيانات
  • بالنسبة لمجموعات البيانات السريرية أو بيانات الطرف الثالث، يرجى التأكد من أن البيان يتماشى مع سياستنا
تم إيداع بيانات الميتابولوميات في منصة Metabolomics (ST003928، ST003929، ST003932 و ST003938). بيانات RNA-seq الضخمة و scRNA-seq التي تم إنشاؤها في هذه الدراسة متاحة في قاعدة بيانات NCBI GEO تحت معرفات BioProject GSE297831 و GSE298392، على التوالي. تم إيداع بيانات البروتيوم والبروتيوم الفوسفوري في اتحاد ProteomeXchange عبر مستودع الشريك PRIDE مع معرف مجموعة البيانات PXD063955. يتم توفير بيانات المصدر مع هذه الورقة.
nature portfolio | ملخص التقرير أبريل 2023

البحث الذي يشمل المشاركين البشريين، بياناتهم، أو المواد البيولوجية

معلومات السياسة حول الدراسات التي تشمل المشاركين البشريين أو البيانات البشرية. انظر أيضًا معلومات السياسة حول الجنس، الهوية/التقديم، والتوجه الجنسي والعرق، الإثنية والعنصرية.

التقرير عن الجنس والنوع

التقرير عن العرق، الإثنية، أو مجموعات اجتماعية ذات صلة أخرى

خصائص السكان

تركز الدراسة الحالية على تصلب الشرايين تحت السريرية وتستكشف تركيز الدم من إيميدازول بروبيونات، حمض يوروكان، والهيستيدين في المشاركين غير المصابين في منتصف العمر ( سنوات). بالنظر إلى التأخير في ظهور تصلب الشرايين تحت السريرية الذي يحدث بعد حوالي 10 سنوات في النساء (PMID: 34543072 و PMID: 25882487)، شمل مجموعتنا 400 مشارك من بينهم 310 ( ، حسب الجنس) كانوا من المشاركين الذكور. تم جمع المعلومات المتعلقة بجنس كل مشارك من خلال الإبلاغ الذاتي عبر استبيان. تشير هذه البيانات إلى الجدول 1a و 2b والجدول 3.
تتكون مجموعة IGT التي تم استخدامها للتحقق من النتائج في مجموعة مستقلة من الرجال والنساء الذين تتراوح أعمارهم بين 50-64 عامًا من منطقة غوتنبرغ (السويد). في هذه الحالة، شملت المجموعة 1844 مشاركًا من بينهم ، حسب الجنس)، كانوا من المشاركين الذكور وبالتالي شملت نسبة أعلى من النساء. تم تجنيد المشاركين على أساس عشوائي من سجل السكان السويدي وتم جمع المعلومات المتعلقة بجنس كل مشارك من خلال الإبلاغ الذاتي عبر استبيان. تشير هذه البيانات إلى الجدول 2a و 2b.
تم إجراء هذه الدراسة في مجموعة فرعية من المشاركين من دراسة PESA (تقدم تصلب الشرايين تحت السريرية المبكرة)، وهي دراسة جماعية مستقبلية رصدية مستمرة لموظفين غير مصابين من أصل قوقازي في بنك سانتاندير في مدريد (PMID: 34238438). تم جمع المعلومات المتعلقة بالعرق ومجموعات اجتماعية ذات صلة أخرى لكل مشارك من خلال الإبلاغ الذاتي عبر استبيان ولم يتم استخدامها كعامل استبعاد. في دراسة IGT، تشمل المجموعة رجالًا ونساءً تتراوح أعمارهم بين 50-64 عامًا من منطقة غوتنبرغ (السويد)، تم تجنيدهم على أساس عشوائي من سجل السكان السويدي. من بين معايير الاستبعاد، تم تضمين الاضطراب المعرفي وعدم القدرة على فهم اللغة السويدية المكتوبة والم spoken وكذلك الأشخاص المولودين خارج السويد.
تم إجراء هذه الدراسة في مجموعة فرعية من المشاركين ( ) من PESA-CNIC-Santander. بناءً على التصوير المتعدد الإقليمي/المتعدد الوسائط (أي التصوير بالموجات فوق الصوتية الوعائية ثنائية وثلاثية الأبعاد والتصوير المقطعي المحوسب غير المتباين)، قمنا بتصنيف 295 مشاركًا يعانون من تصلب الشرايين تحت السريرية و 105 ضوابط بدون تصلب شرايين. تم تعريف مدى تصلب الشرايين وفقًا لعدد المواقع الوعائية المتأثرة ودرجة الكالسيوم في الشريان التاجي (CAC). تم تصنيف الأشخاص الذين يعانون من تصلب الشرايين تحت السريرية بشكل إضافي حسب امتصاص الفلوروديوكسيغلوكوز (18F-FDG) وتنشيط نخاع العظام إلى: تصلب شرايين غير نشط (FDGneg، )، امتصاص 18 F-FDG الشرياني (FDG+_A، )، تنشيط نخاع العظام (FDG+_BM، )، وكلا من امتصاص الشرايين وتنشيط نخاع العظام (FDG+_SYS، ) كمؤشرات على تصلب الشرايين النشط من الناحية الأيضية (FDG+، ). يتم تقديم خصائص السكان التفصيلية وتخصيص المجموعات في الجدول 1a،b والجدول 3 والشكل 2c.
تتكون مجموعة دراسة IGT من رجال ونساء تتراوح أعمارهم بين 50-64 عامًا من منطقة غوتنبرغ (السويد)، تم تجنيدهم على أساس عشوائي من سجل السكان السويدي وشملوا بناءً على حالة الجلوكوز لديهم. تضمنت معايير الاستبعاد المطبقة: داء السكري المعروف، الأمراض الالتهابية (مثل مرض كرون، التهاب القولون التقرحي، الأمراض الروماتيزمية)، العلاج بالستيرويدات أو الأدوية المناعية، السرطان (ما لم يكن خاليًا من الانتكاس لمدة 5 سنوات سابقة)، الاضطراب المعرفي، العلاج للأمراض المعدية ومع المضادات الحيوية في الأشهر الثلاثة الماضية، عدم القدرة على فهم اللغة السويدية المكتوبة والم spoken وكذلك الأشخاص المولودين خارج السويد.
تم تقييم تصلب الشرايين في الشرايين السباتية باستخدام التصوير بالموجات فوق الصوتية وفقًا لبروتوكول موحد يتضمن جهاز تصوير بالموجات فوق الصوتية Siemens Acuson S2000 ومن خلال وجود الكالسيوم في الشريان التاجي الذي تم تقييمه بواسطة التصوير المقطعي المحوسب. تم قياس ضغط الدم الانقباضي (SBP) مرتين باستخدام جهاز تلقائي (Omron M10-IT، Omron Health care Co، كيوتو، اليابان) وتم استخدام متوسط القياسات. تم استخدام استبيان لجمع معلومات مفصلة حول الأدوية والتاريخ العائلي. تم جمع عينة دم وريدية من المشاركين بعد صيام ليلة واحدة وتم استخدامها للتحليل الكيميائي الحيوي الفوري للجلوكوز، الهيموغلوبين الغليكوزيل والكلسترول الكلي. تم حساب SCORE2 (تقييم المخاطر التاجية المنهجي) كما هو موضح سابقًا. تم قياس وزن الجسم، الطول، محيط الخصر والورك باستخدام معدات معايرة مع الأشخاص مرتدين ملابس خفيفة بدون أحذية ووفقًا لتوصيات منظمة الصحة العالمية الحالية. يتم سرد خصائص المشاركين في الجدول 2،ب.
تم تجنيد المشاركين وفقًا لمعايير الإدراج لدراسة PESA-CNIC-Santander الرئيسية (NCT01410318، https:// clinicaltrials.gov/ct2/show/NCT01410318). تشمل معايير الاستبعاد تلك التي تم استخدامها سابقًا للدراسة الرئيسية وتلك التي قد تؤثر على إنتاج إيميدازول بروبيونات أو الارتباطات الموصوفة سابقًا (مثل داء السكري من النوع 2): 1. العلاج النشط للالتهابات أو الأمراض القلبية الوعائية. 2. المشاركون الذين لديهم تاريخ عائلي من الأمراض الالتهابية. 3. العلاج النشط للسرطان، تاريخ زراعة مع علاج مثبط للمناعة أو علاج مناعي نشط. 4. الموظفون الذين هم حوامل أو يرضعون. 5. قصور كلوي أو كبدي ذي صلة سريريًا. 6. غير قادرين على الموافقة. 7. أي حالة سريرية أخرى ذات أهمية قد تعرض الدراسة للخطر أو تكون خطيرة على المشارك. 8. تعاطي المخدرات أو الكحول بشكل نشط. 9. المشاركون الذين يتناولون المضادات الحيوية في الأشهر الثلاثة السابقة لجمع عينات البراز. 10. المشاركون الذين يتناولون مثبطات مضخة البروتون، الملينات، والأدوية غير الستيرويدية المضادة للالتهابات قبل 3 أيام من جمع عينة البراز. 11. الموضوعات المعروفة بداء السكري من النوع 2 أو المعالجة من داء السكري. 12. الموضوعات التي تعاني من اضطرابات معوية.
تم تجنيد مجموعة IGT (رقم الأخلاقيات 560-13) على أساس عشوائي من سجل السكان السويدي وشملت بناءً على حالة الجلوكوز لديهم. تضمنت معايير الاستبعاد المطبقة: داء السكري المعروف، الأمراض الالتهابية (مثل مرض كرون، التهاب القولون التقرحي، الأمراض الروماتيزمية)، العلاج بالستيرويدات أو الأدوية المناعية، السرطان (ما لم يكن خاليًا من الانتكاس لمدة 5 سنوات سابقة)، ضعف الإدراك، العلاج من الأمراض المعدية ومع المضادات الحيوية في الأشهر الثلاثة الماضية، عدم القدرة على فهم اللغة السويدية المكتوبة والم spoken، بالإضافة إلى الموضوعات المولودة خارج السويد. تم دعوة المشاركين عن طريق رسالة وقدموا جميعًا موافقة مستنيرة.
على الرغم من تطبيق معايير تجنيد واستبعاد صارمة، يجب الاعتراف بعدة مصادر محتملة للتحيز. أولاً، قد يكون هناك تحيز في الاختيار الذاتي، حيث كانت المشاركة طوعية؛ قد يختلف الأفراد الذين اختاروا التسجيل بشكل منهجي عن أولئك الذين رفضوا، مما قد يؤدي إلى مجموعة دراسية ذات مستوى أعلى من المعرفة الصحية أو ملفات مخاطر مميزة مقارنة بالسكان العامين. في مجموعة PESA-CNIC-Santander، كان جميع المشاركين موظفين في بنك سانتاندر في مدريد، مما قد يقدم “أثر العامل الصحي” ويحد من التنوع الاجتماعي والمهني للمجموعة.
محفظة الطبيعة | ملخص التقرير أبريل 2023
التنوع المهني. علاوة على ذلك، قد يؤدي الإدراج الحصري للأفراد الإسبان في مجموعة PESA والأفراد السويديين في مجموعة IGT إلى إدخال تحيز جغرافي وسكاني. نتيجة لذلك، قد لا تمثل النتائج بشكل كامل طيف المخاطر القلبية الوعائية أو تقديم المرض الذي يُرى في السكان الأكثر تنوعًا عرقيًا واجتماعيًا أو غير الأوروبيين. في مجموعة IGT، على الرغم من أن التجنيد كان قائمًا على السكان، قد يكون استبعاد الأفراد غير المولودين في السويد وأولئك غير القادرين على فهم اللغة السويدية قد أدخل تحيزًا ثقافيًا أو اجتماعيًا إضافيًا.
الإشراف الأخلاقي
وافقت لجنة الأخلاقيات البحثية في معهد كارلوس الثالث للصحة على بروتوكول الدراسة (CEI PI 32_2018) وتم تزويد جميع المشاركين بموافقة مستنيرة مكتوبة.
قدم جميع المشاركين موافقة مستنيرة، وتمت الموافقة على دراسة IGT من قبل مجلس مراجعة الأخلاقيات في غوتنبرغ (560-13)
يرجى ملاحظة أنه يجب أيضًا تقديم معلومات كاملة حول الموافقة على بروتوكول الدراسة في المخطوطة.

التقارير الخاصة بالمجال

يرجى اختيار الخيار أدناه الذي يناسب بحثك بشكل أفضل. إذا لم تكن متأكدًا، اقرأ الأقسام المناسبة قبل اتخاذ اختيارك.
علوم الحياة
العلوم السلوكية والاجتماعية
العلوم البيئية والتطورية والإيكولوجية
لنسخة مرجعية من الوثيقة مع جميع الأقسام، انظر nature.com/documents/nr-reporting-summary-flat.pdf

تصميم دراسة علوم الحياة

يجب على جميع الدراسات الإفصاح عن هذه النقاط حتى عندما يكون الإفصاح سلبيًا.
حجم العينة
لحساب حجم العينة المطلوب لدراسة على الفئران مع المعلمات المعطاة (اختبار ذو طرفين، عينات غير متزاوجة، مستوى دلالة 0.05، قوة 0.8، واكتشاف فرق لا يقل عن 1 انحراف معياري)، نستخدم الصيغة لتقدير حجم العينة في اختبار t لعينة مزدوجة. تم تحسين هذه الأرقام بناءً على معرفتنا السابقة بإمكانية التكرار، مع تحقيق توازن بين القوة الإحصائية ورفاهية الحيوان، وفقًا لمعيار التخفيض. الصيغة لحجم العينة (لكل مجموعة) في اختبار t لعينة مزدوجة هي كما يلي:
حيث:
n : حجم العينة لكل مجموعة
: القيمة الحرجة لمستوى الدلالة (مثل 1.96 لـ )
: القيمة الحرجة للقوة (مثل 0.84 لـ القوة)
SD: الانحراف المعياري (يفترض أنه متساوي بين المجموعات)
d: حجم التأثير (الفرق الأدنى القابل للاكتشاف بين متوسطات المجموعات)
بالنسبة لمعاملاتنا، سنحتاج إلى حوالي 15.7 فأرًا لكل مجموعة لتحقيق مستوى دلالة 0.05، وقوة 0.8، واكتشاف فرق لا يقل عن 1 انحراف معياري. نزيد حجم العينة بفأر واحد لنكون قادرين على استبعاد فأر حيث قد تفشل التقنية التجريبية. عادةً ما يكون الحجم الإجمالي للعينة حوالي 17 فأرًا لاختبارها في (على الأقل) تجربتين مستقلتين.
بالنسبة للمجموعات البشرية (PESA وIGT)، لم يتم إجراء حساب لحجم العينة، حيث تم جمع العينات بأثر رجعي من دراسات الملاحظة. بدلاً من ذلك، تم تحديد أحجام العينات بناءً على توفر مرضى موصوفين بشكل جيد مع بيانات سريرية وصور وعينات حيوية كاملة من دراسات الملاحظة المستقبلية الجارية. تم تجميع المجموعات بهدف تعظيم العمق البيولوجي والظاهري بدلاً من استهداف حجم تأثير محدد مسبقًا. سمح إدراج مجموعتين مستقلتين مع ظواهر مكملة بالتكرار والتحقق عبر مجموعات البيانات. أشارت اعتبارات القوة بعد الحدث إلى أن حجم عينة مجموعة الاشتقاق (مجموعة PESA، ) كان مدعومًا بشكل كافٍ عند مستوى 0.85 لاكتشاف فرق لا يقل عن 5 نانومول في مستويات ImP بين مجموعة الموضوعات بدون تصلب الشرايين والمرضى بدون تصلب الشرايين. تم اختيار نسبة 1:3 بين المرضى بدون تصلب الشرايين والمرضى مع تصلب الشرايين لتعكس توزيع AT في مجموعة PESA، وتم اشتقاق مقاييس التشتت (أي، الانحراف المعياري) من مجموعة الموضوعات بدون تصلب الشرايين في مجموعة PESA. على التوالي، كانت مجموعة IGT بحجم كافٍ لاكتشاف فرق بقوة 0.85 بمقدار 2 نانومول في مستويات ImP بين الموضوعات بدون ومع AT. كانت اعتبارات القوة تستند إلى اختبار مان-ويتني لمجموعتين مستقلتين. تم تحديد خطأ النوع الأول مسبقًا عند 0.05 لحسابات القوة. تم إجراء تحليل القوة باستخدام G*Power 3.1.9.6 (جامعة كيل، ألمانيا).
استبعاد البيانات
التكرار
لم يتم استبعاد أي بيانات من التحليلات المعروضة في المخطوطة.
بالنسبة لتجارب الفئران وزراعة الخلايا الأولية، تم إجراء نسخ بيولوجية مستقلة متعددة وتجارب مستقلة (على الأقل مرتين)، كما هو موضح في أساطير الأشكال. كانت النتائج من الورقة متسقة عبر أساليب تجريبية متعددة أجراها باحثون مختلفون. جميع محاولات التكرار حصلت على بيانات متسقة.
العشوائية
كانت الفئران متجانسة من حيث العمر (8 أسابيع) وتم تعيينها عشوائيًا إلى أقفاص مختلفة للعلاجات التجريبية (المضادات الحيوية، إيميدازول بروبيونات وإدارة AGN192403). تم تحليل عينات البشر والحيوانات بطريقة عشوائية على مطياف الكتلة.
التعمية
بالنسبة للدراسات الحيوانية والدراسات الخلوية المعتمدة على المختبر، تم تعيين أرقام لكل عينة تجريبية وتم تعمية التحليل عن تخصيص المجموعة أثناء جمع البيانات.
بالنسبة للدراسة البشرية، تم جمع العينات بواسطة موظفين سريريين معميين وتم توليد جميع البيانات بواسطة باحثين كانوا معميين عن
البيانات الوصفية. بمجرد توليد البيانات، تم إجراء التحليل الحسابي مع جميع المعلومات السريرية اللازمة لاختبار الفروق بين المجموعات.

تصميم دراسة العلوم السلوكية والاجتماعية

يجب على جميع الدراسات الإفصاح عن هذه النقاط حتى عندما يكون الإفصاح سلبيًا.
وصف الدراسة وصف بإيجاز نوع الدراسة بما في ذلك ما إذا كانت البيانات كمية أو نوعية أو مختلطة (مثل: دراسة نوعية مقطعية، دراسة تجريبية كمية، دراسة حالة مختلطة).
عينة البحث حدد عينة البحث (مثل: طلاب جامعة هارفارد، القرويين في الهند الريفية) وقدم معلومات ديموغرافية ذات صلة (مثل: العمر، الجنس) وأشر إلى ما إذا كانت العينة تمثل المجتمع. قدم مبررات لعينة الدراسة المختارة. بالنسبة للدراسات التي تتضمن مجموعات بيانات موجودة، يرجى وصف مجموعة البيانات والمصدر.
استراتيجية أخذ العينات وصف إجراء أخذ العينات (مثل: عشوائي، كرة الثلج، طبقي، ملائم). وصف الأساليب الإحصائية التي تم استخدامها لتحديد حجم العينة مسبقًا. إذا لم يتم إجراء حساب حجم العينة، يرجى وصف كيفية اختيار أحجام العينات وتقديم مبرر لسبب كفاية هذه الأحجام. بالنسبة للبيانات النوعية، يرجى الإشارة إلى ما إذا تم النظر في تشبع البيانات، وما هي المعايير التي تم استخدامها لتحديد أنه لا حاجة لمزيد من العينة.
جمع البيانات قدم تفاصيل حول إجراء جمع البيانات، بما في ذلك الأدوات أو الأجهزة المستخدمة لتسجيل البيانات (مثل القلم والورق، الكمبيوتر، جهاز تتبع العين، معدات الفيديو أو الصوت) وما إذا كان هناك أي شخص حاضر بخلاف المشاركين والباحث، وما إذا كان الباحث غير مدرك لحالة التجربة و/أو فرضية الدراسة أثناء جمع البيانات.
توقيت حدد تواريخ بدء وانتهاء جمع البيانات. إذا كان هناك فجوة بين فترات الجمع، اذكر التواريخ لكل مجموعة عينة.
استثناءات البيانات إذا لم يتم استبعاد أي بيانات من التحليلات، يرجى ذكر ذلك أو إذا تم استبعاد بيانات، يرجى تقديم العدد الدقيق للاستبعادات والأسباب وراءها، مع الإشارة إلى ما إذا كانت معايير الاستبعاد قد تم تحديدها مسبقًا.
عدم المشاركة حدد عدد المشاركين الذين انسحبوا/رفضوا المشاركة والأسباب المقدمة لذلك توفير معدل الاستجابة تذكر أنه لم يتخلف أي مشارك عن المشاركة/يرفض المشاركة.
التوزيع العشوائي إذا لم يتم تخصيص المشاركين في مجموعات تجريبية، يرجى ذكر ذلك أو وصف كيفية تخصيص المشاركين في المجموعات، وإذا لم يكن التخصيص عشوائيًا، يرجى وصف كيفية التحكم في المتغيرات المشتركة.

تصميم دراسة العلوم البيئية والتطورية والبيئية

يجب على جميع الدراسات الإفصاح عن هذه النقاط حتى عندما يكون الإفصاح سلبياً.
وصف الدراسة وصف الدراسة بإيجاز. بالنسبة للبيانات الكمية، تشمل عوامل العلاج والتفاعلات، هيكل التصميم (مثل: عامل، متداخل، هرمي)، طبيعة وعدد الوحدات التجريبية والتكرارات.
عينة البحث وصف عينة البحث (مثل مجموعة من طيور الدوري المنزلي المعلّمة، أو جميع نباتات ستينوسيريوس ثوربيري داخل نصب أنبوب الصبار الوطني)، وقدم مبررًا لاختيار العينة. عند الاقتضاء، وصف تصنيفات الكائنات، المصدر، الجنس، نطاق العمر وأي تعديلات. اذكر أي مجموعة سكانية من المفترض أن تمثلها العينة عند الاقتضاء. بالنسبة للدراسات التي تتضمن مجموعات بيانات موجودة، وصف البيانات ومصدرها.
استراتيجية أخذ العينات يرجى ملاحظة إجراء أخذ العينات. وصف الطرق الإحصائية التي تم استخدامها لتحديد حجم العينة مسبقًا أو إذا لم يتم إجراء حساب لحجم العينة، وصف كيف تم اختيار أحجام العينات وتقديم مبرر لسبب كفاية هذه الأحجام.
جمع البيانات وصف إجراء جمع البيانات، بما في ذلك من قام بتسجيل البيانات وكيف.
توقيت ومقياس مكاني حدد تواريخ بدء وانتهاء جمع البيانات، مع الإشارة إلى تكرار ومدة أخذ العينات وتقديم مبرر لهذه الخيارات. إذا كان هناك فجوة بين فترات الجمع، اذكر التواريخ لكل مجموعة عينة. حدد النطاق المكاني الذي تم أخذ البيانات منه.
استثناءات البيانات إذا لم يتم استبعاد أي بيانات من التحليلات، يرجى ذكر ذلك أو إذا تم استبعاد بيانات، يرجى وصف الاستبعادات والمبررات وراءها، مع الإشارة إلى ما إذا كانت معايير الاستبعاد قد تم تحديدها مسبقًا.
إعادة الإنتاج وصف التدابير المتخذة للتحقق من قابلية تكرار النتائج التجريبية. لكل تجربة، اذكر ما إذا كانت هناك أي محاولات لتكرار التجربة قد فشلت أو اذكر أن جميع المحاولات لتكرار التجربة كانت ناجحة.
العشوائية وصف كيفية تخصيص العينات/الكائنات/المشاركين إلى مجموعات. إذا لم يكن التخصيص عشوائيًا، فاشرح كيف تم التحكم في المتغيرات المشتركة. إذا لم يكن هذا ذا صلة بدراستك، فاشرح لماذا.
عمى صف مدى استخدام التعمية أثناء جمع البيانات وتحليلها. إذا لم يكن من الممكن استخدام التعمية، فاشرح السبب أو اشرح لماذا لم تكن التعمية ذات صلة بدراستك.
هل شمل البحث العمل الميداني؟ □ نعم لا
ظروف الميدان وصف ظروف الدراسة للعمل الميداني، مع تقديم المعايير ذات الصلة (مثل: درجة الحرارة، هطول الأمطار).
الموقع حدد موقع العينة أو التجربة، مع تقديم المعلمات ذات الصلة (مثل: خط العرض وخط الطول، الارتفاع، عمق الماء).
الوصول والاستيراد/التصدير صف الجهود التي بذلتها للوصول إلى المواطن وجمع عيناتك واستيرادها/تصديرها بطريقة مسؤولة وامتثالاً للقوانين المحلية والوطنية والدولية، مع الإشارة إلى أي تصاريح تم الحصول عليها (اذكر اسم الجهة المصدرة، تاريخ الإصدار، وأي معلومات تعريفية).
اضطراب صف أي إزعاج ناتج عن الدراسة وكيف تم تقليله.

التقارير عن مواد وأنظمة وطرق محددة

نحتاج إلى معلومات من المؤلفين حول بعض أنواع المواد والأنظمة التجريبية والأساليب المستخدمة في العديد من الدراسات. هنا، يرجى الإشارة إلى ما إذا كانت كل مادة أو نظام أو طريقة مدرجة ذات صلة بدراستك. إذا لم تكن متأكدًا مما إذا كان عنصر القائمة ينطبق على بحثك، يرجى قراءة القسم المناسب قبل اختيار رد.
المواد والأنظمة التجريبية طرق
غير متوفر مشارك في الدراسة غير متوفر
– الأجسام المضادة
خطوط خلايا حقيقية النواة X
□ علم الحفريات وعلم الآثار إكس
X الحيوانات وغيرها من الكائنات الحية

الأجسام المضادة

الأجسام المضادة المستخدمة
أجسام مضادة مضادة للفأر CDllc Brilliant Violet 650m; Biolegend; 117339; Clone N418 PE مضاد CDllc; BD bioscience; 553802; Clone HL3 PE مضاد للفأر NK-1.I; Biolegend; I56504; Clone S17016D
FITC مضاد للفأر CD3e; تونبو; 35-0031-U500; النسخة 145-2C11
مضاد الفأر B220-FITC؛ eBioscience؛ ll-0452-82؛ النسخة RA3-6B2
أجسام مضادة PerCP المضادة للفأر/البشر CD45R/B220؛ بايو ليجند؛ I03234؛ النسخة RA3-6B2
مضاد للبشر/الفئران CD45R (B220) PerCP-Cy5.5؛ eBioscience؛ 45-0452-82؛ النسخة RA3-6B2
أجسام مضادة مضادة للفأر/البشر CDllb Brilliant Violet 605m؛ Biolegend؛ I01237؛ النسخة M1/70
مضاد CDllb الفلوري 660؛ eBioscience؛ 50-0112-80؛ النسخة M1/70
مضاد CDIIb الفأري PerCP-Cyanine5.5؛ eBioscience؛ 45-0112-82؛ النسخة M1/70
مضاد CD206-eF450 للفأر؛ eBioscience؛ 48-2069-42؛ النسخة 19.2
أجسام مضادة PE مضادة للفأر CD31; بيو ليجند; | 02407; النسخة 390
مضاد CD4-BV570 للفئران؛ بايو ليجند؛ I00542؛ النسخة RM4-5
أجسام مضادة مضادة للفأر CD4 PE/Cy7؛ بيو ليجند؛ I00528؛ النسخة RM4-5
مضاد CD45 الفأري APC-eFluor 780; eBioscience; 47-0451-82; النسخة 30-F11
أجسام مضادة CD49b المضادة للفأر (خلايا NK الشاملة)؛ بايو ليجند؛ l08908؛ النسخة DX5
مضاد CD8 الفأري-PE; eBioscience; 12-0081-83; النسخة 53-6.7
أجسام مضادة أحادية النسيلة CD86 (B7-2) (GII)، PE-Cyanine7؛ eBioscience؛ 25-0862-80؛ النسخة GL1
CD90.2 فأر مضاد للفأر، BUV805، النسخة: 53-2.I؛ BD بيوساينس؛ BDB741908؛ النسخة 53-2.1
BV786 فأر مضاد للفأر CD90.2 النسخة 30-H12 (للاستخدام البحثي فقط)؛ BD Biosciences؛ 740841؛ النسخة 53-21
مضاد F4/80 مضاد للفأر 5 PerCP/CyS؛ بيو ليجند؛ 123128؛ النسخة BM8
مضاد فوكسب 3 لفأر/جرذ FITC FJK-16s; eBioscience; ll-5773-82; النسخة FJK-16s
مضاد الفأر Ly6C-BV711; بايوليجند; 128037; النسخة HK1.4
مضاد الماوس LY6G PE; BD فارماجين; 551461; النسخة 1A8
مضاد الفأر Ly6G من APC; BD PHARMINGEN; 560599; النسخة 1A8
مضاد-Ly6G v450; BD PHARMINGEN; 560603; النسخة 1A8
أليكسا فلور 700 مضاد للفأر I-A/1-E [M5/114.15.2]؛ بايوليجند؛ 107622؛ النسخة M5/114.15.2
مضاد MHCII للفأر-UV737; BD Biosciences; 367-5321-82; النسخة M5/114.15.2
بروتين الريبوسوم فوسفو-S6 (سير235/236) (D57.2.2E) XP أرنب mAb؛ إشارة الخلية؛ 4858S؛ النسخة D57.2.2.E مضاد لـ ROR الفأري
غاما (ت) APC; eBioscience; l 7-6981-80; Clone B2D
فأر مضاد لجرذان PE Rat Anti-Mouse Siglec-F Clone ES0-2440 (RUO)؛ BD PHARMINGEN؛ 552126؛ النسخة E50-2440
مضاد الماوس SiglecH FITC؛ eBioscience؛ II-0333-81؛ eBIO440c
مضاد الفأر T-bet-PECF594؛ BD Biosciences؛ 562467؛ النسخة O4-46
أجسام مضادة موصولة بألكسا فلور® 594 لمستقبل VCAM-1/CD106 للفئران؛ بيولوجيا التكنولوجيا؛ FAB6432T؛ النسخة 112734
أجسام مضادة XCRI المضادة للفأر/الجرذ Brilliant Violet 78S’M؛ Biolegend؛ 148225؛ النسخة ZET
https://www.biolegend.com/ar/products/brilliant-violet-650-anti-mouse-cd11c-antibody-8840
https://www.fishersci.com/shop/products/anti-cd11c-r-pe-clone-hl3bd/BDB553802
https://www.biolegend.com/ar/products/pe-anti-mouse-nk-1-1-antibody-16926?GroupID=GROUP20
https://www.citeab.com/antibodies/2204479-35-0031-u500-anti-mouse-cd3e
https://www.thermofisher.com/antibody/product/CD45R-B220-Antibody-clone-RA3-6B2-Monoclonal/11-0452-82
https://www.biolegend.com/fr-ch/search-results/percp-anti-mouse-human-cd45r-b220-antibody-4266?Clone=RA3-6B2
https://www.thermofisher.com/antibody/product/CD45R-B220-Antibody-clone-RA3-6B2-Monoclonal/45-0452-82
https://www.biolegend.com/ar/products/brilliant-violet-605-anti-mouse-human-cd11b-antibody-7637?GroupID=BLG10530
https://www.thermofisher.com/antibody/product/CD11b-Antibody-clone-M1-70-Monoclonal/50-0112-82
https://www.thermofisher.com/antibody/product/CD11b-Antibody-clone-M1-70-Monoclonal/45-0112-82
https://www.thermofisher.com/antibody/product/CD206-MMR-Antibody-clone-19-2-Monoclonal/48-2069-42
https://www.biolegend.com/nl-nl/products/pe-anti-mouse-cd31-antibody-122
https://www.biolegend.com/nl-be/products/brilliant-violet-570-anti-mouse-cd4-antibody-7379
https://www.biolegend.com/ar/فصل-الخلايا/أجسام-مضادة-سي-دي-4-مضاد-للفأر-بي-سيانين-7-1932
https://www.thermofisher.com/antibody/product/CD45-Antibody-clone-30-F11-Monoclonal/47-0451-82
https://www.biolegend.com/ar/products/pe-anti-mouse-cd49b-pan-nk-cells-antibody-234?GroupID=BLG4768
https://www.citeab.com/antibodies/2037994-12-0081-82-cd8a-monoclonal-antibody-53-6-7-pe-eb
https://www.thermofisher.com/antibody/product/CD86-B7-2-Antibody-clone-GL1-Monoclonal/25-0862-82
https://www.fishersci.com/shop/products/cd90-2-rat-anti-mouse-buv805-clone-53-2-1-bd-biosciences/BDB741908
https://www.biolegend.com/ar/products/percp-cyanine5-5-anti-mouse-f480-antibody-4303?GroupID=BLG5319
https://www.citeab.com/antibodies/2041744-11-5773-82-foxp3-monoclonal-antibody-fjk-16s-fitc
https://www.biolegend.com/ar/products/brilliant-violet-711-anti-mouse-ly-6c-antibody-8935?GroupID=BLG7242
https://www.citeab.com/antibodies/2410368-551461-bd-pharmingen-pe-rat-anti-mouse-ly-6g
https://www.citeab.com/antibodies/2410938-560599-bd-pharmingen-apc-rat-anti-mouse-ly-6g
https://www.citeab.com/antibodies/2408945-560603-bd-horizon-v450-rat-anti-mouse-ly-6g
https://www.biolegend.com/fr-ch/products/alexa-fluor-700-anti-mouse-i-a-i-e-antibody-3413
https://www.bdbiosciences.com/ar/products/reagents/flow-cytometry-reagents/research-reagents/single-color-antibodies-ruo/bv786-rat-anti-mouse-i-a-i-e. 742894
https://www.cellsignal.com/products/primary-antibodies/phospho-s6-ribosomal-protein-ser235-236-d57-2-2e-xp-rabbit-mab/4858 https://www.labome.com/product/Invitrogen/17-6981-80.html
https://www.citeab.com/antibodies/2411876-552126-bd-pharmingen-pe-rat-anti-mouse-siglec-f
https://www.labome.com/product/Invitrogen/11-0333-82.html
https://www.bdbiosciences.com/en-de/products/reagents/flow-cytometry-reagents/research-reagents/single-color-antibodies-ruo/بي-سي-إف594-ماوس-أنتي-تي-بيت. 562467
https://www.bio-techne.com/p/antibodies/mouse-vcam-1-cd106-alexa-fluor-594-conjugated-antibody-112734_fab6432t
https://www.biolegend.com/fr-ch/products/brilliant-violet-785-anti-mouse-rat-xcr1-antibody-16711

خطوط خلايا حقيقية النواة

معلومات السياسة حول خطوط الخلايا والجنس والنوع في البحث

مصدر(s) خط الخلية

تم عزل خلايا بطانة الشريان الأورطي من الفئران (MAECs) من الشرايين الأورطية الصدرية للفئران كما هو موصوف سابقًا. تم زراعة الخلايا في وسط 199 (Gibco، Invitrogen Life Technologies) + 20% مصل بقري جنيني + بنسلين/ستربتوميسين 2 مليمول + جلوتامين. هيبز مكمل نمو خلايا بطانة الأوعية هيبارين جميعها من SigmaAldrich، تحت 5% في .
تم عزل خطوط خلايا الألياف الجنينية للفأر (MEF) من 13.5 يومًا بعد الإخصاب باستخدام بروتوكول قياسي. تم تشريح كل جنين في 10 مل من PBS معقم، بعد إزالة أعضائه الداخلية، ورأسه، وساقيه. بعد 30 دقيقة من الحضانة مع هز خفيف في مع تريبسين، تم زراعة الخلايا في طبقين بحجم 100 مم وتم حضنها لمدة لتأسيس خطوط MEF المخلدة، تم زراعة MEFs في مراحل مبكرة في أطباق 60 مم وتم إصابتها بفيروس ريترو (10E5 IU/ml) محمول يحمل جينات فيروس الورم الحليمي البشري (HPV) 16 E6/E7. تم إجراء الاختيار باستخدام من G418 لمدة 10 أيام.
خط الخلايا L929 (ATCC) CCL-1TM) المستخدمة لإنتاج السائل الفائق M-CSF، تم زراعتها في قوارير زراعة خلايا بحجم 175 سم² (ستيمسيل) وأعيد تعليقها في RPMI 1640 (سيغما) المضاف إليه مصل جنين العجل المعطل حرارياً (FCS، سيغما)، 1 مللي مول من البيروفات (لونزا، بازل، سويسرا)، الأحماض الأمينية غير الأساسية (ثيرمو فيشر ساينتيفيك، وولثام، ماساتشوستس)، 2 بنسلين مل ستربتوميسين (الثلاثة من لونزا) و 2-ميركابتوإيثانول (ميرك، دارمشتات، ألمانيا)، والذي يُطلق عليه هنا R10. تم الحصول على السائل العلوي عن طريق تصفية الثقافات التي استمرت 15 يومًا من خلال وحدات فلتر ستيريكوب (ميرك ميليبور) وتم استخدامها لاحقًا لتكملة الوسط من أجل إنتاج البلعميات المشتقة من نخاع العظام.
تم إنتاج البلعميات المشتقة من نخاع العظم (BMDMs) كما هو موصوف سابقًا مع بعض التعديلات. تم زراعة خلايا نخاع العظم من فئران WT C57BL/6J في وسط RPMI 1640 المضاف إليه M-CSF المستخرج من خط خلايا L929 و FBS البنسلين ستربتوميسين، 10 مللي مولار هيبيس، 1 نانومولار صوديوم بايروفات (جميعها من جيبكو) خلال 5 أيام في بيئة معقمة، ولكن ليست معالجة لزراعة الأنسجة، أطباق بتري.
تم شراء خلايا L929 مباشرة من ATCC (ATCC ® CCL-1TM). أما باقي الخلايا المستخدمة فكانت خطوطًا أولية. تم تحديد خطوط الخلايا الأولية من خلال الشكل الخارجي وخصائص النمط الظاهري باستخدام تقنية تحليل تدفق الخلايا.
تمت مراقبة جميع خطوط الخلايا بشكل مستمر واختبارها سلبياً لوجود تلوث بالميوكوبلازما بواسطة تفاعل البوليميراز المتسلسل (PCR).
لم يتم استخدام أي خطوط خلوية يتم التعرف عليها بشكل خاطئ بشكل شائع في الدراسة □
تمت مراقبة جميع خطوط الخلايا بشكل مستمر واختبارها سلبياً لوجود تلوث بالميوكوبلازما بواسطة تفاعل البوليميراز المتسلسل (PCR).

المصادقة

تلوث الميكوبلازما

الخطوط التي يتم التعرف عليها بشكل خاطئ بشكل شائع (انظر سجل ICLAC)
محفظة الطبيعة | ملخص التقرير أبريل 2023

أصل العينة

إيداع العينة

طرق التأريخ

قدم معلومات عن مصدر العينات ووصف التصاريح التي تم الحصول عليها للعمل (بما في ذلك اسم الجهة المصدرة، تاريخ الإصدار، وأي معلومات تعريفية). يجب أن تشمل التصاريح جمع العينات، وعند الاقتضاء، التصدير.
حدد مكان إيداع العينات للسماح بالوصول الحر من قبل باحثين آخرين.
إذا تم توفير تواريخ جديدة، يرجى وصف كيفية الحصول عليها (مثل الجمع، التخزين، معالجة العينة والقياس)، وأين تم الحصول عليها (أي اسم المختبر)، وبرنامج المعايرة وبروتوكول ضمان الجودة أو ذكر أنه لم يتم توفير تواريخ جديدة.
□ ضع علامة في هذا المربع لتأكيد أن التواريخ الخام والمعايرة متاحة في الورقة أو في المعلومات التكميلية.

الإشراف الأخلاقي

حدد المنظمة (أو المنظمات) التي وافقت أو قدمت إرشادات حول بروتوكول الدراسة، أو اذكر أنه لم تكن هناك حاجة لموافقة أخلاقية أو إرشادات واشرح لماذا لا.
يرجى ملاحظة أنه يجب أيضًا تقديم معلومات كاملة حول الموافقة على بروتوكول الدراسة في المخطوطة.

الحيوانات وغيرها من الكائنات البحثية

معلومات السياسة حول الدراسات التي تشمل الحيوانات؛ إرشادات ARRIVE الموصى بها للإبلاغ عن أبحاث الحيوانات، والجنس والنوع في البحث

الحيوانات المخبرية

تم إيواء جميع الفئران (Mus musculus) في درجة حرارة محيطة حوالي رطوبة ودورة ضوء وظلام مدتها 12 ساعة. تم تربية الفئران والحفاظ عليها في مجموعات من 5 حيوانات لكل قفص في CNIC تحت ظروف خالية من مسببات الأمراض المحددة. استخدمنا فئران B6.129P2-Apoetm1Unc/J (مختبر جاكسون، السلالة 002052، ApoE-/-) ذات الخلفية المؤهبة للتصلب؛ وفئران B6.129S7-Ldlrtm1Her/J (مختبر جاكسون، السلالة 002207، Ldlr-/-) التي تم التهجين مع فئران B6.SJL-Ptprca Pepcb/BoyJ التي تعبر عن علامة CD45.1 المتجانسة (مختبر جاكسون، السلالة 002014، B6 CD45.1). لاستخدامها في بدء التجارب، تم استخدام فئران ذكور تتراوح أعمارها بين 6-8 أسابيع.
فئران Rag1tm1Mom/J (مختبر جاكسون، سلالة 002216، Rag1-/-)؛ فئران B6.Cg-Rptortm1.1Dmsa/J (مختبر جاكسون، سلالة 013188، RaploxP) تم تزاوجها مع فئران B6.129P2-Lyz2tm1(cre)lfo/J (مختبر جاكسون، سلالة 004781، Lyz2-Cre) لإنتاج Lyz2 رابتور (Cre+) وأشقاء رابتور (Cre-) كضوابط. تم استخدام الحيوانات المنوية من فئران B6.Nischtm1a(EUCOMM)Hmgu>/ H (مركز ماري ليون في MRC هارويل، المملكة المتحدة، EM:08808) للتخصيب في المختبر لفئران ROSA-Flpe (Gt(ROSA)26Sortm1(FLP1)Dym) لإنتاج فئران Nischf/f (tm1c). تم تزاوج فئران Nischf/f مع فئران Lyz2-Cre (B6.129P2Lyz2tm1(cre)lfo/J) لإنتاج Lyz2 نيش (Cre+) وأشقاء نيشf/f (Cre-) كضوابط.

الحيوانات البرية

الإبلاغ عن الجنس

لم يتم استخدام أي حيوانات برية في الدراسة
تشمل نتائجنا في نماذج الفئران كلا من الذكور والإناث. كما تشمل المجموعات البشرية المشاركات الإناث التي تمثل و من إجمالي مجموعات PESA و IGT، على التوالي.

عينات تم جمعها من الميدان

الإشراف الأخلاقي

لم يتم استخدام أي عينات تم جمعها من الميدان في الدراسة.
تمت الموافقة على الدراسات الحيوانية من قبل اللجنة الأخلاقية المحلية. جميع إجراءات الحيوانات تتوافق مع توجيه الاتحاد الأوروبي 2010/63EU وتوصية 2007/526/EC بشأن حماية الحيوانات المستخدمة لأغراض تجريبية وعلمية أخرى، التي تفرضها القوانين الإسبانية بموجب المرسوم الملكي 1201/2005.
يرجى ملاحظة أنه يجب أيضًا تقديم معلومات كاملة عن الموافقة على بروتوكول الدراسة في المخطوطة.

البيانات السريرية

معلومات السياسة حول الدراسات السريرية

يجب أن تتوافق جميع المخطوطات مع إرشادات ICMJE لنشر الأبحاث السريرية ويجب تضمين قائمة مراجعة CONSORT المكتملة مع جميع التقديمات.

تسجيل التجارب السريرية

تم إجراء مجموعة الاكتشاف في مجموعة فرعية من المشاركين من دراسة PESA-CNIC-Santander (تقدم تصلب الشرايين تحت السريرية المبكر): NCT01410318 (https://clinicaltrials.gov/ct2/show/NCT01410318).
تمت الموافقة على مجموعة IGT المستخدمة للتحقق من صحة من قبل مجلس مراجعة الأخلاقيات في غوتنبرغ (IGTM [560-13])
بروتوكول الدراسة

جمع البيانات

تم تجنيد المتطوعين وفقًا لمعايير الإدراج والاستبعاد لدراسة PESA-CNIC-Santander الرئيسية https:// clinicaltrials.gov/ct2/show/NCT01410318.
كانت معايير الاستبعاد لدراسة IGT هي: داء السكري المعروف، الأمراض الالتهابية (مثل مرض كرون، التهاب القولون التقرحي، الأمراض الروماتيزمية)، العلاج بالستيرويدات أو الأدوية المناعية، السرطان (ما لم يكن خاليًا من الانتكاس لمدة 5 سنوات سابقة)، الاضطراب المعرفي، العلاج للأمراض المعدية واستخدام المضادات الحيوية في الأشهر الثلاثة الماضية، عدم القدرة على فهم اللغة السويدية المكتوبة والم spoken وكذلك الأشخاص المولودين خارج السويد.
محفظة الطبيعة | ملخص التقرير أبريل 2023
بالنسبة لمجموعة PESA، تم جمع عينات الدم والبراز من المشاركين تلاها قياس الطيف الكتلي المستهدف وتسلسل جين 16S rRNA، على التوالي. تم تقييم تصلب الشرايين تحت السريرية من خلال دراسات التصوير بما في ذلك الموجات فوق الصوتية الوعائية ثنائية وثلاثية الأبعاد للشرايين السباتية والوريد الفخذي ووجود الكالسيوم في الشرايين التاجية الذي تم تقييمه بواسطة الأشعة المقطعية (PMID:24268213). خضع الأشخاص الذين يعانون من تصلب الشرايين تحت السريرية لدراسة PET/MRI للجسم بالكامل باستخدام 18F-FDG لتوصيف امتصاص 18F-FDG في الشرايين ونشاط نخاع العظام الأيضي (PMID:30922468 و PMID: 35567559، على التوالي). شملت اختبارات الدم الصائم الكيمياء الحيوية وتحديد بروتين سي التفاعلي عالي الحساسية (hs-CRP). في هذه الدراسة، تم تعريف ارتفاع ضغط الدم (HTN) بأنه انقباضي > 130 مم زئبقي و/أو انبساطي و/أو الأشخاص الذين يتناولون أدوية مضادة لارتفاع ضغط الدم. تم تعريف اضطراب الدهون بأنه الكوليسترول الكلي و LDL-cholesterol -الكوليسترول ، أو استخدام أدوية خافضة للدهون. تم إجراء تقييمات القياسات الجسمية وتحليل مقاومة الكهرباء الحيوية خلال نفس الموعد لكل مشارك. تم قياس الطول والوزن باستخدام معدات معايرة (Tanita BC-545N) مع ارتداء المشاركين الملابس الداخلية وبدون أحذية. تم حساب مؤشر كتلة الجسم (BMI) كوزن (كجم) مقسومًا على مربع الطول (متر).
بالنسبة لمجموعة IGT، تم جمع عينات الدم من المشاركين تلاها قياس الطيف الكتلي المستهدف. تم تقييم تصلب الشرايين في الشرايين السباتية بواسطة التصوير بالموجات فوق الصوتية باستخدام بروتوكول موحد بما في ذلك جهاز الموجات فوق الصوتية Siemens Acuson S2000 ومن خلال وجود الكالسيوم في الشرايين التاجية الذي تم تقييمه بواسطة الأشعة المقطعية. تم قياس ضغط الدم الانقباضي (SBP) مرتين باستخدام جهاز تلقائي (Omron M10-IT، Omron Health care Co، كيوتو، اليابان) وتم استخدام متوسط القياسات. تم استخدام استبيان لجمع معلومات مفصلة عن الأدوية والتاريخ العائلي. تم حساب SCORE2 (تقييم المخاطر التاجية المنهجي) كما هو موضح سابقًا. تم قياس وزن الجسم والطول ومحيط الخصر ومحيط الورك باستخدام معدات معايرة مع ارتداء الأشخاص ملابس خفيفة بدون أحذية ووفقًا لتوصيات منظمة الصحة العالمية الحالية.
أظهرت تحليلات الميتابولوم المستهدفة أن تركيزات إيميدازول بروبيونات (ImP)، ولكن ليس الهيستيدين أو حمض يوروكان، كانت مرتفعة بشكل انتقائي في الأشخاص الذين يعانون من تصلب الشرايين تحت السريرية مقارنة بالضوابط. كما لوحظت ارتباطات خطية وغير خطية بين تركيزات ImP وتصلب الشرايين ومدى تصلب الشرايين، على التوالي. كما زادت نسبة حدوث نقاط نهاية تصلب الشرايين ودرجة CAC عبر تيرتيلات ImP المتزايدة. تم التحقق من صحة هذه النتائج في مجموعة مستقلة، مجموعة IGT. كما وُجد أن ImP زاد بشكل كبير في الأشخاص الذين يعانون من تصلب الشرايين النشط (FDG+) مقارنة بتصلب الشرايين غير النشط، وخاصة أولئك الذين لديهم تنشيط نخاع العظام (FDG+_BM) والتهاب نظامي (FDG+_SYS). بعد التعديل لعوامل الخطر التقليدية في كلا المجموعتين، كانت مستويات ImP الأعلى مرتبطة بشكل مستقل بالنتائج الرئيسية لتصلب الشرايين، مما يشير إلى أن مستويات ImP العالية تعتبر مؤشرًا على زيادة خطر تصلب الشرايين. من الجدير بالذكر أن ImP أظهر أيضًا قيمة إضافية عند إضافته إلى علامات تصلب الشرايين المستمدة من الدم المعروفة مثل LDL-cholesterol وبروتين سي التفاعلي عالي الحساسية (hs-CRP) في تمييز انتشار تصلب الشرايين في كلا المجموعتين وتصلب الشرايين النشط في مجموعة PESA. تكشف هذه النتائج عن ارتباط قوي بين وتصلب الشرايين، وخاصة تصلب الشرايين النشط، مما يشير إلى إمكانية استخدامه كمؤشر على تصلب الشرايين النشط المبكر قبل أن تصبح الأمراض المصاحبة عوامل مشوشة.

البحث المزدوج الاستخدام من القلق

معلومات السياسة حول البحث المزدوج الاستخدام من القلق

المخاطر

هل يمكن أن يشكل الاستخدام العرضي أو المتعمد أو المتهور للمواد أو التقنيات الناتجة عن العمل، أو تطبيق المعلومات المقدمة في المخطوطة، تهديدًا لـ:
لا
نعم

□ الصحة العامة

□ الأمن القومي

□ المحاصيل و/أو الماشية

□ النظم البيئية
□ □ أي مجال آخر مهم

التجارب المثيرة للقلق

هل يتضمن العمل أي من هذه التجارب المثيرة للقلق:
لا
نعم
□ □ إظهار كيفية جعل لقاح غير فعال
□ □ منح مقاومة للمضادات الحيوية أو العوامل المضادة للفيروسات المفيدة علاجياً

□ تعزيز شدة مسببات الأمراض أو جعل مسببات غير ضارة ضارة

□ زيادة قابلية انتقال مسببات الأمراض

□ تغيير نطاق المضيف لمسبب المرض

□ تمكين التهرب من طرق التشخيص/الكشف

□ تمكين تسليح عامل بيولوجي أو سم

□ أي مجموعة أخرى من التجارب والمواد المحتملة الضارة
بذور
أنماط نباتية جديدة
التحقق من الهوية
الإبلاغ عن مصدر جميع مخزونات البذور أو المواد النباتية الأخرى المستخدمة. إذا كان ذلك ممكنًا، يرجى ذكر مركز مخزون البذور ورقم الفهرس. إذا تم جمع عينات نباتية من الميدان، يرجى وصف موقع الجمع، التاريخ وإجراءات أخذ العينات.
وصف الطرق التي تم من خلالها إنتاج جميع الأنماط الجينية النباتية الجديدة. يشمل ذلك تلك التي تم إنشاؤها من خلال الأساليب الجينية المعدلة، وتحرير الجينات، والطفرات المعتمدة على المواد الكيميائية/الإشعاع، والتهجين. بالنسبة لخطوط الجينات المعدلة، وصف طريقة التحويل، وعدد الخطوط المستقلة التي تم تحليلها، والجيل الذي أجريت عليه التجارب. بالنسبة لخطوط تحرير الجينات، وصف المحرر المستخدم، والتسلسل الداخلي المستهدف للتحرير، وتسلسل RNA الدليل المستهدف (إذا كان ذلك مناسبًا) وكيف تم تطبيق المحرر.
وصف أي إجراءات تحقق لكل مخزون بذور مستخدم أو جينوتيب جديد تم إنشاؤه. وصف أي تجارب تم استخدامها لتقييم تأثير الطفرة، وحيثما ينطبق، كيف تم فحص التأثيرات الثانوية المحتملة (مثل إدخالات T-DNA في موقع ثانٍ، التبقيع، تحرير الجينات خارج الهدف).

تسلسل شريحة الكروماتين

إيداع البيانات

□ تأكيد أن كل من البيانات الخام والبيانات النهائية المعالجة قد تم إيداعها في قاعدة بيانات عامة مثل GEO.
□ تأكد من أنك قد قمت بإيداع أو توفير الوصول إلى ملفات الرسم البياني (مثل ملفات BED) للقيم المحددة.
قد تبقى خاصة قبل النشر.
للمستندات “التقديم الأولي” أو “النسخة المنقحة”، قدم روابط وصول للمراجعين. بالنسبة لمستند “التقديم النهائي”، قدم رابطًا للبيانات المودعة.
الملفات في تقديم قاعدة البيانات
جلسة متصفح الجينوم (مثل UCSC)
قدم قائمة بجميع الملفات المتاحة في تقديم قاعدة البيانات.
يرجى تقديم رابط لجلسة متصفح الجينوم المجهول الهوية لوثائق “التقديم الأولي” و”الإصدار المنقح” فقط، لتمكين المراجعة من قبل الأقران. اكتب “لم يعد قابلاً للتطبيق” لوثائق “التقديم النهائي”.

المنهجية

نسخ

عمق التسلسل
وصف النسخ التجريبية، مع تحديد العدد، النوع، واتفاق النسخ.
وصف عمق التسلسل لكل تجربة، مع تقديم العدد الإجمالي للقراءات، والقراءات المخصصة بشكل فريد، وطول القراءات وما إذا كانت مزدوجة أو مفردة.

الأجسام المضادة

وصف الأجسام المضادة المستخدمة في تجارب ChIP-seq؛ إذا كان ذلك مناسبًا، يرجى تقديم اسم المورد، رقم الكتالوج، اسم النسخة، ورقم الدفعة.

معلمات استدعاء القمة

حدد برنامج سطر الأوامر والمعلمات المستخدمة لتعيين القراءة واستدعاء القمة، بما في ذلك ملفات ChIP والملفات الضابطة وملفات الفهرس المستخدمة.
جودة البيانات
برمجيات
وصف الطرق المستخدمة لضمان جودة البيانات بالتفصيل الكامل، بما في ذلك عدد القمم عند مستوى FDR 5% وما فوق 5 أضعاف من الغنى.
وصف البرنامج المستخدم لجمع وتحليل بيانات ChIP-seq. بالنسبة للكود المخصص الذي تم إيداعه في مستودع مجتمعي، يرجى تقديم تفاصيل الوصول.

تدفق الخلايا

المؤامرات

أكد أن:

توضح تسميات المحاور العلامة والفلوركروم المستخدم (مثل CD4-FITC).
المقاييس على المحاور مرئية بوضوح. قم بتضمين الأرقام على المحاور فقط للرسم البياني في أسفل اليسار من المجموعة (المجموعة هي تحليل للعلامات المتطابقة).
جميع الرسوم البيانية هي رسوم بيانية متساوية الارتفاع مع نقاط شاذة أو رسوم بيانية بالألوان الزائفة.
تم توفير قيمة عددية لعدد الخلايا أو النسبة المئوية (مع الإحصائيات).

المنهجية

تحضير العينة

لعينات الدم، بعد محلول تحلل كريات الدم الحمراء، تم صبغ تعليقات الخلايا المفردة لمدة 30 دقيقة في مع مجموعة صبغة خلايا ميتة/حية القابلة للإصلاح Aqua (تقنيات الحياة). بعد الغسل بمحلول PBS، تم صبغ الخلايا في محلول FACS الذي يحتوي على مضاد CD16/32 (BioXcell)، FBS و تمت معالجة EDTA مع خليط الأجسام المضادة المقابل لمدة 30 دقيقة على الثلج. تم صبغ الخلايا بخليط من الأجسام المضادة.
لإزالة تلوث الدم من الأنسجة الوعائية، تم ضخ 10 مل من محلول فوسفات buffered saline (PBS) عبر ثقب قلبي في الفئران التي تتسلل خلاياها إلى الشريان الأورطي.
آلة
تم الاحتفاظ بالشرايين الأورطية في وسط دولبيكو المعدل Eagle (DMEM) البارد ليتم هضمها. تمت إزالة الدهون المحيطة بالأوعية الدموية وتم فتح الشريان الأورطي الصدري مع القوس طوليًا وقطعه إلى قطع أصغر تم حضنها لمدة 30 دقيقة عند 37 درجة مئوية في حمام مائي في محلول الهضم (كولاجيناز A). ديباز II (Roche/Sigma #10103586001). )، (روش/ سيغما #04942078001)، DNase I ( إيلاستاز (Roche/Sigma #10104159001) ) و Libersase TL ( 0.2 وحدة وونش/مل) رقم الكاتالوج#5401119001. بعد فترة الحضانة، تم خلط الأنسجة المهضومة عن طريق السحب، وتم تصفيتها من خلال تم تصفية العينة ودورانها بسرعة 400 جرام لمدة 5 دقائق عند 4 درجات مئوية. تم صبغ الخلايا الفردية بمزيج من الأجسام المضادة.
فاسيمفوني (بي دي بيوساينس)
فاصل خلايا FACSAria (بي دي بيوساينس)
برمجيات
وفرة تجمع الخلايا
برنامج FlowJo الإصدار 10 (TreeStar)
عدد الخلايا موضح في الرسم البياني المقابل لكل مجموعة سكانية.
استراتيجية البوابة
استراتيجية التصفية على أنسجة الدم والأبهر:
  1. FSC و SSC
  2. FSC-H و FSC-A للبوابة على مجموعة خلايا مفردة
  3. قابلية البوابة على الخلايا الحية، يتم تعريف ذلك على أنه خلايا سلبية للتلوين
  4. خلايا CD45+
  5. خلايا CD90 لخلايا T، وخلايا B220 لخلايا B، والخلايا غير T أو B كخلايا سلبية مزدوجة.
  6. تم تصنيف CD90-;B220-; بشكل إضافي على المونوسيتات عالية Ly6C
  7. تم تصنيف CD90-;B220-؛ بشكل إضافي على F4/80+CD86+ و F4/80+CD11c+ (البلاعم)
  8. تم تصنيف خلايا CD90 بشكل إضافي إلى CD4+Rorg-t+ (Th17)، CD4+t-Bet+ (Th1)، CD4+Foxp3+ (Treg)
استراتيجية التصفية على الدم لعزل وحيدات النواة:
  1. FSC و SSC
  2. FSC-H و FSC-A للدخول على مجموعة خلايا مفردة
  3. قابلية البوابة على الخلايا الحية، يتم تعريف ذلك على أنه خلايا سلبية للتلوين
  4. خلايا CD45+
  5. خلايا CD3-، B220-، NK1.1-، LY6G-، CD49-، SiglecF-
  6. تم تحديد المونوسيتات كـ CD11B+ و Ly6C+/-
قم بتحديد هذا المربع لتأكيد أنه تم تقديم رقم يوضح استراتيجية البوابة في المعلومات التكميلية.

التصوير بالرنين المغناطيسي

تصميم تجريبي

نوع التصميم
مواصفات التصميم
مقاييس الأداء السلوكي
حدد حالة المهمة أو حالة الراحة؛ تصميم مرتبط بالحدث أو تصميم الكتلة.
حدد عدد الكتل أو التجارب أو الوحدات التجريبية لكل جلسة و/أو موضوع، وحدد طول كل تجربة أو كتلة (إذا كانت التجارب مقسمة إلى كتل) والفترة بين التجارب.
حدد عدد ونوع المتغيرات المسجلة (مثل: الضغط على الزر الصحيح، وقت الاستجابة) وما هي الإحصائيات التي تم استخدامها لتحديد أن المشاركين كانوا يؤدون المهمة كما هو متوقع (مثل: المتوسط، النطاق، و/أو الانحراف المعياري عبر المشاركين).

استحواذ

حدد: وظيفي، هيكلي، انتشار، تدفق.
حدد في تسلا
شدة المجال
معلمات التسلسل والتصوير
حدد نوع تسلسل النبضات (صدى التدرج، صدى الدوران، إلخ)، نوع التصوير (EPI، حلزوني، إلخ)، مجال الرؤية، حجم المصفوفة، سمك الشريحة، الاتجاه وزمن الانعكاس/زمن التكرار/زاوية الانعكاس.
مجال الاستحواذ
الرنين المغناطيسي الانتشاري
□ مستخدم
حدد ما إذا تم استخدام مسح كامل للدماغ أو عرّف منطقة الاكتساب، موضحًا كيف تم تحديد المنطقة.
□ غير مستخدم

التحضير المسبق

برمجيات المعالجة المسبقة
قدم تفاصيل عن إصدار البرنامج ورقم المراجعة والمعلمات المحددة (النموذج/الوظائف، استخراج الدماغ، التقسيم، حجم نواة التنعيم، إلخ).

التطبيع

قالب التطبيع وصف القالب المستخدم للتطبيع/التحويل، مع تحديد مساحة الموضوع أو مساحة المجموعة الموحدة (مثل تاليراش الأصلية، MNI305، ICBM152) أو الإشارة إلى أن البيانات لم يتم تطبيعها.
إزالة الضوضاء والعيوب وصف إجراءاتك لإزالة العيوب والضوضاء الهيكلية، مع تحديد معلمات الحركة، وإشارات الأنسجة، والإشارات الفسيولوجية (معدل ضربات القلب، التنفس).
تقييد الحجم حدد برنامجك و/أو طريقتك ومعاييرك لتصفية الحجم، وبيّن مدى هذه التصفية.
النمذجة الإحصائية والاستدلال
نوع النموذج والإعدادات حدد النوع (وحيد المتغير الكتلي، متعدد المتغيرات، تحليل الأنماط المتكررة، التنبؤ، إلخ) واذكر التفاصيل الأساسية للنموذج في المستويين الأول والثاني (مثل: تأثيرات ثابتة، عشوائية أو مختلطة؛ انحراف أو ارتباط ذاتي).
التأثيرات المختبرة حدد التأثير الدقيق من حيث شروط المهمة أو المحفز بدلاً من المفاهيم النفسية وأشر إلى ما إذا كانت ANOVA أو التصاميم العاملية قد استخدمت.
حدد نوع التحليل:
نوع الإحصائيات للاستدلال (انظر إكلوند وآخرون 2016) حدد على مستوى الفوكسل أو على مستوى الكتلة وقدم جميع المعلمات ذات الصلة لطرق الكتلة.
تصحيح وصف نوع التصحيح وكيفية الحصول عليه للمقارنات المتعددة (مثل FWE، FDR، التبديل أو مونت كارلو).
النماذج والتحليل
غير متوفر
مشارك في الدراسة □ □ الاتصال الوظيفي و/أو الفعال □ □ تحليل الرسم البياني □ □ النمذجة متعددة المتغيرات أو التحليل التنبؤي
الاتصال الوظيفي و/أو الفعال أبلغ عن مقاييس الاعتماد المستخدمة وتفاصيل النموذج (مثل ارتباط بيرسون، الارتباط الجزئي، المعلومات المتبادلة).
تحليل الرسوم البيانية أبلغ عن المتغير التابع ومقياس الاتصال، مع تحديد الرسم البياني الموزون أو الرسم البياني الثنائي، على مستوى الموضوع أو المجموعة، والملخصات العالمية و/أو العقد المستخدمة (مثل معامل التجميع، الكفاءة، إلخ).
النمذجة متعددة المتغيرات والتحليل التنبؤي حدد المتغيرات المستقلة، استخراج الميزات وتقليل الأبعاد، النموذج، مقاييس التدريب والتقييم.

    1. مجموعة العمل SCORE2 وتعاون مخاطر القلب والأوعية الدموية ESC. خوارزميات توقع مخاطر SCORE2: نماذج جديدة لتقدير مخاطر الإصابة بأمراض القلب والأوعية الدموية على مدى 10 سنوات في أوروبا. Eur. Heart J. 42, 2439-2454 (2021).
    2. فرناندز-فرييرا، ل. وآخرون. انتشار، توزيع الأوعية، ومدى الأوعية المتعددة من تصلب الشرايين تحت السريرية في مجموعة متوسطة العمر. الدورة الدموية 131، 2104-2113 (2015).
    3. ليبي، ب. المشهد المتغير لتصلب الشرايين. الطبيعة 592، 524-533 (2021).
  1. بالنسبة لدراسة PESA، تم جمع عينات البلازما والبراز من ديسمبر 2018 إلى مايو 2021. تم جمع وتحليل بيانات الميتابولوميات في عام 2021. تم جمع وتحليل بيانات تسلسل جين 16S في عام 2022.
    في مجموعة IGT، تم فحص الرجال والنساء الذين تتراوح أعمارهم بين 50 و64 عامًا والذين وُلِدوا في منطقة غوتنبرغ، السويد، بين عامي 2013

Journal: Nature, Volume: 645, Issue: 8079
DOI: https://doi.org/10.1038/s41586-025-09263-w
PMID: https://pubmed.ncbi.nlm.nih.gov/40670786
Publication Date: 2025-07-16

Imidazole propionate is a driver and therapeutic target in atherosclerosis

https://doi.org/10.1038/s41586-025-09263-w
Received: 1 June 2023
Accepted: 9 June 2025
Published online: 16 July 2025
Open access
Annalaura Mastrangelo ${ }^{mathbf{1 , 3 0}}$, Iñaki Robles-Vera ${ }^{mathbf{1 , 3 0}}$, Diego Mañanes ${ }^{mathbf{1 , 2}}$, Miguel Galán ${ }^{mathbf{1 , 2}}$, Marcos Femenía-Muiña ${ }^{1,3}$, Ana Redondo-Urzainqui ${ }^{1,2}$, Rafael Barrero-Rodríguez ${ }^{1,2}$, Eleftheria Papaioannou ${ }^{4,5,6}$, Joaquín Amores-Iniesta ${ }^{1}$, Ana Devesa ${ }^{1,7,8}$, Manuel Lobo-González ${ }^{1}$, Alba Carreras ${ }^{9}$, Katharina R. Beck ${ }^{9}$, Sophie Ivarsson ${ }^{9}$, Anders Gummesson ${ }^{9,10}$, Georgios Georgiopoulos ${ }^{11,12,13}$, Manuel Rodrigo-Tapias ${ }^{1,14}$, Sarai Martínez-Cano ${ }^{mathbf{1 , 1 4}}$, Ivan Fernández-López ${ }^{mathbf{1}}$, Vanessa Nuñez ${ }^{mathbf{1}}$, Alessia Ferrarini ${ }^{mathbf{1}}$, Naohiro Inohara ${ }^{15}$, Kimon Stamatelopoulos ${ }^{11}$, Alberto Benguría ${ }^{1}$, Danay Cibrian ${ }^{1,8,16}$, Francisco Sánchez-Madrid ${ }^{1,8,16,17}$, Vanesa Alonso-Herranz ${ }^{18}$, Ana Dopazo ${ }^{1,8}$, Coral Barbas ${ }^{19}$, Jesús Vázquez ${ }^{1,8}$, Juan Antonio López ${ }^{1,8}$, Alicia González-Martín ${ }^{4,5,6}$, Gabriel Nuñez ${ }^{15,19,20}$, Konstantinos Stellos ${ }^{21,22,23,24}$, Göran Bergström ${ }^{9,25}$, Fredrik Bäckhed ${ }^{9,25,26,27}$, Valentín Fuster ${ }^{1,28}$, Borja Ibañez ${ }^{1,8,29}$ & David Sancho ${ }^{1 boxtimes text { ® }}$

Abstract

Atherosclerosis is the main underlying cause of cardiovascular diseases. Its prevention is based on the detection and treatment of traditional cardiovascular risk factors . However, individuals at risk for early vascular disease often remain unidentified . Recent research has identified new molecules in the pathophysiology of atherosclerosis , highlighting the need for alternative disease biomarkers and therapeutic targets to improve early diagnosis and therapy efficacy. Here, we observed that imidazole propionate (ImP), produced by microorganisms, is associated with the extent of atherosclerosis in mice and in two independent human cohorts. Furthermore, ImP administration to atherosclerosis-prone mice fed with chow diet was sufficient to induce atherosclerosis without altering the lipid profile, and was linked to activation of both systemic and local innate and adaptive immunity and inflammation. Specifically, we found that ImP caused atherosclerosis through the imidazoline-1 receptor (I1R, also known as nischarin) in myeloid cells. Blocking this ImP-I1R axis inhibited the development of atherosclerosis induced by ImP or high-cholesterol diet in mice. Identification of the strong association of ImP with active atherosclerosis and the contribution of the ImP-I1R axis to disease progression opens new avenues for improving the early diagnosis and personalized therapy of atherosclerosis.

Cardiovascular disease (CVD) is a leading cause of death worldwide, with atherosclerosis being its main determinant. Despite advances in prevention and therapy, the increase in CVD-linked morbidity and mortality highlights the need for early interventions in seemingly healthy populations. Atherosclerosis is a complex multifactorial disease whose prevention is based on traditional cardiovascular risk factor-based scores that do not identify individuals at risk for atherosclerotic vascular disease at early stages . Moreover, the main pharmacological interventions are bound to established risk factors (lipid metabolism and recently inflammation ). This emphasizes the need for exploration of treatments that target other factors in the pathophysiology of atherosclerosis , particularly for patients who, despite optimal treatment, still have significant residual cardiovascular risk .
Crosstalk between the metabolisms of the microbiota and host contributes to CVD . However, only a few gut microbiota-dependent metabolites that correlate with late stages of the disease have been described . We sought to identify microbial metabolites associated
with early stages of atherosclerotic vascular disease that could contribute to atherosclerosis progression.
To screen for microbial metabolites that could affect atherosclerosis progression, we fed atherosclerosis-prone Apoe mice different diets with or without antibiotic treatment to deplete the microbiota (Extended Data Fig. 1a). High-cholesterol (HC) diets induced atherosclerosis, which was partially prevented upon antibiotic treatment with HC diet supplemented with choline (HC/HC) (Fig. 1a). Untargeted metabolomics showed a substantial reshaping of the plasma metabolome (Fig. 1b,c) associated with altered gut microbiota composition (Fig.1d,e and Extended Data Fig. 1b) upon diet and antibiotic administration. First, we validated the metabolomics by demonstrating that the host-microbial co-metabolite, trimethylamine -oxide (TMAO) was induced by the addition of dietary choline and associated
Fig. 1| Untargeted metabolomics unveils ImP as a microbiota-dependent metabolite that is associated with atherosclerosis.Apoe mice were fed chow, HC diet or HC/HC diet with or without antibiotics (abx) in the drinking water.a, Quantification of atherosclerotic plaque lesion size in the aortic arch by Oil red O staining. Each point represents an individual mouse ( per group for all conditions, except chow-fed mice administered antibiotics and HC/HCfed mice, ). , Score plots of partial least squares discriminant analysis (PLS-DA) performed on liquid chromatography-mass spectrometry (LC-MS) data of plasma samples collected at endpoint (euthanasia) ( per group) for the three diets (b) and the three diets with antibiotics (c) and 16S rDNA sequencing analysis of caecal samples collected at endpoint (chow, HC, ;
HC/HC, ) (d). e, Chao1 richness analysis of microbiota diversity. f,g, ImP relative abundance in plasma from male mice at endpoint measured by untargeted LC-MS (f) and correlation with aortic arch lesion (g).h, Correlation matrix showing the correlation between ImP and gut microbiota genera (>0.1% of total abundance) in caecal samples from Apoe mice fed chow, HC or HC/HC diets for 8 weeks. Data are pooled from two independent experiments (chow, HC, ; HC/HC, ). g,h, Correlation coefficient ( ) and values are calculated by Spearman’s rank-order correlation test. a,e,f, Individual data and arithmetic mean ± s.e.m. of each group are shown. Two-sided one-way ANOVA with Tukey post hoc correction. .
with atherosclerosis in a microbiota-dependent manner (Extended Data Fig. 1c,d). Notably, we identified ImP, a microbiota-dependent metabolite , to be highly associated with atherosclerosis upon HC feeding (Fig. 1f,g and Extended Data Fig. 1e). Plasma ImP concentration was also associated with changes in the gut microbial ecology upon dietary intervention, particularly with a relative enrichment of Escherichia and Shigella, or Eubacterium (Fig. 1h). However, identification of specific strains with the capacity to produce ImP requires further investigation.

ImP is linked to subclinical atherosclerosis in humans

Next, we aimed to investigate whether increased plasma concentration of ImP was also associated with atherosclerosis in humans. We recruited 400 asymptomatic volunteers from the Progression of Early Subclinical Atherosclerosis (PESA)-Centro Nacional de Investigaciones Cardiovasculares (CNIC)-Santander prospective cohort (hereafter the PESA cohort) study (Supplementary Table 1a,b). On the basis of multiterritorial and multimodal imaging (2D or 3D vascular ultrasonography and non-contrast computed tomography), we classified 295 participants with subclinical atherosclerosis and 105 controls without atherosclerosis. Extent of atherosclerosis was defined according to the number of affected vascular sites and the coronary artery calcium (CAC) score. Targeted metabolomics was used to quantify ImP and its related metabolites (histidine and urocanic acid) in plasma samples. Plasma concentrations of ImP, but not histidine or urocanic acid, were selectively increased in individuals with subclinical atherosclerosis compared with controls (Fig. 2a and Extended Data Fig. 2a). Linear and non-linear associations were observed between ImP concentrations and atherosclerosis and extent of atherosclerosis, respectively
(Fig. 2b). ImP was subsequently measured in an independent cohort, the impaired glucose tolerance (IGT) cohort (Supplementary Table 2a,b), comprising asymptomatic volunteers, including 529 controls and 1,315 individuals with subclinical atherosclerosis . Notably, the association between ImP and early atherosclerosis was confirmed (Fig. 2c,d and Extended Data Fig. 2a).
We further explored the association between ImP, dietary patterns and the microbiota composition. Among the five main principal component analysis (PCA)-derived dietary patterns in the PESA cohort (Extended Data Fig. 2b), ImP was inversely correlated with a Breakfast1 and a Mediterranean dietary pattern (Fig. 2e), consistent with previous findings ribosomal DNA (rDNA) sequencing of faecal samples detected a direct correlation of ImP with the relative abundance of Veillonella and Acidaminococcus, and inverse correlation with Erysipelotrichaceae and Coriobacteriaceae families (Fig. 2e), which are altered in individuals with CVD .
Next, we investigated the association between plasma ImP and established cardiovascular risk factors. In both cohorts, ImP directly correlated with fasting glucose and an adverse cardiometabolic profile, including increased high-sensitivity C-reactive protein (hs-CRP), body mass index (BMI), visceral fat, dyslipidaemia and hypertension, and lower high-density lipoprotein (HDL)-cholesterol (Fig. 2e,f and Supplementary Tables 1b and 2b). The prevalence of atherosclerosis endpoints and the CAC score also increased across ascending ImP tertiles (Supplementary Tables 1b and 2b). After adjusting for traditional risk factors in both cohorts, higher ImP levels were independently associated with main atherosclerosis outcomes (Fig. 2g and Supplementary Table 3), suggesting high ImP levels as indicator of increased atherosclerosis risk. Of note, ImP also showed additive value when added to established blood-derived atherosclerosis biomarkers such as
Fig. 2 | is associated with subclinical atherosclerosis in humans.
a,c, Plasma ImP in healthy individuals (Ctrl) and individuals with subclinical atherosclerosis (AT) from the PESA(a; Ctrl, and IGT(c; Ctrl, ; AT, ) cohorts. b,d, Dose-response curves of plasma ImP concentration and endpoints in the PESA (b) and IGT (d) cohorts. e,f, Spearman correlation matrices between ImP and atherosclerosis traits, diet and microbiota in the PESA (e) and IGT (f) cohorts. Benjamini-Hochberg adjusted values. ALT, alanine aminotransferase; AST, aspartate aminotransferase; BM, bone marrow; ECO2D, 2D vascular ultrasound; ECO3D, 3D vascular ultrasound; F, familial; GFR, glomerular filtration rate; GGT, gamma-glutamyl transferase; HTN, hypertension. g, Adjusted regression models for the association of ImP with atherosclerosis (left) and extent of atherosclerosis (right) in the PESA (top, ) and IGT (bottom, ) cohorts. Effect estimates were controlled for age, sex, smoking, creatinine, family history of CVD, haemoglobin, hypertension and LDL-C (PESA cohort) and age, smoking, family history of CVD, hypertension, LDL-C, Hb1Ac, hs-CRP and ALT (IGT cohort). Error bars
show 95% confidence intervals. OR, odds ratio.h,j, Plasma ImP in individuals with inactive atherosclerosis (FDG ) and active atherosclerosis (FDG , individuals were further stratified according to vascular inflammation (arterial F-FDG uptake, A, ), bone marrow activation ( F-FDG uptake in bone marrow, BM, ) and systemic inflammation (concurrent arterial and bone marrow F-FDG uptake, FDG SYS, ) (j). FDG refers to the group of inactive atherosclerosis. a,c,h, j, Horizontal line represents median and error bars show interquartile range (Supplementary Tables 1a, 2a and 4). Two-tailed Mann-Whitney -test. i, Dose-response curve for plasma ImP effect on active atherosclerosis for the PESA cohort.b,d,i, Dashed lines represent the confidence interval; vertical lines delineate tertiles. k, Multinomial logistic regression for subclinical atherosclerosis in the atherosclerosis subgroups ( _ _ A and ) versus controls according to plasma ImP. Odds ratio was adjusted for age, sex, smoking, glucose, hs-CRP and haemoglobin concentration. g, k, Whiskers indicate 95% confidence intervals (values in Supplementary Tables 3 and 5). .
low-density lipoprotein (LDL)-cholesterol and hs-CRP in discriminating atherosclerosis prevalence in both cohorts (Extended Data Fig. 2c,d).
In the PESA cohort, individuals with subclinical atherosclerosis were further classified by -fluorodeoxyglucose ( -FDG) uptake in arteries and/or bone marrow activation into those with metabolically
active atherosclerosis ( ) or not ( . Increased ImP plasma concentration was observed in the group, following a non-linear association with the outcome (Fig. 2h,i). Further stratification by F-FDG uptake (Extended Data Fig. 2e and Supplementary Table 4) revealed higher plasma ImP concentration in the subgroups of bone
Fig. 3 | Increased circulating ImP induces atherosclerosis and systemic inflammation in chow-fed atherosclerosis-prone mice. a, ImP was administered (lmP) or not (Ctrl) to chow-fed mice. Oil red O staining of aortic arch (left, ) and representative images of aorta (right). b-e, ImP was administered (lmP) or not (Ctrl) to Apoe mice. b, Quantification (left) and representative images (right) of Oil red O staining of aortic root lesions. . Arrowheads indicate areas with positive Oil red O staining. Scale bars, . c,d, Flow cytometry analysis of Ly6C monocytes and T-bet in CD4 T cells in blood at endpoint. Right, representative density plots for Ctrl and ImP. e, Uniform manifold approximation and projection (UMAP) embedding (left) and cell proportions (right) labelled by cell type of cells derived from whole aorta, based on transcriptomic profiles. DCs, dendritic cells; ECs, endothelial cells; FBs, fibroblasts; MFs, macrophages; VSMCs, vascular smooth muscle cells.f, mice grafted with bone marrow from wild-type (WT) (Ctrl, ) or . Atherosclerosis by Oil red O staining of aortic arch (left) and representative
images of aorta (right). g, Heat map of GSEA comparing ImP versus control for endothelial cells, fibroblasts and macrophages from scRNA-seq data of Apoe mice fed chow diet for 4 weeks. EMT, epithelial-mesenchymal transition; NES, normalized enrichment score.h, Global abundance of peptides (mTOR) and phosphopeptides (p-mTOR) in BMDMs (left) or MEFs (right) treated with ImP for 3 h with or without AGN192403 (AGN). The ratio is relative to unstimulated conditions. i, mice grafted with bone marrow from control Raptor or aptor . Quantification (left) and representative images (i) of Oil red O staining of aorta, showing atherosclerosis in aortic arch. a-d,f,i, Individual data points and mean ± s.e.m. of at least two pooled independent experiments. a-d, Twotailed unpaired Student’s -test. f,i, One-way ANOVA with Tukey post hoc correction. g, Two-tailed Kolmogorov-Smirnov test comparing ImP versus unstimulated. h, Two-tailed Wilcoxon signed rank test comparing peptide and phosphopeptide abundance in ImP versus ImP plus AGN treatments.
marrow activation ( _BM) and systemic inflammation ( _SYS; Fig. 2j). Notably, after adjusting for conventional risk factors, the association between ImP and increased risk remained significant across all subgroups of metabolically active atherosclerosis (Fig. 2k and Supplementary Table 5). Additionally, ImP demonstrated additive discriminative ability for active atherosclerosis over LDL-cholesterol and hs-CRP alone (Extended Data Fig. 2c,d). These findings reveal a strong association between ImP and atherosclerosis, particularly active atherosclerosis, suggesting its potential use as an indicator of early active atherosclerosis before other comorbidities become confounding factors.

ImP causes atherosclerosis without cholesterol change

To further explore the effect of ImP on atherosclerosis and determine whether it causally contributed to the development of the early stages of the disease, we administered ImP in the drinking water of atherosclerosis-prone mice, including chow-fed mice, which we treated with ImP for 12 weeks (Fig. 3a and Extended Data Fig. 3a,b) and chow-fed mice, which we treated with ImP for 8 weeks (Fig. 3b
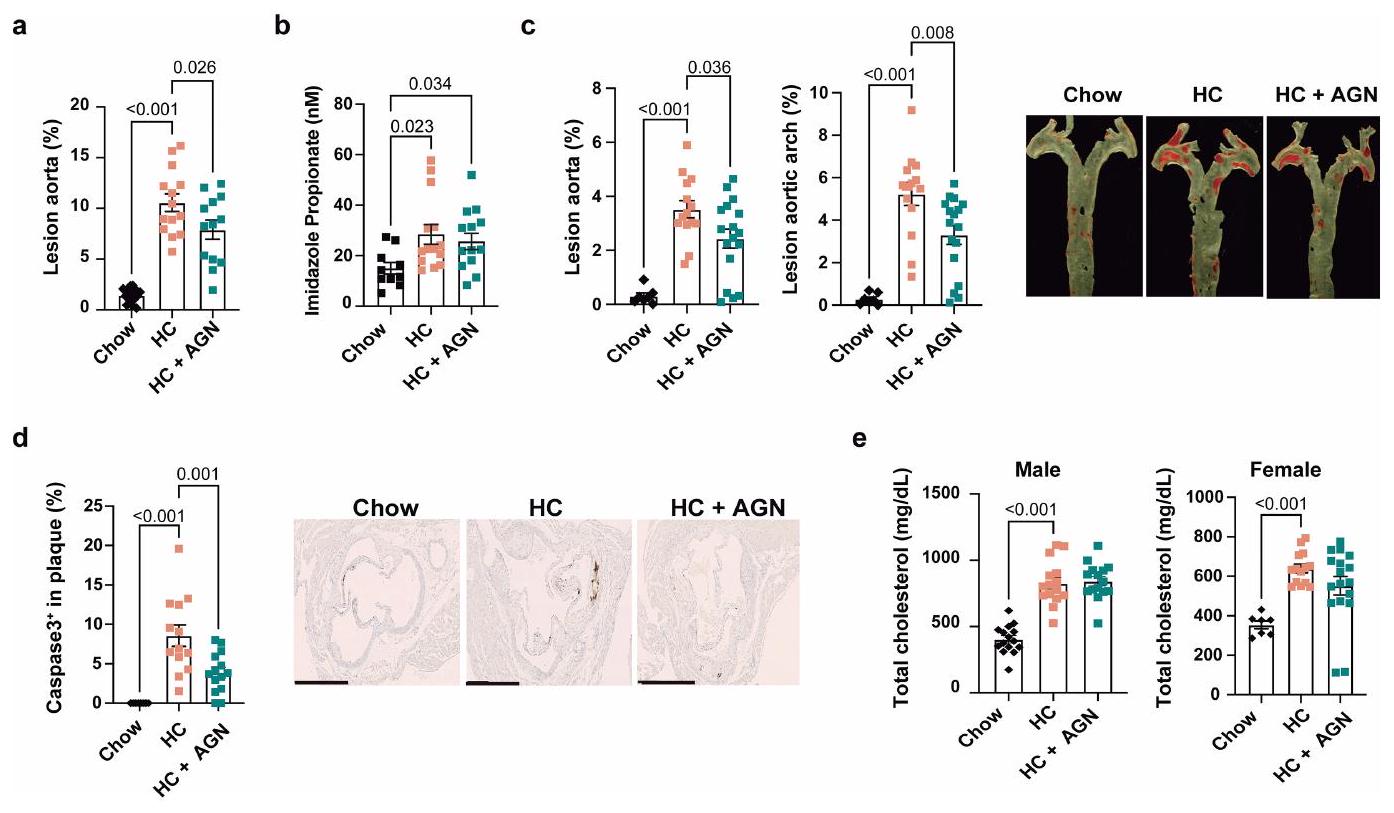
and Extended Data Fig. 3c-e). In both models, ImP supplementation increased atherosclerosis development in the aorta and aortic root without affecting circulating cholesterol or glucose concentration (Fig. 3a,b and Extended Data Fig. 3a-e). Feeding with HC diet alone induced ImP production (Fig.1f). Additional ImP supplementation did not significantly exacerbate atherosclerosis in HC -fed mice, although it further increased atherosclerotic lesions in mice (Extended Data Fig. 3f,g). Thus, to establish a direct ImP-dependent model of atherosclerosis for subsequent investigations, we administered ImP exclusively to chow-fed mice. Notably, mice treated with ImP for eight weeks showed an expansion of proinflammatory Ly6C monocytes, and T helper and T helper cells (Fig. 3c,d and Extended Data Fig. 4a) in the blood, which are associated with a proatherogenic environment .
To further understand the specific changes induced by ImP in the aorta, we performed single-cell RNA-sequencing (scRNA-seq) analysis of the whole aorta from chow-fed Apoe mice that were administered ImP for four or eight weeks (Extended Data Fig. 4b-e). Mice treated with ImP for four weeks showed a mild increase in aortic arch atherosclerosis (Extended Data Fig. 4f), and some local changes in
cell population frequency in the aorta (Extended Data Fig. 4e), without changes in circulating immune cells (Extended Data Fig. 4g,h). By contrast, scRNA-seq of aortas from mice treated with ImP for eight weeks revealed an increase in the relative number of fibroblasts, endothelial cells and immune cells (Fig. 3e). The increased number of immune cells in the aorta was confirmed by flow cytometry analysis (Extended Data Fig. 4i) and histological analysis of the aortic root, which showed increased T cell infiltration in the intima-media layer and increased MAC2 staining for inflammatory macrophages in the atheroma plaque of ImP-treated mice compared with controls (Extended Data Fig. 4j,k). Remarkably, the ability of ImP to induce atherosclerosis was markedly reduced in mice grafted with bone marrow, which lacks T and B cells (Fig. 3f and Extended Data Fig. 41). These data identify ImP as a novel contributor to atherosclerosis aetiology in atherosclerosis-prone mice that is associated with activation of the immune response without affecting the bloodstream concentration of cholesterol.

In vivo ImP alters the aortic transcriptome

To further dissect cellular targets of ImP in the aorta, we investigated transcriptional changes using scRNA-seq analysis after four weeks of treatment. Gene set enrichment analysis (GSEA) of each cell type showed increased inflammation-associated transcriptional pathways in macrophages, fibroblasts and endothelial cells following ImP treatment (Fig. 3g). Reclustering of each cell type in independent analyses identified four macrophage, five fibroblast and three endothelial cell subclusters (Extended Data Fig.5a-c). Analysis of the ImP effect in these subclusters (including four- and eight-week data) showed a reduction in the MF1 cluster associated with homeostatic genes , and an increase in the MF3 cluster expressing genes associated with lipid metabolism, inflammation and macrophage activation (Extended Data Fig.5d,g). Increased ImP in the circulation induced expansion of aortic FB2, FB3 and FB4 subsets, which were characterized by the expression of genes associated with acetylcholine response, immune response and inflammation, and extracellular matrix organization, respectively (Extended Data Fig. 5e,g). Finally, the EC1 subset, which highly expressed genes regulating endothelial cell function , mesenchymal markers and proangiogenesis genes was enriched in the aorta after ImP treatment (Extended Data Fig. 5f,g).
Consistent with these results, ImP was able to activate in vitro mouse embryonic fibroblasts (MEFs) by inducing the production of active monocyte chemoattractant protein-1, which increases monocyte recruitment (Extended Data Fig. 5h,i) associated with atherogenesis . Moreover, RNA-sequencing (RNA-seq) analysis showed a rapid induction of many inflammatory and activation pathways following ImP administration, particularly in bone marrow-derived macrophages (BMDMs) and in MEFs, but not in mouse aortic endothelial cells (MAECs) (Extended Data Fig. 5j), suggesting that macrophages and fibroblasts could be main targets of ImP. Of note, phosphoproteomic analysis showed increased global abundance of phosphopeptides belonging to the mTOR pathway in BMDMs and MEFs upon ImP treatment (Fig. 3h and Extended Data Fig. 5k). These results were in agreement with previous findings in primary hepatocytes and the increased phosphorylated-S6 (p-S6) signal (indicative of mTOR activation) that we found in BMDMs and MEFs following ImP treatment (Extended Data Fig. 51). Further, pre-incubation with the mTOR inhibitor, rapamycin, prevented the induction of TNF production by ImP in BMDMs and MEFs (Extended Data Fig. 5m). Apoe mice fed chow diet and administered ImP for 8 weeks also had increased p-S6 in peritoneal macrophages (Extended Data Fig. 5n). Notably, selective deletion of Raptor (also known as Rptor; associated with mTOR regulation) in myeloid cells of mice grafted with bone marrow from Raptor versus control Raptor littermates prevented the induction of atherosclerosis by ImP (Fig. 3i and Extended Data Fig. 50). These data show that ImP directly
activates an mTOR-dependent inflammatory response in myeloid cells, contributing to atherogenesis.

ImP drives atherosclerosis via IIR in myeloid cells

Since ImP contains an imidazole ring, we hypothesized that it could be sensed by the ubiquitously expressed imidazoline receptors IIR and . We thus treated BMDMs and MEFs with ImP in the presence of AGN192403 (I1R antagonist) or idazoxan (imidazoline receptor antagonist) . Since several imidazoline receptor ligands may also bind -adrenoceptors (for example, idazoxan), we included yohimbine (a -adrenoceptor antagonist with low affinity for imidazoline receptors) increased p-S6 and induced TNF in BMDMs and MEFs, and this effect was selectively blocked by AGN192403 (Extended Data Fig. 6a,b). Phosphoproteomic analysis further confirmed that AGN192403 inhibited ImP -induced mTOR pathway activation (Fig. 3h). Silencing of IIR by small inhibitory RNAs (siRNAs) targeting Nisch in MEFs blocked ImP-induced p-S6 and TNF production, revealing that ImP signals selectively through I1R for these inflammatory functions. Of note, AGN192403 prevented ImP-induced p-S6 or TNF in control siRNA-treated cells but had no effect in IIR-silenced cells, consistent with the selective effect of this inhibitor on the ImP-I1R axis (Extended Data Fig. 6c,d).
To further analyse the function of ImP in myeloid cells we mated Lyz2-cre mice with Nisch mice to generate Lyz24Nisch mice. Analysis of Nisch expression showed a selective deletion in spleen myeloid cells, in contrast to maintained expression in cells of isch mice compared with control Nisch mice (Extended Data Fig. 6e). Notably, ImP -driven induction of p-S6 and TNF production by BMDMs was fully dependent on Nisch (Extended Data Fig. 6f,g), confirming IIR as the host receptor. To determine whether blocking the ImP-IIR axis in myeloid cells would prevent the atherogenic effects of ImP, we administered ImP to Ldlr CD45.1 mice grafted with bone marrow from or isch mice. The absence of IIR in myeloid cells prevented ImP-induced atherosclerosis (Fig.4a and Extended Data Fig.6h).
To analyse the potential use of AGN192403 to prevent ImP-induced atherosclerosis we co-administered ImP and AGN192403 in drinking water to chow-fed Apoe mice for eight weeks. We observed that treatment with AGN192403 inhibited the formation of ImP-induced atherosclerotic plaques in both male and female mice (Fig. 4b and Extended Data Fig. 7a,b), without affecting total cholesterol or ImP concentration in plasma (Extended Data Fig. 7c,d). AGN192403 treatment prevented ImP-induced expansion of Ly6C monocytes and cells, production of proinflammatory cytokines, increase in circulating B and T cells and ImP-mediated p-S6 in peritoneal macrophages (Fig. 4c-e and Extended Data Fig. 7f). Moreover, AGN192403 treatment affected infiltration of immune cells in the aorta, by locally blocking the ability of ImP to increase the regulatory ( ) cell ratio (Fig. 4f and Extended Data Fig. 7g,h) and preventing ImP-induced infiltration of proinflammatory macrophages and B cells (Fig. 4g and Extended Data Fig. 7i,j). These results show that specific IIR deletion in myeloid cells and AGN192403 block ImP-induced atherosclerosis in chow-fed atherosclerosis-prone mice.

ImP-I1R blockade prevents atherosclerosis progression

To assess the capacity of the ImP-IIR axis inhibition to treat atherosclerosis, we fed mice chow or HC diets for eight weeks and treated or not with AGN192403 in the last four weeks of the HC diet. HC diet induced atherosclerosis and ImP production, and treatment with AGN192403 inhibited the progression of atherosclerosis in male and female mice, without affecting ImP concentration (Fig. 4 hand Extended Data Fig. 8a-c). Notably, this treatment also reduced plaque size, necrotic core extension and caspase-3 staining (Fig. 4i and Extended Data Fig. 8d), indicative of reduced plaque complexity in mice . Yet, this protective effect did not affect the increase in cholesterol concentration
Fig. 4 | Blockade of IIR prevents atherosclerosis induction by ImP or high-cholesterol diet. a, mice grafted with bone marrow from control Nisch (Ctrl, ) or Lyz2 Nisch (Ctrl, ) and fed chow diet for 12 weeks. Oil red O staining of aortic arch (left) and representative images of aorta (right). b-g, Chow-fed mice were treated as indicated. b, Oil red O staining of aortic arch (left) and representative images of aorta (right). Ctrl, AGN, . c, Left, Ly6C monocytes in blood at endpoint ( ). Right, representative density plots. d, IFN and TNF in plasma. . e, Left, p-S6 staining in peritoneal macrophages. Ctrl, ; AGN, . Right, representative histograms. f, Ratio of to cells infiltrated in aorta. cells infiltrated in aorta. , Left, individual data. Right, representative density plots.h-m, Apoe mice were fed a chow diet or HC diet for 8 weeks; AGN192403 was added to the HC group (HC + AGN) in the last 4 weeks.h, Oil red
O staining of aortic arch (left) and representative images of aorta (right). Chow, , Masson’s trichrome staining of aortic roots. Quantification of lesions in aortic roots (left), necrotic core area (middle) and representative images (right). Arrowheads indicate necrotic areas. Chow, . Scale bars, , Individual data (left) and representative density plots (right) for flow cytometry quantification of blood Ly6C monocytes ( ; chow, ; HC, ; HC + AGN, ) and T-bet cells ( ; chow, ; HC, ; HC ). I, Plasma IFN and TNF. Chow, ; HC, ; HC + AGN, . m, Individual data (left; chow, and representative histograms (right) for p-S6 staining in peritoneal macrophages. a-m, Individual data points and mean ± s.e.m. from at least two pooled independent experiments. One-way ANOVA with Tukey post hoc correction.
in mice fed the HC diet (Extended Data Fig. 8e). Moreover, AGN192403 treatment prevented HC diet-dependent induction of blood Ly6C monocytes, immunity and proinflammatory cytokines (Fig. 4j-1). The treatment also impaired HC diet-driven p-S6 induction in peritoneal macrophages (Fig. 4m). These results demonstrate that the administration of AGN192403, which inhibits the ImP-I1R axis, prevents atherosclerosis linked to immune cell activation without affecting
cholesterol concentration in plasma, suggesting a novel approach for atherosclerosis therapy.

Discussion

The complex aetiology of CVDs and the silent nature of atherosclerosis pose challenges to the detection of early stages of disease.
Previous studies have focused on associations of ImP and other microbiota-dependent metabolites with advanced stages of CVD or mortality . Specifically, ImP has been related to type 2 diabetes, cardiometabolic disease in people with HIV, coronary artery disease and heart failure . Here, we demonstrate that ImP is associated with atherosclerosis progression in mice and with subclinical active atherosclerosis in an otherwise healthy cohort, in whom atherosclerosis is detected solely through advanced imaging studies that are unavailable in the clinical practice for large population screenings . These findings were independently validated in an additional IGT cohort, despite differences in the median ImP concentration in the PESA cohort, further supporting the association between ImP and early atherosclerosis and suggesting its use as a companion diagnostic and therapeutic target for personalized medicine. Moreover, we demonstrate that ImP induces atherosclerosis without influencing blood cholesterol concentration. Proatherogenic effects of ImP can be pleiotropic and act on multiple cell types . We observed that administration of ImP induced local increase in transcriptional activity in macrophages, fibroblasts and-to a lesser extent-endothelial cells. These transcriptional changes were characterized by enhanced immune cell recruitment and inflammation, which could underlie the atherosclerosis-prone effect of ImP. In addition, ImP activated proatherogenic systemic innate and adaptive responses leading to increased infiltration by immune cells of aortic roots, contributing to atherosclerosis progression , which further correlates with clinical complications and unstable or vulnerable plaque . Although ImP administration does not affect glucose concentration, blood pressure and some renal and liver function parameters, we cannot rule out that other systemic effects could contribute to the pathology, which will have to be addressed in future studies.
We identify IIR as a receptor for ImP that induces p-S6 and proinflammatory cytokine production, consistent with mTOR activation in macrophages contributing to atherosclerosis . We find that ImP-induced atherosclerosis is fully dependent on IIR expression in myeloid cells. However, given the expression and transcriptional effects of ImP in other cell types that contribute to atherosclerosis (fibroblasts and endothelial cells), ImP may also affect these cells by boosting atherosclerosis . Pharmacological blockade of IIR inhibits atherosclerosis progression and the inflammatory response induced by ImP or HC diet, independently of changes in cholesterol concentration but dependent on mTOR blocking in macrophages. Notably, I1R blockade also reduced caspase-3 staining and necrotic core at the plaque as readouts for plaque complexity associated with active and unstable plaque , which could underlie its association with heart failure . Lipid-lowering therapy is currently used to prevent atherosclerosis progression. However, the rate of cardiovascular events remains high even in patients receiving appropriate lipid-lowering treatments . Although other therapies are available, they are not yet established for atherosclerosis treatment and are generally bound to established risk factors . Thus, we propose the ImP-I1R axis in myeloid cells as an independent target for atherosclerosis therapy that may potentially synergize with current treatments.

Online content

Any methods, additional references, Nature Portfolio reporting summaries, source data, extended data, supplementary information, acknowledgements, peer review information; details of author contributions and competing interests; and statements of data and code availability are available at https://doi.org/10.1038/s41586-025-09263-w.
4. Brandts, J. & Ray, K. K. Novel and future lipid-modulating therapies for the prevention of cardiovascular disease. Nat. Rev. Cardiol. 20, 600-616 (2023).
5. Ridker, P. M. et al. Antiinflammatory therapy with canakinumab for atherosclerotic disease. N. Engl. J. Med. 377, 1119-1131 (2017).
6. Nelson, K., Fuster, V. & Ridker, P. M. Low-dose colchicine for secondary prevention of coronary artery disease. J. Am. Coll. Cardiol. 82, 648-660 (2023).
7. Sabatine, M. S. et al. Evolocumab and clinical outcomes in patients with cardiovascular disease. N. Engl. J. Med. 376, 1713-1722 (2017).
8. Kaasenbrood, L. et al. Distribution of estimated 10 -year risk of recurrent vascular events and residual risk in a secondary prevention population. Circulation 134, 1419-1429 (2016).
9. Chakaroun, R. M., Olsson, L. M. & Bäckhed, F. The potential of tailoring the gut microbiome to prevent and treat cardiometabolic disease. Nat. Rev. Cardiol. 20, 217-235 (2023).
10. Nemet, I. et al. Atlas of gut microbe-derived products from aromatic amino acids and risk of cardiovascular morbidity and mortality. Eur. Heart J. 44, 3085-3096 (2023).
11. Witkowski, M., Weeks, T. L. & Hazen, S. L. Gut microbiota and cardiovascular disease. Circ. Res. 127, 553-570 (2020).
12. Nemet, I. et al. A cardiovascular disease-linked gut microbial metabolite acts via adrenergic receptors. Cell 180, 862-877.e22 (2020).
13. Martínez-López, M. et al. Microbiota sensing by Mincle-Syk axis in dendritic cells regulates interleukin-17 and -22 production and promotes intestinal barrier integrity. Immunity 50, 446-461.e9 (2019).
14. Wang, Z. et al. Gut flora metabolism of phosphatidylcholine promotes cardiovascular disease. Nature 472, 57-63 (2011).
15. Koh, A. et al. Microbially produced imidazole propionate impairs insulin signaling through mTORC1. Cell 175, 947-961.e17 (2018).
16. Royer, P. et al. Plasma proteomics for prediction of subclinical coronary artery calcifications in primary prevention. Am. Heart J. 271, 55-67 (2024).
17. Molinaro, A. et al. Imidazole propionate is increased in diabetes and associated with dietary patterns and altered microbial ecology. Nat. Commun. 11, 5881 (2020).
18. Koren, O. et al. Human oral, gut, and plaque microbiota in patients with atherosclerosis. Proc. Natl Acad. Sci. 108, 4592-4598 (2011).
19. Trøseid, M., Andersen, G. Ø., Broch, K. & Hov, J. R. The gut microbiome in coronary artery disease and heart failure: current knowledge and future directions. eBioMedicine 52, 102649 (2020).
20. Fernández-Friera, L. et al. Vascular inflammation in subclinical atherosclerosis detected by hybrid PET/MRI. J. Am. Coll. Cardiol. 73, 1371-1382 (2019).
21. Devesa, A. et al. Bone marrow activation in response to metabolic syndrome and early atherosclerosis. Eur. Heart J. 43, 1809-1828 (2022).
22. Ma, J., Luo, J., Sun, Y. & Zhao, Z. Cytokines associated with immune response in atherosclerosis. Am. J. Transl. Res. 14, 6424-6444 (2022).
23. Gold, E. S. et al. ATF3 protects against atherosclerosis by suppressing 25-hydroxycholesterol-induced lipid body formation. J. Exp. Med. 209, 807-817 (2012).
24. Wculek, S. K., Dunphy, G., Heras-Murillo, I., Mastrangelo, A. & Sancho, D. Metabolism of tissue macrophages in homeostasis and pathology. Cell. Mol. Immunol. 19, 384-408 (2022).
25. Chen, J. Y., Cortes, C. & Ferreira, V. P. Properdin: a multifaceted molecule involved in inflammation and diseases. Mol. Immunol. 102, 58-72 (2018).
26. Kiss, M. G. & Binder, C. J. The multifaceted impact of complement on atherosclerosis. Atherosclerosis 351, 29-40 (2022).
27. Kan, H. et al. Single-cell transcriptome analysis reveals cellular heterogeneity in the ascending aortas of normal and high-fat diet-fed mice. Exp. Mol. Med. 53, 1379-1389 (2021).
28. Zhao, G. et al. Single-cell transcriptomics reveals endothelial plasticity during diabetic atherogenesis. Front. Cell Dev. Biol. 9, 689469 (2021).
29. Gocheva, V., Chen, X., Peters, C., Reinheckel, T. & Joyce, J. A. Deletion of cathepsin H perturbs angiogenic switching, vascularization and growth of tumors in a mouse model of pancreatic islet cell cancer. Biol. Chem. 391, 937-945 (2010).
30. Shih, S.-C. et al. The L6 protein TM4SF1 is critical for endothelial cell function and tumor angiogenesis. Cancer Res. 69, 3272-3277 (2009).
31. Schneller, D. et al. Cytokine-like 1 is a novel proangiogenic factor secreted by and mediating functions of endothelial progenitor cells. Circ. Res. 124, 243-255 (2019).
32. Dyer, L. A., Pi, X. & Patterson, C. The role of BMPs in endothelial cell function and dysfunction. Trends Endocrinol. Metab. 25, 472-480 (2014).
33. Aiello, R. J. et al. Monocyte chemoattractant protein-1 accelerates atherosclerosis in apolipoprotein E-deficient mice. Arterioscler. Thromb. Vasc. Biol. 19, 1518-1525 (1999).
34. Wang, L., Lawrence, J. C., Sturgill, T. W. & Harris, T. E. Mammalian target of rapamycin complex 1 (mTORC1) activity is associated with phosphorylation of raptor by mTOR. J. Biol. Chem. 284, 14693-14697 (2009).
35. Bousquet, P., Hudson, A., García-Sevilla, J. A. & Li, J.-X. Imidazoline receptor system: the past, the present, and the future. Pharmacol. Rev. 72, 50-79 (2020).
36. Head, G. A. & Mayorov, D. N. Imidazoline receptors, novel agents and therapeutic potential. Cardiovasc. Hematol. Agents Med. Chem. 4, 17-32 (2006).
37. Zhang, X. et al. High-protein diets increase cardiovascular risk by activating macrophage mTOR to suppress mitophagy. Nat. Metab. 2, 110-125 (2020).
38. Molinaro, A. et al. Microbially produced imidazole propionate is associated with heart failure and mortality. JACC Heart Fail. 11, 810-821 (2023).
39. Zhu, W. et al. Gut microbial metabolite TMAO enhances platelet hyperreactivity and thrombosis risk. Cell 165, 111-124 (2016).
40. Wang, Z. et al. Gut microbiota, circulating inflammatory markers and metabolites, and carotid artery atherosclerosis in HIV infection. Microbiome 11, 119 (2023).
41. van Son, J. et al. Plasma imidazole propionate is positively correlated with blood pressure in overweight and obese humans. Nutrients 13, 2706 (2021).
42. Trøseid, M. et al. Gut microbiota alterations and circulating imidazole propionate levels are associated with obstructive coronary artery disease in people with HIV. J. Infect. Dis. 229, 898-907 (2024).
43. Nageswaran, V. et al. Gut microbial metabolite imidazole propionate impairs endothelial cell function and promotes the development of atherosclerosis. Arterioscler. Thromb. Vasc. Biol. 45, 823-839 (2025).
44. Wüst, R. C. I. et al. Emerging magnetic resonance imaging techniques for atherosclerosis imaging. Arterioscler. Thromb. Vasc. Biol. 39, 841-849 (2019).
45. Gimbrone, M. A. & García-Cardeña, G. Endothelial cell dysfunction and the pathobiology of atherosclerosis. Circ. Res. 118, 620-636 (2016).
46. Roy, P., Orecchioni, M. & Ley, K. How the immune system shapes atherosclerosis: roles of innate and adaptive immunity. Nat. Rev. Immunol. 22, 251-265 (2022).
47. Finn, A. V., Nakano, M., Narula, J., Kolodgie, F. D. & Virmani, R. Concept of vulnerable/ unstable plaque. Arterioscler. Thromb. Vasc. Biol. 30, 1282-1292 (2010).
48. Wolf, D. & Ley, K. Immunity and inflammation in atherosclerosis. Circ. Res. 124, 315-327 (2019).
49. Zhang, X. et al. Identification of a leucine-mediated threshold effect governing macrophage mTOR signalling and cardiovascular risk. Nat. Metab. 6, 359-377 (2024).
50. Lloyd-Jones, D. M. et al. 2017 focused update of the 2016 ACC expert consensus decision pathway on the role of non-statin therapies for LDL-cholesterol lowering in the management of atherosclerotic cardiovascular disease risk: a report of the American College of Cardiology Task Force on Expert Consensus Decision Pathways. J. Am. Coll. Cardiol. 70, 1785-1822 (2017).
51. Gupta, A. et al. Adverse events associated with unblinded, but not with blinded, statin therapy in the Anglo-Scandinavian Cardiac Outcomes Trial-Lipid-Lowering Arm (ASCOT-LLA): a randomised double-blind placebo-controlled trial and its nonrandomised non-blind extension phase. Lancet 389, 2473-2481 (2017).
Publisher’s note Springer Nature remains neutral with regard to jurisdictional claims in published maps and institutional affiliations.
Open Access This article is licensed under a Creative Commons Attribution-NonCommercial-NoDerivatives 4.0 International License, which permits any non-commercial use, sharing, distribution and reproduction in any medium or format, as long as you give appropriate credit to the original author(s) and the source, provide a link to the Creative Commons licence, and indicate if you modified the licensed material. You do not have permission under this licence to share adapted material derived from this article or parts of it. The images or other third party material in this article are included in the article’s Creative Commons licence, unless indicated otherwise in a credit line to the material. If material is not included in the article’s Creative Commons licence and your intended use is not permitted by statutory regulation or exceeds the permitted use, you will need to obtain permission directly from the copyright holder. To view a copy of this licence, visit http:// creativecommons.org/licenses/by-nc-nd/4.0/.
© The Author(s) 2025, modified publication 2025
¹Centro Nacional de Investigaciones Cardiovasculares Carlos III (CNIC), Madrid, Spain. Escuela de Doctorado, Universidad Autónoma de Madrid, Madrid, Spain. Escuela de Doctorado, Universidad Complutense de Madrid, Madrid, Spain. Institute for Biomedical Research Sols-Morreale (IIBM), Spanish National Research Council-Universidad Autónoma de Madrid, Madrid, Spain. Department of Biochemistry, School of Medicine, Universidad Autónoma de Madrid, Madrid, Spain. Hospital La Paz Institute for Health Research-IdiPAZ, Madrid, Spain. Mount Sinai Fuster Heart Hospital, Icahn School of Medicine at Mount Sinai, New York, NY, USA. CIBER de Enfermedades Cardiovasculares (CIBER-CV), Madrid, Spain. The Wallenberg Laboratory, Department of Molecular and Clinical Medicine, University of Gothenburg, Gothenburg, Sweden. Department of Clinical Genetics and Genomics, Sahlgrenska University Hospital, Gothenburg, Sweden. Department of Clinical Therapeutics, National and Kapodistrian University of Athens Medical School, Athens, Greece. School of Biomedical Engineering and Imaging Sciences, King’s College London, London, UK. Department of Physiology, School of Medicine, University of Patras, Patras, Greece. Inmunotek SL, Alcalá de Henares, Spain. Department of Pathology, University of Michigan Medical School, Ann Arbor, MI, USA. Department of Immunology, Instituto de Investigación Sanitaria del Hospital Universitario de La Princesa, Madrid, Spain. Department of Medicine, Universidad Autónoma de Madrid (UAM), Madrid, Spain. Centro de Metabolómica y Bioanálisis (CEMBIO), Facultad de Farmacia, Universidad San Pablo-CEU, Boadilla del Monte, Spain. Rogel Cancer Center, University of Michigan Medical School, Ann Arbor, MI, USA. Center for Infectious Disease Education and Research (CIDER), Osaka University, Osaka, Japan. Department of Cardiovascular Research, European Center for Angioscience (ECAS), Medical Faculty Mannheim, Heidelberg University, Mannheim, Germany. German Centre for Cardiovascular Research (DZHK), Partner Site Heidelberg/Mannheim, Mannheim, Germany. Department of Medicine VI, University Medical Centre Mannheim, Heidelberg University, Mannheim, Germany. Helmholtz-Institute for Translational AngioCardioScience (HI-TAC) of the Max Delbrück Center for Molecular Medicine in the Helmholtz Association (MDC), Heidelberg University, Mannheim, Germany. Department of Clinical Physiology, Sahlgrenska University Hospital, Gothenburg, Sweden. Novo Nordisk Foundation Microbiome Health Initiative, Technical University of Denmark, Kongens Lyngby, Denmark. National Food Institute, Technical University of Denmark, Kongens Lyngby, Denmark. The Zena and Michael A. Wiener Cardiovascular Institute, Icahn School of Medicine at Mount Sinai, New York, NY, USA. Health Research Institute, Fundación Jiménez Díaz, Universidad Autónoma de Madrid (IIS FJD-UAM), Madrid, Spain. These authors contributed equally: Annalaura Mastrangelo, Iñaki Robles-Vera. e-mail: dsancho@cnic.es

Methods

Mice

Mice were bred and maintained in groups of five animals per cage at the CNIC under specific pathogen-free conditions. We used proatherogenic background B6.129P2-Apoe mice (The Jackson Laboratory, strain 002052, Apoe ); B6.129S7-Ldlr /J mice (The Jackson Laboratory, strain 002207, Ldlr ) backcrossed with B6.SJL-Ptprc Pepc /BoyJ mice expressing the CD45.1 congenic marker (The Jackson Laboratory, strain 002014, B6 CD45.1); B6.129S7-Rag1 mice (The Jackson Laboratory, strain 002216, Rag1 ); B6.Cg-Rptor mice (The Jackson Laboratory, strain 013188, Rap ) were mated with B6.129P2-Lyz2 (cre)Ifo/J mice (The Jackson Laboratory, strain 004781, Lyz2-cre) to generate Lyz2 Raptor ( Cre ) and control Raptor (Cre ) littermates used as controls. Sperm from B6.Nisch /H mice (Mary Lyon Centre at MRC Harwell, UK;EM:08808) was used for in vitro fertilization of ROSA-Flpe mice (Gt(ROSA)26Sor to generate Nisch mice (tm1c). Nisch mice were mated with Lyz2-cre (B6.129P2-Lyz2 (cre)Ifo/J) mice to generate Lyz20Nisch ( ) and control Nisch (Cre-) littermates used as controls. Mice were 7- to 12-week-old at the initiation of experiments. Littermates of the same sex were randomly assigned to experimental groups. Investigators were blinded to group allocation during data collection and analysis to reduce bias. Animal studies were approved by the local ethics committee at CNIC, UAM and Comunidad de Madrid, PROEX 300.4/21 and PROEX 119.6/22. All animal procedures conformed to European Union Directive 2010/63EU and Recommendation 2007/526/EC regarding the protection of animals used for experimental and other scientific purposes, enforced by Spanish law under Real Decreto 53/2013. Mice were fed different diets, including chow, HC (10% fat, 0.75% cholesterol, SSNIFF S9167-E011) and HC/HC (HC + 1% choline, SSNIFF S9167-E016), as indicated in each experiment. per mouse per day, Biogen Cientifica BA-F-3185.0001) was administered in the drinking water. AGN192403 ( g per mouse per day, Labclinics B6583-10) was administered in the drinking water.

Antibiotic administration

For ablation of intestinal bacteria, an antibiotic cocktail of each of ampicillin (Normon), neomycin sulfate (Sigma Aldrich) and metronidazole (Sanofi), vancomycin (Normon) and sucralose (Sigma Aldrich) dissolved in water was used and replenished every three days as described .

Quantification of lesions in the aorta

For atherosclerotic lesion measurements, or male or female mice were fed a chow or high-cholesterol diet for 4,8 or 12 weeks, as indicated in each experiment. Blood was collected from submandibularly punctured mice. Next, mice were perfused with 10 ml phosphate buffered saline (PBS) via cardiac puncture to remove blood contamination from vascular tissue. The aortas were dissected and fixed in formaldehyde (PanReac, AppliChem) at room temperature overnight. Then, the exposed aortas were stained for lipid depositions with Oil Red O (Sigma Aldrich) prior en face assay assessment. In brief, after fixation, aortas were washed with isopropanol and stained for one hour with of Oil Red O. After two washing steps of 5 min with isopropanol , aortas were stored in PBS-azide 0.05%. Images were taken with Leica Nikon camera magnifier and atherosclerotic lesions in the aorta were quantified by calculating the ratio of the lesion area to the total surface area. This measurement was carried out using an automated method that quantifies lipid accumulation in the lesions by applying colour thresholding to the Oil red O-positive areas. The threshold was set by the researcher and remained consistent within the same staining batch, as described . Analysis of the images was performed using ImageJ software.

Aortic roots histology

Perfused hearts were fixed with formaldehyde for 48 h at room temperature. For paraffin sectioning, fixed hearts were incubated overnight in 70% ethanol and embedded in paraffin blocks. Four-micrometre sections of the aortic roots were cut and dried overnight at . The trichrome protocol used was a standard Masson’s trichrome protocol using Weigert’s haematoxylin for nuclei and light green as a collagen stain. Trichrome stain was used to analyse plaque and necrotic core (identified as unstrained regions inside plaque). T cell staining in the heart aortic roots was performed by immunohistochemistry using a CD3 antibody (Invitrogen, MA1-90582). Macrophage staining in the atheroma plaque was performed by immunohistochemestry using a MAC2 antibody (Invitrogen, 14-5302-85). Caspase-3 staining was carried out in the heart aortic roots using anti-caspase-3 antibody (Cell Signaling Technology, 9661). Staining was performed in an automated autostainer (Autostainer Plus, Dako). As secondary antibodies we used anti-rabbit (Dako Envision K4003) for CD3 and caspase-3 staining and rabbit anti-rat (Abcam Ab6734) for MAC2. The digitalized images were obtained using the Carl Zeiss Axio Scan Z1 scanner. Analysis of the images was performed using NDPview 2 and ImageJ software.

Caecal content collection

At the culling, the caecum was resected and rinsed with PBS to collect its contents, which were stored at until sample processing.

Serum analysis

Blood samples were obtained by cardiac puncture. The serum was collected after blood centrifugation at for 10 min and frozen at . Serum biochemical parameters were analysed with a Dimension RxL Max automated analyser the day after the extraction. Glucose and protein content were measured with Dimension RxL Max automated analyser.

LC-MS untargeted metabolomics

Materials. LC-MS grade acetonitrile was from Fluka Analytical; methanol and water were from Fischer Scientific; ethanol was from Merck and formic acid was from Honeywell Fluka.
Sample preparation. Plasma samples were prepared as described . In brief, proteins were removed by adding a cold mixture of methanol:ethanol (1:1, v/v) in a ratio (solvent:sample) and by storing the samples on ice for 20 min . Blank sample was prepared following the same extraction procedure, adding only the solvents to a 1.5 ml Eppendorf tube. Quality control samples (QCs) were prepared by pooling l plasma samples from independent mice and following the same extraction procedures. Samples, QCs and blank, were centrifuged at for and the supernatant was transferred in a 1.5 ml Eppendorf tube. Supernatants were subsequently dried-out in speedvac (Savant SPD131DDA concentrator, Savant RVT5105 refrigerated vapour trap and OFP400 vacuum pump, Thermo Fisher Scientific) for 2 h at room temperature. Before LC-MS analysis, the dried samples and QCs were resuspended in and of a mixture composed of acetonitrile: by constant shaking at for 10 min at and then centrifuged at for 5 min to remove insoluble material. The soluble part was placed in the insert of the LC-MS vial.
LC-MS analysis. Metabolomics untargeted analysis was performed using an Ultimate 3000 HPLC system consisting of a degasser, two binary pumps, and autosampler with thermostat, maintained at (Thermo Fisher Scientific) coupled to a LTQ Orbitrap XL Hybrid Ion Trap-Orbitrap Mass Spectrometer (Thermo Fisher Scientific). The samples were injected onto a Merck SeQuant ZIC-HILIC column , which was maintained thermostatically at ,
and metabolites were eluted at with solvent A composed of water with formic acid, and solvent B composed of acetonitrile with formic acid. The gradient started from to of B in 15 min , keeping constant for 3 min and returned to starting conditions in 0.1 min , finally by keeping the re-equilibration at of B for 11.9 min . Data were collected in positive ESI ion mode. The mass spectrometer operated in full scan mode from 70 to at 60,000 resolution. MS/MS spectra were collected in data-dependent mode via collision induced dissociation (CID) in the ion trap. Samples were analysed in a randomized order. QCs were analysed at the beginning, at the end and every six samples.
Data handling. Generated data were firstly aligned using Compound Discoverer (Thermo Fisher Scientific); signals were extracted and grouped into features (isotopic traces from a single analyte at a particular charge state) using the Metaboprofiler node in Compound discoverer (open source plug-in freely available from OpenMS; https://openms.de/) as described . Features were then filtered by presence keeping the entities that were present in at least of the samples from the same group. Missing values were imputed using the -nearest neigbours method or by limit of detection (LoD) (1/5 of the minimum positive value of each variable) according to the percentage of missing values of the feature within the group in MetaboAnalyst v. 5 (https://www.metaboanalyst.ca/MetaboAnalyst/home.xhtml) . Data were autoscaled and log-transformed. Metabolites were annotated by searching their accurate experimental mass against the Ceu Mass Mediator (http://ceumass.eps.uspceu.es/) and the resulting data matrix handled by Turboputative (https://proteomics.cnic.es/ TurboPutative/) . Identification of ImP was then confirmed by using the reference standard (Sigma Aldrich 77951) in a subsequent LC-MS/ MS analysis following higher-energy collisional dissociation by using 50 eV as collisional energy.

Flow cytometry analysis

For blood samples, single-cell suspensions were stained for 30 min at with LIVE/DEAD Fixable Aqua Dead Cell Stain Kit (Life Technologies). After washing with PBS, cells were stained in FACS buffer containing anti-CD16/32 (BioXcell),3% FBS and 0.05% EDTA with the corresponding antibody cocktail for 30 min on ice. Cells were stained with a cocktail of antibodies against CD45-APCCy7 (Biolegend), CD11b-BV605 (Biolegend), CD11c-BV650 (Biolegend), Ly6C-BV711 (Biolegend), LY6G-APC (BD Biosciences), CD8-PE (eBioscience), CD90-BV785 (BD Biosciences), MHCII-AF700 (Biolegend), B220-PerCP5.5 (Biolegend), SiglecH-FITC (eBioscience), CD4-PeCy7 (Biolegend). In another set of experiments, cells were stained with, CD45-APCCy7 (Biolegend), LY6G-V450 (BD Biosciences), CD11b-ef660 (eBioscience), CD11c-PE (Biolegend), B220-PerCP (Biolegend), CD90-UV805 (Fisher scientific), XCR1-BV785 (Biolegend), CD206-eF450 (Biolegend), MHCII-UV737 (BD Biosciences), F4/80-PerCp5.5 (Biolegend), Roryt-APC (Biolegend), T-bet-PECF594 (BD Biosciences), Ly6C-BV711 (Biolegend), CD86-PECy7 (Biolegend), FOXP3-FITC (Biolegend), CD4-BV570 (Biolegend). Cells were washed again and resuspended in FACS buffer for data acquisition using an LSRFortessa SORP (Becton Dickinson) or a FACSymphony (Becton Dickinson) flow cytometry equipment and analysed with FlowJo software version 10 (TreeStar). The gating strategies used for these analyses are detailed in Supplementary Fig. 1.
To perform flow cytometry analysis of cells infiltrating the aorta, mice were perfused with 10 ml PBS via cardiac puncture to remove blood contamination from vascular tissue. Aortas were kept in cold Dulbecco’s modified Eagle medium (DMEM) to be digested. Perivascular fat was removed and the thoracic aorta with arch was opened longitudinally and cut into smaller pieces that were incubated for 30 min at in a water bath in digestion buffer (Collagenase A( ), (Roche/Sigma 10103586001), Dispase II ( ), (Roche/Sigma 04942078001), DNase I (Roche/Sigma 10104159001)
elastase ( ) and Libersase TL ( 0.2 Wünsch units per ml , 5401119001)). After incubation time the digested tissue was mixed by pipetting, filtered through a strainer and spinned at 400 g 5 min at . Single cells were stained with a cocktail of antibodies against CD45-APCCy7 (Biolegend), CD11b-BV605 (Biolegend), CD11c-BV650 (Biolegend), Ly6C-BV711 (Biolegend), LY6G-APC (BD Biosciences), CD8-PE (eBioscience), CD90-BV785 (BD Biosciences), MHCII-AF700 (Biolegend), B220-PerCP5.5 (Biolegend), SiglecH-FITC (eBioscience), CD4-PeCy7 (Biolegend). Depending on the experimental setting, cells were stained with CD45-APCCy7 (Biolegend), LY6G-V450 (BD Biosciences), CD11b-ef660 (eBioscience), CD45-APCCy7 (Biolegend), LY6G-V450 (BD Biosciences), CD11b-ef660 (eBioscience), CD11c-PE (Biolegend), B220-PerCP (Biolegend), CD90-UV805 (Fisher scientific), XCR1-BV785 (Biolegend), CD206-eF450 (Biolegend), MHCII-UV737 (BD Biosciences), F4/80-PerCp5.5 (Biolegend), Roryt-APC (Biolegend), T-bet-PECF594 (BD Biosciences), Ly6C-BV711 (Biolegend), CD86-PECy7 (Biolegend), FOXP3-FITC (Biolegend), CD4-BV570 (Biolegend), CD31-PE (Biolegend) and VCAM-AF594 (Biotechne). Cells were washed and resuspended in FACS buffer for data acquisition using a LSRFortessa SORP (Becton Dickinson) or a FACSymphony (Becton Dickinson) flow cytometry equipment and analysed with FlowJo software version 10 (TreeStar). Gating strategies for cells, cells, and cells are shown in Supplementary Fig. 2, and those for macrophage subsets are shown in Supplementary Fig. 3.

Study populations

PESA cohort. This study was conducted in a subset of participants from the PESA study . The PESA-CNIC-Santander (NCT01410318) is an ongoing observational prospective cohort study of 4,184 asymptomatic employees of the Santander Bank in Madrid (from 40 to 54 years of age and free of known CVD at baseline in 2009). In addition to the exclusion criteria followed in the main study , participants taking antibiotics in the three months prior to the sample collection, with known type 2 diabetes or those treated for diabetes and/or intestinal disorders were excluded. This enabled us to remove possible confounding effects due to the role of ImP in diabetes and insulin resistance and the modification of gut microbiota possibly affecting the production of ImP. Subclinical atherosclerosis was assessed by imaging studies including 2D and 3D vascular ultrasonography of carotid and iliofemoral arteries and presence of coronary artery calcium assessed by CT scan, as previously described . Participants with subclinical atherosclerosis underwent a whole body F-FDG PET/ MRI study to characterize arterial F-FDG uptake and bone marrow metabolic activity, as described . The cardiovascular risk score used included the European Society of Cardiology SCORE (Systematic Coronary Risk Evaluation), which calculates 10 -year risk of fatal CVD . Fasting blood test included biochemistry and determination of hs-CRP. In this study, hypertension was defined as systolic and/ or diastolic and/or individuals taking antihypertensive drugs. Dyslipidaemia was defined as total cholesterol , LDL-cholesterol -cholesterol , or use of lipid-lowering drugs. Anthropometry and bioelectrical impedance analysis assessments were performed during the same appointment for each participant. Height and weight were measured using calibrated equipment (Tanita BC-545N,) with participants wearing underwear and barefoot. BMI was calculated as weight (in kg ) divided by height (in metres) squared. Extent of atherosclerosis was defined by a summed ordinal variable that is calculated by the number of affected vascular sites into a sum of total points as follows: (1) carotid atherosclerosis (points: 0 , no plaque; 1,1 plaque; 2,2 plaques; 3,3 or more plaques) as estimated by 3D vascular ultrasonography and summed for both left and right carotid artery; (2) femoral atherosclerosis (points: 0, no plaque;1,1 plaque;2,2 plaques;3,3 or more plaques) as estimated by 3D vascular ultrasonography and summed for both left and right femoral artery; (3) presence of calcification in the ascending or descending
aorta (points: 0, no;1, yes); (4) CAC score (points: 0, 0;1, 0.1-99;2, 100-399;3, 400-maximum). For the metabolomic analysis, peripheral blood samples collected after overnight fasting were centrifuged at at room temperature for 10 min to obtain plasma that was further aliquoted and stored at . For 16S rDNA amplicon gene sequencing analysis, faeces were collected in collection cups and immediately frozen at until further analysis. The institutional ethics committee approved the study protocol, and all participants were provided with written informed consent. Characteristics of the participants are listed in Supplementary Tables 1a,b and 3.
IGT cohort. To validate the findings from the PESA study, a subset of the IGT cohort was used (Ethics 560-13). Subject and method design from the validation cohort have been described elsewhere . In brief, the study population comprises men and women aged years from the Gothenburg area (Sweden), recruited on a random basis from the Swedish population register and included based on their glucose status. The applied exclusion criteria included: known diabetes, inflammatory diseases (for example, Crohn’s disease, ulcerative colitis or rheumatic diseases), treatment with steroids or immunomodulatory drugs, cancer (unless relapse free for the preceding five years), cognitive dysfunction, treatment for infectious diseases and with antibiotics in the past three months, inability to understand written and spoken Swedish as well as individuals born outside Sweden. The participants were invited by letter and gave all informed consent. Atherosclerosis was assessed by ultrasound imaging of carotid arteries, using a standardized protocol including a Siemens Acuson S2000 ultrasound scanner, and by presence of coronary artery calcium assessed by CT scan, as previously described . Systolic blood pressure was measured twice with an automatic device (Omron M10-IT, Omron Health Care Company) and the mean of the measurements was used. A questionnaire was used to collect detailed information on medication and family history. A venous blood sample was collected from participants after an overnight fast and was used for immediate biochemical analysis of glucose, glycated haemoglobin and total cholesterol. SCORE2 (systematic coronary risk evaluation) was calculated as described . Body weight, height, waist and hip circumference were measured on calibrated equipment with participants dressed in light clothing without shoes and according to current WHO recommendations. Extent of atherosclerosis was defined by a summed ordinal variable that is calculated by the number of affected vascular sites into a sum of total points as follows: (1) carotid atherosclerosis (points: 0, no plaque; 1, at least 1 plaque at either left or right carotid; 2, plaques at both vessels); (2) CAC score (points: 0, 0;1, 0.1-99; 2, 100-399; 3, 400-maximum). Characteristics of the participants are listed in Supplementary Table 2a,b.

Targeted metabolomics

Plasma levels of ImP, urocanic acid and histidine were quantified using ultra high-performance liquid chromatography (UHPLC) coupled to tandem mass spectrometry (LC-MS/MS). Analyses were performed in two different laboratories in Spain (PESA cohort) and in Sweden (IGT cohort). Both laboratories have used fully validated LC-MS/MS methods.
The determination of ImP in plasma samples from mice fed a chow or high-cholesterol diet with and without ger mouse per day) and/or AGN192403 ( per mouse per day) in the drinking water was carried out by following the method described below for the human study, specifically for the PESA cohort.
Working solutions and standards. For the PESA cohort, individual 1,000 ppm stock solutions of ImP (Sigma Aldrich 77951), urocanic acid (urocanic acid-1,2,3- , Sigma Aldrich, 709638) and histidine (L-histidine- hydrochloride monohydrate, Sigma Aldrich, 791318) were prepared in ultrapure water and stored at . Their respective dilutions were then prepared in methanol:ethanol (1:1, v/v) and stored at
. For the IGT cohort, histidine (histidine- , Cambridge Isotope Lab), ImP and urocanic acid (ImP- and urocanate- , Astra Zeneca) were prepared in acetonitrile.
Metabolite quantification. For the PESA cohort, of methanol: ethanol ( ) were added to of plasma sample and of isotopically labelled internal standards in methanol:ethanol (urocanic acid and histidine). Samples were vortex-mixed for 10 s and then centrifuged at for 20 min at . One-hundred microlitres of supernatant were taken and transferred to liquid chromatography vials for the analysis. Quantification of the metabolites was performed by using an UHPLC system 1290 Infinity series coupled to a triple quadrupole (QqQ) 6460 MS from Agilent Technologies. In brief, of the sample was injected onto an InfinityLab Poroshell 120 HILIC-Z column ( , Agilent Technologies) with a flow rate of . Mobile phase A contained 20 mM ammonium formate in ultrapure water at pH 3 , whereas mobile phase B contained 20 mM aqueous ammonium formate at pH 3 in acetonitrile: . The initial conditions at time 0 were , decreasing to at 11.5 min . The gradient was then increased to at time 12.0 min and held until the total run time of 15 min . Mass spectrometry data were acquired in positive ionization mode. Raw signals for multiple reaction monitoring transitions were checked and peaks corresponding to all the targeted compounds were integrated by MassHunter Quantitative B.10.00 (Agilent Technologies). Multiple reaction monitoring transitions (collision energy, eV ) were as follows: and for ImP;139 >121(10) and 139>93 (26) for urocanic acid; 142>124 (10) and (26) for labelled urocanic acid; and , for histidine; and and for labelled histidine. Quantification of ImP concentration was performed by generating a standard curve with known concentrations of this metabolite. Histidine and urocanic acid were instead quantified by using internal standards added to plasma samples as stated above. Metabolite standards were analysed alongside plasma samples using the LC-MS/MS method. Dilution of the plasma during sample preparation was also taken into account for quantification.
For the IGT cohort, determination of ImP, urocanate and histidine levels in plasma were performed as described previously with minor modifications . In brief, of plasma samples were extracted using 6 volumes of acetonitrile containing 100 nM of internal standards before drying the samples under a flow of nitrogen. Then, the samples were reconstituted with in 1-butanol, subjected to -butyl ester derivatization and finally reconstituted in water:acetonitrile , urocanate and histidine levels were determined by UHPLCMS/MS analysis using multiple reaction monitoring of the transitions and , respectively. For the internal standards, the transitions and were used. The analytical system consisted of an Acquity UPLC I-class system coupled to a Xevo TQ-XS triple quadrupole mass spectrometer (Waters). Sample volume was injected onto a C18 BEH column with particles, Waters) and separated using a gradient consisting of water with 0.1% formic acid (A-phase) and acetonitrile with 0.1% formic acid (B-phase). Quantifications were performed using a standard curve with known concentrations of ImP, urocanate and histidine.

DNA extraction, 16S rDNA amplicon sequencing and microbiota data analysis

For mice caecum samples, total DNA was extracted using the MasterPure Complete DNA & RNA Purification Kit (Epicentre) with some modifications, as previously described . DNA concentrations were normalized using a Qubit 2.0 Fluorometer (Life Technology) and specific amplicon of the 16S rDNA gene (V3-V4 region) was generated following the 16S Metagenomic Sequencing Library Preparation Illumina protocol. The multiplexing step was performed using Nextera XT Index Kit (Illumina) and PCR amplicon-product was checked on a
bioanalyzer DNA1000 chip (Agilent Technologies). The samples were pooled in equimolar amounts and sequenced with the MiSeq Reagent kit v.3, on a MiSeq Illumina platform (FISABIO sequencing service).
For human samples, faecal DNA was extracted using a commercially available kit (E.Z.N.A stool DNA kit, Omega Biotek) . Next, amplicon library of the V4 region within the 16S rDNA gene were generated and both ends of the fragments were sequenced using an Illumina MiSeq by the Microbiome Core of the University of Michigan .
In both studies, to rule out and control for potential reagent contamination, the reagents for DNA extraction and PCR amplification were also sequenced as controls. For data analysis of microbiota from mice and humans, the paired-end sequences were curated, binned into operational taxonomic units at identity level, and annotated with SILVA release using DADA2 for mice data and and RDP version 18 databases using Mothur (v.1.40.5) as previously described for human data. Spearman rank correlation coefficients between ImP level and bacterial abundance were determined using otu.association function of Mothur .

Dietary pattern assessment

Dietary intake data were collected via semi-quantitative 136-item food-frequency questionnaire validated for the Spanish population . Foods reported during the dietary assessment were classified into 44 food groups based on the similarity of nutrients profile, averaged over the days to derive habitual intake and normalized by the BMI of each participant. Next, a PCA was performed in SPSS V.23.0 (SPSS) to identify common underlying dimensions (factors or patterns) of food consumption by deriving factor loadings for each predefined food group. Factors were subsequently rotated using a Varimax procedure to maintain uncorrelated factors. Analysis of eigenvalues, scree plot, and the interpretability of the factor solution were used to support a final decision on retaining a 5-factor solution, where each factor had an eigenvalue . According to the observed factor loadings of the food groups, we named the first factor Mediterranean dietary pattern (enriched in vegetables, whole grains, and fish), the second and third factors as Breakfast dietary patterns (Breakfast1: enriched in cereals, tea, low fat dairy, and Breakfast2: mainly composed of bread, egg and coffee), and the fourth factor the Western dietary pattern (enriched in red meat, sugar, snacks and refined grains) and the fifth factor the Social dietary pattern (enriched in soft drinks and spirits).

scRNA-seq

Apoe -week-old male mice were treated in the drinking water with per mouse per day) for 4 or 8 weeks. Aortas were collected and digested as described above. To obtain enough cell numbers, three aortas per condition were pooled. Each sample was labelled with a cell multiplexing oligo (CMO) using the CMO labelling for scRNA-seq Protocol from 10X Genomics. Cells labelled with CMOs were washed, labelled with SytoxGreen and Hoechst to ensure cell viability, and live cells were sorted with a FACs Aria cell sorter. Samples were pooled and scRNA-seq was performed following the Chromium Next GEM Single Cell3’v.3.1 with feature barcode technology for cell multiplexing protocol(10x Genomics). In brief, cells were first counted and checked their viability using the Countess 3 cell counter (Thermofisher). Next, cells were loaded onto a 10X Genomics chip of the Chromium Controller (10X Genomics). After cDNA amplification, gene expression and CMO libraries were generated and sequenced using an Illumina NextSeq 2000 sequencer.
Raw sequencing data processing was performed from FASTQ file from each port using Cell Ranger (v.6.1.2) with default parameters and the mm10 (GRCm38.p6) mouse genome reference provided by 10 X Genomics. Obtained raw unique molecular identifier (UMI) count matrices of valid barcoded cells for each port were loaded into R (v.4.1.2) for further analyses using Bioconductor packages and Seurat (v.4.0.6) . First, cells were filtered out according to the total
number of UMI counts ( and ), total number of detected genes ( and ), and percentage of mitochondrial UMI counts ( ). Then, resulted cells were demultiplexed using the cellhash R R package (v.1.0.2) using htodemux, bff_cluster, gmm_demux, multiseq, and dropletutils methods. Consensus classification was used for further analyses. Once the final set of cells was obtained, transcriptional expression values were normalized to total UMI counts per cell multiplied by a scaling factor of 10,000 and natural log-transformed (NormalizeData function). Highly variable genes were defined using the VST method as implemented in Seurat setting. A total of 2,000 highly variable genes and PCA modelling was used to reduce this dimensional space after scaling log-transformed expression values. In this step, variability associated with total number of counts was regressed out using the ScaleData function with linear models. Elbow plot method was used to determine the number of principal components for downstream analyses ( 25 principal components). Then, cells were clustered using the Louvain algorithm and visualized using the uniform manifold approximation and projection for dimension reduction (UMAP) algorithm with the first 25 principal components as input. Main clusters were identified by using known markers and computing differentially expressed genes with Wilcoxon rank sum test using the presto R package (v.1.0.0) (Extended Data Fig. 4). Cell proportions were calculated for each condition in every cell population, and a two-proportions Z-test using the prop.test R function was used to determine significance.
Differential expression analyses between conditions were independently performed on every cell population comparing ImP vs control for each timepoint (4 or 8 weeks) using the MAST R package (v.1.20.0). Genes were ranked according to log fold changes, and resulting ranks were used as input for the fgsea R package along with the Hallmark gene sets from the Molecular Signature Data Base (MSigDB; https:// www.gsea-msigdb.org/gsea/msigdb). In order to identify specific cell subpopulations within every general cell type, each population was separated and independently analysed using the same workflow explained above. Subclusters were identified by using known markers and calculating differentially expressed genes with the presto R package. Finally, an overrepresentation analysis considering gene markers for every identified subcluster was performed along with the GO database (https://www.geneontology.org/) in order to interpret the transcriptional state of each subpopulation.

Cell lines

MAECs were isolated from mouse thoracic aortas as described . Cells were cultured in Medium 199 (Gibco, Invitrogen Life Technologies) fetal bovine serum + penicillin/streptomycin glutamine HEPES endothelial cell growth supplement Heparin , all from Sigma Aldrich, under at . MEF cell lines were isolated from 13.5 days post coitum from embryos using standard protocol. Each embryo was dissected into 10 ml of sterile PBS, voided of its internal organs, head, and legs. After 30 min incubation with gentle shaking at with trypsin, cells were plated in two 100 mm dishes and incubated for . To establish the immortalized MEF lines, early passage MEFs were seeded in 60 mm plates and infected with packaged retrovirus carrying the human papillomavirus (HPV) 16 E6/E7 genes. Selection was performed with of G418 during 10 days.
L929 cell line (ATCC CCL-1TM) used for production of the M-CSF supernatant, was grown on cell culture flasks (Stemcell) and resuspended in RPMI 1640 (Sigma) supplemented with heat-inactivated fetal calf serum (FCS, Sigma), 1 mM pyruvate (Lonza), non-essential aminoacids (Thermo Fisher Scientific), 2 mM l-glutamine, penicillin and streptomycin (all three from Lonza), herein called R10. Supernatants were obtained by filtering 15-days long cultures through Stericup Filter units (Merck Millipore) and were used to subsequently supplement the medium for the generation of BMDMs.
Mouse BMDMs were generated as described , with some modifications. Bone marrow cells from WT C57BL/6J mice were cultured in RPMI1640 supplemented with 30% M-CSF obtained from L929 cell line and 10% FBS, penicillin, streptomycin, 10 mM HEPES, 1 nM sodium pyruvate (all from Gibco) during 5 days in sterile, but not tissue culture-treated, Petri dishes.

Bulk RNA-seq

Cultured BMDMs, MEFs and MAECs were plated in equal number and rested overnight. Specifically, for BMDMs and MEFs, cells per well were plated in 6-well plates ( final volume, Corning), and for MAECs cells per well were plated in p24 ( final volume, Corning). Cells were treated in vitro with or without ImP for 1 or 2 h . Total RNA was isolated from BMDMs, MEFs (QIAamp DNA Mini Kit) and MAECs (miRNeasy Micro Kit). Bulk RNA-seq experiments were performed in the Genomics Unit of the CNIC. For the BMDM and MEF samples, RNA-seq libraries were prepared using the NEBNext Ultra II Directional RNA Library preparation kit (New England Biolabs) according to the manufacturer’s instructions. For MAECs samples, libraries were prepared using the NEBNext Single Cell/Low Input RNA Library Prep Kit for Illumina (New England Biolabs) according to the manufacturer’s instructions. All libraries were sequenced in a Nextseq 2000 (Illumina). FastQ files for each sample were obtained using bcl2fastq v. 22.20 software (Illumina). The number of reads per sample was between 11 and 21 million. Reads were preprocessed according to the type of library preparation using cutadapt to trim adapters and FastQC to assess read quality. In the case of directional RNA-seq reads (BMDMs and MEFs), Illumina adaptor sequences were removed, and only reads longer than 30 bp were kept as valid. For MAECs, in addition to Illumina adaptor sequences, adaptors from the low input NEBNext protocol were detected and removed and only reads longer than 30 bp were kept as valid. Resulting reads were mapped to the reference transcriptome GRCm38.102 using STAR and gene expression levels were estimated using RSEM . Further analyses were performed in R (v.4.3.2). In brief, counts per million were calculated, and size factors for inter-sample normalization were determined using the trimmed mean of M values method. Then, log-normalized data considering only genes with counts in 3 samples were used for differential expression analysis, making all possible comparisons within the same cell type using the DESeq2 R package . Gene-set enrichment analysis was performed using the fgsea R package comparing 1 h and 2 h after ImP stimulation with 0 h (unstimulated) within each cell type. Genes were ranked in each comparison according to , and fgsea was used along with the Hallmark gene sets from the Molecular Signature Data Base (MSigDB; https://www.gsea-msigdb.org/gsea/msigdb). Finally, normalized enrichment scores of significant selected pathways were represented as a heat map using the ComplexHeatmap R package .

Proteomics and phosphoproteomics by isobaric labelling

Cultured BMDMs and MEFs were plated at cells per well in 6 -well plates (Corning), 2 ml final volume, and rested overnight in RPMI 1% medium. Cells were treated in vitro with or without and co-incubated or not with AGN192403 ( antagonist) for 180 min . Cell culture monolayers were washed with PBS, and protein extracts were obtained with lysis buffer ( 50 mM Tris-HCl pH Tris-(2-carboxyethyl)phosphine (TCEP)) containing protease and phosphatase inhibitor cocktails (Complete Mini EDTA-free and phosSTOP, Roche). Samples were boiled for 5 min and incubated for 20 min at room temperature for solubilization and reduction of the proteins, and after centrifugation at for 15 min , supernatants were recovered, and protein concentration was determined by using a RC DC Protein Assay Kit (BioRad Laboratories).
Proteome and phosphoproteome analyses were carried out using 18-plex isobaric TMT labelling as described . Statistical analysis of
quantitative data was performed using , and the comparative analysis between conditions was performed using the normalized values and , which represent the binary logarithm of the ratio between the abundance in sample and its control for peptide and protein , respectively. GSEA using values of peptides was used to evaluate the phosphorylation levels in proteins of the mTOR signalling pathway among conditions (that is, cells stimulated with ImP versus unstimulated). In addition, a Wilcoxon signed rank test was performed using paired phosphopeptide abundance values to determine the effects of AGN192403 in the phosphorylation levels of the mTOR pathway among cells treated with ImP and co-incubated or not with AGN192403.

p-S6 staining by flow cytometry

Cultured MEFs and BMDMs were plated in equal numbers ( cells per well) in 6-well plates ( final volume, Corning) and rested overnight. Cells were treated in vitro with or without co-incubated with Rapamycin ( 10 nM ), AGN192403 ( antagonist), Idazoxan ( 0.29 nM , imidazoline receptor and -adrenergic antagonist) or Yohimbine ( antagonist). After 24 h , cells were collected and labelled with p-S6-PE antibody (Cell Signalling 5316) according to the manufacturer protocol and the activation was measured by flow cytometry.

Peritoneal macrophages collection

Peritoneum cells were isolated by lavage with 5 ml of cold PBS. Cells were plated and non-adherent cells were washed with PBS 1 h later. Adherent cells were defined as peritoneal macrophages, which were routinely controlled by flow cytometry. p-S6 staining by flow cytometry was assessed as described above.

TNF measurement

Cultured MEFs and BMDMs were plated in equal numbers ( cells per well) in 96 -well plates ( final volume, Corning) and rested overnight. Cells were treated in vitro with and without ImP ( ) and co-incubated with Rapamycin ( 10 nM ), AGN192403 ( antagonist), Idazoxan ( 0.29 nM , imidazoline receptor and antagonist) or Yohimbine ( antagonist). After 24 h , supernatant was collected, and TNF concentration was quantified with mouse TNF DuoSet ELISA (DY410) according to the manufacturer’s instructions.

MCP1 measurement

Cultured MEFs were plated ( cells per well) in 96-well plates ( final volume, Corning) and rested overnight. Cells were treated in vitro with and without . After 24 h supernatant was collected, and MCP1 concentration was quantified with mouse CCL2/JE/MCP1 DuoSet ELISA (DY479) according to the manufacturer’s instructions.

Transwell

Migration of circulating monocytes induced by MEFs was assessed in a transwell migration assay. Circulating monocytes from 8-week-old Apoe male mice were sorted (CD3 CD49 SIGL ). Initially, MEFs were placed on the lower chamber of the transwell with DMEM 1% FBS. Sorted monocytes were placed onto the upper chamber of the transwell with RPMI 1% FBS. MEFs were stimulated with . After 24 h , the medium under transwell was collected and cells in the supernatant were quantified using LSRFortessa SORP (Becton Dickinson).

Serum cytokines measure

Blood was collected as described above. Amount of TNF and IFN in the serum was measured according to the manufacturer protocol using mouse TNF DuoSet ELISA (DY410) and mouse IFN DuoSet ELISA (DY485), respectively.

ImP treatment in grafted mice

CD45.1 mice were lethally irradiated with two doses of 550 rad (5.5 Gy), separated by at least 3 h , for a total radiation dose of 1,100 rad, followed by intravenous injection of bone marrow cells from CD45.2+ Raptor or control Raptor littermates. In parallel experiments, -adrenoceptor cells from or control C57BL/6J wild-type mice were transferred. In another set of experiments, CD45.1 mice were lethally irradiated as described above followed by intravenous injection of bone marrow cells from CD45.2 Lyz2 Nisch or control Nisch littermates. Grafted mice were injected with of cefovecin subcutaneously to prevent infection upon bone marrow graft. Upon reconstitution of bone marrow after days, mice were treated or not with per mouse per day, Biogen Cientifica BA-F-3185.0001) for 12 weeks in the drinking water.

I1R siRNA silencing

I1R silencing in vitro was performed using Nisch siRNA (Santa Cruz sc-61202), a pool of 3 target-specific 19-25 nt siRNAs designed to knock down Nisch gene expression or control siRNA (Santa Cruz sc-36869) consisting of a scrambled sequence conjugated to 10-20 fluorescein that does not lead to the specific degradation of any cellular mRNA. Cultured MEFs were plated ( cells per well) in a 6-well tissue culture plate in 2 ml of antibiotic-free normal growth medium supplemented with FBS. After 24 h , cells were washed with siRNA Transfection Medium (Santa Cruz sc-3686860) and siRNA duplex solution (A + B) was added after mixing by pipetting and incubating the mixed solution for 30 min at room temperature (A: 60 pmol siRNA into siRNA Transfection Medium; B: of siRNA Transfection Reagent (Santa Cruz sc-29528) into siRNA Transfection Medium). MEFs were incubated with the mixed solution. After 5 h transfection, medium was removed and 2 ml of RMPI 10% FBS with antibiotics was added. After 24 h , cells were treated in vitro with and without and co-incubated or not with AGN192403 antagonist).

Quantitative PCR with reverse transcription

To determine Nisch expression, spleen cells were sorted as CD45 CD11b and cells, and RNA extracted with the RNeasy Mini Kit and reverse transcribed using the High-Capacity cDNA Reverse Transcription Kit with random hexamers following manufacturer’s instructions. Quantitative PCR was performed using the GoTaq qPCR Master Mix in a 7900 HT Fast Real-Time PCR System. The sequence of primers used for qPCR were: Nisch sense 5′-TATGTTGTGGCACAGAAGATGG-3′; anti-sense -TTCAGGCAATGGATAGTGGAT-3′; Gapdh sense 5′-TG AAGCAGGCATCTGAGGG-3′; anti-sense 5′-CGAAGGTGGAAGAGTG GGAG-3′.

Statistics

Data analysis was carried out using GraphPad Prism software v.9.0 (GraphPad Software) and Stata version 18 (StataCorp). Variables were presented as mean ± s.e.m or mean ± s.d. unless otherwise stated. The Kolmogorov-Smirnov test and Shapiro-Wilk normality test were used to determine the normal distribution of samples. Nominal variables were presented as percentages and frequencies. Comparisons between two groups were performed using two-tailed unpaired Student’s -tests (normal distribution) or Mann-Whitney -tests (non-normal distribution) for continuous variables or Fisher exact test for categorical variables. Unless otherwise stated, comparisons across multiple groups were assessed using one-way ANOVA (normal distribution) followed by Tukey’s post hoc test, or Kruskal-Wallis test (non-normal distribution) followed by Dunn’s test as indicated in each figure legend. Continuous variables were compared across tertiles of ImP by ANOVA or non-parametric Kruskall Wallis tests as appropriate, whereas nominal variables by applying the Cohran-Armitage test (dichotomous variables) and the Jonckheere-Terpstra test (ordinal variable) for trend.
Only significant differences are indicated. For untargeted metabolomics data, values were corrected with a Benjamini-Hochberg post hoc method ( ) and supervised (PLS-DA) analyses were applied to select the variables responsible for the separation showed by models in MetaboAnalyst (https://www.metaboanalyst.ca/MetaboAnalyst/ home.xhtml) (Fig. 1b,c). The models were statistically validated by cross-validation tool, using the leave-1/3-out approach to exclude model overfitting.
For the human cohorts (PESA and IGT), no sample size calculation was conducted, as samples were retrospectively collected from observational studies. Instead, sample sizes were determined based on the availability of well-characterized patients with complete clinical, imaging, and biosamples from ongoing prospective observational studies. The cohorts were assembled with the goal of maximizing biological and phenotypic depth rather than targeting a predefined effect size. The inclusion of two independent cohorts with complementary phenotypes enabled replication and validation across datasets. Post hoc power considerations indicated that the sample size of the derivation cohort (PESA cohort, ) was adequately powered at the 0.85 level to detect a minimum 5 nM difference in ImP levels between the group of individuals without atherosclerosis and individuals with atherosclerosis. A ratio of 1:3 between patients without and with atherosclerosis was selected to reflect the distribution of atherosclerosis in the PESA cohort, and measures of dispersion (s.d.) were derived from the group of participants without atherosclerosis in the PESA cohort. Respectively, the IGT cohort was adequately sized to detect with 0.85 power a difference of 2 nM in ImP levels between participants without and with atherosclerosis. Power considerations were based on the Mann-Whitney test for two independent groups. Type I error was prespecified at 0.05 for power calculations. Power analysis was performed with G*Power 3.1.9.6 (University of Kiel, Germany). Restricted cubic splines (natural splines, RCS) with three knots across ImP distribution were applied to produce dose-response curves and to flexibly model the potential non-linear association of continuous ImP with the main endpoints, as previously described . In both cohorts, the three knots for RCS were fixed at the 10th, 50th and 90th percentile of the ImP distribution. Number of knots was selected on the basis of improvement in log likelihood among regression models with 3 – or 4 -knot RCS. To enhance visual clarity, plots with RCS were truncated at values exceeding the 95th percentile of the ImP distribution. We evaluated the non-linear relationships of ImP with log odds ratio of the main atherosclerosis outcomes by examining (Wald test) the non-linear terms (RCS) . Dose-response curves in both cohorts were controlled for a set of confounders, constructed by combining LASSO regression and variables with biological plausibility. LASSO for logistic regression was used for multivariable model selection with respect to the outcome presence of atherosclerosis. Adaptive LASSO with cross-validation was employed to select the value of the LASSO penalty parameter lambda . Adjusted differences in levels of ImP across groups of interest were estimated by multivariable linear regression analysis. To evaluate the association between ImP levels and the presence and activity of atherosclerosis within the PESA cohort multinomial logistic regression was performed and the model was adjusted on a set of confounders (age, sex, smoking status, fasting glucose, hs-CRP and haemoglobin concentration) based on previous evidence . The proportional odds assumption was tested with the Brant Wald test. Correlation analysis of ImP, atherosclerosis traits and risk factors, gut microbiome and dietary patterns was investigated using non-parametric Spearman’s test and the resulting values corrected with a Benjamini-Hochberg post hoc method ( ). Finally, the discriminatory capability of ImP for prevalence of subclinical or active atherosclerosis on top of traditional risk factors, including LDL-cholesterol and hs-CRP, was assessed by comparing area under the curve from corresponding receiver operating characteristic analysis. Areas under the curve were compared using the DeLong test . Bootstrapping with 1,000 replicates was used to derive
bias-corrected confidence interval. All tests were two-tailed and the level of statistical significance was pre-specified at .

Reporting summary

Further information on research design is available in the Nature Portfolio Reporting Summary linked to this article.

Data availability

Metabolomics data are deposited in the Metabolomics workbench (ST003928, ST003929, ST003932 and ST003938). The bulk RNA-seq and scRNA-seq data generated in this study are available in the NCBI GEO database under BioProject IDs GSE297831 and GSE298392, respectively. The proteomics and phosphoproteomics data have been deposited to the ProteomeXchange Consortium via the PRIDE partner repository with the dataset identifier PXD063955. Source data are provided with this paper.
52. Rakoff-Nahoum, S., Paglino, J., Eslami-Varzaneh, F., Edberg, S. & Medzhitov, R. Recognition of commensal microflora by toll-like receptors is required for intestinal homeostasis. Cell 118, 229-241 (2004).
53. Centa, M., Ketelhuth, D. F. J., Malin, S. & Gisterå, A. Quantification of atherosclerosis in mice. J. Vis. Exp. https://doi.org/10.3791/59828 (2019).
54. Mastrangelo, A. et al. Insulin resistance in prepubertal obese children correlates with sex-dependent early onset metabolomic alterations. Int. J. Obes. 40, 1494-1502 (2016).
55. Lorenzo, C. et al. ALDH4A1 is an atherosclerosis auto-antigen targeted by protective antibodies. Nature 589, 287-292 (2021).
56. Pang, Z. et al. Using MetaboAnalyst 5.0 for LC-HRMS spectra processing, multi-omics integration and covariate adjustment of global metabolomics data. Nat. Protoc. 17, 1735-1761 (2022).
57. Gil-de-la-Fuente, A. et al. CEU Mass Mediator 3.0: a metabolite annotation tool. J. Proteome Res. 18, 797-802 (2019).
58. Barrero-Rodríguez, R. et al. TurboPutative: a web server for data handling and metabolite classification in untargeted metabolomics. Front. Mol. Biosci. 9, 952149 (2022).
59. Fernández-Ortiz, A. et al. The Progression and Early detection of Subclinical Atherosclerosis (PESA) study: rationale and design. Am. Heart J. 166, 990-998 (2013).
60. Sanguinetti, E. et al. Microbiome-metabolome signatures in mice genetically prone to develop dementia, fed a normal or fatty diet. Sci. Rep. 8, 4907 (2018).
61. Caruso, R., Ono, M., Bunker, M. E., Núñez, G. & Inohara, N. Dynamic and asymmetric changes of the microbial communities after cohousing in laboratory mice. Cell Rep. 27, 3401-3412.e3 (2019).
62. Kozich, J. J., Westcott, S. L., Baxter, N. T., Highlander, S. K. & Schloss, P. D. Development of a dual-index sequencing strategy and curation pipeline for analyzing amplicon sequence data on the MiSeq Illumina sequencing platform. Appl. Environ. Microbiol. 79, 5112-5120 (2013).
63. Callahan, B. J. et al. DADA2: high-resolution sample inference from Illumina amplicon data. Nat. Methods 13, 581-583 (2016).
64. Schloss, P. D. et al. Introducing mothur: open-source, platform-independent, communitysupported software for describing and comparing microbial communities. Appl. Environ. Microbiol. 75, 7537-7541 (2009).
65. de la Fuente-Arrillaga, C., Ruiz, Z. V., Bes-Rastrollo, M., Sampson, L. & Martinez-González, M. A. Reproducibility of an FFQ validated in Spain. Public Health Nutr. 13, 1364-1372 (2010).
66. Amezquita, R. A. et al. Orchestrating single-cell analysis with Bioconductor. Nat. Methods 17, 137-145 (2020).
67. Hao, Y. et al. Integrated analysis of multimodal single-cell data. Cell 184, 3573-3587.e29 (2021).
68. Boggy, G. J. et al. BFF and cellhashR: analysis tools for accurate demultiplexing of cell hashing data. Bioinformatics 38, 2791-2801 (2022).
69. Toral, M. et al. Carnitine palmitoyltransferase-1 up-regulation by PPAR- prevents lipid-induced endothelial dysfunction. Clin. Sci. 129, 823-837 (2015).
70. Garaude, J. et al. Mitochondrial respiratory-chain adaptations in macrophages contribute to antibacterial host defense. Nat. Immunol. 17, 1037-1045 (2016).
71. Dobin, A. et al. STAR: ultrafast universal RNA-seq aligner. Bioinformatics 29, 15-21 (2013).
72. Li, B. & Dewey, C. N. RSEM: accurate transcript quantification from RNA-seq data with or without a reference genome. BMC Bioinformatics 12, 323 (2011).
73. Love, M. I., Huber, W. & Anders, S. Moderated estimation of fold change and dispersion for RNA-seq data with DESeq2. Genome Biol. 15, 550 (2014).
74. Gu, Z., Eils, R. & Schlesner, M. Complex heatmaps reveal patterns and correlations in multidimensional genomic data. Bioinformatics 32, 2847-2849 (2016).
75. Romero-Becerra, R. et al. activation alters cardiac electrical activity and predisposes to ventricular arrhythmia. Nat. Cardiovasc. Res. 2, 1204-1220 (2023).
76. Rodríguez, J. M. et al. iSanXoT: a standalone application for the integrative analysis of mass spectrometry-based quantitative proteomics data. Comput. Struct. Biotechnol. J. 23, 452-459 (2024).
77. Subramanian, A. et al. Gene set enrichment analysis: a knowledge-based approach for interpreting genome-wide expression profiles. Proc. Natl Acad. Sci. USA 102, 15545-15550 (2005).
78. Stamatelopoulos, K. et al. Amyloid- and mortality in patients with non-ST-segment elevation acute coronary syndrome. Ann. Intern. Med. 168, 855-865 (2018).
79. Stamatelopoulos, K. et al. Cathepsin S levels and survival among patients with non-ST-segment elevation acute coronary syndromes. J. Am. Coll. Cardiol. 80, 998-1010 (2022).
80. Wald, A. Sequential tests of statistical hypotheses. Ann. Math. Stat. 16, 117-186 (1945).
81. Hastie, T., Tibshirani, R. & Wainwright, M. Statistical Learning with Sparsity: The Lasso and Generalizations (Chapman & Hall, 2015).
82. DeLong, E. R., DeLong, D. M. & Clarke-Pearson, D. L. Comparing the areas under two or more correlated receiver operating characteristic curves: a nonparametric approach. Biometrics 44, 837-845 (1988).
Acknowledgements The authors thank M. C. Collado for mouse gut microbiota analysis; M. O. Garmendia for assistance with the metadata from volunteers; members of the D.S. laboratory for help with discussions and critical reading of the manuscript; and the CNIC facilities, foremost the animal, cellomics, histology, metabolomics, genomics, microscopy, clinical trial and bioinformatics facilities, and personnel for assistance. I.R.-V. is funded by FJC2021-048099-I funded by MCIN/AEI/10.13039/501100011033 and European Union NextGenerationEU/PRTR. D.M. is funded by grant PRE2020-092578 MCIN/AEI/10.13039/ 501100011033. M.G. is funded by beca de formación de profesorado Universitario fellowship 20/01418. M.F.-M. is funded by INPhINIT Retaining 2024 from Caixa Foudation LCF/BQ/ DR24/12080010. A.R.-U. is supported by Community of Madrid (PIPF-2022/SALGL-24581). R.B.-R. is funded by Beca de Formación de Profesorado Universitario Fellowship 20/03365. A. Devesa is scientifically supported by the Thrasher Research Fund and acknowledges the support of Sociedad Española de Cardiología (grant SEC/PRS-MOV-INT2O/OO2). Work in the D.S. laboratory is funded by the CNIC; the European Union’s Horizon 2020 Research and Innovation Program under grant agreement ERC-2016-Consolidator Grant 725091; Ministerio de Ciencia, Innovación y Universidades (MICIU) PID2022-137712OB-I00, CPP2021-008310 and CPP2022-009762 MICIU/AEI/10.13039/501100011033 Agencia Estatal de Investigación, Unión Europea NextGenerationEU/PRTR; Comunidad de Madrid (P2O22/BMD-7333 INMUNOVAR-CM); Scientific Foundation of the Spanish Association Against Cancer (AECC- PRYGN246642SANC); Worldwide Cancer Research WWCR-25-0080; European Union ERC-2023-PoC; a research agreement with Inmunotek S.L.; and la Caixa Foundation (LCF/PR/HR23/52430012 and LCF/PR/HR22/52420019). Work in the B.I. laboratory is supported by the European Commission (H2O2O-HEALTH 945118 and ERC-CoG 819775); the PID2022-140176OB-IOO, PID2019-107332RB-IOO MCIN/AEI /10.13039/501100011033; and the Comunidad de Madrid RENIM P2022/BMD-7403. F.B. is funded by grants from the Swedish Heart Lung Foundation (20240882) and is a Wallenberg Fellow and recipient of an ERC-Advanced grant 2022 (101096705-IMPACT). K. Stellos was supported by the Deutsche Forschungsgemeinschaft (DFG, German Research Foundation – Project ID 394046768 – SFB1366 ‘Vascular control of organ function’ C07), the European Research Council (ERC) under the European Union’s Horizon 2020 research and innovation programme (MODVASC, grant agreement 759248), the German Centre for Cardiovascular Research (DZHK) and the Helmholtz-Institute for Translational AngioCardioScience (HI-TAC) of the Max Delbrück Center for Molecular Medicine in the Helmholtz Association (MDC) at Heidelberg University, Heidelberg, Germany. Metabolomics Workbench is supported by NIH grant U2C-DK119886 and OT2-ODO30544 grants. The CNIC is supported by the Instituto de Salud Carlos III (ISCIII), the MICIU and the Pro CNIC Foundation, and is a Severo Ochoa Center of Excellence (CEX2020-001041-S funded by MICIU/AEI /10.13039/501100011033). The PESA study is funded by the CNIC and Santander Bank. This study was partially funded by an intramural grant CNIC-Severo Ochoa to B.I. and D.S.
Author contributions A.M., I.R.-V. and D.S. conceptualized and designed the study. A.M., I.R-V., D.M., J.A.-I., S.M.-C., V.N., I.F.-L., N.I., A.B., M.G., M.R.-T., M.F.-M., A.R.-U., R.B.-R., J.A.L., S.I., K.R.B. and V.A.-H. performed the experiments and analysed the data. A.C., K.R.B., S.I., A.F., I.F.-L., A. Dopazo, C.B., J.V., G.N., F.B., E.P., A.G.-M., D.C. and F.S.-M. supported the experiments and provided equipment and reagents. V.F., B.I., A. Devesa, M.L.-G., G.B. and A.G. developed clinical cohorts, including recruitment of patients, and assisted in the analysis of their results. K. Stamatelopoulos and K. Stellos contributed to data interpretation and provided conceptual input during manuscript revision. G.G. conducted the cohort study analyses and together with A.M., K. Stamatelopoulos and K. Stellos interpreted the human findings. D.S. and B.I. acquired funding. D.S. supervised the project. A.M., I.R.-V. and D.S. wrote the manuscript with input from all of the authors. All authors edited and approved the final manuscript.
Competing interests F.B. receives research funding from Biogaia AB and Novo Nordisk A/S, is co-founder and shareholder of Roxbiosens Inc., and is on the scientific advisory board of Bactolife A/S. F.B., K.R.B. and A.C. are co-founders and shareholders of Implexion Pharma AB. A.M., I.R.-V., D.S., B.I., V.F. and D.M. are inventors on a patent application titled Antagonists of the I1R for use in the Prevention and/or Treatment of an Autoinflammatory or Autoimmune Disease, publication number WO2O25002914 (2025). The other authors declare no competing interests.

Additional information

Supplementary information The online version contains supplementary material available at https://doi.org/10.1038/s41586-025-09263-w.
Correspondence and requests for materials should be addressed to David Sancho. Peer review information Nature thanks Soraya Taleb and the other, anonymous, reviewer(s) for their contribution to the peer review of this work. Peer reviewer reports are available.
Reprints and permissions information is available at http://www.nature.com/reprints.
Extended Data Fig. 1| High cholesterol diets and antibiotics modulate gut microbiota and plasma metabolites in Apo mice. a, Experimental setup corresponding to Fig. 1 and Extended Data Fig.1.ApoE mice were fed different diets (chow, high cholesterol (HC), HC and high choline (HC/HC)) for 8 weeks. At 4 weeks post diet initiation, mice were treated or not with a cocktail of antibiotics (abx) in the drinking water. At sacrifice, aorta, heart, cecal content and plasma samples were collected and analysed. b, Stacked barplots showing the relative abundance of 16S rDNA sequences, at the genus level ( of total abundance), that are significantly different in cecal samples of the indicated groups. Genera shown are all significantly different between chow and HC diets by two-sided Kruskal-Wallis with Dunn’s correction test. .
c, Relative abundance of TMAO in plasma measured by untargeted LC-MS. .d, Correlation of TMAO’s relative abundance with aortic arch lesion. Correlation coefficient ( R ) and p -value are calculated as the Pearson’s parametric correlation test. (chow and and ). e, Tandem mass spectrometry fragmentation by higher-energy collisional dissociation (HCD) using 50 eV as collisional energy of the imidazole propionate (lmP) standard (left) and endogenous mass from plasma of mice fed different diets as indicated.b-d, data are pooled from two independent experiments. c, Arithmetic mean ± SEM of each group is shown. Two-sided one-way ANOVA with Tukey post-hoc correction.
Extended Data Fig. 2 | Metabolic and dietary features of asymptomatic volunteers from the PESA and IGT cohorts. a, Plasma concentration of histidine and urocanic acid in healthy subjects (CTR) and subjects with subclinical atherosclerosis (AT) from the PESA cohort (left, CTR n=105, AT n=295, plasma concentration for both metabolites) and the IGT cohort (right, CTR n = 529, AT , plasma concentration for both metabolites). Data on a base-10 Log scale. Median with interquartile range for each group is shown. ns: non-significant. b, Radar graph of loadings factors for each dietary pattern. c, ROC analysis for the additive value of ImP over LDL-C alone to discriminate subclinical total AT (left and center) and active AT (right). Left, PESA cohort: AUC (CI: 0.524-0.639) vs. AUC (CI: 0.488-0.590), AUC (CI: 0.01 . Center, IGT cohort: (CI:0.535-0.590) vs. (CI: 0.508-0.565), (CI:0.014-0.05) . Right, active AT: AUC , (CI: 0.554-0.659) vs. AUC (CI: analysis for the additive value of ImP on the top of high-sensitivity C Reactive Protein (hs-CPR) to discriminate early AT (left and center) and active AT (right). Left, PESA
cohort: AUC (CI:0.525-0.651) vs. AUC (CI:0.501-0.532), (CI 0.014-0.133, . Center, IGT cohort: (CI:0.530-0.584) vs. (CI:0.10-0.552), (CI:0.06 . Right, active , (CI: ) vs. AUC (CI:0.501-0.536), AUC (CI 0.054-0.155) p = 0.00042 . e, Schematic representation of the distribution of volunteers from the PESA study. Based on multiterritorial/multimodal imaging (i.e.2D/3D vascular ultrasound and non-contrast computed tomography), we classified 295 participants with subclinical atherosclerosis and 105 controls without atherosclerosis (green). Subjects with subclinical atherosclerosis were further stratified according to their uptake of Fluorodeoxyglucose ( F-FDG): those without any uptake considered as inactive atherosclerosis (FDG , yellow); those with metabolic activity in bone marrow (FDG + _BM, n = 40), arteries (FDG +_A, n = 57), or in both compartments (FDG +_SYS, n = 124) considered as active atherosclerosis (FDG + ,red). Pictures are representative images of uptake in arteries and bone marrow.
Extended Data Fig. 3 | The induction of atherosclerosis by ImP supplementation in chow-fed atherosclerosis-prone mice is independent of changes in cholesterol and glucose concentration. a,b, Chow-fed mice were administered ImP (ImP) or not (CTR) in the drinking water for 12 weeks, followed by sacrifice and analysis. a, Oil red O en face staining of the aorta showing quantification of atherosclerotic lesions in whole aorta (left) and representative images (right). , Total cholesterol and glucose concentration in plasma. CTR , Chow-fed mice were treated with ImP or not (CTR) in the drinking water for 8 weeks. c, Masson’s trichrome staining of the aortic roots showing quantification of lesion area (left) and representative images (right). . Bar size . d, Quantification of atherosclerotic lesions by Oil red O en face staining of the aorta showing quantification in aorta (left), aortic arch (middle) and
representative images of aorta (right). CTR=17; , Total cholesterol ( ) and glucose concentration ( ) in plasma. , HC-fed mice were administered or not (CTR) in the drinking water for 12 weeks, Oil red en face staining of the aorta showing quantification of atherosclerotic lesions in aorta (left) and representative images (right). n =9.g, HC-fed Apoe mice were administered ImP ( ImP ) or not (CTR) in the drinking water for 4 weeks, followed by sacrifice and analysis Oil red O en face staining of the aorta showing quantification of atherosclerotic lesions in aorta (left) and representative images (right). , Individual data and mean ± SEM from at least two pooled independent experiments. a,b,c,e,g, Two-tailed unpaired Student’s t test.d, Two-tailed Mann-Whitney U test.f, One-tailed unpaired Student’s t test.
Extended Data Fig. 4 | Increased ImP in circulation induces atherosclerosis and systemic inflammation in chow-fed atherosclerosis-prone mice.
a-k, Chow-fed mice were administered ImP for 4 or 8 weeks as indicated. a, Numbers of ROR in CD4 cells in blood at sacrifice. Left: . Right: representative density plots for CTR (top) and ImP (bottom). b,c UMAP embeddings of whole aorta-derived cells profiled by scRNAseq colored by cell type, regardless of treatment duration (b) and by treatment and time (c). d, Dot plot of cell type markers used to identify main cell populations.e, UMAP embedding (left) and cell proportions (right) labelled by cell type of whole aortaderived cells based on transcriptomic profiles from chow-fed mice after 4 weeks of administration. , Quantification of atherosclerotic lesions by Oil red O en face staining of the aorta, showing quantification in whole aorta (left), aortic arch (middle) and representative images (right) following 4 weeks of ImP administration. CTR = 10; ImP=8.g-i, Numbers of circulating Ly6C monocytes cells, cells and Macrophages CTR after 4 weeks of ImP administration
determined by flow cytometry.i, Total numbers of CD45 cells, CD90 T cells and cells infiltrated in aorta after 8 weeks of ImP administration by flow cytometry analysis. ; . , Staining of cells in intima/media layer in aortic roots showing quantification (left) and representative images (right) of infiltrated T cells after 8 weeks of ImP administration. CTR = 11; . Bar size . k, MAC2 staining inside atheroma plaque showing area quantification (left) and representative images (right) after 8 weeks of ImP administration. ; , Bar size was administered (ImP) or not (CTR) to mice grafted with BM from WT (CTR ) or Rag1 and fed chow diet for 12 weeks. Quantification of atherosclerotic lesions by Oil red O en face staining of the aorta, showing quantification in whole aorta. f-I, Individual data and mean ± SEM from at least two pooled independent experiments. a, f(left),h-k, Two-tailed Unpaired Student’s t test.f(right), g, h(left), Two-tailed Mann-Whitney Utest.I, One-way ANOVA with Tukey post-hoc correction.
Extended Data Fig. 5|See next page for caption.

Article

Extended Data Fig. | ImP induces transcriptional changes in fibroblasts, macrophages and endothelial cells. a-g, Chow-fed mice were administered ImP and the aorta-derived cells from the scRNAseq were analysed.a-c, Dot plot of expression levels of cell type markers used to identify cell subclusters for macrophages (MFs) (a), fibroblasts (FBs) (b), and endothelial cells (ECs) (c). d-f, Table of representative gene ontology (GO) terms enriched in the subclusters of MFs (d), FBs (e) and ECs (f). All shown GO terms are significant (adjusted p-value ). g, Relative abundance (log-ratio) of the subcluster cell proportions comparing ImP treatment vs CTR, regardless of the treatment duration.h, MCP1 concentration measured by ELISA in the supernatant of MEFs treated with ImP for 24 h. n = 10. i, Number of post-migration monocytes collected in the bottom chamber in response to supernatant from (h) and quantified by flow cytometry. , Heat map of gene set enrichment analysis (GSEA) from RNAseq analysis of bone marrow-derived macrophages (BMDMs), mouse embryonic fibroblasts (MEFs) and mouse aortic ECs (MAECs) comparing ImP stimulation after 1 h and 2 h vs unstimulated conditions within each cell type. k, GSEA enrichment plots of phosphopeptides related to the mTOR pathway from BMDMs (top) and MEFs (down) after ImP treatment for 180 min compared with unstimulated cells. Global abundances of all peptides related to the mTOR pathway were used for the analysis.1,m, BMDMs (left) and MEFs
(right) after ImP stimulation for 24 h with or without rapamycin co-incubation. 1, Flow cytometry staining for pS6 ribosomal protein. Left:BMDMn = 8; MEF CTR = 10; ImP=10; ImP + AGN = 9; Right: representative histograms for CTR (top), ImP (middle) and ImP + rapamycin (bottom). m,TNF production measured by ELISA. BMDM ; MEF , Flow cytometry staining for pS 6 in peritoneal macrophages harvested from chow-fed mice administered ImP for 8 weeks. Left: . Right: representative histograms for CTR (top), ImP (bottom). . was administered (ImP) or not (CTR) to Ldlr mice grafted with BM from control Raptor or Raptor ; ) and fed chow diet for 12 weeks. Quantification of atherosclerotic lesions by Oil red en face staining of the aorta, showing quantification in whole aorta.a-c, Wilcoxon rank sum test comparing cell clusters. Adjusted p-value< , Two-proportions Z-test.h,i, Data are pooled from n = 7 independent experiments.h, Two-tailed Unpaired Student’s t test. i, Two-tailed Mann-Whitney Ut test.j, Kolmogorov Smirnov test. k, Nominal p-values were calculated using a 1000-permutation test. 1,m,o, Individual data (each one represent an independent experiment) and mean ± SEM. One-way ANOVA with Tukey post-hoc correction. n, Individual data and mean ± SEM of at least two pooled independent experiments. Two tailed unpaired Student’s t test between CTR and ImP. .
Extended Data Fig. 6 | Imidazoline-1 receptor mediates functional responses that are induced by ImP. a,b, Bone marrow-derived macrophages (BMDMs) and mouse mouse embryonic fibroblasts (MEFs) were treated in vitro with ImP (or not, CTR) and co-incubated with AGN192403 (AGN, I1R antagonist), Idazoxan (IR and adrenoreceptor ( ) antagonist) or Yohimbine ( antagonist). a, Flow cytometry staining for pS6 (left, n=10) and representative histograms (right) corresponding to each treatment matched by color.b, TNF production in 24 h culture supernatant by ELISA (BMDMs: CTR medium , ImP+idazoxan=7, ImP+yohimbine=7; MEF: for all groups).c,d MEFs were transfected with IIR siRNA (siNisch) or control siRNA (siCTR) and stimulated with ImP or not (CTR) and co-incubated or not with AGN192403 (AGN) as indicated.c, Flow cytometry staining for pS6, showing quantification of percentage of pS6 positive cells (left, ) and representative histograms (right) corresponding to each treatment indicated and matched by color. d, TNF production in 24 h culture supernatant by ELISA. and splenic cells were isolated to analyse Nisch mRNA relative expression by qRT-PCR.CD11b Nisch Lyz2 ANisch ; CD3 Nisch Nisch BMDMs were generated from Nisch or
Lyz2 Nisch mice and treated or not (CTR) with ImP in vitro.f, Flow cytometry staining for pS 6 , showing quantification of percentage of pS 6 positive cells (left) and representative histograms (right) corresponding to each treatment matched by color. Nisch CTR ,Nisch ImP , Lyz2 NischCTR , Lyz2 Nisch , TNF production in 24 h culture supernatant by ELISA. Nisch CTR = 5, Nisch , Lyz Nisch CTR , Lyz Nisch . h. ImP was administered (ImP) or not (CTR) to mice grafted with BM from control or Nisch and fed chow diet for 12 weeks. Quantification of atherosclerotic lesions in the aorta by Oil red O en face staining of the aorta. a,b, Arithmetic mean ± SEM and individual data from biological replicates. One-way ANOVA with Tukey post-hoc correction. c,d, Arithmetic mean ± SEM and individual data from pooled independent experiments. One-way ANOVA with Tukey post-hoc correction. e, Arithmetic mean ± SEM and individual data from biological replicates. Two tailed unpaired Student’s t test between Nisch and Nisch. f,g, Arithmetic mean SEM and individual data. One-way ANOVA with Tukey post-hoc correction.h, One-way ANOVA with Tukey post-hoc correction Nisch (CTR = 17, ImP=20) or Lyz2 Nisch (CTR = 19 ). In all panels, n indicates biological replicates.
Extended Data Fig. 7 | Inhibition of the ImP/I1R axis with AGN192403 prevents ImP-induced immune and inflammatory response without affecting circulating ImP and cholesterol concentration. a-i, ImP was administered (or not, CTR) in the presence of AGN192403 (AGN) or not (ImP) in drinking water to mice fed chow diet for 8 weeks, followed by sacrifice and analysis. a, Oil red en face staining of the aorta showing quantification of atherosclerotic lesions in whole aorta in male mice. CTR=15; ImP=17; . , Oil red en face staining of the aorta showing quantification of atherosclerotic lesions in whole aorta (left), aortic arch (middle) and representative images (right) in female mice. CTR . c, Total cholesterol concentration in plasma. Male mice (left), CTR=14;
, and female mice (right), . d, Imidazole Propionate concentration in plasma of male mice at sacrifice. CTR AGN . e, f, Number of T-bet in CD4 T cells. (e), and CD90 and B220 cells (f) in blood at sacrifice by flow cytometry. CTR = 9; AGN and Number of aorta infiltrated T-bet Th1. CTR=9; and FoxP3 Treg cells CTR AGN (h), B220 B cells. (i) and F4/80 Cd11c cells. CTR ; ImP ; AGN ( ) by flow cytometry. , Right: representative density plots for CTR (top), ImP (middle) and ImP + AGN (bottom). , Arithmetic mean ± SEM and individual data from at least two pooled independent experiments. One-way ANOVA with Tukey post-hoc correction.
Extended Data Fig. 8 | Inhibition of the ImP/I1R axis with AGN192403 prevents HC-induced atherosclerosis without affecting circulating ImP and cholesterol concentration. a-e, mice were fed a chow diet or high cholesterol (HC) diet for 8 weeks. At 4 weeks post-diet initiation, AGN192403 was administered (AGN) or not in the drinking water to mice fed HC diet until week 8, followed by sacrifice and analysis.a, Oil red O en face staining of the aorta in male mice showing quantification of atherosclerotic lesions in the whole aorta. Chow=15; HC=14; HC+AGN=13.b, ImP concentration in plasma of male mice at sacrifice. Chow . c , Oil red O en face
staining of the aorta in female mice showing quantification of atherosclerotic lesion in the whole aorta (left), aortic arch (middle) and representative images (right). Chow . d, Caspase 3 staining of aortic roots. Quantification of caspase-3+ (left) and representative images of caspase-3 staining (right). Bar size . . e, Total cholesterol concentration in plasma in male (left), , and female mice (right), Chow , at sacrifice. a-e, Arithmetic mean and individual data from at least two pooled independent experiments. One-way ANOVA with Tukey post-hoc correction.

natureportfolio

Corresponding author(s):
David Sancho
Last updated by author(s): Jun 3, 2025

Reporting Summary

Nature Portfolio wishes to improve the reproducibility of the work that we publish. This form provides structure for consistency and transparency in reporting. For further information on Nature Portfolio policies, see our Editorial Policies and the Editorial Policy Checklist.

Statistics

For all statistical analyses, confirm that the following items are present in the figure legend, table legend, main text, or Methods section.
n/a
Confirmed

The exact sample size for each experimental group/condition, given as a discrete number and unit of measurement

A statement on whether measurements were taken from distinct samples or whether the same sample was measured repeatedly

The statistical test(s) used AND whether they are one- or two-sided
Only common tests should be described solely by name; describe more complex techniques in the Methods section.

A description of all covariates tested

A description of any assumptions or corrections, such as tests of normality and adjustment for multiple comparisons

A full description of the statistical parameters including central tendency (e.g. means) or other basic estimates (e.g. regression coefficient) AND variation (e.g. standard deviation) or associated estimates of uncertainty (e.g. confidence intervals)

For null hypothesis testing, the test statistic (e.g. ) with confidence intervals, effect sizes, degrees of freedom and value noted Give values as exact values whenever suitable.
□ For Bayesian analysis, information on the choice of priors and Markov chain Monte Carlo settings

□ For hierarchical and complex designs, identification of the appropriate level for tests and full reporting of outcomes

□ Estimates of effect sizes (e.g. Cohen’s , Pearson’s ), indicating how they were calculated
Our web collection on statistics for biologists contains articles on many of the points above.

Software and code

Policy information about availability of computer code
Data collection
Untargeted metabolomics data was collected by an Ultimate 3000 HPLC system coupled to a LTQ Orbitrap XL Hybrid Ion Trap-Orbitrap Mass Spectrometer. Targeted metabolomics data was collected for ImP quatification for APOEKO mice and for the PESA cohort by an HPLC system 1290 Infinity series coupled to a triple quadrupole 6460 MS, whereas for the IGT cohort by Acquity UPLC I-class system coupled to a Xevo TQXS triple quadrupole mass spectrometer. Fluorescence-Activated Cell Sorting data was collected by LSRFortessa SORP (Becton Dickinson) or a FACSymphony (Becton Dickinson). 16S rRNA amplicon sequencing data was collected by MiSeq Illumina platform. Single-cell and bulk RNA data was collected by Illumina NextSeq 2000 sequencer. Proteomics and phosphoproteomics data was collected by liquid chromatography with tandem mass spectrometry (LC-MS/MS) using Q Exactive HF Orbitrap MS. Other data were collected with Microsoft Excel 2019.
Data analysis
Heatmap and all charts were generated using GraphPad Prism software v.9.0 (GraphPad Software, San Diego, CA). SPSS version 23.0 and Stata version 18 (StataCorp LP, College Station, TX) were used for statistical analysis. Partial least squares discriminant analysis (PLS-DA) and receiver operating characteristic (ROC) analyses were performed in MetaboAnalyst V5 (https://www.metaboanalyst.ca/MetaboAnalyst/ home.xhtml) and Stata. The Kolmogorov-Smirnov test and Shapiro-Wilk normality test were used to determine the normal distribution of samples. Nominal variables were presented as percentages and frequencies. Comparisons between two groups were performed using twotailed unpaired Student’s t-tests (normal distribution) or Mann-Whitney U-tests (non-normal distribution) for continous variables or Fisher exact test for categorical variables. Unless otherwise stated, comparisons across multiple groups were assessed using one-way ANOVA (normal distribution) followed by Tukey’s post hoc test, or Kruskal-Wallis test (non-normal distribution) followed by Dunn’s test as indicated in each figure legend. Continuous variables were compared across tertiles of ImP by ANOVA or non-parametric Kruskall Wallis tests as appropriate, whereas nominal variables by applying the Cohran-Armitage test (dichotomous variables) and the Jonckheere-Terpstra test (ordinal variable) for trend. Restricted cubic splines (natural splines, RCS) with 3 knots across ImP distribution were applied to produce a doseresponse curves and to flexibly model the potential nonlinear association of continuous ImP with the main endpoints, as previously described (PMID: 29799975; PMID: 36049808). In both cohorts, the 3 knots for RCS were fixed at the 10th, 50th and 90th percentile of the ImP
nature portfolio | reporting summary April2023
distribution. Number of knots was selected on the basis of improvement in log likelihood among regression models with 3 – or 4 -knot RCS. To enhance visual clarity, plots with RCS were truncated at values exceeding the 95th perecentile of the distribution. We evaluated the nonlinear relationships of ImP with log odd ratio (OR) of the main atherosclerosis outcomes by examining (Wald test) the non-linear terms (RCS). Dose-response curves in both cohorts were controlled for a set of confounders, constructed by combining LASSO regression and variables with biological plausibility. LASSO for logistic regression was used for multivariable model selection with respect to the outcome presence of atherosclerosis. Adaptive LASSO with cross validation was employed to select the value of the lasso penalty parameter lambda. Adjusted differences in levels of ImP across groups of interest were estimated by multivariable linear regression analysis. To evaluate the association between ImP levels and the presence and activity of atherosclerosis within the PESA cohort multinomial logistic regression was adjusted on a set of confounders (i.e. age, sex, smoking status, fasting glucose, high-sensitivity C Reactive Protein (hs-CRP), and hemoglobin concentration) based on previous evidence (PMID: 35567559)). The proportional odds assumption was tested with the Brant Wald test. The discriminatory capability of ImP for prevalence of subclinical or active atherosclerosis on top of traditional risk factors, including LDL-cholesterol and highsensitive C Reactive Protein, was assessed by comparing Area(s) Under the Curve (AUC) from corresponding Receiver Operating Characteristic (ROC) analysis. AUCs were compared using the DeLong test (PMID: 3203132). Bootstrapping with 1,000 replicates was used to derive bias-corrected confidence interval (CI) around AUCs.All tests were two tailed and the level of statistical significance was pre-specified at P<0.05.
For untargeted metabolomics data: generated data was firstly aligned using Compound Discoverer (ThermoFisher Scientific); signals were extracted and grouped into features (isotopic traces from a single analyte at a particular charge state) using the Metaboprofiler node in Compound discoverer (the open source plug-in freely available from OpenMS, http://www.openms.de/downloads/). For targeted metabolomics data: Raw signals for multiple reaction monitoring (MRM) transitions were checked and peaks corresponding to all the targeted compounds were integrated by MassHunter Quantitative B. 10.00 (Agilent Technologies).
For 16S rRNA gene sequencing analysis from both mice and human samples, the paired-end sequences were curated, binned into operational taxonomic units at >97% identity level, and annotated with SILVA release v. 132 using DADA2 for mice data and v. 138 and RDP version 18 databases using Mothur (v.1.40.5) for human data.
For dietary pattern assessment a factor analysis was performed in SPSS V.23.0 (SPSS Inc., Armonk, NY, USA) to identify common underlying dimensions (factors or patterns) of food consumption by deriving factor loadings for each predefined food group. Factors were subsequently rotated using a Varimax procedure to maintain uncorrelated factors. Analysis of eigenvalues, scree plot, and the interpretability of the factor solution were used to support a final decision on retaining a 5 -factor solution, where each factor had an eigenvalue .
For single-cell RNA seq data raw sequencing data processing was performed from FASTQ file from each port using Cell Ranger (v6.1.2) with default parameters and the mm 10 (GRCm38.p6) mouse genome reference provided by 10x Genomics. Obtained raw unique molecular identifier (UMI) count matrices of valid barcoded cells for each port were loaded into (v4.1.2) for further analyses using Bioconductor packages and Seurat (v4.0.6). Cells were clustered using the Louvain algorithm for modularity optimization using KNN graph as input and visualized using the Uniform Manifold Approximation and Projection for Dimension Reduction (UMAP) algorithm with the first 25 principal components as input. Main clusters were identified by using known markers and calculating differentially expressed genes with Wilcoxon-rank sum test using presto R package (v1.0.0)). Cell proportions were calculated for each condition and time point in every cell population, and a two-proportions Z-test using the prop.test() R function was chosen to determine significance. Differential expression analyses between conditions were performed using the MAST R package (v1.20.0). Genes were ranked according to the calculated logFCs, and resulting ranks were used as input for the FGSEA algorithm along with the Hallmark gene sets from the Molecular Signature Data Base (MSigDB; https:// www.gsea-msigdb.org/gsea/msigdb). Finally, overrepresentation analysis was performed along with the GO database (www.geneontology.org/).
For RNA-seq resulted reads were mapped to the reference transcriptome GRCm38.102 using STAR25 and gene expression levels were estimated using RSEM26. Further analyses were performed in (v 4.3.2). In brief, counts per million (CPM) were calculated, and size factors for inter-sample normalization were determined using the trimmed mean of M values (TMM) method. Then, log-normalized data considering only genes with counts in three samples were used for differential expression analysis, making all possible comparisons within the same cell type using the DESeq2 R package. Gene-set enrichment analysis was performed using the fgsea R package comparing 1 h and 2 h after ImP stimulation with Oh (unstimulated) within each cell type. Genes were ranked in each comparison according to logFC, and fgsea was used along with the Hallmark gene sets from the Molecular Signature Data Base (MSigDB; https://www.gsea-msigdb.org/gsea/msigdb). Finally, normalized enrichment scores of significant selected pathways were represented as a heatmap using the ComplexHeatmap R package. Proteome and phosphoproteome analyses were accomplished using 18-plex isobaric TMT labeling as described previously. The statistical analysis of quantitative data was made using iSanXoT, and the comparative analysis between conditions was performed using the normalized values and , which represent the binary logarithm of the ratio between the abundance in sample and its control for peptide and protein q , respectively. Gene Set Enrichment Analysis (GSEA) using values of peptides was employed to evaluate the phosphorylation levels in proteins of the mTOR signalling pathway among conditions (i.e. cells stimulated with ImP vs unstimulated). In addition, a Wilcoxon Signed Rank Test was performed using paired phosphopeptide abundance X_p values to determine the effects of AGN192403 in the phosphorylation levels of the mTOR pathway among cells treated with ImP and co-incubated or not with AGN192403.
For manuscripts utilizing custom algorithms or software that are central to the research but not yet described in published literature, software must be made available to editors and reviewers. We strongly encourage code deposition in a community repository (e.g. GitHub). See the Nature Portfolio guidelines for submitting code & software for further information.

Data

Policy information about availability of data

All manuscripts must include a data availability statement. This statement should provide the following information, where applicable:
  • Accession codes, unique identifiers, or web links for publicly available datasets
  • A description of any restrictions on data availability
  • For clinical datasets or third party data, please ensure that the statement adheres to our policy
Metabolomics data are deposited in Metabolomics workbench (ST003928, ST003929, ST003932 and ST003938). The bulk RNA-seq and scRNA-seq data generated in this study are available in the NCBI GEO database under BioProject IDs GSE297831 and GSE298392, respectively. The proteomics and phosphoproteomics data have been deposited to the ProteomeXchange Consortium via the PRIDE partner repository with the dataset identifier PXD063955. Source data are provided with this paper.
nature portfolio | reporting summary April 2023

Research involving human participants, their data, or biological material

Policy information about studies with human participants or human data. See also policy information about sex, gender (identity/presentation), and sexual orientation and race, ethnicity and racism.

Reporting on sex and gender

Reporting on race, ethnicity, or other socially relevant groupings

Population characteristics

The current study is focused on subclinical atherosclerosis and explore the blood concentration of imidazole propionate, urocanic acid and histidine in middle-aged asymptomatic participants ( years). Considering the delayed onset of subclinical atherosclerosis that is approximately 10 years later in women (PMID: 34543072 and PMID: 25882487), our cohort included 400 participants of which 310 ( , by sex) were male participants. The information regarding the sex of each participant was collected by self-reporting via a questionnaire. These data are indicated in Extended Data Table 1a and 2b and Table 3.
The IGT cohort that was used to validate the results in an independent cohort comprises men and women aged 50-64 years from the Gothenburg area (Sweden). In this case the cohort included 1844 participants of which , by sex), were male participants thus including an higher the percentage of women. The participants were recruited on a random basis from the Swedish population register and information regarding the sex of each participant was collected by self-reporting via a questionnaire. These data are indicated in Extended Data Table 2a and 2b.
This study was conducted in a subset of participants from the PESA study (Progression of Early Subclinical Atherosclerosis), an ongoing observational prospective cohort study of caucasian asymptomatic employees of the Santander Bank in Madrid (PMID: 34238438). The information regarding race and other socially relevant groupings of each participant was collected by self-reporting via a questionnaire and was not used as exclusion factor. In the IGT study, the population includes men and women aged 50-64 years from the Gothenburg area (Sweden), recruited on a random basis from the Swedish population register. Among the exclusion criteria, cognitive dysfunction and inability to understand written and spoken Swedish as well as subjects born outside Sweden were included.
This study was conducted in a subset of participants ( ) from the PESA-CNIC-Santander. Based on multiterritorial/ multimodal imaging (i.e. 2D/3D vascular ultrasonography and non-contrast computed tomography), we classified 295 participants with subclinical atherosclerosis and 105 controls without atherosclerosis. Extent of atherosclerosis was defined according to the number of affected vascular sites and the coronary artery calcium (CAC) score. Subjects with subclinical atherosclerosis were further stratified by Fluorodeoxyglucose (18F-FDG) uptake and bone marrow activation in: inactive atherosclerosis (FDGneg, ), arterial 18 F-FDG uptake (FDG+_A, ), bone marrow activation (FDG+_BM, ), and both arterial uptake and bone marrow activation (FDG+_SYS, ) as indicatives of metabolically active atherosclerosis (FDG+, ). Detailed population characteristics and group allocation are presented in Extended Data Table 1a,b and Table 3 and Extended Data Fig. 2c.
The IGT study population is composed of men and women aged 50-64 years from the Gothenburg area (Sweden), recruited on a random basis from the Swedish population register and included based on their glucose status. The applied exclusion criteria included: known diabetes, inflammatory diseases (e.g. Crohn’s disease, ulcerative colitis, rheumatic diseases), treatment with steroids or immunomodulatory drugs, cancer (unless relapse free for the preceding 5 years), cognitive dysfunction, treatment for infectious diseases and with antibiotics in the past three months, inability to understand written and spoken Swedish as well as subjects born outside Sweden.
Atherosclerosis in the carotid arteries was assessed by ultrasound imaging using a standardized protocol including a Siemens Acuson S2000 ultrasound scanner and by presence of coronary artery calcium assessed by CT scan. Systolic blood pressure (SBP) was measured twice with an automatic device (Omron M10-IT, Omron Health care Co, Kyoto, Japan) and the mean of the measurements was used. A questionnaire was used to collect detailed information on medication and family history. A venous blood sample was collected from participants after an overnight fast and was used for immediate biochemical analysis of glucose, glycated haemoglobin and total cholesterol. SCORE2 (Systematic Coronary Risk Evaluation) was calculated as previously. Body weight, height waist and hip circumferences were measured on calibrated equipment with subjects dressed in light clothing without shoes and according to current WHO recommendations. Characteristics of the participants are listed in Extended Data Table 2,b.
Participants were recruited following the inclusion criteria of the main PESA-CNIC-Santander study (NCT01410318, https:// clinicaltrials.gov/ct2/show/NCT01410318). Exclusion criteria included those previously used for the main study and those that could affect imidazole propionate production or associations previously described (e.g. type 2 diabetes): 1. Active treatment for inflammation or cardiovascular disease. 2. Participants with family history inflammatory illness 3. Active treatment for cancer, history of transplant with active immunosuppressive or immunomodulator treatment. 4. Employees who are pregnant or breast-feeding. 5. Clinically relevant renal or hepatic insufficiency. 6. Unable to consent 7. Any other clinically significant condition that may jeopardize the study or be dangerous for the participant. 8. Active drug or alcohol abuse. 9. Participants taking antibiotics in the three months prior to the collection of the faecal samples. 10. Participants taking proton pump inhibitors, laxatives, and non-steroidal anti-inflammatory drugs 3 days prior to the collection of the faecal sample. 11 .Subjects with known Type 2 diabetes or treated for diabetes. 12. Subjects with intestinal disorders.
IGT cohort (Ethics Dnr 560-13) was recruited n a random basis from the Swedish population register and included based on their glucose status. The applied exclusion criteria included: known diabetes, inflammatory diseases (e.g. Crohn’s disease, ulcerative colitis, rheumatic diseases), treatment with steroids or immunomodulatory drugs, cancer (unless relapse free for the preceding 5 years), cognitive dysfunction, treatment for infectious diseases and with antibiotics in the past three months, inability to understand written and spoken Swedish as well as subjects born outside Sweden. The participants were invited by letter and gave all informed consent.
Despite the application of rigorous recruitment and exclusion criteria, several potential sources of bias should be acknowledged. First, self-selection bias may be present, as participation was voluntary; individuals who chose to enroll may differ systematically from those who declined, potentially leading to a study population with higher health literacy or distinct risk profiles compared to the general population. In the PESA-CNIC-Santander subset, participants were all employees of Santander Bank in Madrid, which may introduce a “healthy worker effect” and limit the cohort’s socioeconomic and
nature portfolio | reporting summary April2023
occupational diversity. Moreover, the exclusive inclusion of Spanish individuals in the PESA cohort and Swedish individuals in the IGT cohort may introduce geographic and population-related bias. As a result, the findings may not fully represent the spectrum of cardiovascular risk or disease presentation seen in more ethnically and socioeconomically diverse or nonEuropean populations. In the IGT cohort, although recruitment was population-based, the exclusion of non-Swedish-born individuals and those unable to understand Swedish may have introduced additional cultural or socioeconomic bias.
Ethics oversight
The Instituto de Salud Carlos III research ethics committee approved the study protocol (CEI PI 32_2018) and all participants were provided with a written informed consent.
All participants gave informed consent, and IGT study was approved by the Ethics Review Board in Gothenburg (560-13)
Note that full information on the approval of the study protocol must also be provided in the manuscript.

Field-specific reporting

Please select the one below that is the best fit for your research. If you are not sure, read the appropriate sections before making your selection.
Life sciences
Behavioural & social sciences
Ecological, evolutionary & environmental sciences
For a reference copy of the document with all sections, see nature.com/documents/nr-reporting-summary-flat.pdf

Life sciences study design

All studies must disclose on these points even when the disclosure is negative.
Sample size
To calculate the sample size needed for a study in mice with the given parameters (two-tailed test, unpaired samples, significance level of 0.05 , power of 0.8 , and detecting at least a 1 standard deviation difference), we use the formula for sample size estimation in a two-sample ttest. These numbers were refined based on our previous knowledge of the reproducibility, balancing statistical robustness and animal welfare, following the reduction criterium. The formula for the sample size (per group) in a two-sample t-test is given by:
Where:
n : Sample size per group
: Critical value for significance level (e.g., 1.96 for )
: Critical value for power (e.g., 0.84 for power)
SD: Standard deviation (assumed equal between groups)
d: Effect size (minimum detectable difference between group means)
For our parameters, we would need approximately 15.7 mice per group to achieve a significance level of 0.05 , a power of 0.8 , and detect at least a 1 standard deviation difference. We increase the sample group in 1 mouse to be able to discard a mouse where the experimental technique may fail. Total sample size is usually about 17 mice to be tested in (at least) two independent experiments.
For the human cohorts (PESA and IGT), no sample size calculation was conducted, as samples were retrospectively collected from observational studies. Instead, sample sizes were determined based on the availability of well-characterized patients with complete clinical, imaging, and biosamples from ongoing prospective observational studies. The cohorts were assembled with the goal of maximizing biological and phenotypic depth rather than targeting a predefined effect size. The inclusion of two independent cohorts with complementary phenotypes enabled replication and validation across datasets. Post hoc power considerations indicated that the sample size of the derivation cohort (PESA cohort, ) was adequately powered at the 0.85 level to detect a minimum 5 nMol difference in ImP levels between the group of subjects without atherosclerosis and patients without atherosclerosis. A ratio of 1:3 between patients without and with atherosclerosis was selected to reflect the distribution of AT in the PESA cohort, and measures of dispersion (i.e., standard deviation) were derived from the group of subjects without atherosclerosis in the PESA cohort. Respectively, the IGT cohort was adequately sized to detect with 0.85 power a difference of 2 nMoL in ImP levels between subjects without and with AT. Power considerations were based on the MannWhitney test for 2 independent groups. Type I error was prespecified at 0.05 for power calculations. Power analysis was performed with G*Power 3.1.9.6 (University of Kiel., Germany).
Data exclusions
Replication
No data were excluded from the analyses shown in the manuscript.
For mice and primary cell culture experiments, multiple independent biological replicates and independent experiments (at least twice) were performed, as indicated in figure legends. The results from the paper are consistent across multiple experimental approaches performed by different researchers. All attempts at replication obtained consistent data.
Randomization
Mice were homogeneous in terms of age ( 8 weeks) and randomly assigned to different cages for experimental treatments (antibiotics, imidazole propionate and AGN192403 administration). Human and animal samples were analysed in a randomized fashion on the mass spectrometer.
Blinding
For animal studies and cell-based in vitro studies, numbers were assigned to each experimental sample and analysis was blinded to group allocation during data collection.
For human study, samples were collected by blinded clinical staff and all data were generated by investigators that were blinded to the
metadata. Once data were generated, computational analysis was performed with all of the necessary clinical information to test between groups.

Behavioural & social sciences study design

All studies must disclose on these points even when the disclosure is negative.
Study description Briefly describe the study type including whether data are quantitative, qualitative, or mixed-methods (e.g. qualitative cross-sectional, quantitative experimental, mixed-methods case study).
Research sample State the research sample (e.g. Harvard university undergraduates, villagers in rural India) and provide relevant demographic information (e.g. age, sex) and indicate whether the sample is representative. Provide a rationale for the study sample chosen. For studies involving existing datasets, please describe the dataset and source.
Sampling strategy Describe the sampling procedure (e.g. random, snowball, stratified, convenience). Describe the statistical methods that were used to predetermine sample size if no sample-size calculation was performed, describe how sample sizes were chosen and provide a rationale for why these sample sizes are sufficient. For qualitative data, please indicate whether data saturation was considered, and what criteria were used to decide that no further sampling was needed.
Data collection Provide details about the data collection procedure, including the instruments or devices used to record the data (e.g. pen and paper, computer, eye tracker, video or audio equipment) whether anyone was present besides the participant(s) and the researcher, and whether the researcher was blind to experimental condition and/or the study hypothesis during data collection.
Timing Indicate the start and stop dates of data collection. If there is a gap between collection periods, state the dates for each sample cohort.
Data exclusions If no data were excluded from the analyses, state so OR if data were excluded, provide the exact number of exclusions and the rationale behind them, indicating whether exclusion criteria were pre-established.
Non-participation State how many participants dropped out/declined participation and the reason(s) given provide response rate state that no participants dropped out/declined participation.
Randomization If participants were not allocated into experimental groups, state so OR describe how participants were allocated to groups, and if allocation was not random, describe how covariates were controlled.

Ecological, evolutionary & environmental sciences study design

All studies must disclose on these points even when the disclosure is negative.
Study description Briefly describe the study. For quantitative data include treatment factors and interactions, design structure (e.g. factorial, nested, hierarchical), nature and number of experimental units and replicates.
Research sample Describe the research sample (e.g. a group of tagged Passer domesticus, all Stenocereus thurberi within Organ Pipe Cactus National Monument), and provide a rationale for the sample choice. When relevant, describe the organism taxa, source, sex, age range and any manipulations. State what population the sample is meant to represent when applicable. For studies involving existing datasets, describe the data and its source.
Sampling strategy Note the sampling procedure. Describe the statistical methods that were used to predetermine sample size OR if no sample-size calculation was performed, describe how sample sizes were chosen and provide a rationale for why these sample sizes are sufficient.
Data collection Describe the data collection procedure, including who recorded the data and how.
Timing and spatial scale Indicate the start and stop dates of data collection, noting the frequency and periodicity of sampling and providing a rationale for these choices. If there is a gap between collection periods, state the dates for each sample cohort. Specify the spatial scale from which the data are taken
Data exclusions If no data were excluded from the analyses, state so OR if data were excluded, describe the exclusions and the rationale behind them, indicating whether exclusion criteria were pre-established.
Reproducibility Describe the measures taken to verify the reproducibility of experimental findings. For each experiment, note whether any attempts to repeat the experiment failed OR state that all attempts to repeat the experiment were successful.
Randomization Describe how samples/organisms/participants were allocated into groups. If allocation was not random, describe how covariates were controlled. If this is not relevant to your study, explain why.
Blinding Describe the extent of blinding used during data acquisition and analysis. If blinding was not possible, describe why OR explain why blinding was not relevant to your study.
Did the study involve field work? □ Yes No
Field conditions Describe the study conditions for field work, providing relevant parameters (e.g. temperature, rainfall).
Location State the location of the sampling or experiment, providing relevant parameters (e.g. latitude and longitude, elevation, water depth).
Access & import/export Describe the efforts you have made to access habitats and to collect and import/export your samples in a responsible manner and in compliance with local, national and international laws, noting any permits that were obtained (give the name of the issuing authority, the date of issue, and any identifying information).
Disturbance Describe any disturbance caused by the study and how it was minimized.

Reporting for specific materials, systems and methods

We require information from authors about some types of materials, experimental systems and methods used in many studies. Here, indicate whether each material, system or method listed is relevant to your study. If you are not sure if a list item applies to your research, read the appropriate section before selecting a response.
Materials & experimental systems Methods
n/a Involved in the study n/a
– Antibodies
X Eukaryotic cell lines
□ Palaeontology and archaeology X
X Animals and other organisms

Antibodies

Antibodies used
Brilliant Violet 650m anti-mouse CDllc Antibody ;Biolegend;117339; Clone N418 PE anti CDllc;BD bioscience;553802; Clone HL3 PE anti-mouse NK-1.I Antibody ;Biolegend;I56504; Clone S17016D
FITC Anti-Mouse CD3e;Tonbo;35-0031-U500; clone 145-2C11
Anti-mouse B220-FITC;eBioscience;ll-0452-82; clone RA3-6B2
PerCP anti-mouse/human CD45R/B220 Antibody;Biolegend;I03234; Clone RA3-6B2
Anti-Human/Mouse CD45R (B220) PerCP-Cy5.5;eBioscience;45-0452-82; clone RA3-6B2
Brilliant Violet 605m anti-mouse/human CDllb Antibody;Biolegend;I01237; Clone M1/70
anti-mouse CDllb eFluor 660;eBioscience;50-0112-80; Clone M1/70
Anti-Mouse CDIIb PerCP-Cyanine5.5;eBioscience;45-0112-82; Clone M1/70
Anti-mouse CD206-eF450 ;eBioscience;48-2069-42; Clone 19.2
PE anti-mouse CD31 Antibody;Biolegend;|02407; Clone 390
Anti-mouse CD4-BV570;Biolegend;I00542; Clone RM4-5
PE/Cy7 anti-mouse CD4 Antibody;Biolegend;I00528; Clone RM4-5
Anti-Mouse CD45 APC-eFluor” 780;eBioscience;47-0451-82; Clone 30-F11
PE anti-mouse CD49b (pan-NK cells) Antibody;Biolegend;l08908; Clone DX5
Anti-mouse CD8-PE;eBioscience;12-0081-83; Clone 53-6.7
CD86 (B7-2) Monoclonal Antibody (GII), PE-Cyanine7;eBioscience;25-0862-80; Clone GL1
CD90.2 Rat anti-Mouse, BUV805, Clone: 53-2.I;BD Biosciences;BDB741908; Clone 53-2.1
BV786 Rat Anti-Mouse CD90.2 Clone 30-H12 (RUO);BD Biosciences; 740841; Clone 53-21
PerCP/CyS. 5 anti-mouse F4/80 Antibody;Biolegend;123128; Clone BM8
anti-mouse/rat Foxp3 FITC FJK-16s;eBioscience;ll-5773-82; Clone FJK-16s
Anti-mouse Ly6C-BV711;Biolegend;128037 ; Clone HK1.4
ANTI-MOUSE LY6G PE ;BD PHARMINGEN;551461; Clone 1A8
APC rat anti-Mouse Ly6G ;BD PHARMINGEN;560599; Clone 1A8
anti-Ly6G v450;BD PHARMINGEN;560603; Clone 1A8
Alexa Fluor” 700 anti-mouse I-A/1-E [M5/114.15.2];Biolegend; 107622 ; Clone M5/114.15.2
Anti-mouse MHCII-UV737;BD Biosciences;367-5321-82; Clone M5/114.15.2
Phospho-S6 Ribosomal Protein (Ser235/236) (D57.2.2E) XP Rabbit mAb;Cell signaling;4858S; Clone D57.2.2.E Anti-Mouse ROR
gamma (t) APC;eBioscience;l 7-6981-80 ; Clone B2D
PE Rat Anti-Mouse Siglec-F Clone ES0-2440 (RUO);BD PHARMINGEN;552126; Clone E50-2440
Anti-mouse SiglecH FITC;eBioscience;II-0333-81; eBIO440c
Anti-mouse T-bet-PECF594;BD Biosciences;562467; Clone O4-46
Mouse VCAM-1/CD106 Alexa Fluor® 594-conjugated Antibody;biotechne;FAB6432T; Clone 112734
Brilliant Violet 78S’M anti-mouse/rat XCRI Antibody;Biolegend;148225; Clone ZET
https://www.biolegend.com/en-gb/products/brilliant-violet-650-anti-mouse-cd11c-antibody-8840
https://www.fishersci.com/shop/products/anti-cd11c-r-pe-clone-hl3bd/BDB553802
https://www.biolegend.com/en-us/products/pe-anti-mouse-nk-1-1-antibody-16926?GroupID=GROUP20
https://www.citeab.com/antibodies/2204479-35-0031-u500-anti-mouse-cd3e
https://www.thermofisher.com/antibody/product/CD45R-B220-Antibody-clone-RA3-6B2-Monoclonal/11-0452-82
https://www.biolegend.com/fr-ch/search-results/percp-anti-mouse-human-cd45r-b220-antibody-4266?Clone=RA3-6B2
https://www.thermofisher.com/antibody/product/CD45R-B220-Antibody-clone-RA3-6B2-Monoclonal/45-0452-82
https://www.biolegend.com/en-us/products/brilliant-violet-605-anti-mouse-human-cd11b-antibody-7637?GroupID=BLG10530
https://www.thermofisher.com/antibody/product/CD11b-Antibody-clone-M1-70-Monoclonal/50-0112-82
https://www.thermofisher.com/antibody/product/CD11b-Antibody-clone-M1-70-Monoclonal/45-0112-82
https://www.thermofisher.com/antibody/product/CD206-MMR-Antibody-clone-19-2-Monoclonal/48-2069-42
https://www.biolegend.com/nl-nl/products/pe-anti-mouse-cd31-antibody-122
https://www.biolegend.com/nl-be/products/brilliant-violet-570-anti-mouse-cd4-antibody-7379
https://www.biolegend.com/en-us/cell-separation/pe-cyanine7-anti-mouse-cd4-antibody-1932
https://www.thermofisher.com/antibody/product/CD45-Antibody-clone-30-F11-Monoclonal/47-0451-82
https://www.biolegend.com/en-gb/products/pe-anti-mouse-cd49b-pan-nk-cells-antibody-234?GroupID=BLG4768
https://www.citeab.com/antibodies/2037994-12-0081-82-cd8a-monoclonal-antibody-53-6-7-pe-eb
https://www.thermofisher.com/antibody/product/CD86-B7-2-Antibody-clone-GL1-Monoclonal/25-0862-82
https://www.fishersci.com/shop/products/cd90-2-rat-anti-mouse-buv805-clone-53-2-1-bd-biosciences/BDB741908
https://www.biolegend.com/en-us/products/percp-cyanine5-5-anti-mouse-f480-antibody-4303?GroupID=BLG5319
https://www.citeab.com/antibodies/2041744-11-5773-82-foxp3-monoclonal-antibody-fjk-16s-fitc
https://www.biolegend.com/en-us/products/brilliant-violet-711-anti-mouse-ly-6c-antibody-8935?GroupID=BLG7242
https://www.citeab.com/antibodies/2410368-551461-bd-pharmingen-pe-rat-anti-mouse-ly-6g
https://www.citeab.com/antibodies/2410938-560599-bd-pharmingen-apc-rat-anti-mouse-ly-6g
https://www.citeab.com/antibodies/2408945-560603-bd-horizon-v450-rat-anti-mouse-ly-6g
https://www.biolegend.com/fr-ch/products/alexa-fluor-700-anti-mouse-i-a-i-e-antibody-3413
https://www.bdbiosciences.com/en-ca/products/reagents/flow-cytometry-reagents/research-reagents/single-color-antibodies-ruo/ bv786-rat-anti-mouse-i-a-i-e. 742894
https://www.cellsignal.com/products/primary-antibodies/phospho-s6-ribosomal-protein-ser235-236-d57-2-2e-xp-rabbit-mab/4858 https://www.labome.com/product/Invitrogen/17-6981-80.html
https://www.citeab.com/antibodies/2411876-552126-bd-pharmingen-pe-rat-anti-mouse-siglec-f
https://www.labome.com/product/Invitrogen/11-0333-82.html
https://www.bdbiosciences.com/en-de/products/reagents/flow-cytometry-reagents/research-reagents/single-color-antibodies-ruo/ pe-cf594-mouse-anti-t-bet. 562467
https://www.bio-techne.com/p/antibodies/mouse-vcam-1-cd106-alexa-fluor-594-conjugated-antibody-112734_fab6432t
https://www.biolegend.com/fr-ch/products/brilliant-violet-785-anti-mouse-rat-xcr1-antibody-16711

Eukaryotic cell lines

Policy information about cell lines and Sex and Gender in Research

Cell line source(s)

Mouse aortic endothelial cells (MAECs) were isolated from mouse thoracic aortas as described previously23. Cells were cultured in Medium 199 (Gibco, Invitrogen Life Technologies) + 20% fetal bovine serum + Penicillin/Streptomycin 2 mM + Glutamine HEPES endothelial cell growth supplement Heparin , all from SigmaAldrich, under 5% at .
Mouse embryo fibroblast (MEF) cell lines were isolated from 13.5 dpc from embryos using standard protocol. Each embryo was dissected into 10 ml of sterile PBS, voided of its internal organs, head, and legs. After 30 min incubation with gentle shaking at with trypsin, cells were plated in two 100 mm dishes and incubated for .To establish the immortalized MEF lines, early passage MEFs were seeded in 60 mm plates and infected with 10E5 IU/ml packaged retrovirus carrying the human papillomavirus (HPV) 16 E6/E7 genes. Selection was performed with of G418 during 10 days.
L929 cell line (ATCC CCL-1TM) used for production of the M-CSF supernatant, was grown on 175 cm 2 cell culture flasks (Stemcell) and resuspended in RPMI 1640 (Sigma) supplemented with heat-inactivated fetal calf serum (FCS, Sigma), 1 mM pyruvate (Lonza, Bassel, Switzerland), non-essential aminoacids (Thermo Fisher Scientific, Walthman, MA), 2 ,ml penicillin, streptomycin (all three from Lonza) and 2-mercaptoethanol (Merck, Darmstad,Germany), herein called R10. Supernatants were obtained by filtering 15-days long cultures through Stericup Filter units (Merck Millipore) and were used to subsequently supplement the medium for the generation of bone marrow derived macrophages.
Bone marrow derived macrophages (BMDMs) were generated as previously described with some modifications. BM cells from WT C57BL/6J mice were cultured in RPMI 1640 supplemented with M-CSF obtained from L929 cell line and FBS, penicillin, streptomycin, 10 mM HEPES, 1 nM sodium pyruvate (all from Gibco) during 5 days in sterile, but not tissue-culture treated, Petri dishes.
L929 were directly purchased from ATCC (ATCC ® CCL-1TM). The rest of cells used were primary lines. Primary cell lines were identified by morphology and phenotype characterization by flow cytometry.
All cells lines were continuously surveyed and tested negative for mycoplasma contamination by PCR.
No commonly misidentified cell lines were used in the study □
All cells lines were continuously surveyed and tested negative for mycoplasma contamination by PCR.

Authentication

Mycoplasma contamination

Commonly misidentified lines (See ICLAC register)
nature portfolio | reporting summary April 2023

Specimen provenance

Specimen deposition

Dating methods

Provide provenance information for specimens and describe permits that were obtained for the work (including the name of the issuing authority, the date of issue, and any identifying information). Permits should encompass collection and, where applicable, export.
Indicate where the specimens have been deposited to permit free access by other researchers.
If new dates are provided, describe how they were obtained (e.g. collection, storage, sample pretreatment and measurement), where they were obtained (i.e. lab name), the calibration program and the protocol for quality assurance OR state that no new dates are provided.
□ Tick this box to confirm that the raw and calibrated dates are available in the paper or in Supplementary Information.

Ethics oversight

Identify the organization(s) that approved or provided guidance on the study protocol, OR state that no ethical approval or guidance was required and explain why not.
Note that full information on the approval of the study protocol must also be provided in the manuscript.

Animals and other research organisms

Policy information about studies involving animals; ARRIVE guidelines recommended for reporting animal research, and Sex and Gender in Research

Laboratory animals

All mice (Mus musculus) were housed at an ambient temperature around , humidity of and a light dark cycle of 12 hours. Mice were bred and maintained in groups of 5 animals per cage at the CNIC under specific pathogen-free conditions. We used proatherogenic background B6.129P2-Apoetm1Unc/J mice (The Jackson Laboratory,strain 002052, ApoE-/-); and B6.129S7-Ldlrtm1Her/J mice (The Jackson Laboratory, strain 002207, Ldlr-/-) backcrossed with B6.SJL-Ptprca Pepcb/BoyJ mice expressing the CD45.1 congenic marker (The Jackson Laboratory, strain 002014, B6 CD45.1). For initiation of experiments, 6-8 weekold male mice were used.
Rag1tm1Mom/J mice (The Jackson Laboratory, strain 002216, Rag1-/-); B6.Cg-Rptortm1.1Dmsa/J mice (The Jackson Laboratory, strain 013188, RaploxP) were mated with B6.129P2-Lyz2tm1(cre)lfo/J mice (The Jackson Laboratory, strain 004781, Lyz2-Cre) to generate Lyz2 Raptor (Cre+) and control Raptorf/f (Cre-) littermates used as controls. Sperm from B6.Nischtm1a(EUCOMM)Hmgu>/ H mice (Mary Lyon Centre at MRC Harwell, United, EM:08808) was used for in vitro fertilization of ROSA-Flpe mice (Gt(ROSA)26Sortm1(FLP1)Dym) to generate Nischf/f mice (tm1c). Nischf/f mice were mated with Lyz2-Cre (B6.129P2Lyz2tm1(cre)lfo/J) mice to generate Lyz2 Nisch (Cre+) and control Nischf/f (Cre-) littermates used as controls.

Wild animals

Reporting on sex

No wild animals were used in the study
Our findings in mouse models include both males and females. The human cohorts also include female participants that account for the and the of the whole PESA and IGT cohorts, respectively.

Field-collected samples

Ethics oversight

No field collected samples were used in the study.
Animal studies were approved by the local ethics committee. All animal procedures conformed to EU Directive 2010/63EU and Recommendation 2007/526/EC regarding the protection of animals used for experimental and other scientific purposes, enforced by Spanish law under Real Decreto 1201/2005.
Note that full information on the approval of the study protocol must also be provided in the manuscript.

Clinical data

Policy information about clinical studies

All manuscripts should comply with the ICMJE guidelines for publication of clinical research and a completed CONSORT checklist must be included with all submissions.

Clinical trial registration

The discovery cohort was conducted in a subset of participants from the PESA-CNIC-Santander study (Progression of Early Subclinical Atherosclerosis): NCT01410318 (https://clinicaltrials.gov/ct2/show/NCT01410318).
The IGT cohort used for the validation was approved by Ethics Review Board in Gothenburg (IGTM [560-13])
Study protocol

Data collection

Volunteers were recruited following the inclusion and exclusion criteria of the main PESA-CNIC-Santander study https:// clinicaltrials.gov/ct2/show/NCT01410318.
Exclusion criteria for the IGT study were: known diabetes, inflammatory diseases (e.g. Crohn’s disease, ulcerative colitis, rheumatic diseases), treatment with steroids or immunomodulatory drugs, cancer (unless relapse free for the preceding 5 years), cognitive dysfunction, treatment for infectious diseases and with antibiotics in the past three months, inability to understand written and spoken Swedish as well as subjects born outside Sweden.
nature portfolio | reporting summary April2023
For the PESA ohort, blood and stool samples were collected from the participants followed by targeted mass spectrometry and 16S rRNA gene sequencing, respectively. Subclinical atherosclerosis was assessed by assessed by imaging studies including 2D and 3D vascular ultrasonography of carotid and iliofemoral arteries and presence of coronary artery calcium assessed by CT scan (PMID:24268213). Subjects with subclinical AT underwent a whole body 18F-FDG PET/MRI study to characterize arterial 18F-FDG uptake and bone marrow metabolic activity (PMID:30922468 and PMID: 35567559, respectively). Fasting blood test included biochemistry and determination of high-sensitivity C-reactive protein (hs-CRP). In this study, hypertension (HTN) was as systolic > 130 mmHg and/or diastolic and/or subjects taking antihypertensive drugs. Dyslipidaemia was defined as total cholesterol , LDL-cholesterol -cholesterol , or use of lipid-lowering drugs. Anthropometry and bioelectrical impedance analysis assessments were performed during the same appointment for each participant. Height and weight were measured using calibrated equipment (Tanita BC-545N,) with participants wearing underwear and barefoot. BMI was calculated as weight (kg) divided by height squared (metre).
For the IGT cohort blood samples were collected from the participants followed by targeted mass spectrometry. Atherosclerosis in the carotid arteries was assessed by ultrasound imaging using a standardized protocol including a Siemens Acuson S2000 ultrasound scanner and by presence of coronary artery calcium assessed by CT scan. Systolic blood pressure (SBP) was measured twice with an automatic device (Omron M10-IT, Omron Health care Co, Kyoto, Japan) and the mean of the measurements was used. A questionnaire was used to collect detailed information on medication and family history. SCORE2 (Systematic Coronary Risk Evaluation) was calculated as previously. Body weight, height waist and hip circumferences were measured on calibrated equipment with subjects dressed in light clothing without shoes and according to current WHO recommendations.
The targeted metabolomics analyses showed that imidazole propionate (ImP), but not histidine or urocanic acid, plasma concentrations were selectively increased in subjects with subclinical atherosclerosis when compared to controls. Linear and nonlinear associations were also observed between ImP concentrations and atherosclerosis and extent of atherosclerosis, respectively. The prevalence of atherosclerosis endpoints and the CAC score also increased across ascending ImP tertiles. These findings were validated in an independent cohort, the IGT cohort. ImP was also found significantly increased in subjects with metabolically active atherosclerosis (FDG+) when compared to inactive atherosclerosis, particularly those with bone marrow activation (FDG+_BM) and systemic inflammation (FDG+_SYS). After adjusting for traditional risk factors in both cohorts, higher ImP levels were independently associated with main atherosclerosis outcomes, suggesting high ImP levels as indicator of heightened atherosclerosis risk. Notably, ImP also showed additive value when added to established blood-derived atherosclerosis biomarkers such as LDL-cholesterol and high sensitive C reactive protein (hs-CRP) in discriminating atherosclerosis prevalence in both cohorts and active atherosclerosis in the PESA cohort. These findings reveal a strong association between and atherosclerosis, particularly active atherosclerosis, suggesting its potential use as an indicator of early active atherosclerosis before other comorbidities become confounding factors.

Dual use research of concern

Policy information about dual use research of concern

Hazards

Could the accidental, deliberate or reckless misuse of agents or technologies generated in the work, or the application of information presented in the manuscript, pose a threat to:
No
Yes

□ Public health

□ National security

□ Crops and/or livestock

□ Ecosystems
□ □ Any other significant area

Experiments of concern

Does the work involve any of these experiments of concern:
No
Yes
□ □ Demonstrate how to render a vaccine ineffective
□ □ Confer resistance to therapeutically useful antibiotics or antiviral agents

□ Enhance the virulence of a pathogen or render a nonpathogen virulent

□ Increase transmissibility of a pathogen

□ Alter the host range of a pathogen

□ Enable evasion of diagnostic/detection modalities

□ Enable the weaponization of a biological agent or toxin

□ Any other potentially harmful combination of experiments and agents
Seed stocks
Novel plant genotypes
Authentication
Report on the source of all seed stocks or other plant material used. If applicable, state the seed stock centre and catalogue number. If plant specimens were collected from the field, describe the collection location, date and sampling procedures.
Describe the methods by which all novel plant genotypes were produced. This includes those generated by transgenic approaches, gene editing, chemical/radiation-based mutagenesis and hybridization. For transgenic lines, describe the transformation method, the number of independent lines analyzed and the generation upon which experiments were performed. For gene-edited lines, describe the editor used, the endogenous sequence targeted for editing, the targeting guide RNA sequence (if applicable) and how the editor was applied.
Describe any authentication procedures for each seed stock used or novel genotype generated. Describe any experiments used to assess the effect of a mutation and, where applicable, how potential secondary effects (e.g. second site T-DNA insertions, mosiacism, off-target gene editing) were examined.

ChIP-seq

Data deposition

□ Confirm that both raw and final processed data have been deposited in a public database such as GEO.
□ Confirm that you have deposited or provided access to graph files (e.g. BED files) for the called peaks.
May remain private before publication.
For “Initial submission” or “Revised version” documents, provide reviewer access links. For your “Final submission” document, provide a link to the deposited data.
Files in database submission
Genome browser session (e.g. UCSC)
Provide a list of all files available in the database submission.
Provide a link to an anonymized genome browser session for “Initial submission” and “Revised version” documents only, to enable peer review. Write “no longer applicable” for “Final submission” documents.

Methodology

Replicates

Sequencing depth
Describe the experimental replicates, specifying number, type and replicate agreement.
Describe the sequencing depth for each experiment, providing the total number of reads, uniquely mapped reads, length of reads and whether they were paired- or single-end.

Antibodies

Describe the antibodies used for the ChIP-seq experiments; as applicable, provide supplier name, catalog number, clone name, and lot number.

Peak calling parameters

Specify the command line program and parameters used for read mapping and peak calling, including the ChIP, control and index files used.
Data quality
Software
Describe the methods used to ensure data quality in full detail, including how many peaks are at FDR 5% and above 5-fold enrichment.
Describe the software used to collect and analyze the ChIP-seq data. For custom code that has been deposited into a community repository, provide accession details.

Flow Cytometry

Plots

Confirm that:

The axis labels state the marker and fluorochrome used (e.g. CD4-FITC).
The axis scales are clearly visible. Include numbers along axes only for bottom left plot of group (a ‘group’ is an analysis of identical markers).
All plots are contour plots with outliers or pseudocolor plots.
A numerical value for number of cells or percentage (with statistics) is provided.

Methodology

Sample preparation

For blood samples, after erythrocytes lysis buffer, single cell suspensions were stained for 30 min at with LIVE/DEAD Fixable Aqua Dead Cell Stain Kit (Life Technologies). After washing with PBS, cells were stained in FACS buffer containing antiCD16/32 (BioXcell), FBS and EDTA with the corresponding antibody cocktail for 30 min on ice. Cells were stained with a cocktail of antibodies.
For cells infiltrating the in aorta, mice were perfused with 10 ml of Phosphate Buffered Saline (PBS) via cardiac puncture to remove blood contamination from vascular tissue.
Instrument
The aortas were kept in cold Dulbecco’s Modified Eagle Medium (DMEM) to be digested. Perivascular fat was removed and the thoracic aorta with arch was opened longitudinally and cut into smaller pieces that were incubated for 30 min at 37 oC in water bath in digestion buffer (Collagenase A , (Roche/Sigma #10103586001). Dispase II ( ), (Roche/ Sigma #04942078001), DNase I ( ) (Roche/Sigma #10104159001) elastase ( ) and Libersase TL ( 0.2 Wünsch units/mL) Cat#5401119001. After incubation time the digested tissue was mixed by pipetting, filtered through a strainer and spinned at 400 g 5 min 4 C . Single cells were stained with a cocktail of antibodies.
FACSymphony (BD Biosciences)
FACSAria Cell Sorter (BD Biosciences)
Software
Cell population abundance
FlowJo software version 10 (TreeStar)
The number of cells is indicated in the respective graph corresponding to each population.
Gating strategy
Gating strategy on blood and aorta tissues:
  1. FSC and SSC
  2. FSC-H and FSC-A to gate on single cell population
  3. Viability to gate on live cells, this is defined as negative cells to staining
  4. CD45+ cells
  5. CD90 cells for T cells, B220 cell for B cells and non t or b cells as double negative.
  6. In CD90-;B220-; was further gated on Ly6C high Monocytes
  7. In CD90-;B220-; was further gated on F4/80+CD86+ and F4/80+CD11c+ (Macrophages)
  8. CD90 cells was further gated CD4+Rorg-t+ (Th17), CD4+t-Bet+ (Th1), CD4+Foxp3+ (Treg)
Gating strategy on blood to isolated monocytes:
  1. FSC and SSC
  2. FSC-H and FSC-A to gate on single cell population
  3. Viability to gate on live cells, this is defined as negative cells to staining
  4. CD45+ cells
  5. CD3-, B220-, NK1.1-, LY6G-, CD49-, SiglecF- cells
  6. Monocytes was gated as CD11B+ and Ly6C+/-
Tick this box to confirm that a figure exemplifying the gating strategy is provided in the Supplementary Information.

Magnetic resonance imaging

Experimental design

Design type
Design specifications
Behavioral performance measures
Indicate task or resting state; event-related or block design.
Specify the number of blocks, trials or experimental units per session and/or subject, and specify the length of each trial or block (if trials are blocked) and interval between trials.
State number and/or type of variables recorded (e.g. correct button press, response time) and what statistics were used to establish that the subjects were performing the task as expected (e.g. mean, range, and/or standard deviation across subjects).

Acquisition

Specify: functional, structural, diffusion, perfusion.
Specify in Tesla
Field strength
Sequence & imaging parameters
Specify the pulse sequence type (gradient echo, spin echo, etc.), imaging type (EPI, spiral, etc.), field of view, matrix size, slice thickness, orientation and TE/TR/flip angle.
Area of acquisition
Diffusion MRI
□ Used
State whether a whole brain scan was used OR define the area of acquisition, describing how the region was determined.
□ Not used

Preprocessing

Preprocessing software
Provide detail on software version and revision number and on specific parameters (model/functions, brain extraction, segmentation, smoothing kernel size, etc.).

Normalization

Normalization template Describe the template used for normalization/transformation, specifying subject space or group standardized space (e.g. original Talairach, MNI305, ICBM152) OR indicate that the data were not normalized.
Noise and artifact removal Describe your procedure(s) for artifact and structured noise removal, specifying motion parameters, tissue signals and physiological signals (heart rate, respiration).
Volume censoring Define your software and/or method and criteria for volume censoring, and state the extent of such censoring.
Statistical modeling & inference
Model type and settings Specify type (mass univariate, multivariate, RSA, predictive, etc.) and describe essential details of the model at the first and second levels (e.g. fixed, random or mixed effects; drift or auto-correlation).
Effect(s) tested Define precise effect in terms of the task or stimulus conditions instead of psychological concepts and indicate whether ANOVA or factorial designs were used.
Specify type of analysis:
Statistic type for inference (See Eklund et al. 2016) Specify voxel-wise or cluster-wise and report all relevant parameters for cluster-wise methods.
Correction Describe the type of correction and how it is obtained for multiple comparisons (e.g. FWE, FDR, permutation or Monte Carlo).
Models & analysis
n/a
Involved in the study □ □ Functional and/or effective connectivity □ □ Graph analysis □ □ Multivariate modeling or predictive analysis
Functional and/or effective connectivity Report the measures of dependence used and the model details (e.g. Pearson correlation, partial correlation, mutual information).
Graph analysis Report the dependent variable and connectivity measure, specifying weighted graph or binarized graph, subject- or group-level, and the global and/or node summaries used (e.g. clustering coefficient, efficiency, etc.).
Multivariate modeling and predictive analysis Specify independent variables, features extraction and dimension reduction, model, training and evaluation metrics.

    1. SCORE2 working group and ESC Cardiovascular risk collaboration. SCORE2 risk prediction algorithms: new models to estimate 10-year risk of cardiovascular disease in Europe. Eur. Heart J. 42, 2439-2454 (2021).
    2. Fernández-Friera, L. et al. Prevalence, vascular distribution, and multiterritorial extent of subclinical atherosclerosis in a middle-aged cohort. Circulation 131, 2104-2113 (2015).
    3. Libby, P. The changing landscape of atherosclerosis. Nature 592, 524-533 (2021).
  1. For the PESA study, plasma and faecal samples were collected from December 2018 to May 2021. Metabolomics data were collected and analysed in 2021. 16S gene sequencing data was collected and analysed in 2022.
    In the IGT cohort, men and women aged 50 to 64 years and born in the region of Gothenburg, Sweden, were screened between 2013