DOI: https://doi.org/10.60084/eje.v2i1.145
تاريخ النشر: 2024-02-22
الابتكار والنمو الاقتصادي في أكبر خمس اقتصادات في جنوب شرق آسيا: تحليل تفكيكي
تاريخ المقال
تمت المراجعة 10 فبراير 2024
تم القبول 16 فبراير 2024
متاح على الإنترنت 22 فبراير 2024
الكلمات المفتاحية:
مؤشر الابتكار العالمي
إندونيسيا
تايلاند
سنغافورة
ماليزيا
فيتنام
الملخص
يمتلك الابتكار القدرة على العمل كسيف ذي حدين في التأثير على النمو الاقتصادي. بينما يعمل كقوة دافعة قوية للتقدم الاقتصادي، فإنه يحمل أيضًا مخاطر إلى جانب فوائده. من خلال التعرف على هذه الثنائية، تهدف دراستنا إلى سد الفجوة المحددة وإضافة شمولية للأدبيات من خلال تقييم التأثير الفردي لمؤشرات الابتكار على النمو الاقتصادي في أفضل خمس دول في جنوب شرق آسيا (SEA) بناءً على الناتج المحلي الإجمالي (GDP): إندونيسيا، تايلاند، سنغافورة، ماليزيا، وفيتنام. يتكون جانب الابتكار من 21 مؤشرًا من مؤشر الابتكار العالمي (GII)، مقسمة إلى سبع فئات: المؤسسات، رأس المال البشري والبحث، البنية التحتية، تعقيد السوق، تعقيد الأعمال، مخرجات المعرفة والتكنولوجيا، والمخرجات الإبداعية. تستنتج كل من التحليل اللوحي والتقييمات الخاصة بالدول باستمرار أن الابتكار يؤثر بشكل كبير على النمو الاقتصادي. ومع ذلك، فإن التعمق في المؤشرات المصنفة يكشف عن رؤى مثيرة للاهتمام. بينما تظهر جميع المؤشرات تأثيرًا ملحوظًا، وُجد أن معظمها تعيق بدلاً من تعزيز النمو الاقتصادي. تؤكد هذه الأدلة التجريبية القوية أن الابتكار في الدول المختارة لم يتم تحسينه بعد، مما يبرز الحاجة الملحة لتنفيذ سياسات صديقة للابتكار، بما في ذلك إزالة الحواجز أمام الابتكار، واستهداف الاستثمار في القطاعات الرئيسية، وتعزيز التعليم وتطوير المهارات. تهدف هذه المقاربة الشاملة إلى زراعة بيئة مواتية للابتكار، مما يعزز دور الابتكار كواحد من المحركات الرئيسية للنمو الاقتصادي.
1. المقدمة
يساهم في التوسع الاقتصادي العام [5-8]. علاوة على ذلك، يحفز الابتكار ريادة الأعمال ويخلق فرص عمل جديدة. مع تطور الصناعات وتكيفها مع الأفكار الابتكارية، تصبح أكثر تنافسية على الصعيد العالمي، مما يجذب الاستثمارات ويعزز المزيد من النمو [9-13].
| متغير | رمز | وصف | الوحدات (المصادر) | تفاصيل المتغير |
| معتمد | الناتج المحلي الإجمالي | الناتج المحلي الإجمالي | LCU ثابت (WDI) | مجموع القيمة المضافة الإجمالية من قبل جميع المنتجين المقيمين في الاقتصاد. |
| تحكم | ك | تكوين رأس المال الثابت الإجمالي | LCU ثابت (WDI) | مجموع القيمة المضافة الإجمالية من تحسينات الأراضي؛ وشراء النباتات والآلات والمعدات؛ وبناء السلع العامة. |
| ل | القوة العاملة | شخص (WDI) | يشمل الأشخاص الذين تتراوح أعمارهم بين 15 عامًا وما فوق والذين يقدمون العمالة لإنتاج السلع والخدمات خلال فترة محددة. | |
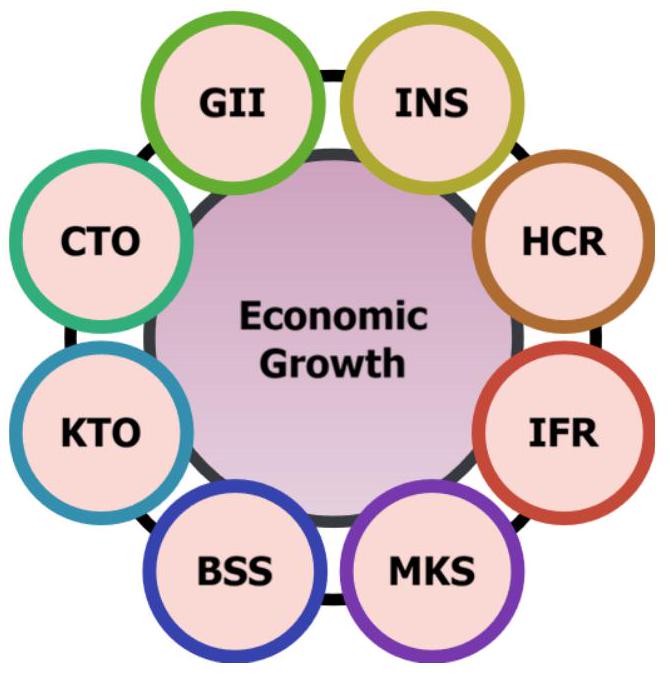
| مستقل | جي | مؤشر الابتكار العالمي | يشير إلى مؤشر مركب يأخذ في الاعتبار عوامل مثل المؤسسة، رأس المال البشري والبحث، البنية التحتية، تطور السوق، تطور الأعمال، المعرفة، التكنولوجيا، والمخرجات الإبداعية. | |
| INS | مؤسسة | تشير إلى مؤشرات مثل البيئة السياسية والتنظيمية وبيئة الأعمال. | ||
| المفوضية السامية للأمم المتحدة لشؤون اللاجئين | رأس المال البشري والبحث | تشير إلى مؤشرات مثل التعليم والبحث والتطوير. | ||
| IFR | البنية التحتية | الدرجة بين 1-100 (الويبو) | تشير إلى مؤشرات مثل تكنولوجيا المعلومات والاتصالات، والبنية التحتية العامة، والاستدامة البيئية. | |
| MKS | تعقيد السوق | تشير إلى مؤشرات مثل الائتمان، والاستثمار، والتجارة، والمنافسة، وحجم السوق. | ||
| نظام دعم الأعمال | تعقيد الأعمال | تشير إلى مؤشرات مثل عمال المعرفة، وروابط الابتكار، وامتصاص المعرفة. | ||
| KTO | مخرجات المعرفة والتكنولوجيا | تشير إلى مؤشرات مثل إنشاء المعرفة وتأثيرها، وانتشار المعرفة. | ||
| المدير التنفيذي للتكنولوجيا | المخرجات الإبداعية | تشير إلى مؤشرات مثل الأصول غير الملموسة، والسلع والخدمات الإبداعية، والإبداع عبر الإنترنت. |
العلاقة بين الابتكار والنمو الاقتصادي في أفضل خمس دول في جنوب شرق آسيا.
2. المواد والأساليب
2.1. البيانات والمتغيرات
| متغير | معنى | الوسيط | ماكس. | دقيقة | الانحراف المعياري | الانحراف | التفرطح | جارك-بيرا |
| في الناتج المحلي الإجمالي | 31.46 | ٢٩.٩٤ | ٣٧.٠٠ | ٢٦.٦١ | ٤.١٦ | 0.25 | 1.27 | 16.24 |
| إنك | 30.17 | ٢٨.٥٢ | ٣٥.٨٤ | 25.27 | ٤.٢٩ | 0.27 | 1.26 | ١٦.٥٢ |
| InL | 17.12 | 17.51 | 18.74 | 14.94 | 1.25 | -0.52 | 2.10 | 9.48 |
| InGII | 3.69 | 3.64 | ٤.١٥ | ٣.٢٨ | 0.24 | 0.37 | ٢.٢٧ | 5.32 |
| فيINS | ٤.١٢ | ٤.٠٩ | ٤.٥٦ | 3.23 | 0.29 | -0.24 | 3.17 | 1.29 |
| المفوضية السامية للأمم المتحدة لشؤون اللاجئين | 3.58 | ٣.٤٥ | ٤.٣١ | 3.04 | 0.37 | 0.47 | 2.09 | 8.64 |
| في IFR | 3.76 | 3.76 | ٤.٢٤ | ٣.٢٠ | 0.25 | 0.02 | ٢.٦٤ | 0.67 |
| إن إم كي إس | ٣.٩٩ | ٤.٠٠ | ٤.٣٧ | ٣.٤٧ | 0.21 | -0.04 | ٢.٧٤ | 0.37 |
| إن بي إس إس | ٣.٦٤ | ٣.٥٧ | ٤.٣٧ | 2.86 | 0.36 | 0.18 | 2.40 | 2.47 |
| إنك تو | ٣.٤٥ | ٣.٤٥ | ٤.١٧ | ٢.٨٧ | 0.31 | -0.02 | ٢.٥٩ | 0.86 |
| InCTO | 3.52 | ٣.٥٥ | 3.82 | 2.86 | 0.21 | -1.20 | ٤.٤٧ | ٣٩.٨٢ |
2.2. نموذج الاقتصاد القياسي
هنا،
2.3. الطرق
2.3.1. تحليل الانحدار باستخدام بيانات اللوحات
| نموذج اللوحة | اختبار تشاو | اختبار هاوسمان | استنتاج | ||
| إحصائية | احتمال | إحصائية | احتمال | ||
| الناتج المحلي الإجمالي
|
70.5835* | 0.0000 | 89.6619* | 0.0000 | أفضل نموذج: FEM |
| الناتج المحلي الإجمالي
|
85.5728* | 0.0000 | ١١٦.٤٨٧* | 0.0000 | أفضل نموذج: FEM |
| الناتج المحلي الإجمالي
|
81.7211* | 0.0000 | ١٠٩.٢٥٣* | 0.0000 | أفضل نموذج: FEM |
| الناتج المحلي الإجمالي
|
81.5004* | 0.0000 | ١٠٨.٨٣٢* | 0.0000 | أفضل نموذج: FEM |
| الناتج المحلي الإجمالي
|
75.6375* | 0.0000 | 98.3251* | 0.0000 | أفضل نموذج: FEM |
| الناتج المحلي الإجمالي
|
83.6422* | 0.0000 | 112.866* | 0.0000 | أفضل نموذج: FEM |
| الناتج المحلي الإجمالي
|
81.1415* | 0.0000 | ١٠٨.٢٠٦* | 0.0000 | أفضل نموذج: FEM |
| الناتج المحلي الإجمالي
|
85.3825* | 0.0000 | ١١٦٫٠٧٨* | 0.0000 | أفضل نموذج: FEM |
| التابع: الناتج المحلي الإجمالي | النموذج 1 | ||
| متغير | سي إم | فيم | ريم |
| ج | 5.4694 | -3.5136 | 5.4694 |
| (7.0441)* | (2.0739)** | (9.2881)* | |
| ك | 0.9506 | 0.7059 | 0.9506 |
| معامل | (391.66)* | (21.59)* | (516.44)* |
| ل (إحصاء t) | -0.0342 | 0.8787 | -0.0342 |
| (1.4406) | (7.8434)* |
|
|
| مؤشر الابتكار العالمي | -0.5708 | -0.3704 | -0.5708 |
| (5.1781)* | (3.6736)* | (6.8277)* | |
| صفة
|
0.9998 | 0.9999 | 0.9998 |
| احتمالية F | 0.0000 | 0.0000 | 0.0000 |
في تحليل الانحدار القياسي باستخدام طريقة المربعات الصغرى العادية (OLS)، يُفضل استخدام نموذج التأثيرات الثابتة (FEM) عندما تكون هناك مخاوف بشأن التأثيرات الفردية الثابتة عبر الزمن، بينما يكون نموذج التأثيرات العشوائية (REM) مناسبًا عندما يُفترض أن هذه التأثيرات غير مرتبطة بالمتغيرات المستقلة. بعد ذلك، يتم إجراء اختبارات تشاو وهاوسمان لاختيار أفضل نموذج من بين الثلاثة وتكون بمثابة الأساس الرئيسي لتفسير نتائج نموذج اللوحة.
2.3.2. المربعات الصغرى القوية
3. النتائج والمناقشة
3.1. الإحصائيات الوصفية
انحراف إيجابي. يعرض InL توزيعًا متماثلًا مع تباين منخفض وانحراف سلبي، مما يشير إلى انحراف إلى اليسار وذيول أثقل. تُظهر InGII وInINS وInBSS توزيعات متماثلة مع تباين منخفض ودرجات متفاوتة من الانحراف والكورتوز، مما يشير إلى انحرافات عن التوزيع الطبيعي. تُظهر InHCR وInIFR وInMKS وInKTO وInCTO توزيعات بخصائص مشابهة للمتغيرات الأخرى، ولكن مع انحراف وكورتوز مميزين. من الجدير بالذكر أن متغير InCTO يظهر انحرافًا كبيرًا عن التوزيع الطبيعي وفقًا لاختبار جاركي-بيرا.
3.2. النتائج الاقتصادية القياسية
3.2.1. أفضل خمس اقتصادات في جنوب شرق آسيا
| التابع: الناتج المحلي الإجمالي | ||||||||
| متغير | النموذج 2 | موديل 3 | النموذج 4 | النموذج 5 | النموذج 6 | النموذج 7 | النموذج 8 | |
| ج | -6.7361 (7.6469) | -5.5824 (5.3384)* | -7.0338 (5.0079)* | -6.6868 (7.0442)* | -3.2579 (1.7233)*** | -6.4666 (7.1683)* | -4.0041 (2.4469)* | |
| ك | 0.6469 (54.175)* | 0.6858 (62.321)* | 0.7204 (33.456)* | 0.6837 (64.423)* | 0.6398 (19.521)* | 0.6774 (56.829)* | 0.6459 (20.365)* | |
| ل | 1.0779 (18.763)* | 0.9639 (13.316)* | 0.9841 (11.048)* | 1.0296 (15.447)* | 0.9246 (8.3071)* | 1.0326 (15.735)* | 0.9553 (9.2118)* | |
| INS | 0.0549 (3.5426)* | |||||||
| HCR | المعامل (إحصاء t) | -0.0413 (2.5036)** | -0.0234 (0.8592) | |||||
| MKS | -0.0265 (2.0391)** | |||||||
| نظام دعم الأعمال | -0.1128 (3.0967)* | |||||||
| KTO | -0.0539 (3.6992)* | |||||||
| المدير التنفيذي للتكنولوجيا | -0.1066 (3.5568)* | |||||||
| صفة
|
0.9999 | 0.9999 | 0.9998 | 0.9998 | 0.9998 | 0.9999 | 0.9998 | |
| احتمال F-stat. | 0.0000 | 0.0000 | 0.0000 | 0.0000 | 0.0000 | 0.0000 | 0.0000 | |
| التابع: الناتج المحلي الإجمالي | |||||||
| بلد | متغير | النموذج 9 | النموذج 10 | النموذج 11 | النموذج 12 | النموذج 13 | |
| ج | 3.3662 (0.9854) | 24.6069 (3.2851)* | 2.7129 (0.4139) | 6.1256 (7.5906)* | -0.0725 (0.0273) | ||
| ك | 1.0066 (8.4475)* | 1.1533 (20.889)* | 0.4431 (2.0713)** | 0.1959 (7.5459)* | 0.7605 (41.545)* | ||
| ل | -0.1023 (0.2582) | -1.6235 (4.4988)* | 1.1769 (2.4126)** | 1.1443 (21.078)* | 0.5888 (3.2508)* | ||
| إندونيسيا | جي | المعامل (إحصاء t) | -0.1661 (2.6284)* | ||||
| تايلاند | مؤشر الابتكار العالمي | 0.2355 (2.1845)** | |||||
| سنغافورة | مؤشر الابتكار العالمي | -1.1944 (2.2558)** | |||||
| ماليزيا | جي | -0.6369 (8.9384)* | |||||
| فيتنام | مؤشر الابتكار العالمي | -0.2686 (5.3724)* | |||||
| صفة
|
0.9957 | 0.9823 | 0.8329 | 0.9979 | 0.9988 | ||
| احتمال F | 0.0000 | 0.0000 | 0.0000 | 0.0000 | 0.0000 | ||
3.2.2. إندونيسيا
النمو. كما هو موضح في الجدول 6، تشير النتائج إلى أن
| التابع: الناتج المحلي الإجمالي | ||||||||
| متغير | النموذج 14 | النموذج 15 | النموذج 16 | النموذج 17 | النموذج 18 | النموذج 19 | النموذج 20 | |
| ج | -2.1031 (1.7193)*** | -7.1319 (3.8276)* | -2.9414 (3.0928)* | -4.4878 (3.0843)* | 1.8862 (1.2569) | 0.0498 (0.0145) | ٤.٦٣٨٢ (١.٤٤٢٤) | |
| ك | 0.8919 (20.561)* | 0.9081 (11.245)* | 1.4141 (20.362)* | 0.9488 (13.412)* | 0.8624 (15.658)* | 0.9331 (8.3507)* | 0.9811 (9.9563)* | |
| ل | 0.3716 (2.5806)* | 0.5981 (2.5993)* | -0.5304 (3.4171)* | 0.4159 (2.0801)** | 0.2333 (1.3116) | 0.1954 (0.5056) | -0.1428 (0.4099) | |
| INS | 0.0411 (5.7311)* | |||||||
| HCR | المعامل (إحصاء t) | 0.1197 (3.3658)* | -0.2182 (8.848)* | |||||
| MKS | -0.0848 (3.8795)* | |||||||
| نظام دعم الأعمال | -0.0659 (5.9561)* | |||||||
| KTO | -0.0588 (1.6734)*** | |||||||
| المدير التنفيذي للتكنولوجيا | -0.0504 (3.3247) | |||||||
| صفة
|
0.9991 | 0.9365 | 0.9443 | 0.9475 | 0.9983 | 0.9226 | 0.9964 | |
| احتمال F-stat. | 0.0000 | 0.0000 | 0.0000 | 0.0000 | 0.0000 | 0.0000 | 0.0000 | |
بطريقة تقليدية، مما قد يبطئ النمو الاقتصادي العام.
3.2.3. تايلاند
3.2.4. سنغافورة
| التابع: الناتج المحلي الإجمالي | ||||||||
| متغير | النموذج 21 | النموذج 22 | النموذج 23 | النموذج 24 | النموذج 25 | النموذج 26 | النموذج 27 | |
| ج | 32.8209 (5.7529)* | 32.8068 (11.662)* | 41.7657 (9.4381)* | ٣٨.٩٢٤٩ (٨.٤٧٥٩)* | 10.6764 (2.0291)** | 31.5368 (4.0831)* | -4.1918 (1.4211) | |
| ك | 1.0494 (24.695)* | 1.1101 (59.103)* | 1.2191 (19.215)* | 1.0751 (34.231) | 0.9966 (34.865)* | 1.1127 (18.159)* | 1.4094 (46.413)* | |
| ل | -1.8939 (6.5581)* | -1.9857 (14.351)* | -2.6419 (10.773) | -2.2798 (9.8253)* | -0.4899 (1.5478) | -1.8966 (4.9265)* | -0.3753 (2.9416)* | |
| INS | 0.0833 (3.1391)* | |||||||
| HCR | المعامل (إحصاء t) | 0.0644 (5.7907)* | -0.0942 (3.4238)* | |||||
| MKS | 0.0648 (2.3976)** | |||||||
| نظام دعم الأعمال | -0.1663 (7.0872)* | |||||||
| KTO | -0.0404 (0.9289) | |||||||
| المدير التنفيذي للتكنولوجيا | 0.1424 (10.921)* | |||||||
| صفة
|
0.9903 | 0.8892 | 0.9947 | 0.8731 | 0.9947 | 0.9796 | 0.8881 | |
| احتمال F | 0.0000 | 0.0000 | 0.0000 | 0.0000 | 0.0000 | 0.0000 | 0.0000 | |
| التابع: الناتج المحلي الإجمالي | ||||||||
| متغير | النموذج 28 | النموذج 29 | النموذج 30 | النموذج 31 | النموذج 32 | النموذج 33 | النموذج 34 | |
| ج | -4.5249 (0.8918) | -7.8257 (2.5256)** | -33.2449 (19.606)* | 1.3305 (0.4217) | -50.8822 (6.0513)* | -7.0489 (1.3545) | 1.0594 (0.2187) | |
| ك | 0.1822 (0.7799) | -0.0499 (0.4032) | 0.9665 (13.605)* | -0.1292 (1.2061) | 0.8329 (5.9227)* | 0.2394 (0.9969) | 1.7433 (7.2755)* | |
| ل | 0.4748 (0.6007) | 2.3179 (9.3134)* | 2.5927 (21.714)* | 2.0699 (11.861)* | 3.3432 (6.2486)* | 1.8605 (3.9331)* | -1.0085 (2.1305)** | |
| INS | 4.3071 (2.1256)** | |||||||
| HCR | المعامل (إحصاء t) | 0.2471 (2.3373)** | -0.8532 (17.316)* | |||||
| MKS | -0.5475 (3.3427)* | |||||||
| نظام دعم الأعمال | 1.4811 (5.7932)* | |||||||
| KTO | -0.0535 (0.3367) | |||||||
| المدير التنفيذي للتكنولوجيا | -0.9321 (3.3082)* | |||||||
| صفة
|
0.8289 | 0.9421 | 0.9864 | 0.6711 | 0.9386 | 0.8128 | 0.8789 | |
| احتمال F | 0.0000 | 0.0000 | 0.0000 | 0.0000 | 0.0000 | 0.0000 | 0.0000 | |
تؤثر بشكل إيجابي، بينما تظهر ثلاثة مؤشرات (IFR وMKS وCTO) تأثيرًا سلبيًا على النمو الاقتصادي. بالإضافة إلى ذلك، وُجد أن مؤشرًا واحدًا (KTO) ليس له تأثير كبير. على وجه التحديد،
نمو بواسطة
| التابع: الناتج المحلي الإجمالي | ||||||||
| متغير | النموذج 35 | النموذج 36 | النموذج 37 | النموذج 38 | النموذج 39 | النموذج 40 | النموذج 41 | |
| ج | -6.3347 (9.7289) | -11.2451 (26.799)* | -12.3581 (10.873)* | -10.1546 (49.589)* | -8.1957 (17.944)* | -12.1297 (28.243)* | -1.4708 (2.7945)* | |
| ك | 0.2805 (9.1826) | 0.4028 (21.551)* | 0.4428 (10.551)* | 0.2571 (36.782)* | 0.3648 (43.921)* | 0.4046 (20.037)* | 0.3171 (16.189)* | |
| ل | 1.7218 (36.533)* | 1.7353 (67.041)* | 1.7408 (56.595)* | 1.8749 (145.49)* | 1.5999 (74.958)* | 1.7543 (57.201)* | 1.3043 (33.609)* | |
| INS | -0.4094 (4.8722)* | |||||||
| HCR | المعامل (إحصاء t) | -0.0764 (2.1818) | -0.0834 (2.1619)** | |||||
| MKS | 0.0415 (3.9742)* | |||||||
| نظام دعم الأعمال | -0.0251 (2.2497)** | |||||||
| KTO | 0.0663 (2.5328)** | |||||||
| المدير التنفيذي للتكنولوجيا | -0.1813 (9.0827)* | |||||||
| صفة
|
0.9932 | 0.9971 | 0.9965 | 0.9997 | 0.9602 | 0.9971 | 0.9979 | |
| احتمال إحصاء F | 0.0000 | 0.0000 | 0.0000 | 0.0000 | 0.0000 | 0.0000 | 0.0000 | |
3.2.5. ماليزيا
3.2.6. فيتنام
3.3. المناقشة
| التابع: الناتج المحلي الإجمالي | ||||||||
| متغير | النموذج 42 | النموذج 43 | النموذج 44 | النموذج 45 | النموذج 46 | النموذج 47 | النموذج 48 | |
| ج | ٤.٥٠١٦ (١.٣١٦٢) | 4.9228 (2.0548)** | -4.6112 (2.1991)** | ٤.٥٤٨٦ (١.٢٩٥٧) | 0.9388 (0.5788) | -1.3849 (0.6387) | 6.6392 (1.7846)*** | |
| ك | 0.8114 (25.164)* | 0.7769 (45.698)* | 0.8013 (48.361)* | 0.7884 (31.077)* | 0.8011 (78.414)* | 0.7259 (51.973)* | 0.7579 (30.153)* | |
| ل | 0.2014 (0.8416) | 0.2437 (1.4949) | 0.7357 (5.3558)* | 0.2369 (0.9898) | 0.3853 (3.6501)* | 0.6932 (4.6457)* | 0.1871 (0.7663) | |
| INS | -0.1045 (2.4131)* | |||||||
| HCR | المعامل (إحصاء t) | -0.1164 (5.2764)* | -0.1322 (5.7299)* | |||||
| MKS | -0.0752 (2.9234)* | |||||||
| نظام دعم الأعمال | 0.0637 (4.5464)* | |||||||
| KTO | -0.0879 (5.8499)* | |||||||
| المدير التنفيذي للتكنولوجيا | -0.1235 (2.5147)** | |||||||
| صفة
|
0.9975 | 0.9988 | 0.9991 | 0.9975 | 0.9581 | 0.9561 | 0.9973 | |
| احتمال إحصاء F | 0.0000 | 0.0000 | 0.0000 | 0.0000 | 0.0000 | 0.0000 | 0.0000 | |
يكشف عن معامل سلبي متناقض، مما يشير إلى أن زيادة الابتكار قد تت correspond مع انخفاض في النمو الاقتصادي في أعلى خمس دول في جنوب شرق آسيا. هذه الفجوة تبرز تعقيد العلاقة بين الابتكار والنمو الاقتصادي وتؤكد على أهمية فحص المكونات المحددة والأطر المؤسسية المحيطة بالابتكار. كما هو موضح في الجدول 12، بينما ترتبط المؤسسات إيجابيًا بالنمو الاقتصادي، فإن مؤشرات رئيسية أخرى، مثل رأس المال البشري والبحث، وتعقيد السوق، وتعقيد الأعمال، ومخرجات المعرفة والتكنولوجيا، تظهر آثارًا سلبية. تدعم نتائج اللجنة أيضًا نتائج كل دولة، مما يشير إلى أن مؤشر الابتكار العالمي في تايلاند فقط له علاقة إيجابية مع النمو الاقتصادي، بينما تظهر إندونيسيا وسنغافورة وماليزيا وفيتنام جميعها تأثيرًا سلبيًا. تدعو هذه النتائج إلى فهم دقيق لنظام الابتكار في هذه الدول، مما يشير إلى وجود فجوات محتملة في دعم السياسات التي قد تعيق القوة التحويلية للابتكار على التنمية الاقتصادية [63-66].
التدخلات السياسية المستهدفة، والاستثمارات في البنية التحتية الحيوية، وتطوير التعليم والمهارات، وتعزيز بيئة الأعمال المواتية يمكن أن يساعد في فتح إمكانيات الابتكار في إندونيسيا ودفع النمو الاقتصادي المستدام [67-73].
| متغير | لجنة | سلاسل زمنية | ||||
| أعلى خمس دول في جنوب شرق آسيا | إندونيسيا | تايلاند | سنغافورة | ماليزيا | فيتنام | |
| مؤشر الابتكار العالمي |
|
|
|
|
|
|
| INS |
|
|
|
|
|
|
| HCR |
|
|
|
|
X |
|
| IFR | X |
|
|
|
|
|
| MKS |
|
|
|
|
|
|
| BSS |
|
|
|
|
|
|
| KTO |
|
|
X |
|
|
|
| CTO |
|
X |
|
|
|
|
على الرغم من أن مشهد الابتكار في سنغافورة قوي، إلا أن القطاعات الداعمة الضرورية لاستدامة النمو الاقتصادي لا تزال متخلفة. تبرز هذه الفجوة التفاعل المعقد للعوامل التي تشكل مسار الاقتصاد في سنغافورة، مما يتطلب نهجًا دقيقًا لمعالجة الفجوات وتعزيز التنمية الشاملة عبر جميع القطاعات [77-79].
4. الاستنتاجات والتوصيات السياسية
زيادة الابتكار غالبًا ما تت correspond مع انخفاض في النمو الاقتصادي. بينما تظهر بعض الدول مثل تايلاند تأثيرات إيجابية للابتكار على النمو الاقتصادي، تواجه دول أخرى مثل إندونيسيا وسنغافورة وماليزيا وفيتنام تحديات حيث تعيق بعض مكونات نظام الابتكار النمو الاقتصادي بدلاً من تسهيله. تبرز هذه الفجوة المثيرة للاهتمام الطبيعة المعقدة للعلاقة بين الابتكار والازدهار الاقتصادي في جنوب شرق آسيا، مما يبرز ضرورة فهم دقيق للمكونات المتميزة والأطر المؤسسية المحيطة بالابتكار.
السياقات لكل دولة وهي ضرورية لفتح إمكانيات الابتكار كقوة دافعة للنمو الاقتصادي المستدام في جنوب شرق آسيا.
بيان توفر البيانات: البيانات متاحة عند الطلب.
الشكر: يعبر المؤلفون عن امتنانهم لمؤسساتهم وجامعاتهم.
References
- Carlaw, K. I., and Lipsey, R. G. (2003). Productivity, Technology and Economic Growth: What is the Relationship?, Journal of Economic Surveys, Vol. 17, No. 3, 457-495. doi:10.1111/14676419.00201.
- Kim, Y. E., Loayza, N., and Balcazar, C. M. M. C. (2016). Productivity as the Key to Economic Growth and Development, World Bank Research and Policy Briefs, No. 108092.
- Gardiner, B., Martin, R., and Tyler, P. (2012). Competitiveness, Productivity and Economic Growth Across the European Regions, Regional Competitiveness, Routledge, 55-77.
- Rauf, A., Ali, N., Sadiq, M. N., Abid, S., Kayani, S. A., and Hussain, A. (2023). Foreign Direct Investment, Technological Innovations, Energy Use, Economic Growth, and Environmental Sustainability Nexus: New Perspectives in BRICS Economies, Sustainability, Vol. 15, No. 18, 14013. doi:10.3390/su151814013.
- McMillan, M., and Rodrik, D. (2011). Globalization, Structural Change and Productivity Growth, Cambridge, MA. doi:10.3386/w17143.
- Khan, S. A. R., Godil, D. I., Quddoos, M. U., Yu, Z., Akhtar, M. H., and Liang, Z. (2021). Investigating the Nexus between Energy, Economic Growth, and Environmental Quality: A Road Map for the Sustainable Development, Sustainable Development, Vol. 29, No. 5, 835-846. doi:10.1002/sd.2178.
- Haseeb, A., Xia, E., Saud, S., Usman, M., and Quddoos, M. U. (2023). Unveiling the Liaison between Human Capital, Trade Openness, and Environmental Sustainability for BRICS Economies: Robust Panel-data Estimation, Natural Resources Forum, Vol. 47, No. 2, 229-256. doi:10.1111/1477-8947.12277.
- Hardi, I., Idroes, G. M., Hardia, N. A. K., Fajri, I., Furqan, N., Noviandy, T. R., and Utami, R. T. (2023). Assessing the Linkage Between Sustainability Reporting and Indonesia’s Firm Value: The Role of Firm Size and Leverage, Indatu Journal of Management and Accounting, Vol. 1, No. 1, 21-28. doi:10.60084/ijma.v1i1.79.
- Thurik, R., and Wennekers, S. (2004). Entrepreneurship, Small Business and Economic Growth, Journal of Small Business and Enterprise Development, Vol. 11, No. 1, 140-149. doi:10.1108/14626000410519173.
- Acs, Z. J., and Szerb, L. (2007). Entrepreneurship, Economic Growth and Public Policy, Small Business Economics, Vol. 28, Nos. 2-3, 109-122. doi:10.1007/s11187-006-9012-3.
- Ali, N., Phoungthong, K., Khan, A., Abbas, S., Dilanchiev, A., Tariq, S., and Sadiq, M. N. (2023). Does FDI Foster Technological Innovations? Empirical Evidence from BRICS Economies, PLOS ONE, Vol. 18, No. 3, e0282498. doi:10.1371/journal.pone. 0282498.
- Ahluwalia, G. K., Kumar, D., Bhat, R. S., and Ray, S. (2023). A Study on Demand and Supply Side Forces of Global Space Economy and Its Various Determinants, European Economic Letters (EEL), Vol. 13, No. 4, 174-186.
- Hardi, I., Idroes, G. M., Utami, R. T., Dahlia, P., Mirza, M. A. F., Humam, R. A., Chairunnisa, R., Hardia, N. A. K., and Mahdani, R. (2023). Dynamic Impact of Inflation and Exchange Rate in Indonesia’s Top 10 Market Capitalization Companies: Implications for Stock Prices, Indatu Journal of Management and Accounting, Vol. 1, No. 2, 51-59. doi:10.60084/ijma.v1i2.110.
- Hipple, S. (1997). Worker Displacement in an Expanding Economy, Monthly Lab. Rev., Vol. 120, 26.
- Krebs, T. (2007). Job Displacement Risk and the Cost of Business Cycles, American Economic Review, Vol. 97, No. 3, 664-686. doi:10.1257/aer.97.3.664.
- Morrison, A., Breen, J., and Ali, S. (2003). Small Business Growth: Intention, Ability, and Opportunity, Journal of Small Business Management, Vol. 41, No. 4, 417-425. doi:10.1111/1540627X. 00092.
- Taiwo, M. A., Ayodeji, A. M., and Yusuf, B. A. (2013). Impact of Small and Medium Enterprises on Economic Growth and Development, American Journal of Business and Management, Vol. 2, No. 1, 18. doi:10.11634/21679606170644.
- Idroes, G. M., Syahnur, S., Majid, M. S. A., Idroes, R., Kusumo, F., and Hardi, I. (2023). Unveiling the Carbon Footprint: Biomass vs. Geothermal Energy in Indonesia, Ekonomikalia Journal of Economics, Vol. 1, No. 1, 10-18. doi:10.60084/eje.v1i1.47.
- Idroes, G. M., Hardi, I., Nasir, M., Gunawan, E., Maulidar, P., and Maulana, A. R. R. (2023). Natural Disasters and Economic Growth in Indonesia, Ekonomikalia Journal of Economics, Vol. 1, No. 1, 33-39. doi:10.60084/eje.v1i1.55.
- Ray, S., and Hardi, I. (2024). Refining ESG Disclosure’s Role in Corporate Economic, Environmental, and Social Sustainability Performance, Indatu Journal of Management and Accounting, Vol. 2, No. 1, 1-8. doi:10.60084/ijma.v2i1.144.
- Dobrotă, C. E., Marcu, N., Siminică, M., and Nețoiu, L. M. (2019). Disparities, Gaps and Evolution Trends of Innovation, as a Vector, Romanian Journal of Economic Forecasting, Vol. 22, No. 4, 174.
- Cornett, A. P., and Sørensen, N. K. (2013). Innovation and Regional Disparities-a Survey of Regional Growth Drivers and Economic Performance: Andreas P. Cornett and Nils Karl Sørensen, Innovation, Technology and Knowledge, Routledge, 98-125.
- Hardi, I., Saputra, J., Hadiyani, R., Maulana, A. R. R., and Idroes, G. M. (2023). Decrypting the Relationship Between Corruption and Human Development: Evidence from Indonesia, Ekonomikalia Journal of Economics, Vol. 1, No. 1, 1-9. doi:10.60084/eje.v1i1.22.
- Alcouffe, A., and Kuhn, T. (2004). Schumpeterian Endogenous Growth Theory and Evolutionary Economics, Journal of Evolutionary Economics, Vol. 14, No. 2, 223-236. doi:10.1007/s00191-004-0205-0.
- Verspagen, B. (2007). Innovation and Economic Growth Theory: A Schumpeterian Legacy and Agenda, Perspectives on Innovation, 42-63.
- Aghion, P., Akcigit, U., and Howitt, P. (2015). Lessons from Schumpeterian Growth Theory, American Economic Review, Vol. 105, No. 5, 94-99. doi:10.1257/aer.p20151067.
- World Intellectual Property Organization. (2023). Global Innovation Index 2023, from https://www.wipo.int/global_innovation_index/en/2023.
- Booth, A. (2013). Education and Economic Development in Southeast Asia: Myths and Realities, Southeast Asian Paper Tigers, Routledge, 173-195.
- Ullah, A. K. M. A., Mohamad, S. M., Hassan, N. H., and Chattoraj, D. (2019). Global Skills Deficiency: Perspectives of Skill Mobility in Southeast Asian Countries, Asian Education and Development Studies, Vol. 8, No. 4, 416-432. doi:10.1108/AEDS-12-2018-0185.
- Bhaskaran, M. (2010). Review of Southeast Asian Economic Developments, Southeast Asian Affairs, 23-43.
- Basri, M. C., and Hill, H. (2020). The Southeast Asian Economies in the Age of Discontent, Asian Economic Policy Review, Vol. 15, No. 2, 185-209. doi:10.1111/aepr. 12305.
- Hardi, I., Dawood, T. C., and Syathi, P. B. (2021). Determinants Comparative Advantage of Non-Oil Export 34 Provinces in Indonesia, International Journal of Business, Economics, and Social Development, Vol. 2, No. 3, 98-106. doi:10.46336/ijbesd.v2i3.137.
- Bong, A., and Premaratne, G. (2018). Regional Integration and Economic Growth in Southeast Asia, Global Business Review, Vol. 19, No. 6, 1403-1415. doi:10.1177/0972150918794568.
- Jones, L., and Hameiri, S. (2020). Southeast Asian Regional Governance: Political Economy, Regulatory Regionalism and ASEAN Integration, 199-224. doi:10.1007/978-3-030-28255-4_8.
- Hardi, I., Ringga, E. S., Fijay, A. H., Maulana, A. R. R., Hadiyani, R., and Idroes, G. M. (2023). Decomposed Impact of Democracy on Indonesia’s Economic Growth, Ekonomikalia Journal of Economics, Vol. 1, No. 2, 51-60. doi:10.60084/eje.v1i2.80.
- Jones, G. W. (2002). Southeast Asian Urbanization and the Growth of Mega-Urban Regions, Journal of Population Research, Vol. 19, No. 2, 119-136. doi:10.1007/BF03031973.
- Yap, K. S. (2011). Urban Challenges in Southeast Asia, UN ESCAP.
- Hasan, I., and Tucci, C. L. (2010). The Innovation-Economic Growth Nexus: Global Evidence, Research Policy, Vol. 39, No. 10, 1264-1276. doi:10.1016/j.respol.2010.07.005.
- Thompson, M. (2018). Social Capital, Innovation and Economic Growth, Journal of Behavioral and Experimental Economics, Vol. 73, 46-52. doi:10.1016/j.socec.2018.01.005.
- Bilbao-Osorio, B., and Rodríguez-Pose, A. (2004). From R&D to Innovation and Economic Growth in the EU, Growth and Change, Vol. 35, No. 4, 434-455. doi:10.1111/j.14682257.2004.00256.x.
- Pece, A. M., Simona, O. E. O., and Salisteanu, F. (2015). Innovation and Economic Growth: An Empirical Analysis for CEE Countries, Procedia Economics and Finance, Vol. 26, 461-467. doi:10.1016/S2212-5671(15)00874-6.
- Maradana, R. P., Pradhan, R. P., Dash, S., Gaurav, K., Jayakumar, M., and Chatterjee, D. (2017). Technological Innovation and
43. Broughel, J., and Thierer, A. D. (2019). Technological Innovation and Economic Growth: A Brief Report on the Evidence, SSRN Electronic Journal. doi:10.2139/ssrn. 3346495.
44. Degelsegger-Márquez, A., Remøe, S. O., and Trienes, R. (2018). Regional Knowledge Economies and Global Innovation Networks – The Case of Southeast Asia, Journal of Science and Technology Policy Management, Vol. 9, No. 1, 66-86. doi:10.1108/JSTPM-06-2017-0027.
45. Mughal, N., Arif, A., Jain, V., Chupradit, S., Shabbir, M. S., RamosMeza, C. S., and Zhanbayev, R. (2022). The Role of Technological Innovation in Environmental Pollution, Energy Consumption and Sustainable Economic Growth: Evidence from South Asian Economies, Energy Strategy Reviews, Vol. 39, 100745. doi:10.1016/j.esr.2021.100745.
46. Qamruzzaman, M., and Jianguo, W. (2017). Financial Innovation and Economic Growth in Bangladesh, Financial Innovation, Vol. 3, No. 1, 19. doi:10.1186/s40854-017-0070-0.
47. Meirun, T., Mihardjo, L. W., Haseeb, M., Khan, S. A. R., and Jermsittiparsert, K. (2021). The Dynamics Effect of Green Technology Innovation on Economic Growth and CO2 Emission in Singapore: New Evidence from Bootstrap ARDL Approach, Environmental Science and Pollution Research, Vol. 28, No. 4, 4184-4194. doi:10.1007/s11356-020-10760-w.
48. Sulaiman, N. F. C. H. E., Saputra, J., and Muhamad, S. (2021). Effects of Human Capital and Innovation on Economic Growth in Selected ASEAN Countries: Evidence from Panel Regression Approach, The Journal of Asian Finance, Economics and Business (JAFEB), Vol. 8, No. 7, 43-54. doi: 10.13106/jafeb.2021.vol8.no7.0043.
49. Lv, L., Yin, Y., and Wang, Y. (2020). The Impact of R&D Input on Technological Innovation: Evidence from South Asian and Southeast Asian Countries, Discrete Dynamics in Nature and Society, Vol. 2020, 6408654. doi:10.1155/2020/6408654.
50. Sultanuzzaman, M. R., Fan, H., Mohamued, E. A., Hossain, M. I., and Islam, M. A. (2019). Effects of Export and Technology on Economic Growth: Selected Emerging Asian Economies, Economic Research-Ekonomska Istraživanja, Vol. 32, No. 1, 2515-2531. doi:10.1080/1331677X.2019.1650656.
51. International Monetary Fund. (2023). IMF DataMapper, from https://www.imf.org/external/datamapper/datasets.
52. World Bank. (2023). World Development Indicators, from https://databank.worldbank.org/source/world-developmentindicators.
53. World Intellectual Property Organization. (2023). Global Innovation Index – All Editions, from https://www.wipo.int/global_innovation_index.
54. Romer, P. M. (1994). The Origins of Endogenous Growth, Journal of Economic Perspectives, Vol. 8, No. 1, 3-22. doi:10.1257/jep.8.1.3.
55. Chirwa, T. G., and Odhiambo, N. M. (2018). Exogenous and Endogenous Growth Models: A Critical Review, Comparative Economic Research. Central and Eastern Europe, Vol. 21, No. 4, 63-84. doi:10.2478/cer-2018-0027.
56. Fatás, A. (2000). Endogenous Growth and Stochastic Trends, Journal of Monetary Economics, Vol. 45, No. 1, 107-128. doi:10.1016/S0304-3932(99)00043-4.
57. Gluzmann, P., and Panigo, D. (2015). Global Search Regression: A New Automatic Model-Selection Technique for Cross-Section, Time-Series, and Panel-Data Regressions, The Stata Journal: Promoting Communications on Statistics and Stata, Vol. 15, No. 2, 325-349. doi:10.1177/1536867X1501500201.
58. Aşıcı, A. A. (2013). Economic Growth and Its Impact on Environment: A Panel Data Analysis, Ecological Indicators, Vol. 24, 324-333. doi:10.1016/j.ecolind.2012.06.019.
59. Teixeira, A. A. C., and Queirós, A. S. S. (2016). Economic Growth, Human Capital and Structural Change: A Dynamic Panel Data Analysis, Research Policy, Vol. 45, No. 8, 1636-1648. doi:10.1016/j.respol.2016.04.006.
60. Inglesi-Lotz, R. (2016). The impact of renewable energy consumption to economic growth: A panel data application, Energy Economics, Vol. 53, 58-63. doi:10.1016/j.eneco.2015.01.003.
61. El Ghaoui, L., and Lebret, H. (1997). Robust Solutions to LeastSquares Problems with Uncertain Data, SIAM Journal on Matrix Analysis and Applications, Vol. 18, No. 4, 1035-1064. doi:10.1137/S0895479896298130.
62. McWilliams, B., Krummenacher, G., Lucic, M., and Buhmann, J. M. (2014). Fast and Robust Least Squares Estimation in Corrupted Linear Models, Z. Ghahramani; M. Welling; C. Cortes; N. Lawrence; K. Q. Weinberger (Eds.), Advances in Neural Information Processing Systems (Vol. 27), Curran Associates, Inc.
63. Gordon, R. (2018). Why Has Economic Growth Slowed When Innovation Appears to be Accelerating?Cambridge, MA. doi:10.3386/w24554.
64. Hu, A. G. (2015). Innovation and Economic Growth in East Asia: An Overview, Asian Economic Policy Review, Vol. 10, No. 1, 1937. doi:10.1111/aepr.12078.
65. Litsareva, E. (2017). Success Factors of Asia-Pacific FastDeveloping Regions’ Technological Innovation Development and Economic Growth, International Journal of Innovation Studies, Vol. 1, No. 1, 72-88. doi:10.3724/SP.J.1440.101006.
66. Idroes, G. M., Hardi, I., Noviandy, T. R., Sasmita, N. R., Hilal, I. S., Kusumo, F., and Idroes, R. (2023). A Deep Dive into Indonesia’s CO2 Emissions: The Role of Energy Consumption, Economic Growth and Natural Disasters, Ekonomikalia Journal of Economics, Vol. 1, No. 2, 69-81. doi:10.60084/eje.v1i2.115.
67. Nurmalia, Hartono, D., and Muzayanah, I. F. U. (2020). The Roles of Entrepreneurship on Regional Economic Growth in Indonesia, Journal of the Knowledge Economy, Vol. 11, No. 1, 28-41. doi:10.1007/s13132-018-0557-6.
68. Busroh, F. F. (2018). Assessing the Role of IPR Legislations for Technology, Innovation and Economic Growth in Indonesia, Int. J. Manag. Bus. Res, Vol. 8, No. 3, 227-236.
69. Aritenang, A. F. (2021). The Importance of Agglomeration Economies and Technological Level on Local Economic Growth: The Case of Indonesia, Journal of the Knowledge Economy, Vol. 12, No. 2, 544-563. doi:10.1007/s13132-021-00735-8.
70. DamuRi, Y. R., Aswicahyono, H., and Christian, D. (2018). Innovation Policy in Indonesia, Innovation Policy in ASEAN, 96127.
71. Widarni, E. L., and Bawono, S. (2021). Human Capital, Technology, and Economic Growth: A Case Study of Indonesia, The Journal of Asian Finance, Economics and Business (JAFEB), Vol. 8, No. 5, 29-35.
72. Hardi, I., Idroes, G. M., Zulham, T., Suriani, S., and Saputra, J. (2023). Economic Growth, Agriculture, Capital Formation and Greenhouse Gas Emissions in Indonesia: FMOLS, DOLS and CCR
73. Maulidar, P., Fitriyani, F., Sasmita, N. R., Hardi, I., and Idroes, G. M. (2024). Exploring Indonesia’s CO2 Emissions: The Impact of Agriculture, Economic Growth, Capital and Labor, Grimsa Journal of Business and Economics Studies, Vol. 1, No. 1, 43-55. doi:10.61975/gjbes.v1i1.22.
74. Intarakumnerd, P., Chairatana, P., and Tangchitpiboon, T. (2002). National Innovation System in Less Successful Developing Countries: The Case of Thailand, Research Policy, Vol. 31, Nos. 8-9, 1445-1457. doi:10.1016/S0048-7333(02)00074-4.
75. Iamratanakul, S. (2014). A Framework of the Innovation System: A Case of Thailand, International Journal of Economic Policy in Emerging Economies, Vol. 7, No. 2, 111. doi:10.1504/IJEPEE.2014.063187.
76. Joseph, K. J. (2006). Thailand: From Investment-led Growth to Innovation-led Growth, Information Technology, Innovation System and Trade Regime in Developing Countries, Palgrave Macmillan UK, London, 53-85. doi:10.1057/9780230626331_3.
77. Bellows, T. J. (2006). Economic Challenges and Political Innovation: The Case of Singapore, Asian Affairs: An American Review, Vol. 32, No. 4, 231-255. doi:10.3200/AAFS.32.4.231-255.
78. Chew, S. B., and Chew, R. (2003). Promoting Innovation in Singapore: Changing the Mindset, International Journal of Entrepreneurship and Innovation Management, Vol. 3, No. 3, 249. doi:10.1504/IJEIM.2003.003284.
79. Robinson, E. (2018). Globalisation in a Small Open Economy: The Singapore Experience, BIS Papers Chapters, Vol. 100, 321-329.
80. Rasiah, R., and Yap, X.-S. (2015). Innovation Performance of the Malaysian Economy, The Global Innovation Index, Vol. 139.
81. Law, S. H., Sarmidi, T., and Goh, L. T. (2020). Impact of Innovation on Economic Growth: Evidence From Malaysia, Malaysian Journal of Economic Studies, Vol. 57, No. 1, 113-132.
82. Akoum, I. (2016). Research, Development and Innovation in Malaysia: Elements of an Effective Growth Model, Asian Economic and Financial Review, Vol. 6, No. 7, 390. doi: 10.18488/journal.aefr/2016.6.7/102.7.390.403.
83. Bekhet, H. A., and Latif, N. W. A. (2017). Highlighting Innovation Policies and Sustainable Growth in Malaysia, International Journal of Innovation, Management and Technology, Vol. 8, No. 3, 228-239. doi: 10.18178/ijimt.2017.8.3.734.
84. Nguyen Van Hiep, P. N. T. (2021). The Role of Science and Technology in Growth Model Innovation in Vietnam (20102020), Journal of Hunan University Natural Sciences, Vol. 48, No. 1.
85. Mazyrin, V. M. (2013). Economic Modernization in Vietnam From Industrialization to Innovation Stage, VNU Journal of Economics And Business; Vol 29 No 2.
86. Nguyen, M. H. (2020). Domestic Innovation Activities and Economic Development in Vietnam, VNUHCM Journal of Economics, Business and Law, Vol. 4, No. 4, 1069-1080. doi: 10.32508/stdjelm.v4i4.629.
DOI: https://doi.org/10.60084/eje.v2i1.145
Publication Date: 2024-02-22
Innovation and Economic Growth in the Top Five Southeast Asian Economies: A Decomposition Analysis
Article History
Revised 10 February 2024
Accepted 16 February 2024
Available Online 22 February 2024
Keywords:
Global innovation index
Indonesia
Thailand
Singapore
Malaysia
Vietnam
Abstract
Innovation has the potential to act as a double-edged sword in impacting economic growth. While it serves as a powerful driver of economic advancement, it also carries risks alongside its benefits. Recognizing this duality, our study aims to fill the identified gap and add comprehensiveness to the literature by assessing the individual impact of innovation indicators on economic growth in the top five Southeast Asian (SEA) countries based on Gross Domestic Product (GDP): Indonesia, Thailand, Singapore, Malaysia, and Vietnam. The innovation aspect comprises 21 indicators from the Global Innovation Index (GII), grouped into seven categories: institution, human capital and research, infrastructure, market sophistication, business sophistication, knowledge and technology outputs, and creative outputs. Both panel analysis and country-specific assessments consistently conclude that innovation significantly influences economic growth. However, delving into the categorized indicators reveals intriguing insights. While all the indicators demonstrate a notable impact, most of them are found to hinder rather than foster economic growth. This compelling empirical evidence underscores that innovation in the selected countries has yet to be optimized, highlighting the urgent need to implement innovation-friendly policies, including removing innovation barriers, targeting investment in key sectors, and fostering education and skills development. This holistic approach aims to cultivate an environment conducive to innovation, thereby solidifying innovation’s role as one of the primary drivers of economic growth.
1. Introduction
contributing to overall economic expansion [5-8]. Furthermore, innovation stimulates entrepreneurship and creates new business opportunities. As industries evolve and adapt to innovative ideas, they become more competitive globally, attracting investments and spurring further growth [9-13].
| Variable | Symbol | Description | Units (Sources) | Variable’s detail |
| Dependent | GDP | Gross domestic product | Constant LCU (WDI) | The sum of gross value added by all resident producers in the economy. |
| Control | K | Gross fixed capital formation | Constant LCU (WDI) | The sum of gross value added by land improvements; plant, machinery, and equipment purchases; and the construction of public goods. |
| L | Labor force | Person (WDI) | Comprises people ages 15 and older who supply labor for producing goods and services during a specified period. | |
| Independent | GII | Global innovation index | Refers to a composite index that considers factors such as the institution, human capital and research, infrastructure, market sophistication, business sophistication, knowledge, technology, and creative outputs. | |
| INS | Institution | Refers to indicators such as political, regulatory, and business environment. | ||
| HCR | Human capital and research | Refers to indicators such as education, research, and development. | ||
| IFR | Infrastructure | Score between 1-100 (WIPO) | Refers to indicators such as information and communication technologies, general infrastructure, and ecological sustainability. | |
| MKS | Market sophistication | Refers to indicators such as credit, investment, trade, competition, and market scale. | ||
| BSS | Business sophistication | Refers to indicators such as knowledge workers, innovation linkages, and knowledge absorption. | ||
| KTO | Knowledge and technology outputs | Refers to indicators such as knowledge creation and impact, and knowledge diffusion. | ||
| CTO | Creative outputs | Refers to indicators such as intangible assets, creative goods and services, and online creativity. |
relationship between innovation and economic growth in the top five SEA nations.
2. Materials and Methods
2.1. Data and Variable
| Variable | Mean | Median | Max. | Min. | Std. Dev. | Skewness | Kurtosis | Jarque-Bera |
| InGDP | 31.46 | 29.94 | 37.00 | 26.61 | 4.16 | 0.25 | 1.27 | 16.24 |
| InK | 30.17 | 28.52 | 35.84 | 25.27 | 4.29 | 0.27 | 1.26 | 16.52 |
| InL | 17.12 | 17.51 | 18.74 | 14.94 | 1.25 | -0.52 | 2.10 | 9.48 |
| InGII | 3.69 | 3.64 | 4.15 | 3.28 | 0.24 | 0.37 | 2.27 | 5.32 |
| InINS | 4.12 | 4.09 | 4.56 | 3.23 | 0.29 | -0.24 | 3.17 | 1.29 |
| InHCR | 3.58 | 3.45 | 4.31 | 3.04 | 0.37 | 0.47 | 2.09 | 8.64 |
| InIFR | 3.76 | 3.76 | 4.24 | 3.20 | 0.25 | 0.02 | 2.64 | 0.67 |
| InMKS | 3.99 | 4.00 | 4.37 | 3.47 | 0.21 | -0.04 | 2.74 | 0.37 |
| InBSS | 3.64 | 3.57 | 4.37 | 2.86 | 0.36 | 0.18 | 2.40 | 2.47 |
| InKTO | 3.45 | 3.45 | 4.17 | 2.87 | 0.31 | -0.02 | 2.59 | 0.86 |
| InCTO | 3.52 | 3.55 | 3.82 | 2.86 | 0.21 | -1.20 | 4.47 | 39.82 |
2.2. Econometric Mode/
Here,
2.3. Methods
2.3.1. Panel Data Regression
| Panel Model | Chow Test | Hausman Test | Conclusion | ||
| Statistic | Prob. | Statistic | Prob. | ||
| GDP
|
70.5835* | 0.0000 | 89.6619* | 0.0000 | Best model: FEM |
| GDP
|
85.5728* | 0.0000 | 116.487* | 0.0000 | Best model: FEM |
| GDP
|
81.7211* | 0.0000 | 109.253* | 0.0000 | Best model: FEM |
| GDP
|
81.5004* | 0.0000 | 108.832* | 0.0000 | Best model: FEM |
| GDP
|
75.6375* | 0.0000 | 98.3251* | 0.0000 | Best model: FEM |
| GDP
|
83.6422* | 0.0000 | 112.866* | 0.0000 | Best model: FEM |
| GDP
|
81.1415* | 0.0000 | 108.206* | 0.0000 | Best model: FEM |
| GDP
|
85.3825* | 0.0000 | 116.078* | 0.0000 | Best model: FEM |
| Dependent: GDP | Model 1 | ||
| Variable | CEM | FEM | REM |
| C | 5.4694 | -3.5136 | 5.4694 |
| (7.0441)* | (2.0739)** | (9.2881)* | |
| K | 0.9506 | 0.7059 | 0.9506 |
| Coeff. | (391.66)* | (21.59)* | (516.44)* |
| L (t-stat.) | -0.0342 | 0.8787 | -0.0342 |
| (1.4406) | (7.8434)* |
|
|
| GII | -0.5708 | -0.3704 | -0.5708 |
| (5.1781)* | (3.6736)* | (6.8277)* | |
| Adj.
|
0.9998 | 0.9999 | 0.9998 |
| F-stat. Prob. | 0.0000 | 0.0000 | 0.0000 |
a standard Ordinary Least Squares (OLS) regression, FEM is preferred when there is a concern about time-invariant individual-specific effects, while REM is suitable when such effects are assumed to be uncorrelated with the independent variables [59, 60]. Subsequently, the Chow and Hausman tests are conducted to choose the best model from the three and serve as the main basis for interpreting the results of the panel model.
2.3.2. Robust Least Squares
3. Results and Discussion
3.1. Descriptive Statistics
positive skewness. InL displays a symmetric distribution with low variability and negative skewness, suggesting left skew and heavier tails. InGII, InINS, and InBSS show symmetric distributions with low variability and varying degrees of skewness and kurtosis, indicating departures from normality. InHCR, InIFR, InMKS, InKTO, and InCTO exhibit distributions with characteristics similar to other variables, but with distinct skewness and kurtosis. Notably, the InCTO variable demonstrates a significant departure from normality according to the Jarque-Bera test.
3.2. Econometric Results
3.2.1. Top Five Southeast Asian Economies
| Dependent: GDP | ||||||||
| Variable | Model 2 | Model 3 | Model 4 | Model 5 | Model 6 | Model 7 | Model 8 | |
| C | -6.7361 (7.6469) | -5.5824 (5.3384)* | -7.0338 (5.0079)* | -6.6868 (7.0442)* | -3.2579 (1.7233)*** | -6.4666 (7.1683)* | -4.0041 (2.4469)* | |
| K | 0.6469 (54.175)* | 0.6858 (62.321)* | 0.7204 (33.456)* | 0.6837 (64.423)* | 0.6398 (19.521)* | 0.6774 (56.829)* | 0.6459 (20.365)* | |
| L | 1.0779 (18.763)* | 0.9639 (13.316)* | 0.9841 (11.048)* | 1.0296 (15.447)* | 0.9246 (8.3071)* | 1.0326 (15.735)* | 0.9553 (9.2118)* | |
| INS | 0.0549 (3.5426)* | |||||||
| HCR | Coeff. (t-stat.) | -0.0413 (2.5036)** | -0.0234 (0.8592) | |||||
| MKS | -0.0265 (2.0391)** | |||||||
| BSS | -0.1128 (3.0967)* | |||||||
| KTO | -0.0539 (3.6992)* | |||||||
| CTO | -0.1066 (3.5568)* | |||||||
| Adj.
|
0.9999 | 0.9999 | 0.9998 | 0.9998 | 0.9998 | 0.9999 | 0.9998 | |
| F-stat. Prob. | 0.0000 | 0.0000 | 0.0000 | 0.0000 | 0.0000 | 0.0000 | 0.0000 | |
| Dependent: GDP | |||||||
| Country | Variable | Model 9 | Model 10 | Model 11 | Model 12 | Model 13 | |
| C | 3.3662 (0.9854) | 24.6069 (3.2851)* | 2.7129 (0.4139) | 6.1256 (7.5906)* | -0.0725 (0.0273) | ||
| K | 1.0066 (8.4475)* | 1.1533 (20.889)* | 0.4431 (2.0713)** | 0.1959 (7.5459)* | 0.7605 (41.545)* | ||
| L | -0.1023 (0.2582) | -1.6235 (4.4988)* | 1.1769 (2.4126)** | 1.1443 (21.078)* | 0.5888 (3.2508)* | ||
| Indonesia | GII | Coeff. (t-stat.) | -0.1661 (2.6284)* | ||||
| Thailand | GII | 0.2355 (2.1845)** | |||||
| Singapore | GII | -1.1944 (2.2558)** | |||||
| Malaysia | GII | -0.6369 (8.9384)* | |||||
| Vietnam | GII | -0.2686 (5.3724)* | |||||
| Adj.
|
0.9957 | 0.9823 | 0.8329 | 0.9979 | 0.9988 | ||
| F-stat. Prob. | 0.0000 | 0.0000 | 0.0000 | 0.0000 | 0.0000 | ||
3.2.2. Indonesia
growth. As depicted in Table 6, the results indicate that a
| Dependent: GDP | ||||||||
| Variable | Model 14 | Model 15 | Model 16 | Model 17 | Model 18 | Model 19 | Model 20 | |
| C | -2.1031 (1.7193)*** | -7.1319 (3.8276)* | -2.9414 (3.0928)* | -4.4878 (3.0843)* | 1.8862 (1.2569) | 0.0498 (0.0145) | 4.6382 (1.4424) | |
| K | 0.8919 (20.561)* | 0.9081 (11.245)* | 1.4141 (20.362)* | 0.9488 (13.412)* | 0.8624 (15.658)* | 0.9331 (8.3507)* | 0.9811 (9.9563)* | |
| L | 0.3716 (2.5806)* | 0.5981 (2.5993)* | -0.5304 (3.4171)* | 0.4159 (2.0801)** | 0.2333 (1.3116) | 0.1954 (0.5056) | -0.1428 (0.4099) | |
| INS | 0.0411 (5.7311)* | |||||||
| HCR | Coeff. (t-stat.) | 0.1197 (3.3658)* | -0.2182 (8.848)* | |||||
| MKS | -0.0848 (3.8795)* | |||||||
| BSS | -0.0659 (5.9561)* | |||||||
| KTO | -0.0588 (1.6734)*** | |||||||
| CTO | -0.0504 (3.3247) | |||||||
| Adj.
|
0.9991 | 0.9365 | 0.9443 | 0.9475 | 0.9983 | 0.9226 | 0.9964 | |
| F-stat. Prob. | 0.0000 | 0.0000 | 0.0000 | 0.0000 | 0.0000 | 0.0000 | 0.0000 | |
traditional manner, potentially slowing overall economic growth.
3.2.3. Thailand
3.2.4. Singapore
| Dependent: GDP | ||||||||
| Variable | Model 21 | Model 22 | Model 23 | Model 24 | Model 25 | Model 26 | Model 27 | |
| C | 32.8209 (5.7529)* | 32.8068 (11.662)* | 41.7657 (9.4381)* | 38.9249 (8.4759)* | 10.6764 (2.0291)** | 31.5368 (4.0831)* | -4.1918 (1.4211) | |
| K | 1.0494 (24.695)* | 1.1101 (59.103)* | 1.2191 (19.215)* | 1.0751 (34.231) | 0.9966 (34.865)* | 1.1127 (18.159)* | 1.4094 (46.413)* | |
| L | -1.8939 (6.5581)* | -1.9857 (14.351)* | -2.6419 (10.773) | -2.2798 (9.8253)* | -0.4899 (1.5478) | -1.8966 (4.9265)* | -0.3753 (2.9416)* | |
| INS | 0.0833 (3.1391)* | |||||||
| HCR | Coeff. (t-stat.) | 0.0644 (5.7907)* | -0.0942 (3.4238)* | |||||
| MKS | 0.0648 (2.3976)** | |||||||
| BSS | -0.1663 (7.0872)* | |||||||
| KTO | -0.0404 (0.9289) | |||||||
| CTO | 0.1424 (10.921)* | |||||||
| Adj.
|
0.9903 | 0.8892 | 0.9947 | 0.8731 | 0.9947 | 0.9796 | 0.8881 | |
| F-stat. Prob. | 0.0000 | 0.0000 | 0.0000 | 0.0000 | 0.0000 | 0.0000 | 0.0000 | |
| Dependent: GDP | ||||||||
| Variable | Model 28 | Model 29 | Model 30 | Model 31 | Model 32 | Model 33 | Model 34 | |
| C | -4.5249 (0.8918) | -7.8257 (2.5256)** | -33.2449 (19.606)* | 1.3305 (0.4217) | -50.8822 (6.0513)* | -7.0489 (1.3545) | 1.0594 (0.2187) | |
| K | 0.1822 (0.7799) | -0.0499 (0.4032) | 0.9665 (13.605)* | -0.1292 (1.2061) | 0.8329 (5.9227)* | 0.2394 (0.9969) | 1.7433 (7.2755)* | |
| L | 0.4748 (0.6007) | 2.3179 (9.3134)* | 2.5927 (21.714)* | 2.0699 (11.861)* | 3.3432 (6.2486)* | 1.8605 (3.9331)* | -1.0085 (2.1305)** | |
| INS | 4.3071 (2.1256)** | |||||||
| HCR | Coeff. (t-stat.) | 0.2471 (2.3373)** | -0.8532 (17.316)* | |||||
| MKS | -0.5475 (3.3427)* | |||||||
| BSS | 1.4811 (5.7932)* | |||||||
| KTO | -0.0535 (0.3367) | |||||||
| CTO | -0.9321 (3.3082)* | |||||||
| Adj.
|
0.8289 | 0.9421 | 0.9864 | 0.6711 | 0.9386 | 0.8128 | 0.8789 | |
| F-stat. Prob. | 0.0000 | 0.0000 | 0.0000 | 0.0000 | 0.0000 | 0.0000 | 0.0000 | |
exert a positive impact, while three indicators (IFR, MKS, and CTO) exhibit a negative impact on economic growth. Additionally, one indicator (KTO) is found to have no significant impact. Specifically, a
growth by
| Dependent: GDP | ||||||||
| Variable | Model 35 | Model 36 | Model 37 | Model 38 | Model 39 | Model 40 | Model 41 | |
| C | -6.3347 (9.7289) | -11.2451 (26.799)* | -12.3581 (10.873)* | -10.1546 (49.589)* | -8.1957 (17.944)* | -12.1297 (28.243)* | -1.4708 (2.7945)* | |
| K | 0.2805 (9.1826) | 0.4028 (21.551)* | 0.4428 (10.551)* | 0.2571 (36.782)* | 0.3648 (43.921)* | 0.4046 (20.037)* | 0.3171 (16.189)* | |
| L | 1.7218 (36.533)* | 1.7353 (67.041)* | 1.7408 (56.595)* | 1.8749 (145.49)* | 1.5999 (74.958)* | 1.7543 (57.201)* | 1.3043 (33.609)* | |
| INS | -0.4094 (4.8722)* | |||||||
| HCR | Coeff. (t-stat.) | -0.0764 (2.1818) | -0.0834 (2.1619)** | |||||
| MKS | 0.0415 (3.9742)* | |||||||
| BSS | -0.0251 (2.2497)** | |||||||
| KTO | 0.0663 (2.5328)** | |||||||
| CTO | -0.1813 (9.0827)* | |||||||
| Adj.
|
0.9932 | 0.9971 | 0.9965 | 0.9997 | 0.9602 | 0.9971 | 0.9979 | |
| F-stat. Prob. | 0.0000 | 0.0000 | 0.0000 | 0.0000 | 0.0000 | 0.0000 | 0.0000 | |
3.2.5. Malaysia
3.2.6. Vietnam
3.3. Discussion
| Dependent: GDP | ||||||||
| Variable | Model 42 | Model 43 | Model 44 | Model 45 | Model 46 | Model 47 | Model 48 | |
| C | 4.5016 (1.3162) | 4.9228 (2.0548)** | -4.6112 (2.1991)** | 4.5486 (1.2957) | 0.9388 (0.5788) | -1.3849 (0.6387) | 6.6392 (1.7846)*** | |
| K | 0.8114 (25.164)* | 0.7769 (45.698)* | 0.8013 (48.361)* | 0.7884 (31.077)* | 0.8011 (78.414)* | 0.7259 (51.973)* | 0.7579 (30.153)* | |
| L | 0.2014 (0.8416) | 0.2437 (1.4949) | 0.7357 (5.3558)* | 0.2369 (0.9898) | 0.3853 (3.6501)* | 0.6932 (4.6457)* | 0.1871 (0.7663) | |
| INS | -0.1045 (2.4131)* | |||||||
| HCR | Coeff. (t-stat.) | -0.1164 (5.2764)* | -0.1322 (5.7299)* | |||||
| MKS | -0.0752 (2.9234)* | |||||||
| BSS | 0.0637 (4.5464)* | |||||||
| KTO | -0.0879 (5.8499)* | |||||||
| CTO | -0.1235 (2.5147)** | |||||||
| Adj.
|
0.9975 | 0.9988 | 0.9991 | 0.9975 | 0.9581 | 0.9561 | 0.9973 | |
| F-stat. Prob. | 0.0000 | 0.0000 | 0.0000 | 0.0000 | 0.0000 | 0.0000 | 0.0000 | |
reveals a paradoxical negative coefficient, suggesting that an increase in innovation might correspond to a decrease in economic growth in the top five SEA countries. This discrepancy underscores the complexity of the innovation-economic growth nexus and emphasizes the importance of examining the specific components and institutional frameworks surrounding innovation. As depicted in Table 12, while institutions positively correlate with economic growth, other key indicators, such as human capital and research, market sophistication, business sophistication, and knowledge and technology outputs, demonstrate adverse effects. The panel findings are further supported by each of the country’s results, indicating that only Thailand’s GII has a positive relationship with economic growth, while Indonesia, Singapore, Malaysia, and Vietnam all exhibit a negative impact. These findings call for a nuanced understanding of the innovation ecosystem in these countries, suggesting potential gaps in policy support that may hinder the transformative power of innovation on economic development [63-66].
targeted policy interventions, investments in critical infrastructure, education and skills development, and fostering an enabling business environment can help unlock Indonesia’s innovation potential and drive sustainable economic growth [67-73].
| Variable | Panel | Time-series | ||||
| Top Five SEA | Indonesia | Thailand | Singapore | Malaysia | Vietnam | |
| GII |
|
|
|
|
|
|
| INS |
|
|
|
|
|
|
| HCR |
|
|
|
|
X |
|
| IFR | X |
|
|
|
|
|
| MKS |
|
|
|
|
|
|
| BSS |
|
|
|
|
|
|
| KTO |
|
|
X |
|
|
|
| CTO |
|
X |
|
|
|
|
innovation landscape, the supporting sectors crucial for sustaining economic growth still lag behind. This disparity highlights the complex interaction of factors shaping Singapore’s economic trajectory, necessitating a nuanced approach to address the gaps and foster holistic development across all sectors [77-79].
4. Conclusions and Policy Recommendations
increase in innovation often corresponds with a decrease in economic growth. While some countries like Thailand demonstrate positive impacts of innovation on economic growth, others such as Indonesia, Singapore, Malaysia, and Vietnam face challenges where certain components of the innovation ecosystem hinder rather than facilitate economic growth. This intriguing discrepancy underscores the intricate nature of the relationship between innovation and economic prosperity in SEA, emphasizing the necessity for a nuanced comprehension of the distinct components and institutional frameworks surrounding innovation.
contexts of each country and are essential to unlocking the potential of innovation as a driver of sustainable economic growth in SEA.
Data Availability Statement: The data is available by request.
Acknowledgments: The authors express their gratitude to their institutions and universities.
References
- Carlaw, K. I., and Lipsey, R. G. (2003). Productivity, Technology and Economic Growth: What is the Relationship?, Journal of Economic Surveys, Vol. 17, No. 3, 457-495. doi:10.1111/14676419.00201.
- Kim, Y. E., Loayza, N., and Balcazar, C. M. M. C. (2016). Productivity as the Key to Economic Growth and Development, World Bank Research and Policy Briefs, No. 108092.
- Gardiner, B., Martin, R., and Tyler, P. (2012). Competitiveness, Productivity and Economic Growth Across the European Regions, Regional Competitiveness, Routledge, 55-77.
- Rauf, A., Ali, N., Sadiq, M. N., Abid, S., Kayani, S. A., and Hussain, A. (2023). Foreign Direct Investment, Technological Innovations, Energy Use, Economic Growth, and Environmental Sustainability Nexus: New Perspectives in BRICS Economies, Sustainability, Vol. 15, No. 18, 14013. doi:10.3390/su151814013.
- McMillan, M., and Rodrik, D. (2011). Globalization, Structural Change and Productivity Growth, Cambridge, MA. doi:10.3386/w17143.
- Khan, S. A. R., Godil, D. I., Quddoos, M. U., Yu, Z., Akhtar, M. H., and Liang, Z. (2021). Investigating the Nexus between Energy, Economic Growth, and Environmental Quality: A Road Map for the Sustainable Development, Sustainable Development, Vol. 29, No. 5, 835-846. doi:10.1002/sd.2178.
- Haseeb, A., Xia, E., Saud, S., Usman, M., and Quddoos, M. U. (2023). Unveiling the Liaison between Human Capital, Trade Openness, and Environmental Sustainability for BRICS Economies: Robust Panel-data Estimation, Natural Resources Forum, Vol. 47, No. 2, 229-256. doi:10.1111/1477-8947.12277.
- Hardi, I., Idroes, G. M., Hardia, N. A. K., Fajri, I., Furqan, N., Noviandy, T. R., and Utami, R. T. (2023). Assessing the Linkage Between Sustainability Reporting and Indonesia’s Firm Value: The Role of Firm Size and Leverage, Indatu Journal of Management and Accounting, Vol. 1, No. 1, 21-28. doi:10.60084/ijma.v1i1.79.
- Thurik, R., and Wennekers, S. (2004). Entrepreneurship, Small Business and Economic Growth, Journal of Small Business and Enterprise Development, Vol. 11, No. 1, 140-149. doi:10.1108/14626000410519173.
- Acs, Z. J., and Szerb, L. (2007). Entrepreneurship, Economic Growth and Public Policy, Small Business Economics, Vol. 28, Nos. 2-3, 109-122. doi:10.1007/s11187-006-9012-3.
- Ali, N., Phoungthong, K., Khan, A., Abbas, S., Dilanchiev, A., Tariq, S., and Sadiq, M. N. (2023). Does FDI Foster Technological Innovations? Empirical Evidence from BRICS Economies, PLOS ONE, Vol. 18, No. 3, e0282498. doi:10.1371/journal.pone. 0282498.
- Ahluwalia, G. K., Kumar, D., Bhat, R. S., and Ray, S. (2023). A Study on Demand and Supply Side Forces of Global Space Economy and Its Various Determinants, European Economic Letters (EEL), Vol. 13, No. 4, 174-186.
- Hardi, I., Idroes, G. M., Utami, R. T., Dahlia, P., Mirza, M. A. F., Humam, R. A., Chairunnisa, R., Hardia, N. A. K., and Mahdani, R. (2023). Dynamic Impact of Inflation and Exchange Rate in Indonesia’s Top 10 Market Capitalization Companies: Implications for Stock Prices, Indatu Journal of Management and Accounting, Vol. 1, No. 2, 51-59. doi:10.60084/ijma.v1i2.110.
- Hipple, S. (1997). Worker Displacement in an Expanding Economy, Monthly Lab. Rev., Vol. 120, 26.
- Krebs, T. (2007). Job Displacement Risk and the Cost of Business Cycles, American Economic Review, Vol. 97, No. 3, 664-686. doi:10.1257/aer.97.3.664.
- Morrison, A., Breen, J., and Ali, S. (2003). Small Business Growth: Intention, Ability, and Opportunity, Journal of Small Business Management, Vol. 41, No. 4, 417-425. doi:10.1111/1540627X. 00092.
- Taiwo, M. A., Ayodeji, A. M., and Yusuf, B. A. (2013). Impact of Small and Medium Enterprises on Economic Growth and Development, American Journal of Business and Management, Vol. 2, No. 1, 18. doi:10.11634/21679606170644.
- Idroes, G. M., Syahnur, S., Majid, M. S. A., Idroes, R., Kusumo, F., and Hardi, I. (2023). Unveiling the Carbon Footprint: Biomass vs. Geothermal Energy in Indonesia, Ekonomikalia Journal of Economics, Vol. 1, No. 1, 10-18. doi:10.60084/eje.v1i1.47.
- Idroes, G. M., Hardi, I., Nasir, M., Gunawan, E., Maulidar, P., and Maulana, A. R. R. (2023). Natural Disasters and Economic Growth in Indonesia, Ekonomikalia Journal of Economics, Vol. 1, No. 1, 33-39. doi:10.60084/eje.v1i1.55.
- Ray, S., and Hardi, I. (2024). Refining ESG Disclosure’s Role in Corporate Economic, Environmental, and Social Sustainability Performance, Indatu Journal of Management and Accounting, Vol. 2, No. 1, 1-8. doi:10.60084/ijma.v2i1.144.
- Dobrotă, C. E., Marcu, N., Siminică, M., and Nețoiu, L. M. (2019). Disparities, Gaps and Evolution Trends of Innovation, as a Vector, Romanian Journal of Economic Forecasting, Vol. 22, No. 4, 174.
- Cornett, A. P., and Sørensen, N. K. (2013). Innovation and Regional Disparities-a Survey of Regional Growth Drivers and Economic Performance: Andreas P. Cornett and Nils Karl Sørensen, Innovation, Technology and Knowledge, Routledge, 98-125.
- Hardi, I., Saputra, J., Hadiyani, R., Maulana, A. R. R., and Idroes, G. M. (2023). Decrypting the Relationship Between Corruption and Human Development: Evidence from Indonesia, Ekonomikalia Journal of Economics, Vol. 1, No. 1, 1-9. doi:10.60084/eje.v1i1.22.
- Alcouffe, A., and Kuhn, T. (2004). Schumpeterian Endogenous Growth Theory and Evolutionary Economics, Journal of Evolutionary Economics, Vol. 14, No. 2, 223-236. doi:10.1007/s00191-004-0205-0.
- Verspagen, B. (2007). Innovation and Economic Growth Theory: A Schumpeterian Legacy and Agenda, Perspectives on Innovation, 42-63.
- Aghion, P., Akcigit, U., and Howitt, P. (2015). Lessons from Schumpeterian Growth Theory, American Economic Review, Vol. 105, No. 5, 94-99. doi:10.1257/aer.p20151067.
- World Intellectual Property Organization. (2023). Global Innovation Index 2023, from https://www.wipo.int/global_innovation_index/en/2023.
- Booth, A. (2013). Education and Economic Development in Southeast Asia: Myths and Realities, Southeast Asian Paper Tigers, Routledge, 173-195.
- Ullah, A. K. M. A., Mohamad, S. M., Hassan, N. H., and Chattoraj, D. (2019). Global Skills Deficiency: Perspectives of Skill Mobility in Southeast Asian Countries, Asian Education and Development Studies, Vol. 8, No. 4, 416-432. doi:10.1108/AEDS-12-2018-0185.
- Bhaskaran, M. (2010). Review of Southeast Asian Economic Developments, Southeast Asian Affairs, 23-43.
- Basri, M. C., and Hill, H. (2020). The Southeast Asian Economies in the Age of Discontent, Asian Economic Policy Review, Vol. 15, No. 2, 185-209. doi:10.1111/aepr. 12305.
- Hardi, I., Dawood, T. C., and Syathi, P. B. (2021). Determinants Comparative Advantage of Non-Oil Export 34 Provinces in Indonesia, International Journal of Business, Economics, and Social Development, Vol. 2, No. 3, 98-106. doi:10.46336/ijbesd.v2i3.137.
- Bong, A., and Premaratne, G. (2018). Regional Integration and Economic Growth in Southeast Asia, Global Business Review, Vol. 19, No. 6, 1403-1415. doi:10.1177/0972150918794568.
- Jones, L., and Hameiri, S. (2020). Southeast Asian Regional Governance: Political Economy, Regulatory Regionalism and ASEAN Integration, 199-224. doi:10.1007/978-3-030-28255-4_8.
- Hardi, I., Ringga, E. S., Fijay, A. H., Maulana, A. R. R., Hadiyani, R., and Idroes, G. M. (2023). Decomposed Impact of Democracy on Indonesia’s Economic Growth, Ekonomikalia Journal of Economics, Vol. 1, No. 2, 51-60. doi:10.60084/eje.v1i2.80.
- Jones, G. W. (2002). Southeast Asian Urbanization and the Growth of Mega-Urban Regions, Journal of Population Research, Vol. 19, No. 2, 119-136. doi:10.1007/BF03031973.
- Yap, K. S. (2011). Urban Challenges in Southeast Asia, UN ESCAP.
- Hasan, I., and Tucci, C. L. (2010). The Innovation-Economic Growth Nexus: Global Evidence, Research Policy, Vol. 39, No. 10, 1264-1276. doi:10.1016/j.respol.2010.07.005.
- Thompson, M. (2018). Social Capital, Innovation and Economic Growth, Journal of Behavioral and Experimental Economics, Vol. 73, 46-52. doi:10.1016/j.socec.2018.01.005.
- Bilbao-Osorio, B., and Rodríguez-Pose, A. (2004). From R&D to Innovation and Economic Growth in the EU, Growth and Change, Vol. 35, No. 4, 434-455. doi:10.1111/j.14682257.2004.00256.x.
- Pece, A. M., Simona, O. E. O., and Salisteanu, F. (2015). Innovation and Economic Growth: An Empirical Analysis for CEE Countries, Procedia Economics and Finance, Vol. 26, 461-467. doi:10.1016/S2212-5671(15)00874-6.
- Maradana, R. P., Pradhan, R. P., Dash, S., Gaurav, K., Jayakumar, M., and Chatterjee, D. (2017). Technological Innovation and
43. Broughel, J., and Thierer, A. D. (2019). Technological Innovation and Economic Growth: A Brief Report on the Evidence, SSRN Electronic Journal. doi:10.2139/ssrn. 3346495.
44. Degelsegger-Márquez, A., Remøe, S. O., and Trienes, R. (2018). Regional Knowledge Economies and Global Innovation Networks – The Case of Southeast Asia, Journal of Science and Technology Policy Management, Vol. 9, No. 1, 66-86. doi:10.1108/JSTPM-06-2017-0027.
45. Mughal, N., Arif, A., Jain, V., Chupradit, S., Shabbir, M. S., RamosMeza, C. S., and Zhanbayev, R. (2022). The Role of Technological Innovation in Environmental Pollution, Energy Consumption and Sustainable Economic Growth: Evidence from South Asian Economies, Energy Strategy Reviews, Vol. 39, 100745. doi:10.1016/j.esr.2021.100745.
46. Qamruzzaman, M., and Jianguo, W. (2017). Financial Innovation and Economic Growth in Bangladesh, Financial Innovation, Vol. 3, No. 1, 19. doi:10.1186/s40854-017-0070-0.
47. Meirun, T., Mihardjo, L. W., Haseeb, M., Khan, S. A. R., and Jermsittiparsert, K. (2021). The Dynamics Effect of Green Technology Innovation on Economic Growth and CO2 Emission in Singapore: New Evidence from Bootstrap ARDL Approach, Environmental Science and Pollution Research, Vol. 28, No. 4, 4184-4194. doi:10.1007/s11356-020-10760-w.
48. Sulaiman, N. F. C. H. E., Saputra, J., and Muhamad, S. (2021). Effects of Human Capital and Innovation on Economic Growth in Selected ASEAN Countries: Evidence from Panel Regression Approach, The Journal of Asian Finance, Economics and Business (JAFEB), Vol. 8, No. 7, 43-54. doi: 10.13106/jafeb.2021.vol8.no7.0043.
49. Lv, L., Yin, Y., and Wang, Y. (2020). The Impact of R&D Input on Technological Innovation: Evidence from South Asian and Southeast Asian Countries, Discrete Dynamics in Nature and Society, Vol. 2020, 6408654. doi:10.1155/2020/6408654.
50. Sultanuzzaman, M. R., Fan, H., Mohamued, E. A., Hossain, M. I., and Islam, M. A. (2019). Effects of Export and Technology on Economic Growth: Selected Emerging Asian Economies, Economic Research-Ekonomska Istraživanja, Vol. 32, No. 1, 2515-2531. doi:10.1080/1331677X.2019.1650656.
51. International Monetary Fund. (2023). IMF DataMapper, from https://www.imf.org/external/datamapper/datasets.
52. World Bank. (2023). World Development Indicators, from https://databank.worldbank.org/source/world-developmentindicators.
53. World Intellectual Property Organization. (2023). Global Innovation Index – All Editions, from https://www.wipo.int/global_innovation_index.
54. Romer, P. M. (1994). The Origins of Endogenous Growth, Journal of Economic Perspectives, Vol. 8, No. 1, 3-22. doi:10.1257/jep.8.1.3.
55. Chirwa, T. G., and Odhiambo, N. M. (2018). Exogenous and Endogenous Growth Models: A Critical Review, Comparative Economic Research. Central and Eastern Europe, Vol. 21, No. 4, 63-84. doi:10.2478/cer-2018-0027.
56. Fatás, A. (2000). Endogenous Growth and Stochastic Trends, Journal of Monetary Economics, Vol. 45, No. 1, 107-128. doi:10.1016/S0304-3932(99)00043-4.
57. Gluzmann, P., and Panigo, D. (2015). Global Search Regression: A New Automatic Model-Selection Technique for Cross-Section, Time-Series, and Panel-Data Regressions, The Stata Journal: Promoting Communications on Statistics and Stata, Vol. 15, No. 2, 325-349. doi:10.1177/1536867X1501500201.
58. Aşıcı, A. A. (2013). Economic Growth and Its Impact on Environment: A Panel Data Analysis, Ecological Indicators, Vol. 24, 324-333. doi:10.1016/j.ecolind.2012.06.019.
59. Teixeira, A. A. C., and Queirós, A. S. S. (2016). Economic Growth, Human Capital and Structural Change: A Dynamic Panel Data Analysis, Research Policy, Vol. 45, No. 8, 1636-1648. doi:10.1016/j.respol.2016.04.006.
60. Inglesi-Lotz, R. (2016). The impact of renewable energy consumption to economic growth: A panel data application, Energy Economics, Vol. 53, 58-63. doi:10.1016/j.eneco.2015.01.003.
61. El Ghaoui, L., and Lebret, H. (1997). Robust Solutions to LeastSquares Problems with Uncertain Data, SIAM Journal on Matrix Analysis and Applications, Vol. 18, No. 4, 1035-1064. doi:10.1137/S0895479896298130.
62. McWilliams, B., Krummenacher, G., Lucic, M., and Buhmann, J. M. (2014). Fast and Robust Least Squares Estimation in Corrupted Linear Models, Z. Ghahramani; M. Welling; C. Cortes; N. Lawrence; K. Q. Weinberger (Eds.), Advances in Neural Information Processing Systems (Vol. 27), Curran Associates, Inc.
63. Gordon, R. (2018). Why Has Economic Growth Slowed When Innovation Appears to be Accelerating?Cambridge, MA. doi:10.3386/w24554.
64. Hu, A. G. (2015). Innovation and Economic Growth in East Asia: An Overview, Asian Economic Policy Review, Vol. 10, No. 1, 1937. doi:10.1111/aepr.12078.
65. Litsareva, E. (2017). Success Factors of Asia-Pacific FastDeveloping Regions’ Technological Innovation Development and Economic Growth, International Journal of Innovation Studies, Vol. 1, No. 1, 72-88. doi:10.3724/SP.J.1440.101006.
66. Idroes, G. M., Hardi, I., Noviandy, T. R., Sasmita, N. R., Hilal, I. S., Kusumo, F., and Idroes, R. (2023). A Deep Dive into Indonesia’s CO2 Emissions: The Role of Energy Consumption, Economic Growth and Natural Disasters, Ekonomikalia Journal of Economics, Vol. 1, No. 2, 69-81. doi:10.60084/eje.v1i2.115.
67. Nurmalia, Hartono, D., and Muzayanah, I. F. U. (2020). The Roles of Entrepreneurship on Regional Economic Growth in Indonesia, Journal of the Knowledge Economy, Vol. 11, No. 1, 28-41. doi:10.1007/s13132-018-0557-6.
68. Busroh, F. F. (2018). Assessing the Role of IPR Legislations for Technology, Innovation and Economic Growth in Indonesia, Int. J. Manag. Bus. Res, Vol. 8, No. 3, 227-236.
69. Aritenang, A. F. (2021). The Importance of Agglomeration Economies and Technological Level on Local Economic Growth: The Case of Indonesia, Journal of the Knowledge Economy, Vol. 12, No. 2, 544-563. doi:10.1007/s13132-021-00735-8.
70. DamuRi, Y. R., Aswicahyono, H., and Christian, D. (2018). Innovation Policy in Indonesia, Innovation Policy in ASEAN, 96127.
71. Widarni, E. L., and Bawono, S. (2021). Human Capital, Technology, and Economic Growth: A Case Study of Indonesia, The Journal of Asian Finance, Economics and Business (JAFEB), Vol. 8, No. 5, 29-35.
72. Hardi, I., Idroes, G. M., Zulham, T., Suriani, S., and Saputra, J. (2023). Economic Growth, Agriculture, Capital Formation and Greenhouse Gas Emissions in Indonesia: FMOLS, DOLS and CCR
73. Maulidar, P., Fitriyani, F., Sasmita, N. R., Hardi, I., and Idroes, G. M. (2024). Exploring Indonesia’s CO2 Emissions: The Impact of Agriculture, Economic Growth, Capital and Labor, Grimsa Journal of Business and Economics Studies, Vol. 1, No. 1, 43-55. doi:10.61975/gjbes.v1i1.22.
74. Intarakumnerd, P., Chairatana, P., and Tangchitpiboon, T. (2002). National Innovation System in Less Successful Developing Countries: The Case of Thailand, Research Policy, Vol. 31, Nos. 8-9, 1445-1457. doi:10.1016/S0048-7333(02)00074-4.
75. Iamratanakul, S. (2014). A Framework of the Innovation System: A Case of Thailand, International Journal of Economic Policy in Emerging Economies, Vol. 7, No. 2, 111. doi:10.1504/IJEPEE.2014.063187.
76. Joseph, K. J. (2006). Thailand: From Investment-led Growth to Innovation-led Growth, Information Technology, Innovation System and Trade Regime in Developing Countries, Palgrave Macmillan UK, London, 53-85. doi:10.1057/9780230626331_3.
77. Bellows, T. J. (2006). Economic Challenges and Political Innovation: The Case of Singapore, Asian Affairs: An American Review, Vol. 32, No. 4, 231-255. doi:10.3200/AAFS.32.4.231-255.
78. Chew, S. B., and Chew, R. (2003). Promoting Innovation in Singapore: Changing the Mindset, International Journal of Entrepreneurship and Innovation Management, Vol. 3, No. 3, 249. doi:10.1504/IJEIM.2003.003284.
79. Robinson, E. (2018). Globalisation in a Small Open Economy: The Singapore Experience, BIS Papers Chapters, Vol. 100, 321-329.
80. Rasiah, R., and Yap, X.-S. (2015). Innovation Performance of the Malaysian Economy, The Global Innovation Index, Vol. 139.
81. Law, S. H., Sarmidi, T., and Goh, L. T. (2020). Impact of Innovation on Economic Growth: Evidence From Malaysia, Malaysian Journal of Economic Studies, Vol. 57, No. 1, 113-132.
82. Akoum, I. (2016). Research, Development and Innovation in Malaysia: Elements of an Effective Growth Model, Asian Economic and Financial Review, Vol. 6, No. 7, 390. doi: 10.18488/journal.aefr/2016.6.7/102.7.390.403.
83. Bekhet, H. A., and Latif, N. W. A. (2017). Highlighting Innovation Policies and Sustainable Growth in Malaysia, International Journal of Innovation, Management and Technology, Vol. 8, No. 3, 228-239. doi: 10.18178/ijimt.2017.8.3.734.
84. Nguyen Van Hiep, P. N. T. (2021). The Role of Science and Technology in Growth Model Innovation in Vietnam (20102020), Journal of Hunan University Natural Sciences, Vol. 48, No. 1.
85. Mazyrin, V. M. (2013). Economic Modernization in Vietnam From Industrialization to Innovation Stage, VNU Journal of Economics And Business; Vol 29 No 2.
86. Nguyen, M. H. (2020). Domestic Innovation Activities and Economic Development in Vietnam, VNUHCM Journal of Economics, Business and Law, Vol. 4, No. 4, 1069-1080. doi: 10.32508/stdjelm.v4i4.629.