DOI: https://doi.org/10.1186/s12933-023-02115-9
PMID: https://pubmed.ncbi.nlm.nih.gov/38184598
تاريخ النشر: 2024-01-06
الارتباط بين الجلوكوز الثلاثي الجليسريد
(تحقق من فحص تحديثات المؤشر وتركيبه مع مؤشرات السمنة وأمراض القلب والأوعية الدموية: NHANES 2003-2018
الملخص
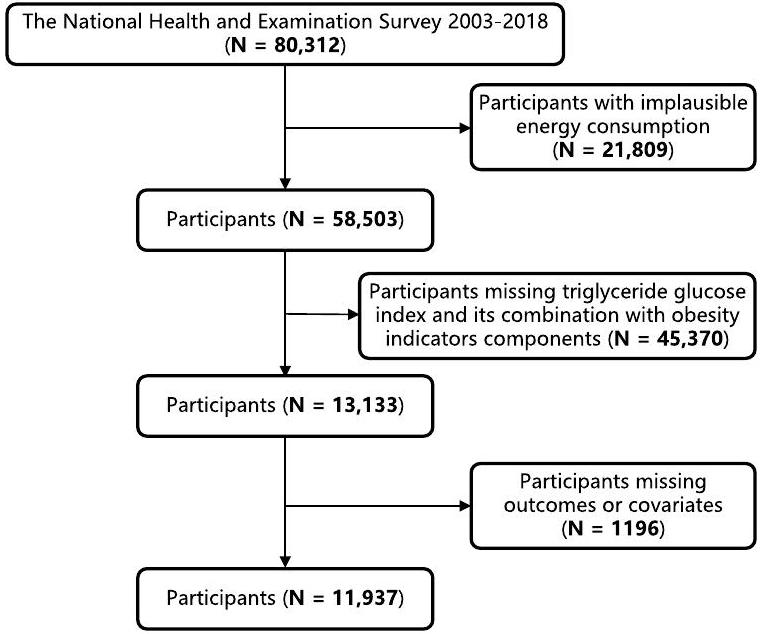
الخلفية في السكان الأمريكيين، العلاقة بين مؤشر الجلوكوز الثلاثي الجليسريد (TyG) وTYG المدمج مع مؤشرات السمنة وأمراض القلب والأوعية الدموية (CVD) ومعدل الوفيات المرتبطة بها لم يتم دراستها بشكل جيد. الطرق شملت هذه الدراسة المقطعية 11,937 بالغًا من المسح الوطني لفحص الصحة والتغذية (NHANES) 2003-2018. تم استخدام نموذج المخاطر النسبية لكوكس، وتحليلات الانحدار اللوجستي الثنائي، والانحدار المكعب المقيد (RCS)، ومنحنيات التشغيل المستقبلي (ROC) لتحليل العلاقة بين TyG ومؤشراته المرتبطة بالسمنة وCVD ومعدل الوفيات المرتبطة بها. استكشفت تحليل الوساطة الدور الوسيط للهيموغلوبين الغليكوزيل والأنسولين في العلاقات المذكورة أعلاه. النتائج في هذه الدراسة، باستثناء عدم وجود ارتباط كبير بين TyG ومعدل وفيات CVD، كانت TyG وTyG-WC وTyG-WHtR وTyG-BMI مرتبطة بشكل كبير وإيجابي مع CVD ومعدل وفيات CVD. كانت TyG-WHtR هي أقوى مؤشر للتنبؤ بمعدل وفيات CVD (HR 1.66، 95% CI 1.21-2.29). كان لمؤشر TyG ارتباط أفضل مع خطر الإصابة بأمراض القلب التاجية (OR 2.52، 95% CI 1.66-3.83). كان TyG-WC مرتبطًا بشكل أفضل مع إجمالي CVD (OR 2.37، 95% CI 1.77-3.17) وفشل القلب الاحتقاني (OR 2.14، 95% CI 1.31-3.51) وذبحة صدرية (OR 2.38، 95% CI 1.43-3.97). كان TyG-WHtR مرتبطًا بشكل أفضل مع احتشاء عضلة القلب (OR 2.24، 95% CI 1.45-3.44). أظهرت تحليلات RCS أن معظم العلاقات المذكورة أعلاه كانت خطية (P-overall < 0.0001، P-nonlinear > 0.05). خلاف ذلك، أظهرت منحنيات ROC أن TyG-WHtR وTyG-WC كان لهما فعالية تشخيصية أكثر قوة من TyG. في تحليلات الوساطة، كان الهيموغلوبين الغليكوزيل وسيطًا في جميع العلاقات المذكورة أعلاه وكان الأنسولين وسيطًا في العلاقات الجزئية. الاستنتاجات تعزز TyG-WC وTyG-WtHR التنبؤ بمعدل وفيات CVD، والفعالية التشخيصية لـ CVD ومعدل وفياته، والارتباط مع بعض CVD فوق TyG الأكثر شيوعًا حاليًا. من المتوقع أن تصبح TyG-WC وTyG-WtHR مقاييس أكثر فعالية لتحديد السكان المعرضين لخطر الإصابة بأمراض القلب والأوعية الدموية في وقت مبكر وتحسين تصنيف المخاطر.
المقدمة
مؤشر الجلوكوز الثلاثي الجليسريد (TyG) هو مقياس لمقاومة الأنسولين يقيم حساسية الجسم للأنسولين من خلال دمج علامتين حيويتين، الجليسريد الثلاثي والجلوكوز في الدم الصائم [3، 4]. تعتبر مقاومة الأنسولين حالة يتم فيها تقليل حساسية الجسم واستجابته للأنسولين، مما يؤدي إلى عدم قدرة الأنسولين على نقل الجلوكوز بكفاءة إلى الخلايا، مما يسبب اضطرابات أيضية مثل فرط سكر الدم [5]. تعتبر مقاومة الأنسولين عامل خطر كبير للعديد من الأمراض الأيضية مثل داء السكري من النوع 2 [6]، السمنة [7]، أمراض القلب والأوعية الدموية [8-10]، وما إلى ذلك. يتم حساب مؤشر TyG باستخدام الصيغة التالية: TyG
السمنة شائعة في جميع أنحاء العالم وترتبط ارتباطًا وثيقًا بمخاطر صحية متنوعة، مثل ضعف تحمل الجلوكوز، مقاومة الأنسولين، واضطرابات الأيض [15-17]، والتي يمكن أن تؤدي إلى بدء تقدم وتوقعات أمراض القلب والأوعية الدموية [18-20]. يرتبط TYG المدمج مع مؤشرات السمنة ارتباطًا وثيقًا بمقاومة الأنسولين [21، 22]، ومتلازمة الأيض [23]، وحمض اليوريك [24]، وداء السكري [25]، والكبد الدهني [26]. أظهرت بعض الدراسات أن TyG المدمج مع مؤشرات السمنة أفضل من مؤشر TyG لتقييم [27]. ومع ذلك، كانت هذه الدراسات حول TyG المدمج مع مؤشرات السمنة وأمراض القلب والأوعية الدموية قليلة وركزت بشكل رئيسي على السكان الآسيويين والأوروبيين [28]. العلاقة بين TyG المدمج مع مؤشرات السمنة وأمراض القلب والأوعية الدموية ومعدل وفيات CVD في السكان الأمريكيين غير واضحة. استخدمت دراستنا قاعدة بيانات المسح الوطني لفحص الصحة والتغذية لتحليل ارتباط مؤشر TyG وتركيبه مع مؤشرات السمنة مع
المواد والطرق
مصدر البيانات والسكان المدروسون
تعريفات TyG وTyG-WC وTyG-WHtR وTyG-BMI
تم حساب TyG وTyG-WC وTyG-WHtR وTyG-BMI وفقًا للصيغ التالية: (1)
وفقًا للتصنيف الإحصائي الدولي للأمراض والمشاكل الصحية ذات الصلة، الإصدار العاشر (ICD-10) الرموز، أمراض القلب والأوعية الدموية (I00-I99)، فشل القلب الاحتقاني (I50.0، I50.1، I50.9)، مرض الشريان التاجي (I20-I25.9)، احتشاء عضلة القلب (I21-I23)، والذبحة الصدرية (I20.0-I20.9)، وفيات أمراض القلب والأوعية الدموية (I00-I09، I11، I13، I20-I51، أو I60-I69).
تقييم المتغيرات المرافقة
استبيان موحد للحالة الطبية. تم سؤال المشاركين: “هل كان لديك قريب مقرب أصيب بنوبة قلبية؟” أو “هل تم إخبارك يومًا أنك مصاب بالسرطان أو ورم خبيث؟” أو “هل أخبرك الطبيب أنك مصاب بالسكري؟” وأجابوا بنعم أو لا. تم الحصول على الوزن والطول وضغط الدم ومحيط الخصر عندما حضر الأشخاص لفحص بدني في مركز صحي متنقل وتم اعتبارها متغيرات من النوع المستمر. بالإضافة إلى ذلك، تم قياس مستوى الجلوكوز في الدم أثناء الصيام (FSG)، والأنسولين، وHbA1c، والدهون الثلاثية، والكوليسترول الكلي عند الأساس عندما قدم المشاركون عينات دم وتم اعتبارها متغيرات من النوع المستمر. تم تطوير AHEI من مؤشر الأكل الصحي الأصلي، الذي شمل 11 مكونًا غذائيًا تم تحديدها من خلال مراجعة شاملة للدراسات. يمكن العثور على مزيد من التفاصيل حول قياس المتغيرات المرافقة على موقع NHANES (https://www.cdc. gov/nchs/nhanes/index.htm).
التحليل الإحصائي
النتائج
الخصائص الأساسية للمشاركين وفقًا للرباعيات لمؤشرات TyG، TyG-WC، TyG-WHtR، وTyG-BMI
العلاقة بين TyG، TyG-WC، TyG-WHtR، TyG-BMI، وفيات أمراض القلب والأوعية الدموية، وإجمالي أمراض القلب والأوعية الدموية، وفشل القلب الاحتقاني، واحتشاء عضلة القلب، والذبحة الصدرية، ومرض الشريان التاجي
يوفر الملف الإضافي 3: الجداول S4-S9 معلومات مفصلة عن جميع العلاقات. بعد تعديل المتغيرات المرافقة، أظهرت النتائج أنه باستثناء عدم وجود ارتباط كبير بين TyG ووفيات أمراض القلب والأوعية الدموية، كانت TyG، وTyG-WC، وTyG-WHtR، وTyG-BMI مرتبطة بشكل كبير وإيجابي بوفيات أمراض القلب والأوعية الدموية، وإجمالي أمراض القلب والأوعية الدموية، وفشل القلب الاحتقاني، واحتشاء عضلة القلب، والذبحة الصدرية، ومرض الشريان التاجي (P trend
تحليل الانحدارات التكعيبية المقيدة (RCS) الذي يحقق في العلاقة بين TyG وTyG-WC وTyG-WHtR وTyG-BMI ووفيات الأمراض القلبية الوعائية، وإجمالي الأمراض القلبية الوعائية، وفشل القلب الاحتقاني، واحتشاء عضلة القلب، والذبحة الصدرية، وأمراض القلب التاجية
| الجلسريد الثلاثي-الجلوكوز (TyG)
|
|
|
||||
|
|
8.23-8.62 | 8.63-9.06 | >9.07 | |||
| ن=2986 | ن=2986 | N=2983 | ن=2982 | |||
| العمر، سنوات | 42.33 (41.36, 43.29) | ٤٧.٠٠ (٤٦.١٣، ٤٧.٨٦) | 50.08 (49.32, 50.85) | ٥١.٩١ (٥١.١٥، ٥٢.٦٦) | < 0.001 | < 0.001 |
| ذكر، % | ٣٧.٦٠ (٣٥.٧٠، ٣٩.٦٠) | ٤٧.٤٠ (٤٥.٢٠، ٤٩.٧٠) | 51.20 (49.20, 53.20) | ٥٨.٥٠ (٥٦.٣٠، ٦٠.٧٠) | < 0.001 | < 0.001 |
| الأبيض غير اللاتيني، % | 68.00 (64.80, 71.10) | 71.00 (67.80, 73.90) | 72.80 (69.70, 75.70) | 73.10 (69.60, 76.30) | < 0.001 | < 0.001 |
| مؤشر كتلة الجسم، كجم/م²
|
25.95 (25.71, 26.20) | 27.95 (27.68, 28.22) | ٢٩.٥٤ (٢٩.٢٣، ٢٩.٨٦) | ٣١.٤٦ (٣١.١٠، ٣١.٨١) | < 0.001 | < 0.001 |
| دخان، % | 19.80 (17.80, 22.00) | ٢٤.٢٠ (٢١.٨٠، ٢٦.٧٠) | ٢٥.٩٠ (٢٣.٨٠، ٢٨.٢٠) | ٢٧.٢٠ (٢٥.٣٠، ٢٩.٣٠) | < 0.001 | < 0.001 |
| اشرب، % | 74.00 (71.30, 76.50) | 73.90 (71.60, 76.10) | 74.60 (72.10, 76.90) | 73.20 (70.90، 75.40) | < 0.001 | < 0.001 |
| التمارين الرياضية المنتظمة، % | ٣٢.٩٠ (٣٠.٣٠، ٣٥.٧٠) | 42.20 (39.90, 44.60) | ٤٣.٦٠ (٤١.٢٠، ٤٦.٠٠) | 50.90 (48.10, 53.70) | < 0.001 | < 0.001 |
| خريج كلية أو أعلى، % | ٣٦.٩٠ (٣٤.١٠، ٣٩.٨٠) | 30.80 (27.60, 34.10) | 27.10 (24.30, 30.10) | 21.20 (18.80, 23.80) | <0.001 | < 0.001 |
| > 100,000 دخل أسري سنوي، % | 19.60 (16.80, 22.60) | 16.50 (13.80, 19.60) | ١٣.٨٠ (١١.٩٠، ١٥.٩٠) | 10.40 (8.10، 13.30) | 0.078 | 0.336 |
| استخدام المكملات الغذائية، % | 51.00 (48.90، 53.10) | ٥١.٣٠ (٤٨.٩٠، ٥٣.٦٠) | 50.20 (48.00, 52.50) | ٥٢.٧٠ (٥٠.١٠، ٥٥.٢٠) | <0.001 | < 0.001 |
| إجمالي الطاقة، كيلو كالوري/يوم |
|
|
|
|
< 0.001 | < 0.001 |
| أهي سوري | 50.86 (50.31, 51.41) | 50.03 (49.47, 50.59) | 50.21 (49.72، 50.71) | ٤٩.٥٨ (٤٩.٠٦، ٥٠.٠٩) | < 0.001 | < 0.001 |
| تاريخ عائلي لأمراض القلب، % | ١٣.٠٠ (١١.٦٠، ١٤.٧٠) | 16.70 (14.70, 18.90) | 17.70 (15.90, 19.60) | 18.80 (16.70، 21.10) | 0.078 | 0.033 |
| الدهون الثلاثية، مليمول/لتر | 0.68 (0.67، 0.69) | 1.07 (1.06, 1.07) | 1.53 (1.52، 1.54) | 2.91 (2.82، 3.00) | < 0.001 | < 0.001 |
| الجلوكوز الصائم، مليمول/لتر | 5.15 (5.12، 5.18) | 5.46 (5.43، 5.49) | 5.76 (5.71، 5.80) | 6.93 (6.80، 7.05) | < 0.001 | < 0.001 |
| محيط الخصر، سم | ٨٩.٩٣ (٨٩.٣٣، ٩٠.٥٢) | ٩٦.٦٧ (٩٥.٨٧، ٩٧.٤٧) | ١٠١.١٢ (١٠٠.٤٦، ١٠١.٧٨) | ١٠٧.٣٤ (١٠٦.٤٩، ١٠٨.١٩) | < 0.001 | < 0.001 |
| الهيموغلوبين الجليكوزي، % | 5.35 (5.34, 5.37) | 5.52 (5.50، 5.54) | 5.65 (5.63، 5.68) | 6.34 (6.28، 6.40) | < 0.001 | < 0.001 |
| الطول الوقوف، سم | 167.49 (167.14, 167.83) | 167.86 (167.50, 168.22) | 167.41 (167.04, 167.79) | 168.01 (167.64, 168.38) | < 0.001 | < 0.001 |
| الأنسولين، بيكومول/لتر | ٤٩.٥٤ (٤٨.٠٧، ٥١.٠١) | 65.07 (63.15, 67.00) | 81.76 (79.41, 84.11) | 118.02 (112.65, 123.39) | < 0.001 | < 0.001 |
| ضغط الدم الانقباضي، مم زئبق | ١١٥.٦٣ (١١٤.٨٨، ١١٦.٣٨) | 120.18 (119.44, 120.91) | ١٢٢.٢٤ (١٢١.٥٢، ١٢٢.٩٦) | 127.11 (126.20, 128.02) | < 0.001 | < 0.001 |
| الكوليسترول، مليمول/لتر | ٤.٦٧ (٤.٦٣، ٤.٧٢) | 5.00 (4.95، 5.05) | 5.21 (5.17، 5.26) | 5.50 (5.44، 5.55) | <0.001 | < 0.001 |
| سرطان تم الإبلاغ عنه ذاتيًا، % | 7.10 (5.90, 8.60) | 9.50 (8.00, 11.20) | 10.70 (9.40، 12.30) | 11.20 (10.00, 12.60) | < 0.001 | < 0.001 |
| مرض السكري المبلغ عنه ذاتياً، % | 2.20 (1.60, 2.80) | ٤.٢٠ (٣.٥٠، ٥.١٠) | 7.70 (6.70، 8.90) | 21.40 (19.10, 23.80) | < 0.001 | < 0.001 |
| وفيات الأمراض القلبية الوعائية، % | 2.00 (1.50, 2.60) | 3.40 (2.90, 4.10) | ٤.٢٠ (٣.٥٠، ٤.٩٠) | 6.60 (5.70, 7.80) | < 0.001 | < 0.001 |
| أمراض القلب والأوعية الدموية، % | 4.80 (4.10, 5.60) | 7.30 (6.20, 8.60) | 10.00 (8.70, 11.50) | ١٣.٧٠ (١٢.١٠، ١٥.٥٠) | <0.001 | < 0.001 |
| فشل القلب الاحتقاني، % | 1.20 (0.90، 1.70) | 1.80 (1.30، 2.40) | 2.60 (2.00, 3.40) | ٤.٤٠ (٣.٦٠، ٥.٣٠) | < 0.001 | < 0.001 |
| احتشاء عضلة القلب، % | 1.70 (1.30، 2.40) | 3.20 (2.40, 4.20) | ٤.٠٠ (٣.٤٠، ٤.٨٠) | 5.50 (4.50, 6.60) | < 0.001 | < 0.001 |
| ذبحة صدرية، % | 1.10 (0.80، 1.60) | 1.60 (1.10, 2.20) | 3.10 (2.40، 0.40) | 3.80 (0.30, 4.80) | < 0.001 | < 0.001 |
| مرض الشريان التاجي، % | 1.70 (1.30، 2.40) | 2.80 (2.10, 3.60) | ٤.٤٠ (٣.٥٠، ٥.٥٠) | 6.30 (5.30, 7.50) | < 0.001 | < 0.001 |
تحليل الوساطة لـ TyG وTyG-WC وTyG-WHtR وTyG-BMI مع وفيات القلب والأوعية الدموية، وإجمالي أمراض القلب والأوعية الدموية، وفشل القلب الاحتقاني، واحتشاء عضلة القلب، والذبحة الصدرية، وأمراض القلب التاجية
49.0، 41.6، و

منحنيات خصائص التشغيل المستقبلية (ROC) لـ TyG وTyG-WC وTyG-WHtR وTyG-BMI وWC وWHtR وBMI فيما يتعلق بوفاة الأمراض القلبية الوعائية، وإجمالي الأمراض القلبية الوعائية، وفشل القلب الاحتقاني، واحتشاء عضلة القلب، والذبحة الصدرية، وأمراض القلب التاجية
بالنسبة لوفيات القلب والأوعية الدموية، كان لمؤشر TyG-WHtR أعلى فعالية تشخيصية (AUC: 0.628، 95% CI 0.608-0.647)، يليه TyG-WC (AUC: 0.614، 95% CI 0.595-0.634). بالنسبة لمجموع أمراض القلب والأوعية الدموية، كان لمؤشر TyG-WHtR أعلى فعالية تشخيصية (AUC: 0.655، 95% CI 0.640-0.670)، يليه TyG-WC (AUC: 0.650، 95% CI 0.635-0.665). بالنسبة لفشل القلب الاحتقاني، كان لمؤشر TyG-WHtR أعلى فعالية تشخيصية (AUC: 0.675، 95% CI 0.648-0.702)، يليه
توزيع TyG وTyG-WC وTyG-WHtR وTyG-BMI فيما يتعلق بوفاة القلب والأوعية الدموية، وإجمالي أمراض القلب والأوعية الدموية، وفشل القلب الاحتقاني، والنوبة القلبية، والذبحة الصدرية، وأمراض القلب التاجية

نقاش
تعتبر TyG، وهي علامة حيوية مشتقة من مستويات الجلوكوز الصائم والدهون الثلاثية، قد اكتسبت شعبية كبديل لمقاومة الأنسولين نظرًا لحسابها السهل ودرجة حساسيتها وخصوصيتها العالية. تُظهر أبحاثنا وجود علاقة إيجابية وملحوظة بين TyG وأمراض القلب والأوعية الدموية الإجمالية، وفشل القلب الاحتقاني، واحتشاء عضلة القلب، والذبحة الصدرية، وأمراض القلب التاجية في السكان في الولايات المتحدة، بما يتماشى مع الدراسات السابقة. ومع ذلك، تركز الأبحاث الحالية حول TyG وأمراض القلب والأوعية الدموية على السكان الأوروبيين والآسيويين، مع عدد محدود من الدراسات التي أجريت في الولايات المتحدة. بعد تعديل بيانات التغذية مثل إجمالي استهلاك الطاقة، ومؤشر النظام الغذائي الصحي الأمريكي، والمكملات الغذائية، حددت دراستنا أن TyG أظهرت علاقة إيجابية وملحوظة مع أمراض القلب والأوعية الدموية الإجمالية، وفشل القلب الاحتقاني، واحتشاء عضلة القلب، والذبحة الصدرية، وأمراض القلب التاجية.
دراستنا هي التحقيق الأول في العلاقة بين TyG مع مؤشرات السمنة وأمراض القلب والأوعية الدموية ووفيات أمراض القلب والأوعية الدموية في السكان الأمريكيين. تكشف نتائج دراستنا أنه باستثناء عدم وجود ارتباط كبير بين TyG ووفيات أمراض القلب والأوعية الدموية، كانت TyG وTyG-WC وTyG-WHtR وTyG-BMI مرتبطة بشكل كبير وإيجابي بوفيات أمراض القلب والأوعية الدموية، وإجمالي أمراض القلب والأوعية الدموية، وفشل القلب الاحتقاني، واحتشاء عضلة القلب، والذبحة الصدرية، وأمراض القلب التاجية. أظهرت تحليلات RCS أن معظم العلاقات المذكورة أعلاه كانت خطية، لكن TyG-WC وTyG-WHtR وTyG-BMI كانت مرتبطة بشكل غير خطي بأمراض القلب والأوعية الدموية.
المعدل الوفيات. هذا يتماشى مع التقارير السابقة [36]. في دراسة جماعية مستقبلية من سكان الولايات المتحدة، كان مؤشر TyG مرتبطًا بالوفيات بسبب جميع الأسباب وأمراض القلب والأوعية الدموية بشكل غير خطي. في النموذج 3، تصبح أحجام التأثير الإيجابية غير ذات دلالة مع الوفاة القلبية الوعائية (HR، 1.37؛ 95% CI 0.78-2.42) [37]. وقد تم اقتراح أن المؤشرات المرتفعة أو المنخفضة بشكل مفرط لـ TyG وTyG-WC وTyG-BMI قد تؤدي إلى زيادة خطر الوفاة القلبية الوعائية، والتي قد تكون مرتبطة بمقاومة الأنسولين المرتفعة أو المنخفضة بشكل مفرط، والاستجابة الالتهابية، والإجهاد التأكسدي، ووظيفة البطانة الوعائية، مما قد يؤدي بدوره إلى زيادة خطر الوفاة القلبية الوعائية [38، 39]. كان TyG-WC وTyG-WHtR وTyG-BMI مرتبطين بشكل غير خطي بالذبحة الصدرية. لا تمثل منحنيات RCS تشتت البيانات. قد تكون مرتبطة بعدد قليل من مرضى الذبحة الصدرية، وتعقيد المرض، وتعدد أبعاد بيانات الذبحة الصدرية، وإعداد معلمات منحنيات RCS، واختيار نماذجها.
دليل للأدبيات حول TyG وTyG-BMI وTyG-WC وTyG-WHtR كمؤشرات لخطر الإصابة بأمراض القلب والأوعية الدموية.
إن أحد الاكتشافات الأساسية في الدراسة هو أن الهيموغلوبين الغليكوزي له دور وساطة جزئي في العلاقة بين TyG وTyG-WC وTyG-WHtR وTyG-BMI ووفيات الأمراض القلبية الوعائية، والأمراض القلبية الوعائية الكلية، وفشل القلب الاحتقاني، والنوبة القلبية، والذبحة الصدرية، وأمراض القلب التاجية. الهيموغلوبين الغليكوزي هو ناتج دمج الهيموغلوبين من كريات الدم الحمراء مع السكريات من
مصل. الهيموغلوبين الجليكوزيل يعكس متوسط مستوى الجلوكوز في الدم على مدى
نقاط القوة والقيود
من خلال الإبلاغ الذاتي، لذلك تم استبعاد المرضى الذين يعانون من أمراض القلب والأوعية الدموية غير المشخصة. ثانياً، اعتمدت الدراسة على عينة دم واحدة في البداية لجمع المعلومات حول TyG وTyG-WC وTyG-WHtR وTyG-BMI. لذلك، لم نتمكن من تقييم تأثيرها على وفيات أمراض القلب والأوعية الدموية، وأمراض القلب والأوعية الدموية الكلية، وفشل القلب الاحتقاني، والنوبات القلبية، والذبحة الصدرية، وأمراض القلب التاجية على مر الزمن. أخيراً، تستند أبحاثنا إلى بيانات من الولايات المتحدة واستبعدت الأشخاص الذين لديهم استهلاك غير طبيعي للطاقة. يبقى أن نرى ما إذا كانت هذه النتائج يمكن تطبيقها على نطاق واسع في مناطق أخرى، مما يشير إلى أن المزيد من البحث مطلوب.
الاستنتاجات
الاختصارات
| TyG | الجلوكوز الثلاثي الجليسريد |
| مرض القلب والأوعية الدموية | أمراض القلب والأوعية الدموية |
| NHANES | المسح الوطني للصحة والتغذية |
| تاي جي-دبليو سي | الجلوكوز والدهون الثلاثية ومحيط الخصر |
| TyG-WHtR | نسبة الجلوكوز والدهون الثلاثية إلى محيط الخصر والطول |
| مؤشر كتلة الجسم TyG | الجلوكوز، الدهون الثلاثية، مؤشر كتلة الجسم |
| RCS | المنحنى التكعيبي المقيد |
| ROC | الخصائص التشغيلية للمستقبل |
| FSG | جلوكوز الدم الصائم |
| اختبار تحمل الجلوكوز عن طريق الفم بعد ساعتين | جلوكوز بعد ساعتين من اختبار تحمل الجلوكوز الفموي |
| كوليسترول HDL | كوليسترول البروتين الدهني عالي الكثافة |
| LDL-C | كوليسترول البروتين الدهني منخفض الكثافة |
| SBP | ضغط الدم الانقباضي |
| HOMA-IR | تقييم النموذج المتوازن لمقاومة الأنسولين |
| الهيموغلوبين A1c | الهيموغلوبين الجليكوزي |
| أهي | مؤشر تناول الطعام الصحي البديل |
| غرف العمليات | نسب الأرجحية |
| Cls | فترات الثقة |
معلومات إضافية
الملف الإضافي 3. الجدول التكميلية 1-31.
شكر وتقدير
مساهمات المؤلفين
التمويل
توفر البيانات والمواد
الإعلانات
المصالح المتنافسة
تفاصيل المؤلف
تم النشر عبر الإنترنت: 06 يناير 2024
References
- Vaduganathan M, Mensah GA, Turco JV, Fuster V, Roth GA. The global burden of cardiovascular diseases and risk. J Am Coll Cardiol. 2022;80(25):2361-71.
- Roth GA, Mensah GA, Johnson CO, Addolorato G, Ammirati E, Baddour LM, Barengo NC, Beaton AZ, Benjamin EJ, Benziger CP, et al. Global burden of cardiovascular diseases and risk factors, 1990-2019. J Am Coll Cardiol. 2020;76(25):2982-3021.
- Lee J, Kim B, Kim W, Ahn C, Choi HY, Kim JG, Kim J, Shin H, Kang JG, Moon S. Lipid indices as simple and clinically useful surrogate markers for insulin resistance in the U.S. population. Sci Rep. 2021. https://doi.org/10. 1038/s41598-021-82053-2.
- Simental-Mendía LE, Rodríguez-Morán M, Guerrero-Romero F. The product of fasting glucose and triglycerides as surrogate for identifying insulin resistance in apparently healthy subjects. Metab Syndr Relat Disord. 2008;6(4):299-304.
- Faerch K, Vaag A, Holst J, Hansen T, Jørgensen T, Borch-Johnsen K. Natural history of insulin sensitivity and insulin secretion in the progression from normal glucose tolerance to impaired fasting glycemia and impaired glucose tolerance: the Inter99 study. Diabetes Care. 2009;32(3):439-44.
- DeFronzo R, Ferrannini E, Groop L, Henry R, Herman W, Holst J, Hu F, Kahn C, Raz I, Shulman G, et al. Type 2 diabetes mellitus. Nat Rev Dis Primers. 2015;1:15019.
- Kahn B, Flier J. Obesity and insulin resistance. J Clin Investig. 2000;106(4):473-81.
- Hill M, Yang Y, Zhang L, Sun Z, Jia G, Parrish A, Sowers J. Insulin resistance, cardiovascular stiffening and cardiovascular disease. Metab Clin Exp. 2021;119:154766.
- Bornfeldt K, Tabas I. Insulin resistance, hyperglycemia, and atherosclerosis. Cell Metab. 2011;14(5):575-85.
- Ingelsson E, Sundström J, Arnlöv J, Zethelius B, Lind L. Insulin resistance and risk of congestive heart failure. JAMA. 2005;294(3):334-41.
- Liang S, Wang C, Zhang J, Liu Z, Bai Y, Chen Z, Huang H, He Y. Triglycerideglucose index and coronary artery disease: a systematic review and meta-analysis of risk, severity, and prognosis. Cardiovasc Diabetol. 2023;22(1):170.
- Wu Z, Liu L, Wang W, Cui H, Zhang Y, Xu J, Zhang W, Zheng T, Yang J. Triglyceride-glucose index in the prediction of adverse cardiovascular events in patients with premature coronary artery disease: a retrospective cohort study. Cardiovasc Diabetol. 2022;21(1):142.
- Tao L-C, Xu J-N, Wang T-T, Hua F, Li J-J. Triglyceride-glucose index as a marker in cardiovascular diseases: landscape and limitations. Cardiovasc Diabetol. 2022. https://doi.org/10.1186/s12933-022-01511-x.
- Ding X, Wang X, Wu J, Zhang M, Cui M. Triglyceride-glucose index and the incidence of atherosclerotic cardiovascular diseases: a meta-analysis of cohort studies. Cardiovasc Diabetol. 2021. https://doi.org/10.1186/ s12933-021-01268-9.
- Huang D, Mathurin P, Cortez-Pinto H, Loomba R. Global epidemiology of alcohol-associated cirrhosis and HCC: trends, projections and risk factors. Nat Rev Gastroenterol Hepatol. 2023;20(1):37-49.
- Lavie C, Laddu D, Arena R, Ortega F, Alpert M, Kushner R. Healthy weight and obesity prevention: JACC health promotion series. J Am Coll Cardiol. 2018;72(13):1506-31.
- Huang T, Qi Q, Zheng Y, Ley S, Manson J, Hu F, Qi L. Genetic predisposition to central obesity and risk of type 2 diabetes: two independent cohort studies. Diabetes Care. 2015;38(7):1306-11.
- Khan SS, Ning H, Wilkins JT, Allen N, Carnethon M, Berry JD, Sweis RN, Lloyd-Jones DM. Association of body mass index with lifetime risk of cardiovascular disease and compression of morbidity. JAMA Cardiol. 2018. https://doi.org/10.1001/jamacardio.2018.0022.
- Iliodromiti S, Celis-Morales C, Lyall D, Anderson J, Gray S, Mackay D, Nelson S, Welsh P, Pell J, Gill J, et al. The impact of confounding on the associations of different adiposity measures with the incidence of cardiovascular disease: a cohort study of 296535 adults of white European descent. Eur Heart J. 2018;39(17):1514-20.
- Wormser D, Kaptoge S, Di Angelantonio E, Wood A, Pennells L, Thompson A, Sarwar N, Kizer J, Lawlor D, Nordestgaard B, et al. Separate and combined associations of body-mass index and abdominal adiposity with cardiovascular disease: collaborative analysis of 58 prospective studies. Lancet. 2011;377(9771):1085-95.
- Yan S, Wang D, Jia Y. Comparison of insulin resistance-associated parameters in US adults: a cross-sectional study. Hormones. 2023;22(2):331-41.
- Lim J, Kim J, Koo S, Kwon G. Comparison of triglyceride glucose index, and related parameters to predict insulin resistance in Korean adults: an analysis of the 2007-2010 Korean national health and nutrition examination survey. PLoS ONE. 2019;14(3):e0212963.
- Zhang
, Zhang T, He S, Jia S, Zhang Z, Ye R, Yang X, Chen X. Association of metabolic syndrome with TyG index and TyG-related parameters in an urban Chinese population: a 15-year prospective study. Diabetol Metab Syndr. 2022;14(1):84. - Zhou S, Yu Y, Zhang Z, Ma L, Wang C, Yang M, Cheng X, Liu T, Sun R, Chen Y. Association of obesity, triglyceride-glucose and its derivatives index with risk of hyperuricemia among college students in Qingdao, China. Front Endocrinol. 2022;13:1001844.
- Xuan W, Liu D, Zhong J, Luo H, Zhang X. Impacts of triglyceride glucosewaist to height ratio on diabetes incidence: a secondary analysis of a population-based longitudinal data. Front Endocrinol. 2022;13:949831.
- Xue Y, Xu J, Li M, Gao Y. Potential screening indicators for early diagnosis of NAFLD/MAFLD and liver fibrosis: triglyceride glucose index-related parameters. Front Endocrinol. 2022;13:951689.
- Er L, Wu S, Chou H, Hsu L, Teng M, Sun Y, Ko Y. Triglyceride glucose-body mass index is a simple and clinically useful surrogate marker for insulin resistance in nondiabetic individuals. PLoS ONE. 2016;11 (3):e0149731.
- Cheng Y, Fang Z, Zhang X, Wen Y, Lu J, He S, Xu B. Association between triglyceride glucose-body mass index and cardiovascular outcomes in
patients undergoing percutaneous coronary intervention: a retrospective study. Cardiovasc Diabetol. 2023;22(1):75. - Hou W, Han T, Sun X, Chen Y, Xu J, Wang Y, Yang X, Jiang W, Sun C. Relationship between carbohydrate intake (quantity, quality, and time eaten) and mortality (total, cardiovascular, and diabetes): assessment of 2003-2014 national health and nutrition examination survey participants. Diabetes Care. 2022;45(12):3024-31.
- Khan S, Sobia F, Niazi N, Manzoor S, Fazal N, Ahmad F. Metabolic clustering of risk factors: evaluation of Triglyceride-glucose index (TyG index) for evaluation of insulin resistance. Diabetol Metab Syndr. 2018;10:74.
- DuT, Yuan G, Zhang M, Zhou X, Sun X, Yu X. Clinical usefulness of lipid ratios, visceral adiposity indicators, and the triglycerides and glucose index as risk markers of insulin resistance. Cardiovasc Diabetol. 2014;13:146.
- Guerrero-Romero F, Simental-Mendía L, González-Ortiz M, MartínezAbundis E, Ramos-Zavala M, Hernández-González S, Jacques-Camarena O , Rodríguez-Morán M. The product of triglycerides and glucose, a simple measure of insulin sensitivity. Comparison with the euglycemic-hyperinsulinemic clamp. J Clin Endocrinol Metab. 2010;95(7):3347-51.
- Che B, Zhong C, Zhang R, Pu L, Zhao T, Zhang Y, Han L. Triglycerideglucose index and triglyceride to high-density lipoprotein cholesterol ratio as potential cardiovascular disease risk factors: an analysis of UK biobank data. Cardiovasc Diabetol. 2023. https://doi.org/10.1186/ s12933-023-01762-2.
- Park K, Ahn C, Lee S, Kang S, Nam J, Lee B, Kim J, Park J. Elevated TyG index predicts progression of coronary artery calcification. Diabetes Care. 2019;42(8):1569-73.
- Qu H, Long L, Chen L, Wu H, Fu C, Zhang S. Triglyceride-glucose index and estimated 10-year risk of a first hard cardiovascular event. Front Cardiovasc Med. 2022;9:994329.
- Zhang
, Xiao , Jiao , Shen . The triglyceride-glucose index is a predictor for cardiovascular and all-cause mortality in CVD patients with diabetes or pre-diabetes: evidence from NHANES 2001-2018. Cardiovasc Diabetol. 2023;22(1):279. - Liu X, He G, Lo K, Huang Y, Feng Y. The triglyceride-glucose index, an insulin resistance marker, was non-linear associated with all-cause and cardiovascular mortality in the general population. Front Cardiovasc Med. 2020;7:628109.
- Kizer J, Arnold A, Jenny N, Cushman M, Strotmeyer E, Ives D, Ding J, Kritchevsky S, Chaves P, Hirsch C, et al. Longitudinal changes in adiponectin and inflammatory markers and relation to survival in the oldest old: the cardiovascular health study all stars study. J Gerontol A Biol Sci Med Sci. 2011;66(10):1100-7.
- Ludin A, Gur-Cohen S, Golan K, Kaufmann K, Itkin T, Medaglia C, Lu X, Ledergor G, Kollet O, Lapidot T. Reactive oxygen species regulate hematopoietic stem cell self-renewal, migration and development, as well as their bone marrow microenvironment. Antioxid Redox Signal. 2014;21(11):1605-19.
- Cho Y, Lee J, Kim H, Kim E, Lee M, Yang D, Kang J, Jung C, Park J, Kim H, et al. Triglyceride glucose-waist circumference better predicts coronary calcium progression compared with other indices of insulin resistance: a longitudinal observational study. J Clin Med. 2020. https://doi.org/10. 3390/jcm10010092.
- Lavie C, Milani R, Ventura H. Obesity and cardiovascular disease: risk factor, paradox, and impact of weight loss. J Am Coll Cardiol. 2009;53(21):1925-32.
- Rexrode K, Carey V, Hennekens C, Walters E, Colditz G, Stampfer M, Willett W, Manson J. Abdominal adiposity and coronary heart disease in women. JAMA. 1998;280(21):1843-8.
- Wang H, He S, Wang J, An Y, Wang X, Li G, Gong Q. Hyperinsulinemia and plasma glucose level independently associated with all-cause and cardiovascular mortality in Chinese people without diabetes-A post-hoc analysis of the 30-year follow-up of Da Qing diabetes and IGT study. Diabetes Res Clin Pract. 2023;195:110199.
- Barzegar N, Tohidi M, Hasheminia M, Azizi F, Hadaegh F. The impact of triglyceride-glucose index on incident cardiovascular events during 16 years of follow-up: Tehran Lipid and Glucose Study. Cardiovasc Diabetol. 2020;19(1):155.
- Li X, Chan J, Guan B, Peng S, Wu X, Lu X, Zhou J, Hui J, Lee Y, Satti D, et al. Triglyceride-glucose index and the risk of heart failure: evidence from
two large cohorts and a Mendelian randomization analysis. Cardiovasc Diabetol. 2022;21(1):229. - Sánchez-Iñigo L, Navarro-González D, Fernández-Montero A, PastranaDelgado J, Martínez J. The TyG index may predict the development of cardiovascular events. Eur J Clin Invest. 2016;46(2):189-97.
- Liu L, Wu Z, Zhuang Y, Zhang Y, Cui H, Lu F, Peng J, Yang J. Association of triglyceride-glucose index and traditional risk factors with cardiovascular disease among non-diabetic population: a 10-year prospective cohort study. Cardiovasc Diabetol. 2022;21(1):256.
- Laakso M, Kuusisto J. Insulin resistance and hyperglycaemia in cardiovascular disease development. Nat Rev Endocrinol. 2014;10(5):293-302.
- Sinning C, Makarova N, Völzke H, Schnabel R, Ojeda F, Dörr M, Felix S, Koenig W, Peters A, Rathmann W, et al. Association of glycated hemoglobin A levels with cardiovascular outcomes in the general population: results from the BiomarCaRE (biomarker for cardiovascular risk assessment in Europe) consortium. Cardiovasc Diabetol. 2021;20(1):223
- Selvin E, Steffes M, Zhu H, Matsushita K, Wagenknecht L, Pankow J, Coresh J, Brancati F. Glycated hemoglobin, diabetes, and cardiovascular risk in nondiabetic adults. N Engl J Med. 2010;362(9):800-11.
- Pyöräla K. Relationship of glucose tolerance and plasma insulin to the incidence of coronary heart disease: results from two population studies in Finland. Diabetes Care. 1979;2(2):131-41.
- Lamarche B, Tchernof A, Mauriège P, Cantin B, Dagenais G, Lupien P, Després J. Fasting insulin and apolipoprotein B levels and low-density lipoprotein particle size as risk factors for ischemic heart disease. JAMA. 1998;279(24):1955-61.
- Sinha A, Bhattacharya S, Acharya K, Mazumder S. Stimulation of nitric oxide synthesis and protective role of insulin in acute thrombosis in vivo. Life Sci. 1999;65(25):2687-96.
- Xi L, Kukreja R. Pivotal role of nitric oxide in delayed pharmacological preconditioning against myocardial infarction. Toxicology. 2000;155:37-44.
- Yazar A, Polat G, Un I, Levent A, Kaygusuz A, Büyükafşar K, Çamdeviren H. Effects of glibenclamide, metformin and insulin on the incidence and latency of death by oubain-induced arrhythmias in mice. Pharmacol Res. 2002;45(3):183-7.
- Ren J, Wu N, Wang S, Sowers J, Zhang Y. Obesity cardiomyopathy: evidence, mechanisms, and therapeutic implications. Physiol Rev. 2021;101(4):1745-807.
- Ormazabal V, Nair S, Elfeky O, Aguayo C, Salomon C, Zuñiga F. Association between insulin resistance and the development of cardiovascular disease. Cardiovasc Diabetol. 2018;17(1):122.
ملاحظة الناشر
هل أنت مستعد لتقديم بحثك؟ اختر BMC واستفد من:
- تقديم سريع ومريح عبر الإنترنت
- مراجعة دقيقة من قبل باحثين ذوي خبرة في مجالك
- نشر سريع عند القبول
- دعم لبيانات البحث، بما في ذلك أنواع البيانات الكبيرة والمعقدة
- الوصول المفتوح الذهبي الذي يعزز التعاون الأوسع وزيادة الاقتباسات
- أقصى رؤية لبحثك: أكثر من 100 مليون مشاهدة للموقع سنويًا
تعرف على المزيدbiomedcentral.com/submissions
ساهم Keke Dang وXuanyang Wang بالتساوي في هذا العمل ويتشاركان في تأليف العمل الأول.
*المراسلة:
Ying Li
liying_helen@163.com
القائمة الكاملة لمعلومات المؤلف متاحة في نهاية المقالة
DOI: https://doi.org/10.1186/s12933-023-02115-9
PMID: https://pubmed.ncbi.nlm.nih.gov/38184598
Publication Date: 2024-01-06
The association between triglyceride-glucose
(Dheck for Check for updates index and its combination with obesity indicators and cardiovascular disease: NHANES 2003-2018
Abstract
Background In the American population, the relationship between the triglyceride-glucose (TyG) index and TYG combined with indicators of obesity and cardiovascular disease (CVD) and its mortality has been less well studied. Methods This cross-sectional study included 11,937 adults from the National Health and Nutrition Examination Survey (NHANES) 2003-2018. Cox proportional hazards model, binary logistic regression analyses, restricted cubic spline (RCS), and receiver operating characteristic (ROC) were used to analyze the relationship between TyG and its combined obesity-related indicators and CVD and its mortality. Mediation analysis explored the mediating role of glycated hemoglobin and insulin in the above relationships. Results In this study, except for no significant association between TyG and CVD mortality, TyG, TyG-WC, TyG-WHtR, and TyG-BMI were significantly and positively associated with CVD and CVD mortality. TyG-WHtR is the strongest predictor of CVD mortality (HR 1.66, 95% CI 1.21-2.29). The TyG index correlated better with the risk of coronary heart disease (OR 2.52, 95% CI 1.66-3.83). TyG-WC correlated best with total CVD (OR 2.37, 95% CI 1.77-3.17), congestive heart failure (OR 2.14, 95% CI 1.31-3.51), and angina pectoris (OR 2.38, 95% CI 1.43-3.97). TyG-WHtR correlated best with myocardial infarction (OR 2.24, 95% CI 1.45-3.44). RCS analyses showed that most of the above relationships were linear (P-overall < 0.0001, P-nonlinear > 0.05). Otherwise, ROC curves showed that TyG-WHtR and TyG-WC had more robust diagnostic efficacy than TyG. In mediation analyses, glycated hemoglobin mediated in all the above relationships and insulin-mediated in partial relationships. Conclusions TyG-WC and TyG-WtHR enhance CVD mortality prediction, diagnostic efficacy of CVD and its mortality, and correlation with some CVD over and above the current hottest TyG. TyG-WC and TyG-WtHR are expected to become more effective metrics for identifying populations at early risk of cardiovascular disease and improve risk stratification.
Introduction
The Triglyceride-Glucose (TyG) index is a measure of insulin resistance that assesses the body’s insulin sensitivity by combining two biomarkers, triglyceride and fasting blood glucose [3, 4]. Insulin resistance is a state in which the body’s sensitivity and response to insulin are reduced, resulting in the inability of insulin to efficiently transport glucose into cells, causing metabolic abnormalities such as hyperglycemia [5]. Insulin resistance is considered a significant risk factor for several metabolic diseases such as type 2 diabetes [6], obesity [7], cardiovascular disease [8-10], and so on. The TyG index is calculated using the following formula: TyG
Obesity is prevalent worldwide and is closely associated with various health risks, such as poor glucose tolerance, insulin resistance, and metabolic disorders [15-17], which can lead to the onset progression and prognosis of cardiovascular disease [18-20]. TYG combined with obesity indices is closely associated with insulin resistance [21, 22], metabolic syndrome [23], uric acid [24], diabetes mellitus [25], and fatty liver [26]. Some studies have shown that TyG combined with adiposity indices is better than the TyG index for assessing [27]. However, these studies on TyG combined with obesity indices and cardiovascular disease were few and mainly focused on Asian and European populations [28]. The relationship between TyG combined with obesity indices and cardiovascular disease and CVD mortality in the American population is unclear. Our study used the National Health and Nutrition Examination Survey database to analyse the association of the TyG index and its combination of obesity indices with
Materials and methods
Data source and study population
Definitions of TyG, TyG-WC, TyG-WHtR, and TyG-BMI
TyG, TyG-WC, TyG-WHtR, and TyG-BMI were calculated according to the following formulas: (1)
According to the International Statistical Classification of Diseases and Related Health Problems, Tenth Revision (ICD-10) codes, cardiovascular disease (I00-I99), congestive heart failure (I50.0, I50.1, I50.9), coronary artery disease (I20-I25.9), myocardial infarction (I21-I23), and angina pectoris (I20.0-I20.9), CVD mortality (I00-I09, I11, I13, I20-I51, or I60-I69).
Assessment of covariates
standardized medical condition questionnaire. The participants were asked: “Close relative had a heart attack?” or “Ever been told you had cancer or malignancy?” or “Doctor told you you had diabetes?” and answered by yes or no. Weight, height, blood pressure, and waist circumference were obtained when people attended a physical examination at a mobile health center and were considered continuous type variables. In addition, fasting blood glucose (FSG), insulin, HbA1c, triglycerides, and total cholesterol were measured at baseline when participants provided blood samples and were considered continuous type variables. The AHEI was developed from the original Healthy Eating Index, which included 11 food components identified through a comprehensive review of studies. More details on the measurement of covariates can be found on the NHANES website (https://www.cdc. gov/nchs/nhanes/index.htm).
Statistical analysis
Results
Basic characteristics of participants according to the quartile of TyG, TyG-WC, TyG-WHtR, and TyG-BMI indicators
Relationship between TyG, TyG-WC, TyG-WHtR, TyG-BMI, and cardiovascular disease mortality, total CVD, congestive heart failure, myocardial infarction, angina pectoris, and coronary heart disease
disease. Additional file 3: Tables S4-S9 provide detailed information on all associations. After adjustment for covariates, the results showed that except for no significant association between TyG and CVD mortality, TyG, TyG-WC, TyG-WHtR, and TyG-BMI were significantly and positively associated with CVD mortality, total cardiovascular disease, congestive heart failure, myocar-dial infarction, angina pectoris, and coronary heart disease ( P trend
Restricted cubic splines (RCS) analysis investigating the relationship between TyG, TyG-WC, TyG-WHtR, and TyG-BMI and cardiovascular disease mortality, total CVD, congestive heart failure, myocardial infarction, angina pectoris, and coronary heart disease
| Triglyceride-glucose (TyG) (
|
|
|
||||
|
|
8.23-8.62 | 8.63-9.06 | >9.07 | |||
| N=2986 | N=2986 | N=2983 | N=2982 | |||
| Age, years | 42.33 (41.36, 43.29) | 47.00 (46.13, 47.86) | 50.08 (49.32, 50.85) | 51.91 (51.15, 52.66) | < 0.001 | < 0.001 |
| Male, % | 37.60 (35.70, 39.60) | 47.40 (45.20, 49.70) | 51.20 (49.20, 53.20) | 58.50 (56.30, 60.70) | < 0.001 | < 0.001 |
| Non-Hispanic white, % | 68.00 (64.80, 71.10) | 71.00 (67.80, 73.90) | 72.80 (69.70, 75.70) | 73.10 (69.60, 76.30) | < 0.001 | < 0.001 |
| BMI, kg/m
|
25.95 (25.71, 26.20) | 27.95 (27.68, 28.22) | 29.54 (29.23, 29.86) | 31.46 (31.10, 31.81) | < 0.001 | < 0.001 |
| Smoke, % | 19.80 (17.80, 22.00) | 24.20 (21.80, 26.70) | 25.90 (23.80, 28.20) | 27.20 (25.30, 29.30) | < 0.001 | < 0.001 |
| Drink, % | 74.00 (71.30, 76.50) | 73.90 (71.60, 76.10) | 74.60 (72.10, 76.90) | 73.20 (70.90, 75.40) | < 0.001 | < 0.001 |
| Regular exercise, % | 32.90 (30.30, 35.70) | 42.20 (39.90, 44.60) | 43.60 (41.20, 46.00) | 50.90 (48.10, 53.70) | < 0.001 | < 0.001 |
| College graduate or above, % | 36.90 (34.10, 39.80) | 30.80 (27.60, 34.10) | 27.10 (24.30, 30.10) | 21.20 (18.80, 23.80) | <0.001 | < 0.001 |
| > 100,000 annual household income, % | 19.60 (16.80, 22.60) | 16.50 (13.80, 19.60) | 13.80 (11.90, 15.90) | 10.40 (8.10, 13.30) | 0.078 | 0.336 |
| Dietary supplements use, % | 51.00 (48.90, 53.10) | 51.30 (48.90, 53.60) | 50.20 (48.00, 52.50) | 52.70 (50.10, 55.20) | <0.001 | < 0.001 |
| Total energy, kcal/day |
|
|
|
|
< 0.001 | < 0.001 |
| AHEI sore | 50.86 (50.31, 51.41) | 50.03 (49.47, 50.59) | 50.21 (49.72, 50.71) | 49.58 (49.06, 50.09) | < 0.001 | < 0.001 |
| Family history of heart disease, % | 13.00 (11.60, 14.70) | 16.70 (14.70, 18.90) | 17.70 (15.90, 19.60) | 18.80 (16.70, 21.10) | 0.078 | 0.033 |
| Triglyceride, mmol/L | 0.68 (0.67, 0.69) | 1.07 (1.06, 1.07) | 1.53 (1.52, 1.54) | 2.91 (2.82, 3.00) | < 0.001 | < 0.001 |
| Fasting glucose, mmol/L | 5.15 (5.12, 5.18) | 5.46 (5.43, 5.49) | 5.76 (5.71, 5.80) | 6.93 (6.80, 7.05) | < 0.001 | < 0.001 |
| Waist circumference, cm | 89.93 (89.33, 90.52) | 96.67 (95.87, 97.47) | 101.12 (100.46, 101.78) | 107.34 (106.49, 108.19) | < 0.001 | < 0.001 |
| Glycohemoglobin, % | 5.35 (5.34, 5.37) | 5.52 (5.50, 5.54) | 5.65 (5.63, 5.68) | 6.34 (6.28, 6.40) | < 0.001 | < 0.001 |
| Standing height, cm | 167.49 (167.14, 167.83) | 167.86 (167.50, 168.22) | 167.41 (167.04, 167.79) | 168.01 (167.64, 168.38) | < 0.001 | < 0.001 |
| Insulin, pmol/L | 49.54 (48.07, 51.01) | 65.07 (63.15, 67.00) | 81.76 (79.41, 84.11) | 118.02 (112.65, 123.39) | < 0.001 | < 0.001 |
| Systolic blood pressure, mmHg | 115.63 (114.88, 116.38) | 120.18 (119.44, 120.91) | 122.24 (121.52, 122.96) | 127.11 (126.20, 128.02) | < 0.001 | < 0.001 |
| Cholesterol, mmol/L | 4.67 (4.63, 4.72) | 5.00 (4.95, 5.05) | 5.21 (5.17, 5.26) | 5.50 (5.44, 5.55) | <0.001 | < 0.001 |
| Self-reported cancer, % | 7.10 (5.90, 8.60) | 9.50 (8.00, 11.20) | 10.70 (9.40, 12.30) | 11.20 (10.00, 12.60) | < 0.001 | < 0.001 |
| Self-reported diabetes, % | 2.20 (1.60, 2.80) | 4.20 (3.50, 5.10) | 7.70 (6.70, 8.90) | 21.40 (19.10, 23.80) | < 0.001 | < 0.001 |
| Death of cardiovascular diseases, % | 2.00 (1.50, 2.60) | 3.40 (2.90, 4.10) | 4.20 (3.50, 4.90) | 6.60 (5.70, 7.80) | < 0.001 | < 0.001 |
| Cardiovascular diseases, % | 4.80 (4.10, 5.60) | 7.30 (6.20, 8.60) | 10.00 (8.70, 11.50) | 13.70 (12.10, 15.50) | <0.001 | < 0.001 |
| Congestive heart failure, % | 1.20 (0.90, 1.70) | 1.80 (1.30, 2.40) | 2.60 (2.00, 3.40) | 4.40 (3.60, 5.30) | < 0.001 | < 0.001 |
| Myocardial infarction, % | 1.70 (1.30, 2.40) | 3.20 (2.40, 4.20) | 4.00 (3.40, 4.80) | 5.50 (4.50, 6.60) | < 0.001 | < 0.001 |
| Angina pectoris, % | 1.10 (0.80, 1.60) | 1.60 (1.10, 2.20) | 3.10 (2.40, 0.40) | 3.80 (0.30, 4.80) | < 0.001 | < 0.001 |
| Coronary heart disease, % | 1.70 (1.30, 2.40) | 2.80 (2.10, 3.60) | 4.40 (3.50, 5.50) | 6.30 (5.30, 7.50) | < 0.001 | < 0.001 |
Mediation analysis of TyG, TyG-WC, TyG-WHtR, and TyG-BMI with CVD mortality, total CVD, congestive heart failure, myocardial infarction, angina pectoris, and coronary heart disease
49.0, 41.6, and
Receiver operating characteristic (ROC) curves of TyG, TyG-WC, TyG-WHtR, TyG-BMI, WC, WHtR, and BMI in relation to cardiovascular disease mortality, total CVD, congestive heart failure, myocardial infarction, angina pectoris, and coronary heart disease
For CVD mortality, TyG-WHtR had the highest diagnostic efficacy (AUC: 0. 628, 95% CI 0.608-0.647), followed by TyG-WC (AUC: 0.614, 95% CI 0.595-0.634). For total CVD, TyG-WHtR had the highest diagnostic efficacy (AUC: 0. 655, 95% CI 0.640-0.670), followed by TyG-WC (AUC: 0.650, 95% CI 0.635-0.665). For congestive heart failure, TyG-WHtR had the highest diagnostic efficacy (AUC: 0.675, 95% CI 0.648-0.702), followed by
Stratification of TyG, TyG-WC, TyG-WHtR, and TyG-BMI in relation to CVDmortality, total CVD, congestive heart failure, myocardial infarction, angina pectoris, and coronary heart disease
Discussion
TyG, a biomarker derived from fasting glucose and triglyceride levels, has gained popularity as a substitute for insulin resistance owing to its user-friendly calculation and high degree of sensitivity and specificity [30-32]. Our research demonstrates a signifcant and positive connection between TyG and total CVD, congestive heart failure, myocardial infarction, angina pectoris, and coronary heart disease in the United States population, consistent with previous studies [33, 34]. However, current research on TyG and cardiovascular disease has centered on European and Asian populations, with a limited number of studies conducted in the United States [35]. Following the adjustment of nutritional data covariates such as total energy intake, AHEI, and dietary supplements, our investigation determined that TyG showed a significant and affirmative correlation with total CVD, congestive heart failure, myocardial infarction, angina pectoris, and coronary heart disease.
Our study is the inaugural investigation into the correlation between TyG combined with obesity indicators and CVD and CVD mortality in an American population. The findings of our study reveal that except for no significant association between TyG and CVD mortality, TyG, TyG-WC, TyG-WHtR, and TyG-BMI were significantly and positively associated with CVD mortality, total cardiovascular disease, congestive heart failure, myocar-dial infarction, angina pectoris, and coronary heart disease. RCS analyses showed that most of the above relationships were linear, but TyG-WC, TyG-WHtR, and TyGBMI were non-linearly associated with cardiovascular
mortality. This is consistent with previous reports [36]. In a prospective cohort study from the United States population, the TyG index was associated with mortality due to all-cause and cardiovascular disease nonlinearly. In Model 3, the positive effect sizes become non-significant with cardiovascular death (HR, 1.37; 95% CI 0.78-2.42) [37]. It has been suggested that excessively high or low TyG, TyG-WC, and TyG-BMI indices may lead to an increased risk of cardiovascular death, which may be related to excessively high or low insulin resistance, inflammatory response, oxidative stress vascular endothelial function, which in turn may lead to an increased risk of cardiovascular death [38, 39]. TyG-WC, TyG-WHtR, and TyG-BMI were non-linearly associated with angina pectoris. The RCS curves do not represent the dispersion of the data. They may be related to the small number of angina patients, the disease’s complexity, the angina data’s multidimensionality, the setting of the parameters of the RCS curves, and the choice of their models.
proof for the literature on TyG, TyG-BMI, TyG-WC, and TyG-WHtR as predictors of cardiovascular disease risk.
An essential finding of the study is that glycated hemoglobin has a partial mediating role in the association between TyG, TyG-WC, TyG-WHtR, and TyG-BMI and CVD mortality, total CVD, congestive heart failure, myocardial infarction, angina pectoris, and coronary heart disease. Glycated hemoglobin is the product of combining hemoglobin from red blood cells with sugars from
serum. Glycated hemoglobin reflects the average blood glucose level over the last
Strengths and limitations
by self-report, so patients with undiagnosed CVD were omitted. Secondly, the study relied on a single baseline blood sample to gather information on TyG, TyG-WC, TyG-WHtR, and TyG-BMI. Therefore, we could not assess their impact on CVD mortality, total CVD, congestive heart failure, myocardial infarction, angina pectoris, and coronary heart disease over time. Finally, our research is based on data from the United States and excluded people with abnormal energy intake. It remains to be seen whether these findings can be widely applied to other regions, suggesting that further research is warranted.
Conclusions
Abbreviations
| TyG | Triglyceride-glucose |
| CVD | Cardiovascular disease |
| NHANES | National Health and Nutrition Examination Survey |
| TyG-WC | Glucose triglyceride-waist circumference |
| TyG-WHtR | Glucose triglyceride-waist height ratio |
| TyG-BMI | Glucose triglyceride-body mass index |
| RCS | Restricted cubic spline |
| ROC | Receiver operating characteristic |
| FSG | Fasting blood glucose |
| OGTT 2 hPG | 2-Hour glucose from an oral glucose tolerance test |
| HDL-C | High-density lipoprotein-cholesterol |
| LDL-C | Low-density lipoprotein-cholesterol |
| SBP | Systolic Blood Pressure |
| HOMA-IR | Homeostatic Model Assessment of Insulin Resistance |
| HbA1c | Glycated hemoglobin |
| AHEI | Alternative healthy eating index |
| ORs | Odds ratios |
| Cls | Confidence intervals |
Supplementary Information
Additional file 3. Supplementary Table 1-31.
Acknowledgements
Author contributions
Funding
Availability of data and materials
Declarations
Competing interests
Author details
Published online: 06 January 2024
References
- Vaduganathan M, Mensah GA, Turco JV, Fuster V, Roth GA. The global burden of cardiovascular diseases and risk. J Am Coll Cardiol. 2022;80(25):2361-71.
- Roth GA, Mensah GA, Johnson CO, Addolorato G, Ammirati E, Baddour LM, Barengo NC, Beaton AZ, Benjamin EJ, Benziger CP, et al. Global burden of cardiovascular diseases and risk factors, 1990-2019. J Am Coll Cardiol. 2020;76(25):2982-3021.
- Lee J, Kim B, Kim W, Ahn C, Choi HY, Kim JG, Kim J, Shin H, Kang JG, Moon S. Lipid indices as simple and clinically useful surrogate markers for insulin resistance in the U.S. population. Sci Rep. 2021. https://doi.org/10. 1038/s41598-021-82053-2.
- Simental-Mendía LE, Rodríguez-Morán M, Guerrero-Romero F. The product of fasting glucose and triglycerides as surrogate for identifying insulin resistance in apparently healthy subjects. Metab Syndr Relat Disord. 2008;6(4):299-304.
- Faerch K, Vaag A, Holst J, Hansen T, Jørgensen T, Borch-Johnsen K. Natural history of insulin sensitivity and insulin secretion in the progression from normal glucose tolerance to impaired fasting glycemia and impaired glucose tolerance: the Inter99 study. Diabetes Care. 2009;32(3):439-44.
- DeFronzo R, Ferrannini E, Groop L, Henry R, Herman W, Holst J, Hu F, Kahn C, Raz I, Shulman G, et al. Type 2 diabetes mellitus. Nat Rev Dis Primers. 2015;1:15019.
- Kahn B, Flier J. Obesity and insulin resistance. J Clin Investig. 2000;106(4):473-81.
- Hill M, Yang Y, Zhang L, Sun Z, Jia G, Parrish A, Sowers J. Insulin resistance, cardiovascular stiffening and cardiovascular disease. Metab Clin Exp. 2021;119:154766.
- Bornfeldt K, Tabas I. Insulin resistance, hyperglycemia, and atherosclerosis. Cell Metab. 2011;14(5):575-85.
- Ingelsson E, Sundström J, Arnlöv J, Zethelius B, Lind L. Insulin resistance and risk of congestive heart failure. JAMA. 2005;294(3):334-41.
- Liang S, Wang C, Zhang J, Liu Z, Bai Y, Chen Z, Huang H, He Y. Triglycerideglucose index and coronary artery disease: a systematic review and meta-analysis of risk, severity, and prognosis. Cardiovasc Diabetol. 2023;22(1):170.
- Wu Z, Liu L, Wang W, Cui H, Zhang Y, Xu J, Zhang W, Zheng T, Yang J. Triglyceride-glucose index in the prediction of adverse cardiovascular events in patients with premature coronary artery disease: a retrospective cohort study. Cardiovasc Diabetol. 2022;21(1):142.
- Tao L-C, Xu J-N, Wang T-T, Hua F, Li J-J. Triglyceride-glucose index as a marker in cardiovascular diseases: landscape and limitations. Cardiovasc Diabetol. 2022. https://doi.org/10.1186/s12933-022-01511-x.
- Ding X, Wang X, Wu J, Zhang M, Cui M. Triglyceride-glucose index and the incidence of atherosclerotic cardiovascular diseases: a meta-analysis of cohort studies. Cardiovasc Diabetol. 2021. https://doi.org/10.1186/ s12933-021-01268-9.
- Huang D, Mathurin P, Cortez-Pinto H, Loomba R. Global epidemiology of alcohol-associated cirrhosis and HCC: trends, projections and risk factors. Nat Rev Gastroenterol Hepatol. 2023;20(1):37-49.
- Lavie C, Laddu D, Arena R, Ortega F, Alpert M, Kushner R. Healthy weight and obesity prevention: JACC health promotion series. J Am Coll Cardiol. 2018;72(13):1506-31.
- Huang T, Qi Q, Zheng Y, Ley S, Manson J, Hu F, Qi L. Genetic predisposition to central obesity and risk of type 2 diabetes: two independent cohort studies. Diabetes Care. 2015;38(7):1306-11.
- Khan SS, Ning H, Wilkins JT, Allen N, Carnethon M, Berry JD, Sweis RN, Lloyd-Jones DM. Association of body mass index with lifetime risk of cardiovascular disease and compression of morbidity. JAMA Cardiol. 2018. https://doi.org/10.1001/jamacardio.2018.0022.
- Iliodromiti S, Celis-Morales C, Lyall D, Anderson J, Gray S, Mackay D, Nelson S, Welsh P, Pell J, Gill J, et al. The impact of confounding on the associations of different adiposity measures with the incidence of cardiovascular disease: a cohort study of 296535 adults of white European descent. Eur Heart J. 2018;39(17):1514-20.
- Wormser D, Kaptoge S, Di Angelantonio E, Wood A, Pennells L, Thompson A, Sarwar N, Kizer J, Lawlor D, Nordestgaard B, et al. Separate and combined associations of body-mass index and abdominal adiposity with cardiovascular disease: collaborative analysis of 58 prospective studies. Lancet. 2011;377(9771):1085-95.
- Yan S, Wang D, Jia Y. Comparison of insulin resistance-associated parameters in US adults: a cross-sectional study. Hormones. 2023;22(2):331-41.
- Lim J, Kim J, Koo S, Kwon G. Comparison of triglyceride glucose index, and related parameters to predict insulin resistance in Korean adults: an analysis of the 2007-2010 Korean national health and nutrition examination survey. PLoS ONE. 2019;14(3):e0212963.
- Zhang
, Zhang T, He S, Jia S, Zhang Z, Ye R, Yang X, Chen X. Association of metabolic syndrome with TyG index and TyG-related parameters in an urban Chinese population: a 15-year prospective study. Diabetol Metab Syndr. 2022;14(1):84. - Zhou S, Yu Y, Zhang Z, Ma L, Wang C, Yang M, Cheng X, Liu T, Sun R, Chen Y. Association of obesity, triglyceride-glucose and its derivatives index with risk of hyperuricemia among college students in Qingdao, China. Front Endocrinol. 2022;13:1001844.
- Xuan W, Liu D, Zhong J, Luo H, Zhang X. Impacts of triglyceride glucosewaist to height ratio on diabetes incidence: a secondary analysis of a population-based longitudinal data. Front Endocrinol. 2022;13:949831.
- Xue Y, Xu J, Li M, Gao Y. Potential screening indicators for early diagnosis of NAFLD/MAFLD and liver fibrosis: triglyceride glucose index-related parameters. Front Endocrinol. 2022;13:951689.
- Er L, Wu S, Chou H, Hsu L, Teng M, Sun Y, Ko Y. Triglyceride glucose-body mass index is a simple and clinically useful surrogate marker for insulin resistance in nondiabetic individuals. PLoS ONE. 2016;11 (3):e0149731.
- Cheng Y, Fang Z, Zhang X, Wen Y, Lu J, He S, Xu B. Association between triglyceride glucose-body mass index and cardiovascular outcomes in
patients undergoing percutaneous coronary intervention: a retrospective study. Cardiovasc Diabetol. 2023;22(1):75. - Hou W, Han T, Sun X, Chen Y, Xu J, Wang Y, Yang X, Jiang W, Sun C. Relationship between carbohydrate intake (quantity, quality, and time eaten) and mortality (total, cardiovascular, and diabetes): assessment of 2003-2014 national health and nutrition examination survey participants. Diabetes Care. 2022;45(12):3024-31.
- Khan S, Sobia F, Niazi N, Manzoor S, Fazal N, Ahmad F. Metabolic clustering of risk factors: evaluation of Triglyceride-glucose index (TyG index) for evaluation of insulin resistance. Diabetol Metab Syndr. 2018;10:74.
- DuT, Yuan G, Zhang M, Zhou X, Sun X, Yu X. Clinical usefulness of lipid ratios, visceral adiposity indicators, and the triglycerides and glucose index as risk markers of insulin resistance. Cardiovasc Diabetol. 2014;13:146.
- Guerrero-Romero F, Simental-Mendía L, González-Ortiz M, MartínezAbundis E, Ramos-Zavala M, Hernández-González S, Jacques-Camarena O , Rodríguez-Morán M. The product of triglycerides and glucose, a simple measure of insulin sensitivity. Comparison with the euglycemic-hyperinsulinemic clamp. J Clin Endocrinol Metab. 2010;95(7):3347-51.
- Che B, Zhong C, Zhang R, Pu L, Zhao T, Zhang Y, Han L. Triglycerideglucose index and triglyceride to high-density lipoprotein cholesterol ratio as potential cardiovascular disease risk factors: an analysis of UK biobank data. Cardiovasc Diabetol. 2023. https://doi.org/10.1186/ s12933-023-01762-2.
- Park K, Ahn C, Lee S, Kang S, Nam J, Lee B, Kim J, Park J. Elevated TyG index predicts progression of coronary artery calcification. Diabetes Care. 2019;42(8):1569-73.
- Qu H, Long L, Chen L, Wu H, Fu C, Zhang S. Triglyceride-glucose index and estimated 10-year risk of a first hard cardiovascular event. Front Cardiovasc Med. 2022;9:994329.
- Zhang
, Xiao , Jiao , Shen . The triglyceride-glucose index is a predictor for cardiovascular and all-cause mortality in CVD patients with diabetes or pre-diabetes: evidence from NHANES 2001-2018. Cardiovasc Diabetol. 2023;22(1):279. - Liu X, He G, Lo K, Huang Y, Feng Y. The triglyceride-glucose index, an insulin resistance marker, was non-linear associated with all-cause and cardiovascular mortality in the general population. Front Cardiovasc Med. 2020;7:628109.
- Kizer J, Arnold A, Jenny N, Cushman M, Strotmeyer E, Ives D, Ding J, Kritchevsky S, Chaves P, Hirsch C, et al. Longitudinal changes in adiponectin and inflammatory markers and relation to survival in the oldest old: the cardiovascular health study all stars study. J Gerontol A Biol Sci Med Sci. 2011;66(10):1100-7.
- Ludin A, Gur-Cohen S, Golan K, Kaufmann K, Itkin T, Medaglia C, Lu X, Ledergor G, Kollet O, Lapidot T. Reactive oxygen species regulate hematopoietic stem cell self-renewal, migration and development, as well as their bone marrow microenvironment. Antioxid Redox Signal. 2014;21(11):1605-19.
- Cho Y, Lee J, Kim H, Kim E, Lee M, Yang D, Kang J, Jung C, Park J, Kim H, et al. Triglyceride glucose-waist circumference better predicts coronary calcium progression compared with other indices of insulin resistance: a longitudinal observational study. J Clin Med. 2020. https://doi.org/10. 3390/jcm10010092.
- Lavie C, Milani R, Ventura H. Obesity and cardiovascular disease: risk factor, paradox, and impact of weight loss. J Am Coll Cardiol. 2009;53(21):1925-32.
- Rexrode K, Carey V, Hennekens C, Walters E, Colditz G, Stampfer M, Willett W, Manson J. Abdominal adiposity and coronary heart disease in women. JAMA. 1998;280(21):1843-8.
- Wang H, He S, Wang J, An Y, Wang X, Li G, Gong Q. Hyperinsulinemia and plasma glucose level independently associated with all-cause and cardiovascular mortality in Chinese people without diabetes-A post-hoc analysis of the 30-year follow-up of Da Qing diabetes and IGT study. Diabetes Res Clin Pract. 2023;195:110199.
- Barzegar N, Tohidi M, Hasheminia M, Azizi F, Hadaegh F. The impact of triglyceride-glucose index on incident cardiovascular events during 16 years of follow-up: Tehran Lipid and Glucose Study. Cardiovasc Diabetol. 2020;19(1):155.
- Li X, Chan J, Guan B, Peng S, Wu X, Lu X, Zhou J, Hui J, Lee Y, Satti D, et al. Triglyceride-glucose index and the risk of heart failure: evidence from
two large cohorts and a Mendelian randomization analysis. Cardiovasc Diabetol. 2022;21(1):229. - Sánchez-Iñigo L, Navarro-González D, Fernández-Montero A, PastranaDelgado J, Martínez J. The TyG index may predict the development of cardiovascular events. Eur J Clin Invest. 2016;46(2):189-97.
- Liu L, Wu Z, Zhuang Y, Zhang Y, Cui H, Lu F, Peng J, Yang J. Association of triglyceride-glucose index and traditional risk factors with cardiovascular disease among non-diabetic population: a 10-year prospective cohort study. Cardiovasc Diabetol. 2022;21(1):256.
- Laakso M, Kuusisto J. Insulin resistance and hyperglycaemia in cardiovascular disease development. Nat Rev Endocrinol. 2014;10(5):293-302.
- Sinning C, Makarova N, Völzke H, Schnabel R, Ojeda F, Dörr M, Felix S, Koenig W, Peters A, Rathmann W, et al. Association of glycated hemoglobin A levels with cardiovascular outcomes in the general population: results from the BiomarCaRE (biomarker for cardiovascular risk assessment in Europe) consortium. Cardiovasc Diabetol. 2021;20(1):223
- Selvin E, Steffes M, Zhu H, Matsushita K, Wagenknecht L, Pankow J, Coresh J, Brancati F. Glycated hemoglobin, diabetes, and cardiovascular risk in nondiabetic adults. N Engl J Med. 2010;362(9):800-11.
- Pyöräla K. Relationship of glucose tolerance and plasma insulin to the incidence of coronary heart disease: results from two population studies in Finland. Diabetes Care. 1979;2(2):131-41.
- Lamarche B, Tchernof A, Mauriège P, Cantin B, Dagenais G, Lupien P, Després J. Fasting insulin and apolipoprotein B levels and low-density lipoprotein particle size as risk factors for ischemic heart disease. JAMA. 1998;279(24):1955-61.
- Sinha A, Bhattacharya S, Acharya K, Mazumder S. Stimulation of nitric oxide synthesis and protective role of insulin in acute thrombosis in vivo. Life Sci. 1999;65(25):2687-96.
- Xi L, Kukreja R. Pivotal role of nitric oxide in delayed pharmacological preconditioning against myocardial infarction. Toxicology. 2000;155:37-44.
- Yazar A, Polat G, Un I, Levent A, Kaygusuz A, Büyükafşar K, Çamdeviren H. Effects of glibenclamide, metformin and insulin on the incidence and latency of death by oubain-induced arrhythmias in mice. Pharmacol Res. 2002;45(3):183-7.
- Ren J, Wu N, Wang S, Sowers J, Zhang Y. Obesity cardiomyopathy: evidence, mechanisms, and therapeutic implications. Physiol Rev. 2021;101(4):1745-807.
- Ormazabal V, Nair S, Elfeky O, Aguayo C, Salomon C, Zuñiga F. Association between insulin resistance and the development of cardiovascular disease. Cardiovasc Diabetol. 2018;17(1):122.
Publisher’s Note
Ready to submit your research? Choose BMC and benefit from:
- fast, convenient online submission
- thorough peer review by experienced researchers in your field
- rapid publication on acceptance
- support for research data, including large and complex data types
- gold Open Access which fosters wider collaboration and increased citations
- maximum visibility for your research: over 100 M website views per year
Learn more biomedcentral.com/submissions
Keke Dang and Xuanyang Wang have contributed equally to this work and share first authorship.
*Correspondence:
Ying Li
liying_helen@163.com
Full list of author information is available at the end of the article