الانتقائية المتوسطة بواسطة جهد النبض للأكسدة الكهروكيميائية للجلسرين إلى حمض الجلسريك Pulse potential mediated selectivity for the electrocatalytic oxidation of glycerol to glyceric acid

المجلة: Nature Communications، المجلد: 15، العدد: 1
DOI: https://doi.org/10.1038/s41467-024-46752-4
PMID: https://pubmed.ncbi.nlm.nih.gov/38499522
تاريخ النشر: 2024-03-18

الانتقائية المتوسطة بواسطة جهد النبض للأكسدة الكهروكيميائية للجلسرين إلى حمض الجلسريك

تاريخ الاستلام: 18 سبتمبر 2023
تاريخ القبول: 7 مارس 2024
تاريخ النشر على الإنترنت: 18 مارس 2024
(أ) تحقق من التحديثات

وي تشين © , ليانغ زانغ , ليتاو , يوانتشينغ , هوان بانغ , شوانغين وانغ © & يوقين زو ©

الملخص

منع تعطيل المحفزات القائمة على المعادن النبيلة بسبب الأكسدة الذاتية والامتصاص السام هو تحدٍ كبير في الأكسدة الكهروكيميائية العضوية. في هذه الدراسة، نستخدم استراتيجية التحليل الكهربائي بالجهد النبضي للأكسدة الكهروكيميائية الانتقائية للجلسرين إلى حمض الجلسريك على محفز قائم على البلاتين. تكشف تقنيات الطيف الكهرومغناطيسي بالأشعة تحت الحمراء وتحليل الطيف الضوئي للأشعة السينية شبه في الموقع، والمحاكاة باستخدام العناصر المحدودة أن الجهد النبضي يمكن أن يخصص أكسدة المحفز والبيئة الدقيقة السطحية. هذا يمنع التراكم المفرط للأنواع الوسيطة السامة ويحرر المواقع النشطة لإعادة امتصاص مادة OH و الجلسرين. تؤدي استراتيجية التحليل الكهربائي بالجهد النبضي إلى انتقائية أعلى لحمض الجلسريك (81.8%) مقارنة بالأكسدة الكهروكيميائية ذات الجهد الثابت مع . تقدم هذه الدراسة استراتيجية فعالة للتخفيف من تعطيل المحفزات الكهروكيميائية القائمة على المعادن النبيلة.

لتخفيف أزمة الطاقة، تعتبر الطاقة الحيوية المتجددة بديلاً مثاليًا وفعالًا للطاقة الأحفورية، واستخدام الطاقة الحيوية المتجددة يتماشى مع مفهوم التنمية المستدامة وصداقة البيئة. يؤدي إنتاج الديزل الحيوي إلى توليد كميات كبيرة من الجلسرين (GLY, ) كنواتج ثانوية . بسبب الكفاءة المنخفضة لاستخدام GLY، فإن الطلب عليه أقل بكثير من إنتاجه، مما يؤدي إلى انخفاض مستمر في سعره ( في 2019) . بالمقابل، فإن معظم مشتقات GLY، مثل الجلسيرالدهيد (GLAD)، ثنائي هيدروكسي أسيتون، حمض الجلسريك (GLA)، حمض اللبنيك (LA)، وحمض الجليكوليك (GA)، لها قيمة اقتصادية عالية . لذلك، فإن استخدام GLY الزائد ومنخفض التكلفة للحصول على منتجات ذات قيمة مضافة عالية أمر بالغ الأهمية. مقارنة بأساليب الأكسدة التقليدية، تقدم الأكسدة الكهروكيميائية العديد من المزايا البارزة، مثل عدم الحاجة إلى مؤكسدات كيميائية، ظروف تفاعل معتدلة، ونشاط وانتقائية قابلة للتحكم . ومع ذلك، فإن المحفزات الكهروكيميائية، وخاصة تلك القائمة على المعادن النبيلة، عرضة للتعطيل خلال عملية الأكسدة الكهروكيميائية ذات الجهد الثابت التقليدي (CE)، مما يؤدي إلى انخفاض الانتقائية وضعف الاستقرار.
لمعالجة هذه المشكلة، فإن تصميم المحفز وتحسين نظام التحليل الكهربائي أمران حاسمان. تقدم الأكسدة الكهروكيميائية النبضية (PE) حلاً أبسط وأكثر فعالية دون الحاجة إلى تحضير معقد للمحفزات الكهروكيميائية والمعالجة المسبقة. يمكن أن تمنع PE تعطيل المحفز الكهروكيميائي عن طريق تغيير بيئة التفاعل، والتحكم في إعادة هيكلة المحفز، وإعادة توزيع الأنواع السطحية، وضبط الواجهة . وبالتالي، جذبت PE الكثير من الاهتمام في العديد من المجالات التي تتعلق بالتحويل الكهروكيميائي للجزيئات الصغيرة، مثل ، وتحليل الماء الكهروكيميائي ، وما إلى ذلك. ومع ذلك، فإن تطبيق PE في التحويل الكهروكيميائي للجزيئات العضوية لا يزال محدودًا.
تظهر المعادن النبيلة (مثل البلاتين، والبلاديوم، والذهب) نشاطًا ممتازًا في تفاعل أكسدة الجلسرين (GEOR)، مثل جهد بدء منخفض، وانتقائية عالية لمنتجات C3، ومقاومة جيدة للتآكل . من بين هذه المعادن، يعتبر البلاتين هو المحفز الأكثر شعبية لأكسدة الجلسرين نظرًا لنشاطه التحفيزي القوي في البيئات الحمضية والقلوية . ومع ذلك، يمكن أن يؤدي تطبيق جهد الأكسدة والتحليل الكهربائي المطول إلى تكوين، مما يعيق
امتصاص مادة OH وركيزة الكحول . بالإضافة إلى ذلك، خلال عملية GEOR، يمكن أن تمتص الأنواع الوسيطة وتتراكم على موقع البلاتين دون تفكك وإزالة، مما يؤدي إلى تسمم المحفز الكهروكيميائي . هذا يعيق إعادة امتصاص و GLY على المحفز، مما يؤدي إلى كثافة تيار منخفضة وانتقائية منخفضة لمنتجات C3. لمنع تعطيل المحفزات القائمة على البلاتين، تم إجراء الكثير من العمل، مثل ضبط – نطاق البلاتين من خلال سبكها مع عنصر معدني ثانٍ ، وتحميل البلاتين على الركائز المؤكسدة لتسريع إزالة الأنواع الوسيطة الممتصة . على الرغم من أن هذه الطرق يمكن أن تخفف من عدم تنشيط محفزات البلاتين إلى حد ما، إلا أنها معقدة وتستهلك الموارد، مما يحد من تطبيقها على نطاق واسع.
في هذا العمل، تم تحقيق الأكسدة الكهروكيميائية الانتقائية للجلسرين إلى حمض الجلسريك من خلال PE، مع كريستالات نانوية من البلاتين محاطة بالكربون الجرافيتي ( ) كمحفز. منع الجهد القصير لأكسدة الجلسرين ( ) تراكم الأنواع الوسيطة السامة والأكسدة المفرطة لمحفز Pt@G. سهل تطبيق جهود منخفضة نسبيًا ( ) إزالة سريعة لحمض الجلسريك، مما سمح له بالانتشار في المحلول. يمنع وصول المحفز إلى حالة مفرطة الأكسدة وإطلاق المواقع النشطة على سطح المحفز إعادة امتصاص و GLY، مما يخفف من تسمم المحفز ويحسن انتقائية حمض الجلسريك ( ) مقارنة بتلك التي تم تحقيقها في CE التقليدي ( ). توفر هذه الدراسة استراتيجية للتخفيف من تعطيل المحفزات القائمة على المعادن النبيلة وتحقيق أكسدة كهروكيميائية عالية الانتقائية للجلسرين إلى منتجات C3.

النتائج

قيود CE على GEOR باستخدام محفز قائم على البلاتين

تشتهر المحفزات القائمة على البلاتين بنشاطها التحفيزي الممتاز في أكسدة الكحول. يظهر الرسم البياني للجهد الدوري لـ في محلول 1 M KOH (الشكل 1a، المنحنى الأسود) نمطًا مميزًا للبلاتين متعدد البلورات. وفقًا للأدبيات، كان نطاق الجهد لـ يتوافق مع امتصاص/إزالة ، بينما كانت القمم بين 0.2 و تتوافق مع امتصاص/إزالة الأنيونات أو البروتونات، وحدثت تكوين القابل للعكس بين 0.7 و . عند إضافة 20 مللي مول من GLY، اختفى الذروة حول في الدورة الثانية من الفولتامترية الدورية (CV) (الشكل التكميلي 1)، مما يشير إلى أن المنتجات الوسيطة الممتصة حدت من امتصاص/إزالة . حدثت ذروة أكسدة ملحوظة عند (الشكل 1a، المنحنى الأحمر) بسبب أكسدة الجلسرين. مع استمرار منحنى CV في التحرك إيجابيًا، حدث انخفاض كبير في كثافة التيار. توضح منحنيات LSV مع سرعات دوران وتركيزات GLY المختلفة أن الانخفاض في كثافة التيار لم يكن ناتجًا عن قيود نقل الكتلة (الشكل التكميلي 2). عندما تم تحريك منحنى CV في الاتجاه السلبي، ظهرت ذروة أكسدة عند ، متزامنة مع إزالة . يشير هذا إلى أن إزالة أطلقت مواقع نشطة لامتصاص الجلسرين، مما أدى إلى زيادة ملحوظة في تيار الأكسدة بدءًا من 0.7 . تشير هذه الظواهر إلى أن المنتجات الوسيطة لأكسدة الجلسرين و احتلت المواقع النشطة للمحفز دون إزالة، مما أدى إلى تعطيل المحفز.
يمكن أيضًا تأكيد هذه الظاهرة من خلال تحليل طيفي للمعاوقة الكهروكيميائية أثناء التشغيل. وفقًا للأدبيات، يحدث GEOR عند الواجهة ذات التردد المنخفض في مخططات بود (Bode) للمحفزات القائمة على البلاتين . كما هو موضح في الشكل التكميلي 3، انخفض زاوية الطور مع زيادة الجهد من 0.3 إلى . وبالمثل، أظهرت مخططات نايكويست (الشكل 1b) انخفاضًا في أقطار نصف الدائرة، مما يشير إلى انخفاض مقاومة نقل الشحنة ( ) (الشكل 1c) وزيادة سرعة تفاعل GEOR مع زيادة الجهد من 0.3 إلى . ومع ذلك، مع زيادة الجهد بشكل أكبر ( )، زادت زاوية الطور في المنطقة ذات التردد المنخفض بشكل ملحوظ، وظهرت نصف الدائرة في مخططات نايكويست داخل
نظام الإحداثيات السلبية. هذه ظاهرة تسمم المحفز النموذجية للمحفزات القائمة على البلاتين . كما زادت المحسوبة من مخططات نايكويست بشكل حاد عندما وصل الجهد إلى 0.8 ، بينما لم تظهر مقاومة المحلول ( ) تغييرات ملحوظة (الشكل 1c). يشير هذا إلى أن السبب الرئيسي لظاهرة التسمم كان ، الذي نشأ من الواجهة بين سطح المحفز والكهارل.
علاوة على ذلك، لم يكن ظاهرة التسمم ناتجة فقط عن تكوين أنواع سامة؛ بل يمكن أن تؤدي التغيرات في المحفز أيضًا إلى تقييد امتصاص GLY، مما يؤدي إلى انخفاض في التيار خلال التحليل الكهربائي المطول. وبالتالي، تم إجراء اختبار الجهد المفتوح الدائرة (OCP) لتقييم امتصاص GLY قبل وبعد فترات مختلفة من التحليل الكهربائي في (الشكل 1د). بعد حقن 50 مللي مولار من GLY، انخفضت تغييرات OCP من 0.33 إلى مع زيادة وقت التحليل الكهربائي، مما يدل على ضعف امتصاص الجليسرول، ربما بسبب أكسدة المحفز خلال عملية التحليل الكهربائي. أكدت نتائج جهد الدائرة المفتوحة أن ظاهرة التسمم، التي حدت من امتصاص الجليسرول على سطح المحفز، لم تكن فقط بسبب تراكم وسائط أكسدة الجليسرول. ولكن أيضًا ناتج عن التغيرات في المحفز خلال عملية التحليل الكهربائي. أدى معدل الامتصاص البطيء للوسائط إلى مزيد من الأكسدة العميقة والانقسام C-C. لذلك، يمكن أن يؤدي ظاهرة التسمم للمحفزات المعتمدة على البلاتين خلال GEOR إلى نتيجتين غير مرغوب فيهما بشكل كبير: انخفاض كثافة التيار وسوء الانتقائية لمنتجات C3 (الشكل 1e).

الأداء الكهروتحفيزي لـ GEOR مع PE

يعتبر PE استراتيجية بسيطة وفعالة لإعادة بناء سطح المحفز ديناميكيًا وإعادة توزيع الأنواع الممتصة على السطح خلال عملية التحفيز الكهربائي. . لذلك، نقترح استخدام التحليل الكهربائي مع جهد الموجة المربعة لتقليل التغطية لـ وتراكم الوسائط، مما يؤدي إلى تحرير المواقع النشطة، بينما يمنع أيضًا أكسدة محفزات البلاتين (الشكل التكميلي 4). كما هو موضح في الشكل التكميلي 5a، فإن كثافات التيار لـ CE (الخط المنقط) و PE ( ، تم تسجيل (خط صلب) عند إمكانيات مختلفة. انخفضت كثافات التيار في CE بشكل كبير مع زيادة وقت التحليل الكهربائي، محتفظة فقط بـ لتيار الحالي بعد 4000 ثانية من التحليل الكهربائي. في هذه الأثناء، ظلت كثافة التيار المحتفظ بها من PE عند ، وهو ما يزيد بشكل كبير عن ذلك في CE (الشكل 2 أ والشكل التوضيحي 5). بالإضافة إلى ذلك، على الرغم من أن PE يستغرق نصف الوقت الفعلي للتحليل الكهربائي فقط، إلا أن كثافة التيار الإجمالية لا تزال أعلى من CE. وهذا يعني أن PE يمكن أن يخفف بشكل فعال من ظاهرة تسمم المحفز ويقدم إمكانية التحليل الكهربائي المستقر على مدى فترة طويلة.
تم الكشف عن توزيعات منتجات أكسدة GLY بناءً على CE و PE وحسابها من خلال الكروماتوغرافيا السائلة عالية الأداء. انخفضت انتقائية GLA من 41.7% إلى 27.2% مع زيادة جهد CE من 0.6 إلى (الشكل 2ب). عندما يكون PE ( تم تطبيقه لأكسدة GLY، وزادت انتقائية GLA بشكل ملحوظ من إلى (الشكل 2ج). علاوة على ذلك، زادت منتجات C1 و C2 (حمض الأكساليك، GA، وحمض الفورميك) مع زيادة الجهد الأكسدي، بغض النظر عما إذا كان الوضع الكهربائي هو CE أو PE. نظرًا لأن كمية الكولوم تبقى كما هي ( ) في ظروف إلكتروليتية مختلفة، تميل نسبة تحويل GLY المقابلة إلى الانخفاض مع زيادة منتجات C1 وC2، وذلك بسبب استخدام المزيد من الكهرباء لكسر روابط C-C. لم يتم ملاحظة GLAD، وهو وسيط مهم، في منتجات أكسدة الجلسرين، لأن GLAD يمكن أن يخضع لإزالة الماء المحفزة بالقاعدة بشكل تلقائي وإعادة ترتيب كانيزارو في بيئة قلوية قوية، مما يؤدي في النهاية إلى التحول إلى . وهذا يشير إلى أن المنتج الثانوي الرئيسي لـ GEOR كان LA المستمد من GLAD. كان محتوى LA خلال CE أعلى من ذلك خلال PE، مما يدل على أن GLAD تراكم على سطح المحفز خلال التحليل الكهربائي المطول. مع استهلاك السطح
الشكل 1 | قيود CE لـ GEOR على Pt @G. أ. منحنيات CV لـ Pt @G في 1 م KOH مع وبدون 20 مللي مول من GLY. مخططات نايكويست و(ج) مقاومة نقل الشحنة المقابلة ) ومقاومة الحل ( ) عند إمكانيات مختلفة. د منحنيات جهد الدائرة المفتوحة لـ بعد CE بأوقات مختلفة في KOH، مع
يتم حقن GLY بعد ذلك. الأرقام في الشكل تشير إلى قيمة فرق الجهد (مقابل RHE) للجهد المفتوح. الشكل التخطيطي لـ GEOR القائم على CE فوق Pt@G. GLY هو الجلسرين، GLAD هو الجليسرالدهيد، GLA هو حمض الجلسريك.
واحتلال المواقع النشطة بواسطة الأنواع السامة أعاق إعادة امتصاص لم يكن من الممكن أكسدة GLAD بسرعة أكبر إلى GLA. تظهر النتائج أن هذه الحالة يمكن تخفيفها بكفاءة من خلال استراتيجية الجهد النبضي.
لزيادة انتقائية GLA، تم إجراء تجارب GEOR في محاليل كهربائية ذات قيم pH مختلفة (الشكل التوضيحي 6). زادت انتقائية GLA في البداية ثم انخفضت مع زيادة pH، حيث كانت المحلول الكهربائي الأمثل هو 1 M KOH. كانت الانتقائية المنخفضة لـ GLA في 3 M KOH بسبب إعادة ترتيب كانيزارو السريعة على سطح المحفز. بالنظر إلى كل من انتقائية GLA وكثافة التيار، فإن الإمكانيات لـ PE مع و تم اختيارها لمزيد من تحسين الحالة.
ارتفعت نسبة الرسوم ومعدل التحويل مع زيادة النسبة من زادت (الشكل التوضيحي الإضافي 7 أ، ب). وعلى العكس، انخفضت الانتقائية لـ C3 و GLA مع زيادة نسبة زادت، مع أعلى القيم لـ و تحقق في و (الشكل التوضيحي الإضافي 7c والشكل 2d). حدثت أقل انتقائية لـ LA عندما تم ضبطه على 0.05 ثانية (الشكل التوضيحي 7d). وهذا يشير إلى أن الانتقائية العالية لـ C3 و GLA من المحتمل أن تكون ناتجة عن تركيزات أقل من GLAD و GLA على سطح المحفز، مما يمكن أن يمنع تكوين LA من خلال التفاعلات التلقائية ويعيق الأكسدة العميقة لـ GLA لإنتاج منتجات منخفضة الكربون. ومع ذلك، فإن وجود مستوى منخفض جداً من كانت النسبة أيضًا ضارة بمعدل التفاعل، مما أدى إلى أدنى كثافة تيار أكسدة GLY (الشكل التوضيحي 8-10). لذلك، كانت حالة PE المثلى في هذه الدراسة هي , ، و (الشكل التكميلي 11، PE3). لتعزيز انتقائية GLA، فإن تقليل تركيز GLY المحلي على سطح المحفز الكهربائي هو طريقة فعالة نظرًا لانخفاض إنتاج LA (الشكل التكميلي 12). في هذه الحالة (PE3) مع 20 مللي مول من GLY، انتقائية C3 و تم تحقيق انتقائية GLA، جنبًا إلى جنب مع معدل تحويل GLY (الشكل 2e والشكل التكميلي 13). هذه الأداء يتجاوز معظم النتائج المبلغ عنها في الأدبيات (الشكل 2f والجدول التكميلي 3) .

تأثير الوضع الكهربائي على الخصائص الفيزيائية والكيميائية Pt@G خلال GEOR

لتحقيق تأثير أوضاع CE و PE على المحفز الكهربائي، تم فحص الخصائص الفيزيائية والكيميائية لـ Pt@G قبل وبعد التحليل الكهربائي. أولاً، تم إجراء أنماط حيود الأشعة السينية (XRD) وتحليل رامان لجمع معلومات هيكلية حول Pt@G. أظهر Pt@G الهيكل البلوري المتعدد النموذجي لـ Pt، مع كون السطح البلوري الرئيسي المعرض هو Pt (111) (الشكل 3a). كما حدث ذروة تتوافق مع طبقة الجرافيت عند أكدت طيف رامان وجود طبقة الجرافيت (الشكل 3ب). تم استخدام مجهر الإلكترون الناقل عالي الدقة (TEM) لتحليل مفصل للهيكل والشكل (الشكل 3ج، د). أظهر محفز Pt@G جزيئات نانوية متجانسة بمتوسط قطر يبلغ 2.4 نانومتر. بالإضافة إلى ذلك، تم ملاحظة قشور الجرافيت التي تحيط بجزيئات البلاتين (الشكل 3د، هـ)، مما يؤكد نجاح تخليق محفزات Pt@G. تحتوي قشور الجرافيت التي تحيط بجزيئات البلاتين على عيوب وليست كاملة بحيث يمكن لجزيئات البلاتين أن تعمل كعوامل حفازة. كشفت أنماط حيود الإلكترون في المنطقة المختارة (SAED) (الشكل المرفق في الشكل 3د) أن Pt@G يمتلك هيكلًا متعدد البلورات مع أسطح بلورية من (111)، (200)، (220)، و(311)، وهو ما يتوافق مع نتائج تحليل XRD.
علاوة على ذلك، تم توصيف المحفزات Pt@G التي خضعت لعمليات PE3 و CE بشكل إضافي عبر تقنية TEM وطيف الأشعة السينية للألكترونات (XPS). أظهرت صور TEM والأنماط المقابلة SAED أن الشكل والطور البلوري لـ Pt@G لم يتعرضا لتغييرات كبيرة بعد عمليات PE3 و CE (الشكل التكميلي 14). ومع ذلك، وفقًا لنتائج XPS، لم يكن محتوى عنصر الأكسجين في PE3 المطبق على أكسدة GLY (20.97%) أعلى بشكل ملحوظ من محتوى Pt@G الأولي (19.56%) (الشكل التكميلي 15 والجدول التكميلي 4). كشفت التحليلات الدقيقة لـ XPS أن محتوى Pt (II) زاد من إلى بعد CE، بينما كان محتوى Pt (II) في المحفز المستخدم لـ PE3 (17.3%) ليس أعلى بشكل ملحوظ من محتوى المحفز الأولي (الشكل 4f-h والجدول التكميلي 5).
الشكل 2 | الأداء الكهروتحفيزي لـ GEOR تحت وضع التحليل الكهربائي لـ CE و PE. أ معدل احتفاظ التيار لبروتوكول CE و PE مع إمكانيات مختلفة بعد 4000 ثانية من التحليل الكهربائي. توزيع المنتج ومعدل التحويل لـ GEOR تحت أوضاع التحليل الكهربائي لـ (ب) CE و (ج) PE. لمدة 0.5 ثانية و لمدة 0.5 ثانية). يتم الحفاظ على الشحنة الكهربية للأوضاع الكهربية المختلفة بشكل أساسي عند حوالي 20 كولوم. تحسين الحالة لـ و GLY في 1 م KOH) مع انتقائية GLA ووقت التحليل الكهربائي هو لـ لـ و 0.05 ثانية ،
على التوالي. اختيارية ومعدل تحويل GLY مع 20 مللي مول من GLY تحت وضع التحليل الكهربائي لـ PE3. النسب المئوية باللون الأسود تشير إلى الاختيارية المقابلة لـ GLA. مقارنة بين انتقائية GLA ومعدل تحويل GLY (البيانات مستمدة من الشكل 2e) في هذا العمل مع تلك الواردة في التقارير السابقة، والأرقام بين قوسين في الشكل تشير إلى أرقام المراجع المقابلة. ب، ج، د، هـ TA حمض التارتاريك، GLA حمض الجليسرين، LA حمض اللبنيك، OA حمض الأكساليك، GA حمض الجليكوليك، FA حمض الفورميك.
علاوة على ذلك، أظهرت تحليل OCP أن PE3 أدى إلى انخفاض أقل في الإمكانية مقارنةً بـ CE (الشكل التوضيحي التكميلي 16). وهذا يدل على أن تطبيق PE هو وسيلة فعالة لمنع الأكسدة المفرطة للمحفز، والتي من شأنها أن تعزز امتصاص GLY.

أثر الوضع الكهربائي على البيئة الدقيقة السطحية المحيطة بـ Pt@G أثناء GEOR

الكشف عن التغيرات في الأنواع السطحية على المحفزات أثناء التحفيز الكهربائي أمر ضروري لتوضيح عملية التفاعل. للحصول على معلومات حول التغيرات في البيئة الدقيقة السطحية والأنواع الممتصة خلال عملية GEOR، تم إجراء تحليل طيفي بالأشعة تحت الحمراء باستخدام تحويل فورييه (FTIR) في الموقع. تم الحصول على طيف FTIR في منطقة توافق مع مواقع الامتزاز على المحفز لـ رابطة الجليسرول . 1114-1126 المنطقة تتوافق مع رابطة ألكوكسي جسرية تتكون من مجموعة كحول أولية واحدة من الجليسرول وذرتين من سطح المعدن. . الفرقة في توافق مع الرابطة التي تتشكل بين ذرة سطح معدنية واحدة ومجموعة الكحول الأولية من الجليسرول . كما هو موضح في الشكل التكميلي 17، أظهرت هاتان المنطقتان قممًا سلبية مقارنةً بطيف OCP، وانخفضت المناطق مع زيادة الجهد من 0.3 إلى ، مما يشير إلى إزالة الهيدروجين من مجموعة الكحول الأولية للجليسرول الماصة على سطح المحفز. التمدد المتماثل ظهرت أنواع الكربوكسيلات ذات الضعف عند (المُعَلَّم باللون الأرجواني)، متسق مع التقارير السابقة . الفرقة في توافق مع في تكوين ثنائي الأسنان الجسري (المُميز أيضًا باللون الأرجواني) الذي يشمل موقعين من البلاتين . الفرقة تركزت في توافق مع وضع الشد للأنواع الماصة من الألدهيدات زادت شدة هذه الروابط المتعلقة بوسائط أكسدة الجليسرول مع زيادة الجهد (الشكل التكميلي 17) و
وقت التحليل الكهربائي (الشكل 4 أ والشكل التكميلي 18 ب). وصلت شدة هذه المناطق تحت CE إلى القيمة القصوى بشكل أسرع في (الشكل التكميلي 18ب) من (الشكل 4أ). تظهر هذه النتائج أن الجهد الأعلى أدى إلى التكوين السريع وتراكم وسائط أكسدة الجليسرول. علاوة على ذلك، أدى زيادة وقت التحليل الكهربائي إلى التراكم المستمر للوسائط، وهو ما كان مصدر ظاهرة السمية للحفاز.
روابط الهيدروجين السطحية المرتبطة بـ تمت دراسة تركيز وسائط أكسدة الجليسرول بشكل أعمق. كانت هناك خطوط حول 3236 و تم تحديدها كمجموعات OH سطحية متورطة في الروابط الهيدروجينية على سطح المحفز المعدني ومجموعات OH الحرة، على التوالي. . الفرق في زاد الإقليم مع زيادة الإمكانية (الشكل التوضيحي 17) ومع زيادة وقت التحليل الكهربائي خلال CE في (الشكل التوضيحي التكميلي 19) و (الشكل التوضيحي التكميلي 18a). بالإضافة إلى ذلك، الشريط عند المخصصة للروابط الهيدروجينية بين الجزيئات كما أظهرت نفس الاتجاهات في التغيرات (الشكل 4أ، الأشكال التكميلية 17 و18ب). كان هناك سببان محتملان لزيادة الروابط الهيدروجينية على سطح المحفز. أولاً، مع زيادة الجهد، زادت أيضًا تركيزات OH على السطح لأن الشحنة السلبية كانت تفضل تكوين الألكوكسيد وامتصاصه على سطح المحفز. ثانياً، بيئة ذات pH أعلى تعززت تشكيل وسائط الألدهيد إلى هيكل ديوكسي جمنالي. أظهر هيكل الديول الجمنالي على Pt (111) طاقة امتصاص أقوى من GLY و GLA، مما يشير إلى أن إزالة الديول الجمنالي من سطح المحفز إلى المحلول كانت أكثر تحديًا (الشكل 4d). علاوة على ذلك، يمكن أن يسهل تشكيل هذا الهيكل التحويل السريع لـ GLAD إلى GLA، مما يحسن من انتقائية GLA. لذلك، فإن تعزيز الشدة الملحوظ في المنطقة و فرقة
الشكل 3 | التوصيف الفيزيائي والكيميائي لـ Pt@G. أ نمط XRD؛ (ب) طيف رامان؛ (ج-هـ) صور TEM لـ Pt@G. ج الإطار يظهر حجم الجسيمات. تم تنقيح طيف التحليل الطيفي للأشعة السينية عالية الدقة لـ Pt. لـ ( ) Pt@G الأولي، (g) Pt@G المستخدم في PE3، و(h) Pt@G المستخدم في CE عند 0.7 فولت. توزيع جزيئات Pt@G. الدرجات الداخلية تظهر أنماط SAED لـ Pt@G.
مع زيادة الجهد ووقت التحليل الكهربائي يوفر دليلاً على تراكم و intermediates أكسدة الجليسرول خلال عملية CE.
لتقييم تأثير التحليل الكهربائي النبضي على الأنواع السطحية خلال GEOR بشكل أكبر، تم مقارنة طيف FTIR في الموقع لأقطاب Pt@G مع أوضاع التحليل الكهربائي CE و PE. كانت PE3 و CE عند 0.7 تمت دراسة الأوقات المتفاوتة (الشكل 4ب والشكل التكميلي 20). كانت شدة الروابط عند 1400 و1588 و و الـ زاد الإقليم مع مرور الوقت. ومع ذلك، عندما تم تطبيق بروتوكول PE3، انخفضت شدة هذه الأشرطة، خاصة بالنسبة للروابط عند 1400 و ، والتي تت correspond إلى الأنواع الكربوكسيلية والألدهيد، على التوالي. علاوة على ذلك، خلال بروتوكولات PE المختلفة (الشكل 4c)، انخفضت هذه الروابط كما زادت من 0.05 إلى 2 ثانية (من PE5 إلى PE1). علاوة على ذلك، فإن شدة الروابط عند 1115 و مرتبط بالكحول الأولي
مجموعات الجليسرول، زادت كـ زاد من 0.05 إلى 2 ثانية. وهذا يشير إلى أن تطبيق طريقة PE منع تراكم الأنواع الوسيطة السامة على سطح القطب، وعزز من إزالة وتشتت الأنواع الكربوكسيلية بسرعة، وحرر المواقع النشطة لإعادة امتصاص GLY. كانت مجموعة هذه التأثيرات هي السبب الرئيسي للاختيار العالي لـ GLA الذي لوحظ في GEOR بناءً على عملية PE.

محاكاة العناصر المحدودة والفهم الميكانيكي للبولي إيثيلين لجهاز GEOR

لتوضيح سلوكيات الامتزاز/التحرر للأنواع السطحية خلال عملية GEOR بشكل أعمق، تم إجراء محاكاة حاسوبية باستخدام برنامج COMSOL Multiphysics (يمكن العثور على المعلمات التفصيلية في قسم الطرق). خلال عملية التحفيز الكهربائي، يعتمد معدل نقل الإلكترون بشكل أساسي على الجهد المطبق.
الشكل 4 | طيف FTIR في الموقع لمحفزات Pt@G في 1 م KOH مع 50 مللي مول من GLY تحت ظروف مختلفة. أ CE عند مع أوقات مختلفة، (ب) PE3 بعد CE عند 0.7 مع أوقات مختلفة و (ج) بروتوكولات PE مختلفة (PE1-PE5: لـ لـ و 0.05 ثانية، على التوالي). طاقة الامتزاز لـ GLY، (تحول من GLAD)، و GLA على Pt (111) في
إلكتروليت قلوي. الصور الثلاثة المدخلة تعرض الهندسة المثلى لامتصاص الأنواع الثلاثة المقابلة على سطح Pt (111). اللون لكل عنصر هو أصفر برتقالي لـ H، أزرق فاتح لـ O، بنفسجي لـ C، ورمادي لـ Pt، على التوالي.
الجهد وتركيز المتفاعلات والمنتجات داخل الطبقة المزدوجة الكهربائية (EDL) . التغيرات في الجهد تؤثر أيضًا بشكل كبير على توزيع المتفاعلات والمنتجات بسبب تأثيرات الحقول الكهربائية داخل EDL، خاصة بالنسبة للأيونات المشحونة كهربائيًا. لذلك، تم تقييم التأثير على توزيع ,
و داخل EDL عند جهد مختلف، دون النظر في التفاعلات الكهروكيميائية/الكيميائية والامتصاص. كان تركيز على سطح المحفز (على بعد 0 نانومتر) أعلى من ذلك في المحلول، وأصبح هذا الفرق أكثر وضوحًا مع زيادة الجهد من 0.1
إلى (الشكل 5أ). أظهر توزيع على سطح القطب نفس الاتجاه، بينما أظهرت الأيونات الموجبة ( و ) نمطًا معكوسًا (الشكل التكميلي 21). وهذا يشير إلى أن الأيونات السالبة ( و ) كانت تميل إلى التراكم على سطح القطب بسبب تأثير الحقول الكهربائية. على العكس من ذلك، عندما تم تطبيق جهد أقل نسبيًا، تم تعزيز إزالة الأيونات السالبة وانتشارها.
تم إجراء تحليل العناصر المحدودة لمحاكاة التغيرات المحلية في التركيز للأنواع المختلفة مع عمليات PE و CE، وتم النظر في الامتصاص/الإزالة للمتفاعلات والمنتجات والتفاعلات الكهروكيميائية والكيميائية. يتم عرض ملف التركيز المحلي المتغير مع الزمن لـ GLAD في الشكل 5ب. عند جهد ثابت قدره , تراكم GLAD على السطح التحفيزي بسبب امتصاصه القوي على موقع Pt. أظهر تركيز GLA المحلي على السطح نفس الاتجاه (الشكل التكميلي 22). بالمقابل، أدى تطبيق PE إلى تقليل تراكم GLAD و GLA، مع انخفاض التركيزات المحلية مع زيادة (من PE5 إلى PE1). تتماشى هذه النتائج مع نتائج التحليلات السابقة (الشكل 4ب، ج). يتم تقديم ملفات التركيز ثنائية الأبعاد المرئية لـ GLAD مع PE3 في الشكل 5ج، مما يوفر تمثيلًا بصريًا لفهم تأثير الجهد النبضي على تراكم وتحويل الأنواع الكهربائية.
بالإضافة إلى التركيز المحلي، أثر تغطية السطح للأنواع المختلفة بشكل مباشر على نقل الإلكترون في تفاعل المحفز الكهربائي. عند جهد ثابت قدره ، انخفضت تغطية (الشكل التكميلي 23أ) و GLY (الشكل التكميلي 23ب) بشكل كبير بسبب استهلاكها وتراكم الأنواع السامة التي تحتل عددًا كبيرًا من المواقع النشطة (الشكل التكميلي 23ج، د). لعبت دورًا أساسيًا في GEOR. أدى انخفاض تغطية إلى عدم قدرة عدد كبير من الأنواع الوسيطة على التحول بسرعة، مما أدى إلى تعطيل المحفز بسرعة وكثافة تيار منخفضة. على العكس من ذلك، أدى تطبيق PE إلى انخفاض تغطية GLAD و GLA وزيادة تغطية و GLY. وهذا يوضح أن الأكسدة السريعة لـ GLAD، بسبب تغطية OH الأعلى وانتشار GLA السريع مع جهد أقل ( )، عززت تجديد المواقع النشطة لإعادة امتصاص و GLY. علاوة على ذلك، منع وقت النبض القصير للجهد العالي بشكل فعال مزيدًا من أكسدة GLA (الشكل 5د). توفر هذه الاستراتيجيات وسيلة فعالة لمنع تعطيل المحفز وتحقيق انتقائية عالية لـ C3 خلال GEOR.

نقاش

طورنا استراتيجية PE لمعالجة مشكلة تعطيل المحفزات الكهربائية القائمة على Pt من خلال تغيير الميكروبيئة السطحية للمحفز. كشفت التوصيفات في الموقع والمحاكاة الحاسوبية أن وضع الإلكتروليت PE منع التراكم المفرط للأنواع الوسيطة السامة، وعزز إزالة وانتشار المنتج المستهدف (GLA) إلى المحلول، وسرع من إعادة امتصاص و GLY. بالإضافة إلى ذلك، خفف تطبيق بروتوكول PE من أكسدة Pt خلال عملية CE، مما زاد من امتصاص GLY. وبالتالي، تم تحقيق انتقائية ملحوظة لـ C3 (87.3-84.6%) وانتقائية GLA (81.8-74.4%). توفر هذه العمل استراتيجية بسيطة وفعالة لمنع تعطيل المحفزات الكهربائية القائمة على المعادن الثمينة والحصول على منتجات C3 عالية القيمة من الجلسرين مع انتقائية عالية.

طرق

تحضير Pt@G

تم تحضير بلورات نانوية من Pt الجرافيتية ( ) في نظام ترسيب بخار كيميائي (CVD) . في إجراء نموذجي، تم نقع السيليكا المدخنة (1.0 غرام) في 100 مل من الميثانول مع وتمت الموجات فوق الصوتية لمدة ساعتين. ثم تم تجفيف الخليط عند ، وتم وضع المسحوق في غرفة CVD للميثان لنمو الجرافيت مع تدفق ميثان قدره وتدفق هيدروجين قدره لمدة 5 دقائق عند . بعد ذلك، تم حفر العينة
بـ HF و لإذابة السيليكا، ثم تم غسلها وطردها للحصول على محفز Pt@G.

التوصيفات

تم إجراء تحليل حيود الأشعة السينية (XRD) على جهاز قياس حيود الأشعة السينية Siemens D500 مع مصدر Cu Ka ( ). تم الحصول على طيف رامان باستخدام نظام رامان InVia من Renishaw مع تحفيز ليزر 633 نانومتر (Renishaw، المملكة المتحدة). تم التقاط صور TEM باستخدام JEM-2010 (JEOL، اليابان). تم الحصول على أطياف التحليل الطيفي للأشعة السينية (XPS) باستخدام مقياس الطيف الضوئي للأشعة السينية ESCALAB 250Xi.

القياسات الكهروكيميائية

تم إجراء الاختبار الكهروكيميائي في نظام ثلاثي الأقطاب مع شبكة التيتانيوم المحضرة المحملة بالمحفزات ( ) كقطب عمل، و كقطب مرجعي وقضيب جرافيت كقطب مضاد. تم استخدام CHI 660 E كجهاز عمل كهروكيميائي. تم إجراء LSV بمعدل مسح قدره في الخلية الفردية. تم إجراء اختبار التحليل الكهربائي في الخلية المقسمة، مفصولة بغشاء نافيون 117. تم إجراء التحليل الكهربائي بالجهد النبضي (PE) باستخدام تقنية خطوات الجهد المتعددة. الجهود النسبية المنخفضة والعالية تُسمى و على التوالي. يتم تسمية وقت الاستجابة بـ و . تم إجراء قياسات الطيف الكهروكيميائي في الموقع (EIS) بواسطة Autolab PGSTAT302N (Eco Chemie، أوتريخت، هولندا) على مدى نطاق التردد من إلى مع سعة 10 مللي فولت.

تحليل المنتج

تم تحديد منتجات التحليل الكهربائي باستخدام كروماتوغرافيا السائل عالية الأداء (HPLC، LC 2030 C، شيمادزو، اليابان) المجهزة بكل من كاشف UV وكاشف RID. كانت المرحلة المتنقلة 5 مللي مول من مع معدل تدفق قدره وكانت درجة حرارة العمود . تم استخدام كاشف UV عند 210 نانومتر لتحديد كمية حمض الأكساليك (OA)، حمض التارتونيك (TA)، الجليسرالدهيد (GLAD)، ثنائي هيدروكسي أسيتون (DHA)، حمض الجلسرين (GLA)، حمض اللبنيك (LA) وحمض الجليكوليك (GA)، حمض الفورميك (FA). تم استخدام كاشف RID لتحديد تركيز GLY. تم حساب معدل تحويل GLY وانتقائية المنتجات كما يلي:
حيث هو عدد ذرات الكربون في المنتج.

دراسة FTIR في الموقع

تم إجراء FTIR في الموقع تحت جهود مختلفة بواسطة مقياس الطيف بالأشعة تحت الحمراء (BRUKER، TENSOR II، الولايات المتحدة الأمريكية) المجهز بكاشف كادميوم الزئبق (MCT) المبرد بالنيتروجين السائل. تم جمع الأطياف بدقة قدرها في نطاق . تم ترسيب فيلم الذهب كيميائيًا على السيليكون أحادي البلورة. أولاً، تم غمر بلورة السيليكون في محلول مختلط ( ) لمدة ساعتين لغسل الملوثات السطحية. ثم تم تلميع سطح بلورة السيليكون باستخدام مسحوق بسمك 0.05 مم لمدة 30 دقيقة ثم تم غسلها بالإيثانول والماء المقطر. تم غمر بلورة السيليكون النظيفة مرة أخرى في المحلول المختلط لمدة 15 دقيقة عند ثم تم غسلها بالماء المقطر. بعد ذلك، تم غمر وجه البلورة من السيليكون في محلول طلاء الذهب ( ) لمدة 5 دقائق عند تلاها غسل بالماء المقطر وتجفيف بالهواء. تم إسقاط محفز Pt@G على فيلم الذهب لاختبار FTIR في الموقع. تم إجراء الاختبارات في خلية كهروكيميائية ذات قسمين. فيلم الذهب
الشكل 5 | محاكاة عملية GEOR مع بروتوكول PE. أ تأثير الجهد الثابت المطبق على انتشار على سطح القطب. تركيز السطح لـ GLAD في أوقات التحليل الكهربائي المختلفة لبروتوكول CE و PE (PE1-PE5: لـ لـ 2.0 و 1.0 و 0.5 و 0.2 و 0.05 ثانية، على التوالي). ج لقطات لـ GLA في أوقات التحليل الكهربائي المختلفة لـ
بروتوكول PE3. أ، ب، ج البيانات التي تم الحصول عليها من خلال حزمة المحاكاة الفيزيائية المتعددة COMSOL. يتم تمثيل المحفز بـ بواسطة سبع نقاط بيضاء دائرية. د مخطط لمسارات GEOR المعتمد على PE. GLY الجلسرين، GLAD الجليسرالدهيد، GLA حمض الجلسريك، TA حمض التارتاريك، GA حمض الجليكوليك.
محملة بالمحفز، قضيب الجرافيت و تم استخدامها كأقطاب عمل، وقطب مضاد، وقطب مرجعي على التوالي.

حساب طاقة الامتزاز

تم إجراء حسابات طاقة الامتزاز باستخدام حزمة المحاكاة الأولية فيينا (VASP 5.4) . تم استخدام إمكانيات الموجة المعززة بالمشاريع (PAW) والدالة الوظيفية Perdew-Burke-Ernzerhof (PBE) لتفاعلات الإلكترون-الأيون وطاقة التبادل-الارتباط، على التوالي . تم تعيين قطع الطاقة الحركية لأساس الموجة المسطحة إلى 500 eV وتم استخدام القطع لوصف الإلكترونات التكافؤية. تم حساب تفاعلات فان دير فالس (vdW) بين الجزيئات العضوية وأسطح Pt بواسطة طريقة DFT-D3 . Pt هو ( ) سوبرسيل من السطح (111). تم تعيين معيار تقارب القوة إلى وكان معيار تقارب الطاقة هو . تم أخذ منطقة بريلوان بعينة مع شبكة نقاط k مركزة على غاما من لسوبرسيلات Pt. تم اعتماد طبقة فراغ من في النماذج الثلاثة.

محاكاة العناصر المحدودة للطبقة المزدوجة المنتشرة

لتقييم تأثير التغيرات في الجهد على توزيع الأيونات المشحونة كهربائيًا خلال عملية التحليل الكهربائي. تم إنشاء النموذج الذي يجمع بين نموذج الطبقة المزدوجة ونقل الأنواع المخففة وواجهات الفيزياء الكهروستاتيكية لحساب نقل الكتلة بواسطة برنامج COMSOL Multiphysics 6.1. يحتوي النموذج على قطب مشحون مجاور للمحلول الكتلي.
يتم تعريف هندسة النموذج بواسطة فترة واحدة بين 0 و L، مما يشير إلى هيكل أحادي البعد. تشمل هذه الفترة مرحلة الإلكتروليت التي تمتد من القطب عبر الطبقة المزدوجة المنتشرة وتمتد إلى المحلول الكتلي المتعادل كهربائيًا. يتم استخدام شرط الحدود المحدد عند لتنظيم المكون المضغوط من الطبقة المزدوجة. يتم عرض المعلمات الرئيسية لمحاكاة العناصر المحدودة للطبقة المزدوجة المنتشرة في الجدول التكميلي 1.

محاكاة العناصر المحدودة لـ GEOR

تمت نمذجة GEOR مع عملية التحليل الكهربائي بالجهد النبضي في برنامج COMSOL Multiphysics 6.1 مع وحدة نقل الأنواع المخففة المدمجة مع توزيع التيار الثانوي. تم بناء نماذج لهندسة الأقطاب بما في ذلك الأقطاب المسطحة والأقطاب مع الجسيمات النانوية. المعادلة المكانية هي معادلة الانتشار، المعروفة بقانون فيك الثاني، الذي يصف النقل الكيميائي للأنواع النشطة كهربائيًا. المعروفة بقانون فيك الثاني، الذي يصف النقل الكيميائي للأنواع النشطة كهربائيًا.
عند حدود الكتلة، تم افتراض تركيز موحد يساوي التركيز الكتلي للمواد المتفاعلة، حيث يكون للمنتجات تركيز صفر. عند حدود القطب، يتم تقليل الأنواع المتفاعلة لتشكيل المنتجات. في هذه الدراسة، تم تقسيم عملية GEOR على سطح القطب إلى عمليتين تشمل تفاعلات الامتزاز/الامتزاز (بدون نقل الشحنة) وتفاعلات الأكسدة والاختزال الكهروكيميائية (مع نقل الشحنة). في الوقت نفسه، هناك تفاعلات توازن في المحلول.
تفاعلات الامتزاز/الامتزاز (بدون نقل الشحنة):
تفاعلات الأكسدة والاختزال الكهروكيميائية (مع نقل الشحنة):
تفاعلات التوازن:
حيث * تمثل المواقع النشطة الحرة. لامتزاز أنواع مختلفة معبر عنها بـ .
يتم وصف التيار المحلي للتفاعل الكهروكيميائي في التعبيرات التالية:
حيث و هما التعبيران عن تركيز المختزل والأكاسيد؛ و هما معامل تبادل الإلكترون، هو ثابت فاراداي، و هو ثابت الغاز المثالي. هو درجة الحرارة. هو عدد نقل الإلكترون. هو الجهد الزائد للتفاعل. هو ثابت معدل الحركية. هو الكثافة في الموقع للأنواع الممتصة. يتم عرض المعلمات الرئيسية لمحاكاة العناصر المحدودة لـ GEOR في الجدول التكميلي 2.

توفر البيانات

جميع البيانات متاحة في المخطوطة، والمواد التكميلية، ومن المؤلفين عند الطلب. يتم توفير بيانات المصدر كملف بيانات مصدر. يتم توفير بيانات المصدر مع هذه الورقة.

References

  1. Sharninghausen, L. S., Campos, J., Manas, M. G. & Crabtree, R. H. Efficient selective and atom economic catalytic conversion of glycerol to lactic acid. Nat. Commun. 5, 5084 (2014).
  2. Alisson Dias da Silva, R., Ana Luíza Freitas, F., Antônio Ésio, B., Rita Maria de Brito, A. & Luiz Antônio Magalhães, P. Market prospecting and assessment of the economic potential of glycerol from biodiesel. In Biotechnological Applications of Biomass (eds Thalita Peixoto B., Thiago Olitta B., Luiz Carlos B.). IntechOpen (2020).
  3. Sheng, H. et al. Linear paired electrochemical valorization of glycerol enabled by the electro-Fenton process using a stable cathode. Nat. Catal. 5, 716-725 (2022).
  4. Katryniok, B. et al. Selective catalytic oxidation of glycerol: perspectives for high-value chemicals. Green Chem. 13, 1960-1979 (2011).
  5. Zhou, C., Beltramini, J. N., Fan, Y. & Lu, G. Q. Chemoselective catalytic conversion of glycerol as a biorenewable source to valuable commodity chemicals. Chem. Soc. Rev. 37, 527-549 (2008).
  6. González-Cobos, J., Baranton, S. & Coutanceau, C. A systematic in situ infrared study of the electrooxidation of C3 alcohols on carbon-supported Pt and Pt-Bi catalysts. J. Phys. Chem. C 120, 7155-7164 (2016).
  7. Casebolt, R., Levine, K., Suntivich, J. & Hanrath, T. Pulse check: potential opportunities in pulsed electrochemical reduction. Joule 5, 1987-2026 (2021).
  8. Zhang, X. et al. Asymmetric low-frequency pulsed strategy enables ultralong reduction stability and controllable product selectivity. J. Am. Chem. Soc. 145, 2195-2206 (2023).
  9. Timoshenko, J. et al. Steering the structure and selectivity of electroreduction catalysts by potential pulses. Nat. Catal. 5, 259-267 (2022).
  10. Kim, C. et al. Tailored catalyst microenvironments for electroreduction to multicarbon products on copper using bilayer ionomer coatings. Nat. Energy 6, 1026-1034 (2021).
  11. Li, P. et al. Pulsed nitrate-to-ammonia electroreduction facilitated by tandem catalysis of nitrite intermediates. J. Am. Chem. Soc. 145, 6471-6479 (2023).
  12. Guo, M. et al. Pulsed electrocatalysis enabling high overall nitrogen fixation performance for atomically dispersed Fe on . Angew. Chem. 135, e202217635 (2023).
  13. Bu, Y. et al. Electrical pulse-driven periodic self-repair of Cu-Ni tandem catalyst for efficient ammonia synthesis from nitrate. Angew. Chem. Int. Ed. 62, e202217337 (2023).
  14. Ding, Y. et al. Pulsed electrocatalysis enables an efficient 2-electron oxygen reduction reaction for production. J. Mater. Chem. A 9, 15948-15954 (2021).
  15. Vincent, I. et al. Pulsed current water splitting electrochemical cycle for hydrogen production. Int. J. Hydrogen Energy 43, 10240-10248 (2018).
  16. Zhao, M. et al. Pd-Ru alloy nanocages with a face-centered cubic structure and their enhanced activity toward the oxidation of ethylene glycol and glycerol. Small Methods 4, 1900843 (2020).
  17. Fan, L. et al. Recent progress in electrocatalytic glycerol oxidation. Energy Technol. 9, 2000804 (2021).
  18. Zhou, Y., Shen, Y. & Xi, J. Seed-mediated synthesis of PtxAuy@Ag electrocatalysts for the selective oxidation of glycerol. Appl. Catal. B: Environ. 245, 604-612 (2019).
  19. Li, Z. et al. Alcohols electrooxidation coupled with production at high current densities promoted by a cooperative catalyst. Nat. Commun. 13, 147 (2022).
  20. Zhang, Y. et al. Potential-dynamic surface chemistry controls the electrocatalytic processes of ethanol oxidation on gold surfaces. ACS Energy Lett. 4, 215-221 (2019).
  21. Gao, F. et al. Shape-control of one-dimensional PtNi nanostructures as efficient electrocatalysts for alcohol electrooxidation. Nanoscale 11, 4831-4836 (2019).
  22. Zhang, Z. et al. Engineering phase and surface composition of nanocatalysts: a strategy for enhancing CO tolerance. Nano Energy 34, 224-232 (2017).
  23. Ren, Z. et al. Pt/ZrO2 catalyst with metal-support synergistic effect towards glycerol selective oxidation. Chem. Eng. J. 468, 143623 (2023).
  24. Li, J. et al. Tuning the product selectivity toward the high yield of glyceric acid in Pt-CeO2/CNT electrocatalyzed oxidation of glycerol. ChemCatChem 14, e202200509 (2022).
  25. Wu, G., Liu, Y., He, Y., Feng, J. & Li, D. Reaction pathway investigation using in situ Fourier transform infrared technique over Pt/CuO and for selective glycerol oxidation. Appl. Catal. B: Environ. 291, 120061 (2021).
  26. Dong, J. et al. Direct in situ raman spectroscopic evidence of oxygen reduction reaction intermediates at high-index surfaces. J. Am. Chem. Soc. 142, 715-719 (2020).
  27. Marković, N. M., Marinković, N. S. & Adžić, R. R. Electrosorption of hydrogen and sulphuric acid anions on single-crystal platinum stepped surfaces: Part I. The [110] zone. J. Electroanal. Chem. Interfacial Electrochem. 241, 309-328 (1988).
  28. Wang, Y. et al. Efficient electrocatalytic oxidation of glycerol via promoted generation over single-atom-bismuth-doped spinel . ACS Catal 12, 12432-12443 (2022).
  29. Sandrini, R. M. L. M. et al. Mechanistic aspects of glycerol electrooxidation on electrode in alkaline media. Electrochem. Commun. 86, 149-152 (2018).
  30. Hong, W., Shang, C., Wang, J. & Wang, E. Bimetallic PdPt nanowire networks with enhanced electrocatalytic activity for ethylene glycol and glycerol oxidation. Energy Environ. Sci. 8, 2910-2915 (2015).
  31. Zhou, P. et al. Heterogeneous-interface-enhanced adsorption of organic and hydroxyl for biomass electrooxidation. Adv. Mater. 34, 2204089 (2022).
  32. Yan, Y. et al. Electrocatalytic upcycling of biomass and plastic wastes to biodegradable polymer monomers and hydrogen fuel at high current densities. J. Am. Chem. Soc. 145, 6144-6155 (2023).
  33. Liu, X. & Yang, C. Electrocatalytic selective oxidation of glycerol to glyceric acid over efficient Pt/CNTs-CeO2 catalysts. Mater. Lett. 324, 132658 (2022).
  34. Zhou, Y., Shen, Y., Xi, J. & Luo, X. Selective electro-oxidation of glycerol to dihydroxyacetone by PtAg skeletons. ACS Appl. Mater. Interfaces 11, 28953-28959 (2019).
  35. Zhou, Y., Shen, Y. & Piao, J. Sustainable conversion of glycerol into value-added chemicals by selective electro-oxidation on Pt-based catalysts. ChemElectroChem 5, 1636-1643 (2018).
  36. Kim, Y. et al. The role of ruthenium on carbon-supported PtRu catalysts for electrocatalytic glycerol oxidation under acidic conditions. ChemCatChem 9, 1683-1690 (2017).
  37. Dai, C. et al. Electrochemical production of lactic acid from glycerol oxidation catalyzed by AuPt nanoparticles. J. Catal. 356, 14-21 (2017).
  38. Inoue, H. et al. Mechanism of glycerol oxidation reaction on silvermodified palladium electrode in alkaline medium. Int. J. Hydrogen Energy 43, 18664-18671 (2018).
  39. Copeland, J. R., Santillan, I. A., Schimming, S. M., Ewbank, J. L. & Sievers, C. Surface interactions of glycerol with acidic and basic metal oxides. J. Phys. Chem. C 117, 21413-21425 (2013).
  40. An, Z. et al. Pt1 enhanced C-H activation synergistic with catalysis for glycerol cascade oxidation to glyceric acid. Nat. Commun. 13, 5467 (2022).
  41. Mello, G. A. B., Busó-Rogero, C., Herrero, E. & Feliu, J. M. Glycerol electrooxidation on Pd modified Au surfaces in alkaline media: effect of the deposition method. J. Chem. Phys. 150, 041703 (2018).
  42. Xu, L. et al. Salting-out aldehyde from the electrooxidation of alcohols with 100% selectivity. Angew. Chem. Int. Ed. 61, e202210123 (2022).
  43. Zhang, L., Li, C. & Huang, J. A beginners’ guide to modelling of electric double layer under equilibrium, nonequilibrium and AC conditions. J. Electrochem. 28, 2108471 (2022).
  44. Zhang, L. et al. In vivo activation of pH-responsive oxidase-like graphitic nanozymes for selective killing of Helicobacter pylori. Nat. Commun. 12, 2002 (2021).
  45. Zhang, L. et al. A magnetocatalytic propelled cobalt-platinum@graphene navigator for enhanced tumor penetration and theranostics. CCS Chem. 4, 2382-2395 (2022).
  46. Obst, S. & Bradaczek, H. Molecular dynamics study of the structure and dynamics of the hydration shell of alkaline and alkaline-earth metal cations. J. Phys. Chem. 100, 15677-15687 (1996).
  47. Kresse, G. & Furthmüller, J. Efficient iterative schemes for ab initio total-energy calculations using a plane-wave basis set. Phys. Rev. B 54, 11169-11186 (1996).
  48. Grimme, S., Antony, J., Ehrlich, S. & Krieg, H. A consistent and accurate ab initio parametrization of density functional dispersion correction (DFT-D) for the 94 elements H-Pu. J. Chem. Phys. 132, 154104 (2010).

شكر وتقدير

يقر Y.Z. بالدعم من البرنامج الوطني الرئيسي للبحث والتطوير في الصين (2022YFA1504200)، ومؤسسة العلوم الطبيعية الوطنية في الصين (22122901)، ومؤسسة العلوم الطبيعية الإقليمية في هونان (2021JC0008، 2021JJ20024، 2021RC3054). يقر H.P. بالدعم من مؤسسة العلوم الطبيعية الوطنية في الصين (52371240).

مساهمات المؤلفين

قام Y.Z. و H.P. و S.W. بتصميم وإشراف المشروع. أجرى W.C. التجارب وحلل البيانات. قام L.Z. بإجراء قياسات STEM والتحليل. قام L.X. بإجراء حسابات DFT وأعد قسم DFT للمخطوطة. قام Y.H. بإجراء بعض التجارب. قام W.C. بإجراء محاكاة العناصر المحدودة باستخدام COMSOL وكتب الورقة.

المصالح المتنافسة

يعلن المؤلفون عدم وجود مصالح متنافسة.

معلومات إضافية

المعلومات التكميلية النسخة الإلكترونية تحتوي على
المواد التكميلية المتاحة على
https://doi.org/10.1038/s41467-024-46752-4.
يجب توجيه المراسلات وطلبات المواد إلى هوان بانغ أو يوقين زو.
معلومات مراجعة الأقران تشكر Nature Communications زهايو جين، هاوبو لي، والمراجعين الآخرين المجهولين على مساهمتهم في مراجعة الأقران لهذا العمل. يتوفر ملف مراجعة الأقران.
معلومات إعادة الطبع والتصاريح متاحة على
http://www.nature.com/reprints
ملاحظة الناشر تظل Springer Nature محايدة فيما يتعلق بالمطالبات القضائية في الخرائط المنشورة والانتماءات المؤسسية.
الوصول المفتوح هذه المقالة مرخصة بموجب رخصة المشاع الإبداعي للاستخدام والمشاركة والتكيف والتوزيع وإعادة الإنتاج في أي وسيلة أو تنسيق، طالما أنك تعطي الائتمان المناسب للمؤلفين الأصليين والمصدر، وتوفر رابطًا لرخصة المشاع الإبداعي، وتوضح ما إذا كانت هناك تغييرات قد تم إجراؤها. الصور أو المواد الأخرى من طرف ثالث في هذه المقالة مشمولة في رخصة المشاع الإبداعي للمقالة، ما لم يُشار إلى خلاف ذلك في سطر ائتمان للمادة. إذا لم تكن المادة مشمولة في رخصة المشاع الإبداعي للمقالة واستخدامك المقصود غير مسموح به بموجب اللوائح القانونية أو يتجاوز الاستخدام المسموح به، ستحتاج إلى الحصول على إذن مباشرة من صاحب حقوق الطبع والنشر. لعرض نسخة من هذه الرخصة، قم بزيارة http://creativecommons.org/licenses/by/4.0/.
© المؤلفون 2024

  1. المختبر الوطني الرئيسي للكيمياء/الاستشعار الحيوي والكيميوميتري، كلية الكيمياء والهندسة الكيميائية، جامعة هونان، تشانغشا 410000، جمهورية الصين الشعبية. مدرسة الكيمياء والهندسة الكيميائية، جامعة يانغتشو، يانغتشو 225009، جمهورية الصين الشعبية. المختبر الرئيسي للجلود في مقاطعة تشجيانغ، معهد المواد الجديدة والتقنيات الصناعية، جامعة ونتشو، ونتشو، تشجيانغ 325035، جمهورية الصين الشعبية. ساهم هؤلاء المؤلفون بالتساوي: وي تشن، ليانغ تشانغ، ليتاو شيو. البريد الإلكتروني: panghuan@yzu.edu.cn; yuqin_zou@hnu.edu.cn

Journal: Nature Communications, Volume: 15, Issue: 1
DOI: https://doi.org/10.1038/s41467-024-46752-4
PMID: https://pubmed.ncbi.nlm.nih.gov/38499522
Publication Date: 2024-03-18

Pulse potential mediated selectivity for the electrocatalytic oxidation of glycerol to glyceric acid

Received: 18 September 2023
Accepted: 7 March 2024
Published online: 18 March 2024
(A) Check for updates

Wei Chen © , Liang Zhang , Leitao , Yuanqing , Huan Pang , Shuangyin Wang © & Yuqin Zou ©

Abstract

Preventing the deactivation of noble metal-based catalysts due to selfoxidation and poisonous adsorption is a significant challenge in organic electro-oxidation. In this study, we employ a pulsed potential electrolysis strategy for the selective electrocatalytic oxidation of glycerol to glyceric acid over a Pt-based catalyst. In situ Fourier-transform infrared spectroscopy, quasi-in situ X-ray photoelectron spectroscopy, and finite element simulations reveal that the pulsed potential could tailor the catalyst’s oxidation and surface micro-environment. This prevents the overaccumulation of poisoning intermediate species and frees up active sites for the re-adsorption of OH adsorbate and glycerol. The pulsed potential electrolysis strategy results in a higher glyceric acid selectivity (81.8%) than constant-potential electrocatalysis with . This work offers an efficient strategy to mitigate the deactivation of noble metal-based electrocatalysts.

To alleviate the energy crisis, renewable bioenergy is an ideal and effective alternative to fossil energy, and the use of renewable bioenergy is consistent with the concept of sustainable development and environmental friendliness. Biodiesel production leads to the generation of large amounts of glycerol (GLY, ) as byproducts . Because of the low utilization efficiency of GLY, its demand is much lower than its production, leading to a continuous decline in its price ( in 2019) . In contrast, most GLY derivatives, such as glyceraldehyde (GLAD), dihydroxyacetone, glyceric acid (GLA), lactic acid (LA), and glycolic acid (GA), have high economic value . Therefore, using the excess and low-cost GLY to obtain high-value-added products is crucial. Compared with traditional oxidation methods, electrocatalytic oxidation offers numerous outstanding advantages, such as the nonrequirement of chemical oxidants, mild reaction conditions, and controllable activity and selectivity . However, electrocatalysts, particularly those based on noble metals, are prone to deactivation during the conventional constant-potential electrocatalysis (CE) process, causing low selectivity and poor stability.
To address this issue, the catalyst design and optimization of the electrolysis system are crucial. Pulsed electrocatalysis (PE) offers a simpler and more effective solution without complex electrocatalyst preparation and pre-treatment. PE can prevent electrocatalyst deactivation by altering the reaction environment, controlling catalyst restructuring, redistributing surface species, and adjusting interfacial . Thus, PE has attracted much attention in numerous fields involving the electrocatalytic conversion of small molecules, such as , and water electrolysis , and so on. However, the application of PE in the electrocatalytic conversion of organic molecules remains limited.
Noble metals (e.g., Pt, Pd, and Au) exhibit excellent glycerol electro-oxidation reaction (GEOR) activity, such as a low onset potential, high selectivity for C3 products, and good corrosion resistance . Among these, platinum is the most popular catalyst for glycerol oxidation owing to its strong catalytic activity in both acidic and alkaline environments . However, applying an oxidation potential and prolonged electrolysis can result in formation, hindering the
adsorption of OH adsorbate and alcohol substrate . Additionally, during the GEOR process, intermediate species can adsorb and accumulate on the Pt site without dissociation and desorption, leading to electrocatalyst poisoning . This hampers the readsorption of and GLY on the catalyst, resulting in low current density and selectivity for C 3 products. To prevent the deactivation of Pt-based catalysts, extensive work has been conducted, such as the tuning of the -band of Pt through alloying with a second metal element , and Pt loading onto oxide substrates to accelerate the removal of adsorbed intermediate species . Although these methods can mitigate the inactivation of Pt catalysts to some extent, they are complex and resource-intensive, limiting their large-scale application.
In this work, the selective electrocatalytic oxidation of GLY to GLA was achieved through PE, with Pt nanocrystals capsuled in graphitic carbon ( ) as the catalyst. The short duration of GLY oxidation potential ( ) prevented the accumulation of poisoning intermediate species and the over-oxidation of the Pt@G catalyst. The application of relatively low potentials ( ) facilitated the rapid desorption of GLA, allowing it to diffuse into the solution. Preventing the catalyst from reaching an over-oxidized state and releasing active sites on the catalyst surface enables the re-adsorption of and GLY, which alleviates the poisoning of the catalyst and improves the selectivity of GLA ( ) compared with that achieved in conventional CE ( ). This work provides a strategy to mitigate the deactivation of noble metal catalysts and achieve highly selective electrocatalytic oxidation of GLY to C3 products.

Results

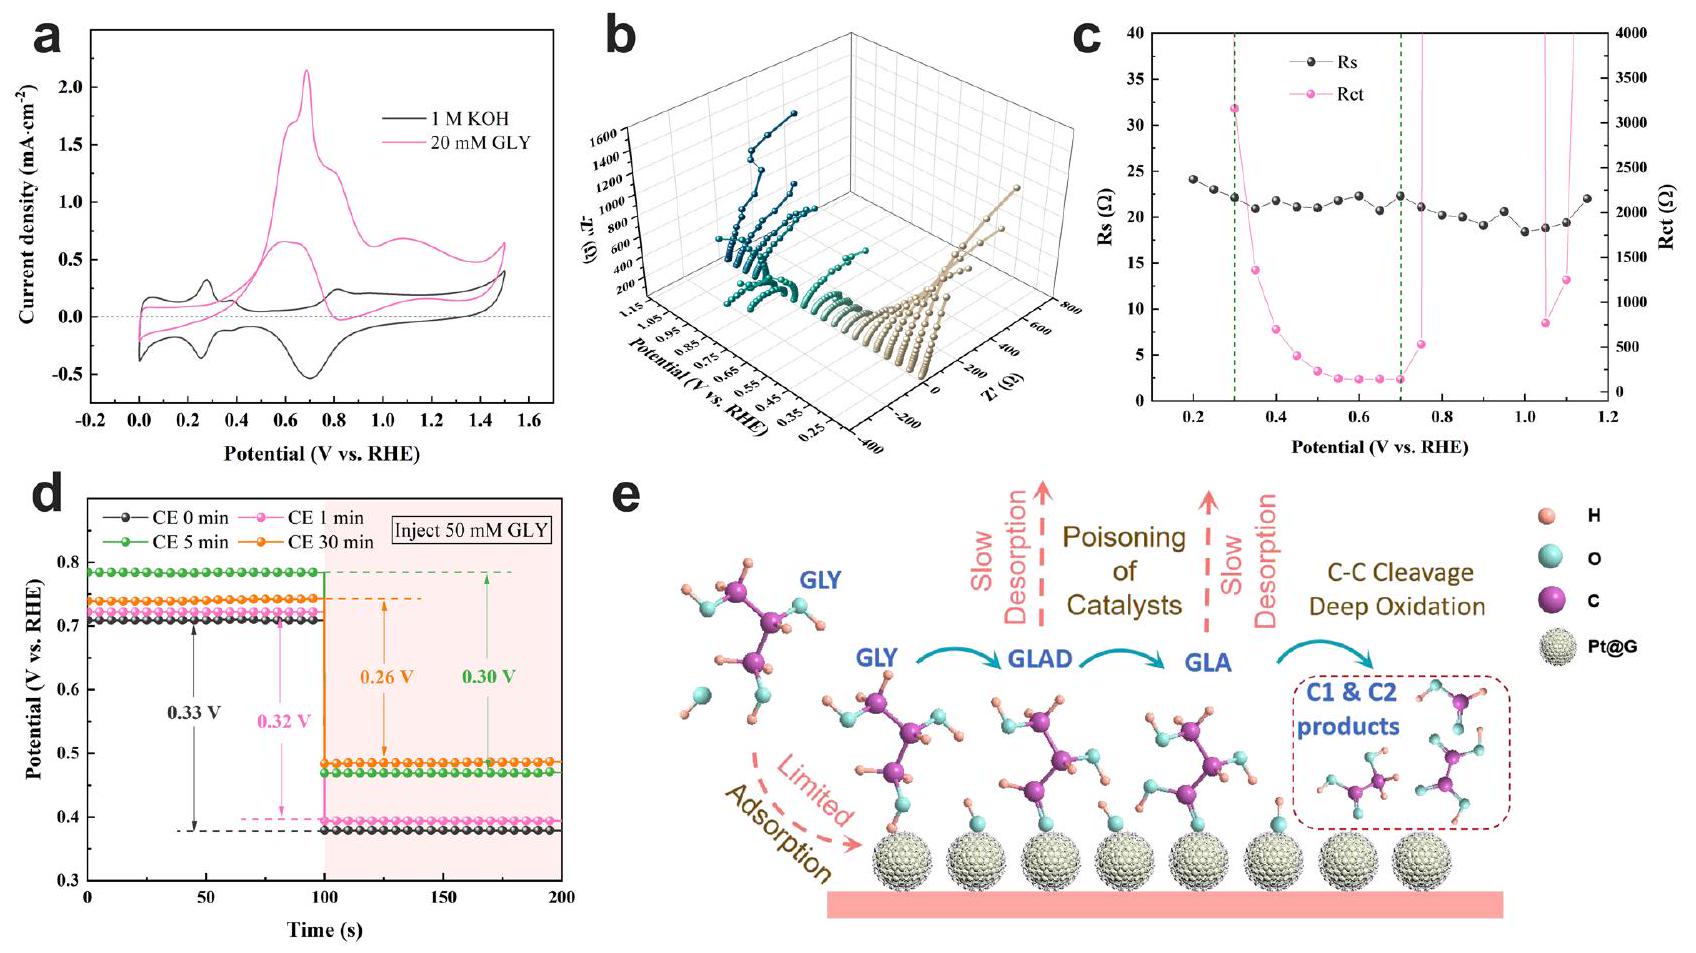
Limitations of CE for GEOR over a Pt-based catalyst

Platinum-based catalysts are well known for their excellent catalytic activity in alcohol oxidation. The cyclic voltammogram of in a 1 M KOH solution (Fig. 1a, black curve) exhibits the characteristic pattern of polycrystalline Pt. According to the literature, the potential range of corresponded to the adsorption/desorption of , while the peaks between 0.2 and corresponded to anion or proton adsorption/desorption, and reversible formation occurred between 0.7 and . Upon the addition of 20 mM GLY, the peak around disappeared in the second cyclic voltammetry (CV) cycle (Supplementary Fig. 1), indicating that the absorbed intermediate products limited the adsorption/desorption of . A noticeable oxidation peak occurred at (Fig. 1a, red curve) owing to glycerol oxidation. As the CV curve continued to sweep positively, a significant drop in current density occurred. The LSV curves with different rotation speeds and GLY concentrations illustrate that the decrease in current density did not originate from mass transfer limitations (Supplementary Fig. 2). When the CV curve was swept negatively, an oxidation peak appeared at , coinciding with the desorption of . This indicates that desorption released active sites for glycerol adsorption, resulting in a noticeable increase in oxidation current starting from 0.7 . These phenomena suggest that the intermediate products of glycerol oxidation and occupied the active sites of the catalyst without desorption, leading to catalyst deactivation.
This phenomenon can also be confirmed through operando electrochemical impedance spectroscopy analysis. According to the literature, GEOR occurs at the low-frequency interface in Bode plots for Pt-based catalysts . As shown in Supplementary Fig. 3, the phase angle decreased as the potential increased from 0.3 to . Similarly, the Nyquist plots (Fig. 1b) exhibited decreasing semicircle diameters, indicating lower charge-transfer resistance ( ) (Fig. 1c) and faster GEOR reaction kinetics as the potential increased from 0.3 to . However, with a further increase in potential ( ), the phase angle in the low-frequency region remarkably increased, and the semicircle in the Nyquist plots appeared inside the
negative coordinate system. This is a typical catalyst poisoning phenomenon of Pt-based catalysts . The calculated from the Nyquist plots also increased sharply when the potential reached 0.8 , while the solution resistance ( ) showed no noticeable changes (Fig. 1c). This indicates that the main reason for the poisoning phenomenon was , which originated from the interface between the catalyst surface and the electrolyte.
Furthermore, the poisoning phenomenon was not solely due to the formation of poisonous species; changes in the catalyst can also restrict GLY adsorption, leading to a decrease in current during prolonged electrolysis. Thus, an open-circuit potential (OCP) test was conducted to evaluate GLY adsorption before and after various electrolysis durations at (Fig. 1d). After the injection of 50 mM GLY, the OCP changes decreased from 0.33 to as the electrolysis time increased, indicating weaker GLY adsorption, possibly caused by the oxidation of the catalyst during the electrolysis process. The OCP results confirmed that the poisoning phenomenon, which limited the adsorption of GLY on the catalyst surface, was not only due to the accumulation of glycerol oxidation intermediates , but also caused by changes in the catalyst during the electrolysis process. The slow desorption rate of intermediates led to further deep oxidation and C-C cleavage. Therefore, the poisoning phenomenon of Pt-based catalysts during GEOR can result in two significant undesirable consequences: reduced current density and poor selectivity for C3 products (Fig. 1e).

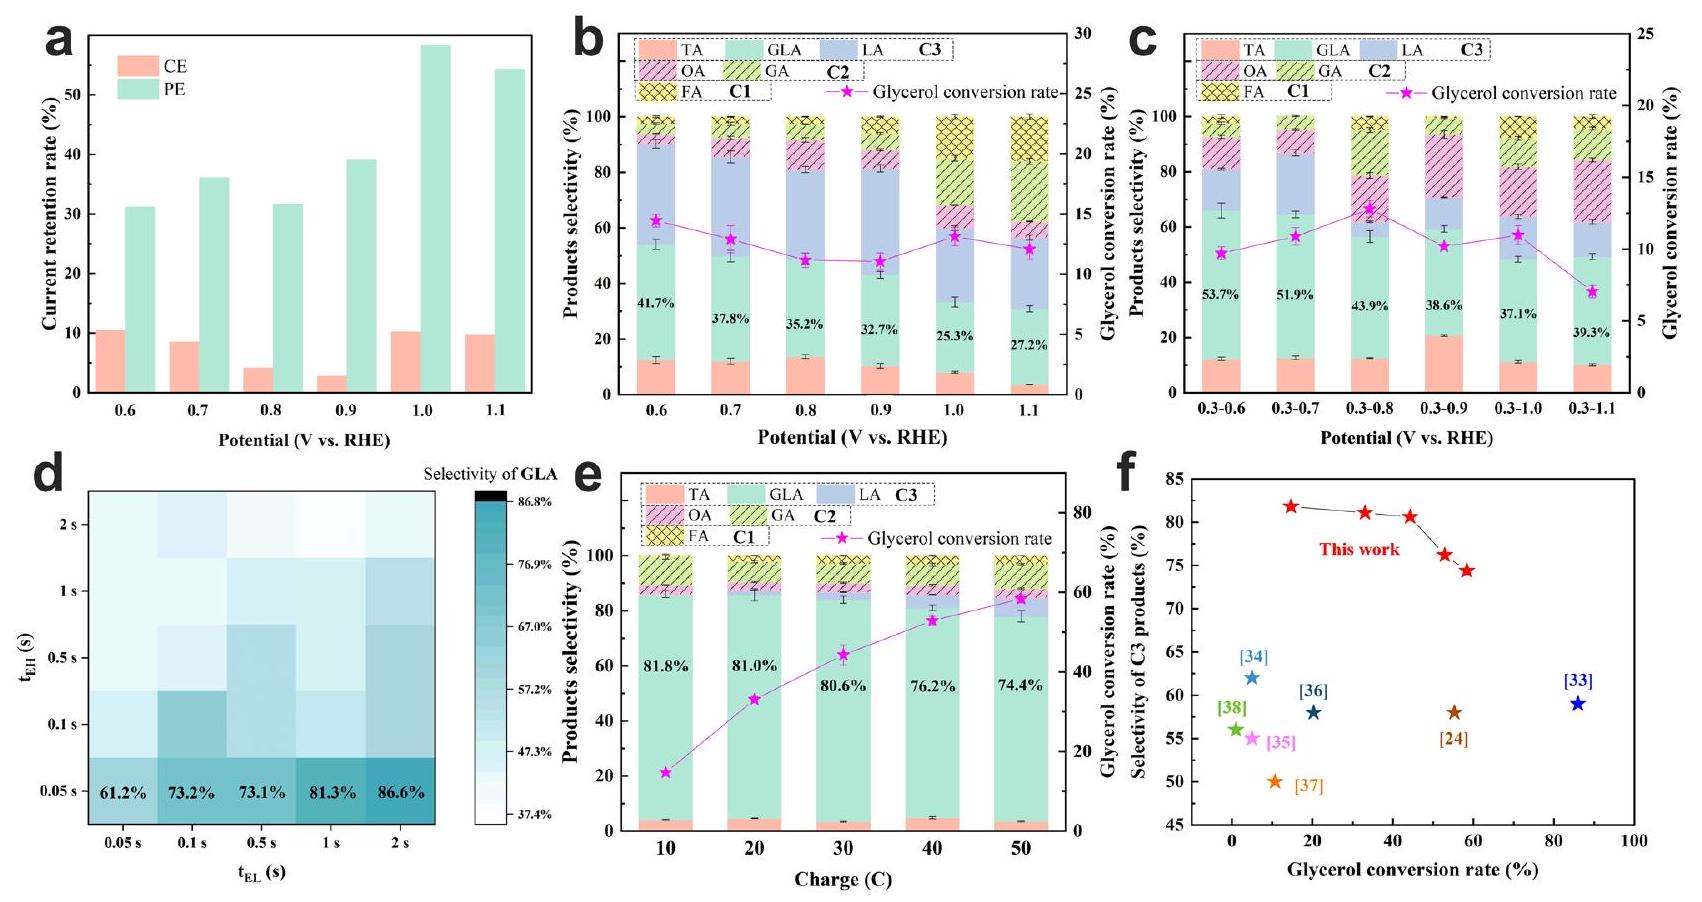
Electrocatalytic performance of GEOR with PE

PE is considered a simple and efficient strategy for dynamically reconstructing the catalyst surface and redistributing surfaceadsorbed species during the electrocatalysis process . Therefore, we propose using PE with a square-wave potential to reduce the coverage of and the accumulation of intermediates, thereby releasing active sites, while also preventing the oxidation of platinum catalysts (Supplementary Fig. 4). As shown in Supplementary Fig. 5a, the current densities of CE (dashed line) and PE ( , ; solid line) at different potentials were recorded. The current densities of CE decreased dramatically with an increase in electrolysis time, retaining only of the current after 4000 s of electrolysis. Meanwhile, the current density retention of PE remained at , which is significantly higher than that of CE (Fig. 2a and Supplementary Fig. 5). Additionally, even though PE only takes half the actual electrolysis time, its overall current density is still higher than CE. This implies that PE can effectively mitigate the catalyst poisoning phenomenon and offers the possibility of stable electrolysis over an extended period.
The product distributions of GLY oxidation based on CE and PE were further detected and calculated through high-performance liquid chromatography. The selectivity of GLA decreased from 41.7% to 27.2% as the potential of CE increased from 0.6 to (Fig. 2b). When PE ( ) was applied for GLY oxidation, the selectivity of GLA significantly increased from to (Fig. 2c). Moreover, the C1 and C2 products (oxalic acid, GA, and formic acid) increased with increasing oxidation potential, regardless of whether the electrolytic mode was CE or PE. Since the Coulomb amount stays the same ( ) for different electrolytic conditions, the corresponding GLY conversion rate tends to decrease with the increase of C1&C2 products, which is due to the fact that more electricity is used for C-C bond breaking. GLAD, an important intermediate, was not observed in the glycerol oxidation products, because GLAD can undergo spontaneous base-catalyzed dehydration and Cannizzaro rearrangement in a strongly alkaline environment, ultimately transforming into . This suggests that the main byproduct of GEOR was LA derived from GLAD. The LA content during CE was higher than that during PE, indicating that GLAD accumulated on the catalyst surface during prolonged electrocatalysis. As the consumption of surface
Fig. 1 | Limitations of CE for the GEOR on Pt @G. a CV curves of Pt @G in 1 M KOH with and without 20 mM GLY. Nyquist plots and (c) corresponding charge-transfer resistance ( ) and solution resistance ( ) at various potentials. d Open-circuit potential curves of after CE with different times in KOH , with
GLY being injected subsequently. The numbers in the figure indicate the value of the potential (vs. RHE) difference of the OCP. e Schematic of CE-based GEOR over Pt@G. GLY glycerol, GLAD glyceraldehyde, GLA glyceric acid.
and the occupation of active sites by poisonous species hindered the re-adsorption of , GLAD could not be rapidly further oxidized to GLA. The results demonstrate that this situation can be efficiently alleviated by the pulse potential strategy.
To further enhance the selectivity of GLA, GEOR experiments were conducted in electrolytes with different pH values (Supplementary Fig. 6). The selectivity of GLA initially increased and then decreased as the pH increased, with the optimal electrolyte being 1 M KOH . The lower selectivity of GLA in 3 M KOH was due to the rapid Cannizzaro rearrangement on the catalyst surface. Considering both GLA selectivity and current density, the potentials for PE with and were chosen for further condition optimization.
The charge and conversion rate increased as the proportion of increased (Supplementary Fig. 7a, b). Conversely, the selectivity for C3 and GLA decreased as the proportion of increased, with the highest values of and achieved at and (Supplementary Fig. 7c and Fig. 2d). The lowest LA selectivity occurred when was set to 0.05 s (Supplementary Fig. 7d). This suggests that the high selectivity for C3 and GLA likely originated from lower concentrations of GLAD and GLA on the catalyst surface, which can prevent LA formation through spontaneous reactions and inhibit the deep oxidation of GLA to produce low-carbon products. However, having a too-low ratio was also detrimental to the reaction rate, resulting in the lowest GLY oxidation current density (Supplementary Fig. 8-10). Therefore, the optimal PE condition in this study was , , and (Supplementary Fig. 11, PE3). To further enhance the selectivity of GLA, reducing the local GLY concentration on the electrocatalyst surface is an effective method owing to the lower LA production (Supplementary Fig. 12). Under this condition (PE3) with 20 mM GLY, C3 selectivity and GLA selectivity were achieved, along with a GLY conversion rate (Fig. 2e and Supplementary Fig. 13). This performance surpasses that of most reported results in the literature (Fig. 2f and Supplementary Table 3) .

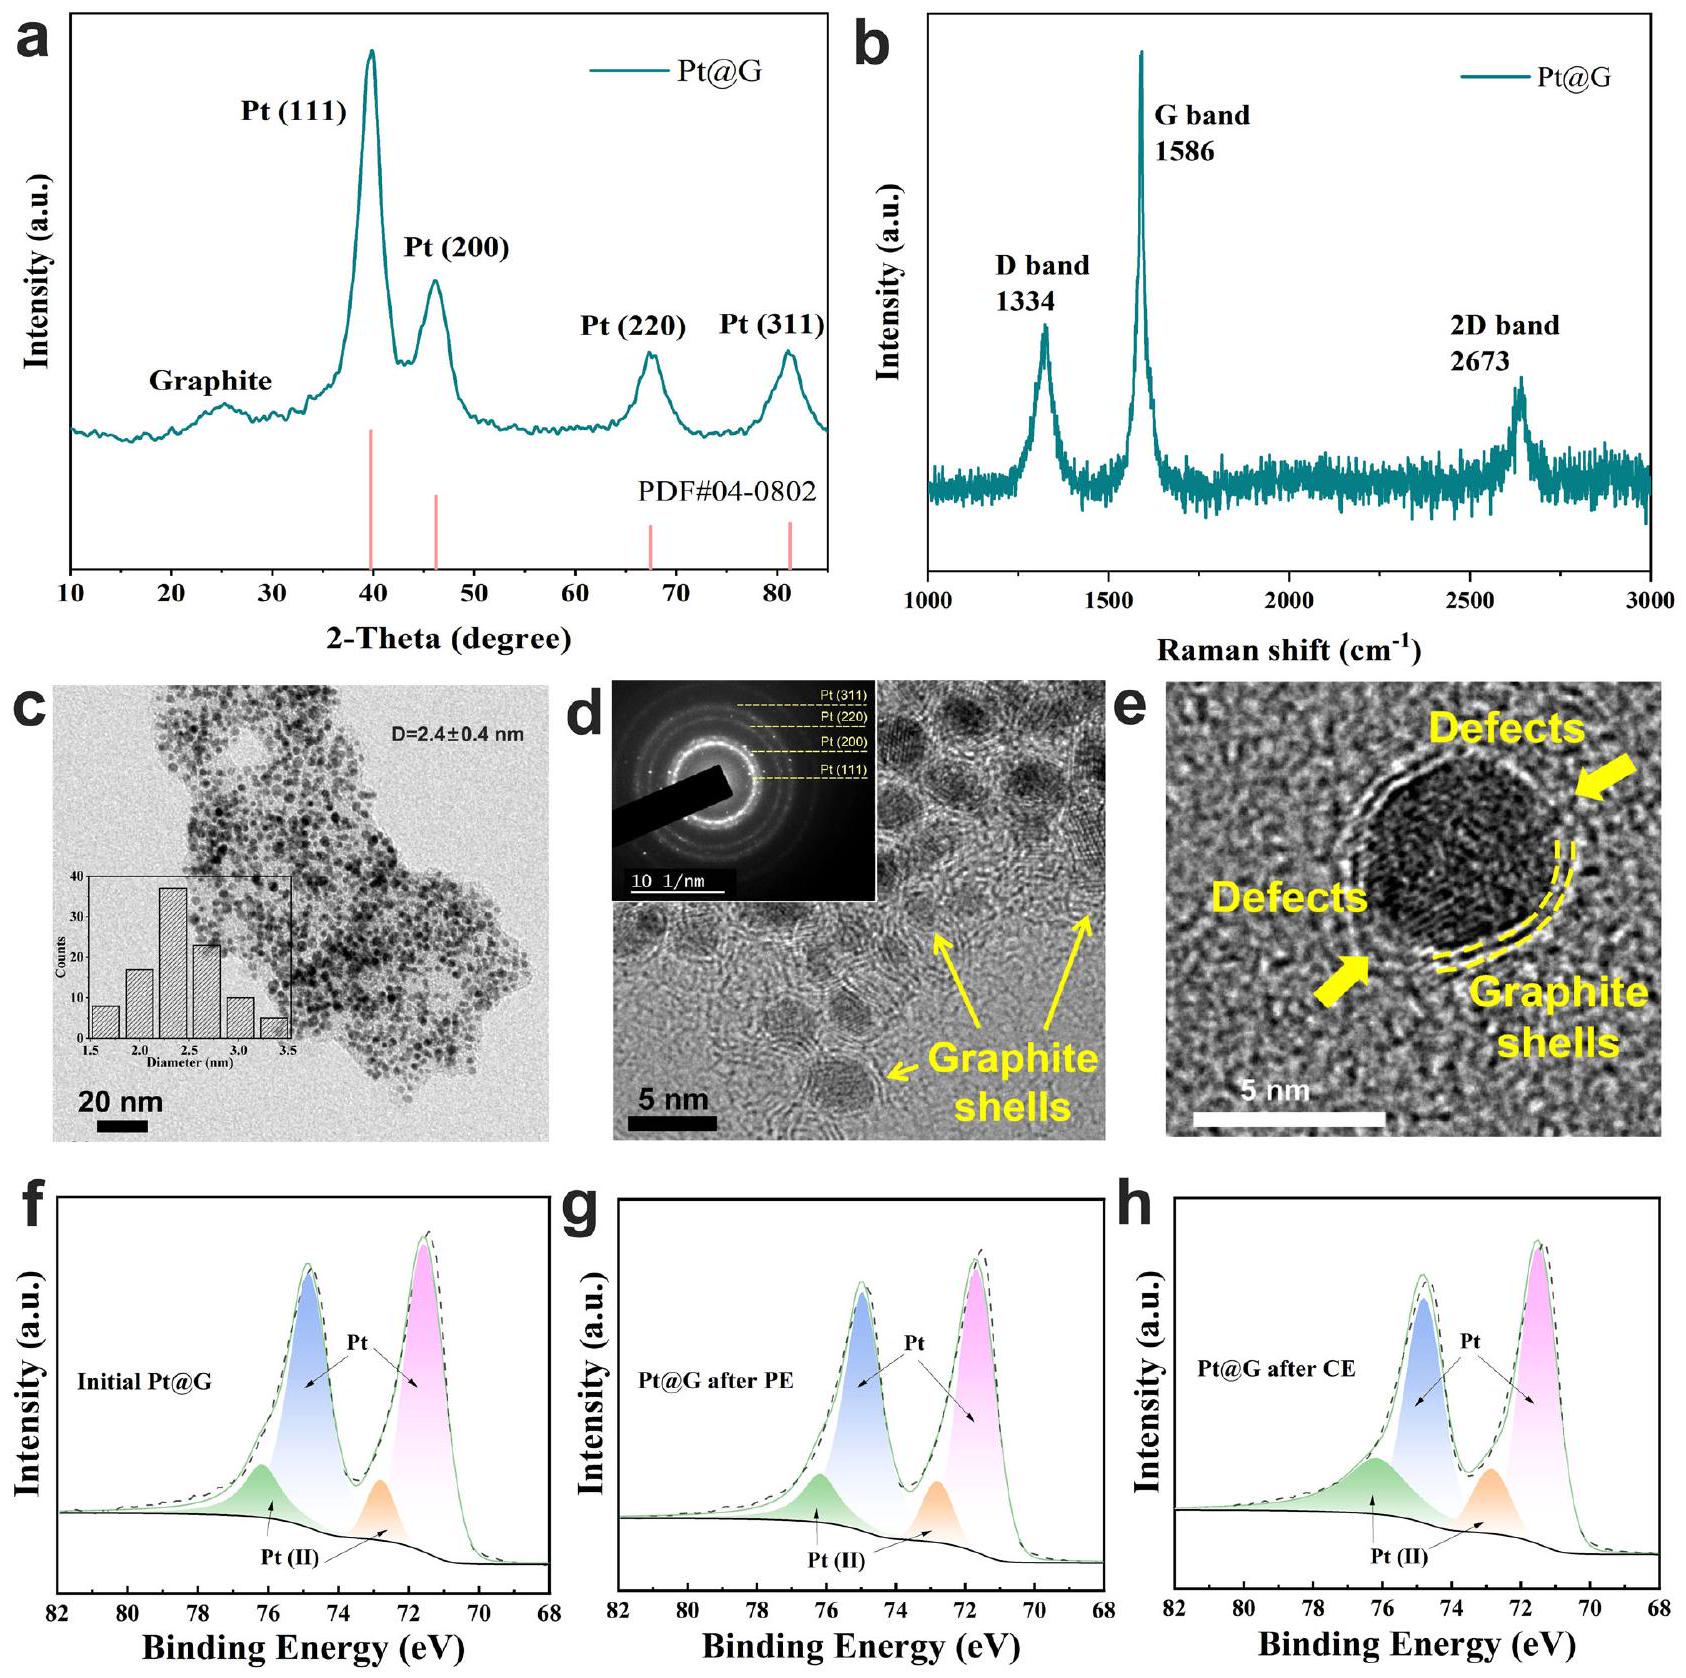
Effect of electrolytic mode on physical and chemical properties Pt@G during GEOR

To investigate the impact of CE and PE modes on the electrocatalyst, the physical and chemical properties of Pt@G before and after electrolysis were examined. First, X-ray diffraction (XRD) patterns and Raman analysis were conducted to gather structural information about Pt@G. Pt@G exhibited the typical polycrystalline Pt structure, with the main exposed crystal surface being Pt (111) (Fig. 3a). A peak corresponding to the graphite layer also occurred at . Raman spectra further confirmed the presence of the graphite layer (Fig. 3b). High-resolution transmission electron microscopy (TEM) was employed for a detailed analysis of morphology and structure (Fig. 3c, d). The Pt@G catalyst exhibited uniform nanoparticles with an average diameter of 2.4 nm . Additionally, graphite shells encapsulating Pt nanoparticles were observed (Fig. 3d, e), confirming the successful synthesis of Pt@G catalysts. The graphite shells encapsulating the platinum nanoparticles have defects and are not complete so that the platinum particles can act as catalysts. The selectedarea electron diffraction (SAED) patterns (The inset figure in Fig. 3d) revealed that Pt@G possessed a polycrystalline structure with crystal surfaces of (111), (200), (220), and (311), which is consistent with the XRD analysis results.
Furthermore, the Pt@G catalysts subjected to PE3 and CE were further characterized via TEM and X-ray photoelectron spectroscopy (XPS). The TEM images and corresponding SAED patterns showed that the morphology and crystalline phase of Pt@G did not undergo significant changes after the PE3 and CE processes (Supplementary Fig. 14). However, according to the XPS results, the oxygen element content of PE3 applied for GLY oxidation (20.97%) was not significantly higher than that of the initial Pt@G (19.56%) (Supplementary Fig. 15 and Supplementary Table 4). XPS refined analysis revealed that the Pt (II) content increased from to after CE, while the Pt (II) content of the catalyst used for PE3 (17.3%) was not significantly higher than that of the initial catalyst (Fig. 4f-h and Supplementary Table 5).
Fig. 2 | Electrocatalytic performance of GEOR under the electrolytic mode of CE and PE. a The current retention rate of CE and PE protocol with different potentials after 4000 s electrolysis. Product distribution and conversion rate of GEOR under the electrolytic modes of (b) CE and (c) PE ( for 0.5 s and for 0.5 s ). The electrolytic charge of different electrolytic modes is basically kept at about 20 C . Condition optimization of and GLY in 1 M KOH ) with the selectivity of GLA and the electrolysis time is for for and 0.05 s ,
respectively. e Selectivity and GLY conversion rate with 20 mM GLY under the electrolytic mode of PE3. The percentages in black indicate the corresponding selectivity of GLA. Comparison of the GLA selectivity and GLY conversion rate (Data derived from Fig. 2e) in this work with those of previous reports and the numbers in parentheses in the figure indicate the corresponding reference numbers. b, c, d, e TA tartronic acid, GLA glyceric acid, LA lactic acid, OA oxalic acid, GA glycolic acid, FA formic acid.
Moreover, the OCP analysis indicated that PE3 resulted in a smaller decrease in potential than CE (Supplementary Fig. 16). This demonstrates that the application of PE is an efficient method to prevent excessive oxidation of the catalyst, which would otherwise promote the adsorption of GLY.

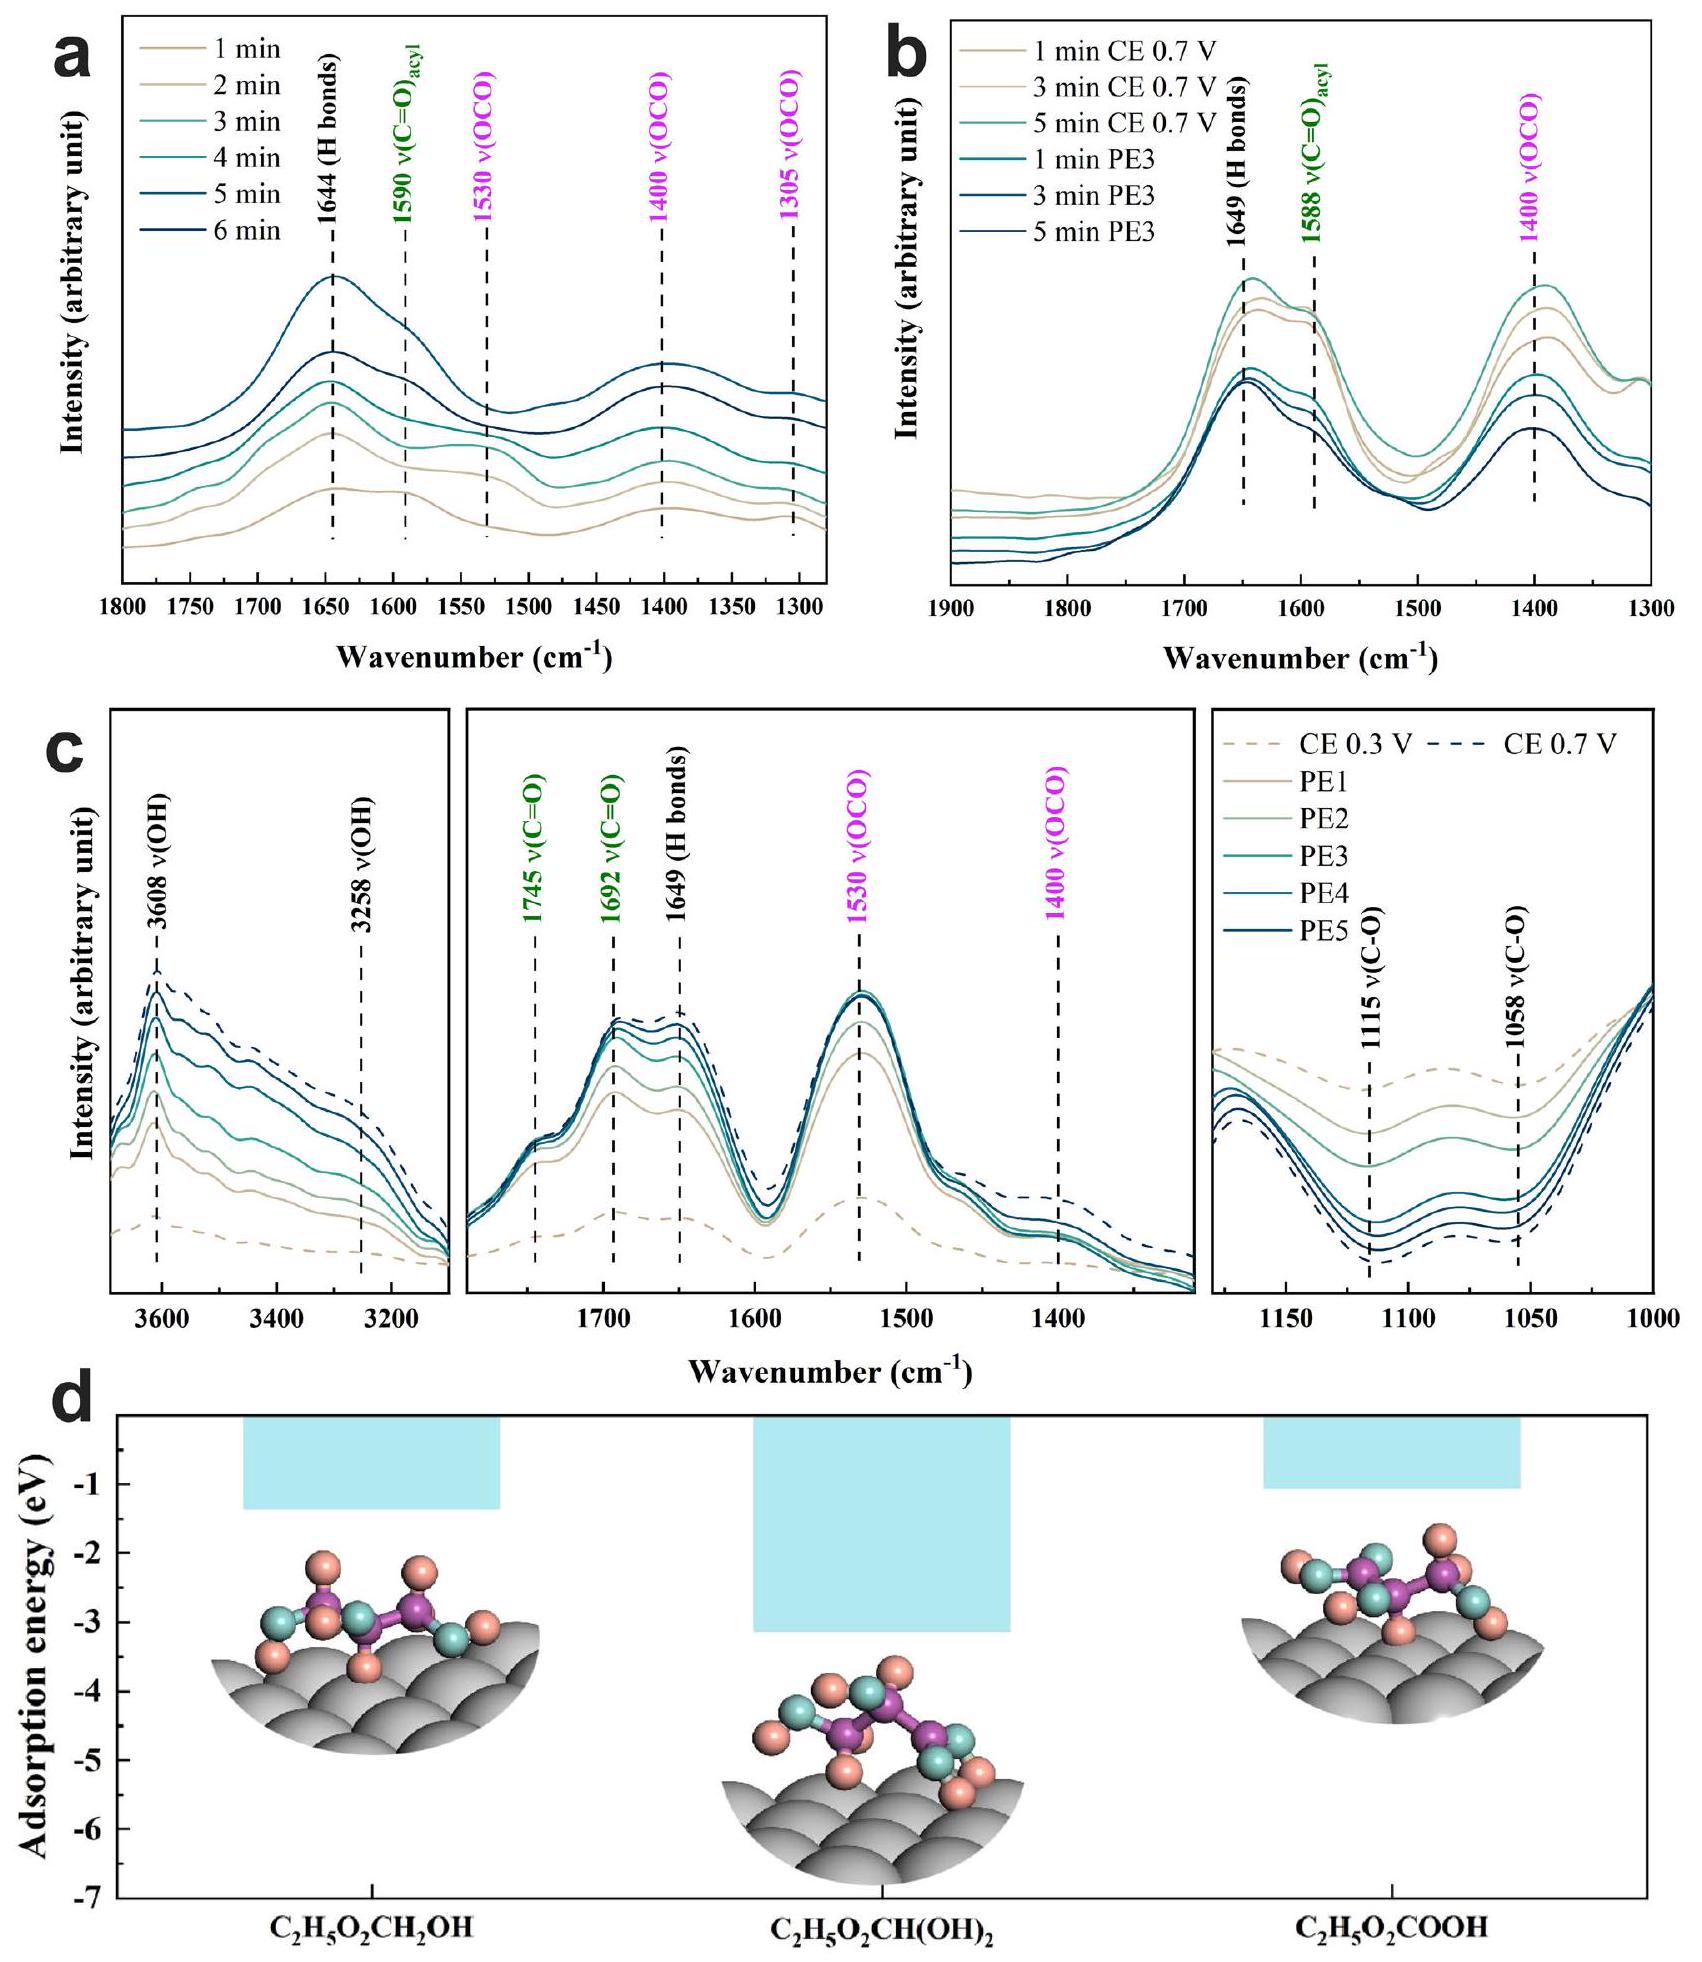
Effect of electrolytic mode on surface micro-environment surrounding Pt@G during GEOR

Revealing the changes of surface species on catalysts during the electrocatalyst is essential to elucidate the reaction process. To obtain information about alterations in the surface micro-environment and adsorbed species during the GEOR process, in situ Fourier-transform infrared (FTIR) spectroscopy analysis was conducted. The FTIR spectra in the region of corresponded to the adsorption sites on the catalyst for the bond of glycerol . The 1114-1126 region corresponded to a bridging alkoxy bond formed from one primary alcohol group of glycerol and two metal surface atoms . The band at corresponded to the bond formed between one metal surface atom and a primary alcohol group of glycerol . As shown in Supplementary Fig. 17, these two regions exhibited negative peaks compared with the OCP spectrum, and the regions decreased as the potential increased from 0.3 to , indicating the dehydrogenation of glycerol’s primary alcohol group adsorbed on the catalyst surface. The symmetric stretch of twofold carboxylate species appeared at (marked in magenta), consistent with previous reports . The band at corresponded to in a bridging bidentate configuration (also marked in magenta) involving two Pt sites . The band centered at corresponded to the stretch mode of adsorbed aldehyde species . The intensity of these bonds related to glycerol oxidation intermediates increased with an increase in potential (Supplementary Fig. 17) and
electrolysis time (Fig. 4a and Supplementary Fig. 18b). The intensity of these regions under CE reached the maximum value faster at (Supplementary Fig. 18b) than at (Fig. 4a). These results demonstrate that higher potential led to the rapid formation and accumulation of glycerol oxidation intermediates. Furthermore, the increase in electrolysis time resulted in the continuous accumulation of intermediates, which was the origin of the toxicity phenomenon of the catalyst.
The surface hydrogen bonds associated with and glycerol oxidation intermediates concentration were further investigated. The bands around 3236 and were identified as surface OH groups involved in hydrogen bonds on the metal catalyst surface and free OH groups, respectively . The bands in the region increased as the potential increased (Supplementary Fig. 17) and with an increase in electrolysis time during CE at (Supplementary Fig. 19) and (Supplementary Fig. 18a). Additionally, the band at , assigned to intermolecular hydrogen bonds , also displayed the same trends in changes (Fig. 4a, Supplementary Figs. 17 and 18b). There were two possible reasons for the increase in hydrogen bonds on the catalyst surface. First, as the potential increased, the surface OH concentration also increased because the negative charge favored alkoxide formation and adsorption on the catalyst surface . Second, a higher pH environment promoted the formation of aldehyde intermediates into a geminal diol structure . The geminal diol structure on Pt (111) exhibited stronger adsorption energy than GLY and GLA, indicating that the desorption of geminal diol from the catalyst surface into the solution was more challenging (Fig. 4d). Furthermore, the formation of this structure can facilitate the rapid conversion of GLAD into GLA, thereby improving the selectivity of GLA. Therefore, the intensity enhancement observed in the region and the band
Fig. 3 | Physical and chemical characterization of Pt@G. a XRD pattern; (b) Raman spectrum; (c-e) TEM images of Pt@G. c Inset shows the particle size dis-High-resolution X-ray photoelectron spectroscopy refined spectra of Pt for ( ) initial Pt@G, (g) Pt@G used for PE3, and (h) Pt@G used for CE at 0.7 V rhe . tribution of Pt@G nanoparticles. d Inset shows the SAED patterns of Pt@G.
with an increase in potential and electrolysis time provides evidence of the accumulation of and glycerol oxidation intermediates during the CE process.
To further evaluate the effect of pulsed electrolysis on surface species during GEOR, in situ FTIR spectra of Pt@G electrodes with electrolytic modes of CE and PE were compared. The PE3 and CE at 0.7 with varying times were investigated (Fig. 4b and Supplementary Fig. 20). The intensity of bonds at 1400,1588 , and and the region increased with time. However, when the PE3 protocol was applied, the intensity of these bands decreased, especially for the bonds at 1400 and , which corresponded to carboxylate and aldehyde species, respectively. Furthermore, during the different PE protocols (Fig. 4c), these bonds decreased as increased from 0.05 to 2 s (from PE5 to PE1). Moreover, the intensity of bonds at 1115 and , associated with the primary alcohol
groups of glycerol, increased as increased from 0.05 to 2 s . This indicates that the application of the PE method prevented the accumulation of toxic intermediate species on the electrode surface, promoted the rapid desorption and diffusion of carboxylate species, and freed up active sites for the re-adsorption of GLY. The combination of these effects was the key reason for the high GLA selectivity observed in GEOR based on the PE process.

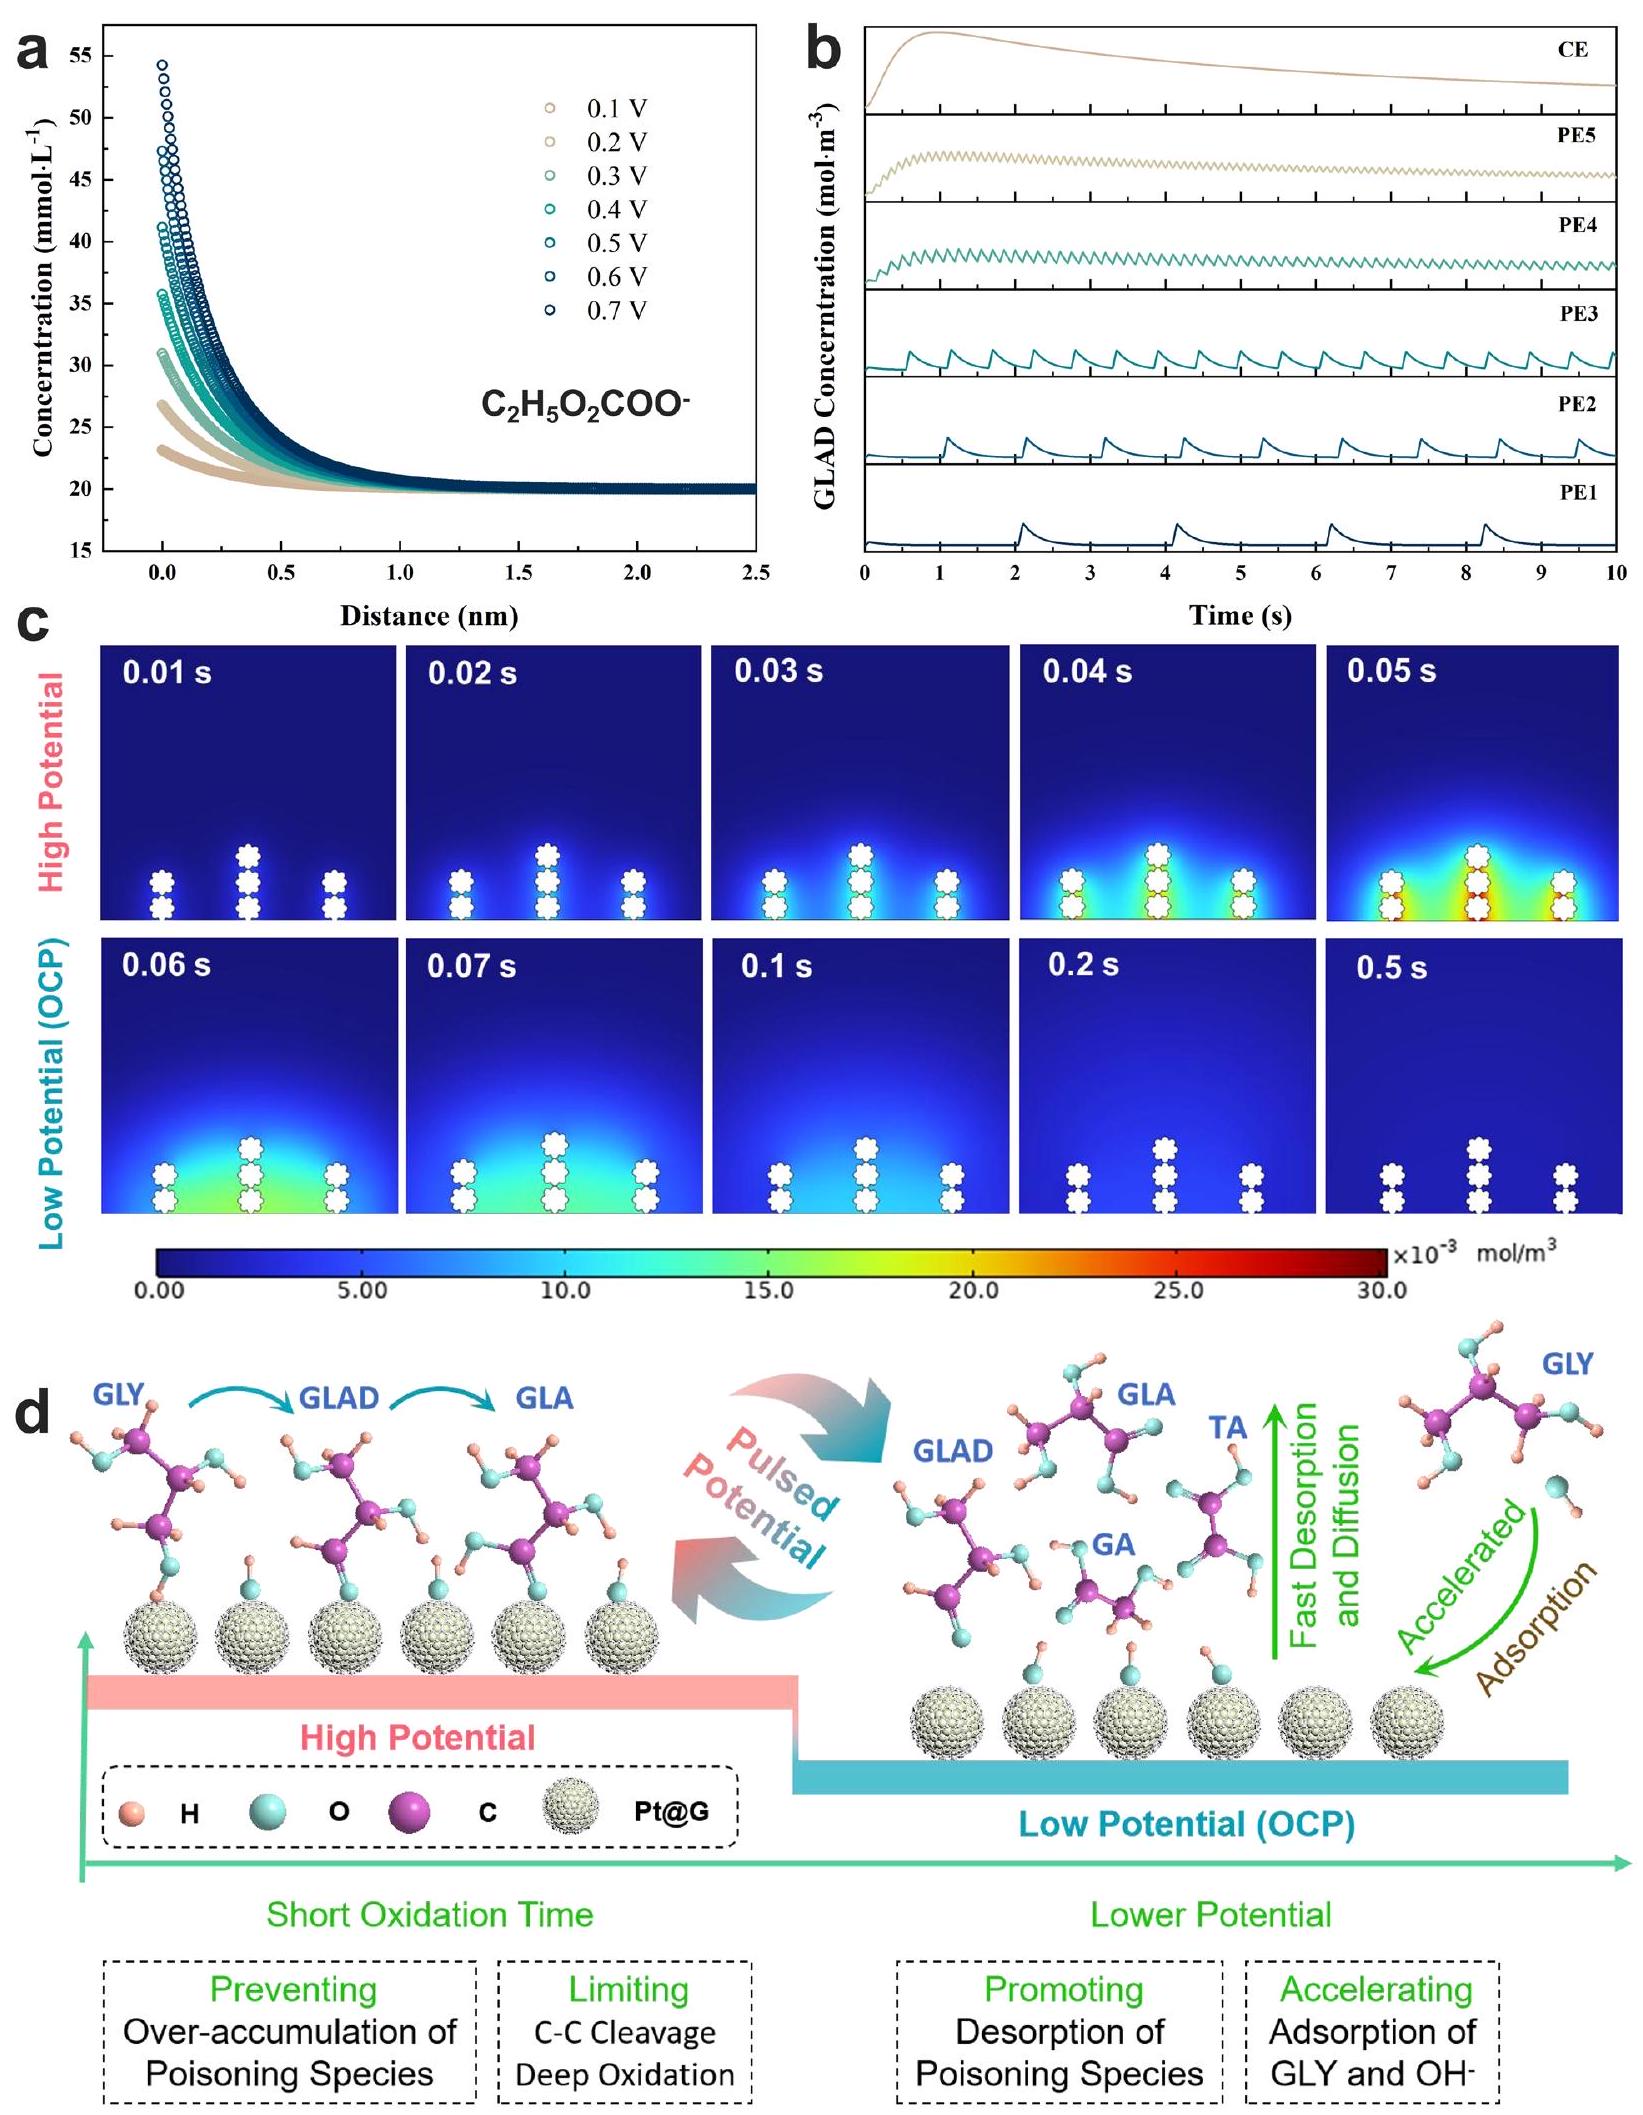
Finite element simulation and mechanistic understanding of PE for GEOR

To more deeply elucidate the adsorption/desorption behaviors of surface species during the GEOR process, computer simulations were conducted using COMSOL Multiphysics software (detailed parameters can be found in the Methods section). During the electrocatalysis process, the rate of electron transfer primarily depends on the applied
Fig. 4 | In situ FTIR spectra of Pt@G catalysts in 1 M KOH with 50 mM GLY under different conditions. a CE at with different times, (b) PE3 after CE at 0.7 with different times and (c) different PE protocols (PE1-PE5: for for and 0.05 s , respectively). Adsorption energy of GLY, (transformed from GLAD), and GLA on Pt (111) in an
alkaline electrolyte. The three inset images present the optimized adsorption geometry of the corresponding three species on the Pt (111) surface. The color for each element is tangerine yellow for H , light blue for O , purple for C , and gray for Pt , respectively.
potential and the concentration of reactants and products within the electric double layer (EDL) . Changes in potential also significantly influence the distribution of reactants and products owing to the effects of the electric fields within the EDL, particularly for electrically charged ions. Therefore, the effect on the distribution of ,
and within the EDL at different potentials was evaluated, without considering electrochemical/chemical reactions and adsorption. The concentration of on the catalyst surface (at a distance of 0 nm ) was higher than that in the solution, and this difference became more pronounced as the potential increased from 0.1
to (Fig. 5a). The distribution of on the electrode surface exhibited the same trend, while the positive ions ( and ) exhibited an opposite pattern (Supplementary Fig. 21). This suggests that negative ions ( and ) tended to accumulate on the electrode surface owing to the influence of electric fields. Conversely, when a relatively lower potential was applied, the desorption and diffusion of negative ions were promoted.
Finite element analysis was conducted to simulate the local concentration changes of different species with the PE and CE processes, and the adsorption/desorption of reactants and products and electrochemical and chemical reactions were considered. The timedependent local concentration profile of GLAD is shown in Fig. 5b. At a constant potential of , GLAD accumulated on the catalytic surface owing to its strong adsorption onto the Pt site. The surface local GLA concentration exhibited the same trend (Supplementary Fig. 22). In contrast, the application of PE effectively mitigated the enrichment of GLAD and GLA, with local concentrations decreasing as increased (from PE5 to PE1). These results align with the results of previous analyses (Fig. 4b, c). The visualized 2D concentration profiles of GLAD with PE3 are presented in Fig. 5c, offering a visual representation to further comprehend the effect of pulse potential on the accumulation and conversion of electrode species.
In addition to the local concentration, the surface coverage of different species directly affected electron transfer in the electrocatalyst reaction. At a constant potential of , the coverage of (Supplementary Fig. 23a) and GLY (Supplementary Fig. 23b) decreased significantly owing to their consumption and the accumulation of poisoning species that occupy a large number of active sites (Supplementary Fig. 23c, d). played an essential role in GEOR. Decreased coverage resulted in a large number of intermediate species being unable to transform rapidly, leading to rapid catalyst deactivation and a low current density. In contrast, the application of PE resulted in lower coverage of GLAD and GLA and higher coverage of and GLY. This demonstrates that the rapid oxidation of GLAD, due to higher OH coverage and fast diffusion of GLA with lower potential ( ), promoted the refreshing of active sites for the readsorption of and GLY. Moreover, the short pulse time of high potential effectively prevented further GLA oxidation (Fig. 5d). These strategies provide an effective means to prevent catalyst deactivation and achieve high C3 selectivity during GEOR.

Discussion

We developed a PE strategy to address the deactivation issue of Ptbased electrocatalysts by altering the catalyst surface microenvironment. In situ characterization and computer simulations revealed that the PE electrolytic mode prevented the overaccumulation of poisoning intermediate species, promoted the desorption and diffusion of the target product (GLA) into the solution, and accelerated the re-adsorption of and GLY. Additionally, the application of the PE protocol alleviated Pt oxidation during the CE process, further enhancing GLY adsorption. Consequently, remarkable C3 selectivity (87.3-84.6%) and GLA selectivity (81.8-74.4%) were achieved. This work provides a simple and efficient strategy to prevent the deactivation of noble-based electrocatalysts and obtain high-value C3 products from glycerol with high selectivity.

Methods

Preparation of Pt@G

The graphitic Pt nanocrystals ( ) were prepared in a chemical vapor deposition (CVD) system . In a typical procedure, the fumed silica ( 1.0 g ) was impregnated with in 100 mL methanol and sonicated for 2 h . The mixture was then dried at , and the powder was placed into a methane CVD chamber for graphitic growth with a methane flow of and hydrogen flow of for 5 min at . After that, the sample was etched
with HF and to dissolve the silica, then washed and centrifugated to obtain the Pt@G catalyst.

Characterizations

The X-ray diffraction (XRD) analysis was conducted on a Siemens D500 diffractometer with a Cu Ka source ( ). The Raman spectra were obtained with Renishaw’s InVia Raman system with 633 nm laser excitation (Renishaw, UK). TEM images were taken with a JEM-2010 (JEOL, Japan). X-ray photoelectron spectroscopy (XPS) spectra were acquired with an ESCALAB 250Xi X-ray photoelectron spectrometer.

Electrochemical measurements

The electrochemical test was carried out in a three-electrode system with the prepared titanium mesh loaded with catalysts ( ) as the working electrode, as the reference electrode and graphite rod as the counter electrode. The CHI 660 E was used as the electrochemical workstation. LSV was performed with a scan rate of in the single cell. The electrolysis test was performed in the divided cell, separated by the Nafion 117 membrane. The pulsed potential electrolysis (PE) was conducted by using the muti-potential steps technique. The relative lower and higher potentials are named and respectively. The responding time is named and . In situ electrochemical impedance spectroscopy (EIS) measurements were carried out by Autolab PGSTAT302N (Eco Chemie, Utrecht, the Netherlands) over the frequency range from to with an amplitude of 10 mV .

Product analysis

The determination of electrolysis products was achieved using highperformance liquid chromatography (HPLC, LC 2030 C, Shimadzu, Japan) equipped with both a UV detector and a RID detector. The mobile phase was 5 mM aqueous with a flow rate of and the column temperature was . The UV detector with 210 nm was used for the quantification of oxalic acid (OA), tartronic acid (TA), glyceraldehyde (GLAD), dihydroxyacetone (DHA), glyceric acid (GLA), lactic acid (LA) and glycolic acid (GA), formic acid (FA). The RID detector was used to determine the GLY concentration. The conversion rate of GLY and the selectivity of products were calculated as follows:
where is the carbon atom number of the product.

In situ FTIR study

The in situ FTIR was performed under different potentials by an infrared spectrometer (BRUKER, TENSOR II, USA) which was equipped with a mercury cadmium telluride (MCT) detector cooled by liquid nitrogen. The spectra were collected at a resolution of in the range. The Au film was chemically deposited on the single-crystal silicon. First, the Si crystal was immersed in the mixture solution ( ) for 2 h to wash the surface contaminants. Then, the Si crystal surface was polished with 0.05 mm powder for 30 min and then washed with ethanol and deionized water. The clean Si crystal was further immersed in the mixture solution for 15 min at and then washed with deionized water. Next, the crystal face of Si was immersed in a gold plating solution ( ) for 5 min at followed by washing with deionized water and air dried. The Pt@G catalyst was dropped on Au film for the in situ FTIR test. The tests were performed in a two-compartment electrochemical cell. The Au film
Fig. 5 | Simulations of the GEOR process with the PE protocol. a Effect of applied constant potential on the diffusion of on the electrode surface. Surface concentration of GLAD at different electrolysis times for CE and PE protocol (PE1-PE5: for for 2.0,1.0, 0.5 , 0.2 and 0.05 s , respectively). c Snapshots of GLA at different electrolysis times for
the PE3 protocol. a, b, c Data obtained through COMSOL multiple physical quantities. The catalyst of is represented by seven round white dots. d Schematic of the pathways of PE-based GEOR. GLY glycerol, GLAD glyceraldehyde, GLA glyceric acid, TA tartronic acid, GA glycolic acid.
loaded with catalyst, graphite rod and were used as working electrodes, counter electrode and reference electrode respectively.

Adsorption energy calculation

Adsorption energy calculations were performed using the Vienna ab initio simulation package (VASP 5.4) . The projector-augmented-wave (PAW) pseudopotentials and Perdew-Burke-Ernzerhof (PBE) functional were used for electron-ion interactions and exchange-correlation energy functional, respectively . The kinetic energy cutoff for planewave basis was set to 500 eV cutoff was used for describing valence electrons. The van der Waals (vdW) interactions among organic molecules and surfaces of Pt were calculated by the DFT-D3 method . Pt is a ( ) supercell of the (111) surface. The force convergence criterion was set to and the energy convergence criterion was . The Brillouin zone was sampled with a Gamma-centered k point grid of for Pt supercells. A vacuum layer of was adopted in the three models.

Finite element simulations of the diffuse double layer

To evaluate the effect of potential changes on the distribution of the electrically charged ions during the electrocatalysis process. The model with a double-layer model combines the transport of diluted species and electrostatics physics interfaces to account for mass transfer was established by COMSOL Multiphysics 6.1 software. The model contains one charged electrode adjacent to the bulk solution.
The geometry of the model is defined by a single interval between 0 and L , indicating a one-dimensional structure. This interval encompasses the electrolyte phase spanning from the electrode through the diffuse double layer and extending to the electroneutral bulk solution. The boundary condition set at is utilized to regulate the compact component of the double layer. The main parameters for finite element simulations of the diffuse double layer are shown in Supplementary Table 1.

Finite element simulations of the GEOR

The modelling of the GEOR with pulsed potential electrolysis process was performed in COMSOL Multiphysics 6.1 software with a diluted species transport module combined with secondary current distribution. Models of electrode geometries including planar and electrode with nanoparticles were built. The domain equation is the diffusion equation, known as Fick’s 2nd law, which describes the chemical transport of the electroactive species. known as Fick’s 2nd law, which describes the chemical transport of the electroactive species.
At the bulk boundary, a uniform concentration was assumed to be equal to the bulk concentration for the reactants, where the products have zero concentration. At the electrode boundary, the reactant species are reduced to form the products. In this study, the GEOR process on the electrode surface was divided into two processes including the adsorption/desorption reactions (without the charge transfer) and the electrochemical redox reactions (with the charge transfer). Meanwhile, there are two equilibrium reactions in the solution.
Adsorption/desorption reactions (without the charge transfer):
Electrochemical redox reactions (with the charge transfer):
Equilibrium reactions:
where the * stands for the free active sites. For the adsorption of different spices expressed as .
The local current of the electrochemical reaction is described in the following expressions:
where and are the expressions for the concentration of reductant and oxides; and are the electron exchange coefficient, is the Faraday constant, and is the ideal gas constant. is temperature. is the electron transfer number. is the overpotential of the reaction. is the kinetic rate constant. is the in-situ density of the absorption spices. The main parameters for finite element simulations of the GEOR are shown in Supplementary Table 2.

Data availability

All data are available in the manuscript, the supplementary materials, and from the authors on request. Source data are provided as a Source Data file. Source data are provided with this paper.

References

  1. Sharninghausen, L. S., Campos, J., Manas, M. G. & Crabtree, R. H. Efficient selective and atom economic catalytic conversion of glycerol to lactic acid. Nat. Commun. 5, 5084 (2014).
  2. Alisson Dias da Silva, R., Ana Luíza Freitas, F., Antônio Ésio, B., Rita Maria de Brito, A. & Luiz Antônio Magalhães, P. Market prospecting and assessment of the economic potential of glycerol from biodiesel. In Biotechnological Applications of Biomass (eds Thalita Peixoto B., Thiago Olitta B., Luiz Carlos B.). IntechOpen (2020).
  3. Sheng, H. et al. Linear paired electrochemical valorization of glycerol enabled by the electro-Fenton process using a stable cathode. Nat. Catal. 5, 716-725 (2022).
  4. Katryniok, B. et al. Selective catalytic oxidation of glycerol: perspectives for high-value chemicals. Green Chem. 13, 1960-1979 (2011).
  5. Zhou, C., Beltramini, J. N., Fan, Y. & Lu, G. Q. Chemoselective catalytic conversion of glycerol as a biorenewable source to valuable commodity chemicals. Chem. Soc. Rev. 37, 527-549 (2008).
  6. González-Cobos, J., Baranton, S. & Coutanceau, C. A systematic in situ infrared study of the electrooxidation of C3 alcohols on carbon-supported Pt and Pt-Bi catalysts. J. Phys. Chem. C 120, 7155-7164 (2016).
  7. Casebolt, R., Levine, K., Suntivich, J. & Hanrath, T. Pulse check: potential opportunities in pulsed electrochemical reduction. Joule 5, 1987-2026 (2021).
  8. Zhang, X. et al. Asymmetric low-frequency pulsed strategy enables ultralong reduction stability and controllable product selectivity. J. Am. Chem. Soc. 145, 2195-2206 (2023).
  9. Timoshenko, J. et al. Steering the structure and selectivity of electroreduction catalysts by potential pulses. Nat. Catal. 5, 259-267 (2022).
  10. Kim, C. et al. Tailored catalyst microenvironments for electroreduction to multicarbon products on copper using bilayer ionomer coatings. Nat. Energy 6, 1026-1034 (2021).
  11. Li, P. et al. Pulsed nitrate-to-ammonia electroreduction facilitated by tandem catalysis of nitrite intermediates. J. Am. Chem. Soc. 145, 6471-6479 (2023).
  12. Guo, M. et al. Pulsed electrocatalysis enabling high overall nitrogen fixation performance for atomically dispersed Fe on . Angew. Chem. 135, e202217635 (2023).
  13. Bu, Y. et al. Electrical pulse-driven periodic self-repair of Cu-Ni tandem catalyst for efficient ammonia synthesis from nitrate. Angew. Chem. Int. Ed. 62, e202217337 (2023).
  14. Ding, Y. et al. Pulsed electrocatalysis enables an efficient 2-electron oxygen reduction reaction for production. J. Mater. Chem. A 9, 15948-15954 (2021).
  15. Vincent, I. et al. Pulsed current water splitting electrochemical cycle for hydrogen production. Int. J. Hydrogen Energy 43, 10240-10248 (2018).
  16. Zhao, M. et al. Pd-Ru alloy nanocages with a face-centered cubic structure and their enhanced activity toward the oxidation of ethylene glycol and glycerol. Small Methods 4, 1900843 (2020).
  17. Fan, L. et al. Recent progress in electrocatalytic glycerol oxidation. Energy Technol. 9, 2000804 (2021).
  18. Zhou, Y., Shen, Y. & Xi, J. Seed-mediated synthesis of PtxAuy@Ag electrocatalysts for the selective oxidation of glycerol. Appl. Catal. B: Environ. 245, 604-612 (2019).
  19. Li, Z. et al. Alcohols electrooxidation coupled with production at high current densities promoted by a cooperative catalyst. Nat. Commun. 13, 147 (2022).
  20. Zhang, Y. et al. Potential-dynamic surface chemistry controls the electrocatalytic processes of ethanol oxidation on gold surfaces. ACS Energy Lett. 4, 215-221 (2019).
  21. Gao, F. et al. Shape-control of one-dimensional PtNi nanostructures as efficient electrocatalysts for alcohol electrooxidation. Nanoscale 11, 4831-4836 (2019).
  22. Zhang, Z. et al. Engineering phase and surface composition of nanocatalysts: a strategy for enhancing CO tolerance. Nano Energy 34, 224-232 (2017).
  23. Ren, Z. et al. Pt/ZrO2 catalyst with metal-support synergistic effect towards glycerol selective oxidation. Chem. Eng. J. 468, 143623 (2023).
  24. Li, J. et al. Tuning the product selectivity toward the high yield of glyceric acid in Pt-CeO2/CNT electrocatalyzed oxidation of glycerol. ChemCatChem 14, e202200509 (2022).
  25. Wu, G., Liu, Y., He, Y., Feng, J. & Li, D. Reaction pathway investigation using in situ Fourier transform infrared technique over Pt/CuO and for selective glycerol oxidation. Appl. Catal. B: Environ. 291, 120061 (2021).
  26. Dong, J. et al. Direct in situ raman spectroscopic evidence of oxygen reduction reaction intermediates at high-index surfaces. J. Am. Chem. Soc. 142, 715-719 (2020).
  27. Marković, N. M., Marinković, N. S. & Adžić, R. R. Electrosorption of hydrogen and sulphuric acid anions on single-crystal platinum stepped surfaces: Part I. The [110] zone. J. Electroanal. Chem. Interfacial Electrochem. 241, 309-328 (1988).
  28. Wang, Y. et al. Efficient electrocatalytic oxidation of glycerol via promoted generation over single-atom-bismuth-doped spinel . ACS Catal 12, 12432-12443 (2022).
  29. Sandrini, R. M. L. M. et al. Mechanistic aspects of glycerol electrooxidation on electrode in alkaline media. Electrochem. Commun. 86, 149-152 (2018).
  30. Hong, W., Shang, C., Wang, J. & Wang, E. Bimetallic PdPt nanowire networks with enhanced electrocatalytic activity for ethylene glycol and glycerol oxidation. Energy Environ. Sci. 8, 2910-2915 (2015).
  31. Zhou, P. et al. Heterogeneous-interface-enhanced adsorption of organic and hydroxyl for biomass electrooxidation. Adv. Mater. 34, 2204089 (2022).
  32. Yan, Y. et al. Electrocatalytic upcycling of biomass and plastic wastes to biodegradable polymer monomers and hydrogen fuel at high current densities. J. Am. Chem. Soc. 145, 6144-6155 (2023).
  33. Liu, X. & Yang, C. Electrocatalytic selective oxidation of glycerol to glyceric acid over efficient Pt/CNTs-CeO2 catalysts. Mater. Lett. 324, 132658 (2022).
  34. Zhou, Y., Shen, Y., Xi, J. & Luo, X. Selective electro-oxidation of glycerol to dihydroxyacetone by PtAg skeletons. ACS Appl. Mater. Interfaces 11, 28953-28959 (2019).
  35. Zhou, Y., Shen, Y. & Piao, J. Sustainable conversion of glycerol into value-added chemicals by selective electro-oxidation on Pt-based catalysts. ChemElectroChem 5, 1636-1643 (2018).
  36. Kim, Y. et al. The role of ruthenium on carbon-supported PtRu catalysts for electrocatalytic glycerol oxidation under acidic conditions. ChemCatChem 9, 1683-1690 (2017).
  37. Dai, C. et al. Electrochemical production of lactic acid from glycerol oxidation catalyzed by AuPt nanoparticles. J. Catal. 356, 14-21 (2017).
  38. Inoue, H. et al. Mechanism of glycerol oxidation reaction on silvermodified palladium electrode in alkaline medium. Int. J. Hydrogen Energy 43, 18664-18671 (2018).
  39. Copeland, J. R., Santillan, I. A., Schimming, S. M., Ewbank, J. L. & Sievers, C. Surface interactions of glycerol with acidic and basic metal oxides. J. Phys. Chem. C 117, 21413-21425 (2013).
  40. An, Z. et al. Pt1 enhanced C-H activation synergistic with catalysis for glycerol cascade oxidation to glyceric acid. Nat. Commun. 13, 5467 (2022).
  41. Mello, G. A. B., Busó-Rogero, C., Herrero, E. & Feliu, J. M. Glycerol electrooxidation on Pd modified Au surfaces in alkaline media: effect of the deposition method. J. Chem. Phys. 150, 041703 (2018).
  42. Xu, L. et al. Salting-out aldehyde from the electrooxidation of alcohols with 100% selectivity. Angew. Chem. Int. Ed. 61, e202210123 (2022).
  43. Zhang, L., Li, C. & Huang, J. A beginners’ guide to modelling of electric double layer under equilibrium, nonequilibrium and AC conditions. J. Electrochem. 28, 2108471 (2022).
  44. Zhang, L. et al. In vivo activation of pH-responsive oxidase-like graphitic nanozymes for selective killing of Helicobacter pylori. Nat. Commun. 12, 2002 (2021).
  45. Zhang, L. et al. A magnetocatalytic propelled cobalt-platinum@graphene navigator for enhanced tumor penetration and theranostics. CCS Chem. 4, 2382-2395 (2022).
  46. Obst, S. & Bradaczek, H. Molecular dynamics study of the structure and dynamics of the hydration shell of alkaline and alkaline-earth metal cations. J. Phys. Chem. 100, 15677-15687 (1996).
  47. Kresse, G. & Furthmüller, J. Efficient iterative schemes for ab initio total-energy calculations using a plane-wave basis set. Phys. Rev. B 54, 11169-11186 (1996).
  48. Grimme, S., Antony, J., Ehrlich, S. & Krieg, H. A consistent and accurate ab initio parametrization of density functional dispersion correction (DFT-D) for the 94 elements H-Pu. J. Chem. Phys. 132, 154104 (2010).

Acknowledgements

Y.Z. acknowledges the support from the National Key R&D Program of China (2022YFA1504200), the National Natural Science Foundation of China (22122901), and the Provincial Natural Science Foundation of Hunan (2021JC0008, 2021JJ20024, 2021RC3054). H.P. acknowledges the support from the National Natural Science Foundation of China (52371240).

Author contributions

Y.Z., H.P., and S.W. conceived and supervised the project. W.C. conducted experiments and analyzed data. L.Z. performed STEM measurement and analysis. L.X. performed the DFT calculations and prepared the DFT section for the manuscript. Y.H. conducted some experiments. W.C. performed COMSOL finite element simulations and wrote the paper.

Competing interests

The authors declare no competing interests.

Additional information

Supplementary information The online version contains
supplementary material available at
https://doi.org/10.1038/s41467-024-46752-4.
Correspondence and requests for materials should be addressed to Huan Pang or Yuqin Zou.
Peer review information Nature Communications thanks Zhaoyu Jin, Haobo Li, and the other, anonymous, reviewer(s) for their contribution to the peer review of this work. A peer review file is available.
Reprints and permissions information is available at
http://www.nature.com/reprints
Publisher’s note Springer Nature remains neutral with regard to jurisdictional claims in published maps and institutional affiliations.
Open Access This article is licensed under a Creative Commons Attribution 4.0 International License, which permits use, sharing, adaptation, distribution and reproduction in any medium or format, as long as you give appropriate credit to the original author(s) and the source, provide a link to the Creative Commons licence, and indicate if changes were made. The images or other third party material in this article are included in the article’s Creative Commons licence, unless indicated otherwise in a credit line to the material. If material is not included in the article’s Creative Commons licence and your intended use is not permitted by statutory regulation or exceeds the permitted use, you will need to obtain permission directly from the copyright holder. To view a copy of this licence, visit http://creativecommons.org/ licenses/by/4.0/.
© The Author(s) 2024

  1. State Key Laboratory of Chem/Bio-Sensing and Chemometrics, College of Chemistry and Chemical Engineering, Hunan University, Changsha 410000, P. R. China. School of Chemistry and Chemical Engineering, Yangzhou University, Yangzhou 225009, P. R. China. Key Laboratory of Leather of Zhejiang Province, Institute of New Materials and Industrial Technologies, Wenzhou University, Wenzhou, Zhejiang 325035, P. R. China. These authors contributed equally: Wei Chen, Liang Zhang, Leitao Xu. e-mail: panghuan@yzu.edu.cn; yuqin_zou@hnu.edu.cn