DOI: https://doi.org/10.1038/s41598-025-92034-4
PMID: https://pubmed.ncbi.nlm.nih.gov/40016446
تاريخ النشر: 2025-02-27
افتح
التحليل الزماني المكاني للتوسع الحضري وديناميات استخدام الأراضي باستخدام محرك جوجل الأرض والنماذج التنبؤية
الملخص
لقد زاد التوسع الحضري والتغيرات في استخدام الأراضي/غطاء الأرض (LULC) بشكل مكثف في العقود الأخيرة بسبب النشاط البشري، مما يؤثر على المناظر الطبيعية البيئية والتنموية. درست هذه الدراسة التغيرات التاريخية والمتوقعة في LULC وأنماط النمو الحضري في منطقتي ملتان وسرغودها، باكستان، باستخدام صور الأقمار الصناعية من لاندسات، والحوسبة السحابية، ونمذجة التنبؤ من 1990 إلى 2030. تم تقسيم تحليل صور الأقمار الصناعية إلى أربع فترات زمنية (1990-2000، 2000-2010، 2010-2020، و2020-2030). سهلت منصة محرك جوجل الأرض السحابية تصنيف صور لاندسات 5 ETM (1990، 2000، و2010) وصور لاندسات 8 OLI (2020) باستخدام نموذج الغابة العشوائية. تم استخدام نموذج محاكاة يدمج الأوتوماتا الخلوية وشبكة عصبية اصطناعية متعددة الطبقات في ملحق MOLUSCE من QGIS للتنبؤ بالنمو الحضري حتى عام 2030. أظهرت الخرائط الناتجة مستويات دقة عالية باستمرار تتجاوز
لقد وصلت التحضر العالمي إلى مستويات غير مسبوقة، حيث تجاوز عدد سكان المدن في العالم 4.7 مليار في عام 2023 ومن المتوقع أن يزيد بمقدار 2.8 مليار إضافي بحلول عام 2050. هذا النمو الحضري السريع ملحوظ بشكل خاص في الدول النامية مثل باكستان، حيث تتوسع المدن بوتيرة استثنائية بسبب الهجرة من الريف إلى الحضر، والنمو الطبيعي للسكان، والتنمية الاقتصادية
المواد والأساليب
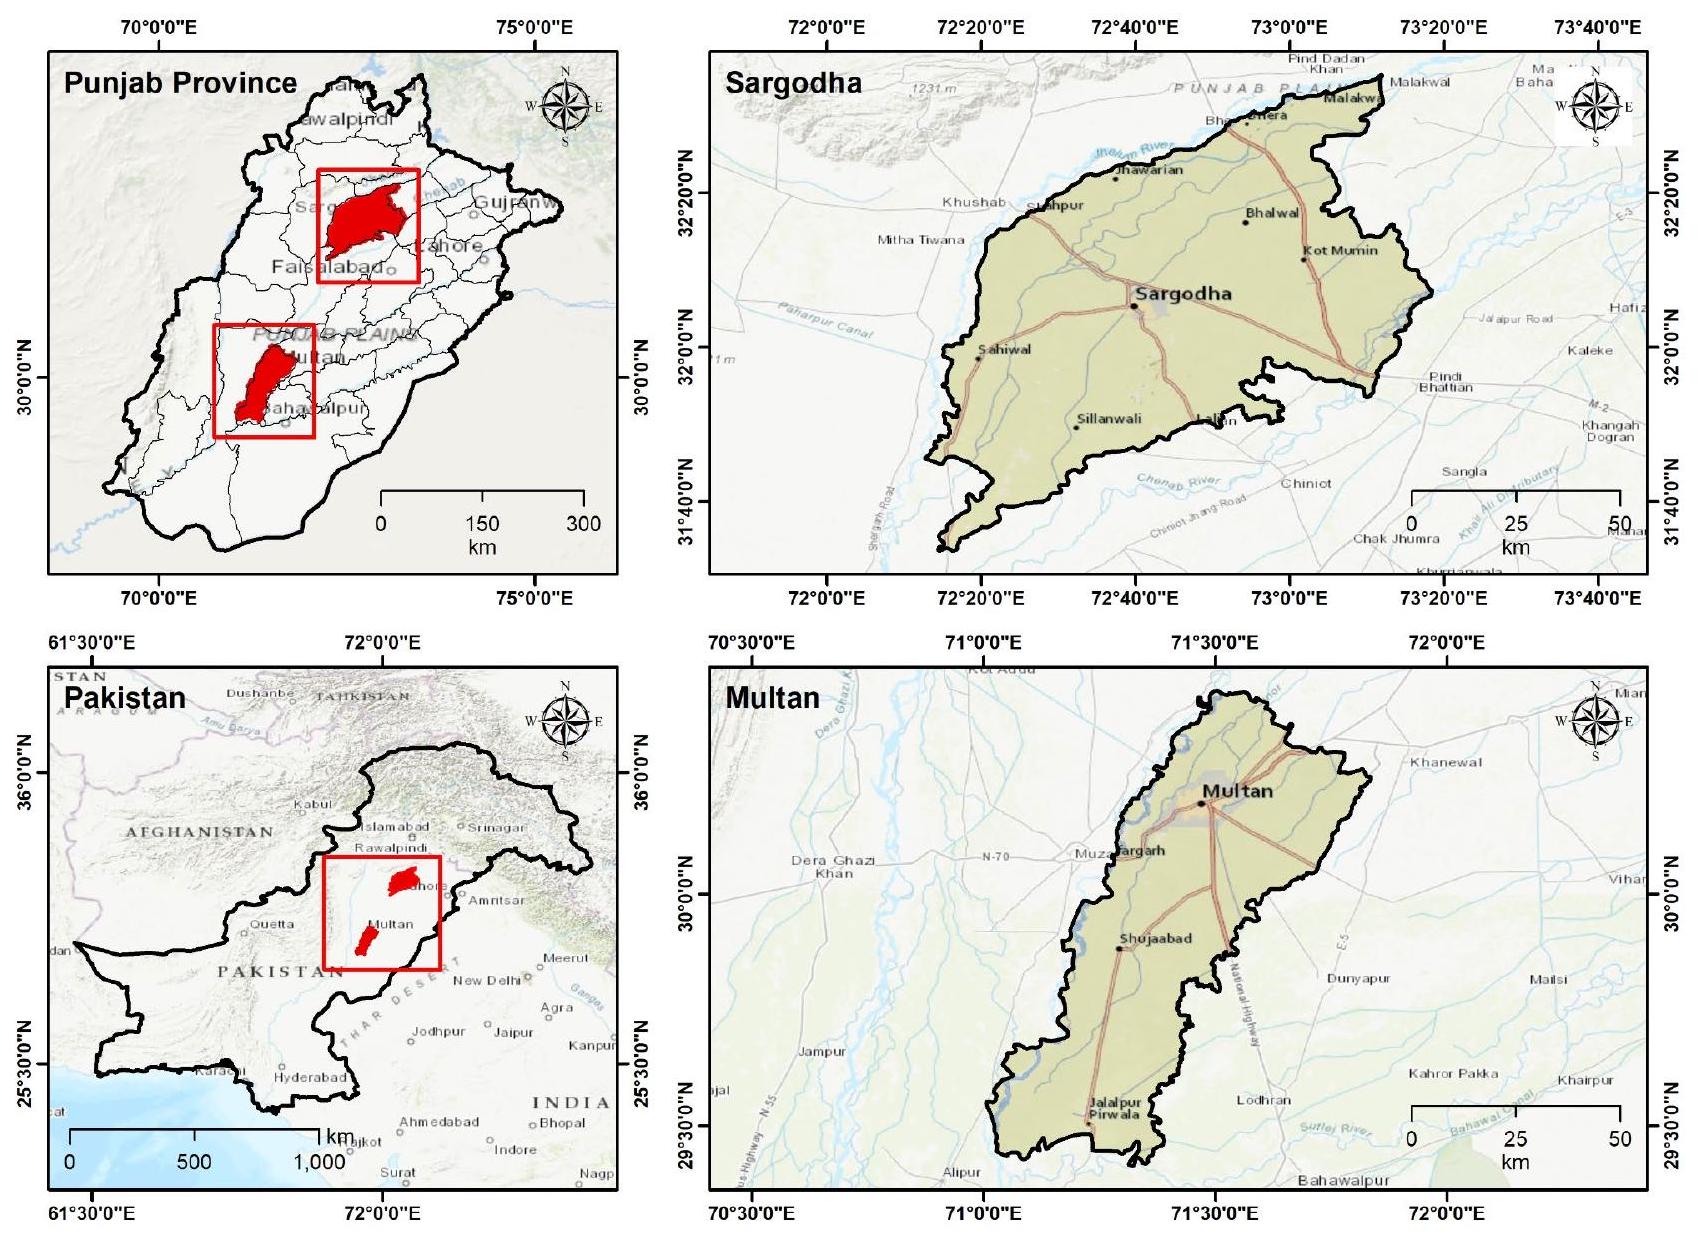
منطقة الدراسة
البرمجيات والبيانات المكانية
| مؤشرات الأقمار الصناعية | اختصارات | معادلات | المراجع |
| مؤشر الفرق النباتي المعدل | NDVI |
|
41 |
| مؤشر الفرق النباتي المعدل للتربة | SAVI |
|
42 |
| مؤشر الفرق النباتي المعزز | EVI |
|
42،43 |
| مؤشر الفرق المائي المعدل | MNDWI |
|
44 |
معالجة منهجية
تصنيف استخدام الأراضي والنباتات وتغطية الأرض
بدأت المعالجة الأولية بتجميع مناطق التدريب لكل فئة من فئات LULC داخل مناطق الدراسة. تم تحديد خمس فئات مميزة وتم التحقق منها باستخدام أجهزة استقبال GPS: (i) الأراضي الزراعية (بما في ذلك الأراضي الزراعية والبساتين)، (ii) المسطحات المائية، (iii) المناطق المبنية، (iv) الأراضي القاحلة، و(v) تغطية النباتات. تم إجراء معالجة صور الأقمار الصناعية في GEE، باستخدام مجموعات Landsat 5 (ID: LANDSAT/LT05/C01/T1_SR) للبيانات التاريخية (1990 و2000 و2010) وLandsat 8 (ID: LANDSAT/LC08/C01/T1_SR) لعام 2020. تم اختيار الصور مع إعطاء الأولوية للمشاهد ذات التغطية السحابية الدنيا والتوقيت الموسمي الأمثل لتمييز تغطية الأرض. تم تنفيذ قناع السحب باستخدام خوارزمية C Function of Mask (CFMask) لإزالة تلوث السحب والظلال. لتعزيز دقة التصنيف، تم حساب أربعة مؤشرات نباتية:
حساب مؤشرات النباتات
تم دمج هذه المؤشرات في عملية التصنيف لتحسين التمييز بين أنواع تغطية الأرض المختلفة، وخاصة بين المناطق المبنية والتربة العارية وبين أنواع النباتات المختلفة.
تصنيف الغابة العشوائية (RF)
ديناميات تغيير استخدام الأراضي وتغطية الأرض
نمذجة سيناريوهات النمو الحضري المستقبلية
النتائج
تصنيف استخدام الأراضي وتغطية الأراضي
| استخدامات الأراضي | 1990 | ٢٠٠٠ | 2010 | ٢٠٢٠ | ||||
| منطقة
|
(% ) | منطقة
|
(% ) | منطقة
|
(% ) | منطقة
|
(% ) | |
| ملتان | ||||||||
| ماء | 60.01 | 1.64 | 25.25 | 0.69 | 53.34 | 1.46 | 91.29 | 2.5 |
| مبني | ٢٤٠.٥٥٧٦ | 6.58 | 397.5034 | 10.87 | 544.4061 | 14.89 | 440.3033 | 12.04 |
| نباتات | ٢,٥٩٦.٥٠ | 71.02 | ٢,٩٣٠.١٦ | 80.15 | ٢,٩٠١.٠٢ | 79.35 | ٢٧١٧.٦١ | ٧٤.٣٤ |
| أرض قاحلة | 758.7097 | ٢٠.٧٥ | 302.919 | 8.29 | 157.0504 | ٤.٣ | ٤٠٦.٦٢ | 11.12 |
| إجمالي | ٣,٦٥٥.٧٨ | 100 | ٣,٦٥٥.٨٤ | 100 | ٣,٦٥٥.٨٢ | 100 | ٣,٦٥٥.٨٣ | 100 |
| سargodha | ||||||||
| ماء | 84.49 | 1.47 | 154.78 | 2.68 | ٢٢٠.٩٥ | 3.84 | 169.41 | 2.94 |
| مبني | 730.91 | 12.69 | 563.6298 | 9.78 | ٣٨٧.٦٥٠٧ | 6.73 | ١٠٢٩.٠٦٧ | 17.83 |
| نباتات | ٣,٩٣٨.٦٨ | 68.38 | ٤٧٧٦٫٦٣ | 82.85 | ٣,٧٠٣.٠٩ | 64.29 | ٤٤٨٦٫٧٨ | ٧٧.٧٤ |
| أرض قاحلة | ١٠٠٥.٥٠ | 17.46 | ٢٧٠٫٥٤٢٦ | ٤.٦٩ | ١٤٤٨.٤٣٦ | 25.15 | 86.61585 | 1.5 |
| إجمالي | ٥٧٥٩٫٥٨ | 100 | ٥٧٦٥٫٥٨ | 100 | ٥٧٦٠٫١٢ | 100 | ٥٧٧١.٨٨ | 100 |
| مدن | دقة |
|
|
|
|
| سargodha | OA | 0.95 | 0.97 | 0.88 | 0.95 |
| ك | 0.93 | 0.82 | 0.95 | 0.93 | |
| ملتان | OA | 0.97 | 0.93 | 0.96 | 0.94 |
| ك | 0.95 | 0.89 | 0.93 | 0.91 |
| التحول إلى منطقة حضرية | منطقة
|
|||
| 1990-2000 | 2000-2010 | 2000-2020 | 2020-2030 | |
| ملتان | ||||
| الماء للبناء | 16.94 | ٢٢.٢٩ | 13.10 | 10.00 |
| مبني (لا تغيير) | ٢٠٠.٤٨ | ٢٧٦.٩ | ٤٧١.٢٩ | ١,١٠٥.٤٠ |
| الخضار إلى المباني | ١٣١.٨٠ | 167.69 | ٥٤١.٤٠ | 170.85 |
| من أرض قاحلة إلى مبنية | ٥٦.٣٦ | ٣٨.٧٠ | ١٣٠.٠٣ | ١٧٣٫٠٠ |
| إجمالي | ٤٠٥.٥٨ | ٥٠٥.٥٨ | ١١٥٥.٨٢ | ١٤٥٩.٢٥ |
| سargodha | ||||
| الماء للبناء | 10.10 | 72.70 | 15.90 | 8.30 |
| مبني (لا تغيير) | ١٧٢.٠٦ | ٣٣٧.٩٨ | 496.72 | 871.98 |
| الخضار إلى المباني | ٧٨.٨٧ | ١٢٤.٩٦ | ٧٩٢.٧٠ | 211.98 |
| من أرض قاحلة إلى مبنية | ٣٧.٩١ | ٣٤.٢٧ | ٢٨٠.٦٠ | ٤٥.٧٩ |
| إجمالي | 298.94 | 569.91 | 1585.92 | ١١٣٨.٠٥ |
| فصول | ملتان 1990 | ملتان 2000 | ملتان 2010 | ملتان 2020 | ||||||||
|
|
% | لا نقاط |
|
% | لا نقاط |
|
% | لا نقاط |
|
% | لا. نقاط | |
| ماء | 0.6 | 1.64 | 145 | 0.25 | 0.69 | 145 | 0.53 | 1.46 | 145 | 0.91 | 2.5 | 145 |
| مبني | 2.41 | 6.58 | 16 | 3.98 | 10.87 | 16 | 5.44 | 14.89 | 16 | ٤.٤ | 12.04 | 16 |
| نباتات | ٢٥.٩٧ | 71.02 | 150 | ٢٩.٣ | 80.15 | 150 | ٢٩.٠١ | 79.35 | 150 | ٢٧.١٨ | ٧٤.٣٤ | 150 |
| أرض قاحلة | ٧.٥٩ | ٢٠.٧٥ | ٢٢ | 3.03 | 8.29 | ٢٢ | 1.57 | ٤.٣ | ٢٢ | ٤.٠٧ | 11.12 | ٢٢ |
| صفر | 0 | 0 | 123 | 0 | 0 | 123 | 0 | 0 | 123 | 0 | 0 | 123 |
| إجمالي | ٣٦.٥٦ | 100 | ٤٥٦ | ٣٦.٥٦ | 100 | ٤٥٦ | ٣٦.٥٦ | 100 | ٤٥٦ | ٣٦.٥٦ | 100 | ٤٥٦ |
| فصول | سargodha 1990 | سرغودها 2000 | سargodha 2010 | سargodha 2020 | ||||||||
|
|
% | لا نقاط |
|
% | لا نقاط |
|
% | لا نقاط |
|
% | لا نقاط | |
| ماء | 0.84 | 1.47 | ١٣٠ | 1.55 | 2.07 | 130 | ٢.٢١ | 3.84 | ١٣٠ | 1.69 | 1.32 | ١٣٠ |
| مبني | 7.31 | 12.69 | ٢٥ | 0.43 | 0.57 | ٢٥ | 3.88 | 6.73 | 25 | 10.29 | 8.05 | ٢٥ |
| نباتات | ٣٩.٣٩ | 68.38 | ١١٠ | 69.94 | 93.73 | ١١٠ | ٣٧.٠٣ | ٦٤.٢٩ | ١١٠ | 44.87 | ٣٥.٠٨ | ١١٠ |
| أرض قاحلة | 10.06 | 17.46 | 27 | 2.71 | 3.63 | 27 | ١٤.٤٨ | ٢٥.١٥ | 27 | 9.25 | 7.23 | 27 |
| صفر | 0 | 0 | 164 | 0 | 0 | 164 | 0 | 0 | 164 | 0 | ٤٨.٣٢ | 164 |
| إجمالي | ٥٧.٦ | 100 | ٤٥٦ | ٧٤.٦٢ | 100 | ٤٥٦ | 57.6 | 100 | ٤٥٦ | 66.1 | 100 | ٤٥٦ |
ديناميات تغيير استخدام الأراضي وتغطية الأرض
| منطقة ملتان
|
|||||
| توجيه | 1990 | ٢٠٠٠ | 2010 | ٢٠٢٠ | ٢٠٣٠ |
| ن | ٦ | ٦ | ٧ | ٧ | 14 |
| لا | 9 | 9 | ٨ | 10 | 19 |
| E | 52 | 70 | 93 | ١٠٥ | 114 |
| SE | 26 | 23 | ١٠٥ | 245 | ٢٨٣ |
| S | 12 | 9 | ١٣ | 151 | 152 |
| SW | ٢٩ | 32 | 64 | 158 | ٢٢٣ |
| W | ٣٣ | 73 | 94 | 161 | 199 |
| NW | 68 | 60 | 84 | ١٧٩ | 159 |
| منطقة سارجودها
|
|||||
| توجيه | 1990 | ٢٠٠٠ | 2010 | ٢٠٢٠ | ٢٠٣٠ |
| ن | 19 | 81 | ١٠٢ | 128 | 152 |
| لا | 40 | 99 | ١١٥ | 216 | 248 |
| E | ٣٢ | 77 | ١٢٠ | 169 | 187 |
| SE | 19 | 41 | 93 | 131 | ١٤٥ |
| S | 11 | ٢٨ | 62 | ٥٨ | 66 |
| SW | 14 | ٣٥ | ٥٦ | 84 | ١٠٦ |
| و | 21 | ٣٨ | ٥٥ | ٤٩ | 96 |
| NW | 30 | 52 | 77 | 67 | 99 |
توجهات وأنماط النمو الحضري
1990-2000: هيمنت عليها التوسع الشرقي والغربي
2000-2010: ظهور نمو قوي في الجنوب الشرقي
2010-2020: نمو متعدد الاتجاهات مع هيمنة جنوب شرق
أظهرت سارجودها نمط نمو متوازن أكثر، مع توسع كبير في اتجاهات متعددة. أظهر القطاع الشمالي الشرقي أكبر نمو دراماتيكي، حيث زاد من
| منطقة حضرية |
|
|
|
|
|
| ملتان | ٢٤٠.٥٥ | ٣٩٧.٥٠ | 544.40 | ٤٤٠.٣٠ | ٤٣٣.٢٢ |
| سargodha | 730.91 | ٥٦٣.٦٢ | ٣٨٧.٦٥ | ١٠٢٩.٠٦ | ١٤٠٤.٩٧ |
سيناريوهات النمو الحضري المستقبلي
نقاش
ديناميات الزمنية للنمو الحضري
أنماط تحويل استخدام الأراضي
آثار النمو الاتجاهي والتخطيط المكاني
الآثار البيئية والزراعية
رؤى منهجية وتطبيقات التخطيط
تداعيات التخطيط والسياسة
التحديات والفرص المستقبلية
قيود البحث والاتجاهات المستقبلية
الاستنتاجات
في هذه المناطق التي تتطور بسرعة. سيوفر دمج هذه العوامل الإضافية رؤى أكثر شمولاً لتخطيط التنمية الحضرية المستدامة، مما يساعد على ضمان استدامة كل من الأنظمة الحضرية والزراعية في المشهد المتطور في باكستان.
توفر البيانات
تاريخ الاستلام: 1 يوليو 2024؛ تاريخ القبول: 25 فبراير 2025
نُشر على الإنترنت: 27 فبراير 2025
References
- Asif, M. et al. Modelling of land use and land cover changes and prediction using CA-Markov and Random Forest. Geocarto Int. 38, (2023).
- Asif, M., Kazmi, J. H. & Tariq, A. Traditional ecological knowledge based indicators for monitoring rangeland conditions in Thal and Cholistan Desert, Pakistan. Environ. Challenges 13, 100754 (2023).
- Bokhari, R. et al. Land subsidence analysis using synthetic aperture radar data. Heliyon vol. 9 at https://doi.org/10.1016/j.heliyon. 2023.e14690 (2023).
- Zhao, Z. et al. Comparison of three machine learning algorithms using google earth engine for land use land cover classification. Rangel. Ecol. Manag. 92, 129-137 (2024).
- Tariq, A. & Mumtaz, F. Modeling spatio-temporal assessment of land use land cover of Lahore and its impact on land surface temperature using multi-spectral remote sensing data. Environ. Sci. Pollut. Res. 30, 23908-23924 (2022).
- Barboza, E. et al. Analyzing urban expansion and land use dynamics in Bagua grande and chachapoyas using cloud computing and predictive modeling. Earth Syst. Environ. https://doi.org/10.1007/s41748-024-00470-5 (2024).
- Ullah, N. et al. Geospatial analysis and AHP for flood risk mapping in Quetta, Pakistan: A tool for disaster management and mitigation. Appl. Water Sci. 14, 236 (2024).
- Tariq, A. & Qin, S. Spatio-temporal variation in surface water in Punjab, Pakistan from 1985 to 2020 using machine-learning methods with time-series remote sensing data and driving factors. Agric. Water Manag. 280, 108228 (2023).
- Hao, Z. et al. Multitemporal analysis of urbanization-driven slope and ecological impact using machine-learning and remote sensing techniques. IEEE J. Sel. Top. Appl. Earth Obs. Remote Sens. 18, 1876-1895 (2025).
- Aslam, R. W., Shu, H. & Yaseen, A. Monitoring the population change and urban growth of four major Pakistan cities through spatial analysis of open source data. Ann. GIS 1-13 (2023) https://doi.org/10.1080/19475683.2023.2166989.
- Aslam, R. W. et al. Monitoring landuse change in Uchhali and Khabeki wetland lakes, Pakistan using remote sensing data. Gondwana Res. 129, 252-267 (2024).
- Gulshad, K., Szydłowski, M., Yaseen, A. & Aslam, R. W. A comparative analysis of methods and tools for low impact development (LID) site selection. J. Environ. Manage. 354, 120212 (2024).
- Wang, N. et al. Spatio-temporal dynamics of rangeland transformation using machine learning algorithms and remote sensing data. Rangel. Ecol. Manag. 94, 106-118 (2024).
- Aslam, R. W., Shu, H., Yaseen, A., Sajjad, A. & Abidin, S. Z. U. Identification of time-varying wetlands neglected in Pakistan through remote sensing techniques. Environ. Sci. Pollut. Res. 30, 74031-74044. https://doi.org/10.1007/s11356-023-27554-5 (2023).
- Aslam, R. W. et al. Wetland identification through remote sensing: Insights into wetness, greenness, turbidity, temperature, and changing landscapes. Big Data Res. 100416 (2023) https://doi.org/10.1016/j.bdr.2023.100416.
- Naz, I., Ahmad, I., Aslam, R. W., Quddoos, A. & Yaseen, A. Integrated assessment and geostatistical evaluation of groundwater quality through water quality indices. Water 16, 63 (2023).
- Lingye, T. et al. Assessment of urban environmental quality by socioeconomic and environmental variables using open-source datasets. Trans. GIS https://doi.org/10.1111/tgis. 13250 (2024).
- Aslam, R. W., Naz, I., Shu, H., Yan, J. & Tariq, A. Multi-temporal image analysis of wetland dynamics using machine learning algorithms. J. Environ. Manage. 370, 122490 (2024).
- Aslam, R. W. et al. Machine learning-based wetland vulnerability assessment in the sindh province ramsar site using remote sensing data. Remote Sens. 16, 928 (2024).
- Chaoyong, W. et al. SAR image integration for multi-temporal analysis of Lake Manchar Wetland dynamics using machine learning. Sci. Rep. 14, 26669 (2024).
- Quddoos, A., Muhmood, K., Naz, I., Aslam, R. W. & Usman, S. Y. Geospatial insights into groundwater contamination from urban and industrial effluents in Faisalabad. Discov. Water 4, 50 (2024).
- Feng, L. et al. Exploring rangeland dynamics in Punjab, Pakistan: Integrating LULC, LST, and remote sensing for ecosystem analysis (2000-2020). Rangel. Ecol. Manag. https://doi.org/10.1016/j.rama.2024.09.008 (2024).
- Naz, I. et al. Integrated geospatial and geostatistical multi-criteria evaluation of urban groundwater quality using water quality indices. Water 16, 2549 (2024).
- Tariq, A. & Shu, H. CA-Markov chain analysis of seasonal land surface temperature and land use landcover change using optical multi-temporal satellite data of Faisalabad, Pakistan. Remote Sens. 12, 1-23. https://doi.org/10.3390/rs12203402 (2020).
- Singh, S. & Rai, P. K. Application of earth observation data for estimation of changes in land trajectories in Varanasi District, India. J. Landsc. Ecol. Republic) 11, 5-18 (2018).
- Mohiuddin, G. & Mund, J.-P. Spatiotemporal analysis of land surface temperature in response to land use and land cover changes: A remote sensing approach. Remote Sens. 16, 1286 (2024).
- Tariq, A., Shu, H., Siddiqui, S., Imran, M. & Farhan, M. Monitoring land use and land cover changes using geospatial techniques, a case study of Fateh Jang, Attock, Pakistan. Geogr. Environ. Sustain. 14, 41-52. https://doi.org/10.24057/2071-9388-2020-117 (2021).
- Tan, J., Yu, D., Li, Q., Tan, X. & Zhou, W. Spatial relationship between land-use/land-cover change and land surface temperature in the Dongting Lake area, China. Sci. Rep. 10, 9245 (2020).
- Maskooni, E. K., Naghibi, S. A., Hashemi, H. & Berndtsson, R. Application of advanced machine learning algorithms to assess groundwater potential using remote sensing-derived data. Remote Sens. 12, 2742 (2020).
- Luo, M. et al. Improving forest above-ground biomass estimation by integrating individual machine learning models. Forests 15, 975 (2024).
- Wang, M. et al. Annual wetland mapping in metropolis by temporal sample migration and random forest classification with time series landsat data and google earth engine. Remote Sens. 14, 3191 (2022).
- Cutler, R. et al. Random forests for classification in ecology. Ecology 88(11), 2783-2792 (2007).
- Arshad, A., Mirchi, A., Vilcaez, J., Umar Akbar, M. & Madani, K. Reconstructing high-resolution groundwater level data using a hybrid random forest model to quantify distributed groundwater changes in the Indus Basin. J. Hydrol. 628 (2024).
- Lu, L. et al. Spatiotemporal variation of surface urban heat islands in relation to land cover composition and configuration: A multi-scale case study of Xi’an, China. Remote Sens. 12, 2713 (2020).
- Zhang, X. et al. Analysis on decoupling between urbanization level and urbanization quality in China. Sustainability 12, 6835 (2020).
- Faichia, C. et al. Using RS data-based CA-Markov model for dynamic simulation of historical and future LUCC in vientiane, Laos. Sustainability 12, 8410 (2020).
- Rwanga, S. S. & Ndambuki, J. M. Accuracy assessment of land use/land cover classification using remote sensing and GIS. Int. J. Geosci. 08, 611-622 (2017).
- Mahboob, M. A., Atif, I. & Iqbal, J. Remote sensing and GIS applications for assessment of urban sprawl in Karachi, Pakistan. Sci. Technol. Dev. 34, 179-188 (2017).
- Fang, Y. et al. Assessment of the hydrodynamics role for groundwater quality using an integration of GIS, water quality index and multivariate statistical techniques. J. Environ. Manage. 273, 111185 (2020).
- Ullah, H. et al. Geo-spatial analysis and modelling of water borne diseases in District Multan. J. Biodivers. Environ. Sci. 12, 1-15 (2021).
- Defries, R. S. & Townshend, J. R. Ndvi-derived land cover classifications at a global scale. Int. J. Remote Sens. 15, 3567-3586 (1994).
- Huete, A. A soil-adjusted vegetation index (SAVI). Remote Sens. Environ. 25, 295-309 (1988).
- Rocha, A. V. & Shaver, G. R. Advantages of a two band EVI calculated from solar and photosynthetically active radiation fluxes. Agric. For. Meteorol. 149, 1560-1563 (2009).
- Xu, H. Modification of normalised difference water index (NDWI) to enhance open water features in remotely sensed imagery. Int. J. Remote Sens. 27, 3025-3033 (2006).
- Belgiu, M. & Drăguț, L. Random forest in remote sensing: A review of applications and future directions. ISPRS J. Photogramm. Remote Sens. 114, 24-31 (2016).
- Prasad, A. M., Iverson, L. R. & Liaw, A. Newer classification and regression tree techniques: Bagging and random forests for ecological prediction. Ecosystems 9, 181-199 (2006).
- Ullah, S., Qiao, X. & Tariq, A. Impact assessment of planned and unplanned urbanization on land surface temperature in Afghanistan using machine learning algorithms: A path toward sustainability. Sci. Rep. 15, 3092 (2025).
- Ullah, S., Qiao, X. & Abbas, M. Addressing the impact of land use land cover changes on land surface temperature using machine learning algorithms. Sci. Rep. 14, 18746 (2024).
- Ullah, S., Abbas, M. & Qiao, X. Impact assessment of land-use alteration on land surface temperature in Kabul using machine learning algorithm. J. Spat. Sci. 1-23 (2024) https://doi.org/10.1080/14498596.2024.2364283.
- Sayemuzzaman, M. & Jha, M. K. Modeling of future land cover land use change in North Carolina using Markov chain and cellular automata model. Am. J. Eng. Appl. Sci. 7, 295-306 (2014).
- Farhan, M. et al. Predicting land use land cover dynamics and land surface temperature changes using CA-Markov-Chain models in Islamabad, Pakistan (1992-2042). IEEE J. Sel. Top. Appl. Earth Obs. Remote Sens. 1-18 (2024).
- Mohamed, A. & Worku, H. Simulating urban land use and cover dynamics using cellular automata and Markov chain approach in Addis Ababa and the surrounding. Urban Clim. 31, 100545 (2020).
- Abdul Rahaman, S., Aruchamy, S., Balasubramani, K. & Jegankumar, R. Land use/land cover changes in semi-arid mountain landscape in Southern India: A geoinformatics based Markov chain approach. Int. Arch. Photogramm. Remote Sens. Spat. Inf. Sci. – ISPRS Arch. 42, 231-237 (2017).
- Ullah, S., Khan, M. & Qiao, X. Examining the impact of land use and land cover changes on land surface temperature in Herat city using machine learning algorithms. GeoJournal 89, 225 (2024).
- Sang, L., Zhang, C., Yang, J., Zhu, D. & Yun, W. Simulation of land use spatial pattern of towns and villages based on CA-Markov model. Math. Comput. Model. 54, 938-943 (2011).
- Farhan, M. et al. Predicting land use land cover dynamics and land surface Temperature changes using CA-Markov-chain models in Islamabad, Pakistan (1992-2042). IEEE J. Sel. Top. Appl. Earth Obs. Remote Sens. 17, 16255-16271 (2024).
- Shirazi, S. A. & Kazmi, S. J. H. Analysis of population growth and urban development in Lahore-Pakistan using geospatial techniques: Suggesting some future options. South Asian Stud. 29, 269-280 (2014).
- Waseem, M., Mutahir Ullah Ghazi, S., Ahmed, N., Ayaan, M. & Kebede Leta, M. Rainwater harvesting as sustainable solution to cope with drinking water scarcity and urban flooding: A case study of public institutions in Lahore, Pakistan. CivilEng 4, 638-656 (2023).
- Khan, M. K., Naeem, K., Huo, C. & Hussain, Z. The nexus between vegetation, urban air quality, and public health: An empirical study of Lahore. Front. Public Heal. 10, 1-21 (2022).
- Khanum, F., Chaudhry, M. N. & Kumar, P. Characterization of five-year observation data of fine particulate matter in the metropolitan area of Lahore. Air Qual. Atmos. Heal. 10, 725-736 (2017).
- Riaz, O., Ghaffar, A. & Butt, I. Modelling Land use Patterns of Lahore (Pakistan) using remote sensing and GIS. Glob. J. Sci. Front. Res. H Environ. Earth Sci. 14, 24-30 (2014).
- Iram, A., Rasool, L., Shahzad, F. & Saeed, Y. Impact of urban sprawl on public health: An analysis of Lahore-Pakistan. World Appl. Sci. J. 20, 80-86 (2012).
- Zia, S. M., Shirazi, S. A. & Alam, R. Temporal analysis of temperature trends in the metropolitan area of Lahore, Pakistan. Pak. J. Sci. 66, 83-88 (2014).
- Jabeen, F., Ali, Z. & Maharjan, A. Assessing health impacts of winter smog in lahore for exposed occupational groups. Atmosphere (Basel). 12, 1-14 (2021).
- Mahmood, K. et al. Groundwater Levels Susceptibility To Degradation in Lahore Metropolitan. Depression 25, 123-126 (2000).
- Muhammad, A. M., Zhonghua, T., Dawood, A. S. & Earl, B. Evaluation of local groundwater vulnerability based on DRASTIC index method in Lahore, Pakistan. Geofísica Int. 54, 67-81 (2015).
- Ali, M. et al. A study of aerosol properties over Lahore (Pakistan) by using AERONET data. Asia-Pacific J. Atmos. Sci. 50, 153-162 (2014).
- Jiang, Z. & Xu, C. Policy incentives, government subsidies, and technological innovation in new energy vehicle enterprises: Evidence from China. Energy Policy 177, 113527 (2023).
- Arima, E. Y., Simmons, C. S., Walker, R. T. & Cochrane, M. A. Fire in the Brazilian Amazon: A spatially explicit model for policy impact analysis. J. Reg. Sci. 47, 541-567 (2007).
الشكر والتقدير
مساهمات المؤلفين
الإعلانات
المصالح المتنافسة
البرمجيات
معلومات إضافية
معلومات إعادة الطبع والتصاريح متاحة على www.nature.com/reprints.
ملاحظة الناشر تظل Springer Nature محايدة فيما يتعلق بالمطالبات القضائية في الخرائط المنشورة والانتماءات المؤسسية.
© المؤلفون 2025
كلية الفيزياء وهندسة المعلومات، جامعة فوزهو، فوزهو 350116، الصين. قسم الحياة البرية، مصايد الأسماك وتربية الأحياء المائية، كلية موارد الغابات، جامعة ولاية ميسيسيبي، ستاركفيل، MS 39762-9690، الولايات المتحدة الأمريكية. المختبر الوطني الرئيسي للهندسة المعلوماتية في المسح، ورسم الخرائط والاستشعار عن بعد (LIESMARS)، جامعة ووهان، ووهان 430079، الصين. معهد البحث من أجل التنمية المستدامة في سيخا دي سيلفا (INDES-CES)، جامعة توريبيو رودريغيز دي ميندوزا في الأمازون، تشاتشابوياس 01001، بيرو. قسم موارد المياه والهندسة البيئية، جامعة نانغرهار، نانغرهار 2600، أفغانستان. قسم هندسة البرمجيات، كلية علوم الحاسوب والمعلومات، جامعة الملك سعود، 11543 الرياض، المملكة العربية السعودية. البريد الإلكتروني: at2139@msstate.edu; Sajidjalwan@gmail.com
DOI: https://doi.org/10.1038/s41598-025-92034-4
PMID: https://pubmed.ncbi.nlm.nih.gov/40016446
Publication Date: 2025-02-27
OPEN
Spatio-temporal analysis of urban expansion and land use dynamics using google earth engine and predictive models
Abstract
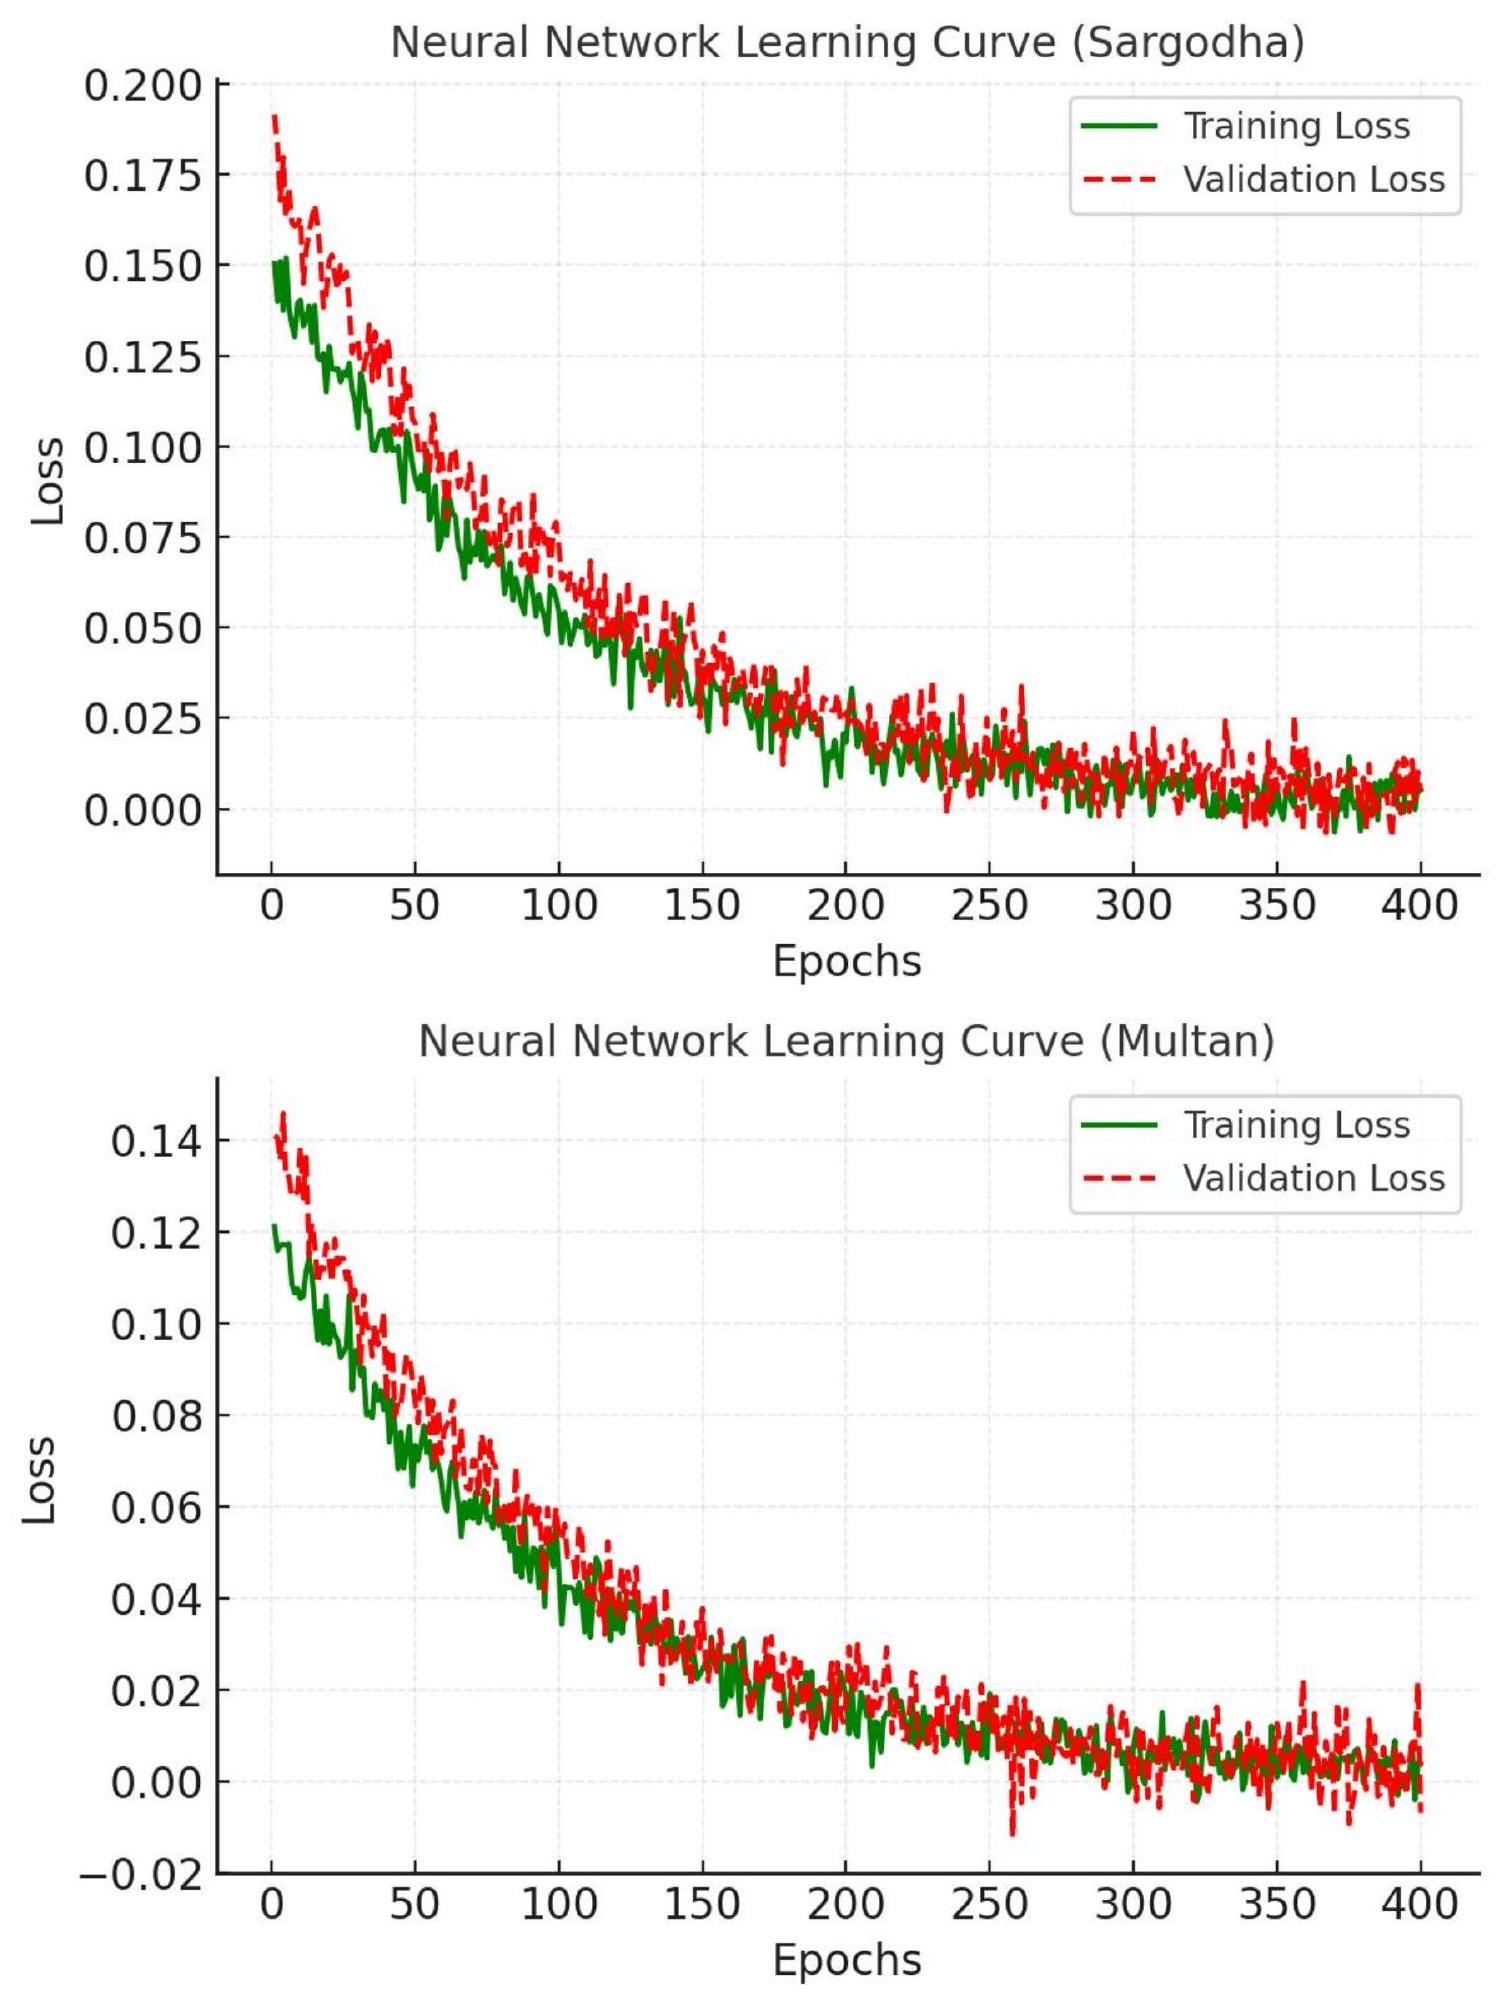
Urban expansion and changes in land use/land cover (LULC) have intensified in recent decades due to human activity, influencing ecological and developmental landscapes. This study investigated historical and projected LULC changes and urban growth patterns in the districts of Multan and Sargodha, Pakistan, using Landsat satellite imagery, cloud computing, and predictive modelling from 1990 to 2030. The analysis of satellite images was grouped into four time periods (1990-2000, 2000-2010, 2010-2020, and 2020-2030). The Google Earth Engine cloud-based platform facilitated the classification of Landsat 5 ETM (1990, 2000, and 2010) and Landsat 8 OLI (2020) images using the Random Forest model. A simulation model integrating Cellular Automata and an Artificial Neural Network Multilayer Perceptron in the MOLUSCE plugin of QGIS was employed to forecast urban growth to 2030. The resulting maps showed consistently high accuracy levels exceeding
Global urbanization has reached unprecedented levels, with the world’s urban population surpassing 4.7 billion in 2023 and projected to increase by an additional 2.8 billion by 2050. This rapid urban growth is particularly pronounced in developing nations like Pakistan, where cities are expanding at an extraordinary pace due to rural-urban migration, natural population growth, and economic development
Materials and methods
Study area
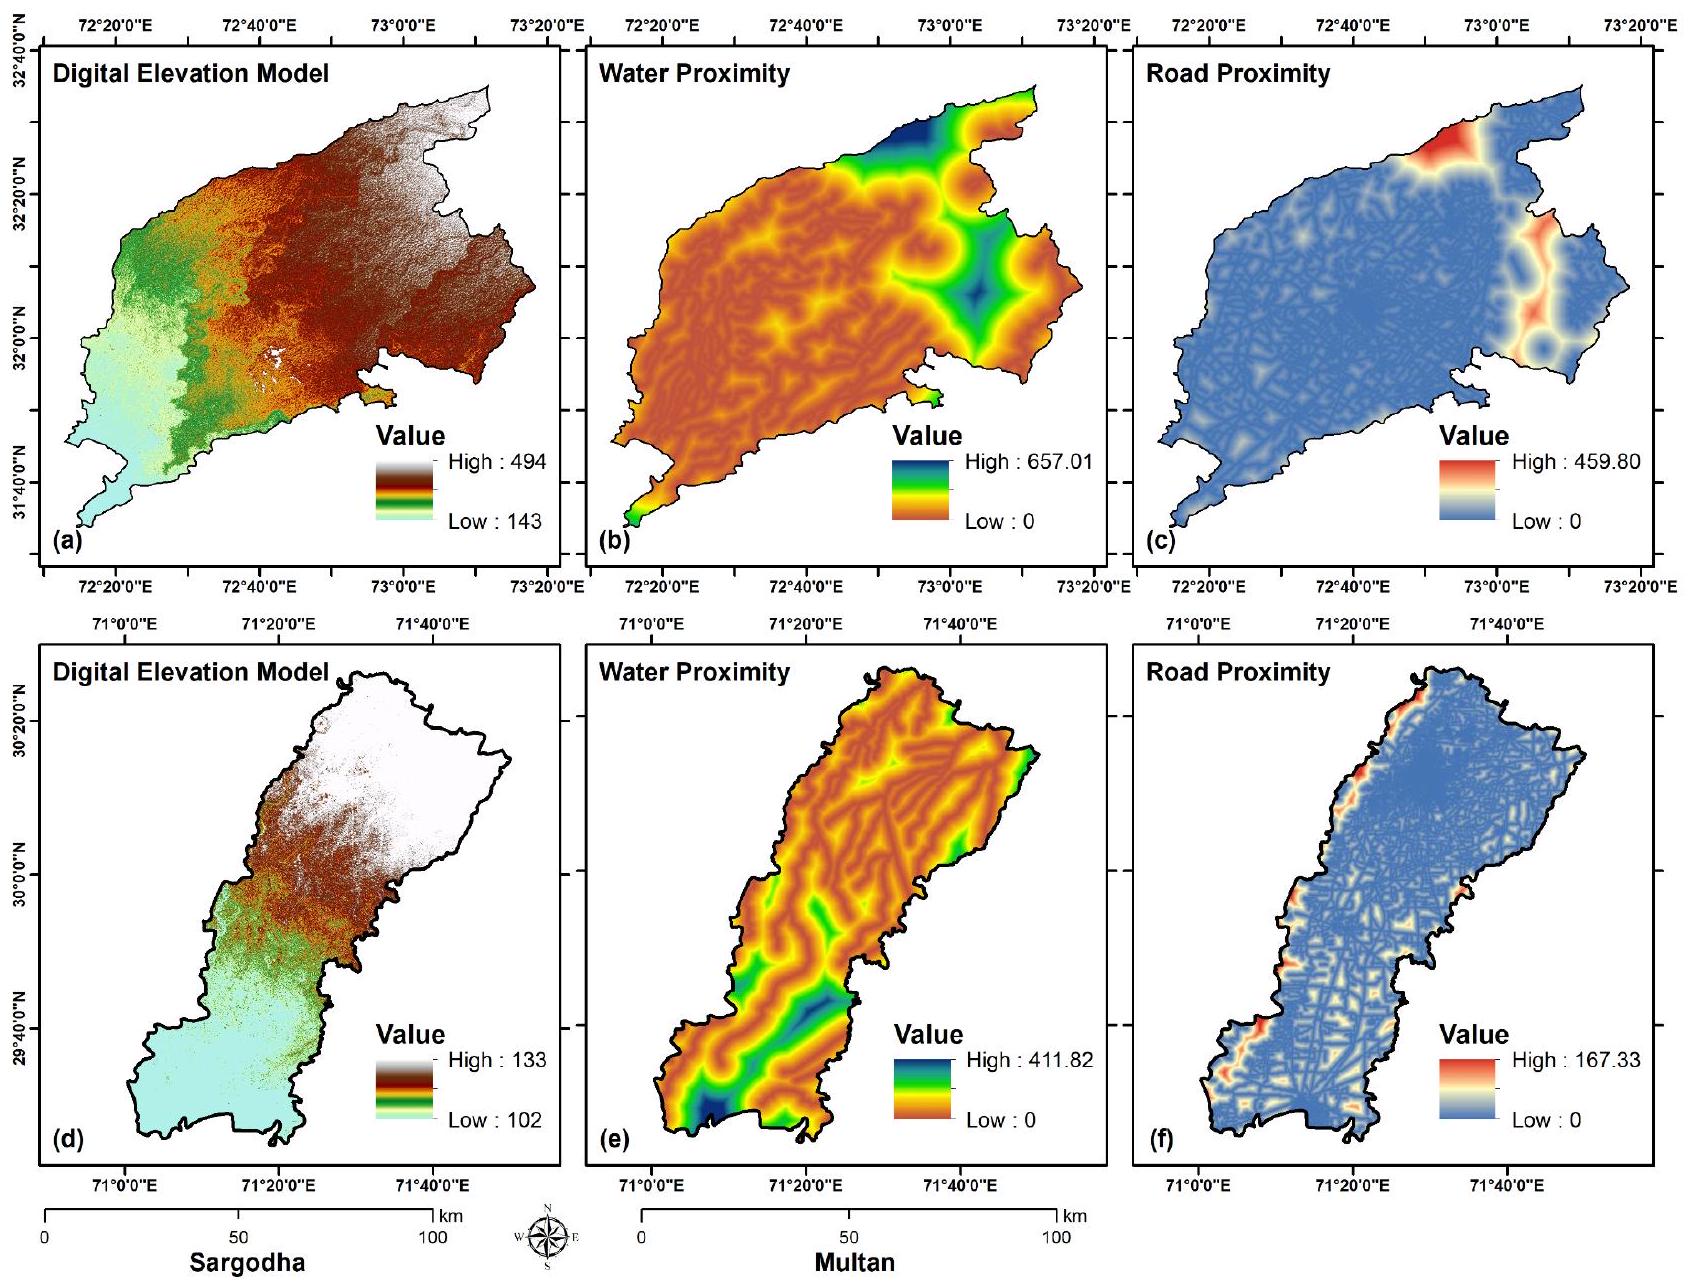
Software and spatial data
| Satellite Indices | Abbreviations | Equations | References |
| Normalized Difference Vegetation Index | NDVI |
|
41 |
| Soil Adjusted Vegetation Index | SAVI |
|
42 |
| Enhanced Vegetation Index | EVI |
|
42,43 |
| Modified Normalized Difference Water Index | MNDWI |
|
44 |
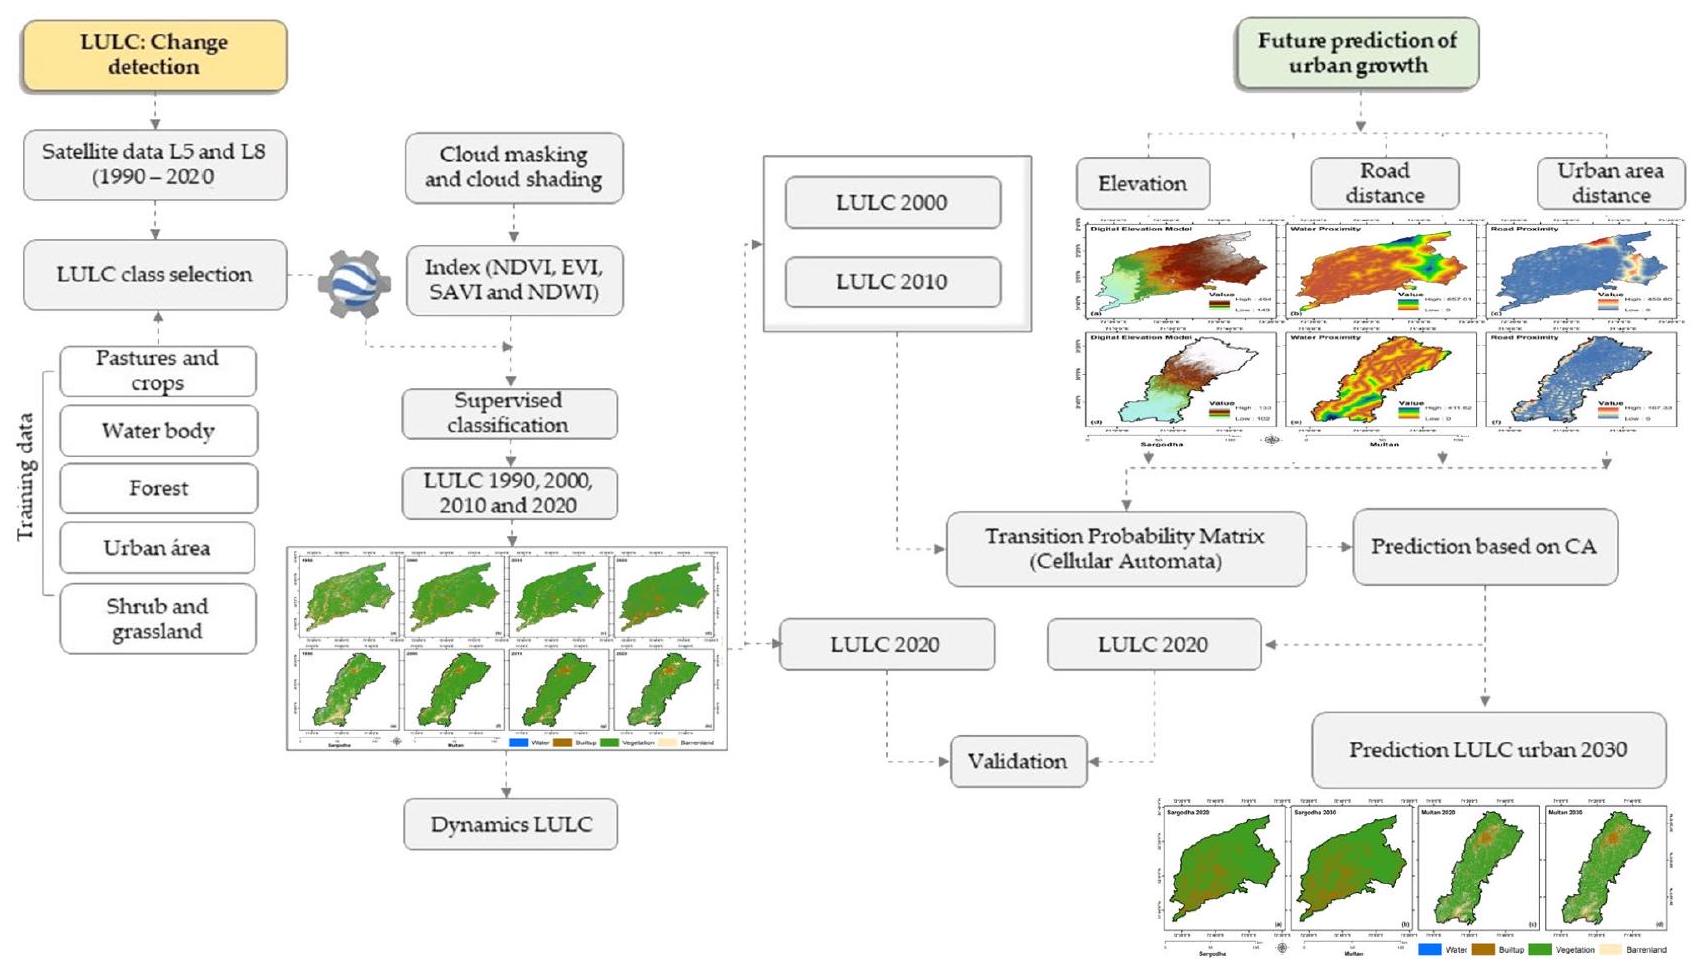
Methodological processing
Classification of vegetation land use and land cover
Initial preprocessing began with compiling training areas for each LULC class within the study regions. Five distinct classes were identified and ground-truthed using GPS receivers: (i) agricultural land (including cropland and orchards), (ii) water bodies, (iii) built-up area, (iv) barren land, and (v) vegetation cover. Satellite imagery processing was conducted in GEE, utilizing Landsat 5 collections (ID: LANDSAT/LT05/C01/T1_SR) for historical data (1990, 2000, and 2010) and Landsat 8 (ID: LANDSAT/LC08/C01/T1_SR) for 2020. Image selection prioritized scenes with minimal cloud cover and optimal seasonal timing for land cover discrimination. Cloud masking was implemented using the C Function of Mask (CFMask) algorithm to remove cloud contamination and shadows. To enhance classification accuracy, four vegetation indices were calculated:
Vegetation indices calculation
These indices were incorporated into the classification process to improve discrimination between different land cover types, particularly between built-up areas and bare soil and between various vegetation types.
Random forest (RF) classification
Land use land cover change dynamics
Modeling of future urban growth scenarios
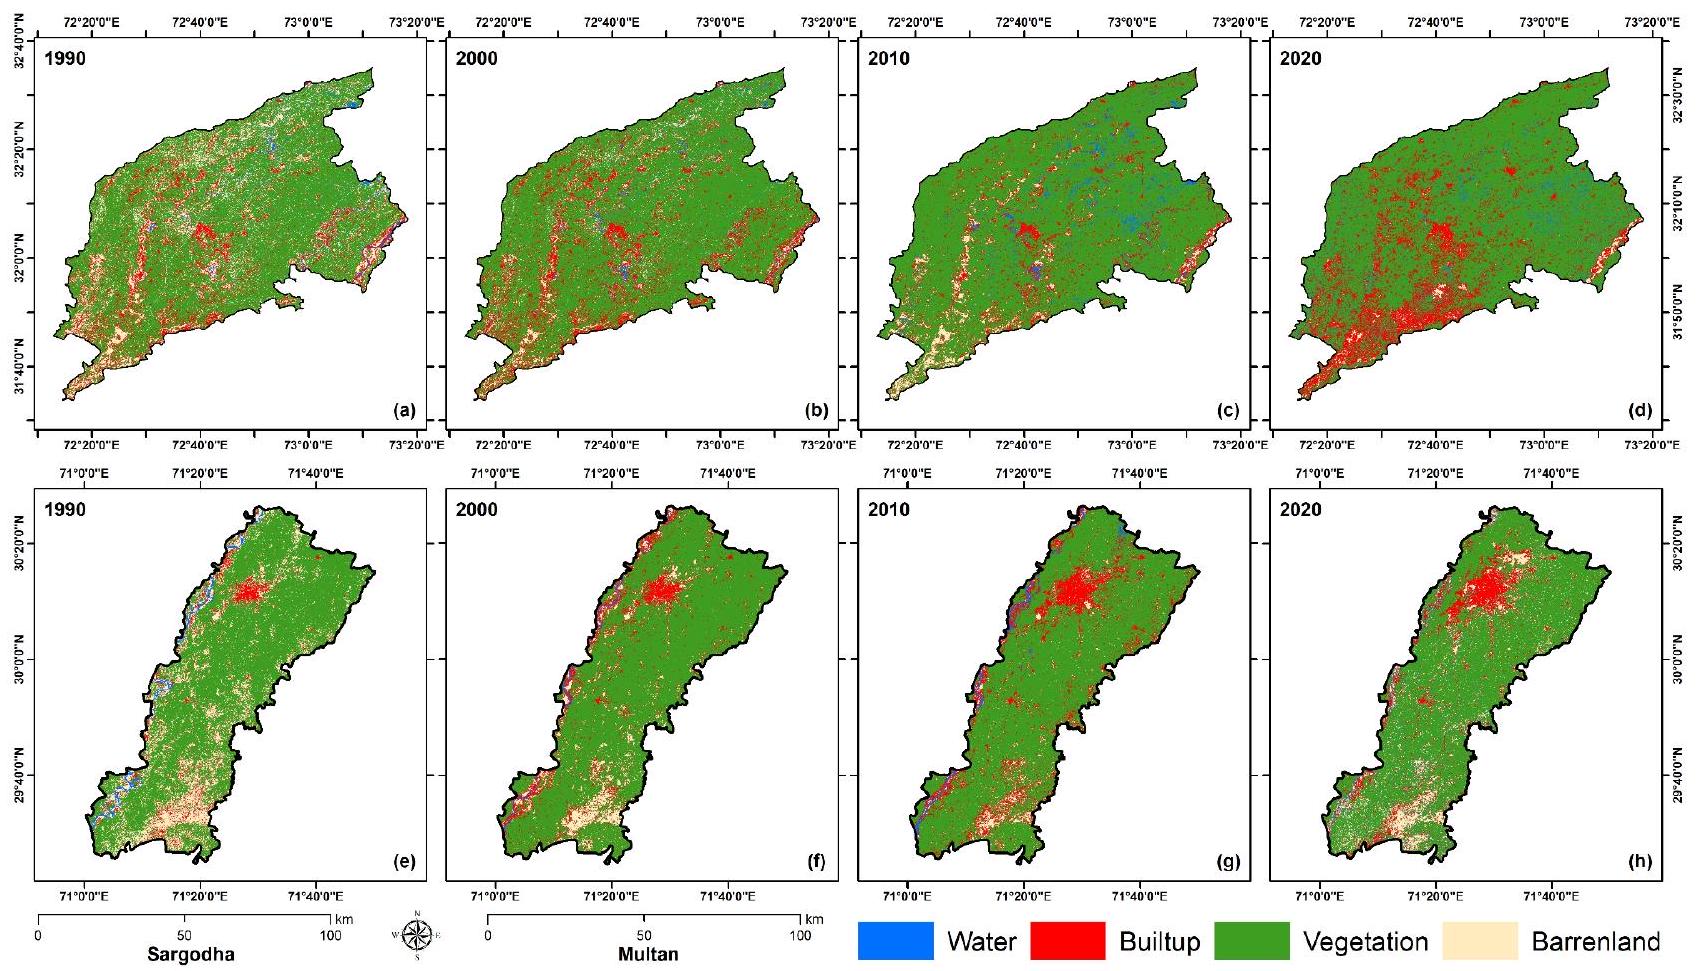
Results
Land use and land cover classification
| LULC | 1990 | 2000 | 2010 | 2020 | ||||
| Area
|
(%) | Area
|
(%) | Area
|
(%) | Area
|
(%) | |
| Multan | ||||||||
| Water | 60.01 | 1.64 | 25.25 | 0.69 | 53.34 | 1.46 | 91.29 | 2.5 |
| Builtup | 240.5576 | 6.58 | 397.5034 | 10.87 | 544.4061 | 14.89 | 440.3033 | 12.04 |
| Vegetation | 2,596.50 | 71.02 | 2,930.16 | 80.15 | 2,901.02 | 79.35 | 2,717.61 | 74.34 |
| Barren Land | 758.7097 | 20.75 | 302.919 | 8.29 | 157.0504 | 4.3 | 406.62 | 11.12 |
| Total | 3,655.78 | 100 | 3,655.84 | 100 | 3,655.82 | 100 | 3,655.83 | 100 |
| Sargodha | ||||||||
| Water | 84.49 | 1.47 | 154.78 | 2.68 | 220.95 | 3.84 | 169.41 | 2.94 |
| Builtup | 730.91 | 12.69 | 563.6298 | 9.78 | 387.6507 | 6.73 | 1029.067 | 17.83 |
| Vegetation | 3,938.68 | 68.38 | 4,776.63 | 82.85 | 3,703.09 | 64.29 | 4,486.78 | 77.74 |
| Barren Land | 1,005.50 | 17.46 | 270.5426 | 4.69 | 1448.436 | 25.15 | 86.61585 | 1.5 |
| Total | 5,759.58 | 100 | 5,765.58 | 100 | 5,760.12 | 100 | 5,771.88 | 100 |
| Cities | Accuracy |
|
|
|
|
| Sargodha | OA | 0.95 | 0.97 | 0.88 | 0.95 |
| K | 0.93 | 0.82 | 0.95 | 0.93 | |
| Multan | OA | 0.97 | 0.93 | 0.96 | 0.94 |
| K | 0.95 | 0.89 | 0.93 | 0.91 |
| Transformation to urban area | Area
|
|||
| 1990-2000 | 2000-2010 | 2000-2020 | 2020-2030 | |
| Multan | ||||
| Water to built-up | 16.94 | 22.29 | 13.10 | 10.00 |
| Built-up (no change) | 200.48 | 276.9 | 471.29 | 1,105.40 |
| Veg to built-up | 131.80 | 167.69 | 541.40 | 170.85 |
| Barren to built-up | 56.36 | 38.70 | 130.03 | 173.00 |
| Total | 405.58 | 505.58 | 1155.82 | 1459.25 |
| Sargodha | ||||
| Water to built-up | 10.10 | 72.70 | 15.90 | 8.30 |
| Built-up (no change) | 172.06 | 337.98 | 496.72 | 871.98 |
| Veg to built-up | 78.87 | 124.96 | 792.70 | 211.98 |
| Barren to built-up | 37.91 | 34.27 | 280.60 | 45.79 |
| Total | 298.94 | 569.91 | 1585.92 | 1138.05 |
| Classes | Multan 1990 | Multan 2000 | Multan 2010 | Multan 2020 | ||||||||
|
|
% | No points |
|
% | No points |
|
% | No points |
|
% | No. points | |
| Water | 0.6 | 1.64 | 145 | 0.25 | 0.69 | 145 | 0.53 | 1.46 | 145 | 0.91 | 2.5 | 145 |
| Builtup | 2.41 | 6.58 | 16 | 3.98 | 10.87 | 16 | 5.44 | 14.89 | 16 | 4.4 | 12.04 | 16 |
| Vegetation | 25.97 | 71.02 | 150 | 29.3 | 80.15 | 150 | 29.01 | 79.35 | 150 | 27.18 | 74.34 | 150 |
| Barren Land | 7.59 | 20.75 | 22 | 3.03 | 8.29 | 22 | 1.57 | 4.3 | 22 | 4.07 | 11.12 | 22 |
| Zero | 0 | 0 | 123 | 0 | 0 | 123 | 0 | 0 | 123 | 0 | 0 | 123 |
| Total | 36.56 | 100 | 456 | 36.56 | 100 | 456 | 36.56 | 100 | 456 | 36.56 | 100 | 456 |
| Classes | Sargodha 1990 | Sargodha 2000 | Sargodha 2010 | Sargodha 2020 | ||||||||
|
|
% | No points |
|
% | No points |
|
% | No points |
|
% | No points | |
| Water | 0.84 | 1.47 | 130 | 1.55 | 2.07 | 130 | 2.21 | 3.84 | 130 | 1.69 | 1.32 | 130 |
| Builtup | 7.31 | 12.69 | 25 | 0.43 | 0.57 | 25 | 3.88 | 6.73 | 25 | 10.29 | 8.05 | 25 |
| Vegetation | 39.39 | 68.38 | 110 | 69.94 | 93.73 | 110 | 37.03 | 64.29 | 110 | 44.87 | 35.08 | 110 |
| Barren Land | 10.06 | 17.46 | 27 | 2.71 | 3.63 | 27 | 14.48 | 25.15 | 27 | 9.25 | 7.23 | 27 |
| Zero | 0 | 0 | 164 | 0 | 0 | 164 | 0 | 0 | 164 | 0 | 48.32 | 164 |
| Total | 57.6 | 100 | 456 | 74.62 | 100 | 456 | 57.6 | 100 | 456 | 66.1 | 100 | 456 |
Land use and land cover change dynamics
| Multan area
|
|||||
| Orientation | 1990 | 2000 | 2010 | 2020 | 2030 |
| N | 6 | 6 | 7 | 7 | 14 |
| NE | 9 | 9 | 8 | 10 | 19 |
| E | 52 | 70 | 93 | 105 | 114 |
| SE | 26 | 23 | 105 | 245 | 283 |
| S | 12 | 9 | 13 | 151 | 152 |
| SW | 29 | 32 | 64 | 158 | 223 |
| W | 33 | 73 | 94 | 161 | 199 |
| NW | 68 | 60 | 84 | 179 | 159 |
| Sargodha area
|
|||||
| Orientation | 1990 | 2000 | 2010 | 2020 | 2030 |
| N | 19 | 81 | 102 | 128 | 152 |
| NE | 40 | 99 | 115 | 216 | 248 |
| E | 32 | 77 | 120 | 169 | 187 |
| SE | 19 | 41 | 93 | 131 | 145 |
| S | 11 | 28 | 62 | 58 | 66 |
| SW | 14 | 35 | 56 | 84 | 106 |
| W | 21 | 38 | 55 | 49 | 96 |
| NW | 30 | 52 | 77 | 67 | 99 |
Urban growth orientation and patterns
1990-2000: Dominated by eastern and western expansion
2000-2010: Emergence of strong southeastern growth
2010-2020: Multi-directional growth with southeastern dominance
Sargodha exhibited a more balanced directional growth pattern, with significant expansion in multiple directions. The northeastern sector showed the most dramatic growth, increasing from
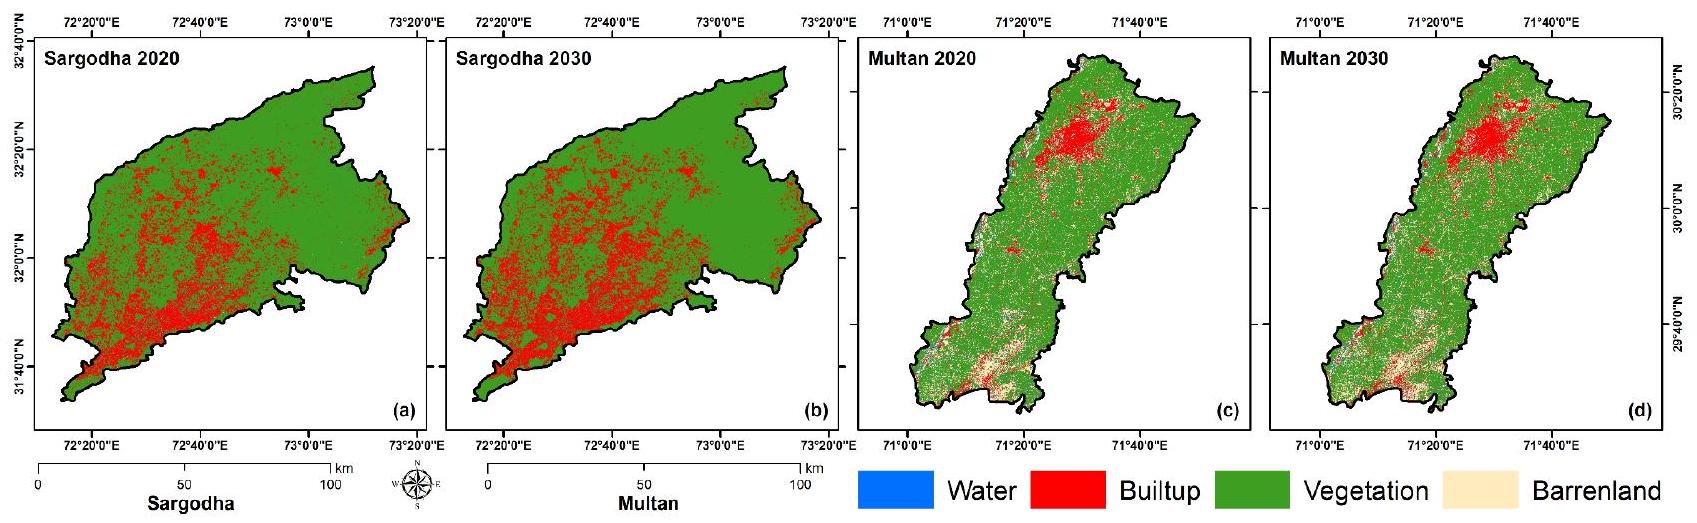
| Urban area |
|
|
|
|
|
| Multan | 240.55 | 397.50 | 544.40 | 440.30 | 433.22 |
| Sargodha | 730.91 | 563.62 | 387.65 | 1029.06 | 1404.97 |
Future urban growth scenarios
Discussion
Temporal dynamics of urban growth
Land use transformation patterns
Directional growth and spatial planning implications
Environmental and agricultural implications
Methodological insights and planning applications
Planning and policy implications
Future challenges and opportunities
Research limitations and future directions
Conclusions
in these rapidly evolving regions. Integrating these additional factors would provide even more comprehensive insights for sustainable urban development planning, helping to ensure the long-term viability of both urban and agricultural systems in Pakistan’s evolving landscape.
Data availability
Received: 1 July 2024; Accepted: 25 February 2025
Published online: 27 February 2025
References
- Asif, M. et al. Modelling of land use and land cover changes and prediction using CA-Markov and Random Forest. Geocarto Int. 38, (2023).
- Asif, M., Kazmi, J. H. & Tariq, A. Traditional ecological knowledge based indicators for monitoring rangeland conditions in Thal and Cholistan Desert, Pakistan. Environ. Challenges 13, 100754 (2023).
- Bokhari, R. et al. Land subsidence analysis using synthetic aperture radar data. Heliyon vol. 9 at https://doi.org/10.1016/j.heliyon. 2023.e14690 (2023).
- Zhao, Z. et al. Comparison of three machine learning algorithms using google earth engine for land use land cover classification. Rangel. Ecol. Manag. 92, 129-137 (2024).
- Tariq, A. & Mumtaz, F. Modeling spatio-temporal assessment of land use land cover of Lahore and its impact on land surface temperature using multi-spectral remote sensing data. Environ. Sci. Pollut. Res. 30, 23908-23924 (2022).
- Barboza, E. et al. Analyzing urban expansion and land use dynamics in Bagua grande and chachapoyas using cloud computing and predictive modeling. Earth Syst. Environ. https://doi.org/10.1007/s41748-024-00470-5 (2024).
- Ullah, N. et al. Geospatial analysis and AHP for flood risk mapping in Quetta, Pakistan: A tool for disaster management and mitigation. Appl. Water Sci. 14, 236 (2024).
- Tariq, A. & Qin, S. Spatio-temporal variation in surface water in Punjab, Pakistan from 1985 to 2020 using machine-learning methods with time-series remote sensing data and driving factors. Agric. Water Manag. 280, 108228 (2023).
- Hao, Z. et al. Multitemporal analysis of urbanization-driven slope and ecological impact using machine-learning and remote sensing techniques. IEEE J. Sel. Top. Appl. Earth Obs. Remote Sens. 18, 1876-1895 (2025).
- Aslam, R. W., Shu, H. & Yaseen, A. Monitoring the population change and urban growth of four major Pakistan cities through spatial analysis of open source data. Ann. GIS 1-13 (2023) https://doi.org/10.1080/19475683.2023.2166989.
- Aslam, R. W. et al. Monitoring landuse change in Uchhali and Khabeki wetland lakes, Pakistan using remote sensing data. Gondwana Res. 129, 252-267 (2024).
- Gulshad, K., Szydłowski, M., Yaseen, A. & Aslam, R. W. A comparative analysis of methods and tools for low impact development (LID) site selection. J. Environ. Manage. 354, 120212 (2024).
- Wang, N. et al. Spatio-temporal dynamics of rangeland transformation using machine learning algorithms and remote sensing data. Rangel. Ecol. Manag. 94, 106-118 (2024).
- Aslam, R. W., Shu, H., Yaseen, A., Sajjad, A. & Abidin, S. Z. U. Identification of time-varying wetlands neglected in Pakistan through remote sensing techniques. Environ. Sci. Pollut. Res. 30, 74031-74044. https://doi.org/10.1007/s11356-023-27554-5 (2023).
- Aslam, R. W. et al. Wetland identification through remote sensing: Insights into wetness, greenness, turbidity, temperature, and changing landscapes. Big Data Res. 100416 (2023) https://doi.org/10.1016/j.bdr.2023.100416.
- Naz, I., Ahmad, I., Aslam, R. W., Quddoos, A. & Yaseen, A. Integrated assessment and geostatistical evaluation of groundwater quality through water quality indices. Water 16, 63 (2023).
- Lingye, T. et al. Assessment of urban environmental quality by socioeconomic and environmental variables using open-source datasets. Trans. GIS https://doi.org/10.1111/tgis. 13250 (2024).
- Aslam, R. W., Naz, I., Shu, H., Yan, J. & Tariq, A. Multi-temporal image analysis of wetland dynamics using machine learning algorithms. J. Environ. Manage. 370, 122490 (2024).
- Aslam, R. W. et al. Machine learning-based wetland vulnerability assessment in the sindh province ramsar site using remote sensing data. Remote Sens. 16, 928 (2024).
- Chaoyong, W. et al. SAR image integration for multi-temporal analysis of Lake Manchar Wetland dynamics using machine learning. Sci. Rep. 14, 26669 (2024).
- Quddoos, A., Muhmood, K., Naz, I., Aslam, R. W. & Usman, S. Y. Geospatial insights into groundwater contamination from urban and industrial effluents in Faisalabad. Discov. Water 4, 50 (2024).
- Feng, L. et al. Exploring rangeland dynamics in Punjab, Pakistan: Integrating LULC, LST, and remote sensing for ecosystem analysis (2000-2020). Rangel. Ecol. Manag. https://doi.org/10.1016/j.rama.2024.09.008 (2024).
- Naz, I. et al. Integrated geospatial and geostatistical multi-criteria evaluation of urban groundwater quality using water quality indices. Water 16, 2549 (2024).
- Tariq, A. & Shu, H. CA-Markov chain analysis of seasonal land surface temperature and land use landcover change using optical multi-temporal satellite data of Faisalabad, Pakistan. Remote Sens. 12, 1-23. https://doi.org/10.3390/rs12203402 (2020).
- Singh, S. & Rai, P. K. Application of earth observation data for estimation of changes in land trajectories in Varanasi District, India. J. Landsc. Ecol. Republic) 11, 5-18 (2018).
- Mohiuddin, G. & Mund, J.-P. Spatiotemporal analysis of land surface temperature in response to land use and land cover changes: A remote sensing approach. Remote Sens. 16, 1286 (2024).
- Tariq, A., Shu, H., Siddiqui, S., Imran, M. & Farhan, M. Monitoring land use and land cover changes using geospatial techniques, a case study of Fateh Jang, Attock, Pakistan. Geogr. Environ. Sustain. 14, 41-52. https://doi.org/10.24057/2071-9388-2020-117 (2021).
- Tan, J., Yu, D., Li, Q., Tan, X. & Zhou, W. Spatial relationship between land-use/land-cover change and land surface temperature in the Dongting Lake area, China. Sci. Rep. 10, 9245 (2020).
- Maskooni, E. K., Naghibi, S. A., Hashemi, H. & Berndtsson, R. Application of advanced machine learning algorithms to assess groundwater potential using remote sensing-derived data. Remote Sens. 12, 2742 (2020).
- Luo, M. et al. Improving forest above-ground biomass estimation by integrating individual machine learning models. Forests 15, 975 (2024).
- Wang, M. et al. Annual wetland mapping in metropolis by temporal sample migration and random forest classification with time series landsat data and google earth engine. Remote Sens. 14, 3191 (2022).
- Cutler, R. et al. Random forests for classification in ecology. Ecology 88(11), 2783-2792 (2007).
- Arshad, A., Mirchi, A., Vilcaez, J., Umar Akbar, M. & Madani, K. Reconstructing high-resolution groundwater level data using a hybrid random forest model to quantify distributed groundwater changes in the Indus Basin. J. Hydrol. 628 (2024).
- Lu, L. et al. Spatiotemporal variation of surface urban heat islands in relation to land cover composition and configuration: A multi-scale case study of Xi’an, China. Remote Sens. 12, 2713 (2020).
- Zhang, X. et al. Analysis on decoupling between urbanization level and urbanization quality in China. Sustainability 12, 6835 (2020).
- Faichia, C. et al. Using RS data-based CA-Markov model for dynamic simulation of historical and future LUCC in vientiane, Laos. Sustainability 12, 8410 (2020).
- Rwanga, S. S. & Ndambuki, J. M. Accuracy assessment of land use/land cover classification using remote sensing and GIS. Int. J. Geosci. 08, 611-622 (2017).
- Mahboob, M. A., Atif, I. & Iqbal, J. Remote sensing and GIS applications for assessment of urban sprawl in Karachi, Pakistan. Sci. Technol. Dev. 34, 179-188 (2017).
- Fang, Y. et al. Assessment of the hydrodynamics role for groundwater quality using an integration of GIS, water quality index and multivariate statistical techniques. J. Environ. Manage. 273, 111185 (2020).
- Ullah, H. et al. Geo-spatial analysis and modelling of water borne diseases in District Multan. J. Biodivers. Environ. Sci. 12, 1-15 (2021).
- Defries, R. S. & Townshend, J. R. Ndvi-derived land cover classifications at a global scale. Int. J. Remote Sens. 15, 3567-3586 (1994).
- Huete, A. A soil-adjusted vegetation index (SAVI). Remote Sens. Environ. 25, 295-309 (1988).
- Rocha, A. V. & Shaver, G. R. Advantages of a two band EVI calculated from solar and photosynthetically active radiation fluxes. Agric. For. Meteorol. 149, 1560-1563 (2009).
- Xu, H. Modification of normalised difference water index (NDWI) to enhance open water features in remotely sensed imagery. Int. J. Remote Sens. 27, 3025-3033 (2006).
- Belgiu, M. & Drăguț, L. Random forest in remote sensing: A review of applications and future directions. ISPRS J. Photogramm. Remote Sens. 114, 24-31 (2016).
- Prasad, A. M., Iverson, L. R. & Liaw, A. Newer classification and regression tree techniques: Bagging and random forests for ecological prediction. Ecosystems 9, 181-199 (2006).
- Ullah, S., Qiao, X. & Tariq, A. Impact assessment of planned and unplanned urbanization on land surface temperature in Afghanistan using machine learning algorithms: A path toward sustainability. Sci. Rep. 15, 3092 (2025).
- Ullah, S., Qiao, X. & Abbas, M. Addressing the impact of land use land cover changes on land surface temperature using machine learning algorithms. Sci. Rep. 14, 18746 (2024).
- Ullah, S., Abbas, M. & Qiao, X. Impact assessment of land-use alteration on land surface temperature in Kabul using machine learning algorithm. J. Spat. Sci. 1-23 (2024) https://doi.org/10.1080/14498596.2024.2364283.
- Sayemuzzaman, M. & Jha, M. K. Modeling of future land cover land use change in North Carolina using Markov chain and cellular automata model. Am. J. Eng. Appl. Sci. 7, 295-306 (2014).
- Farhan, M. et al. Predicting land use land cover dynamics and land surface temperature changes using CA-Markov-Chain models in Islamabad, Pakistan (1992-2042). IEEE J. Sel. Top. Appl. Earth Obs. Remote Sens. 1-18 (2024).
- Mohamed, A. & Worku, H. Simulating urban land use and cover dynamics using cellular automata and Markov chain approach in Addis Ababa and the surrounding. Urban Clim. 31, 100545 (2020).
- Abdul Rahaman, S., Aruchamy, S., Balasubramani, K. & Jegankumar, R. Land use/land cover changes in semi-arid mountain landscape in Southern India: A geoinformatics based Markov chain approach. Int. Arch. Photogramm. Remote Sens. Spat. Inf. Sci. – ISPRS Arch. 42, 231-237 (2017).
- Ullah, S., Khan, M. & Qiao, X. Examining the impact of land use and land cover changes on land surface temperature in Herat city using machine learning algorithms. GeoJournal 89, 225 (2024).
- Sang, L., Zhang, C., Yang, J., Zhu, D. & Yun, W. Simulation of land use spatial pattern of towns and villages based on CA-Markov model. Math. Comput. Model. 54, 938-943 (2011).
- Farhan, M. et al. Predicting land use land cover dynamics and land surface Temperature changes using CA-Markov-chain models in Islamabad, Pakistan (1992-2042). IEEE J. Sel. Top. Appl. Earth Obs. Remote Sens. 17, 16255-16271 (2024).
- Shirazi, S. A. & Kazmi, S. J. H. Analysis of population growth and urban development in Lahore-Pakistan using geospatial techniques: Suggesting some future options. South Asian Stud. 29, 269-280 (2014).
- Waseem, M., Mutahir Ullah Ghazi, S., Ahmed, N., Ayaan, M. & Kebede Leta, M. Rainwater harvesting as sustainable solution to cope with drinking water scarcity and urban flooding: A case study of public institutions in Lahore, Pakistan. CivilEng 4, 638-656 (2023).
- Khan, M. K., Naeem, K., Huo, C. & Hussain, Z. The nexus between vegetation, urban air quality, and public health: An empirical study of Lahore. Front. Public Heal. 10, 1-21 (2022).
- Khanum, F., Chaudhry, M. N. & Kumar, P. Characterization of five-year observation data of fine particulate matter in the metropolitan area of Lahore. Air Qual. Atmos. Heal. 10, 725-736 (2017).
- Riaz, O., Ghaffar, A. & Butt, I. Modelling Land use Patterns of Lahore (Pakistan) using remote sensing and GIS. Glob. J. Sci. Front. Res. H Environ. Earth Sci. 14, 24-30 (2014).
- Iram, A., Rasool, L., Shahzad, F. & Saeed, Y. Impact of urban sprawl on public health: An analysis of Lahore-Pakistan. World Appl. Sci. J. 20, 80-86 (2012).
- Zia, S. M., Shirazi, S. A. & Alam, R. Temporal analysis of temperature trends in the metropolitan area of Lahore, Pakistan. Pak. J. Sci. 66, 83-88 (2014).
- Jabeen, F., Ali, Z. & Maharjan, A. Assessing health impacts of winter smog in lahore for exposed occupational groups. Atmosphere (Basel). 12, 1-14 (2021).
- Mahmood, K. et al. Groundwater Levels Susceptibility To Degradation in Lahore Metropolitan. Depression 25, 123-126 (2000).
- Muhammad, A. M., Zhonghua, T., Dawood, A. S. & Earl, B. Evaluation of local groundwater vulnerability based on DRASTIC index method in Lahore, Pakistan. Geofísica Int. 54, 67-81 (2015).
- Ali, M. et al. A study of aerosol properties over Lahore (Pakistan) by using AERONET data. Asia-Pacific J. Atmos. Sci. 50, 153-162 (2014).
- Jiang, Z. & Xu, C. Policy incentives, government subsidies, and technological innovation in new energy vehicle enterprises: Evidence from China. Energy Policy 177, 113527 (2023).
- Arima, E. Y., Simmons, C. S., Walker, R. T. & Cochrane, M. A. Fire in the Brazilian Amazon: A spatially explicit model for policy impact analysis. J. Reg. Sci. 47, 541-567 (2007).
Acknowledgements
Author contributions
Declarations
Competing interests
Software
Additional information
Reprints and permissions information is available at www.nature.com/reprints.
Publisher’s note Springer Nature remains neutral with regard to jurisdictional claims in published maps and institutional affiliations.
© The Author(s) 2025
College of Physics and Information Engineering, Fuzhou University, Fuzhou 350116, China. Department of Wildlife, Fisheries and Aquaculture, College of the Forest Resources, Mississippi State University, Starkville, MS 39762-9690, USA. State Key Laboratory of Information Engineering in Surveying, Mapping and Remote Sensing (LIESMARS), Wuhan University, Wuhan 430079, China. Instituto de Investigación para el Desarrollo Sustentable de Ceja de Selva (INDES-CES), Universidad Nacional Toribio Rodríguez de Mendoza de Amazonas, Chachapoyas 01001, Peru. Department of Water Resources and Environmental Engineering, Nangarhar University, Nangarhar 2600, Afghanistan. Department of Software Engineering, College of Computer and Information Sciences, King Saud University, 11543 Riyadh, Saudi Arabia. email: at2139@msstate.edu; Sajidjalwan@gmail.com