التحليل الشامل والمدهش وسرعة جهاز تحليل الكتلة الأستري للعينات المعقدة للغاية هو قفزة نوعية في التحليل الوظيفي للميكروبيومات The astounding exhaustiveness and speed of the Astral mass analyzer for highly complex samples is a quantum leap in the functional analysis of microbiomes

المجلة: Microbiome، المجلد: 12، العدد: 1
DOI: https://doi.org/10.1186/s40168-024-01766-4
PMID: https://pubmed.ncbi.nlm.nih.gov/38454512
تاريخ النشر: 2024-03-07

التحليل الشامل والمدهش وسرعة جهاز تحليل الكتلة الأستري للعينات المعقدة للغاية هو قفزة نوعية في التحليل الوظيفي للميكروبيومات

ثيبوت دوماس روكسانا مارتينيز بينا كلمنت لوزانو سونيا رادو أوليفييه بيبل لوسيا غرينغا وجان أرمانغو

الملخص

الخلفية من خلال تحليل البروتينات التي تعتبر العمود الفقري للأنظمة البيولوجية، تتيح الميتابروتيوميات لنا قائمة الأنواع الموجودة في أي ميكروبيوم، ومراقبة الكتلة الحيوية النسبية، وتوصيف وظيفة الأنظمة البيولوجية المعقدة. النتائج هنا، نقدم استراتيجية جديدة لتحديد هيكل المجتمع الميكروبي لعينة معينة وتصميم قاعدة بيانات تسلسل بروتين مخصصة لاستغلال بيانات مطيافية الكتلة الشاملة بشكل مثالي. تستفيد هذه الطريقة من قدرات الجيل الأول من مطياف الكتلة رباعي القطب الذي يتضمن محلل أسترا (Astral) غير المفقود للمسار غير المتماثل، مما يوفر سرعة مسح MS/MS وسرعة حساسية عالية. استغللنا استراتيجيات الاكتساب المعتمد على البيانات والاكتساب المستقل عن البيانات باستخدام مستخلص ببتيد من عينة براز إنسان تم إضافة كميات دقيقة من الببتيدات من نوعين مرجعيين من البكتيريا. الاستنتاجات تثبت طريقتنا، التي تجمع بين كلا طريقتي الاكتساب، أنها فعالة من حيث الوقت أثناء معالجة قواعد البيانات العامة الواسعة والمجموعات الضخمة من البيانات، حيث تحقق تغطية لأكثر من 122,000 ببتيد فريد و38,000 مجموعة بروتينية خلال فترة 30 دقيقة من DIA. يمثل هذا تحولًا كبيرًا عن منهجيات الميتابروتيوميات الحالية، مما يؤدي إلى تغطية أوسع للمسارات الأيضية التي تحكم النظام البيولوجي. معًا، تمثل استراتيجيتنا ومحلل الكتلة أسترا قفزة نوعية في التحليل الوظيفي للميكروبيومات.

الكلمات الرئيسية: مطيافية الكتلة بالتزامن، الميكروبيوم، تحليل البروتينات، التصنيف، التحليل الوظيفي
*المراسلة:
جان أرمونغو
jean.armengaud@cea.fr
قسم الأدوية والتقنيات للصحة (DMTS)، جامعة باريس-ساكلاي، CEA، INRAE، SPI، 30200 باغنول-سور-سيس، فرنسا
ثيرمو فيشر ساينتيفيك GmbH، 63303 دريتش، ألمانيا

الخلفية

تعتبر المجتمعات الميكروبية أنظمة بيولوجية معقدة بسبب تنوع مكوناتها، وديناميكياتها في الزمان والمكان، وقدراتها الوظيفية المعقدة والمتكررة، والعديد من التفاعلات والشبكات الممكنة. شهدت أبحاث الميكروبيوم العديد من التقدمات في تحديد طبيعة مكوناتها، مشيرة إلى الأنواع الرئيسية ذات الأهمية الوظيفية، وتوقع وظائفها بناءً على معلومات الميتاجينوميات. من خلال تحديد البروتينات ومراقبة كمياتها، تُعتبر الميتابروتيوميات منهجية.
يوفر معلومات حاسمة حول المكونات الهيكلية، والإنزيمات، والرسائل المعلوماتية للميكروبات، بالإضافة إلى استجابة المضيف، إن وجدت [2]. بالإضافة إلى تحديد المسارات الأيضية النشطة وتقييم مستوى نشاطها من خلال كمياتها، تتيح هذه المنهجية تتبعها إلى الكائنات المحددة التي أنتجت البروتينات المقابلة بفضل تسلسلات الببتيد التي تم إنشاؤها بواسطة مطيافية الكتلة المت tandem عالية الدقة. لذلك، تلعب الميتابروتيوميات دورًا رئيسيًا في تعميق معرفتنا بالميكروبيومات، مقارنة بالمنهجيات المحدودة بتصنيف الميكروبات والإمكانات الجينومية. علاوة على ذلك، بفضل سرعتها القصوى، يمكن أن تصبح هذه المنهجية أداة تشخيصية جديدة جذابة للطب البشري والبيئة [3].
تتأثر أبحاث الميكروبيوم بشدة بالتقدم المنهجي. التطورات الأخيرة في مطيافية الكتلة المتزامنة، واستراتيجيات الاكتساب، وأدوات التفسير لديها إمكانيات كبيرة لتحويل الميتابروتيومكس إلى منهجية عالية الأداء لتعميق المعرفة بوظائف الميكروبات. يواجه الميتابروتيومكس كمية هائلة من البيانات المعقدة، بما في ذلك قواعد بيانات ضخمة من تسلسلات البروتينات المبنية على بيانات الميتاجينوم أو أعداد كبيرة من الكائنات الحية المتسلسلة. كما يواجه الميتابروتيومكس عددًا استثنائيًا من البروتينات والمتغيرات من العينة، مما يجعل تحديد الببتيدات الشائعة أسهل من تحديد الببتيدات المحددة. أخيرًا، يميل نقص التغطية الشاملة لقاعدة بيانات تسلسل البروتينات إلى تقليل نتائج التفسير. مؤخرًا، وصف ستيوارت وآخرون تطوير مطياف كتلة جديد يجمع بين رباعي الكتلة القوي Orbitrap، ومعالج الأيونات الجديد فخ الأيونات المستقيمة، ومحلل مفاهيمي ثوري يسمى محلل الخسارة غير المتماثلة (Astral)، مما يتيح اكتسابًا أسرع لطيف MS/MS عالي الدقة وحساسية عالية مقارنة بمطيافات الكتلة الحديثة. أظهرت النتائج التي قدمها هذا الجهاز الجديد في علم البروتينات وعودًا واعدة من حيث عمق التحليل مع تحديد 10,000 مجموعة من مستخلص ببتيدات HeLa خلال تشغيل واحد مدته 48 دقيقة. تم توثيق مثل هذا الأداء بشكل أكبر للتحليل الشامل لتعديلات البروتينات بعد الترجمة، وبروتينات البلازما، والخلايا الدنيا، وعلم البروتينات على مستوى الخلية الواحدة. نظرًا لهذه التحسينات الكبيرة، نستكشف في هذه الدراسة أدائها لتوصيف عينات معقدة للغاية باستخدام معيار محدد من المواد البرازية البشرية المضافة إليها كميات دقيقة من بروتينات بكتيرية. لاستغلال هذه التكنولوجيا الجديدة بالكامل، نقترح سير عمل جديد للميتابروتيومكس، يعتمد على تحديد موثوق للبروتينات الدقيقة من اكتساب يعتمد على البيانات القصيرة.
قاعدة بيانات تختار الجينومات الأكثر قيمة، تسجيل مجموعات بيانات عالية الكثافة في الاكتساب غير المعتمد على البيانات، وتفسير لزيادة تغطية اللاعبين الرئيسيين في الميكروبيوتا.

المواد والطرق

عينة مرجعية من MetaP

تم زراعة Deinococcus proteolyticus و Balneola vulgaris [10] في تم التحريك بسرعة 140 دورة في الدقيقة في وسط LB و Marine، على التوالي. تم جمع الخلايا في المرحلة الثابتة عن طريق الطرد المركزي. تم الحصول على المادة البرازية البشرية من متبرع بالغ صحي. تم استخراج البروتينات وتحليلها إلى ببتيدات باستخدام التربسين كما هو موصوف سابقًا [11]. تم قياس الببتيدات المستخرجة من البكتيريا الاثنين والمادة البرازية باستخدام اختبارات ومعايير ببتيد كوانتيتاتيف من بيرس (Thermo Fisher Scientific) وفقًا لتعليمات الشركة المصنعة، ثم تم خلطها بنسبة 2:1:97 لـ D. proteolyticus: B. vulgaris: المادة البرازية للحصول على عينة مرجعية MetaP.

مطياف الكتلة أوربيتراب أسترا

تم إجراء تحليل NanoLC-MS/MS على جهاز Orbitrap Astral MS المتصل بجهاز Vanquish. نظام نيو UHPLC (ثيرمو فيشر) )، متصلة بجهاز EASY-Spray مصدر نانو، ومزود بعمود تحليلي IonOpticks-TS ) مثبت باستخدام جهاز التحكم Heater THOR (IonOpticks). تم تطوير التدرجات الأربعة المستخدمة مع حمض الفورميك (المذيب أ) و حمض الفورميك أسيتونيتريل (المُذيب ب): في 18 دقيقة تليها في دقيقتين (تدرج 20 دقيقة) في 25 دقيقة تليها في 5 دقائق (تدرج 30 دقيقة) في 52 دقيقة تليها في 8 دقائق (تدرج 60 دقيقة)، و في 56 دقيقة تليها في 21 دقيقة و في 12 دقيقة (تدرج 90 دقيقة)، تليها غسلة للعمود في لمدة 9 دقائق وإعادة التوازن. تم حقن الببتيدات (125 نانوغرام) مباشرة في العمود. في وضع DDA، تم تشغيل جهاز Orbitrap Astral MS في الوضع الإيجابي مع زمن دورة ثابت قدره 0.5 ثانية مع نطاق مسح كامل من بدقة 120,000. تم ضبط التحكم التلقائي في الكسب (AGC) على “مخصص”، مع هدف AGC موحد من وتم تعيين الحد الأقصى لوقت الحقن عند 50 مللي ثانية. تم تعيين عرض اختيار أيون السلف عند 2 دالتون. تم تحفيز تفتت الببتيد بواسطة الاضطراب التصادمي عالي الطاقة (HCD) مع تعيين طاقة تصادم HCD عند تم تسجيل مسحات أيونات الشظايا باستخدام محلل أستراال مع نطاق مسح من . في وضع DDA، تم اختبار تدرجات 30 دقيقة و60 دقيقة في ثلاث تكرارات للحقن. في وضع DIA، تم برمجة جهاز Orbitrap Astral MS بأعلى دقة MS. مع نطاق مسح كامل من تم تعيين الهدف العادي لنظام التحكم التلقائي في الكسب عند
. تم تعيين عرض النافذة لقياسات DIA إلى 2 Da لـ و تدرجات بحد أقصى لوقت الحقن قدره 3 أو 5 مللي ثانية، على التوالي. تم تعيين هذه العرض عند 3 دالتون لـ ، وتدرجات 60 دقيقة مع أقصى وقت حقن لـ و 7 مللي ثانية، على التوالي. تم تفعيل وظيفة التحكم في الحلقة ( نطاق الاستحواذ كان بعد تجزئة الأيونات المعزولة باستخدام HCD مع طاقة الاصطدام العادية (NCE). في وضع DIA، تم اختبار تدرجات 90 دقيقة في ثلاث نسخ تحليلية. تم حقن كمية قدرها 125 نانوجرام من الببتيدات في كل عملية تحليلية.

تفسير البيانات لتحديد بروتينات الكائنات الحية

تم إجراء بروتيوتيب باستخدام مطيافية الكتلة بالتزامن مع كل مجموعة بيانات DDA كما هو موصوف سابقًا [12]. أعلى تم اختيار الأطياف باستخدام Scanranker [13]. تم تفسير هذه الأطياف MS/MS باستخدام Mascot الإصدار 2.6.1 (Matrix Science) ضد قاعدة بيانات NCBInrS [12]. تم ربط تسلسلات الببتيد بالأنواع في رتب التصنيف مثل الأنواع، الجنس، العائلة، الرتبة، الطبقة، الشعبة، والمملكة العليا، كما تم وصفه سابقًا [14]، مما أسفر عن تطابقات الطيف مع التصنيف (TSMs). تم استخدام TSMs وتسلسلات الببتيد المحددة حسب التصنيف (spePEP) للتعرف على التصنيف الجنسي. بعد ذلك، تم بدء جولة ثانية من البحث ضد قاعدة بيانات مستمدة من NCBInr تشمل جميع الأجناس المحددة وذريتها لتحديد الأنواع.

إنشاء قاعدة بيانات DB48

تم استخدام الأنواع الأكثر وفرة التي تم تحديدها من خلال بروتينات لتكوين قاعدة بيانات عينة محددة. تم اختيار ما مجموعه 48 كائنًا، وتم تنزيل تسلسلات البروتين المعلنة لها من NCBI، ودمجها في ملف fasta واحد، مما أسفر عن قاعدة بيانات DB48، التي تضم 437,578 إدخال بروتين وتبلغ إجمالي 169,873,349 حمض أميني. تم إيداع مكتبة الطيف DB48 لتفسير DIA في Figshare وهي متاحة مباشرة للتنزيل.https://figshare.com/articles/dataset/DB48_SpectralLibrary_predicted_speclib/24638913).

تفسير بيانات الميتابروتيوميات

تم معالجة ملف بيانات DDA الخام المكتسب (60 دقيقة، تكرار 3) باستخدام برنامج Proteome Discoverer برنامج v3.1، باستخدام SEQUEST في النهاية مع CHIMERYS خوارزميات البحث. تم تطبيق المعايير القياسية، مع تعديل الكارباميدوميثيلاسيون للسيستين كتحوير ثابت، وأكسدة الميثيونين كتحوير متغير، والهدف من معدل الاكتشاف الخاطئ (FDR) لبيانات تطابق الطيف الكتلي (PSMs) والببتيدات كحد أقصى. ، الحد الأدنى لطول الببتيد هو 6، ومعدل الاكتشاف الخاطئ للبروتينات هو تم تفسير ملفات DIA الخام باستخدام DIA-NN 1.8.1 [15].
تم إجراء توليد المكتبة في السليكو استنادًا إلى قاعدة بيانات DB48. تم السماح بحد أقصى من 2 انقسام مفقود، و2 تعديل متغير (أكسدة الميثيونين وأستلة الطرف N)، وطول الببتيد يتراوح من 7 إلى 30 بقايا، وشحنة السلف 2 و تتراوح من 400 إلى 1008، وتتراوح أيونات الشظايا من 200 إلى تم اختيار وضع الاستدلال التلقائي لدقة السلف و MS1. تم تفعيل المطابقة بين الجولات المكررة ولم يتم تفعيل وظائف الطيف المشترك. تم إجراء استدلال البروتين بناءً على أسماء البروتينات.

التحليل الوظيفي للمضيف والميكروبات والبكتيريا المضافة

تم استخدام البروتين الرئيسي داخل كل مجموعة بروتين محددة للتحليل الوظيفي، حيث تم مقارنة تسلسلات البروتين ضد قاعدة بيانات كيوتو لعلم الجينات والجنوم (KEGG) باستخدام أداة GhostKOALA. ثم تم تعيين مصطلحات التماثل (KO) إلى مسارات KEGG. من أجل تقييم عمق التحليل الوظيفي، تم حساب نسبة تغطية المسار من خلال قسمة عدد مصطلحات KO المرصودة على العدد الإجمالي لمصطلحات KO في المسار. تم استخدام متوسط وفرة البروتينات لقياس وزن كل مسار مرتبط بالمضيف أو الميكروبيوتا. تم توضيح مساهمة كل نوع ضمن وظيفة باستخدام أداة Circos. تم رسم مصطلحات KO لـ Deinococcus proteolyticus و Balneola vulgaris على مسارات KEGG الأيضية باستخدام iPath 3.0.

تحليل الطيف الكتلي Orbitrap Exploris 480 ومعالجة البيانات

تم تحليل معيار metaP في ثلاث نسخ على جهاز Orbitrap Exploris 480 (ثيرمو ساينتيفيك) جهاز مطياف الكتلة الثنائي المرتبط بجهاز فانكويش وحدة مضخة نيو (ثيرمو فيشر) تم إزالة الأملاح من الببتيدات على عمود PepMap 100 C18 العكسي. -عمود مسبق (5 مم، Åهوية ثيرمو فيشر ) وفصلت على عمود EasySpray (75 مم، C18) ÅÅ، ثيرمو ساينتيفيك ) بمعدل تدفق قدره باستخدام تدرج من 0 إلى 85 دقيقة، و من 85 إلى 90 دقيقة) من الطور المتحرك و المرحلة ). تم تفعيل وضع DDA مع مسح كامل للكتلة من 375 إلى ، دقة MS تبلغ 120,000 ودقة MS/MS تبلغ 15,000. تم اختيار فقط الببتيدات التي تحمل شحنتين أو ثلاث شحنات موجبة للتفتيت مع وقت استبعاد ديناميكي قدره 20 ثانية ونافذة عزل قدرها .
الشكل 1 إشارات البروتين النسبي لمستويات تصنيفية مختلفة مجمعة حسب الفصيلة المحددة. تم تقدير الكتلة الحيوية للبروتين بناءً على إشارة TSMs المخصصة لهذه الكائنات الدقيقة، وتم تجميعها حسب الفصيلة في مستويات تصنيفية مختلفة.

بيانات بروتيوميات مطيافية الكتلة

تم إيداع بيانات بروتينات قياس الطيف الكتلي في اتحاد بروتينات بروتيوم إكس عبر مستودع شريك PRIDE تحت معرفات مجموعة البيانات PXD045838 (مجموعة بيانات Orbitrap Astral DDA)، PXD046290 (ملفات Orbitrap Astral DIA لمدة 15 و30 دقيقة)، PXD046320 (ملفات Orbitrap Astral DIA لمدة 60 و90 دقيقة)، وPXD047139 (ملفات Orbitrap Exploris 480 DDA لمدة 90 دقيقة).

النتائج

تحديد الأنواع الأكثر وفرة في العينة باستخدام تقنية البروتوتيبينغ المعتمدة على DDA

تم إجراء تجارب NanoLC-MS/MS باستخدام 125 نانوغرام من عينة مرجعية MetaP التي تم إنشاؤها خصيصًا لهذا الاختبار لجهاز مطياف الكتلة الت tandem Orbitrap Astral، باستخدام تدرجات مدتها 30 دقيقة و60 دقيقة، في ثلاث تكرارات لكل منهما. كانت تفسير البروتينات لهذه المجموعات الستة مقابل قاعدة بيانات مستمدة من NCBInr تشمل معلومات تسلسل البروتين من 50,995 نوعًا مختلفًا محدودًا بأفضل. طيف لكل منها، كما تم تقييمه بواسطة أداة Scanranker. تم استغلال هذه الجولة الأولى من البحث لتحديد الأجناس القابلة للملاحظة في كل مجموعة بيانات. تم بناء قاعدة بيانات تضم جميع نسل الأجناس المحددة لكل مجموعة بيانات و
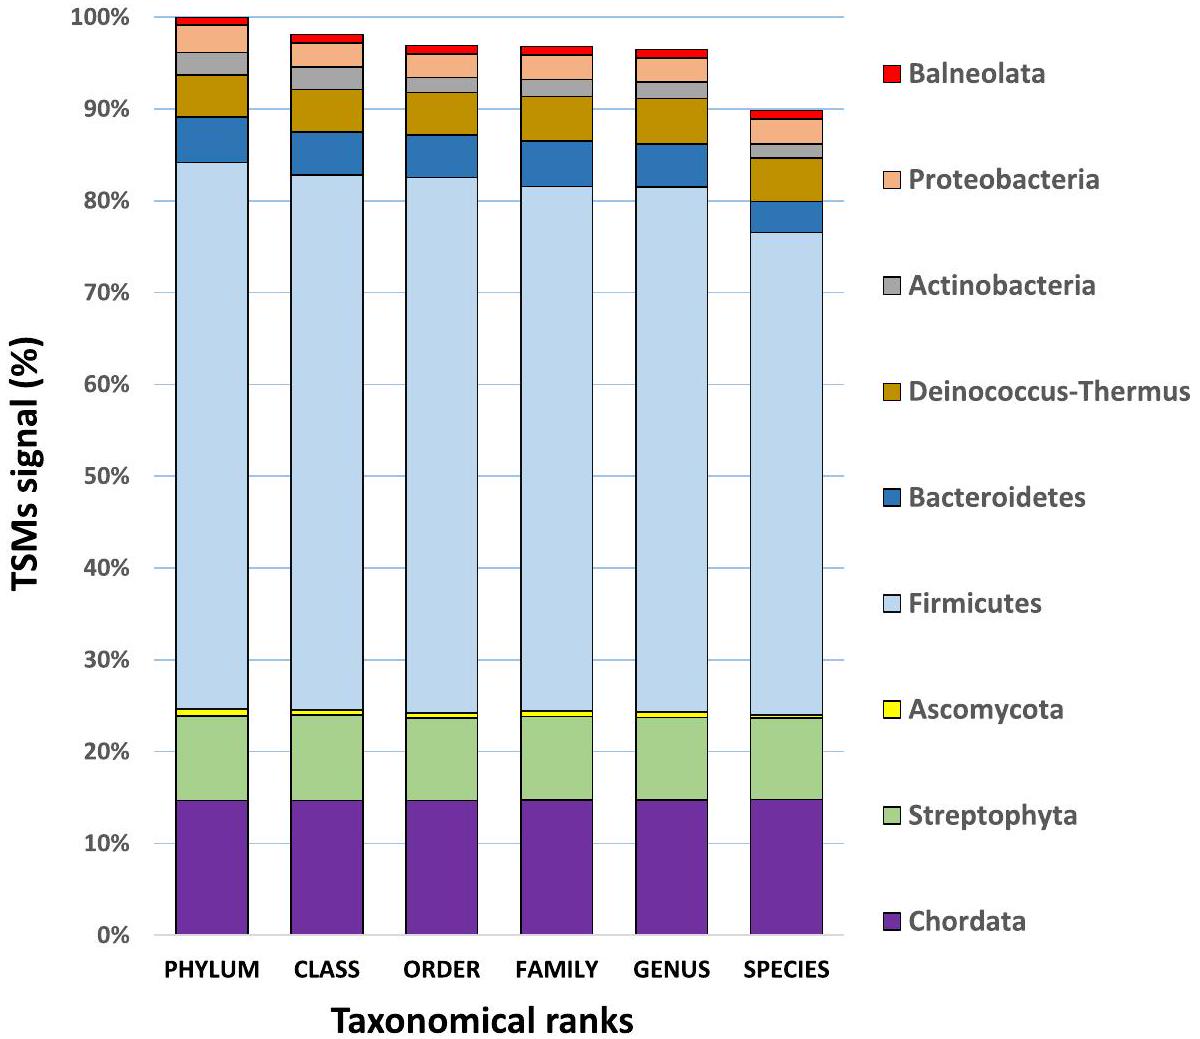
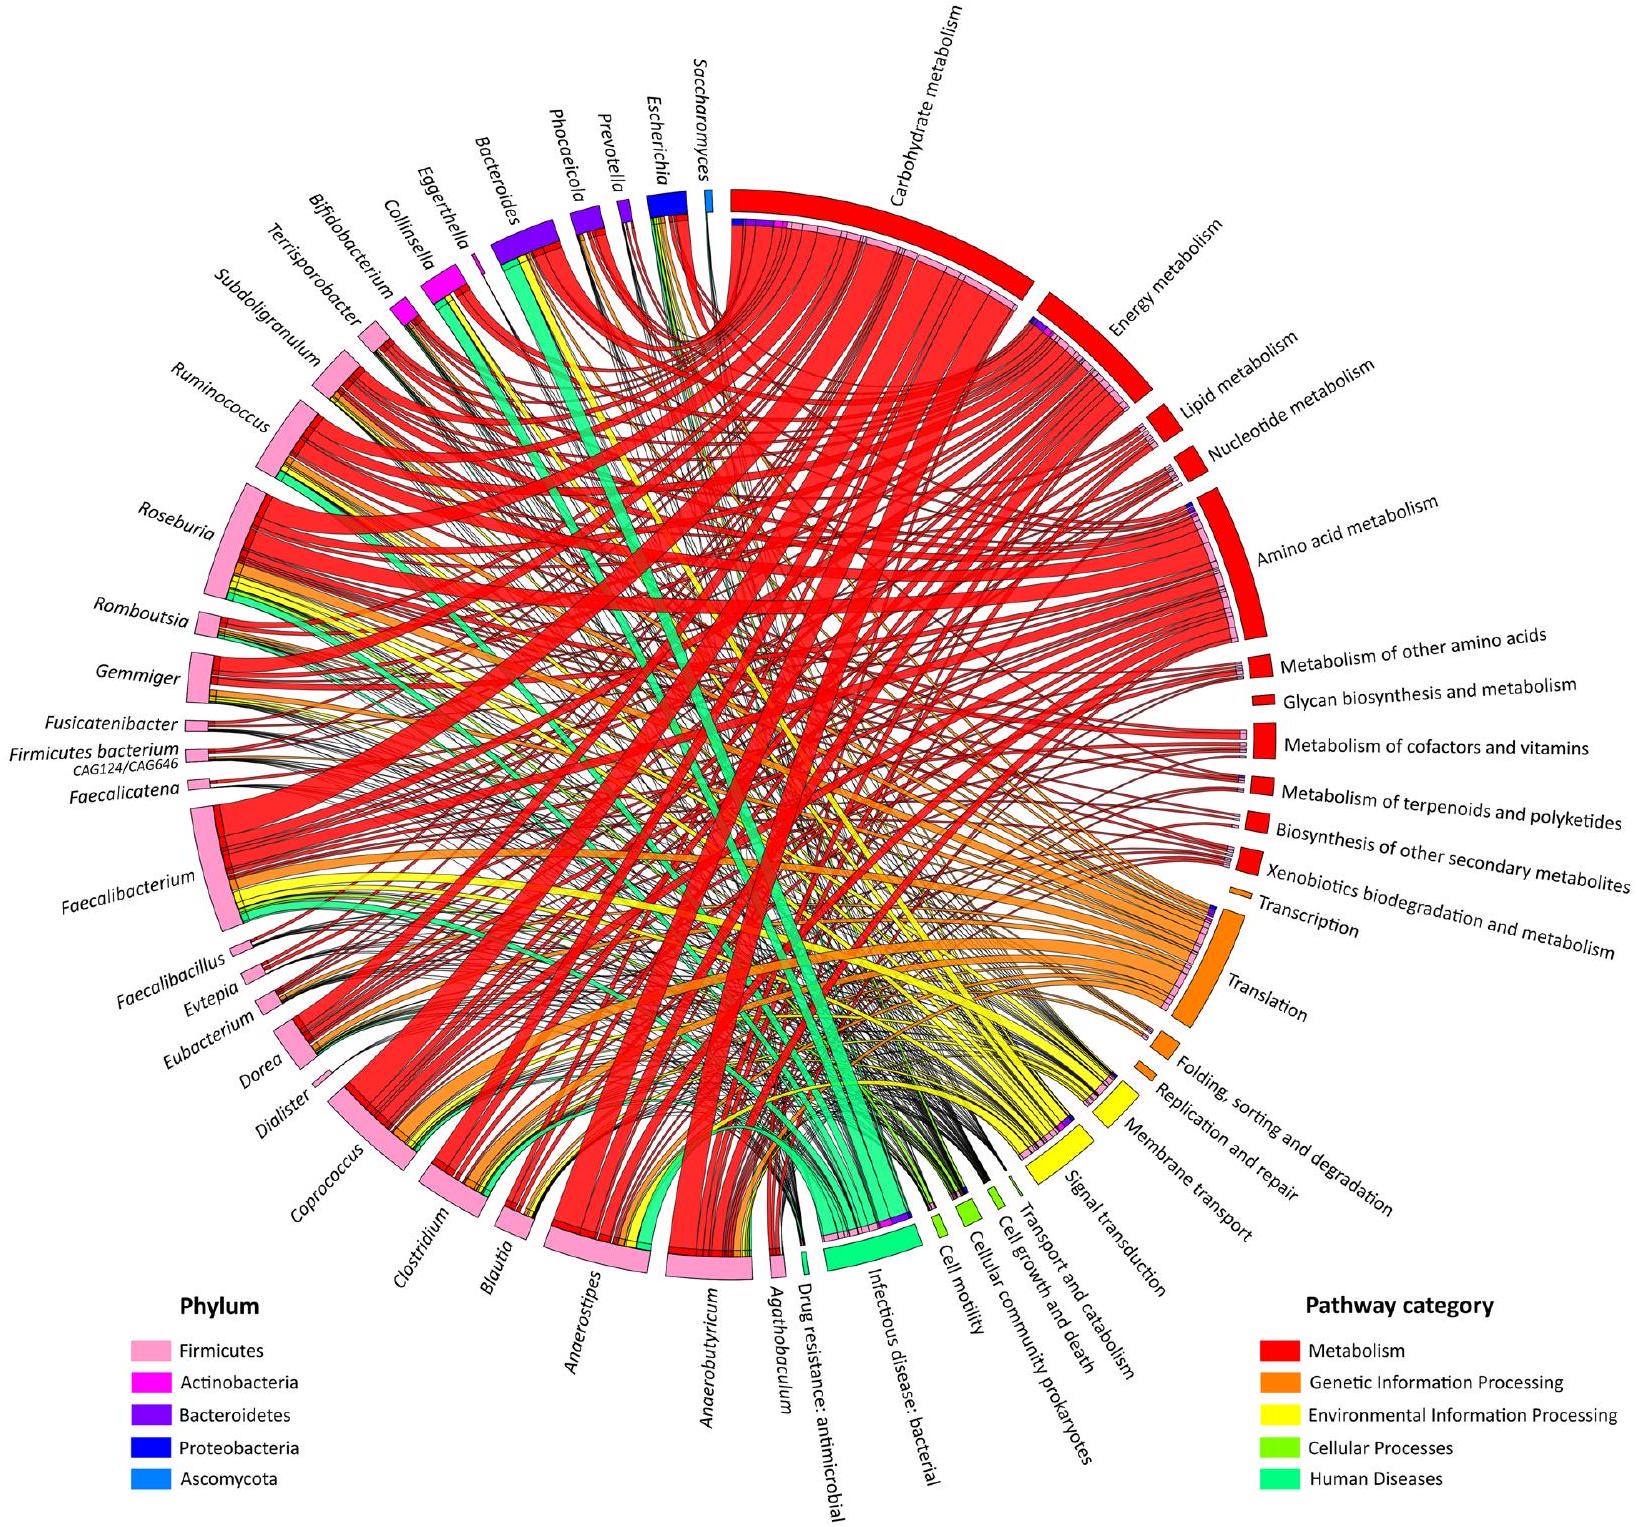
تم استخدامه لإجراء بحث ثانٍ لتحديد الكائنات الحية على مستوى النوع التصنيفي. الأنواع المحددة في هذه التحليلات الست المستقلة مدرجة في الجدول S1، مع العدد المقابل من الببتيدات المحددة لكل نوع ومطابقات الطيف لكل نوع (TSMs) في مختلف الرتب التصنيفية. يوفر الجدول S2 قائمة موثوقة من 9 شعب، و44 جنسًا، و56 نوعًا تم تحديد بروتيناتها من خلال دمج هذه النتائج، مع مساهمتها الخاصة في الكتلة الحيوية للبروتين (الشكل 1). إشارة TSMs العامة تنخفض قليلاً عند الانتقال لأسفل التسلسل الهرمي التصنيفي، من على مستوى الشعبة إلى في العائلة و على مستوى الجنس، على التوالي. يُلاحظ انخفاض أكثر وضوحًا عند الانتقال من مستوى الجنس إلى مستوى الأنواع ( ). وهذا يشير إلى أن مستوى الجنس مغطى بشكل جيد من قبل الجينومات المرجعية التمثيلية في قاعدة البيانات المستخدمة في بروتينات النمط، بينما يُلاحظ تغطية تسلسلية أقل على مستوى الأنواع. وبالتالي، فإن خصوصية بروتينات النمط لهذا الرتبة التصنيفية أقل قليلاً مقارنة بالرتب التصنيفية الأعلى. ومن المRemarkably، بالنسبة لـ Deinococcus proteolyticus و Balneola vulgaris و Homo sapiens، التي توجد جينوماتها المتسلسلة في قاعدة البيانات، لا يُلاحظ أي انخفاض على طول الرتب التصنيفية (الشكل 1). أكبر انخفاض في
تم ملاحظة النسبة بالنسبة لـ Ascomycota و Actinobacteria، مما يشير إلى أن الأنواع الممثلة بروتيوتيب داخل هذين الفيلين تمثل بشكل ضعيف فقط. نظرًا لأن مساهماتها الإجمالية صغيرة، فإن هذا له تأثير ضئيل على النتائج. في الواقع، فإن إشارة TSMs العالمية، التي تمثل القيمة الأولية، يبرز أهمية مستوى الأنواع عبر معظم الشعب.
من بين الـ 13 حقيقيات النوى، يعتبر المضيف Homo sapiens منطقياً أكثر الأنواع وفرة، حيث يمثل أكثر من من الكتلة الحيوية للبروتين. تم الكشف عن أحد عشر نوعًا مرتبطًا بفصيلة Streptophyta، تمثل ما مجموعه 9.9% من الكتلة الحيوية للبروتين، مع كون Glycine max وHelianthus annuus وOryza sativa هي المكونات الغذائية المتبقية الأكثر وفرة. تم تحديد نوع واحد فقط ينتمي إلى Ascomycota، وهو Saccharomyces cerevisiae. من بين 43 نوعًا بكتيريًا تم تحديدها، كانت Faecalibacterium prausnitzii وAnaerobutyricum halliii وCoprococcus eutactus هي الأكثر وفرة، حيث تمثل , , و من الكتلة الحيوية للبروتين، على التوالي. كان الكائن الأقل وفرة، Clostridium bartlettii CAG:1329، يمثل فقط من الكتلة الحيوية للبروتين ولكن تم الكشف عنه بشكل موثوق مع 10 ببتيدات محددة لنوعه في أفضل تحليل. لم يتم تحديد أي أركيا في هذه المادة البيولوجية المأخوذة من شخص شاب صحي يتبع نظامًا غذائيًا خاليًا من اللحوم. كما هو متوقع، هيمنت Firmicutes على الميكروفلورا مع 33 نوعًا محددًا، تمثل من الكتلة الحيوية للبروتين. من الجدير بالذكر أن البكتيريا المضافة التي لم يتم الإبلاغ عنها أبدًا في الميكروبيوم البرازي، Deinococcus proteolyticus وBalneola vulgaris، تم تحديدها مع 237 و55 ببتيدًا محددًا لنوعها في أفضل تحليل، على التوالي. وقد مثلت و من الكتلة الحيوية للبروتين، على التوالي، كما تم حسابه من إشارة TSMs المخصصة لمجموعات البيانات الست المفسرة. بينما تتوافق النسبة الثانية بدقة مع الكمية المضافة المتوقعة من Balneola vulgaris ( )، فإن القيمة الأولى تفرط في تقييم الكمية المضافة من Deinococcus proteolyticus ( )، مما يشير إلى أنه يجب تحسين قواعد الاقتصاد في إنشاء TSMs. يظهر النطاق الديناميكي للأنواع التي تم تقييمها بواسطة الميتابروتيوميات أن عددًا صغيرًا نسبيًا من الأجناس يهيمن على العينة من حيث الكتلة الحيوية، حيث تساهم خمسة أجناس (Homo وClostridium وFaecalibacterium وCoprococcus وAnaerobutyricum) في ما يقرب من 50% من الكتلة الحيوية للبروتين. بعد ذلك، قمنا ببناء قاعدة بيانات تسلسل البروتين DB48 المخصصة لتمثيل فقط تلك الكائنات التي تم تحديدها بواسطة التحليل الطيفي الكتلي المتسلسل، والتي يجب أن تمثل الجزء الأكبر من الكتلة الحيوية للبروتين، أي،

من الإجمالي (الجدول S3).

تم تحسين حالة الميتابروتيوميات الحالية من Astral DDA
نظرًا للتنوع العالي للببتيدات الموجودة في معيار MetaP، من المتوقع أن تكون نسبة كبيرة من طيف MS/MS شبحية، مما يؤدي إلى انخفاض في نسبة التعيين. تم إجراء اختبار أولي على مجموعة بيانات DDA واحدة (التكرار 3) باستخدام قاعدة بيانات تسلسل البروتين DB48 المقيدة بأكثر الكائنات وفرة الموجودة في العينة. تم دمج خوارزمية CHIMERYS الجديدة (MSAID، ألمانيا) في Proteome Discoverer لتحديد الأطياف الشبحية، حيث تم تحديد 158,716 PSMs و42,996 تسلسل ببتيد و27,628 بروتين و12,480 مجموعة بروتين. نسبة أطياف MS/MS المعينة هي ونسبة تسلسل الببتيد لكل مجموعة بروتين هي 3.45، والتي تعتبر مرتفعة نسبيًا مقارنة بمعظم الدراسات السابقة للميتابروتيوميات. توضح هذه التفسير الأخير الجودة العالية لتحضير الببتيد والتحلل البروتيني حيث أن من الببتيدات ليس لديها انقسامات مفقودة، و من الببتيدات نتجت عن انقسام مفقود فريد، و فقط تفسر بواسطة انقسامين مفقودين. من حيث شحنة السلف، 69.4% لديها شحنتين إيجابيتين، و لديها 3 شحنات إيجابية، و لديها 4 شحنات. تؤكد الاختلافات من حيث نسبة التعيين وتنوع تسلسل الببتيد الفائدة الكبيرة للذكاء الاصطناعي في تفسير مجموعات بيانات الميتابروتيوميات المعقدة جدًا. تمت مقارنة أداء أداة Astral بأداة Orbitrap Exploris 480 باستخدام نفس عينة المرجع metaP. كل من قياسات DDA الثلاثة التي استغرقت 90 دقيقة أنتجت متوسطًا قدره من أطياف MS/MS، مما أدى بعد استعلام DB48 إلى متوسط قدره من PSMs و تسلسل ببتيد و مجموعة بروتين (الجدول S4). تتماشى تلك النتائج مع تلك المبلغ عنها لعينات براز بشرية أخرى باستخدام نفس الأداة ولكن مع تدرج أطول [20]. في وضع DDA، أدى أداء أداة Astral وأداة CHIMERYS إلى ما يقرب من 10 مرات أكثر من PSMs، وزيادة ثلاثية في عدد الببتيدات ومجموعات البروتين المحددة، مع ثلثي الوقت المخصص فقط للتحليل الطيفي الكتلي. يوضح الشكل 2 المقارنة بين الأداتين من حيث تغطية البروتين. تشير هذه النتائج إلى حالة الميتابروتيوميات الحالية المتطورة التي يمكن تحقيقها بناءً على مجموعات بيانات DDA المكتسبة باستخدام مطياف الكتلة المتسلسل Orbitrap Astral.

تزيد الميتابروتيوميات DIA بشكل كبير من تغطية الببتيد واكتشاف البروتين

لتحقيق أداء أداة Astral في وضع DIA وتقييم مدى تحسينها لعمق معرفة الميتابروتيوم، تم إجراء تحليلات DIA مع معلمات اكتساب LC-MS/MS مختلفة. سجلنا تحليلات ثلاثية من معيار MetaP باستخدام تدرجات تمتد إلى و90 دقيقة. تم إجراء تفسير البيانات باستخدام مكتبة طيفية تم إنشاؤها في السليكو لـ DIA-NN، وكانت النتائج
الشكل 2 مخطط Venn يوضح الميزات المشتركة والخاصة للبروتينات ومجموعات البروتين التي تم اكتشافها بواسطة ثلاث منهجيات. تم الحصول على مجموعة البيانات المستخدمة مع تدرج 60 دقيقة (التكرار 3) لـ chimerys DDA وDIA-NN DIA Orbitrap Astral، وتدرج 90 دقيقة لـ Orbitrap Exploris 480
مقدمة إما في الوضع العادي أو في وضع استنتاج البروتينات الهيوريستيكي. يتجنب هذا الخيار الأخير تكرار الوصول إلى البروتين عبر مجموعات بروتين متعددة، مما يعطي نتائج أكثر ملاءمة للتحليل الوظيفي اللاحق، على الرغم من تقليل عدد مجموعات البروتين المدرجة. يظهر تفسير البيانات هذا تحسينًا في التفسير مقارنة بمجموعة بيانات DDA (الشكل 2) وإعادة إنتاج عالية بين التكرارات (الشكل 3). تم ملاحظة ما مجموعه 188,442 تسلسل ببتيد عند جمع 18 عملية تحليلية وتم ملاحظة 59,242 تسلسل ببتيد عبر جميع الظروف الست. على سبيل المثال، في مجموعة البيانات التي تم الحصول عليها في 30 دقيقة من التدرج (نافذة تكسير 2 Da ووقت حقن 3 ثوان)، تم ملاحظة 140,857 ( ) سلف، و122,087 تسلسل ببتيد، و مجموعة بروتين في المتوسط لكل عملية تحليلية. عند جمع الثلاثة تكرارات، تم ملاحظة ما مجموعه 124,546 تسلسل ببتيد و38,987 مجموعة بروتين تحت هذه الظروف التجريبية. منطقيًا، أدى التدرج الأطول الذي تم اختباره، 90 دقيقة، إلى مشهد أكبر بمتوسط 138,596 ببتيد فريد و44,204 مجموعة بروتين. بالنسبة لتدرج 60 دقيقة، تم ملاحظة 118,262 تسلسل ببتيد و37,934 مجموعة بروتين، مما يمثل زيادة كبيرة مقارنة بـ تحليل DDA CHIMERYS مع و تغيير مضاعف، على التوالي. بشكل عام، تؤكد هذه النتائج فائدة تحليلات DIA لتحديد الببتيدات والبروتينات. من الجدير بالذكر أن تدرج 15 دقيقة ( ) يعمل بشكل جيد جدًا مع 96,102 تسلسل ببتيد محدد و31,928 مجموعة بروتين، بمتوسط 3.0 ببتيدات لكل مجموعة بروتين.

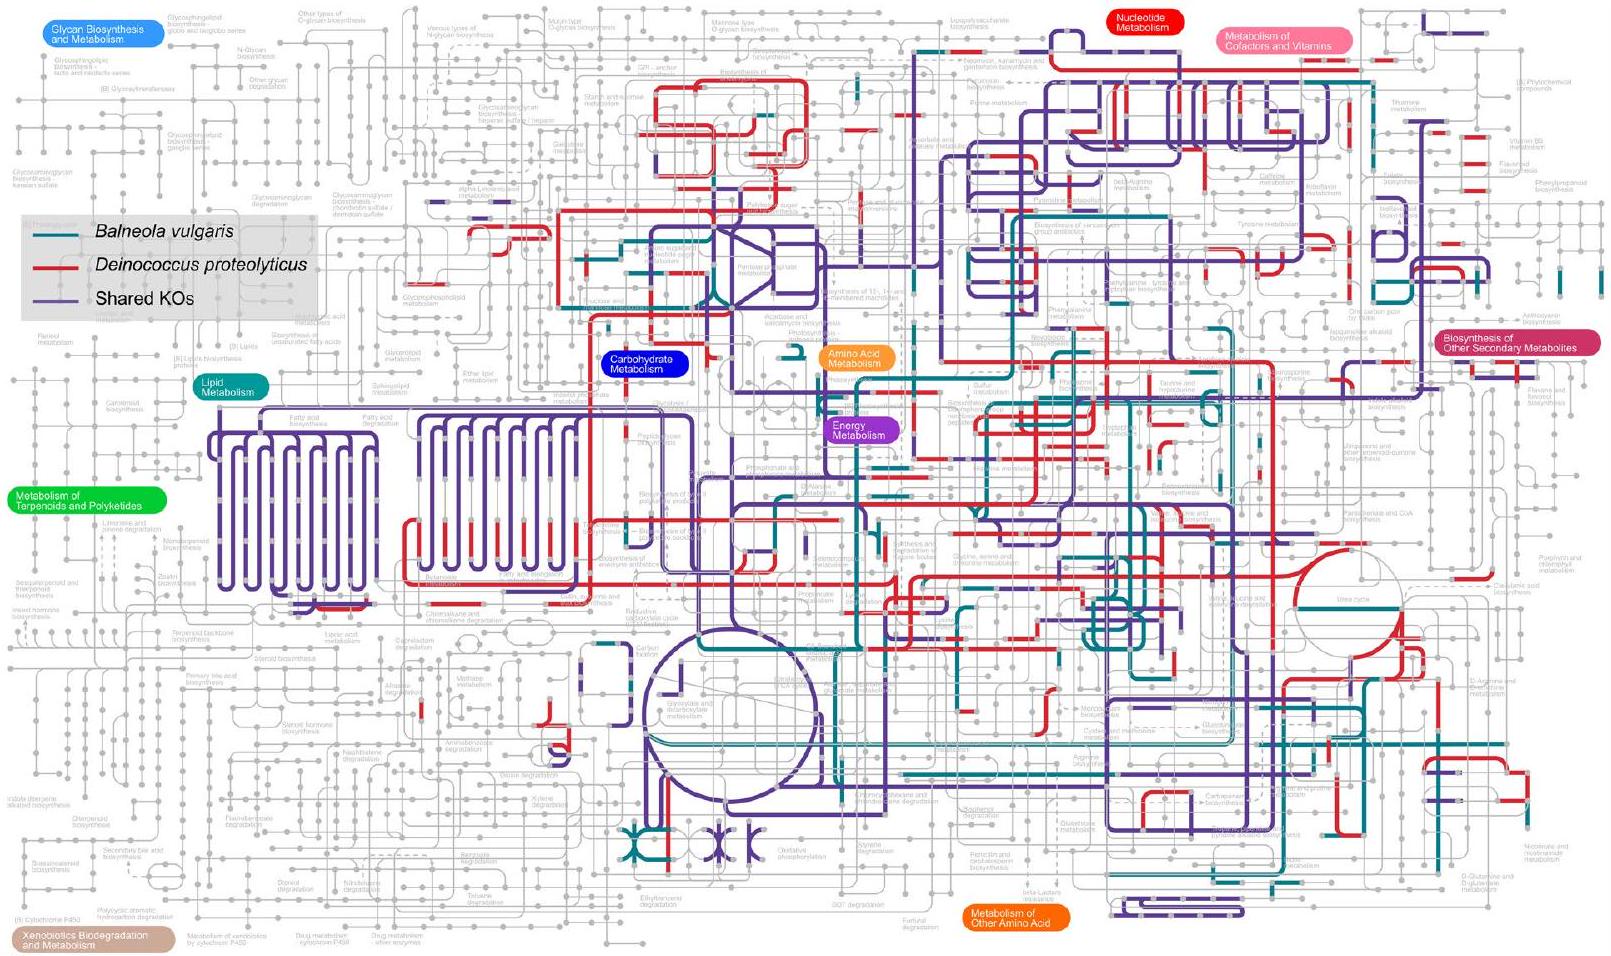
تعتمد المناظر المحسنة بشكل كبير لمسارات الأيض على مشهد DIA للببتيدات كبير جدًا

لكشف الإمكانات الكاملة لمطياف الكتلة Orbitrap Astral لتعزيز فهمنا للأنظمة البيولوجية المتنوعة، استكشفنا المزيد من نتائج تدرج DIA لمدة 30 دقيقة ( )، حيث يقدم تسوية جيدة بين وقت الاكتساب والأداء. تم توضيح البروتينات المحددة باستخدام قاعدة بيانات KEGG. عبر الثلاثة تكرارات التحليلية، تم بنجاح توضيح ما مجموعه 25,283 مجموعة بروتين متميزة، بمتوسط مجموعة بروتين لكل عملية تحليلية. من بين هذه، نشأت 997 بروتينًا من المضيف ( من الوفرة المتراكمة)، و2,036 بروتينًا من النظام الغذائي المتبقي ( من الوفرة)، و20,418 من الميكروبيوتا ( من الوفرة)، بينما مثلت B. vulgaris وD. proteolyticus 743 و1089 بروتينًا، 1.1 و من الوفرة، على التوالي (الجدول S5). يجب ملاحظة أن النسبتين الأخيرتين تتفقان بشكل جيد نسبيًا مع التصميم التجريبي لعينة MetaP، مما يشير إلى أن وفرة البروتين التراكمية قد تكون مؤشرًا جيدًا لتقدير نسبة الكتلة الحيوية لكل نوع. وهذا أيضًا يظهر أن تفسير مجموعات بيانات DIA وDDA متقارب إلى حد ما عندما يتعلق الأمر بتحديد نسبة الكتلة الحيوية لوحدة تصنيفية، على الرغم من أنه تم استخدام متغيرين بديلين مختلفين، وهما شدة البروتين وTSM.
من الجدير بالذكر، من 22,250 من البروتينات الميكروبية و (886 من 997) من البروتينات البشرية كانت تحتوي على تعليقات KO موجودة (الجدول S5). وُجد أن البروتينات المضيفة والميكروبية كانت متورطة في 367 و191 مسارًا بيولوجيًا، على التوالي، تغطي خمسة وظائف
الشكل 3 نتائج تفسير DIA للظروف الخمسة التي تم اختبارها ثلاث مرات. أ متوسط عدد السلف والمركبات الفريدة المكتشفة للنسخ الثلاثة، والمركبات الفريدة المتراكمة. مخطط فين للمركبات الفريدة بين الظروف الخمسة. متوسط عدد مجموعات البروتينات مع أو بدون استنتاج حدسي، ومجموعات البروتينات المتراكمة عند جمع النسخ الثلاثة
الشكل 4 وفرة جميع مسارات KEGG المحددة للمضيف والميكروبيوتا. أ المضيف. ب الميكروبيوتا. تعتمد نسبة المسار على كتلة البروتين. تمثل الأرقام الداخلية عدد مصطلحات KO المسجلة في المسارات
الشكل 4 مستمر
الشكل 5 المسارات الوظيفية وعلاقات الأجناس. يتم الإشارة إلى شعبة كل من 29 جنسًا ميكروبيًا تم تحديده في مجموعة البيانات، بالإضافة إلى الفئات الفرعية الوظيفية المجمعة حسب فئة مسار KEGG
الفئات: الأيض، معالجة المعلومات الجينية، معالجة المعلومات البيئية، العمليات الخلوية، والأمراض البشرية (الجدول S6). يتم عرض توزيعها العام في الشكل 4. من المثير للاهتمام، أن المجموعة العامة لمسارات KEGG ‘أيض الكربوهيدرات’ لديها أعلى معدل وفرة وأعلى عدد من وظائف KO (544) للميكروبيوتا. حتى المسارات التي تشمل بروتينات أقل وفرة، مثل ‘حركة الخلايا’، تظهر عمق تغطية يزيد عن (الجدول S6). عندما تعمقنا في مساهمات الأجناس الميكروبية المختلفة في التنوع الوظيفي للأمعاء، لاحظنا أننا قادرون على استكشاف الوظائف حتى
داخل الأنواع الأقل تمثيلًا نسبيًا، مما يدعم إمكانية أداة Orbitrap Astral في تسليط الضوء على الدور الفريد للميكروبيوتا بأكملها (الشكل 5).
نوجه انتباهنا إلى B. vulgaris و . proteolyticus، حيث قدمت التعليقات على بروتيناتهم المحددة، والتي بلغت 743 و1089، لنا لمحة وظيفية عن و من ملفهم البروتيني، على التوالي. يوضح الشكل 6 التداخل والتغطية المحددة لمساراتهم الأيضية. على الرغم من أن كمية B. vulgaris أقل من D. proteolyticus ( )، وجدنا أن إنتاج عامل الفولات وتخليق الفينيلبروبان هو أمر مهم داخل
الشكل 6 المنظر المقارن لأيض KEGG لـ B. vulgaris وD. proteolyticus. تميز الألوان بين المسارات الأيضية المشتركة بين البكتيريا المضافة وبين تلك الخاصة بكل بكتيريا بحرية.
تم الكشف عن بروتينات لأيض عدة أحماض أمينية (الهستيدين، التريبتوفان، الفالين، الليوسين، والإيزوليوسين) والإنزيمات البروتينية بشكل خاص في D. proteolyticus، بما يتماشى مع الخصائص المبلغ عنها لهذه البكتيريا والتي تنعكس في اسم النوع.
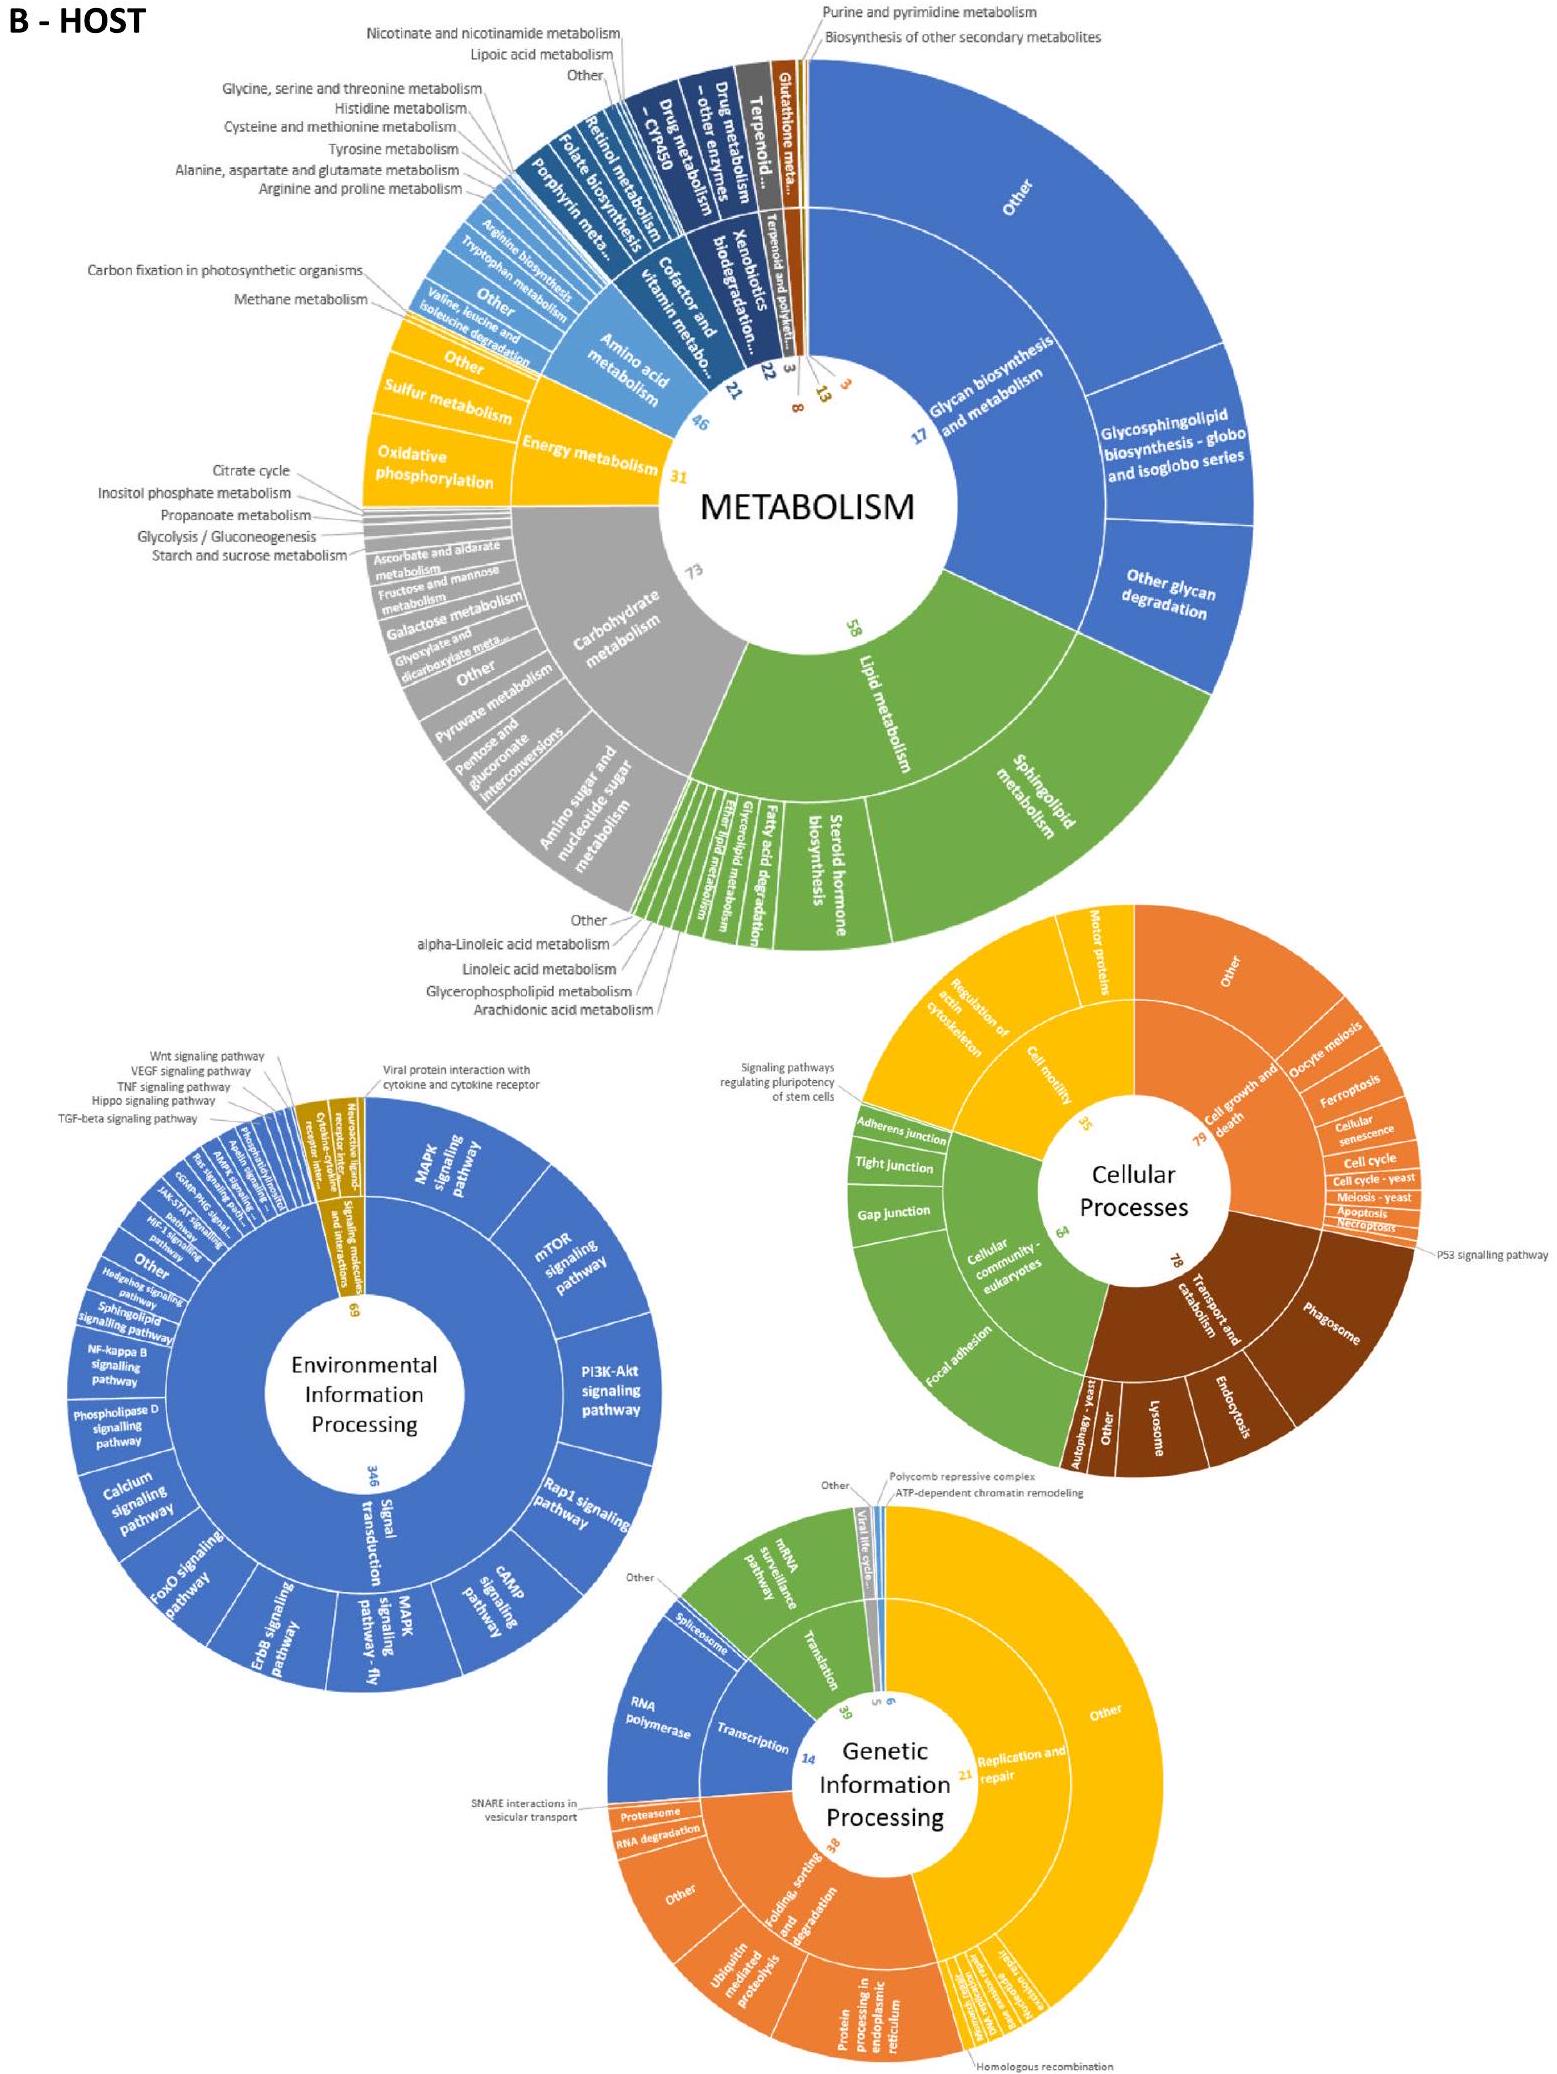
أخيرًا، تم التعليق على البروتينات الخاصة بالمضيف ضمن 367 مسارًا على مستوى KEGG 2، مع تميز نقل الإشارة كواحد من أكثر المسارات كثافة من حيث تعليقات KO. بلغ عمق التغطية لـ ‘إعادة امتصاص الكالسيوم المنظم بواسطة الهرمونات وعوامل أخرى’ (الجدول S6). في مجموعة البيانات هذه، على الرغم من أن التغطية كانت منخفضة، فإن المسارات المعروفة بلعب دور حاسم في تفاعل الميكروبيوتا-المضيف، مثل تلك المتعلقة بوظيفة الجهاز المناعي، هي معلوماتية للغاية.

نقاش

جهاز مطياف الكتلة المتسلسل من الجيل التالي Orbitrap Astral، الذي تم إصداره مؤخرًا من قبل Thermo، يعتمد على تقنية Orbitrap، وهي معالج أيونات جديد تم تطويره لحقن الأيونات بسرعة بعد تفتت السلف [5]، ومحلل الانعكاس المتعدد القوي Astral. يتضمن هذا الجهاز الأخير تذبذبات متعددة بين مرآتين كهربائيتين، مما يؤدي إلى طول رحلة إجمالي للأيونات الثانوية يتجاوز 30 م. تتكون أداؤه من قدرة دقة الكتلة
100,000 عند تردد مسح MS/MS يبلغ 200 هرتز. تم توثيق أداء هذه الأداة بالفعل لمجموعة متنوعة من التطبيقات في بروتينات الإنسان ولخليط بسيط من الببتيدات من ثلاثة كائنات، حيث تم الإبلاغ عن 14,000 بروتينًا لدرجة انحدار مدتها 28 دقيقة [6]. هنا، نقدم لأول مرة النتائج التي تم الحصول عليها لعينة ميتابروتينات حقيقية. على الرغم من أن خليط الببتيدات الذي تم الحصول عليه من عينة براز إنسان مضاف إليه ببتيدات من بكتيريا معروفة هو معقد جدًا، كان عدد مسحات MS/MS على مدى 60 دقيقة أكثر من 331 ألف في وضع DDA، أي بمعدل 92 مسحة في الثانية. كانت المعلمات المستخدمة هنا مثالية للدرجات القصيرة، لكن تحسينًا إضافيًا سيحسن بالتأكيد النتائج للدرجات الطويلة، التي يمكن استخدام المزيد من مادة الببتيد لها. تعتبر مجموعة البيانات المسجلة ذات جودة عالية، مما أدى إلى تحديد أكثر من 42,000 ببتيد فريد، لكن تم تسجيل مجموعات بيانات أفضل في وضع DIA، مع تحديد أكثر من 122,000 ببتيد فريد في 30 دقيقة فقط. كثافة المعلومات مرتفعة بشكل استثنائي، مع حجم ملفات DDA لمدة 60 دقيقة وDIA لمدة 30 دقيقة لكل منهما. الزيادة بمقدار ثلاثة أضعاف في الببتيدات الفريدة ليست ضارة بالنسبة لنسبة الببتيدات لكل بروتين، مما يشير إلى أن الثقة في نتائج DIA يجب أن تكون في نفس نطاق نتائج DDA.
النهج المقترح هنا للاستفادة من مجموعات البيانات الكبيرة المسجلة بواسطة مطياف الكتلة المتسلسل Orbitrap Astral يعتمد على (i) مسح DDA للعينة لتحديد بروتينات الكائنات دون أي أولوية على مستوى الجنس أو النوع باستخدام قاعدة بيانات عامة مستمدة من قاعدة بيانات NCBInr، (ii) بناء قاعدة بيانات مخصصة تمثل، قدر الإمكان، الكائنات التي تساهم أكثر في كتلة البروتين، و(iii) تفسير مجموعات بيانات DIA الكبيرة باستخدام قاعدة بيانات محددة للعينة ذات حجم محدود. تواجه الاستراتيجيات الحالية لتفسير مجموعات بيانات DIA المستندة إلى قواعد بيانات كبيرة، مثل البيانات الميتاجينومية المكتسبة من نفس العينة [21] أو كتالوج مخصص للميكروبيوم المعوي مثل MetaHit [22]، تحديات كبيرة بسبب مساحة البحث الكبيرة بشكل استثنائي والقيود الحاسوبية. يعد استخدام قاعدة بيانات ببتيد تجمع جميع الببتيدات التي تم تحديدها بالفعل في دراسات سابقة حول الميكروبيوم المعوي البشري بديلاً مثيرًا للاهتمام تم استكشافه مؤخرًا [23]، لكن تصميمه المسبق قد يكون ضارًا لوصف العينات غير النمطية. في الواقع، كانت البكتيريا المضافة المستخدمة في الدراسة الحالية، والتي لم يتم الإبلاغ عنها أبدًا في التحليلات السابقة للميكروبيوم المعوي، ستفوتها طرق التفسير التقليدية. هنا، يحدد بروتينات الكائنات الموجودة في العينة بناءً على معلومات تصنيفية دقيقة وموثوقة مستمدة من تسلسلات ببتيد عالية الجودة الكائنات الموجودة في العينة على مستوى الجنس أو النوع أو حتى رتبة السلالة. تتمتع هذه المنهجية بإمكانات كبيرة للتشخيص السريع للعينات المعقدة [3،24]، حيث لديها القدرة على تقدير الكتلة الحيوية لكل نوع محدد بدقة [14]. لقد تم تطبيقها بنجاح لتقييم اختلال التوازن في الميكروبيوم المعوي لمرضى COVID-19 [12]، لتحديد اللاعبين الميكروبيين الرئيسيين في الحيوانات الرائدة [25]، أو لتحديد وجود مسببات الأمراض على بقايا بشرية قديمة [26، 27]. يؤدي بروتينات مطياف الكتلة المتسلسل إلى استراتيجية ميتابروتينات دقيقة التصنيف، كما تم اقتراحه في البداية للعينات الأقل تعقيدًا [28]. هنا، قمنا بتقييد بحث بروتيناتنا إلى مجموعة فرعية من الطيف الناتج عن قيود الحوسبة ولكن تم الحصول على منظر مشابه من الكائنات لاختيارها لبناء قاعدة البيانات، بغض النظر عن مجموعة بيانات Orbitrap Astral المستخدمة. وبالتالي، فإن مسح DDA السريع باستخدام Orbitrap Astral لـ التدرج سيكون من حيث المبدأ أكثر من كافٍ لإنشاء قاعدة بيانات مخصصة بسرعة لتفسير DIA. نحن مقتنعون بأن هذه الطريقة ذات المرحلتين مناسبة لتحليل مثل هذه العينات المعقدة: (ط) يتم استخدام بروتيوتيب تصنيفي موثوق لاختيار قاعدة البيانات الأكثر ملاءمة، ثم (2) يتم إجراء تفسير بروتيوميات كلاسيكي، مع كون كل خطوة مقيدة بشكل مناسب بمعدل الاكتشاف الخاطئ. هذه العملية هي بطبيعتها تمامًا كما هو الحال في بروتيوميات كلاسيكية: إذا تمت معالجة عينة بشرية أو عينة من الإشريكية
كولاي، سيتم اختيار قاعدة البيانات المخصصة للتفسير وفقًا للمعلومات السابقة المتاحة. بدون معرفة مسبقة، سيحدد بروتيوتيب بسهولة ما إذا كانت العينة تحتوي على بروتينات بشرية أو بروتينات معوية، وستكون قاعدة البيانات النهائية لتفسير البروتيوم منطقياً مخصصة. على الرغم من أن قاعدة البيانات لتفسير الميتابروتيوم لعينات ميكروبيوم الأمعاء قد لا تكون شاملة بما يكفي لتشمل جميع تسلسلات المتغيرات البروتينية الموجودة في العينة، فإن الاستراتيجية التي نقترحها فعالة للغاية، كما هو موضح في هذه الدراسة. ستتعزز نتائج مثل هذه الاستراتيجية في المستقبل القريب مع زيادة عدد الجينومات المتاحة في قواعد البيانات العامة مع مرور الوقت. بالتأكيد، فإن إضافة بعد جديد للتفسير، مثل تفسير التسلسل الجديد [29]، أو البحث المتسامح مع الأخطاء، أو البحث عن تعديلات ما بعد الترجمة المتعددة [30]، لاستغلال إشارات MS/MS التي لم يتم تعيينها بعد مع الاستراتيجية الحالية، ستفيد بالتأكيد النتائج. ومع ذلك، يجب رفع القيود الحوسبية للبرامج المقابلة لتكون قابلة للتطبيق على مجموعات بيانات DIA الكبيرة جدًا التي تم الحصول عليها بواسطة جهاز Orbitrap Astral.
يمكن أيضًا تفسير بيانات DIA باستخدام مكتبة طيفية تجريبية تعتمد على بيانات DDA المكتسبة من نفس العينة. ومع ذلك، كشفت العديد من الدراسات المرجعية أن تفسير بيانات DIA بدون مكتبة يعطي نتائج أفضل من الاستراتيجيات المعتمدة على المكتبات [31-33] أو نتائج مشابهة [34]. في الواقع، ستكون مثل هذه المكتبة الطيفية لمجموعات بيانات الميتابروتيوم جزئية فقط لتفسير نتائج DIA حيث أن مجموعة بيانات DDA بعيدة عن أن تكون مكتملة بما فيه الكفاية. هنا، بشكل أكثر تحديدًا، فإن المعلمات المستخدمة للحصول على DDA في هذه الدراسة تسجل المزيد من الأطياف الشيميرية مقارنة بالمعلمات التقليدية، مما يهدد نتيجة المكتبة الطيفية. أخيرًا، فإن الحجم غير المعتاد لمجموعة البيانات يجعل هذه الاستراتيجية تتطلب موارد حوسبة كبيرة. بديل آخر يتكون من إنشاء مكتبة طيفية زائفة مباشرة من بيانات DIA لتسهيل بناء قاعدة البيانات [35]، ولكن لم يتم تحسين خطوط الأنابيب بعد لمجموعات بيانات Orbitrap Astral. من الواضح أنه من الأهمية القصوى تحسين برامج البروتيوميات والميتابروتيوميات للتعامل مع مجموعات بيانات Astral العملاقة وتقييم جميع الاستراتيجيات الممكنة ضمن إطار مبادرة الميتابروتيوميات [36]. نتائج تفسير DIA التي تم الحصول عليها هنا، 122,087 تسلسل ببتيد في المتوسط لعينة من التدرج على عينة مرجعية MetaP، يمكن مقارنتها بشكل إيجابي مع النتائج التي تم الحصول عليها مؤخرًا جدًا على مواد بيولوجية مشابهة ولكن مع أدوات ومعلمات مختلفة: 11,122 تسلسل ببتيد لتدرج [35]، 49,224 تسلسل ببتيد لتدرج [34]، و70,272 ببتيد لتدرج 130 دقيقة [37].
تعتبر الكتلة الحيوية للكائنات الحية المحددة المقدرة من مجموعات بيانات DDA وDIA قابلة للمقارنة نسبيًا، بينما يتم تقدير الأولى بناءً على عدد TSMs والأخيرة بناءً على شدة السلف. على سبيل المثال، تم تقدير بكتيريا Balneola vulgaris المضافة إلى معيار MetaP لتمثيل من إجمالي البيبتيدوم عند و ، على التوالي. مثلت Streptophyta (الغذاء) و ، على التوالي. بالنسبة لبكتيريا Deinococcus proteolyticus، فإن نسبة الكتلة الحيوية تقاس بشكل أفضل مع نتائج DIA ( ) مقارنةً بنتائج DDA ( ). حيث لم نلاحظ انحرافًا كبيرًا من حيث الكتلة الحيوية بين استراتيجيتين الاكتساب، استنتجنا أن الإشارات التي تم ملاحظتها باستخدام كلا الطريقتين بعيدة عن العشوائية بين 437,578 إدخال بروتين في قاعدة بيانات DB48 وموثوقة. في أي حال، يمكن أن تساعد التحليلات الإضافية لمختلف الأدوات ومعلمات DIA التجريبية وخطوط أنابيب التفسير مجتمع الميتابروتيوميات في اعتماد DIA [2، 36]. إن أخذ شدة معايير البروتين أو الكائنات المحددة المضافة بكميات معروفة إلى العينة كمؤشرات مراقبة هو أمر ذو صلة لهدف كهذا.
استنادًا إلى النتائج المبلغ عنها هنا، يبدو أن وضع DIA متفوق على وضع DDA لتحليل الميكروبيوم، حيث يمكن تحديد وقياس المزيد من الببتيدات والبروتينات، كما تم إثباته بالفعل [37-39]، مما يوفر مزيدًا من المعلومات حول المسارات البيولوجية للنظام. هنا، لاحظنا أن حتى بكتيريا مضافة عند في مصفوفة البراز المعقدة مغطاة بشكل جيد من حيث التوصيف الوظيفي مع تحليل DIA Astral لمدة 30 دقيقة واحدة. ومع ذلك، فإن متوسط 3.0 ببتيد لكل مجموعة بروتين تم الحصول عليه في هذا التحليل، بينما هو أعلى من معظم الدراسات الحالية في الميتابروتيوميات، يشير إلى أن تنوع تسلسلات البروتين ونطاق الديناميكية للوفرة في عينات البراز هائل. لذلك لا يزال يحدث أخذ عينات عشوائية للببتيدات بواسطة مطياف الكتلة الثنائي، حتى مع هذا الجيل الجديد من مطياف الكتلة الثنائي، كما تم التنبؤ به سابقًا [3]. نتيجة لذلك، يجب بذل المزيد من الجهود التحليلية لتحقيق تغطية أكبر من هذا النوع من العينات. في الواقع، يمكن أن تكون عينات الميكروبيوم معقدة جدًا لدرجة أنها تقدم تحديات مثيرة للاهتمام من حيث الكروماتوغرافيا، ومطيافية الكتلة، والمعلوماتية. في رأينا، هذه عينات لا تقدر بثمن لاستكشاف ومقارنة أداء مطياف الكتلة الثنائي من الجيل التالي مع ترددات اكتساب MS/MS تزيد عن 200 هرتز، والتي من المرجح أن يتم تطويرها واقتراحها في المستقبل.
في الختام، نبلغ، من عينة واحدة، عن تحديد وقياس 44,204 مجموعة بروتين في تحليل DIA مع بحث FDR محكوم بـ ، وهو رقم رائد مقارنةً
جميع التقارير المنشورة حتى الآن حول عينات الميتابروتيوم الحقيقية التي نعلم بها. من المتوقع أن تكون هذه القيمة أعلى بكثير في المستقبل، بمجرد إجراء تحسينات محددة في جميع مراحل الإجراء التحليلي. إن القدرة على تضمين أكثر من 122,000 ببتيد فريد و38,000 مجموعة بروتين ضمن تشغيل DIA لمدة 30 دقيقة، مع الحفاظ على تكرارية جيدة جدًا عبر العمليات التحليلية، يعد أيضًا واعدًا جدًا. هذا الرقم القياسي المحدد من حيث عدد الببتيدات والبروتينات المكتشفة ليس له قيمة في حد ذاته ولكنه يسمح لنا بالتطلع إلى إمكانيات الميتابروتيوميات في المستقبل لمواجهة تحديات أكثر تعقيدًا، مثل مجموعات العينات المتتالية وعمق وظيفي محسّن. في النهاية، فإن محلل الكتلة Astral للعينات المعقدة للغاية يقرب الميتابروتيوميات من الاستخدام الروتيني في التشخيصات السريرية.

معلومات إضافية

تحتوي النسخة الإلكترونية على مواد إضافية متاحة علىhttps://doi. org/10.1186/s40168-024-01766-4.
الملف الإضافي 1: الجدول S1. قائمة الأنواع المحددة بواسطة بروتيوتيب DDA ( قيمة 0.05) لست مجموعات بيانات فردية.
الملف الإضافي 2: الجدول S2. النتائج التصنيفية المتراكمة بواسطة بروتيوتيب DDA.
الملف الإضافي 3: الجدول S3. قائمة الكائنات المختارة لبناء قاعدة بيانات تسلسل البروتين DB48.
الملف الإضافي 4: الجدول S4. قائمة الببتيدات والبروتينات المحددة من مطياف الكتلة Orbitrap Exploris 480 باستخدام اكتساب DDA.
الملف الإضافي 5: الجدول S5. قائمة البروتينات المحددة في مجموعات بيانات DIA لمدة 30 دقيقة (2Da-3 ms) (3 تكرارات).
الملف الإضافي 6: الجدول S6. التحليل الوظيفي لبروتينات المضيف والميكروبيوتا المحددة في مجموعات بيانات DIA لمدة 30 دقيقة (2Da-3 ms) (3 تكرارات).

شكر وتقدير

تود JA أن تشكر منطقة أوكيتاني (منحة DeepMicro) وشبكة IBISA GIS الفرنسية ووكالة البحث الوطنية (منحة Dyn-microbiome – مشروع – ANR-20-CE34-0012) على مساهمتها في تطوير الميتابروتيوميات في منصة ProGénoMix.

مساهمات المؤلفين

التصور، TD، OP، LG، JA. المنهجية، TD، RMP، CL، SR، OP، LG. التحقيق، TD، TMP، CL، SR، OP، LG، JA. الموارد، TD، CL، JA. الكتابة – المسودة الأصلية، JA. الكتابة – المراجعة والتحرير، جميع المؤلفين. الإشراف، LG، JA. الحصول على التمويل، JA. جميع المؤلفين قرأوا ووافقوا على المخطوطة النهائية.

التمويل

منطقة أوكيتاني بيري نيس-ميديتراني: منحة DeepMicro؛ وكالة البحث الوطنية: مشروع – ANR-20-CE34-0012 منحة Dyn-microbiome (https:// anr.fr/Project-ANR-20-CE34-0012).

توفر البيانات والمواد

تم إيداع بيانات بروتيوميات مطياف الكتلة في اتحاد ProteomeXchange عبر مستودع الشريك PRIDE تحت معرفات مجموعة البيانات PXD045838 (مجموعة بيانات Orbitrap Astral DDA)، PXD046290 (ملفات Orbitrap Astral DIA لمدة 15 و30 دقيقة)، PXD046320 (ملفات Orbitrap Astral DIA لمدة 60 و90 دقيقة)، وPXD047139 (ملفات Orbitrap Exploris 480 DDA لمدة 90 دقيقة). البيانات عامة.

الإعلانات

غير قابل للتطبيق.
غير قابل للتطبيق.

المصالح المتنافسة

يعلن المؤلفون عدم وجود مصالح متنافسة.
تاريخ الاستلام: 2 أكتوبر 2023 تاريخ القبول: 17 يناير 2024
تم النشر على الإنترنت: 07 مارس 2024

References

  1. Berg G, Rybakova D, Fischer D, Cernava T, Verges MC, Charles T, Chen X, Cocolin L, Eversole K, Corral GH, et al. Microbiome definition re-visited: old concepts and new challenges. Microbiome. 2020;8:103. https://doi. org/10.1186/s40168-020-00875-0.
  2. Van Den Bossche T, Arntzen MO, Becher D, Benndorf D, Eijsink VGH, Henry C, Jagtap PD, Jehmlich N, Juste C, Kunath BJ, et al. The Metaproteomics Initiative: a coordinated approach for propelling the functional characterization of microbiomes. Microbiome. 2021;9:243. https://doi.org/10. 1186/s40168-021-01176-w.
  3. Armengaud J. Metaproteomics to understand how microbiota function: The crystal ball predicts a promising future. Environ Microbiol. 2023;25:115-25. https://doi.org/10.1111/1462-2920.16238.
  4. Stewart HI, Grinfeld D, Giannakopulos A, Petzoldt J, Shanley T, Garland M, Denisov E, Peterson AC, Damoc E, Zeller M, et al. Parallelized acquisition of orbitrap and astral analyzers enables high-throughput quantitative analysis. Anal Chem. 2023;95:15656-64. https://doi.org/10.1021/acs.analc hem.3c02856.
  5. Stewart H, Grinfeld D, Wagner A, Kholomeev A, Biel M, Giannakopulos A, Makarov A, Hock C. A conjoined rectilinear collision cell and pulsed extraction ion trap with auxiliary DC electrodes. J Am Soc Mass Spectrom. 2023. https://doi.org/10.1021/jasms.3c00311.
  6. Guzman UH, Martinez Del Val A, Ye Z, Damoc E, Arrey TN, Pashkova A, Denisov E, Petzoldt J, Peterson AC, Harking F, et al. Narrow-window DIA: Ultra-fast quantitative analysis of comprehensive proteomes with high sequencing depth. In: bioRxiv. 2023.
  7. Heil LR, Damoc E, Arrey TN, Pashkova A, Denisov E, Petzoldt J, Peterson AC, Hsu C, Searle BC, Shulman N, et al. Evaluating the performance of the Astral mass analyzer for quantitative proteomics using data-independent acquisition. J Proteome Res. 2023. https://doi.org/10.1021/acs.jproteome. 3c00357.
  8. Ye Z, Sabatier P, Martin-Gonzalez J, Eguchi A, Bekker-Jensen DB, Bache N, Olsen JV. One-Tip enables comprehensive proteome coverage in minimal cells and single zygotes. In: bioRxiv. 2023.
  9. Petrosius V, Aragon-Fernandez P, Arrey TN, Üresin N, Furtwängler B, Stewart H, Denisov E, Petzoldt J, Peterson AC, Hock C, et al. Evaluating the capabilities of the Astral mass analyzer for single-cell proteomics. In: bioRxiv. 2023.
  10. Lozano C, Kielbasa M, Gaillard JC, Miotello G, Pible O, Armengaud J. Identification and characterization of marine microorganisms by tandem mass spectrometry proteotyping. Microorganisms. 2022;10. https://doi. org/10.3390/microorganisms10040719.
  11. Hayoun K, Gouveia D, Grenga L, Pible O, Armengaud J, Alpha-Bazin B. Evaluation of sample preparation methods for fast proteotyping of microorganisms by tandem mass spectrometry. Front Microbiol. 1985;2019:10. https://doi.org/10.3389/fmicb.2019.01985.
  12. Grenga L, Pible O, Miotello G, Culotta K, Ruat S, Roncato MA, Gas F, Bellanger L, Claret PG, Dunyach-Remy C, et al. Taxonomical and functional changes in COVID-19 faecal microbiome could be related to SARS-CoV-2 faecal load. Environ Microbiol. 2022;24:4299-316. https://doi.org/10.1111/ 1462-2920.16028.
  13. Ma ZQ, Chambers MC, Ham AJ, Cheek KL, Whitwell CW, Aerni HR, Schilling B, Miller AW, Caprioli RM, Tabb DL. ScanRanker: Quality assessment
    of tandem mass spectra via sequence tagging. J Proteome Res. 2011;10:2896-904. https://doi.org/10.1021/pr200118r.
  14. Pible O, Allain F, Jouffret V, Culotta K, Miotello G, Armengaud J. Estimating relative biomasses of organisms in microbiota using “phylopeptidomics.” Microbiome. 2020;8:30. https://doi.org/10.1186/s40168-020-00797-x.
  15. Demichev V, Messner CB, Vernardis SI, Lilley KS, Ralser M. DIA-NN: neural networks and interference correction enable deep proteome coverage in high throughput. Nat Methods. 2020;17:41-4. https://doi.org/10.1038/ s41592-019-0638-x.
  16. Kanehisa M, Goto S. KEGG: kyoto encyclopedia of genes and genomes. Nucleic Acids Res. 2000;28:27-30. https://doi.org/10.1093/nar/28.1.27.
  17. Kanehisa M, Sato Y, Morishima K. BlastKOALA and GhostKOALA: KEGG tools for functional characterization of genome and metagenome sequences. J Mol Biol. 2016;428:726-31. https://doi.org/10.1016/j.jmb. 2015.11.006.
  18. Krzywinski M, Schein J, Birol I, Connors J, Gascoyne R, Horsman D, Jones SJ, Marra MA. Circos: an information aesthetic for comparative genomics. Genome Res. 2009;19:1639-45. https://doi.org/10.1101/gr.092759.109.
  19. Darzi Y, Letunic I, Bork P, Yamada T. iPath3.0: interactive pathways explorer v3. Nucleic Acids Res. 2018;46:W510-3. https://doi.org/10.1093/nar/ gky299.
  20. Ramos-Nascimento A, Grenga L, Haange SB, Himmelmann A, Arndt FS, Ly YT, Miotello G, Pible O, Jehmlich N, Engelmann B, et al. Human gut microbiome and metabolite dynamics under simulated microgravity. Gut Microbes. 2023;15:2259033. https://doi.org/10.1080/19490976.2023. 2259033.
  21. Blakeley-Ruiz JA, Kleiner M. Considerations for constructing a protein sequence database for metaproteomics. Comput Struct Biotechnol J. 2022;20:937-52. https://doi.org/10.1016/j.csbj.2022.01.018.
  22. Bassignani A, Plancade S, Berland M, Blein-Nicolas M, Guillot A, Chevret D, Moritz C, Huet S, Rizkalla S, Clement K, et al. Benefits of iterative searches of large databases to interpret large human gut metaproteomic data sets. J Proteome Res. 2021;20:1522-34. https://doi.org/10.1021/acs.jproteome. 0c00669.
  23. Sun Z, Ning Z, Cheng K, Duan H, Wu Q, Mayne J, Figeys D. MetaPep: A core peptide database for faster human gut metaproteomics database searches. Comput Struct Biotechnol J. 2023;21:4228-37. https://doi.org/ 10.1016/j.csbj.2023.08.025.
  24. Grenga L, Pible O, Armengaud J. Pathogen proteotyping: a rapidly developing application of mass spectrometry to address clinical concerns. Clin Mass Spectrom. 2019;14 Pt A:9-17. https://doi.org/10.1016/j.clinms.2019. 04.004.
  25. Gouveia D, Pible O, Culotta K, Jouffret V, Geffard O, Chaumot A, DegliEsposti D, Armengaud J. Combining proteogenomics and metaproteomics for deep taxonomic and functional characterization of microbiomes from a non-sequenced host. NPJ Biofilms Microbiomes. 2020;6:23. https:// doi.org/10.1038/s41522-020-0133-2.
  26. Charlier P, Armengaud J. Did Saint Leonard suffer from Madura foot at the time of death? Infectious disease diagnosis by paleo-proteotyping. J Infect. 2023. https://doi.org/10.1016/j.jinf.2023.10.021.
  27. Oumarou Hama H, Chenal T, Pible O, Miotello G, Armengaud J, Drancourt M. An ancient coronavirus from individuals in France, circa 16th century. Int J Infect Dis. 2023;131:7-12. https://doi.org/10.1016/j.jid.2023.03.019.
  28. Brooks B, Mueller RS, Young JC, Morowitz MJ, Hettich RL, Banfield JF. Strain-resolved microbial community proteomics reveals simultaneous aerobic and anaerobic function during gastrointestinal tract colonization of a preterm infant. Front Microbiol. 2015;6:654. https://doi.org/10.3389/ fmicb.2015.00654.
  29. Kleikamp HBC, Pronk M, Tugui C, Guedes da Silva L, Abbas B, Lin YM, van Loosdrecht MCM, Pabst M. Database-independent de novo metaproteomics of complex microbial communities. Cell Syst. 2021;12:375-383 e375. https://doi.org/10.1016/j.cels.2021.04.003.
  30. Duan H, Zhang X, Figeys D. An emerging field: post-translational modification in microbiome. Proteomics. 2023;23:e2100389. https://doi.org/10. 1002/pmic. 202100389.
  31. Jiang N, Gao Y, Xu J, Luo F, Zhang X, Chen R. A data-independent acquisition (DIA)-based quantification workflow for proteome analysis of 5000 cells. J Pharm Biomed Anal. 2022;216:114795. https://doi.org/10.1016/j. jpba.2022.114795.
  32. Steger M, Demichev V, Backman M, Ohmayer U, Ihmor P, Muller S, Ralser M, Daub H. Time-resolved in vivo ubiquitinome profiling by
DIA-MS reveals USP7 targets on a proteome-wide scale. Nat Commun. 2021;12:5399. https://doi.org/10.1038/s41467-021-25454-1.
33. Zhang F, Ge W, Huang L, Li D, Liu L, Dong Z, Xu L, Ding X, Zhang C, Sun Y, et al. A Comparative analysis of data analysis tools for data-independent acquisition mass spectrometry. Mol Cell Proteomics. 2023;22:100623. https://doi.org/10.1016/j.mcpro.2023.100623.
34. Gomez-Varela D, Xian F, Grundtner S, Sondermann JR, Carta G, Schmidt M. Increasing taxonomic and functional characterization of hostmicrobiome interactions by DIA-PASEF metaproteomics. Front Microbiol. 2023;14:1258703. https://doi.org/10.3389/fmicb.2023.1258703.
35. Pietila S, Suomi T, Elo LL. Introducing untargeted data-independent acquisition for metaproteomics of complex microbial samples. ISME Commun. 2022;2:51. https://doi.org/10.1038/s43705-022-00137-0.
36. Van Den Bossche T, Kunath BJ, Schallert K, Schape SS, Abraham PE, Armengaud J, Arntzen MO, Bassignani A, Benndorf D, Fuchs S, et al. Critical Assessment of MetaProteome Investigation (CAMPI): a multi-laboratory comparison of established workflows. Nat Commun. 2021;12:7305. https://doi.org/10.1038/s41467-021-27542-8.
37. Zhao J, Yang Y, Xu H, Zheng J, Shen C, Chen T, Wang T, Wang B, Yi J, Zhao D, et al. Data-independent acquisition boosts quantitative metaproteomics for deep characterization of gut microbiota. NPJ Biofilms Microbiomes. 2023;9:4. https://doi.org/10.1038/s41522-023-00373-9.
38. Aakko J, Pietila S, Suomi T, Mahmoudian M, Toivonen R, Kouvonen P, Rokka A, Hanninen A, Elo LL. Data-independent acquisition mass spectrometry in metaproteomics of gut microbiota-implementation and computational analysis. J Proteome Res. 2020;19:432-6. https://doi.org/ 10.1021/acs.jproteome.9b00606.
39. Long S, Yang Y, Shen C, Wang Y, Deng A, Qin Q, Qiao L. Metaproteomics characterizes human gut microbiome function in colorectal cancer. NPJ Biofilms Microbiomes. 2020;6:14. https://doi.org/10.1038/ s41522-020-0123-4.

ملاحظة الناشر

تظل Springer Nature محايدة فيما يتعلق بالمطالبات القضائية في الخرائط المنشورة والانتماءات المؤسسية.

Journal: Microbiome, Volume: 12, Issue: 1
DOI: https://doi.org/10.1186/s40168-024-01766-4
PMID: https://pubmed.ncbi.nlm.nih.gov/38454512
Publication Date: 2024-03-07

The astounding exhaustiveness and speed of the Astral mass analyzer for highly complex samples is a quantum leap in the functional analysis of microbiomes

Thibaut Dumas , Roxana Martinez Pinna , Clément Lozano , Sonja Radau , Olivier Pible , Lucia Grenga and Jean Armengaud

Abstract

Background By analyzing the proteins which are the workhorses of biological systems, metaproteomics allows us to list the taxa present in any microbiota, monitor their relative biomass, and characterize the functioning of complex biological systems. Results Here, we present a new strategy for rapidly determining the microbial community structure of a given sample and designing a customized protein sequence database to optimally exploit extensive tandem mass spectrometry data. This approach leverages the capabilities of the first generation of Quadrupole Orbitrap mass spectrometer incorporating an asymmetric track lossless (Astral) analyzer, offering rapid MS/MS scan speed and sensitivity. We took advantage of data-dependent acquisition and data-independent acquisition strategies using a peptide extract from a human fecal sample spiked with precise amounts of peptides from two reference bacteria. Conclusions Our approach, which combines both acquisition methods, proves to be time-efficient while processing extensive generic databases and massive datasets, achieving a coverage of more than 122,000 unique peptides and 38,000 protein groups within a 30 -min DIA run. This marks a significant departure from current state-of-the-art metaproteomics methodologies, resulting in broader coverage of the metabolic pathways governing the biological system. In combination, our strategy and the Astral mass analyzer represent a quantum leap in the functional analysis of microbiomes.

Keywords Tandem mass spectrometry, Microbiome, Proteotyping, Taxonomy, Functional analysis
*Correspondence:
Jean Armengaud
jean.armengaud@cea.fr
Département Médicaments Et Technologies Pour La Santé (DMTS), Université Paris-Saclay, CEA, INRAE, SPI, 30200 Bagnols-Sur-Cèze, France
Thermo Fisher Scientific GmbH, 63303 Dreieich, Germany

Background

Microbial communities are challenging biological systems due to the diversity of their components, their dynamics in time and space, intricate and redundant functional capabilities, and their myriad of possible interactions and networks. Microbiome research has seen many advances in establishing the nature of their components, pointing at key functionally relevant species, and predicting their functions based on metagenomics information [1]. By identifying proteins and monitoring their quantities, metaproteomics is a methodology
that provides crucial information on the structural components, enzymes, and informational messengers of microorganisms, as well as on the host response, if any [2]. In addition to identifying the metabolic pathways in action and assessing their level of activity by means of their quantities, the methodology makes it possible to trace them back to the specific organisms that produced the corresponding proteins thanks to peptide sequences established by high-resolution tandem mass spectrometry. Metaproteomics therefore has a key role in deepening our knowledge of microbiomes, compared with methodologies limited to cataloguing microorganisms and genomic potential. Moreover, thanks to its extreme speed, this methodology could become an attractive new diagnostic tool for human medicine and the environment [3].
Microbiome research is strongly influenced by methodological advances. Recent developments in tandem mass spectrometry, acquisition strategies, and interpretation tools have great potential to transform metaproteomics into a high-performance methodology for deepening knowledge of microbial functioning. Metaproteomics grapples with an enormous amount of complex data, including giant databases of protein sequences built from metagenomic data or large numbers of sequenced organisms. Metaproteomics is also confronted with an exceptionally high number of proteins and variants from the sample, making the identification of common peptides easier than specific ones. Last, the lack of comprehensive coverage of the protein sequence database tends to decrease the outcome of the interpretation. Very recently, Stewart et al. [4] described the development of a new mass spectrometer that combines a powerful Orbitrap mass-resolving quadrupole, a novel ion processor rectilinear ion trap [5], and a revolutionary conceptual analyzer called Asymmetric Track Lossless (Astral) analyzer, enabling faster acquisition of high-resolution MS/MS spectra and high sensitivity compared with state-of-theart mass spectrometers. The results demonstrated by this novel instrument for proteomics are promising in terms of depth of analysis with 10,000 groups identified from a HeLa peptide extract over a single 48 -min run [4]. Such performance was further documented for comprehensive analysis of proteome post-translational modifications [6], plasma proteome [7], minimal cells [8], and single-cell proteomics [9]. Given these substantial improvements, in the present study, we explore its performance for profiling highly complex samples using a specific standard of human fecal material spiked with precise amounts of two bacterial proteomes. To fully exploit this new technology, we propose a novel workflow for metaproteomics, based on reliable proteotyping of microorganisms from short data-dependent acquisition (DDA), designing a specific
database selecting the most valuable genomes, recording of high-density datasets in data-independent acquisition, and interpretation for increased coverage of the key players in the microbiota.

Materials and methods

MetaP reference sample

Deinococcus proteolyticus and Balneola vulgaris [10] were cultivated at with agitation at 140 rpm agitation in LB and Marine broth, respectively. Cells were harvested at the stationary phase by centrifugation. Human fecal material was obtained from a healthy adult donor. Proteins were extracted and proteolyzed into peptides with trypsin as previously described [11]. Peptides obtained from the two bacteria and the fecal material were quantified using the Pierce Quantitative Peptide Assays and Standards (Thermo Fisher Scientific) according to the manufacturer’s instructions, and then mixed at a ratio of 2:1:97 for D. proteolyticus: B. vulgaris: fecal material to obtain the MetaP reference sample.

Orbitrap Astral mass spectrometry

NanoLC-MS/MS analysis was performed on an Orbitrap Astral MS coupled to a Vanquish Neo UHPLC system (Thermo Scientific ), interfaced with an EASY-Spray nano-source, and equipped with an IonOpticks-TS analytical column ( ) stabilized with a Heater THOR Controller (IonOpticks). The four gradients used were developed with formic acid/ (Eluant A) and formic acid/ acetonitrile/ (Eluant B): in 18 min followed by in 2 min ( 20 min gradient), in 25 min followed by in 5 min ( 30 min gradient), in 52 min followed by in 8 min ( 60 min gradient), and in 56 min followed by in 21 min and in 12 min ( 90 min gradient), followed by a column wash at for 9 min and re-equilibration. Peptides ( 125 ng ) were directly injected into the column. In DDA mode, the Orbitrap Astral MS was operated in positive mode with a fixed cycle time of 0.5 s with a full scan range of at a resolution of 120,000 . The automatic gain control (AGC) was set to “custom”, with a normalized AGC target of and a maximum injection time of 50 ms . Precursor ion selection width was set at 2 Da . Peptide fragmentation was triggered by higher-energy collisional dissociation (HCD) with an HCD collision energy set at . Fragment ion scans were recorded with the Astral analyzer with a scan range of . In DDA mode, 30 min and 60 min gradients were tested in injection triplicates. In DIA mode, the Orbitrap Astral MS was programmed at the highest MS resolution with a full scan range of . The normalized AGC target was set at
. For DIA measurements, the window width was set to 2 Da for the and gradients with a maximum injection time of 3 or 5 ms , respectively. This width was set at 3 Da for the , and 60 min gradients with a maximum injection time of and 7 ms , respectively. The loop control function was activated ( ). The acquisition range was after fragmentation of the isolated ions using HCD with normalized collision energy (NCE). In DIA mode, , and 90 min gradients were tested in analytical triplicate. A quantity of 125 ng of peptides was injected per analytical run.

Data interpretation for proteotyping organisms

Tandem mass spectrometry proteotyping was performed with each DDA dataset as previously described [12]. The top spectra were selected using Scanranker [13]. These MS/MS spectra were interpreted using Mascot version 2.6.1 (Matrix Science) against the NCBInrS database [12]. Peptide sequences were mapped to taxa at the species, genus, family, order, class, phylum, and superkingdom taxonomical ranks, as previously described [14], resulting in Taxon-to-Spectrum Matches (TSMs). TSMs and taxon-specific peptide sequences (spePEP) were used for the taxonomic identification of genera. Subsequently, a second round of search was initiated against a database derived from NCBInr encompassing all the identified genera and their descendants to identify the species.

DB48 database creation

The most abundant species identified by proteotyping were used to create a specific-sample database. A total of 48 organisms were selected, and their annotated protein sequences were downloaded from NCBI, and merged in a single fasta file, resulting in the DB48 database, comprising 437,578 protein entries and totaling 169,873,349 amino acids. The DB48 spectral library for DIA interpretation was deposited in Figshare and is directly available for download (https://figshare.com/articles/dataset/ DB48_SpectralLibrary_predicted_speclib/24638913).

Data metaproteomics interpretation

The acquired DDA raw data file ( 60 min , replicate 3) was processed with Proteome Discoverer v3.1 software, using eventually SEQUEST with CHIMERYS search algorithms. Standard parameters were applied, with Carbamidomethylation of cysteines as fixed modification, Oxidation of methionines as variable modification, target FDR for PSMs and peptides of maximum , minimum peptide length of 6 , and FDR for proteins of . DIA raw files were interpreted using DIA-NN 1.8.1 [15]. Deep learning-based spectral
library generation was conducted in silico based on the DB48 database. A maximum of 2 missed cleavages were allowed, 2 variable modifications (oxidation of methionines and acetylation of the N-terminus), peptide length ranging from 7 to 30 residues, precursor charge of 2 and range from 400 to 1008 , and fragment ion range from 200 to . Automatic inference mode was selected for precursor and MS1 accuracy. Match between replicate runs and no shared spectra functions were activated. Protein inference was conducted based on protein names.

Functional profiling of the host, microbiota, and spiked bacteria

The main protein within each identified protein group was employed for functional analysis, where the protein sequences were compared against the Kyoto Encyclopedia of Genes and Genomes (KEGG) database [16] using GhostKOALA tool [17]. KEGG orthologous (KO) terms were then assigned to KEGG pathways. In order to evaluate the depth of functional analysis, a percentage of pathway coverage was calculated by dividing the number of observed KO terms by the total number of KO terms in the pathway. Averaged protein abundance was used to quantify the weight of each pathway attributed to the host or microbiota. The contribution of each taxon within a function was illustrated using Circos tool [18]. The mapping of Deinococcus proteolyticus and Balneola vulgaris KO terms on the KEGG metabolic pathways was done with iPath 3.0 [19].

Orbitrap Exploris 480 mass spectrometry and data processing

The metaP standard was analyzed in triplicates on an Orbitrap Exploris 480 (Thermo Scientific ) tandem mass spectrometer coupled to a Vanquish Neo pump module (Thermo Scientific ). Peptides were desalted on a reverse-phase PepMap 100 C18 -precolumn ( 5 mm , i.d. , Thermo Scientific ) and separated on a EasySpray column ( 75 mm , C18 Å, Thermo Scientific ) at a flow rate of using a gradient from 0 to 85 min , and from 85 to 90 min ) of mobile phase and phase ). DDA mode was activated with a full mass scan from 375 to , an MS resolution of 120,000 and a MS/MS resolution of 15,000. Only peptides with 2 or 3 positive charges were selected for fragmentation with a dynamic exclusion time of 20 s and an isolation window of .
Fig. 1 Relative proteotyping signals for different taxonomical ranks grouped by identified phylum. Protein biomass estimated based on the TSMs signal assigned to these microorganisms is grouped per phylum at various taxonomical ranks

Mass spectrometry proteomics data

Mass spectrometry proteomics data have been deposited to the ProteomeXchange Consortium via the PRIDE partner repository under the dataset identifiers PXD045838 (Orbitrap Astral DDA dataset), PXD046290 (15 and 30 min Orbitrap Astral DIA files), PXD046320 (60 and 90 min Orbitrap Astral DIA files), and PXD047139 ( 90 min Orbitrap Exploris 480 DDA files).

Results

DDA-based proteotyping to identify the most abundant organisms in the sample

NanoLC-MS/MS runs were carried out with 125 ng of the MetaP reference sample specifically created for this test of the Orbitrap Astral tandem mass spectrometer, using 30 min and 60 min gradients, in triplicate each. Proteotyping interpretation of these six datasets against a generic NCBInr-derived database encompassing protein sequence information from 50,995 different species was limited to the best spectra for each, as assessed by the Scanranker tool. This first round of searching was exploited to identify observable genera in each dataset. A database comprising all the descendants of the identified genera was built for each dataset and
used to perform a second search to identify organisms at the species taxonomical rank. The species identified in these six independent analyses are listed in Table S1, along with the corresponding number of taxon-specific peptides and Taxon-to-Spectrum Matches (TSMs) at the various taxonomical ranks. Table S2 provides a reliable list of the 9 phyla, 44 genera, and 56 species that were proteotyped through the merging of these results, along with their respective contribution to protein biomass (Fig. 1). The overall TSMs signal decreases slightly when moving down the taxonomical hierarchy, from at the phylum level to at the family and at the genus level, respectively. A more pronounced decrease is observed when moving from the genus to the species level ( ). This indicates that the genus level is well covered by the representative reference genomes in the database used for the proteotyping, while lower sequence coverage is observed at the species level. The proteotyping specificity of this taxonomical rank is therefore slightly lower compared to higher taxonomical ranks. Remarkably, for Deinococcus proteolyticus, Balneola vulgaris, and Homo sapiens, whose sequenced genomes are present in the database, no decrease is observed along the taxonomical ranks (Fig. 1). The largest decrease in
the ratio is observed for Ascomycota and Actinobacteria, suggesting that the proteotyped species within these two phyla are only weakly representative. Given that their overall contributions are small, this has minimal impact on the results. In fact, the global TSMs signal, which represents of the initial value, underscores the relevance of the species level across most phyla.
Amongst the 13 Eukaryota, the host Homo sapiens is logically the most abundant species, accounting for over of the protein biomass. Eleven species affiliated to Streptophyta phylum were detected, representing a total of 9.9% of protein biomass, with Glycine max, Helianthus annuus, and Oryza sativa being the most abundant residual food components. Only one species assigned to Ascomycota, Saccharomyces cerevisiae, was identified. Among the 43 bacterial species identified, Faecalibacterium prausnitzii, Anaerobutyricum halliii, and Coprococcus eutactus were the most abundant, accounting for , , and of protein biomass, respectively. The least abundant organism, Clostridium bartlettii CAG:1329, represented only of the protein biomass but was reliably detected with 10 species-specific peptides in the best analytical run. No archaea were identified in this biological material sampled from a healthy young person on a meat-free diet. As expected, Firmicutes dominated the microflora with 33 identified species, accounting for of the protein biomass. Notably, the two spiked bacteria never reported in the fecal microbiota, Deinococcus proteolyticus and Balneola vulgaris, were identified with 237 and 55 species-specific peptides in the best analytical run, respectively. They accounted for and of the protein biomass, respectively, as calculated from the TSMs signal assigned for the six interpreted datasets. While the second percentage corresponds very precisely to the expected added quantity of Balneola vulgaris ( ), the first value overevaluates the added quantity of Deinococcus proteolyticus ( ), indicating that the parsimony rules for establishing TSMs should be improved. The dynamic range of taxa assessed by metaproteomics shows that a relatively small number of genera dominate the sample in terms of biomass, with five genera (Homo, Clostridium, Faecalibacterium, Coprococcus, and Anaerobutyricum) contributing to almost 50% of the protein biomass. Next, we built the DB48 protein sequence database customized to represent only those organisms identified by tandem mass spectrometry proteotyping, which should account for the bulk of the protein biomass, i.e., of the total (Table S3).

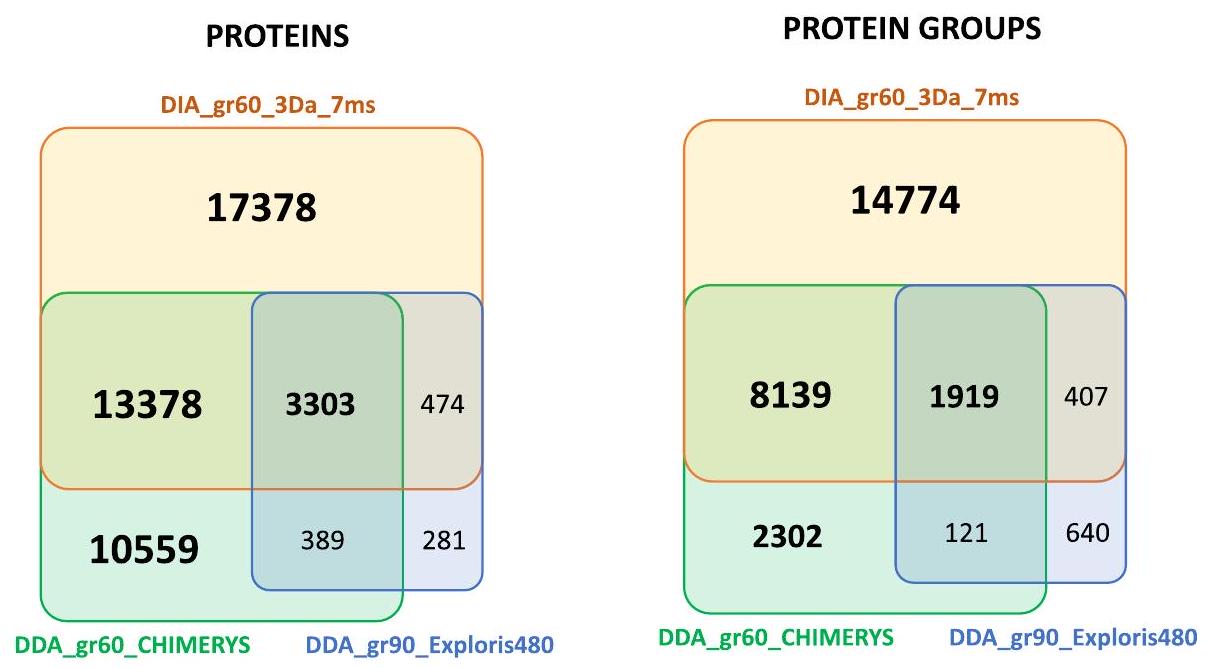
Astral DDA current state-of-the-art metaproteomics is improved

Due to the high diversity of peptides present in the MetaP standard, a large portion of the MS/MS spectra
are expected to be chimeric, leading to a decrease in the assignment ratio. Preliminary testing was performed on a single DDA dataset (replicate 3) using the DB48 protein sequence database restricted to the most abundant organisms present in the sample. The new CHIMERYS algorithm (MSAID, Germany) integrated into Proteome Discoverer for the identification of chimeric spectra identified 158,716 PSMs, 42,996 peptide sequences, 27,628 proteins, and 12,480 protein groups. The ratio of MS/MS spectra assigned is and the ratio of peptide sequences per protein group is 3.45 , which are both rather high compared to most previously reported metaproteomics studies. This last interpretation demonstrates the high quality of the peptide preparation and proteolysis since of the peptides have no missed cleavages, of the peptides resulted from a unique missed cleavage, and only are explained by two missed cleavages. In terms of precursor charge, 69.4% have 2 positive charges, have 3 positive charges, and have 4 charges. The differences in terms of assignation ratio and diversity of peptide sequence confirm the great benefit of artificial intelligence for interpreting very complex metaproteomics datasets. The Astral instrument performance was compared to the Orbitrap Exploris 480 using the exact same metaP reference sample. Each of the three 90 -min DDA acquisition measurements generated an average of MS/MS spectra, resulting after querying the DB48 in an average of PSMs, peptide sequences, and protein groups (Table S4). Those results are consistent with those reported for other human fecal samples using the same instrument but with a longer gradient [20]. In DDA mode, the performance of the Astral and CHIMERYS tool interpretation resulted in almost 10 times more PSMs, a threefold increase in the number of peptides and protein groups identified, with only two-thirds of the dedicated time to mass spectrometry. Figure 2 shows the comparison between the two instruments in terms of protein coverage. These results indicate the new current state-of-the-art metaproteomics that can be achieved based on DDA datasets acquired with the Orbitrap Astral tandem mass spectrometer.

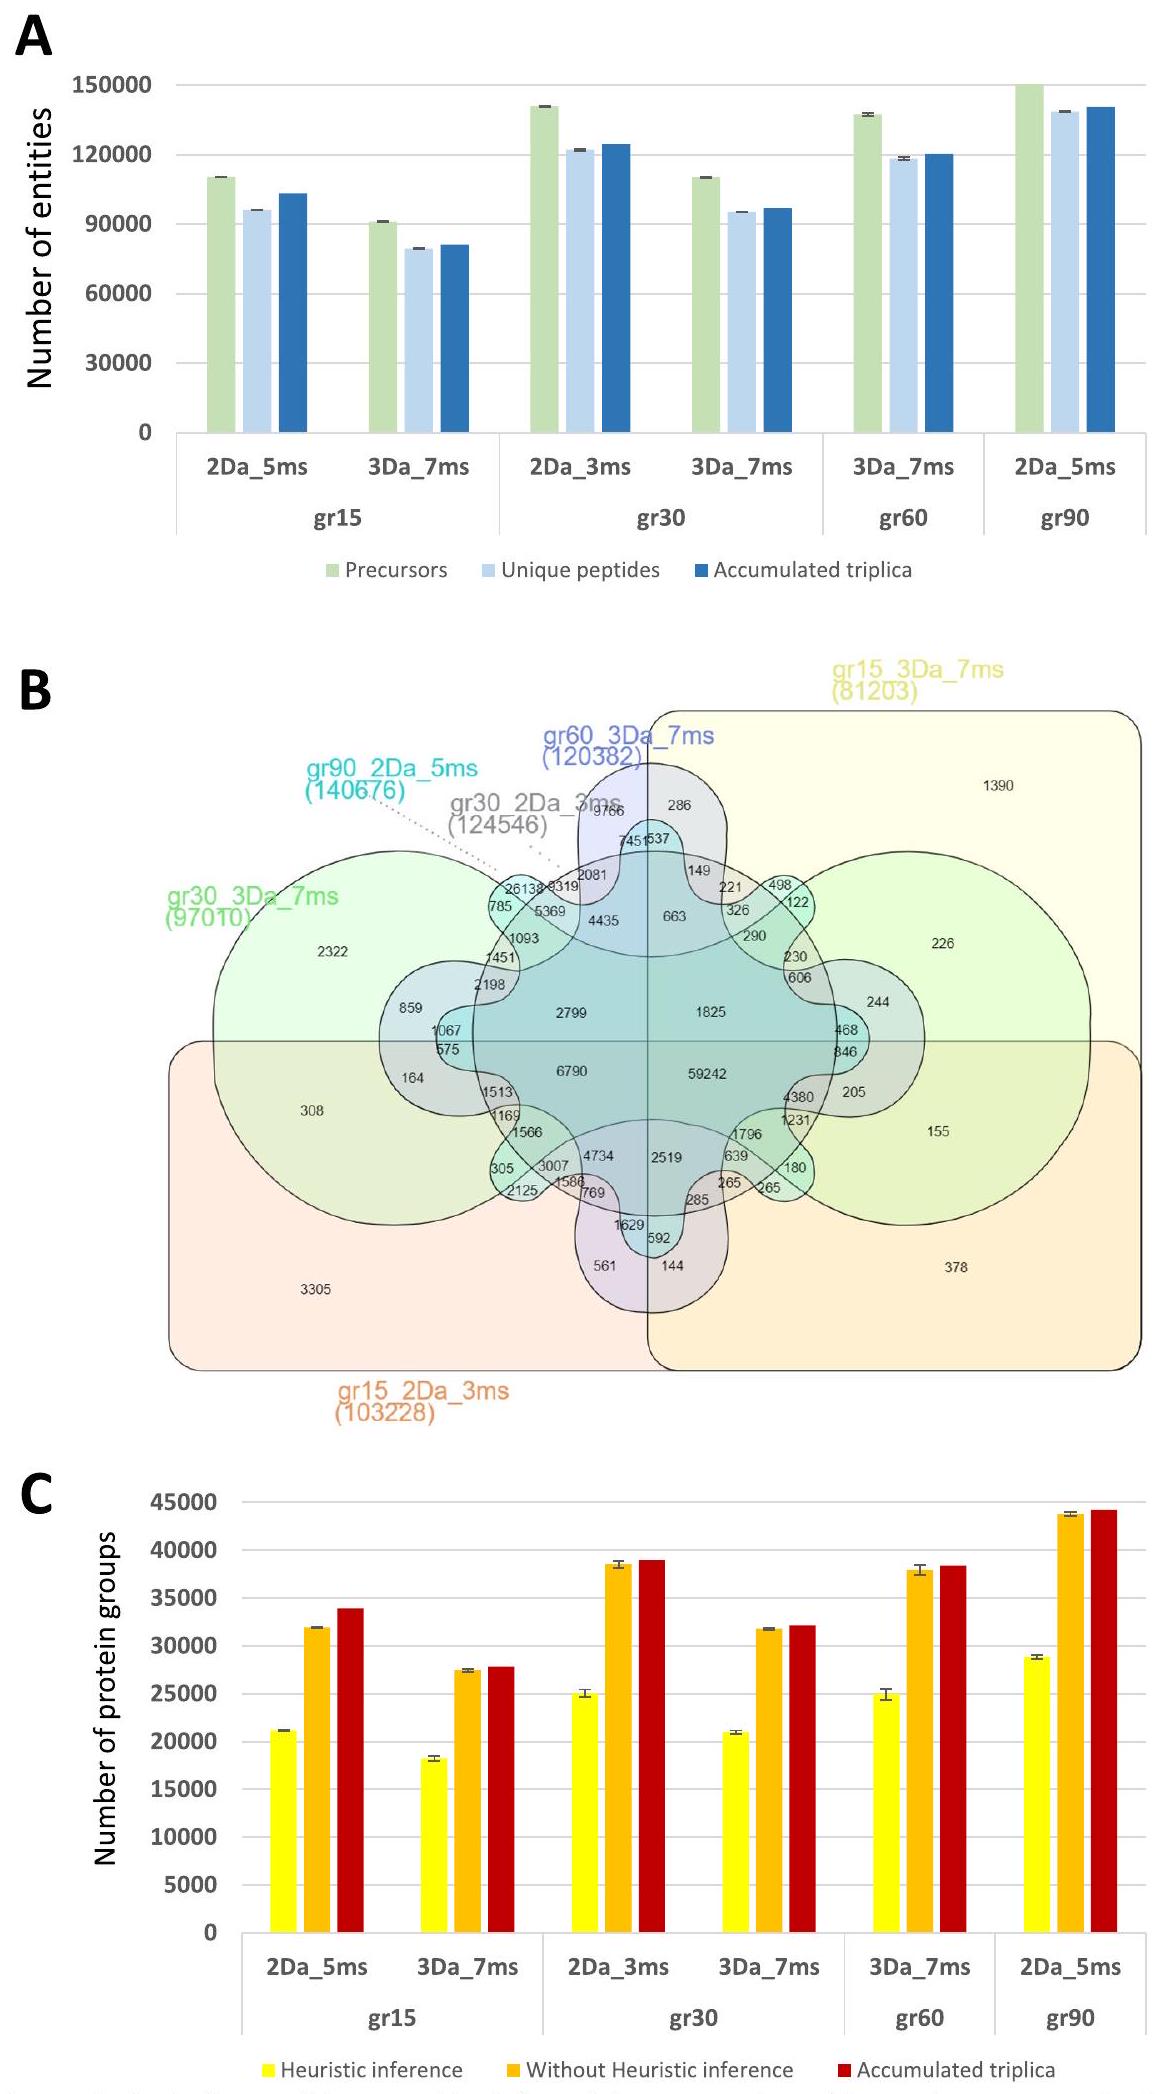
DIA metaproteomics increases significantly peptide coverage and protein detection

To investigate the Astral performance in DIA mode and assess the extent to which it improves the depth of metaproteome knowledge, DIA analyses with different LC-MS/MS acquisition parameters were carried out. We recorded triplicate analyses of the MetaP standard using gradients spanning , and 90 min . Data interpretation was performed with a spectral library generated in silico for DIA-NN, and the results were
Fig. 2 Venn diagram depicting the common and specific features of proteins and protein groups detected by three methodologies. The dataset used was acquired with a 60-min gradient (replicate 3) for chimerys DDA and DIA-NN DIA Orbitrap Astral, and 90 min gradient for Orbitrap Exploris 480
presented either in normal mode or in heuristic protein inference mode. This last option avoids protein accession redundancies across multiple protein groups, giving more appropriate results for subsequent functional analysis, albeit with a reduction in the number of protein groups listed. This data interpretation shows improved interpretation compared to the DDA dataset (Fig. 2) and high reproducibility between replicates (Fig. 3). A total of 188,442 peptide sequences are observed when totaling the 18 analytical runs and 59,242 peptide sequences are observed across all six conditions. For example, in the dataset acquired in 30 min of gradient ( 2 Da fragmentation window and 3 s injection time), 140,857 ( ) precursors, 122,087 peptide sequences, and protein groups were observed in average per analytical run. When cumulating the three replicates, a total of 124,546 peptide sequences and 38,987 protein groups were observed under these experimental conditions. Logically, the longer gradient tested, 90 min , resulted in a larger landscape with an average of 138,596 unique peptides and 44,204 protein groups. For the 60 -min gradient, 118,262 peptide sequences and 37,934 protein groups were observed, thus a significant increase compared to the gradient DDA CHIMERYS analysis with and fold change, respectively. Overall, these results emphasize the benefit of DIA analyses for peptide and protein identification. Noteworthy, the 15 min gradient ( ) performs very well with 96,102 peptide sequences identified and 31,928 protein groups, with an average of 3.0 peptides per protein group.

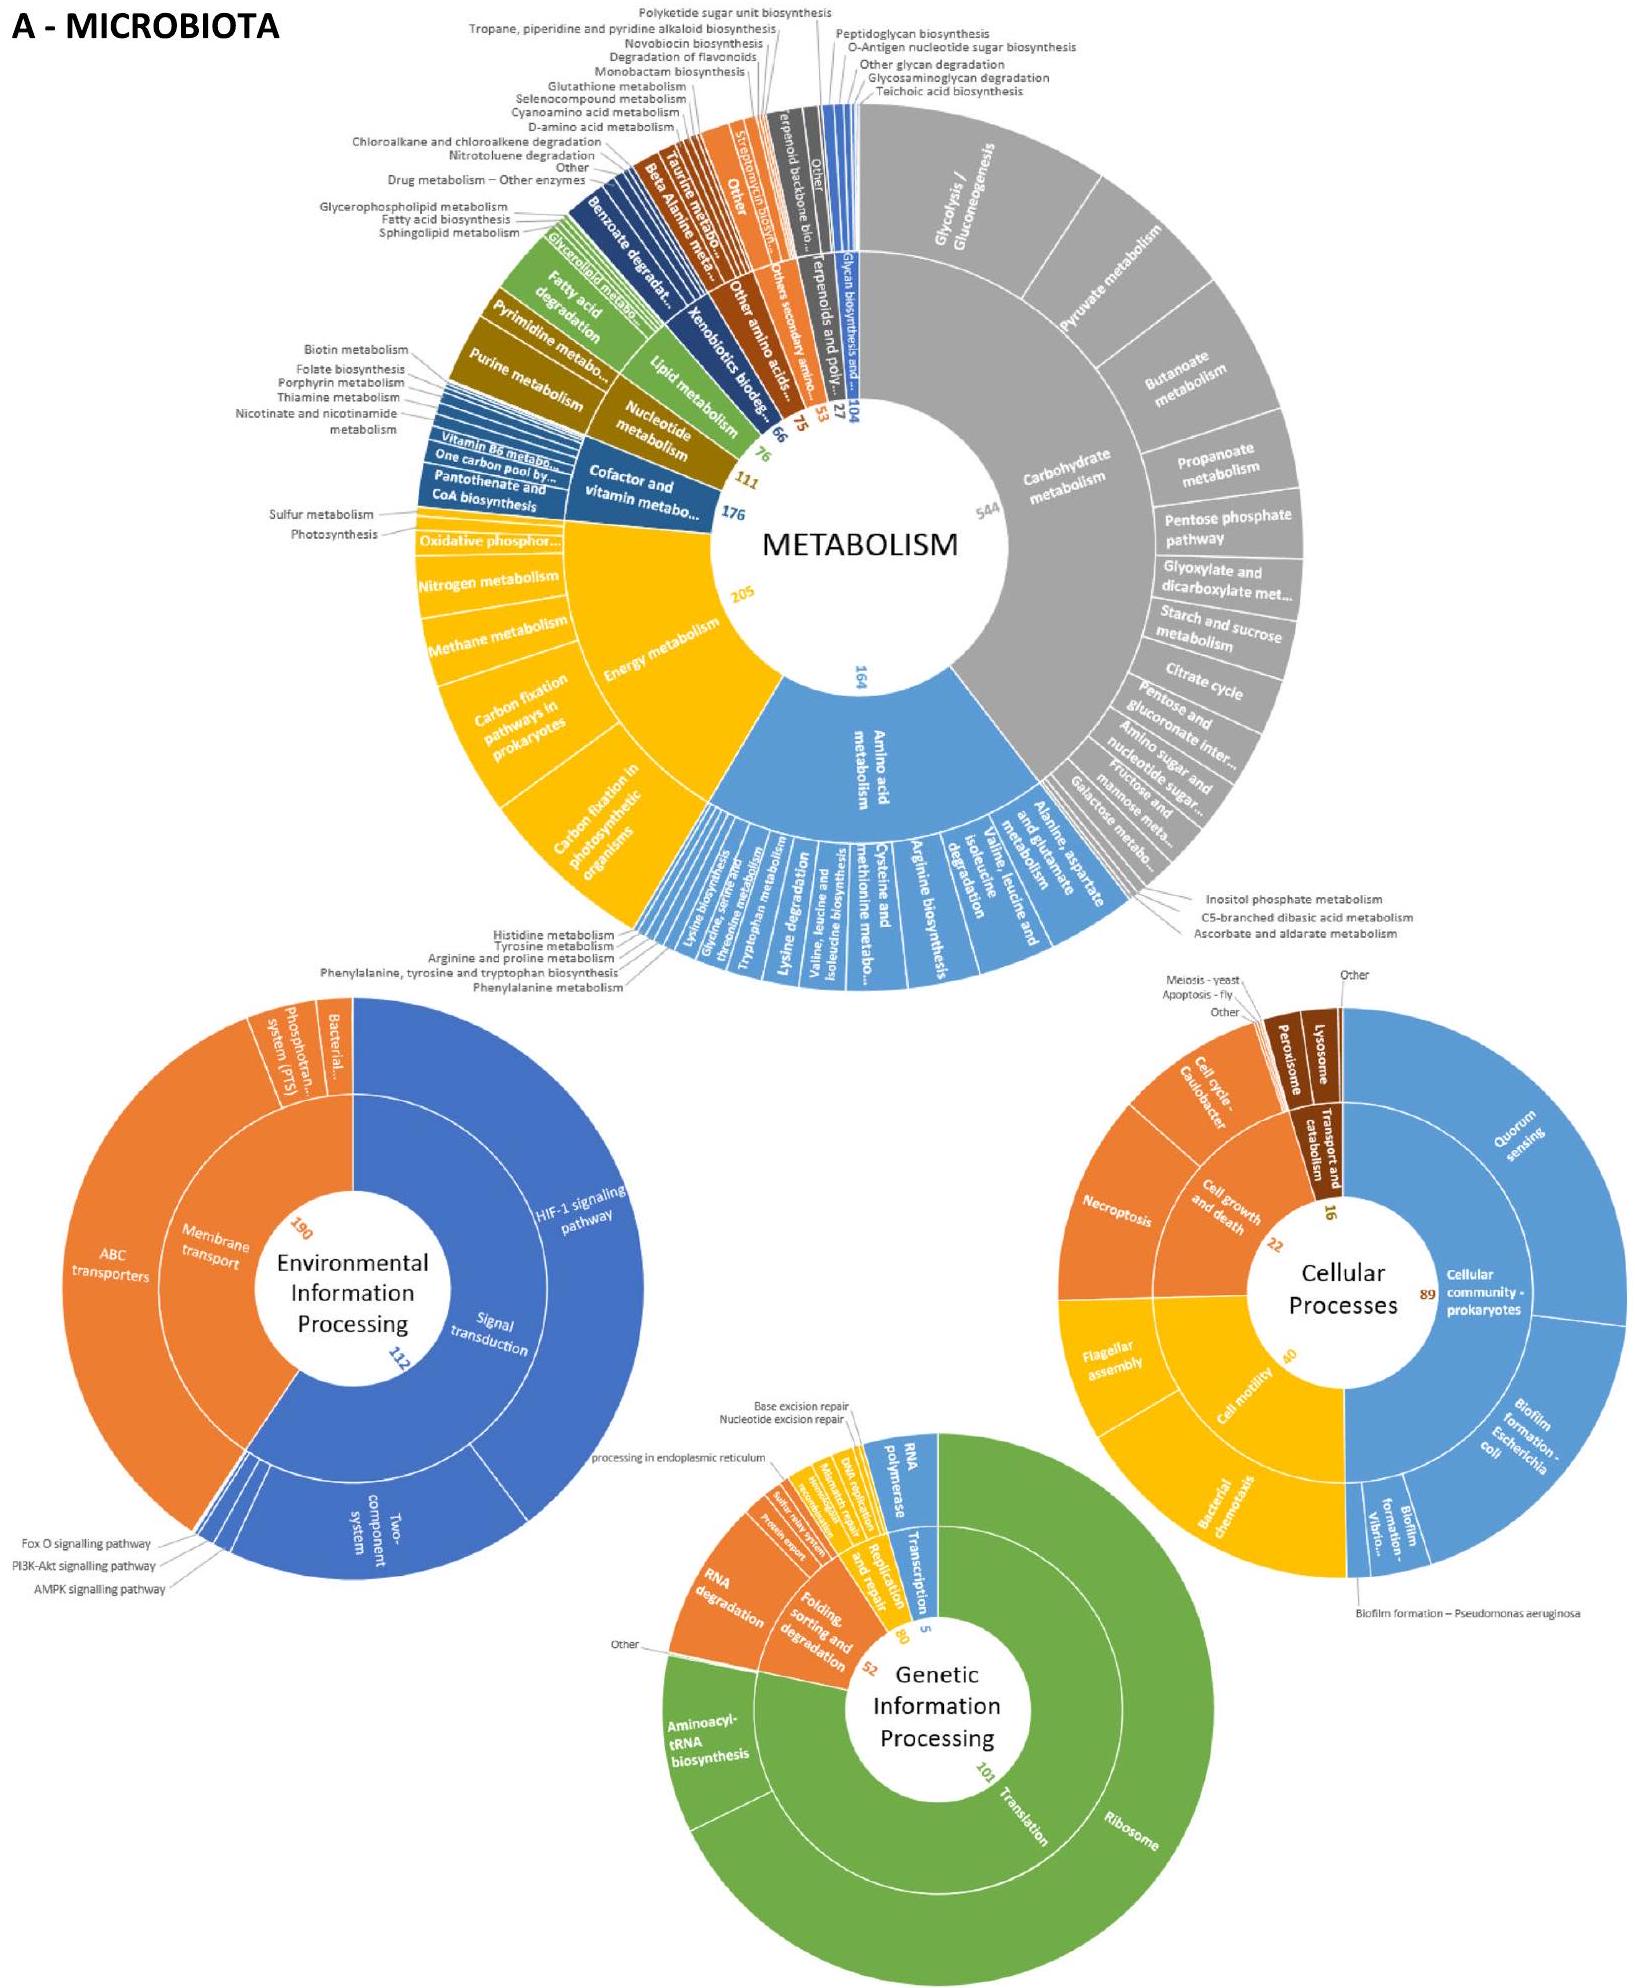
Significantly improved panorama of metabolic pathways relies on extra-large DIA peptidome landscape

To unveil the full potential of the Orbitrap Astral mass spectrometer to advance our understanding of diverse biological systems, we further explored the results of the 30 -min DIA gradient ( ), as it offers a good compromise between acquisition time and performance. The proteins identified were annotated using the KEGG database. Across the three analytical replicates, a total of 25,283 distinct protein groups were successfully annotated, with an average of protein groups per analytical run. Of these, 997 proteins originated from the host ( of cumulated abundance), 2,036 proteins from the residual diet ( of abundance), 20,418 from the microbiota ( of abundance), while B. vulgaris and D. proteolyticus accounted for 743 and 1089 proteins, 1.1 and of abundance, respectively (Table S5). It should be noted that the latter two percentages are in relatively good agreement with the experimental design of the MetaP sample, indicating that cumulative protein abundance could be a good indicator for estimating the percentage biomass of each taxon. This also shows that the interpretation of the DIA and DDA datasets is fairly convergent when it comes to establishing the percentage biomass of a taxonomic unit, although here two different surrogate variables, namely protein intensity and TSM, were used.
Notably, out of 22,250 of microbial proteins and ( 886 out of 997) of human proteins had existing KO annotations (Table S5). Host and microbial proteins were found to be involved in 367 and 191 biological pathways, respectively, covering five functional
Fig. 3 DIA interpretation results for the five conditions tested in triplicate. A Average numbers of detected precursors and unique peptides for the three replicates, and accumulated unique peptides. Venn diagram of unique peptides among the five conditions. Average numbers of protein groups with or without heuristic inference, and accumulated protein groups when summing the three replicates
Fig. 4 Abundance of all identified KEGG pathways for the host and the microbiota. A Host. B Microbiota. The proportion of the pathway depends on the protein biomass. The inner numbers represent the number of KO terms recorded in the pathways
Fig. 4 continued
Fig. 5 Functional pathways and genera relationships The phylum of each of the 29 microbial genera identified in the dataset is indicated as well as the functional subcategories grouped per KEGG pathway category
categories: metabolism, genetic information processing, environmental information processing, cellular processes, and human diseases (Table S6). Their general distribution is shown in Fig. 4. Interestingly, the general collection of ‘carbohydrate metabolisms’ KEGG pathways has both the highest abundance rate and the highest number of KO functions (544) for the microbiota. Even pathways including less abundant proteins, such as ‘cell motility’, show a depth of coverage of over (Table S6). When we delved into the contributions of different microbial genera to the functional diversity of the gut, we observed that we were able to explore functions even
within relatively less represented taxa, supporting the potential of the Orbitrap Astral instrument in shedding light on the peculiar role of the entire microbiota (Fig. 5).
Turning our attention to the spiked B. vulgaris and . proteolyticus, annotation of their identified proteins, amounting to 743 and 1089, provided us with a functional snapshot of and of their proteomic profile, respectively. Figure 6 shows the overlap and specific coverage of their metabolic pathways. Although the amount of B. vulgaris is lower than that of D. proteolyticus ( ), we found that folate cofactor production and phenylpropanoid synthesis are important within the
Fig. 6 Comparative KEGG metabolism landscape of B. vulgaris and D. proteolyticus. Colors distinguish the metabolic pathways shared between the two spiked bacteria and those specific to each
marine bacterium. Proteins for the metabolism of several amino acids (Histidine, Tryptophane, Valine, Leucine, and Isoleucine) and proteases are specifically detected in D. proteolyticus, in line with the characteristics reported for this bacterium and reflected in the species epithet.
Finally, host-specific proteins were annotated within 367 KEGG-level 2 pathways, with signal transduction standing out as one of the most densely populated pathways in terms of KO annotations. The depth of coverage reached for ‘Endocrine and other factor-regulated calcium reabsorption’ (Table S6). In this dataset, despite having low coverage, pathways known to play a crucial role in microbiota-host interaction, such as that related to the immune system function, are highly informative.

Discussion

The Orbitrap Astral next-generation tandem mass spectrometer, recently released by Thermo, is based on Orbitrap technology, a new ion processor rectilinear trap developed to rapidly inject ions obtained after precursor fragmentation [5], and the powerful Astral multi-reflection analyzer. This last device incorporates multiple oscillations between two electrostatic mirrors, resulting in a total flight length for secondary ions exceeding 30 m . Its performance consists of a mass resolving power of
100,000 at the MS/MS scanning frequency of 200 Hz . The performance of this instrument has already been documented for various applications in human proteomics and for a simple mixture of peptides from three organisms, where 14,000 proteins were reported for a 28 -min gradient [6]. Here, we present for the first time the results obtained for a real-life metaproteomics sample. Although the peptide mixture obtained from a human fecal sample spiked with peptides from known bacteria is very complex, the number of MS/MS scans over 60 min was over 331 thousand in DDA mode, i.e. an average of 92 scans per second. The parameters used here were optimal for short gradients, but further optimization would definitely improve results for long gradients, for which more peptide material could be used. This recorded dataset is of high quality, resulting in the identification of over 42,000 unique peptides, but even better datasets were recorded in DIA mode, with the identification of over 122,000 unique peptides in just 30 min . Information density is exceptionally high, with the size of the DDA 60 min and DIA 30 min raw files being each. The three fold increase in unique peptides is not detrimental to the ratio of peptides per protein, indicating that the confidence in the DIA results should be in the same range as DDA results.
The approach proposed here to take advantage of the large datasets recorded by the Orbitrap Astral tandem mass spectrometer is based on (i) a DDA survey of the sample to proteotype organisms without any a priori at the genus or species level using a generic database derived from the NCBInr database, (ii) the construction of a dedicated database representing, as far as possible, the organisms that contribute the most to protein biomass, and (iii) the interpretation of large DIA datasets with a sample-specific database of limited size. Current strategies for interpreting DIA datasets based on large databases, such as metagenomic data acquired on the same sample [21] or a catalog dedicated to the gut microbiome such as MetaHit [22], face significant challenges due to the exceptionally large search space and computational limitations. The use of a peptide database gathering all peptides already identified in previous studies on the human gut microbiome is an interesting alternative that has recently been explored [23], but its a priori design may be detrimental to the characterization of atypical samples. Indeed, the two spiked bacteria used in the present study, which were never reported in previous analyses of the gut microbiome, would have been missed by conventional interpretation approaches. Here, proteotyping based on accurate and reliable taxonomic information derived from high-quality peptide sequences identifies the organisms present in the sample at genus, species, or even strain taxonomical ranks. This methodology has great potential for the rapid diagnostics of complex samples [3,24], having the capacity to accurately estimate the biomass of each identified taxon [14]. It has been successfully applied to assess dysbiosis in the gut microbiome of COVID-19 patients [12], to identify keystone microbial players in sentinel animals [25], or to determine the presence of pathogens on ancient human remains [26, 27]. Tandem mass spectrometry proteotyping leads to a fine-grained taxonomy resolved metaproteomic strategy, as initially proposed for less complex samples [28]. Here, we constrained our proteotyping search to a subset of spectra due to computational limits but obtained a similar landscape of organisms to select for database construction, regardless of the Orbitrap Astral dataset employed. Consequently, a quick Orbitrap Astral DDA survey of gradient would in principle be more than sufficient to rapidly create the customized database for the DIA interpretation. We are convinced that this two-stage approach is appropriate for the analysis of such complex samples: (i) reliable taxonomic proteotyping is used to select the most appropriate database, and then, (ii) classical proteomics interpretation is carried out, each step being appropriately FDR-constrained. This procedure is by nature exactly the same as that used for classical proteomics: if a human or Escherichia
coli sample is processed, the database chosen for interpretation will be selected accordingly on the basis of the prior information available. Without prior knowledge, proteotyping will easily determine whether the sample contains human or enterobacterial proteins and the final database for proteomic interpretation will logically be customized. Although the database for metaproteomic interpretation of gut microbiome samples may not be comprehensive enough to encompass all protein variant sequences present in the sample, the strategy we propose is highly effective, as demonstrated in the present study. The results of such a strategy will be further strengthened in the near future as the number of genomes available in generalist databases increases over time. Certainly, the addition of a new interpretation dimension, such as de novo sequencing interpretation [29], error-tolerant searches, or searches for multiple post-translational modifications [30], to exploit the MS/MS signals that have not yet been assigned with the current strategy, will certainly benefit the results. However, the computational limitations of the corresponding software would need to be lifted in order to be applied to the very large DIA datasets acquired by the Orbitrap Astral instrument.
DIA data can also be interpreted with an experimental spectral library based on DDA data acquired on the same sample. However, several benchmark studies have revealed that interpretation of DIA data without a library gives better results than library-based strategies [31-33] or similar results [34]. Indeed, such a spectral library for metaproteomics datasets will only be partial for interpreting DIA results as the DDA dataset is far from complete enough. Here, more specifically the parameters used for DDA acquisition in this study record more chimeric spectra than conventional parameters, thus compromising the result of the spectral library. Last, the unusual size of the dataset makes this strategy very demanding in terms of computing resources. Another alternative consists of generating a pseudo-spectral library directly from the DIA data to facilitate database construction [35], but pipelines have not been yet optimized for the Orbitrap Astral datasets. Clearly, it is of utmost importance to improve proteomic and metaproteomic software for handling giant Astral datasets and benchmark all possible strategies within the metaproteomic initiative framework [36]. The DIA interpretation results obtained here, 122,087 peptide sequences on average for a of gradient on the MetaP reference sample, can be compared favorably with results obtained very recently on similar biological material but with different instruments and parameters: 11,122 peptide sequences for a gradient [35], 49,224 peptide sequences for a gradient [34], and 70,272 peptides for a 130 -min gradient [37].
The biomasses of the identified organisms estimated from the DDA and DIA datasets are relatively comparable, while the former is estimated on the number of TSMs and the latter on precursor intensity. For example, the Balneola vulgaris bacterium added to MetaP standard to represent of the total peptidome was estimated at and , respectively. The Streptophyta (food) represented and , respectively. For the Deinococcus proteolyticus bacterium, the percentage of biomass is better measured with DIA results ( ) than with DDA results ( ). As we did not observe a significant skew in terms of biomass between the two acquisition strategies, we concluded that the signals observed with both methods are far from random among the 437,578 protein entries in the DB48 database and are reliable. In any case, further analysis of various instruments, experimental DIA parameters, and interpretation pipelines could help the metaproteomics community to adopt DIA [2, 36]. Taking into account the intensity of protein standards or specific organisms added in known quantities to the sample as monitoring indicators is relevant for such an objective.
Based on the results reported here, DIA mode appears superior to DDA mode for microbiome analysis, as more peptides and proteins can be identified and quantified, as has already been established [37-39], providing more information on the biological pathways of the system. Here, we observed that even a bacterium added at in the complex fecal matrix is well covered in terms of functional characterization with a single 30 -min DIA Astral analysis. However, the average of 3.0 peptides per protein group obtained in this analysis, while higher than most current metaproteomics studies, indicates that the diversity of protein sequences and the dynamic range of abundance in fecal samples are huge. Random peptide sampling by the tandem mass spectrometer therefore still occurs, even with this new generation of tandem mass spectrometers, as previously predicted [3]. As a result, further analytical efforts should be made to achieve greater coverage of this type of sample. Indeed, microbiome samples can be so complex that they present interesting challenges in terms of chromatography, mass spectrometry, and informatics. In our view, these are invaluable samples for probing and comparing the performance of next-generation tandem mass spectrometers with MS/MS acquisition frequencies above 200 Hz , which will most likely be developed and proposed in the future.
In conclusion, we report, from a single sample, the identification and quantification of 44,204 protein groups in a DIA analysis with a controlled FDR search of , a groundbreaking figure compared with
all reports published to date on real-life metaproteomic samples of which we are aware. This value is set to be much higher in the future, once specific optimizations have been made at all stages of the analytical procedure. The ability to encompass more than 122,000 unique peptides and 38,000 protein groups within a 30 -min DIA run, while maintaining a very good repeatability across analytical runs, is also very promising. This specific record in terms of the number of peptides and proteins detected is futile in itself but allows us to glimpse the possibilities of metaproteomics for the future to tackle more complex challenges, such as consequent cohorts of samples and improved functional depth. Ultimately, the Astral mass analyzer for highly complex samples brings metaproteomics closer to routine use in clinical diagnostics.

Supplementary Information

The online version contains supplementary material available at https://doi. org/10.1186/s40168-024-01766-4.
Additional file 1: Table S1. List of identified taxa by DDA proteotyping ( value 0.05 ) for six individual datasets.
Additional file 2: Table S2. Cumulated taxonomical results by DDA proteotyping.
Additional file 3: Table S3. List of organisms selected for building the DB48 protein sequence database.
Additional file 4: Table S4. List of identified peptides and proteins from the Orbitrap Exploris 480 mass spectrometer using a DDA acquisition.
Additional file 5: Table S5. List of identified proteins in the 30 min (2Da-3 ms) DIA datasets (3 replicates).
Additional file 6: Table S6. Functional analysis of host and microbiota proteins identified in the 30 min (2Da-3 ms) DIA datasets (3 replicates).

Acknowledgements

JA would like to thank the Région Occitanie (DeepMicro grant), the French IBISA GIS network, and the Agence Nationale de la Recherche (Dyn-microbiome grant-Project-ANR-20-CE34-0012) for contributing to the development of metaproteomics in the ProGénoMix platform.

Authors’ contributions

Conceptualization, TD, OP, LG, JA. Methodology, TD, RMP, CL, SR, OP, LG. Investigation, TD, TMP, CL, SR, OP, LG, JA. Resources, TD, CL, JA. Writing – original draft, JA. Writing – review and editing, all authors. Supervision, LG, JA. Funding acquisition, JA. All authors read and approved the final manuscript.

Funding

Région Occitanie Pyrénées-Méditerranée: DeepMicro grant; Agence Nationale de la Recherche: Project-ANR-20-CE34-0012 Dyn-microbiome grant (https:// anr.fr/Project-ANR-20-CE34-0012).

Availability of data and materials

Mass spectrometry proteomics data have been deposited to the ProteomeXchange Consortium via the PRIDE partner repository under the dataset identifiers PXD045838 (Orbitrap Astral DDA dataset), PXD046290 (15 and 30 min Orbitrap Astral DIA files), PXD046320 (60 and 90 min Orbitrap Astral DIA files), and PXD047139 (90 min Orbitrap Exploris 480 DDA files). The data are public.

Declarations

Not applicable.
Not applicable.

Competing interests

The authors declare no competing interests.
Received: 2 October 2023 Accepted: 17 January 2024
Published online: 07 March 2024

References

  1. Berg G, Rybakova D, Fischer D, Cernava T, Verges MC, Charles T, Chen X, Cocolin L, Eversole K, Corral GH, et al. Microbiome definition re-visited: old concepts and new challenges. Microbiome. 2020;8:103. https://doi. org/10.1186/s40168-020-00875-0.
  2. Van Den Bossche T, Arntzen MO, Becher D, Benndorf D, Eijsink VGH, Henry C, Jagtap PD, Jehmlich N, Juste C, Kunath BJ, et al. The Metaproteomics Initiative: a coordinated approach for propelling the functional characterization of microbiomes. Microbiome. 2021;9:243. https://doi.org/10. 1186/s40168-021-01176-w.
  3. Armengaud J. Metaproteomics to understand how microbiota function: The crystal ball predicts a promising future. Environ Microbiol. 2023;25:115-25. https://doi.org/10.1111/1462-2920.16238.
  4. Stewart HI, Grinfeld D, Giannakopulos A, Petzoldt J, Shanley T, Garland M, Denisov E, Peterson AC, Damoc E, Zeller M, et al. Parallelized acquisition of orbitrap and astral analyzers enables high-throughput quantitative analysis. Anal Chem. 2023;95:15656-64. https://doi.org/10.1021/acs.analc hem.3c02856.
  5. Stewart H, Grinfeld D, Wagner A, Kholomeev A, Biel M, Giannakopulos A, Makarov A, Hock C. A conjoined rectilinear collision cell and pulsed extraction ion trap with auxiliary DC electrodes. J Am Soc Mass Spectrom. 2023. https://doi.org/10.1021/jasms.3c00311.
  6. Guzman UH, Martinez Del Val A, Ye Z, Damoc E, Arrey TN, Pashkova A, Denisov E, Petzoldt J, Peterson AC, Harking F, et al. Narrow-window DIA: Ultra-fast quantitative analysis of comprehensive proteomes with high sequencing depth. In: bioRxiv. 2023.
  7. Heil LR, Damoc E, Arrey TN, Pashkova A, Denisov E, Petzoldt J, Peterson AC, Hsu C, Searle BC, Shulman N, et al. Evaluating the performance of the Astral mass analyzer for quantitative proteomics using data-independent acquisition. J Proteome Res. 2023. https://doi.org/10.1021/acs.jproteome. 3c00357.
  8. Ye Z, Sabatier P, Martin-Gonzalez J, Eguchi A, Bekker-Jensen DB, Bache N, Olsen JV. One-Tip enables comprehensive proteome coverage in minimal cells and single zygotes. In: bioRxiv. 2023.
  9. Petrosius V, Aragon-Fernandez P, Arrey TN, Üresin N, Furtwängler B, Stewart H, Denisov E, Petzoldt J, Peterson AC, Hock C, et al. Evaluating the capabilities of the Astral mass analyzer for single-cell proteomics. In: bioRxiv. 2023.
  10. Lozano C, Kielbasa M, Gaillard JC, Miotello G, Pible O, Armengaud J. Identification and characterization of marine microorganisms by tandem mass spectrometry proteotyping. Microorganisms. 2022;10. https://doi. org/10.3390/microorganisms10040719.
  11. Hayoun K, Gouveia D, Grenga L, Pible O, Armengaud J, Alpha-Bazin B. Evaluation of sample preparation methods for fast proteotyping of microorganisms by tandem mass spectrometry. Front Microbiol. 1985;2019:10. https://doi.org/10.3389/fmicb.2019.01985.
  12. Grenga L, Pible O, Miotello G, Culotta K, Ruat S, Roncato MA, Gas F, Bellanger L, Claret PG, Dunyach-Remy C, et al. Taxonomical and functional changes in COVID-19 faecal microbiome could be related to SARS-CoV-2 faecal load. Environ Microbiol. 2022;24:4299-316. https://doi.org/10.1111/ 1462-2920.16028.
  13. Ma ZQ, Chambers MC, Ham AJ, Cheek KL, Whitwell CW, Aerni HR, Schilling B, Miller AW, Caprioli RM, Tabb DL. ScanRanker: Quality assessment
    of tandem mass spectra via sequence tagging. J Proteome Res. 2011;10:2896-904. https://doi.org/10.1021/pr200118r.
  14. Pible O, Allain F, Jouffret V, Culotta K, Miotello G, Armengaud J. Estimating relative biomasses of organisms in microbiota using “phylopeptidomics.” Microbiome. 2020;8:30. https://doi.org/10.1186/s40168-020-00797-x.
  15. Demichev V, Messner CB, Vernardis SI, Lilley KS, Ralser M. DIA-NN: neural networks and interference correction enable deep proteome coverage in high throughput. Nat Methods. 2020;17:41-4. https://doi.org/10.1038/ s41592-019-0638-x.
  16. Kanehisa M, Goto S. KEGG: kyoto encyclopedia of genes and genomes. Nucleic Acids Res. 2000;28:27-30. https://doi.org/10.1093/nar/28.1.27.
  17. Kanehisa M, Sato Y, Morishima K. BlastKOALA and GhostKOALA: KEGG tools for functional characterization of genome and metagenome sequences. J Mol Biol. 2016;428:726-31. https://doi.org/10.1016/j.jmb. 2015.11.006.
  18. Krzywinski M, Schein J, Birol I, Connors J, Gascoyne R, Horsman D, Jones SJ, Marra MA. Circos: an information aesthetic for comparative genomics. Genome Res. 2009;19:1639-45. https://doi.org/10.1101/gr.092759.109.
  19. Darzi Y, Letunic I, Bork P, Yamada T. iPath3.0: interactive pathways explorer v3. Nucleic Acids Res. 2018;46:W510-3. https://doi.org/10.1093/nar/ gky299.
  20. Ramos-Nascimento A, Grenga L, Haange SB, Himmelmann A, Arndt FS, Ly YT, Miotello G, Pible O, Jehmlich N, Engelmann B, et al. Human gut microbiome and metabolite dynamics under simulated microgravity. Gut Microbes. 2023;15:2259033. https://doi.org/10.1080/19490976.2023. 2259033.
  21. Blakeley-Ruiz JA, Kleiner M. Considerations for constructing a protein sequence database for metaproteomics. Comput Struct Biotechnol J. 2022;20:937-52. https://doi.org/10.1016/j.csbj.2022.01.018.
  22. Bassignani A, Plancade S, Berland M, Blein-Nicolas M, Guillot A, Chevret D, Moritz C, Huet S, Rizkalla S, Clement K, et al. Benefits of iterative searches of large databases to interpret large human gut metaproteomic data sets. J Proteome Res. 2021;20:1522-34. https://doi.org/10.1021/acs.jproteome. 0c00669.
  23. Sun Z, Ning Z, Cheng K, Duan H, Wu Q, Mayne J, Figeys D. MetaPep: A core peptide database for faster human gut metaproteomics database searches. Comput Struct Biotechnol J. 2023;21:4228-37. https://doi.org/ 10.1016/j.csbj.2023.08.025.
  24. Grenga L, Pible O, Armengaud J. Pathogen proteotyping: a rapidly developing application of mass spectrometry to address clinical concerns. Clin Mass Spectrom. 2019;14 Pt A:9-17. https://doi.org/10.1016/j.clinms.2019. 04.004.
  25. Gouveia D, Pible O, Culotta K, Jouffret V, Geffard O, Chaumot A, DegliEsposti D, Armengaud J. Combining proteogenomics and metaproteomics for deep taxonomic and functional characterization of microbiomes from a non-sequenced host. NPJ Biofilms Microbiomes. 2020;6:23. https:// doi.org/10.1038/s41522-020-0133-2.
  26. Charlier P, Armengaud J. Did Saint Leonard suffer from Madura foot at the time of death? Infectious disease diagnosis by paleo-proteotyping. J Infect. 2023. https://doi.org/10.1016/j.jinf.2023.10.021.
  27. Oumarou Hama H, Chenal T, Pible O, Miotello G, Armengaud J, Drancourt M. An ancient coronavirus from individuals in France, circa 16th century. Int J Infect Dis. 2023;131:7-12. https://doi.org/10.1016/j.jid.2023.03.019.
  28. Brooks B, Mueller RS, Young JC, Morowitz MJ, Hettich RL, Banfield JF. Strain-resolved microbial community proteomics reveals simultaneous aerobic and anaerobic function during gastrointestinal tract colonization of a preterm infant. Front Microbiol. 2015;6:654. https://doi.org/10.3389/ fmicb.2015.00654.
  29. Kleikamp HBC, Pronk M, Tugui C, Guedes da Silva L, Abbas B, Lin YM, van Loosdrecht MCM, Pabst M. Database-independent de novo metaproteomics of complex microbial communities. Cell Syst. 2021;12:375-383 e375. https://doi.org/10.1016/j.cels.2021.04.003.
  30. Duan H, Zhang X, Figeys D. An emerging field: post-translational modification in microbiome. Proteomics. 2023;23:e2100389. https://doi.org/10. 1002/pmic. 202100389.
  31. Jiang N, Gao Y, Xu J, Luo F, Zhang X, Chen R. A data-independent acquisition (DIA)-based quantification workflow for proteome analysis of 5000 cells. J Pharm Biomed Anal. 2022;216:114795. https://doi.org/10.1016/j. jpba.2022.114795.
  32. Steger M, Demichev V, Backman M, Ohmayer U, Ihmor P, Muller S, Ralser M, Daub H. Time-resolved in vivo ubiquitinome profiling by
DIA-MS reveals USP7 targets on a proteome-wide scale. Nat Commun. 2021;12:5399. https://doi.org/10.1038/s41467-021-25454-1.
33. Zhang F, Ge W, Huang L, Li D, Liu L, Dong Z, Xu L, Ding X, Zhang C, Sun Y, et al. A Comparative analysis of data analysis tools for data-independent acquisition mass spectrometry. Mol Cell Proteomics. 2023;22:100623. https://doi.org/10.1016/j.mcpro.2023.100623.
34. Gomez-Varela D, Xian F, Grundtner S, Sondermann JR, Carta G, Schmidt M. Increasing taxonomic and functional characterization of hostmicrobiome interactions by DIA-PASEF metaproteomics. Front Microbiol. 2023;14:1258703. https://doi.org/10.3389/fmicb.2023.1258703.
35. Pietila S, Suomi T, Elo LL. Introducing untargeted data-independent acquisition for metaproteomics of complex microbial samples. ISME Commun. 2022;2:51. https://doi.org/10.1038/s43705-022-00137-0.
36. Van Den Bossche T, Kunath BJ, Schallert K, Schape SS, Abraham PE, Armengaud J, Arntzen MO, Bassignani A, Benndorf D, Fuchs S, et al. Critical Assessment of MetaProteome Investigation (CAMPI): a multi-laboratory comparison of established workflows. Nat Commun. 2021;12:7305. https://doi.org/10.1038/s41467-021-27542-8.
37. Zhao J, Yang Y, Xu H, Zheng J, Shen C, Chen T, Wang T, Wang B, Yi J, Zhao D, et al. Data-independent acquisition boosts quantitative metaproteomics for deep characterization of gut microbiota. NPJ Biofilms Microbiomes. 2023;9:4. https://doi.org/10.1038/s41522-023-00373-9.
38. Aakko J, Pietila S, Suomi T, Mahmoudian M, Toivonen R, Kouvonen P, Rokka A, Hanninen A, Elo LL. Data-independent acquisition mass spectrometry in metaproteomics of gut microbiota-implementation and computational analysis. J Proteome Res. 2020;19:432-6. https://doi.org/ 10.1021/acs.jproteome.9b00606.
39. Long S, Yang Y, Shen C, Wang Y, Deng A, Qin Q, Qiao L. Metaproteomics characterizes human gut microbiome function in colorectal cancer. NPJ Biofilms Microbiomes. 2020;6:14. https://doi.org/10.1038/ s41522-020-0123-4.

Publisher’s Note

Springer Nature remains neutral with regard to jurisdictional claims in published maps and institutional affiliations.