التدهور الوظيفي السريع لخلايا القاتل الطبيعي بعد دخول الورم يحد من المناعة المضادة للورم Rapid functional impairment of natural killer cells following tumor entry limits anti-tumor immunity
تؤدي خلل وظيفة الخلايا المناعية داخل بيئة الورم الدقيقة (TME) إلى تقويض السيطرة على تقدم السرطان. تحتوي الأورام المتقدمة على خلايا قاتلة طبيعية (NK) متميزة من الناحية الظاهرية، ومع ذلك، لا تزال الديناميات الزمنية والأسس الميكانيكية والأهمية الوظيفية لمجموعة خلايا NK غير مفهومة تمامًا. هنا، نستخدم الوسم الضوئي، جنبًا إلى جنب مع التحليلات الطولية للترانسكريبتوم والخلايا، لاستجواب مصير خلايا NK داخل الورم. نكشف أن خلايا NK تفقد بسرعة وظائفها الفعالة وتتبنى حالة ظاهرة متميزة مع ميزات مرتبطة بالإقامة في الأنسجة. لم يؤثر استنفاد خلايا NK من الأورام المتقدمة على نمو الورم، مما يشير إلى أن خلايا NK داخل الورم تتوقف عن المساهمة بنشاط في الاستجابات المضادة للورم. منع إعطاء IL-15 فقدان الوظيفة وحسن السيطرة على الورم، مما أدى إلى توليد خلايا NK داخل الورم تتمتع بخصائص الإقامة في الأنسجة ووظيفة فعالة محسنة. بشكل جماعي، تكشف بياناتنا مصير خلايا NK بعد تجنيدها في الأورام وتوفر رؤى حول كيفية استعادة وظيفتها.
لقد أدى التأثير السريري للعلاج المناعي لمرضى السرطان إلى دفع أبحاث واسعة حول تكوين ووظيفة الخلايا المناعية داخل الأورام . من بين هذه الخلايا، كانت خلايا CD8 T السامة للورم هي الأكثر توصيفًا، مع طيف
من خلايا T المستنفدة مع وظائف فعالة متناقصة تم وصفها . تمتلك الخلايا اللمفاوية الفطرية، التي تمثلها تقليديًا خلايا NK، ولكنها تشمل الآن أيضًا مجموعات أخرى من الخلايا اللمفاوية الفطرية (ILC)، أيضًا إمكانات سامة قوية. هناك اهتمام متزايد في استغلال
هذه المجموعة الموسعة من الخلايا الفعالة لأغراض علاجية من خلال فتح إمكاناتها السامة. ومع ذلك، لا يزال سلوك هذه الخلايا وكيف يتغير مع مرور الوقت داخل TME غير مفهوم جيدًا.
تعتبر خلايا NK التقليدية (cNK) دائرية في الفئران والبشر مع نمط ظاهري سام بشكل قوي؛ فهي مسلحة بمجموعة من الجرانزيم والبرفورين، إلى جانب العديد من الروابط المحفزة للاستماتة بما في ذلك TRAIL وFASL . في الجسم الحي، يؤدي نقص خلايا NK الدائم إلى ضعف السيطرة على نمو الورم وزيادة المرض النقيلي في نماذج سرطان الفئران المتعددة . من المهم، بخلاف وظائفها السامة المباشرة، تعمل خلايا NK أيضًا كمنسقين لاستجابة خلايا T من خلال تجنيدها وتنشيطها وتوسيعها لخلايا التغصن (DCs)، وخاصة خلايا DC التقليدية من النوع 1 (cDC1)، من خلال إنتاجها للكيماكينات CCL5 وXCL1، بالإضافة إلى FLT3L وIFN . تعتبر مجموعة CDC 1 الأكثر قدرة على الانتقال إلى العقدة اللمفاوية المتصرفة (dLN) لتقديم مستضدات الورم إلى خلايا T الساذجة، وبالتالي دفع توسيع خلايا CD8 T المضادة للورم . علاوة على ذلك، تجذب CDC 1 داخل TME وتعيد تنشيط خلايا CD8 T الفعالة لتكثيف واستدامة الاستجابة . بشكل جماعي، تؤكد هذه البيانات الدور الرئيسي للتواصل المنسق بين خلايا NK وDC في توليد استجابات مضادة للورم دائمة. في الواقع، فإن تكرار خلايا NK وCDC1 داخل الميلانوما يتنبأ بالاستجابة للعلاج المضاد لـ PD-1 .
ومع ذلك، تم وصف التباين الظاهري والخلل الوظيفي داخل مجموعة خلايا NK داخل الورم , مما قد يقوض السيطرة على نمو الورم. تضيف اكتشاف مجموعات ILC المختلفة المعنية في الاستجابات المناعية من النوع 1، والتي تُسمى مجتمعة ILC1s، مستوى إضافيًا من التعقيد لفهم تكوين الخلايا اللمفاوية المتسللة إلى الورم (TILs) – وخاصة ما إذا كانت هذه المجموعات تأتي من خلايا تم تجنيدها من الدورة الدموية أو من مناطق الإقامة في الأنسجة . تشترك ILC1s في العديد من التشابهات الظاهرية والبرامج النسخية مع خلايا NK، وعلى الرغم من أن معظم ILCs مقيمة في الأنسجة، فقد لوحظت ILC1s دائرية في الفئران . خلايا NK متميزة تطوريًا عن ILC1s وتم تمييزها في البداية بناءً على تعبير الجرانزيم والسُمية، ومع ذلك، كشفت الأوصاف الأكثر حداثة أن بعض ILC1s تعبر عن الجرانزيم وقادرة على قتل الخلايا المستهدفة . في الواقع، تم اقتراح تحويل خلايا NK إلى حالة ILC1 داخل TME . وبالتالي، قد يعكس خلل خلايا NK داخل الأورام تكيف cNKs مع TME، أو مساهمة مجموعات ILC المحلية، أو مزيج من كليهما. قد يسهل تحديد كيفية ولماذا تتشكل مجموعات NK/ILC1 داخل الورم تحقيق تحقيقات أكثر دقة حول الآليات التي تحتاج إلى استهدافها للتلاعب بهذه الخلايا اللمفاوية الفطرية وتعزيز الاستجابات المناعية المضادة للورم.
هنا، نستخدم الوسم الزمني للأورام من خلال التحويل الضوئي لتتبع مصير خلايا NK في الجسم الحي بعد تجنيدها في الأورام الصلبة. تكشف بياناتنا عن فقدان سريع لإنتاج الكيماكينات والسيتوكينات، إلى جانب ضعف السُمية، حيث تتكيف خلايا cNK، أو يتم تعديلها بواسطة، TME. نوضح أن جميع خلايا cNK المحتفظ بها داخل الورم تتبنى في النهاية حالة متميزة وغير وظيفية، تتميز بتعبير CD49a، وأن التباين الملحوظ عبر العديد من نماذج الأورام قبل السريرية يعكس الوقت الذي قضته خلايا cNK داخل الورم. لم يكن لاستنفاد خلايا NK من الأورام المتقدمة أي تأثير على نمو الورم مما يشير إلى أن هذه الخلايا قد توقفت عن المساهمة بنشاط في السيطرة على الورم. يمكن حظر فقدان وظيفة خلايا NK بعد دخول الورم من خلال تعزيز إشارات IL-15، مما يؤدي إلى تحسين السيطرة على نمو الورم. بشكل جماعي، توضح بياناتنا مصير خلايا NK داخل الأورام الصلبة، محددة الحالة المتكيفة مع الورم التي تتبناها هذه الخلايا بمجرد دخولها إلى TME، مما يحد من مساهمتها في الاستجابة المضادة للورم. توفر هذه البيانات معلومات إضافية حول الجهود المستقبلية لإحياء خلايا NK داخل الورم وتعزيز المناعة المضادة للورم.
النتائج
تظهر خلايا NK تغييرات في الترانسكريبتوم بسرعة بعد دخول الورم
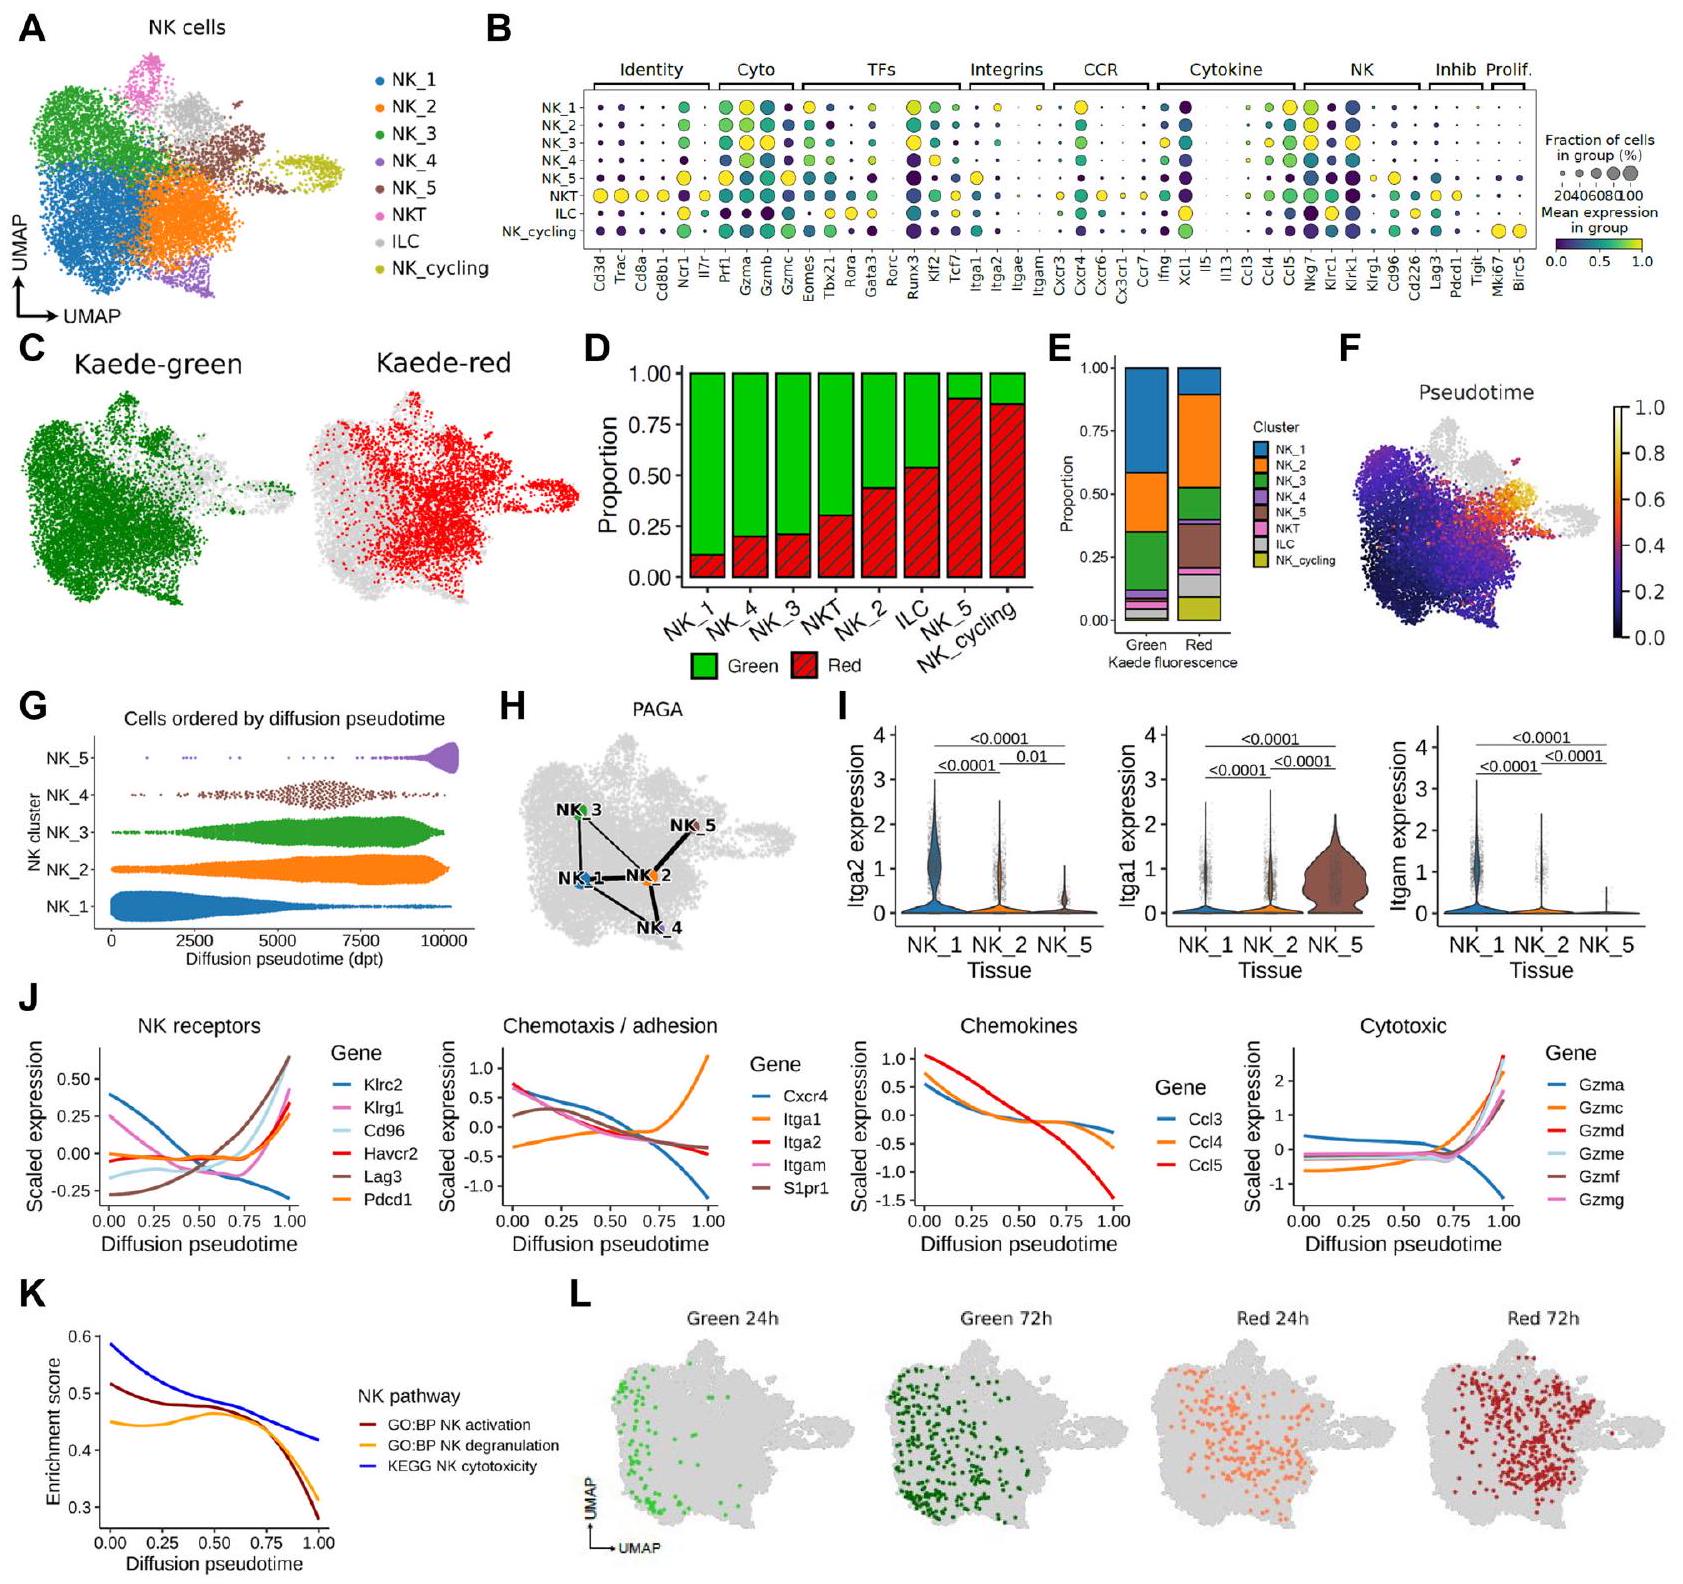
سلطت الدراسات الأخيرة الضوء على أن مجموعة خلايا NK داخل الورم متميزة، تتميز بوظائف متغيرة بما في ذلك انخفاض السُمية وقدرة ضعيفة على تنسيق تجنيد وتنشيط DC . لا يزال السبب الدقيق وراء حدوث ذلك غير محسوم. حتى الآن، تفتقر الدراسات في الجسم الحي التي تتعقب مصير خلايا NK داخل الورم بشكل محدد. باستخدام الوسم الديناميكي الذي وصفناه مؤخرًا لمجموعة المناعة الورمية , سعينا لتحديد حالة خلايا NK عند دخولها الأورام ورسم التغييرات في ظاهريتها ووظيفتها في الوقت الحقيقي على مدار الوقت. لهذا الغرض، تم زراعة أورام MC38 تحت الجلد على جانب الفئران القابلة للتحويل الضوئي Kaede، وهو نموذج ترانسجيني حيث تعبر جميع الخلايا عن بروتين فلوري أخضر يتحول بشكل لا رجعة فيه إلى شكل أحمر عند التعرض للضوء البنفسجي . تم وسم مجموعة المناعة بالكامل في الورم بشكل انتقائي بعد 13 يومًا من الزراعة وتم حصاد الأنسجة بعد يومين. وبالتالي، من بين الخلايا المعزولة من الورم، كانت خلايا Kaede Green+ (KG+) غير المسمى قد قضت في الورم ما يصل إلى 48 ساعة، بينما كانت خلايا Kaede Red+ (KR+) قد قضت على الأقل 48 ساعة داخل الأنسجة. لالتقاط التغييرات الترانسكريبتومية عبر مجموعة TIL على مدار الوقت وبطريقة غير متحيزة، استخدمنا تسلسل scRNA (scRNA-seq). تم عزل TILs بواسطة FACS لتحقيق توازن أفضل في الأعداد، وتم تقسيمها بشكل أكبر إلى مجموعات KG+ وKR+ وتم تحليلها بواسطة scRNA-seq القائم على القطرات (الشكل التكميلية 1A). استراتيجيات التصفية المستخدمة ضمنت أن مجموعة خلايا NK تم التقاطها بالكامل (الشكل التكميلية 1B).
بعد مراقبة الجودة، تم تحليل إجمالي 46,342 من خلايا TIL، والتي تتكون من عدد قليل من خلايا B، وخلايا NK المحتملة، والعديد من تجمعات خلايا T (CD4، CD8، Treg، TCR+) كما هو معرف بواسطة العلامات الكلاسيكية (الشكل التوضيحي 1C-E). ركزنا على مجموعة خلايا NK المحتملة المكونة من 11,808 خلية، والتي تم تعريفها في البداية من خلال التعبير العالي عن Prf1 و Ncr1 و Klrb1c و Fcgr3. أظهر إعادة تصنيف هذه الخلايا بشكل غير متحيز في عزلة 8 مجموعات، من بينها 6 تم تعريفها كخلايا NK بناءً على التعبير عن Ncr1 و Eomes و Gzmb وغياب Cd3e و Il7ra، بما في ذلك مجموعة خلايا NK الدائرية التي تعبر أيضًا عن Mki67 و Birc5 (الشكل 1A، B، الشكل التوضيحي 1F). تم تحديد المجموعتين المتبقيتين كخلايا NKT ومجموعة ILC، وتم تمييزها عن خلايا NK الحقيقية من خلال التعبير عن Il7ra و Rora و Gata3، في غياب التعبير عن Eomes و Cd3e (الشكل التوضيحي 1G-I).أظهر تعبير Tbx21، ولكن ليس Eomes، داخل مجموعة ILC الصغيرة انتشار ILC1s (الشكل التوضيحي التكميلي 1I)باستخدام توقيعات محددة منشورة لـ NK و ILC1قمنا أيضًا بتأكيد تحديد العنقود الخاص بنا (الشكل التوضيحي التكميلي 1J).
ثم حددنا نسبة و الخلايا داخل كل مجموعة لتوفير سياق للوقت الذي قضاه داخل بيئة الورم الدقيقة لكل مجموعة فرعية (الشكل 1C-E). كشفت هذه البيانات عن تدرج في نسبة الخلايا KR+ عبر مجموعات NK، حيث تتكون مجموعة NK_1 تقريبًا بالكامل من خلايا KG+ ومجموعة NK_5 في الطرف الآخر، التي تتكون من حواليالخلايا. أظهر التحليل الإضافي لمجموعة NK_cycling أن الخلايا الدورية يمكن العثور عليها في جميع مجموعات خلايا NK/ILC/NKT، مما يشير إلى أن هذه لا تشكل نمطًا متميزًا (الشكل التوضيحي التكميلي 1K). ومع ذلك، من الجدير بالذكر أن NK_5 كانت غنية بشكل خاص بين خلايا NK الدورية، مما يشير إلى أن بعض خلايا NK المحتفظ بها في الورم قد تتوسع في الموقع (الشكل التوضيحي التكميلي 1L). لترتيب التغيرات النسخية التي تحدث داخل خلايا NK بعد دخولها الورم، قمنا بإجراء تحليل مسار زمني زائف، مستندًا إلى NK_1 حيث كانت تحتوي على أعلى نسبة من خلايا NK التي دخلت الورم مؤخرًا. أبرزت هذه التحليلات مجموعة NK_5 كحالة نهائية للمسار (الشكل 1F، G). وبالمثل، أشار تجريد الرسم القائم على التقسيم (PAGA) لرسم اتصال المجموعات (الشكل 1H) إلى أن المسار الرئيسي لمصير خلايا NK الورمية يتقدم من NK_1 إلى NK_2 ثم إلى توقيع NK_5 النسخي.
الشكل 1 | التغيرات السريعة في ترانسكريبتوم خلايا NK بعد دخولها إلى البيئة المجهرية للورم. تم زراعة أورام MC38 تحت الجلد على الجانب، وتم تحويلها ضوئيًا وتحليلها بعد 48 ساعة باستخدام تسلسل RNA أحادي الخلية القائم على القطرات. يظهر UMAP 11,808 خلية NK تم تعريفها من خلال تعبير Ncr1 و Prf1 و Klrb1c و Fcgr3، وتم حلها إلى 8 مجموعات تتكون من NK_1 إلى NK_5، إلى جانب مجموعة دورية واحدة ومجموعتين إضافيتين تصف خلايا ILC و NKT. ب. مخططات النقاط تظهر تعبير الجينات المختارة المستخدمة لمزيد من توصيف المجموعات. ج. UMAP يظهر توزيع خلايا Kaede Green+ و Kaede Red+ عبر مجموعات NK. د. نسبة خلايا Kaede Green+ و Kaede Red+ داخل كل مجموعة. هـ. نسبة كل مجموعة داخل خلايا Kaede Green+ و Kaede Red+. و. UMAP يظهر مسار انتشار زائف الزمن متجذر في NK_1. ز. مخطط تجمع النحل للمجموعات الخمس من NK (NK_1 إلى NK_5) عبر الزمن الزائف. H PAGA توضح العلاقة بين تعبير الجينات بين مجموعات NK. I الرسوم البيانية للفيولن تظهر تعبير Iga1 و Itga2 و Itgam عبر NK_1 و NK_2 و NK_5. J الجينات المعبر عنها بشكل مختلف عبر الزمن الزائف مجمعة حسب الوظيفة. K تحليلات المسار التي تصف التغيرات في تنشيط NK، وإطلاق الحبيبات، والسمية الخلوية عبر الزمن الزائف. L UMAPs تظهر دمج بيانات خلايا NK بعد 24 و 72 ساعة من التحويل الضوئي مع البيانات الأصلية المستمدة من 48 ساعة بعد التوسيم. تم تحديد الأهمية الإحصائية بواسطة اختبار ويلكوكسون ذو الجانبين مع تصحيح بنجاميني-هوشبرغ للاختبارات المتعددة. تُعرض البيانات كصندوق (الوسيط؛ الصندوق، النسبة المئوية 25 والنسبة المئوية 75؛ الشعيرات، 1.5*نطاق الربع بين) ورسوم بيانية للفيولن. في (J، K) تُعرض البيانات كتحليل انحدار محلي (loess) ملائم لقيم التعبير المقاسة.
تم استخدام التعبير التفاضلي للإنترغرينات CD49a و CD49b لتمييز خلايا NK السليمة (CD49b+) وخلايا NK المقيمة في الأنسجة و ILC1 (CD49a+).كان تعبير Itga2 (CD49b) محدودًا على مجموعات NK_1 و NK_2 بينما تم التعبير عن Itga1 (CD49a) من قبل غالبية مجموعة NK_5، ولكن ليس المجموعات الأخرى (الشكل 11). ومن المثير للاهتمام، أن تعبير Itgam، الذي يشفر CD11b ويحدد خلايا NK الناضجة في الدورة الدموية، كان محدودًا على مجموعة NK_1.
لبدء التحقيق في التغيرات النسخية التي تحدث داخل خلايا NK داخل الورم، قمنا برسم تعبير الجينات المجمعة وظيفيًا على مدى الزمن الزائف (الشكل 1J).بينما تقدمت خلايا NK نحو حالة الزمن الزائف داخل الورم النهائية (NK_5)، كان هناك زيادة في تنظيم مستقبلات المثبطة بما في ذلك Pdcd1 وLag3 وHavcr2 وCd96، وتغير في النسخ المرتبطة بالهجرة مع انخفاض ملحوظ في تعبير Cxcr4 وItgam، ولكن زيادة في Itga1، بالإضافة إلى فقدان التعبير عن (الكيموكينات المرتبطة بتجنيد خلايا DC)، وتغير تعبير الجرانزيم (الشكل 1J). بما يتماشى مع هذه النتائج، حدد تحليل إثراء مجموعة الجينات انخفاضًا في مجموعات جينات مسار ‘تنشيط NK’ و’إفراز NK’ و’سمية NK’ على مدى الزمن الزائف (الشكل 1K). للتحقيق بشكل أعمق في المحركات المحتملة لهذا الانتقال، قمنا بإجراء تنظيم جيني تحليل الشبكة باستخدام SCENIC (الشكل التوضيحي 2). وقد كشف ذلك عن الانخفاض المتزامن لعدد كبير من مجموعات عوامل النسخ على مدى الزمن الزائف، حيث تنتقل خلايا NK إلى الحالة الموصوفة بواسطة NK 5. وشملت هذه عوامل النسخ المعقدة AP-1 Fos وFosb وJun وJunb، التي يتم تنشيطها خلال برامج الخلايا القاتلة NK وتُنظم بشكل منخفض من خلال التفاعلات مع الروابط المثبطة.. تشمل عوامل النسخ الأخرى التي تم تقليل تنظيمها Irf8 و Klf2 و Myc، والتي تدعم تنشيط خلايا NK وتكاثرهامن المثير للاهتمام أننا لم نحدد مجموعات تنظيم عوامل النسخ التي زادت بشكل ملحوظ مع الزمن الزائف، مما يشير إلى أن حالة خلايا NK المحتفظ بها في الورم تنشأ من انخفاض نشاط عوامل النسخ الأساسية المرتبطة بتعزيز تطوير خلايا NK الناضجة وتوسعها.
لفهم التغيرات في خلايا NK داخل الورم بمرور الوقت بشكل أفضل، قمنا أيضًا بتحليل خلايا NK في بيانات تسلسل RNA أحادي الخلية حيث تم تقييم خلايا المناعة المتسللة في الورم بعد 24 و72 ساعة من التحويل الضوئي.، مما يوفر دقة أكبر للتغيرات التي تحدث في الوقت الحقيقي. أعادت تحليل 1035 خلية NK كشف عن ثلاث مجموعات NK (الشكل التكميلي 3A، B). ومن الجدير بالذكر أن مجموعة NK_a كانت تتكون تقريبًا بالكامل من خلايا KG+، بينما احتوت مجموعة NK_c على خلايا KR+ فقط، مما يتماشى مع مسار خطي بسيط (الشكل التكميلي 3B، C). كانت التغيرات الكبيرة في التعبير الجيني عبر هذه المجموعات الثلاث تتطابق بشكل وثيق مع تلك التي لوحظت في تحليلنا الأولي، بما في ذلك التحول من تعبير Itgam إلى تعبير Itga1 (الشكل التكميلي 3D، E). لتحديد مكان وجود نسخ جينات خلايا NK من 24 و72 ساعة بعد التحويل الضوئي على طول مسار الوقت الزائف، قمنا بإسقاط هذه البيانات في مجموعة بيانات الخلايا الفردية المرجعية الأولية لدينا (الشكل 1F). وللطمأنة، كانت هذه البيانات المؤرخة تتماشى بشكل وثيق مع مسار الوقت الزائف لدينا، مما يثبت أن تحليلاتنا تمثل بدقة التغيرات الزمنية في التعبير الجيني (الشكل 1L). أخيرًا، للتحقيق بشكل أكبر في طبيعة خلايا NK التي تم تجنيدها إلى الورم، قمنا بدمج خلايا NK الدائرة باستخدام بيانات scRNA-seq المتاحة للجمهور (https://www.10xgenomics.com/الموارد/مجموعات البيانات/10-k-mouse-pbm-cs-multiplexed-2-cm-os-3-1- مع مجموعة بيانات الورم لدينا (الشكل S1M). كانت هذه الخلايا القاتلة الطبيعية في الدم تشبه بشكل أكبر NK_1 و NK_2، التي تهيمن عليها Kaedegreen في بيانات تسلسل RNA أحادي الخلية، والأهم من ذلك، لم يتم تعيين أي منها إلى NK_5 (الشكل التوضيحي 1N). أكدت مقارنة تعبير Itgam و Itga1 و Itga2 غياب Itga1 بين خلايا NK الدائرة (الشكل التوضيحي 10).
بشكل جماعي، تكشف هذه البيانات عن تغييرات سريعة في النسخ الجيني لخلايا cNK التي تعبر عن Itgam بعد دخولها إلى بيئة الورم من الدورة الدموية. بمجرد دخولها إلى الأورام، تتمايز خلايا NK بسرعة نحو حالة نسخية شائعة تتميز بتغيرات كبيرة في الوظائف الأساسية والتعبير عن Itga1.
التعبير التفاضلي عن CD11b و CD49a يلتقط التغيرات الزمنية في نمط خلايا NK
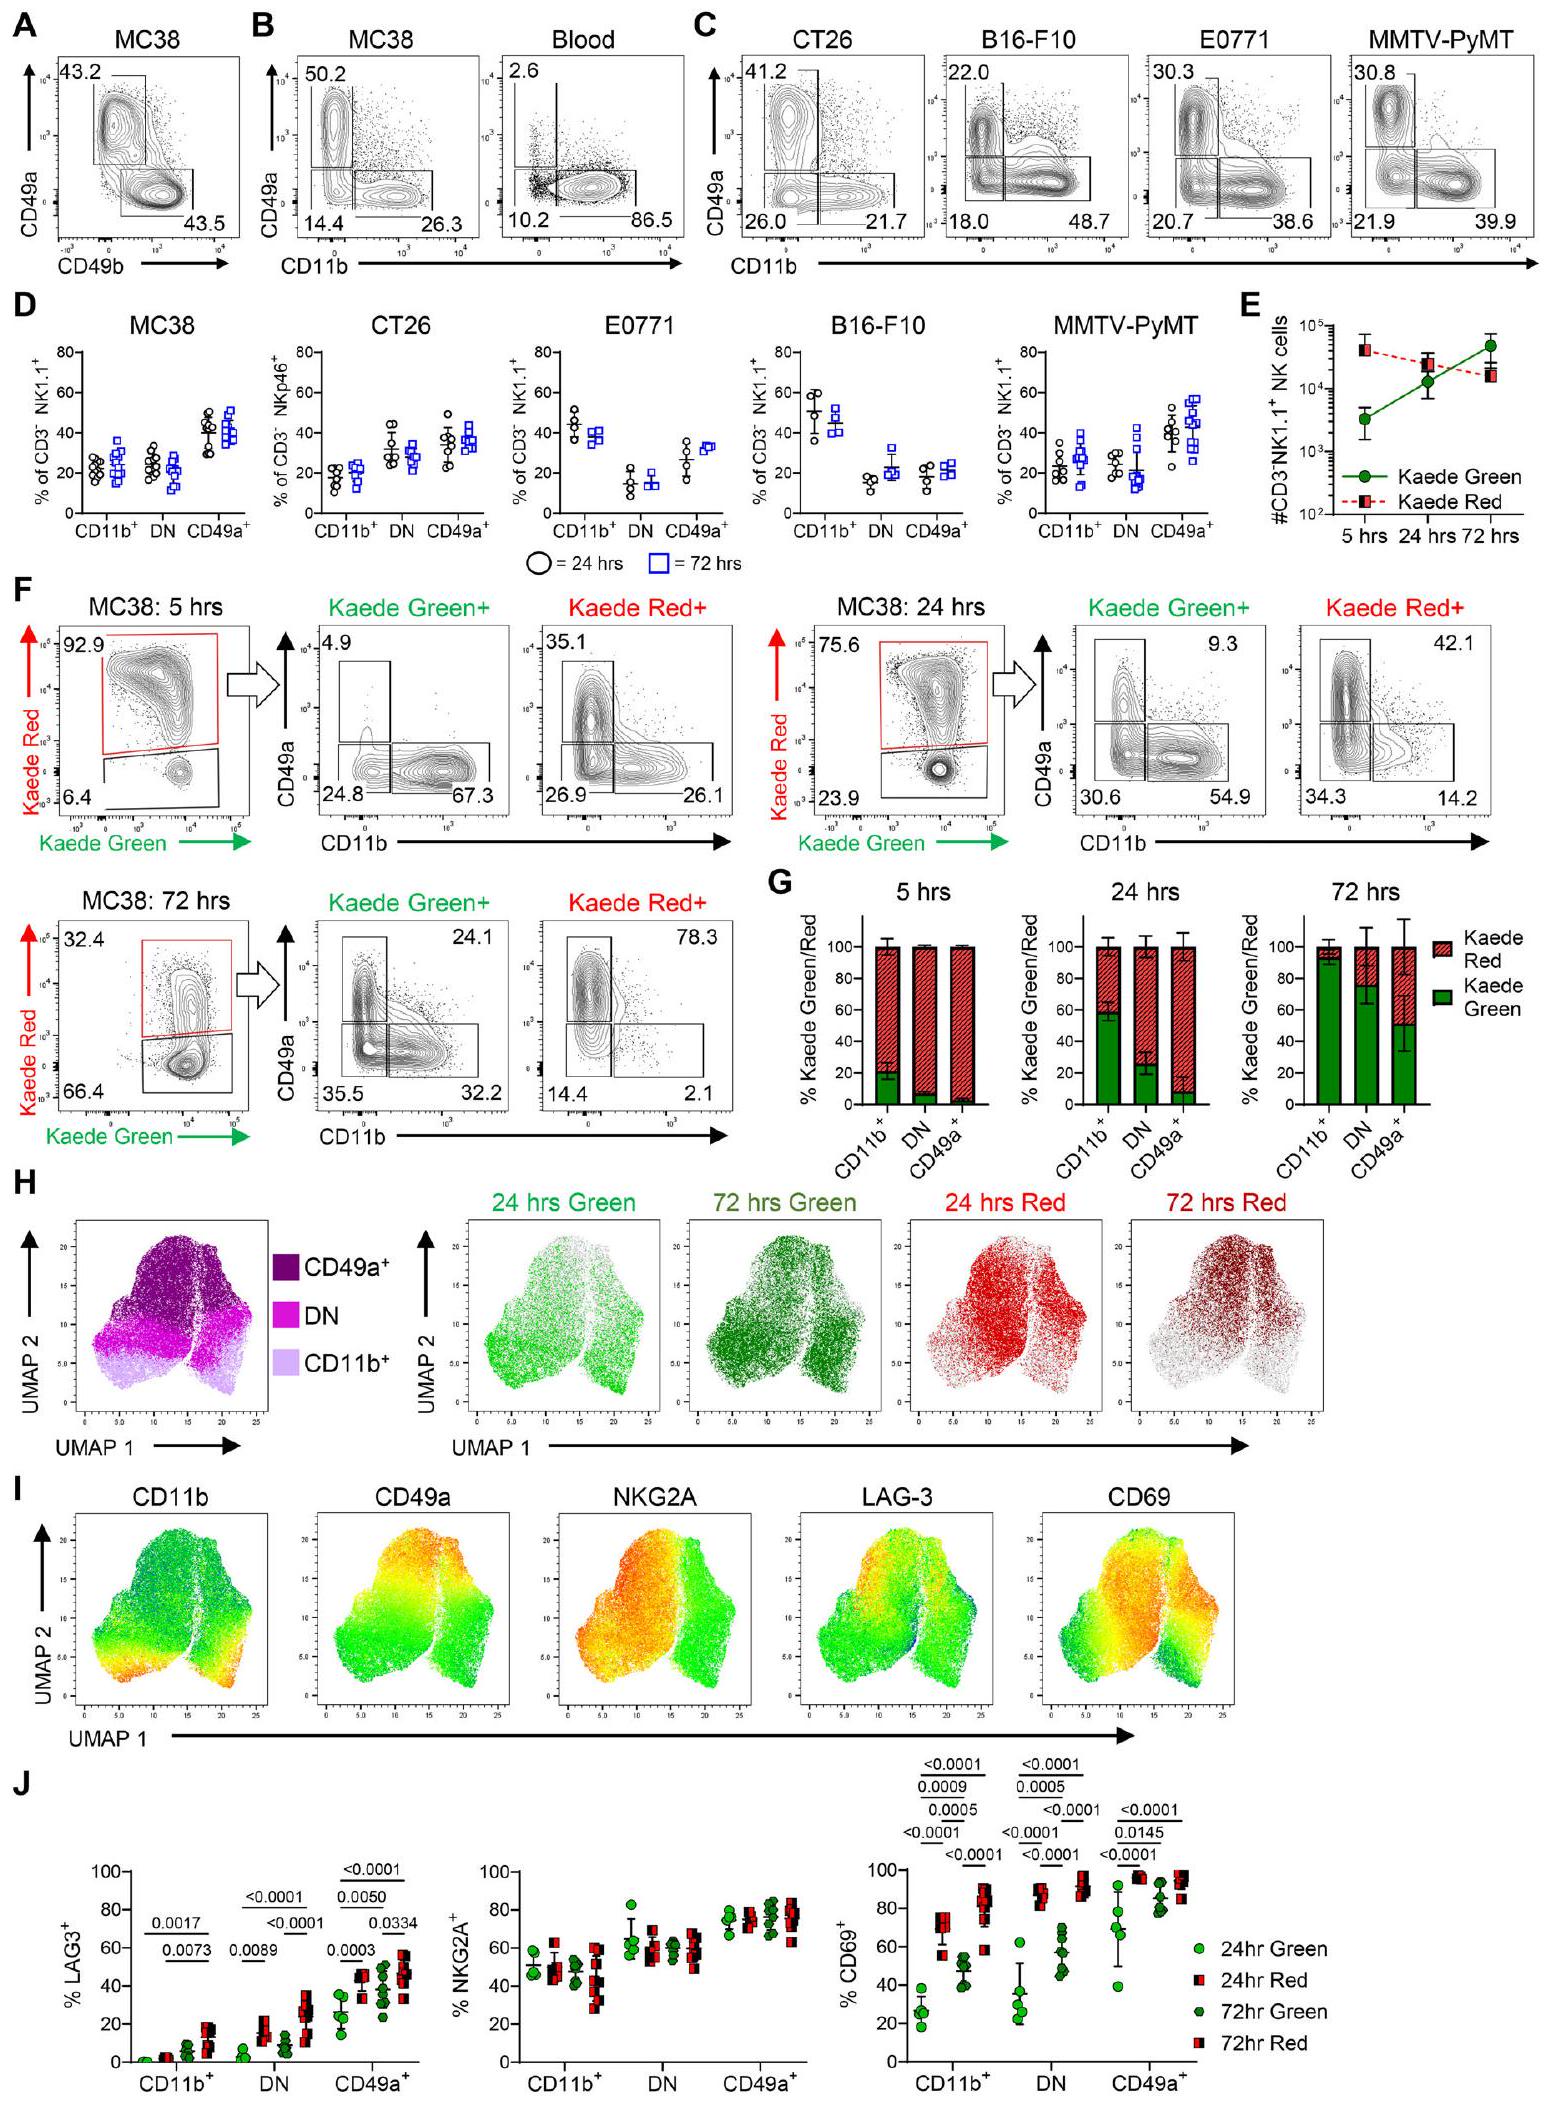
للتحقق من التغيرات السريعة الملحوظة في الملف النسخي لخلايا NK التي تدخل الورم، لجأنا إلى قياس التدفق الخلوي وبدأنا في تحديد أفضل طريقة للتعرف على الخلايا الموصوفة على طول المسار الرئيسي لمصير الخلايا. نظرًا للتعبير المختلف عن Itga1 وItga2 (الشكل 1I) والاستخدام السابق لهذه التكاملات لتعريف تجمعات NK.قمنا بتقييم CD49a مقابل CD49b على خلايا CD3- NK1.1+ في أورام MC38. ومع ذلك، كشفت تحليلاتنا عن وجود مجموعتين واضحتي NK فقط (الشكل 2A)، مما دفعنا لتجربة استراتيجيات تصنيف بديلة. مقارنة تعبير CD49a مقابل CD11b حددت ثلاث مجموعات من خلايا CD3NK1.1+: خلايا CD11b+ CD49a-، خلايا CD11b- CD49a- وخلايا CD11b- CD49a+ (الشكل 2B). من المهم أن نمط التلوين المماثل لوحظ عبر نماذج سرطانية فئوية متعددة بما في ذلك أورام تحت الجلد الأخرى (CT26، B16-F10-OVA)، والأورام الموضعية (E0771) والأورام الأولية (MMTV-PyMT) (الشكل 2C، D). لتوسيع هذا التحليل ومقارنة خلايا NK داخل الورم مع مجموعات NK/ILC1 الموجودة في الأنسجة السليمة، قمنا بتقييم خلايا CD3- NK1.1+ في أورام MC38 وB16-F10، إلى جانب الطحال والكبد والأمعاء الدقيقة والقولون (الشكل التكميلية 4). تشير هذه البيانات إلى أن حجرة خلايا NK في الورم كانت فينوتيبياً متميزة عن تجمعات ILC1 المحددة في الأنسجة غير الورمية، بما يتماشى مع تحليلات scRNA-seq الحديثة.
لتأكيد أن تعبير CD49a مقابل CD11b يمكن استخدامه لتقييم نمط خلايا NK عند دخولها الورم ثم تتبع التغيرات مع مرور الوقت، قمنا بتحويل صور أورام MC38 وتحليل حجرة خلايا NK داخل الورم بعد 5 و 24 و 72 ساعة. أظهرت إحصائية العدد الإجمالي لخلايا NK استمرار تجنيد خلايا جديدة (KG+) خلال هذه الفترة الزمنية، إلى جانب انخفاض طفيف في عدد الخلايا المحتفظ بها (KR+) داخل الورم (الشكل 2E). أظهر التحليل بعد 5 ساعات فقط من التحويل الضوئي وجود مجموعة صغيرة من خلايا NK الجديدة الواصلة KG+، حيث كانت الغالبية منها CD11b+CD49a- وكانت حجرة CD49a+ غائبة (الشكل 2F). أظهر التحليل بعد 24 ساعة من التحويل الضوئي أن حوالي 10% من خلايا NK KG+ تعبر عن CD49a، مما يثبت أن تغيير تعبير الإنتجرين يبدأ في الحدوث بعد يوم واحد فقط في البيئة المجهرية للورم. ومن الجدير بالذكر أن مجموعة KR+ بعد 72 ساعة من التحويل الضوئي، والتي بحكم التعريف قضت على الأقل 3 أيام داخل الورم، كانت جميعها تقريبًا CD49a+CD11b-. نظرًا لوجود مزيج من خلايا CD49a+ و CD49a- بين خلايا KR+ بعد 24 ساعة، تشير هذه البيانات إلى أن التحويل الكامل لخلايا cNK يستغرق أكثر من 24 ساعة ولكنه يكتمل في حوالي 3 أيام. أظهر تحليل نسبة خلايا KG+ داخل كل مجموعة أنه بحلول 72 ساعة بعد التحويل الضوئي، كانت الغالبية العظمى من مجموعات CD11b+CD49a- و CD11b-CD49a- تتكون من خلايا تدخل بعد التوسيم (الشكل 2G). لوحظت تغييرات ديناميكية مماثلة في نمط خلايا NK مع مرور الوقت في نماذج أورام فئران متعددة أخرى (الشكل التكميلية 5). بالإضافة إلى ذلك، قمنا بمزيد من التحقق من أنماط التعبير التي لوحظت في تحليلنا النسخي، حيث تم تحديد زيادة التعبير عن LAG-3 و CD69 كميزات مميزة لحالة ‘الاحتفاظ بالورم’ CD49a+ (الأشكال 2H-J). ومن المثير للاهتمام، أن تعبير NKG2A، المستقبل المثبط المشفر بواسطة Klrc1، أظهر نمط تعبير ثنائي الطور، إلى حد كبير مستقل عن الوقت داخل الورم.
تشير هذه البيانات بوضوح إلى أن تباين خلايا NK داخل الورم يمكن تفسيره بالوقت الذي قضته خلايا cNK داخل الورم. إن غياب خلايا NK السلبية لـ CD49a بين خلايا NK الإيجابية لـ KR بعد 72 ساعة من التحويل الضوئي يشير إلى أن هذه الخلايا يجب أن تتحول جميعها إما إلى حالة إيجابية لـ CD49a، أو تخرج من الورم، أو تموت في الموقع. للتحقيق في خروج خلايا NK، تم تحويل الأورام ضوئيًا وتم تحليل خلايا KR+ الموجودة في العقد اللمفاوية الدانية والطحال بعد 24 و72 ساعة (الشكل التوضيحي 6). كانت النسبة والعدد الإجمالي لخلايا NK الإيجابية لـ KR في أي من الأنسجة منخفضة جدًا، مما يشير إلى أن عددًا قليلاً من خلايا NK خرجت من الورم. من بين تلك خلايا NK التي خرجت، كانت الغالبية تفتقر إلى تعبير CD49a. تشير هذه البيانات مجتمعة إلى أن حجرة خلايا NK الإيجابية لـ CD49a في نماذج الأورام الفأرية هذه تنشأ من تمايز واحتفاظ خلايا cNK الدائرة.
تفقد خلايا NK بسرعة الوظائف الأساسية الفعالة بعد دخولها الورم
بعد أن حددنا كيفية التعرف على التغيرات الزمنية في حالة خلايا NK من خلال مزيج من الوسم الضوئي وتحليل تعبير الإنتجرين، سعينا لفهم كيف تأثرت وظيفة خلايا NK بالوقت الذي قضته في بيئة الورم الدقيقة. للنظر في التفاعلات الخلوية المحتملة لحالات خلايا NK المختلفة التي تم تحديدها بطريقة غير متحيزة، استخدمنا CellChat.وركزت بشكل خاص على الخلايا النخاعية داخل البيئة المجهرية للورم نظرًا للأدلة على تأثير هذا المحور الخلوي على المناعة المضادة للورم (الشكل التوضيحي 7). حددت هذه التحليل عددًا من الروابط المحتملة التي اختلفت اعتمادًا على حالة خلايا NK، بما في ذلك عدد من التفاعلات المناعية المحفزة (Ifng، Ccl5، Il18) التي تشمل خلايا NK التي تم تجنيدها حديثًا، ولكن ليس تلك التي تم الاحتفاظ بها داخل الورم لعدة أيام. ومن الروابط الأخرى الملحوظة كانت الاستجابة المحتملة لحالة NK_5 لإشارات Il15 بالإضافة إلى ظهور تفاعلات مستقبلات مثبطة (مثل Cd244a:Cd48). بشكل جماعي، أبرز هذا التحليل غير المتحيز في السليكون الإمكانية لوجود اتصالات خلوية مختلفة تمامًا بين خلايا NK التي تم تجنيدها حديثًا وتلك المحتفظ بها في الورم.
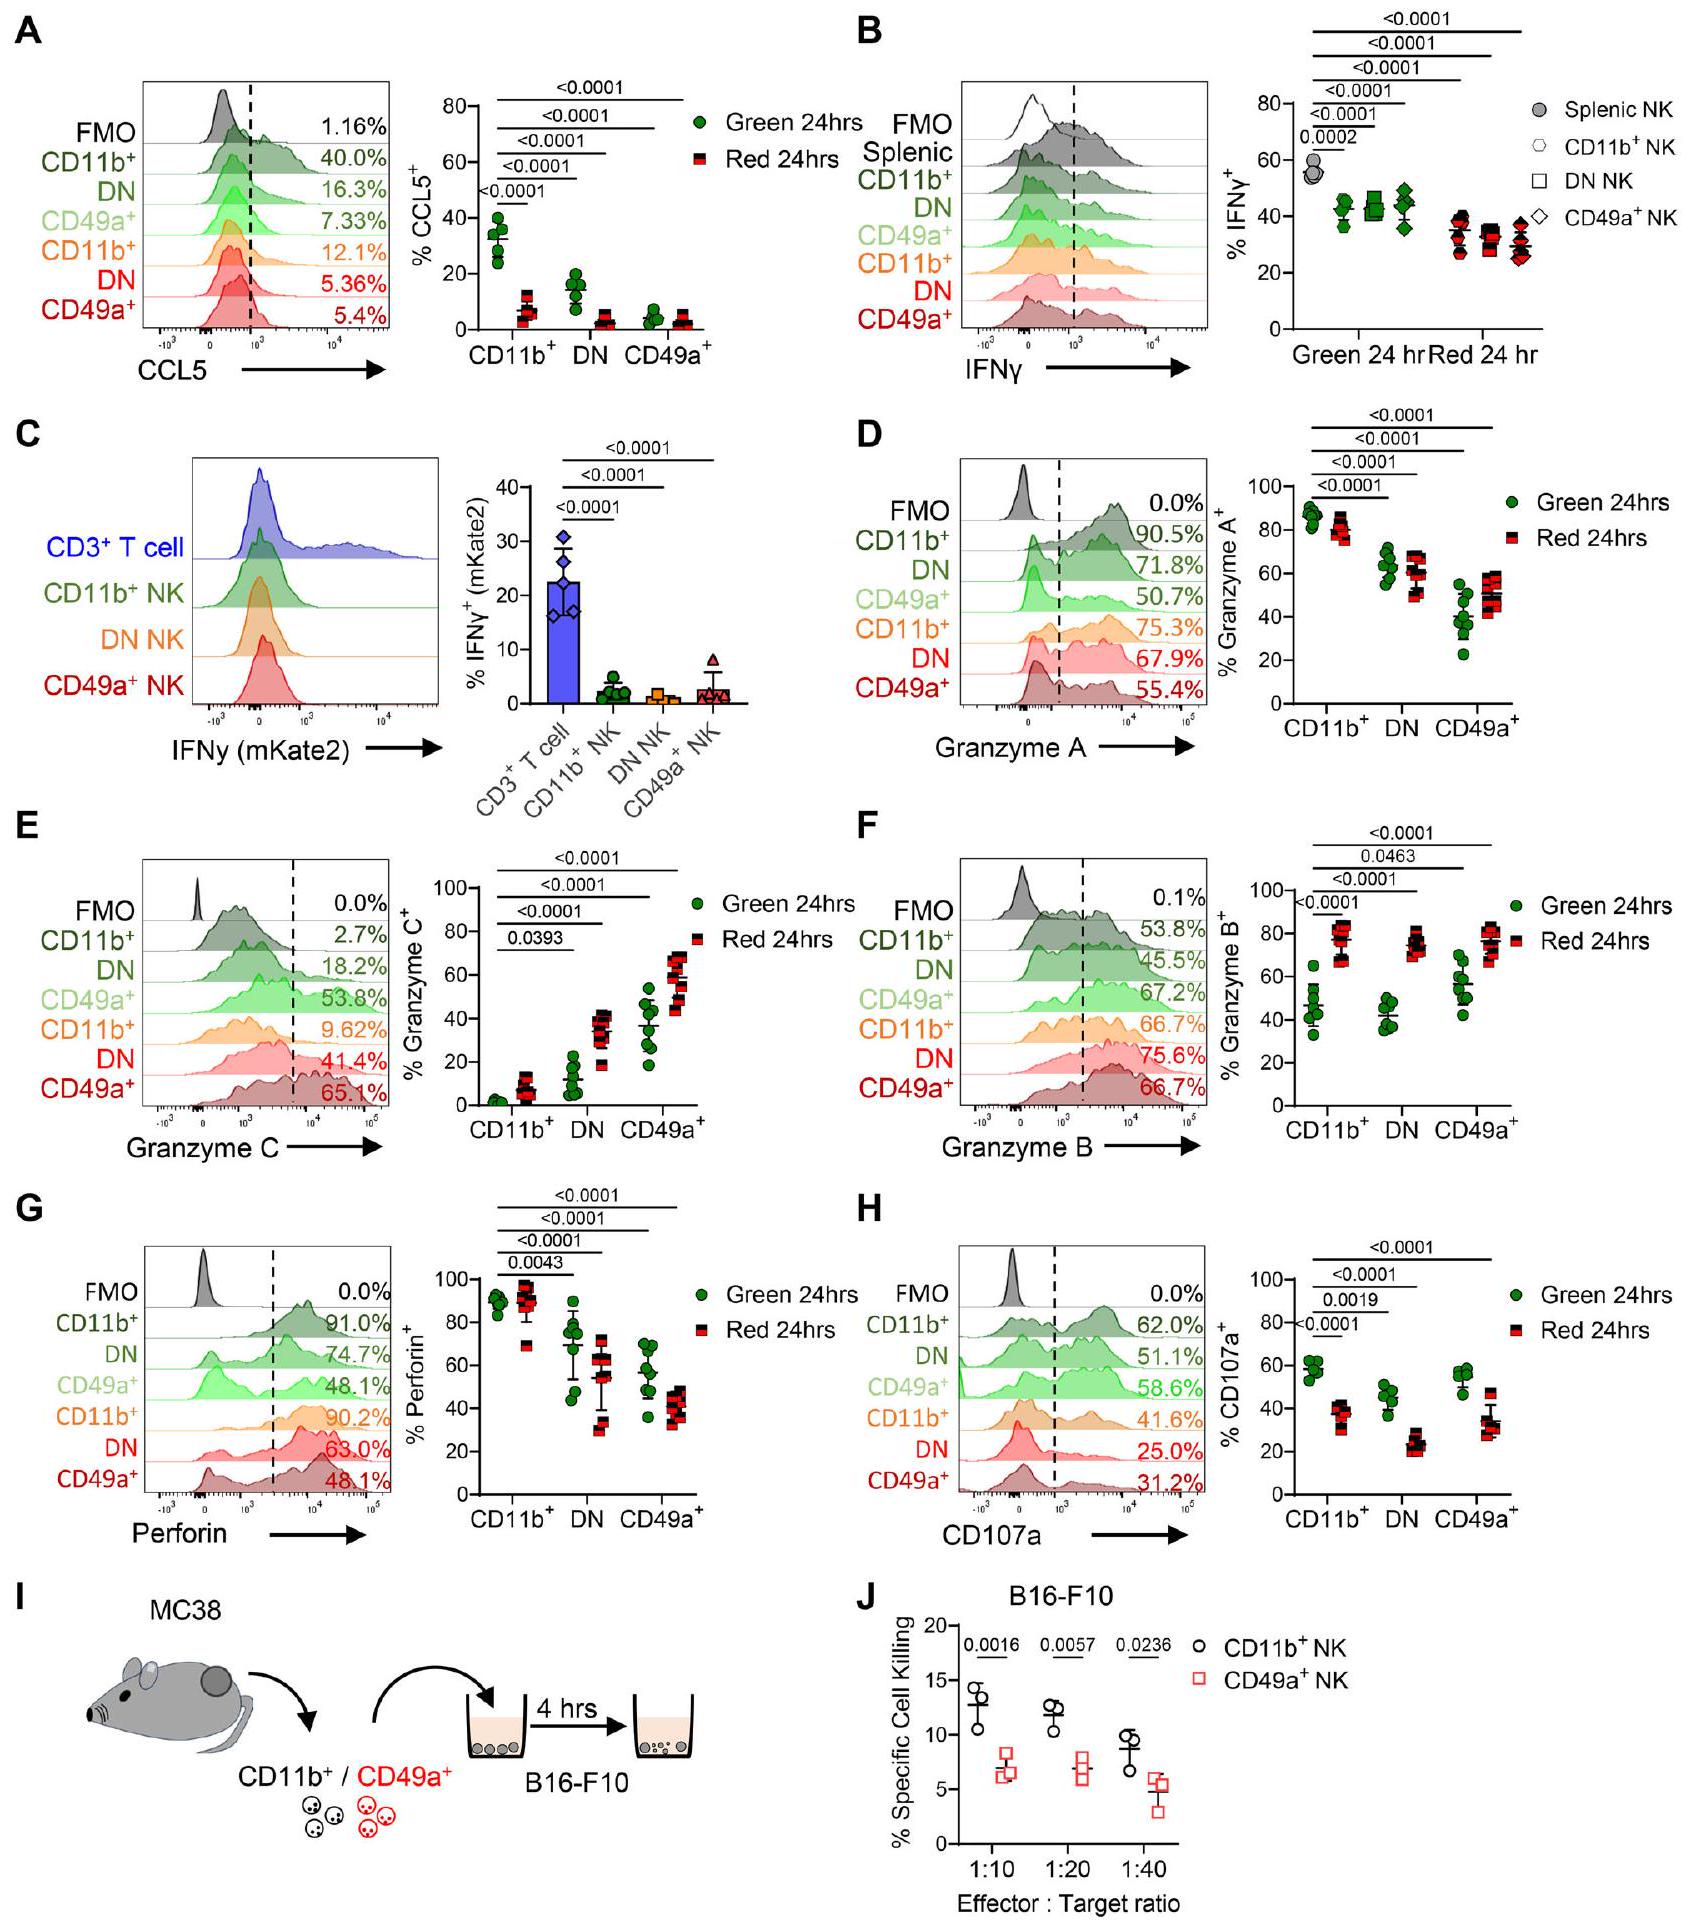
للتحقق من بعض التغيرات النسخية الملحوظة، تم عزل خلايا NK من الأورام المعلّمة بالضوء، وتحفيزها خارج الجسم، وتقييمها بواسطة قياس التدفق الخلوي الداخلي. أظهر تحليل خلايا NK بعد 24 ساعة من التحويل الضوئي أن إنتاج CCL5 كان مقصورًا علىالخلايا، مؤكدة الفقد السريع للتعبير عن CCL5 بعد دخول الورم (الشكل 3A). إنتاج خلايا NK لـ IFNهو آلية إضافية يمكن من خلالها للخلايا المناعية الفطرية تنشيط خلايا DCs لـ تمكين تحفيز محدد للمستضد خلايا بعد التحفيز خارج الجسم، أنتجت خلايا NK داخل الورم كميات أقل بكثير من IFNمن خلايا NK الطحالية (الشكل 3B). للتحقيق بشكل أعمق في تعبير Ifng في خلايا NK في غياب التحفيز الخارجي، توجهنا إلى Ifngفئران التقرير. لتأكيد دقة التقرير في هذا النموذج الجديد، تم تحفيز الخلايا الطحالية خارج الجسم باستخدام IL-12 وIL-18 المعاد تكوينهما، مما أدى إلى تقارير قوية عن تعبير Ifng في خلايا NK.
الشكل 2 | التعبير التفاضلي لـ CD11b و CD49a يلتقط التغيرات الزمنية في نمط الخلايا القاتلة الطبيعية. أ تعبير CD49a مقابل CD49b بواسطة الخلايا القاتلة الطبيعية (CD3- NK1.1+) المعزولة من أورام MC38 المزروعة تحت الجلد على الجانب. ب تعبير CD49a مقابل CD11b بواسطة الخلايا القاتلة الطبيعية المعزولة من أورام MC38، إلى جانب الدم. تعبير CD49a مقابل CD11b بواسطة خلايا NK عبر نماذج الأورام المتعددة. تم تحديد خلايا NK على أنها CD3- NK1.1+ في فئران C57BL/6، و CD3- NKp46+ في فئران BALB/c. د نسبة خلايا NK ضمن بوابات CD11b + CD49a-، CD11b- CD49a- (سلبية مزدوجة، DN) و CD11b- CD49a+ عبر نماذج الأورام المختلفة. تم جمع البيانات من أورام B16-F10-OVA و EO771 من تكرار مستقل واحد، وأورام MC38 و CT26 و MMTV-PyMT تم تجميعها من تكرارين مستقلين، حيث MC38 ( ), CT26 ( )، EO771 ( ب16-ف10-أوفا ( )، و MMTV-PyMT ( عدد خلايا NK من Kaede Green+ و Kaede Red+ عند 5 و 24 و 72 ساعة بعد تحويل الضوء لأورام MC38. تعبير CD49a مقابل CD11b بواسطة Kaede
خلايا NK من Kaede Green+ و Kaede Red+ عند 5 و 24 و 72 ساعة بعد تحويل الضوء. نسبة Kaede Green/Red لكل مجموعة خلايا NK في كل نقطة زمنية بعد تحويل الضوء. البيانات عندساعة تمثل تكرارًا مستقلًا واحدًا، بينماوساعة مجمعة من تكرارين مستقلين. H UMAPs تظهر تعبير البروتين CD11b و CD49a جنبًا إلى جنب مع تعبير Kaede Green/Red بواسطة خلايا NK المعزولة من أورام MC38 عند 24 و 72 ساعة بعد تحويل الضوء. I UMAPS تظهر تعبير CD11b و CD49a و NKG2A و LAG-3 و CD69. J تعداد نسبة الخلايا التي تعبر عن NKG2A و LAG-3 و CD69 عبر مجموعات خلايا NK. البيانات في UMAPsوتمثل تكرارين مستقلين. تم تحديد الأهمية الإحصائية بواسطة ANOVA ثنائية الاتجاه مع اختبار المقارنات المتعددة Šidák (J). يتم تقديم البيانات مع عرض جميع نقاط البيانات الفردية بالإضافة إلى القيمة المتوسطةSD. في جميع التجارب، ‘‘ تعرف ورمًا واحدًا على فأر فردي، أي،تشير إلى 3 فئران كل منها يحمل ورمًا واحدًا. خلايا ولكن ليس خلايا T (الشكل التكميلي 8A). ومع ذلك، كانت خلايا NK المعزولة حديثًا من أورام MC38 المزروعة في فئران Ifngتفتقر إلى تعبير mKate2 بغض النظر عن تعبيرها عن الإنتجرين (الشكل 3C). للتحقق من التغيرات في الملف السام لخلايا NK داخل الورم كما أشار التحليل النسخي (الشكل 1J)، أكدنا أن الغرانزيم A تم إنتاجه من قبل الغالبية العظمى من خلايا CD11b + CD49a-، ولكن تم اكتشاف كميات أقل بكثير في مجموعات CD11b- CD49a- و CD11b- CD49a + (الشكل 3D). بالمقارنة مع الانخفاض في إنتاج الغرانزيم A، ومرة أخرى متسقة مع التغيرات الملحوظة على مدى الوقت النسخي الزائف، كان إنتاج الغرانزيم C مفقودًا من خلايا KG+ CD11b+ CD49a- وتم إنتاجه بشكل أكبر من قبل خلايا KR+ CD11bCD49a+ (الشكل 3E). الغرانزيم B، الذي لم يتم التعبير عنه بشكل مختلف على مدى الوقت الزائف على المستوى النسخي، تم اكتشافه عبر جميع مجموعات خلايا NK ونسبة أكبر بكثير من خلايا KR+ NK أنتجت الغرانزيم B (الشكل 3F). ومع ذلك، كان إنتاج البيرفورين منخفضًا بشكل كبير في خلايا NK CD11b- CD49a+ مقارنة بمجموعات CD11b+ CD49a- (الشكل 3G). أخيرًا، كانت نسبة خلايا NK التي تعبر عن CD107a منخفضة بشكل كبير بين مجموعة KR+ (الشكل 3H).
تم تأكيد هذه التغيرات في وظيفة خلايا NK عندما احتفظت داخل الأورام في نماذج أورام فئران أخرى (الشكل التكميلي 8B-E). من الجدير بالذكر، بعد تحليل أورام CT26 المزروعة تحت الجلد، سألنا أيضًا عما إذا كانت خلايا NK غير الوظيفية قد لوحظت أيضًا عندما تم زراعة هذه السلالة الخلوية القولونية بشكل موضعي (الشكل التكميلي 8F، G). هنا، بالإضافة إلى خلايا NK EOMES+ داخل مجموعات CD3-NKp46+، كانت خلايا ILCs CXCR6+ EOMES- واضحة، وهي مجموعة تفتقر في النموذج تحت الجلد الذي يعكس مساهمة ILCs الموجودة داخل الأنسجة المحلية (الشكل التكميلي 8 H، I). لتقييم ما إذا كانت خلايا cNK تتمايز إلى نمط CD11b- CD49a+، قمنا بعزل خلايا NK الطحالية من فئران Kaede ونقلناها عن طريق الوريد إلى مضيفين WT C57BL/6 يحملون أورام MC38 (الشكل التكميلي 9A، B). فقط داخل أورام MC38، قامت خلايا NK KG+ المنقولة بزيادة تعبير CD49a و الغرانزيم C (الشكل التكميلي 9C-G). أخيرًا، سعينا لاختبار ما إذا كانت مجموعة خلايا NK CD11b- CD49a+ أقل سمية من خلايا CD11b + CD49a- التي تدخل الأورام. للقيام بذلك، قمنا بعزل خلايا NK CD11b+ و CD49a+ من أورام MC38 واختبرنا قدرتها على تكسير خلايا ورم B16-F10 في المختبر على مدى 4 ساعات (الشكل 3I). أظهرت مجموعة CD11b+ قتلًا أفضل بشكل ملحوظ من خلايا NK CD49a+ المسمى، متسقة مع الفروق الوظيفية في القدرة السامة لهذه المجموعات (الشكل 3J). بشكل جماعي، توضح هذه البيانات وجود خلايا NK غير الوظيفية عبر نماذج سرطان قبل السريرية متعددة تستهدف أنسجة مختلفة. بشكل عام، يرتبط زيادة تعبير CD49a في غياب CD11b بالاحتفاظ في TME، وتغير الوظائف الفعالة، وتقليل كفاءة قتل خلايا الورم.
تدفع آليات متعددة في TME تحويل خلايا cNK إلى حجرة خلايا NK CD49a + المحتفظ بها في الورم
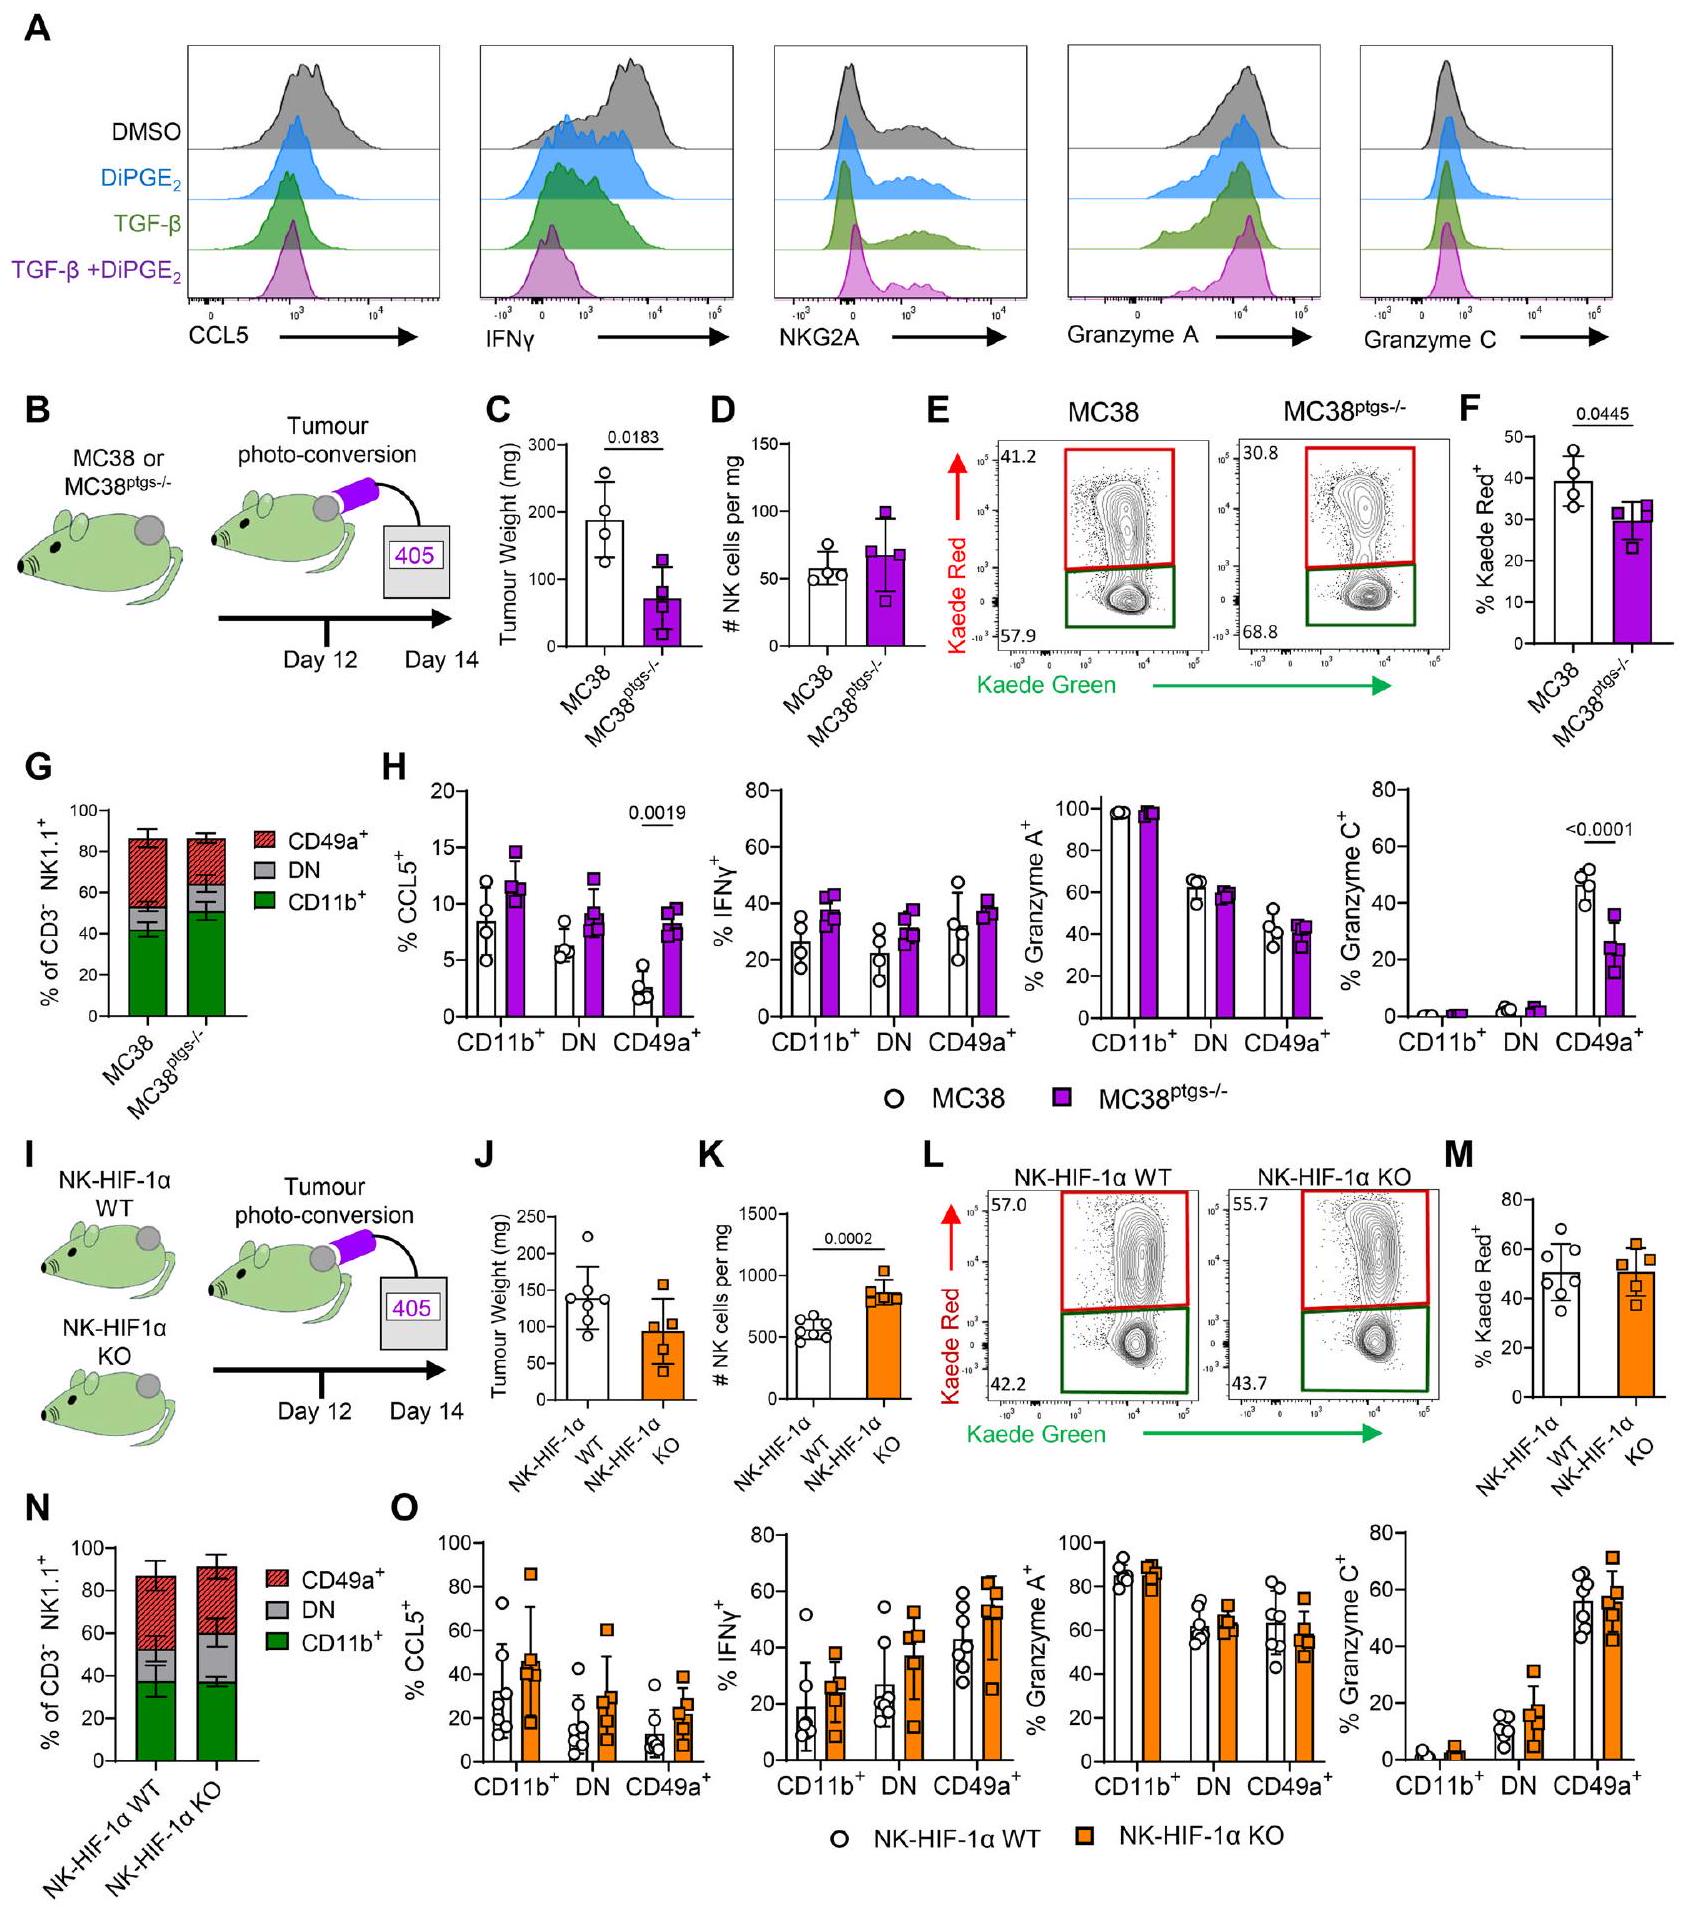
بعد تحديد الحالة الخلوية التي تتبناها خلايا cNK التي تحتفظ بها داخل الأورام، سعينا لفهم الآليات داخل TME التي تدفع هذا المصير الخلوي. تم ربط مسارات TGFو بتغير وظائف خلايا NK سواء في المختبر أو في الجسم الحي. سألنا في البداية عما إذا كانت خلايا NK ذات النمط الظاهري والمجموعة الوظيفية لخلايا CD49a+ ‘المحتفظ بها في الورم’، يمكن تحفيزها من خلال تعرض cNKs لـ TGFالمعاد تركيبها و/أوخارج الجسم. أدى الزرع مع TGF، ولكن ليس، إلى زيادة تعبير CD49a، ومع ذلك لم يتغير تعبير CD11b (الشكل التكميلي 10A). أدى الزرع مع TGFأو، بمفردها، أو معًا، إلى تقليل إنتاج خلايا NK لـ CCL5 عند إعادة التحفيز، بينما تطلبت الخسارة الكاملة لتعبير IFNكلا من التعرض لـ TGFوومع ذلك، لم يتم ملاحظة أي تغيير في إنتاج الغرانزيم A أو الغرانزيم C، مما يشير إلى أن الطيف الكامل من التغيرات المرتبطة بخلايا NK المحتفظ بها داخل الأورام لا يمكن إعادة إنتاجه في المختبر.
بينما تمكنا من إعادة إنتاج جزئي لتغيرات نمط خلايا NK والوظائف في المختبر، لتعريف الإشارات التي تعدل خلايا NK داخل الورم بشكل أفضل، انتقلنا إلى الأساليب الحية، مع التفكير في أن هذه ستعكس TME المعقد بشكل أفضل. للتحقيق في دور TGFفي دفع التغيرات في خلايا NK داخل الورم، سعينا لتقليل Tregs داخل الورم، نظرًا لأنها مصدر حاسم لـ TGF. نظرًا لأن خلايا NK يمكن أن تعبر عن CTLA4 و CD25، استخدمنا الأجسام المضادة المضادة لـ OX40، التي حذفت بكفاءة خلايا FoxP3+ CD4 T داخل الورم بينما تركت خلايا NK سليمة (الشكل التكميلي 10C-E). ومع ذلك، لم يؤثر تقليل Tregs داخل الورم على نسب خلايا NK التي تعبر بشكل مختلف عن CD49a أو CD11b (الشكل التكميلي 10F). لم يتم الكشف عن أي اختلافات في إنتاج IFNأو الغرانزيم A أو الغرانزيم C، على الرغم من أن إنتاج CCL5 قد زاد بشكل كبير بسبب تقليل Treg (الشكل التكميلي 10G).
للتحقيق في تأثير خلايا الورم المشتقة منالخلايا الناقصة COX-1 و COX-2 (المشفرة بواسطة Ptgs1/Ptgs2، المسماة MC38) تم زراعتها على جانب فئران C57BL/6 Kaede وتم مقارنة حجرة خلايا NK مع تلك الخاصة بأورام MC38 (الشكل 4B). على الرغم من ضعف نمو الورم لخلايا MC38(الشكل 4C)، لم تتغير نسبة خلايا NK بشكل كبير، وكان الاحتفاظ بخلايا NK قد أثر بشكل متواضع فقط (الشكل 4D-F). بينما لم تتغير نسبة مجموعات خلايا NK المحددة بتعبير CD49a و CD11b، لوحظت اختلافات كبيرة في إنتاج CCL5 و الغرانزيم C، مما يشير إلى تأثير جزئي على نمط خلايا NK ووظيفتها (الشكل 4G، H).
نقص الأكسجة هو سمة شائعة للأورام الصلبة وقد تم ربطه بتغير وظائف خلايا NK. لاستكشاف التأثيرات المحتملة لنقص الأكسجة على خلايا NK، كررنا أولاً زراعتنا في المختبر عند 1% أكسجين، ومع ذلك، لم يتم ملاحظة سوى تغييرات متواضعة جدًا في تعبير الإنتجرين والغرانزيم (الشكل التكميلي). لاختبار دور HIF-1في كبح وظائف خلايا NK داخل الورم، أنشأناxHif1ax Kaede mice وزرعناها، جنبًا إلى جنب مع ضوابط من نفس السلالة السلبية مع أورام MC38 (الشكل 4I). تم تحويل الأورام بالضوء في اليوم 12 وتم تحليلها بعد 48 ساعة بعد التحفيز خارج الجسم. فشل الحذف الشرطي لتعبير HIF-1في خلايا NK في التأثير بشكل كبير على نمو الورم (الشكل 4J) و
الشكل 3 | تغير خلايا NK بسرعة إنتاج الكيموكينات والسيتوكينات والغرانزيم خلال 24 ساعة من دخول TME. تم استخدام تدفق الخلايا لتأكيد التغيرات في وظيفة خلايا NK المعزولة من أورام MC38 بعد 24 ساعة من تحويل الضوء. A نسبة خلايا NK التي تنتج CCL5 بعد إعادة التحفيز خارج الجسم، مع هيستوجرامات تمثيلية جنبًا إلى جنب مع التعداد (). B نسبة خلايا NK التي تنتج IFNبعد التحفيز خارج الجسم، مع هيستوجرامات تمثيلية جنبًا إلى جنب مع العد ). تقرير C عن mKate 2 في الاستخدام فنيكرتم تقييم الفئران المراسلين، مع خلايا T مقابل خلايا NK المعزولة من أورام MC38. تم عرض الرسوم البيانية التمثيلية ونسبة الخلايا الموجبة لـ mKate2. تم عرض الرسوم البيانية التمثيلية التي تظهر نسبة خلايا NK المنتجة (D) جرزيم A، (E) جرزيم C، (F) جرزيم B، (G) CD107a، (H) بيرفورين في أورام MC38 التي تم تحويلها ضوئيًا وتم تحليلها بعد 24 ساعة. تم تجميع البيانات من تجربتين مستقلتين. ) للجميع
التحليلات باستثناء تعبير CD107a حيثمن تجربة مستقلة واحدة. رسم كاريكاتوري يوضح إعداد التجربة حيث تم عزل خلايا NK الموجبة لـ CD11b و CD49a من أورام MC38 باستخدام تقنية فرز الخلايا (FACS) وتم زراعتها مع خلايا الميلانوما B16-F10 التي تم معالجتها مسبقًا بصبغة الخلايا البنفسجية والتي تم صبغها بعد ذلك لقياس حيوية الخلايا. ج مقارنة قتل الخلايا المستهدفة بواسطة خلايا NK من حيث السمية الخلوية بين خلايا NK الموجبة لـ CD11b و CD49a التي تم فرزها باستخدام FACS.تم تحديد الأهمية بواسطة تحليل التباين ثنائي الاتجاه مع اختبار المقارنة المتعددة لشيداك (A و B و D-H) مقارنةً بالمتوسطات لخلايا Kaede Green+ CD11b+، أو بين المجموعات (J)، واختبار كروسكال-واليس مع اختبار المقارنة المتعددة لدن (C). تُعرض البيانات مع جميع نقاط البيانات الفردية بالإضافة إلى القيمة المتوسطة. SD. في جميع التجارب ‘ يحدد ورمًا واحدًا على فأر فردي، أي، تشير إلى 3 فئران كل منها يحتوي على ورم واحد.
الشكل 4 | آليات متعددة في البيئة المجهرية للورم تدفع تحويل خلايا cNK إلى حالة محتفظة بالورم CD49a+. دور TGF و HIF-1 تم التحقيق فيها في المختبر وفي الجسم الحي كآليات تعزز تمايز خلايا NK إلى الحالة المحتفظ بها في الورم والتي تتميز بتعبير CD49a ووظائف أساسية معطلة. رسم بياني عمودي يوضح نسبة خلايا NK الموجبة لـ CD11b و CD49a بعد 48 ساعة من الزراعة في RPMI مع IL-2/IL-15 مع إضافة TGF-.و/أو DiPGEرسم كاريكاتيري يلخص تصميم التجربة لعرقلة إنتاج الورمتم تطعيم فئران كايدي إما بـ MC38 ( ) أو MC38 (MC38 ) خلايا، تم تحويلها ضوئيًا في D12 وتم تحليلها بعد 48 ساعة. C وزن الورم. D تعداد خلايا NK لكل ملغ من الورم. E مخططات تحليل التدفق تظهر تعبير Kaede Green مقابل Kaede Red بواسطة خلايا NK. F نسبة خلايا NK التي تعبر عن علامة Kaede Red بعد 48 ساعة من التحويل الضوئي. G نسبة خلايا NK في مجموعات CD11b+CD49a-، CD11b- CD49a- و CD11b- CD49a+. H نسبة خلايا NK الخلايا التي تنتج CCL5، IFNجرانزيم A، جرانزيم C بعد إعادة التحفيز خارج الجسم. رسم كاريكاتيري يلخص التصميم التجريبي لاستهداف Hifla داخل خلايا NK، باستخدام Ncr1. x Hif1 فأر كايدي (NK-HIF1ضربة قاضية ) مقابل رفقاء القمامة السلبيين لـ cre (NK-HIF1 WT ) مزروعة بأورام MC38، تم تحويلها ضوئيًا في اليوم 12 وتم تحليلها بعد 48 ساعة. ج وزن الورم. ك تعداد خلايا NK لكل ملغ من الورم. ل مخططات تحليل التدفق تظهر تعبير Kaede الأخضر مقابل Kaede الأحمر بواسطة خلايا NK. م نسبة خلايا NK التي تعبر عن علامة Kaede الحمراء بعد 48 ساعة من التحويل الضوئي. ن نسبة خلايا NK في الفئات CD11b+ CD49a-، CD11b- CD49a- و CD11b CD49a+. O نسبة خلايا NK التي تنتج CCL5، IFN، غرانزيم A، غرانزيم C بعد إعادة التحفيز خارج الجسم. تم تحديد الأهمية الإحصائية بواسطة غير المقترناختبارات ( ) أو تحليل التباين ثنائي الاتجاه مع اختبار المقارنة المتعددة لشيداك لمقارنة متوسطات المجموعات ( ). يتم عرض البيانات مع جميع نقاط البيانات الفردية بالإضافة إلى القيمة المتوسطة +/- الانحراف المعياري. بينما كان هناك زيادة متواضعة في عدد خلايا NK في الورم (الشكل 4 ك)، لم تكن هناك اختلافات في نسبة خلايا NK الإيجابية لـ KR، أو نسبة مجموعات خلايا NK، أو إنتاج CCL5، أو IFN.تم الكشف عن الجرانزيم A أو الجرانزيم C (الشكل 4L-O).
بشكل جماعي، تلخص هذه البيانات الملاحظات المنشورة بشأن دور TGF و في تغيير وظيفة خلايا NK، وخاصة إنتاج CCL5. ومع ذلك، فإن العديد من الإشارات، بدلاً من يبدو أن آلية واحدة تسبب مجموعة كاملة من التغيرات المميزة لخلايا NK التي تبقى داخل نماذج الأورام الفأرية.
تظهر خلايا NK في سرطان القولون والمستقيم البشري فقدان الوظائف الفعالة
بعد أن أظهرنا عبر نماذج سرطانية متعددة في الفئران أن خلايا NK المحتفظ بها داخل الأورام تصبح غير وظيفية، سعينا
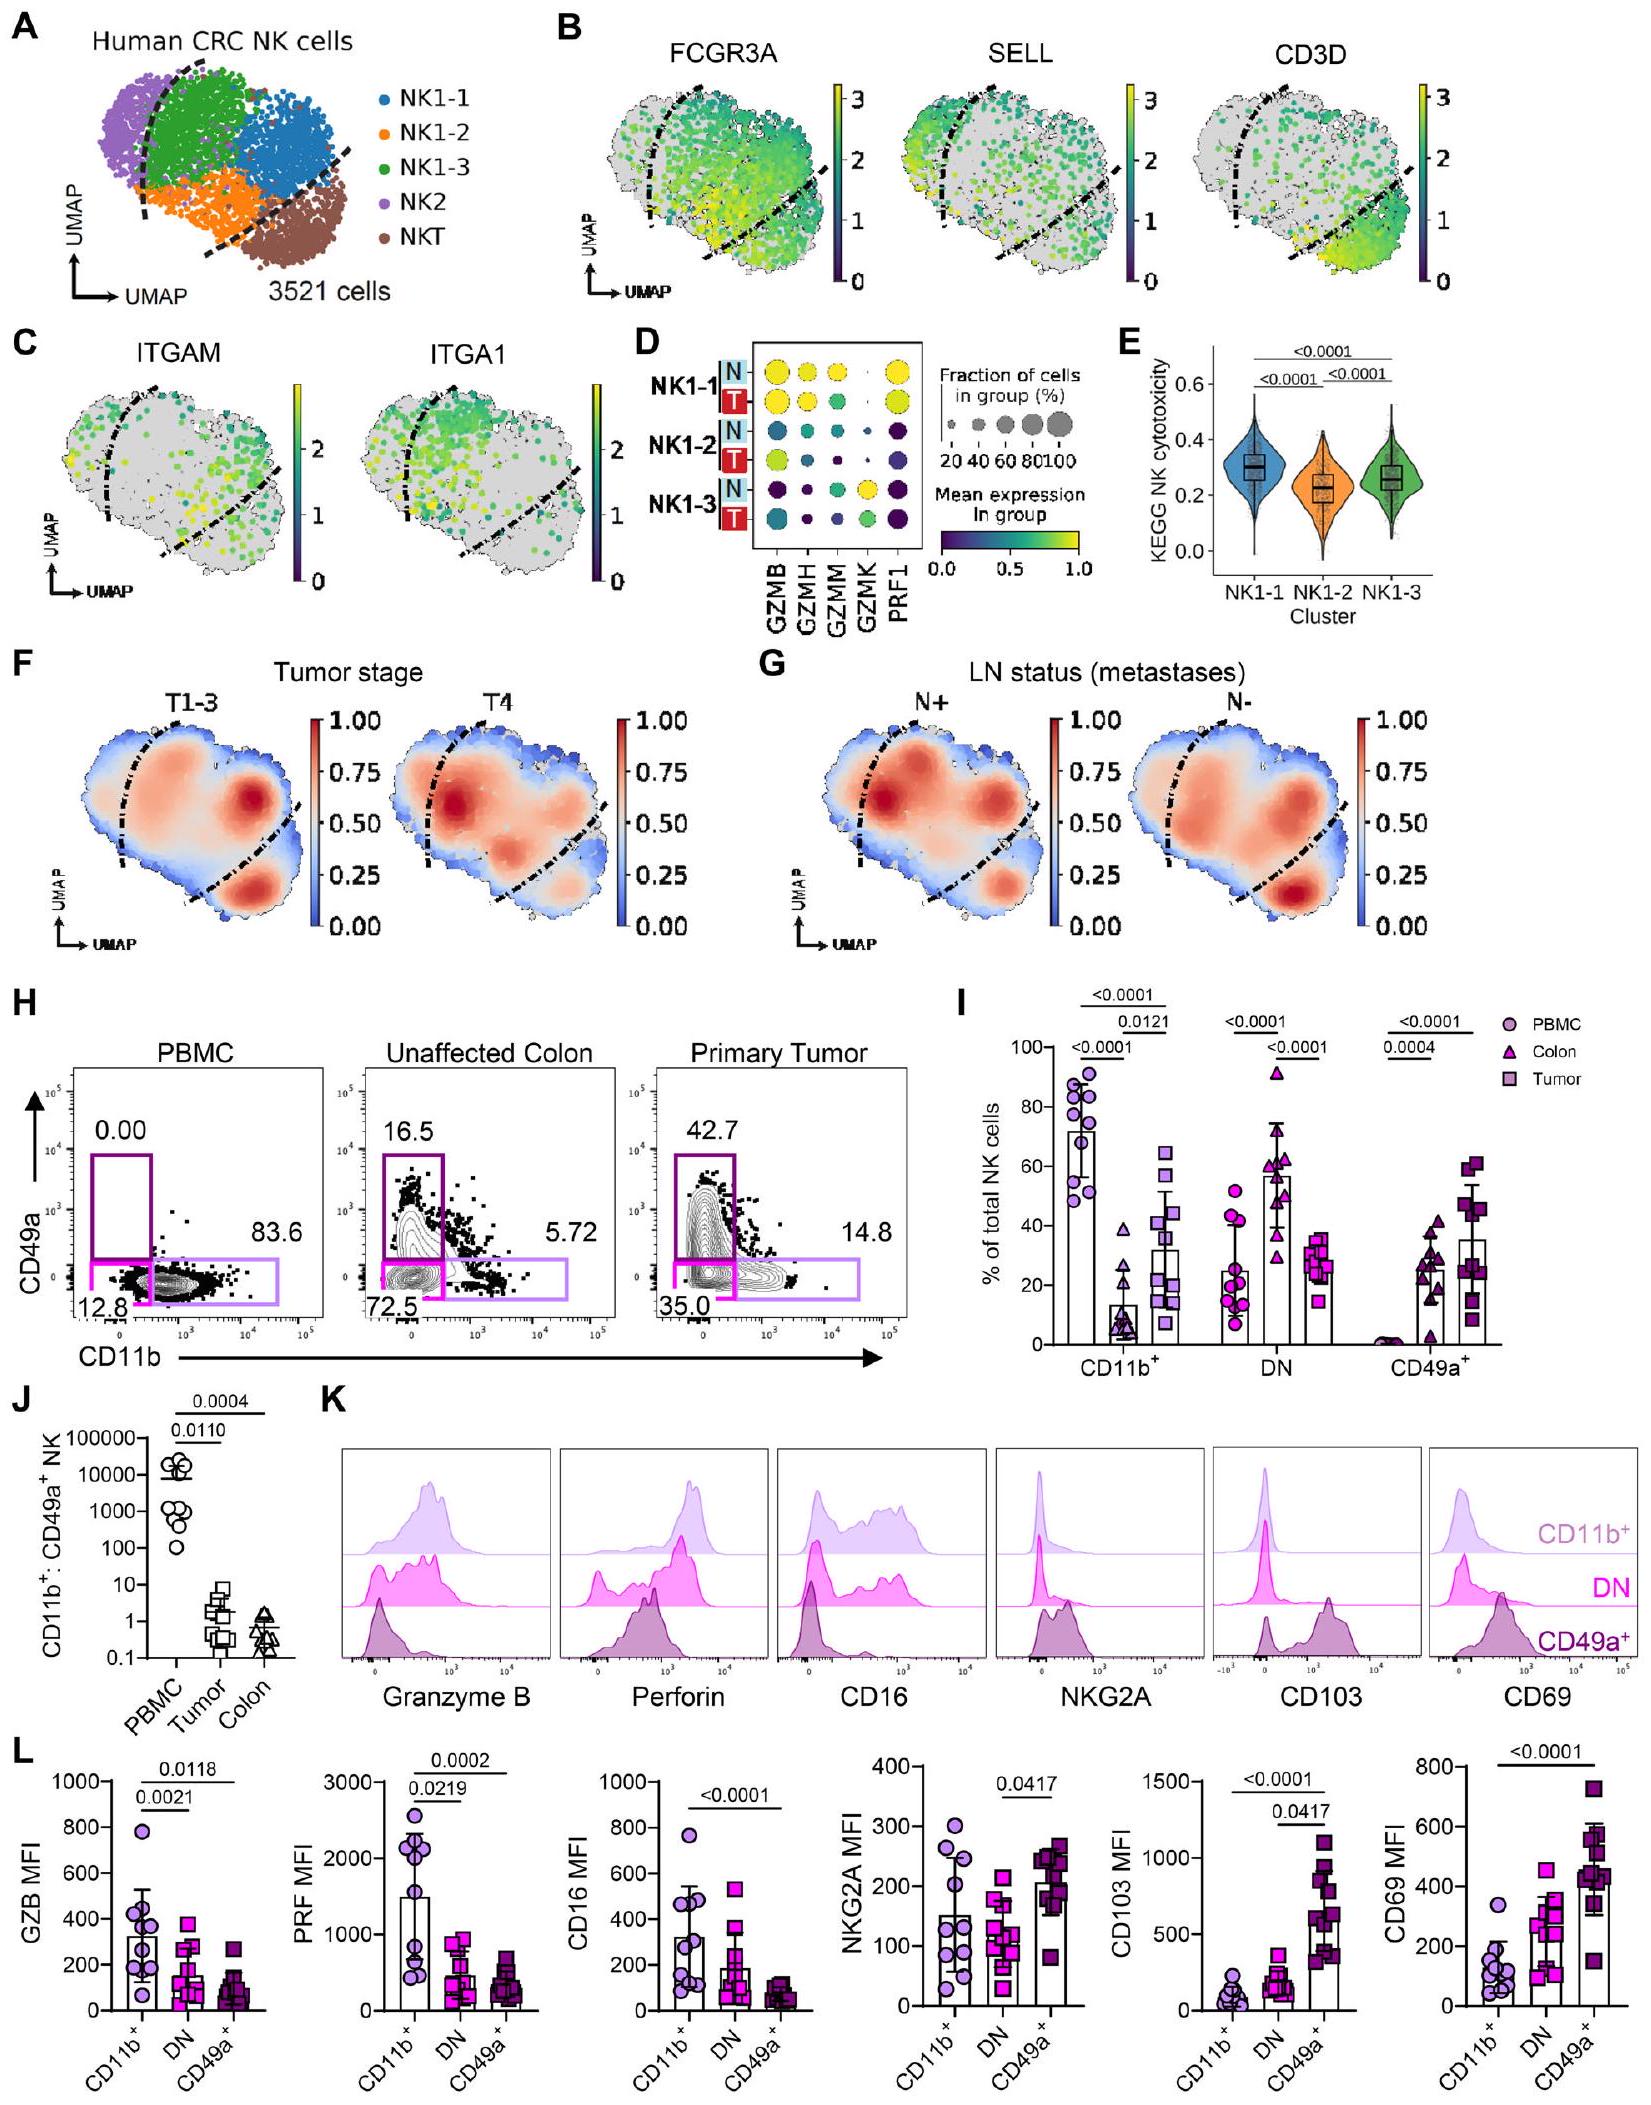
الشكل 5 | تظهر خلايا NK في سرطان القولون والمستقيم البشري فقدان الوظائف الفعالة. تم البحث عن أدلة على خلايا NK غير الوظيفية داخل سرطان القولون والمستقيم البشري من خلال تحليل المعلومات الحيوية لمجموعات البيانات المتاحة للجمهور جنبًا إلى جنب مع تحليل التدفق الخلوي لعينات سرطان القولون والمستقيم البشري الأولية. A تمثيل UMAP لـ 3521 خلية NK من تسلسل RNA أحادي الخلية لـ 62 عينة من سرطان القولون والمستقيم البشري، من GSE178341. B تعبير الجينات المحددة للعلامات للمجموعات الموضحة في ‘A’. C تعبير ITGAM وITGA1 في مجموعات NK1. D تعبير جينات الجرانيزيم والبرفورين في مجموعات NK1، في الورم (T) مقابل الأنسجة الطبيعية المجاورة (N). E إثراء مجموعة الجينات لسمية الخلايا القاتلة الطبيعية KEGG بين مجموعات NK1. F تضمين كثافة نواة غاوسي للخلايا في أورام سرطان القولون والمستقيم حسب مرحلة الورم، و(G) النقائل في العقد اللمفاوية (LN). H تمثيل مخططات التدفق التي توضح تكرار خلايا NK الموجبة لـ CD49a وCD11b عبر PBMC، وأنسجة القولون غير المتأثرة وورم سرطان القولون والمستقيم الأولي لنفس المتبرع. I مخطط عمودي يظهر تكرار خلايا NK CD11b+ CD49a- و CD11b- CD49a- و CD11b- CD49a+ عبر الأقسام. نسبة خلايا NK CD11b+ CD49a- إلى CD11b- CD49a+ عبر أقسام الأنسجة. تمثيلات بيانية تمثل تعبير العلامات المختارة على مجموعات خلايا NK المتسللة إلى الورم. مخططات عمودية توضح قيم geoMFI للعلامات المحددة في خلايا NK المتسللة إلى الورم. تم تحديد الأهمية الإحصائية بواسطة: (E) اختبار ويلكوكسون ذو الجانبين، البيانات معروضة كصندوق (الوسيط؛ الصندوق، النسبة المئوية 25 والنسبة المئوية 75؛ الشعيرات، 1.5*نطاق الربع بين) ومخططات كمان، (I) تحليل التباين الثنائي مع اختبار المقارنات المتعددة لتوكاي، و (J، L) اختبار فريدمان مع اختبار المقارنات المتعددة لدون. يتم تقديم البيانات مع عرض جميع النقاط الفردية بالإضافة إلى القيمة المتوسطة +/- الانحراف المعياري. H-L تصف البيانات من 10 مرضى مصابين بسرطان القولون. و ‘ ‘ يحدد مريضًا فرديًا. دليل على أن خلايا NK تمر بانتقال مماثل في الأورام البشرية. أظهرت تحليل خلايا المناعة من النسخ الجينية الكلية لـ 521 سرطان قولون بشري أن خلايا NK موجودة في أورام القولون، لكن معظمها تتبنى حالة “راقدة”، غير مفعلة (الشكل التكميلي 11A، B)لتوصيف نمطهم الظاهري بدقة، قمنا بإعادة تحليل تسلسل RNA أحادي الخلية لأورام القولون البشرية“، بما في ذلك 3521 خلية NK من 62 مريضًا (الشكل 5A، الشكل التوضيحي 11C، D). من بين هذه الخلايا، كانت الغالبية تعبر عن FCGR3A، سلبية SELL، وسلبية CD3D (المعروفة باسم “NK1”)، وهي خلايا CD56 مجموعة خلايا NK السامة CD16+ في البشر ” (الشكل 5B). داخل خلايا NK1، كشفت التجميع غير المتحيز عن 3 حالات خلوية متميزة، بما في ذلك مجموعة فرعية NK1-1 التي تعبر عن ITGAM، ومجموعة فرعية NK1-3 التي تعبر عن ITGA1، ومجموعة فرعية NK1-2 السلبية المزدوجة، مشابهة لملاحظاتنا في الأورام الفأرية (الشكل 5C). كانت تعبيرات عدة جرانزيمات (GZMB، GZMH، GZMM)، وبيرفورين (PRF1)، وتوقيعات جينية تمثل السمية الخلوية لـ NK والتفعيل غنية في NK1-1 ولكنها منخفضة في NK1-2 وNK1-3 (الشكل 5D، E، الشكل التكميلية 11E). هذا يتماشى مع ملاحظاتنا في الفئران، حيث تقوم خلايا CD49a+ المقيمة بسرعة بخفض علامات السمية الخلوية والتفعيل مقارنة بخلايا CD11b+ التي تتسلل حديثًا. علاوة على ذلك، كان هناك انخفاض في تعبير PRF1 وجينات السمية الخلوية لـ NK في خلايا NK المتسللة إلى الورم مقارنة بالنسيج القولوني الطبيعي المجاور، مما يشير بشكل أكبر إلى فقدان وظيفة خلايا NK المضادة للورم (الشكل 5D، الشكل التكميلية 11F). كانت المجموعة الفرعية التي تعبر عن ITGAM مرتبطة بشكل أوثق بالأورام في مراحل مبكرة T1-3، بينما كانت المجموعة الفرعية التي تعبر عن ITGA1 غنية داخل الأورام المتقدمة T4 أو الأورام التي تقدمت لتنتشر إلى نقائل العقد اللمفاوية (الشكل 5F، G). أخيرًا، قمنا بمقارنة DEGs بين خلايا NK الورمية التي تعبر عن Itgam وتلك التي تعبر عن Itga1 في بيانات CRC البشرية هذه مع خلايا NK الفأرية الأصلية لدينا من أورام MC38. حددت هذه التحليل 184 DEG، والتي شملت Ccl5، Ifng، Il2rb، Tnfrsf1b وEomes كجينات مرتفعة التعبير في خلايا NK CD11b+ وCd96، Cd160، Havcr2، Klrg1،
وبالتالي، كان هناك طيف من حالات التعبير الجيني لخلايا NK، مماثل لذلك الذي لوحظ في نماذج الأورام الفأرية، واضحًا في سرطان القولون والمستقيم البشري. هذه البيانات تتماشى مع التحليلات النسخية الحديثة عبر عدة أورام بشرية، التي حددت خلايا NK المرتبطة بالأورام والتي تعاني من ضعف في الوظائف الفعالة والتي ارتبطت بتوقعات غير مواتية.لتأكيد هذه الأنماط الظاهرية على مستوى البروتين، قمنا بمقارنة خلايا NK في الدم المحيطي، مع تلك المستخرجة من القولون غير المتأثر وسرطان القولون والمستقيم الأولي. أظهر تحليل عينات الأنسجة المزدوجة من 10 مرضى مصابين بسرطان القولون والمستقيم تحولًا واضحًا من خلايا NK التي تعبر بشكل أساسي عن CD11b + في الدم إلى خلايا NK التي تعبر عن CD49a+ في الأورام، بينما كان القولون الطبيعي يهيمن عليه خلايا NK التي لا تعبر عن CD11b ولا CD49a (الشكل 5H-J، الشكل التوضيحي 12). أظهر التوصيف الأعمق لنمط خلايا NK الفرعية داخل الورم انخفاضًا في تعبير الجزيئات الوسيطة للسمية مثل الجرنازيم B والبرفورين بالإضافة إلى CD16 داخل مجموعة CD49a+ (الشكل 5K، L). وقد توازى ذلك مع زيادة في تعبير NKG2A وعلامات الإقامة النسيجية CD103 وCD69 على خلايا NK CD49a+.
بشكل جماعي، تُظهر هذه البيانات وجود مجموعة فرعية من خلايا NK إيجابية لـ CD49a تتمتع بخصائص الإقامة النسيجية وتفتقر إلى تعبير البروتينات السامة للخلايا داخل بيئة الورم في سرطان القولون والمستقيم.
تعزيز إشارات IL-15 يدفع تشكيل مجموعة متميزة من خلايا NK السامة داخل الورم
تحليلاتنا أعلاه تُظهر أن خلايا NK السيتوكينية التي تم استقطابها إلى الورم تصبح غير وظيفية بسرعة، سواء في قدرتها السامة للخلايا أو في قدرتها على استقطاب وتنشيط خلايا DC في الورم. بينما تم الإبلاغ عن أن استنزاف خلايا NK قبل إنشاء النقائل الرئوية يؤدي إلى زيادة كبيرة في عبء المرض.تساءلنا عما إذا كانت خلايا NK غير الوظيفية التي تتشكل في الأورام المتقدمة لا تزال تساهم في السيطرة على نمو الورم. لاختبار ذلك، تم إنشاء أورام MC38 في فئران WT ثم تم استنفاد خلايا NK باستخدام أجسام مضادة مضادة لـ NK1.1، تم إعطاؤها منذ 6 أيام من نمو الورم. تم تحقيق استنفاد فعال للغاية لخلايا NK داخل الورم؛ ومع ذلك، لم يؤثر فقدان خلايا NK داخل الورم في الأورام المتقدمة على النمو عبر نماذج الأورام المختلفة (الشكل التكميلي 13A-G)، حتى في غياب خلايا T (الشكل التكميلي.هذه البيانات تتماشى مع الاستنتاج بأن خلايا NK داخل الورم تفشل في المساهمة بشكل ذي مغزى في الاستجابة المناعية ضد الورم بسبب الحالة الوظيفية المعطلة التي تكتسب بسرعة.
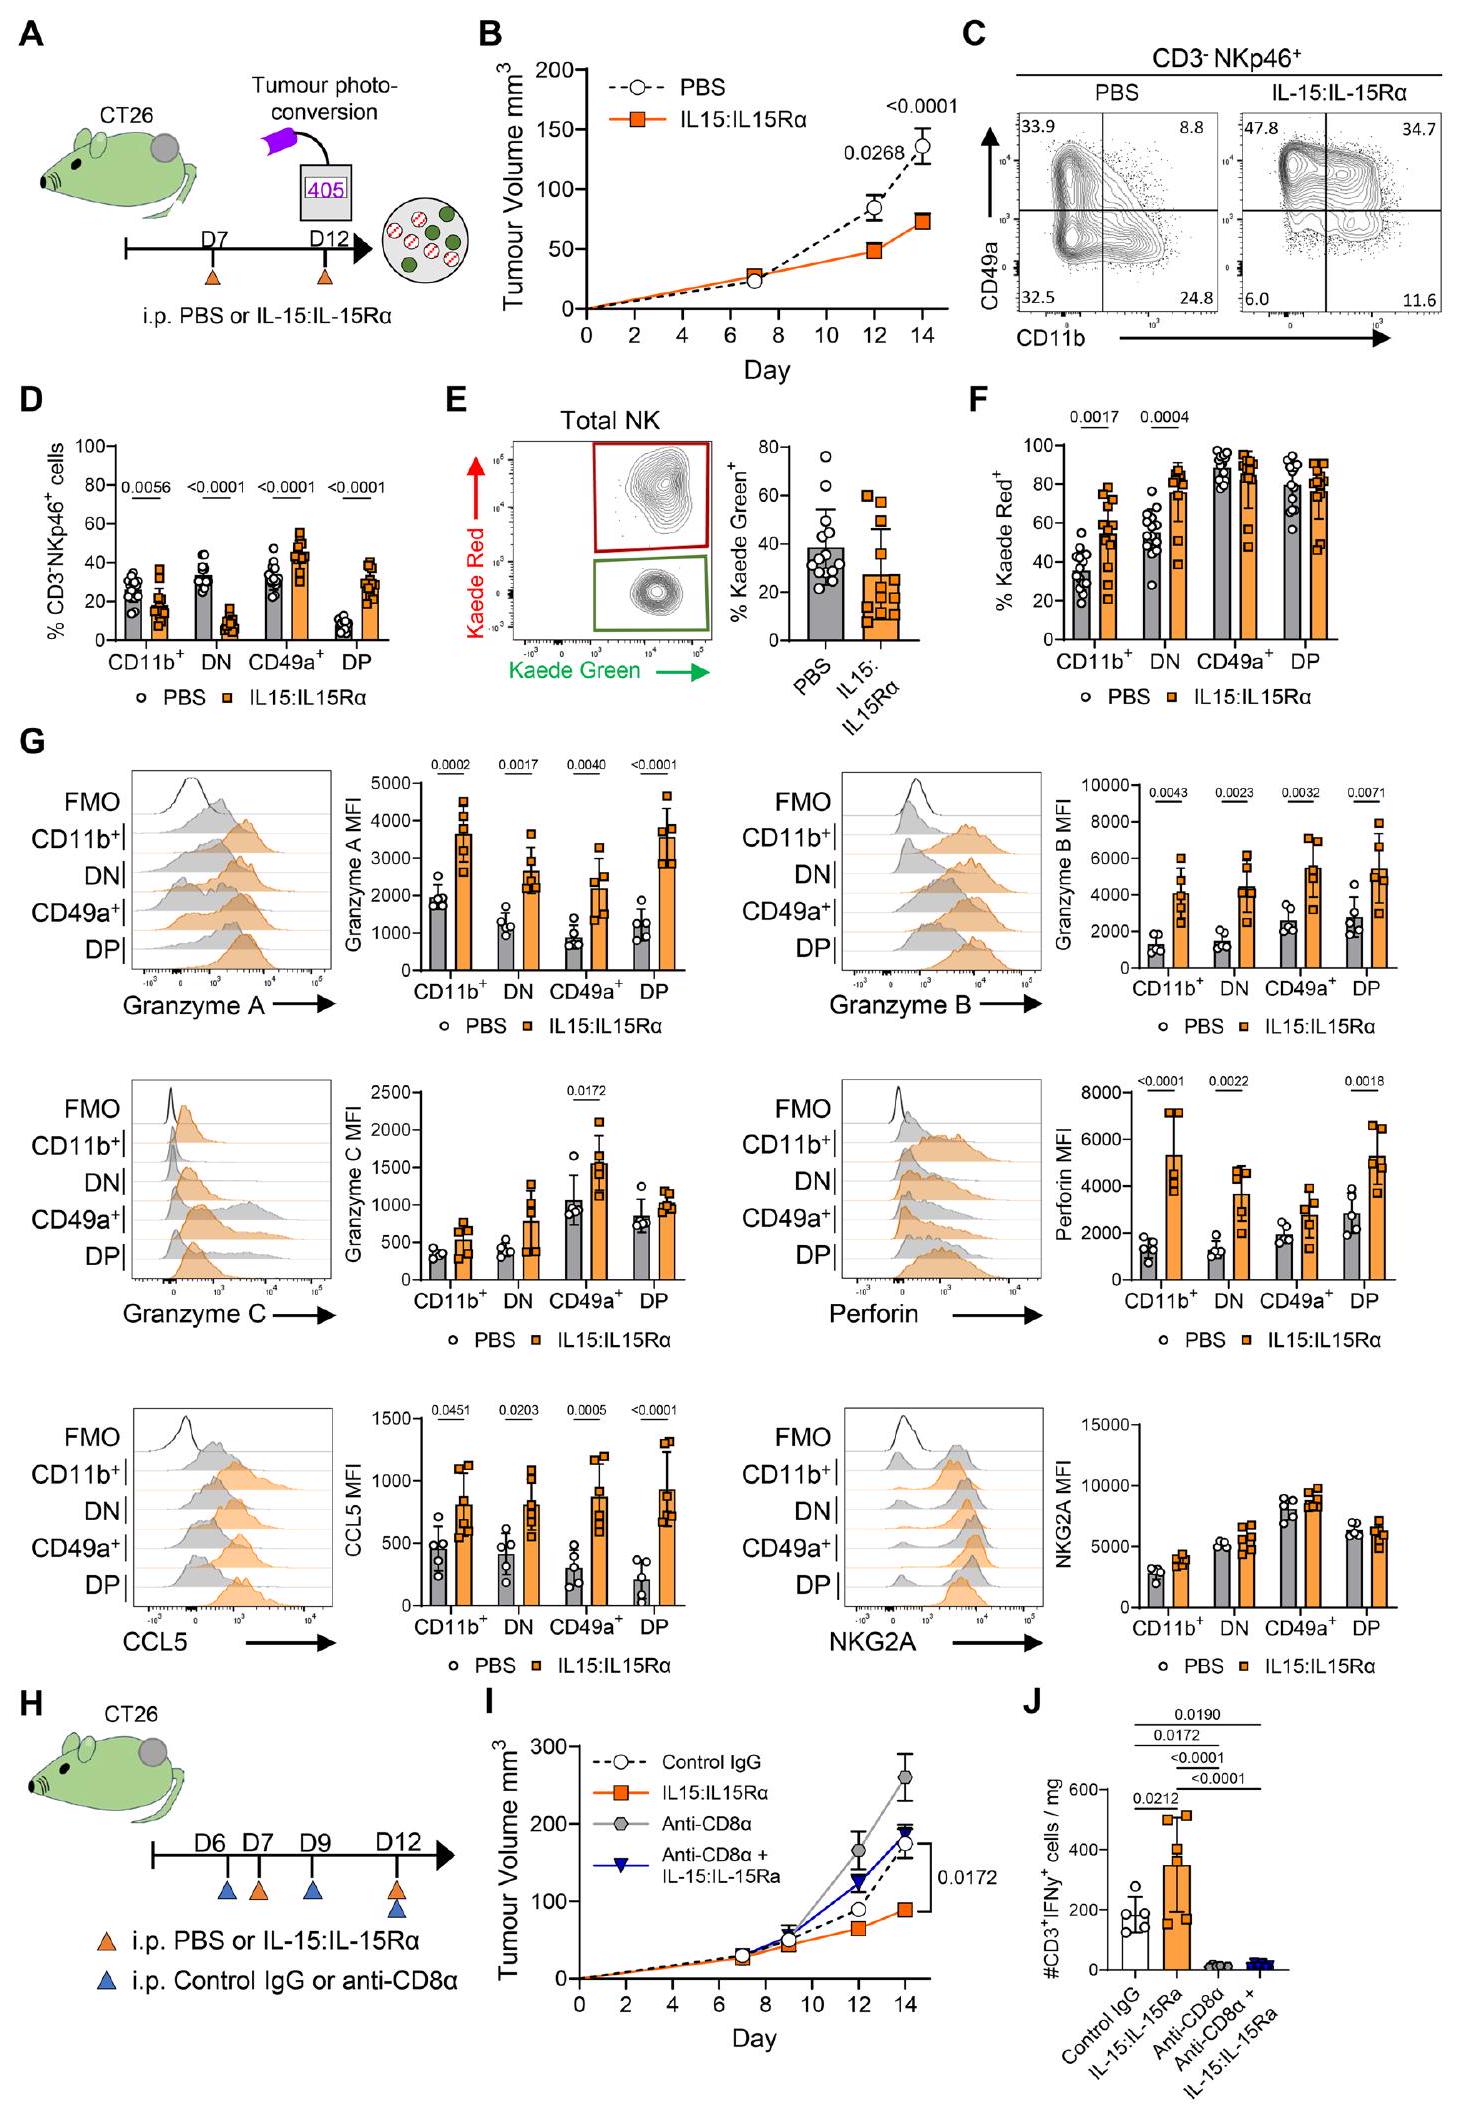
أخيرًا، بحثنا عن طرق يمكن أن تمنع أو تعكس فقدان وظيفة خلايا NK التي تم imprintها بسبب الإقامة في البيئة المجهرية للورم، وبالتالي تدعم استجابات مضادة للأورام محسّنة. IL-15 يحفز تمايز وتنشيط كل من خلايا T وNK.تشير البيانات الأولية للمرضى إلى أن الاستجابة لمحفزات IL-15R مرتبطة بتوسع خلايا NK وخلايا T CD8+ وزيادة في IFN.الإنتاج. ومع ذلك، فإنه غير واضح كيف يعزز تحفيز IL-15R استجابات خلايا NK المضادة للورم أو إمكانية تجنيد خلايا NK إلى الأورام الصلبة. لتحديد ما إذا كان تعزيز إشارات IL-15 أدى إلى الحفاظ على وظائف خلايا NK التي تتعطل عادة بسبب التكيف مع البيئة المجهرية للورم (TME)، تم علاج الفئران الحاملة للأورام بمركبات IL-15:IL-15Ra، حيث أن هذه المركبات لها نشاط معزز بشكل كبير مقارنة بـ IL-15 المؤتلف وحده. قمنا باختبار هذه المركبات، التي تم إعطاؤها في اليوم السابع واليوم الثاني عشر من نمو الورم، سواء قبل أو بالتزامن مع التحويل الضوئي، في نماذج ورمية متعددة (الشكل 6A). أظهرت فئران BALB/c Kaede الحاملة لأورام CT26 تحكمًا كبيرًا في الورم مع العلاج (الشكل 6B). كشفت تحليل حجرة خلايا NK داخل الورم عن اختلافات ملحوظة في تعبير الإنتجرين بعد إعطاء مركبات IL-15:IL15Ra (الشكل 6C). بشكل مفاجئ، أدى العلاج إلى تعبير غالبية خلايا NK عن CD49a، ومع ذلك، لاحظنا أيضًا ظهور مجموعة CD49a+CD11b+ التي كانت بالكاد قابلة للاكتشاف في ضوابط PBS (الشكل 6D). لنسأل عما إذا كانت مركبات IL-15:IL-15Ra قد تسببت في ظهور خلايا CD49a+ CD11b+ بعد دخولها إلى الورم، أو إذا كانت هذه الخلايا قد تشكلت في المحيط ثم انتقلت إلى الورم، قمنا بتحويل الأورام ضوئيًا وقارنّا نسبة تعبير KR داخل مجموعات خلايا NK داخل الورم المختلفة. لم يتسبب العلاج في فرق كبير في النسبة الإجمالية لـالخلايا في الورم (الشكل 6E). تحليل مجموعات خلايا NK المحددة بواسطة
أظهر تعبير CD49a مقابل CD11b أن الغالبية العظمى من خلايا NK CD49a+CD11b+ كانت KR+، مما يدل على أن هذه المجموعة ظهرت مع مرور الوقت في الورم، بدلاً من أن تنشأ من خلايا تتنقل إلى الورم (الشكل 6F). كشفت تحليل وظائف خلايا NK أن مجموعات CD49a+ CD11b- و CD49a+ CD11b+ الموسعة التي لوحظت بعد علاج IL-15:IL-15Ra كانت تعبر بشكل قوي عن البيرفورين والجرانزيمات A و B و C (الشكل 6G). كما أن تعزيز إشارات IL-15 زيادة كبيرة في إنتاج CCL5، في غياب تغييرات دراماتيكية في تعبير NKG2A (الشكل 6G). تم ملاحظة بيانات مماثلة في كل من أورام MC38 وB16-F10-OVA بعد علاج IL-15:IL-15Ra (الشكل التكميلية 14). أخيرًا، نظرًا لأن تعزيز إشارات IL-15 يؤثر على كل من خلايا CD8 T وخلايا NK، سعينا لتحديد مساهمة خلايا NK في السيطرة المعززة على نمو الورم بعد العلاج. تم تقسيم فئران BALB/c Kaede الحاملة لأورام CT26 إلى
الشكل 6 | إدارة IL15:IL15Rتؤدي المجمعات إلى تعزيز السيطرة على الورم وتكوين خلايا NK داخل الورم من نوع CD49 + CD11b + مع وظائف معززة. لمنع فقدان وظائف خلايا NK داخل الورم، تم علاج فئران BALB/c Kaede الحاملة لأورام CT26 بمجمعات IL-15:IL-15Ra. A رسم كاريكاتوري يوضح التصميم التجريبي. B منحنيات نمو CT26. C مخططات تدفق تمثيلية تعبر عن CD49a مقابل CD11b بواسطة خلايا NK (CD3-NKp46+). D نسبة خلايا NK مع نمط CD11b+ CD49a-، CD11b- CD49a-، CD11b- CD49a+، CD11b+ CD49a+. E مخطط تدفق تمثيلي يظهر تعبير Kaede Green مقابل Kaede Red بواسطة خلايا NK الكلية مع تعداد نسبة خلايا NK Kaede Green+. F نسبة خلايا Kaede Red+ ضمن مجموعات خلايا NK CD11b+CD49a-، CD11b- CD49a-، CD11b- CD49a+، CD11b+ CD49a+. البيانات مجمعة من 3 تجارب مستقلة، (المجموع التراكمي: PBSIL15:IL-15Ra ). تمثيلات بيانية تمثيلية وعدّ لجرانزيم A، جرانزيم ب، جرانزيم ج، بيرفورين، CCL5، وNKG2A (MFI) بعد التحفيز خارج الجسم (بيانات من تجربة واحدة من ثلاث تجارب موضحة، PBS و IL-15:IL-15R ). H كارتون يوضح التصميم التجريبي لاستنفاد خلايا CD8 T بالتزامن مع مجمعات IL-15:IL-15Ra (PBS , PBS + مضاد-CD8 , IL-15:IL مضاد-CD8 ). I منحنى نمو الورم للتجربة الموضحة في (H). J العدد الإجمالي لخلايا NK لكل ملغ من الورم. تم تحديد الأهمية الإحصائية بواسطة ANOVA ثنائية الاتجاه مع اختبار المقارنات المتعددة لشيداك (B,D,F,G و I)، اختبار غير متزاوج (E)، أو ANOVA أحادي الاتجاه مع اختبار المقارنات المتعددة لتوكاي (J). يتم تقديم البيانات مع عرض جميع نقاط البيانات الفردية بالإضافة إلى القيمة المتوسطة +/- SD، باستثناء (B، I) حيث يتم عرض القيمة المتوسطة +/- SEM. في جميع التجارب، ‘ ‘ تعرف ورمًا واحدًا على فأر فردي، أي، تشير إلى 3 فئران كل منها تحتوي على ورم واحد.
مجموعات علاج PBS أو IL15:IL-15Ra، ثم تم تقسيمها إلى مجموعات تتلقى التحكم في النوع أو مضاد-CD8 Abs لاستنفاد قسم خلايا CD8 T بشكل محدد (الشكل 6H). أدى إعطاء مجمعات IL-15:IL-15Ra بالتزامن مع Abs التحكم في النوع إلى أكبر تحكم في نمو الورم، بينما أدى استنفاد خلايا CD8 T إلى نمو ورم أسرع من الفئران الضابطة PBS التي أعطيت Abs التحكم في النوع (الشكل 6I). أدى استنفاد خلايا CD8 T بالتزامن مع مجمعات IL-15:IL-15Ra إلى تحسين التحكم في الورم مقابل PBS/مضاد-CD8 Abs، بما يتماشى مع مساهمة خلايا NK و CD8 T المتميزة في الاستجابات المضادة للورم. تم تأكيد الاستنفاد الفعال لخلايا CD8 T من خلال تحليل خلايا T المنتجة لـ IFN داخل الورم (الشكل 6J).
تجمع هذه البيانات لتظهر أن تعزيز إشارات IL-15 قادر على منع فقدان الوظائف الأساسية لخلايا NK التي تحدث عندما تتكيف خلايا cNK مع TME. يؤدي إعطاء مجمعات IL-15:IL-15Ra إلى ظهور قسم متميز من خلايا NK CD49a+ CD11b+، غير الموجود عادة داخل الأورام، والذي يحتفظ بملف سمي عالي ويساهم في تحسين التحكم في الورم.
نقاش
هنا، نستغل التوسيم الزمني المحدد بالموقع الذي توفره فئران كايدي القابلة للتحويل الضوئي لتحديد كيف تتغير خلايا NK مع مرور الوقت داخل TME. لقد وصفت دراسات متعددة وجود مجموعة متميزة من خلايا NK CD49a+ داخل الأورام البشرية والفئران . تؤكد بياناتنا أن هذه المجموعة يمكن تشكيلها بسرعة من خلايا cNK المجندة من الدورة الدموية التي تستجيب بعد ذلك للظروف داخل الورم لتطوير حالة محتفظ بها في الورم، متميزة عن تلك الخاصة بخلايا cNK الدائرة أو ILC1s داخل الأنسجة اللمفاوية أو غير اللمفاوية. تحمل التكيف مع TME علامات الإقامة في الأنسجة، بما في ذلك تعبير CD49a و CD69، إلى جانب فقدان الوظائف الأساسية لخلايا cNK الفعالة في قتل خلايا السرطان وتجنيد وتفعيل DCs. بعد تحديد الحالة النهائية لتمايز خلايا NK داخل الأورام، سعينا لتحديد الآليات التي تدفع هذه التغييرات. كانت معالجة أو البرنامج النسخي الذي تتحكم فيه HIF- غير كافية لدفع مجموعة كاملة من التغييرات التي تحدد خلايا NK المحتفظ بها في الورم، مما يعني أن العمل المنسق لعدة إشارات ينظم هذه المصير. يمكن منع فقدان وظائف خلايا NK داخل الورم من خلال تعزيز إشارات IL-15، مما دفع تمايز خلايا NK داخل الورم نحو حالة هجينة تعرف بتعبير CD49a العالي، ولكن أيضًا وظائف فعالة محسنة. بشكل جماعي، توفر هذه البيانات نظرة ثاقبة حول كيفية تغير خلايا NK عند تجنيدها في الأورام، ومعدل حدوث ذلك، ووظائفها المحتملة داخل TME.
كان الأمر لافتًا بشكل خاص في بياناتنا، السرعة التي فقدت بها خلايا cNK التي تدخل الورم الوظائف الفعالة الأساسية. بينما يبدو أن خلايا cNK يتم تجنيدها باستمرار إلى الورم، كانت 24 ساعة داخل الورم المتنامي كافية لإعادة برمجة شاملة للنسخ. من خلال تحديد معدل تغير خلايا NK، تشير بياناتنا إلى أن زيادة مساهمة خلايا التأثير الفطرية داخل الأورام قد تعتمد على آليات تتجاوز تلك التي تعمل داخل TME، بدلاً من مجرد تعزيز التجنيد. تشير بياناتنا
أيضًا إلى أن العلاجات الخلوية مثل خلايا CAR NK قد تكون أقل كفاءة مما هو متوقع في السرطانات الصلبة وتُغلق بسرعة، إذا لم تؤخذ الجهود لتجاوز آليات التكيف مع الأنسجة بعين الاعتبار. يبدو أن إنتاج كيموكينات وسيتوكينات خلايا NK حساس بشكل خاص للإشارات داخل TME. تم فقدان إنتاج CCL5 في المختبر في وجود إما TGF أو ، ويمكن أن يتم تعزيزه في الجسم الحي عند استهداف إما Tregs داخل الورم أو خلايا الورم المشتقة من . بينما تعتبر خلايا cNK منتجة قوية لـ IFN ، تشير الفئران الجديدة المطورة التي تعبر عن Ifng إلى أن خلايا NK داخل الورم، بغض النظر عن تعبيرها عن الإنتجرين، تعبر عن القليل جدًا من هذه السيتوكين الفعالة الرئيسية.
فهم آلية كاملة لكيفية تأسيس الحالة المحتفظ بها داخل الورم أفلت منا. الإشارات المحلية بواسطة TGF معروفة جيدًا في دفع الإقامة في الأنسجة لكل من خلايا NK و CD8 T . ومع ذلك، تشير بياناتنا إلى أن إشارات TGF وحدها غير كافية لتفسير جميع التغييرات الملحوظة داخل قسم خلايا NK المحتفظ بها، بما في ذلك التبديل الواضح في إنتاج الجرنازيم. بشكل مدهش، فشلت التغييرات المتوقعة في نظم عوامل النسخ مع مرور الوقت في تحديد أي مسارات تم تنظيمها بشكل زائد قد تدفع الانتقال إلى حالة CD49a+. كان تعبير Hifla عبر الزمن الزائف واضحًا، ومع ذلك، فإن حذفه المستهدف في خلايا NK فشل في تغيير مصير خلايا NK داخل نماذج الورم التي قمنا بتقييمها. حاليًا، تشير بياناتنا إلى الظروف داخل TME التي تؤدي إلى تخفيف العديد من المسارات التي تدفع تفعيل خلايا NK وتوسعها. كيف يتم تنسيق ذلك بالضبط لا يزال سؤالًا مفتوحًا.
سواء كانت مجموعة خلايا NK CD49a+ تساهم بنشاط في الاستجابة المضادة للورم، أو ربما تعيقها، تستحق مزيدًا من التحقيق، خاصةً منذ أن تشير بياناتنا إلى أن هذا هو مصير جميع خلايا NK المحتفظ بها داخل الورم. بينما ركزنا على فقدان الوظائف الفعالة، تشير التنبؤات الحاسوبية للتفاعلات الخلوية إلى أن خلايا NK CD49a+ قد تدعم مجموعات فطرية أخرى تعيق الاستجابة. يمكن أن يوفر التحليل التفصيلي لمكان وجود خلايا NK CD49a+ داخل الورم وما إذا كانت مناطق محددة تعزز هذه الخلايا مزيدًا من الفهم حول كيفية الحفاظ على هذه الخلايا وأدوارها المحتملة. يجب أن تأخذ الدراسات المستقبلية حول كيفية تنظيم تغييرات وظيفة خلايا NK في الاعتبار أيضًا ما إذا كان تحويل cNK إلى حالة محتفظ بها في الورم قابلًا للعكس ومدى تأثير التغييرات الوراثية على هذا الانتقال.
بدأنا هذه الدراسات حول قسم خلايا NK داخل الورم لفهم أفضل لكيفية تشكيل هذه المجموعة والمساهمة المحتملة لـ ILCs المقيمة في الأنسجة. تظهر بياناتنا أنه في نماذج الأورام الشائعة المستخدمة، يتم اشتقاق قسم NK CD49a+ تقريبًا حصريًا من خلايا cNK المجندة من الدورة الدموية. على الرغم من أن الإطار الزمني الذي توفره التوسيم الضوئي قصير جدًا لتقييم الإقامة في الأنسجة بالكامل، فإن خلايا NK CD49a+ داخل الورم قد زادت أيضًا من تعبير CD69، بما يتماشى مع الإقامة داخل الورم. لقد ربطت دراسات متعددة في كل من الفئران والبشر سابقًا تعبير CD49a بالإقامة في الأنسجة . من المهم، في بياناتنا، أن تظل هذه المجموعة متميزة نسخيًا عن مجموعة ILC الحقيقية المحدودة التي تمكنا من اكتشافها. تفسيرنا هو
أن خلايا cNK تؤسس حالة ‘محتفظ بها في الورم’ يمكن تعريفها جزئيًا من خلال تعبير CD49a، بدلاً من ‘التحول’ إلى ILC1s . على المستوى الخلوي، واجهنا صعوبة في تحديد مجموعة واضحة من ILC CD127+ بواسطة قياس التدفق في أي من نماذج الأورام من خطوط الخلايا المتجانسة، مما يحد من المزيد من التحقيق. من المحتمل أن تعكس عدم وجود ILCs CD127+ داخل هذه الأورام المتجانسة انتشار هذه الأورام داخل ‘مساحة’ تحت الجلد، بدلاً من نسيج محدد مع قسم ILC المرتبط. استخدمت دراسات حديثة تتبع مصير تعبير S1pr5 لاستنتاج أن معظم الخلايا اللمفاوية الفطرية CD49a+ داخل الورم لم تكن مشتقة من خلايا cNK . هنا، نموذج ورم الثدي MMTV-PyMT العفوي تم استخدامه ووجود خلايا ILCs داخل وسادة الدهون الثديية قد يفسر الفروق الملحوظة مقارنةً بنماذج الأورام لدينا. من الجدير بالذكر أنه بينما كانت خلايا ILCs غائبة إلى حد كبير عن أورام CT26 التي نمت تحت الجلد، كانت هناك مجموعة من خلايا ILC تعبر عن CXCR6+ EOMES- وتظهر تعبيرًا عن إنزيم الجرناز C داخل أورام CT26 الموضعية، مما يشير مرة أخرى إلى أن موقع الأنسجة مهم. دراسات إضافية باستخدام تتبع مصير S1pr5 وGzmc، جنبًا إلى جنب مع أساليب أخرى لتمييز NK وILC1 مثل Rora، ستكون ضرورية.يجب أن يتم استخدامه عبر نماذج السرطان الفأرية المتعددة لمزيد من توضيح مساهمة خلايا cNK المتمايزة مقابل خلايا ILCs المقيمة في الأنسجة.
بعد تحديد التكلفة المناعية لخلايا NK التي تتكيف مع بيئة الورم، سعينا لتحديد التدخلات التي يمكن أن تحد أو تمنع فقدان الوظائف الرئيسية. يعزز IL-15 بقاء خلايا NK، وتكاثرها، وسمّيتها، ويتم حالياً تجربة تعزيز الإشارات IL-15 علاجياً، سواء بمفرده أو بالاشتراك مع أهداف أخرى مثل PD-L1.من المحتمل أن يتضمن توفير IL-15 داخل بيئة الورم CCR7+ DCs، التي تعبر عن مستويات عالية من IL-15 و IL-15RA، وتتواجد مع خلايا NK في السرطانات البشرية ويمكن أن تدعم تفاعلات جزيئية إضافية مثل PVR:TIGIT.تُجرى حاليًا تجارب على العلاجات التي تستخدم منبهات IL-15R (ALT-803 و NIZ985) بمفردها أو بالاشتراك مع مثبطات نقاط التفتيش المناعية (NCT02523469، NCT02452268، NCT03228667، NCT03520686، NCT05096663) وقد أظهرت بعض الوعود الأولية لدى المرضى الذين انتكسوا سابقًا بعد علاج مثبطات نقاط التفتيش المناعية.بينما فشل IL-15 المعاد التركيب في التأثير على نمو الورم في أيدينا، فإن مجمعات IL-15:IL-15Ra التي تحفز إشارات متفوقة في الجسم الحيكانوا قادرين على تقليص نمو الورم بشكل مستمر في نماذج سرطان متعددة. كان المشترك بين جميع الأورام المعالجة هو زيادة تعبير CD49a على خلايا NK داخل الورم، وزيادة إنتاج CCL5، وزيادة تعبير الجرanzيم والبيرفورين بما يتماشى مع زيادة السمية الخلوية ومساهمتها في تعزيز الاستجابة المناعية المضادة للورم. أظهرت إزالة خلايا CD8 T داخل هذه الأورام مساهمة من قسم NK المعاد تنشيطه جنبًا إلى جنب مع استجابة معززة من خلايا CD8 T. بينما أدت الإدارة النظامية لمركبات IL-15:IL-15Ra إلى تضخم الطحال، بسبب التوسع المحيطي في تجمعات خلايا NK وCD8 T المحيطية.تشير بياناتنا إلى أن العلاج عزز كل من النمط الظاهري المقيم في الأنسجة والوظيفة الفعالة المتفوقة لخلايا NK بشكل خاص داخل الورم. وقد حددت الدراسات السابقة أن الجمع بين IL-15 و TGFالإشارات المتزامنة في دفع نمط ظاهري مقيم في الأنسجة يتم تعريفه بواسطة CD49a و CD69 و CD103تُبرز بياناتنا أن التنشيط القوي المدفوع بواسطة مجمعات IL-15:IL-15Ra يدعم وظائف فعالة مرتفعة على الرغم من أنه يبدو أنه يعزز جوانب من برنامج الإقامة النسيجية.
باختصار، هنا قدمنا خريطة مفصلة لكيفية استجابة خلايا NK الدائرة لبيئة الورم (TME) ومصيرها داخل هذا النسيج. تبرز هذه الدراسات مدى سرعة تحول خلايا المناعة إلى حالة غير منظمة داخل بيئة الورم، ويمكن أن تدعم تصميم أساليب علاجية تهدف إلى إحياء الذراع الفطرية للاستجابة المناعية المضادة للورم وتعزيز السيطرة على الورم.
طرق
تصميم الدراسة
كانت الأهداف الرئيسية لهذه الدراسة هي فهم كيفية تشكيل حجرة خلايا NK في الأورام، وتحديد الآليات التحكم في مصير خلايا NK داخل الورم وتحديد الأساليب للتلاعب بمصير ووظيفة خلايا NK داخل الورم. سعينا لتحديد مصير خلايا NK التي تدخل الورم من الدورة الدموية من خلال وضع علامات زمنية محددة للموقع على كامل مكون المناعة في الأورام. تم تحقيق ذلك باستخدام خطوط خلايا ورمية متجانسة مزروعة في فئران معدلة وراثيًا تعبر عن بروتينات قابلة للتحويل الضوئي باللون الأخضر، والتي، عند تعرضها للضوء البنفسجي، تتحول إلى فلوريسcence حمراء يمكن اكتشافها لعدد من الأيام بعد التحويل الضوئي. تم استعمار الأورام بواسطة خلايا المناعة المضيفة (التي كانت ‘خضراء’) ومن خلال وضع علامات على جميع خلايا المناعة داخل الورم في لحظة معينة (أي، تحويلها إلى ‘حمراء’)، تمكنا من تمييز الخلايا المحتفظ بها والخلايا الجديدة التي تدخل، ثم تحليل مصير الخلايا مع مرور الوقت في الورم. نستخدم تجارب زمنية ومجموعة من تسلسل RNA على مستوى الخلية الواحدة، لالتقاط التغيرات النسخية بشكل غير متحيز، تليها قياسات التدفق الخلوي للتحقق من هذه التغيرات على مستوى البروتين. بناءً على هذا التوصيف، قمنا بعد ذلك بالتحقيق في الآليات التي تسبب التغيرات في نمط وظيفية خلايا NK بالإضافة إلى التدخلات التي يمكن أن تغير التغيرات التي حدثت في خلايا NK بعد دخولها الورم.
فئران
تم شراء إناث من فئران C57BL/6J، بعمر 6-8 أسابيع، من شركة تشارلز ريفر (رمز السلالة 632) وتم السماح لها بالتكيف في وحدة خدمات الطب الحيوي بجامعة برمنغهام لمدة أسبوع قبل استخدامها في التجارب. راج2تم تربية الفئران (JAX، رمز السلالة 008449) في وحدة خدمات الطب الحيوي بجامعة برمنغهام. C57BL/6 Kaedeفئران BALB/c Kaede تُحافظ عليها وتُربى في وحدة الخدمات الطبية الحيوية بجامعة برمنغهام. Hif1aإن سي آر 1فئران (المقدمة بلطف من قبل الدكتور كريستيان ستوكمان، جامعة زيورخ، سويسرا) تم تهجينها مع فئران C57BL/6 Kaede وتم الاحتفاظ بها في وحدة خدمات الطب الحيوي بجامعة برمنغهام. Ifngتم إنتاج الفئران بواسطة تاكونيك وتم الحفاظ عليها في وحدة خدمات الطب الحيوي بجامعة برمنغهام. بالنسبة لجميع الفئران التي تم إنتاجها والحفاظ عليها في وحدة خدمات الطب الحيوي بجامعة برمنغهام، تم استخدام كل من الفئران الذكور والإناث في التجارب، على الرغم من أنه داخل التجربة، كانت الفئران متطابقة من حيث الجنس. على مدار المشروع، كانت أعمار الفئران التجريبية تتراوح بين 8 و 18 أسبوعًا. تم الحفاظ على الحيوانات في ظروف خالية من مسببات الأمراض المحددة واستخدمت وفقًا لإرشادات وزارة الداخلية بموجب ترخيص مشروع مُنح لـ D.R. Withers وتمت الموافقة عليه من قبل هيئة رعاية الحيوان والمراجعة الأخلاقية بجامعة برمنغهام. كانت الحيوانات الضابطة تعيش معًا. تم قتل الفئران عن طريق خلع العنق في نهاية التجربة.
توليد Ifngفئران المراسلين
C57BL/6NTac-Ifngتم إنتاج الفئران بواسطة تاكونيك، تم تحسين Cre (iCre)ومراسل الفلورسنت الأحمر البعيد mKate2تم إدخالها في موضع Ifng مباشرة بعد الإكسون 4، محاطة بببتيدات T2A و P2A ذاتية الانقسام.
نماذج أورام الفئران
MC38 (مقدمة بلطف من الدكتور غريغوري سوننبرغ، وييل كورنيل ميديسن، نيويورك، نيويورك)، MC38-Ova (تم الحصول عليها من أسترازينيكا)، CT26 (مقدمة بلطف من البروفيسور تيم إليوت، جامعة أكسفورد، أكسفورد، المملكة المتحدة)، MC38 (مقدمة بلطف من الدكتور سانتياغو زيليناي، جامعة مانشستر، مانشستر، المملكة المتحدة) تم زراعة خلايا أدينوكارسينوما القولون الفأرية، وخلايا الميلانوما B16F10-Ova (المستخرجة من أسترازينيكا) في وسط RPMI مضاف إليه 2 مليمول من L-glutamine (#21875034 Thermo Fisher Scientific)، و10% FBS (#F9665 SigmaAldrich)، والبنسلين-ستربتوميسين (#P4333 Sigma-Aldrich). تم زراعة خلايا أدينوكارسينوما الثدي EO771 (المقدمة بلطف من الدكتور فيدور بيرديتشيفسكي، جامعة برمنغهام، برمنغهام، المملكة المتحدة)، و4T1 (المستخرجة من أسترازينيكا) في وسط DMEM مضاف إليه 2 مليمول من L-glutamine (#21875034 Thermo Fisher Scientific)، و10% FBS (#F9665 Sigma-Aldrich)، والبنسلين-ستربتوميسين (#P4333 SigmaAldrich). تم زراعة جميع الخلايا في معقبل أن يكون تم حصادها وتعليقها في محلول PBS من دولبيكو (#D8662 سيغما-ألدريتش) لحقن الورم.، أو تم حقن خلايا الورم EO771 فيإلى وسادة الدهون الثديية في إناث الفئران تحت التخدير عبرالإيزوفلورين الغازي. (CT26، MC38، MC38Ova، MC38 )، أو تم حقن خلايا ورم B16-F10-Ova فيتحت التخدير تحت الجلد في الجانب الأيسر قبل الحلاقة عبرالإيزوفلورين الغازي. لحقن CT26 في الموقع الأصلي،تم حقن خلايا الورم CT26 فيإدخال PBS إلى جدار القولون باستخدام منظار مزود بتلسكوب صلب متعدد الأغراض (كارل ستورز إندوسكوب) تحت التخدير عبرالإيزوفلورين الغازي. تم قياس حجم الورم بشكل دوري باستخدام مقياس فرنييه الرقمي، وتم حساب الحجم باستخدام الصيغةبالمليمترات المكعبة، حيث تمثل L أطول قطر وW القطر العمودي على L للورم. تم قياس أوزان الأورام في نهاية التجربة. تم التضحية بالفئران بعد 5 ساعات،أو 72 ساعة بعد التحويل الضوئي وتم جمع الأورام للتحليل.
نقص الخلايا
تم تحقيق استنفاد خلايا NK وخلايا T CD8+ عن طريق إعطاء مضاد NK1.1 (PK136، ) أو مضاد-CD8 أو إن فيفو ماب نوع الأجسام المضادة IgG2a للتحكم (بايو إكسل، C1.18.4، أو التحكم في نوع IgG2a من إنفيفو ماب الفأر (BioXCell، 2A3، ) في PBS عن طريق الحقن داخل الصفاق كل 3 أيام بدءًا من اليوم السادس بعد زراعة الورم. تم تحقيق استنفاد خلايا Tregs عن طريق إعطاء antiOX40 (OX86، )، أو PBS عن طريق الحقن داخل الصفاق في اليوم السابع والحادي عشر من نمو الورم. مضاد NK1.1، مضاد CD8تم توفير الأجسام المضادة المضادة لـ OX40 من قبل أسترازينيكا.
إدارة IL-15:IL-15Rالمجمعات
rlL-15 (#210-15، بيبروتيك) و rlL-15R (#551-MR-100) تم إعادة تكوينها في PBS بنسبة 1:5 وتم حضنها فيلمدة 30 دقيقة لتشكيل IL-15:IL-15Rالمجمعات. مجمعات IL-15 (رIL-15:12.5rlLتم إعطاؤها عن طريق الحقن داخل الصفاق في اليوم السابع والثاني عشر من نمو الورم.
نقل خلايا NK الطحالية
تم إثراء خلايا NK من طحال فئران C57BL/6 Kaede باستخدام مجموعة عزل خلايا NK (#130-115-818، ميلتيني بيوتيك) وفقًا لتعليمات الشركة المصنعة. تقريبًاتم نقل خلايا NK الطحالية عن طريق الحقن الوريدي إلى فئران C57BL/6 الحاملة لورم MC38 بعد 12 يومًا من زراعة الورم، ثم تم جمع الأنسجة بعد 3 أيام.
تسمية الصور لمكونات الورم
عند الوصول إلىبقطر في كلا من الأورام المحقونة في الدهون تحت الجلد ودهون الثدي تم تعريضها إلىتم استخدام ضوء LED مركز على طول الموجة (Dymax BlueWave QX4 مزود بعدسة تركيز 8 مم، DYM41572؛ Intertronics) باستخدام 9 دورات من التعرض للضوء لمدة 20 ثانية مع فترة استراحة مدتها 5 ثوانٍ بين كل دورة، على مسافة ثابتة. تم استخدام لوح ألياف كثافة متوسطة أسود لحماية بقية الفأر.
تفكيك الأنسجة
تمت معالجة الأورام كما هو موضح سابقًا في دراسة زهي وآخرون. باختصار، تم قطع الأورام إلى قطع صغيرة وهضمها إنزيميًا باستخدامكولاجيناز D (#11088882001، روش)، وDNase I (#101104159001، روش) عندلـفي جهاز اهتزاز حراري مضبوط على 1000 دورة في الدقيقة. ثم تم تصفية العينات من خلالمنخل خلايا، تم الطرد المركزي لمدة 5 دقائق عند 400 جراموإعادة تعليقها في محلول الصبغة ( FBS و 2 مللي مولار EDTA في PBS).
تم سحق الطحال من خلالمنخل، ثم تم حضنه مع محلول تحلل كريات الدم الحمراء لجاي على الثلج لمدة 5 دقائق. تم جمع الخلايا عن طريق الطرد المركزي للعينات بسرعة 400 جرام لمدة 5 دقائق فيقبل إعادة تعليق كريات الخلايا في محلول الصبغة. تم جمع العقد اللمفاوية، وتنظيفها من الدهون، ثم قطعها إلى قطع صغيرة قبل الحضانة في كولاجيناز ددي إنز I لـفي جهاز اهتزاز حراري بسرعة 1000 دورة في الدقيقة لمدة 20 دقيقة. تم تمرير العينات عبرمنخل، تم الطرد المركزي عند 400 جلمدة 5 دقائق قبل إعادة تعليق راسب الخلايا في محلول الصبغة. تم قطع الكبد إلى قطع صغيرةقطع وضغطت من خلالثم تم غسله من خلالمصفاة مع RPMI. تم وضع تعليقات الكبد على قمة محلول 67% OptiPrep (#07820، تقنيات STEMCELL) وتم الطرد المركزي عند 1000 جرام لمدة 25 دقيقة قبل جمع طبقة التداخل الغنية بالخلايا المناعية. تم غسل العينات مرة أخرى مع RPMI، ثم تم الطرد المركزي لمدة 5 دقائق عند 400 جرام وقبل أن يتم إعادة تعليقها أخيرًا في محلول الصبغة. تم غسل الرئتين، وقطعها إلىقطع قبل حضانة الأنسجة فيليبرسروشي” و دي إنز I لمدة 45 دقيقة عندتم تمرير العينات عبرثم تم غسله من خلالمنخل مع RPMI. تم ترسيب الخلايا عن طريق الطرد المركزي بسرعة 400 جرام ولمدة 5 دقائق، ثم تم إعادة تعليق كريات الخلايا في محلول جاي وتم حضنها على الثلج لمدة 5 دقائق. تم طرد العينات مركزيًا لمدة 5 دقائق عند 400 ج.قبل إعادة تعليق كريات الخلايا في محلول الصبغة. تم معالجة الأمعاء الدقيقة كما هو موصوف سابقًا.باختصار، تم إزالة الدهون وبقع باير من الأمعاء الدقيقة، قبل تنظيف المحتويات الداخلية وقطع الأنسجة إلى قطع صغيرة في محلول ملحي متوازن من هانك (HBSS) (#55037 C، سيغما-ألدريش) يحتوي على 2% من مصل الجنين. بعد ذلك، تم هز الأمعاء الدقيقة بقوة في HBSS مع 2 مللي مول من EDTA قبل حضانة العينات فيلمدة 20 دقيقة، ثم تصفية من خلال شبكة نيتكس، وغسلها جيدًا بمحلول HBSS. تم حضانة العينات معكولاجيناز VIII (#C2139، سيغما-ألدريش) و DNase لمدة 15 دقيقة، تم تصفيته من خلال ، ثم منخل قبل أن يتم الطرد المركزي عند 400 جلمدة 5 دقائق، وأخيرًا أعيد تعليقها في محلول الصبغة. تم معالجة الأمعاء الغليظة بطريقة مشابهة ولكن تم هضمها فيكولاجيناز V (#C9263، سيغما-ألدريش)،كولاجيناز دديباز (#17-105-041، جيبكو)، و DNase عند لمدة 45 دقيقة. ثم تمت معالجة الأمعاء الغليظة وفقًا لخطوات الغسل والترشيح المستخدمة للأمعاء الدقيقة، وأخيرًا تم إعادة تعليق الخلايا في محلول الصبغة للاستخدام. تم إجراء جميع عمليات الحضانة في حاضنة مهتزة تم ضبطها على 300 دورة في الدقيقة.
اختبارات في المختبر
لتقييم قتل الخلايا المستهدفة بواسطة خلايا NK، تم زراعة خلايا ورم الميلانوما B16F0-Ova مع خلايا NK المعزولة بواسطة FACS كما هو موصوف سابقًا.تم حضن خلايا B16F10-Ova معسيل تريس بنفسجي (#C34557، إنفيتروجن) لمدة 15 دقيقة فيتم غسلها في RPMI وتدويرها عند 350 جرام لمدة 5 دقائق قبل الزرعخلايا في RPMI كامل مدعوم بـ FBS و 2 مللي مولار L-glutamine. تم فرز خلايا NK CD11b+ أو CD49a+ من أورام MC38 باستخدام FACS وتم إضافتها لتحقيق نسب 1:10 و 1:20 و 1:40 من الفاعل: الهدف. تم زراعة الخلايا معًا لمدة 4 ساعات في و .
لتقييم تأثير و TGF- على نمط ووظيفة خلايا NK، تم إثراء خلايا NK الطحالية بواسطة MACs وزراعتها في و في RPMI يحتوي على 300 وحدة من rIL-2 (بيبروتيك)، (Peprotech) و إما 0.1% DMSO (Sigma) أو تم تعزيزها بمزيد من TGF- 16,16-ثنائي ميثيل بروستاجلاندين E2 )، أو كلاهما TGF- و DiPGE مجمعة. تم زراعة خلايا NK لمدة 48 ساعة قبل إعادة التحفيز باستخدام PMA و Ionomycin وتحليل التدفق اللاحق. في تجارب نقص الأكسجة، تم زراعة خلايا NK الغنية بـ MACs مع DMSO و TGF-أو DiPGEكما هو مذكور أعلاه أو فيغرفة نقص الأكسجين بالتوازي.
تدفق الخلايا
لتقييم إنتاج السيتوكينات والجرانزيم والبرفورين، تم تحفيز الخلايا فيفوربول 12-ميريستات 13-أسيتات (PMA، #P1585، سيغما-ألدريش) وأيونوميسين (#I0634، سيغما-ألدريش) لمدة 4 ساعات وفي وجودتم إضافة بريفيلدين أ (#B6542، سيغما-ألدريش) بعد الساعة الأولى. لتقييم تفريغ الخلايا، تم تحفيز الخلايا كما في السابق، ولكنتم استخدام الموننسين (#420701، بايو ليجند) بدلاً من بريفيلدين A، وتم إضافة CD107a طوال مدة ثقافة التحفيز. تم معالجة تعليقات الخلايا المفردة بحجب Fc باستخدام مضاد CD16/32 (2.4G2، BioLegend) في محلول التلوين على الثلج لمدة 15 دقيقة قبل تلوين المستضدات السطحية في محلول التلوين على الثلج لمدة 35 دقيقة. ثم تم تثبيت الخلايا باستخدام محلول تثبيت BD CytoFix (#554655، BD Biosciences) على الثلج لمدة 45 دقيقة قبل التلوين للعلامات داخل الخلوية طوال الليل مخففة في محلول اختراق eBioscience (#00-8333-56، Thermo Fisher Scientific). تم إجراء التلوين الثانوي داخل الخلوية لتحديد Granzyme A وCCL5 في درجة حرارة الغرفة لمدة 45 دقيقة. تم نقل العينات إلى محلول التلوين، مع إضافةعداد الخرز (#ACBP-100-10، Spherotech) يتم جمع البيانات على جهاز BD LSR Fortessa X-20 (BD Bioscience) باستخدام برنامج FACSDiva 8.0.2 (BD Bioscience) وتحليلها باستخدام FlowJo v10 (BD Bioscience). الأجسام المضادة السطحية والداخلية المستخدمة كانت ضد المستضدات الفأرية التالية: CCL5 المنقى (1:200، Goat IgG، R&D Systems)، CD107a BV786 (1:200، النسخة 1D4B، BioLegend)، CD11b PE-Dazzle594 (1:300، النسخة M1/70، BioLegend)، CD200r1 APC (1:200، النسخة OX-110، BioLegend)، CD3 BV711 أو BUV737 (1:200، النسخة 17A2، BioLegend)، CD45 FITC أو BV510 (1:200، النسخة 30-F11، BioLegend)، CD49a BUV395 (1:200، النسخة RM4-5، BD Bioscience)، CD49b BV711 (1:100، النسخة DX5، BioLegend)، CD69 PE-Cy7 أو BV711 (1:200، النسخة H1.2F3، BioLegend)، DNAM-1 BV605 (1:200، النسخة TX42.1، BioLegend)، EOMES PE أو PE-Cy7 (1:100، النسخة Dan11mag، BioLegend)، Granzyme A المنقى (1:300، النسخة 3G8.5، BD Biosciences)، Granzyme B BV421 (1:300، النسخة QA18A28، BioLegend)، Granzyme C PE-Cy7 (1:300، النسخة SFC108، BioLegend)، IFNBUV737 (1:400، النسخة XMG1.2، BioLegend)، IgG2b BV605 أو R718 (1:400، النسخة R12-3، BioLegend)، IL-7RBV605 أو BV421 (1:100، النسخة A7R34، BioLegend)، Ki-67 BV711 أو AF700 (1:200، النسخة SolA15، BioLegend)، KLRG1 BV605 (1:100، النسخة 2F1، BioLegend)، LAG3 BV786 (1:100، النسخة C9B7W، BioLegend)، NK1.1 BV650 أو BV786 (1:100، النسخة PK136، BioLegend)، NKG2A/C/E BV421 (1:400، النسخة 20d5، BioLegend)، NKp46 BV650 أو BV786 (1:100، النسخة 29A1.4، BioLegend)، OX40 BV711 (1:100، النسخة OX-86، BioLegend)، PD-1 PE-Cy7 (1:200، النسخة RMP1-30، BioLegend)، Perforin APC (1:300، النسخة S16009A، BioLegend)، T-bet e660 (1:100، النسخة eBio4B10، BioLegend)، و TCRتم استخدام BUV737 (1:200، النسخة H57-597، BioLegend). تم استخدام الأجسام المضادة متعددة النسائل المربوطة بـ AF647 من الحمير ضد IgG الماعز (1:400، رقم الكتالوج #A32849، Thermo Fisher Scientific) لتحديد وتعزيز صبغة CCL5.
الأجسام المضادة السطحية والداخلية المستخدمة كانت ضد المستضدات البشرية التالية: CD16-FITC (1:25، النسخة 3G8؛ Biolegend)، NKG2A-APC (3:50، النسخة Z199، Beckman Coulter)، GZA-AF700 (1:50، النسخة CB9، Biolegend)، CD49a-BV421 (1:50، النسخة SR84؛ BD)، CD11bBV510 (1:25، النسخة ICRF44؛ BD)، CD3-BV570 (3:50، النسخة UCHT1؛ Biolegend)، CD57-BV605 (1:50، النسخة QA17A04؛ Biolegend)، CD103-BV650 (1:25، النسخة BER-ACT8؛ BD)، PRF1-BV711 (1:50، النسخة dG9؛ Biolegend)، LAG3-BV786 (1:25، النسخة T47-530؛ BD)، T-bet-PE (1:10، النسخة O4-46؛ BD)، GZB-PE-CF594 (1:25، النسخة GB11؛ BD)، CD127-PE-Cy5 (3:50، النسخة A019D5؛ Biolegend)، CD69-PE-Cy5.5 (1:25، النسخة CH/4؛ Thermofisher)، EOMES-PE-Cy7 (3:50، النسخة WD1928؛ Thermofisher)، CD45-BUV395 (1:25، النسخة HI30؛ BD)، CD56-BUV737 (1:25، النسخة NCAM16.2؛ BD).
عزل FACS
تم صبغ تعليقات الخلايا المفردة للأجسام المضادة المرفوعة ضد المستضدات التالية: CD45 FITC (نسخة 30-F11، BioLegend)، CD11b PEDazzle594 (نسخة M1/70، BioLegend)، TCR BUV737 (نسخة H57-597، BioLegend)، NKp46 BV650 (نسخة 29A1.4، BioLegend)، و CD49a BUV395 (نسخة RM4-5، BD Biosciences)، بالإضافة إلى صبغة حيوية Live/Dead Near-IR (#L10119، Thermo Fisher Scientific). خلايا NK (Live CD45CD11bتي سي آر CD3 تم فرزها إلى CD11bCD49a و CD11bتم استخدام خلايا باستخدام جهاز فرز الخلايا FACS Aria II (BD Biosciences) ثم تم استخدامها للاختبارات في المختبر. بالنسبة لتسلسل RNA أحادي الخلية (scRNA-seq)، تم صبغ الخلايا الفردية باستخدام أجسام مضادة ضد ما يلي: CD45-BUV395 (نسخة 30-F11، BioLegend)، CD11b-APC (نسخة M1/70، BioLegend)، Ter119-PE-Cy7 (1:400، نسخة TER-119، BioLegend)، NK1.1-BV650 (نسخة PK136، BioLegend). الخلايا اللمفاوية المتسللة إلى الورم (حيةتر119 ) كانوا مرتبة في مجموعتين بناءً على وجود الكايدي الأحمر، وهما G48 و R48، في إشارة إلى الكايدي الأخضر 48 ساعة والكايدي الأحمر 48 ساعة.
بناء مكتبة الخلايا المفردة وتسلسلها
تم إعداد مكتبات التعبير الجيني من مجموعات الخلايا المفردة التي تم فرزها باستخدام جهاز FACS باستخدام جهاز Chromium وطرود كواشف الخلايا المفردة 3′ GEM v3 (10x Genomics, Inc.) وفقًا لبروتوكول الشركة المصنعة. كانت مكتبات التسلسل الناتجة تتكون من تراكيب Illumina القياسية ذات الطرفين محاطة بتسلسلات P5 وP7. تم ترميز شريط 10x البالغ طوله 16 قاعدة وUMI البالغ طوله 10 قواعد في القراءة 1، بينما تم استخدام القراءة 2 لتسلسل شظية cDNA. تم دمج تسلسلات فهرس العينة كقراءة فهرس i7. تم التسلسل ذو الطرفين.تم تنفيذ ذلك على منصة Illumina NovaSeq 6000. تم معالجة بيانات تسلسل .bcl الناتجة لأغراض مراقبة الجودة باستخدام برنامج bcl2fastq (الإصدار 2.20.0.422) وتم تقييم ملفات fastq الناتجة باستخدام FastQC (الإصدار 0.11.3) وFastqScreen (الإصدار 0.9.2) وFastqStrand (الإصدار 0.0.5) قبل المحاذاة والمعالجة باستخدام خط أنابيب CellRanger (الإصدار 6.1.2).
معالجة تسلسل RNA أحادي الخلية
تم تحليل بيانات تعبير الجينات على مستوى الخلية الواحدة من مخرجات عد الخلايا من CellRanger (الميزات المفلترة، الرموز الشريطية، والمصفوفات) باستخدام Scanpy. (v1.8.2) سير العمل. تم تنفيذ اكتشاف الزوجات باستخدام Scrublet(v0.2.1)، مع خلايا من التجميع الفرعي التكراري تم تمييزها بنتائج Scrublet الشاذة المصنفة كأزواج محتملة. خلايا مع العد الموجه إلى أو تم تصفية الجينات. تم تحديد نسبة محتوى الميتوكوندريا عندتم تصفية الجينات التي تم اكتشافها في أقل من 3 خلايا. تم تطبيع إجمالي عدد الجينات لكل خلية إلى مجموع مستهدف من وتم تحويل loglp. نتج عن ذلك مجموعة بيانات عاملة تتكون من 46,342 خلية. بعد ذلك، تم اختيار الميزات ذات التباين العالي بناءً على حد أدنى وحد أقصى للتعبير المتوسط لـ و على التوالي، مع حد أدنى من التشتت قدره 0.5. تم استبعاد إجمالي عدد الميزات، ونسبة الميتوكوندريا، ودرجات دورة الخلية، حيثما تم الإشارة إليها. تم تعيين عدد المكونات الرئيسية المستخدمة في بناء الرسم البياني للجوار إلى 50 في البداية، ثم 30 لمعالجة المجموعات الفرعية. تم تنفيذ التجميع باستخدام خوارزمية لايدن مع تعيين الدقة بين 0.8 و 1.0. تم استخدام تقريب وتصور متعدد الأشكال الموحد (UMAP، الإصدار 0.5.1) لتقليل الأبعاد والتصور، مع مسافة دنيا قدرها 0.3، وجميع المعلمات الأخرى وفقًا للإعدادات الافتراضية في Scanpy.
تحليل تسلسل RNA أحادي الخلية من نماذج أورام الفئران
تم تقسيم أنواع الخلايا ذات الاهتمام وإعادة تجميعها كما هو موضح أعلاه. تم توضيح المجموعات الناتجة باستخدام جينات العلامة الكلاسيكية. تم إجراء تقييم مجموعات الجينات باستخدام أداة tl.score genes من Scanpy. تم الحصول على مجموعات الجينات من قاعدة بيانات التوقيع الجزيئي (MSigDB)، وبالتحديد KEGG أو علم الأحياء الجزيئي (GO)، باستخدام حزمة R msigdbr (v7.5.1) أو بيانات RNAseq المنشورة. تم إجراء اختبار الجينات التفاضلي باستخدام اختبار ويلكوكسون لمجموع الرتب مع تصحيح الاختبار المتعدد بنجاميني-هوشبرغ المطبق في tl.rank_genes_groups من Scanpy. تم إجراء تحليل المسار باستخدام تجريد الرسم البياني القائم على التقسيم (PAGA).وزمن الانتشار الزائف (تم تنفيذه في Scanpy v1.8.2). بالنسبة لتحليل الزمن الزائف، تم توجيه مسار التمايز في الكتلة السائدة ذات اللون الأخضر (NK_1)، والتي تمثل مجموعة الخلايا المرتبطة بشكل أكبر بالخلايا الجديدة. تم اختيار الخلية الجذرية المحددة بناءً على القيم القصوى لمكونات الانتشار. تم حساب التعبير التفاضلي عبر الزمن الزائف باستخدام حزمة tradeSeq (v0.99) تم معالجة وتحليل بيانات scRNAseq بعد 24 و72 ساعة من التحويل الضوئي باتباع نفس الخطوات المذكورة أعلاه؛ والبيانات متاحة من خلال مستودع ArrayExpress (رقم الوصول E-MTAB-10176)، كما تم نشره ووصفه سابقًا.دمج ونقل العلامة لـبيانات تسلسل RNA أحادي الخلية، خلايا NK الدورية، وخلايا الدم المحيطية (المستخرجة من 10X Genomics) بيانات العرض التوضيحي:https://www.10xgenomics.com/resources/تم إجراء تحليل مجموعة البيانات (datasets/10-k-mouse-pbm-cs-multiplexed-2-cm-os-3-1-standard-6-0-0) باستخدام أداة tlingest من Scanpy. بالنسبة لخلايا NK الدائرية، تم إجراء انحدار دورة الخلية أولاً على المجموعة الفرعية Mki67.تم استخدام دالة pp.regress_out من Scanpy على الخلايا، قبل إعادة الدمج. تم إجراء تحليل إثراء نشاط عوامل النسخ باستخدام pySCENIC (الإصدار 0.12)تم إجراء تحليل التواصل بين الخلايا باستخدام CellChat (الإصدار 1.5.0).
تحليل تسلسل RNA من الأورام البشرية
تم الوصول إلى بيانات تسلسل RNA أحادي الخلية (scRNA-seq) البشرية المنشورة المتعلقة بسرطان القولون والمستقيم (CRC) والبيانات الوصفية المرفقة بها وتحميلها من مستودع GEO باستخدام رقم الصعود GSE178341.تم الوصول إلى بيانات تسلسل RNA الكمي من مجموعة جينوم السرطان (TCGA) لسرطان القولون والمستقيم الغدي البشري (TCGA-COAD) باستخدام TCGAbiolinks.تم إجراء فك التشفير الخلوي باستخدام أداة Cibersortx على الويبتم تحليل تسلسل RNA أحادي الخلية من أورام القولون والمستقيم البشرية باستخدام سير العمل Scanpy (الإصدار 1.8.2) كما هو موضح أعلاه. تم إجراء تصفية لمراقبة الجودة وفقًا للمعايير الموضحة في المنشور الأصلي. تم إجراء تصحيح الدفعة باستخدام خوارزمية Harmony (harmonypy الإصدار 0.0.5) مع معرف المريض كشرط للدفعة. تم التحقق من تعليقات الخلايا من المنشورات الأصلية وتنقيحها باستخدام تعبير الجينات المميزة الكلاسيكية. تم تنفيذ تقدير كثافة النواة الغاوسية لحساب كثافة الخلايا من ظروف مختلفة في تضمين UMAP باستخدام دالة tl.embedding_density من Scanpy. تم تنفيذ تحليل إثراء مجموعة الجينات المرتبة مسبقًا (GSEA) في fgsea (الإصدار 1.24)، باستخدام إحصائية والد كمعيار لترتيب الجينات.
التحليل الإحصائي
تم تحليل البيانات المجمعة باستخدام برنامج Flow Jo 10.8.1 (BD Bioscience) وGraphPad Prism 9.4.0. تم إنشاء UMAPs في FlowJo باستخدام إضافات DownSampleV3 وUMAP، المتاحة على FlowJo Exchange. تم تحليل بيانات scRNA-seq في Python (v3.8.12) وR (v4.0.4). تم تحديد طبيعة البيانات باستخدام اختبار شابيرو-ويلك. تم مقارنة أزواج العينات باستخدام اختبار مان-ويتني U ذو الذيلين غير المتزاوج. عند مقارنة أكثر من مجموعتين من البيانات، تم تحديد الدلالة الإحصائية إما باستخدام ANOVA أحادي الاتجاه مع اختبار المقارنات المتعددة لتوكاي، أو ANOVA ثنائي الاتجاه مع اختبار المقارنات المتعددة لشيداك. تم تحديد نقطتين من البيانات كقيم شاذة بواسطة طريقة ROUT في الشكل التكميلي 11E-F وتمت إزالتهما من التحليل. جميع الرسوم البيانية تظهر المتوسط.الانحراف المعياري ما لم يُذكر خلاف ذلك. فقط الاختلافات الهامة مُعلمة على الرسوم البيانية.
ملخص التقرير
معلومات إضافية حول تصميم البحث متاحة في ملخص تقارير مجموعة نيتشر المرتبط بهذه المقالة.
توفر البيانات
تم إيداع بيانات تسلسل RNA أحادي الخلية التي تم إنشاؤها بواسطة هذه الدراسة في مستودع GEO العام تحت أرقام الوصول GSE221064.
References
Galon, J. et al. Type, density, and location of immune cells within human colorectal tumors predict clinical outcome. Science 313, 1960-1964 (2006).
Naito, Y. et al. CD8+ T cells infiltrated within cancer cell nests as a prognostic factor in human colorectal cancer. Cancer Res. 58, 3491-3494 (1998).
Azimi, F. et al. Tumor-infiltrating lymphocyte grade is an independent predictor of sentinel lymph node status and survival in patients with cutaneous melanoma. J. Clin. Oncol. 30, 2678-2683 (2012).
Herbst, R. S. et al. Predictive correlates of response to the anti-PD-L1 antibody MPDL3280A in cancer patients. Nature 515, 563-567 (2014).
Im, S. J. et al. Defining CD8+ T cells that provide the proliferative burst after PD-1 therapy. Nature 537, 417-421 (2016).
Utzschneider, D. T. et al. T cell Factor 1-Expressing Memory-like CD8(+) T Cells sustain the immune response to chronic viral infections. Immunity 45, 415-427 (2016).
Siddiqui, I. et al. Intratumoral Tcf1(+)PD-1(+)CD8(+) T cells with stemlike properties promote tumor control in response to vaccination and checkpoint blockade immunotherapy. Immunity 50, 195-211.e110 (2019).
Sade-Feldman, M. et al. Defining T cell states associated with response to checkpoint immunotherapy in melanoma. Cell 175, 998-1013.e1020 (2018).
Trinchieri, G. Biology of natural killer cells. Adv. Immunol. 47, 187-376 (1989).
Smyth, M. J. et al. Differential tumor surveillance by natural killer (NK) and NKT cells. J. Exp. Med. 191, 661-668 (2000).
Vivier, E., Tomasello, E., Baratin, M., Walzer, T. & Ugolini, S. Functions of natural killer cells. Nat. Immunol. 9, 503-510 (2008).
Kim, S., lizuka, K., Aguila, H. L., Weissman, I. L. & Yokoyama, W. M. In vivo natural killer cell activities revealed by natural killer celldeficient mice. Proc. Natl. Acad. Sci. USA. 97, 2731-2736 (2000).
Bottcher, J. P. et al. NK cells stimulate recruitment of cDC1 into the tumor microenvironment promoting cancer immune control. Cell 172, 1022-1037.e1014 (2018).
Barry, K. C. et al. A natural killer-dendritic cell axis defines checkpoint therapy-responsive tumor microenvironments. Nat. Med. 24, 1178-1191 (2018).
Roberts, E. W. et al. Critical role for CD103(+)/CD141(+) dendritic cells bearing CCR7 for tumor antigen trafficking and priming of T cell immunity in melanoma. Cancer Cell 30, 324-336 (2016).
Salmon, H. et al. Expansion and activation of CD103(+) dendritic cell progenitors at the tumor site enhances tumor responses to therapeutic PD-L1 and BRAF inhibition. Immunity 44, 924-938 (2016).
Broz, M. L. et al. Dissecting the tumor myeloid compartment reveals rare activating antigen-presenting cells critical for T cell immunity. Cancer Cell 26, 638-652 (2014).
Spranger, S., Dai, D., Horton, B. & Gajewski, T. F. Tumor-residing Batf3 dendritic cells are required for effector cell trafficking and adoptive T cell therapy. Cancer Cell 31, 711-723.e714 (2017).
Gao, Y. et al. Tumor immunoevasion by the conversion of effector NK cells into type 1 innate lymphoid cells. Nat. Immunol. 18, 1004-1015 (2017).
Cortez, V. S. et al. SMAD4 impedes the conversion of NK cells into ILC1-like cells by curtailing non-canonical TGF-beta signaling. Nat. Immunol. 18, 995-1003 (2017).
McFarland, A. P. et al. Multi-tissue single-cell analysis deconstructs the complex programs of mouse natural killer and type 1 innate lymphoid cells in tissues and circulation. Immunity 54, 1320-1337.e1324 (2021).
Cortez, V. S. et al. Transforming growth factor-beta signaling guides the differentiation of innate lymphoid cells in salivary glands. Immunity 44, 1127-1139 (2016).
Lopes, N. et al. Tissue-specific transcriptional profiles and heterogeneity of natural killer cells and group 1 innate lymphoid cells. Cell Rep. Med. 3, 100812 (2022).
Friedrich, C. et al. Effector differentiation downstream of lineage commitment in ILC1s is driven by Hobit across tissues. Nat. Immunol. 22, 1256-1267 (2021).
Vivier, E. et al. Innate lymphoid cells: 10 years on. Cell 174, 1054-1066 (2018).
Spits, H. et al. Innate lymphoid cells-a proposal for uniform nomenclature. Nat. Rev. Immunol. 13, 145-149 (2013).
Walker, J. A., Barlow, J. L. & McKenzie, A. N. Innate lymphoid cellshow did we miss them? Nat. Rev. Immunol. 13, 75-87 (2013).
Gasteiger, G., Fan, X., Dikiy, S., Lee, S. Y. & Rudensky, A. Y. Tissue residency of innate lymphoid cells in lymphoid and nonlymphoid organs. Science 350, 981-985 (2015).
Dutton, E. E. et al. Peripheral lymph nodes contain migratory and resident innate lymphoid cell populations. Sci. Immunol. 4, eaau8082 (2019).
Zhang, J. et al. T-bet and Eomes govern differentiation and function of mouse and human NK cells and ILC1. Eur. J. Immunol. 48, 738-750 (2018).
Klose, C. S. et al. Differentiation of type 1 ILCs from a common progenitor to all helper-like innate lymphoid cell lineages. Cell 157, 340-356 (2014).
Di Censo, C. et al. Granzyme A and CD160 expression delineates ILC1 with graded functions in the mouse liver. Eur. J. Immunol. 51, 2568-2575 (2021).
Nixon, B. G. et al. Cytotoxic granzyme C-expressing ILC1s contribute to antitumor immunity and neonatal autoimmunity. Sci. Immunol. 7, eabi8642 (2022).
Li, Z. et al. In vivo labeling reveals continuous trafficking of TCF-1+ T cells between tumor and lymphoid tissue. J. Exp. Med. 219, e20210749 (2022).
Tomura, M. et al. Monitoring cellular movement in vivo with photoconvertible fluorescence protein “Kaede” transgenic mice. Proc. Natl. Acad. Sci. USA. 105, 10871-10876 (2008).
Walker, J. A. et al. Polychromic reporter mice reveal unappreciated innate lymphoid cell progenitor heterogeneity and elusive ILC3 progenitors in bone marrow. Immunity 51, 104-118.e107 (2019).
Robinette, M. L. et al. Transcriptional programs define molecular characteristics of innate lymphoid cell classes and subsets. Nat. Immunol. 16, 306-317 (2015).
Chiossone, L. et al. Maturation of mouse NK cells is a 4-stage developmental program. Blood 113, 5488-5496 (2009).
Van den Berge, K. et al. Trajectory-based differential expression analysis for single-cell sequencing data. Nat. Commun. 11, 1201 (2020).
Aibar, S. et al. SCENIC: single-cell regulatory network inference and clustering. Nat. Methods 14, 1083-1086 (2017).
Bernard, K. et al. Engagement of natural cytotoxicity programs regulates AP-1 expression in the NKL human NK cell line. J. Immunol. 162, 4062-4068 (1999).
Adams, N. M. et al. Transcription factor IRF8 orchestrates the adaptive natural killer cell response. Immunity 48, 1172-1182.e1176 (2018).
Rabacal, W. et al. Transcription factor KLF2 regulates homeostatic NK cell proliferation and survival. Proc. Natl. Acad. Sci. USA. 113, 5370-5375 (2016).
Khameneh, H. J. et al. Myc controls NK cell development, IL-15driven expansion, and translational machinery. Life Sci. Alliance 6 (2023).
Jin, S. et al. Inference and analysis of cell-cell communication using CellChat. Nat. Commun. 12, 1088 (2021).
Adam, C. et al. DC-NK cell cross talk as a novel CD4+ T-cellindependent pathway for antitumor CTL induction. Blood 106, 338-344 (2005).
Laine, A. et al. Regulatory T cells promote cancer immune-escape through integrin alphavbeta8-mediated TGF-beta activation. Nat. Commun. 12, 6228 (2021).
Stojanovic, A., Fiegler, N., Brunner-Weinzierl, M. & Cerwenka, A. CTLA-4 is expressed by activated mouse NK cells and inhibits NK Cell IFN-gamma production in response to mature dendritic cells. J. Immunol. 192, 4184-4191 (2014).
Lee, S. H., Fragoso, M. F. & Biron, C. A. Cutting edge: a novel mechanism bridging innate and adaptive immunity: IL-12 induction of CD25 to form high-affinity IL-2 receptors on NK cells. J. Immunol. 189, 2712-2716 (2012).
Ni, J. et al. Single-cell RNA sequencing of tumor-infiltrating NK cells reveals that inhibition of transcription factor HIF-1alpha Unleashes NK cell activity. Immunity 52, 1075-1087.e1078 (2020).
Krzywinska, E. et al. Loss of HIF-1alpha in natural killer cells inhibits tumour growth by stimulating non-productive angiogenesis. Nat. Commun. 8, 1597 (2017).
Cancer Genome Atlas Research, N. et al. The cancer Genome Atlas Pan-Cancer analysis project. Nat. Genet. 45, 1113-1120 (2013).
Pelka, K. et al. Spatially organized multicellular immune hubs in human colorectal cancer. Cell 184, 4734-4752.e4720 (2021).
Crinier, A. et al. High-dimensional single-cell analysis identifies organ-specific signatures and conserved NK Cell subsets in humans and mice. Immunity 49, 971-986.e975 (2018).
Tang, F. et al. A pan-cancer single-cell panorama of human natural killer cells. Cell 186, 4235-4251.e4220 (2023).
Lo, H. C. et al. Resistance to natural killer cell immunosurveillance confers a selective advantage to polyclonal metastasis. Nat Cancer 1, 709-722 (2020).
Kennedy, M. K. et al. Reversible defects in natural killer and memory CD8 T cell lineages in interleukin 15-deficient mice. J. Exp. Med. 191, 771-780 (2000).
Sun, H. et al. Accumulation of tumor-infiltrating CD49a(+) NK cells correlates with poor prognosis for human hepatocellular carcinoma. Cancer Immunol. Res. 7, 1535-1546 (2019).
Moreno-Nieves, U. Y. et al. Landscape of innate lymphoid cells in human head and neck cancer reveals divergent NK cell states in the tumor microenvironment. Proc. Natl. Acad. Sci. USA. 118, e2101169118 (2021).
Mackay, L. K. et al. The developmental pathway for CD103(+)CD8+ tissue-resident memory T cells of skin. Nat. Immunol. 14, 1294-1301 (2013).
Sheridan, B. S. et al. Oral infection drives a distinct population of intestinal resident memory CD8(+) T cells with enhanced protective function. Immunity 40, 747-757 (2014).
Zhang, N. & Bevan, M. J. Transforming growth factor-beta signaling controls the formation and maintenance of gut-resident memory T cells by regulating migration and retention. Immunity 39, 687-696 (2013).
Marquardt, N. et al. Unique transcriptional and protein-expression signature in human lung tissue-resident NK cells. Nat. Commun. 10, 3841 (2019).
Sojka, D. K. et al. Cutting edge: local proliferation of uterine tissueresident NK cells during decidualization in mice. J. Immunol. 201, 2551-2556 (2018).
Peng, H. et al. Liver-resident NK cells confer adaptive immunity in skin-contact inflammation. J. Clin. Investig. 123, 1444-1456 (2013).
Lin, E. Y. et al. Progression to malignancy in the polyoma middle T oncoprotein mouse breast cancer model provides a reliable model for human diseases. Am. J. Pathol. 163, 2113-2126 (2003).
Wrangle, J. M. et al. ALT-803, an IL-15 superagonist, in combination with nivolumab in patients with metastatic non-small cell lung cancer: a non-randomised, open-label, phase 1b trial. Lancet Oncol. 19, 694-704 (2018).
Grabstein, K. H. et al. Cloning of a T cell growth factor that interacts with the beta chain of the interleukin-2 receptor. Science 264, 965-968 (1994).
Burton, J. D. et al. A lymphokine, provisionally designated interleukin T and produced by a human adult T -cell leukemia line, stimulates T-cell proliferation and the induction of lymphokineactivated killer cells. Proc. Natl. Acad. Sci. USA. 91, 4935-4939 (1994).
Ma, S., Caligiuri, M. A. & Yu, J. Harnessing IL-15 signaling to potentiate NK cell-mediated cancer immunotherapy. Trends Immunol. 43, 833-847 (2022).
Di Pilato, M. et al. CXCR6 positions cytotoxic T cells to receive critical survival signals in the tumor microenvironment. Cell 184, 4512-4530.e4522 (2021).
Lee, C. et al. Tumour-retained activated CCR7+ dendritic cells are heterogeneous and regulate local anti-tumour cytolytic activity. Nat. Commun https://doi.org/10.1038/s41467-024-44787-1 (2024).
Stoklasek, T. A., Schluns, K. S. & Lefrancois, L. Combined IL-15/IL15Ralpha immunotherapy maximizes IL-15 activity in vivo. J. Immunol. 177, 6072-6080 (2006).
Dubois, S., Patel, H. J., Zhang, M., Waldmann, T. A. & Muller, J. R. Preassociation of IL-15 with IL-15R alpha-IgG1-Fc enhances its activity on proliferation of NK and CD8+/CD44high T cells and its antitumor action. J. Immunol. 180, 2099-2106 (2008).
Hawke, L. G., Mitchell, B. Z. & Ormiston, M. L. TGF-beta and IL-15 synergize through MAPK pathways to drive the conversion of human NK cells to an innate Lymphoid Cell 1-like phenotype. J. Immunol. 204, 3171-3181 (2020).
Shimshek, D. R. et al. Codon-improved Cre recombinase (iCre) expression in the mouse. Genesis 32, 19-26 (2002).
Shcherbo, D. et al. Far-red fluorescent tags for protein imaging in living tissues. Biochem. J. 418, 567-574 (2009).
Fiancette, R. et al. Reciprocal transcription factor networks govern tissue-resident ILC3 subset function and identity. Nat. Immunol. 22, 1245-1255 (2021).
Wong, P., Wagner, J. A., Berrien-Elliott, M. M., Schappe, T. & Fehniger, T. A. Flow cytometry-based ex vivo murine NK cell cytotoxicity assay. STAR Protoc. 2, 100262 (2021).
Wolf, F. A., Angerer, P. & Theis, F. J. SCANPY: large-scale single-cell gene expression data analysis. Genome Biol. 19, 15 (2018).
Wolock, S. L., Lopez, R. & Klein, A. M. Scrublet: computational identification of cell doublets in single-cell transcriptomic data. Cell Syst. 8, 281-291.e289 (2019).
Wolf, F. A. et al. PAGA: graph abstraction reconciles clustering with trajectory inference through a topology preserving map of single cells. Genome Biol. 20, 59 (2019).
Haghverdi, L., Buttner, M., Wolf, F. A., Buettner, F. & Theis, F. J. Diffusion pseudotime robustly reconstructs lineage branching. Nat. Methods 13, 845-848 (2016).
Newman, A. M. et al. Determining cell type abundance and expression from bulk tissues with digital cytometry. Nat. Biotechnol. 37, 773-782 (2019).
شكر وتقدير
نشكر الدكتور ي. ميو (جامعة تسوكوبا) والدكتور أ. كاناغاوا (RCAI، ريكين) والدكتور م. تومورا (جامعة أوساكا أوتاني) على فئران كايدي. نشكر الدكتور س. زيليناي لمشاركته اللطيفة لـ MC38.الخلايا. نشكر وحدة الخدمات الطبية الحيوية في جامعة برمنغهام على كل مساعدتهم في العمل التجريبي داخل الكائنات الحية. نشكر A. Ptasinska وزملاءه في جينوميات برمنغهام، مرفق الجينوم والتسلسل في جامعة برمنغهام، على مساعدتهم في تسلسل RNA للخلايا المفردة ومنصة تحليل التدفق في جامعة برمنغهام. نشكر غاريث هاول ونواة تحليل التدفق في جامعة مانشستر، وأندي هايز وكلير موريزرو في مرفق تقنيات الجينوم في جامعة مانشستر على مساعدتهم في تسلسل RNA للخلايا المفردة. النتائج المعروضة هنا تعتمد جزئيًا على البيانات التي تم إنشاؤها بواسطة شبكة أبحاث TCGA:https://www.cancer.gov/tcga. تم دعم هذا العمل من خلال المنح التالية لـ D.R.W.: زمالة بحثية كبيرة من مؤسسة ويلكوم (110199/Z/15/Z)، جائزة مشروع المناعة من أبحاث السرطان في المملكة المتحدة (C54019/A27535)، منحة CLIP من معهد أبحاث السرطان (CRI3128)، منحة أبحاث السرطان العالمية (21-0073) ومنحة MRC
منحة IMPACT iCASE للطلاب مع أسترازينيكا. تم دعم البحث في مختبر J.M. من قبل الجمعية السويدية للسرطان. التمويل لـ M.R.H.: زمالة السير هنري ديل الممولة بشكل مشترك من قبل مؤسسة ويلكوم والجمعية الملكية (رقم المنحة 105644/Z/14/Z)، وجائزة معهد ليستر للطب الوقائي. Z.K.T. و M.R.C. مدعومان من قبل منحة بحثية من مجلس البحوث الطبية لخرائط الخلايا البشرية (MR/SO35842/1). M.R.C. مدعوم من قبل جائزة محقق مؤسسة ويلكوم (220268/Z/20/Z) ومن قبل مركز كامبريدج للبحوث الطبية الحيوية التابع لـ NIHR.
مساهمات المؤلفين
صمم I.D. وأجرى التجارب، وحلل البيانات، وأجرى التحليل الإحصائي وكتب المخطوطة؛ صمم C.Y.C.L. وأجرى التجارب، وحلل البيانات وكتب المخطوطة؛ صمم Z.K.T. وZ.L. وC.W. وF.G. وB.C.K. وV.M.R. وR.F. التجارب وأجروها؛ صمم C.A.T. وأجرى التجارب وحلل البيانات؛ حلل S.M.B. البيانات؛ حصل C.N. وU.L. على عينات من الأنسجة البشرية؛ قدم C.S. وV.S. نموذجًا حيويًا ونقدا البيانات؛ صمم G.C. وS.A.H. وS.J.D. وJ.M. وM.R.H. التجارب ونقدوا البيانات؛ صمم M.R.C. وD.R.W. التجارب، وحللا ونقدا البيانات وكتبا المخطوطة.
المصالح المتنافسة
يعلن المؤلفون عن المصالح المتنافسة التالية: جي. سي.، إس. إيه. إتش.، إس. جي. دي. هم موظفون بدوام كامل في أسترازينيكا ويمتلكون أو قد امتلكوا أسهمًا في أسترازينيكا. المؤلفون الآخرون لا يعلنون عن أي مصالح متنافسة.
يجب توجيه المراسلات والطلبات للحصول على المواد إلى منى ر. كلاثورثي أو ديفيد ر. ويذرز.
معلومات مراجعة الأقران تشكر مجلة Nature Communications جونغ-أيون بارك والمراجعين الآخرين المجهولين على مساهمتهم في مراجعة هذا العمل. يتوفر ملف مراجعة الأقران.
معهد المناعة والعلاج المناعي، كلية العلوم الطبية وطب الأسنان، جامعة برمنغهام، برمنغهام، المملكة المتحدة.قسم الطب، وحدة المناعة الجزيئية، مختبر الأبحاث الطبية لمجلس الأبحاث الطبية، جامعة كامبريدج، كامبريدج، المملكة المتحدة.علم الوراثة الخلوية، معهد ويلكوم سانجر، حرم ويلكوم الجينومي، هينكستون، كامبريدج، المملكة المتحدة.مركز الطب المعدي، قسم الطب هودينغ، معهد كارولينسكا، ستوكهولم، السويد.قسم الطب الجزيئي والجراحة، معهد كارولينسكا وقسم سرطان الحوض، مستشفى جامعة كارولينسكا، ستوكهولم، السويد.قسم المعلوماتية، التصوير وعلوم البيانات، كلية البيولوجيا والطب والصحة، جامعة مانشستر، مركز مانشستر الأكاديمي للعلوم الصحية، مانشستر، المملكة المتحدة.معهد التشريح، جامعة زيورخ، زيورخ، النمسا.معهد علم الأدوية وعلم السموم، جامعة الطب البيطري، فيينا، النمسا.البحث والتطوير في علم الأورام المبكر، أسترازينيكا، الولايات المتحدة الأمريكية.البحث والتطوير في علم الأورام المبكر، أسترازينيكا، المملكة المتحدة.البحث السريري في أمراض الرئة والحساسية، الوحدة الطبية لأمراض الرئة والحساسية، مستشفى كارولينسكا الجامعي، ستوكهولم، السويد.معهد ليديا بيكر للمناعة والالتهابات، قسم العدوى والمناعة والطب التنفسي، كلية البيولوجيا والطب والصحة، جامعة مانشستر، مركز مانشستر الأكاديمي للعلوم الصحية، مانشستر، المملكة المتحدة. البريد الإلكتروني:mrc38@medschl.cam.ac.uk; د.ويذرز@بirmingham.ac.uk
Immune cell dysfunction within the tumor microenvironment (TME) undermines the control of cancer progression. Established tumors contain phenotypically distinct, tumor-specific natural killer (NK) cells; however, the temporal dynamics, mechanistic underpinning and functional significance of the NK cell compartment remains incompletely understood. Here, we use photo-labeling, combined with longitudinal transcriptomic and cellular analyses, to interrogate the fate of intratumoral NK cells. We reveal that NK cells rapidly lose effector functions and adopt a distinct phenotypic state with features associated with tissue residency. NK cell depletion from established tumors did not alter tumor growth, indicating that intratumoral NK cells cease to actively contribute to anti-tumor responses. IL-15 administration prevented loss of function and improved tumor control, generating intratumoral NK cells with both tissue-residency characteristics and enhanced effector function. Collectively, our data reveals the fate of NK cells after recruitment into tumors and provides insight into how their function may be revived.
The clinical impact of immunotherapy for cancer patients has prompted extensive research into the composition and function of immune cells within tumors . Amongst these, tumor cytotoxic CD8 T cells have been the most extensively characterized, with a spectrum
of exhausted T cells with diminishing effector functions described . Innate lymphocytes, classically represented by NK cells, but which now also includes other innate lymphoid cell (ILC) populations, also have potent cytotoxic potential. There is increasing interest in harnessing
this expanded pool of effector cells for therapeutic purposes by unlocking its cytotoxic potential. However, the behavior of these cells and how this changes over time within the TME remains poorly understood.
Conventional NK (cNK) cells are circulatory in mouse and human with a robustly cytotoxic phenotype; they are armed with an array of granzymes and perforin, alongside multiple apoptosis-inducing ligands including TRAIL and FASL . In vivo, constitutive NK cell deficiency results in impaired control of tumor growth and enhanced metastatic disease in multiple murine cancer models . Importantly, beyond their direct cytotoxic functions, NK cells further act as orchestrators of the T cell response through their recruitment, activation and expansion of dendritic cells (DCs), particularly conventional type 1 DCs (cDC1), via their production of the chemokines CCL5, XCL1, as well as FLT3L and IFN . The CDC 1 subset is the most adept at trafficking to the draining lymph node (dLN) to cross-present tumor antigens to naïve T cells, and thus drive the expansion of anti-tumor CD8 T cells . Furthermore, CDC 1 within the TME attract and restimulate effector CD8 T cells to amplify and sustain the response . Collectively, these data emphasize the key role of coordinated NK cellDC crosstalk for generating durable anti-tumor responses. Indeed, the frequency of NK and CDC1 within melanoma is predictive of the response to anti-PD-1 therapy .
However, phenotypic heterogeneity and dysfunction has been described within the intratumoral NK cell compartment , likely undermining control of tumor growth. The discovery of different ILC populations involved in type 1 immune responses, collectively termed ILC1s, adds a further level of complexity to understanding the composition of tumor infiltrating lymphocytes (TILs)-most notably whether such populations derive from cells recruited from the circulation or tissue-resident compartments . ILC1s share many phenotypic similarities and transcriptional programs with NK cells, and although most ILCs are tissue-resident, circulating ILC1s have been observed in mice . NK cells are developmentally distinct from ILC1s and were initially further distinguished based upon granzyme expression and cytotoxicity, however, more recent descriptions have revealed that some ILC1s express granzymes and are able to kill target cells . Indeed, NK cell conversion to an ILC1 state within the TME has been proposed . Thus, NK cell dysfunction within tumors may reflect the adaptation of cNKs to the TME, the contribution of local ILC populations, or a combination of both. Defining how and why intratumoral NK/ILC1 populations form may facilitate more precise investigation of the mechanisms that need to be targeted to manipulate these innate lymphocytes and promote anti-tumor immune responses.
Here, we use temporal labeling of tumors through photoconversion to track the fate of NK cells in vivo after recruitment into solid tumors. Our data reveals the rapid loss of chemokine and cytokine production, alongside impaired cytotoxicity, as cNK cells adapt to, or are modulated by, the TME. We demonstrate that all cNK cells retained within the tumor ultimately adopt a distinct, dysfunctional state, characterized by expression of CD49a, and that the heterogeneity observed across many pre-clinical tumor models reflects the time cNK cells have spent within the tumor. Depletion of NK cells from established tumors had no impact on tumor growth indicating that these cells have ceased to actively contribute to tumor control. The loss of NK cell functionality after tumor entry could be blocked through enhanced IL-15 signaling, leading to improved control of tumor growth. Collectively, our data clarify the fate of NK cells within solid tumors, defining the tumor-adapted state that these cells adopt once within the TME, which limits their contribution to the anti-tumor response. These data inform further efforts to revive intratumoral NK cells and enhance anti-tumor immunity.
Results
NK cells rapidly exhibit transcriptome alterations after tumor entry
Recent studies have highlighted that the intratumoral NK cell compartment is distinct, characterized by altered functions including reduced cytotoxicity and an impaired ability to orchestrate DC recruitment and activation . Precisely why this occurs remains unresolved. To date, in vivo studies tracking the fate of NK cells specifically within the tumor are lacking. Using our recently described dynamic labeling of the tumor immune compartment , we sought to define the state of NK cells as they enter tumors and map real-time changes in their phenotype and function over time. To this end, MC38 tumors were grafted subcutaneously on the flank of Kaede photoconvertible mice, a transgenic model in which all cells express a green fluorescent protein that irreversibly switches to a red form upon exposure to violet light . The entire immune compartment of the tumor was selectively labeled at 13 days post-engraftment and tissue harvested 2 days later. Thus, amongst the cells isolated from the tumor, unlabeled Kaede Green+ (KG+) cells had been in the tumor for up to 48 h , while Kaede Red+ (KR+) cells had spent at least 48 h within the tissue. To capture transcriptomic changes across the TIL compartment over time and in an unbiased manner, we employed scRNAsequencing (scRNA-seq). TILs were FACS-isolated to better equilibrate numbers, further split into KG+ and KR+ populations and analyzed by droplet-based scRNA-seq (Supplementary Fig. 1A). The gating strategy used ensured the NK cell compartment was fully captured (Supplementary Fig. 1B).
After quality control, a total of 46,342 TILs were analyzed, comprised of a small number of B cells, putative NK cells and multiple T cell populations (CD4, CD8, Treg, TCR+) as defined by canonical markers (Supplementary Fig. 1C-E). We focused upon the putative NK cell cluster of 11,808 cells, initially defined by high expression of Prf1, Ncr1, Klrb1c and Fcgr3. Unbiased re-clustering of these cells in isolation revealed 8 clusters, of which 6 were defined as NK cells based upon expression of Ncr1, Eomes, Gzmb and the absence of Cd3e and Il7ra, including a cycling NK cell cluster additionally expressing Mki67 and Birc5 (Fig. 1A, B, Supplementary Fig. 1F). The remaining two clusters were identified as NKT cells and an ILC cluster, distinguished from bona fide NK cells by expression of Il7ra, Rora and Gata3, in the absence of Eomes, and Cd3e expression (Supplementary Fig. 1G-I) . Expression of Tbx21, but not Eomes within the small ILC cluster indicated the prevalence of ILC1s (Supplementary Fig. 1I) . Using published NK and ILC1-specific signatures , we further confirmed our cluster identification (Supplementary Fig. 1J).
We then determined the proportion of and cells within each cluster to contextualize the time spent within the tumor microenvironment of each sub-cluster (Fig. 1C-E). These data revealed a gradation in the proportion of KR+ cells across the NK clusters, with the NK_1 cluster comprised almost entirely of KG+ cells and the NK_5 cluster at the other extreme, consisting of approximately cells. Further analysis of the NK_cycling cluster revealed that cycling cells could be found in all NK/ILC/NKT cell clusters, suggesting that these do not constitute a distinct phenotype (Supplementary Fig. 1K). However, of note, NK_5 was particularly enriched among the cycling NK cells, suggesting that some tumor-retained NK cells may expand in situ (Supplementary Fig. 1L). To temporally order the transcriptomic changes that occur within NK cells after entering the tumor we performed a pseudotime trajectory analysis, rooted in NK_1 since this contained the highest proportion of NK cells that had recently entered the tumor. These analyses highlighted the NK_5 cluster as the end state of the trajectory (Fig. 1F, G). Similarly, partition-based graph abstraction (PAGA) to map cluster connectivity (Fig. 1H), indicated that the major cell fate trajectory for tumor NK cells progresses from the NK_1 through to NK_2 and then onto the NK_5 transcriptional signature.
Fig. 1 | Rapid changes to the NK cell transcriptome after entry into the TME. MC38 tumors, grafted subcutaneously on the flank, were photoconverted and analyzed 48 h later using droplet-based scRNA-sequencing. A UMAP showing 11,808 NK cells defined by expression of Ncr1, Prf1, Klrb1c, Fcgr3, resolved into 8 clusters comprised of NK_1 to NK_5, alongside 1 cycling cluster and two further clusters that describe ILC and NKT cells. B Dot plots showing expression of selected genes used to further characterize the clusters. C UMAP showing the distribution of Kaede Green+ and Kaede Red+ cells across the NK clusters. D The proportion of Kaede Green+ and Kaede Red+ cells within each cluster. E Proportion of each cluster within the Kaede Green+ and Kaede Red+ cells. F UMAP showing diffusion pseudotime trajectory rooted in NK_1. G Bee swarm plot of the 5 NK clusters (NK_1
to NK_5) over pseudotime. H PAGA illustrating gene expression relationship between NK clusters. I Violin plots showing expression of Iga1, Itga2, Itgam across NK_1, NK_2 and NK_5. J Differentially expressed genes over pseudotime grouped by function. K Pathway analyses characterizing changes in NK activation, degranulation, and cytotoxicity over pseudotime. L UMAPs showing integration of NK cell data after 24 and 72 h post-photoconversion with the original data derived from 48 h post-labeling. Statistical significance determined by two-sided Wilcoxon ranksum test with Benjamini-Hochberg multiple-testing correction. Data are shown as box (median; box, 25th percentile and 75th percentile; whiskers, 1.5*inter-quartile range) and violin plots. In (J, K) data are shown as local regression (loess) fit to scaled expression values.
Differential expression of the integrins CD49a and CD49b has been used to distinguish cNK cells (CD49b+) and tissue-resident NK cells and ILC1 (CD49a+) . Expression of Itga2 (CD49b) was limited to the NK_1 and NK_2 clusters while Itga1 (CD49a) was expressed by the majority of the NK_5 cluster, but not the other clusters (Fig. 11). Interestingly, expression of Itgam, which encodes CD11b and defines mature NK cells in the circulation , was limited to the NK_1 cluster.
To begin investigating the transcriptomic changes occurring within intratumoral NK cells, we plotted the expression of functionally grouped genes over pseudotime (Fig. 1J) . As NK cells progressed
towards the terminal intratumoral pseudotime state (NK_5), there was an upregulation of inhibitory receptors including Pdcd1, Lag3, Havcr2, Cd96, a change in migration-associated transcripts with a marked reduction in Cxcr4 and Itgam expression, but an increase in Itga1, as well as loss of expression of (chemokines associated with DC recruitment), and altered granzyme expression (Fig. 1J). Consistent with these findings, geneset enrichment analysis identified a reduction in ‘NK activation’, ‘NK degranulation’ and ‘NK cytotoxicity’ pathway gene sets over pseudotime (Fig. 1K). To further investigate the potential drivers of this transition, we performed a gene regulatory
network analysis using SCENIC (Supplementary Fig. 2). This revealed the concomitant downregulation of a large number of transcription factor regulons over pseudotime, as NK cells transition to the state described by NK 5. These included the AP-1 complex transcription factors Fos, Fosb, Jun, Junb, which are activated during NK cell cytolytic programs and down regulated by interactions with inhibitory ligands . Other down-regulated transcription factors included Irf8, Klf2, Myc, which support NK cell activation and proliferation . Interestingly, we did not identify transcription factor regulons significantly upregulated with pseudotime, suggesting that the tumor-retained NK state arises from the reduced activity of core transcription factors associated with promoting mature NK cell development and expansion.
To better understand changes in intratumoral NK cells over time, we additionally analyzed NK cells in scRNA-seq data where TILs were assessed at 24 and 72 h post photoconversion , providing finer granularity of the changes that occur over real time. Re-analysis of 1035 NK cells revealed three NK clusters (Supplementary Fig. 3A, B). Notably, the NK_a cluster was comprised almost entirely of KG+ cells, while NK_c contained only KR+ cells, consistent with a simple linear trajectory (Supplementary Fig. 3B, C). Substantial changes in gene expression across these three clusters closely matched those observed in our initial analysis, including a switch from Itgam to Itga1 expression (Supplementary Fig. 3D, E). To determine where NK cell transcriptomes from 24 and 72 h post photoconversion would embed along the pseudo-time trajectory, we projected these data into our initial reference single cell data set (Fig. 1F). Reassuringly, these timestamped data closely aligned to our pseudotime trajectory, validating that our analyses faithfully model temporal transcriptional changes (Fig. 1L). Finally, to further investigate the nature of the NK cells recruited into the tumor, we integrated circulating NK cells utilizing publicly available scRNA-seq date (https://www.10xgenomics.com/ resources/datasets/10-k-mouse-pbm-cs-multiplexed-2-cm-os-3-1-
standard-6-0-0) with our tumor data set (Fig. S1M). These blood NK cells most resembled NK_1 and NK_2, which are predominantly Kaedegreen in the scRNA-seq data, and importantly, none were mapped to NK_5 (Supplementary Fig. 1N). Comparison of Itgam, Itga1 and Itga2 expression confirmed the absence of Itga1 amongst the circulating NK cells (Supplementary Fig. 10).
Collectively, these data reveal rapid changes to the transcriptome of Itgam-expressing cNK cells after entering the TME from the circulation. Once within tumors, NK cells rapidly differentiate towards a common transcriptional state characterized by substantially altered core functions and expression of Itga1.
Differential expression of CD11b and CD49a expression capture temporal changes in NK cell phenotype
To validate the rapid changes observed in the transcriptional profile of NK cells entering the tumor, we turned to flow cytometry and initially sought to establish how best to identify cells described along the main cell fate trajectory. Given the differential expression of Itga1 and Itga2 (Fig. 1I) and prior use of these integrins to define NK populations , we assessed CD49a versus CD49b on CD3- NK1.1+ cells in MC38 tumors. However, our analysis revealed only two clear NK cell populations (Fig. 2A), prompting us to try alternative gating strategies. Comparison of CD49a versus CD11b expression identified three populations of CD3NK1.1+ cells: CD11b+ CD49a- cells, CD11b- CD49a- and CD11b- CD49a+ cells (Fig. 2B). Importantly, a similar staining pattern was observed across multiple murine cancer models including other subcutaneous (CT26, B16-F10-OVA), orthotopic (E0771) and primary (MMTV-PyMT) tumors (Fig. 2C, D). To extend this analysis and compare intratumoral NK cells with the NK/ILC1 populations found in healthy tissue, we assessed the CD3- NK1.1+ cells in MC38 and B16-F10 tumors, alongside spleen, liver, small intestine and colon (Supplementary Fig. 4). These data indicated that the tumor NK cell compartment was phenotypically
distinct to the ILC1 populations identified in non-tumor tissues, consistent with recent scRNA-seq analyses .
To confirm that expression of CD49a versus CD11b could be used to assess the phenotype of NK cells as they enter the tumor and then track changes over time, we photoconverted MC38 tumors and analyzed the intratumoral NK cell compartment 5, 24 and 72 h later. Enumeration of the total number of NK cells indicated the continuous recruitment of new (KG+) cells over this time frame, alongside a modest decline in the number of retained (KR+) cells within the tumor (Fig. 2E). Analysis at only 5 h post-photoconversion revealed a small KG+ population of newly arrived NK cells, the majority of which were CD11b+CD49a- and the CD49a+ compartment was absent (Fig. 2F). Analysis at 24 h post-photoconversion revealed that approximately 10% of the KG+ NK cells expressed CD49a, establishing that a switch in integrin expression begins to occur after only 1 day in the TME. Notably, the KR+ population at 72 h post photoconversion, which by definition had spent at least 3 days within the tumor, were essentially all CD49a+CD11b-. Since a mixture of CD49a+ and CD49a- NK cells were evident amongst the KR+ cells at 24 h , these data indicate that full conversion of cNKs takes more than 24 h but is completed within approximately 3 days. Analysis of the % of KG+ cells within each population highlighted that by 72 h post photoconversion, the vast majority of the CD11b+CD49a- and CD11b-CD49a- populations comprised of cells entering post-labeling (Fig. 2G). Comparable dynamic changes in NK cell phenotype over time were observed in multiple other murine tumor models (Supplementary Fig. 5). In addition, we further validated the expression patterns observed in our transcriptomic analysis, identifying increased expression of LAG-3 and CD69 as characteristic features of the CD49a+ ‘tumor -retained’ state (Fig. 2H-J). Interestingly, expression of NKG2A, the inhibitory receptor encoded by Klrc1, showed a biphasic expression pattern, largely independent of time within the tumor.
These data clearly indicated that intratumoral NK cell heterogeneity could be explained by the time cNK cells have spent within the tumor. The absence of CD49a- NK cells amongst the KR+ NK cells at 72 h post-photoconversion indicates that these cells must all either differentiate to a CD49a+ state, egress the tumor, or die in situ. To investigate NK cell egress, tumors were photoconverted and the KR+ cells present in the dLN and spleen analyzed 24 and 72 h later (Supplementary Fig. 6). The proportion and total number of KR+ NK cells in either tissue was very low, indicating that few NK cells egressed the tumor. Of those NK cells that did egress, the majority lacked CD49a expression. Collectively these data indicate that the CD49a+ NK cell compartment in these murine tumor models arise from the differentiation and retention of circulating cNK cells.
NK cells rapidly lose core effector functions after tumor entry
Having established how to identify the temporal changes in NK cell state through a combination of photo-labeling and analysis of integrin expression, we sought to understand how NK cell function was impacted by time spent in the tumor microenvironment. To consider the potential cellular interactions of the different NK cell states identified in an unbiased manner, we used CellChat and specifically focused on myeloid cells within the TME given evidence of this cellular axis impacting anti-tumor immunity (Supplementary Fig. 7). This analysis identified a number of potential associations that differed depending on the NK state, including a number of immunostimulatory interactions (Ifng, Ccl5, Il18) involving newly recruited NK cells, but not those that had been retained within the tumor for several days. Other associations of note included the potential responsiveness of the NK_5 state to Il15 signaling as well as the emergence of inhibitory receptor interactions (e.g., Cd244a:Cd48). Collectively, this unbiased in silico analysis highlighted the potential for quite different cellular communications between recently recruited and tumor-retained NK cells.
To validate some of the transcriptional changes observed, NK cells were isolated from photo-labeled tumors, stimulated ex vivo and assessed by intracellular flow cytometry. Analysis of NK cells at 24 h post-photoconversion revealed that production of CCL5 was restricted to cells, confirming the rapid loss of CCL5 expression after tumor entry (Fig. 3A). NK cell production of IFN is a further mechanism by which innate immune cells may activate DCs to
enable priming of antigen specific cells . Post-stimulation ex vivo, the intratumoral NK cells produced significantly less IFN than splenic NK cells (Fig. 3B). To further investigate NK cell Ifng expression in the absence of ex vivo stimulation, we turned to Ifng reporter mice. To confirm accurate reporting in this newly generated model, splenocytes were stimulated ex vivo with recombinant IL-12 and IL-18, which resulted in robust mKate2 reporting of Ifng expression in NK
Fig. 2 | Differential expression of CD11b and CD49a capture temporal changes in NK cell phenotype. A Expression of CD49a vs CD49b by NK cells (CD3- NK1.1+) isolated from MC38 tumors grafted subcutaneously on the flank. B Expression of CD49a vs CD11b by NK cells isolated from MC38 tumors, alongside blood.
C Expression of CD49a vs CD11b by NK cells across multiple tumor models. NK cells identified as CD3- NK1.1+ in C57BL/6 mice, CD3- NKp46+ in BALB/c mice. D Proportion of NK cells within the CD11b + CD49a-, CD11b- CD49a- (double negative, DN) and CD11b- CD49a+ gates across the different tumor models. Data collected from B16-F10-OVA and EO771 tumors was from 1 independent repeat, and MC38, CT26, and MMTV-PyMT tumors pooled from 2 independent repeats, where MC38 ( ), CT26 ( ), EO771 ( , B16-F10-OVA ( ), and MMTV-PyMT ( ). E Number of Kaede Green+ and Kaede Red+ NK cells at 5, 24 and 72 h post photoconversion of MC38 tumors. F Expression of CD49a versus CD11b by Kaede
Green+ and Kaede Red+ NK cells at 5,24 and 72 h post photoconversion. G The proportion of Kaede Green/Red for each NK cell subset at each time point post photoconversion. Data at h is representative of 1 independent repeat, whereas and h pooled from 2 independent repeats. H UMAPs showing protein expression of CD11b and CD49a alongside Kaede Green/Red expression by NK cells isolated from MC38 tumors at 24 and 72 h post photoconversion. I UMAPS showing expression of CD11b, CD49a, NKG2A, LAG-3 and CD69.J Enumeration of the proportion of cells expressing NKG2A, LAG-3 and CD69 across the NK cell subsets. Data in UMAPs , and are representative of two independent repeats. Statistical significance was determined by two-way ANOVA with Šidák’s multiple comparisons test (J). Data are presented showing all individual data points as well as the mean value SD. In all experiments, ‘ ‘ defines a single tumor on an individual mouse, i.e., refers to 3 mice each with a single tumor.
cells but not T cells (Supplementary Fig. 8A). However, NK cells freshly isolated from MC38 tumors grafted into Ifng mice, lacked mKate2 expression regardless of their integrin expression (Fig. 3C). To validate the changes in the cytotoxic profile of intratumoral NK cells indicated by the transcriptomic analysis (Fig. 1J), we confirmed granzyme A was produced by the vast majority of CD11b + CD49a- cells, but significantly less was detected in the CD11b- CD49a- and CD11b- CD49a + populations (Fig. 3D). Contrasting with the decline in granzyme A production, and again consistent with the changes observed over transcriptional pseudotime, granzyme C production was lacking from KG+ CD11b+ CD49a- cells and most highly produced by KR+ CD11bCD49a+ cells (Fig. 3E). granzyme B, which was not differentially expressed over pseudotime at the transcriptional level, was detected across all the NK cell populations and a significantly higher proportion of KR+ NK cells produced granzyme B (Fig. 3F). However, production of Perforin was significantly reduced in CD11b- CD49a+ NK cells versus the CD11b+ CD49a- populations (Fig. 3G), Finally, the proportion of NK cells expressing CD107a was significantly reduced amongst the KR+ compartment (Fig. 3H).
These changes in the function of NK cells when retained within tumors were further confirmed in other murine tumor models (Supplementary Fig. 8B-E). Of note, having analyzed CT26 tumors grown subcutaneously, we further asked whether dysfunctional NK cells were also observed when this colorectal cell line was grown orthotopically (Supplementary Fig. 8F, G). Here, in addition to EOMES+ NK cells within the CD3-NKp46+ populations, CXCR6+ EOMES- ILCs were evident, a population lacking in the subcutaneous model that reflected the contribution of ILCs present within the local tissue (Supplementary Fig. 8 H , I). To directly assess whether cNK cells differentiate into the CD11b- CD49a+ phenotype, we MACS-isolated splenic NK cells from Kaede mice and transferred them i.v. into WT C57BL/6 hosts bearing MC38 tumors (Supplementary Fig. 9A, B). Only within the MC38 tumors did the transferred KG+ NK cells upregulate CD49a and granzyme C (Supplementary Fig. 9C-G). Finally, we sought to test whether the CD11b- CD49a+ NK population was less cytotoxic that the CD11b + CD49a- cells that enter tumors. To do this, we FACS-isolated the CD11b+ and CD49a+ NK cells from MC38 tumors and tested their ability to lyse B16-F10 tumor cells in vitro over 4 h (Fig. 3I). The CD11b+ population showed significantly better killing than the labeled CD49a+ NK cells, consistent with functional differences in the cytotoxic ability of these populations (Fig. 3J). Collectively, these data demonstrate the presence of dysfunctional NK cells across multiple preclinical cancer models targeting different tissues. In all, upregulation of CD49a expression in the absence of CD11b is associated with retention in the TME, altered effector functions and less efficient tumor cell killing.
Multiple mechanisms in the TME drive the conversion of cNK cells to a tumor – retained CD49a + NK cell compartment
Having defined the cellular state adopted by cNK cells that become retained within tumors, we sought to understand the mechanisms
within the TME that drive this cell fate. The TGF and pathways have both been linked to altered NK cell functions both in vitro and in vivo . We initially asked whether NK cells with the phenotype and functional repertoire of CD49a+ ‘tumor-retained’ cells, could be induced by exposure of cNKs to recombinant TGF and/or exvivo. Culture with TGF , but not , caused the upregulation of CD49a, however CD11b expression did not change (Supplementary Fig. 10A). Culture with either TGF or , alone, or in combination, diminished NK cell production of CCL5 upon restimulation, while complete loss of IFN expression required both TGF and exposure (Fig. 4A, Supplementary Fig. 10B). However, no alteration in granzyme A or granzyme C production was observed, indicating that the full spectrum of changes associated with the NK cells retained within tumors could not be recapitulated in vitro.
While we could partially recapitulate NK phenotype and functional changes in vitro, to further define the cues that modulate intratumoral NK cells we turned to in vivo approaches, reasoning that these would better model the complex TME. To investigate the role of TGF in driving changes to NK cells within the tumor, we sought to deplete intratumoral Tregs, given these are a critical source of TGF . Since NK cells can express CTLA4 and CD25 , we utilized anti-OX40 Abs, which efficiently deleted the FoxP3+ CD4 T cells within the tumor while leaving NK cells intact (Supplementary Fig. 10C-E). However, depletion of intratumoral Tregs did not alter the proportions of NK cells differentially expressing CD49a or CD11b (Supplementary Fig. 10F). No differences in IFN , granzyme A or granzyme C production were detected, although CCL5 production was significantly enhanced by Treg-depletion (Supplementary Fig. 10G).
To investigate the impact of tumor cell-derived cells deficient COX-1 and COX-2 (encoded by Ptgs1/Ptgs2, termed MC38 ) were grafted on the flank of C57BL/6 Kaede mice and the NK cell compartment compared with that of MC38 tumors (Fig. 4B). Despite impaired tumor growth of the MC38 cells (Fig. 4C), the proportion of NK cells was not significantly altered, and the retention of NK cells only modestly impacted (Fig. 4D-F). While the proportion of the NK cell subsets defined by CD49a and CD11b expression were unchanged, significant differences in CCL5 and granzyme C production were observed, indicating a partial effect on NK cell phenotype and function (Fig. 4G, H).
Hypoxia is a common feature of solid tumors and has been linked with the altered NK cell effector functions . To explore the potential effects of hypoxia on NK cells, we first repeated our in vitro cultures at 1% oxygen, however, only very modest changes in integrin and granzyme expression were observed (Supplementary Fig. ). To specifically test the role of HIF-1 in restraining NK cell functions within the tumor, we generated xHif1a x Kaede mice and grafted these, alongside cre-negative littermate controls with MC38 tumors (Fig. 4I). Tumors were photoconverted on day 12 and analyzed 48 h later after ex vivo stimulation. Conditional deletion of HIF-1 expression in NK cells failed to significantly impair tumor growth (Fig. 4J) and
Fig. 3 | NK cells rapidly change chemokine, cytokine and granzyme production within 24 h of entering the TME. Flow cytometry was used to validate changes to the function of NK cells isolated from MC38 tumors at 24 h post photoconversion. A Proportion of NK cells producing CCL5 after ex vivo stimulation, with representative histograms alongside enumeration ( ). B Proportion of NK cells producing IFN after ex vivo stimulation, with representative histograms alongside enumeration ( ). C Reporting of mKate 2 in using fnycre reporter mice, with T cells versus NK cells isolated from MC38 tumors assessed. Representative histograms and the proportion of mKate2+ cells shown. Representative histograms showing proportion of NK cells producing (D) granzyme A, (E) granzyme C, (F) granzyme B, (G) CD107a, (H) Perforin in MC38 tumors that were photoconverted and analyzed 24 h later. Data pooled from 2 independent experiments ( ) for all
analyses except CD107a expression where from 1 independent experiment. I Cartoon showing experimental setup whereby CD11b + and CD49a + NK cells from MC38 tumors were FACS-isolated and co-cultured with B16-F10 melanoma cells pre-treated with cell trace violet that were then stained for cell viability. J NKmediated target cell killing comparing cytotoxicity between FACS sorted CD11b+ and CD49a+ NK cells ( ). Significance was determined by two-way ANOVA with Šidák’s multiple comparison test (A, B, and D-H) comparing means to Kaede Green+ CD11b+ cells, or between groups (J), and a Kruskal-Wallis test with Dunn’s multiple comparison test (C). Data are presented showing all individual data points as well as the mean value SD. In all experiments ‘ ‘ defines a single tumor on an individual mouse, i.e., refers to 3 mice each with a single tumor.
Fig. 4 | Multiple mechanisms in the TME drive the conversion of cNK cells to a tumor-retained CD49a+ state. The role of TGF and HIF-1 were investigated in vitro and in vivo as mechanisms promoting NK cell differentiation to the tumor retained state characterized by CD49a expression and disrupted core functions. A Bar chart showing proportion of CD11b + and CD49a + NK cells after 48 h in culture in RPMI with IL-2/IL-15 further supplemented with TGF- and/or DiPGE . B Cartoon summarizing experimental design for impeding tumor produced . Kaede mice were grafted with either MC38 ( ) or MC38 (MC38 ) cells, photoconverted on D12 and analyzed 48 h later. C Tumor weight. D Enumeration of NK cells per mg tumor. E Flow cytometry plots showing Kaede Green versus Kaede Red expression by NK cells. F Proportion of NK cells expressing Kaede Red label 48 h post photoconversion. G Proportion of NK cells in CD11b+CD49a-, CD11b- CD49a- and CD11b- CD49a+ subsets. H Proportion of NK
cells producing CCL5, IFN , granzyme A, granzyme C after ex vivo restimulation. I Cartoon summarizing experimental design for targeting Hifla within NK cells, using Ncr1 x Hif1 x Kaede mice (NK-HIF1 KO ) versus cre-negative littermates (NK-HIF1 WT ) grafted with MC38 tumors, photoconverted on D12 and analyzed 48 h later. J Tumor weight. K Enumeration of NK cells per mg tumor. L Flow cytometry plots showing Kaede Green versus Kaede Red expression by NK cells. M Proportion of NK cells expressing Kaede Red label 48 h post photoconversion. N Proportion of NK cells in CD11b+ CD49a-, CD11b- CD49a- and CD11bCD49a+ subsets. O Proportion of NK cells producing CCL5, IFN , granzyme A, granzyme C after ex vivo restimulation. Statistical significance was determined by unpaired tests ( ) or two-way ANOVA with Šidák’s multiple comparison test comparing group means ( ). Data are presented showing all individual data points as well as the mean value +/- SD.
while there was a modest increase in the number of NK cells in the tumor (Fig. 4 K ), no differences in the % of KR+ NK cells, the proportion of NK cell subsets, nor production of CCL5, IFN , granzyme A or granzyme C was detected (Fig. 4L-O).
Collectively, these data recapitulate published observations regarding the role of TGF and in altering NK cell function, particularly CCL5 production. However, numerous signals, rather than a
single mechanism appear to cause the full array of changes characteristic of NK cells that become retained within murine tumor models.
NK cells in human colorectal cancer show loss of effector functions
Having demonstrated across multiple murine cancer models that the NK cells retained within tumors become dysfunctional, we sought
Fig. 5 | NK cells in human CRC show loss of effector functions. Evidence for dysfunctional NK cells within human CRC was sought through bioinformatics analysis of publicly available data sets alongside flowcytometric analysis of primary human CRC samples. A UMAP of 3521 NK cells from scRNA-seq of 62 human CRC samples, from GSE178341. B Expression of selected marker genes for clusters shown in ‘A’. C Expression of ITGAM and ITGA1 in NK1 subsets. D Granzyme and perforin gene expression in NK1 subsets, in tumor (T) versus normal adjacent (N) tissue. E Gene set enrichment for KEGG Natural killer cell-mediated cytotoxicity between NK1 clusters. F Gaussian kernel density embedding of cells in CRC tumors by tumor staging, and (G) lymph node (LN) metastases. H Representation flow plots depicting the frequency of CD49a+ and CD11b+ NK cells across PBMC, unaffected colon tissue and CRC primary tumor for the same donor. I Bar plot showing the
frequency of CD11b+ CD49a-, CD11b- CD49a- and CD11b- CD49a+ NK cells across compartments. J Ratio of CD11b+ CD49a- to CD11b- CD49a+ NK cells across tissue compartments. K Representative histograms showing expression of selected markers on tumor infiltrating NK cell subsets. L Bar plots depicting geoMFI values for specific markers in tumor infiltrating NK cells. Statistical significance was determined by: (E) two-sided Wilcoxon rank-sum test, data are shown as box (median; box, 25th percentile and 75th percentile; whiskers, 1.5*inter-quartile range) and violin plots, (I) two-way ANOVA with Tukey’s multiple comparison test, and (J, L) Friedman test with Dunn’s multiple comparisons test. Data are presented showing all individual data points as well as the mean value +/- SD. H-L describe data from 10 patients with colorectal cancer, where and ‘ ‘ defines an individual patient.
evidence that NK cells undergo a comparable transition in human tumors. Deconvolution of immune cells from bulk transcriptomes of 521 human colorectal cancers indicated that NK cells are present in colorectal tumors, but most adopt a “resting”, non-activated state (Supplementary Fig. 11A, B) . To precisely characterize their phenotype, we re-analyzed scRNA-seq of human colorectal tumors , including 3521 NK cells from 62 patients (Fig. 5A, Supplementary Fig. 11C, D). Among these, the majority were FCGR3A-expressing, SELLnegative, CD3D-negative cells (termed “NK1”), which are the CD56 CD16+ cytotoxic NK cell subset in humans (Fig. 5B). Within NK1 cells, unbiased clustering revealed 3 distinct cell states, including an ITGAM-expressing NK1-1 subset, an ITGA1-expressing NK1-3 subset, and a double-negative NK1-2 subset, similar to our observations in murine tumors (Fig. 5C). Expression of several granzymes (GZMB, GZMH, GZMM), perforin (PRF1), and gene signatures representing NK cytotoxicity and activation were enriched on NK1-1 but downregulated in NK1-2 and NK1-3 (Fig. 5D, E, Supplementary Fig. 11E). This is consistent with our observations in mice, where resident CD49a+ cells rapidly downregulate cytotoxicity and activation markers compared to newly infiltrating CD11b+ cells. Moreover, there was reduced expression of PRF1 and NK cytotoxicity genes in tumor-infiltrating NK cells versus adjacent normal colorectal tissue, further suggesting a loss of anti-tumor NK cell function (Fig. 5D, Supplementary Fig. 11F). The ITGAM-expressing subset more closely associated with early-stage T1-3 tumors, while the ITGA1-expressing were enriched within advancedstage T4 tumors or tumors that had progressed to disseminate lymph node metastases (Fig. 5F, G). Finally, we compared the DEGs between Itgam-expressing and Itga1-expressing tumor NK cells in this human CRC data with our original murine NK cells from MC38 tumors. This analysis identified 184 DEGs, which included Ccl5, Ifng Il2rb, Tnfrsf1b and Eomes as genes upregulated in the CD11b+ NK cells and Cd96, Cd160, Havcr2, Klrg1, Tbx21, Gzmc as genes upregulated in the CD49a+ NK cells (Supplementary Fig. 11G, Supplementary Data 1).
Thus, a spectrum of NK cell transcriptional states, comparable to that observed in murine tumor models, was evident in human CRC. These data are consistent with recent transcriptomic analyses across multiple human tumors, which identified tumor-associated NK cells with impaired effector functions and that associated with unfavorable prognosis . To validate these phenotypes at the protein level, we compared NK cells in peripheral blood, with those obtained from unaffected colon and primary CRC. Analysis of paired tissue samples from 10 patients with CRC demonstrated a clear shift from predominantly CD11b + NK cells in blood to more CD49a+ NK cells in the tumors, while normal colon was dominated by NK cells expressing neither CD11b nor CD49a (Fig. 5H-J, Supplementary Fig. 12). Deeper characterization of the phenotype of NK cell subsets within the tumor showed a lower expression of the cytotoxicity-mediating molecules granzyme B and perforin as well as CD16 within the CD49a+ subset (Fig. 5K, L). This was paralleled by higher expression of NKG2A and the tissue-residency markers CD103 and CD69 on CD49a+ NK cells.
Collectively, these data demonstrate the presence of a CD49a+ subset of NK cells with features of tissue residency that lacks the expression of cytotoxic proteins within the CRC TME.
Enhanced IL-15 signaling drives formation of a distinct cytotoxic intratumoral NK cell population
Our analyses above demonstrate that cNK cells recruited into the tumor rapidly become dysfunctional, both in their cytotoxicity and their capacity to recruit and activate DC in the tumor. While depletion of NK cells prior to establishing lung metastases has been reported to result in a significant increase in disease burden , we questioned whether the dysfunctional NK cells that form in established tumors continued to contribute to the control of tumor growth. To test this, MC38 tumors were established in WT mice and then NK cells were depleted using anti-NK1.1 Abs, administered from 6 days of tumor growth. Highly efficient NK cell depletion was achieved within the tumor; however, the loss of intratumoral NK cells in established tumors did not alter growth across different tumor models (Supplementary Fig. 13A-G), even in the absence of T cells (Supplementary Fig. ). These data are consistent with the conclusion that intratumoral NK cells fail to meaningfully contribute to the anti-tumor response due to the rapidly acquired dysfunctional state.
Finally, we sought approaches that could block or reverse the loss of NK cell function imprinted by residence in the TME and thus support enhanced anti-tumor responses. IL-15 drives the differentiation and activation of both T and NK cells . Initial patient data suggest that the response to IL-15R agonizts is associated with NK cell and CD8+ T cell expansion and increased IFN production. However, it is unclear how IL-15R agonism enhances NK cell anti-tumor responses or the potential recruitment of NK cells into solid tumors. To determine whether enhanced IL-15 signaling resulted in the maintenance of NK functions normally disrupted by adaptation to the TME, tumor bearing mice were treated with complexes of IL-15:IL-15Ra, since these complexes have a significantly enhanced activity versus recombinant IL-15 alone. We tested these complexes, administered at D7 and D12 of tumor growth, both prior to and concurrent with photoconversion, in multiple tumor models (Fig. 6A). BALB/c Kaede mice bearing CT26 tumors showed significantly enhanced tumor control with treatment (Fig.6B). Analysis of the intratumoral NK cell compartment revealed striking differences in integrin expression following administration of IL-15:IL15Ra complexes (Fig. 6C). Surprisingly, treatment resulted in the majority of the NK cells expressing CD49a, however we also observed the emergence of a CD49a+CD11b+ population barely detectable in the PBS controls (Fig. 6D). To ask whether IL-15:IL-15Ra complexes caused the emergence of CD49a+ CD11b+ cells after entry into the tumor, or if these cells were formed in the periphery and trafficked into the tumor, we photoconverted tumors and compared the % KR expression within different intratumoral NK cell subsets. Treatment did not cause a significant difference in the total proportion of cells in the tumor (Fig. 6E). Analysis of the NK cell subsets defined by
CD49a versus CD11b expression revealed that the vast majority of CD49a+CD11b+ NK cells were KR+, demonstrating that this subset emerged over time in the tumor, rather than arising from cells trafficking into the tumor (Fig. 6F). Analysis of NK cell functions revealed that the expanded CD49a+ CD11b- and CD49a+ CD11b+ populations observed after IL-15:IL-15Ra treatment had robust expression of perforin and granzymes A, B, and C (Fig. 6G). Enhanced IL-15 signaling also
significantly increased CCL5 production, in the absence of dramatic changes in NKG2A expression (Fig. 6G). Comparable data was observed in both MC38 and B16-F10-OVA tumors after IL-15:IL-15Ra treatment (Supplementary Fig. 14). Finally, since enhanced IL-15 signaling impacts both CD8 T cells and NK cells, we sought to determine the NK cell contribution to the enhanced control of tumor growth after treatment. BALB/c Kaede mice bearing CT26 tumors were split into
Fig. 6 | Administration of IL15:IL15R complexes result in enhanced tumor control and the formation of CD49 + CD11b + intratumoral NK cells with heightened functions. To block loss of NK cell functions within the tumor, BALB/c Kaede mice bearing CT26 tumors were treated with IL-15:IL-15Ra complexes. A Cartoon showing experimental design. B Growth curves for CT26. C Representative flow cytometry plots expression of CD49a versus CD11b by NK cells (CD3-NKp46+ ). D Proportion of NK cells with CD11b+ CD49a-, CD11b- CD49a-, CD11b- CD49a+, CD11b+ CD49a+ phenotype. E Representative flow cytometry plot showing Kaede Green versus Kaede Red expression by total NK cells alongside enumeration of % Kaede Green+ NK cells. F Proportion of Kaede Red+ cells within CD11b+CD49a-, CD11b- CD49a-, CD11b- CD49a+, CD11b+ CD49a+ subsets of NK cells. Data pooled from 3 independent experiments, (cumulative totals: PBS , IL15:IL-15Ra ). G Representative histograms and enumeration of granzyme A,
granzyme B, granzyme C, perforin, CCL5, and NKG2A (MFI) after ex vivo stimulation (data from 1 of 3 experiments shown, PBS and IL-15:IL-15R ). H Cartoon showing experimental design for CD8 T cell depletion in combination with IL-15:IL-15Ra complexes (PBS , PBS + anti-CD8 , IL-15:IL anti-CD8 ). I Tumor growth curve for experiment illustrated in (H). J Total number of NK cells per mg tumor. Statistical significance was determined by two-way ANOVA with Šidák’s multiple comparisons test (B,D,F,G and I), unpaired test (E), or one-way ANOVA with Tukey’s multiple comparisons test (J). Data are presented showing all individual data points as well as the mean value +/- SD, except (B, I) where mean value +/- SEM are shown. In all experiments ‘ ‘ defines a single tumor on an individual mouse, i.e., refers to 3 mice each with a single tumor.
PBS or IL15:IL-15Ra treatment groups, and then further divided into groups receiving isotype control or anti-CD8 Abs to specifically deplete the CD8 T cell compartment (Fig. 6H). Administration of IL-15:IL-15Ra complexes combined with isotype control Abs mediated the greatest control of tumor growth, while CD8 T cell depletion resulted in faster tumor growth than in PBS control mice given isotype Abs (Fig. 6I). Depletion of CD8 T cells in combination with IL-15:IL-15Ra complexes improved tumor control versus PBS/anti-CD8 Abs, consistent with a distinct NK cell and CD8 T cell contribution to anti-tumor responses. Effective depletion of CD8 T cells was confirmed by analysis of IFN producing T cells within the tumor (Fig. 6J).
Combined these data reveal that enhanced IL-15 signaling is able to block the loss of core NK cell functions that occurs as cNK cells adapt to the TME. Administration of IL-15:IL-15Ra complexes results in the emergence of a distinct CD49a+ CD11b+ NK cell compartment, not normally present within tumors, that retains a highly cytotoxic profile and contribute to improved tumor control.
Discussion
Here, we exploit the site-specific temporal labeling afforded by Kaede photoconvertible mice to determine how NK cells change over time spent within the TME. Multiple studies have described the presence of a distinct CD49a+ NK cell population within murine and human tumors . Our data establishes that this population can be rapidly formed from cNK cells recruited from the circulation that then respond to conditions within the tumor to develop a tumor-retained state, distinct from that of circulating cNK cells or ILC1s within lymphoid or non-lymphoid tissues. Adaptation to the TME bears hallmarks of tissue-residency, including CD49a and CD69 expression, alongside the loss of the basic cNK effector functions of efficient cancer-cell killing and the recruitment and activation of DCs. Having defined the end-state of NK cell differentiation within tumors, we sought to determine the mechanisms that drive these changes. Manipulation of or the transcription program controlled by HIF- , was insufficient to drive the full array of changes that define tumorretained NK cells, implying that the coordinated action of multiple signals orchestrates this fate. The loss of NK cell functions within the tumor could be prevented through enhanced IL-15 signaling, which pushed intratumoral NK cell differentiation towards a hybrid state defined by high CD49a expression, but also enhanced effector functions. Collectively, these data provide insight into how NK cells change upon recruitment into tumors, the rate at which this occurs, and their likely functions within the TME.
Particularly striking within our data, was the speed at which cNK cells entering the tumor lost core effector functions. While cNK cells appear to be continuously recruited into the tumor, 24 h within the growing tumor was sufficient for extensive transcriptomic reprogramming. By establishing the rate at which NK cells change, our data indicates that increasing the contribution of innate effector cells within the tumors may depend on over-riding mechanisms operating within the TME, rather than simply enhancing recruitment. Our data
further suggests that cellular therapies such as CAR NK cells may be less efficient than hoped in solid cancers and rapidly ‘turned-off’, if efforts to over-ride tissue-adaptation mechanisms are not appropriately considered. NK cell chemokine and cytokine production appear particularly sensitive to signals within the TME. CCL5 production was lost in vitro in the presence of either recombinant TGF or , and could be enhanced in vivo upon targeting either intratumoral Tregs or tumor cell derived . While cNK cells are potent producers of IFN , newly developed Ifng reporter mice indicate that intratumoral NK cells, regardless of their integrin expression, express very little of this key effector cytokine.
A complete mechanistic understanding of how the tumorretained state is established within the tumor eluded us. Local signaling by TGF is well established in driving tissue-residency in both NK cells and CD8 T cells . However, our data indicate that TGF signaling alone is insufficient to account for all the changes observed within the retained NK cell compartment, including the clear switch in granzyme production. Surprisingly, the predicted changes in transcription factor regulons over time failed to identify any upregulated pathways that might drive the transition to the CD49a+ state. Expression of Hifla over pseudotime was evident, however, its targeted deletion in NK cells failed to change NK cell fate within the tumor models we assessed. Currently, our data points to conditions within the TME resulting in a dampening of many pathways that drive NK cell activation and expansion. Precisely how this is orchestrated remains an outstanding question.
Whether the CD49a+ NK compartment actively contributes to the anti-tumor response, or perhaps even impedes it, is worthy of further investigation, particularly since our data argues that this is the fate of all NK cells retained within the tumor. While we have concentrated on the loss of effector functions, in silico prediction of cellular interactions suggest that the CD49a+ NK cells may support other innate populations that inhibit the response. Detailed analysis of where the CD49a+ NK cells reside within the tumor and whether specific niches foster these cells could provide further insight into how these cells are sustained and their potential roles. Future studies of how changes in NK cell function are regulated should also consider whether the conversion of cNK to a tumor-retained state is reversible and the extent to which epigenetic changes underpin this transition.
We initiated these studies of the intratumoral NK cell compartment to better understand how this population was formed and the potential contribution of tissue-resident ILCs. Our data demonstrate that in multiple commonly used tumor models, the CD49a+ NK compartment is derived almost exclusively from cNK cells recruited from the circulation. Although the time frame afforded by photo-labeling is too short to fully assess tissue-residency, CD49a+ intratumoral NK cells also upregulated CD69, consistent with becoming resident within the tumor. Multiple studies in both mouse and human have previously linked CD49a expression with tissue-residency . Importantly, in our data, this population remains transcriptionally distinct from the limited bona fide ILC population we could detect. Our interpretation is
that cNK cells establish a ‘tumor-retained’ state that can be partly defined by CD49a expression, rather than ‘converting’ into ILC1s . At the cellular level, we struggled to identify a clear CD127+ ILC population by flow cytometry in any of the syngeneic cell line tumor models, limiting further investigation. The lack of CD127+ ILCs within these syngeneic tumors likely reflects the propagation of these tumors within a ‘space’ under the skin, rather than a specific tissue with an associated ILC compartment. Recent studies used fate-mapping of S1pr5 expression to conclude that most intratumoral CD49a+ innate lymphocytes were not derived from cNK cells . Here, a spontaneous MMTV-PyMT breast tumor model was utilized and the presence of ILCs within the mammary fat pad, may explain the differences observed compared with our tumor models. Of note, while ILCs were largely absent from CT26 tumors grown subcutaneously, a CXCR6+ EOMES- ILC population that expressed granzyme C was evident within orthotopic CT26 tumors, again suggesting that the tissue site matters. Further studies using fate-mapping of S1pr5 and Gzmc, alongside other approaches to distinguish NK and ILC1 such as Rora reporting , should be employed across the multiple murine cancer models to further resolve contribution of differentiating cNKs cells versus tissueresidents ILCs.
Having defined the immunological cost of NK cells adapting to the TME, we sought to identify interventions that could limit or block the loss of key functions. IL-15 promotes NK cell survival, proliferation, and cytotoxicity, and therapeutically enhanced IL-15 signaling, alone or in combination with other targets such as PD-L1, is currently being trialed . Provision of IL-15 within the TME likely involves CCR7+ DCs, which express high levels of IL-15 and IL-15RA, co-localize with NK cells in human cancers and can support further molecular interactions such as PVR:TIGIT . Therapies utilizing IL-15R agonizts (ALT-803 and NIZ985) are currently being trialed alone or in combination with ICB (NCT02523469, NCT02452268, NCT03228667, NCT03520686, NCT05096663) and have shown some initial promise in patients that have previously relapsed from immune checkpoint inhibitor treatment . While recombinant IL-15 failed to impact tumor growth in our hands, IL-15:IL-15Ra complexes which drive superior in vivo signaling , were able to consistently curtail tumor growth in multiple cancer models. Common to all the treated tumors was the upregulation of CD49a expression on intratumoral NK cells, enhanced CCL5 production, and increased granzyme and perforin expression consistent with heightened cytotoxicity and their contribution to the enhanced anti-tumor response. Depletion of CD8 T cells within these tumors indicated a contribution from the revived NK compartment alongside a heightened CD8 T cell response. While systemic administration of IL-15:IL-15Ra complexes did drive splenomegaly, due to peripheral expansion of peripheral NK and CD8 T cell populations , our data indicates that treatment promoted both a tissue-resident phenotype and superior effector function for NK cells specifically within the tumor. Previous studies have identified that the combination of IL-15 and TGF signaling synergized in driving a tissue-resident phenotype defined by CD49a, CD69 and CD103 . Our data highlights that the strong activation driven by IL-15:IL-15Ra complexes sustains heightened effector functions despite seemingly promoting aspects of a tissue-residency program.
In summary, here we have provided a detailed map of how circulating NK cells respond to the TME and their fate within this tissue. These studies highlight how quickly immune cells can become dysregulated within the TME and can support the design of therapeutic approaches designed to revive the innate arm of the anti-tumor response and enhance tumor control.
Methods
Study design
The main aims of this study were to understand how the NK cell compartment of tumors was formed, determine the mechanisms
controlling the fate of NK cells within the tumor and to identify approaches to manipulate NK fate and function within the tumor. We sought to define the fate of NK cells entering the tumor from the circulation through site-specific temporal labeling of the entire immune compartment of tumors. This was achieved using syngeneic tumor cell lines grafted into transgenic mice expressing green photoconvertible proteins which, when exposed to violet light, switched to a red fluorescence that could then be detected for a number of days post photoconversion. Tumors were colonized by the host immune cells (which were ‘green’) and by labeling all the immune cells within the tumor at a given moment in time (i.e., turning them ‘red’), we could distinguish retained and newly entering cells to then unpick the fate of cells over time in the tumor. We use time course experiments and a combination of single-cell RNA-sequencing, to unbiasedly capture transcriptomic changes, followed by flow cytometry to validate these changes at the protein level. Building from this characterization, we then investigated the mechanisms causing the changes in NK cell phenotype and function as well as interventions that could alter the changes that occurred in NK cells after entering the tumor.
Mice
Female C57BL/6J mice, aged 6-8 wks were purchased from Charles River (Strain code 632) and allowed to acclimatize to the University of Birmingham Biomedical Services Unit for a week prior to use in experiments. Rag2 mice (JAX, strain code 008449) were bred at the University of Birmingham Biomedical Services Unit. C57BL/6 Kaede and BALB/c Kaede mice are maintained and bred at the University of Birmingham Biomedical Services Unit. Hif1a Ncr1 mice (kindly provided by Dr. Christian Stockmann, University of Zurich, Switzerland) were crossed with C57BL/6 Kaede mice and maintained at the University of Birmingham Biomedical Services Unit. Ifng mice were generated by Taconic and maintained at the University of Birmingham Biomedical Services Unit. For all mice generated and maintained at the University of Birmingham Biomedical Services Unit, both male and female mice were used in experiments, although within an experiment, mice were sex-matched. Across the project, experimental mice were aged between 8 and 18 weeks. Animals were maintained under specific pathogen-free conditions and used in accordance with Home Office Guidelines under a Project License awarded to D.R. Withers and approved by the University of Birmingham Animal Welfare and Ethical Review Body. Control animals were co-housed. Mice were killed by cervical dislocation at the end of the experiment.
Generation of Ifng reporter mice
C57BL/6NTac-Ifng mice were generated by Taconic, An improved Cre (iCre) and the far-red fluorescent reporter mKate2 were inserted into the Ifng locus immediately after exon 4, flanked by T2A and P2A self-cleaving peptides.
Mouse tumor models
MC38 (kindly provided by Dr. Gregory Sonnenberg, Weill Cornell Medicine, New York, NY), MC38-Ova (obtained from AstraZeneca), CT26 (kindly provided by Professor Tim Elliot, University of Oxford, Oxford, UK), MC38 (kindly provided by Dr Santiago Zelenay, University of Manchester, Manchester, UK) murine colon adenocarcinoma cells, and B16F10-Ova (obtained from AstraZeneca) murine melanoma cells were cultured in RPMI supplemented with 2 mM L-glutamine (#21875034 Thermo Fisher Scientific), 10% FBS (#F9665 SigmaAldrich), and penicillin-streptomycin (#P4333 Sigma-Aldrich). EO771 (kindly provided by Dr. Fedor Berditchevski, University of Birmingham, Birmingham, UK), and 4T1 (obtained from AstraZeneca) mammary carcinoma cells were cultured in DMEM supplemented with 2 mM L-glutamine (#21875034 Thermo Fisher Scientific), 10% FBS (#F9665 Sigma-Aldrich), and penicillin-streptomycin (#P4333 SigmaAldrich). All cells were cultured at with before being
harvested and suspended in Dulbeccos’ PBS (#D8662 Sigma-Aldrich) for tumor injection. , or EO771 tumor cells were injected in into the mammary fat pad of female mice under anesthesia via gaseous isoflurane. (CT26, MC38, MC38Ova, MC38 ), or B16-F10-Ova tumor cells were injected in subcutaneously into the pre-shaven left flank under anesthesia via gaseous isoflurane. For orthotopic CT26 injections, CT26 tumor cells were injected in PBS into the colonic wall using an endoscope fitted with an integrated multi-purpose rigid telescope (Karl Storz Endoskope) under anesthesia via gaseous isoflurane. Tumor size was periodically measured with a digital Vernier caliper, and the volume was calculated using the formula in cubic millimeters, where L represents the longest diameter and W the perpendicular diameter to L for the tumor. Tumor weights were measured at the endpoint of the experiment. Mice were sacrificed 5 h , , or 72 h post-photoconversion and tumors were harvested for analysis.
Cell depletion
Depletion of NK cells and CD8+ T cells was achieved by administering anti-NK1.1 (PK136, ) or anti-CD8 , or InVivoMab mouse IgG2a isotype control (BioXCell, C1.18.4, ), or InVivoMab rat IgG2a isotype control (BioXCell, 2A3, ) in PBS via intraperitoneal injection every 3 days beginning on day 6 post tumor engraftment. Depletion of Tregs was achieved by administering antiOX40 (OX86, ), or PBS via intraperitoneal injection on day 7 and 11 of tumor growth. Anti-NK1.1, anti-CD8 , and anti-OX40 antibodies were provided by AstraZeneca.
Administration of IL-15:IL-15R complexes
rlL-15 (#210-15, Peprotech) and rlL-15R (#551-MR-100) were reconstituted in PBS at a ratio of 1:5 and incubated at for 30 min to form IL-15:IL-15R complexes. IL-15 complexes ( rIL-15:12.5 rlL ) were administered via intraperitoneal injections on day 7 and 12 of tumor growth.
Splenic NK cell transfer
NK cells were enriched from the spleens of C57BL/6 Kaede mice using NK Cell Isolation Kit (#130-115-818, Miltenyi Biotec) as per manufacturer’s instructions. Approximately splenic NK cells were transferred via intravenous injection into MC38 tumor bearing C57BL/ 6 mice 12 days after tumor engraftment, tissues were then collected 3 days later.
Tumor compartment photo-labeling
Upon reaching in diameter both subcutaneous and mammary fat pad injected tumors were exposed to a wavelength focused LED light (Dymax BlueWave QX4 fitted with 8 mm focusing lens, DYM41572; Intertronics) using 9 cycles of 20 s light exposure with a 5 -s break interval between each cycle, at a fixed distance. Black medium density fiberboard was used to shield the remainder of the mouse.
Tissue dissociation
Tumors were processed as described previously Zhi et al. In short, tumors were cut into small pieces and enzymatically digested using Collagenase D (#11088882001, Roche), and DNase I (#101104159001, Roche) at for in a heat block shaker set to 1000 rpm . Samples were then filtered through a cell strainer, centrifuged for 5 min at 400 g and and resuspended in staining buffer ( FBS and 2 mM EDTA in PBS).
Spleens were crushed through a strainer, then incubated with Gey’s red blood cell lysis solution on ice for 5 min . Cells were harvested by centrifuging samples at 400 g for 5 min at before resuspending cell pellets in staining buffer. Lymph nodes were collected, cleaned of fat, then cut into little pieces before incubating in Collagenase D and DNase I for in a heat block shaker at 1000 rpm for 20 min . Samples were passed through a strainer, centrifuged at 400 g and for 5 min before resuspending the cell pellet in staining buffer. Livers were cut into small pieces and pressed through a , then washed through a strainer with RPMI. Liver suspensions were layered on top a 67% OptiPrep (#07820, STEMCELL Technologies) solution and centrifuged at 1000 g for 25 min before collecting the interphase layer enriched for immune cells. Samples were washed again with RPMI, then centrifuged for 5 min at 400 g and before finally resuspending in staining buffer. Lungs were washed, cut into pieces before incubating tissue in Liberase ( , Roche) and DNase I for 45 min at . Samples were passed through a , then washed through a strainer with RPMI. Cells were pelleted by centrifuging at 400 g and for 5 min , then cell pellets were resuspended in Gey’s solution and incubated on ice for 5 min . Samples were centrifuged for 5 min at 400 g and before resuspending cell pellets in staining buffer. The small intestines were processed as described previously , briefly, fat and Peyer’s patches were removed for the small intestine, before cleaning internal contents and cutting tissue into small piece in Hank’s Balanced Salt Solution (HBSS) (#55037 C, Sigma-Aldrich) containing 2% FBS. Next, the small intestines were shaken vigorously in HBSS with 2 mM EDTA before incubating samples at for 20 min , then filtering through a nitex mesh, and washing thoroughly with HBSS. Samples were incubated with collagenase VIII (#C2139, Sigma-Aldrich) and DNase for 15 min , filtered through a , and then strainer before being centrifuged at 400 g and for 5 min , and finally resuspended in staining buffer. Large intestines were processed similarly but digested in Collagenase V (#C9263, Sigma-Aldrich), Collagenase D, Dispase (#17-105-041, Gibco), and DNase at for 45 min . Large intestines were then processed as per washing and straining steps used for small intestines, and finally cells were resuspended in staining buffer for use. All incubations were done in a shaking incubator set to 300 rpm.
In vitro assays
To assess NK cell mediated target cell killing, B16F0-Ova melanoma tumor cells were co-cultured with FACS NK cells as described previously . B16F10-Ova cells were incubated with Cell Trace Violet (#C34557, Invitrogen) for 15 min at , washed in RPMI and centrifuged at 350 g for 5 min before plating cells in complete RPMI supplemented with FBS and 2 mM L-glutamine. FACS sorted CD11b+ or CD49a+ NK cells from MC38 tumors were added to achieve 1:10, 1:20, and 1:40 Effector: Target ratios. Cells were cocultured for 4 h at and .
To evaluate effect of and TGF- on NK cell phenotype and function, splenic NK cells were MACs enriched and cultured at and in RPMI containing 300U rIL-2 (Peprotech), (Peprotech) and either 0.1% DMSO (Sigma) or further supplemented with either TGF- 16,16-Dimethlyprostaglandin E2 ( ), or both TGF- and DiPGE combined. NK cells were cultured for 48 h before restimulation with PMA and Ionomycin and subsequent flow analysis. In hypoxia experiments, MACs enriched NK cells were cultured with DMSO, TGF- , or DiPGE as above or in a hypoxia chamber in parallel.
Flow cytometry
To assess cytokine, granzyme and perforin production, cells were stimulated in Phorbol 12-myristate 13-acetate (PMA, #P1585, Sigma-Aldrich) and ionomycin (#I0634, Sigma-Aldrich) for 4 h and in the presence of brefeldin A (#B6542, Sigma-Aldrich) added after the first hour. To assess cellular degranulation cells were stimulated like before, but Monensin (#420701, BioLegend) was used in place of Brefeldin A, and CD107a was added for the duration of
the stimulation culture. Single cell suspensions underwent Fc blocking with anti-CD16/32 (2.4G2, BioLegend) in staining buffer on ice for 15 min before staining surface antigens in staining buffer on ice for 35 min . Cells were then fixed with BD CytoFix fixation buffer (#554655, BD Biosciences) on ice for 45 min before staining for intracellular markers overnight diluted in eBioscience permeabilization buffer (#00-8333-56, Thermo Fisher Scientific). Secondary intracellular staining to label Granzyme A and CCL5 was performed at room temperature for 45 min . Samples were transferred into staining buffer, with the addition of counting beads (#ACBP-100-10, Spherotech) being acquiring data on a BD LSR Fortessa X-20 (BD Bioscience) using FACSDiva 8.0.2 software (BD Bioscience) and analyzed with FlowJo v10 (BD Bioscience). Surface and intracellular antibodies used were against the following mouse antigens: CCL5 purified (1:200, Goat IgG, R&D Systems), CD107a BV786 (1:200, clone 1D4B, BioLegend), CD11b PE-Dazzle594 (1:300, clone M1/70, BioLegend), CD200r1 APC (1:200, clone OX-110, BioLegend), CD3 BV711 or BUV737 (1:200, clone 17A2, BioLegend), CD45 FITC or BV510 (1:200, clone 30-F11, BioLegend), CD49a BUV395 (1:200, clone RM4-5, BD Bioscience), CD49b BV711 (1:100, clone DX5, BioLegend), CD69 PE-Cy7 or BV711 (1:200, clone H1.2F3, BioLegend), DNAM-1 BV605 (1:200, clone TX42.1, BioLegend), EOMES PE or PE-Cy7 (1:100, clone Dan11mag, BioLegend), Granzyme A purified (1:300, clone 3G8.5, BD Biosciences), Granzyme B BV421 (1:300, clone QA18A28, BioLegend), Granzyme C PE-Cy7 (1:300, clone SFC108, BioLegend), IFN BUV737 (1:400, clone XMG1.2, BioLegend), IgG2b BV605 or R718 (1:400, clone R12-3, BioLegend), IL-7R BV605 or BV421 (1:100, clone A7R34, BioLegend), Ki-67 BV711 or AF700 (1:200, clone SolA15, BioLegend), KLRG1 BV605 (1:100, clone 2F1, BioLegend), LAG3 BV786 (1:100, clone C9B7W, BioLegend), NK1.1 BV650 or BV786 (1:100, clone PK136, BioLegend), NKG2A/C/E BV421 (1:400, clone 20d5, BioLegend), NKp46 BV650 or BV786 (1:100, clone 29A1.4, BioLegend), OX40 BV711 (1:100, clone OX-86, BioLegend), PD-1 PE-Cy7 (1:200, clone RMP1-30, BioLegend), Perforin APC (1:300, clone S16009A, BioLegend), T-bet e660 (1:100, clone eBio4B10, BioLegend), and TCR BUV737 (1:200, clone H57-597, BioLegend). AF647conjugated polyclonal donkey anti-goat IgG (1:400, catalog number #A32849, Thermo Fisher Scientific) was used to identify and amplify CCL5 staining.
Single cell suspensions were stained for antibodies raised against the following antigens: CD45 FITC (clone 30-F11, BioLegend), CD11b PEDazzle594 (clone M1/70, BioLegend), TCR BUV737 (clone H57-597, BioLegend), NKp46 BV650 (clone 29A1.4, BioLegend), and CD49a BUV395 (clone RM4-5, BD Biosciences), in addition to Live/Dead Near-IR viability stain (#L10119, Thermo Fisher Scientific). NK cells (Live CD45 CD11b , TCR CD3 ) were sorted into CD11b CD49a and CD11b cells using a FACS Aria II Cell sorter (BD Biosciences) and then used for in vitro assays. For scRNA-seq, singles cells were stained using antibodies against the following: CD45-BUV395 (clone 30-F11, BioLegend), CD11b-APC (clone M1/70, BioLegend), Ter119-PE-Cy7 (1:400, clone TER-119, BioLegend), NK1.1-BV650 (clone PK136, BioLegend). Tumor infiltrating lymphocytes (Live Ter119 ) were
sorted into two groups based on the presence of the Kaede Red, namely, G48 and R48 referring to Kaede Green 48 h and Kaede Red 48 h .
Single-cell library construction and sequencing
Gene expression libraries from were prepared from FACS-sorted populations of single cells using the Chromium Controller and Chromium Single Cell 3′ GEM Reagent Kits v3 ( 10 x genomics, Inc.) according to the manufacturer’s protocol. The resulting sequencing libraries comprised of standard Illumina paired-end constructs flanked with P5 and P7 sequences. The 16 bp 10x barcode and 10 bp UMI were encoded in read 1 , while read 2 was used to sequence the cDNA fragment. Sample index sequences were incorporated as the i7 index read. Paired-end sequencing ( ) was performed on the Illumina NovaSeq 6000 platform. The resulting.bcl sequence data were processed for QC purposes using bcl2fastq software (v2.20.0.422) and the resulting fastq files were assessed using FastQC (v0.11.3), FastqScreen (v0.9.2) and FastqStrand (v0.0.5) prior to alignment and processing with the CellRanger (v6.1.2) pipeline.
Processing of scRNA-seq
Single-cell gene expression data from CellRanger count output (filtered features, barcodes, and matrices) were analyzed using the Scanpy (v1.8.2) workflow. Doublet detection was performed using Scrublet (v0.2.1), with cells from iterative sub-clustering flagged with outlier Scrublet scores labeled as potential doublets. Cells with counts mapped to or genes were filtered. The percentage mitochondrial content cut-off was set at . Genes detected in fewer than 3 cells were filtered. Total gene counts for each cell were normalized to a target sum of and loglp transformed. There resulted in a working dataset of 46,342 cells. Next, highly variable features were selected based on a minimum and maximum mean expression of and respectively, with a minimum dispersion of 0.5. Total feature counts, mitochondrial percentage, and cell cycle scores, where indicated, were regressed out. The number of principal components used for neighborhood graph construction was set to 50 initially, and subsequently 30 for subgroup processing. Clustering was performed using the Leiden algorithm with resolution set between 0.8 and 1.0. Uniform manifold approximation and projection (UMAP, v0.5.1) was used for dimensional reduction and visualization, with a minimum distance of 0.3, and all other parameters according to the default settings in Scanpy.
Analysis of scRNA-seq from mouse tumor models
Cell types of interest were subset and re-clustered as described above. Resulting clusters were annotated using canonical marker genes. Gene set scoring was performed using Scanpy’s tl.score genes tool. Gene sets were obtained from the Molecular Signature Database (MSigDB) inventory, specifically KEGG or Gene Ontology (GO), using the R package msigdbr (v7.5.1) or published RNAseq data. Differential gene testing was performed using the Wilcoxon rank sum test with Benjamini-Hochberg multiple-testing correction implemented in Scanpy’s tl.rank_genes_groups. Trajectory analysis was performed using partition-based graph abstraction (PAGA) and diffusion pseudotime (implemented in Scanpy v1.8.2). For pseudotime analysis, the differentiation trajectory was rooted in the Kaede-green dominant cluster (NK_1), which represents the cellular subset most associated with newly entering cells. The specific root cell was selected based on the extrema of diffusion components. Calculation of differential expression across pseudotime was performed using the tradeSeq (v0.99) package . The 24 and 72 h post-photoconversion scRNAseq data was processed and analysed following the same steps above; and the data is accessible through the ArrayExpress repository (accession number E-MTAB-10176), as previously published and described . Integration and label transfer of the scRNA-seq data, cycling NK cells, and PBMCs (obtained from 10X Genomics
demonstration data: https://www.10xgenomics.com/resources/ datasets/10-k-mouse-pbm-cs-multiplexed-2-cm-os-3-1-standard-6-0-0) with the main data set was performed using Scanpy’s tlingest tool. For cycling NK cells, cell cycle regression was first performed on subset Mki67 cells using Scanpy’s pp.regress_out function, before reintegration. Transcription factor activity enrichment analysis was performed using pySCENIC (v0.12) . Cell-cell communication analysis was performed using CellChat (v1.5.0) .
Analysis of RNA-seq from human tumors
Published human CRC scRNA-seq data and accompanying metadata was accessed and downloaded from the GEO repository using the ascension number GSE178341 . The cancer genome atlas (TCGA) bulkRNAseq data of human colorectal adenocarcinoma (TCGA-COAD) was accessed using TCGAbiolinks . Cellular deconvolution was performed using the Cibersortx webtool . scRNA-seq from human colorectal tumors was analyzed using the Scanpy (v1.8.2) workflow as outlined above. Filtering for quality control was performed according to the parameters outlined in the original publication. Batch correction was performed using the Harmony algorithm (harmonypy v0.0.5) with patient ID as the batch term. Cell annotations from original publications were checked and refined using canonical marker gene expression. Gaussian kernel density estimation to compute density of cells from various conditions in the UMAP embedding was performed using Scanpy’s tl.embedding_density. Pre-ranked gene set enrichment analysis (GSEA) was implemented in fgsea (v1.24), using the Wald statistic as the gene rank metric.
Statistical analysis
Data collected were analyzed using Flow Jo 10.8.1 software (BD Bioscience) and GraphPad Prism 9.4.0. UMAPs generated in FlowJo were made using DownSampleV3 and UMAP plugins, both available on the FlowJo Exchange. scRNA-seq data was analysed in Python (v3.8.12) and R (v4.0.4) Normality was determined using the Shapiro-Wilk test. Pairs of samples were compared using an unpaired two-tailed Mann-Whitney U test. When comparing more than two sets of data, statistical significance was determined by either one-way ANOVA with Tukey’s multiple comparison test, or two-way ANOVA with Šidák’s multiple comparisons test. Two data points were identified as outliers by the ROUT method in Supplemental figure 11E-F and removed from analysis. All graphs show mean SD unless stated otherwise. Only significant differences are marked on graphs.
Reporting summary
Further information on research design is available in the Nature Portfolio Reporting Summary linked to this article.
Data availability
The scRNA-seq data generated by this study have been deposited in the GEO public repository under accession numbers GSE221064.
References
Galon, J. et al. Type, density, and location of immune cells within human colorectal tumors predict clinical outcome. Science 313, 1960-1964 (2006).
Naito, Y. et al. CD8+ T cells infiltrated within cancer cell nests as a prognostic factor in human colorectal cancer. Cancer Res. 58, 3491-3494 (1998).
Azimi, F. et al. Tumor-infiltrating lymphocyte grade is an independent predictor of sentinel lymph node status and survival in patients with cutaneous melanoma. J. Clin. Oncol. 30, 2678-2683 (2012).
Herbst, R. S. et al. Predictive correlates of response to the anti-PD-L1 antibody MPDL3280A in cancer patients. Nature 515, 563-567 (2014).
Im, S. J. et al. Defining CD8+ T cells that provide the proliferative burst after PD-1 therapy. Nature 537, 417-421 (2016).
Utzschneider, D. T. et al. T cell Factor 1-Expressing Memory-like CD8(+) T Cells sustain the immune response to chronic viral infections. Immunity 45, 415-427 (2016).
Siddiqui, I. et al. Intratumoral Tcf1(+)PD-1(+)CD8(+) T cells with stemlike properties promote tumor control in response to vaccination and checkpoint blockade immunotherapy. Immunity 50, 195-211.e110 (2019).
Sade-Feldman, M. et al. Defining T cell states associated with response to checkpoint immunotherapy in melanoma. Cell 175, 998-1013.e1020 (2018).
Trinchieri, G. Biology of natural killer cells. Adv. Immunol. 47, 187-376 (1989).
Smyth, M. J. et al. Differential tumor surveillance by natural killer (NK) and NKT cells. J. Exp. Med. 191, 661-668 (2000).
Vivier, E., Tomasello, E., Baratin, M., Walzer, T. & Ugolini, S. Functions of natural killer cells. Nat. Immunol. 9, 503-510 (2008).
Kim, S., lizuka, K., Aguila, H. L., Weissman, I. L. & Yokoyama, W. M. In vivo natural killer cell activities revealed by natural killer celldeficient mice. Proc. Natl. Acad. Sci. USA. 97, 2731-2736 (2000).
Bottcher, J. P. et al. NK cells stimulate recruitment of cDC1 into the tumor microenvironment promoting cancer immune control. Cell 172, 1022-1037.e1014 (2018).
Barry, K. C. et al. A natural killer-dendritic cell axis defines checkpoint therapy-responsive tumor microenvironments. Nat. Med. 24, 1178-1191 (2018).
Roberts, E. W. et al. Critical role for CD103(+)/CD141(+) dendritic cells bearing CCR7 for tumor antigen trafficking and priming of T cell immunity in melanoma. Cancer Cell 30, 324-336 (2016).
Salmon, H. et al. Expansion and activation of CD103(+) dendritic cell progenitors at the tumor site enhances tumor responses to therapeutic PD-L1 and BRAF inhibition. Immunity 44, 924-938 (2016).
Broz, M. L. et al. Dissecting the tumor myeloid compartment reveals rare activating antigen-presenting cells critical for T cell immunity. Cancer Cell 26, 638-652 (2014).
Spranger, S., Dai, D., Horton, B. & Gajewski, T. F. Tumor-residing Batf3 dendritic cells are required for effector cell trafficking and adoptive T cell therapy. Cancer Cell 31, 711-723.e714 (2017).
Gao, Y. et al. Tumor immunoevasion by the conversion of effector NK cells into type 1 innate lymphoid cells. Nat. Immunol. 18, 1004-1015 (2017).
Cortez, V. S. et al. SMAD4 impedes the conversion of NK cells into ILC1-like cells by curtailing non-canonical TGF-beta signaling. Nat. Immunol. 18, 995-1003 (2017).
McFarland, A. P. et al. Multi-tissue single-cell analysis deconstructs the complex programs of mouse natural killer and type 1 innate lymphoid cells in tissues and circulation. Immunity 54, 1320-1337.e1324 (2021).
Cortez, V. S. et al. Transforming growth factor-beta signaling guides the differentiation of innate lymphoid cells in salivary glands. Immunity 44, 1127-1139 (2016).
Lopes, N. et al. Tissue-specific transcriptional profiles and heterogeneity of natural killer cells and group 1 innate lymphoid cells. Cell Rep. Med. 3, 100812 (2022).
Friedrich, C. et al. Effector differentiation downstream of lineage commitment in ILC1s is driven by Hobit across tissues. Nat. Immunol. 22, 1256-1267 (2021).
Vivier, E. et al. Innate lymphoid cells: 10 years on. Cell 174, 1054-1066 (2018).
Spits, H. et al. Innate lymphoid cells-a proposal for uniform nomenclature. Nat. Rev. Immunol. 13, 145-149 (2013).
Walker, J. A., Barlow, J. L. & McKenzie, A. N. Innate lymphoid cellshow did we miss them? Nat. Rev. Immunol. 13, 75-87 (2013).
Gasteiger, G., Fan, X., Dikiy, S., Lee, S. Y. & Rudensky, A. Y. Tissue residency of innate lymphoid cells in lymphoid and nonlymphoid organs. Science 350, 981-985 (2015).
Dutton, E. E. et al. Peripheral lymph nodes contain migratory and resident innate lymphoid cell populations. Sci. Immunol. 4, eaau8082 (2019).
Zhang, J. et al. T-bet and Eomes govern differentiation and function of mouse and human NK cells and ILC1. Eur. J. Immunol. 48, 738-750 (2018).
Klose, C. S. et al. Differentiation of type 1 ILCs from a common progenitor to all helper-like innate lymphoid cell lineages. Cell 157, 340-356 (2014).
Di Censo, C. et al. Granzyme A and CD160 expression delineates ILC1 with graded functions in the mouse liver. Eur. J. Immunol. 51, 2568-2575 (2021).
Nixon, B. G. et al. Cytotoxic granzyme C-expressing ILC1s contribute to antitumor immunity and neonatal autoimmunity. Sci. Immunol. 7, eabi8642 (2022).
Li, Z. et al. In vivo labeling reveals continuous trafficking of TCF-1+ T cells between tumor and lymphoid tissue. J. Exp. Med. 219, e20210749 (2022).
Tomura, M. et al. Monitoring cellular movement in vivo with photoconvertible fluorescence protein “Kaede” transgenic mice. Proc. Natl. Acad. Sci. USA. 105, 10871-10876 (2008).
Walker, J. A. et al. Polychromic reporter mice reveal unappreciated innate lymphoid cell progenitor heterogeneity and elusive ILC3 progenitors in bone marrow. Immunity 51, 104-118.e107 (2019).
Robinette, M. L. et al. Transcriptional programs define molecular characteristics of innate lymphoid cell classes and subsets. Nat. Immunol. 16, 306-317 (2015).
Chiossone, L. et al. Maturation of mouse NK cells is a 4-stage developmental program. Blood 113, 5488-5496 (2009).
Van den Berge, K. et al. Trajectory-based differential expression analysis for single-cell sequencing data. Nat. Commun. 11, 1201 (2020).
Aibar, S. et al. SCENIC: single-cell regulatory network inference and clustering. Nat. Methods 14, 1083-1086 (2017).
Bernard, K. et al. Engagement of natural cytotoxicity programs regulates AP-1 expression in the NKL human NK cell line. J. Immunol. 162, 4062-4068 (1999).
Adams, N. M. et al. Transcription factor IRF8 orchestrates the adaptive natural killer cell response. Immunity 48, 1172-1182.e1176 (2018).
Rabacal, W. et al. Transcription factor KLF2 regulates homeostatic NK cell proliferation and survival. Proc. Natl. Acad. Sci. USA. 113, 5370-5375 (2016).
Khameneh, H. J. et al. Myc controls NK cell development, IL-15driven expansion, and translational machinery. Life Sci. Alliance 6 (2023).
Jin, S. et al. Inference and analysis of cell-cell communication using CellChat. Nat. Commun. 12, 1088 (2021).
Adam, C. et al. DC-NK cell cross talk as a novel CD4+ T-cellindependent pathway for antitumor CTL induction. Blood 106, 338-344 (2005).
Laine, A. et al. Regulatory T cells promote cancer immune-escape through integrin alphavbeta8-mediated TGF-beta activation. Nat. Commun. 12, 6228 (2021).
Stojanovic, A., Fiegler, N., Brunner-Weinzierl, M. & Cerwenka, A. CTLA-4 is expressed by activated mouse NK cells and inhibits NK Cell IFN-gamma production in response to mature dendritic cells. J. Immunol. 192, 4184-4191 (2014).
Lee, S. H., Fragoso, M. F. & Biron, C. A. Cutting edge: a novel mechanism bridging innate and adaptive immunity: IL-12 induction of CD25 to form high-affinity IL-2 receptors on NK cells. J. Immunol. 189, 2712-2716 (2012).
Ni, J. et al. Single-cell RNA sequencing of tumor-infiltrating NK cells reveals that inhibition of transcription factor HIF-1alpha Unleashes NK cell activity. Immunity 52, 1075-1087.e1078 (2020).
Krzywinska, E. et al. Loss of HIF-1alpha in natural killer cells inhibits tumour growth by stimulating non-productive angiogenesis. Nat. Commun. 8, 1597 (2017).
Cancer Genome Atlas Research, N. et al. The cancer Genome Atlas Pan-Cancer analysis project. Nat. Genet. 45, 1113-1120 (2013).
Pelka, K. et al. Spatially organized multicellular immune hubs in human colorectal cancer. Cell 184, 4734-4752.e4720 (2021).
Crinier, A. et al. High-dimensional single-cell analysis identifies organ-specific signatures and conserved NK Cell subsets in humans and mice. Immunity 49, 971-986.e975 (2018).
Tang, F. et al. A pan-cancer single-cell panorama of human natural killer cells. Cell 186, 4235-4251.e4220 (2023).
Lo, H. C. et al. Resistance to natural killer cell immunosurveillance confers a selective advantage to polyclonal metastasis. Nat Cancer 1, 709-722 (2020).
Kennedy, M. K. et al. Reversible defects in natural killer and memory CD8 T cell lineages in interleukin 15-deficient mice. J. Exp. Med. 191, 771-780 (2000).
Sun, H. et al. Accumulation of tumor-infiltrating CD49a(+) NK cells correlates with poor prognosis for human hepatocellular carcinoma. Cancer Immunol. Res. 7, 1535-1546 (2019).
Moreno-Nieves, U. Y. et al. Landscape of innate lymphoid cells in human head and neck cancer reveals divergent NK cell states in the tumor microenvironment. Proc. Natl. Acad. Sci. USA. 118, e2101169118 (2021).
Mackay, L. K. et al. The developmental pathway for CD103(+)CD8+ tissue-resident memory T cells of skin. Nat. Immunol. 14, 1294-1301 (2013).
Sheridan, B. S. et al. Oral infection drives a distinct population of intestinal resident memory CD8(+) T cells with enhanced protective function. Immunity 40, 747-757 (2014).
Zhang, N. & Bevan, M. J. Transforming growth factor-beta signaling controls the formation and maintenance of gut-resident memory T cells by regulating migration and retention. Immunity 39, 687-696 (2013).
Marquardt, N. et al. Unique transcriptional and protein-expression signature in human lung tissue-resident NK cells. Nat. Commun. 10, 3841 (2019).
Sojka, D. K. et al. Cutting edge: local proliferation of uterine tissueresident NK cells during decidualization in mice. J. Immunol. 201, 2551-2556 (2018).
Peng, H. et al. Liver-resident NK cells confer adaptive immunity in skin-contact inflammation. J. Clin. Investig. 123, 1444-1456 (2013).
Lin, E. Y. et al. Progression to malignancy in the polyoma middle T oncoprotein mouse breast cancer model provides a reliable model for human diseases. Am. J. Pathol. 163, 2113-2126 (2003).
Wrangle, J. M. et al. ALT-803, an IL-15 superagonist, in combination with nivolumab in patients with metastatic non-small cell lung cancer: a non-randomised, open-label, phase 1b trial. Lancet Oncol. 19, 694-704 (2018).
Grabstein, K. H. et al. Cloning of a T cell growth factor that interacts with the beta chain of the interleukin-2 receptor. Science 264, 965-968 (1994).
Burton, J. D. et al. A lymphokine, provisionally designated interleukin T and produced by a human adult T -cell leukemia line, stimulates T-cell proliferation and the induction of lymphokineactivated killer cells. Proc. Natl. Acad. Sci. USA. 91, 4935-4939 (1994).
Ma, S., Caligiuri, M. A. & Yu, J. Harnessing IL-15 signaling to potentiate NK cell-mediated cancer immunotherapy. Trends Immunol. 43, 833-847 (2022).
Di Pilato, M. et al. CXCR6 positions cytotoxic T cells to receive critical survival signals in the tumor microenvironment. Cell 184, 4512-4530.e4522 (2021).
Lee, C. et al. Tumour-retained activated CCR7+ dendritic cells are heterogeneous and regulate local anti-tumour cytolytic activity. Nat. Commun https://doi.org/10.1038/s41467-024-44787-1 (2024).
Stoklasek, T. A., Schluns, K. S. & Lefrancois, L. Combined IL-15/IL15Ralpha immunotherapy maximizes IL-15 activity in vivo. J. Immunol. 177, 6072-6080 (2006).
Dubois, S., Patel, H. J., Zhang, M., Waldmann, T. A. & Muller, J. R. Preassociation of IL-15 with IL-15R alpha-IgG1-Fc enhances its activity on proliferation of NK and CD8+/CD44high T cells and its antitumor action. J. Immunol. 180, 2099-2106 (2008).
Hawke, L. G., Mitchell, B. Z. & Ormiston, M. L. TGF-beta and IL-15 synergize through MAPK pathways to drive the conversion of human NK cells to an innate Lymphoid Cell 1-like phenotype. J. Immunol. 204, 3171-3181 (2020).
Shimshek, D. R. et al. Codon-improved Cre recombinase (iCre) expression in the mouse. Genesis 32, 19-26 (2002).
Shcherbo, D. et al. Far-red fluorescent tags for protein imaging in living tissues. Biochem. J. 418, 567-574 (2009).
Fiancette, R. et al. Reciprocal transcription factor networks govern tissue-resident ILC3 subset function and identity. Nat. Immunol. 22, 1245-1255 (2021).
Wong, P., Wagner, J. A., Berrien-Elliott, M. M., Schappe, T. & Fehniger, T. A. Flow cytometry-based ex vivo murine NK cell cytotoxicity assay. STAR Protoc. 2, 100262 (2021).
Wolf, F. A., Angerer, P. & Theis, F. J. SCANPY: large-scale single-cell gene expression data analysis. Genome Biol. 19, 15 (2018).
Wolock, S. L., Lopez, R. & Klein, A. M. Scrublet: computational identification of cell doublets in single-cell transcriptomic data. Cell Syst. 8, 281-291.e289 (2019).
Wolf, F. A. et al. PAGA: graph abstraction reconciles clustering with trajectory inference through a topology preserving map of single cells. Genome Biol. 20, 59 (2019).
Haghverdi, L., Buttner, M., Wolf, F. A., Buettner, F. & Theis, F. J. Diffusion pseudotime robustly reconstructs lineage branching. Nat. Methods 13, 845-848 (2016).
Newman, A. M. et al. Determining cell type abundance and expression from bulk tissues with digital cytometry. Nat. Biotechnol. 37, 773-782 (2019).
Acknowledgements
We thank Dr Y. Miwa (Tsukuba University) and Dr O. Kanagawa (RCAI, RIKEN) and Dr. M. Tomura (Osaka Ohtani University) for the Kaede mice. We thank Dr S. Zelenay for kindly sharing MC38 cells. We thank the Biomedical Services Unit at the University of Birmingham for all their help with in vivo experimental work. We thank A. Ptasinska and colleagues at Genomics Birmingham, the genomic and sequencing facility of the University of Birmingham, for their help with single cell RNA sequencing and the University of Birmingham Flow Cytometry Platform. We thank Gareth Howell and the University of Manchester flow cytometry core, and Andy Hayes and Claire Morrisroe in the University of Manchester Genomic Technologies core facility for their help with single cell RNA sequencing. Results shown here are in part based upon data generated by the TCGA Research Network: https://www.cancer.gov/tcga. This work was supported by the following Grants to D.R.W.: Senior Research Fellowship from the Wellcome Trust (110199/Z/15/Z), Cancer Research UK Immunology Project Award (C54019/A27535), Cancer Research Institute CLIP Grant (CRI3128), Worldwide Cancer Research Grant (21-0073) and an MRC
IMPACT iCASE Studentship with AstraZeneca. Research in the laboratory of J.M. was supported by The Swedish Cancer Society. Funding to M.R.H.: Sir Henry Dale Fellowship jointly funded by the Wellcome Trust and the Royal Society (Grant Number 105644/Z/14/Z), and Lister Institute of Preventative Medicine Prize. Z.K.T. and M.R.C. are supported by a Medical Research Council Human Cell Atlas Research Grant (MR/SO35842/1). M.R.C. is supported by a Wellcome Trust Investigator Award (220268/Z/ 20/Z) and by the NIHR Cambridge Biomedical Research Centre.
Author contributions
I.D. designed and performed experiments, analyzed data, performed statistical analysis and wrote the manuscript; C.Y.C.L. designed and performed experiments, analyzed data and wrote the manuscript; Z.K.T., Z.L., C.W., F.G., B.C.K., V.M.R., R.F. designed and performed experiments; C.A.T. designed and performed experiments and analyzed data; S.M.B. analyzed data; C.N. and U.L. obtained human tissue samples; C.S., V.S. provided in vivo model and critiqued data; G.C., S.A.H., S.J.D., J.M., M.R.H. designed experiments and critiqued data; M.R.C. and D.R.W. designed experiments, analyzed and critiqued data and wrote the manuscript.
Competing interests
The authors declare the following competing interests: G.C., S.A.H., S.J.D. are full-time employees of AstraZeneca and own or have owned AstraZeneca stock. The remaining author declare no competing interests.
Correspondence and requests for materials should be addressed to Menna R. Clatworthy or David R. Withers.
Peer review information Nature Communications thanks Jong-Eun Park and the other, anonymous, reviewer(s) for their contribution to the peer review of this work. A peer review file is available.
Institute of Immunology and Immunotherapy, College of Medical and Dental Sciences, University of Birmingham, Birmingham, UK. Department of Medicine, Molecular Immunity Unit, Medical Research Council Laboratory of Molecular Biology, University of Cambridge, Cambridge, UK. Cellular Genetics, Wellcome Sanger Institute, Wellcome Genome Campus, Hinxton, Cambridge, UK. Center for Infectious Medicine, Department of Medicine Huddinge, Karolinska Institutet, Stockholm, Sweden. Department of Molecular Medicine and Surgery, Karolinska Institutet and Department of Pelvic Cancer, Karolinska University Hospital, Stockholm, Sweden. Division of Informatics, Imaging & Data Science, Faculty of Biology, Medicine and Health, the University of Manchester, Manchester Academic Health Science Centre, Manchester, UK. Institute of Anatomy, University of Zurich, Zurich, Austria. Institute of Pharmacology and Toxicology, University of Veterinary Medicine, Vienna, Austria. Early Oncology R&D, AstraZeneca, MD, USA. Early Oncology R&D, AstraZeneca, UK. Clinical Lung and Allergy Research, Medical unit for Lung and Allergy Diseases, Karolinska University Hospital, Stockholm, Sweden. Lydia Becker Institute of Immunology and Inflammation, Division of Infection, Immunity and Respiratory Medicine, Faculty of Biology, Medicine and Health, the University of Manchester, Manchester Academic Health Science Centre, Manchester, UK. e-mail: mrc38@medschl.cam.ac.uk; d.withers@bham.ac.uk