التعبير الجيني المكاني للكبد البشري السليم والمُتليف بدقة خلوية فردية Spatial transcriptomics of healthy and fibrotic human liver at single-cell resolution
التعبير الجيني المكاني للكبد البشري السليم والمُتليف بدقة خلوية فردية
يتكون الكبد من خلايا بارينشيمية وغير بارينشيمية وخلايا مناعية مرتبة في هياكل تشريحية تُسمى الفصيصات، والتي هيبقطر وموصوفة بمواقع تدفق الوريد البابي والشرياني وتدفق الوريد المركزيداخل الفصيص، يتم تنظيم الخلايا الكبدية تقليديًا إلى ثلاث مناطق، حيث تكون المنطقة 1 قريبة من الوريد البابي والشريان الكبدي، والمنطقة 3 قريبة من الوريد المركزي، والمنطقة 2 في المنطقة المتوسطة.تطابق تقسيم الخلايا الكبدية الوظيفة مع البيئة الفيزيولوجية من حيث المكان والزمان.على سبيل المثال، فإن الخلايا الكبدية في المنطقة 1 تشارك بشكل أكبر في عملية تكوين الجلوكوز والأكسدة بيتا، مما يعكس البيئة الغنية نسبيًا بالأكسجين والمواد الغذائية بالقرب من الوريد البابي والشريان الكبدي، بينما تكون الخلايا الكبدية في المنطقة 3 أكثر نشاطًا في عملية التحلل السكري وتكوين الدهون، مما يعكس نقص الأكسجين والمواد الغذائية بالقرب من الوريد المركزي.بعيدًا عن الأيض، تعبير المورفوجين، مثل
تاريخ الاستلام: 5 سبتمبر 2024 تم القبول: 9 ديسمبر 2024 نُشر على الإنترنت: 02 يناير 2025
لقد تقدم تسلسل RNA أحادي الخلية (scRNA-seq) في فهمنا لأنواع الخلايا وتنوعها داخل الكبد البشري، ولكن لم يتم بعد وصف التنظيم المكاني بدقة خلوية. هنا نطبق تقنية الهجين الفلوري المتعدد الخطأ (MERFISH) لرسم توزيع المناطق الخاصة بالخلايا الكبدية، وحل المجموعات الفرعية من السكان البلعميين والميزنشيميين مكانيًا، والتحقيق في العلاقة بين تعدد الصبغيات في الخلايا الكبدية وتعبير الجينات داخل الكبد البشري السليم. إن دمج المعلومات المكانية من MERFISH مع النسخة الأكثر اكتمالاً من النسخ الجينية التي تنتجها تسلسل RNA أحادي النواة (snRNA-seq) يكشف أيضًا عن تفاعلات مستقبلات-ليغاند الغنية في المناطق. أخيرًا، تحدد تحليلات MERFISH وsnRNA-seq لعينات الكبد المتليف مجموعتين من الخلايا الكبدية التي تتوسع مع الإصابة وليس لها توزيعات منطقة واضحة. معًا، توفر هذه الخرائط المكانية للكبد السليم والمتليف فهمًا أعمق لإعادة تشكيل الخلايا والمكان الذي يقود المرض، مما قد يوفر بدوره طرقًا جديدة للتدخل والدراسة الإضافية.
الذي ينتمي إلى أعضاء عائلة Wnt، يتشكل أيضًا بواسطة هذه المنطقة ويمكن أن يتغير مع الزمن. وبالتالي، فإن هذه التنظيمات المناطقية حاسمة لفهم نشاط الخلايا الكبدية. ومع ذلك، لا تزال العديد من تفاصيل هذه التنظيمات، بما في ذلك كيفية تعديل الخلايا الكبدية للتعبير الجيني على طول محور الوريد البابي-الوريد المركزي ووظيفة هذا الضبط المكاني المحتمل غير واضحة في الكبد البشري، حيث إن التحليلات الحالية للخلايا المفردة في الكبد البشري قد قاست إما التعبير الجيني دون بيانات مكانية أو قيمت البيانات المكانية دون دقة الخلايا المفردة.
يتكون الكبد أيضًا من خلايا غير بارينشيمية، والتي تشمل خلايا نجمية كبدية (HSCs)، البلعميات المقيمة، خلايا بطانة الأوعية (ECs)، وخلايا القنوات الصفراوية.بينما تم وصف مجموعات فرعية من البلعميات والخلايا الجذعية الكبدية في الكبد البشري السليم في بيانات الخلايا المفردةلم يتم حل هذه المجموعات الفرعية، والاختلافات المحتملة في تعبير الجينات داخلها، ضمن الفص.
تنظيم الخلايا الفردية في الكبد البشري. وبالتالي، فإن دورها ضمن السياق المكاني للكبد لا يزال غير واضح.
بالإضافة إلى الموقع المكاني، فإن ميزة أخرى من ميزات الخلايا الكبدية التي قد تؤدي إلى التباين الوظيفي هي تعدد الصيغ الصبغية.بشكل محدد، يمكن أن تكون الخلايا الكبدية في الكبد البالغ مفردة أو متعددة النوى، ويمكن أن تختلف النوى نفسها في عدد الصبغيات. في بداية الحياة، تكون معظم الخلايا الكبدية البشرية ثنائية الصبغيات وتحتوي على نواة واحدة؛ يزداد عدد الصبغيات مع التقدم في العمر بحيث يكون حوالي ثلث الخلايا الكبدية في البالغين متعددة النوى، أو تحتوي نواها على أكثر من نسختين من كل كروموسوم.ومع ذلك، لا يزال التنظيم المكاني للخلايا الكبدية متعددة النوى وتأثير المحتوى النووي على التعبير الجيني غير مفهوم بشكل جيد..
هنا، نطبق تقنيات النسخ الجيني المكاني المعتمدة على الصور (التهجين الفلوري في الموقع المقاوم للأخطاء المتعددة؛ MERFISH) وتسلسل RNA أحادي النواة (snRNA-seq) على نفس عينات الكبد البشري السليم من أجل بناء خرائط مكانية للخلايا الكبدية والخلايا غير الكبدية بدقة خلوية واحدة وعبر النسخ الجيني. سمح لنا هذا التحليل بتحديد تدرجات التعبير الجيني عبر مناطق الخلايا الكبدية البشرية، وتحديد أنواع الخلايا التي تتواجد فيها تعبيرات المستقبلات والليغاندات في القرب المكاني لتعزيز التواصل، وتقييم العلاقة بين عدد النسخ والتعبير الجيني داخل الخلايا الكبدية. كما أجرينا قياسات مماثلة في عينات كبد متليف لفهم التغيرات التي تحدث في الخلايا الكبدية والخلايا غير الكبدية مع الإصابة المزمنة. توفر هذه التحليلات خريطة نسخ جيني مكاني للخلايا الكبدية البشرية، موضحة التدرج في التعبير الجيني للخلايا الكبدية من المنطقة البابية إلى الوريد المركزي وتظهر أن عدد النسخ في الخلايا الكبدية موزع بالتساوي عبر المناطق داخل الفصيص ولا يؤثر على التعبير الجيني التفاضلي. بالإضافة إلى ذلك، نحدد مجموعات فرعية من البلعميات المكانية المتميزة وسكان خلايا الكبد الجذعية، ونحدد توسع مجموعتين من الخلايا الكبدية مع الإصابة المزمنة، مما يوفر معًا نهجًا وإطارًا لفهم التغيرات التي تحدث مع مرض الكبد البشري بدقة خلوية واحدة في الفضاء. بشكل أوسع، قد يكون الإطار الذي نقدمه للتحليل المشترك المكاني والنسخي للخلايا الفردية داخل الكبد البشري السليم والمريض مفيدًا للدراسة الإضافية لإعادة تشكيل الجزيئات والخلايا والأنسجة التي تحدث في مرض الكبد البشري.
النتائج
التنظيم المكاني للخلايا الكبدية في كبد الإنسان
لاستكشاف التنظيم المكاني والخلوى للكبد البشري، جمعنا أنسجة كبد بشرية من هوامش الاستئصال الجراحي لثلاثة مرضى بالغين (امرأتان ورجل واحد؛ الجدول التكميلي 1). بينما يخضع عدد قليل من المرضى لاستئصال الكبد دون اشتباه في وجود مرض، فإن غياب علامات واضحة للإصابة الحادة أو المزمنة في صور H&E دعم تصنيفنا لهذه العينات على أنها ‘صحية’ (الشكل التكميلي 1 والجدول التكميلي 1). صممنا لوحة MERFISH تستهدف 317 جينًا مع التركيز على الخلايا الكبدية (الطرق؛ البيانات التكملية 1)، ثم قمنا بتوصيف تعبير هذه الجينات ضمن مقاطع مجمدة مأخوذة من هذه العينات باستخدام MERFISH..
كشف توزيع الجينات الفردية الرئيسية عن البنية المعمارية الغنية للكبد وقدم تحققًا أوليًا من قياساتنا. لاحظنا صفائح من الخلايا تعبر عنمتسق مع الخلايا الكبدية (الشكل التوضيحي 2)، بينما كان تعبير CD5L متجمعًا في المساحات بين الخلايا الكبدية بما يتماشى مع البلعميات المقيمة الموجودة في الجيوب الكبدية. (الشكل التوضيحي التكميلي 2a-f). كان تعبير PDGFRB مركزًا على طول الحواف من-تعبير الخلايا الكبدية في توزيع متوقع لخلايا الكبد الجذعية، والتي تقع في الفضاء تحت البطاني (الشكل التكميلي 2a-f). كانت KRT7 و SOX9 مركزة في المناطق المحيطة بالقنوات الصفراوية بما يتماشى مع خلايا القنوات الصفراوية وتضم مجموعات تشير إلى مقاطع طولية من القنوات الصفراوية الصغيرة (الشكل التكميلي 2g-l)، بينما كانت تعبيرات DNASE13 و INMT متناثرة في النسيج الخلالي بما يتماشى مع توزيع خلايا البطانية. (الشكل التوضيحي الإضافي 2g-l).
لتعريف الخلايا الفردية ضمن بياناتنا، قمنا بتضمين صبغة مناعية فلورية ضد بان-سيل في قياسات MERFISH لدينا. علامة سطحية، الـ-ATPازتم دمج صبغة الأجسام المضادة هذه في قراءة MERFISH الخاصة بنا من خلال استخدام جسم مضاد ثانوي موسوم بأوليغونوكليوتيد. (الطرق). ثم استخدمنا Cellposeلتحديد حدود الخلايا في ثلاثة أبعاد من هذه الأصباغ المشتركة، تم تعيين RNAs داخل هذه الحدود، وتطبيق روتين تقسيم قائم على RNA، Baysor، لضبط وتحسين هذه الحدود واستعادة الخلايا التي لم توفر الأصباغ المشتركة حدودًا واضحة (الشكل التكميلي 3). بعد هذا التحليل وإزالة الخلايا ذات الأعداد الصغيرة من النسخ، قمنا بتجميع مجموعة بيانات منالخلايا المحتملة من كبد الإنسان السليم (الشكل التكميلي 4).
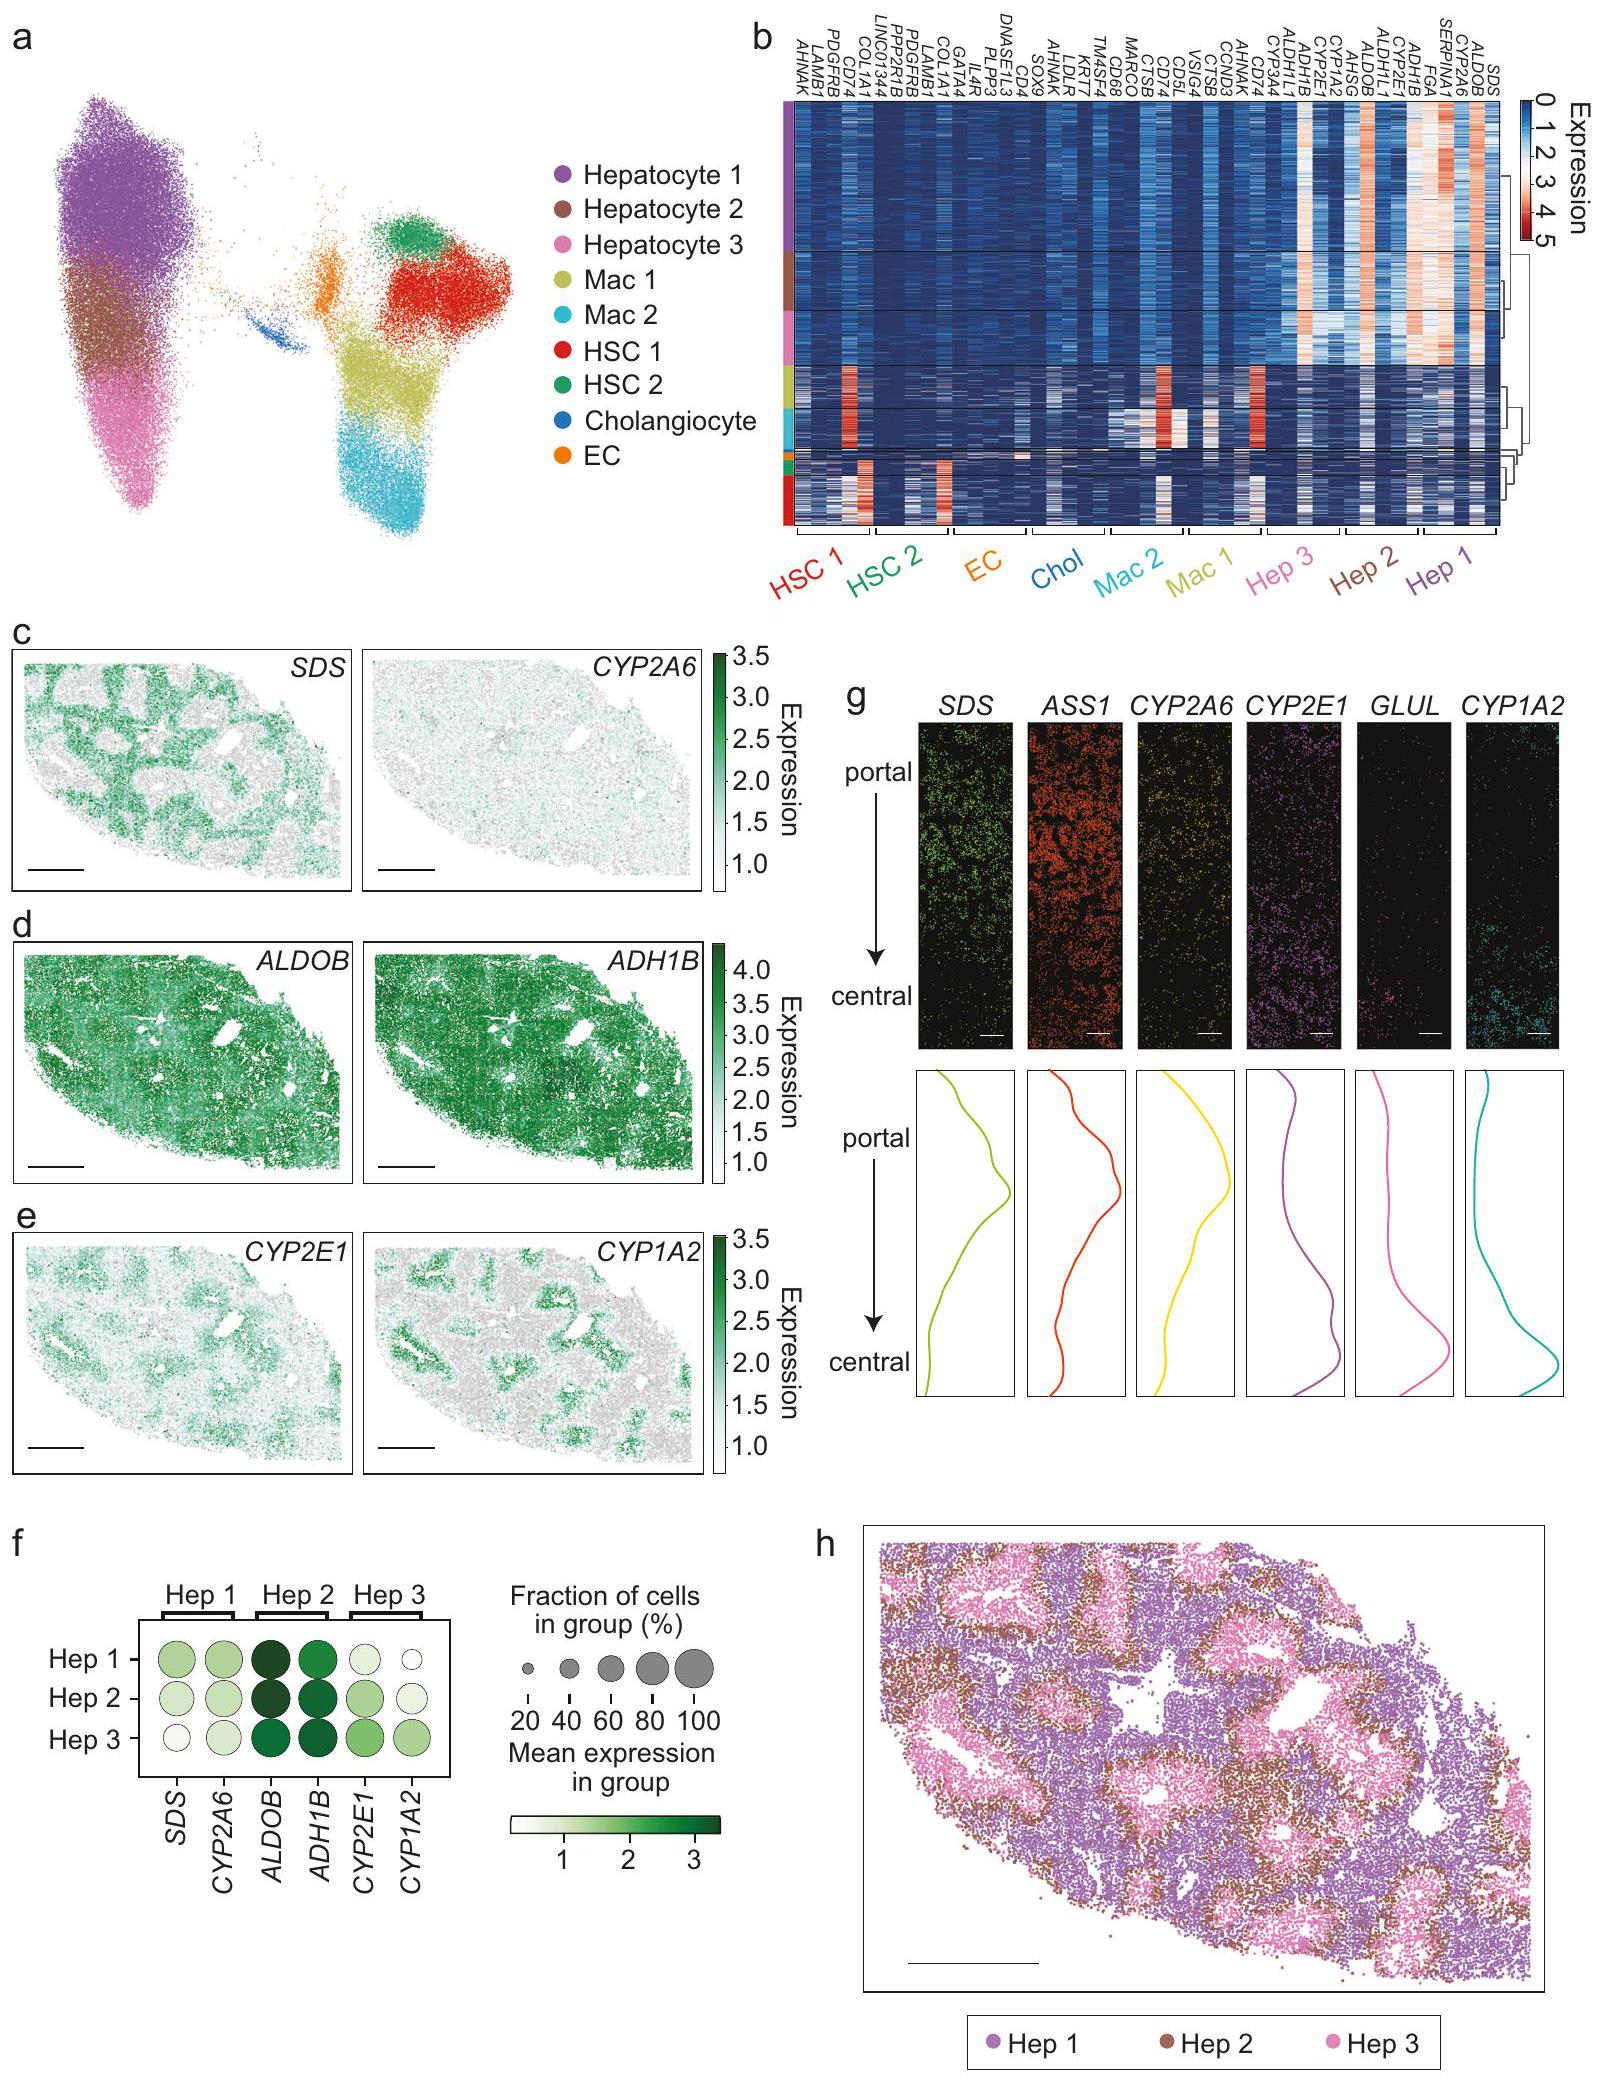
تم قياس تعبير جميع الجينات الـ 317 في كل خلية لتوليد مصفوفة عدّ لعينات كبد الإنسان. ثم تم تصور مصفوفة العد للبيانات المجمعة بواسطة تقريب وتوقع متعدد الأشكال (UMAP) بعد تطبيق تصحيح الدفعة (الطرق؛ الشكل 1a). تم تعريف ثلاث مجموعات من الخلايا الكبدية جنبًا إلى جنب مع مجموعتين من خلايا HSC، ومجموعتين من الخلايا البالعة، ومجموعة واحدة من خلايا EC، ومجموعة واحدة من خلايا القناة الصفراوية. تم تعريف كل مجموعة بواسطة علامات مثبتة، مما يدعم تعيين مجموعتنا (الشكل 1b؛ البيانات التكميلية 2)، وتمت ملاحظة أدلة محدودة على تعبير جينات العلامات خارج أنواع الخلايا التي تحددها، مما يدعم تقسيمنا (الشكل التكميلي 3c). تعكس هذه الملاحظات تركيز الخلايا الكبدية في لوحة MERFISH الخاصة بنا وكذلك الحجم الأكبر للخلايا الكبدية، حيث احتوت مجموعات الخلايا الكبدية على المزيد من عدّ RNA والمزيد من الجينات المعبر عنها مقارنةً بالمجموعات الأخرى (الشكل التكميلي 4b-d). ومع ذلك، باستثناء تجمعات اللمفاويات والخلايا المتعادلة، التي لم تحتوي على جينات علامات كافية في لوحتنا، فإن الأعداد الأقل الملاحظة لكل خلية لمجموعات غير الخلايا الكبدية لا تزال سمحت لنا بتعريف جميع الفئات الرئيسية الأخرى للخلايا المتوقعة داخل الكبد بوضوح (الشكل 1a، b).
بعد ذلك، استكشفنا التوزيع المكاني للخلايا الكبدية من خلال تقييم تعبير الجينات الفردية (الشكل 1c-f، الشكل التكميلي 5a). تم إثراء SDS في المنطقة 1 (حول البوابة)، بينما زاد تعبير CYP2E1 في المنطقة 3 (حول المركز)، كما تم وصفه سابقًا في الفأر (الشكل 1c، e، f؛ الشكل التكميلي 5a). بالإضافة إلى ذلك، وجدنا أن CYP2A6 وASS1 كانا مثرين في المناطق البوابة مشابهة لـ SDS، بينما كان CYP1A2 وGLUL مثرين في المناطق المركزية مشابهة لـ CYP2E1 (الشكل 1c، e، f-g). تم التعبير عن ALDOB وADH1B في جميع الخلايا الكبدية ولكن تم إثراؤهما في المنطقة 2، معتعبير تحول نحو المناطق 1 و2 وتعبير تحول نحو المناطق 2 و3 (الشكل 1d، f). أظهرت هذه النتائج أن MERFISH تلتقط الفروق في تعبير الجينات عبر المناطق داخل الفص الكبدي، وسألنا بعد ذلك مدى فعالية تعريفنا للمنطقة باستخدام مجموعة مجسات MERFISH الكاملة. أظهر رسم مجموعات الخلايا الكبدية 1 و2 و3 (الشكل 1a) عودة إلى مقاطع الأنسجة توزيعًا منطقيًا واضحًا، حيث تمركزت مجموعة الخلايا الكبدية 1 في المنطقة 1، ومجموعة الخلايا الكبدية 3 في المنطقة 3، ومجموعة الخلايا الكبدية 2 في المنطقة 2 (بين المنطقة 1 و3؛ الشكل 1h، الشكل التكميلي 5b، c). بشكل جماعي، تتماشى هذه الملاحظات مع التقسيم الكلاسيكي الموصوف في كبد الإنسان والفأر، مما يدعم قياسات MERFISH لدينا.
بينما كشف تحليلنا أن الخلايا الكبدية يمكن فصلها إلى ثلاث تجمعات، لاحظنا أن هذه التجمعات موجودة داخل مجموعة واحدة من الخلايا في تمثيل UMAP للبيانات (الشكل 1a). يشير هذا التمثيل إلى أن المناطق الكبدية الكلاسيكية تمثل تقريبات لمتغير مستمر في تعبير الجينات في الخلايا الكبدية تحدده العلاقة المكانية بين المناطق البوابة والمركزية للفص. لاستكشاف هذه الإمكانية بشكل أكبر، قمنا بإجراء تحليل زمني زائف على تعبير الجينات للخلايا الكبدية ووجدنا أن الزمن الزائف تم رسمه على توزيع مستمر في الفضاء (الشكل التكميلي 5d-f). يمكن أيضًا ملاحظة هذا التدرج في تعبير الجينات عبر الفصوص الفردية (الشكل 1g)، حيث تظهر العديد من الجينات تدرجًا في تعبير الجينات من المناطق حول البوابة إلى المناطق حول المركز (الشكل التكميلي 5g). بشكل جماعي، تشير هذه الملاحظات إلى أن تعبير الجينات المكاني في الخلايا الكبدية البشرية يتم وصفه بشكل أفضل بواسطة متغير مستمر تحدده المسافة النسبية بين المناطق البوابة والمركزية للفص، مشابهة للملاحظات في الفأر.
التنظيم المكاني للخلايا غير البرانشيمية في كبد الإنسان
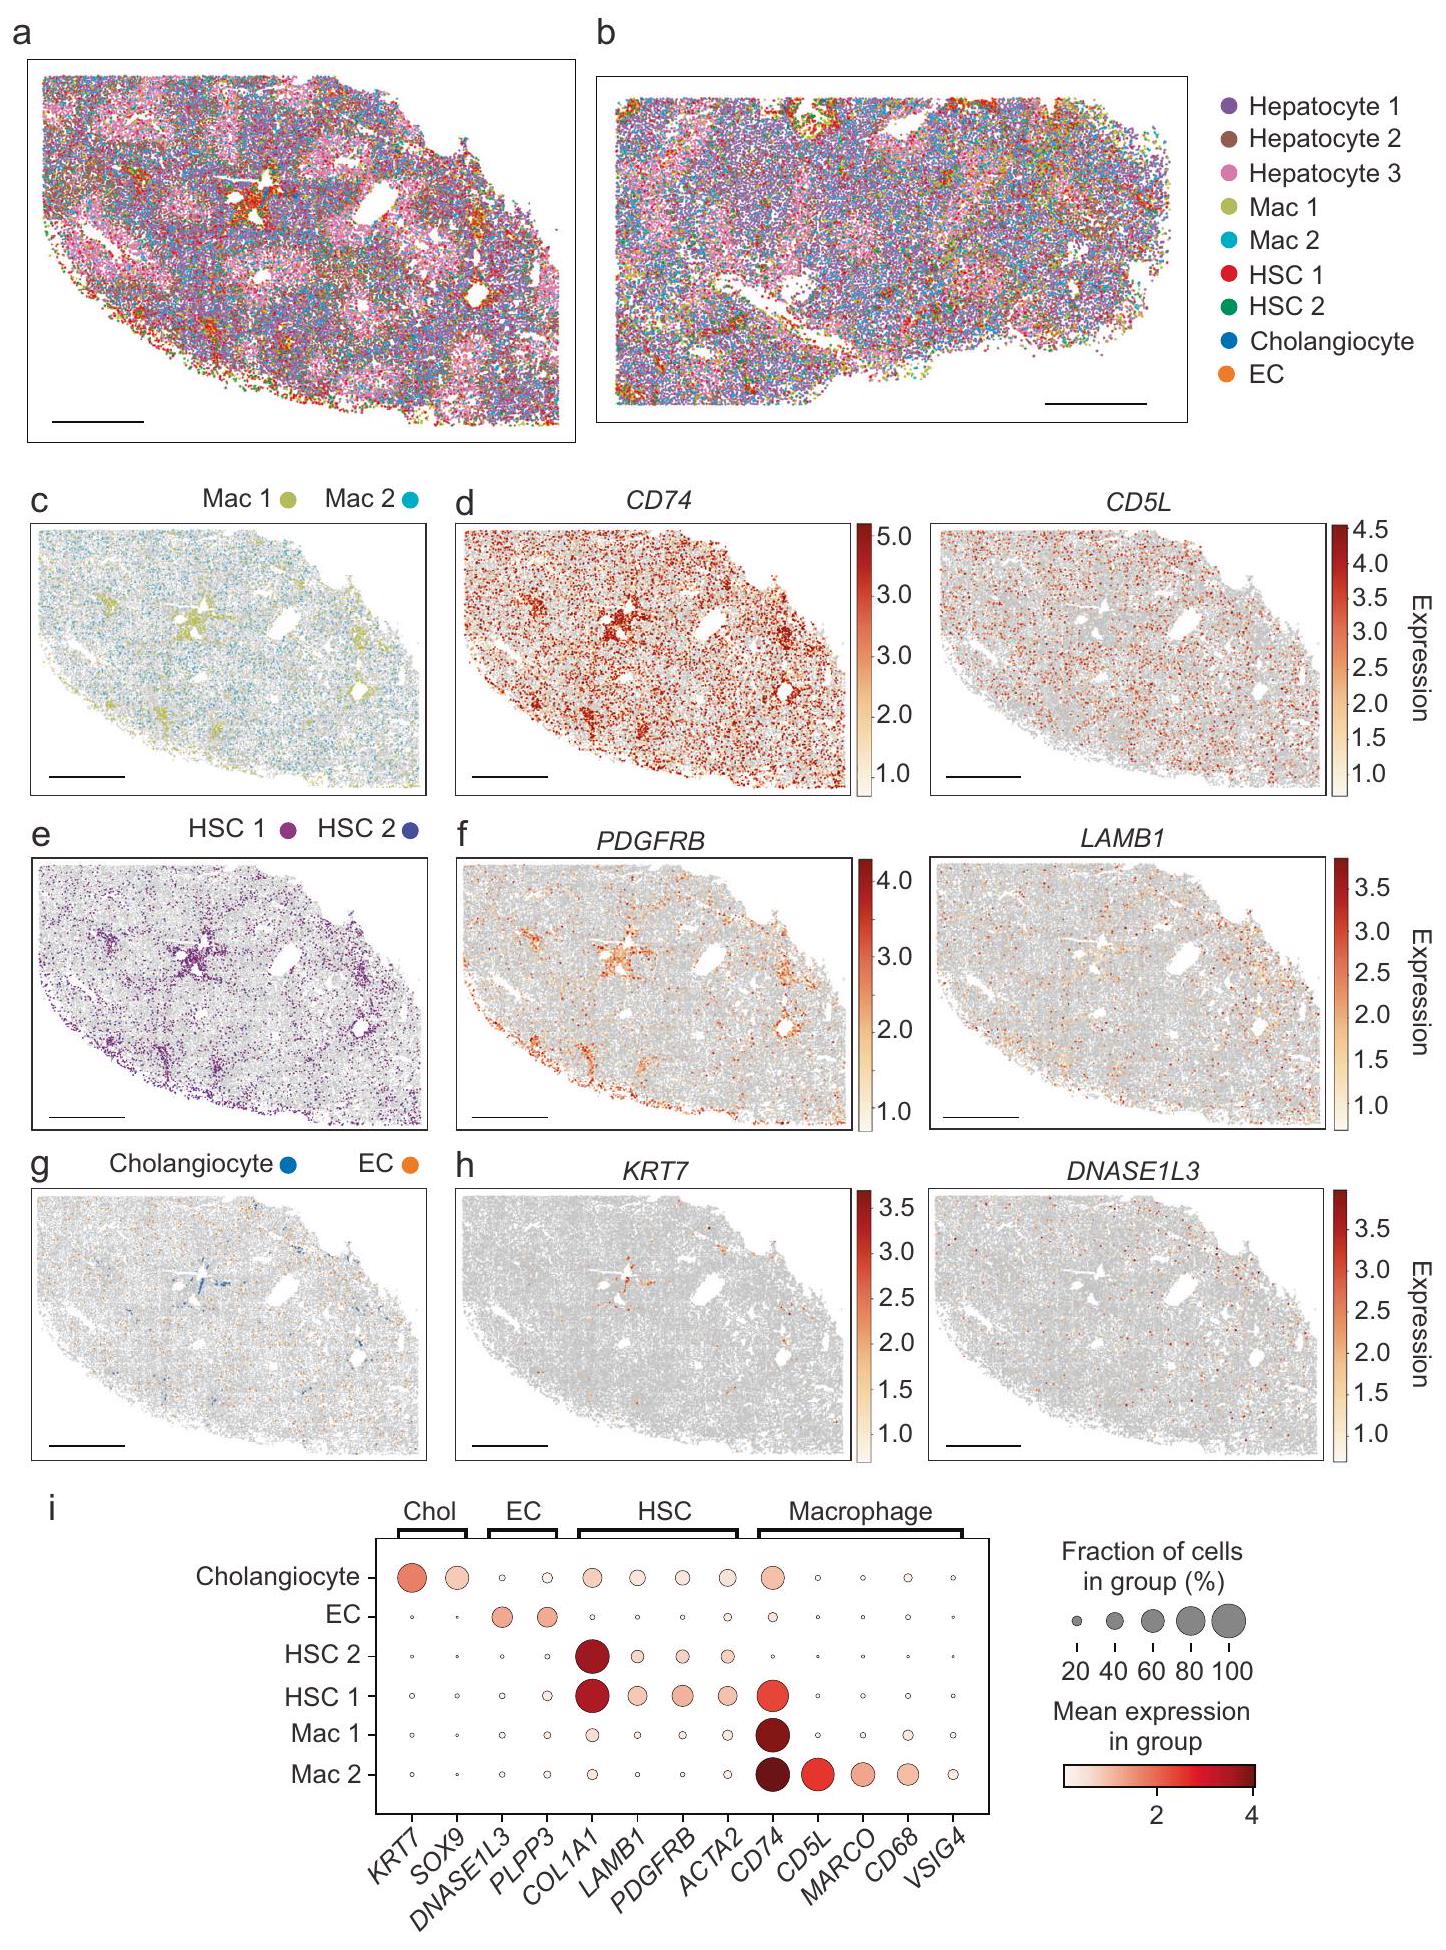
بعد ذلك، قمنا بتوسيع تحليلنا ليشمل التنظيم المكاني لأنواع الخلايا غير البرانشيمية (الشكل 2). تم تصور مجموعتين من الخلايا البالعة في الكبد السليم وأظهرت أنماط توزيع مختلفة (الشكل 2a، b، c، الشكل التكميلي 6a). كانت مجموعة الخلايا البالعة (Mac) 1 مثرية في المنطقة حول البوابة وتوزعت أيضًا
عبر الفصوص، بينما كانت خلايا Mac 2 متناثرة بشكل أكثر انتشارًا عبر الفصوص. تم تحديد كلا مجموعتي الخلايا البالعة من خلال تعبير CD74، بينما كانت خلايا Mac 2 تعبر أيضًا عن CD5L وMARCO (الشكل 2d، i؛ الشكل التكميلي 6b)، مما يتماشى بشكل أكبر مع الخلايا البالعة غير الالتهابية أو خلايا كوبر.
تم تحديد مجموعتين أيضًا تظهر أنماط تعبير جيني تتماشى مع HSCs (الشكل 2a، b، e؛ الشكل التكميلي 6c).
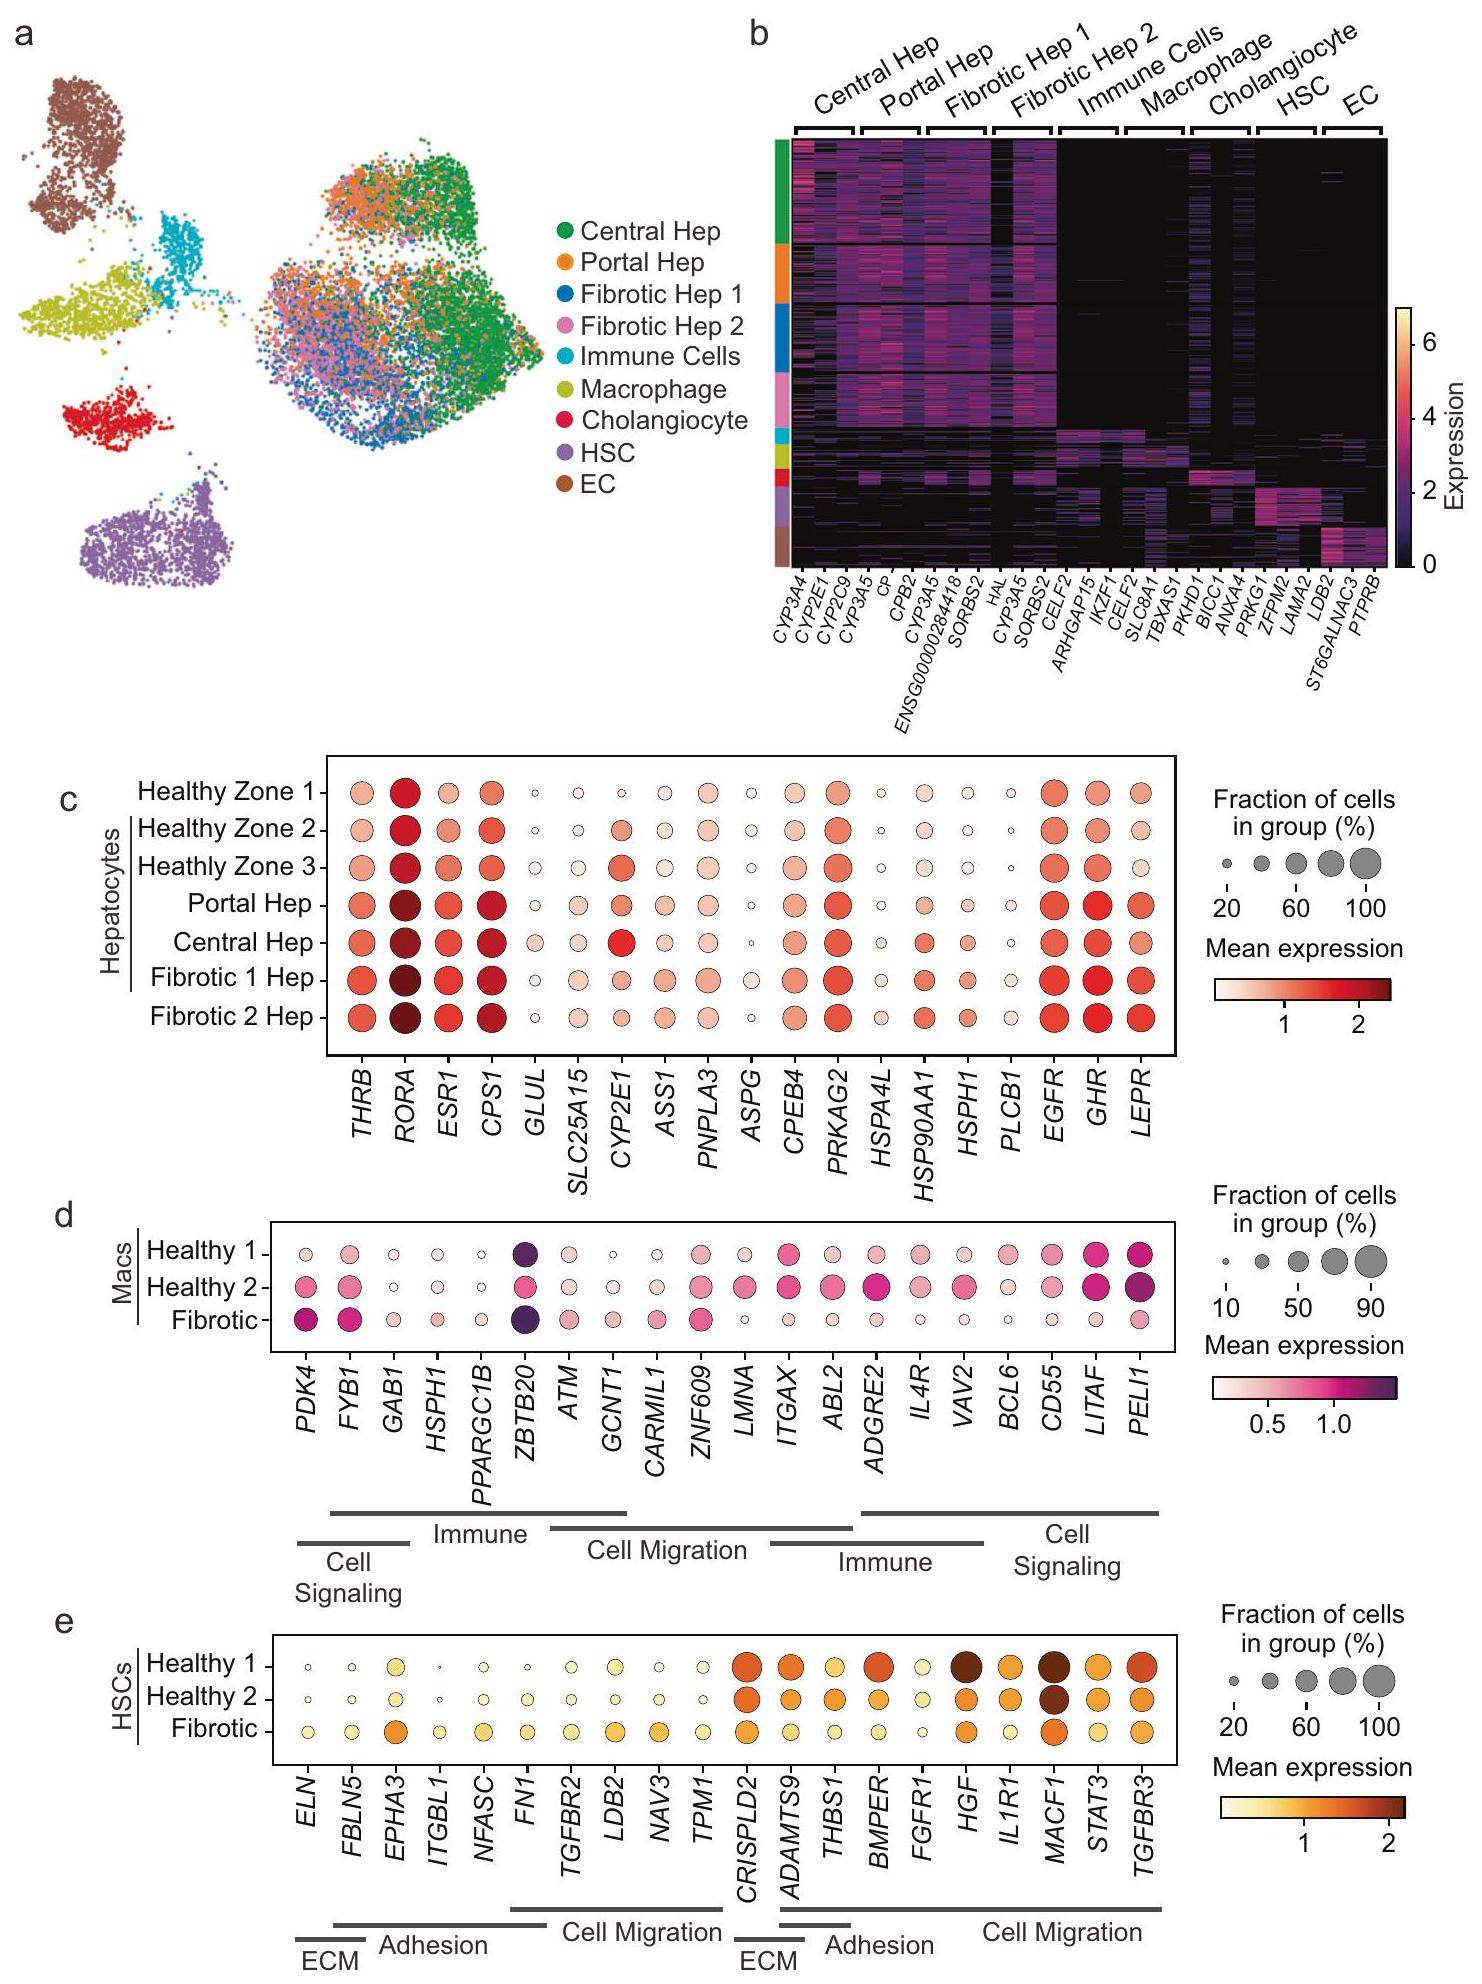
الشكل 1 | رسم الخلايا الكبدية داخل بنية كبد الإنسان السليم باستخدام MERFISH. أ تقريب متعدد الأشكال الموحد (UMAP) لجميع الخلايا المقاسة باستخدام MERFISH في كبد الإنسان السليم. ب خريطة حرارية تعرض الجينات المعبر عنها بشكل مختلف التي تحدد كل مجموعة. يتم الإشارة إلى تعبير الجينات المنظم بواسطة اللون. تمثل كل عمود خلية واحدة، ويتم تجميع الخلايا حسب المجموعة كما هو موضح باللون على يسار الخريطة الحرارية. يتم الإشارة إلى الجينات في أعلى الخريطة الحرارية، ومجموعات الجينات المميزة لمجموعات فردية موضحة في الأسفل. يتم عرض التجميع الهرمي على اليمين. يتم عرض الجينات المثرية في كل مجموعة. قد تظهر الجينات أكثر من مرة إذا كانت مثرية في أكثر من مجموعة. ج-هـ توزيع الخلايا التي تعبر عن SDS وCYP2A6 (المثرية في المنطقة 1، ج)، ALDOB وADH1B (الأكثر إثراءً في المنطقة 2، د)، وCYP2E1 وCYP1A2 (المثرية في
المنطقة 3، هـ) في مقطع من نسيج الكبد. قضبان القياس: . يتم قياس مستوى التعبير في تعبير الجينات المنظم.رسم نقطي يحدد تعبير الجينات المرسومة فيحيث يمثل حجم النقطة نسبة الخلايا التي تعبر عن جين معين، وتشير كثافة اللون إلى متوسط التعبير.توزيعات mRNA عبر فص واحد. تمثل كل نقطة نسخة mRNA فردية للجين المحدد موجهة من منطقة بوابة في الأعلى إلى منطقة مركزية في الأسفل. ثم تم رسم الوفرة النسبية لكل نسخة عبر الفص (اللوحة السفلية) لنفس مجال الرؤية. قضبان القياس: التوزيع المكاني للخلايا المعينة لكل مجموعة من الخلايا الكبدية (Hep 1، Hep 2، أو Hep 3). تتوافق خلايا Hep 1 (البنفسجي) مع المناطق حول البوابة (المنطقة 1)، وتتناسب خلايا Hep 3 (الوردي) مع المناطق حول المركز (المنطقة 3)، وتتناسب خلايا Hep 2 (البني) بين خلايا Hep 1 وHep 3 (المنطقة 2). قضيب القياس: .
عرضت هذه الخلايا أيضًا توزيعات مكانية مختلفة، حيث كانت خلايا HSC 1 مثرية في المناطق حول البوابة وموزعة عبر الفصوص، بينما كانت خلايا HSC 2 متناثرة بشكل أكثر انتشارًا عبر الفصوص دون إثراء حول البوابة. اختلفت هاتان المجموعتان بشكل أساسي في مستويات تعبير CD74، بينما عبرت كلا المجموعتين عن PDGFRB وLAMB1 (الشكل 2f، i؛ الشكل التكميلي 6d).
تم تحديد خلايا القناة الصفراوية وECs أيضًا بواسطة MERFISH وتبعت توزيعات متوقعة (الشكل 2a، b، g؛ الشكل التكميلي 6e). تم تحديد خلايا القناة الصفراوية في المناطق البوابة وتم التعرف عليها من خلال تعبير KRT7 (الشكل 2h، اليسار؛ الشكل التكميلي 6f، اليسار)، بينما تم التعرف على ECs، العديد منها يصف الأوعية الشعرية، بشكل أكثر انتشارًا عبر الكبد، وعبرت عن DNASE1L3 (الشكل 2h، اليمين؛ الشكل التكميلي 6f، اليمين). لم نلاحظ أنماطًا واضحة من التقسيم في تعبير الجينات داخل هذه المجموعات غير البرانشيمية، مما يشير إلى أنه، إذا كانت مثل هذه التدرجات موجودة في كبد الإنسان، فإن مكتبة MERFISH الخاصة بنا لا تحتوي على الجينات المناسبة لالتقاطها.
دمج MERFISH مع بيانات snRNA-seq
MERFISH يحدد الخلايا البرنشيمية وغير البرنشيمية في نسيج الكبد البشري بدقة خلوية فردية ويوفر بيانات التعبير لمئات الجينات، لكنه لا يغطي الجينوم الكامل. لمعالجة هذه القيود، قمنا بعد ذلك بإجراء تحليل snRNA-seq لنفس عينات الكبد البشري التي تم تحليلها بواسطة MERFISH، مما يوفر ملف تعريفالنوى بعد التصفية (الشكل التوضيحي 7a). أظهرت تصور UMAP وتجمع Leiden تنوعًا مشابهًا لعدد الخلايا في بيانات snRNA-seq لما لاحظناه في بيانات MERFISH (الشكل 3a، b، الشكل التوضيحي 7b، c). ثم استخدمنا أدوات دمج البيانات القياسية لتجميع الخلايا الكبدية في بيانات snRNA-seq مع تلك المقاسة في MERFISH (الشكل 3a، b؛ الشكل التوضيحي 8a). أظهر تصور بيانات snRNA-seq بعد هذا الدمج أننا استطعنا تحديد مناطق الخلايا الكبدية 1 و2 و3 كما هو موضح في بيانات MERFISH، لكن محور تقسيم المناطق داخل الخلايا الكبدية لم يكن واضحًا في بيانات snRNA-seq كما كان في قياسات MERFISH (الشكل 1a؛ الشكل 3a).
من خلال الاستفادة من تحليل تسلسل RNA الصغير (snRNA-seq) وحده، قمنا أيضًا بتعريف مجموعتين من خلايا الدم الجذعية (HSCs)، ومجموعتين من البلعميات، ومجموعة من خلايا القنوات الصفراوية، ومجموعة من خلايا البطانية (ECs) (الشكل 3أ، ب؛ البيانات التكميلية 2). كانت ملفات التعبير الجيني لمجموعات snRNA-seq التي تم تحديدها من خلال هذا التحليل تتوافق مع ملفات التعبير الخاصة بمجموعات MERFISH المقابلة، مما يدعم تعيينها، ويعزز صحة ملفات التعبير المقاسة باستخدام كلا التقنيتين، ويقدم مزيدًا من الدعم لتقسيم MERFISH (الشكل التكميلية 8ب-د). ومع ذلك، لاحظنا بعض الأدلة على انخفاض تعبير علامات خلايا الدم الجذعية والبلعميات في خلايا القنوات الصفراوية التي تم رؤيتها باستخدام snRNA-seq مقارنة بتلك التي تم رؤيتها باستخدام MERFISH، مما يتماشى مع تحديات التقسيم المتواضعة مع هذه الخلايا (الشكل التكميلية 8د). بالإضافة إلى ذلك، حددت بيانات snRNA-seq أيضًا مجموعة من خلايا المناعة غير البلعومية، والتي لم يتم تعريفها في بيانات MERFISH (الشكل 3أ).
تشكيل مناطق الكبد يؤثر على التفاعلات مع الخلايا غير الكبدية
بينما لم نلاحظ توزيعات واضحة في المناطق في الخلايا غير الكبدية، لاحظنا أن التباين في تعبير الجينات في الخلايا الكبدية ومع ذلك، يمكن أن تخلق منطقة للتفاعلات بين الخلايا الكبدية وهذه المجموعات الخلوية الأخرى. لاستكشاف هذه الإمكانية، استخدمنا CellPhoneDBمع بيانات تسلسل RNA الصغيرة غير المشفرة لدينا لاستكشاف أوضاع محتملة للتفاعلات بين الخلايا التي يمكن أن تتشكل بواسطة تقسيم الكبد (الطرق؛ البيانات التكميلية 3). على وجه التحديد، ركزنا هذا التحليل فقط على تفاعلات المستقبلات-الليغاند التي تتزايد بشكل فريد بين الخلايا الكبدية من مناطق محددة وأنواع الخلايا القريبة من هذه الخلايا الكبدية المقسمة (الشكل 3c، البيانات التكميلية 3). على سبيل المثال، في منطقة المحيط البابي، أنتجت الخلايا الكبدية (المنطقة 1) TGFB3، الذي يمكن أن يتفاعل مع TGFBR1 المعبر عنه في خلايا Mac 1 وMac 2. PLA2G2A، وهو فوسفوليباز سري.يمكن أن تتفاعل مع الإنتغرينات a4b1 و a5b1، مما يسمح لخلايا الكبد المحيطية بالإشارة إلى HSC 1 و HSC 2 و Mac 1 و Mac 2 و ECs. يمكن أن يتعارض IL1RN الذي تنتجه خلايا الكبد المحيطية مع IL1R المعبر عنه من قبل خلايا Mac 1. يمكن أن تشير TF التي تنتجها خلايا Mac 1 إلى TFRC على خلايا الكبد المحيطية، بينما تعبر HSC 1 و ECs عن EFNA5 و EFNB2، على التوالي، للإشارة إلى خلايا الكبد البوابية من خلال EPHA2 و EPHB1.
“في المنطقة المحيطية، يمكن أن تشير الخلايا الكبدية إلى خلايا HSC 1 و HSC 2 من خلال التعبير عن GDF7، الذي يمكن التعرف عليه بواسطة عدة مستقبلات BMP في خلايا HSC 1 و HSC 2. يتم التعرف على تعبير TENM3 أو TENM2 من قبل الخلايا الكبدية المحيطية بواسطة ADGRL2 و/أو ADGRL3، التي يتم التعبير عنها بواسطة خلايا HSC 1 و HSC 2 و Mac 1. يتم التعرف على VEGFA، الذي يتم التعبير عنه بواسطة الخلايا الكبدية المحيطية، بواسطة NRP2، الذي يتم التعبير عنه بواسطة خلايا HSC 1 و NRP1 الذي يتم التعبير عنه بواسطة خلايا Mac 2. يمكن أن تشير HEBP1 من الخلايا الكبدية المحيطية أيضًا إلى خلايا Mac 1 و Mac 2 التي تعبر عن FPR3، بينما يمكن أن يشير التعبير المحيطي عن CCL16 إلى CCR1 المعبر عنه على خلايا Mac 2. يمكن أن تشير THBS1 و THBS2 التي تنتجها HSCs إلى CD36 المعبر عنه في الخلايا الكبدية المحيطية. يتم الكشف عن THBS1/2 بأعلى مستوى في HSCs ويمكن أن تشير إلى CD36 المعبر عنه بواسطة الخلايا الكبدية المحيطية (البيانات التكميلية 3)، بينما يتم أيضًا إثراء زوج المستقبل-الليغاند THBS1CD36 بين الخلايا الكبدية المحيطية والبلعميات. يمكن أن تشير GAS6 التي تنتجها HSC 1 و ECs إلى الخلايا الكبدية المحيطية من خلال MERTK، بينما يمكن التعرف على SEMA4D المعبر عنه بواسطة خلايا Mac 1 و Mac 2، و VEGFB الذي تنتجه خلايا Mac 2 بواسطة PLXNB2 و NRP1، على التوالي، وكلاهما يتم التعبير عنه بواسطة الخلايا الكبدية المحيطية. تنتج ECs و خلايا Mac 2 أيضًا WNT2B، الذي يمكن التعرف عليه بواسطة FZD6-LRP5/6 في الخلايا الكبدية المحيطية، مع أعلى درجات التفاعل التي لوحظت بين ECs و الخلايا الكبدية في المنطقة 3 (البيانات التكميلية 3). تسلط هذه النتائج الضوء على تفاعلات المستقبل
أثر المحتوى النووي على تعبير الجينات في الخلايا الكبدية
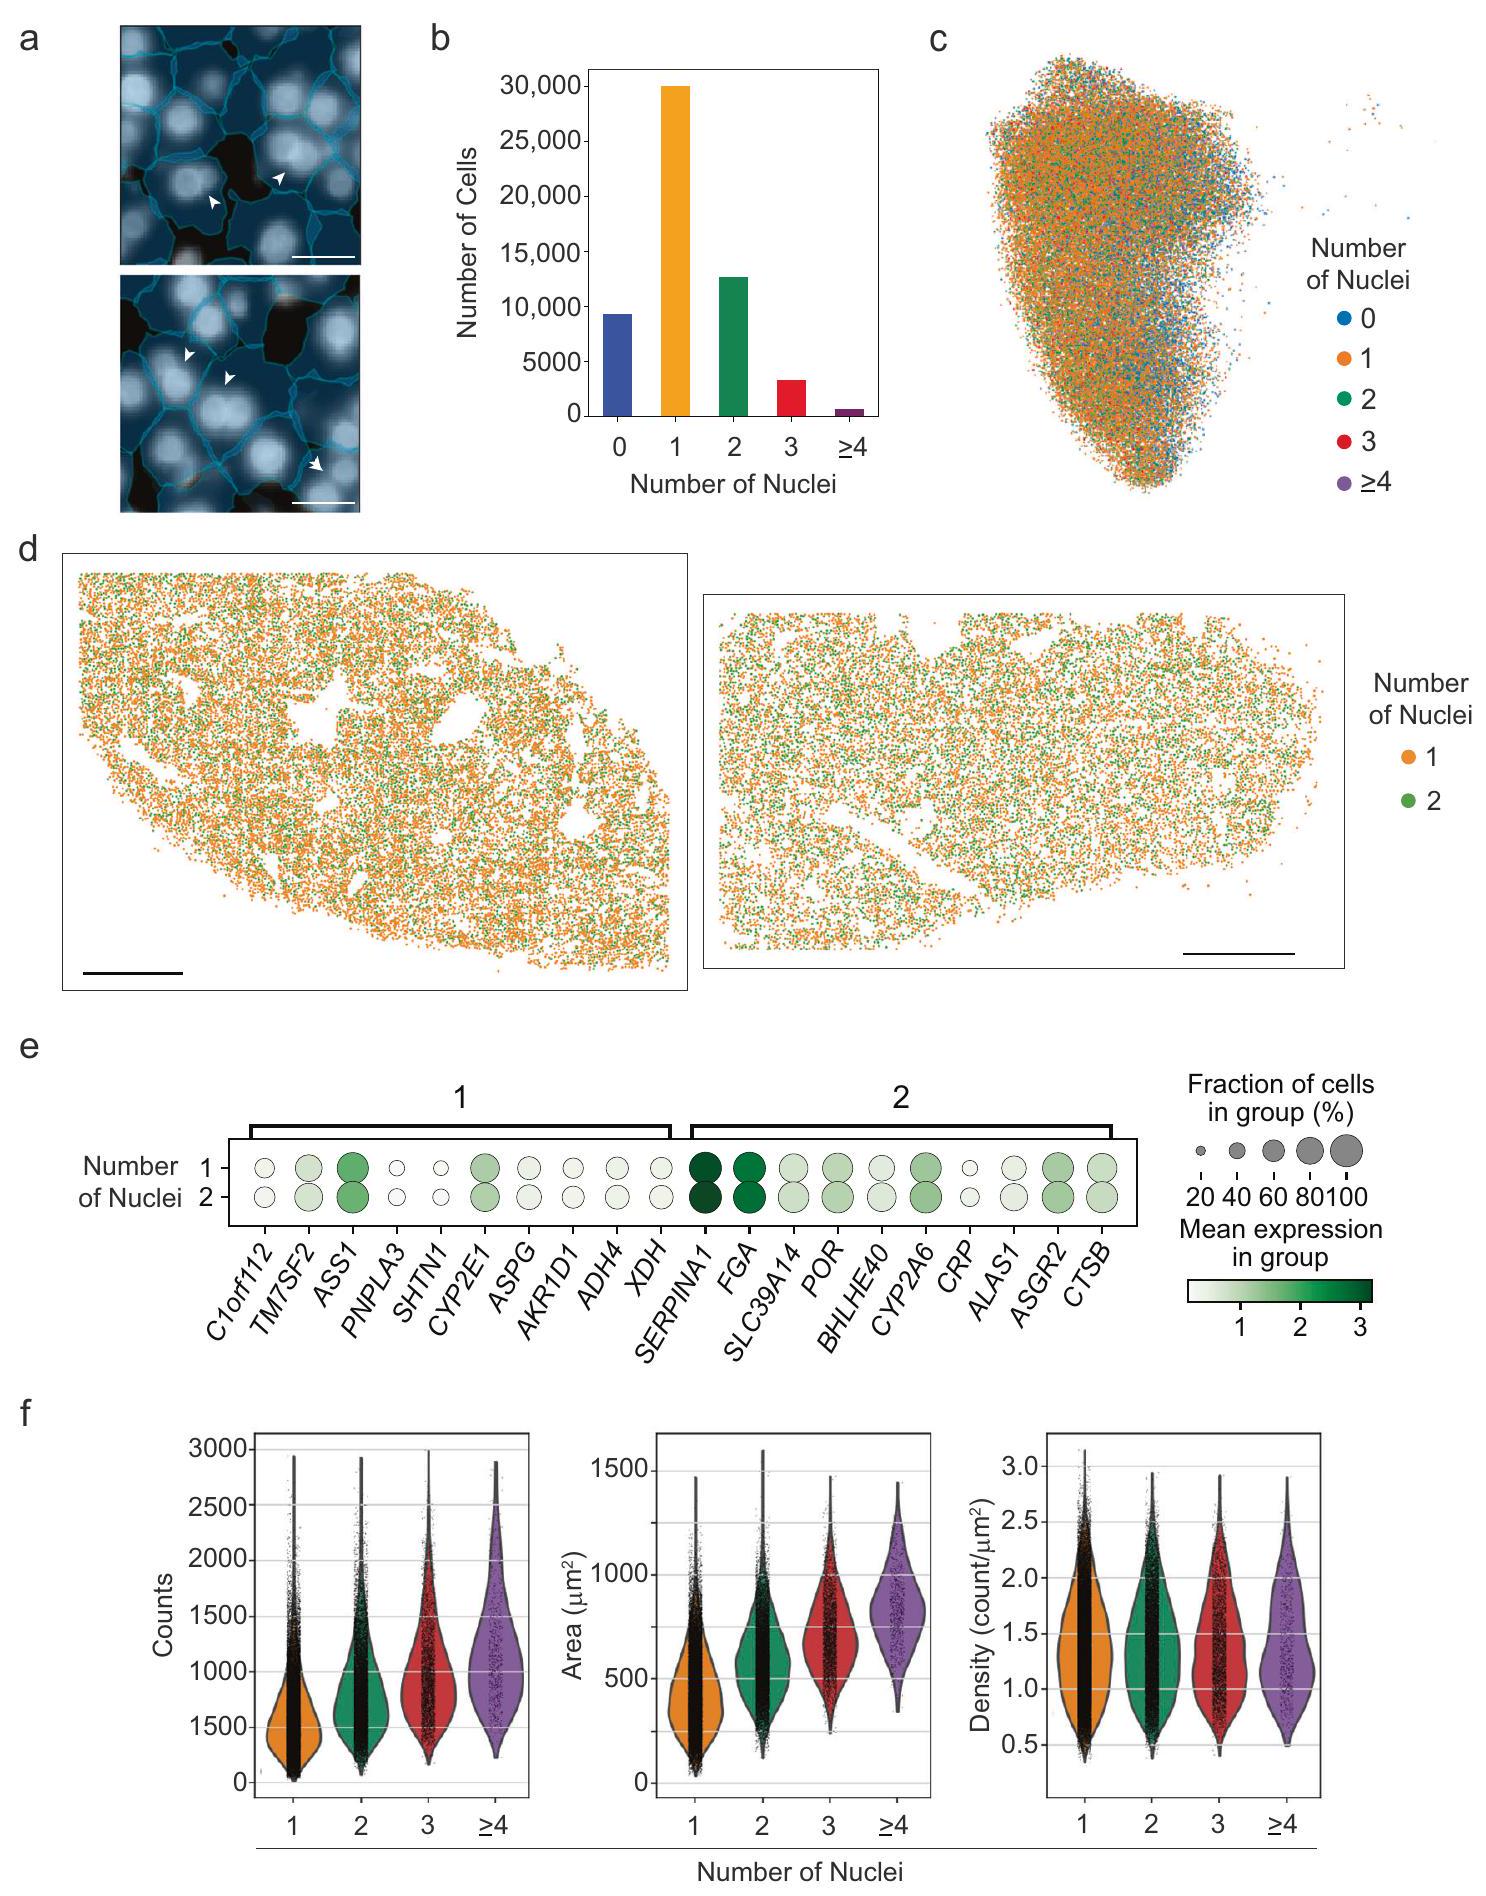
تمتلك الخلايا الكبدية القدرة على تكرار نواتها دون الانقسام، مما ينتج خلايا متعددة الصبغيات ومتعددة النوى.ليس من الواضح ما إذا كان المحتوى النووي الإضافي يؤدي إلى تغييرات محددة في تعبير الجينات التي يمكن أن تعدل الوظيفة، أو إلى أي درجة يؤثر التوزيع على المحتوى النووي في الكبد البشري. كنهج قائم على الصور في علم النسخ، يوفر MERFISH بشكل طبيعي مقياسًا لمحتوى النواة في كل خلية. للاستفادة من هذه القدرة، قمنا بعدّ عدد النوى الملحوظة في كل كبد فردي وارتبطت هذه الخاصية بجوانب تعبير الجينات والموقع المكاني.
الشكل 2 | خرائط MERFISH للخلايا غير النسيجية داخل الكبد السليم. توزيع مكاني لجميع الخلايا المحددة بواسطة MERFISH ضمن بنية الكبد السليم لنسج من متبرعين مختلفين، المتبرع 1 (أ) والمتبرع 2 (ب). قضبان القياس:التوزيع المكاني لمجموعات البلعميات (ج)، والخلايا الجذعية الكبدية (هـ)، وخلايا القنوات الصفراوية وخلايا البطانية (ز) المرسومة في نفس مقطع الأنسجة كما في (أ). مقياس الأشرطة:التوزيع المكاني للخلايا في نفس شريحة الأنسجة كما في (أ)
ملون بالتعبير المنظم لجينات العلامة المحددة. CD74 و CD5L تحدد البلعميات (د)، PDGFRB و LAMB1 تحدد خلايا الجذع الدموية (ف)، KRT7 تحدد خلايا القنوات الصفراوية، و DNAS1L3 تحدد خلايا البطانية (هـ). شريط القياس:رسم نقطي ي quantifies تعبير الجينات التي تحدد الخلايا غير البرانشيمية في الكبد. حجم النقطة يمثل نسبة الخلايا التي تعبر عن جين معين، وشدة اللون تشير إلى متوسط التعبير.
في الواقع، لاحظنا كل من الخلايا الكبدية أحادية النواة ومتعددة النوى في بيانات MERFISH (الشكل 4a) ووجدنا أن حوالي ثلث الخلايا الكبدية كانت متعددة النوى (الشكل 4b). لم يتغير توزيع الخلايا الكبدية أحادية النواة ومتعددة النوى عبر الخلايا الكبدية. المناطق (الشكل 4c، d)، ولم نلاحظ أي تغييرات ملحوظة في تعبير الجينات بين الخلايا الكبدية ذات نواة واحدة أو نواتين كما تم قياسه بواسطة MERFISH (الشكل 4e). ومع ذلك، زادت إجمالي عدد RNA لكل خلية مع زيادة عدد النوى (الشكل 4f، اليسار) كما زادت مساحة الخلية.
تطبيق النسخ الجيني المكاني في تليف الكبد
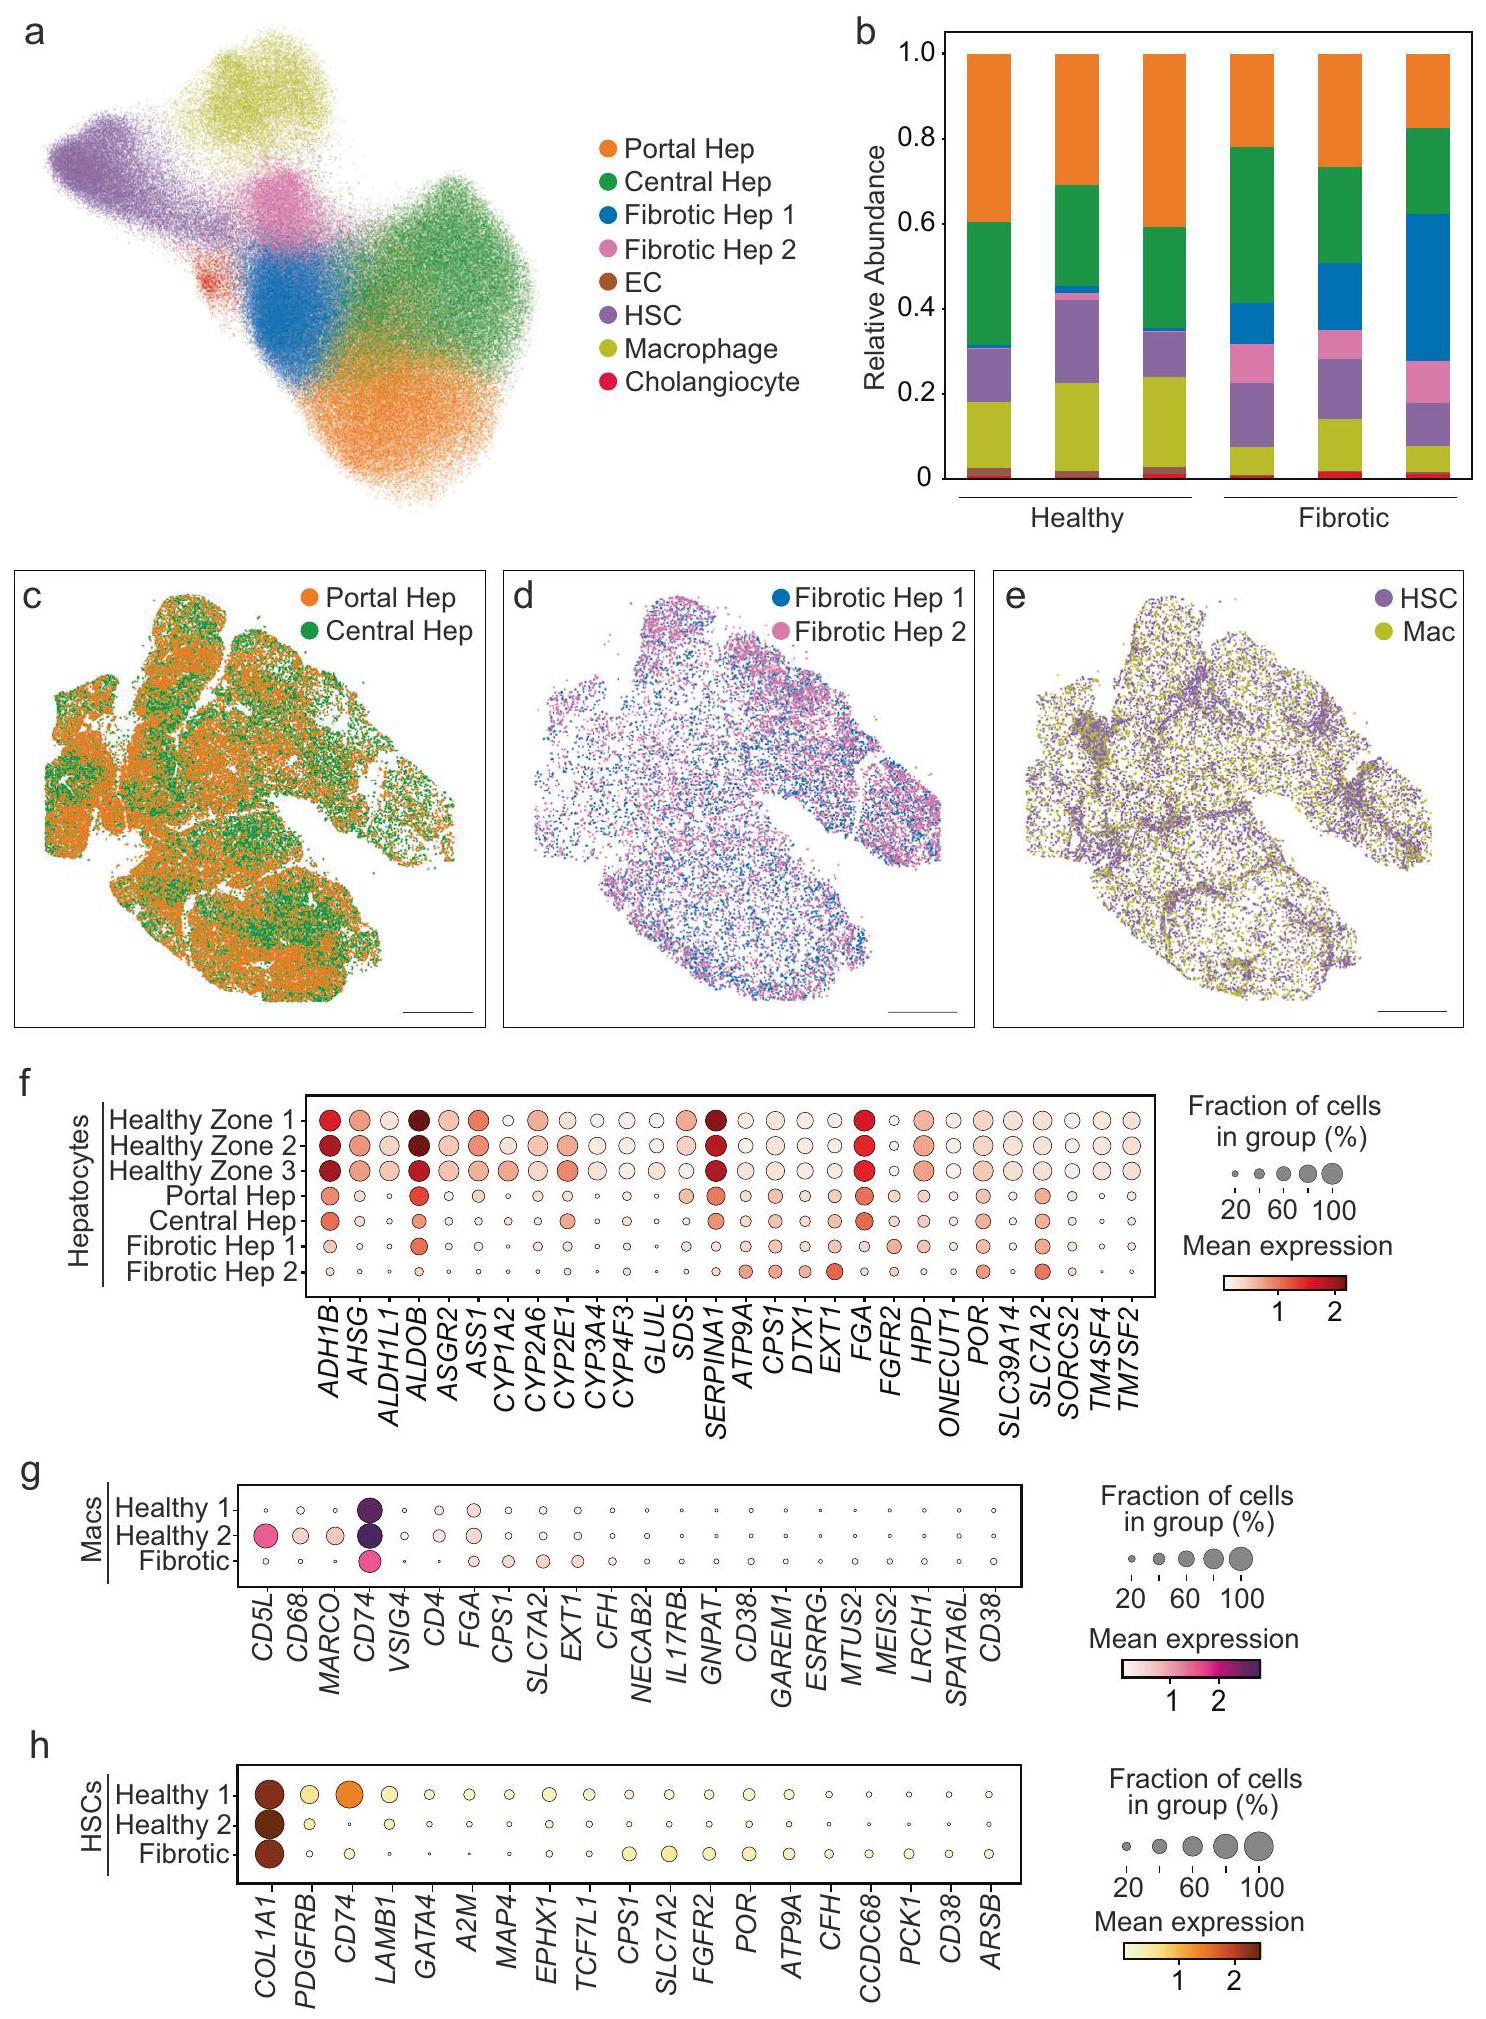
من أجل استكشاف إعادة تشكيل الفضاء والخلايا التي تحدث في سياق المرض، قمنا بعد ذلك بإجراء MERFISH على عينات كبد بشرية من مرضى يعانون من إصابة الكبد والتليف (الجدول التكميلي 1 والشكل التكميلي 1). استغلينا نفس البروتوكولات كما هو موصوف أعلاه لتصوير وتقسيم الخلايا، وفي المجموع، قمنا بتصويرالخلايا (الشكل التكميلي 9). من أجل مقارنة الخلايا الكبدية بين الكبد الطبيعي والكبد الليفي، قمنا بتطبيق طرق تصحيح الدفعات لدمج بيانات MERFISH بشكل مشترك عبر جميع العينات (الشكل 5 أ، ب؛ الشكل التكميلي 10). بدلاً من ثلاث مناطق من الخلايا الكبدية، أنتج هذا التحليل المشترك منطقتين: مجموعة محيطية من الخلايا الكبدية (Portal Hep) ومجموعة مركزية من الخلايا الكبدية (Central Hep)، والتي احتوت مجتمعة على خلايا كبدية من المنطقة 1 و2 و3 من الكبد الصحي (الشكل 5 أ، الشكل التكميلي 9 ب-د، الشكل التكميلي 10، البيانات التكملية 2). بالإضافة إلى ذلك، تم تحديد مجموعتين كانتا تتكونان تقريبًا بالكامل من الخلايا الكبدية الناتجة عن الإصابة الليفية (Fibrotic Hep 1 و2) (الشكل 5 أ، الشكل التكميلي 9 ب-د، الشكل التكميلي 10، البيانات التكملية 2). احتفظت الخلايا الكبدية المحيطية والخلايا الكبدية المركزية بموقعها المتوقع في سياق إصابة الكبد المزمنة (الشكل 5 ج)، بينما كانت المجموعتان من الخلايا الكبدية اللتين ظهرتا مع الإصابة الليفية موزعتين في جميع أنحاء الفصوص (الشكل 5 د). تم أيضًا تحديد مجموعة واحدة من خلايا HSC ومجموعة واحدة من البلعميات (الشكل 5 أ، ب؛ البيانات التكملية 2). عرضت خلايا HSC شرائط من الخلايا عبر الفصوص، بينما كانت البلعميات منتشرة بشكل أكثر انتشارًا عبر الفصوص (الشكل 5 هـ). وبالتالي، نجد أن تقسيم الخلايا الكبدية لا يزال محفوظًا جزئيًا على الأقل مع الإصابة الليفية، بينما يتم إثراء حالتين من الخلايا الكبدية المرتبطة بالإصابة التي لا يبدو أنها تحتفظ بالتقسيم.
بعد ذلك، قمنا بتقييم التغيرات في التعبير الجيني بين الخلايا الكبدية في الكبد الصحي وتلك التي تعاني من إصابة ليفية باستخدام MERFISH (الشكل 5 و؛ البيانات التكملية 4). من أجل هذا التحليل، قمنا أولاً بفصل الخلايا الكبدية الصحية إلى مناطقها الثلاث الأصلية (المنطقة الصحية 1، 2، 3) وقارنّا التعبير مع الخلايا الكبدية المحيطية والمركزية من الكبد الليفي (Portal Hep وCentral Hep؛ البيانات التكملية 4). تحتفظ الخلايا الكبدية المحيطية والمركزية من الكبد الليفي بنفس التعبير الجيني المنطقي مثل المنطقة الصحية 1 و2 و3 وتتميز بشكل أساسي بتقليل التعبير عن هذه الجينات. ثم قمنا بتقييم التعبير الجيني للسكان الليفيين الموسعين (Fibrotic Hep 1 و2) (الشكل 5 و، الأسفل؛ البيانات التكملية 4). أظهرت مجموعة Fibrotic Hep 1 انخفاضًا عامًا في التعبير عن الجينات الغنية في الخلايا الكبدية، بينما أظهرت مجموعة Fibrotic Hep 2 زيادة في التعبير عن عدة جينات ملحوظة، بما في ذلك SLC7A2 وCPS1 وATP9A وDTX1 وPOR وEXT1 مقارنة بجميع مجموعات الخلايا الكبدية الأخرى.
أظهرت المجموعات غير الكبدية أيضًا تغييرات في التعبير الجيني المرتبطة بالمرض. على سبيل المثال، أظهرت البلعميات الليفية فقدان MARCO وCD5L وCD68 واحتفظت بنمط تعبير يتطابق بشكل أقرب مع خلايا Mac 1 في الكبد الطبيعي (الشكل 5 ز)، بينما حافظت خلايا HSC الليفية على مستويات عالية من تعبير COL1A1 دون وجود توقيع إيجابي واضح من الجينات الأخرى المدرجة في لوحة MERFISH (الشكل 5 ح).
تغيرات التعبير على مستوى النسخ في التليف
لتوسيع تحليلنا على مستوى النسخ، قمنا بعد ذلك بإجراء snRNA-seq على نفس العينات التي تم تمييزها باستخدام MERFISH، وجمعنا النوى عبر هذه العينات الثلاث (الشكل 6؛ الشكل التكميلي 11). أنتج تحليل بيانات snRNA-seq وحده نفس المجموعات غير الكبدية كما هو موضح في MERFISH؛ ومع ذلك، من أجل دمج تمييز الخلايا الكبدية بشكل أفضل، قمنا بدمج وتجمع الخلايا الكبدية بين هذين القياسين (الشكل 6 أ، ب؛ الشكل التكميلي 12 أ، ب). من المهم أن يكشف هذا التحليل عن نوى في بيانات snRNA-seq كانت مشابهة لمجموعتي الخلايا الكبدية الليفية (Fibrotic Hep 1 وFibrotic Hep 2) التي تم رؤيتها في قياسات MERFISH، مما يدعم ظهور هاتين المجموعتين المرتبطتين بالمرض (الشكل التكميلي 12 أ، ب).
ثم استخدمنا بيانات النسخ الأكثر اكتمالًا من snRNA-seq لتقييم الفروق في التعبير الجيني بين
الخلايا الكبدية في الكبد الصحي والكبد الذي يعاني من إصابة ليفية. في الواقع، كانت هناك تنوع وظيفي كبير من الجينات التي تم التعبير عنها بشكل مختلف بين الخلايا الكبدية ضمن هذه الظروف (البيانات التكملية 4). لتنظيم هذه الوظائف، قمنا بإجراء تحليل علم وظائف الجينات (GO)، والذي أظهر أن الجينات التي تم تحفيزها مع الإصابة كانت غنية عبر العديد من المسارات الأيضية (البيانات التكملية 5). وبالتالي، ركزنا على الفئة العامة الأكثر من العمليات الأيضية (GO:0008152) لالتقاط هذه التغيرات في التعبير الجيني (الشكل 6 ج، البيانات التكملية 6). عند مقارنة جميع الخلايا الكبدية الصحية مع جميع الخلايا الكبدية المصابة، كانت المجموعة الأكثر غنى من الجينات الأيضية تشمل تلك التي لها نشاط ديهيدروجيناز وأكسيداز وهيدرولاز جنبًا إلى جنب مع مستقبلات نووية THRB وRORA وESR1 (البيانات التكملية 4 والبيانات التكملية 6). لوحظ أيضًا زيادة في التعبير في الليغازات CPS1 وGLUL وناقل SLC25A15، والتي تشارك في مسار اليوريا (البيانات التكملية 6).
مع الإصابة، استمرت الخلايا الكبدية التي تحتفظ بالتقسيم المحيطي والمركزي (Portal Hep وCentral Hep) في إظهار زيادة في التعبير عن الهيدرولازات والأكسيدازات، ومُستقبلات نووية THRB وRORA وESR1 مقارنة بالخلايا الكبدية الصحية من المناطق 1 و2 و3، وكان تحفيز الديهيدروجينازات الأكثر وضوحًا في Central Heps مع الإصابة (الشكل 6 ج، البيانات التكملية 4 والبيانات التكملية 6). بينما تزداد الأكسيدازات في كل من Portal وCentral Heps مع الإصابة، يظهر CYP2E1 أعلى تعبير في Central Heps مع الإصابة (الشكل 6 ج، البيانات التكملية 4 والبيانات التكملية 6). تزداد الليغاز CPS1 في كلا المجموعتين، وتبقى GLUL أكثر تقييدًا في Central Heps وASS1 في Portal Heps مع الإصابة. ضمن المجموعات الكبدية التي تظهر مع الإصابة الليفية ولا تظهر توزيعًا منطقيًا (Fibrotic Hep 1 و2، الشكل 5 د)، نلاحظ مرة أخرى زيادة في المسارات الأيضية، بشكل أساسي تلك التي تتعلق بالأحماض الدهنية والأحماض الأمينية، بينما يتم تقليل المسارات المتعلقة بمعالجة RNA وتخليق الريبوسوم (الشكل التكميلي 13 أ، ب). تستمر كل من Fibrotic Hep 1 وFibrotic Hep 2 في إظهار زيادة في التعبير عن مستقبلات نووية THRB وRORA وESR1 (الشكل 6 ج، البيانات التكملية 4 والبيانات التكملية 6) وتحافظ على زيادة التعبير عن CPS1 وSLC25A15. خلايا Fibrotic Hep 1 غنية نسبيًا في الأكسيدازات مقارنة بخلايا Fibrotic Hep 2 وتشتهر بزيادة التعبير عن الفوسفوليباز PNPLA3 , جنبًا إلى جنب مع ASPG وCPEB4 وPRKAG2. تظهر خلايا Fibrotic Hep 2 زيادة نسبية في التعبير عن الهيدرولازات وبروتينات الصدمة الحرارية (HSPH1 وHSP9OAA1، بينما يتم إثراء HSPH1 في كل من Fibrotic Hep 1 و2)، وPLCB1 مقارنة بخلايا Fibrotic Hep 1. يتم زيادة المستقبل الغشائي في خلايا Fibrotic Hep 1 وFibrotic Hep 2، بينما يتم زيادة المستقبل الغشائي في جميع مجموعات الخلايا الكبدية المصابة، و يتم إثراؤه في Portal Heps المصابة ومجموعات Fibrotic Hep 1 وFibrotic Hep 2 (الشكل 6 ج، البيانات التكملية 4 والبيانات التكملية 6). تظهر هذه النتائج التأثير الأيضي للإصابة المزمنة على الخلايا الكبدية، بما في ذلك التنشيط الشائع لمستقبلات الهرمونات النووية والجينات التي تنظم مسار اليوريا، وزيادة أكثر تقييدًا في تحفيز المستقبلات الغشائية وبروتينات الصدمة الحرارية، والفوسفوليباز PNPLA3.
تم تقييم التعبير الجيني أيضًا في الخلايا غير البرانشيمية. مع الإصابة، أظهرت البلعميات تغييرات في التعبير الجيني في مسارات تشمل إشارات الخلايا، هجرة الخلايا، والاستجابة المناعية عند مقارنتها بـ Mac 1 و Mac 2 من الكبد السليم (الشكل 6d، البيانات التكميلية 2). شملت التغييرات في التعبير الجيني في خلايا ستار (HSCs) مع الإصابة تلك المتعلقة بالمصفوفة خارج الخلوية، هجرة الخلايا، والتصاق الخلايا عند مقارنتها بـ HSC 1 و HSC 2 في الكبد السليم (الشكل 6e، البيانات التكميلية 2). كما أظهرت الخلايا البطانية (ECs) وخلايا القناة الصفراوية (cholangiocytes) تغييرات في التعبير الجيني عبر فئات تشمل التصاق الخلايا وإشارات مستقبلات سطح الخلية مع الإصابة (الشكل التكميلية 12c، d؛ البيانات التكميلية 2). تظهر هذه النتائج أن مجموعة البلعميات المحددة مع الإصابة تختلف عن Mac 1 و Mac 2 المحددة في المتبرعين الأصحاء. وبالمثل، فإن مجموعة HSC المحددة في الإصابة تختلف عن HSC 1 و HSC 2 في المتبرعين الأصحاء.
الشكل 4 | الخلايا الكبدية متعددة النوى لا تمتلك توزيعات فريدة من حيث المكان أو التعبير الجيني. أ مثال لصور MERFISH DAPI تظهر خلايا كبدية تحتوي على نواة واحدة وأخرى متعددة النوى. تم الإشارة إلى أمثلة الخلايا متعددة النوى بواسطة رؤوس الأسهم البيضاء. تلوين DAPI يحدد النوى (باللون الأبيض)، وحدود الخلايا (باللون الأزرق الفاتح) تم تحديدها بواسطة Baysor بمساعدة من Cellpose. مقياس الأشرطة:. ب توزيع عدد النوى لكل خلية كبدية. ج خريطة UMAP للخلية الكبدية، كما في الشكل 1، ملونة بعدد النوى الموجودة داخل كل خلية كبدية. بيانات المصدر هي مقدمة كملف بيانات المصدر. التوزيع المكاني للخلايا الكبدية مع نواة واحدة أو اثنتين تم اكتشافها في كبد إنسان سليم (المانح 1، يسار والمانح 2، يمين). شريط القياس:مخططات النقاط لجينات الكبد للخلايا الكبدية ذات نواة واحدة أو نواتين. تمثل حجم الدوائر نسبة الخلايا التي تعبر عن جين في كل مجموعة، بينما تشير شدة اللون إلى متوسط التعبير.توزيع النسخ لكل خلية (يسار)، المساحة لكل خلية (وسط) وكثافة RNA لكل خلية (يمين) للخلايا الكبدية ذات المحتوى النووي المحدد. تم توفير بيانات المصدر كملف بيانات مصدر.
نقاش
تم تحقيق تقدم كبير في رسم خريطة الكبد البشري بدقة الخلية الواحدة مؤخرًا باستخدام تسلسل RNA أحادي الخلية (scRNA-seq) وتسلسل RNA النووي أحادي الخلية (snRNA-seq).. بالتوازي، منصات مثل فيزيومالآن توفر معلومات مكانية، ولكن لا يزال من الصعب تخصيص النصوص لـ الخلايا الفردية وأنواع الخلايا الموجودة بالقرب من بعضها البعض. هنا نكمل هذه الجهود السابقة من خلال تطوير بروتوكولات لتطبيق MERFISH في عينات الكبد البشري واستخدام هذه الطرق لتحقيق تحليل النسخ الجزيئي المكاني لـالجينات بدقة الخلية الواحدة في الكبد البشري، تحليلالخلايا في
الشكل 5 | تكشف MERFISH عن توزيع محفوظ وتوسع في تجمعات الخلايا الكبدية في الكبد المتليف الذي لا يتبع التوزيع المنطقي. أ UMAP للأنسجة المتليفية المقاسة باستخدام MERFISH. يتم الإشارة إلى التجمعات بواسطة اللون. تظهر خلايا الكبد البوابية وخلايا الكبد المركزية تشابهات مع الخلايا الكبدية المحددة كخلايا من المنطقة 1 و2 و3 من الكبد السليم، وتحتوي خلايا الكبد المتليفية 1 وخلايا الكبد المتليفية 2 على تجمعات من الخلايا الكبدية التي تظهر مع إصابة التليف. يظهر تجمع HSC تشابهات مع كل من خلايا HSC 1 وHSC 2 من الكبد السليم، ويظهر تجمع Mac تشابهات مع كل من تجمعات Mac 1 وMac 2 من الكبد السليم. ب وفرة نسبية لكل نوع من الخلايا المحددة في كل عينة (من اليسار إلى اليمين: المتبرعين الأصحاء 1-3 تليها المتبرعين المتليفين 4-6). يتم تلوين أنواع الخلايا كما فيتُقدم بيانات المصدر كـ مصدر
ملف البيانات. توزيع الخلايا السكانية في الكبد المتليف (المانح 4)، يبرز الخلايا الكبدية التي تشبه تلك الموجودة في العينات الصحية (ج)، مجموعات الخلايا الكبدية التي يتم التعرف عليها فقط عند تضمين عينات الكبد المتليف (د)، والخلايا غير البرانشيمية الرئيسية (هـ). شريط القياس:. رسم بياني يوضح تعبير الجينات المعبر عنها بشكل مختلف في المجموعات التي تظهر في القياسات الصحية (المنطقة الصحية 1، 2، أو 3) أو في العينات الليفية (الكبد البابي، الكبد المركزي، الكبد الليفي 1، أو الكبد الليفي 2) للخلايا الكبدية (f)، البلعميات (g)، وخلايا ستيل (h). تشير Macs Healthy 1 وHealthy 2 إلى خلايا Mac 1 وMac 2 في الكبد الصحي، وتشير HSCs Healthy 1 وHealthy 2 إلى خلايا HSC 1 وHSC 2 في الكبد الصحي.
الشكل 6 | دمج MERFISH و snRNA-seq لتحليل الكبد المتليف. أ UMAP لبيانات snRNA-seq لكبد إنسان مصاب. تم تحديد التعليقات التوضيحية للخلايا الكبدية من خلال دمج البيانات من كل من MERFISH و snRNA-seq والاستفادة من تعبير جينات العلامة ونقل العلامات من MERFISH. ب خريطة حرارية تعرض الجينات المعبر عنها بشكل مختلف التي تحدد كل مجموعة من snRNA-seq. يتم الإشارة إلى مستوى التعبير المنظم بواسطة شريط الألوان على اليمين. تمثل كل عمود نواة واحدة، وتُجمع النوى حسب المجموعة كما هو موضح في أعلى الخريطة الحرارية. يتم الإشارة إلى الجينات في أسفل الخريطة الحرارية، مجموعات من خصائص الجينات لمجموعات الخلايا الفردية موضحة في الأعلى، والخلايا مجمعة حسب المجموعة كما هو موضح باللون على اليسار. الرسم النقطي (c) يquantifies تعبير الجينات المعبر عنها بشكل مختلف في المجموعات التي تم رؤيتها في القياسات الصحية (المنطقة الصحية 1، 2، أو 3) أو في العينات الليفية (الكبد البابي، الكبد المركزي، الكبد الليفي 1، أو الكبد الليفي 2) لخلايا الكبد. الرسوم النقطية التي quantifies تعبير الجينات المعبر عنها بشكل مختلف في البلعميات (d) وخلايا الكبد الجذعية (e) موضحة. تشير Macs Healthy 1 وHealthy 2 إلى خلايا Mac 1 وMac 2 في الكبد الصحي، وتشير HSCs Healthy 1 وHealthy 2 إلى خلايا HSC 1 وHSC 2 في الكبد الصحي. كلا من الكبد السليم والمريض. وقد سمح دمج MERFISH مع snRNA-seq لنا بتحليل النسخ الجيني الأوسع ضمن أنواع الخلايا وأنواع الخلايا الفرعية المحددة مكانيًا.
من هذه القياسات، تمكنا من تحديد ثلاث مجموعات من الخلايا الكبدية التي تتميز بموقعها المتميز عبر الفص في كبد الإنسان السليم، وهو ما يميز فصل الخلايا الكبدية إلى مناطق 1 و2 و3 moving من المناطق المحيطية إلى المناطق المركزية. بينما يسمح لنا MERFISH بتعريف هذه المناطق، فإنه يتضح أيضًا من خلال تحليل الزمن الزائف، وقياس التعبير الجيني عبر الفصوص الفردية، والتحليل النسخي الذي تم إجراؤه عبر الفصوص، أن تقسيم المناطق يعكس تدرجًا من المناطق المحيطية إلى المناطق المركزية بدلاً من مناطق متميزة. وبالتالي، فإن المناطق الثلاث الكلاسيكية هي، في الواقع، تقريب للتعبير الجيني المستمر والتغيرات الوظيفية التي تحدث في الفضاء مع الخلايا الكبدية البشرية – وهو اقتراح يتماشى مع التحليل الحديث على مستوى الخلية الواحدة في كبد الفأر..
مع تطور الإصابة الليفية، حافظ العديد من الخلايا الكبدية على نمط زوني، لكننا لاحظنا أيضًا ظهور مجموعتين إضافيتين من الخلايا الكبدية مع الإصابة الليفية تظهر توزيعًا منتشرًا عبر الفصوص دون انحياز إلى البوابة أو المركز (مجموعات Hep 1 و 2 الليفية؛ الشكل 5 أ، ب، د). يمكن أن تتغير الجينات المحددة التي تم التعرف عليها كمعبر عنها بشكل مختلف بين MERFISH و snRNA-seq وقد تعكس اختلافات بين التوزيع النووي والسيتوبلازمي لبعض النسخ، لكن الموضوع المشترك من كلا التحليلين كان إثراء الجينات في مسار اليوريا مع الإصابة الليفية. CPS1 (سينثاز فوسفات الكاربامويل I) مسؤول عن تحويل الأمونيا إلى فوسفات الكاربامويل للدخول في دورة اليوريا.SCL7A2 يشفر ناقل الأرجينين/الأورنيثين/الليسين ويوفر الأورنيثين (إما مباشرة أو من خلال تحويل الأرجينين) للتفاعل مع فوسفات الكاربامويل لتكوين السيترولين.و SLC25A15 هو ناقل أورنيثين في دورة اليوريا (الأشكال 5f و 6c). بالإضافة إلى ذلك، أظهرت خلايا Fibrotic Hep 1 زيادة في الجينات بما في ذلك PNPLA3 و CPEB4 و ASPG، والتي ترتبط بالتشحم الكبدي، والتهاب الكبد الدهني، و/أو التليف.وTHRB، الذي يشفر الهدف البروتيني للريزميتيروم، وهو دواء ثبت فعاليته في علاج التهاب الكبد الدهني غير الكحوليمعًا تسلط الضوء على مسارات إضافية قد تتغير في المرض.
تم تحديد نوعين من البلعميات بواسطة MERFISH وتظهر أنماط توزيع مختلفة عبر الفصيص. تم تحديد خلايا Mac 2 على أنها، و مع زيادة التعبير عن VISG4 مقارنة بخلايا Mac 1 وكانت موزعة بشكل أكثر انتشارًا عبر الفصيص، وهو ما يتماشى مع خلايا كوفبر. كانت خلايا Mac 1 و CD5L بمستويات أقل من CD68. بينما تم العثور على خلايا Mac 1 أيضًا عبر الفصيص، إلا أنها أظهرت غنى مميز في المناطق البابية مقارنة بخلايا Mac 2. أكدت المقارنات الإضافية للتعبير الجيني بين Macl و Mac 2 باستخدام snRNA-seq هذه الأنماط التعبيرية مع زيادة CD163 و VCAM1 و TMEM26 في خلايا Mac 2 (البيانات التكميلية 2)، وكلها علامات محفوظة تطوريًا لخلايا كوفبر . بينما عبرت خلايا Mac 2 عن مستويات أعلى من IL18 مقارنة بخلايا Mac 1، لم نلاحظ زيادة التعبير عن GPNMB و SPP1 أو LGALS1 في خلايا Mac 1 اللازمة لربطها بالبلاعم المرتبطة بالدهون (LAMs)، التي تم تحديدها في كبد الفئران الصحية وتوسعت مع الدهنيات . مع تطور إصابة ليفية، فقدت مجموعة البلاعم تعبير MARCO و CD5L و CD68 في بيانات MERFISH، وأظهرت تحليل snRNA-seq أيضًا انخفاضًا في MARCO و CD5L بالإضافة إلى VCAM1 و CD163. بينما تشير هذه الميزات إلى الابتعاد عن علامات خلايا كوفبر، تم الحفاظ على تعبير IL18، وظل التعبير الجيني مميزًا عن مجموعة Mac 1 (الشكل 6d).
كما حددت MERFISH مجموعتين من خلايا HSC. كانت HSC 1 غنية في المناطق البابية مقارنة بـ HSC 2، وتم العثور على كلا المجموعتين موزعتين عبر الفصيصات. ضمن الجينات التي تم تقييمها بواسطة مجسات MERFISH، أظهر الشابيرون من الفئة II MHC CD74 أكبر تعبير تفاضلي بين مجموعتي HSC، مع أعلى تعبير لوحظ في خلايا HSC 1. تم ملاحظة تأثير مشابه أيضًا في بيانات snRNA-seq. يتم التعبير عن CD74 بواسطة خلايا HSC، ويمكن تحفيزه بواسطة إشارات التهابية مثل IFN- ويمكن
تعزيز تنشيط المناعة من خلال تفاعلات متوسطة MHC من الفئة II . من غير الواضح حاليًا ما إذا كانت هذه المجموعات الإيجابية والسلبية من CD74 تمثل خلايا HSC بقدرات تقديم مستضد مميزة أو ربما تاريخ مختلف من التنشيط. بشكل عام، كان ملف التعبير عن خلايا HSC المصابة مميزًا عن مجموعات HSC 1 و HSC 2 (الشكل 6e).
مع دقة مكانية على مستوى الخلية الواحدة، قمنا بتقييم التعبير المشترك للمستقبلات والليغاندات في الخلايا عبر تقسيم خلايا الكبد. لم يتم تصميم لوحة MERFISH الخاصة بنا لاستكشاف مجموعة متنوعة من المسارات الوظيفية في خلايا HSC أو البلاعم أو ECs عبر المناطق، ولكن البيانات الحالية تسمح لنا بطرح أسئلة حول التفاعلات المحددة المدفوعة بالتعبير التفاضلي للمستقبلات أو الليغاندات في خلايا الكبد عبر المناطق. في الواقع، نلاحظ أن التعبير المنطقي للمستقبلات والليغاندات في خلايا الكبد يمكن أن يشكل التفاعلات المحتملة مع الخلايا غير البرنشيمية. على وجه الخصوص، حددنا تفاعلات الإشارة بما في ذلك إشارة ثرومبوسبوندين (THBS1/2) من خلايا HSC إلى CD36 في خلايا الكبد من المنطقة 3، والتي قد تؤثر على خلل التمثيل الغذائي المرتبط بمرض الكبد الدهني (MASLD) ، وتفاعل WNT2B، الذي يتم التعبير عنه بواسطة ECs وخلايا Mac 2، مع FZD6 و LPR5/6 المعبر عنهما بواسطة خلايا الكبد من المنطقة 3 يساعد في التحقق من صحة هذا التحليل. بشكل أوسع، أنتج هذا التحليل، مثل جميع تحليلات المستقبلات والليغاندات على مستوى الخلية الواحدة، فقط فرضيات حول التفاعلات المحتملة. ومع ذلك، يمكن أن تكون هذه المجموعة الغنية من الفرضيات للتفاعلات المنظمة مكانيًا مفيدة في توجيه الدراسات الوظيفية المستقبلية.
توفر MERFISH أيضًا بيانات حول النوى وحدود الخلايا بالإضافة إلى التعبير الجيني، مما يسمح لنا بربط محتوى النوى بالتعبير الجيني داخل خلايا فردية. وجدنا أن حوالي ثلث خلايا الكبد البالغة متعددة النوى ، بما يتماشى مع الأوصاف السابقة للكبد البشري. لم نقم بتحديد عدد النوى بشكل منفصل، ولكن بناءً على هذه الدراسات، نتوقع أن من هذه الخلايا الكبدية متعددة النوى هي . بينما لم نلاحظ تغييرًا في التعبير الجيني النسبي مع زيادة محتوى النوى، لاحظنا زيادة في نسخ RNA. بالإضافة إلى ذلك، تميل خلايا الكبد متعددة النوى أيضًا إلى أن تكون أكبر حجمًا، بحيث كانت مستويات mRNA متناسبة مع حجم الخلية. تتماشى هذه النتائج مع التفسير القائل بأن الخلايا ذات المزيد من النوى أكبر وتعبر عن مستويات أعلى من RNA. معظم النسخ المحددة في خلايا الكبد هي سيتوبلازمية، ولكن النسخ موجودة أيضًا في النواة. من الممكن أن يتم استخدام بيانات MERFISH لتقييم النشاط النسخي بين نوى مختلفة في نفس خلية الكبد، ولكن هذا سيتطلب أدوات إضافية لإعادة بناء النوى من الصور المكدسة والتحكم في نسبة كل نواة مرئية في خلية فردية.
مجتمعة، استخدمت دراستنا MERFISH لإنشاء خرائط ترانسكريبتوميك مكانية للكبد الصحي والليفية بدقة خلوية واحدة لتعريف مجموعات فرعية مميزة مكانيًا وترانسكريبتوميًا من خلايا الكبد والبلاعم و HSCs داخل الفصيصات الكبدية ومجموعات فرعية مميزة من خلايا الكبد التي تتوسع مع الإصابة الليفية. من خلال دمج MERFISH مع snRNA-seq، قمنا بتمديد ملفات التعبير النسخي لأنواع الخلايا في هذه الخرائط المكانية لفهم تفاعلات المستقبلات والليغاندات الفريدة التي تشمل خلايا الكبد والخلايا غير البرنشيمية عبر مناطق خلايا الكبد وحددنا التغيرات في التعبير الجيني في مجموعات خلايا الكبد المميزة مكانيًا مع الإصابة. أخيرًا، من خلال تقييم محتوى النوى، وجدنا أن خلايا الكبد متعددة النوى لا تظهر اختلافات في التعبير الجيني النسبي مقارنة بخلايا الكبد أحادية النواة، ولكنها تميل إلى أن تكون أكبر وتنتج المزيد من النسخ الكلية. ستتمكن الدراسات المستقبلية الآن من توسيع هذه الأساليب، وتوسيع مكتبات مجموعات المجسات لتشمل أنواع RNA إضافية لتقييم جميع أنواع الخلايا في الكبد وملفاتها التعبيرية الأوسع بدقة خلوية مكانية واحدة في الصحة والمرض.
طرق
جمع الأنسجة
تم جمع جميع عينات الكبد من أنسجة جراحية زائدة في مستشفى ماساتشوستس العام وفقًا للبروتوكولات المعتمدة من قبل
مجالس المراجعة المؤسسية لمستشفى ماساتشوستس العام (MGB) أو معهد دانا فاربر للسرطان (DFCI) بما في ذلك الموافقة على تقديم بيانات عن العمر حسب العقد والجنس. جميع بيانات MERFISH و snRNA-seq المقدمة هنا هي من عينات متطابقة. لم يتم اعتبار الجنس كمتغير بسبب حجم العينة الصغيرة. تم الحصول على موافقة المرضى بموجب بروتوكول MGB 2019P001245 (AM-061) أو بروتوكول DFCI 02-240 (جميع العينات الأخرى). حصل المرضى الذين وافقوا بموجب 2019P001245 على تعويض قدره دولار أمريكي ورخصة وقوف. لم يحصل المرضى الذين وافقوا بموجب 02-240 على تعويض. تم استخدام الأنسجة المجمعة للتحليل، ولا تتوفر أنسجة إضافية للتوزيع.
تحضير عينة MERFISH
تم تثبيت مقاطع أنسجة الكبد ( سمك) عن طريق الغمر في بارافورمالدهيد (PFA؛ EMS 15710) في محلول ملحي مخفف (PBS؛ أمبيون AM9625) لمدة ساعات عند مع هز لطيف. بعد التثبيت، تم نقل عينات الأنسجة إلى محلول سكروز (VWR، 0335) في PBS المخفف 1X المضاف إليه PFA وتم حضنها طوال الليل عند مع هز لطيف. بعد الغسل في PBS المخفف 1X، تم وضع العينات في قوالب تجميد على ثلج جاف، مغطاة بوسائط قطع مثالية (OCT؛ Tissue-Tek 4583)، ملفوفة في ورق الألمنيوم، وتم تخزينها عند حتى الاستخدام.
تحضير مكتبة MERFISH
تم اختيار مجموعة من 317 جينًا مع التركيز على تلك المعبر عنها بشكل مختلف بين مجموعات خلايا الكبد مكملة بعلامات شائعة لخلايا الكبد غير البرنشيمية . تم تصميم مجسات MERFISH المستهدفة لهذه الجينات باستخدام خط أنابيب سابق باختصار، احتوى كل مسبار على منطقة بطول 30 نيوكليوتيد خاصة بـ RNA المستهدف، متصلة بسلسلة من تسلسلات القراءة التي تحدد الرمز الثنائي المعين لذلك RNA. تم استهداف كل mRNA بـ 72 من هذه المجسات. لترميز هذه الجينات الـ 317، اخترنا رمزًا بطول 22 بت، بوزن هامينغ ثابت ومسافة هامينغ، بوزن هامينغ قدره 4 وحد أدنى من مسافة هامينغ قدره 4. احتوى كل من المجسات الـ 72 على تسلسلين للقراءة، واحتوى مكمل جميع المجسات الترميزية لجين معين على حالات من الأربعة قراءات المرتبطة بـ 4 بتات التي كانت تحتوي على ‘1’. يحتوي هذا المخطط للترميز على 332 رمزًا، واستفدنا من الـ 15 غير المستخدمة لترميز RNAs كضوابط رموز ‘فارغة’، غير المعينة لـ RNA (البيانات التكميلية 1).
تم تصميم قوالب هذه المجسات عن طريق دمج بادئ ومروج T7 مع التسلسلات (البيانات التكميلية 1)، كما هو موضح سابقًا، وتم طلب مجموعة القوالب من شركة تويست بايوساينس. تم تضخيم هذه القوالب إلى مجسات مشفرة في بروتوكول يتضمن تفاعل البوليميراز المتسلسل (PCR)، النسخ داخل الخلايا، النسخ العكسي، التحلل القلوي، وتنقية SPRI، كما هو موضح سابقًا..
صبغة MERFISH
تشمل سير العمل العام لتحضير عينات MERFISH تقطيع العينات، وتمريرها، وصبغ حدود الخلايا، وتهجين مجسات RNA، وتضمين هلام الأكريلاميد، والهضم، وتفتيح العينات بالضوء. وقد تم وصف هذه البروتوكولات سابقًا.باختصار، تم قطع الأنسجة المدمجة في OCT بالتبريد بسمك 7وتم نقل الشرائح إلى أغطية دائرية بقطر 40 مم مغطاة بالسيلان وبولي-لايسين مع كرات مرجعية، تم إعدادها كما هو موضح سابقًا.بعد التقطيع، تم تثبيت شرائح الأنسجة لفترة وجيزة بـتم حفظ العينة في 1X PBS في درجة حرارة الغرفة لمدة 10 دقائق، وغسلت ثلاث مرات باستخدام 1X PBS لمدة 5 دقائق، ثم تم اختراقها طوال الليل فيفيالإيثانول. تم إعادة ترطيب العينات في محلول ملحي من سترات الصوديوم (SSC؛ أمبيون AM9763).
لإعداد عينات لتلوين الأجسام المضادة لحدود الخلايا، تم معالجة عينات الأنسجة بـبروتياز K (نيو إنجلاند بيو لابز [NEB]؛ P8107S) في درجة حرارة مسبقة التسخين ( ) 2X SSC لمدة 10 دقائق عند ثم تم شطف العينات بمحلول 2 X SSC قبل الحضانة مع حاجز مؤقتبسا،مثبط RNase الفأري [NEB، M0314L] في 2X SSC) لمدة 30 دقيقة. ثم تم صبغ العينة باستخدام جسم مضاد أولي ضد-ATPاز، Abcam؛ Ab76020) في نفس محلول الحجب لمدة 30 دقيقة في درجة حرارة الغرفة. تم إزالة كمية الأجسام المضادة الأولية الزائدة من العينات من خلال ثلاث غسلات لمدة 10 دقائق باستخدام 2 X SSC في درجة حرارة الغرفة. تم صبغ العينة باستخدام جسم مضاد ثانوي وفقًا لنفس البروتوكول المستخدم للأجسام المضادة الأولية (“; ثيرمو فيشر؛ A16112). تم وسم الأجسام المضادة الثانوية باستخدام أوليغونيوكليوتيد وفقًا للبروتوكولات السابقة..
تمت هجين المجسات مع العينة بتركيزفيفورماميد (فيشر ساينتيفيك، AM9342)،سلفات الدكستران (VWR، ) ، محلول tRNA الخميرة (ThermoFisher، 15401029) في 2X SSC لمدة 48 ساعة فيفي فرن مرطب. تم شطف العينات عن طريق ترك العينات تجلس فيالفورماميد في 2X SSC قبل التهجين لمدة لا تقل عن 4 ساعات ومرتين بعد التهجين لمدة 30 دقيقة في كل مرة عند.
لتنظيف العينات، تم تضمينها في هلام بولي أكريلاميد ثم تم هضمها لمدة يومين باستخدام بروتياز K، كما هو موصوف سابقًا.باختصار، تم تضمين العينات في فيلم رقيق من بولي أكريلاميد عن طريق قلبها على شريحة ميكروسكوب مغطاة بـ GelSlick مع قطرة منمحلول الأكريلاميدأكريلاميد: ثنائي الأكريلاميد [بايو راد، 1610144] معتيميد [سيغما، T7024] وبيرسلفات الأمونيوم [سيغما، 215589]). بعد أن تم بوليمرة الجل لمدة ساعتين، تم تغطية العينات بمحلول هضم (1% بروتيناز K، 20% v/v SDS [ثيرمو فيشر، AM9823]، 0.25%ترايتون-X [سيغما، T8787] في 2X SSC) وتم حضنه فيلمدة 24 ساعة. ثم تم شطف العينات عدة مرات باستخدام 2 X SSC. من أجل إزالة الفلورية الذاتية، تم تبييض العينات تحت ضوء LED الأزرق عندلمدة 24 ساعة. تم تخزين العينات فيحتى التصوير.
تسلسل RNA صغير
تم إجراء استخراج النواة المفردة بناءً على البروتوكولات الموصوفة سابقًا. محلول ملح-تريس 2X (محلول ST) يحتوي على 292 مللي مول من NaCl (ثيرمو فيشر ساينتيفيك، AM9759)، 20 مللي مول من تريس-هيدروكلوريد pH 7.5 (ثيرمو فيشر ساينتيفيك، 15567027)، (VWR الدولية المحدودة، )، و تم تحضير (Sigma Aldrich، M1028) في ماء نقي للغاية. في يوم كل تجربة، تم إعداد عينة لكل عينة من Tween مع الأملاح ومخزن Tris (TST) من 1 مل من مخزن 2X ST.منتوين-20 (سيغما ألدريتش، P-7949، النهائي)، منبي إس إيه (NEB، B9000S، النهائي) و ماء خالٍ من النوكلياز ومكمل بـمثبط RNase الحامي (Millipore Sigma، 3335402001). تم تحضير محلول 1X ST عن طريق تخفيف 2X ST بالماء النقي (Thermo Fisher Scientific، 10977023) وتمت إضافته بـمثبط RNase الحامي (ميلبورن سيغما، 3335402001).
على الثلج الجاف، تم وضع قسم من الأنسجة المجمدة في أنبوب gentleMACS C (Miltenyi Biotec، 130-093-237) مع 2 مل من محلول TST. تم تفكيك الأنسجة على الفور باستخدام جهاز تفكيك gentleMACS (Miltenyi Biotec، 130-096-427) باستخدام برنامج m_Spleen_01_01 مرتين وتم حضنها على الثلج لمدة 5 دقائق لإكمال حضانة مدتها 10 دقائق في محلول Tween مع الأملاح ومحلول Tris (TST). تم طرد أنابيب C في جهاز الطرد المركزي عندلمدة دقيقتين عند 500 جرام. تم إعادة تعليق الكريات في محلول TST، وتم تصفيتها من خلالمصفاة خلايا فالكون (VWR، 43-50040-51) في أنبوب مخروطي سعة 50 مل. تم غسل المصفاة بـ 1 مل من محلول ST 1X قبل الاستخدام. تم استخدام 1 مل إضافي من محلول ST 1X لغسل أنابيب gentleMACS C والمصفاة، وتم إضافة 1 مل آخر إلى المصفاة للغسل النهائي. تم نقل العينة إلى أنبوب مخروطي سعة 15 مل وتم الطرد المركزي عند لمدة 10 دقائق عند 500 جرام. تم إعادة تعليق الكريات في 1X PBS (-Mg/-Ca، جيبكو، 10010023)، 1% BSA (NEB، B9000S)، و مثبط RNase الحامي (بين اعتمادًا على حجم الحبيبات). تم تصفية محلول النواة من خلالمنخل خلايا فالكون (كورنينج، 352235). تم عد النوى باستخدام مقياس خلايا قابل للتصرف من INCYTO C-chip (VWR، 22-600-100).
معالجة العينة
تم إجراء قياسات MERFISH كما هو موضح سابقًا باستخدام نظام مجهر مخصص.تم تصوير الشريحة بالكامل أولاً باستخدام عدسة مكبرة 10X وصبغة DAPI، وتم استخدام هذه الصورة الموزاييك لاختيار منطقة الاهتمام لقياسات MERFISH. تم تحميل 8000-12000 نواة من تعليق النواة الفردية على شرائح الكروم (Chromium Chips) لمكتبة الخلية الفردية 3′ (مجموعة Chromium Next GEM Single Cell 3′ Kit v3.1؛ PN-1000268، PN1000120، PN-1000215) وفقًا لتوصيات الشركة المصنعة (10x Genomics). تم بناء مكتبات التعبير الجيني وفهرستها وفقًا لتعليمات الشركة المصنعة وتم تجميعها للتسلسل على جهاز تسلسل NovaSeq 6000 (Illumina). تم تسلسل جميع المكتبات إلى عمق مستهدف يبلغ 400 مليون قراءة بالتكوين التالي: R1: 28 bp؛ R2: 90 bp؛ I1، I2: 10 bp.
تحليل
فك تشفير MERFISH. تم تنفيذ فك تشفير MERFISH باستخدام خط أنابيب تم وصفه سابقًا.باختصار، تم تجميع الصور من مجال رؤية واحد (FOV) في كومات مصححة للحركة تحتوي على جميع مستويات الز و قنوات التصوير، وتم تحديد وزن مثالي لشدة الإضاءة النسبية لإطارات الصور المختلفة، وتم تخصيص وحدات البكسل لرموز شريطية فردية باستخدام نهج فك تشفير ناعم يعتمد على أقرب الجيران مع مقياس المسافة الإقليدية. تم تجميع وحدات البكسل المجاورة المخصصة لنفس الرمز الشريطي لتشكيل RNA واحد.
تم تعيين RNAs للخلايا باستخدام مزيج من Cellpose (الإصدار 0.7.2) و بايسور (الإصدار 0.5.0). باختصار، قمنا بتدريب نموذج cellpose استنادًا إلى -صبغة المناعة الفلورية لـ ATPase وأنشأنا مصفوفة تسميات باستخدام Cellpose وهذا النموذج لكل مجال رؤية. تم تطبيق Cellpose على كل مستوى ز separately، ثم تم دمج الحدود المتداخلة عبر مستويات الز لإنشاء تقسيم ثلاثي الأبعاد. استغللنا خط الأنابيب السابق لدينالتحديد حدود الخلايا، ربط الحدود عبر حدود مجال الرؤية، وتحليل RNAs ضمن هذه الحدود. تم تحسين نتيجة التقسيم الأولية بعد ذلك باستخدام Baysor مع المعلمات التالية: المقياس 10، والانحراف المعياري للمقياس 50%، والجزيئات/الخلايا 3، وثقة سابقة 0.50.
تحليل MERFISH على مستوى الخلية الواحدة. تم تحليل مخرجات Baysor باستخدام Scanpy (الإصدار 1.8.1). تم دمج البيانات MERFISH في هيكل AnnData واحد، وتم تصفية الخلايا التي تحتوي على أقل من 3 جينات و15 عد RNA، وتم تطبيع الخلايا المتبقية، وتطبيق مقياس لوغاريتمي. تم استخدام Harmony كطريقة دمج بياناتنا من أجل حساب تباين العينة. لتحليل بيانات MERFISH الصحية، استخدمنا 100 مكون PCA وقرار Leiden النهائي 1.1. لتحليل بيانات MERFISH الليفية، استخدمنا 150 مكون PCA وقرار Leiden النهائي 1.2.
snRNA-seq. تم فصل العينات باستخدام أداة تحويل bcl2fastq من Illumina وخط أنابيب 10x Genomics Cell Ranger (الإصدار 7.0.1) لأداء المحاذاة ضد مرجع Cell Ranger المبني مسبقًا GRCh38-2020-A (بما في ذلك الإنترونات). تم إزالة الخلايا التي تحتوي على عد ميتوكوندري أو ريبوسومي والخلايا التي تحتوي على <500 جين أو UMI<500. تم إزالة RNA المحيط باستخدام حزمة Soup (الإصدار 1.6.2). ركزنا على RNA المحيط من الجينات الغنية في الخلايا الكبدية، حيث شكلت الخلايا الكبدية حوالي 70% من الخلايا في مجموعة البيانات. قمنا بتضمين الجينات الكبدية التي تم استخدامها سابقًا لإزالة RNA المحيط (CYP2E1، ASGR1، CYP3A4، SCD، SLP1، CYP2B6، CPS1، CRP، و لكن تم تضمين في فلتر منفصل عن الجينات الأخرى بسبب اكتشافه العالي عبر المجموعات. أضفنا فلتر ثالث (CYP27A1، CYP4A11، CYP4V2، CYP2B7P، CYP2A6، CYP2A7، CYP3A5، CYP2C9، CYP2C8، CYP4F3، CYP3A43) بناءً على التعبير العالي في الخلايا الكبدية في مجموعة البيانات الحالية. بعد ذلك، تم تصفية الثنائيات والمتعددات باستخدام DoubletFinder v2.0.4 لكل عينة فردية.
تم تطبيع عدد كل عينة باستخدام طريقة SCTransform في Seurat v4.3.0 مع قراءة الميتوكوندريا التي تم إزالتها.
تم دمج العينات الصحية والمريضة في كائنات Seurat فردية، وتم إسقاط الجينات في فضاء المكونات الرئيسية باستخدام تحليل المكونات الرئيسية (RunPCA). تم إجراء الدمج وتصحيح الدفعة عبر الموضوعات باستخدام حزمة Harmony. تم استخدام أول 20 مكونًا رئيسيًا تمت معالجتها باستخدام Harmony كمدخلات لوظائف FindNeighbours وFindClusters. تم إجراء التجميع للعينات الصحية عند دقة 1، تم اختيارها من الدقات المختبرة (0.1، 0.2، 0.3، 0.4، 0.5، 0.6، 0.7، 0.8، 0.9 و1.0). تم استخدام نفس الدقة للعينات المريضة.
تم بناء رسم بياني للجيران الأقرب المشترك بناءً على مقياس المسافة الإقليدية في فضاء المكونات الرئيسية، وتم تجميع الخلايا باستخدام خوارزمية لوفين. تم استخدام وظيفة RunUMAP مع الإعدادات الافتراضية لحساب إحداثيات UMAP ثنائية الأبعاد لتحديد تجمعات الخلايا المتميزة. تم تعيين أنواع الخلايا إلى المجموعات باستخدام ScType مع الكبد كتسمية الأنسجة. حددنا الخلايا الكبدية، HSC، خلايا القناة الصفراوية، الخلايا البطانية (EC)، البلعميات، ونوع إضافي من خلايا الجهاز المناعي. تم تصنيف بعض المجموعات الفرعية داخل تجمعات الخلايا الكبدية على أنها غير معروفة بواسطة ScType وتم تعيينها يدويًا بتسمية الخلايا الكبدية بناءً على تعبير الجينات. تعكس جميع تسميات المجموعات المبلغ عنها لبيانات snRNA-seq من العينات الصحية أو المريضة التعيينات التي تم إجراؤها من تحليل بيانات snRNA-seq فقط، باستثناء تقسيمات الخلايا الكبدية، التي تم تصنيفها بشكل مشترك من خلال الدمج مع MERFISH (انظر أدناه). قمنا بإجراء دمج مشترك للخلايا الكبدية مع MERFISH حيث لم يكن المحور الجيني الإقليمي واضحًا كما هو الحال في تحليل snRNA-seq، ولم يعيد التحليل الأولي لهذه البيانات بمفردها تجميعات تحدد هذه التدرجات في التعبير الجيني بوضوح كما هو الحال في MERFISH.
ثم تم إجراء مراقبة جودة على مستوى المجموعة باستخدام MALAT1، وهو ترانسكريبت RNA غير مشفر طويل محتفظ به في النواة، كمؤشر على مجموعات snRNA-seq عالية الجودة. قمنا بإزالة مجموعتين من مجموعة البيانات الصحية ومجموعتين من مجموعة بيانات إصابة الأنسجة الليفية حيث كانت أكثر من من الخلايا تحتوي على أقل من ثلاث قراءات MALAT1. بالمقابل، كانت أقل من من الخلايا في أي مجموعة أخرى تظهر أقل من ثلاث قراءات MALAT1.
دمج بيانات MERFISH وsnRNA-seq. لدمج قياسات MERFISH الصحية وsnRNA-seq لتحديد التدرجات الإقليمية داخل الخلايا الكبدية ضمن بيانات snRNA-seq، قمنا بدمج هيكليتي AnnData المنفصلتين اللتين تحتويان فقط على خلايا كبدية تم تحديدها من التجميع Leiden الموصوف أعلاه. تم تحويل التعبير لوغاريتميًا، وتم قياسه باستخدام z-score، وتم تقليم الجينات لتشمل فقط تلك التي تم قياسها باستخدام MERFISH قبل الدمج. ثم تم دمج هذه الخلايا باستخدام Harmony من أجل مقارنة علامات التعبير الجيني والتسميات عبر أنواع الخلايا، مستفيدين من الخوارزميات المدمجة والإعدادات الافتراضية المرتبطة بـ scanpy. تم تجميع هذه البيانات المدمجة باستخدام تجميع Leiden من أجل تقييم وتجميع الخلايا الكبدية بين الطريقتين. ثم تم توضيح المجموعات الفردية من Leiden من خلال الاستفادة من مزيج من تعبير العلامات والتسميات الموجودة المشتقة من تحليل التجميع لبيانات MERFISH فقط، كما هو موضح أعلاه. من المهم أن يتم استخدام هذا النهج فقط لتطبيق التسميات على خلايا snRNA-seq، وتم أخذ جميع تحليلات التعبير المشتقة من هذا الدمج من خلايا snRNA-seq.
تحليل الربط بين الليغاند والمستقبل. تم تقييم تفاعلات المستقبل-الليغاند باستخدام بيانات snRNA-seq باستخدام CellPhoneDB. قمنا بتطبيق 1000 تكرار واعتبرنا الليغاندات والمستقبلات للتحليل إذا تم التعبير عنها من قبل ما لا يقل عن من الخلايا (عتبة). تم اختيار التفاعلات المهمة بين الخلايا الكبدية والخلايا غير الكبدية (قيمة p -value أقل من 0.05) فقط إذا كانت التفاعلات تشمل خلايا كبدية من منطقة واحدة أو منطقتين. تم استبعاد التفاعلات المتوقعة إذا 1) كانت درجة التفاعل لتفاعل مهم أقل من
درجة التفاعل لتفاعل غير مهم بين الخلايا الكبدية ونوع الخلية المحدد و 2) كان الليغاند معبرًا عنه بمستوى أعلى في خلية المستقبل مقارنة بخلية الليغاند. يتم عرض فقط التفاعلات المحددة على أنها ليغاند-مستقبل.
تحليل التعبير الجيني بين الخلايا الكبدية في الكبد الصحي والأكباد المصابة بإصابة ليفية. تم إجراء تحليل التعبير التفاضلي للمقارنات المحددة باستخدام وظيفة الجينات المرتبة من scanpy باستخدام نموذج t-test. تم ترتيب الجينات حسب الدرجات لتحديد 100 جين الأكثر تحفيزًا لكل مقارنة داخل الخلايا الكبدية. تم إجراء تحليل GO (العملية البيولوجية؛ إصدار Panther 19.0) كما هو موضح لجميع الخلايا الكبدية الصحية مقارنة بجميع الخلايا الكبدية في الأكباد المصابة بإصابة ليفية (البيانات التكميلية 5). أظهرت النتائج إثراء المسارات الأيضية، وتم اختيار الفئة الأوسع من العملية الأيضية (GO:0008152) كأوسع فئة لتقييم التغيرات في الجينات الأيضية. تم تقييم الجينات داخل هذه المسار لكل مقارنة لاحقة، وتم تصنيفها بشكل أكبر حسب فئة بروتين Panther.
تحليل إثراء مجموعة الجينات (GSEA). تم إجراء تحليل إثراء مجموعة الجينات (GSEA) باستخدام GSEApy (الإصدار 1.1.3) لمقارنة Fibrotic Hep 1 وFibrotic Hep 2 مع كل من الخلايا الكبدية الصحية وجميع الخلايا الكبدية المحددة. تم اشتقاق المصطلحات من قائمة “GO_Biological_Process_2021”.
الإحصائيات وإمكانية التكرار
تم إجراء التحليلات الإحصائية كما هو موضح. لم يتم استخدام أي طريقة إحصائية لتحديد حجم العينة لـ MERFISH أو snRNA-seq. لم يتم استبعاد أي بيانات تلبي المعايير الموصوفة من التحليلات. لم تكن التجارب عشوائية. لم يكن المحققون معصوبين العينين أثناء التجارب وتقييم النتائج.
ملخص التقرير
معلومات إضافية حول تصميم البحث متاحة في ملخص تقرير Nature Portfolio المرتبط بهذه المقالة.
توفر البيانات
تم إيداع بيانات MERFISH الخام والمعالجة التي تم إنتاجها في هذه الدراسة في datadryad تحت الرقم doi: 10.5061/dryad.37pvmcvsg [https://datadryad.org/stash/dataset/doi:10.5061/dryad.37pvmcvsg]. تتوفر بيانات snRNA-seq الخام المستخدمة في هذه الدراسة في قاعدة بيانات GEO تحت رمز الوصول: GSE210077. تم إيداع البيانات المعالجة لـ snRNA-seq في datadryad تحت doi: 10.5061/dryad.37pvmcvsghttps://datadryad.org/stash/dataset/doi:10.5061/درع.37pvmcvsg]. لمساعدة في تصور هذه البيانات، تم إنشاء عارض ويب ل MERFISH و snRNA-seq المقدمين في هذه الورقة. يمكن الوصول إلى هذا العارض على:https://moffittlab.github.io/التصور/2024_كبد_البشر/index.html. تم توفير بيانات المصدر مع هذه الورقة.
References
Rezania, V., Coombe, D. & Tuszynski, J. A. A physiologically-based flow network model for hepatic drug elimination III: 2D/3D DLA lobule models. Theor. Biol. Med. Model 13, 9 (2016).
Teutsch, H. F. The modular microarchitecture of human liver. Hepatology 42, 317-325 (2005).
Gebhardt, R. Metabolic zonation of the liver: Regulation and implications for liver function. Pharm. Therapeut 53, 275-354 (1992).
Jungermann, K. & Keitzmann, T. Zonation of Parenchymal and Nonparenchymal Metabolism in Liver. Annu Rev. Nutr. 16, 179-203 (1996).
Martini, T., Naef, F. & Tchorz, J. S. Spatiotemporal Metabolic Liver Zonation and Consequences on Pathophysiology. Annu. Rev. Pathol.: Mech. Dis. 18, 439-466 (2023).
Kietzmann, T. Metabolic zonation of the liver: The oxygen gradient revisited. Redox Biol. 11, 622-630 (2017).
Droin, C. et al. Space-time logic of liver gene expression at sublobular scale. Nat. Metab. 3, 43-58 (2021).
Damm, G. et al. Human parenchymal and non-parenchymal liver cell isolation, culture and characterization. Hepatol. Int. 7, 951-958 (2013).
Roberts, S., Ludwig, J. & Larusso, N. The pathobiology of biliary epithelia. Gastroenterology 112, 269-279 (1997).
MacParland, S. A. et al. Single cell RNA sequencing of human liver reveals distinct intrahepatic macrophage populations. Nat. Commun. 9, 4383 (2018).
Ramachandran, P. et al. Resolving the fibrotic niche of human liver cirrhosis at single-cell level. Nature 38, 1-29 (2019).
Andrews, T. S. et al. Single-Cell, Single-Nucleus, and Spatial RNA Sequencing of the Human Liver Identifies Cholangiocyte and Mesenchymal Heterogeneity. Hepatol. Commun. 6, 821-840 (2021).
Tanami, S. et al. Dynamic zonation of liver polyploidy. Cell Tissue Res. 368, 405-410 (2017).
Kudryavtsev, B. N., Kudryavtseva, M. V., Sakuta, G. A. & Stein, G. I. Human hepatocyte polyploidization kinetics in the course of life cycle. Virchows Arch. B 64, 387-393 (1993).
Watanabe, T. & Tanaka, Y. Age-related alterations in the size of human hepatocytes. Virchows Arch. B 39, 9-20 (1982).
Saeter, G. et al. Changes in ploidy distributions in human liver carcinogenesis. J. Natl Cancer Inst. 80, 1480-1485 (1988).
Matsumoto, T., Wakefield, L. & Grompe, M. The Significance of Polyploid Hepatocytes During Aging Process. Cell Mol. Gastroenterol. Hepatol. 11, 1347-1349 (2021).
Chen, K. H., Boettiger, A. N., Moffitt, J. R., Wang, S. & Zhuang, X. Spatially resolved, highly multiplexed RNA profiling in single cells. Science 348, aaa6090 (2015).
Moffitt, J. R. et al. High-throughput single-cell gene-expression profiling with multiplexed error-robust fluorescence in situ hybridization. Proc. Natl Acad. Sci. 113, 11046-11051 (2016).
Moffitt, J. R. et al. High-performance multiplexed fluorescence in situ hybridization in culture and tissue with matrix imprinting and clearing. Proc. Natl Acad. Sci. 113, 14456-14461 (2016).
Aizarani, N. et al. A human liver cell atlas reveals heterogeneity and epithelial progenitors. Nature 472, 199-204 (2019).
Petukhov, V. et al. Cell segmentation in imaging-based spatial transcriptomics. Nat. Biotechnol. 40, 345-354 (2022).
Stringer, C., Wang, T., Michaelos, M. & Pachitariu, M. Cellpose: a generalist algorithm for cellular segmentation. Nat. Methods 18, 100-106 (2020).
Braeuning, A. et al. Differential gene expression in periportal and perivenous mouse hepatocytes. Febs J. 273, 5051-5061 (2006).
Saito, K., Negishi, M. & Squires, E. J. Sexual dimorphisms in zonal gene expression in mouse liver. Biochem. Biophys. Res. Commun. 436, 730-735 (2013).
Halpern, K. B. et al. Single-cell spatial reconstruction reveals global division of labour in the mammalian liver. Nature 542, 352-356 (2017).
González-Blas, C. B. et al. Single-cell spatial multi-omics and deep learning dissect enhancer-driven gene regulatory networks in liver zonation. Nat. Cell Biol. 26, 153-167 (2018).
Halpern, K. B. et al. Paired-cell sequencing enables spatial gene expression mapping of liver endothelial cells. Nat. Biotechnol. 36, 962-970 (2018).
Dobie, R. et al. Single-Cell Transcriptomics Uncovers Zonation of Function in the Mesenchyme during Liver Fibrosis. Cell Rep. 29, 1832-1847.e8 (2019).
Inverso, D. et al. A spatial vascular transcriptomic, proteomic, and phosphoproteomic atlas unveils an angiocrine Tie-Wnt signaling axis in the liver. Dev. Cell 56, 1677-1693.e10 (2021).
Vento-Tormo, R. et al. Single-cell reconstruction of the early maternal-fetal interface in humans. Nature 563, 347-353 (2018).
Lambeau, G. & Gelb, M. H. Biochemistry and Physiology of Mammalian Secreted Phospholipases A2. Annu. Rev. Biochem. 77, 495-520 (2008).
Romeo, S. et al. Genetic variation in PNPLA3 confers susceptibility to nonalcoholic fatty liver disease. Nat. Genet. 40, 1461-1465 (2008).
Sharma, A. et al. Onco-fetal Reprogramming of Endothelial Cells Drives Immunosuppressive Macrophages in Hepatocellular Carcinoma. Cell 183, 377-394.e21 (2020).
Martínez, A. I., Pérez-Arellano, I., Pekkala, S., Barcelona, B. & Cervera, J. Genetic, structural and biochemical basis of carbamoyl phosphate synthetase 1 deficiency. Mol. Genet. Metab. 101, 311-323 (2010).
Matsumoto, S. et al. Urea cycle disorders-update. J. Hum. Genet. 64, 833-847 (2019).
Yahyaoui, R. et al. A new metabolic disorder in human cationic amino acid transporter-2 that mimics arginase 1 deficiency in newborn screening. J. Inherit. Metab. Dis. 42, 407-413 (2019).
Fiermonte, G. et al. The Mitochondrial Ornithine Transporter Bacterial Expression, Reconstitution, Functional Characterization, And Tissue Distribution Of Two Human Isoforms*. J. Biol. Chem. 278, 32778-32783 (2003).
Valenti, L. et al. Homozygosity for the patatin-like phospholipase-3/ adiponutrin 1148 M polymorphism influences liver fibrosis in patients with nonalcoholic fatty liver disease. Hepatology 51, 1209-1217 (2010).
Maillo, C. et al. Circadian- and UPR-dependent control of CPEB4 mediates a translational response to counteract hepatic steatosis under ER stress. Nat. Cell Biol. 19, 94-105 (2017).
Xanthakos, S. A. et al. High Prevalence of Nonalcoholic Fatty Liver Disease in Adolescents Undergoing Bariatric Surgery. Gastroenterology 149, 623-634.e8 (2015).
Harrison, S. A. et al. A Phase 3, Randomized, Controlled Trial of Resmetirom in NASH with Liver Fibrosis. N. Engl. J. Med. 390, 497-509 (2024).
Guilliams, M. et al. Spatial proteogenomics reveals distinct and evolutionarily conserved hepatic macrophage niches. Cell 185, 379-396.e38 (2022).
Remmerie, A. et al. Osteopontin Expression Identifies a Subset of Recruited Macrophages Distinct from Kupffer Cells in the Fatty Liver. Immunity 53, 641-657.e14 (2020).
Stockinger, B. et al. A role of la-associated invariant chains in antigen processing and presentation. Cell 56, 683-689 (1989).
Maubach, G., Lim, M. C. C., Kumar, S. & Zhuo, L. Expression and upregulation of cathepsin S and other early molecules required for antigen presentation in activated hepatic stellate cells upon IFN- treatment. Biochim. Biophys. Acta (BBA) – Mol. Cell Res. 1773, 219-231 (2007).
Viñas, O. et al. Human hepatic stellate cells show features of anti-gen-presenting cells and stimulate lymphocyte proliferation. Hepatology 38, 919-929 (2003).
Zeng, H. et al. CD36 promotes de novo lipogenesis in hepatocytes through INSIG2-dependent SREBP1 processing. Mol. Metab. 57, 101428 (2022).
Wang, B., Zhao, L., Fish, M., Logan, C. Y. & Nusse, R. Self-renewing diploid Axin2+ cells fuel homeostatic renewal of the liver. Nature 524, 180-185 (2015).
Preziosi, M., Okabe, H., Poddar, M., Singh, S. & Monga, S. P. Endothelial Wnts regulate -catenin signaling in murine liver zonation and regeneration: A sequel to the Wnt-Wnt situation. Hepatol. Commun. 2, 845-860 (2018).
Moffitt, J. R. et al. Molecular, spatial, and functional single-cell profiling of the hypothalamic preoptic region. Science 362, eaau5324 (2018).
Cadinu, P. et al. Charting the cellular biogeography in colitis reveals fibroblast trajectories and coordinated spatial remodeling. Cell 187, 2010-2028.e30 (2024).
Wang, G., Moffitt, J. R. & Zhuang, X. Multiplexed imaging of highdensity libraries of RNAs with MERFISH and expansion microscopy. Sci. Rep. 8, 4847 (2018).
Slyper, M. et al. A single-cell and single-nucleus RNA-Seq toolbox for fresh and frozen human tumors. Nat. Med. 26, 792-802 (2020).
Wolf, F. A., Angerer, P. & Theis, F. J. SCANPY: large-scale single-cell gene expression data analysis. Genome Biol. 19, 15 (2018).
Korsunsky, I. et al. Fast, sensitive and accurate integration of singlecell data with Harmony. Nat. Methods 16, 1289-1296 (2019).
Young, M. D. & Behjati, S. SoupX removes ambient RNA contamination from droplet-based single-cell RNA sequencing data. GigaScience 9, giaa151 (2020).
McGinnis, C. S., Murrow, L. M. & Gartner, Z. J. DoubletFinder: Doublet Detection in Single-Cell RNA Sequencing Data Using Artificial Nearest Neighbors. Cell Syst. 8, 329-337.e4 (2019).
lanevski, A., Giri, A. K. & Aittokallio, T. Fully-automated and ultra-fast cell-type identification using specific marker combinations from single-cell transcriptomic data. Nat. Commun. 13, 1246 (2022).
Clarke, Z. A. & Bader, G. D. MALAT1 expression indicates cell quality in single-cell RNA sequencing data. bioRxiv 2024.07.14.603469. https://doi.org/10.1101/2024.07.14.603469 (2024).
Montserrat-Ayuso, T. & Esteve-Codina, A. Revealing the Prevalence of Suboptimal Cells and Organs in Reference Cell Atlases: An Imperative for Enhanced Quality Control. bioRxiv 2024.04.18.590104. https://doi.org/10.1101/2024.04.18.590104 (2024).
Garcia-Alonso, L. et al. Single-cell roadmap of human gonadal development. Nature 607, 540-547 (2022).
Fang, Z., Liu, X. & Peltz, G. GSEApy: a comprehensive package for performing gene set enrichment analysis in Python. Bioinformatics 39, btac757 (2022).
شكر وتقدير
يشكر المؤلفون جاسنيت أنيجا على المساعدة في تنظيم جمع أنسجة الكبد، وكينيث تانابي على المساعدة في جمع العينات، ونيكول بروسايدس ومركز أبحاث علم الأمراض في مستشفى ماساتشوستس العام على المساعدة في تقطيع الأنسجة. نشكر سونيا ماكبارلاند، غاري بادير، تالولا أندروز، وجويرية عاطف على المناقشات المفيدة والمساعدة في اختيار الجينات لمجموعة مجسات MERFISH. نشكر كريستين مكابي على المساعدة في إدارة البيانات، وآدم سلايمين، دان دوبينسكي، ومنصة برود لعلم الجينوم على المساعدة في توليد بيانات تسلسل RNA أحادي النواة. تم دعم A.C.M. من قبل أموال داخلية من UMass Chan، وتم دعم R.J.X.، J.R.M.، وA.C.M من قبل منح من مبادرة تشان زوكربيرغ.
مساهمات المؤلفين
قام ب.ب.، ب.ر.و.، ج.ر.م، و أ.س.م. بتصميم الدراسة وتصميم التجارب. تم إعداد العينات لـ MERFISH بواسطة ب.ب. وتم تصويرها بواسطة ب.ر.و. بدعم من أ.س. و إ.ت.إ. تم إجراء تسلسل snRNA بواسطة ل.أ.-ز. و س.م. بدعم من Å.س.، إ.ت.إ، ج.د.، و ر.ج.إكس. تم إجراء التحليلات الحاسوبية بواسطة ب.ر.و.، ب.ب.، و ر.ي.ر. تم بناء أدوات التصوير بواسطة ل.ج. و ت.ل. تم كتابة المخطوطة بواسطة ب.ر.و.، ب.ب.، ج.ر.م، و أ.س.م. مع مدخلات من جميع المؤلفين الآخرين.
المصالح المتنافسة
R.J.X. هو أحد مؤسسي Celsius Therapeutics و Jnana Therapeutics، ومدير مجلس إدارة MoonLake Immunotherapeutics، ومستشار لشركة نستله. J.R.M هو أحد مؤسسي، ومساهمي، ومستشاري Vizgen. J.R.M. هو مخترع على براءات اختراع مرتبطة بـ MERFISH تم التقدم بها نيابة عنه من قبل جامعة هارفارد ومستشفى بوسطن للأطفال. تم مراجعة اهتمامات J.R.M وإدارتها من قبل مستشفى بوسطن للأطفال. وفقًا لسياسات تضارب المصالح الخاصة بهم. حصل J.R.M. على تمويل بحثي من Merck لمشاريع غير ذات صلة. حصل A.C.M. على تمويل بحثي من Boehringer Ingelheim و GlaxoSmithKline لمشاريع غير ذات صلة. يعلن المؤلفون الآخرون عن عدم وجود مصالح متنافسة.
ملاحظة الناشر: تظل شركة سبرينجر ناتشر محايدة فيما يتعلق بالمطالبات القضائية في الخرائط المنشورة والانتماءات المؤسسية.
الوصول المفتوح هذه المقالة مرخصة بموجب رخصة المشاع الإبداعي النسبية-غير التجارية-بدون مشتقات 4.0 الدولية، والتي تسمح بأي استخدام غير تجاري، ومشاركة، وتوزيع، واستنساخ في أي وسيلة أو صيغة، طالما أنك تعطي الائتمان المناسب للمؤلفين الأصليين والمصدر، وتوفر رابطًا لرخصة المشاع الإبداعي، وتوضح إذا قمت بتعديل المادة المرخصة. ليس لديك إذن بموجب هذه الرخصة لمشاركة المواد المعدلة المشتقة من هذه المقالة أو أجزاء منها. الصور أو المواد الأخرى من طرف ثالث في هذه المقالة مشمولة في رخصة المشاع الإبداعي الخاصة بالمقالة، ما لم يُشار إلى خلاف ذلك في سطر الائتمان للمادة. إذا لم تكن المادة مشمولة في رخصة المشاع الإبداعي الخاصة بالمقالة وكان استخدامك المقصود غير مسموح به بموجب اللوائح القانونية أو يتجاوز الاستخدام المسموح به، فستحتاج إلى الحصول على إذن مباشرة من صاحب حقوق الطبع والنشر. لعرض نسخة من هذه الرخصة، قم بزيارة http:// creativecommons.org/licenses/by-nc-nd/4.0/. (ج) المؤلف(ون) 2024
برنامج الطب الخلوي والجزيئي، مستشفى بوسطن للأطفال، بوسطن، MA 02115، الولايات المتحدة الأمريكية.قسم الميكروبيولوجيا، معهد بلافاتنيك، كلية الطب بجامعة هارفارد، بوسطن، MA 02115، الولايات المتحدة الأمريكية.قسم أمراض الجهاز الهضمي، كلية الطب بجامعة ماساتشوستس تشان، ووستر، ماساتشوستس، الولايات المتحدة الأمريكية.معهد برود التابع لجامعة هارفارد ومعهد ماساتشوستس للتكنولوجيا، كامبريدج، MA 02142، الولايات المتحدة الأمريكية.مستشفى ماساتشوستس العام، بوسطن، MA 02114، الولايات المتحدة الأمريكية.المركز للطب الحيوي الحاسوبي، قسم المعلوماتية الحيوية، معهد بلافاتنيك، كلية الطب بجامعة هارفارد، بوسطن، MA 02115، الولايات المتحدة الأمريكية.ساهم هؤلاء المؤلفون بالتساوي: بريانا ر. واتسون، بيبلاب بول. البريد الإلكتروني:jeffrey.moffitt@childrens.harvard.edu; alan.mullen@umassmed.edu
Spatial transcriptomics of healthy and fibrotic human liver at single-cell resolution
The liver is composed of parenchymal, non-parenchymal, and immune cells that are organized into anatomic structures called lobules, which are in diameter and defined by sites of portal venous and arterial inflow and central venous outflow . Within the lobule, hepatocytes are classically organized into three zones, with zone 1 proximal to the portal vein and hepatic artery, zone 3 proximal to the central vein, and zone 2 in the intermediate region . Hepatocyte zonation matches function to the physiologic environment in both space and time . For example, hepatocytes in zone 1 are more involved in gluconeogenesis and beta-oxidation, reflecting the relatively oxygen- and nutrient-rich environment near the portal vein and hepatic artery, whereas hepatocytes in zone 3 are more active in glycolysis and lipogenesis, reflecting the depletion of oxygen and nutrients near the central vein . Beyond metabolism, morphogen expression, such as
Received: 5 September 2024
Accepted: 9 December 2024
Published online: 02 January 2025
Single-cell RNA sequencing (scRNA-seq) has advanced our understanding of cell types and their heterogeneity within the human liver, but the spatial organization at single-cell resolution has not yet been described. Here we apply multiplexed error robust fluorescent in situ hybridization (MERFISH) to map the zonal distribution of hepatocytes, spatially resolve subsets of macrophage and mesenchymal populations, and investigate the relationship between hepatocyte ploidy and gene expression within the healthy human liver. Integrating spatial information from MERFISH with the more complete transcriptome produced by single-nucleus RNA sequencing (snRNA-seq), also reveals zonally enriched receptor-ligand interactions. Finally, MERFISH and snRNA-seq analysis of fibrotic liver samples identify two hepatocyte populations that expand with injury and do not have clear zonal distributions. Together these spatial maps of the healthy and fibrotic liver provide a deeper understanding of the cellular and spatial remodeling that drives disease which, in turn, could provide new avenues for intervention and further study.
that of Wnt-family members, is also shaped by this zonation and can vary in time . Thus, this zonal organization is critical for our understanding of hepatocyte activity. However, many details of this zonation, including how hepatocytes adjust their gene expression along the portal-central vein axis and the function of this potential spatial fine tuning remain unclear in the human liver, as current single-cell analyses of the human liver have either measured gene expression without spatial data or evaluated spatial data without single-cell resolution.
The liver is also composed of non-parenchymal cells, which include hepatic stellate cells (HSCs), resident macrophages, endothelial cells (ECs), and cholangiocytes . While sub-populations of macrophages and HSCs in the healthy human liver have been described in single-cell data , these subpopulations, and potential gene expression variations within, have not been resolved within the lobule
organization at single-cell resolution in the human liver. As such, their role within the spatial context of the liver also remains unclear.
In addition to spatial location, another feature of hepatocytes that may drive functional heterogeneity is their ploidy . Specifically, hepatocytes in the adult liver can either be single or multinucleated, and nuclei themselves can vary in ploidy. Early in life, most human hepatocytes are diploid and contain a single nucleus; ploidy increases with age such that in adults, about a third of hepatocytes are multinucleated, or their nuclei contain more than two copies of each chromosome . Yet the spatial organization of multinucleated hepatocytes and the impact of nuclear content on gene expression remains poorly understood .
Here, we apply image-based spatial transcriptomics (multiplexed error robust fluorescence in situ hybridization; MERFISH) and singlenucleus RNA sequencing (snRNA-seq) to the same samples of healthy human liver in order to construct spatial maps of hepatocytes and nonparenchymal cells at single-cell and transcriptome-wide resolution. This analysis allowed us to define gradients of gene expression across human hepatocyte zones, determine the cell types where receptorligand co-expression are in spatial proximity to promote crosstalk, and evaluate the relationship between ploidy and gene expression within hepatocytes. We also performed similar measurements in fibrotic liver samples to understand the changes in hepatocytes and nonparenchymal cells that occur with chronic injury. These analyses provide a single-cell spatial transcriptomic map of the human liver, annotating the gradient in hepatocyte gene expression from the portal area to central vein and show that hepatocyte ploidy is equally distributed across zones within the lobule and does not affect differential gene expression. In addition, we define subsets of spatially distinct macrophages and HSC populations, and identify the expansion of two hepatocyte populations with chronic injury, which together provide an approach and framework to understand changes that occur with human liver disease at single-cell resolution in space. More broadly, the framework we provide for the joint spatial and transcriptomic analysis of single cells within the healthy and diseased human liver may prove useful for the further study of the molecular, cellular, and tissue remodeling that occurs in human liver disease.
Results
Spatial organization of hepatocytes in the human liver
To explore the spatial and cellular organization of the human liver, we collected human liver tissue from the margins of surgical resections of three adult patients (two female and one male; Supplementary Table 1). While few patients undergo liver resection without suspicion of disease, the absence of clear signs of acute or chronic injury in H&E images supported our assignment of these samples as ‘Healthy’ (Supplementary Fig. 1 and Supplementary Table 1). We designed a MERFISH panel targeting 317 genes with a focus on hepatocytes (Methods; Supplementary Data 1), and then characterized the expression of these genes within cryosections taken from these samples using MERFISH .
The distribution of key individual genes revealed the rich spatial architecture of the liver and provided an initial validation of our measurements. We observed sheets of cells expressing , consistent with hepatocytes (Supplementary Fig. 2), while CD5L expression was clustered in spaces between hepatocytes consistent with resident macrophages located in sinusoids (Supplementary Fig. 2a-f). PDGFRB expression was concentrated along the edges of -expressing hepatocytes in a distribution expected for HSCs, which are located in the subendothelial space (Supplementary Fig. 2a-f). KRT7 and SOX9 were enriched in periportal areas consistent with cholangiocytes and include clusters suggestive of longitudinal sections of small bile ducts (Supplementary Fig. 2g-l), while DNASE13 and INMT expression were scattered through the parenchyma consistent with the distribution of ECs (Supplementary Fig. 2g-l).
To define individual cells within our data, we included in our MERFISH measurements an immunofluorescence stain against a pan-cell
surface marker, the -ATPase . This antibody stain was incorporated into our MERFISH readout through the use of an oligonucleotide-tagged secondary antibody (Methods). We then leveraged Cellpose to define cell boundaries in three dimensions from these co-stains, assigned RNAs within these boundaries, and applied an RNA-based segmentation routine, Baysor , to adjust and improve these boundaries and recover cells for which the co-stains did not provide clear boundaries (Supplementary Fig. 3). Following this analysis and removal of cells with small numbers of transcripts, we compiled a dataset of putative cells from the healthy human liver (Supplementary Fig. 4).
The expression of all 317 genes was quantified in each cell to generate a count matrix for the human liver samples. The count matrix for the pooled data was then visualized by Uniform Manifold Approximation and Projection (UMAP) after the application of batch correction (Methods; Fig. 1a). Three clusters of hepatocytes were defined along with two HSC clusters, two macrophage clusters, one EC cluster, and one cholangiocyte cluster. Each cluster was defined by established markers, supporting our cluster assignment (Fig. 1b; Supplementary Data 2), and limited evidence of marker gene expression outside of the cell types they define was observed, supporting our segmentation (Supplementary Fig. 3c). Reflecting both the hepatocyte focus of our MERFISH panel as well as the larger size of hepatocytes, hepatocyte clusters contained more RNA counts and more expressed genes than other clusters (Supplementary Fig. 4b-d). Nonetheless, with the exception of lymphocyte and neutrophil populations, which did not contain sufficient marker genes in our panel, the lower counts observed per cell for non-hepatocyte clusters still allowed us to clearly define all other major cell classes expected within the liver (Fig. 1a, b).
We next explored the spatial distribution of hepatocytes by evaluating the expression of individual genes (Fig. 1c-f, Supplementary Fig. 5a). SDS was enriched in zone 1 (periportal), while CYP2E1 expression increased in zone 3 (pericentral), as previously described in mouse (Fig. 1c, e, f; Supplementary Fig. 5a). In addition, we found that CYP2A6 and ASS1 were enriched in portal regions similar to SDS, while CYP1A2 and GLUL were enriched in central regions similar to CYP2E1 (Fig. 1c, e, f-g). ALDOB and ADH1B were expressed in all hepatocytes but were enriched in zone 2, with expression shifted towards zones 1 and 2 and expression shifted towards zones 2 and 3 (Fig. 1d, f). These results showed that MERFISH captures differences in gene expression across zones within the hepatic lobule, and we next asked how effectively we could define zonation with the full MERFISH probe set. Mapping hepatocyte clusters 1, 2, and 3 (Fig. 1a) back to tissue sections showed clear zonal distribution, with hepatocyte cluster 1 localizing to zone 1, hepatocyte cluster 3 to zone 3, and hepatocyte cluster 2 to zone 2 (between zone 1 and 3; Fig. 1h, Supplementary Fig. 5b, c). Collectively, these observations are consistent with the classic zonation described in human and mouse liver , supporting our MERFISH measurements.
While our analysis revealed that hepatocytes can be separated into three populations, we noted that these populations are contained within a single group of cells in the UMAP representation of the data (Fig. 1a). This representation suggests that the classic liver zones represent approximations of a continuous variable in gene expression in hepatocytes determined by the spatial relationship between portal and central areas of the lobule. To explore this possibility further, we performed a pseudotime analysis on gene expression of hepatocytes and found that the pseudotime mapped to a continuous distribution in space (Supplementary Fig. 5d-f). This gradient of gene expression could also be observed across individual lobules (Fig. 1g), where many genes show a gradient in gene expression from periportal to pericentral regions (Supplementary Fig. 5g). Collectively, these observations suggest that spatial gene expression in human hepatocytes is better described by a continuous variable determined by the relative distance between the portal and central areas of the lobule, similar to observations in mouse .
Spatial organization of non-parenchymal cells in the human liver
We next expanded our analysis to include the spatial organization of non-parenchymal cell types (Fig. 2). Two macrophage populations were visualized in the healthy liver and showed different patterns of distribution (Fig. 2a, b, c, Supplementary Fig. 6a). Macrophage (Mac) cluster 1 was enriched in the periportal area and also dispersed
through the lobules, while cells from Mac 2 were scattered more diffusely through the lobules. Both macrophage populations were identified by expression of CD74, while Mac 2 cells also expressed CD5L and MARCO (Fig. 2d, i; Supplementary Fig. 6b), most consistent with noninflammatory macrophages or Kupffer cells .
Two clusters were also identified demonstrating patterns of gene expression consistent with HSCs (Fig. 2a, b, e; Supplementary Fig. 6c).
Fig. 1 | Mapping hepatocytes within the architecture of the healthy human liver with MERFISH. a Uniform manifold approximation and projection (UMAP) of all cells measured with MERFISH in the healthy human liver. b Heatmap displaying differentially expressed genes that identify each cluster. Normalized gene expression is indicated by color. Each column represents a single cell, and cells are grouped by cluster as indicated by color at the left of the heatmap. Genes are indicated on the top of the heatmap, and groups of genes characteristic of individual clusters are indicated on the bottom. Hierarchical clustering is shown at the right. Genes enriched in each cluster are shown. Genes may appear more than once if enriched in more than one cluster. c-e Distribution of cells expressing SDS and CYP2A6 (enriched in zone 1, c), ALDOB and ADH1B (most enriched in zone 2, d), and CYP2E1 and CYP1A2 (enriched in
zone 3, e) in a section of liver tissue. Scale bars: . Expression level is measured in normalized gene expression. Dot plot quantifying expression of genes mapped in where the size of the dot represents the percentage of cells expressing a specific gene, and the color intensity indicates mean expression. mRNA distributions across a single lobule. Each dot represents an individual mRNA transcript for the indicated gene oriented from a portal region at the top to a central region at the bottom. The relative abundance of each transcript across the lobule was then plotted (lower panel) for the same field of view. Scale bars: Spatial distribution of cells assigned to each cluster of hepatocytes (Hep 1, Hep 2, or Hep 3). Hep 1 cells (purple) map to periportal areas (zone 1), Hep 3 cells (pink) map to pericentral areas (zone 3), and Hep 2 cells (brown) map between Hep 1 and Hep 3 cells (zone 2). Scale bar: .
These cells also displayed different spatial distributions, with cells from HSC 1 enriched in periportal regions and spread through the lobules, while cells from HSC 2 were scattered more diffusely through the lobules without periportal enrichment. These two populations differed primarily in the levels of CD74 expression, while both populations expressed PDGFRB and LAMB1 (Fig. 2f, i; Supplementary Fig. 6d).
Cholangiocytes and ECs were also identified by MERFISH and followed predicted distributions (Fig. 2a, b, g; Supplementary Fig. 6e). Cholangiocytes were localized to portal regions and were identified by expression of KRT7 (Fig. 2h, left; Supplementary Fig. 6f, left), while ECs, many of which line the sinusoids, were identified more diffusely through the liver, and expressed DNASE1L3 (Fig. 2h, right; Supplementary Fig. 6f, right). We did not note clear patterns of zonation in gene expression within these non-parenchymal populations , suggesting that, if such gradients exist in the human liver, our MERFISH library does not contain the proper genes to capture them.
Integration of MERFISH with snRNA-seq data
MERFISH identifies parenchymal and non-parenchymal cells in human liver tissue at single-cell resolution and provides expression data for hundreds of genes, but it does not cover the full transcriptome. To address this limitation, we next performed snRNA-seq analysis for the same human liver samples analyzed by MERFISH, profiling nuclei after filtering (Supplementary Fig. 7a). UMAP visualization and Leiden clustering revealed a similar diversity of cell populations in the snRNA-seq data to what we observed in the MERFISH data (Fig. 3a, b, Supplementary Fig. 7b, c). We then leveraged standard data integration tools to jointly cluster hepatocytes in the snRNA-seq data with those measured in MERFISH (Fig. 3a, b; Supplementary Fig. 8a). Visualization of the snRNA-seq data after this integration showed that we could identify hepatocytes zones 1,2 , and 3 as seen in the MERFISH data, but the axis of zonation within hepatocytes was not as clear in the snRNAseq data as it was in the MERFISH measurements (Fig. 1a; Fig. 3a).
Leveraging the snRNA-seq alone, we also defined two populations of HSCs, two populations of macrophages, a population of cholangiocytes, and a population of ECs (Fig. 3a, b; Supplementary Data 2). The gene expression profiles of the snRNA-seq clusters identified with this analysis had expression profiles consistent with the corresponding MERFISH clusters, supporting their assignment, cross validating the expression profiles measured with both techniques, and providing further support for the MERFISH segmentation (Supplementary Fig. 8b-d). However, we did note some evidence of lower HSC and macrophage marker expression in the cholangiocytes seen with snRNA-seq relative to those seen with MERFISH, consistent with modest segmentation challenges with these cells (Supplementary Fig. 8d). In addition, the snRNAseq data also identified a population of non-macrophage immune cells, which were not defined in the MERFISH data (Fig. 3a).
Hepatocyte zonation shapes interactions with nonparenchymal cells
While we did not observe clear zonal distributions in non-parenchymal cells, we noted that the variation in gene expression in hepatocytes
could nonetheless create a zonality to the interactions between hepatocytes and these other cell populations. To explore this possibility, we leveraged CellPhoneDB with our snRNA-seq data to explore potential modes of cell-cell interactions that could be shaped by liver zonation (Methods; Supplementary Data 3). Specifically, we focused this analysis only on receptor-ligand interactions that are uniquely enriched between hepatocytes of specific zones and the cell types in close proximity to these zonated hepatocytes (Fig. 3c, Supplementary Data 3). For example, in the periportal region hepatocytes (zone 1) produced TGFB3, which can interact with TGFBR1 expressed in Mac 1 and Mac 2 cells. PLA2G2A, a secretory phospholipase , can interact with integrins a4b1 and a5b1, allowing periportal hepatocytes to signal to HSC 1, HSC 2, Mac 1, Mac 2, and ECs. IL1RN produced by periportal hepatocytes can also antagonize IL1R expressed by Mac 1 cells. TF produced by Mac 1 cells can signal to TFRC on periportal hepatocytes, while HSC 1 and ECs expressed EFNA5 and EFNB2, respectively to signal to portal hepatocytes through EPHA2 and EPHB1.
In the pericentral region, hepatocytes could signal to HSC 1 and HSC 2 cells through expression of GDF7, which can be recognized by multiple BMP receptors in HSC 1 and HSC 2 cells. Expression of TENM3 or TENM2 by pericentral hepatocytes is recognized by ADGRL2 and/or ADGRL3, which are expressed by HSC 1, HSC 2, and Mac 1 cells. VEGFA, expressed by pericentral hepatocytes is recognized by NRP2, expressed by HSC 1 cells and NRP1 expressed by Mac 2 cells. HEBP1 from pericentral hepatocytes could also signal to Mac 1 and Mac 2 cells expressing FPR3, while pericentral expression of CCL16 could signal to CCR1 expressed on Mac 2 cells. THBS1 and THBS2 produced by HSCs can signal to CD36 expressed in pericentral hepatocytes. THBS1/2 is detected at the highest level in HSCs and can signal to CD36 expressed by pericentral hepatocytes (Supplementary Data 3), while the THBS1CD36 receptor-ligand pair is also enriched between pericentral hepatocytes and macrophages. GAS6 produced by HSC 1 and ECs can signal to pericentral hepatocytes through MERTK, while SEMA4D expressed by Mac 1 and Mac 2 cells, and VEGFB produced by Mac 2 cells can be recognized by PLXNB2 and NRP1, respectively, both of which are expressed by pericentral hepatocytes. ECs and Mac 2 cells also produce WNT2B, which can be recognized by FZD6-LRP5/6 in periportal hepatocytes, with the highest interaction scores observed between ECs and zone 3 hepatocytes (Supplementary Data 3). These findings highlight receptor-ligand interactions that may regulate cross-talk between hepatocytes and non-parenchymal cells in zone specific patterns.
Effect of nuclear content on gene expression in hepatocytes
Hepatocytes have the capacity to replicate their nuclei without dividing, generating polyploid and multinucleated cells . It is not clear if additional nuclear content leads to defined gene expression changes that could modulate function, or to what degree zonation influences nuclear content in the human liver. As an image-based approach to transcriptomics, MERFISH naturally provides a measure of the nuclear content of each cell. To leverage this capability, we counted the number of nuclei observed in individual hepatocytes and correlated this property with aspects of gene expression and spatial location.
Fig. 2 | MERFISH maps non-parenchymal cells within the healthy liver.
a, b Spatial distribution of all cells defined by MERFISH within the architecture of the healthy liver for tissue from two different donors, donor 1 (a) and donor 2 (b). Scale bars: Spatial distribution of macrophage (c), HSC (e), and cholangiocyte and EC (g) populations mapped in the same tissue section as a. Scale bars: Spatial distribution of cells in the same tissue section as (a)
colored by the normalized expression of the indicated marker genes. CD74 and CD5L identify macrophages (d), PDGFRB and LAMB1 identify HSCs (f), KRT7 identifies cholangiocytes, and DNAS1L3 identifies ECs (h). Scale bars: . i Dot plot quantifying expression of genes that identify non-parenchymal cells in the liver. The size of the dot represents the percentage of cells expressing a specific gene, and the color intensity indicates mean expression.
Indeed, we observed both single and multinucleated hepatocytes in the MERFISH data (Fig. 4a) and found that approximately a third of hepatocytes were multinucleated (Fig. 4b). The distribution of single and multinucleated hepatocytes did not change across hepatocyte
zones (Fig. 4c, d), and we did not observe any significant changes in expression of genes between hepatocytes with one or two nuclei as quantified by MERFISH (Fig. 4e). Nonetheless, the total RNA counts per cell increased with nuclei number (Fig. 4f, left) as did the cell area
Applying spatial transcriptomics in liver fibrosis
In order to explore the spatial and cellular remodeling that occurs in the context of disease, we next performed MERFISH on human liver samples from patients with liver injury and fibrosis (Supplementary Table 1 and Supplementary Fig. 1). We leveraged the same protocols as described above to image and segment cells and, in total, imaged cells (Supplementary Fig. 9). In order to compare hepatocytes between normal and fibrotic liver, we applied batch correction methods to jointly integrate MERFISH data across all samples (Fig. 5a, b; Supplementary Fig. 10). Instead of three zones of hepatocytes, this joint analysis produced two: a periportal cluster of hepatocytes (Portal Hep) and a pericentral cluster of hepatocytes (Central Hep), which collectively contained zone 1,2 and 3 hepatocytes from healthy liver (Fig. 5a, Supplementary Fig. 9b-d, Supplementary Fig. 10, Supplementary Data 2). In addition, two clusters were also identified that were almost entirely composed of hepatocytes from fibrotic injury (Fibrotic Hep 1 and 2) (Fig. 5a, Supplementary Fig. 9b-d, Supplementary Fig. 10, Supplementary Data 2). Periportal hepatocytes and pericentral hepatocytes retained their expected localization in the setting of chronic liver injury (Fig. 5c), while the two clusters of hepatocytes that emerged with fibrotic injury were distributed throughout the lobules (Fig. 5d). A single cluster of HSCs and a single cluster of macrophages were also identified (Fig. 5a, b; Supplementary Data 2). HSCs displayed bands of cells across lobules, while macrophages were spread more diffusely through the lobules (Fig. 5e). Thus, we find that hepatocyte zonation is at least partially maintained with fibrotic injury, while two injury-related hepatocyte states are enriched that do not appear to retain zonation.
We next evaluated changes in gene expression between hepatocytes in healthy livers and those with fibrotic injury using MERFISH (Fig. 5f; Supplementary Data 4). For this analysis, we first separated healthy hepatocytes into their original three zones (Healthy zone 1, 2, 3) and compared expression to portal and central hepatocytes from fibrotic liver (Portal Hep and Central Hep; Supplementary Data 4). Portal and central hepatocytes from the fibrotic liver retain the same zonal expression of marker genes as healthy zone 1,2 , and 3 and are characterized primarily by a reduction in expression of these genes. We then evaluated gene expression of the expanded fibrotic populations (Fibrotic Hep 1 and 2) (Fig. 5f, bottom; Supplementary Data 4). The Fibrotic Hep 1 cluster showed a general reduction in expression of genes enriched in hepatocytes, while the Fibrotic Hep 2 cluster showed an increase in expression of several notable genes, including SLC7A2, CPS1, ATP9A, DTX1, POR and EXT1 compared to all other hepatocyte populations.
Non-hepatocyte clusters also showed disease-associated gene expression changes. For example, fibrotic macrophages showed a loss of MARCO, CD5L, CD68 and retained an expression pattern that more closely matched Mac 1 cells in normal liver (Fig. 5g), while fibrotic HSCs maintained high levels of COL1A1 expression without a clear positive signature from the other genes included in the MERFISH panel (Fig. 5h).
Transcriptome-wide expression changes in fibrosis
To expand our analysis transcriptome-wide, we next performed snRNA-seq on the same samples characterized with MERFISH, collecting nuclei across these three samples (Fig. 6; Supplementary Fig. 11). Analysis of the snRNA-seq data alone produced the same non-parenchymal clusters as seen with MERFISH; however, to better integrate the labeling of the hepatocytes, we jointly integrated and clustered hepatocytes between these two measurements (Fig. 6a, b; Supplementary Fig. 12a, b). Importantly, this analysis revealed nuclei in the snRNA-seq data that were similar to the two fibrotic hepatocyte clusters (Fibrotic Hep 1 and Fibrotic Hep 2) seen in the MERFISH measurements, supporting the emergence of these two diseaseassociated populations (Supplementary Fig. 12a, b).
We then used the more complete transcriptomic data from snRNA-seq to evaluate differences in gene expression between
hepatocytes in healthy liver and livers with fibrotic injury. Indeed, a large functional diversity of genes were differentially expressed between hepatocytes within these conditions (Supplementary Data 4). To organize this functionality, we performed gene ontology (GO) analysis, which showed that genes induced with injury were enriched across many metabolic pathways (Supplementary Data 5). We thus focused on the more general category of metabolic processes (GO:0008152) to capture these changes in gene expression (Fig. 6c, Supplementary Data 6). When comparing all healthy to all injured hepatocytes, the most highly enriched group of metabolic genes include those with dehydrogenase, oxygenase, and hydrolase activity along with nuclear receptors THRB, RORA, and ESR1 (Supplementary Data 4 and Supplementary Data 6). Increased expression was also observed in the ligases CPS1 and GLUL and the transporter SLC25A15, which are involved in the urea pathway (Supplementary Data 6).
With injury, hepatocytes that maintain portal and central zonation (Portal Hep and Central Hep) both continued to show increased expression of hydrolases, oxygenases, and the nuclear receptors THRB, RORA, and ESR1 in comparison to healthy hepatocytes from zones 1,2 , and 3 , and induction of dehydrogenases was most pronounced in Central Heps with injury (Fig. 6c, Supplementary Data 4 and Supplementary Data 6). While oxygenases increase in both Portal and Central Heps with injury, CYP2E1 shows the highest expression in Central Heps with injury (Fig. 6c, Supplementary Data 4 and Supplementary Data 6). The ligase CPS1 is increased in both populations, and GLUL remains more restricted to Central Heps and ASS1 to Portal Heps with injury. Within the hepatic populations that emerge with fibrotic injury and do not show zonal distribution (Fibrotic Hep 1 and 2, Fig. 5d), we again observe an enrichment in metabolic pathways, primarily those involving fatty acids and amino acids, while pathways involving RNA processing and ribosome biosynthesis are reduced (Supplementary Fig 13a, b). Both Fibrotic Hep 1 and Fibrotic Hep 2 continue to show enriched expression of the nuclear receptors THRB, RORA, and ESR1 (Fig. 6c, Supplementary Data 4 and Supplementary Data 6) and maintain increased expression of CPS1 and SLC25A15. Fibrotic Hep 1 cells are relatively more enriched in oxygenases compared to Fibrotic Hep 2 cells and are notable for increased expression of the phospholipase PNPLA3 , along with ASPG, CPEB4, and PRKAG2. Fibrotic Hep 2 cells show relative enrichment in expression of hydrolases, heat shock proteins (HSPH1 and HSP9OAA1, while HSPH1 is enriched in both Fibrotic Hep 1 and 2), and PLCB1 compared to Fibrotic Hep 1 cells. The transmembrane receptor is increased in Fibrotic Hep 1 and Fibrotic Hep 2 cells, while the transmembrane receptor is increased in all injured hepatocyte populations, and is enriched in injured Portal Heps and Fibrotic Hep 1 and Fibrotic Hep 2 populations (Fig. 6c, Supplementary Data 4 and Supplementary Data 6). These results show the metabolic impact of chronic injury on hepatocytes, including common activation of nuclear hormone receptors and genes that regulate the urea pathway, and more restricted induction of transmembrane receptors, heat shock proteins, and the phospholipase PNPLA3.
Gene expression was also evaluated in non-parenchymal cells. With injury, macrophages showed changes in gene expression in pathways including cell signaling, cell migration, and immune response when compared to Mac 1 and Mac 2 from healthy livers (Fig. 6d, Supplementary Data 2). Change in gene expression in HSCs with injury included those involved with the extracellular matrix, cell migration, and cell adhesion when compared to HSC 1 and HSC 2 in healthy livers (Fig. 6e, Supplementary Data 2). ECs and cholangiocytes also showed changes in gene expression across categories including cell adhesion and cell surface receptor signaling with injury (Supplementary Fig. 12c, d; Supplementary Data 2). These results show that the macrophage population defined with injury is distinct from Mac 1 and Mac 2 identified in healthy donors. Similarly, the HSC population defined in injury is distinct from HSC 1 and HSC 2 in healthy donors.
Fig. 4 | Multinucleated hepatocytes do not have unique spatial or gene expression distributions. a Example MERFISH DAPI images showing hepatocytes containing single and multiple nuclei. Examples of multinucleated cells are indicated by white arrowheads. DAPI staining marks nuclei (white), and cell boundaries (light blue) were determined by Baysor with input from Cellpose. Scale bars: . b Distribution of number of nuclei per hepatocyte. c Hepatocyte UMAP, as in Fig. 1, colored by the number of nuclei found within each hepatocyte. Source data are
provided as a Source Data file. d Spatial distribution of hepatocytes with 1 or 2 detected nuclei in healthy human liver (donor 1, left and donor 2, right). Scale bar: . e Dot plots of hepatocyte genes for hepatocytes with 1 or 2 nuclei. The size of circles represents the percentage of cells expressing a gene in each group and the color intensity indicates mean expression. Distribution of the transcripts per cell (left), area per cell, (middle) and RNA density per cell (right) for hepatocytes with the indicated nuclear content. Source data are provided as a Source Data file.
Discussion
Significant advances in mapping the human liver at single-cell resolution have been achieved recently with scRNA-seq and snRNAseq . In parallel, platforms such as Visium now provide spatial information, but it has remained challenging to assign transcripts to
individual cells and cell types located in close proximity. Here we complement these previous efforts by developing protocols for the application of MERFISH in human liver samples and using these methods to achieve spatial transcriptomic analysis of genes at single-cell resolution in the human liver, profiling cells in
Fig. 5 | MERFISH reveals conserved zonation and expansion of hepatocyte populations in fibrotic livers that do not follow zonal distribution. a UMAP of fibrotic tissue measured with MERFISH. Clusters are indicated by color. Portal Hep and Central Hep show similarities to hepatocytes identified as zone 1,2, and 3 cells from healthy liver, and Fibrotic Hep 1 and Fibrotic Hep 2 contain hepatocyte clusters that emerge with fibrotic injury. The HSC cluster shows similarities to both HSC 1 and HSC 2 cells from healthy liver, and the Mac cluster has similarities to both Mac 1 and Mac 2 clusters from healthy liver. b Relative abundance of each cell type identified in each sample (left to right: healthy donors 1-3 followed by fibrotic donors 4-6). Cell types are colored as in . Source data are provided as a Source
Data file. c-e Spatial distribution of cell populations in the fibrotic liver (donor 4), highlight hepatocytes that are similar to those seen in healthy samples (c), hepatocyte populations that are identified only when including fibrotic liver samples (d), and key non-parenchymal cells (e). Scale bar: . f-h Dot plot quantifying expression of genes differentially expressed in clusters seen in healthy measurements (Healthy zone 1, 2, or 3) or in fibrotic samples (Portal Hep, Central Hep, Fibrotic Hep 1, or Fibrotic Hep 2) for hepatocytes (f), macrophages (g), and HSCs (h). Macs Healthy 1 and Healthy 2 refer to Mac 1 and Mac 2 cells in healthy liver, and HSCs Healthy 1 and Healthy 2 refer to HSC 1 and HSC 2 cells in healthy liver.
Fig. 6 | Combining MERFISH and snRNA-seq to analyze fibrotic livers. a UMAP of snRNA-seq data for injured human liver. Annotations for the hepatocytes were determined by merging data from both MERFISH and snRNA-seq and leveraging both marker gene expression and label-transfer of MERFISH labels. b Heatmap displaying differentially expressed genes that identify each snRNA-seq cluster. Normalized expression level is indicated by the color bar on the right. Each column represents a single nucleus, and nuclei are grouped by cluster as indicated at the top of the heatmap. Genes are indicated at the bottom of the heatmap, groups of
genes characteristics of individual cell clusters are indicated on the top, and cells are grouped by cluster as indicated by color at the left. c Dot plot quantifying expression of genes differentially expressed in clusters seen in healthy measurements (Healthy zone 1, 2, or 3) or in fibrotic samples (Portal Hep, Central Hep, Fibrotic Hep 1, or Fibrotic Hep 2) for hepatocytes. Dot plots quantifying expression of genes differentially expressed in macrophages (d) and HSCs (e) are shown. Macs Healthy 1 and Healthy 2 refer to Mac 1 and Mac 2 cells in healthy liver, and HSCs Healthy 1 and Healthy 2 refer to HSC 1 and HSC 2 cells in healthy liver.
both healthy and diseased liver. Combining MERFISH with snRNA-seq then allowed us to analyze the broader transcriptome within spatially resolved cell types and cell sub-types.
From these measurements, we were able to resolve three clusters of hepatocytes that are spatially distinct across the lobule in healthy human liver, characteristic of separation of hepatocytes into zones 1,2, and 3 moving from periportal to pericentral regions. While MERFISH allows to us to define these zones, it is also evident through pseudotime analysis, measurement of gene expression across individual lobules, and transcriptional analysis performed across lobules, that zonation reflects a gradient from periportal to pericentral regions rather than distinct zones. Thus, the classic three zones are, in reality, an approximation for the continuous gene expression and functional changes that occur in space with human hepatocytes-a proposal consistent with recent single-cell analysis in the murine liver .
With the development of fibrotic injury, many hepatocytes maintained a zonal phenotype, but we also observed the emergence of two additional hepatocyte populations with fibrotic injury that show diffuse distribution through the lobules without a portal or central bias (Fibrotic Hep 1 and 2 populations; Fig. 5a, b, d). Specific genes identified as differentially expressed can shift between MERFISH and snRNA-seq and may reflect differences between nuclear and cytoplasmic distribution of some transcripts, but a common theme from both analyses was enrichment of genes in the urea pathway with fibrotic injury. CPS1 (Carbamoyl phosphate synthetase I) is responsible for converting ammonia to carbamoyl phosphate to enter the urea cycle , SCL7A2 encodes an arginine/ ornithine/lysine transporter and provides ornithine (either directly or through conversion of arginine) to interact with carbamoyl phosphate to form citrulline , and SLC25A15, is an ornithine transporter in the urea cycle (Figs. 5f and 6c). In addition, Fibrotic Hep 1 cells showed enrichment in genes including PNPLA3, CPEB4, and ASPG, which are linked to hepatic steatosis, steatohepatitis, and/or fibrosis , and THRB, which encodes the protein target of resmetirom, a medication shown to be effective in treating nonalcoholic steatohepatitis , together highlighting additional pathways that may be altered in disease.
Two populations of macrophages were identified by MERFISH and show different distribution patterns through the lobule. Mac 2 cells were identified as , and with increased expression of VISG4 compared to Mac 1 cells and were located more diffusely through the lobule, most consistent with Kupffer cells. Mac 1 cells were and CD5L with lower levels of CD68. While Mac 1 cells were also found through the lobule, they did exhibit a distinct enrichment in portal areas in contrast to Mac 2 cells. Further comparisons of gene expression between Macl and Mac 2 with snRNA-seq confirmed these expression patterns along with increased CD163, VCAM1, and TMEM26 in Mac 2 cells (Supplementary Data 2), all of which are evolutionarily conserved markers of Kupffer cells . While Mac 2 cells expressed higher levels of IL18 compared to Mac 1 cells, we do not observe the increased expression of GPNMB, SPP1, or LGALS1 in Mac 1 cells necessary to link them to lipid associated macrophages (LAMs), identified in the livers of healthy mice and expanded with steatosis . With the development of fibrotic injury, the macrophage population lost expression of MARCO, CD5L, and CD68 in the MERFISH data, and snRNA-seq analysis also showed reduction in MARCO and CD5L as well as VCAM1 and CD163. While these features suggest movement away from Kupffer cell markers, IL18 expression was maintained, and gene expression remained distinct from the Mac 1 population (Fig. 6d).
MERFISH also identified two populations of HSCs. HSC 1 was enriched in the portal areas compared to HSC 2, and both populations were found distributed through the lobules. Within the genes evaluated by the MERFISH probes, the MHC class II chaperone CD74 showed the greatest differential expression between the two HSC populations, with highest expression observed in HSC 1 cells. A similar effect was also observed in the snRNA-seq data. CD74 is expressed by HSCs, can be induced by inflammatory signals such as IFN- and can
promote immune activation through MHC class II-mediated interactions . It is currently unclear if these CD74 positive and negative populations represent HSCs with distinct antigen presentation abilities or possibly different histories of activation. Overall, the injured HSC expression profile was distinct from HSC 1 and HSC 2 populations (Fig. 6e).
With single-cell spatial resolution, we evaluated receptor-ligand coexpression in cells across hepatocyte zonation. Our MERFISH panel was not designed to explore a diverse set of functional pathways in HSCs, macrophages, or ECs across zones, but the current data do allow us to ask about specific interactions driven by differential expression of receptors or ligands in hepatocytes across zones. Indeed, we observe that the zonal expression of receptors and ligands in hepatocytes can shape the potential interactions with non-parenchymal cells. In particular, we identified signaling interactions including a thrombospondin signal (THBS1/2) from HSCs to CD36 in zone 3 hepatocytes, which may influence metabolic dysfunction associated steatotic liver disease (MASLD) , and the interaction of WNT2B, expressed by ECs and Mac 2 cells, with FZD6 and LPR5/6 expressed by zone 3 hepatocytes helps validate this analysis. More broadly, this analysis, like all single-cell receptor-ligand analyses, produced only hypotheses of potential interactions. Nonetheless, this rich set of hypotheses for spatially organized interactions could prove useful in directing future functional studies.
MERFISH also provides data about nuclei and cell boundaries in addition to gene expression, allowing us to link nuclei content to gene expression within individual cells. We found that approximately a third of adult hepatocytes are multinucleated , in agreement with previous descriptions of human liver. We did not quantify ploidy separately, but based on these studies, we would predict that of these multinucleated hepatocytes are . While we did not observe a change in relative gene expression with increase in nuclear content, we did observe an increase in RNA transcripts. In addition, multinucleated hepatocytes also tend to be larger in size, such that mRNA levels were proportional to cell size. These findings are consistent with the interpretation that cells with more nuclei are both larger and express higher levels of RNA. Most of the transcripts identified in hepatocytes are cytoplasmic, but transcripts are also present in the nucleus. It is possible that MERFISH data could be used to evaluate transcriptional activity between different nuclei in the same hepatocyte, but this will require additional tools to reconstruct nuclei from the stacked images and control for the fraction of each nuclei visualized in an individual cell.
Taken together, our study applied MERFISH to create spatial transcriptomic maps of the healthy and fibrotic liver at single-cell resolution to define spatially and transcriptionally distinct subpopulations of hepatocytes, macrophages, and HSCs within hepatic lobules and distinct hepatocyte sub-populations that expand with fibrotic injury. By combining MERFISH with snRNA-seq, we extended the transcriptional profiles of cell types in these spatial maps to understand unique receptor-ligand interactions involving hepatocytes and non-parenchymal cells across hepatocyte zones and defined changes in gene expression in spatially-resolved hepatocyte populations with injury. Finally, by evaluating nuclear content, we found that multinucleated hepatocytes do not show differences in relative gene expression compared to mono-nucleated hepatocytes, but tend to be larger and produce more total transcripts. Future studies will now be able to extend these approaches, expanding probe set libraries to encompass additional RNA species to evaluate all cell types in the liver and their broader transcriptional profiles at single-cell spatial resolution in health and disease.
Methods
Tissue collection
All liver samples were collected from excess surgical tissue at Massachusetts General Hospital in accordance with protocols approved by
the Mass General Brigham (MGB) or Dana Farber Cancer Institute (DFCI) Institutional Review Boards (IRBs) including approval to provide data on age by decade and sex. All MERFISH and snRNA-seq data presented within are from matched samples. Sex was not considered as a variable due to the small sample size. Patients were consented under MGB protocol 2019P001245 (AM-061) or DFCI protocol 02-240 (all other samples). Patients consented under 2019P001245 received compensation of USD and a parking pass. Patients consented under 02-240 did not receive compensation. Tissue collected was used for analysis, and additional tissue is not available for distribution.
MERFISH sample preparation
Liver tissue sections ( thickness) were fixed by submerging in fresh paraformaldehyde (PFA; EMS 15710) in 1X Phosphate Buffered Saline (PBS; Ambion AM9625) for hours at with gentle rocking. After fixation, tissue samples were then transferred to a sucrose (VWR, 0335) solution in 1X PBS supplemented with PFA and incubated overnight at with gentle rocking. After washing in 1X PBS, samples were placed in cryomolds on dry ice, covered with Optimal Cutting Temperature media (OCT; Tissue-Tek 4583), wrapped in aluminum foil, and stored at until use.
MERFISH library preparation
A panel of 317 genes were selected with a focus on those differentially expressed between hepatocyte clusters supplemented with common markers of non-parenchymal liver cells . The MERFISH encoding probes targeting these genes were designed using a previous pipeline . Briefly, each probe contained a 30 -nt-long region specific to the targeted RNA, concatenated with a series of readout sequences that defined the binary barcode assigned to that RNA. Each mRNA was targeted with 72 such probes. To encode these 317 genes, we selected a 22-bit-long, constant Hamming weight and Hamming distance code with a Hamming weight of 4 and a minimum Hamming distance of 4 . Each of the 72 encoding probes contained two readout sequences and the complement of all encoding probes to a given gene contained instances of the four readouts associated with the 4 bits in which they had a ‘ 1 ‘. This barcoding scheme contains 332 barcodes and we leveraged the 15 not used to encode RNAs as ‘blank’ barcode controls, not assigned to an RNA (Supplementary Data 1).
Templates for these probes were designed by concatenating a primer and a T7 promoter to the sequences (Supplementary Data 1), as described previously, and the template pool was ordered from Twist Biosciences. These templates were amplified into encoding probes in a protocol that involved PCR, in vitro transcription, reverse transcription, alkaline hydrolysis, and SPRI purification, as described previously .
MERFISH staining
The general workflow for MERFISH sample preparation includes sectioning, permeabilization, cell boundary staining, RNA probe hybridization, acrylamide gel embedding, digestion, and photobleaching of samples. These protocols have been described previously . Briefly, OCT-embedded tissues were cryosectioned at a thickness of 7 , and slices were transferred onto silanized, poly-lysine coated 40mm circular coverslips with fiducial beads, prepared as described previously . Following sectioning, tissue slices were briefly fixed with PFA in 1X PBS at room temperature for 10 minutes, washed thrice with 1X PBS for 5 minutes, and then permeabilized overnight at in ethanol. Samples were rehydrated in 2 X saline sodium citrate (SSC; Ambion AM9763).
To prepare samples for antibody staining of cell boundaries, tissue samples were treated with proteinase K (New England Biolabs [NEB]; P8107S) in pre-warmed ( ) 2X SSC for 10 minutes at . Samples were then rinsed with 2 X SSC before incubating with a
blocking buffer ( BSA, murine RNase inhibitor [NEB, M0314L] in 2X SSC) for 30 minutes. The sample was then stained with a primary antibody against the -ATPase , Abcam; Ab76020) in the same blocking buffer for 30 minutes at room temperature. Excess primary antibody was removed from the samples with three, 10 -minute, 2 X SSC washes at room temperature. The sample was stained with a secondary antibody using the same protocol as the primary antibody ( ; ThermoFisher; A16112). The secondary antibody was labeled with an oligonucleotide using previous protocols .
Probes were hybridized to the sample at a concentration of in a formamide (Fisher Scientific, AM9342), dextran sulfate (VWR, ), yeast tRNA (ThermoFisher, 15401029) solution in 2X SSC for 48 hours at in a humidified oven. Samples were rinsed by letting the samples sit in formamide in 2X SSC before hybridization for at least 4 hours and twice after hybridization for 30 minutes each time at .
To clear samples, they were embedded in a polyacrylamide gel and then digested for two days with proteinase K, as described previously . Briefly, samples were embedded in a thin polyacrylamide film by inverting them onto a GelSlick-coated microscope slide with a droplet of acrylamide solution ( acrylami-de:bis-acrylamide [BioRad, 1610144] with TEMED [Sigma, T7024] and ammonium persulfate [Sigma, 215589]). After the gel polymerized for 2 hours, samples were covered with a digestion solution (1% proteinase K, 20% v/v SDS [ThermoFisher, AM9823], 0.25% triton-X [Sigma, T8787] in 2X SSC) and incubated at for 24 hours. Samples were then rinsed multiple times with 2 X SSC . In order to remove autofluorescence, samples were photobleached under a blue LED light at for 24 hours. Samples were stored at until imaging.
snRNA-seq
Single nucleus extraction was performed based on previouslydescribed protocols . A 2X stock of salt-Tris solution (ST buffer) containing 292 mM NaCl (Thermo Fisher Scientific, AM9759), 20 mM Tris-HCl pH 7.5 (Thermo Fisher Scientific, 15567027), (VWR International Ltd, ), and (Sigma Aldrich, M1028) was prepared in ultrapure water. The day of each experiment, for each sample, Tween with salts and Tris (TST) buffer was made from 1 ml of 2X ST buffer, of Tween-20 (Sigma Aldrich, P-7949, final), of BSA (NEB, B9000S, final) and of nuclease-free water and supplemented with Protector RNase inhibitor (Millipore Sigma, 3335402001). 1X ST buffer was prepared by dilution 2X ST with ultrapure water (Thermo Fisher Scientific, 10977023) and supplemented with Protector RNase Inhibitor (Millipore Sigma, 3335402001).
On dry ice, a section of frozen tissue was placed into a gentleMACS C Tube (Miltenyi Biotec, 130-093-237) with 2 ml of TST buffer. Tissue was immediately dissociated using a gentleMACS Dissociator (Miltenyi Biotec, 130-096-427) using the m_Spleen_01_01 program twice and incubated on ice for 5 min to complete a 10 min incubation in Tween with salts and Tris (TST) buffer. C tubes were centrifuged at for 2 min at 500 g . The pellet was resuspended in TST buffer, filtered through a Falcon cell strainer (VWR, 43-50040-51) into a 50 ml conical tube. The strainer was washed with 1 ml 1X ST buffer before use. An additional 1 ml of 1 X ST buffer was used to wash the gentleMACS C Tubes and filter, and another 1 ml was added to the filter for a final wash. The sample was transferred to a 15 ml conical tube and centrifuged at for 10 min at 500 g . The pellet was resuspended in 1X PBS (-Mg/-Ca, Gibco, 10010023), 1% BSA (NEB, B9000S), and Protector RNase Inhibitor (between depending on pellet volume). The nucleus solution was filtered through a Falcon cell strainer (Corning, 352235). Nuclei were counted using a INCYTO C-chip disposable hemocytometer (VWR, 22-600-100).
Sample processing
MERFISH measurements. MERFISH measurements were performed as described previously using a custom-microscope system . The entire slice was first imaged using a 10X objective and the DAPI stain, and this mosaic was used to select the region of interest for MERFISH measurements.
snRNA-seq. 8000-12,000 nuclei of the single nucleus suspension were loaded onto the Chromium Chips for the Chromium Single Cell 3 ‘ Library (Chromium Next GEM Single Cell 3’ Kit v3.1; PN-1000268, PN1000120 , PN-1000215) according to the manufacturer’s recommendations (10x Genomics). Gene expression libraries were constructed and indexed according to manufacturer’s instructions and pooled for sequencing on a NovaSeq 6000 sequencer (Illumina). All libraries were sequenced to a targeted depth of 400 million reads in the following configuration: R1: 28 bp ; R2: 90 bp ; I1, I2: 10 bp .
Analysis
MERFISH decoding. MERFISH decoding was performed using a previously described pipeline . Briefly, images from a single field-ofview (FOV) were stacked into movement-corrected stacks containing all z-planes and imaging channels, an optimal weighting was determined for the relative intensity of different image frames, and pixels were assigned to individual barcodes using a soft decoding approach based on nearest neighbors with a Euclidean distance metric. Adjacent pixels assigned to the same barcode were aggregated to form a single RNA.
RNAs were assigned to cells using a combination of Cellpose (version 0.7.2) and Baysor (version 0.5.0). Briefly, we trained a cellpose model based on the -ATPase immunofluorescent stain and created a label matrix using cellpose and this model for each FOV. Cellpose was applied to each z-plane separately, and then overlapping boundaries were combined across z-planes to create a 3D segmentation. We leveraged our previous pipeline to identify cell boundaries, connect boundaries across FOV boundaries, and parse RNAs into these boundaries. This initial segmentation result was then refined and improved with Baysor using the following parameters: scale 10, scale standard deviation 50%, molecules/cell 3, and prior confidence 0.50.
MERFISH single-cell analysis. The output of Baysor was analyzed using Scanpy (version 1.8.1). Initial processing concatenated the MERFISH data into a single AnnData structure, filtered cells with less than 3 genes and 15 RNA counts, normalized the remaining cells, and applied a logarithmic scaling. Harmony was used as our data integration method in order to account for sample variation . For the analysis of the healthy MERFISH data, we used 100 PCA components and a final Leiden resolution of 1.1 For the analysis of the MERFISH fibrotic data, we used 150 PCA components and a final Leiden resolution of 1.2
snRNA-seq. Samples were demultiplexed using Illumina’s bcl2fastq conversion tool and the 10x Genomics pipeline Cell Ranger (version 7.0.1) to perform alignment against the Genomics pre-built Cell Ranger reference GRCh38-2020-A (introns included). Cells with mitochondrial or ribosomal counts and cells with <500 genes or UMI<500 were removed. Ambient RNA was removed using the Soup package (version 1.6.2). We focused on ambient RNA from genes enriched in hepatocytes, as hepatocytes constituted almost 70% of cells in the dataset. We included hepatocyte genes previously used for ambient RNA removal (CYP2E1, ASGR1, CYP3A4, SCD, SLP1, CYP2B6, CPS1, CRP, , and but included in a separate filter from the other genes due to ts high detection across clusters. We added a third filter (CYP27A1, CYP4A11, CYP4V2, CYP2B7P, CYP2A6, CYP2A7, CYP3A5, CYP2C9, CYP2C8, CYP4F3, CYP3A43) based high expression in hepatocytes in the current dataset. Next, doublets and multiplets were filtered out using DoubletFinder v2.0.4 for each individual sample.
Each sample’s count was normalized by the SCTransform method in Seurat v4.3.0 with mitochondrial reads regressed out.
Healthy and diseased samples were each merged into individual Seurat objects, and genes were projected into principal component space using principal component analysis (RunPCA). Integration and batch correction across subjects were performed with the Harmony R package. The first 20 principal components processed with Harmony were used as inputs for the FindNeighbours and FindClusters functions. Clustering for healthy samples was performed at a resolution of 1 , chosen from tested resolutions (0.1, 0.2, 0.3, 0.4 0.5, 0.6, 0.7, 0.8, 0.9 and 1.0). The same resolution was used for diseased samples.
A shared-nearest-neighbor graph was constructed based on the Euclidean distance metric in principal component space, and cells were clustered using the Louvain algorithm. The RunUMAP function with default settings was used to calculate 2D UMAP coordinates to identify distinct cell populations. Cell types were assigned to clusters using ScType with liver as the tissue annotation. We identified hepatocyte, HSC, cholangiocyte, endothelial cell (EC), macrophage, and an additional immune system cell, populations. A few sub-clusters within the hepatocyte populations were labeled as unknown by ScType and were manually assigned the hepatocyte label based on gene expression. All reported cluster labels for snRNA-seq data from healthy or diseased samples reflects the assignments made from the analysis of the snRNA-seq data alone, with the exception of the hepatocyte subdivisions, which were jointly labeled by co-integrating with MERFISH (see below). We performed joint integration of hepatocytes with MERFISH as the zonal gene expression axis was not as apparent in snRNA-seq analysis, and initial analysis of these data alone did not recapitulate clusters that defined these gene expression gradients as clearly as MERFISH.
Cluster-level quality control was then performed using MALAT1, a long noncoding RNA transcript retained in the nucleus , as an indicator of high-quality snRNA-seq clusters . We removed two clusters from the healthy dataset and two from the fibrotic injury dataset where greater than of cells contained fewer than three MALAT1 reads. In contrast, fewer than of cells in any other cluster showed fewer than three MALAT1 reads.
Integration of MERFISH and snRNA-seq data. To co-integrate the healthy MERFISH and snRNA-seq measurements to identify the zonal gradients within hepatocytes within the snRNA-seq data, we concatenated the two separate AnnData structures containing just hepatocyte cells identified from the Leiden clustering described above. Expression was logarithmically transformed, z-scored, and the genes were trimmed to just those measured with MERFISH before concatenation. These cells were then integrated using Harmony in order to compare gene expression markers and labels across cell types, leveraging the inbuilt algorithms and defaults associated with scanpy. This co-integrated data was clustered using Leiden clustering in order to assess and group the hepatocytes between the two modalities. The individual Leiden clusters were then annotated by leveraging a combination of marker expression and the existing annotations derived from the clustering analysis of the MERFISH data alone, as described above. Importantly, this approach was used only to apply labels to the snRNA-seq cells, and all expression analysis derived from this cointegration was taken from the snRNA-seq cells.
Ligand-receptor analysis. Receptor-ligand interactions were evaluated using snRNA-seq data using CellPhoneDB . We applied 1000 iterations and considered ligands and receptors for analysis if expressed by at least of cells (threshold ). Significant interactions between hepatocytes and non-parenchymal cells ( p -value of 0.05 or less) were only selected if the interactions involved hepatocytes from one or two zones. Predicted interactions were excluded if 1) the interaction score for a significant interaction was less than the
interaction score for non-significant interaction between hepatocytes and the indicated cell type and 2) the ligand was expressed at a higher level in the receptor cell than the ligand cell. Only interactions defined as Ligand-Receptor are displayed.
Analysis of gene expression between hepatocytes in healthy liver and livers with fibrotic injury. Differential expression analysis was performed for the indicated comparisons using scanpy’s ranked genes function using the t-test model. Genes were ranked by scores to identify the 100 most induced genes for each comparison within hepatocytes. GO analysis (biologic process; Panther release 19.0) was performed as indicated for all healthy hepatocytes compared to all hepatocytes in livers with fibrotic injury (Supplementary Data 5). Results showed enrichment of metabolic pathways, and the broader category of metabolic process (GO:0008152) was selected as the broadest category to evaluate changes in metabolic genes. Genes within this pathway were then evaluated for each subsequent comparison, and were further characterized by Panther protein class.
Gene set enrichment analysis (GSEA). Gene set enrichment analysis (GSEA) was performed using GSEApy (version 1.1.3) to compare Fibrotic Hep 1 and Fibrotic Hep 2 with both healthy hepatocytes and all identified hepatocytes. The terms were derived from the “GO_Biological_Process_2021” list.
Statistics and reproducibility
Statistical analyses were performed as described. No statistical method was used to predetermine sample size for MERFISH or snRNA-seq. No data that met the described criteria were excluded from the analyses. The experiments were not randomized. The Investigators were not blinded to allocation during experiments and outcome assessment.
Reporting summary
Further information on research design is available in the Nature Portfolio Reporting Summary linked to this article.
Data availability
The MERFISH raw and processed data generated in this study have been deposited in datadryad under the doi: 10.5061/dryad.37pvmcvsg [https://datadryad.org/stash/dataset/doi:10.5061/dryad.37pvmcvsg].
The raw snRNA-seq data used in this study are available in the GEO database under accession code: GSE210077. Processed data for snRNA-seq have been deposited in datadryad under the doi: 10.5061/ dryad.37pvmcvsg [https://datadryad.org/stash/dataset/doi:10.5061/ dryad.37pvmcvsg]. To aid in the visualization of these data, a web viewer has been created for the MERFISH and snRNA-seq presented in this paper. This viewer can be accessed at: https://moffittlab.github.io/ visualization/2024_Human_Liver/index.html. Source data are provided with this paper.
References
Rezania, V., Coombe, D. & Tuszynski, J. A. A physiologically-based flow network model for hepatic drug elimination III: 2D/3D DLA lobule models. Theor. Biol. Med. Model 13, 9 (2016).
Teutsch, H. F. The modular microarchitecture of human liver. Hepatology 42, 317-325 (2005).
Gebhardt, R. Metabolic zonation of the liver: Regulation and implications for liver function. Pharm. Therapeut 53, 275-354 (1992).
Jungermann, K. & Keitzmann, T. Zonation of Parenchymal and Nonparenchymal Metabolism in Liver. Annu Rev. Nutr. 16, 179-203 (1996).
Martini, T., Naef, F. & Tchorz, J. S. Spatiotemporal Metabolic Liver Zonation and Consequences on Pathophysiology. Annu. Rev. Pathol.: Mech. Dis. 18, 439-466 (2023).
Kietzmann, T. Metabolic zonation of the liver: The oxygen gradient revisited. Redox Biol. 11, 622-630 (2017).
Droin, C. et al. Space-time logic of liver gene expression at sublobular scale. Nat. Metab. 3, 43-58 (2021).
Damm, G. et al. Human parenchymal and non-parenchymal liver cell isolation, culture and characterization. Hepatol. Int. 7, 951-958 (2013).
Roberts, S., Ludwig, J. & Larusso, N. The pathobiology of biliary epithelia. Gastroenterology 112, 269-279 (1997).
MacParland, S. A. et al. Single cell RNA sequencing of human liver reveals distinct intrahepatic macrophage populations. Nat. Commun. 9, 4383 (2018).
Ramachandran, P. et al. Resolving the fibrotic niche of human liver cirrhosis at single-cell level. Nature 38, 1-29 (2019).
Andrews, T. S. et al. Single-Cell, Single-Nucleus, and Spatial RNA Sequencing of the Human Liver Identifies Cholangiocyte and Mesenchymal Heterogeneity. Hepatol. Commun. 6, 821-840 (2021).
Tanami, S. et al. Dynamic zonation of liver polyploidy. Cell Tissue Res. 368, 405-410 (2017).
Kudryavtsev, B. N., Kudryavtseva, M. V., Sakuta, G. A. & Stein, G. I. Human hepatocyte polyploidization kinetics in the course of life cycle. Virchows Arch. B 64, 387-393 (1993).
Watanabe, T. & Tanaka, Y. Age-related alterations in the size of human hepatocytes. Virchows Arch. B 39, 9-20 (1982).
Saeter, G. et al. Changes in ploidy distributions in human liver carcinogenesis. J. Natl Cancer Inst. 80, 1480-1485 (1988).
Matsumoto, T., Wakefield, L. & Grompe, M. The Significance of Polyploid Hepatocytes During Aging Process. Cell Mol. Gastroenterol. Hepatol. 11, 1347-1349 (2021).
Chen, K. H., Boettiger, A. N., Moffitt, J. R., Wang, S. & Zhuang, X. Spatially resolved, highly multiplexed RNA profiling in single cells. Science 348, aaa6090 (2015).
Moffitt, J. R. et al. High-throughput single-cell gene-expression profiling with multiplexed error-robust fluorescence in situ hybridization. Proc. Natl Acad. Sci. 113, 11046-11051 (2016).
Moffitt, J. R. et al. High-performance multiplexed fluorescence in situ hybridization in culture and tissue with matrix imprinting and clearing. Proc. Natl Acad. Sci. 113, 14456-14461 (2016).
Aizarani, N. et al. A human liver cell atlas reveals heterogeneity and epithelial progenitors. Nature 472, 199-204 (2019).
Petukhov, V. et al. Cell segmentation in imaging-based spatial transcriptomics. Nat. Biotechnol. 40, 345-354 (2022).
Stringer, C., Wang, T., Michaelos, M. & Pachitariu, M. Cellpose: a generalist algorithm for cellular segmentation. Nat. Methods 18, 100-106 (2020).
Braeuning, A. et al. Differential gene expression in periportal and perivenous mouse hepatocytes. Febs J. 273, 5051-5061 (2006).
Saito, K., Negishi, M. & Squires, E. J. Sexual dimorphisms in zonal gene expression in mouse liver. Biochem. Biophys. Res. Commun. 436, 730-735 (2013).
Halpern, K. B. et al. Single-cell spatial reconstruction reveals global division of labour in the mammalian liver. Nature 542, 352-356 (2017).
González-Blas, C. B. et al. Single-cell spatial multi-omics and deep learning dissect enhancer-driven gene regulatory networks in liver zonation. Nat. Cell Biol. 26, 153-167 (2018).
Halpern, K. B. et al. Paired-cell sequencing enables spatial gene expression mapping of liver endothelial cells. Nat. Biotechnol. 36, 962-970 (2018).
Dobie, R. et al. Single-Cell Transcriptomics Uncovers Zonation of Function in the Mesenchyme during Liver Fibrosis. Cell Rep. 29, 1832-1847.e8 (2019).
Inverso, D. et al. A spatial vascular transcriptomic, proteomic, and phosphoproteomic atlas unveils an angiocrine Tie-Wnt signaling axis in the liver. Dev. Cell 56, 1677-1693.e10 (2021).
Vento-Tormo, R. et al. Single-cell reconstruction of the early maternal-fetal interface in humans. Nature 563, 347-353 (2018).
Lambeau, G. & Gelb, M. H. Biochemistry and Physiology of Mammalian Secreted Phospholipases A2. Annu. Rev. Biochem. 77, 495-520 (2008).
Romeo, S. et al. Genetic variation in PNPLA3 confers susceptibility to nonalcoholic fatty liver disease. Nat. Genet. 40, 1461-1465 (2008).
Sharma, A. et al. Onco-fetal Reprogramming of Endothelial Cells Drives Immunosuppressive Macrophages in Hepatocellular Carcinoma. Cell 183, 377-394.e21 (2020).
Martínez, A. I., Pérez-Arellano, I., Pekkala, S., Barcelona, B. & Cervera, J. Genetic, structural and biochemical basis of carbamoyl phosphate synthetase 1 deficiency. Mol. Genet. Metab. 101, 311-323 (2010).
Matsumoto, S. et al. Urea cycle disorders-update. J. Hum. Genet. 64, 833-847 (2019).
Yahyaoui, R. et al. A new metabolic disorder in human cationic amino acid transporter-2 that mimics arginase 1 deficiency in newborn screening. J. Inherit. Metab. Dis. 42, 407-413 (2019).
Fiermonte, G. et al. The Mitochondrial Ornithine Transporter Bacterial Expression, Reconstitution, Functional Characterization, And Tissue Distribution Of Two Human Isoforms*. J. Biol. Chem. 278, 32778-32783 (2003).
Valenti, L. et al. Homozygosity for the patatin-like phospholipase-3/ adiponutrin 1148 M polymorphism influences liver fibrosis in patients with nonalcoholic fatty liver disease. Hepatology 51, 1209-1217 (2010).
Maillo, C. et al. Circadian- and UPR-dependent control of CPEB4 mediates a translational response to counteract hepatic steatosis under ER stress. Nat. Cell Biol. 19, 94-105 (2017).
Xanthakos, S. A. et al. High Prevalence of Nonalcoholic Fatty Liver Disease in Adolescents Undergoing Bariatric Surgery. Gastroenterology 149, 623-634.e8 (2015).
Harrison, S. A. et al. A Phase 3, Randomized, Controlled Trial of Resmetirom in NASH with Liver Fibrosis. N. Engl. J. Med. 390, 497-509 (2024).
Guilliams, M. et al. Spatial proteogenomics reveals distinct and evolutionarily conserved hepatic macrophage niches. Cell 185, 379-396.e38 (2022).
Remmerie, A. et al. Osteopontin Expression Identifies a Subset of Recruited Macrophages Distinct from Kupffer Cells in the Fatty Liver. Immunity 53, 641-657.e14 (2020).
Stockinger, B. et al. A role of la-associated invariant chains in antigen processing and presentation. Cell 56, 683-689 (1989).
Maubach, G., Lim, M. C. C., Kumar, S. & Zhuo, L. Expression and upregulation of cathepsin S and other early molecules required for antigen presentation in activated hepatic stellate cells upon IFN- treatment. Biochim. Biophys. Acta (BBA) – Mol. Cell Res. 1773, 219-231 (2007).
Viñas, O. et al. Human hepatic stellate cells show features of anti-gen-presenting cells and stimulate lymphocyte proliferation. Hepatology 38, 919-929 (2003).
Zeng, H. et al. CD36 promotes de novo lipogenesis in hepatocytes through INSIG2-dependent SREBP1 processing. Mol. Metab. 57, 101428 (2022).
Wang, B., Zhao, L., Fish, M., Logan, C. Y. & Nusse, R. Self-renewing diploid Axin2+ cells fuel homeostatic renewal of the liver. Nature 524, 180-185 (2015).
Preziosi, M., Okabe, H., Poddar, M., Singh, S. & Monga, S. P. Endothelial Wnts regulate -catenin signaling in murine liver zonation and regeneration: A sequel to the Wnt-Wnt situation. Hepatol. Commun. 2, 845-860 (2018).
Moffitt, J. R. et al. Molecular, spatial, and functional single-cell profiling of the hypothalamic preoptic region. Science 362, eaau5324 (2018).
Cadinu, P. et al. Charting the cellular biogeography in colitis reveals fibroblast trajectories and coordinated spatial remodeling. Cell 187, 2010-2028.e30 (2024).
Wang, G., Moffitt, J. R. & Zhuang, X. Multiplexed imaging of highdensity libraries of RNAs with MERFISH and expansion microscopy. Sci. Rep. 8, 4847 (2018).
Slyper, M. et al. A single-cell and single-nucleus RNA-Seq toolbox for fresh and frozen human tumors. Nat. Med. 26, 792-802 (2020).
Wolf, F. A., Angerer, P. & Theis, F. J. SCANPY: large-scale single-cell gene expression data analysis. Genome Biol. 19, 15 (2018).
Korsunsky, I. et al. Fast, sensitive and accurate integration of singlecell data with Harmony. Nat. Methods 16, 1289-1296 (2019).
Young, M. D. & Behjati, S. SoupX removes ambient RNA contamination from droplet-based single-cell RNA sequencing data. GigaScience 9, giaa151 (2020).
McGinnis, C. S., Murrow, L. M. & Gartner, Z. J. DoubletFinder: Doublet Detection in Single-Cell RNA Sequencing Data Using Artificial Nearest Neighbors. Cell Syst. 8, 329-337.e4 (2019).
lanevski, A., Giri, A. K. & Aittokallio, T. Fully-automated and ultra-fast cell-type identification using specific marker combinations from single-cell transcriptomic data. Nat. Commun. 13, 1246 (2022).
Clarke, Z. A. & Bader, G. D. MALAT1 expression indicates cell quality in single-cell RNA sequencing data. bioRxiv 2024.07.14.603469. https://doi.org/10.1101/2024.07.14.603469 (2024).
Montserrat-Ayuso, T. & Esteve-Codina, A. Revealing the Prevalence of Suboptimal Cells and Organs in Reference Cell Atlases: An Imperative for Enhanced Quality Control. bioRxiv 2024.04.18.590104. https://doi.org/10.1101/2024.04.18.590104 (2024).
Garcia-Alonso, L. et al. Single-cell roadmap of human gonadal development. Nature 607, 540-547 (2022).
Fang, Z., Liu, X. & Peltz, G. GSEApy: a comprehensive package for performing gene set enrichment analysis in Python. Bioinformatics 39, btac757 (2022).
Acknowledgements
The authors thank Jasneet Aneja for assistance in organizing the collection of liver tissue, Kenneth Tanabe for assistance with sample collection, and Nicole Brousaides and the MGH Histopathology Research Core for help sectioning tissue. We thank Sonya MacParland, Gary Bader, Tallulah Andrews, and Jawairia Atif for helpful discussions and assistance in selecting genes for the MERFISH probe set. We thank Cristin McCabe for assistance with data management, and Adam Slamin, Dan Dubinsky, and the Broad Genomics Platform for help with generation of single-nucleus RNA sequencing data. A.C.M. was supported by internal funds from UMass Chan, and R.J.X., J.R.M., and A.C.M were supported by grants from the Chan Zuckerberg Initiative.
Author contributions
B.P., B.R.W., J.R.M, and A.C.M. conceived the study and designed the experiments. Samples were prepared for MERFISH by B.P. and imaged by B.R.W. with support from A.S. and E.T.E. snRNA-seq was performed by L.A.-Z. and S.M. with support from Å.S., E.T.E, J.D., and R.J.X. Computational analyses were performed by B.R.W., B.P., and R.U.R. Visualization tools were built by L.G. and T.L. The manuscript was written by B.R.W., B.P., J.R.M, and A.C.M. with input from all other authors.
Competing interests
R.J.X. is a co-founder of Celsius Therapeutics and Jnana Therapeutics, board director at MoonLake Immunotherapeutics, and consultant to Nestlé. J.R.M is a co-founder of, stake-holder in, and advisor for Vizgen. J.R.M. is an inventor on patents associated with MERFISH applied for on his behalf by Harvard University and Boston Children’s Hospital. J.R.M.`s interests were reviewed and are managed by Boston Children’s Hospital
in accordance with their conflict-of-interest policies. J.R.M. has received research funding from Merck for unrelated projects. A.C.M. has received research funding from Boehringer Ingelheim and GlaxoSmithKline for unrelated projects. The remaining authors declare no competing interests.
Additional information
Supplementary information The online version contains
Correspondence and requests for materials should be addressed to Jeffrey R. Moffitt or Alan C. Mullen.
Peer review information Nature Communications thanks Bruce Wang, and the other, anonymous, reviewer for their contribution to the peer review of this work. A peer review file is available.
Publisher’s note Springer Nature remains neutral with regard to jurisdictional claims in published maps and institutional affiliations.
Open Access This article is licensed under a Creative Commons Attribution-NonCommercial-NoDerivatives 4.0 International License, which permits any non-commercial use, sharing, distribution and reproduction in any medium or format, as long as you give appropriate credit to the original author(s) and the source, provide a link to the Creative Commons licence, and indicate if you modified the licensed material. You do not have permission under this licence to share adapted material derived from this article or parts of it. The images or other third party material in this article are included in the article’s Creative Commons licence, unless indicated otherwise in a credit line to the material. If material is not included in the article’s Creative Commons licence and your intended use is not permitted by statutory regulation or exceeds the permitted use, you will need to obtain permission directly from the copyright holder. To view a copy of this licence, visit http:// creativecommons.org/licenses/by-nc-nd/4.0/.
(c) The Author(s) 2024
Program in Cellular and Molecular Medicine, Boston Children’s Hospital, Boston, MA 02115, USA. Department of Microbiology, Blavatnik Institute, Harvard Medical School, Boston, MA 02115, USA. Division of Gastroenterology, University of Massachusetts Chan Medical School, Worcester, MA, USA. Broad Institute of Harvard and MIT, Cambridge, MA 02142, USA. Massachusetts General Hospital, Boston, MA 02114, USA. Core for Computational Biomedicine, Department for Biomedical Informatics, Blavatnik Institute, Harvard Medical School, Boston, MA 02115, USA. These authors contributed equally: Brianna R. Watson, Biplab Paul. e-mail: jeffrey.moffitt@childrens.harvard.edu; alan.mullen@umassmed.edu