التنقيب الجيوفيزيائي المتكامل للكشف عن المعادن العميقة في منطقة تعدين الذهب يونغشين، هيلونغجيانغ، الصين Integrated geophysical prospecting for deep ore detection in the Yongxin gold mining area, Heilongjiang, China

المجلة: Scientific Reports، المجلد: 15، العدد: 1
DOI: https://doi.org/10.1038/s41598-025-92108-3
PMID: https://pubmed.ncbi.nlm.nih.gov/40025120
تاريخ النشر: 2025-02-28

تقارير علمية

افتح

التنقيب الجيوفيزيائي المتكامل للكشف عن المعادن العميقة في منطقة تعدين الذهب يونغشين، هيلونغجيانغ، الصين

يشانغ يين جون تشين تشونغهاي تشاو □ ، يوانجيانغ يانغ تشنغلو هاينا و شيانغ تشاو

الملخص

تلعب تقنيات الاستكشاف الجيوفيزيائي دورًا محوريًا في تعزيز دقة توقعات التنقيب عن المعادن. ومع ذلك، فإن الاعتماد فقط على طرق فردية غالبًا ما يقدم عدم اليقين. تقدم هذه الدراسة دراسة حالة من رواسب الذهب في يونغشين، حيث قمنا بدمج طرق المغناطيسية الصوتية (AMT) مع المسح الجاذبي والتصوير المغناطيسي عالي الدقة للتغلب على هذا التحدي. تم استخدام تقنيات النمذجة ثلاثية الأبعاد المتقدمة لتحديد التغيرات الصخرية وخصائص التمعدن العميقة الموجودة في المنطقة بدقة. قدمت عملية عكس وتفسير بيانات AMT العرضية رؤى حول الهيكل تحت السطحي حتى عمق 1.5 كم. تم تحقيق موثوقية البيانات المعززة من خلال تفسير متكامل مقيد ببيانات متعددة، مما أتاح استنتاجًا أكثر دقة للإطار الجيولوجي الأعمق. علاوة على ذلك، من خلال دمج مجموعات بيانات متنوعة، اكتشفنا خصائص التمعدن العميق، والتكوين ثلاثي الأبعاد للكتل الصخرية المرتبطة بالتمعدن، والتوجه المكاني لرواسب الخام المعروفة. سهل هذا النهج الشامل فهمًا كاملاً للتكوينات الجيولوجية الأعمق. أدت التحليلات التفصيلية للهياكل المسيطرة على الخام وعلامات الاستكشاف إلى تطوير نموذج جيولوجي-جيوفيزيائي مصمم خصيصًا للتنقيب عن المعادن داخل منطقة الدراسة، مما يمثل مرجعًا قيمًا لجهود الاستكشاف العميق المستقبلية.

في السنوات الأخيرة، مع النضوب التدريجي للموارد المعدنية السطحية، أصبحت استكشاف وتطوير الموارد المعدنية على أعماق تتراوح بين 500 إلى 2000 متر هي التركيز الرئيسي لعلماء رواسب المعادن. . في هذا السياق، تواجه طرق الاستكشاف الجيولوجي التقليدية العديد من القيود، وأصبح اكتشاف رواسب جديدة من المعادن أكثر صعوبة بشكل متزايد. لذلك، أصبحت أهمية تقنيات الاستكشاف الجيوفيزيائي عالية الدقة، وعالية الوضوح، وسهلة التشغيل ذات أهمية قصوى. من بين هذه الطرق، تم استخدام طريقة المغناطيسية الترددية الصوتية (AMT) على نطاق واسع في استكشاف المعادن العميق بسبب مزاياها مثل كفاءة العمل العالية، وعمق الاستكشاف الكبير، والقدرة على اختراق الطبقات ذات المقاومة العالية، والدقة القوية في الطبقات ذات المقاومة المنخفضة. .
من الجدير بالذكر أن طرق الاستكشاف الجيوفيزيائية المتكاملة حققت نتائج ملحوظة في مناطق التعدين المختلفة حول العالم. على سبيل المثال، قام لاhti وآخرون بإجراء عكس سلس ثنائي الأبعاد لبيانات AMT لتصور هيكل الموصلية تحت السطح في حزام أوتوكمبو في شرق فنلندا. وقدمت هذه النتائج رؤى قيمة للاستكشاف العميق وتوقع موضع جسم الخام. . وبالمثل، قام وانغ وآخرون، في حزام التمعدن الذهبي جياوجيا في شاندونغ، بدمج البيانات الجيولوجية والتكتونية وبيانات الحفر، وملفات مسح المغناطيسية الصوتية ذات المصدر المسيطر (CSAMT) لإنشاء نموذج جيولوجي ثلاثي الأبعاد. من خلال تحليل شامل للصخور، والخصائص الفيزيائية، والتفسير الأمامي للحقل الجيوفيزيائي، قاموا ببناء نموذج جيولوجي-جيوفيزيائي ثلاثي الأبعاد وحددوا ستة أهداف تعدين واعدة. علاوة على ذلك، استخدم تشانغ وآخرون تقنية AMT لإنشاء ملفات جيوكهربائية ثنائية الأبعاد في منطقة أبحاث هونغششان في مقاطعة قانسو. من خلال ربط الصخور السطحية بالخصائص الفيزيائية مثل المقاومة والقدرة المغناطيسية، أنشأوا نموذجًا جيولوجيًا ثلاثي الأبعاد لمنطقة مزيج الأوفيوليت. يوفر هذا النموذج رؤى حاسمة حول حدوث العلاقات والتواصل، والتي تعتبر أساسية لاستكشاف آليات تشكيل الصخور الأساسية والفائقة الأساس. .
لتحديد شكل جسم الخام بدقة أكبر وتوقع إمكانيات التمعدن العميق، استخدمنا طريقة استكشاف جيوفيزيائية متكاملة تعتمد بشكل أساسي على الماجنتوتيلوريك بتردد الصوت.
تم إجراء مسوحات (AMT) مدعومة بقياسات الجاذبية والمسح المغناطيسي العالي في منطقة تعدين الذهب يونغشين. قمنا بنشر ما مجموعه 25 ملف AMT في منطقة الدراسة ومعالجة بيانات الحقل باستخدام تقنيات عكس AMT ثنائية الأبعاد المتقدمة. من خلال هذا النهج، حصلنا على معلومات تفصيلية عن الهيكل الكهربائي حتى عمق 1.5 كم تحت السطح. علاوة على ذلك، من خلال دمج البيانات الجيولوجية والفيزيائية والجاذبية المغناطيسية من منطقة الدراسة، قمنا بإجراء تفسير متعمق وتحليل قيود للأجسام الشاذة داخل الهيكل الكهربائي، مما أدى إلى نموذج جيولوجي-فيزيائي أكثر دقة. يكشف هذا النموذج ليس فقط عن خصائص التوزيع العميق والعلاقات لعناصر التمعدن المختلفة في منطقة الدراسة، ولكن أيضًا يوفر اتجاه استكشاف قوي وأساس نشر لتحديد مناطق التمعدن المواتية وإنشاء نماذج توقع استكشاف الخام.

الإعداد الجيولوجي الجيولوجيا الإقليمية

تقع منطقة الدراسة في الجزء الشرقي من حزام الأوروجين المركزي الآسيوي (الشكل 1أ)، وتحديداً عند الواجهة التكتونية لكتل شينغ’an وسونغن في حزام الأوروجين في منغوليا الداخلية-شينغ’an الكبرى (الشكل 1ب). هذه منطقة جيولوجية معقدة شهدت تطوراً تكتونياً وماغماتياً مطولاً. . منذ العصر الباليوزي، تأثرت بالتحولات التكتونية بين صفيحة سيبيريا وصفيحة شمال الصين، بالإضافة إلى تطور المحيط الباليوآسيوي وإغلاقه النهائي خلال الحقبة المتوسطة، تضمنت الأحداث الرئيسية التغيرات التكتونية المتعلقة بمحيط منغول-أوخوتسك وغمر صفيحة المحيط الهادئ، تلاها تصدعات عميقة في الحقبة الحديثة. . لقد أدت هذه الأنشطة التكتونية والمغناطيسية المتعددة إلى تشكيل ملف جيولوجي متنوع، بما في ذلك الصخور البركانية والمتحولة من العصر الباليوزوي، وصخور البازلت القارية من العصر الميزوزوي، وصخور الرواسب النهرية والبحيرية من العصر الباليوجيني، والجرانيت من العصر الفينيروزوي تشتهر هذه المنطقة من شمال شرق الصين بتاريخها التكتوني والمغناطيسي المعقد والعنيف. ونتيجة لذلك، تحتوي على مجموعة واسعة من رواسب المعادن الثمينة وغير الحديدية، بما في ذلك رواسب النحاس-الموليبدينوم، والحديد-النحاس (الموليبدينوم) المتعددة المعادن، ورواسب الذهب السطحية. (الشكل 1ج).
الشكل 1. خريطة الموقع الجيولوجي التكتوني. (أ) تقسيم تكتوني مبسط للصين والمنطقة المحيطة بها، معدلة بعد ليو وآخرون. . (ب) التقسيمات التكتونية لشمال شرق الصين، معدلة بعد زهاو وآخرون. . (ج) خريطة جيولوجية مبسطة لسلسلة جبال شينغ’an الصغرى، معدلة بعد زهاو وآخرون. (تم إنشاء الشكل باستخدام CorelDraw X9 (http://www.coreldraw.com/cn/) بواسطة جون تشين).

جيولوجيا رواسب الخام

يتميز منجم يونغشين للذهب، الواقع على بعد 70 كم شمال شرق نينجيانغ في مقاطعة هيلونغجيانغ و115 كم جنوب غرب مدينة هيهي، باحتياطي كبير من الذهب يبلغ حوالي 20 طنًا بمتوسط درجة تتكون منطقة التعدين من أنواع صخرية متنوعة، تهيمن عليها صخور السينيجرانيت من العصر الكربوني المتأخر، والمايلونيت الجرانيتية، وصخور بركانية من العصر الطباشيري المبكر، وغيرها من التكوينات تحت البركانية، مع وجود بروز طفيف للجرانوديوريت (الشكل 2).
تشمل الصخور البركانية من العصر الطباشيري المبكر بشكل أساسي تشكيل لونغجيانغ، وتشكيل جوانغhua، وتشكيل غانهي. يتوزع تشكيل لونغجيانغ في الأجزاء الوسطى والشمالية من منطقة التعدين، ويتكون بشكل رئيسي من الصخور البركانية المتوسطة الحمضية. يقع تشكيل جوانغhua بشكل أساسي في الجزء الشمالي من منطقة التعدين، ويتكون في الغالب من الصخور البركانية الحمضية. يظهر تشكيل غانهي بشكل متقطع في الزاوية الجنوبية الغربية من منطقة التعدين، ويتكون بشكل رئيسي من الأنديسايت، وأنديسايت البازلت الفقاعي، والبازلت الفقاعي. تتراكب هذه الانفجارات البركانية من العصر الطباشيري المبكر بشكل غير متوافق على صخور الساينوجرانيت، والميولونيت الجرانيتية، والجرانوديوريت في منطقة التعدين. تظهر الديوريت-بورفيريت والجرانيت بورفيريت من العصر الطباشيري المبكر مخرجات على شكل عروق موجهة نحو الشمال الشرقي إلى الشمال-الشمال الشرقي، تقريبًا بالتوازي مع جسم الخام.
تتميز رواسب يونغشين بوجود جسمين من خام الذهب يتحكمان فيهما منطقة صدع موجهة نحو الشمال الشرقي، توجد بشكل رئيسي عند التماس بين الساينوجرانيت من العصر الكربوني المبكر والميلونيت. . تمتد هذه الأجسام المعدنية في اتجاه الشمال الشرقي، مع ملف متموج لطيف في المقاطع العرضية وهياكل مصفوفة من طرف إلى طرف. الجسم المعدني الرئيسي، المسمى رقم 1، يمتد بطول 375 مترًا، بعرض أقصى يبلغ 73 مترًا، وعرض أدنى يبلغ 7 مترًا، وزاوية ميل تتراوح من إلى . يمتد إلى عمق حوالي 800 متر .
تعتبر رواسب يونغشين رواسب ذهبية حرارية. الأنواع الرئيسية من الخام هي في الغالب بريشيا مدمجة هيدروحرارية، ونوع عروق الكوارتز، ونوع الصخور المتغيرة، مع كميات صغيرة من نوع الميلونيت في بعض الأحيان. تظهر الخامات أنسجة متنوعة، بما في ذلك الحبيبات الإيوهيدالية-هيديبورفية، والحبيبات الزينومورفية، والبريشيا، والموزعة، والعروق الصغيرة، والفجوات أو الدروز. المعادن المعدنية الرئيسية هي البيريت، والغالاينا، والسفاليريت، وكميات قليلة من الكالكوبيريت، مع وجود نادر للذهب الأصلي. الهيماتيت والغيتيت موجودان كمعادن ثانوية، بينما تتكون معادن الرواسب بشكل رئيسي من الكوارتز، والفلدسبار البوتاسي، والكالسيت، والسيريسيت، والكلوريت، والإبيدوت، وكمية صغيرة من الأديولاريا.

طرق تحليلية

استخدمت هذه الدراسة نظام V8 المتعدد الوظائف المتصل بالكهرباء، الذي طورته شركة فينيكس جيولوجيا في كندا، لإجراء مسوحات المغناطيسية الصوتية (AMT). يتمتع نظام V8 بالقدرة على التقاط الحقول الكهرومغناطيسية الطبيعية ضمن نطاق تردد يتراوح من 0.35 هرتز إلى ، مما يتيح استكشاف الأعماق السفلية. شملت الأعمال الميدانية ثلاث مراحل رئيسية: اختيار الموقع، نشر الأقطاب الكهربائية، وجمع البيانات.
الشكل 2. خريطة جيولوجية لودائع الذهب في يونغشين. (تم إنشاء الشكل باستخدام CorelDraw X9 (http://www.coreldraw.com/cn/) بواسطة جون تشين).
اختيار الموقع ونشر الأقطاب. غطت منطقة المسح حوالي 100 كيلومتر مربع في منطقة تعدين الذهب في يونغشين. تم إنشاء 25 خط مسح موجه من الشرق إلى الغرب، متباعدة بمقدار 500 متر، مع نقاط قياس موضوعة كل 200 متر على طول كل خط. أسفر هذا التكوين عن 1012 نقطة قياس (الشكل 2). تم استخدام مصفوفة أقطاب على شكل صليب، مع هامش خطأ في الاتجاه لا يتجاوز لضمان التوجيه الدقيق. تم ضبط تباعد الأقطاب الكهربائية على 50 متر لتحقيق أفضل دقة في الإشارة.
جمع البيانات. تم اعتماد طريقة المراقبة المتزامنة متعددة المحطات، مما يسمح بجمع البيانات في وقت واحد من عدة نقاط قياس. . سجلت كل محطة مكونات الحقل الكهربائي (Ex، Ey) والحقل المغناطيسي (Hx، Hy). تم ضبط تردد العينة بناءً على العمق المستهدف، مع ترددات أعلى (على سبيل المثال، للهياكل الضحلة وترددات أقل (مثل 0.35 هرتز) للاستكشاف الأعمق. تم تحديد وقت جمع البيانات في كل محطة إلى ساعتين لضمان نسبة إشارة إلى ضوضاء كافية.
معالجة البيانات والعكس. تم عكس البيانات المعالجة في نظام عكس الجيوفيزياء في الخزانات (RGIS)، وهو حزمة برمجيات شاملة تستخدم للعكس الجيوفيزيائي والنمذجة. شملت معلمات العكس نموذجًا ابتدائيًا بمقاومة نصف فضاء متجانس قدره ورقم التكرار الأقصى 100. تم التحقق من نماذج المقاومة النهائية من خلال المقارنة مع الهياكل الجيولوجية المعروفة وبيانات الآبار. تشير طرق معالجة البيانات التفصيلية إلى البحث الذي أجراه ريجان بيتييا وآخرون. .
مراقبة الجودة. أظهرت قياسات المقاومة الكهربائية خطأ نسبيًا قدره في وضع الكهرباء المستعرضة (TE) و في وضع المغناطيسية العرضية (TM)، مما يدل على الجودة العالية وموثوقية البيانات المجمعة. كما أكدت التوافقية بين أوضاع TE وTM على قوة النتائج. .

النتيجة

الخصائص الفيزيائية

جمعت هذه الدراسة عينات من الصخور وحللت خصائصها الكهربائية والكثافة والاستجابة المغناطيسية، والتي تعكس الخصائص الفيزيائية للصخور في منطقة الدراسة (الجدول 1). تكشف النتائج عن تباينات واضحة في هذه الخصائص بين أنواع الصخور المختلفة.
تظهر الصخور المتداخلة عمومًا قيم مقاومة عالية. من الجدير بالذكر أن الديوريت من العصر الأوردوفيشي الأوسط يظهر نطاق مقاومة واسع يتراوح من 436.3 إلى الميلونيت الجرانيتية من العصر الكربوني المتأخر لها مقاومة متوسطة تبلغ بينما تظهر الجرانيت المونزونيتي والجرانيت السيانيت في العصر الكربوني المتأخر شذوذات عالية مماثلة في المقاومة. تتراوح مقاومة الجرانوديوريت من العصر الجوراسي الأوسط بين 3435.4 و ، بمتوسط تظهر الصخور الرملية من طبقات تشكيل لوهي أيضًا شذوذات عالية في المقاومة، تتراوح من 706.5 إلى .
على النقيض من ذلك، تظهر الصخور البركانية مثل الأنديسايت من تشكيل لونغجيانغ، والتوف الوسيط الحمضي من تشكيل جيوفينغشان، والرايوليت من تشكيل جوانغhua، شذوذات مقاومة متوسطة منخفضة بمتوسط مقاومات تبلغ ، و على التوالي. ومع ذلك، يظهر بازلت تشكيل غانه مقاومة عالية، بمتوسط .
فيما يتعلق بالاستجابة المغناطيسية، فإن الديوريتات من العصر الأورديفيشي الأوسط تتمتع بأقوى استجابة مغناطيسية بمتوسط ، تليها الجرانيتات المونزونية من العصر الكربوني المتأخر في تظهر المايلونيتات الجرانيتية من أواخر الكربوني ضعفاً في القابلية المغناطيسية عند كلا من الجرانوديوريت من العصر الجوراسي الأوسط والجرانيت السيني من العصر الكربوني المتأخر يظهران معدلات منخفضة من القابلية المغناطيسية، بمتوسط حوالي .
بين الطبقات الطبقية، تتمتع صخور الرمل من تشكيل لوخه بمعدلات منخفضة من القابلية المغناطيسية، بينما يظهر التوف الوسيط الحمضي من تشكيل جيوفينغشان والرايوليت من تشكيل جوانغhua شذوذات ضعيفة في القابلية المغناطيسية. بينما يتمتع بازلت تشكيل غانخه بأعلى معدل للقابلية المغناطيسية، حيث يتراوح من 387.0 إلى .
تشير قياسات الكثافة إلى خصائص شذوذ كثافة متوسطة إلى منخفضة للصخور. تعتبر الديوريتات من العصر الأورديفيشي الأوسط الأكثر كثافة بين الصخور المدخلة بمتوسط كثافة قدره بينما تتمتع الأنديسيتات من تشكيل لونغجيانغ بأدنى كثافة عند الصخر الرملي من تشكيل لوخه له كثافة منخفضة أيضًا، مشابهة لتشكيل لونغجيانغ.
نوع الصخور المقاومية ( ) النفاذية المغناطيسية (10-5 SI) الكثافة ( )
نطاق التباين القيمة المتوسطة نطاق التباين القيمة المتوسطة نطاق التباين القيمة المتوسطة
صخر متداخل جرانوديوريت من العصر الجوراسي الأوسط ٣٤٣٥.٤-١٤٩٧٧.٩ ٥١٧٨.٤ 80.0-357.0 224.5 2.4-2.8 2.6
جرانيت مونزونيتي من أواخر العصر الكربوني 1183.5-25,096.5 5880.8 42.0-772.0 431.8 2.4-2.7 2.6
سيينوجرانيت من أواخر العصر الكربوني ٣٤٣.٧-٣٣,٢٣٢.٧ ٥٩٢١.٨ ٢٠.٠-٤٨٠.٠ ٢٢٣.٠ 2.4-2.6 2.6
ميوليت جرانيتية من أواخر العصر الكربوني 1922.9-8214.9 ٤٠٩٠.٣ 4.0-299.0 ٣٥.٤ 2.3-2.7 2.5
ديوريت منتصف الأورودوفيشي 436.3-20,533.5 6118.2 ٢٧.٠-٢٥٦٤.٠ ١٠٣١.٢ 2.5-2.9 ٢.٧
طبقة بازلت تشكيل غاني 83.5-57,754.7 5773.6 ٣٨٧.٠-٢٠٥٩.٠ 865.0 2.1-2.7 2.6
ريولايت تشكيل جوانغوا 888.5-4826.0 ٢٨٥٧.٣ 13.0-554.0 ١٤٥.٦ 2.1-2.7 2.5
تكوين جيوفنغشان التوف الحمضي المتوسط 118.4-5877.9 1485.7 40.0-235.0 100.6 2.3-2.9 2.6
انديسايت تشكيل لونغجيانغ 795.7-3745.7 1875.7 2.08-2.63 ٢.٤
رملية تشكيل لوخه 706.5-31,699.2 5400.3 12.0-481.0 ٨٨.٢ 2.2-2.6 ٢.٤
الجدول 1. الخصائص الفيزيائية للصخور في منطقة الدراسة.
تقدم الاختلافات الكبيرة في الخصائص الكهربائية، والقدرة المغناطيسية، والكثافة بين الصخور الرئيسية والطبقات الطبقية أساسًا حيويًا لتحديد الطبقات وأجسام الصخور. . تشير هذه النتائج إلى أن المنطقة تمتلك الخصائص الفيزيائية اللازمة للاستكشاف الجاذبي والمغناطيسي والكهربائي الفعال.

خصائص الشذوذ الجاذبي الإقليمي

تظهر الشذوذات الجاذبية التي لوحظت في منطقة الدراسة عادة كقيم أعلى في الجنوب الشرقي وقيم أقل في الغرب، مع نطاق من الشدات يتراوح من -32 إلى . تتماشى هذه الشذوذات بشكل رئيسي في اتجاه الشمال الغربي، مما يعكس الأنماط الهيكلية الجيولوجية السائدة في المنطقة بأكملها. من خلال التحليل الدقيق وتفسير مجموعات البيانات المختلفة، بما في ذلك توزيعات خطوط الإيزوغون وخصائص حقل الجاذبية (الشكل 3أ)، استنتجنا وجود ثمانية صدوع. داخل حقل الجاذبية المحلي، تم تحديد أربعة شذوذات عالية متميزة (موسومة G1-4) وثلاث شذوذات منخفضة (موسومة L1-3). بشكل جماعي، تعرض هذه الشذوذات أنماط تشوه غير منتظمة ومنقطعة، مما يبرز الطبيعة المعقدة والدقيقة للهيكل القشري داخل منطقة الدراسة (الشكل 3ب).

خصائص الشذوذ المغناطيسي الإقليمي

تتراوح قوة المجال المغناطيسي في المنطقة بأكملها عادة بين -500 إلى 1500 نانو تسلا. في الجزء الغربي، يظهر المجال المغناطيسي نمطًا مميزًا من الشذوذات الإيجابية المتقطعة فوق خلفية سلبية منخفضة وثابتة بشكل عام. بشكل بارز، هناك شذوذات إيجابية فردية أو متعددة القمم ذات حجم كبير، تتماشى بشكل رئيسي في اتجاه الشمال الشرقي. غالبًا ما ترتبط هذه الشذوذات بقيم المجال المغناطيسي التي تتراوح من -500 إلى -1500 نانو تسلا، والتي تتوافق مع الجيولوجيا الأساسية لصخور البازلت من تكوين غانخه، وتكوين جيانخه من العصر الوسيط، وصخور بركانية من تكوين جيوفنجشان، والتي تُعزى أساسًا إلى صخور البازلت من تكوين غانخه.
على النقيض من ذلك، يظهر المجال المغناطيسي في المنطقة الشرقية تباينًا أكثر تدريجًا، مع تقلبات في القوة تتراوح بين -50 و 50 نانو تسلا. تتوافق هذه الإشارة المغناطيسية الدقيقة مع الميزات الجيولوجية مثل الميول الجرانيتية المتأخرة من العصر الكربوني والجرانيت المونزونيتي (الشكل 4أ). من الجدير بالذكر أن الغالبية العظمى من حالات التمعدن التي تم اكتشافها داخل منطقة الدراسة تقع في مناطق تتميز بتدرجات الشذوذ المغناطيسي أو مناطق ذات كثافة مغناطيسية منخفضة. عادةً ما تعرض نقاط التمعدن هذه قيم شذوذ مغناطيسي تتراوح بين -200 إلى 500 نانو تسلا (الشكل 4ب).

الميزات الجيولوجية المتكاملة لملفات AMT

تقدم هذه الورقة تفسيرًا وتحليلًا متكاملًا لنتائج الانعكاس من ثلاثة ملفات AMT تمثيلية، بما في ذلك الخطوط 725 و730 و760 (الشكل 5). اخترنا وضع الانعكاس TE&TM، الذي يمكنه
الشكل 3. خريطة شذوذ الجاذبية. (أ) خريطة شذوذ الجاذبية بوجير. (ب) خريطة شذوذ الجاذبية المتبقية. في الشكل، يتم الإشارة إلى الصدوع المختلفة بالحرف “F”. (تم إنشاء الشكل باستخدام RGIS (https://www.cgs.gov.cn/ddztt/kydh/2016kydh/Sbzs/201609/t20160923_405162.html) بواسطة جون تشين).
الشكل 4. خطة خطوط الشذوذ المغناطيسي. (أ) خطة خطوط الشذوذ المغناطيسي الإقليمي. (ب) خطة خطوط الشذوذ المغناطيسي المحلي. (تم إنشاء الشكل باستخدام RGIS (https://www.cgs.gov.cn/Ddz.tt/kydh/2016kydh/Sbz s/201609/t20160923_405162.html) بواسطة جون تشين).
تقليل تأثير التشوه ثلاثي الأبعاد بشكل فعال، وتمييز الطبقات بشكل أفضل، وتحديد خصائص التوزيع المكاني للهياكل الصدعية. نظرًا للطبيعة النسبية للمقاومة العالية والمنخفضة، يتم تعيين عتبة من كخط فاصل بين الاثنين، استنادًا إلى البيانات الإحصائية من خصائص الصخور الكهربائية في منطقة العمل والخبرة السابقة.
يمر الخط 725 عبر الجزء الجنوبي من منطقة الدراسة. تشير ملف المقاومة إلى أنه، باستثناء القسم بين النقاط 1800 و1860، فإن جميع المناطق الأخرى القريبة من السطح تعرض طبقات ذات مقاومة منخفضة متفاوتة، تتراوح من 20 إلى . من خلال ربط الخرائط الجيولوجية والبيانات المتاحة، يُستنتج أن هذه الطبقات ذات المقاومة المنخفضة القريبة من السطح تُعزى أساسًا إلى تراكمات سهل الفيضانات المنخفضة، وقشور الصخور المتآكلة، وطبقات من تكوين غانخه وتكوين جيوفنجشان. في ملف الخط 725، يُلاحظ تباين واضح بين المقاومات العالية والمنخفضة في الأقسام الوسطى والسفلية، محددة بواسطة حدود واضحة. من الجدير بالذكر أن طبقة المقاومة العالية مقسمة إلى ثلاثة أجزاء بواسطة منطقتين متميزتين من المقاومة المنخفضة. على وجه التحديد، تشير النقاط من 1260 إلى 1360 ومن 1560 إلى 1640 إلى منطقتين عموديتين من المقاومة المنخفضة. تمتد المنطقة الأولى إلى السطح، على الأرجح بسبب الصخور تحت البركانية من تكوين غانخه. ومع ذلك، تبقى المنطقة الأخيرة تحت الأرض، مع ظهور مقاومة عالية محلية أعلاها. وهذا يشير إلى أن منطقة المقاومة المنخفضة ناتجة عن الصخور تحت البركانية، بينما قد تكون المقاومة العالية أعلاها ناتجة عن الميول الجرانيتية المتصدعة داخل طبقة المقاومة العالية (الشكل 5).
يظهر الخط 730، الذي يقع أيضًا في الجزء الجنوبي من منطقة الدراسة، مقاومة منخفضة بشكل رئيسي بالقرب من السطح. يُفترض أن غياب هذه الطبقة بين النقاط 1760 و1820 يعود إلى قشرة متآكلة رقيقة تكشف عن الميول الجرانيتية الأساسية. عند عمق يتوافق مع النقطة 1480، يتم الكشف عن جسم خام الذهب عند التماس بين الجرانيت السيني والميول الجرانيتية. جسم خام الذهب آخر مرئي في منطقة المقاومة المنخفضة عند النقطة 1670. نظرًا لأن الذهب وحده لا ينتج استجابة مقاومة منخفضة ما لم يكن مصحوبًا بكميات كبيرة من المعادن المتعددة، جنبًا إلى جنب مع بيانات الحفر والجيولوجيا، يُفترض أن المقاومة المنخفضة الملحوظة تُعزى أساسًا إلى القشرة المتآكلة. وبالتالي، يتم تحديد المناطق داخل وحول حواف طبقات المقاومة العالية، حيث تظهر مناطق واتجاهات المقاومة المنخفضة، كأهداف رئيسية لاستكشاف المعادن في المستقبل (الشكل 5).
يقع الخط 760 في قلب منطقة الدراسة، ويظهر تدرج مقاومة متميز يزداد من الغرب إلى الشرق. بين النقاط 1020 و1320، تكون طبقة المقاومة المنخفضة واضحة في الجزء الغربي. يُفترض أن هذه الطبقة ناتجة عن الطبقات الرسوبية الأكثر سمكًا التي تنتمي إلى تكوين غانخه وتكوين غوانغhua بالقرب من السطح. في أعماق أكبر، يُفترض أن طبقات تكوين لوخه تساهم في هذه المقاومة المنخفضة. يظهر اتجاه مقاومة عالية ملحوظ (يتراوح من 352 إلى ) في الطبقات السفلية من المقطع العرضي من 1020 إلى 1120، ويُعزى ذلك على الأرجح إلى وجود الجرانيت السيني. علاوة على ذلك، يُعتقد أن المقاومة العالية الاستثنائية التي لوحظت بين النقاط 1440 و1840 (التي تتراوح من 6310 إلى ) ناتجة عن الميول الجرانيتية.
الشكل 5. مخطط مقطع المقاومة لملف AMT وتفسير مستنتج لخط 725، خط 730 وخط 760. في الشكل، يتم الإشارة إلى الصدوع المختلفة بالحرف “F”. يمثل المحور العلوي من الرسم البياني الأوسط رقم نقطة القياس. (تم إنشاء الشكل باستخدام RGIS (https://www.cgs.gov.cn/Ddztt/ kydh/2016kydh/Sbzs/201609/t20160923_405162.html) بواسطة جون تشين).
الميول الجرانيتية. في منتصف القسم الشرقي الأقصى، يُعتقد أن منطقة نصف دائرية تعرض اتجاه مقاومة منخفضة ناتجة عن تفتت الصخور (الشكل 5).
استنادًا إلى الخصائص الكهربائية المعروضة عبر هذه الملفات الثلاثة، يمكننا استنتاج ما يلي من بيانات AMT في هذه المنطقة: من المحتمل أن تكون طبقة المقاومة المنخفضة القريبة من السطح ناتجة عن رواسب مرتبطة بسهل الفيضانات المنخفضة، وقشرة الصخور المتآكلة، بالإضافة إلى طبقات من تكوين غانخه، وتكوين لونغجيانغ، وتكوين جيو فنجشان، وطبقات بركانية أخرى من العصر الوسيط. من ناحية أخرى، تتكون مناطق المقاومة العالية بشكل أساسي من الجرانيت السيني والميول الجرانيتية. تظهر الأقسام الداخلية لهذه المناطق مقاومة متوسطة إلى منخفضة، مما يشير إلى احتمال وجود فتحات بركانية.

نقاش

الانعكاس المشترك للبيانات الجاذبية والمغناطيسية والكهربائية

تستخدم طريقة الانعكاس الجيوفيزيائي المشترك عدة معلمات فيزيائية وأنواع مختلفة من البيانات الجيوفيزيائية للقيود المتبادلة، مما يمكن أن يحسن بشكل فعال دقة نتائج الانعكاس. . باستخدام القدرات القوية لمحاكاة الانعكاس في برنامج RGIS، قمنا باستيراد بيانات الاستكشاف الفعلية لتوليد خطوط مقاسة. من خلال دمج القيود مثل الظروف الجيولوجية، وخصائص الصخور الفيزيائية، وبيانات الحفر، قمنا بتعديل مواقع الفوالق، ونطاقات الصخور، والأشكال بشكل مستمر لتحسين النموذج الأولي لـ AMT. هذه النماذج الموزعة هي نتيجة لنمذجة تفاعلية ثنائية الأبعاد لبيانات الجاذبية والمغناطيسية مقيدة بالتوزيع ثنائي الأبعاد لمقاومة الكهرباء المستخلصة من الانعكاس ثنائي الأبعاد لبيانات AMT. كانت هذه العملية تهدف إلى تحقيق أفضل توافق بين الشذوذ النظري الناتج عن النموذج والشذوذ المقاس، مما يقلل من متوسط مربع الخطأ لنتائج المحاكاة. خلال عملية التوافق، طورنا فهمًا واضحًا للتطور الهيكلي، والطبقات، والظروف الطبقية لمنطقة الدراسة. هذه الطريقة ضمنت أننا لم نسعى بشكل مفرط للتوافق مع البيانات الملاحظة، مما منع فقدان الأهمية الجيولوجية الأساسية في النموذج المستخلص. هذه العملية التكرارية لتحسين النموذج الأولي
تضمن توافقًا مثاليًا للمعلمات لكل من الشذوذ النظري والمقاس، بينما يتوافق متوسط مربع الخطأ لنتائج المحاكاة مع متطلباتنا المستهدفة .
أجرت هذه الدراسة مسحًا للجاذبية يمتد وقياسات ملف مغناطيسي عالي على طول الخطوط 730 و765 و795 (الشكل 2). نظرًا للمسافة الكبيرة بين خطوط الملف، اعتمدت الدراسة بشكل أساسي على تفسيرات الملف، باستخدام الشذوذ السطحي فقط كمرجع.
خلال عملية الانعكاس، تم الحصول على معظم قياسات الملف المغناطيسي في مناطق الصخور البركانية حيث تكون تقلبات المجال المغناطيسي ملحوظة، مما يطرح تحديات للانعكاس الكمي . لتعزيز دقة وجودة الانعكاس، دمجت هذه الدراسة قيودًا من عمق الصخور الأساسية والميزات المتعرجة المستنتجة من ملفات AMT. تم إجراء تفسير مشترك للجاذبية والمغناطيسية والانقلاب الكهربائي لثلاثة خطوط ملف مغناطيسي عالي، بما في ذلك تلك التي تحتوي على ملفات AMT.
بالنسبة للخط 730، أظهر القسم الشرقي مجالًا مغناطيسيًا أعلى مقارنة بالقسم الغربي، مع وجود مجال مغناطيسي إيجابي باستمرار في الشرق ومجال متعارض في الغرب. عزا الخريطة الجيولوجية ذلك إلى الجرانيت الكربوني في الشرق وتكوين جيوفينغشان الكريتاسي من العصر الوسيط في الغرب. اتبعت حقل الجاذبية على طول هذا الخط اتجاهًا مشابهًا، مع قيم أعلى في الشرق وأقل في الغرب. لوحظ انتفاخ جاذبية بارز حول علامة النقطة 1190 في الغرب.
كشفت نتائج الانعكاس أن القسم السفلي من الملف يتكون من الجرانيت، وتحديدًا من المايلونيت الجرانيت في الشرق والجرانيت السيانوي في الغرب. توجد طبقة رقيقة من تكوين جيوفينغشان وتغطية رباعية فوق الجرانيت الأورثوكلاسي في الغرب، بينما يكون المايلونيت الجرانيت في الشرق مكشوفًا بشكل رئيسي على السطح (الشكل 6).
من خلال تحليل الخصائص الشاذة لمختلف ملفات الجاذبية والمغناطيسية، جنبًا إلى جنب مع ملفات الصوت الكهربائي، تم استقراء نتائج الانعكاس عبر منطقة الدراسة بأكملها. سهلت هذه الطريقة الشاملة استنتاج التوزيع الطبقي الكامل داخل منطقة الدراسة.
يظهر الخط 765، على غرار الخط 730، مجالًا مغناطيسيًا أقوى في الغرب وأضعف في الشرق. يظهر المجال المغناطيسي الغربي تباينات طفيفة وأنماط منشار محلية، معظمها إيجابية. يكشف قسم الانعكاس للجاذبية والمغناطيسية أن الجرانيت السياني يقع أعمق قليلاً، وأن تغطية الصخور البركانية من العصر الرباعي والعصر الوسيط قد زادت، حيث وصلت إلى عمق أقصى يبلغ حوالي 500 متر في الغرب. الفرق الملحوظ عن الخط 730 هو أن الخط 765 يتميز بانخفاض في القيمة المغناطيسية وارتفاع بارز في قيمة الجاذبية بين النقاط 1220 و1300 في الغرب. يتوافق هذا مع الصخور تحت البركانية المشار إليها في الخريطة الجيولوجية (الشكل 7).
بالمقارنة مع الخط 765، زادت تغطية القسم الشرقي من الخط 795 في السماكة. يظهر الجزء الغربي من الخط بروز تكوين لوهي وصخور تحت بركانية، حيث يظهر تكوين لوهي في شكل صخور غريبة. يكون المجال المغناطيسي سلبيًا بشكل رئيسي في الغرب، بينما
الشكل 6. الانعكاس المشترك للمعلومات الجاذبية والمغناطيسية والكهربائية للخط 730. في الشكل، يتم الإشارة إلى الفوالق المختلفة بالحرف “F”. يمثل المحور العلوي من الرسم البياني الأوسط رقم نقطة القياس. (تم إنشاء الشكل باستخدام RGIS (https://www.cgs.gov.cn/Ddztt/kydh/2016kydh/Sbzs/201609/t20160923_405162.html) بواسطة جون تشين).
الشكل 7. الانعكاس المشترك للمعلومات الجاذبية والمغناطيسية والكهربائية للخط 765. في الشكل، يتم الإشارة إلى الفوالق المختلفة بالحرف “F”. يمثل المحور العلوي من الرسم البياني الأوسط رقم نقطة القياس. (تم إنشاء الشكل باستخدام RGIS (https://www.cgs.gov.cn/Ddztt/kydh/2016kydh/Sbzs/201609/t20160923_405162.html) بواسطة جون تشين).
يميل إلى التسطح في الشرق. هناك انخفاض كبير في الجاذبية من النقاط 1140 إلى 1220، مما يتماشى مع طبقات الصخور الرسوبية. من النقطة 1260 شرقًا، ترتفع الجاذبية تدريجيًا، مما يتوافق مع الصخور المدخلة (الشكل 8).
توقع ليانغ وآخرون في دراستهم حول الكيمياء الجيولوجية للهالة أن جهود الاستكشاف المستقبلية يجب أن تركز على الشمال الغربي من منجم الذهب يونغشين . بينما خلص لي وآخرون إلى أن المناطق العميقة من المنطقة الشمالية الغربية قيد الدراسة تمتلك إمكانات معدنية . في ضوء هذه النتائج، تدمج هذه الورقة تفسير بيانات الجاذبية والمغناطيسية والكهربائية مع السياق الجيولوجي لمنطقة الدراسة لاستنتاج فهم شامل للميزات الجيولوجية-الفيزيائية للمنطقة بأكملها.
يظهر السيانوجرانيت المتأخر من العصر الكربوني بشكل رئيسي في الأقسام الوسطى الغربية والشمالية الشرقية من منطقة التعدين، حيث يظهر اتجاهًا عامًا نحو الشمال الشرقي ومظهرًا غير منتظم يشبه المخزون. يتم إخفاء الأجزاء العليا من هذا التكوين الصخري بواسطة الصخور البركانية التابعة لتكوين غوانغوا، ويخترق الجزء الغربي المايلونيت الجرانيت المتأخر من العصر الكربوني. تتواجد مناطق الكسر في جميع أنحاء المنطقة، وتمتد عادة في اتجاه الشمال الشرقي، مما يؤدي إلى نمط توزيع مكاني زوني يتميز بترتيب غير متقطع يشبه الكتل من الصخور البركانية المدفونة.
بالإضافة إلى ذلك، يحدث تكوين لوهي من العصر الأورديفيشي العلوي بشكل رئيسي في الجزء الشمالي الشرقي من منطقة الدراسة، حيث يظهر نمطًا إيقاعيًا متزايدًا بشكل عام من قاعدته نحو الأعلى. تتوافق قاعدة هذا التكوين مع تكوين دوباوشان المجاور، بينما تتراكب طبقاته العليا بواسطة الصخور البركانية من العصر الوسيط، والتي تتكون بشكل خاص من تكوين غانهي من العصر الكريتاسي السفلي، وتكوين غوانغوا، وتكوين جيوفينغشان.
من خلال دمج البيانات الجيولوجية والفيزيائية، توفر هذه الدراسة رؤى قيمة حول الإعداد الجيولوجي المعقد الذي يشمل تشكيلات صخرية متعددة، ومناطق كسر، وأحداث مدخلة، جميعها تحمل أهمية من حيث الإمكانات المعدنية التي حددتها الأبحاث السابقة.
في الوقت نفسه، خضعت توزيع هياكل الكسر داخل منطقة الدراسة لاستنتاج وتحليل شامل، مما يكشف عن وجود ثمانية كسور. تتماشى هذه الكسور بشكل أساسي في اتجاهات الشمال الغربي، والشمال الشرقي، والشمال-الجنوب، وقريبًا من الشرق-الغرب. من الجدير بالذكر أن الكسور الشمالية الشرقية والشمالية الغربية تشكل هياكل كسر إقليمية عميقة وواسعة. تبدو الكسور الشمالية الشرقية متناثرة ومتعرجة برفق، بينما تظهر الكسور الشمالية الغربية عمومًا خصائص هياكل كسر توترية (التواء).
استنادًا إلى النتائج التفسيرية المذكورة أعلاه، تم إنشاء نموذج جيولوجي-جيوفيزيائي. يبرز هذا النموذج أن الشذوذات الجاذبية والمغناطيسية والكهربائية التي لوحظت في مناطق الاتصال بين الجرانيت الأورثوكلاسي المتأخر الكربوني والمايوليت الجرانيتية تتماشى تمامًا مع مواقع الأنماط النموذجية.
الشكل 8. الانعكاس المشترك لمعلومات الجاذبية والمغناطيسية والكهربائية للخط 795. في الشكل، يتم الإشارة إلى الفوالق المختلفة بالحرف “F”. يمثل المحور العلوي للرسم البياني الأوسط رقم نقطة القياس. (تم إنشاء الشكل باستخدام RGIS (https://www.cgs.gov.cn/Ddztt/kydh/2016kydh/Sbzs/201609/t20160923_405162.html) بواسطة جون تشين).
ترسبات معدنية. تشير هذه النتيجة إلى أن طريقة عكس المعلومات الجيوفيزيائية المتكاملة تمتلك درجة معينة من الإشارة والجدوى.
لتحديد أهداف الاستكشاف المحددة بشكل أكبر، تم استخدام برنامج Creatar XModeling لنمذجة الجيولوجيا ثلاثية الأبعاد لبناء نموذج جيولوجي ثلاثي الأبعاد لمنطقة الدراسة (الشكل 8). يحقق هذا النموذج شفافية للأجسام الجيولوجية العميقة، مما يوفر فهماً معززاً للجيولوجيا تحت السطح ويساعد في تحديد الموارد المعدنية المحتملة.

تحليل الظروف الملائمة للتعدين

أجرت هذه الدراسة تحليلًا شاملاً للنموذج الجيولوجي-الفيزيائي (الشكل 9) لمنطقة تعدين الذهب في يونغشين، محددةً الظروف المواتية الرئيسية (الجدول 2) للتعدين وبناء نموذج متكامل للعثور على الخام. قمنا بدمج نموذج جيولوجي ثلاثي الأبعاد مع طرق فيزيائية مختلفة، بما في ذلك المسوحات الجاذبية والمغناطيسية والكهرومغناطيسية، لإجراء تقييم مفصل لإمكانات التمعدن في الجزء العميق من منطقة التعدين.
(1) الظروف الجيولوجية. يكشف النموذج الجيولوجي-الفيزيائي لمنطقة دراستنا عن طبقات تمتد عبر العصور الحديثة (سينوزوي) والوسطى (ميزوزوي) والقديمة (باليزوئي). تعمل الطبقات الحديثة والوسطى، بما في ذلك الرواسب النهرية وتكوينات مثل جوانغhua، لونغجيانغ، غانخه، وجيوفينغشان، كطبقات تغطية. تتكون الطبقات الباليوزوية بشكل أساسي من تشكيلات دوباوشان، ولوه، ونيتشيوه، وياوسانغنان.
تُلاحظ شذوذات جيوفيزيائية كبيرة في مناطق الاتصال بين السيينوجرانيت من العصر الكربوني المتأخر والميلونيت الجرانيت، تحديدًا داخل تشكيل جوانغhua من العصر الوسيط. تشير هذه الشذوذات إلى أن البريشيا الهيدروحرارية (الشكل 9أ) الموجودة حول هذه الاتصالات هي موقع محتمل لجسم خام. علاوة على ذلك، يظهر تقاطع هذه الأنواع من الصخور كمنطقة واعدة للتعدين.
بالإضافة إلى ذلك، يقع حقل الذهب يونغشين في محيط حوض بركاني من العصر الطباشيري المبكر. تتميز بتعرضات شاسعة من الصخور البركانية وما دون البركانية. يرتبط التمعدن بالذهب مكانيًا بالكتل ما دون البركانية والمناطق الهامشية من هذا الحوض البركاني (الشكل 9ب، ج، د)، مما يشير إلى علاقة وثيقة بين البركانية وتمعدن الذهب.
الشكل 9. العوامل المواتية للتعدين ونموذج التنقيب المتكامل. (أ) البريشيا الهيدروحرارية. (ب) تقاطع الجرانيت المونزونيتي، والميولونيت الجرانيت، وتكوين جوانغhua. (ج) الصخور تحت البركانية. (د) هوامش حوض التصدع البركاني لتكوين جوانغhua. (هـ) تقاطع الفوالق الشمالية الشرقية والشمالية الغربية. (و) تقاطع تكوين جوانغhua مع الفوالق الشمالية الغربية-الشرقية. (ز) تفسير الجيوفيزياء AMT. (ح) نموذج التنقيب المعدني الشامل. (تم إنشاء الشكل باستخدام ميكرومين (https://www.wiseminet ech.com/) بواسطة جون تشين).
أنواع رواسب المعادن عوامل مواتية للتعدين متغيرات الميزة
إيداع الذهب الإيبيثيرمال ميزات جيولوجية ملائمة الخرسانة الهيدروحرارية (الشكل 9أ)
تقاطع الجرانيت المونزونيتي، والجرانيت المايلونيت، وتكوين جوانغhua (الشكل 9ب)
صخور تحت بركانية (الشكل 9ج)
هوامش حوض غوانغوا التكتوني البركاني (الشكل 9د)
هياكل التمعدن المواتية تقاطع الفوالق الشمالية الشرقية والشمالية الغربية (الشكل 9e)
تقاطع تشكيل جوانغوا مع الفوالق NW-NE (الشكل 9f)
خصائص جيولوجية جغرافية ملائمة للتعدين تفسير الجيوفيزياء AMT (الشكل 9g)
الجدول 2. نموذج شامل للاستكشاف لمنطقة الدراسة.
(2) الظروف التكتونية. تتميز المنطقة بوجود صدوع موجهة نحو الشمال الغربي، والشمال الشرقي، والشمال والجنوب، وتقريباً شرق-غرب. تؤثر الهياكل العميقة للصدوع في الشمال الشرقي والشمال الغربي (الشكل 9e) بشكل كبير على التمعدن، والأنشطة الماغماتية، وعمليات التمعدن. تعتبر الصدوع الموجهة نحو الشمال الشرقي أكثر بروزًا وتتميز بتكتونيات الكسر الانضغاطي، بينما تكون الصدوع الموجهة نحو الشمال الغربي أصغر وعادة ما تظهر خصائص كسر الشد.
ترتبط الأعداد الأكبر من خامات الذهب والمعادن المتعددة بشكل أساسي بتكوين جوانغhua وهذه الفوالق (الشكل 9f). وقد تطورت شذوذات التمعدن ومواقع التغير الهيدروحراري عند تقاطعاتها، مما يشير إلى وجود ارتباط مكاني وثيق بين رواسب الذهب وهذه الهياكل التكتونية.
(3) الظروف الجيوفيزيائية ونموذج الاستكشاف المتكامل. تم تحديد سبعة شذوذات جاذبية من خلال المسوحات الجاذبية والمغناطيسية. تحدث هذه الشذوذات بشكل أساسي في منطقة الاتصال بين الصخور البركانية والبركانية تحت السطحية من العصر الوسيط والشيرتات الجرانوديوريتية من العصر الكربوني المتأخر، والتي يمكن ملاحظتها في مناطق التدرج أو المناطق ذات الكثافة المغناطيسية المنخفضة.
تكشف قياسات AMT عن قيم مقاومة صخرية منخفضة، تتوافق مع منطقة تدرج مقاومة متوسطة إلى منخفضة (الشكل 9g). تشير الدراسات السابقة ونتائجنا إلى أن موقع التمعدن في ودائع الذهب في يونغشين يقع في منطقة تماس محددة.
بالنظر إلى جميع العوامل، نفترض أن مناطق تدرج الشذوذ المغناطيسي أو المناطق ذات الحقول المغناطيسية المنخفضة، جنبًا إلى جنب مع مناطق تدرج المقاومة المتوسطة إلى المنخفضة، تشكل مواقع ملائمة للتعدين. يُعتقد أن مناطق الكسور المتوافقة مع الطبقات ذات المقاومة المنخفضة المرئية في صور AMT مرتبطة ارتباطًا وثيقًا بعمليات التمعدن.
من خلال استخدام نموذج شامل لاستكشاف المعادن (الشكل 9h)، اكتشفنا أن جسم خام الذهب المعروف في يونغشين يقع داخل وحول جسم البريشيا المائية في منطقة تماس محددة. توفر هذه المقاربة المتكاملة رؤى قيمة لجهود استكشاف المعادن المستقبلية في منطقة الدراسة.

تنبؤ التمعدن

يتوافق جسم الخام مع منطقة التمعدن المواتية التي تم تحديدها من خلال التفسير المتكامل لل anomalies الجاذبية والمغناطيسية والكهربائية. بالإضافة إلى ذلك، فإن منطقة الكسور والتقاطع بين الكتل الصخرية الواقعة في شمال شرق منطقة الدراسة تحمل تشابهات جيولوجية وجيوفيزيائية مع جسم خام الذهب المعروف في يونغشين، مما يشير إلى سياق تمعدن قابل للمقارنة (الشكل 10). يظهر جسم البريشيا الهيدروحراري، الواقع عند الحدود بين المايلونيت الجرانيتية من العصر الكربوني المتأخر والسينيجرانيت، علامات جيوفيزيائية لمنطقة ذات تدرج مقاومة متوسطة إلى منخفضة، مما يشير إلى إمكانية وجود تمعدن على مستويات أعمق.
لتحقيق هذا الاحتمال، تم اختيار ثقب الحفر ZK790-1 للاستكشاف. كشفت نتائج الحفر أن أجزاء الثقب العميقة تتكون في الغالب من المايلونيت الجرانوديوريت القوي السيليكا، مع حدوث متقطع للديوريت-بورفيريت وعيون الكوارتز. ومن الجدير بالذكر أنه تم العثور على عدة طبقات من التمعدن ذات سماكات متفاوتة. إن التوافق بين أنواع الصخور والسماكات التي تم العثور عليها مع نتائجنا المفسرة يبرز فعالية تقنيات التفسير الجيوفيزيائي المتكاملة في استكشاف موارد المعادن.

الاستنتاجات

(1) يتم التحكم في رواسب الذهب في يونغشين بشكل أساسي بواسطة صدوع تتجه نحو الشمال الشرقي وتوجد داخل منطقة الاتصال بين المايلونيت الجرانيتية من العصر الكربوني المتأخر والسينيجرانيت. تحدد دراستنا بدقة مواقع الخامات داخل منطقة تدرج المقاومة العالية إلى المنخفضة.
(2) يدمج هذا البحث بشكل مبتكر بين قياسات المغناطيسية الصوتية (AMT) والاستطلاعات الجاذبية والتصوير المغناطيسي العالي، مستفيدًا من تقنيات النمذجة ثلاثية الأبعاد لتحديد التغيرات الصخرية والميزات الجيولوجية العميقة التي تشكل خامات في منطقة الدراسة بشكل فعال. تُظهر هذه الطريقة أسلوب تفسير شامل وفعال للغاية.
(3) من خلال بناء نموذج جيولوجي ثلاثي الأبعاد، حققنا “شفافية” الهيكل الجيولوجي ضمن نطاق عمق يبلغ 1.5 كم في منطقة الدراسة. من خلال دمج الظروف الجيولوجية المكونة للخامات مع نتائج التفسير الجيوفيزيائي، قمنا بتلخيص ظروف التمعدن المواتية لمنطقة تعدين الذهب يونغشين وطورنا نموذجًا شاملًا لاستكشاف الخامات. وقد أكدت التحقق من الحفر بنجاح على تحديد مناطق متعددة متمعدنة في العمق، مما يؤكد التآزر بين الاستكشاف الجيوفيزيائي المتكامل.
الشكل 10. نموذج جيولوجي ثلاثي الأبعاد وخريطة موقع التحقق من الحفر. (تم إنشاء الشكل باستخدام ميكرومين (https://www.wiseminetech.com/) بواسطة جون تشين).
استكشاف و النمذجة ثلاثية الأبعاد، وتسليط الضوء على إمكاناتها الكبيرة وآفاق تطبيقها في استكشاف المعادن.

توفر البيانات

البيانات التي تم إنشاؤها و/أو تحليلها خلال الدراسة الحالية غير متاحة للجمهور بسبب [المتطلبات التنظيمية للبيانات السرية] ولكن البيانات غير السرية متاحة من المؤلف المراسل عند الطلب المعقول.
تاريخ الاستلام: 10 أبريل 2024؛ تاريخ القبول: 25 فبراير 2025
تم النشر عبر الإنترنت: 01 مارس 2025

References

  1. Bellefleur, G., de Kemp, E., Goutier, J., Allard, M. & Adam, E. Seismic imaging of the geologic framework and structures related to volcanogenic massive sulfide deposits in the Archean Rouyn-Noranda District, Quebec Canada. Econ. Geol. 109, 103-119 (2014).
  2. Liu, S. F. et al. Adoption of a mineral system model in successful deep exploration at Erdaogou, China’s deepest gold mine, on the northeastern margin of the North China Craton. Ore Geol. Rev. 131, 104060 (2021).
  3. Han, S. et al. Integrated geophysical exploration of the coupling of a concealed rock body and metallogenic structures- mining area case study in Jilinbaolige, Inner Mongolia. China. J. Appl. Geophys. 178, 104048 (2020).
  4. Ogah, A. J. & Abubakar, F. Solid mineral potential evaluation using integrated aeromagnetic and aeroradiometric datasets. Sci. Rep. 14, 1637 (2024).
  5. Olierook, H. K. H. et al. Emplacement of the Argyle diamond deposit into an ancient rift zone triggered by supercontinent breakup. Nat. Commun. 14, 5274 (2023).
  6. Yang, J., Liu, S. & Hu, X. Inversion of high-amplitude magnetic total field anomaly: An application to the Mengku iron-ore deposit, northwest China. Sci. Rep. 10, 11949 (2020).
  7. Zhang, G. et al. Joint interpretation of geological, magnetic, AMT, and ERT data for mineral exploration in the northeast of Inner Mongolia, China. Pure Appl. Geophys. 175, 989-1002 (2017).
  8. Lahti, I., Kontinen, A. & Nykänen, V. AMT survey in the Outokumpu ore belt, eastern Finland. Explor. Geophys. 50, 351-363 (2019).
  9. Cushing, E. M. et al. Building a three dimensional model of the active Plio-Quaternary basin of Argostoli (Cephalonia Island, Greece): An integrated geophysical and geological approach. Eng. Geol. 265, 105441 (2020).
  10. Qi, G., Meng, G. X., Yan, J. Y., Tang, H. J. & Xue, R. H. Three-dimensional geological-geophysical modeling and prospecting indications of the ashele ore concentration area in Xinjiang based on irregular sections. Minerals 13, 984 (2023).
  11. Anderson, E. D. et al. Geophysical data provide three dimensional insights into porphyry copper systems in the Silverton caldera, Colorado, USA. Ore Geol. Rev. 152, 105223 (2023).
  12. Eldougdoug, A. et al. Exploring gold mineralization in altered ultramafic rocks in south Abu Marawat, Eastern Desert, Egypt. Sci. Rep. 13, 7293 (2023).
  13. Tominaga, M. et al. Multi-scale magnetic mapping of serpentinite carbonation. Nat. Commun. 8, 1870 (2017).
  14. Wang, Q. Y., Liu, H. D., Chen, J. P., Wang, L. J. & Zhu, D. C. 3D geological modeling and metallogenic prognosis of Jiaojia gold metallogenic belt in Shandong. J. Geol. 38, 412-420 (2014).
  15. Zheng, X. M., Ni, J. C., Guo, G., Fang, W. X. & Wang, H. W. Application of audio frequency magnetotelluric sounding in 3D geological modeling in Hongshishan ophiolitic melange belt Gansu. Miner. Explor. 12, 1602-1609 (2021).
  16. Wang, L. et al. Geology and genesis of the Early Paleozoic Zhengguang intermediate-sulfidation epithermal Au-Zn deposit, northeast China. Ore Geol. Rev. 124, 103602 (2020).
  17. Zhang, A. Q. et al. Lithosphere-asthenosphere interactions beneath northeast China and the origin of its intraplate volcanism. Geology 50, 210-215 (2021).
  18. Wu, F. Y. et al. The Heilongjiang Group: A Jurassic accretionary complex in the Jiamusi Massif at the western Pacific margin of northeastern China. Island Arc 16, 156-172 (2007).
  19. Gong, M. Y., Tian, W., Fu, B., Wang, S. Y. & Dong, J. L. Zircon Hf-O isotopic constraints on the origin of Late Mesozoic felsic volcanic rocks from the Great Xing’an Range, NE China. Lithos 308, 412-427 (2018).
  20. Zhang, L. S. et al. Petrogenesis and tectonic settingof granitoids in the Fuanpu molybdenum deposit, Lesser Xing ar-Zhangguangcai range metallogenic belt: Constraints from element geochemistry, zircon U-Pb geochronology and Sr-Nd-Hf isotopes. Acta Geol. Sin. 95, 2471-2492 (2021).
  21. Shu, Q. H., Chang, Z. S. & Mavrogenes, J. Fluid compositions reveal fluid nature, metal deposition mechanisms, and mineralization potential: An example at the Haobugao Zn-Pb skarn, China. Geology 49, 473-477 (2021).
  22. Mao, J. W. et al. Mesozoic large-scale metallogenic pulses in North China and corresponding geodynamic settings. Acta Petrol. Sin. 21, 171-190 (2005).
  23. Xu, M. J., Xu, W. L., Wang, F., Gao, F. H. & Yu, J. J. Geochronology and geochemistry of the Early Jurassic granitoids in the central Lesser Xing’an Range, NE China and its tectonic implications. Acta Petrol. Sin. 29, 354-368 (2013).
  24. Shu, Q. H. et al. Regional metallogeny of Mo-bearing deposits in northeastern China, with new Re-Os dates of porphyry Mo deposits in the northern Xilamulun district. Econ. Geol. 111, 1783-1798 (2016).
  25. Shu, Q. H. et al. Zircon trace elements and magma fertility: insights from porphyry (-skarn) Mo deposits in NE China. Miner. Depos. 54, 645-656 (2019).
  26. Xing, K., Shu, Q. H. & Lentz, D. R. Constraints on the formation of the giant Daheishan porphyry Mo deposit (NE China) from whole-rock and accessory mineral geochemistry. J. Petrol. 62, 1-26 (2021).
  27. Cheng, G. H. et al. Zircon U-Pb ages, Hf isotopes of the granitoids and Re-Os ages of the molybdenites in Luming molybdenum ore area, Heilongjiang Province, and its geological significance. Acta Petrol. Sin. 31, 2450-2464 (2015).
  28. Zhai, D. G. et al. The genesis of the giant Shuangjianzishan epithermal Ag-Pb-Zn deposit, Inner Mongolia, Northeastern China. Econ. Geol. 115, 101-128 (2020).
  29. Zhang, C. P. et al. Geochronology and isotope geochemistry studies of an epithermal gold deposit in the northern Lesser Khingan Range, NE China: The Gaosongshan example. Ore Geol. Rev. 105, 356-374 (2019).
  30. Liu, Y. et al. Origin and evolution of ore-forming fluid for the Gaosongshan gold deposit, Lesser Xing’an Range: Evidence from fluid inclusions, H-O-S-Pb isotopes. Geosci. Front. 10, 1961-1980 (2019).
  31. Zhao, Z. H. et al. Age of the Yongxin Au deposit in the Lesser Xing’an Range: Implications for an Early Cretaceous geodynamic setting for gold mineralization in NE China. Geol. J. 54, 2525-2544 (2019).
  32. Zhao, Z. H. et al. Genesis of the Yidonglinchang gold deposit, Lesser Xing’an Range, China: Insights from fluid inclusions, H-O-SPb isotopes, and and geochronology. Ore Geol. Rev. 163 (2023).
  33. Zhao, Z. H. et al. Zircon U-Pb geochronology and Sr-Nd-Pb-Hf isotopic constraints on the timing and origin of the Early Cretaceous igneous rocks in the Yongxin gold deposit in the Lesser Xing’an Range, NE China. Geol. J. 55, 2684-2703 (2019).
  34. Yuan, M. W. et al. Geochemical and isotopic composition of auriferous pyrite from the Yongxin gold deposit, Central Asian Orogenic Belt: Implication for ore genesis. Ore Geol. Rev. 93, 255-267 (2018).
  35. Pitiya, R. et al. Audio magnetotellurics study of the geoelectric structure across the Zhugongtang giant lead-zinc deposit, NW Guizhou Province, China. Minerals 12 (2022).
  36. Singh, S. et al. Audio-magnetotelluric investigation of sulfide mineralization in Proterozoic-Archean greenstone belts of Eastern Indian Craton. J. Earth Syst. Sci. 127 (2018).
  37. Ugbor, C. C., Arinze, I. J. & Emedo, C. O. Analysis of aeromagnetic data of Ikwo and Environs, Southeastern Nigeria: A mineral and hydrocarbon exploration guide. Nat. Resour. Res. 29, 2915-2932 (2020).
  38. Di Paolo, F. et al. La Palma island (Spain) geothermal system revealed by 3D magnetotelluric data inversion. Sci. Rep. 10, 18181 (2020).
  39. Darabi-Golestan, F., Ghavami-Riabi, R., Khalokakaie, R., Asadi-Haroni, H. & Seyedrahimi-Nyaragh, M. Interpretation of lithogeochemical and geophysical data to identify the buried mineralized area in Cu-Au porphyry of Dalli-Northern Hill. Arab. J. Geosci. 6, 4499-4509 (2012).
  40. Maharaj, D., Elbra, T. & Pesonen, L. J. Physical properties of the drill core from the Elgygytgyn impact structure, NE Russia. Meteorit. Planet. Sci. 48, 1130-1142 (2013).
  41. Zhang, R. Z. et al. 3-D joint inversion of gravity and magnetic data using data-space and truncated Gauss-Newton methods. IEEE Geosci. Remote Sens. Lett. 19, 1-5 (2022).
  42. Li, W. B., Qian, J. L. & Li, Y. G. Joint inversion of surface and borehole magnetic data: A level-set approach. Geophysics 85, 15-32 (2020).
  43. Xiao, B. et al. Rare earth element characteristics of shales from Wufeng-Longmaxi formations in deep-buried areas of the Northern Sichuan Basin, Southern China: Implications for provenance, depositional conditions, and paleoclimate. ACS Omega 9, 2088-2103 (2024).
  44. Vatankhah, S., Renaut, R. A., Huang, X. G., Mickus, K. & Gharloghi, M. Large-scale focusing joint inversion of gravity and magnetic data with Gramian constraint. Geophys. J. Int. 230, 1585-1611 (2022).
  45. Zhang, S. et al. A facile approach to ultralight and recyclable 3D self-assembled copolymer/graphene aerogels for efficient oil/water separation. Sci. Total Environ. 694, 133671 (2019).
  46. Yang, Z. W., Tan, H. D., Peng, M., Kong, W. X. & Wu, P. P. Three-dimensional joint inversion of gravity, magnetic and magnetotelluric data based on cross-gradient theory. Chin. J. Geophys. Chin. Ed. 63, 736-752 (2020).
  47. Li, C. L. et al. Study on pyrite thermoelectricity, ore-forming fluids and H-O-Rb-Sr isotopes of the Yongxin gold deposit, Central Asian Orogenic Belt: Implications for ore genesis and exploration. Ore Geol. Rev. 121 (2020).
  48. Behrendt, J. C. The aeromagnetic method as a tool to identify Cenozoic magmatism in the West Antarctic Rift System beneath the West Antarctic Ice Sheet-A review; Thiel subglacial volcano as possible source of the ash layer in the WAISCORE. Tectonophysics 585, 124-136 (2013).
  49. Ross, P. S. et al. High-resolution physical properties, geochemistry, and alteration mineralogy for the host rocks of the Archean Lemoine auriferous volcanogenic massive sulfide deposit, Canada. Econ. Geol. 111, 1561-1574 (2016).
  50. Caballero-Miranda, C. I. et al. Vertical AMS variation within basalt flow profiles from the Xitle volcano (Mexico) as indicator of heterogeneous strain in lava flows. J. Volcanol. Geotherm. Res. 311, 9-28 (2016).
  51. Sakr, S. M., Bamousa, A. O., Gougazeh, M. H. & Zaman, H. Petromagnetic investigations of the volcanic rocks in southern part of Al-Madinah, Saudi Arabia: Differentiation of different lava types. J. Taibah Univ. Sci. 14, 1009-1022 (2020).
  52. Liang, K. W., Zhao, Z. H. & Guo, Y. Application of primary halo in deep metallogenic prediction: A case study of Yongxin gold deposit in Heihe Area. Geol. Resour. 28, 512-518 (2019).
  53. Li, C. L. et al. Discovery and geological significance of gold-silver bearing minerals and tellurides in the Yongxin gold deposit in the northeastern Great Xing’an Range. Earth Sci. Front. 27, 244-254 (2020).
  54. Deng, C. Z. et al. Geochemistry of Early Cretaceous volcanic rocks in the Northeastern Great Xing’an Range, northeast China and implication for geodynamic setting. Int. Geol. Rev. 61, 1594-1612 (2018).
  55. Liu, R. P. et al. Zircon U-Pb geochronology and petrogeochemistry of host igneous rocks of the Dong’an gold deposit in Heilongjiang Province, NE China. Acta Petrol. Sin. 31, 1391-1408 (2015).
  56. Zhang, M. M. et al. Tellurium and gold enrichment aided by melts and pyrite crystallization kinetics: Insights from the Yongxin gold deposit, northeast China. Ore Geol. Rev. 156, 105370 (2023).
  57. Zhao, Z. H. et al. Early Cretaceous gold mineralization in the Lesser Xing’an Range of NE China: The Yongxin example. Int. Geol. Rev. 61, 1522-1548 (2018).

الشكر والتقدير

تم دعم هذا العمل ماليًا من قبل المؤسسة الوطنية للعلوم الطبيعية في الصين (42372108)، ومشروع التمويل لمركز الابتكار العلمي والتكنولوجي الجيولوجي في شمال شرق الصين (QCJJ2023-20)، ومشروع التمويل من وزارة التعليم في مقاطعة لياونينغ (LJ212410147031، LJ222410147089)، ومؤسسة العلوم الطبيعية في مقاطعة لياونينغ (2024-MS-207)، ومؤسسة العلوم الطبيعية في مقاطعة شاندونغ (ZR2024QD274)، ومؤسسة العلوم الطبيعية في مقاطعة هيلونغجيانغ في الصين (ZL2024D005).

مساهمات المؤلفين

كتب Y.C.Y. و Z.H.Z. النص الرئيسي للمخطوطة، وجمع Y.J.Y. و X.Z. العينات وحللوها، وفسر C.L.L. و H.N.L. البيانات وحللوها، وأعد J.C. الأشكال 1-10. راجع جميع المؤلفين المخطوطة.

الإعلانات

المصالح المتنافسة

يعلن المؤلفون عدم وجود مصالح متنافسة.

معلومات إضافية

يجب توجيه المراسلات والطلبات للحصول على المواد إلى Z.Z.
معلومات إعادة الطبع والتصاريح متاحة على www.nature.com/reprints.
ملاحظة الناشر تظل Springer Nature محايدة فيما يتعلق بالمطالبات القضائية في الخرائط المنشورة والانتماءات المؤسسية.
الوصول المفتوح هذه المقالة مرخصة بموجب رخصة المشاع الإبداعي للاستخدام والمشاركة والتكيف والتوزيع وإعادة الإنتاج في أي وسيلة أو تنسيق، طالما أنك تعطي الائتمان المناسب للمؤلفين الأصليين والمصدر، وتوفر رابطًا لرخصة المشاع الإبداعي، وتوضح ما إذا كانت هناك تغييرات قد تم إجراؤها. الصور أو المواد الأخرى من طرف ثالث في هذه المقالة مشمولة في رخصة المشاع الإبداعي للمقالة، ما لم يُذكر خلاف ذلك في سطر الائتمان للمادة. إذا لم تكن المادة مشمولة في رخصة المشاع الإبداعي للمقالة واستخدامك المقصود غير مسموح به بموجب اللوائح القانونية أو يتجاوز الاستخدام المسموح به، ستحتاج إلى الحصول على إذن مباشرة من صاحب حقوق الطبع والنشر. لعرض نسخة من هذه الرخصة، قم بزيارة http://creativecommons.org/licenses/by/4.0/.
© المؤلفون 2025

  1. كلية التعدين، جامعة لياونينغ التقنية، فوكسي، لياونينغ 123000، الصين. مختبر لياونينغ الرئيسي للتنمية الخضراء للموارد المعدنية، LNTU، فوكسي، لياونينغ 123000، الصين. معهد هيلونغجيانغ لمسح الموارد الطبيعية، هاربين، هيلونغجيانغ 150036، الصين. البريد الإلكتروني: zhaozhonghai@Intu.edu.cn

Journal: Scientific Reports, Volume: 15, Issue: 1
DOI: https://doi.org/10.1038/s41598-025-92108-3
PMID: https://pubmed.ncbi.nlm.nih.gov/40025120
Publication Date: 2025-02-28

scientific reports

OPEN

Integrated geophysical prospecting for deep ore detection in the Yongxin gold mining area, Heilongjiang, China

Yechang Yin , Jun Chen , Zhonghai Zhao □ , Yuanjiang Yang , Chenglu , Haina & Xiang Zhao

Abstract

Geophysical exploration techniques play a pivotal role in enhancing the accuracy of mineral prospecting predictions. However, relying solely on individual methods often introduces uncertainties. This study presents a case study from the Yongxin gold deposit, where we integrated audio-frequency magnetotelluric (AMT) methods with gravimetric surveying and high-resolution magnetic profiling to overcome this challenge. Advanced three-dimensional modeling techniques were utilized to precisely delineate lithological variations and deep-seated mineralization features inherent to the area. The inversion and interpretation of cross-sectional AMT data provided insights into the subsurface structure down to a depth of 1.5 km . This enhanced data reliability was achieved through an integrated interpretation constrained by multiple datasets, enabling a more accurate inference of the deeper geological framework. Furthermore, by amalgamating various datasets, we uncovered characteristics of deep mineralization, the three-dimensional configuration of mineralization-related rock masses, and the spatial orientation of known ore deposits. This holistic approach facilitated a comprehensive understanding of the deeper geological formations. A detailed analysis of ore-controlling structures and exploration markers led to the development of a tailored geological-geophysical model for mineral exploration within the study area, serving as a valuable reference for future deep exploration efforts.

In recent years, with the gradual depletion of shallow mineral resources, the exploration and development of mineral resources at depths ranging from 500 to 2000 m have become the primary focus of ore deposit scientists . In this context, traditional geological exploration methods face numerous limitations, and the discovery of new ore deposits has become increasingly challenging . Therefore, the significance of highprecision, high-resolution, and easy-to-operate geophysical exploration techniques has become paramount . Among these, the Audio-frequency Magnetotelluric (AMT) method has been widely utilized in deep mineral exploration due to its advantages such as high work efficiency, large exploration depth, ability to penetrate highresistivity layers, and strong resolution for low-resistivity layers .
Notably, integrated geophysical exploration methods have achieved remarkable results in various mining areas worldwide. For instance, Lahti et al. conducted a 2D smooth inversion of AMT data to visualize the subsurface conductivity structure of the Outokumpu belt in eastern Finland. This provided valuable insights for deep exploration and ore body positioning prediction . Similarly, Wang et al., in the Jiaojia gold mineralization belt of Shandong, integrated geological, tectonic, drilling data, and controlled-source audio-frequency magnetotelluric (CSAMT) survey profiles to create a three-dimensional geological model. Through a comprehensive analysis of lithology, physical properties, and the forward interpretation of the geophysical field, they constructed a three-dimensional geological-geophysical model and identified six prospective mining targets . Furthermore, Zhang et al. employed AMT technology to generate two-dimensional geoelectrical profiles in the Hongshishan research area of Gansu Province. By correlating surface lithology with physical properties like resistivity and magnetic susceptibility, they established a three-dimensional geological model of the ophiolite mélange zone. This model offers crucial insights into the occurrence and contact relationships, which are essential for exploring the formation mechanisms of basic and ultrabasic rocks .
To more accurately delineate the ore body morphology and predict the deep mineralization potential, we employed an integrated geophysical exploration method primarily based on Audio-frequency Magnetotelluric
(AMT) surveys, supplemented by gravity areal measurements and high-magnetic profile surveys in the Yongxin gold mining area. We deployed a total of 25 AMT profiles in the study area and processed the field data using advanced two-dimensional AMT inversion techniques. Through this approach, we obtained detailed electrical structure information up to a depth of 1.5 km below the surface. Furthermore, by integrating geological, physical, and gravimagnetic data from the study area, we conducted in-depth interpretation and constraint analysis of the anomalous bodies within the electrical structure, resulting in a more precise geological-geophysical model. This model not only reveals the deep distribution characteristics and relationships of various mineralization elements in the study area but also provides a strong exploration direction and deployment basis for subsequent identification of favorable mineralization zones and the establishment of ore-prospecting prediction models.

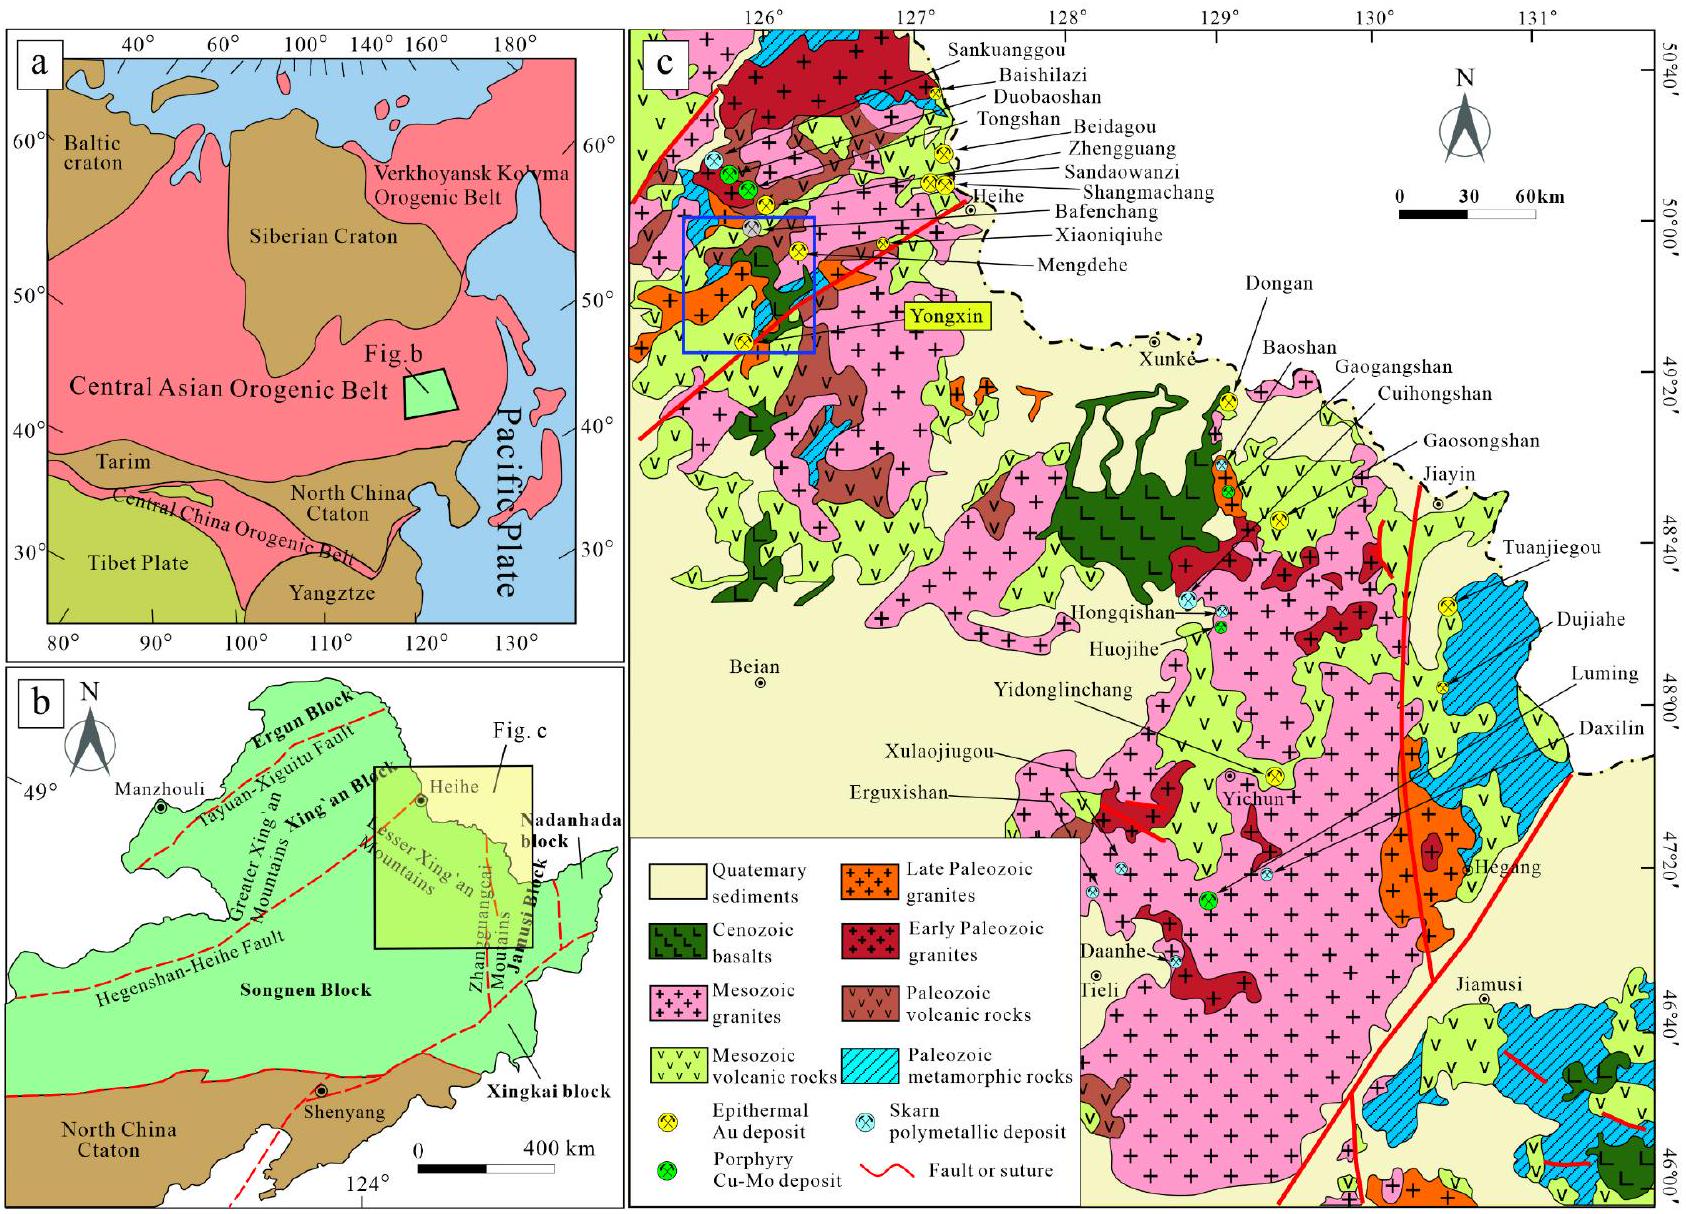
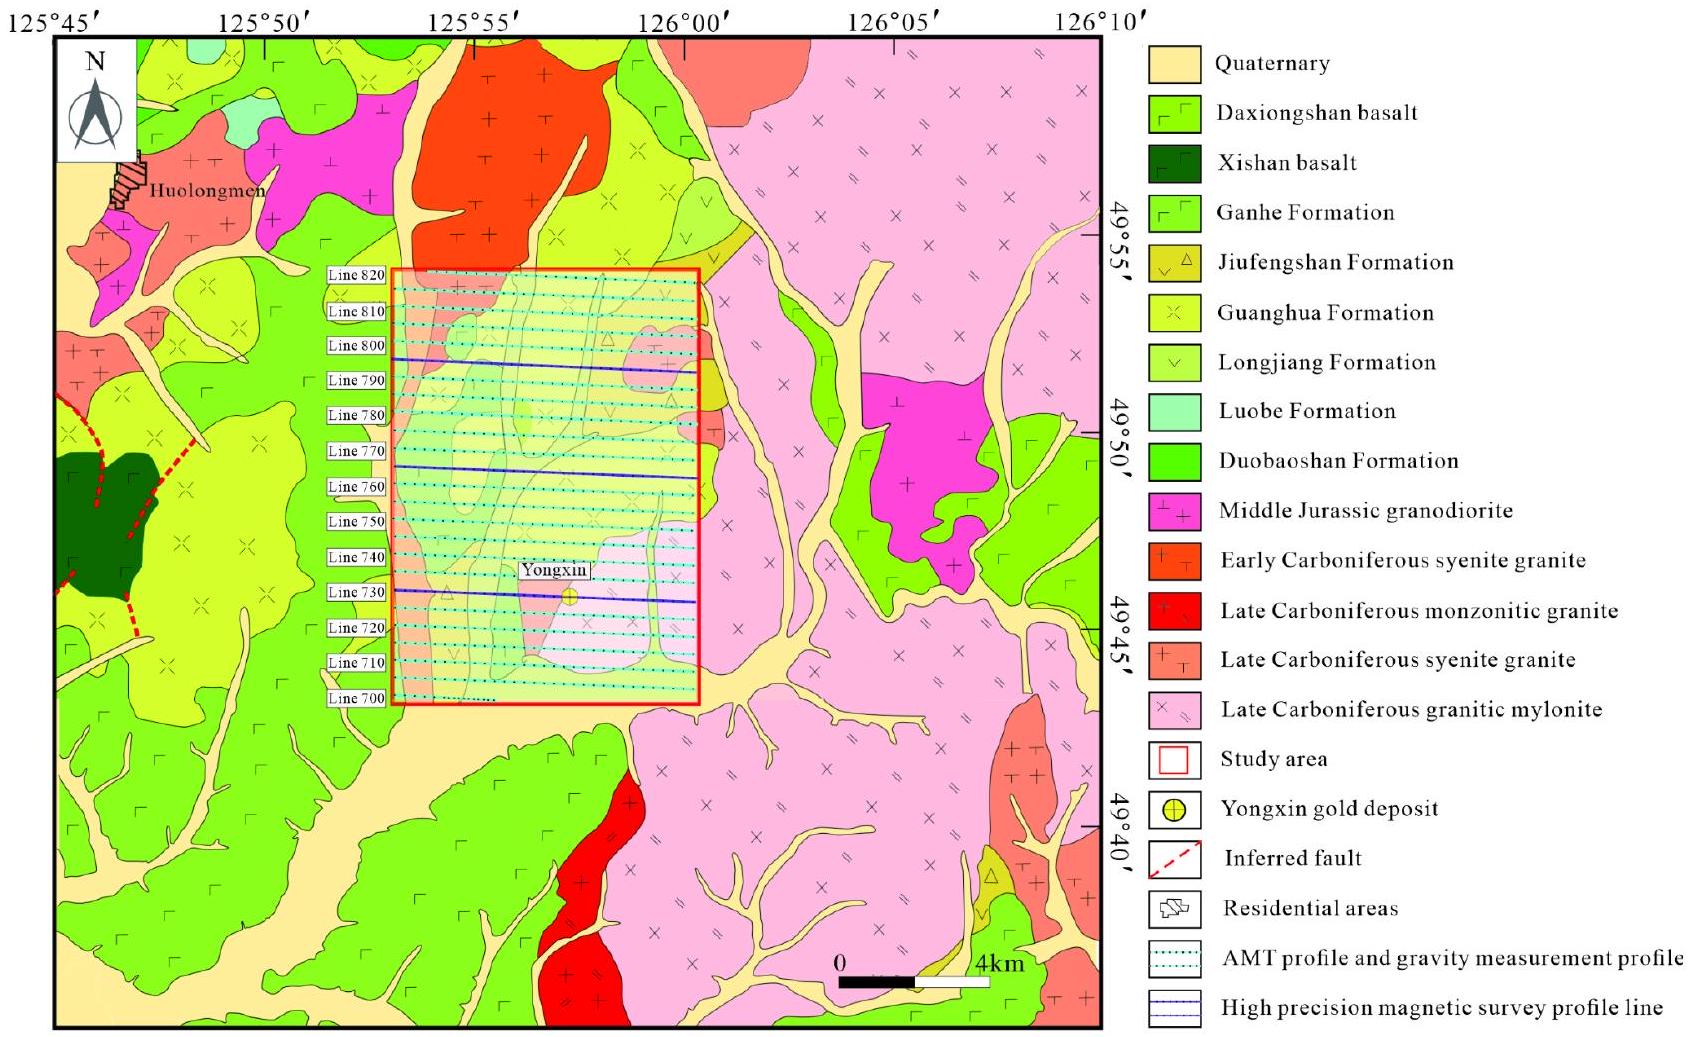
Geological setting Regional geology

The study area is situated in the eastern segment of the Central Asian Orogenic Belt (Fig. 1a), specifically at the tectonic interface of the Xing’an and Songnen blocks in the Inner Mongolia-Great Xing’an orogenic belt (Fig. 1b). This is a geologically complex region that has undergone prolonged tectonic and magmatic evolution . Since the Paleozoic era, it has been influenced by the tectonic shifts between the Siberian and North China Plates, as well as the Paleo-Asian Ocean’s development and eventual closure . During the Mesozoic, key events included the tectonic changes related to the Mongol-Okhotsk Ocean and the Pacific Plate’s subduction, followed by deep faulting in the Cenozoic . These multiple tectonic and magmatic activities have resulted in a diverse geological profile, including Paleozoic volcanic and metamorphic rocks, Mesozoic continental volcanic rocks, Paleogene fluvial-lacustrine sedimentary rocks, and Phanerozoic granites . This region of Northeast China is renowned for its intense and intricate tectonic and magmatic history. As a result, it hosts a wide range of precious and non-ferrous metal deposits, including copper-molybdenum, iron-copper (molybdenum) polymetallic, and epithermal gold deposits (Fig. 1c).
Fig. 1. Geotectonic location map. (a) Simplified tectonic division of China and the surrounding area, modified after Liu et al. . (b) Tectonic subdivisions of NE China, modified after Zhao et al. . (c) Simplified geological map of the Lesser Xing’an Range, modified after Zhao et al. (The figure is generated using CorelDraw X9 (http://www.coreldraw.com/cn/) by Jun Chen).

Ore deposit geology

The Yongxin gold deposit, situated 70 km northeast of Nenjiang in Heilongjiang Province and 115 km southwest of Heihe City, boasts a substantial gold reserve of approximately 20 tonnes with an average grade of . The mining area comprises various rock types, predominantly Late Carboniferous syenogranite, granitic mylonite, Early Cretaceous volcanic rocks, and other subvolcanic formations, with a minor outcrop of granodiorite (Fig. 2).
The Early Cretaceous volcanic rocks primarily comprise the Longjiang Formation, the Guanghua Formation, and the Ganhe Formation. The Longjiang Formation is distributed in the central and northern parts of the mining area, mainly consisting of intermediate-acidic volcanic rocks. The Guanghua Formation is primarily located in the northern part of the mining area, predominantly consisting of acidic volcanic rocks. The Ganhe Formation appears sporadically in the southwestern corner of the mining area, mainly composed of andesite, vesicle andesite basalt, and vesicular basalt. These Early Cretaceous volcanic rock eruptions unconformably overlie the mining area’s Syenogranite, granitic mylonite, and granodiorite. Early Cretaceous diorite-porphyrite and granite porphyry exhibit vein-shaped outputs oriented northeast to north-northeast, roughly parallel to the ore body.
The Yongxin deposit features two gold ore bodies controlled by a northeast-oriented fault zone, mainly found at the contact between Early Carboniferous syenogranite and mylonite . These ore bodies extend in a northeast direction, with a gentle wave-like profile on cross-sections and structures aligned end-to-end. The main ore body, designated as No. 1, spans 375 m in length, with a maximum width of 73 m , a minimum width of 7 m , and an inclination angle ranging from to . It extends to a depth of approximately 800 m .
The Yongxin deposit is an epithermal gold deposit. The primary ore types are predominantly hydrothermal cemented breccia, quartz vein type, and altered rock type, with occasional small amounts of mylonite type. The ores exhibit various textures, including euhedral-hypidiomorphic granular, xenomorphic granular, brecciated, disseminated, veinlet, and vug or drusy. The primary metallic minerals are pyrite, galena, sphalerite, and minor chalcopyrite, with rare occurrences of native gold. Hematite and goethite are present as secondary minerals, while the lode minerals consist mainly of quartz, potassium feldspar, calcite, sericite, chlorite, epidote, and a small amount of adularia.

Analytical methods

This study employed the V8 networked multi-functional electrical method system, developed by Phoenix Geophysics of Canada, to conduct audio-frequency magnetotelluric (AMT) surveys. The V8 system is capable of capturing natural electromagnetic fields within a frequency range of 0.35 Hz to , enabling deep subsurface exploration. The fieldwork involved three main stages: site selection, electrode deployment, and data acquisition.
Fig. 2. Geological map of the Yongxin gold deposit. (The figure is generated using CorelDraw X9 (http://www. coreldraw.com/cn/) by Jun Chen).
Site selection and electrode deployment. The survey area covered approximately 100 km 2 in the Yongxin gold mining region. A total of 25 east-west oriented survey lines were established, spaced 500 m apart, with measurement points positioned every 200 m along each line. This configuration yielded 1012 measurement points (Fig. 2). A cross-shaped electrode array was utilized, with an azimuth error margin of no more than to ensure accurate orientation. The electrode spacing was set to 50 m for optimal signal resolution.
Data acquisition. A multi-station synchronous observation method was adopted, allowing simultaneous data collection at multiple measurement points . Each station recorded both electric (Ex, Ey) and magnetic (Hx, Hy ) field components. The sampling frequency was adjusted based on the target depth, with higher frequencies (e.g., ) for shallow structures and lower frequencies (e.g., 0.35 Hz ) for deeper exploration. The data acquisition time at each station was set to 2 h to ensure sufficient signal-to-noise ratio.
Data processing and inversion. Processed data were inverted in the Reservoir Geophysics Inversion System (RGIS), a comprehensive software package used for geophysical inversion and modeling. The inversion parameters included a starting model with a homogeneous half-space resistivity of and a maximum iteration number of 100 . The final resistivity models were validated through comparison with known geological structures and borehole data.The detailed data processing methods refer to the research conducted by Regean Pitiya et al. .
Quality control. The resistivity measurements exhibited a relative error of in the transverse electric (TE) mode and in the transverse magnetic (TM) mode, demonstrating the high quality and reliability of the collected data. The consistency between the TE and TM modes further confirmed the robustness of the results .

Result

Physical properties

This study collected rock samples and analyzed their electrical properties, density, and magnetic susceptibility, which reflect the physical characteristics of the rocks in the study area (Table 1). The findings reveal distinct variations in these properties among different rock types.
Intrusive rocks generally exhibit high resistivity values . Notably, the Middle Ordovician diorite shows a wide resistivity range from 436.3 to . The Late Carboniferous granitic mylonite has an average resistivity of , while the Late Carboniferous monzonitic granite and syenite granite demonstrate similarly high resistivity anomalies. The resistivity of Middle Jurassic granodiorite varies between 3435.4 and , averaging at . Sandstones from the Luohe Formation strata also present high resistivity anomalies, ranging from 706.5 to .
In contrast, volcanic rocks like the andesite of the Longjiang Formation, the intermediate-acid tuff of the Jiufengshan Formation, and the rhyolite of the Guanghua Formation display medium-low resistive anomalies with average resistivities of , and , respectively. However, the Ganhe Formation basalt shows a high resistivity anomaly, averaging at .
Regarding magnetic susceptibility, the Middle Ordovician diorites have the strongest magnetic susceptibility with an average of , followed by the Late Carboniferous monzonitic granites at . The Late Carboniferous granitic mylonites show the weakest magnetic susceptibility at . Both the Middle Jurassic granodiorites and the Late Carboniferous syenogranites exhibit similarly low magnetic susceptibility rates, averaging around .
Among the stratigraphic layers, the Luohe Formation sandstones have low magnetic susceptibility rates, while the intermediate-acid tuff of the Jiufengshan Formation and the rhyolite of the Guanghua Formation display weak magnetic susceptibility anomalies. The Ganhe Formation basalt has the highest magnetic susceptibility rate, varying from 387.0 to .
Density measurements indicate medium to low-density anomaly characteristics for the rocks. The Middle Ordovician diorites are the densest among the intrusive rocks with an average density of , whereas the andesites of the Longjiang Formation have the lowest density at . The sandstone of the Luohe Formation also has a low density, similar to the Longjiang Formation.
Type Lithology Resistivity ( ) Magnetic susceptibility (10-5 SI) Density ( )
Variation range Average value Variation range Average value Variation range Average value
Intrusive rock Middle Jurassic granodiorite 3435.4-14,977.9 5178.4 80.0-357.0 224.5 2.4-2.8 2.6
Late Carboniferous monzonitic granite 1183.5-25,096.5 5880.8 42.0-772.0 431.8 2.4-2.7 2.6
Late Carboniferous Syenogranite 343.7-33,232.7 5921.8 20.0-480.0 223.0 2.4-2.6 2.6
Late Carboniferousgranitic mylonite 1922.9-8214.9 4090.3 4.0-299.0 35.4 2.3-2.7 2.5
Middle Ordovician diorite 436.3-20,533.5 6118.2 27.0-2564.0 1031.2 2.5-2.9 2.7
Stratum Ganhe Formation basalt 83.5-57,754.7 5773.6 387.0-2059.0 865.0 2.1-2.7 2.6
Guanghua Formation rhyolite 888.5-4826.0 2857.3 13.0-554.0 145.6 2.1-2.7 2.5
Jiufengshan Formation intermediate-acid tuff 118.4-5877.9 1485.7 40.0-235.0 100.6 2.3-2.9 2.6
Longjiang Formation andesite 795.7-3745.7 1875.7 2.08-2.63 2.4
Luohe Formation sandstone 706.5-31,699.2 5400.3 12.0-481.0 88.2 2.2-2.6 2.4
Table 1. Physical properties of rocks in the study area.
The significant variations in electrical properties, magnetic susceptibility, and density among the main rocks and stratigraphic layers provide a crucial basis for identifying strata and rock bodies . These findings suggest that the region possesses the necessary physical properties for effective gravimetric, magnetic, and electrical exploration.

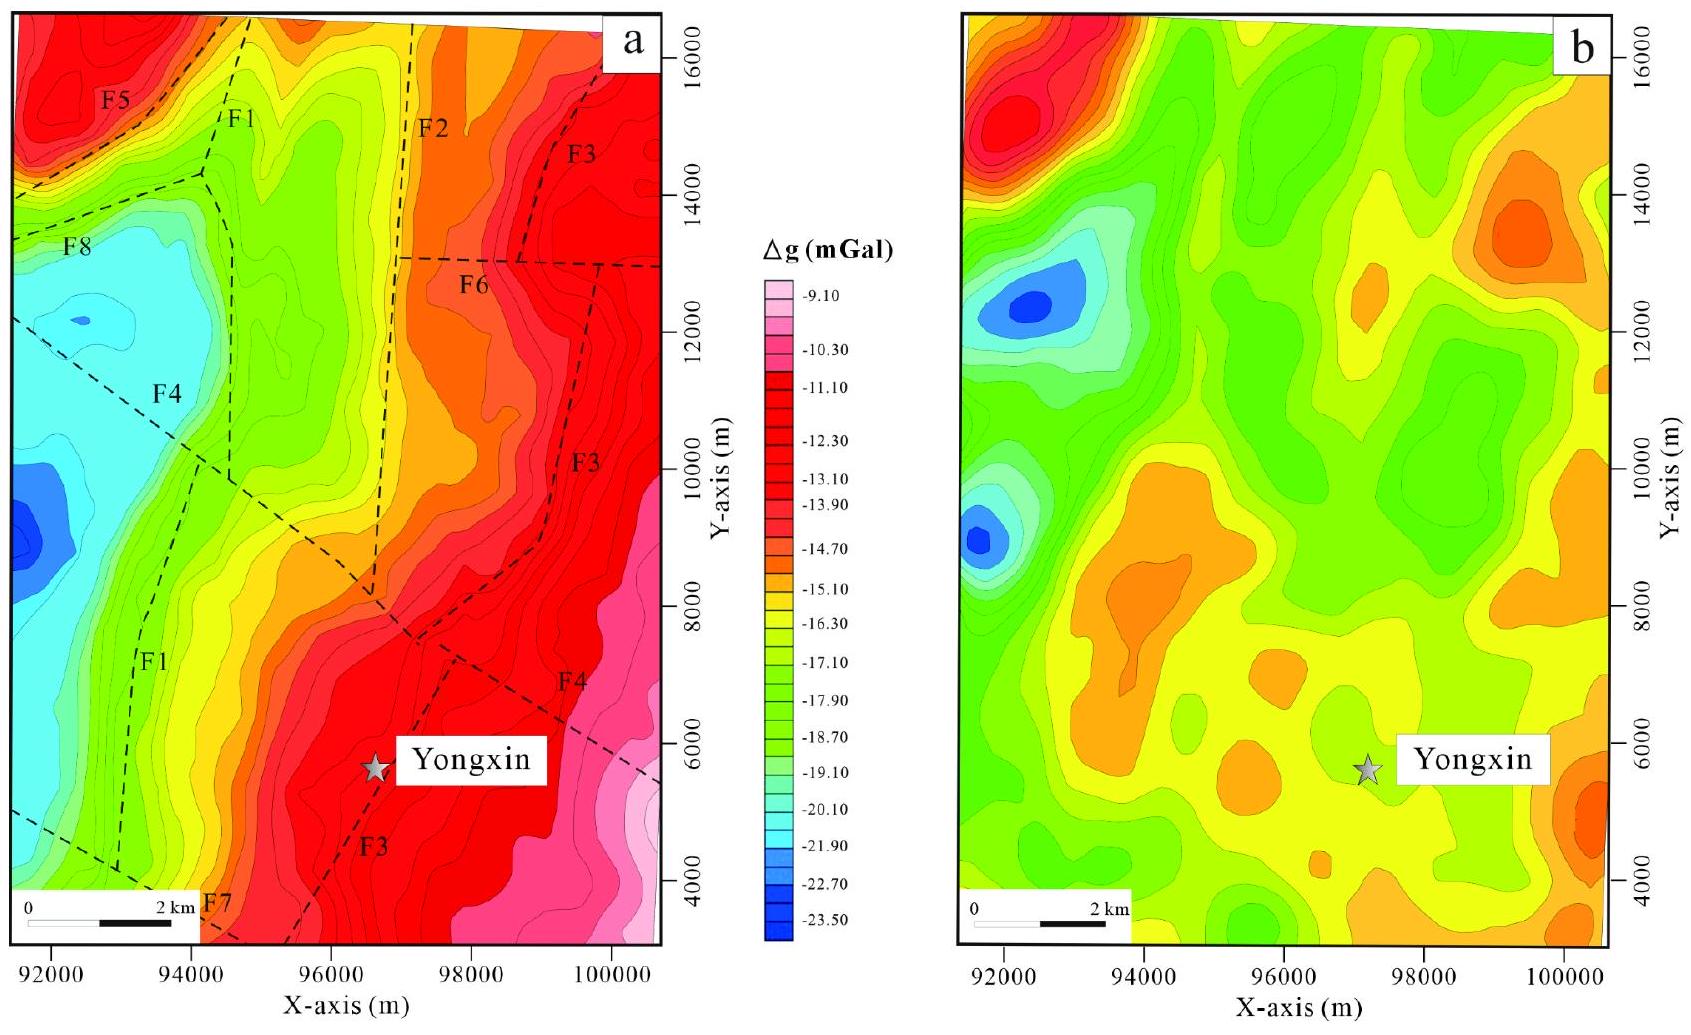
Regional gravity anomaly characteristics

The gravity anomalies observed in the study area typically manifest as higher values in the southeast and lower values in the west, with a range of intensities spanning from -32 to . These anomalies predominantly align in a northwest direction, echoing the geological structural patterns prevalent in the entire region. Through rigorous analysis and interpretation of various datasets, including isogonic line distributions and gravity field attributes (Fig. 3a), we have inferred the existence of eight faults. Within the local gravity field, four distinct high anomalies (labeled G1-4) and three low anomalies (labeled L1-3) have been identified. Collectively, these anomalies display irregular and discontinuous patterns of distortion, underscoring the intricate and complex nature of the crustal structure within the study area (Fig. 3b).

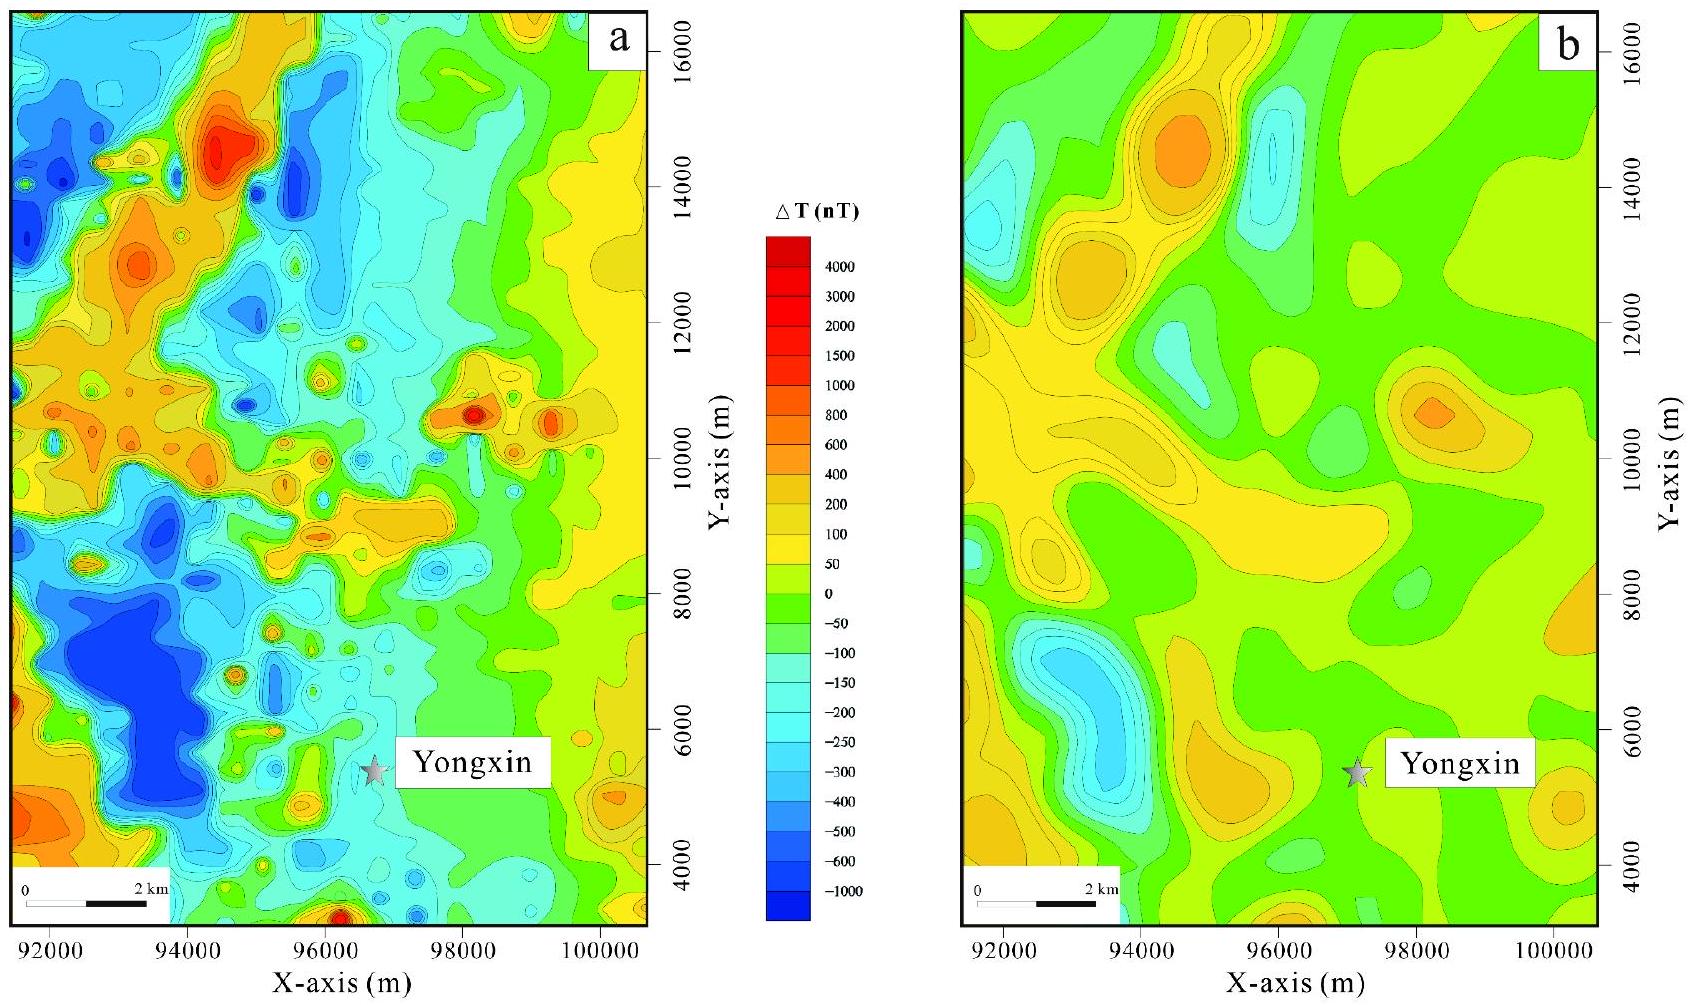
Regional magnetic anomaly characteristics

The magnetic field strength in the entire region typically falls within the range of -500 to 1500 nT . In the western part, the magnetic field exhibits a distinctive pattern of intermittent positive anomalies superimposed on a generally low and steady negative background. Prominently, there are island-like single or multi-peak positive anomalies of significant magnitude, predominantly aligned in a northeast direction. These anomalies are often associated with magnetic field values ranging from -500 to -1500 nT , which correspond to the underlying geology of Cenozoic Xishan basalt, Mesozoic Ganhe Formation, and Jiufengshan Formation volcanic rocks, primarily attributed to the basaltic rocks of the Ganhe Formation.
In contrast, the magnetic field in the eastern region exhibits a more gradual variation, with strengths fluctuating between – 50 and 50 nT . This subtle magnetic signature corresponds to geological features such as Late Carboniferous granitic mylonite and monzonitic granite (Fig. 4a). Notably, a majority of the mineralization occurrences discovered within the study area are situated in zones characterized by magnetic anomaly gradients or regions of reduced magnetic intensity. These mineralization points typically exhibit magnetic anomaly values within the range of -200 to 500 nT (Fig. 4b).

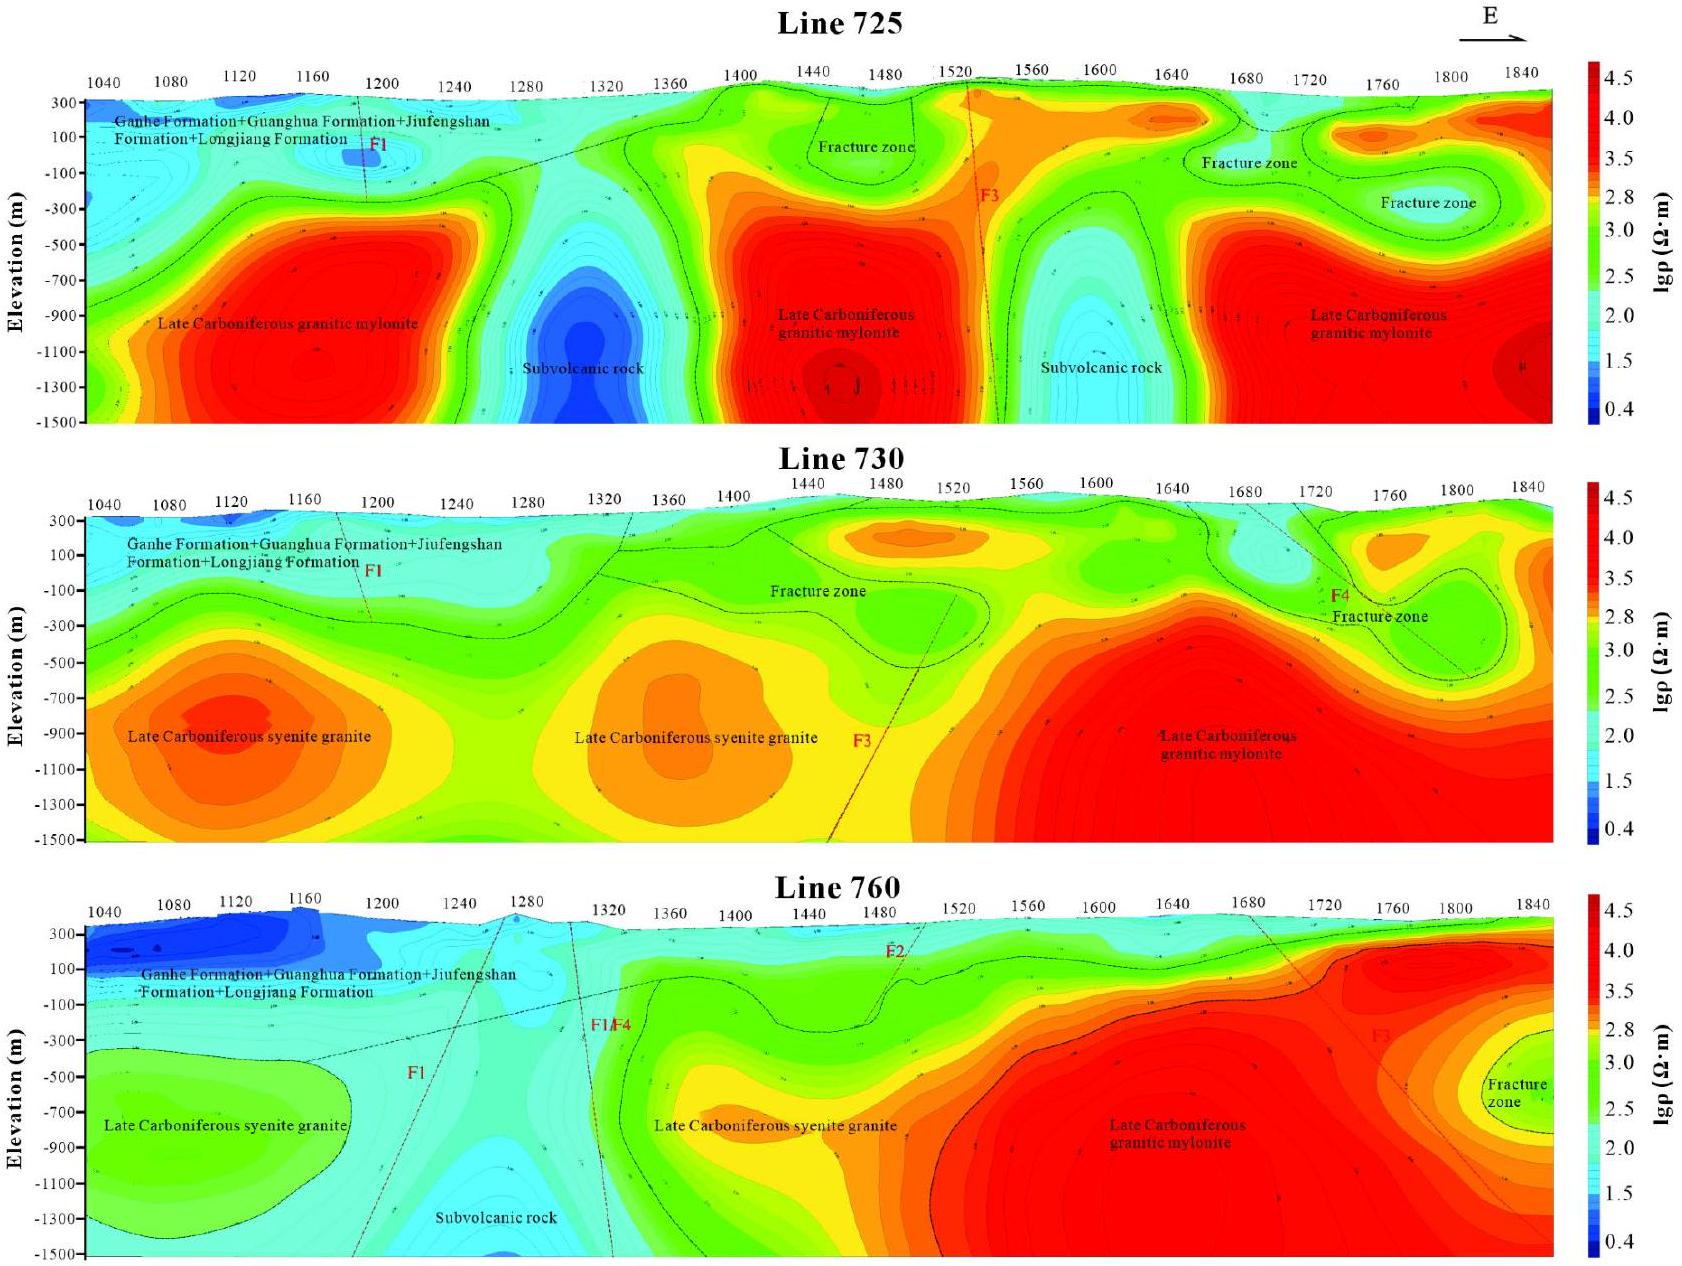
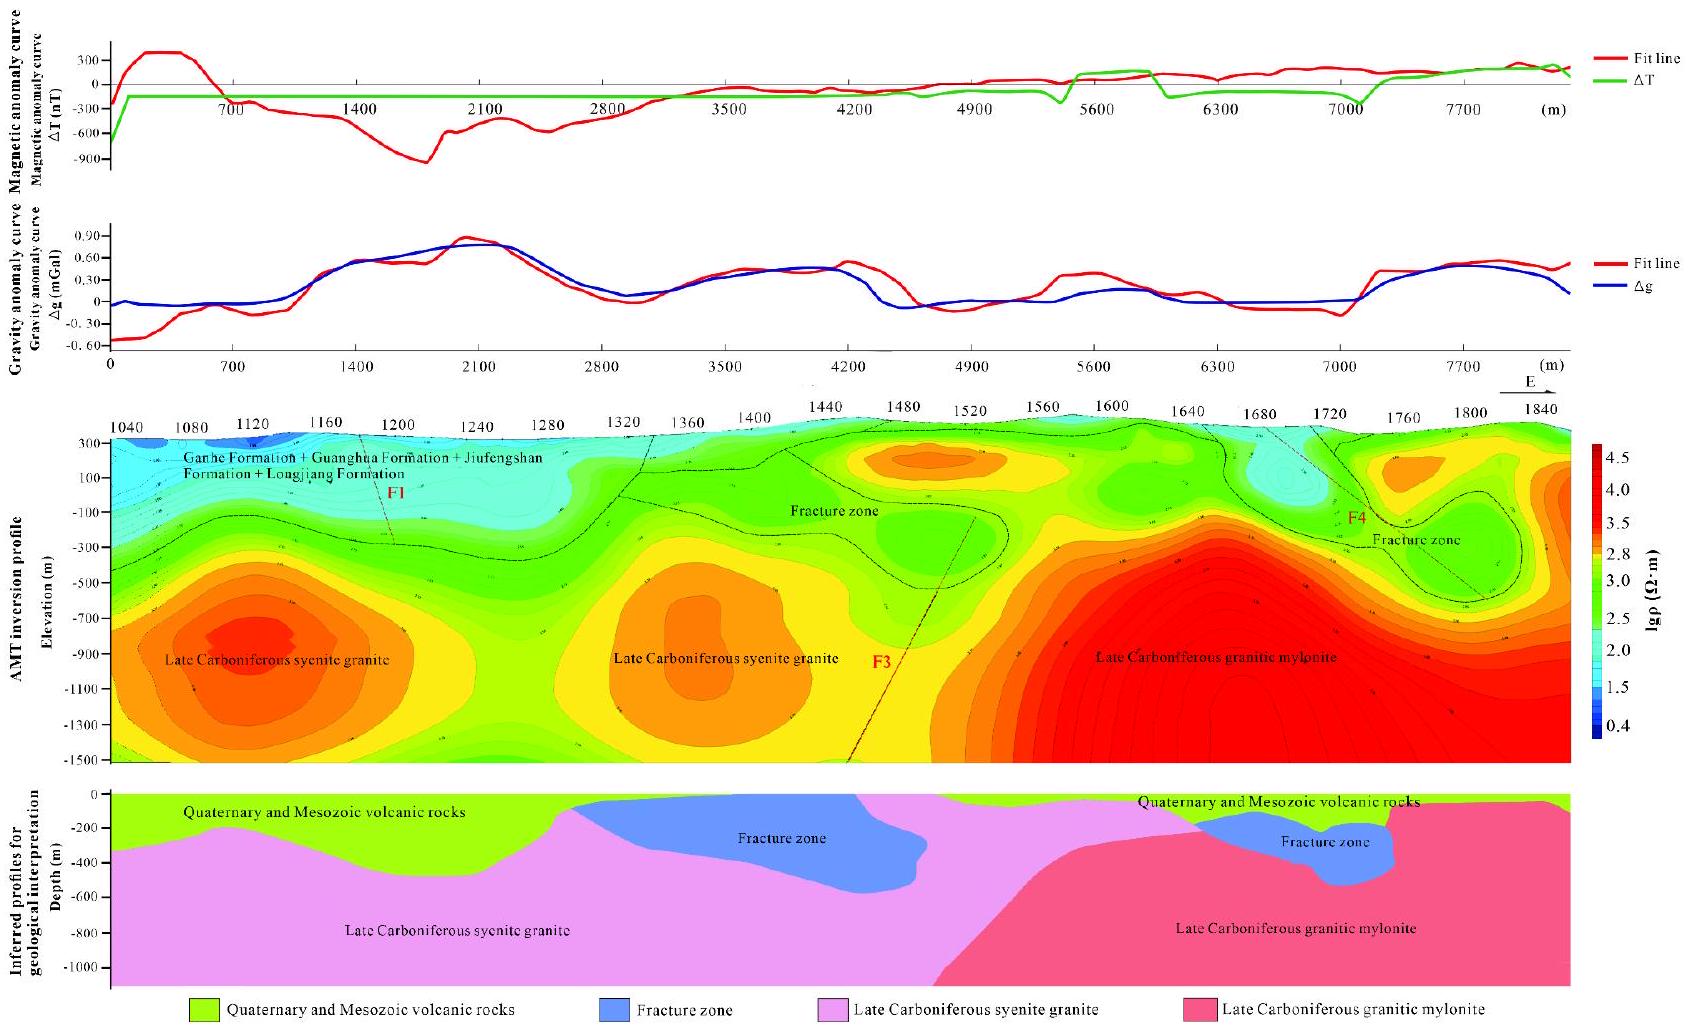
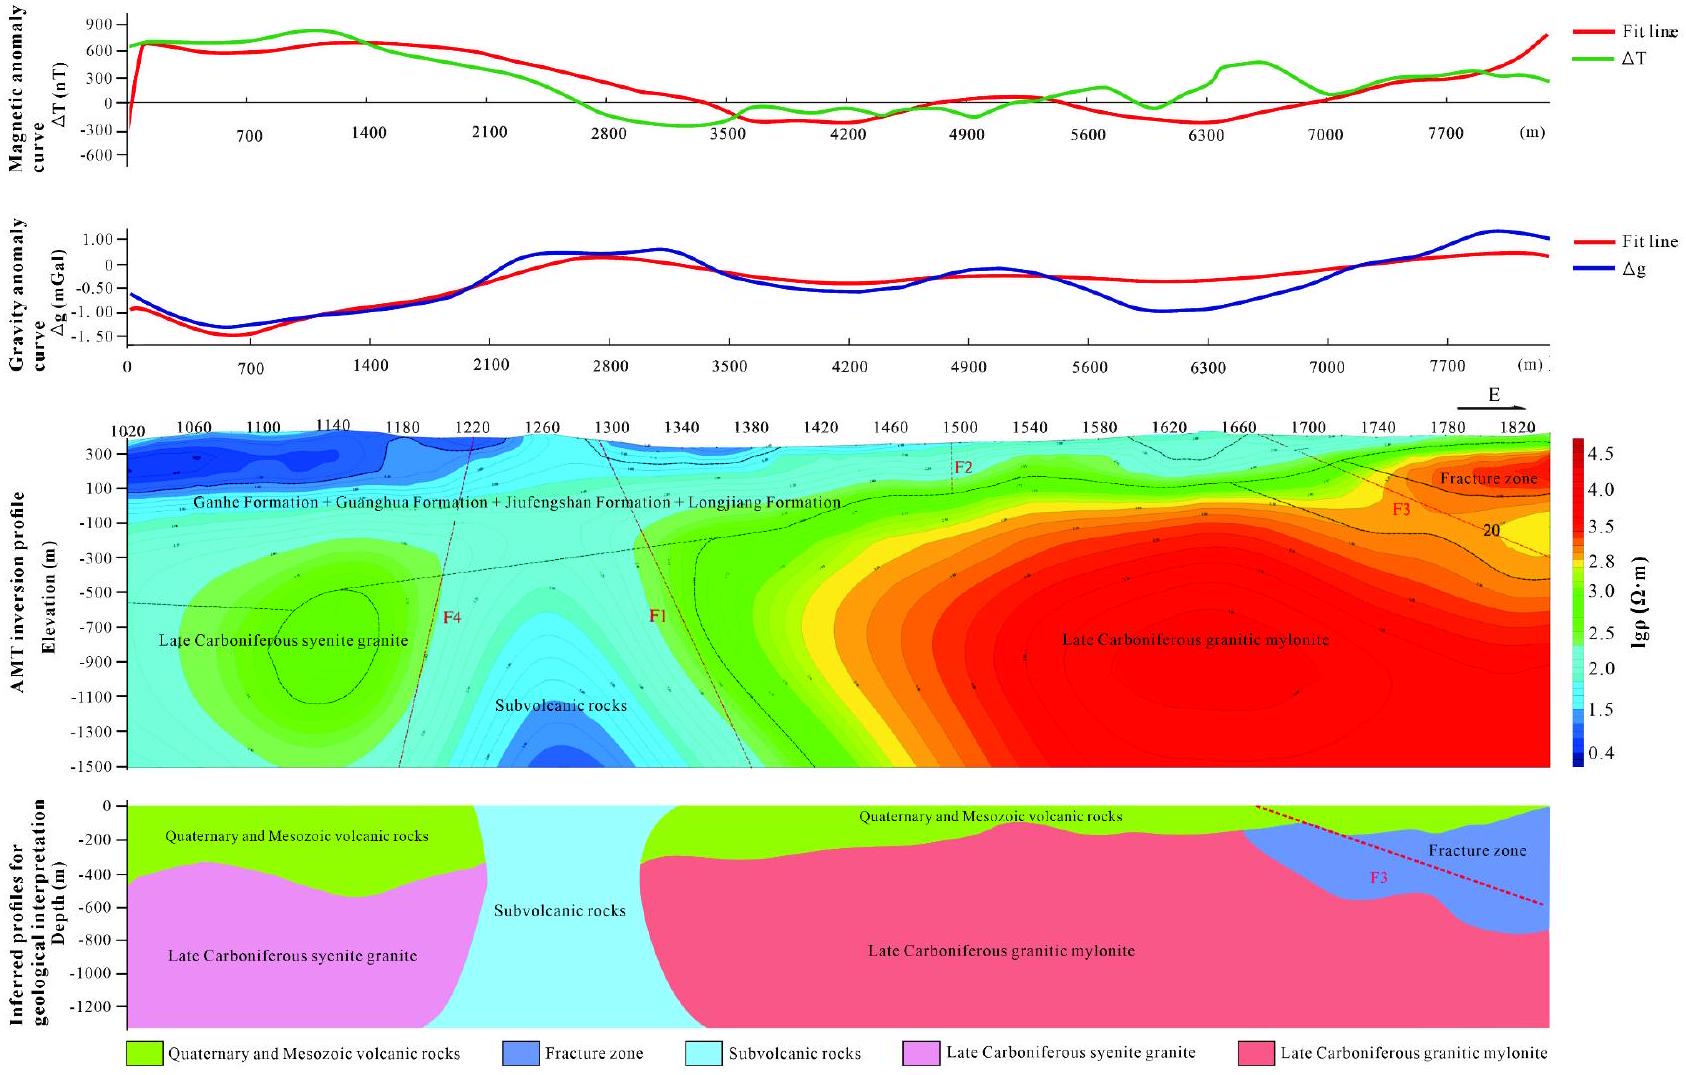
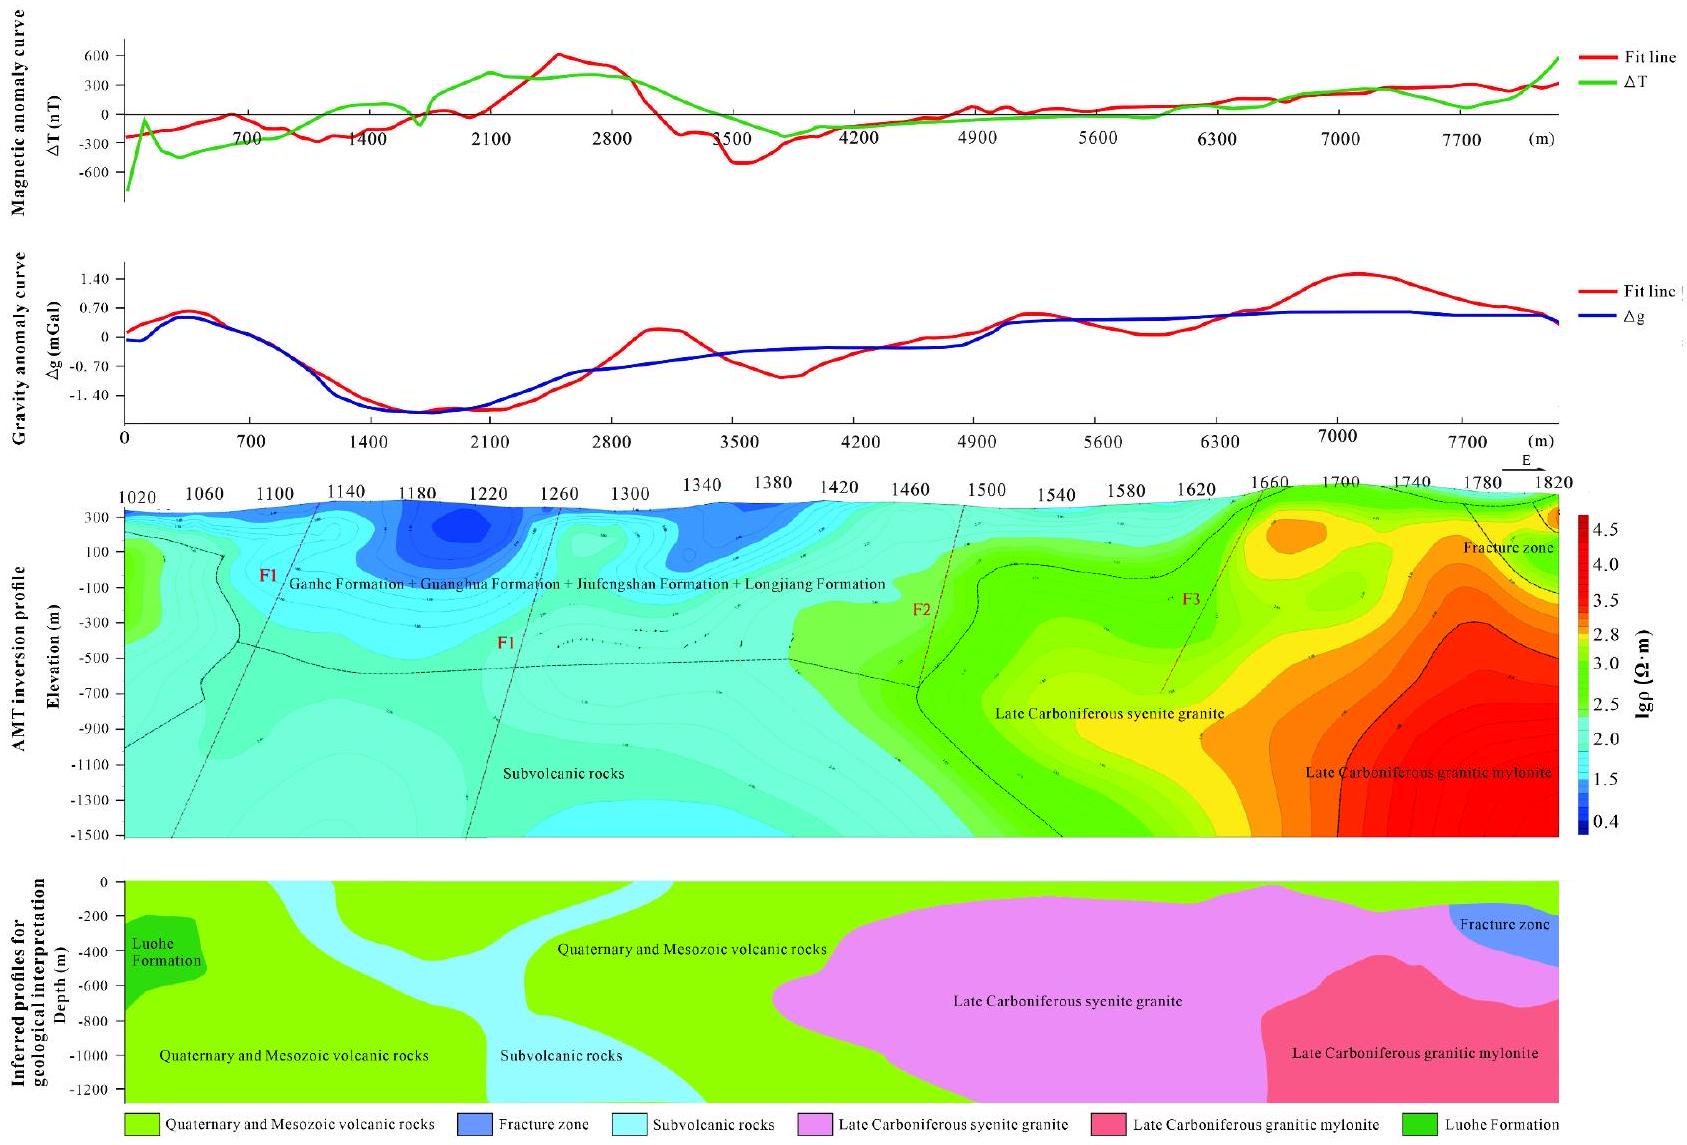
Integrated geological features of AMT profiles

This paper presents an integrated interpretation and analysis of inversion results from three representative AMT profiles, including Lines 725, 730, and 760 (Fig. 5). We chose the TE&TM inversion mode, which can
Fig. 3. Gravity anomaly map. (a) Bouguer gravity anomaly map. (b) Residual gravity anomaly map. In the figure, the different faults are denoted by the letter “F”. (The figure is generated using RGIS (https://www.cgs.go v.cn/ddztt/kydh/2016kydh/Sbzs/201609/t20160923_405162.html) by Jun Chen).
Fig. 4. Magnetic anomaly contour plan. (a) Regional magnetic anomaly contour plan. (b) local magnetic anomaly contour plan. (The figure is generated using RGIS (https://www.cgs.gov.cn/Ddz.tt/kydh/2016kydh/Sbz s/201609/t20160923_405162.html) by Jun Chen).
effectively reduce the influence of 3D distortion, better distinguish the strata, and identify the spatial distribution characteristics of fault structures. Given the relative nature of high and low resistivity, a threshold of is set as the dividing line between the two, based on statistical data from the work area’s rock electrical properties and prior experience.
Line 725 traverses the southern portion of the study area. The resistivity profile indicates that, apart from the section between points 1800 and 1860, all other areas near the surface exhibit layers of varying low resistivity, ranging from 20 to . By correlating geological maps and available data, it is deduced that these nearsurface low-resistivity layers are primarily attributed to low flood plain accumulations, weathered rock crusts, and strata from the Ganhe and Jiufengshan Formations. In the profile of Line 725, a distinct contrast between high and low resistivities is observed in the middle to lower sections, delineated by a clear boundary. Notably, the high-resistivity layer is segmented into three parts by two distinct low-resistivity zones. Specifically, points 1260 to 1360 and 1560 to 1640 mark two vertical low-resistivity areas. The former zone extends to the surface, likely due to subvolcanic rocks from the Ganhe Formation. The latter zone, however, remains subterranean, with localized high resistivity appearing above. This suggests that the low-resistivity area is caused by subvolcanic rocks, while the high resistivity above may result from fractured granitic mylonite within the high-resistivity layer (Fig. 5).
Line 730, also located in the southern part of the study area, exhibits predominantly low resistivity near the surface. The absence of this layer between points 1760 and 1820 is hypothesized to be due to a thin weathered crust exposing the underlying granitic mylonite. At a depth corresponding to point 1480, a gold ore body is exposed at the contact between syenogranite and granitic mylonite. Another gold ore body is visible in the low-resistivity zone at point 1670 . Given that gold alone does not produce a low-resistivity response unless accompanied by significant amounts of other polymetallic minerals, combined with drilling and geological data, it is postulated that the observed low resistivity is primarily attributed to the weathered crust. Consequently, areas within and along the edges of high-resistivity layers, where low-resistivity zones and trends emerge, are identified as prime targets for future mineral exploration (Fig. 5).
Line 760 is situated in the heart of the study area, exhibiting a distinct resistivity gradient that increases from west to east. Between points 1020 and 1320, a low-resistivity layer is evident in the western segment. This layer is postulated to arise from the thicker sedimentary strata belonging to the Ganhe and Guanghua Formations close to the surface. Deeper down, it is conjectured that the Luohe Formation strata contribute to this low resistivity. A notable high-resistivity trend (ranging from 352 to ) emerges in the lower strata of the 1020 to 1120 cross-section, likely attributable to the presence of syenogranite. Furthermore, the exceptionally high resistivity observed between points 1440 and 1840 (spanning from 6310 to ) is believed to stem from granitic
Fig. 5. AMT resistivity cross-sectional diagram and inferred interpretation diagram of Line 725, Line 730 and Line 760. In the figure, the different faults are denoted by the letter “F”. The top axis of the middle plot represents the measurement point number. (The figure is generated using RGIS (https://www.cgs.gov.cn/Ddztt/ kydh/2016kydh/Sbzs/201609/t20160923_405162.html) by Jun Chen).
mylonite. In the middle of the farthest eastern section, a semicircular area displaying a low-resistivity trend is thought to result from rock disintegration (Fig. 5).
Drawing from the electrical traits exhibited across these three profiles, we can deduce the following from the AMT data in this region: The low-resistivity layer close to the surface likely originates from deposits associated with low-lying river floodplains, weathered rock crust, as well as strata from the Ganhe Formation, Longjiang Formation, Jiu Fengshan Formation, and other Mesozoic volcanic layers. On the other hand, the high-resistivity zones are primarily made up of syenogranite and granitic mylonite. The interior sections of these zones exhibit medium to low resistivity, indicating the possible existence of magmatic vents.

Discussion

The joint inversion of gravity, magnetic, and electrical data

The joint geophysical inversion method utilizes multiple physical parameters and various types of geophysical data for mutual constraint, which can effectively improve the accuracy of inversion results . Utilizing the powerful inversion simulation capabilities of the RGIS software, we imported the actual exploration data to generate measured lines. By incorporating constraints such as geological conditions, rock physical properties, and drilling data, we continuously adjusted fault locations, rock mass ranges, and shapes to optimize the AMT initial model. These zoned models result from an interactive 2D modelling of gravity and magnetic data constrained by the two-dimensional distribution of the electrical resistivity obtained from the 2D inversion of AMT data. This optimization process aimed to achieve the best fit between the theoretical anomalies generated by the model and the measured anomalies, minimizing the mean square error of the simulation results. During the fitting process, we developed a clear understanding of the structural development, lithology, and stratigraphic conditions of the study area. This approach ensured that we did not overly pursue fitting to the observed data, preventing the loss of fundamental geological significance in the obtained model.This iterative optimization of the initial model
ensures optimal parameter fitting for both theoretical and measured anomalies, while the mean square error of the simulation results meets our target requirements .
This study conducted a gravity survey spanning and high-magnetic profile measurements along lines 730, 765, and 795 (Fig. 2). Given the significant spacing between profile lines, the study primarily relied on profile interpretations, using the plane anomalies only as a reference.
During the inversion process, the majority of the magnetic profile measurements were obtained in volcanic rock regions where magnetic field fluctuations are pronounced, posing challenges for quantitative inversion . To enhance the inversion’s accuracy and quality, this study incorporated constraints from the bedrock depth and undulating features deduced from the AMT profiles. A joint gravity-magnetic and electrical inversion interpretation was performed for the three high-magnetic profile lines, including those with AMT profiles.
For line 730, the eastern section exhibited a higher magnetic field compared to the western section, with a consistently positive magnetic field in the east and an opposing field in the west. The geological map attributed this to Carboniferous granite in the east and the Mesozoic Cretaceous Jiufengshan Formation in the west. The gravity field along this line followed a similar trend, with higher values in the east and lower in the west. A prominent gravity bulge was observed around the 1190 -point mark in the west.
Inversion results revealed that the profile’s lower section comprises granite, specifically granitic mylonite in the east and Syenogranite in the west. A thin layer of the Jiufengshan Formation and Quaternary cover rests above the orthoclase granite in the west, while the granitic mylonite in the east is predominantly exposed at the surface (Fig. 6).
By analyzing the anomalous characteristics of various gravity and magnetic profiles, along with electrical sounding profiles, the inversion results were extrapolated across the entire study area. This comprehensive approach facilitated the inference of the complete stratigraphic distribution within the study region.
Line 765, akin to line 730, displays a magnetic field that is stronger in the west and weaker in the east. The western magnetic field shows mild variations and local sawtooth patterns, mostly positive. The gravity and magnetic inversion section reveals that the syenite granite lies somewhat deeper, and the Quaternary and Mesozoic volcanic rock cover has thickened, reaching a maximum depth of approximately 500 m in the west. A notable difference from line 730 is that line 765 features a low magnetic value depression and a prominent high gravity value bulge between points 1220 and 1300 in the west. This corresponds to the subvolcanic rocks indicated on the geological map (Fig. 7).
In comparison to line 765, the cover in the eastern section of line 795 has increased in thickness. The western part of the line showcases the emergence of the Luohe Formation and subvolcanic rocks, where the Luohe Formation appears in the form of xenoliths. The magnetic field is predominantly negative in the west, while
Fig. 6. The joint inversion of gravity, magnetic and electrical information of Line 730. In the figure, the different faults are denoted by the letter “F”. The top axis of the middle plot represents the measurement point number. (The figure is generated using RGIS (https://www.cgs.gov.cn/Ddztt/kydh/2016kydh/Sbzs/201609/t201 60923_405162.html) by Jun Chen).
Fig. 7. The joint inversion of gravity, magnetic and electrical information of Line 765. In the figure, the different faults are denoted by the letter “F”. The top axis of the middle plot represents the measurement point number. (The figure is generated using RGIS (https://www.cgs.gov.cn/Ddztt/kydh/2016kydh/Sbzs/201609/t201 60923_405162.html) by Jun Chen).
it tends to flatten out in the east. There is a significant gravity dip from points 1140 to 1220 , which aligns with sedimentary rock strata. From point 1260 eastward, gravity progressively rises, correlating with intrusive rocks (Fig. 8).
Liang et al. speculated in their halo geochemistry study that further prospecting efforts should focus on the northwest of the Yongxin gold mine . While Li et al. concluded that the deep regions of the northwestern area under study possess mineralization potential . In light of these findings, this paper integrates gravity, magnetic, and electrical data interpretation with the geological context of the study area to derive a comprehensive understanding of the geological-geophysical features of the entire region.
The Late Carboniferous Syenogranite primarily emerges in the central-western and northeastern sections of the mining area, displaying a general northeast orientation and an irregular stock-like appearance. The upper portions of this rock formation are concealed by volcanic rocks belonging to the Guanghua Formation, and the western segment is intruded by Late Carboniferous granitic mylonite. Fracture zones are prevalent throughout the area, typically extending in a northeasterly direction, resulting in a zonal spatial distribution pattern characterized by a discontinuous block-like arrangement of subducted volcanic rocks.
Additionally, the Upper Ordovician Luhe Formation predominantly occurs in the northeastern segment of the study region, exhibiting a generally transgressive rhythmic pattern from its base towards the top. The base of this formation conforms to the adjacent Duobaoshan Formation, while its upper layers are overlaid by Mesozoic volcanic rocks, specifically comprising the Lower Cretaceous Ganhe Formation, Guanghua Formation, and Jiufengshan Formation.
By synthesizing geological and geophysical data, this study provides valuable insights into the complex geological setting encompassing multiple rock formations, fracture zones, and intrusive events, all of which hold significance in terms of the mineralization potential identified by preceding research.
Simultaneously, the distribution of fracture structures within the study area has undergone thorough inference and analysis, revealing the presence of eight fractures. These fractures primarily align in northwest, northeast, north-south, and near east-west directions. Notably, the northeast and northwest fractures constitute two regional, deep, and extensive fracture structures. The northeast fractures appear sparse and gently undulating, while the northwest fractures generally exhibit characteristics of tensile (torsional) fracture structures.
Drawing from the aforementioned interpretive results, a geological-geophysical model has been established. This model underscores that the gravity, magnetic, and electrical anomalies observed at the contact zones between Late Carboniferous orthoclase granite and granitic mylonite align precisely with the locations of typical
Fig. 8. The joint inversion of gravity, magnetic and electrical information of Line 795. In the figure, the different faults are denoted by the letter “F”. The top axis of the middle plot represents the measurement point number. (The figure is generated using RGIS (https://www.cgs.gov.cn/Ddztt/kydh/2016kydh/Sbzs/201609/t201 60923_405162.html) by Jun Chen).
mineral deposits. This finding suggests that the integrated geophysical information constraint inversion method possesses a certain degree of referentiality and feasibility.
To further pinpoint specific exploration targets, the Creatar XModeling 3D geological modeling software has been employed to build a three-dimensional geological model of the study area (Fig. 8). This model achieves a transparency of deep geological bodies, providing an enhanced understanding of the subsurface geology and aiding in the identification of potential mineral resources.

Analysis of favorable conditions for mineralization

This study conducted a comprehensive analysis of the geological-geophysical model (Fig. 9) of the Yongxin gold mining area, identifying key favorable conditions (Table 2) for mineralization and constructing an integrated ore-finding model. We combined a three-dimensional geological model with various geophysical methods, including gravity, magnetic, and electromagnetic surveys, to conduct a detailed assessment of the mineralization potential in the deep part of the mining area.
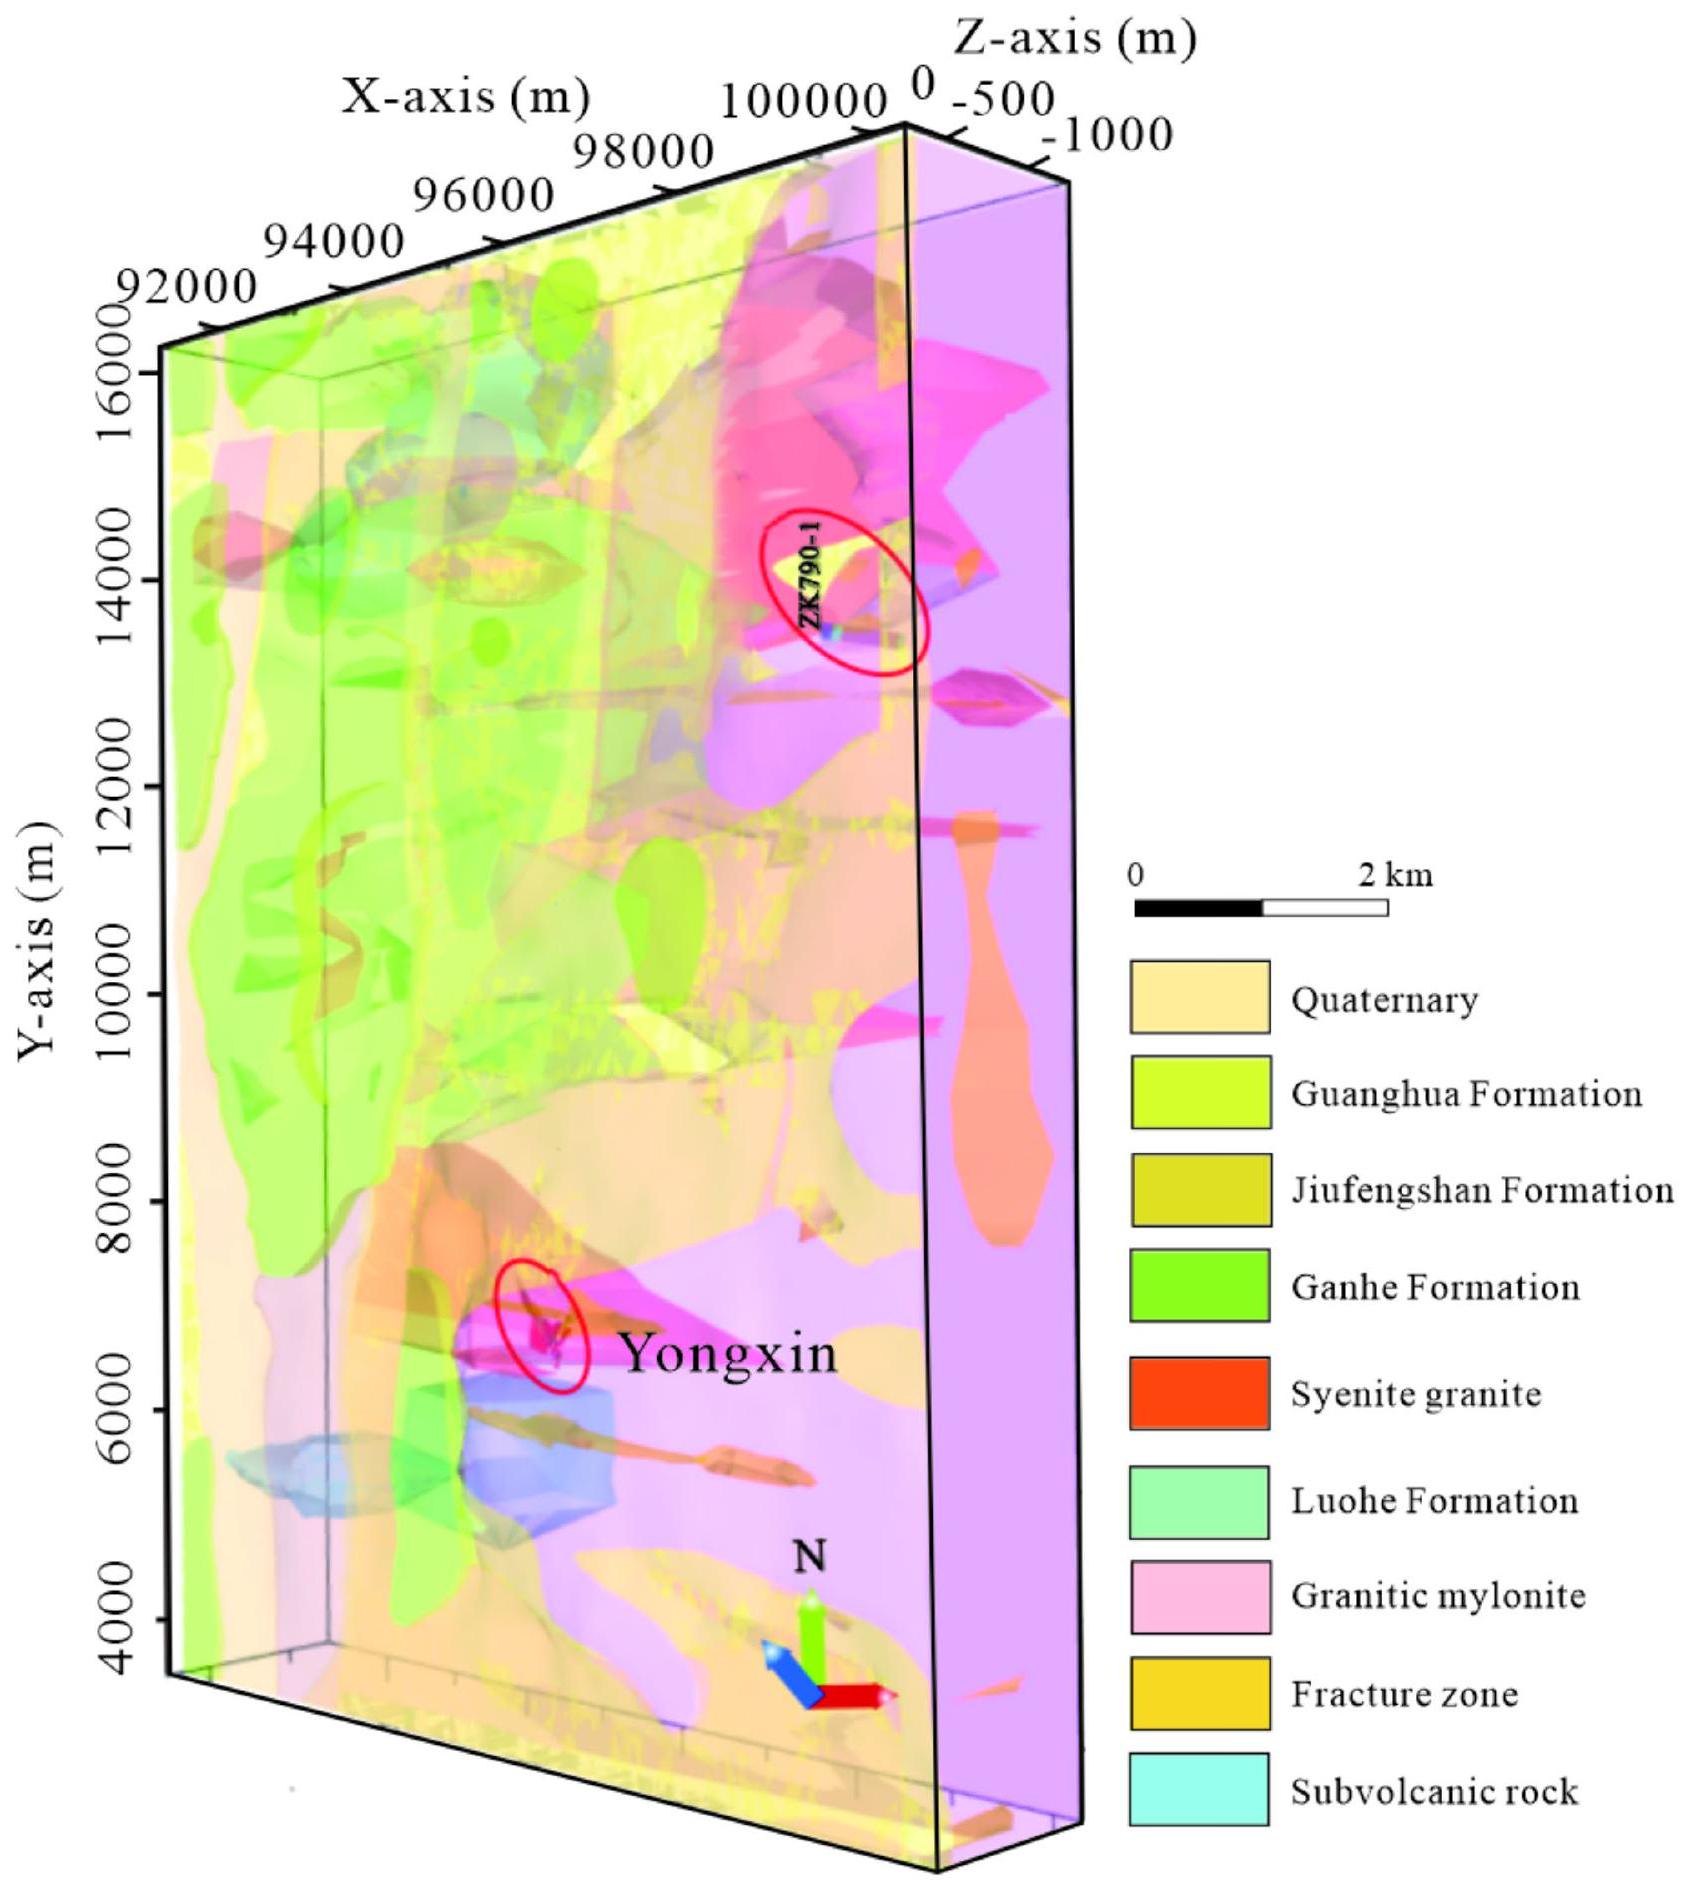
(1) Geological conditions. The geological-geophysical model of our study area reveals strata spanning the Cenozoic, Mesozoic, and Paleozoic eras. The Cenozoic and Mesozoic strata, including river alluvium and formations like Guanghua, Longjiang, Ganhe, and Jiufengshan, serve as cover layers
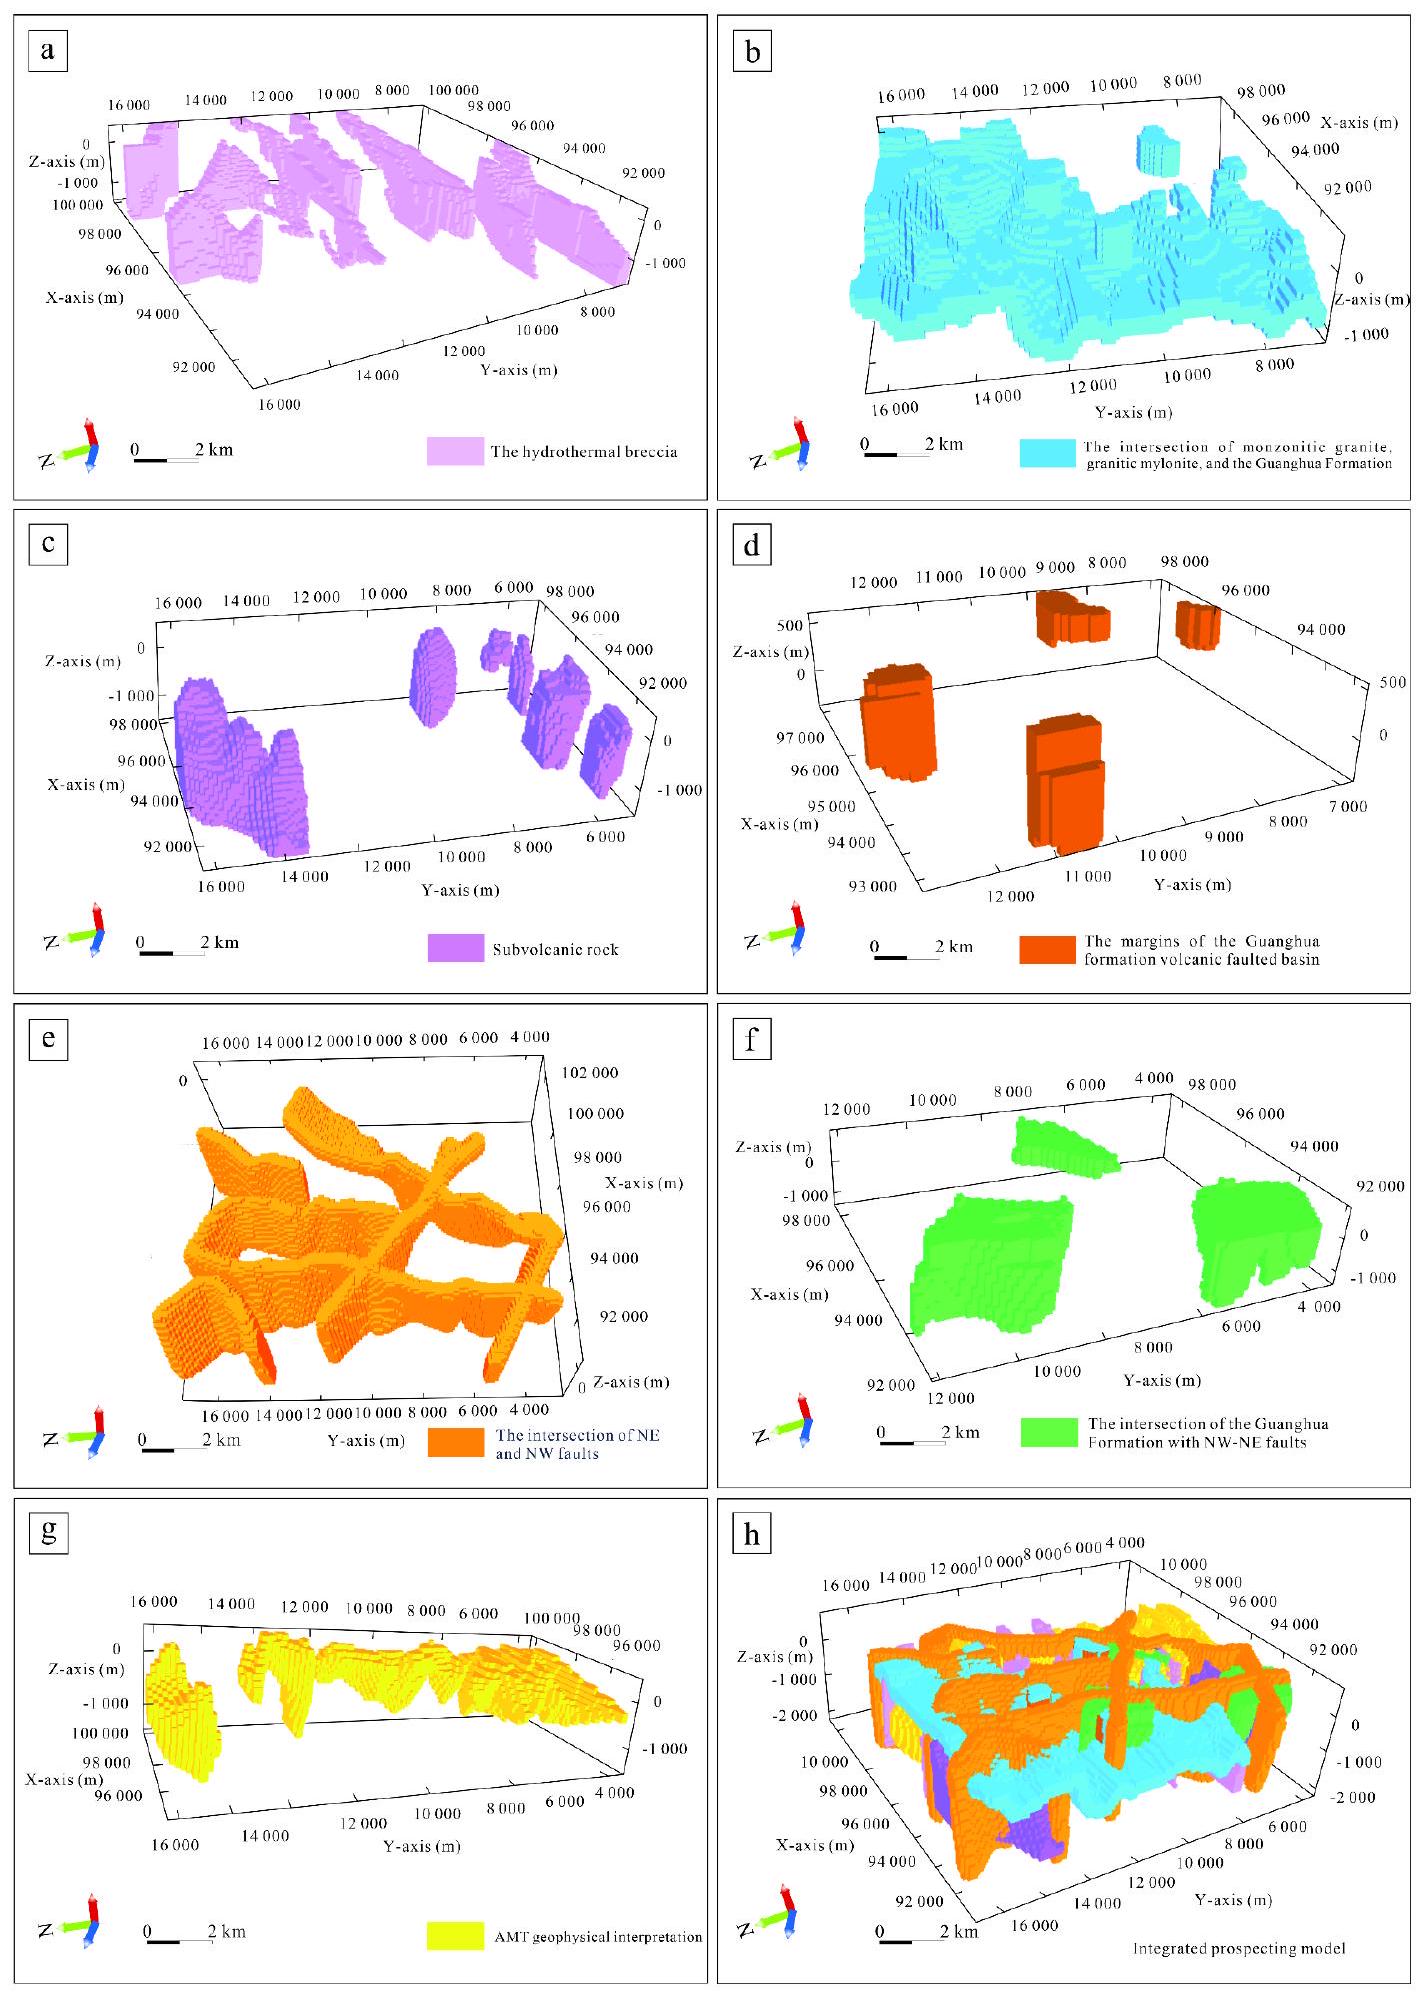
 . The Paleozoic strata consist primarily of the Duobaoshan, Luohe, Niqiuhe, and Yaosangnan formations.
Significant geophysical anomalies are observed at the contact zones between Late Carboniferous syenogranite and granitic mylonite, specifically within the Mesozoic Guanghua formation. These anomalies suggest that the hydrothermal breccia (Fig. 9a) located around these contacts is a potential ore body site. Furthermore, the intersection of these rock types emerges as a promising mineralization zone.
In addition, the Yongxin gold deposit lies at the periphery of an Early Cretaceous volcanic basin , characterized by vast exposures of volcanic and subvolcanic rocks. Gold mineralization is spatially associated with subvolcanic masses and the marginal zones of this volcanic basin (Fig. 9b, c, d), indicating a close relationship between volcanism and gold mineralization.
Fig. 9. Favorable factors for mineralization and integrated prospecting model. (a) Hydrothermal breccia. (b) The intersection of monzonitic granite, granitic mylonite, and the Guanghua Formation. (c) Subvolcanic rock. (d) The margins of the Guanghua Formation volcanic faulted basin. (e) The intersection of NE and NW faults. (f) The intersection of the Guanghua Formation with NW-NE faults. (g) AMT geophysical interpretation. (h) Comprehensive mineral prospecting model. (The figure is generated using micromine (https://www.wiseminet ech.com/) by Jun Chen).
Types of mineral deposit Favorable factors for mineralization Feature variables
Epithermal gold deposit Favorable geological features The hydrothermal breccia (Fig. 9a)
The intersection of monzonitic granite, granitic mylonite, and the Guanghua Formation (Fig. 9b)
Subvolcanic rock (Fig. 9c)
The margins of the Guanghua formation volcanic faulted basin (Fig. 9d)
Favorable mineralization structures The intersection of NE and NW faults (Fig. 9e)
The intersection of the Guanghua Formation with NW-NE faults (Fig. 9f)
Favorable geophysical characteristics for mineralization AMT geophysical interpretation (Fig. 9g)
Table 2. Comprehensive prospecting model for the study area.
(2) Tectonic conditions. The area features faults oriented northwest, northeast, north-south, and nearly eastwest . Deep fault structures in the northeast and northwest (Fig.9e) significantly influence mineralization, magmatic activities, and mineralization processes. The northeast-oriented faults are more prominent and characterized by compressive fracture tectonics, while the northwest-oriented faults are smaller and typically exhibit tensile fracture characteristics.
A higher number of gold and polymetallic ores are primarily associated with the Guanghua Formation and these faults (Fig. 9f). Mineralization anomalies and hydrothermal alteration sites have developed at their intersections, indicating a close spatial correlation between gold deposits and these tectonic structures.
(3) Geophysical conditions and integrated prospecting model. Seven gravity anomalies were identified through gravity and magnetic surveys. These anomalies primarily occur at the contact zone between Mesozoic vol-canic-subvolcanic rocks and Late Carboniferous granodioritic cherts, observable in gradient zones or regions of low magnetic intensity.
AMT measurements reveal low rock resistivity values, corresponding to a mid-to-low resistivity gradient zone (Fig. 9g). Previous studies and our findings suggest that the mineralization site of the Yongxin gold deposit is located at a specific contact zone.
Considering all factors, we postulate that magnetic anomaly gradient zones or low magnetic field regions, combined with mid-to-low resistivity gradient zones, constitute favorable locations for mineralization. Fracture zones aligned with low-resistivity strata visible in AMT images are believed to be closely associated with mineralization processes.
Utilizing a comprehensive mineral prospecting model (Fig. 9h), we discovered that the known Yongxin gold ore body is situated within and adjacent to a hydrothermal breccia body at a specific contact zone. This integrated approach provides valuable insights for future mineral exploration efforts in the study area.

Mineralization prediction

The ore body corresponds to the favorable mineralization zone identified through the integrated interpretation of gravity, magnetism, and electrical anomalies. Additionally, the fracture zone and the junction of rock masses located northeast of the study area bear geological and geophysical resemblances to the known Yongxin gold ore body, implying a comparable mineralization context (Fig. 10). The hydrothermal breccia body, situated at the boundary between Late Carboniferous granitic mylonite and syenigranite, exhibits geophysical markers of a medium-to-low resistive gradient zone, suggesting potential mineralization at deeper levels.
To investigate this prospect, drilling hole ZK790-1 was selected for exploration. Drilling outcomes disclosed that the deeper borehole segments predominantly consist of strongly silicified granodioritic mylonite, with intermittent occurrences of diorite-porphyrite and quartz veins. Notably, multiple mineralization layers of varying thicknesses were encountered. The concordance between the encountered rock types and thicknesses with our interpreted results underscores the efficacy of integrated geophysical interpretation techniques in metal mineral resource exploration.

Conclusions

(1) The Yongxin gold deposit is primarily controlled by north-east trending faults and is hosted within the contact zone between Late Carboniferous granitic mylonite and syenogranite. Our study precisely locates the ore bodies within the high-to-low resistivity gradient zone.
(2) This research innovatively integrates audio-frequency magnetotelluric (AMT) sounding, gravity surveys, and high-magnetic profiling, leveraging 3D modeling techniques to effectively identify lithological variations and deep ore-forming geological features within the study area. This approach demonstrates a highly efficient and comprehensive interpretation method.
(3) By constructing a 3D geological model, we have achieved “transparency” of the geological structure within a 1.5 km depth range in the study area. Combining ore-forming geological conditions with geophysical interpretation results, we have summarized the favorable mineralization conditions of the Yongxin gold mining area and developed a comprehensive ore-prospecting model. Drilling verification has successfully identified multiple mineralized zones at depth, confirming the synergy between integrated geophysical ex-
Fig. 10. 3D geological model and drilling verification location map. (The figure is generated using micromine (https://www.wiseminetech.com/) by Jun Chen).
ploration and 3D modeling, and highlighting their significant potential and application prospects in metal mineral exploration.

Data availability

The datasets generated and/or analysed during the current study are not publicly available due [REGULATORY REQUIREMENTS FOR CONFIDENTIAL DATA] but non confidential data are available from the corresponding author on reasonable request.
Received: 10 April 2024; Accepted: 25 February 2025
Published online: 01 March 2025

References

  1. Bellefleur, G., de Kemp, E., Goutier, J., Allard, M. & Adam, E. Seismic imaging of the geologic framework and structures related to volcanogenic massive sulfide deposits in the Archean Rouyn-Noranda District, Quebec Canada. Econ. Geol. 109, 103-119 (2014).
  2. Liu, S. F. et al. Adoption of a mineral system model in successful deep exploration at Erdaogou, China’s deepest gold mine, on the northeastern margin of the North China Craton. Ore Geol. Rev. 131, 104060 (2021).
  3. Han, S. et al. Integrated geophysical exploration of the coupling of a concealed rock body and metallogenic structures- mining area case study in Jilinbaolige, Inner Mongolia. China. J. Appl. Geophys. 178, 104048 (2020).
  4. Ogah, A. J. & Abubakar, F. Solid mineral potential evaluation using integrated aeromagnetic and aeroradiometric datasets. Sci. Rep. 14, 1637 (2024).
  5. Olierook, H. K. H. et al. Emplacement of the Argyle diamond deposit into an ancient rift zone triggered by supercontinent breakup. Nat. Commun. 14, 5274 (2023).
  6. Yang, J., Liu, S. & Hu, X. Inversion of high-amplitude magnetic total field anomaly: An application to the Mengku iron-ore deposit, northwest China. Sci. Rep. 10, 11949 (2020).
  7. Zhang, G. et al. Joint interpretation of geological, magnetic, AMT, and ERT data for mineral exploration in the northeast of Inner Mongolia, China. Pure Appl. Geophys. 175, 989-1002 (2017).
  8. Lahti, I., Kontinen, A. & Nykänen, V. AMT survey in the Outokumpu ore belt, eastern Finland. Explor. Geophys. 50, 351-363 (2019).
  9. Cushing, E. M. et al. Building a three dimensional model of the active Plio-Quaternary basin of Argostoli (Cephalonia Island, Greece): An integrated geophysical and geological approach. Eng. Geol. 265, 105441 (2020).
  10. Qi, G., Meng, G. X., Yan, J. Y., Tang, H. J. & Xue, R. H. Three-dimensional geological-geophysical modeling and prospecting indications of the ashele ore concentration area in Xinjiang based on irregular sections. Minerals 13, 984 (2023).
  11. Anderson, E. D. et al. Geophysical data provide three dimensional insights into porphyry copper systems in the Silverton caldera, Colorado, USA. Ore Geol. Rev. 152, 105223 (2023).
  12. Eldougdoug, A. et al. Exploring gold mineralization in altered ultramafic rocks in south Abu Marawat, Eastern Desert, Egypt. Sci. Rep. 13, 7293 (2023).
  13. Tominaga, M. et al. Multi-scale magnetic mapping of serpentinite carbonation. Nat. Commun. 8, 1870 (2017).
  14. Wang, Q. Y., Liu, H. D., Chen, J. P., Wang, L. J. & Zhu, D. C. 3D geological modeling and metallogenic prognosis of Jiaojia gold metallogenic belt in Shandong. J. Geol. 38, 412-420 (2014).
  15. Zheng, X. M., Ni, J. C., Guo, G., Fang, W. X. & Wang, H. W. Application of audio frequency magnetotelluric sounding in 3D geological modeling in Hongshishan ophiolitic melange belt Gansu. Miner. Explor. 12, 1602-1609 (2021).
  16. Wang, L. et al. Geology and genesis of the Early Paleozoic Zhengguang intermediate-sulfidation epithermal Au-Zn deposit, northeast China. Ore Geol. Rev. 124, 103602 (2020).
  17. Zhang, A. Q. et al. Lithosphere-asthenosphere interactions beneath northeast China and the origin of its intraplate volcanism. Geology 50, 210-215 (2021).
  18. Wu, F. Y. et al. The Heilongjiang Group: A Jurassic accretionary complex in the Jiamusi Massif at the western Pacific margin of northeastern China. Island Arc 16, 156-172 (2007).
  19. Gong, M. Y., Tian, W., Fu, B., Wang, S. Y. & Dong, J. L. Zircon Hf-O isotopic constraints on the origin of Late Mesozoic felsic volcanic rocks from the Great Xing’an Range, NE China. Lithos 308, 412-427 (2018).
  20. Zhang, L. S. et al. Petrogenesis and tectonic settingof granitoids in the Fuanpu molybdenum deposit, Lesser Xing ar-Zhangguangcai range metallogenic belt: Constraints from element geochemistry, zircon U-Pb geochronology and Sr-Nd-Hf isotopes. Acta Geol. Sin. 95, 2471-2492 (2021).
  21. Shu, Q. H., Chang, Z. S. & Mavrogenes, J. Fluid compositions reveal fluid nature, metal deposition mechanisms, and mineralization potential: An example at the Haobugao Zn-Pb skarn, China. Geology 49, 473-477 (2021).
  22. Mao, J. W. et al. Mesozoic large-scale metallogenic pulses in North China and corresponding geodynamic settings. Acta Petrol. Sin. 21, 171-190 (2005).
  23. Xu, M. J., Xu, W. L., Wang, F., Gao, F. H. & Yu, J. J. Geochronology and geochemistry of the Early Jurassic granitoids in the central Lesser Xing’an Range, NE China and its tectonic implications. Acta Petrol. Sin. 29, 354-368 (2013).
  24. Shu, Q. H. et al. Regional metallogeny of Mo-bearing deposits in northeastern China, with new Re-Os dates of porphyry Mo deposits in the northern Xilamulun district. Econ. Geol. 111, 1783-1798 (2016).
  25. Shu, Q. H. et al. Zircon trace elements and magma fertility: insights from porphyry (-skarn) Mo deposits in NE China. Miner. Depos. 54, 645-656 (2019).
  26. Xing, K., Shu, Q. H. & Lentz, D. R. Constraints on the formation of the giant Daheishan porphyry Mo deposit (NE China) from whole-rock and accessory mineral geochemistry. J. Petrol. 62, 1-26 (2021).
  27. Cheng, G. H. et al. Zircon U-Pb ages, Hf isotopes of the granitoids and Re-Os ages of the molybdenites in Luming molybdenum ore area, Heilongjiang Province, and its geological significance. Acta Petrol. Sin. 31, 2450-2464 (2015).
  28. Zhai, D. G. et al. The genesis of the giant Shuangjianzishan epithermal Ag-Pb-Zn deposit, Inner Mongolia, Northeastern China. Econ. Geol. 115, 101-128 (2020).
  29. Zhang, C. P. et al. Geochronology and isotope geochemistry studies of an epithermal gold deposit in the northern Lesser Khingan Range, NE China: The Gaosongshan example. Ore Geol. Rev. 105, 356-374 (2019).
  30. Liu, Y. et al. Origin and evolution of ore-forming fluid for the Gaosongshan gold deposit, Lesser Xing’an Range: Evidence from fluid inclusions, H-O-S-Pb isotopes. Geosci. Front. 10, 1961-1980 (2019).
  31. Zhao, Z. H. et al. Age of the Yongxin Au deposit in the Lesser Xing’an Range: Implications for an Early Cretaceous geodynamic setting for gold mineralization in NE China. Geol. J. 54, 2525-2544 (2019).
  32. Zhao, Z. H. et al. Genesis of the Yidonglinchang gold deposit, Lesser Xing’an Range, China: Insights from fluid inclusions, H-O-SPb isotopes, and and geochronology. Ore Geol. Rev. 163 (2023).
  33. Zhao, Z. H. et al. Zircon U-Pb geochronology and Sr-Nd-Pb-Hf isotopic constraints on the timing and origin of the Early Cretaceous igneous rocks in the Yongxin gold deposit in the Lesser Xing’an Range, NE China. Geol. J. 55, 2684-2703 (2019).
  34. Yuan, M. W. et al. Geochemical and isotopic composition of auriferous pyrite from the Yongxin gold deposit, Central Asian Orogenic Belt: Implication for ore genesis. Ore Geol. Rev. 93, 255-267 (2018).
  35. Pitiya, R. et al. Audio magnetotellurics study of the geoelectric structure across the Zhugongtang giant lead-zinc deposit, NW Guizhou Province, China. Minerals 12 (2022).
  36. Singh, S. et al. Audio-magnetotelluric investigation of sulfide mineralization in Proterozoic-Archean greenstone belts of Eastern Indian Craton. J. Earth Syst. Sci. 127 (2018).
  37. Ugbor, C. C., Arinze, I. J. & Emedo, C. O. Analysis of aeromagnetic data of Ikwo and Environs, Southeastern Nigeria: A mineral and hydrocarbon exploration guide. Nat. Resour. Res. 29, 2915-2932 (2020).
  38. Di Paolo, F. et al. La Palma island (Spain) geothermal system revealed by 3D magnetotelluric data inversion. Sci. Rep. 10, 18181 (2020).
  39. Darabi-Golestan, F., Ghavami-Riabi, R., Khalokakaie, R., Asadi-Haroni, H. & Seyedrahimi-Nyaragh, M. Interpretation of lithogeochemical and geophysical data to identify the buried mineralized area in Cu-Au porphyry of Dalli-Northern Hill. Arab. J. Geosci. 6, 4499-4509 (2012).
  40. Maharaj, D., Elbra, T. & Pesonen, L. J. Physical properties of the drill core from the Elgygytgyn impact structure, NE Russia. Meteorit. Planet. Sci. 48, 1130-1142 (2013).
  41. Zhang, R. Z. et al. 3-D joint inversion of gravity and magnetic data using data-space and truncated Gauss-Newton methods. IEEE Geosci. Remote Sens. Lett. 19, 1-5 (2022).
  42. Li, W. B., Qian, J. L. & Li, Y. G. Joint inversion of surface and borehole magnetic data: A level-set approach. Geophysics 85, 15-32 (2020).
  43. Xiao, B. et al. Rare earth element characteristics of shales from Wufeng-Longmaxi formations in deep-buried areas of the Northern Sichuan Basin, Southern China: Implications for provenance, depositional conditions, and paleoclimate. ACS Omega 9, 2088-2103 (2024).
  44. Vatankhah, S., Renaut, R. A., Huang, X. G., Mickus, K. & Gharloghi, M. Large-scale focusing joint inversion of gravity and magnetic data with Gramian constraint. Geophys. J. Int. 230, 1585-1611 (2022).
  45. Zhang, S. et al. A facile approach to ultralight and recyclable 3D self-assembled copolymer/graphene aerogels for efficient oil/water separation. Sci. Total Environ. 694, 133671 (2019).
  46. Yang, Z. W., Tan, H. D., Peng, M., Kong, W. X. & Wu, P. P. Three-dimensional joint inversion of gravity, magnetic and magnetotelluric data based on cross-gradient theory. Chin. J. Geophys. Chin. Ed. 63, 736-752 (2020).
  47. Li, C. L. et al. Study on pyrite thermoelectricity, ore-forming fluids and H-O-Rb-Sr isotopes of the Yongxin gold deposit, Central Asian Orogenic Belt: Implications for ore genesis and exploration. Ore Geol. Rev. 121 (2020).
  48. Behrendt, J. C. The aeromagnetic method as a tool to identify Cenozoic magmatism in the West Antarctic Rift System beneath the West Antarctic Ice Sheet-A review; Thiel subglacial volcano as possible source of the ash layer in the WAISCORE. Tectonophysics 585, 124-136 (2013).
  49. Ross, P. S. et al. High-resolution physical properties, geochemistry, and alteration mineralogy for the host rocks of the Archean Lemoine auriferous volcanogenic massive sulfide deposit, Canada. Econ. Geol. 111, 1561-1574 (2016).
  50. Caballero-Miranda, C. I. et al. Vertical AMS variation within basalt flow profiles from the Xitle volcano (Mexico) as indicator of heterogeneous strain in lava flows. J. Volcanol. Geotherm. Res. 311, 9-28 (2016).
  51. Sakr, S. M., Bamousa, A. O., Gougazeh, M. H. & Zaman, H. Petromagnetic investigations of the volcanic rocks in southern part of Al-Madinah, Saudi Arabia: Differentiation of different lava types. J. Taibah Univ. Sci. 14, 1009-1022 (2020).
  52. Liang, K. W., Zhao, Z. H. & Guo, Y. Application of primary halo in deep metallogenic prediction: A case study of Yongxin gold deposit in Heihe Area. Geol. Resour. 28, 512-518 (2019).
  53. Li, C. L. et al. Discovery and geological significance of gold-silver bearing minerals and tellurides in the Yongxin gold deposit in the northeastern Great Xing’an Range. Earth Sci. Front. 27, 244-254 (2020).
  54. Deng, C. Z. et al. Geochemistry of Early Cretaceous volcanic rocks in the Northeastern Great Xing’an Range, northeast China and implication for geodynamic setting. Int. Geol. Rev. 61, 1594-1612 (2018).
  55. Liu, R. P. et al. Zircon U-Pb geochronology and petrogeochemistry of host igneous rocks of the Dong’an gold deposit in Heilongjiang Province, NE China. Acta Petrol. Sin. 31, 1391-1408 (2015).
  56. Zhang, M. M. et al. Tellurium and gold enrichment aided by melts and pyrite crystallization kinetics: Insights from the Yongxin gold deposit, northeast China. Ore Geol. Rev. 156, 105370 (2023).
  57. Zhao, Z. H. et al. Early Cretaceous gold mineralization in the Lesser Xing’an Range of NE China: The Yongxin example. Int. Geol. Rev. 61, 1522-1548 (2018).

Acknowledgements

This work was financially supported by the National Natural Science Foundation of China (42372108), the funding project of Northeast Geological S&T Innovation Center of China Geological Survey (QCJJ2023-20), the funding project of the Educational Department of Liaoning Province (LJ212410147031, LJ222410147089), the Liaoning Provincial Natural Science Foundation (2024-MS-207), the Shandong Provincial Natural Science Foundation (ZR2024QD274), and the Heilongjiang Provincial Natural Science Foudation of China (ZL2024D005).

Author contributions

Y.C.Y. and Z.H.Z. wrote the main manuscript text, Y.J.Y. and X.Z. collected and analyzed samples, C.L.L. and H.N.L. interpreted and analyzed the data and J.C. prepared Figs. 1-10. All authors reviewed the manuscript.

Declarations

Competing interests

The authors declare no competing interests.

Additional information

Correspondence and requests for materials should be addressed to Z.Z.
Reprints and permissions information is available at www.nature.com/reprints.
Publisher’s note Springer Nature remains neutral with regard to jurisdictional claims in published maps and institutional affiliations.
Open Access This article is licensed under a Creative Commons Attribution 4.0 International License, which permits use, sharing, adaptation, distribution and reproduction in any medium or format, as long as you give appropriate credit to the original author(s) and the source, provide a link to the Creative Commons licence, and indicate if changes were made. The images or other third party material in this article are included in the article’s Creative Commons licence, unless indicated otherwise in a credit line to the material. If material is not included in the article’s Creative Commons licence and your intended use is not permitted by statutory regulation or exceeds the permitted use, you will need to obtain permission directly from the copyright holder. To view a copy of this licence, visit http://creativecommons.org/licenses/by/4.0/.
© The Author(s) 2025

  1. College of Mining, Liaoning Technical University, Fuxin, Liaoning 123000, China. Liaoning Key Laboratory of Green Development of Mineral Resources, LNTU, Fuxin, Liaoning 123000, China. Heilongjiang Institute of Natural Resources Survey, Harbin, Heilongjiang 150036, China. email: zhaozhonghai@Intu.edu.cn