DOI: https://doi.org/10.1038/s41467-024-45522-6
PMID: https://pubmed.ncbi.nlm.nih.gov/38321031
تاريخ النشر: 2024-02-06
الجهد وتأثير الطبقة المزدوجة الكهربائية في تخليق اليوريا الكهروكيميائي
تم القبول: 24 يناير 2024
نُشر على الإنترنت: 06 فبراير 2024
(ط) تحقق من التحديثات
الملخص
يعد التخليق الكهروكيميائي وسيلة واعدة لإنتاج اليوريا المستدام، ومع ذلك لم يتم الكشف عن الآلية الدقيقة بالكامل. هنا، نستكشف آلية الاقتران الكهروكيميائي للنيتريت وثاني أكسيد الكربون على أسطح النحاس نحو تخليق اليوريا استنادًا إلى طريقة الجهد الثابت المدمجة مع نموذج المذيب الضمني. تم العثور على جهد القطب العامل، الذي تم تجاهله عادة، له تأثير على كل من آلية التفاعل والنشاط. تكشف الدراسة الحسابية الإضافية حول مسارات التفاعل أن *CO-NH و*NH-CO-NH هما الوسيطان الرئيسيان. بالإضافة إلى ذلك، من خلال تحليل ترددات الدوران تحت ظروف مختلفة من الجهود والضغوط ودرجات الحرارة ضمن نموذج ميكروكينتيكي، نوضح أن النشاط يزداد مع درجة الحرارة، و
الاقتران الكهروتحفيزي لـ
الأقطاب: زيادة نسبة السطح (100) ورفع درجة حرارة التفاعل.
النتائج
المواقع النشطة وآلية التفاعل لـ
جزيء الماء المذيب داخل
غير مدرج للخطوة التالية من اقتران C – N، حيث إن تشكيل
يتم استخدام الشروط بدلاً من ذلك. تم حساب الطاقات الكلية للحالة الابتدائية والحالة الانتقالية من خلال الآلية الأكثر ملاءمة لـ
الأول
أكثر من خطوة الهدرجة لـ *NH (الشكل التكميلي 15). تُعرض لقطات من المسارات التفاعلية للخطوات المحتملة الأولى للربط على هذه الأسطح الثلاثة في الشكل التكميلي 16. تُقدم الطاقات الكلية لحالات الحالة الابتدائية وحالة الانتقال للخطوات المحتملة لربط C-N كدالة لإمكانات القطب في الأشكال التكملية 17-19، مع تلخيص المعلمات الملائمة للدوال التربيعية في الجداول التكملية 7-9.
خطوتا الربط الثانية C -N وخطوات الهدرجة النهائية
خطوات الهدرجة. مقارنة الحواجز الحركية لثاني تفاعل ربط C -N والمرتبط به
مناسب بسبب الحاجز الحركي الكبير لـ
0.00 إلى -1.30 فولت (يمكن رؤية التفاصيل في الأشكال التكميلية 26a و c و 27). بعد ذلك، يمكن أن يتم هدرجة *NH-CO-NH إلى *NH-CO-
محاكاة الميكروكينتيك
300 كلفن و 1 بار. أوقات التحول لكل موقع لتخليق اليوريا على (ج)
تغطية الأنواع أثناء تخليق اليوريا على
نقاش
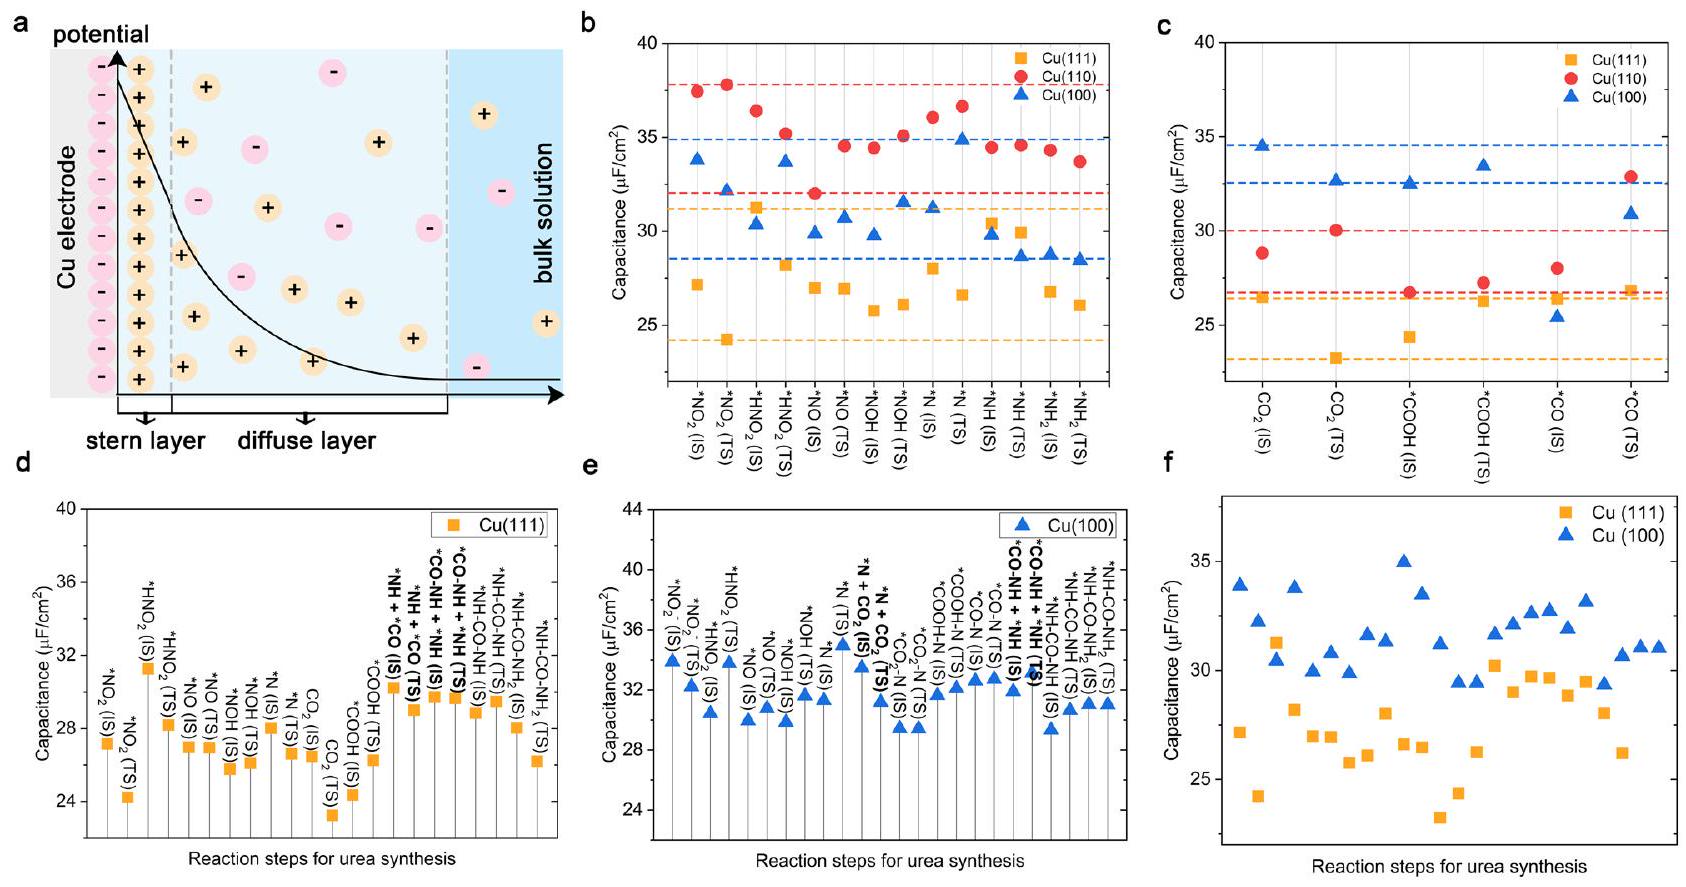
أهمية فهم دور طبقة مزدوجة كهربائية (EDL) في التحفيز الكهربائي، لتصميم وتحسين عملية تخليق اليوريا. تحليل شامل لطبقة مزدوجة كهربائية على
السعات. لتوضيح الأصل الفيزيائي للعلاقة بين سعة طبقة مزدوجة كهربائية والحركية الكهربائية، درسنا كثافة الشحنة السطحية (
طرق
حسابات DFT
طريقة الجهد الثابت
نموذج الميكروكينتيك
توفر البيانات
References
- Zhang, X. et al. Managing nitrogen for sustainable development. Nature 528, 51-59 (2015).
- Erisman, J. W., Sutton, M. A., Galloway, J., Klimont, Z. & Winiwarter, W. How a century of ammonia synthesis changed the world. Nat. Geosci. 1, 636-639 (2008).
- Comer, B. M. et al. Prospects and challenges for solar fertilizers. Joule 3, 1578-1605 (2019).
- Service, R. F. New recipe produces ammonia from air, water, and sunlight. Science 345, 610 (2014).
- Chen, S. et al. Electrocatalytic synthesis of ammonia at room temperature and atmospheric pressure from water and nitrogen on a carbon-nanotube-based electrocatalyst. Angew. Chem. Int. Ed. 56, 2699-2703 (2017).
- Zhu, X., Zhou, X., Jing, Y. & Li, Y. Electrochemical synthesis of urea on MBenes. Nat. Commun. 12, 1-9 (2021).
- Lv, C. et al. Selective electrocatalytic synthesis of urea with nitrate and carbon dioxide. Nat. Sustain. 4, 868-876 (2021).
- Chen, C. et al. Coupling
and in to synthesize urea under ambient conditions. Nat. Chem. 12, 717-724 (2020). - Liu, X., Jiao, Y., Zheng, Y., Jaroniec, M. & Qiao, S. Z. Mechanism of C – N bonds formation in electrocatalytic urea production revealed by ab initio molecular dynamics simulation. Nat. Commun. 13, 5471 (2022).
- Van der Ham, C. J., Koper, M. T. & Hetterscheid, D. G. Challenges in reduction of dinitrogen by proton and electron transfer. Chem. Soc. Rev. 43, 5183-5191 (2014).
- Chen, J. G. et al. Beyond fossil fuel-driven nitrogen transformations. Science 360, eaar6611 (2018).
- Liu, X., Jiao, Y., Zheng, Y., Jaroniec, M. & Qiao, S. Z. Building up a picture of the electrocatalytic nitrogen reduction activity of transition metal single-atom catalysts. J. Am. Chem. Soc. 141, 9664-9672 (2019).
- Zhang, X . et al. Identifying and tailoring
coupling site for efficient urea synthesis over diatomic Fe-Ni catalyst. Nat. Commun. 13, 5337 (2022). - Wei, X. et al. Oxygen vacancy-mediated selective C-N coupling toward electrocatalytic urea synthesis. J. Am. Chem. Soc. 144, 11530-11535 (2022).
- Schmelz, W. J., Hochman, G. & Miller, K. G. Total cost of carbon capture and storage implemented at a regional scale: northeastern and midwestern United States. Interf. Focus 10, 20190065 (2020).
- Jiang, Y. et al. Techno-economic comparison of various process configurations for post- combustion carbon capture using a singlecomponent water-lean solvent. Int. J. Greenh. Gas. Control. 106, 103279 (2021).
- Rosca, V., Duca, M., de Groot, M. T. & Koper, M. T. M. Nitrogen cycle electrocatalysis. Chem. Rev. 109, 2209-2244 (2009).
- Quinn, R. DTN retail fertilizer trends. Great American Crop https:// greatamericancrop.com/news-resources/article/2022/12/14/dtn-retail-fertilizer-trends (2022).
- Li, J., Zhang, Y., Kuruvinashetti, K. & Kornienko, N. Construction of
bonds from small-molecule precursors through heterogeneous electrocatalysis. Nat. Rev. Chem. 6, 303-319 (2022). - Wan, H. et al. Electrochemical synthesis of urea: Co-reduction of nitric oxide and carbon monoxide. ACS Catal. 13, 1926-1933 (2023).
- Yang, G. L. et al. Gaseous
coupling with N-containing intermediates for key C-N bond formation during urea production from coelectrolysis over Cu. ACS Catal. 12, 11494-11504 (2022). - Shibata, M. & Furuya, N. Electrochemical synthesis of urea at gasdiffusion electrodes. J. Electroanal. Chem. 507, 177-184 (2001).
- Shibata, M., Yoshida, K. & Furuya, N. Electrochemical synthesis of urea on reduction of carbon dioxide with nitrate and nitrite ions using Cu-loaded gas-diffusion electrode. J. Electroanal. Chem. 387, 143-145 (1995).
- Shibata, M., Yoshida, K. & Furuya, N. Electrochemical synthesis of urea at gas-diffusion electrodes: Part II. Simultaneous reduction of carbon dioxide and nitrite ions at
and Au catalysts. J. Electroanal. Chem. 442, 67-72 (1998). - Shibata, M., Yoshida, K. & Furuya, N. Electrochemical synthesis of urea at gas-diffusion electrodes: IV. Simultaneous reduction of carbon dioxide and nitrate ions with various metal catalysts. J. Electroanal. Chem. 145, 2348 (1998).
- Zhang, S. et al. High-efficiency electrosynthesis of urea over bacterial cellulose regulated Pd-Cu bimetallic catalyst. EES Catal. 1, 45-53 (2023).
- Pan, L. et al. Single-atom or dual-atom in
nanosheet: Which is the better choice for electrocatalytic urea synthesis? Angew. Chem. Int. Ed. 62, e202216835 (2023). - Li, D. et al. Accelerating electron-transfer dynamics by
immobilized reversible single-atom copper for enhanced artificial photosynthesis of urea. Adv. Mater. 34, 2207793 (2022). - Tao, Z., Rooney, C. L., Liang, Y. & Wang, H. Accessing organonitrogen compounds via
coupling in electrocatalytic reduction. J. Am. Chem. Soc. 143, 19630-19642 (2021). - Li, P. et al. Hydrogen bond network connectivity in the electric double layer dominates the kinetic pH effect in hydrogen electrocatalysis on Pt. Nat. Catal. 5, 900-911 (2022).
- Wang, J. et al. Spatially and temporally understanding dynamic solid-electrolyte interfaces in carbon dioxide electroreduction. Chem. Soc. Rev. 52, 5013-5050 (2023).
- Chen, C. et al. Exploration of the bio-analogous asymmetric C-C coupling mechanism in tandem
electroreduction. Nat. Catal. 5, 878-887 (2022). - Cheng, T., Xiao, H. & Goddard, W. III A Reaction mechanism for the electrochemical reduction of
to CO and formate on the surface at 298 K from quantum mechanics free energy calculations with explicit water. J. Am. Chem. Soc. 138, 13802-13805 (2016). - Xiao, H., Cheng, T., Goddard, W. A. III & Sundararaman, R. Mechanistic explanation of the pH dependence and onset potentials for hydrocarbon products from electrochemical reduction of CO on Cu(111). J. Am. Chem. Soc. 138, 483-486 (2016).
- Long, J. et al. Direct electrochemical ammonia synthesis from nitric oxide. Angew. Chem. Int. Ed. 59, 9711-9718 (2020).
- Hu, T., Wang, C., Wang, M., Li, C. M. & Guo, C. Theoretical insights into superior nitrate reduction to ammonia performance of copper catalysts. ACS Catal. 11, 14417-14427 (2021).
- Li, H., Long, J., Jing, H. & Xiao, J. Steering from electrochemical denitrification to ammonia synthesis. Nat. Commun. 14, 112 (2023).
- Hao, Y., Wang, L. & Huang, L. F. Lanthanide-doped MoS
with enhanced oxygen reduction activity and biperiodic chemical trends. Nat. Commun. 14, 3256 (2023). - Singstock, N. R. & Musgrave, C. B. How the bioinspired
chevrel breaks electrocatalytic nitrogen reduction scaling relations. J. Am. Chem. Soc. 144, 12800-12806 (2022). - Zhao, X. & Liu, Y. Origin of selective production of hydrogen peroxide by electrochemical oxygen reduction. J. Am. Chem. Soc. 143, 9423-9428 (2021).
- Wang, X. et al. Pivotal role of reversible
geometric conversion in oxygen evolution. Nature 611, 702-708 (2022). - Kim, D., Shi, J. & Liu, Y. Substantial impact of charge on electrochemical reactions of two-dimensional materials. J. Am. Chem. Soc. 140, 9127-9131 (2018).
- Hu, X. et al. What is the real origin of the activity of Fe-N-C electrocatalysts in the
reduction reaction? Critical roles of coordinating pyrrolic N and axially adsorbing species. J. Am. Chem. Soc. 144, 18144-18152 (2022). - Bai, X. et al. Dynamic stability of copper single-atom catalysts under working conditions. J. Am. Chem. Soc. 144, 17140-17148 (2022).
- Xiao, H., Cheng, T. & Goddard, W. A. III Atomistic mechanisms underlying selectivities in C1 and C2 products from electrochemical reduction of CO on Cu (111). J. Am. Chem. Soc. 139, 130-136 (2017).
- Liu, X. et al. Understanding trends in electrochemical carbon dioxide reduction rates. Nat. Commun. 8, 15438 (2017).
- Sebastián-Pascual, P., Shao-Horn, Y. & Escudero-Escribano, M. Toward understanding the role of the electric double layer structure and electrolyte effects on well-defined interfaces for electrocatalysis. Curr. Opin. Electrochem. 32, 100918 (2022).
- Rossmeisl, J., Nørskov, J. K., Taylor, C. D., Janik, M. J. & Neurock, M. Calculated phase diagrams for the electrochemical oxidation and reduction of water over Pt (111). J. Phys. Chem. B 110, 21833-21839 (2006).
- Lioubashevski, O., Katz, E. & Willner, I. Magnetic field effects on electrochemical processes: a theoretical hydrodynamic model. J. Phys. Chem. B 108, 5778-5784 (2004).
- Ringe, S. et al. Double layer charging driven carbon dioxide adsorption limits the rate of electrochemical carbon dioxide reduction on Gold. Nat. Commun. 11, 33 (2020).
- Vijay, S. et al. Dipole-field interactions determine the
reduction activity of 2D Fe-N-C single-atom catalysts. ACS Catal. 10, 7826-7835 (2020). - Hamelin, A., Vitanov, T., Sevastyanov, E. & Popov, A. The electrochemical double layer on sp metal single crystals: The current status of data. J. Electroanal. Chem. Interfacial Electrochem. 145, 225-264 (1983).
- Valette, G. Double layer on silver single crystal electrodes in contact with electrolytes having anions which are slightly specifically adsorbed: Part II. The (100) face. J. Electroanal. Chem. Interfacial Electrochem. 138, 37-54 (1982).
- Wu, J. Understanding the electric double-layer structure, capacitance, and charging dynamics. Chem. Rev. 122, 10821-10859 (2022).
- Kresse, G. & Furthmuller, J. Efficient iterative schemes for Ab initio total-energy calculations using a plane-wave basis set. Phys. Rev. B: Condens. Matter Mater. Phys. 54, 11169 (1996).
- Blöchl, P. E. Projector augmented-wave method. Phys. Rev. B: Condens. Matter Mater. Phys. 50, 17953 (1994).
- Kresse, G. & Joubert, D. From ultrasoft pseudopotentials to the projector augmented wave method. Phys. Rev. B: Condens. Matter Mater. Phys. 59, 1758 (1999).
- Grimme, S. Semiempirical GGA-type density functional constructed with a long-range dispersion correction. J. Comput. Chem. 27, 1787 (2006).
- Henkelman, G., Uberuaga, B. P. & Jonsson, H. J. A climbing image nudged elastic band method for finding saddle points and minimum energy paths. Chem. Phys. 113, 9901 (2000).
- Wang, V., Xu, N., Liu, J., Tang, G. & Geng, W.-T. VASPKIT: a userfriendly interface facilitating high-throughput computing and analysis using VASP code. Comput. Phys. Commun. 267, 108033 (2021).
- Nørskov, J. K. et al. H. Origin of the overpotential for oxygen reduction at a fuel-cell cathode. J. Phys. Chem. B 108, 17886-17892 (2004).
- Duan, Z. & Henkelman, G. Theoretical resolution of the exceptional oxygen reduction activity of
in alkaline media. ACS Catal. 9, 5567-5573 (2019). - Taylor, C. D., Wasileski, S. A., Filhol, J.-S. & Neurock, M. First principles reaction modeling of the electrochemical interface: Consideration and calculation of a tunable surface potential from atomic and electronic structure. Phys. Rev. B: Condens. Matter Mater. Phys. 73, 165402 (2006).
- Mathew, K., Sundararaman, R., Letchworth-Weaver, K., Arias, T. A. & Hennig, R. G. Implicit solvation model for density-functional study of nanocrystal surfaces and reaction pathways. J. Chem. Phys. 140, 084106 (2014). No.
- Fishman, M., Zhuang, H. L., Mathew, K., Dirschka, W. & Hennig, R. G. Accuracy of exchange-correlation functionals and effect of solvation on the surface energy of copper. Phys. Rev. B: Condens. Matter Mater. Phys. 87, 245402 (2013).
- Martyna, G. J., Klein, M. L. & Tuckerman, M. Nosé-Hoover chains: the canonical ensemble via continuous dynamics. J. Chem. Phys. 97, 2635-2643 (1992).
- Tran, B., Cai, Y., Janik, M. J. & Milner, S. T. Hydrogen bond thermodynamics in aqueous acid solutions: a combined DFT and classical force-field approach. J. Phys. Chem. A 126, 7382-7398 (2022).
- Arntsen, C., Chen, C., Calio, P. B., Li, C. & Voth, G. A. The hopping mechanism of the hydrated excess proton and its contribution to proton diffusion in water. J. Chem. Phys. 154, 194506 (2021).
- Calio, P. B., Li, C. & Voth, G. A. Resolving the structural debate for the hydrated excess proton in water. J. Am. Chem. Soc. 143, 18672-18683 (2021).
- Filhol, J.-S. & Neurock, M. Elucidation of the electrochemical activation of water over Pd by first principles. Angew. Chem. Int. Ed. 45, 402-406 (2006).
- Duan, Z. & Henkelman, G. Surface charge and electrostatic spin crossover effects in
electrocatalysts. ACS Catal. 10, 12148-12155 (2020). - Lynggaard, H., Andreasen, A., Stegelmann, C. & Stoltze, P. Analysis of simple kinetic models in heterogeneous catalysis. Prog. Surf. Sci. 77, 71 (2004).
- Stoltze, P. Microkinetic simulation of catalytic reactions. Prog. Surf. Sci. 65, 65 (2000).
- Liu, J. C. et al. Heterogeneous
single-cluster catalyst for ammonia synthesis via an associative mechanism. Nat. Commun. 9, 1610 (2018). - Zhou, S. et al. Boron nitride nanotubes for ammonia synthesis: activation by filling transition metals. J. Am. Chem. Soc. 142, 308-317 (2019).
- Rebarchik, M., Bhandari, S., Kropp, T. & Mavrikakis, M. Insights into the oxygen evolution reaction on graphene-based single-atom catalysts from first-principles-informed microkinetic modeling. ACS Catal. 13, 5225-5235 (2023).
- Stegelmann, C., Andreasen, A. & Campbell, C. T. Degree of rate control: how much the energies of intermediates and transition states control rates. J. Am. Chem. Soc. 131, 8077-8082 (2009).
- Campbell, C. T. The degree of rate control: a powerful tool for catalysis research. ACS Catal. 7, 2770-2779 (2017).
شكر وتقدير
مساهمات المؤلفين
المصالح المتنافسة
معلومات إضافية
المواد التكميلية متاحة على
https://doi.org/10.1038/s41467-024-45522-6.
http://www.nature.com/reprints
© المؤلف(ون) 2024
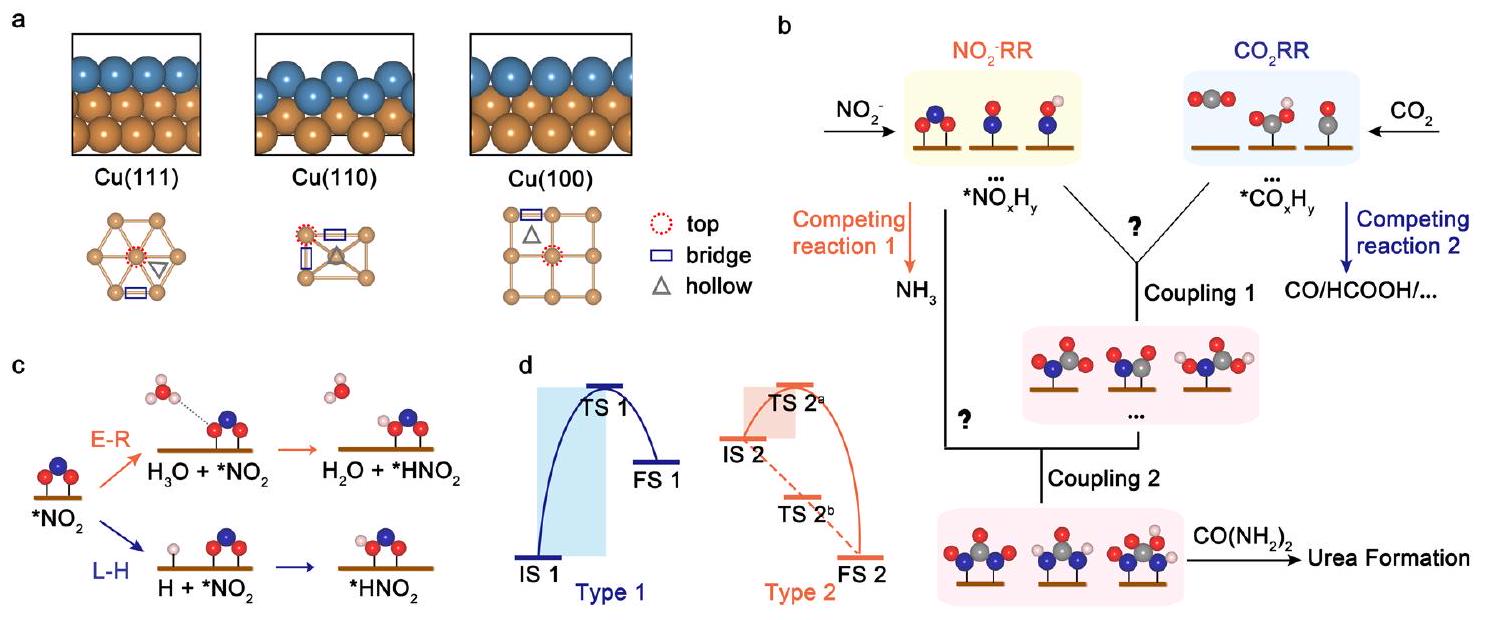
مدرسة علوم المواد والهندسة، جامعة نانيانغ التكنولوجية، 50 شارع نانيانغ، سنغافورة 639798، سنغافورة. مركز كامبريدج للبحوث المتقدمة والتعليم في سنغافورة، 1 طريق كريت، سنغافورة 138602، سنغافورة. مدرسة الهندسة الكيميائية، جامعة أديلايد، أديلايد، SA 5005، أستراليا. معهد أبحاث الطاقة @ جامعة نانيانغ التكنولوجية، ERI@N، المدرسة العليا متعددة التخصصات، جامعة نانيانغ التكنولوجية، 50 شارع نانيانغ، سنغافورة 639798، سنغافورة. مركز علوم وتكنولوجيا التحفيز المتقدم، جامعة نانيانغ التكنولوجية، 50 شارع نانيانغ، سنغافورة 639798، سنغافورة. البريد الإلكتروني:xuzc@ntu.edu.sg - خطوة نقل الإلكترون المترابط (PCET). د توضيح تخطيطي للحواجز الحركية للتفاعلات الكهروكيميائية. IS و TS و FS تمثل الحالات الابتدائية والانتقالية والنهائية. بالنسبة لتفاعل النوع 2، هناك احتمالان. قد يتقدم التفاعل بشكل تلقائي دون عبور حاجز حركي (TS
)، أو تتطلب حاجزًا حركيًا مثل النوع 1 (TS 2a).
DOI: https://doi.org/10.1038/s41467-024-45522-6
PMID: https://pubmed.ncbi.nlm.nih.gov/38321031
Publication Date: 2024-02-06
Potential and electric double-layer effect in electrocatalytic urea synthesis
Accepted: 24 January 2024
Published online: 06 February 2024
(i) Check for updates
Abstract
Electrochemical synthesis is a promising way for sustainable urea production, yet the exact mechanism has not been fully revealed. Herein, we explore the mechanism of electrochemical coupling of nitrite and carbon dioxide on Cu surfaces towards urea synthesis on the basis of a constant-potential method combined with an implicit solvent model. The working electrode potential, which has normally overlooked, is found influential on both the reaction mechanism and activity. The further computational study on the reaction pathways reveals that *CO-NH and *NH-CO-NH as the key intermediates. In addition, through the analysis of turnover frequencies under various potentials, pressures, and temperatures within a microkinetic model, we demonstrate that the activity increases with temperature, and the
electrocatalytic coupling of
electrodes: increasing (100) surface ratio and elevating the reaction temperature.
Results
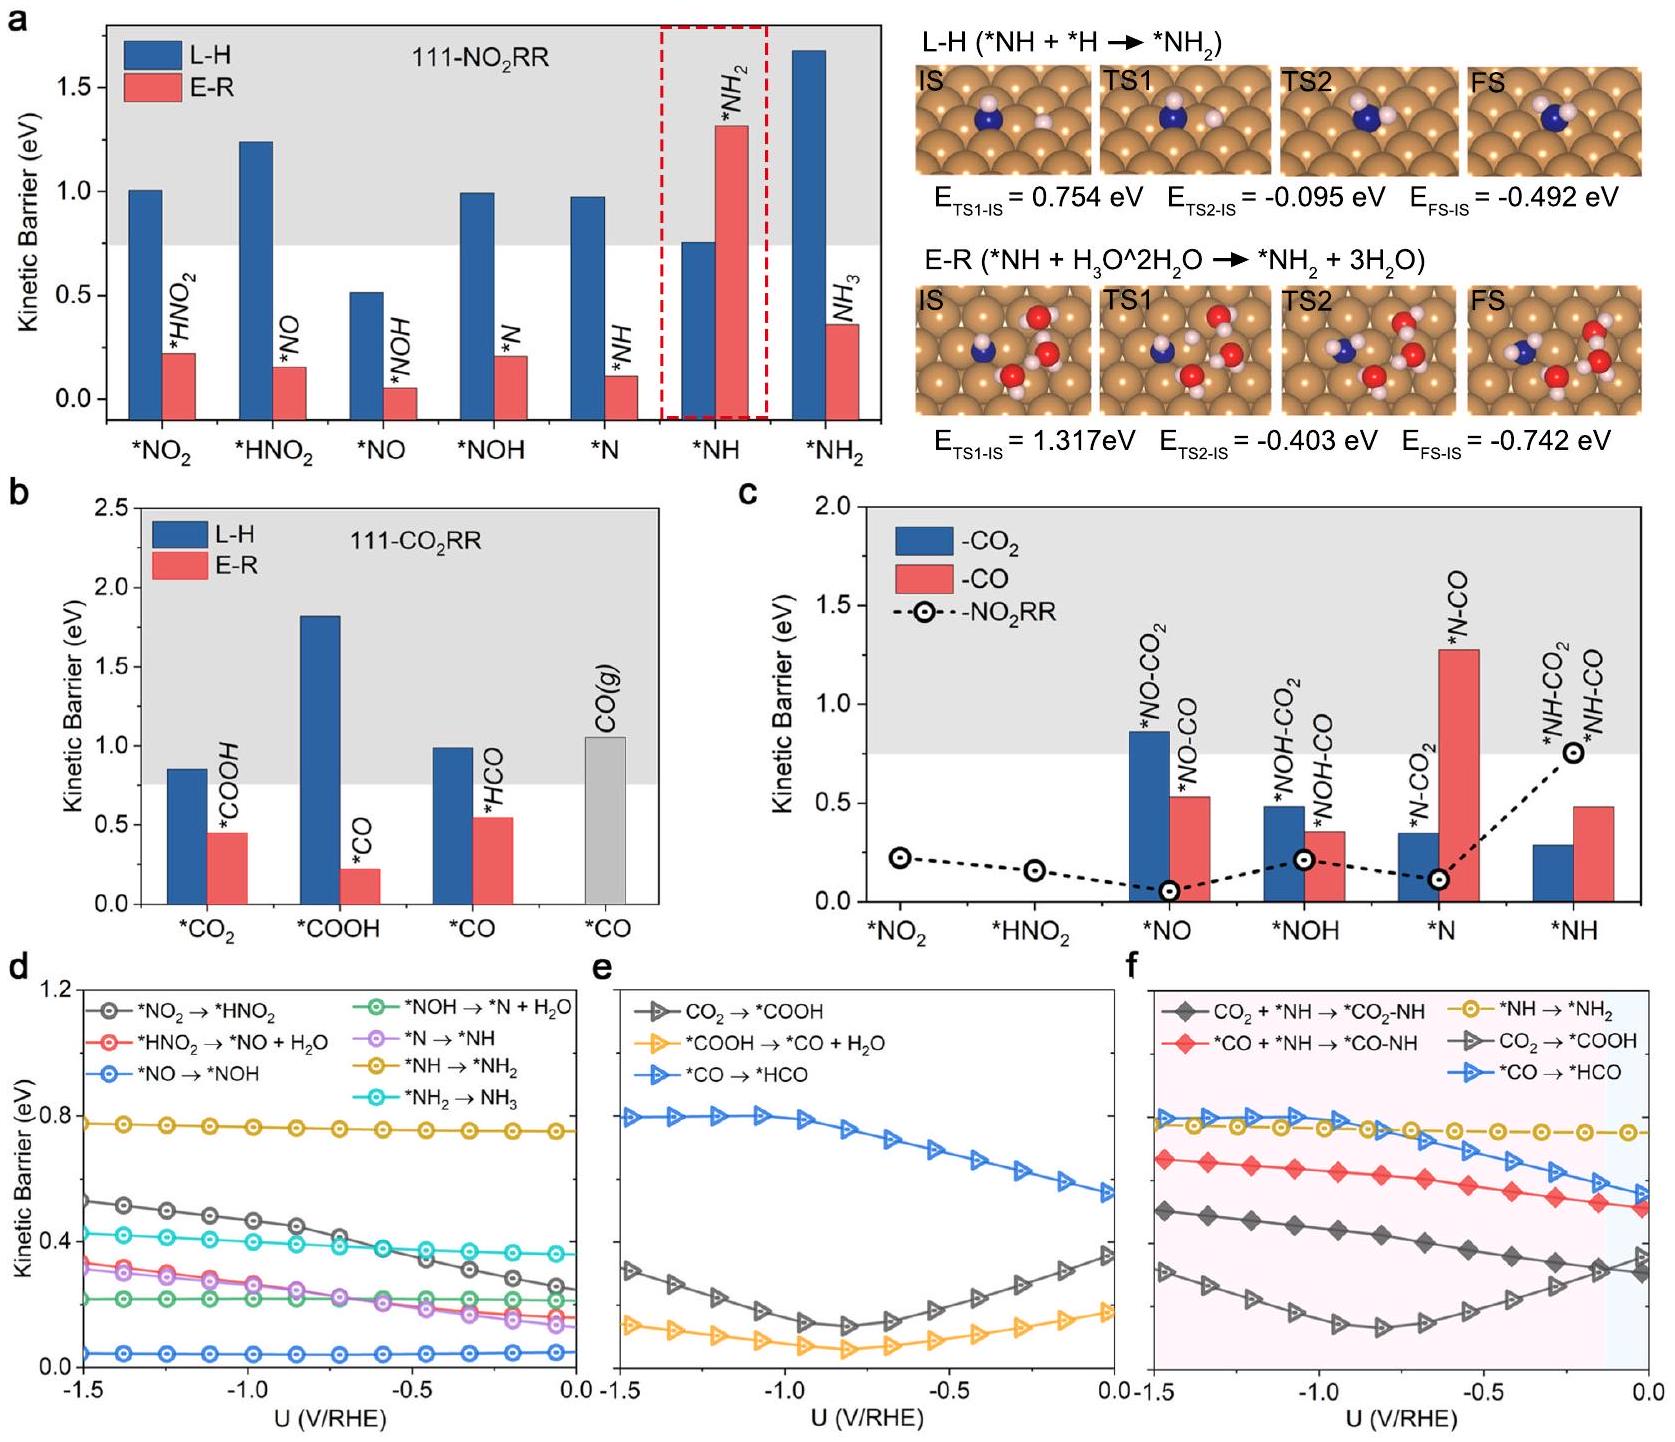
Active sites and reaction mechanism for
solvating water molecule within the
not included for the next C – N coupling step, as the formation of
conditions is utilized instead. The calculated total energies of IS and TS via the most favorable mechanism for
The first
than the hydrogenation step of *NH (Supplementary Fig. 15). Snapshots of reactive trajectories for potential first coupling steps on these three surfaces are displayed in Supplementary Fig. 16. The total energies of IS and TS states for the possible C-N coupling steps as a function of electrode potential are presented in Supplementary Figs. 17-19, with the fitted parameters of the parabolic functions summarized in Supplementary Tables 7-9.
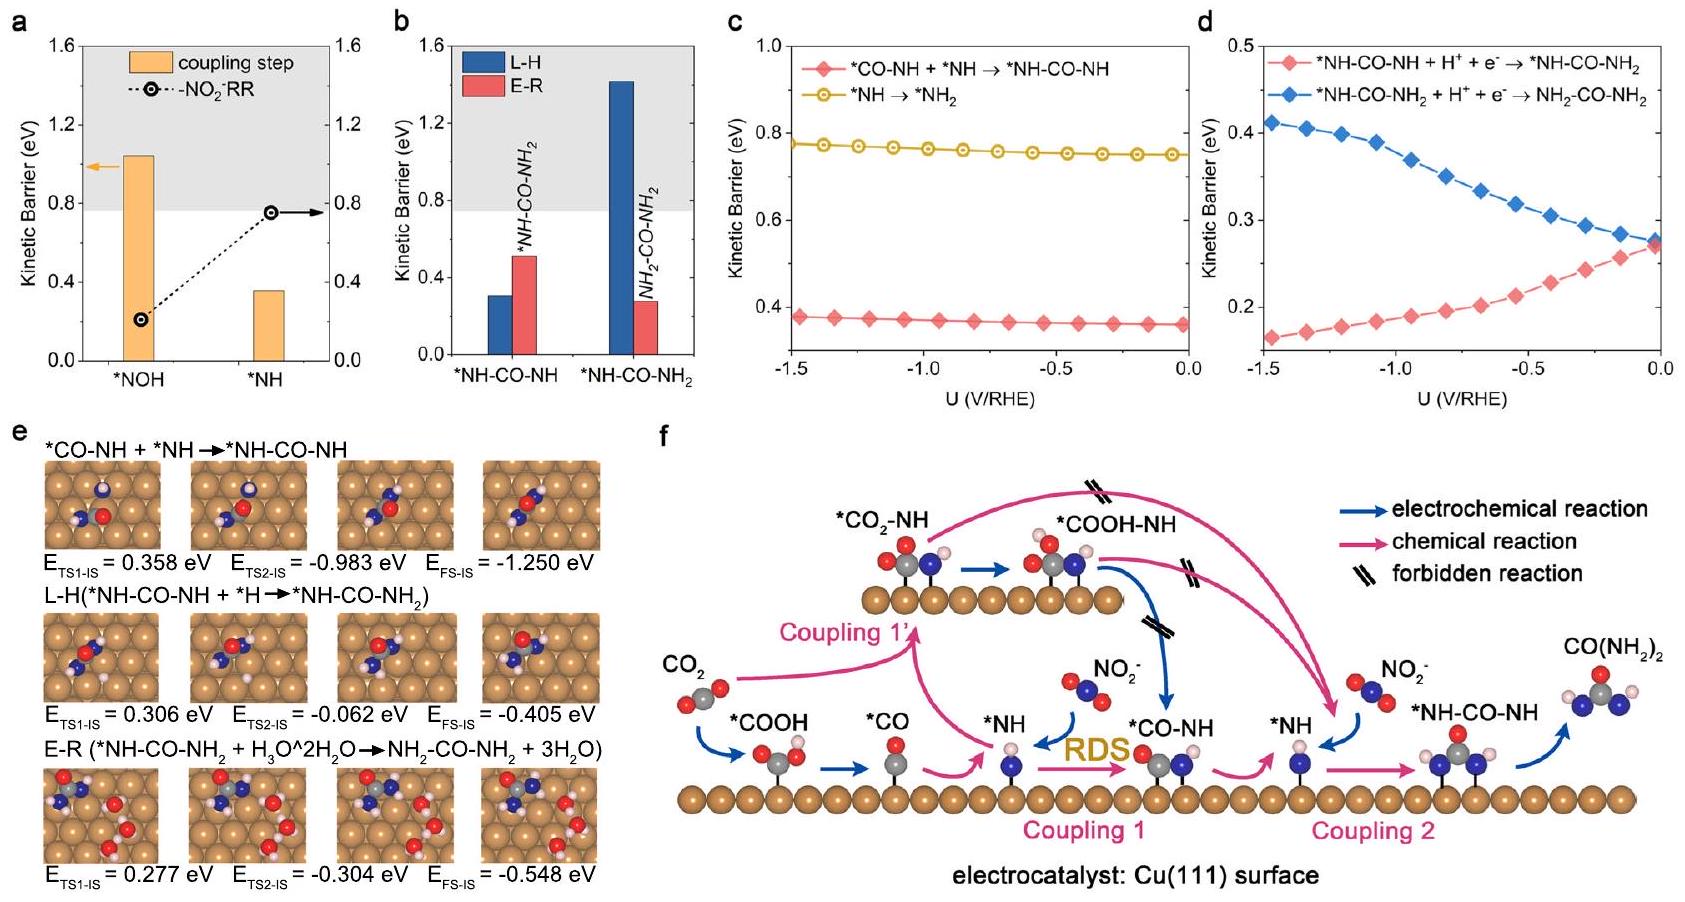
The second C -N coupling and final hydrogenation steps
hydrogenation steps. a Comparison of kinetic barriers for the second C -N coupling and the corresponding
favorable due to the large kinetic barrier for
0.00 to -1.30 V (details can be seen in Supplementary Figs. 26a, c and 27). After that, the *NH-CO-NH could be further hydrogenated to *NH-CO-
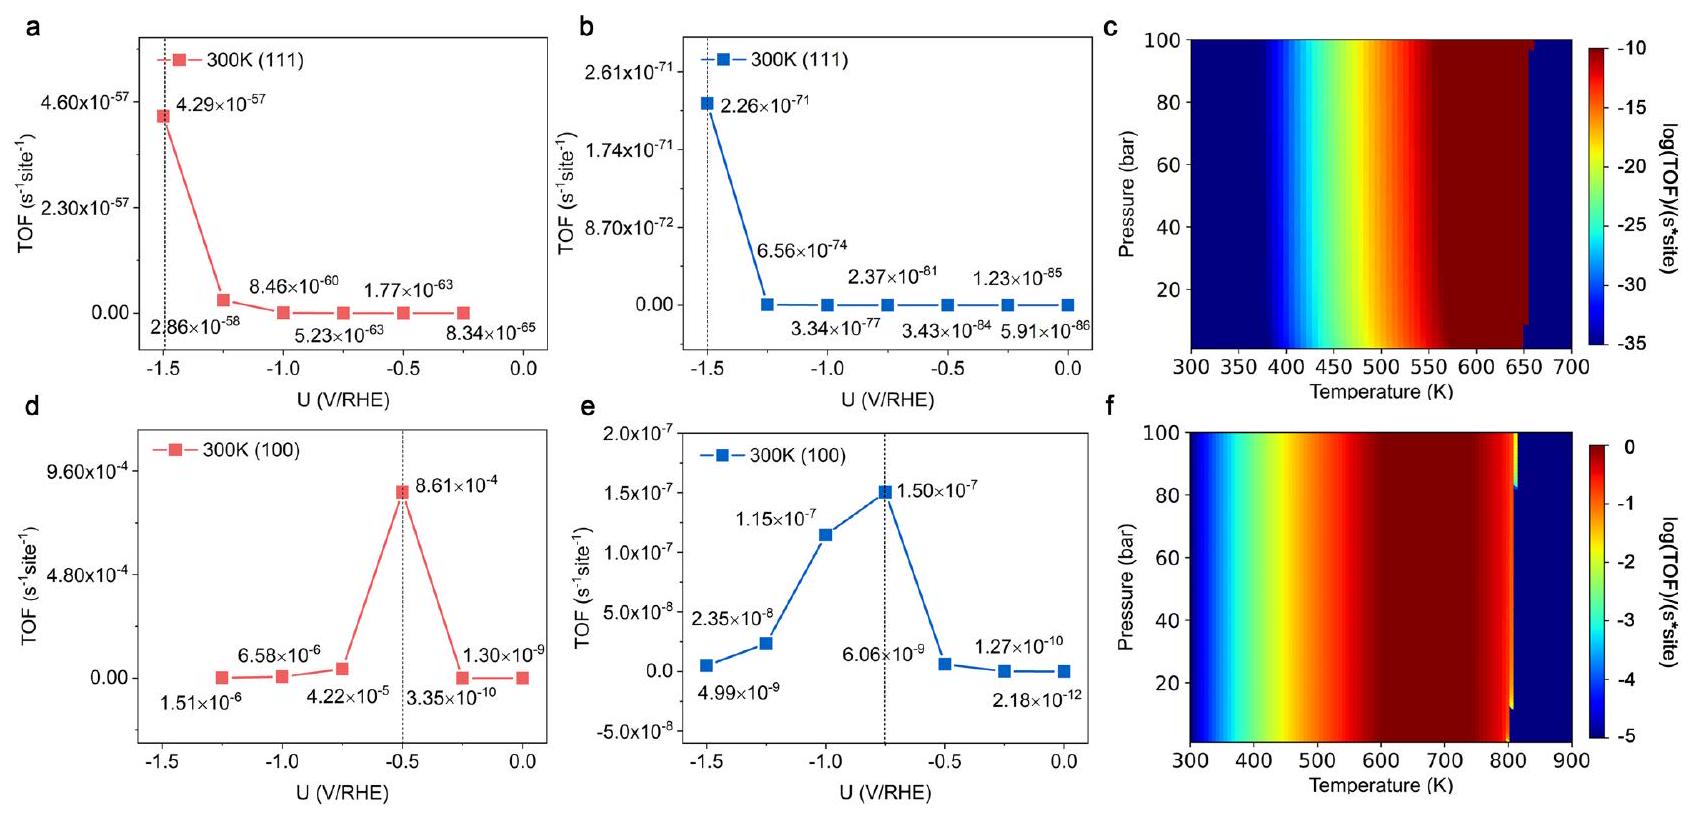
Microkinetic simulations
300 K and 1 bar . TOFs per site for urea synthesis on (c)
covering species during the urea synthesis on
Discussion
importance to understand the role of EDL in electrocatalysis, for the design and optimization of the urea synthesis process. A comprehensive analysis of EDL on
capacitances. To better illustrate the physical origin of the relationship between EDL capacitance and electrokinetic, we studied the surfacecharge density (
Methods
DFT computations
Constant potential method
Microkinetic model
Data availability
References
- Zhang, X. et al. Managing nitrogen for sustainable development. Nature 528, 51-59 (2015).
- Erisman, J. W., Sutton, M. A., Galloway, J., Klimont, Z. & Winiwarter, W. How a century of ammonia synthesis changed the world. Nat. Geosci. 1, 636-639 (2008).
- Comer, B. M. et al. Prospects and challenges for solar fertilizers. Joule 3, 1578-1605 (2019).
- Service, R. F. New recipe produces ammonia from air, water, and sunlight. Science 345, 610 (2014).
- Chen, S. et al. Electrocatalytic synthesis of ammonia at room temperature and atmospheric pressure from water and nitrogen on a carbon-nanotube-based electrocatalyst. Angew. Chem. Int. Ed. 56, 2699-2703 (2017).
- Zhu, X., Zhou, X., Jing, Y. & Li, Y. Electrochemical synthesis of urea on MBenes. Nat. Commun. 12, 1-9 (2021).
- Lv, C. et al. Selective electrocatalytic synthesis of urea with nitrate and carbon dioxide. Nat. Sustain. 4, 868-876 (2021).
- Chen, C. et al. Coupling
and in to synthesize urea under ambient conditions. Nat. Chem. 12, 717-724 (2020). - Liu, X., Jiao, Y., Zheng, Y., Jaroniec, M. & Qiao, S. Z. Mechanism of C – N bonds formation in electrocatalytic urea production revealed by ab initio molecular dynamics simulation. Nat. Commun. 13, 5471 (2022).
- Van der Ham, C. J., Koper, M. T. & Hetterscheid, D. G. Challenges in reduction of dinitrogen by proton and electron transfer. Chem. Soc. Rev. 43, 5183-5191 (2014).
- Chen, J. G. et al. Beyond fossil fuel-driven nitrogen transformations. Science 360, eaar6611 (2018).
- Liu, X., Jiao, Y., Zheng, Y., Jaroniec, M. & Qiao, S. Z. Building up a picture of the electrocatalytic nitrogen reduction activity of transition metal single-atom catalysts. J. Am. Chem. Soc. 141, 9664-9672 (2019).
- Zhang, X . et al. Identifying and tailoring
coupling site for efficient urea synthesis over diatomic Fe-Ni catalyst. Nat. Commun. 13, 5337 (2022). - Wei, X. et al. Oxygen vacancy-mediated selective C-N coupling toward electrocatalytic urea synthesis. J. Am. Chem. Soc. 144, 11530-11535 (2022).
- Schmelz, W. J., Hochman, G. & Miller, K. G. Total cost of carbon capture and storage implemented at a regional scale: northeastern and midwestern United States. Interf. Focus 10, 20190065 (2020).
- Jiang, Y. et al. Techno-economic comparison of various process configurations for post- combustion carbon capture using a singlecomponent water-lean solvent. Int. J. Greenh. Gas. Control. 106, 103279 (2021).
- Rosca, V., Duca, M., de Groot, M. T. & Koper, M. T. M. Nitrogen cycle electrocatalysis. Chem. Rev. 109, 2209-2244 (2009).
- Quinn, R. DTN retail fertilizer trends. Great American Crop https:// greatamericancrop.com/news-resources/article/2022/12/14/dtn-retail-fertilizer-trends (2022).
- Li, J., Zhang, Y., Kuruvinashetti, K. & Kornienko, N. Construction of
bonds from small-molecule precursors through heterogeneous electrocatalysis. Nat. Rev. Chem. 6, 303-319 (2022). - Wan, H. et al. Electrochemical synthesis of urea: Co-reduction of nitric oxide and carbon monoxide. ACS Catal. 13, 1926-1933 (2023).
- Yang, G. L. et al. Gaseous
coupling with N-containing intermediates for key C-N bond formation during urea production from coelectrolysis over Cu. ACS Catal. 12, 11494-11504 (2022). - Shibata, M. & Furuya, N. Electrochemical synthesis of urea at gasdiffusion electrodes. J. Electroanal. Chem. 507, 177-184 (2001).
- Shibata, M., Yoshida, K. & Furuya, N. Electrochemical synthesis of urea on reduction of carbon dioxide with nitrate and nitrite ions using Cu-loaded gas-diffusion electrode. J. Electroanal. Chem. 387, 143-145 (1995).
- Shibata, M., Yoshida, K. & Furuya, N. Electrochemical synthesis of urea at gas-diffusion electrodes: Part II. Simultaneous reduction of carbon dioxide and nitrite ions at
and Au catalysts. J. Electroanal. Chem. 442, 67-72 (1998). - Shibata, M., Yoshida, K. & Furuya, N. Electrochemical synthesis of urea at gas-diffusion electrodes: IV. Simultaneous reduction of carbon dioxide and nitrate ions with various metal catalysts. J. Electroanal. Chem. 145, 2348 (1998).
- Zhang, S. et al. High-efficiency electrosynthesis of urea over bacterial cellulose regulated Pd-Cu bimetallic catalyst. EES Catal. 1, 45-53 (2023).
- Pan, L. et al. Single-atom or dual-atom in
nanosheet: Which is the better choice for electrocatalytic urea synthesis? Angew. Chem. Int. Ed. 62, e202216835 (2023). - Li, D. et al. Accelerating electron-transfer dynamics by
immobilized reversible single-atom copper for enhanced artificial photosynthesis of urea. Adv. Mater. 34, 2207793 (2022). - Tao, Z., Rooney, C. L., Liang, Y. & Wang, H. Accessing organonitrogen compounds via
coupling in electrocatalytic reduction. J. Am. Chem. Soc. 143, 19630-19642 (2021). - Li, P. et al. Hydrogen bond network connectivity in the electric double layer dominates the kinetic pH effect in hydrogen electrocatalysis on Pt. Nat. Catal. 5, 900-911 (2022).
- Wang, J. et al. Spatially and temporally understanding dynamic solid-electrolyte interfaces in carbon dioxide electroreduction. Chem. Soc. Rev. 52, 5013-5050 (2023).
- Chen, C. et al. Exploration of the bio-analogous asymmetric C-C coupling mechanism in tandem
electroreduction. Nat. Catal. 5, 878-887 (2022). - Cheng, T., Xiao, H. & Goddard, W. III A Reaction mechanism for the electrochemical reduction of
to CO and formate on the surface at 298 K from quantum mechanics free energy calculations with explicit water. J. Am. Chem. Soc. 138, 13802-13805 (2016). - Xiao, H., Cheng, T., Goddard, W. A. III & Sundararaman, R. Mechanistic explanation of the pH dependence and onset potentials for hydrocarbon products from electrochemical reduction of CO on Cu(111). J. Am. Chem. Soc. 138, 483-486 (2016).
- Long, J. et al. Direct electrochemical ammonia synthesis from nitric oxide. Angew. Chem. Int. Ed. 59, 9711-9718 (2020).
- Hu, T., Wang, C., Wang, M., Li, C. M. & Guo, C. Theoretical insights into superior nitrate reduction to ammonia performance of copper catalysts. ACS Catal. 11, 14417-14427 (2021).
- Li, H., Long, J., Jing, H. & Xiao, J. Steering from electrochemical denitrification to ammonia synthesis. Nat. Commun. 14, 112 (2023).
- Hao, Y., Wang, L. & Huang, L. F. Lanthanide-doped MoS
with enhanced oxygen reduction activity and biperiodic chemical trends. Nat. Commun. 14, 3256 (2023). - Singstock, N. R. & Musgrave, C. B. How the bioinspired
chevrel breaks electrocatalytic nitrogen reduction scaling relations. J. Am. Chem. Soc. 144, 12800-12806 (2022). - Zhao, X. & Liu, Y. Origin of selective production of hydrogen peroxide by electrochemical oxygen reduction. J. Am. Chem. Soc. 143, 9423-9428 (2021).
- Wang, X. et al. Pivotal role of reversible
geometric conversion in oxygen evolution. Nature 611, 702-708 (2022). - Kim, D., Shi, J. & Liu, Y. Substantial impact of charge on electrochemical reactions of two-dimensional materials. J. Am. Chem. Soc. 140, 9127-9131 (2018).
- Hu, X. et al. What is the real origin of the activity of Fe-N-C electrocatalysts in the
reduction reaction? Critical roles of coordinating pyrrolic N and axially adsorbing species. J. Am. Chem. Soc. 144, 18144-18152 (2022). - Bai, X. et al. Dynamic stability of copper single-atom catalysts under working conditions. J. Am. Chem. Soc. 144, 17140-17148 (2022).
- Xiao, H., Cheng, T. & Goddard, W. A. III Atomistic mechanisms underlying selectivities in C1 and C2 products from electrochemical reduction of CO on Cu (111). J. Am. Chem. Soc. 139, 130-136 (2017).
- Liu, X. et al. Understanding trends in electrochemical carbon dioxide reduction rates. Nat. Commun. 8, 15438 (2017).
- Sebastián-Pascual, P., Shao-Horn, Y. & Escudero-Escribano, M. Toward understanding the role of the electric double layer structure and electrolyte effects on well-defined interfaces for electrocatalysis. Curr. Opin. Electrochem. 32, 100918 (2022).
- Rossmeisl, J., Nørskov, J. K., Taylor, C. D., Janik, M. J. & Neurock, M. Calculated phase diagrams for the electrochemical oxidation and reduction of water over Pt (111). J. Phys. Chem. B 110, 21833-21839 (2006).
- Lioubashevski, O., Katz, E. & Willner, I. Magnetic field effects on electrochemical processes: a theoretical hydrodynamic model. J. Phys. Chem. B 108, 5778-5784 (2004).
- Ringe, S. et al. Double layer charging driven carbon dioxide adsorption limits the rate of electrochemical carbon dioxide reduction on Gold. Nat. Commun. 11, 33 (2020).
- Vijay, S. et al. Dipole-field interactions determine the
reduction activity of 2D Fe-N-C single-atom catalysts. ACS Catal. 10, 7826-7835 (2020). - Hamelin, A., Vitanov, T., Sevastyanov, E. & Popov, A. The electrochemical double layer on sp metal single crystals: The current status of data. J. Electroanal. Chem. Interfacial Electrochem. 145, 225-264 (1983).
- Valette, G. Double layer on silver single crystal electrodes in contact with electrolytes having anions which are slightly specifically adsorbed: Part II. The (100) face. J. Electroanal. Chem. Interfacial Electrochem. 138, 37-54 (1982).
- Wu, J. Understanding the electric double-layer structure, capacitance, and charging dynamics. Chem. Rev. 122, 10821-10859 (2022).
- Kresse, G. & Furthmuller, J. Efficient iterative schemes for Ab initio total-energy calculations using a plane-wave basis set. Phys. Rev. B: Condens. Matter Mater. Phys. 54, 11169 (1996).
- Blöchl, P. E. Projector augmented-wave method. Phys. Rev. B: Condens. Matter Mater. Phys. 50, 17953 (1994).
- Kresse, G. & Joubert, D. From ultrasoft pseudopotentials to the projector augmented wave method. Phys. Rev. B: Condens. Matter Mater. Phys. 59, 1758 (1999).
- Grimme, S. Semiempirical GGA-type density functional constructed with a long-range dispersion correction. J. Comput. Chem. 27, 1787 (2006).
- Henkelman, G., Uberuaga, B. P. & Jonsson, H. J. A climbing image nudged elastic band method for finding saddle points and minimum energy paths. Chem. Phys. 113, 9901 (2000).
- Wang, V., Xu, N., Liu, J., Tang, G. & Geng, W.-T. VASPKIT: a userfriendly interface facilitating high-throughput computing and analysis using VASP code. Comput. Phys. Commun. 267, 108033 (2021).
- Nørskov, J. K. et al. H. Origin of the overpotential for oxygen reduction at a fuel-cell cathode. J. Phys. Chem. B 108, 17886-17892 (2004).
- Duan, Z. & Henkelman, G. Theoretical resolution of the exceptional oxygen reduction activity of
in alkaline media. ACS Catal. 9, 5567-5573 (2019). - Taylor, C. D., Wasileski, S. A., Filhol, J.-S. & Neurock, M. First principles reaction modeling of the electrochemical interface: Consideration and calculation of a tunable surface potential from atomic and electronic structure. Phys. Rev. B: Condens. Matter Mater. Phys. 73, 165402 (2006).
- Mathew, K., Sundararaman, R., Letchworth-Weaver, K., Arias, T. A. & Hennig, R. G. Implicit solvation model for density-functional study of nanocrystal surfaces and reaction pathways. J. Chem. Phys. 140, 084106 (2014). No.
- Fishman, M., Zhuang, H. L., Mathew, K., Dirschka, W. & Hennig, R. G. Accuracy of exchange-correlation functionals and effect of solvation on the surface energy of copper. Phys. Rev. B: Condens. Matter Mater. Phys. 87, 245402 (2013).
- Martyna, G. J., Klein, M. L. & Tuckerman, M. Nosé-Hoover chains: the canonical ensemble via continuous dynamics. J. Chem. Phys. 97, 2635-2643 (1992).
- Tran, B., Cai, Y., Janik, M. J. & Milner, S. T. Hydrogen bond thermodynamics in aqueous acid solutions: a combined DFT and classical force-field approach. J. Phys. Chem. A 126, 7382-7398 (2022).
- Arntsen, C., Chen, C., Calio, P. B., Li, C. & Voth, G. A. The hopping mechanism of the hydrated excess proton and its contribution to proton diffusion in water. J. Chem. Phys. 154, 194506 (2021).
- Calio, P. B., Li, C. & Voth, G. A. Resolving the structural debate for the hydrated excess proton in water. J. Am. Chem. Soc. 143, 18672-18683 (2021).
- Filhol, J.-S. & Neurock, M. Elucidation of the electrochemical activation of water over Pd by first principles. Angew. Chem. Int. Ed. 45, 402-406 (2006).
- Duan, Z. & Henkelman, G. Surface charge and electrostatic spin crossover effects in
electrocatalysts. ACS Catal. 10, 12148-12155 (2020). - Lynggaard, H., Andreasen, A., Stegelmann, C. & Stoltze, P. Analysis of simple kinetic models in heterogeneous catalysis. Prog. Surf. Sci. 77, 71 (2004).
- Stoltze, P. Microkinetic simulation of catalytic reactions. Prog. Surf. Sci. 65, 65 (2000).
- Liu, J. C. et al. Heterogeneous
single-cluster catalyst for ammonia synthesis via an associative mechanism. Nat. Commun. 9, 1610 (2018). - Zhou, S. et al. Boron nitride nanotubes for ammonia synthesis: activation by filling transition metals. J. Am. Chem. Soc. 142, 308-317 (2019).
- Rebarchik, M., Bhandari, S., Kropp, T. & Mavrikakis, M. Insights into the oxygen evolution reaction on graphene-based single-atom catalysts from first-principles-informed microkinetic modeling. ACS Catal. 13, 5225-5235 (2023).
- Stegelmann, C., Andreasen, A. & Campbell, C. T. Degree of rate control: how much the energies of intermediates and transition states control rates. J. Am. Chem. Soc. 131, 8077-8082 (2009).
- Campbell, C. T. The degree of rate control: a powerful tool for catalysis research. ACS Catal. 7, 2770-2779 (2017).
Acknowledgements
Author contributions
Competing interests
Additional information
supplementary material available at
https://doi.org/10.1038/s41467-024-45522-6.
http://www.nature.com/reprints
© The Author(s) 2024
School of Material Science and Engineering, Nanyang Technological University, 50 Nanyang Avenue, Singapore 639798, Singapore. The Cambridge Centre for Advanced Research and Education in Singapore, 1 CREATE way, Singapore 138602, Singapore. School of Chemical Engineering, The University of Adelaide, Adelaide, SA 5005, Australia. Energy Research Institute @ Nanyang Technological University, ERI@N, Interdisciplinary Graduate School, Nanyang Technological University, 50 Nanyang Avenue, Singapore 639798, Singapore. Center for Advanced Catalysis Science and Technology, Nanyang Technological University, 50 Nanyang Avenue, Singapore 639798, Singapore. e-mail: xuzc@ntu.edu.sg - coupled electron transfer (PCET) step. d Schematic illustration of kinetic barriers for electrochemical reactions. IS, TS and FS represent the initial, transition, and final states. For Type 2 reaction, there are two possibilities. The reaction may proceed spontaneously without crossing a kinetic barrier (TS
), or require a kinetic barrier as same as Type 1 (TS 2a).