الحساسية الناشئة لدرجة حرارة الكربون العضوي في التربة المدفوعة بالارتباطات المعدنية Emergent temperature sensitivity of soil organic carbon driven by mineral associations

المجلة: Nature Geoscience، المجلد: 17، العدد: 3
DOI: https://doi.org/10.1038/s41561-024-01384-7
تاريخ النشر: 2024-02-20

الحساسية الناشئة لدرجة حرارة الكربون العضوي في التربة المدفوعة بالارتباطات المعدنية

تاريخ الاستلام: 23 أكتوبر 2022
تاريخ القبول: 23 يناير 2024
تاريخ النشر على الإنترنت: 20 فبراير 2024
(D) تحقق من التحديثات

كاترينا جورجيو © ®، تشارلز د. كوفن (1) ، ويليام ر. وايدر ، ميلاني د. هارتمان ، ويليام ج. رايلي ، جينيفر بيتي-ريدج (1) ، نيكولاس ج. بوسكيل (1) ، روز ز. أبراموف (1) ، إريك و. سليسرير ، أندرس أhlström © ، ويليام ج. بارتون ، آدم ف. أ. بيليجريني © ، ديريك بييرسون © ، بنجامين ن. سولمان (1) ، كينغ زو (1) & روبرت ب. جاكسون (1)

الملخص

تعتمد تحلل المادة العضوية في التربة وتفاعلاتها مع المناخ على ما إذا كانت المادة العضوية مرتبطة بالمعادن التربة. ومع ذلك، فإن قيود البيانات قد أعاقت التحليلات على نطاق عالمي لبرك الكربون العضوي المرتبط بالمعادن والجزيئات ومرجعيتها في نماذج النظام الأرضي المستخدمة لتقدير ردود الفعل بين دورة الكربون والمناخ. هنا نقوم بتحليل التقديرات العالمية المستمدة من الملاحظات لبرك الكربون في التربة لتحديد نسبها النسبية وحساب حساسياتها الحرارية المناخية كتناقص في الكربون مع زيادة درجة الحرارة. نجد أن الحساسية الحرارية المناخية للكربون الجزيئي أعلى في المتوسط من تلك الخاصة بالكربون المرتبط بالمعادن، وتصل إلى 53% أعلى في المناخات الباردة. علاوة على ذلك، فإن توزيع الكربون بين هذه البرك الأساسية من الكربون في التربة يدفع الحساسية الحرارية المناخية الناشئة لمخزونات الكربون في التربة. ومع ذلك، تختلف النماذج العالمية بشكل كبير في توقعاتها لتوزيعات برك الكربون في التربة. نوضح أن النسبة العالمية لبرك النماذج التي تشبه من الناحية المفاهيمية الكربون المحمي بالمعادن تتراوح من 16 إلى 85% عبر نماذج النظام الأرضي من مشروع المقارنة بين النماذج المتصلة المرحلة 6 ونماذج الأراضي غير المتصلة، مع تداعيات على أعمار الكربون في التربة واستجابة النظام البيئي. لتحسين توقعات ردود الفعل بين دورة الكربون والمناخ، من الضروري تقييم برك الكربون الأساسية في التربة للتنبؤ بدقة بتوزيع الكربون وضعف الكربون في التربة.

تمثل ردود الفعل بين الكربون والمناخ في التربة عدم يقين كبير في استجابة الغلاف الحيوي الأرضي لتغير المناخ . ينبع هذا عدم اليقين، جزئيًا، من العلاقات غير المضبوطة بين حساسيات درجات الحرارة لعمليات التحلل والاستقرار للكربون العضوي في التربة (C)، والتي هي معلمات رئيسية في نماذج الكيمياء الحيوية للتربة . بينما استكشفت العديد من الدراسات التجريبية والنمذجة
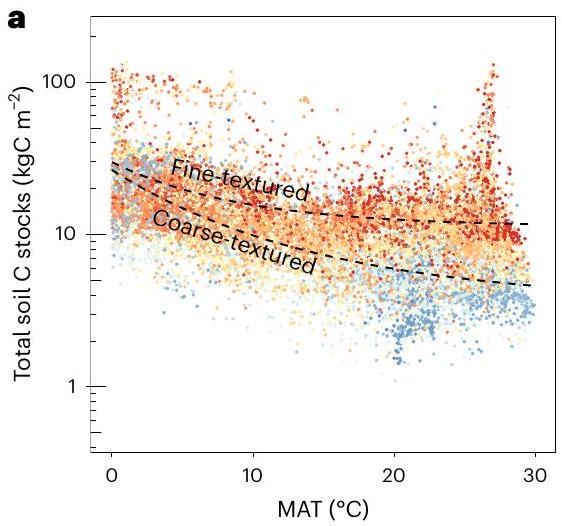
أثر درجات الحرارة على مخزونات الكربون في التربة الكلية ومعدلات الدوران على نطاقات النظام البيئي إلى النطاق العالمي ، فإنها تتجاهل إلى حد كبير التباين في المادة العضوية في التربة. هذه غفلة رئيسية نظرًا لأن أجزاء المادة العضوية الأساسية في التربة أو ‘البرك’ (على سبيل المثال، المادة العضوية الجزيئية أو المرتبطة بالمعادن) يمكن أن تظهر استجابات مختلفة للاحتباس الحراري في التلاعبات المعملية والميدانية .
الشكل 1 | التوزيع العالمي لمخزونات الكربون في التربة المستمدة من الملاحظات كدالة لدرجة الحرارة المناخية والمعادن الطينية والطفيلية. أ، ب، إجمالي مخزونات الكربون في التربة (أ) ونسبة إجمالي الكربون في التربة المحمي (المعادن المرتبطة) (ب) كدالة لدرجة الحرارة السنوية المتوسطة (MAT) عالميًا.
كل خلية شبكية ملونة حسب نسبة المعادن الطينية والطفيلية، وتظهر الاتجاهات الأفضل ملاءمة للتربة ذات القوام الناعم والخشن؛ هنا، تم تصنيف التربة ذات القوام الناعم على أنها تلك التي تحتوي على محتوى الطين + الطفيل والتربة ذات القوام الخشن مع محتوى الطين + الطفيل.
لذا فإن فهم وقياس الحساسية الحرارية لهذه البرك الأساسية على النطاق العالمي أمر حاسم للتنبؤ بدقة بردود الفعل الناشئة وضعف الكربون العضوي في التربة تجاه المناخ المتغير.
تسرع درجات حرارة التربة الأكثر دفئًا من معدل تحلل المادة العضوية، مما يؤدي غالبًا إلى فقدان مخزونات الكربون في التربة الكلية . ومع ذلك، يمكن أن تعتمد القابلية المحتملة لتحلل المادة العضوية في تربة معينة على ارتباطها بالمعادن . تتكون المادة العضوية المرتبطة بالمعادن من وحدات صغيرة مشتقة من النباتات أو الميكروبات وبيوبوليمرات مرتبطة كيميائيًا أو فيزيائيًا بالمعادن ذات الحجم الطيني والطفيل، بينما تتكون المادة العضوية الجزيئية إلى حد كبير من قطع أكبر، جزئيًا متحللة من المواد النباتية . يمكن أن تحد الارتباطات المعدنية من وصول المكونات الميكروبية وإنزيماتها إلى المادة العضوية، ونتيجة لذلك، غالبًا ما يكون الكربون المرتبط بالمعادن أقدم من الجزيئي . في نماذج الكيمياء الحيوية للتربة، يمكن تمثيل هذه البرك بشكل صريح أو ضمنيًا (انظر ‘قابلية تفسير برك النماذج’ في الطرق)، مع تداعيات على دينامياتها العابرة واستجابتها طويلة الأجل للظروف الجديدة. من أجل التناسق عبر البيانات والنماذج، نشير إلى الكربون المرتبط بالمعادن (وبرك الدورة الأبطأ) على أنه ‘محمي’ والكربون الجزيئي (وكل برك النماذج الأخرى) على أنه ‘غير محمي’، مع الاعتراف بأن التوافر الحيوي واستمرارية كل بركة أكثر تعقيدًا في الممارسة العملية . من المهم أن يبقى الكثير من عدم اليقين في استجابات الكربون المحمي وغير المحمي في التربة للاحتباس الحراري عبر نطاقات مكانية واسعة ، مما يعيق جهود مرجعية النماذج.
تقييم الديناميات العابرة لنماذج الكيمياء الحيوية للتربة للاحتباس الحراري لا يزال يمثل تحديًا، جزئيًا لأن ملاحظات الكربون في التربة على نطاقات زمنية متعددة العقود إلى قرون محدودة . تظهر الحضانة في المختبر والدراسات الميدانية أن معدلات التحلل تزداد، وغالبًا ما تنخفض مخزونات الكربون، مع الاحتباس الحراري . ومع ذلك، على نطاقات زمنية متعددة العقود، قد تحد الاستجابات التكيفية في النشاط الميكروبي من تأثير الاحتباس الحراري على معدلات التحلل . علاوة على ذلك، تركز العديد من التجارب على استجابة مخزونات الكربون في التربة الكلية، ولا تقيس أو تبلغ عن الاستجابات النسبية لأجزاء الكربون الأساسية في التربة. نظرًا لهذه القيود البيانية، فإن نهجًا بديلاً هو مرجعية النماذج العالمية باستخدام تدرجات مكانية – على الرغم من أن هذا النهج غير كافٍ لتقييد الديناميات العابرة (أي، افتراضات المكان مقابل الزمن) ، فإن تدرجات المناخ تعكس حساسيات درجات الحرارة المناخية طويلة الأجل التي ينبغي، من حيث المبدأ، أن تلتقطها نماذج الكربون في التربة.
هنا نقيم الحساسية الحرارية المناخية لمخزونات الكربون في التربة الكلية، ودور برك الكربون المرتبطة بالمعادن والجزيئية في دفع هذه الخاصية الناشئة في البيانات والنماذج. أولاً، نستفيد من منتج بيانات عالمي مصفوفة من الكربون المرتبط بالمعادن
والكربون الجزيئي في التربة (المستمد من تجميع ملاحظات أجزاء التربة ) لتحديد توزيع الكربون العضوي في التربة بين هاتين البركتين وحساسياتهما الحرارية المناخية على النطاق العالمي. ثم نقيم التوزيعات وحساسيات درجات الحرارة لمخزونات الكربون المحمي (مثل المرتبطة بالمعادن) وغير المحمي (مثل الجزيئية) عبر مجموعة من 12 نموذجًا عالميًا – وهي تسعة نماذج من النظام الأرضي (ESMs) من مشروع المقارنة بين النماذج المتصلة المرحلة 6 (CMIP6) وثلاثة نماذج أراضي غير متصلة ، بما في ذلك نموذجين للكربون في التربة بشكل ميكروبي (الجداول التكميلية 1-3). على الرغم من وجود اعتبارات مهمة بشأن قابلية تفسير البرك المودلة والأجزاء المقاسة (انظر ‘قابلية تفسير برك النماذج’ في الطرق)، فإن المعايير الخاصة بالبرك تقدم فرصة حاسمة لتحسين صيغ النماذج وتقليل عدم اليقين. نرى أن حل توزيع وحساسيات درجات الحرارة للبرك الأساسية من الكربون في التربة أمر ضروري لتطوير فهم تنبؤي للاعتماد الحراري الناشئ لتحلل الكربون في التربة الكلية وتقييد النماذج الكيميائية الحيوية العالمية.

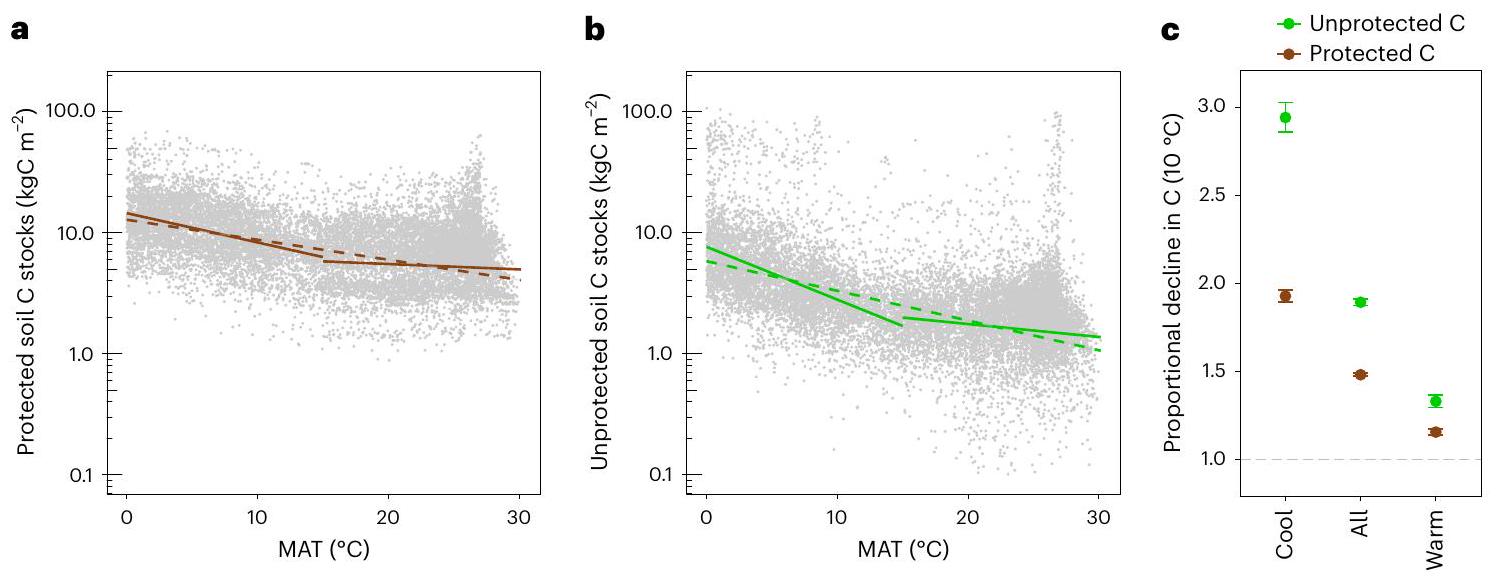
الحساسية الحرارية المناخية لبرك الكربون في التربة

من المعروف أن مخزونات الكربون العضوي في التربة تنخفض بشكل عام مع زيادة درجة الحرارة عبر تدرجات المناخ . ومع ذلك، يمكن أن تختلف شدة هذه الحساسية الحرارية المناخية عبر التربة . في الواقع، يبدو أن هذه العلاقة تتأثر بمحتوى الطين والطفل، حيث أن التربة ذات القوام الناعم (أي التربة التي تحتوي على كميات أكبر من معادن الطين والطفل) لديها حساسية حرارية مناخية أقل مقارنة بالتربة الرملية ذات القوام الخشن (مستنتج من القوة النسبية للعلاقات في الشكل 1a). يمكن أن تُعزى هذه الحساسية الحرارية المتباينة جزئيًا إلى القدرة المعدنية لكل نوع من التربة. ، ولكن بشكل أكثر تحديدًا لتأثيره على توزيع الكربون في التربة بين تجمعات الكربون المرتبطة بالمعادن وتجمعات الكربون الجزيئية. نظرًا لأن الكربون المرتبط بالمعادن غالبًا ما يكون له حساسية حرارية أقل من الكربون الجزيئي يمكن أن تلعب نسبة الكربون المرتبطة بالمعادن دورًا رئيسيًا في دفع حساسية درجة حرارة التربة الكلية الناشئة (انظر المخطط المفاهيمي في الشكل التوضيحي 1).
عالمياً، تشير نتائجنا إلى أن نسبة الكربون في التربة المرتبطة بالمعادن (المشار إليها فيما بعد بـ ‘المحمية’ من أجل التناسق مع نماذج التجمعات تزداد ( ) مع زيادة متوسط درجة الحرارة (الشكل 1ب؛ وهو اتجاه لا تلتقطه معظم النماذج العالمية (الأشكال التكميلية 2 و 3)). علاوة على ذلك، تحتوي التربة ذات القوام الناعم على نسب أكبر من الكربون المحمي مقارنة بالتربة ذات القوام الخشن عبر جميع درجات الحرارة. لذلك نتوقع أن تظهر التربة ذات القوام الناعم حساسية حرارية مناخية أقل مقارنة بالرمال ذات القوام الخشن.
الشكل 2 | التوزيع العالمي للتربة المحمية وغير المحمية المستمدة من الملاحظات المخزونات كدالة لدرجة الحرارة المناخية. الكتل الكربونية في التربة المحمية (المعتمدة على المعادن) (أ) وغير المحمية (الجزيئية) (ب) كدالة لدرجة الحرارة المتوسطة السنوية في المناطق فوق عالمياً. يتم عرض الانحدارات الخطية لـ ودافئ ( ) المناطق (الخطوط الصلبة) وعبر جميع درجات الحرارة فوق (خطوط منقطة). ج، حساسية درجة الحرارة المناخية المحسوبة كنسبة الانخفاض لكل مجموعة من كربون التربة لـ زيادة في MAT (مماثلة لـ ” المناخية ، ولكن بالنسبة لأسهم C)
محاسبة المتغيرات المربكة المحتملة (انظر ‘تحليل البيانات’ في الطرق). النقاط تمثل الانخفاض النسبي لكل مجموعة من مجموعات الكربون في التربة (المستمدة من انحدارات الانحدار؛ خلايا الشبكة للتربة المعدنية غير المتجمدة فوق عالمياً، مع في المناطق الباردة و في المناطق الدافئة)، وتدل أشرطة الخطأ على CIs (الجدول التكميلي 6). قيم أعلى ( تشير ) إلى انخفاضات أكبر في C مع زيادة درجة الحرارة المناخية.
التربة التي تحتوي على مخزونات كربون غير محمية أعلى تؤدي إلى حساسية أكبر لدرجة الحرارة. تظهر حساسية درجة الحرارة المناخية لكربون التربة الكلي من توزيعات المخزونات الأساسية واعتمادياتها على درجة الحرارة.
لتقييم حساسية درجة الحرارة المناخية لكل مجموعة من مخزونات الكربون في التربة، قمنا بحساب الانخفاض النسبي في مخزونات الكربون لكل زيادة في متوسط درجة الحرارة مع التحكم في العوامل المربكة المحتملة التي تشمل الإنتاجية الأولية، وهطول الأمطار، ومحتوى الطين والطفيل (الطرق). تعتمد طريقتنا على الدراسات السابقة “ويقدم مقياسًا مرجعيًا مشابهًا لـ” المناخية (أي، الزيادة في معدلات العمليات لكل زيادة في درجة الحرارة) ولكن لأسهم الكربون بدلاً من معدلات التنفس أو معدل الدوران . نجد أنه على المستوى العالمي، فإن مخزونات الكربون غير المحمية لديها ( فترة الثقة (CI): 26,30%) حساسية درجة الحرارة المناخية أكبر من مخزونات الكربون المحمية (الشكل 2). هذه النمط بارز بشكل خاص في المناطق الباردة. حيث C غير محمي ، ) أكثر حساسية لدرجة الحرارة من C المحمي، مقارنة بالمناطق الدافئة ( حيث الفرق النسبي هو فقط كلا خزانات الكربون في التربة تظهر حساسية ضعيفة لدرجات الحرارة المناخية في المناطق الدافئة (الشكل 2c). تشير هذه النتيجة الأخيرة إلى أن التحلل في المناطق الباردة محدود أكثر بدرجات الحرارة، وأن المناطق الدافئة لا تشهد انخفاضًا حادًا في كربون التربة مقابل زيادة معينة في متوسط درجة الحرارة. تدعم دراسات التدرج في التربة الاستوائية هذه الفروق. ، ويتماشى مع دراسات الحضانة التي تظهر أن المجتمعات الميكروبية المتكيفة مع الحرارة عادة ما تظهر حساسية أقل لدرجات الحرارة (أي، ) وكفاءات أعلى لنمو الميكروبات . علاوة على ذلك، تحتوي المناطق الدافئة على نسب أعلى من الكربون المحمي (الشكل 1ب)، بحيث تعكس حساسية درجة حرارة الكربون في التربة الكلية الناشئة بشكل أقرب تلك الخاصة بحوض الكربون المحمي. لذلك، فإن نسبة الكربون المحمي بالإضافة إلى حساسيتها لدرجات الحرارة المناخية، قد تكون بمثابة معيار مهم لتقييم النماذج العالمية.

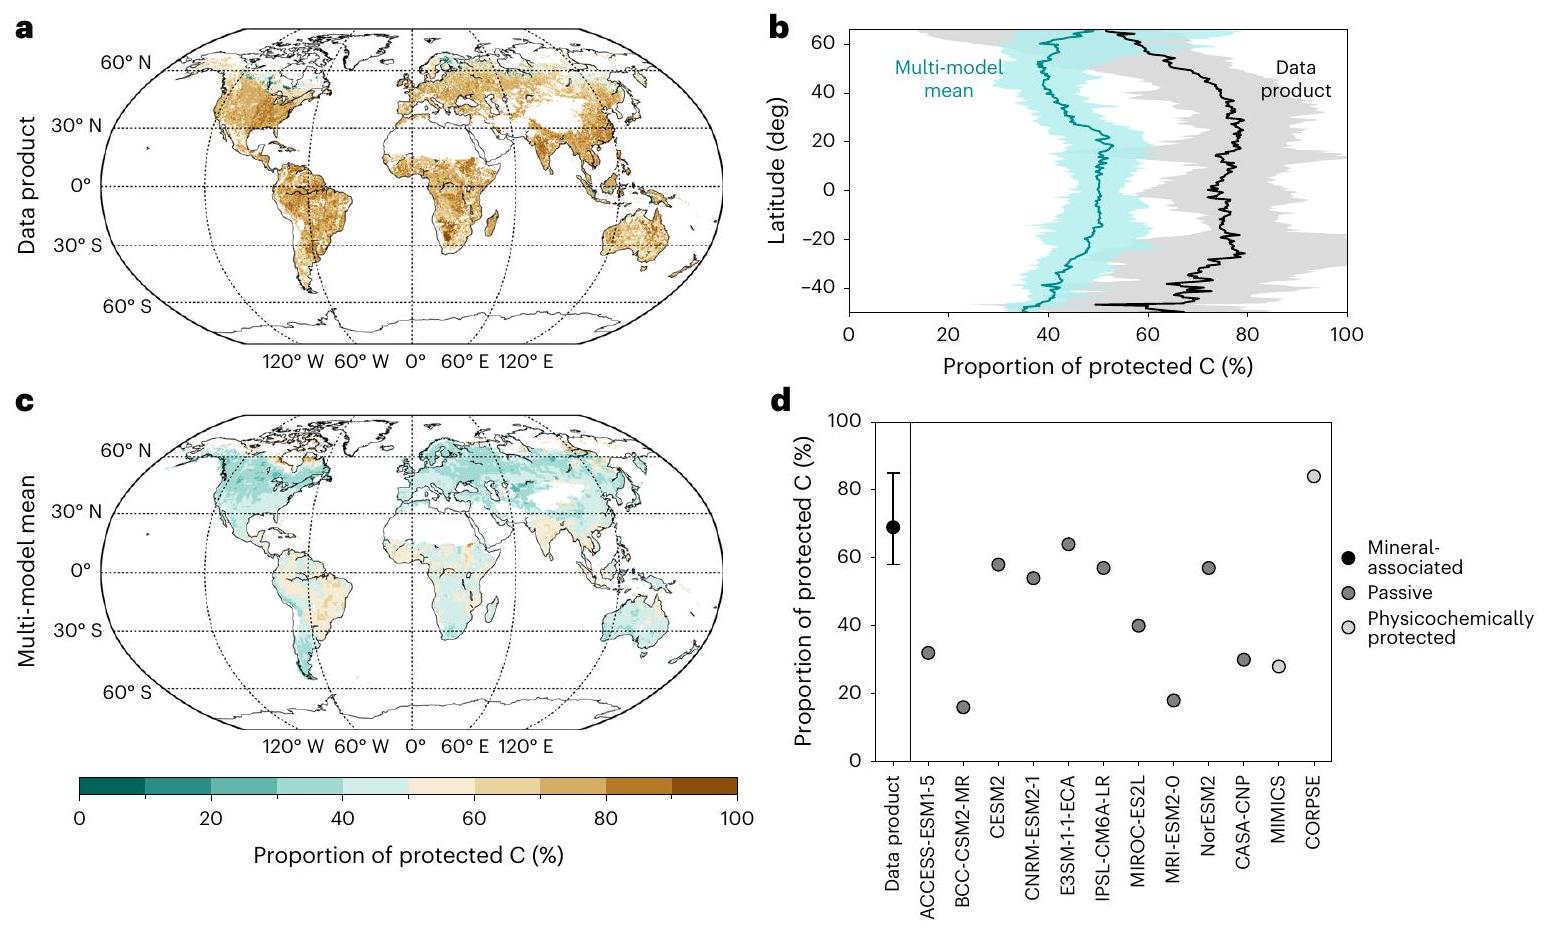
أنماط عالمية في خزانات الكربون في التربة عبر البيانات والنماذج

تختلف نماذج الكربون في التربة في افتراضاتها الأساسية، والتمثيلات الرياضية، والمعلمات. ومع ذلك، اقترحت عدة دراسات أن أبطأ دورة (‘سلبية’) من كربون التربة في العديد من نماذج النظام البيئي تتوافق بشكل عام مع الكربون المرتبط بالمعادن (المحمية). . هذا يعكس تصورًا شائعًا لمصادر مجموعة المانحين،
التحكمات المعدنية، أوقات التدوير والستيوكيومترية للكربون المحمي الذي يُستخدم لتقريب تشكيل وخصائص المادة العضوية المرتبطة بالمعادن (انظر ‘قابلية تفسير نموذج الحوض’ في الطرق). وبالتالي، نتبنى هذا التقليد هنا، مع الاعتراف بأن هناك لا تزال عدم يقين جوهري في قابلية تفسير الأحواض المودلّة والكسور المعرفة عمليًا. نفترض أن المعايير المستندة إلى توزيعات الأحواض النسبية، جنبًا إلى جنب مع أعمار الكربون المشع سيكون ذلك حاسمًا لتحسين معلمات النموذج المستقبلية وتقييد الديناميات العابرة.
عادةً ما يتم تقييم نماذج الكربون في التربة العالمية استنادًا إلى مقاييس الكربون في التربة الكلية. . ومع ذلك، حتى النماذج التي تتنبأ بمخزونات الكربون في التربة الكلية المماثلة يمكن أن تختلف بشكل كبير في توزيعات المجموعات الأساسية لها (الشكل التكميلي 4). بينما تتفاوت مخزونات الكربون في التربة الكلية في التربة المعدنية غير المتجمدة بمقدار 2.5 مرة عبر نماذج CMIP6 ESM ونماذج الأراضي غير المتصلة في هذه الدراسة، فإن التربة المحمية تتفاوت الأسهم تقريبًا سبعة أضعاف. ونتيجة لذلك، تتراوح نسبة C المحمية من 16 إلى عبر النماذج العالمية (الشكل 3 والجدول التكميلي 4). إن هذا الانتشار الكبير في توقعات النماذج يمثل فرصة حاسمة لتطبيق قيود مدفوعة بالبيانات وتقليل عدم اليقين. نجد أن حوالي نصف نماذج النظام البيئي المدروسة تقدر نسبة الكربون المحمي في التربة على مستوى العالم بأقل من الواقع مقارنة بمنتج البيانات المستند إلى الملاحظات، وبالتالي تحتوي على كربون زائد في خزانات الكربون غير المحمية ذات الدورة السريعة. هذه النتيجة صحيحة بشكل خاص في التربة المعدنية غير المتجمدة، حيث تقدر العديد من النماذج العالمية نسبة الكربون المحمي في كل من المناطق الباردة والدافئة بأقل من الواقع (الشكل التكميلي 5 والجدول التكميلي 5). على وجه الخصوص، تلتقط ستة نماذج (CESM2، CNRM-ESM2-1، E3SM-1-1-ECA، IPSL-CM6A-LR، NorESM2 ونموذج CORPSE المعتمد على الميكروبات) تقريبًا نسبة الكربون المحمي، بينما تقدر النماذج الستة الأخرى (ACCESS-ESM1-5، BCC-CSM2-MR، MIROC-ES2L، MRI-ESM2-0، CASA-CNP ونموذج MIMICS المعتمد على الميكروبات) هذه النسبة بشكل كبير بأقل من الواقع (الشكل 3d). ومع ذلك، نلاحظ أن جميع النماذج في هذه الدراسة قابلة للتكيف مع قيود محددة للخزانات في الأعمال المستقبلية – في الواقع، كانت كل من الصيغ من الدرجة الأولى والصيغ المعتمدة على الميكروبات مع تحسينات في المعلمات قادرة على مطابقة الملاحظات بشكل أفضل في الدراسات السابقة. . ومع ذلك، تشير نتائجنا عمومًا إلى أن الكربون في التربة يميل نحو تجمعات الكربون ذات الدورة الأسرع في عدة نماذج عالمية، وهو ما يتماشى مع دراسات المعايير المستندة إلى الكربون المشع التي أظهرت أن النماذج البيئية الحالية تقدر بشكل غير كافٍ متوسط عمر الكربون في التربة عبر خطوط العرض. .
الشكل 3 | نسبة الكربون في التربة في البرك المحمية عالميًا عبر البيانات والنماذج. أ-ج، النسبة المئوية لإجمالي كربون التربة المحمي في المنتج المستمد من الملاحظات وفي المتوسط المتعدد النماذج لمجموعة نماذج CMIP6 ESMs ونماذج الأراضي غير المتصلة، موضحة عالميًا (أ، ج) وكمتوسطات عرضية ( ؛ خطوط صلبة). نطاقات عدم اليقين المظللة في يتوافق مع فترات التنبؤ لمنتج البيانات ، والنسب المئوية الخامسة والخامسة والتسعين من مجموعة النماذج المتعددة عبر كل نطاق عرض جغرافي. د، النسبة العالمية لإجمالي الكربون في التربة الذي يتم حمايته عبر نماذج ESM الفردية ونماذج الأراضي غير المتصلة.
محمي تم تقديرها كجزء مرتبط بالمعادن لمنتج البيانات، والمسابح المحمية فيزيائيًا وكيميائيًا في MIMICS وCORPSE، وأبطأ تجمع غير نشط في نماذج CMIP6 ESMs وCASA-CNP (انظر ‘قابلية تفسير تجمع النموذج’ في الطرق). يتم تقديم المتوسطات العالمية للتربة المعدنية غير المتجمدة، باستثناء التندرا والصحاري والأراضي الخثية. خلايا الشبكة لـ الدقة)، ونطاق عدم اليقين لمنتج البيانات يتوافق مع فترة التنبؤ (ملخص في الجدول التكميلي 5).
في خطوط العرض العليا، تُظهر النماذج الدقيقة الميكروبية نسبة أقل من الكربون المحمي (الشكل التكميلي 4)، وهو ما يتماشى مع الدراسات الحديثة. يدعم منتج البيانات المستمد من الملاحظات أيضًا هذا الاتجاه العرضي (الشكل 3ب). بالمقابل، تُظهر عدة نماذج من CMIP6 نسبة أكبر من الكربون المحمي عند خطوط العرض العليا (خصوصًا فوق “; الشكل التوضيحي الإضافي 3)، مما يشير إلى أن قابلية تفسير الحوض المحمي كمرتبط بالمعادن قد تتعطل في هذه المناطق ضمن نماذج CMIP6 معينة. على سبيل المثال، في النماذج التي تحتوي على كيمياء حيوية للتربة ذات الدقة الرأسية (CESM2، E3SM-1-1-ECA وNorESM2) قد تكون هذه النسب الأكبر من الكربون المحمي ناتجة عن الأطر الزمنية النسبية لعمليات التحلل والخلط العمودي. وذلك لأن كربون الطبقة النشطة في المناطق ذات العرض الجغرافي العالي يتم نقله إلى طبقات التربة المتجمدة عبر معدل انتشار ثابت بطيء يمثل التموجات الجليدية. ، مما ينقل بالتالي جزءًا أكبر من الكربون بطيء الدوران مقارنةً بمخزونات الكربون سريعة الدوران. بينما يكون الكربون في التربة قديمًا بالفعل في هذه العروض العليا إن تحللها محدود أكثر بسبب درجات الحرارة المنخفضة التي تقلل من توفر الماء السائل بدلاً من ارتباطها بالمعادن. نظرًا لأن درجة الحرارة والهيدرولوجيا يمكن أن تتغير على مدى عقود، فإن تمثيل المواد العضوية طويلة الأمد في المناطق ذات العرض العالي كخزان بطيء الدورة بشكل جوهري (على عكس الأشكال الجزيئية غير المحمية التي يمكن أن تكون أكثر حساسية للاضطراب) لها تداعيات مهمة على استجابة خزانات الكربون في التربة المتجمدة الدائمة للتغير المناخي المتوقع (الأشكال التكميلية 6-8).

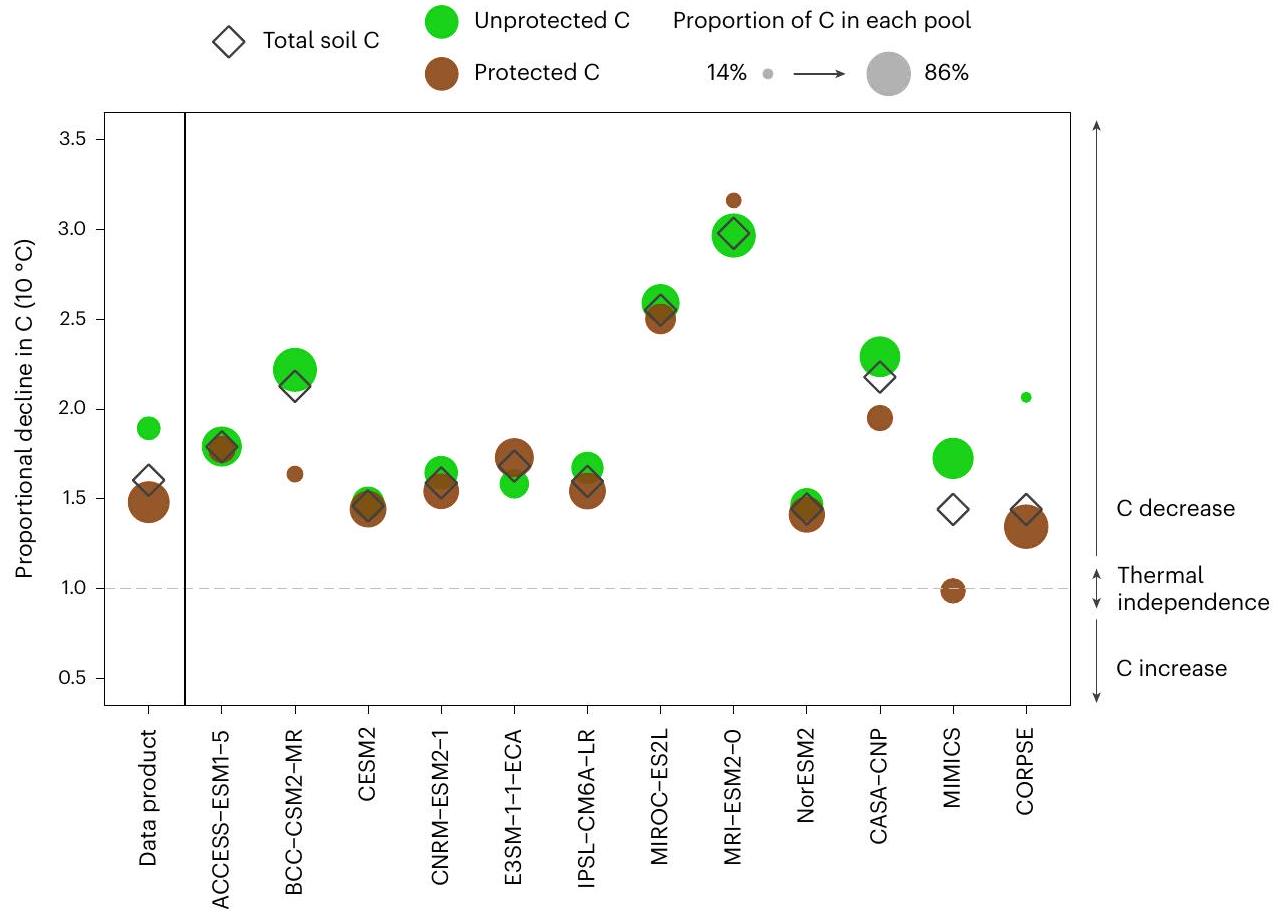
حساسية الكربون في التربة لدرجة الحرارة في النماذج العالمية

حساسية درجة الحرارة المناخية لكتلة الكربون في التربة هي خاصية ناشئة تعتمد في النهاية على توزيع الكربون ضمن الخزانات الأساسية وحساسيات درجة الحرارة الخاصة بها. بينما
قد تبدو بعض النماذج قادرة على التقاط حساسية درجة الحرارة المناخية المستمدة من الملاحظات لكتل الكربون في التربة، لكن هذا الاتفاق لا يحدث دائمًا للأسباب الصحيحة وقد ينهار عند النظر في مساهمة خزانات الكربون في التربة المحمية وغير المحمية. على سبيل المثال، ستة من نماذج CMIP6 ESMs (ACCESS-ESM1-5، CESM2، CNRM-ESM2-1، E3SM-1-1-ECA، IPSL-CM6A-LR وNorESM2) ونموذجان محددان ميكروبيًا (MIMICS وCORPSE) تلتقط تقريبًا حساسية درجة الحرارة لكتل الكربون في التربة (الشكل 4 والجدول التكميلي 6). ومع ذلك، تظهر هذه النماذج نفسها توزيعات متباينة وحساسيات درجة حرارة مناخية لخزانات الكربون في التربة المحمية وغير المحمية (الشكل 4). فقط عدد قليل من النماذج تلتقط تقريبًا حساسية درجة الحرارة المناخية للكربون المحمي (CESM2، CNRM-ESM2-1، IPSL-CM6A-LR، NorESM2 وCORPSE) وأقل منها للكربون غير المحمي (ACCESS-ESM1-5، MIMICS وCORPSE).
تشير البيانات المستمدة من الملاحظات بشكل عام إلى أن الكربون المحمي لديه حساسية حرارية مناخية أقل من الكربون غير المحمي (الشكل 2). تتفق النماذج عمومًا مع هذا الاتجاه، على الرغم من أن الفرق في حساسية درجات الحرارة المناخية بين الأحواض أقل وضوحًا في نماذج CMIP6 مقارنة بالنماذج الدقيقة الميكروبية (الشكل 4). قد ينشأ هذا الفرق لأن العديد من نماذج التربة من الدرجة الأولى تفرض نفس معلمات الاعتماد على درجة الحرارة عبر جميع الأحواض. ، وبالتالي فإن حساسية درجات الحرارة المناخية الناشئة غالبًا ما تكون مشابهة بين المجمعات. هناك بعض الاستثناءات الملحوظة بين نماذج CMIP6، حيث يبدو أن الكربون غير المحمي أقل حساسية لدرجات الحرارة مقارنة بالكربون المحمي (وهي، على وجه الخصوص، MRI-ESM2-0 وإلى حد أقل E3SM-1-1-ECA (الشكل 4)، بالإضافة إلى CESM2 وCNRM-ESM2-1 وMIROC-ES2L وNorESM في المناطق الباردة (الشكل التكميلي 9)). قد ينشأ هذا بسبب معلمات حساسية درجة الحرارة المستندة إلى تعقيد جزيئي أكبر مفترض.
الشكل 4 | الحساسية الحرارية المناخية لإجمالي الكربون في التربة ومساهمة الأحواض المحمية وغير المحمية. الحساسية الحرارية المناخية لإجمالي الكربون في التربة (المشار إليها بالماس) هي خاصية ناشئة عن الحساسية الحرارية المناخية للأحواض المحمية (دوائر بنية) وغير المحمية (دوائر خضراء) من الكربون في التربة، بالإضافة إلى النسبة من داخل كل من هذه المجموعات (المشار إليها بمنطقة العلامة). الانخفاض النسبي في C لـ تم حساب الزيادة في MAT لكل مجموعة C، مع التحكم
للعوامل المحتملة المربكة (انظر ‘تحليل البيانات’ في الطرق). تظهر النتائج لمنتج البيانات ومجموعة من نماذج ESM ونماذج الأراضي غير المتصلة عبر خلايا الشبكة مع MAT على مستوى العالم؛ يتم تقديم فترات الثقة 95% في الجدول التكميلي 6. القيم الأعلى ( تشير القيم الأكبر إلى انخفاضات أكبر في C مع زيادة درجة الحرارة المناخية، بينما تشير القيم الأقل من 1 (<1) إلى زيادات في C، والقيم التي تساوي 1 (الخط المنقط الرمادي) تشير إلى الاستقلال الحراري.
لـ C المحمية في نماذج مختارة في النهاية، يمكن أن تكون الحساسية الحرارية المناخية المميزة لبرك الكربون في التربة الأساسية التي تم ملاحظتها في بيانات المنتج والنماذج المعتمدة على العمليات لها تداعيات مهمة على التوقعات العابرة، خاصة فيما يتعلق بأعمار الكربون واستجابة النظام البيئي، وتشكل معيارًا مهمًا لتقييم أداء النماذج.
نظرًا لأن الكربون المحمي يشكل الغالبية العظمى من كربون التربة الكلي على مستوى العالم في منتج البيانات (الشكل 3d)، فإنه يهيمن أيضًا على حساسية درجة الحرارة المناخية لمخزونات كربون التربة الكلي (الشكل 4). ومع ذلك، فإن العديد من النماذج لا تلتقط هذه النمط. في الواقع، يهيمن الكربون غير المحمي على مخزونات كربون التربة الكلي وحساسية درجة الحرارة المناخية في بعض النماذج (BCC-CSM2-MR، MRI-ESM2-0، CASA-CNP وMIMICS)، بينما تحتوي معظم النماذج الأخرى على نسب مماثلة وحساسيات درجة حرارة لمخزونات الكربون الأساسية. فقط عدد قليل من النماذج العالمية لديها نسب مرتفعة بما يكفي من الكربون المحمي لدفع حساسية درجة الحرارة المناخية الكلية التي تهيمن عليها مجموعة الكربون المحمي (على سبيل المثال، E3SM-1-1-ECA وCORPSE)، كما لوحظ في منتج البيانات (الشكل 4 والشكل التكميلي 9).
علاوة على ذلك، يمكن أن تختلف حساسية درجات الحرارة المناخية لكتل الكربون في التربة ودورانها عبر المناخات، حيث تكون الاعتماديات على درجة الحرارة عادةً أعلى في المناخات الباردة مقارنةً بالمناخات الدافئة. ومع ذلك، لم يتم استكشاف حساسية درجات الحرارة لبرك الكربون في التربة الأساسية ضمن هذه الأنظمة المناخية في النماذج أو الملاحظات على نطاق عالمي. نجد أن كل من برك الكربون المحمية وغير المحمية تظهر حساسية أكبر لدرجات الحرارة المناخية في المناخات الباردة مقارنة بالمناخات الدافئة، ولكن من المثير للاهتمام أن هذا التباين عبر المناخات يكون أكثر وضوحًا بالنسبة للكربون غير المحمي مقارنة بالكربون المحمي، وخاصة في المنتج المستمد من الملاحظات مقارنة بالنماذج العالمية (الأشكال 2 و5 والأشكال التكميلية 9-11).
بشكل عام، تُظهر تحليلاتنا أن النماذج العالمية تميل إلى المبالغة في تقدير حساسية درجة الحرارة المناخية المحمية. الأسهم في
كلا المناخين البارد والدافئ، وكلا برك الكربون في المناخات الدافئة (الشكل 5). هذا صحيح بشكل خاص بالنسبة لـ MIROC-ES2L و CASA-CNP و MRI-ESM2-0، التي تفرط في تقدير الحساسية المناخية للمناطق المحمية. بأكثر من عاملين. ومع ذلك، تميل النماذج العالمية إلى التقليل من حساسية درجة الحرارة المناخية للكربون غير المحمي في المناخات الباردة (الشكل 5). تشير عدم قدرة معظم نماذج النظام البيئي إلى مطابقة هذه الأنماط الإقليمية إلى أن الاستجابة المؤقتة للاحتباس الحراري قد تكون أيضًا متحيزة، خاصة في المناخات الباردة. قد يكون الكربون المحمي (ذو الدورة الأبطأ) في نماذج النظام البيئي حساسًا بشكل مفرط للاحتباس الحراري في المناطق الباردة، بينما قد لا يكون الكربون غير المحمي (ذو الدورة الأسرع) حساسًا بما فيه الكفاية للاحتباس الحراري، مما يؤثر على ديناميات الكربون في التربة وتوزيعات الأعمار تحت السيناريوهات المستقبلية.

الآثار ووجهات النظر المستقبلية

نقترح أن توزيعات وحساسيات درجة الحرارة المناخية لبرك الكربون في التربة الأساسية هي خصائص نظام بيئي ينبغي أن تتوقع النماذج العالمية إعادة إنتاجها. تسلط نتائجنا الضوء على أنه حتى نماذج النظام البيئي العالمية التي تتنبأ بمخزونات الكربون في التربة الكلية وحساسيات درجة الحرارة المناخية المماثلة يمكن أن تختلف بشكل كبير في توقعاتها لبرك الكربون في التربة الأساسية، مما يؤثر على أعمار الكربون واستجابة النظام البيئي تحت ظروف متغيرة. على وجه الخصوص، بسبب تقدير مفرط للكربون في البرك غير المحمية (الأسرع في الدورة)، قد تكون عدة نماذج ESMs من CMIP6 حساسة للغاية لمدخلات الكربون وقد تفرط في تقدير آثار زيادة الإنتاج الأولي على إمكانية احتجاز الكربون في التربة (على سبيل المثال، مع زيادات كبيرة في الكربون غير المحمي؛ الشكل التوضيحي 6)؛ وهو اكتشاف يتفق مع دراسات مستقلة تعتمد على الكربون المشع. . وهذا يعني أن تقديرات النموذج لمقدار احتجاز الكربون الذي قد ينتج عن تغير المناخ و قد يكون تخصيب النظم البيئية الأرضية قويًا جدًا. علاوة على ذلك، تميل معظم نماذج النظام البيئي إلى التقليل من حساسية درجة الحرارة المناخية للكربون غير المحمي في المناخات الباردة، مما قد يؤدي إلى تقدير منخفض لفقدان الكربون من
ب
منتج بيانات ACC ACCESS-ESM1-5 E3S إي 3 إس إم – 1 – 1 – إي سي إيه ولا نورسم2
* متوسط النماذج المتعددة نسخة مخفية بي سي سي – سي إس إم 2 – إم آر نظام تحديد المواقع الداخلي IPSL-CM6A-LR كاس كاسا-سي إن بي
* مخرجات النموذج CES CESM2 مير MIROC-ES2L ميم مقلدات
سي إن آر سي إن آر إم – إي إس إم 2-1 الرنين المغناطيسي إم آر آي – إي إس إم 2 – 0 كور جثة
الشكل 5|حساسية درجة الحرارة المناخية للتربة المحمية وغير المحمية عبر أنظمة درجات الحرارة. أ، ب، الانخفاض النسبي في مخزونات الكربون في التربة المحمية (أ) وغير المحمية (ب) لـ زيادة في MAT، مع التحكم في المتغيرات المربكة المحتملة. يتم عرض الانخفاضات النسبية للمناخات الباردة ( حصيرة ; دوائر زرقاء) ومناخات دافئة (MAT ; دوائر حمراء). تظهر النتائج لمنتج البيانات (مثلثات سوداء)، ومتوسط مجموعة النماذج المتعددة (نجوم) وكل نموذج ESM ونموذج الأرض غير المتصل (صلب
دوائر؛ مُعلمة بالاختصارات)؛ تم تقديم فترات الثقة 95% في الجدول التكميلية 6. تُظهر تقديرات كثافة النواة لكل لوحة، موضحة توزيع حساسية درجات الحرارة المناخية عبر مجموعة النماذج لكل مجموعة وبيئة حرارية. القيم الأعلى ( تشير إلى انخفاضات أكبر في C مع زيادة درجة الحرارة المناخية، قيم أقل ) تشير إلى زيادات في والقيم التي تساوي 1 (خط متقطع رمادي) تشير إلى الاستقلال الحراري.
تلك البرك غير المحمية مع الاحترار، هي تقدير غير دقيق لدورة الكربون العالمية – ردود الفعل المناخية وتوقعات تراكم الكربون المدفوعة بالإنتاجية العالية في هذه المناطق. بينما قد يتم تعويض هذا التحيز جزئيًا في نماذج النظام البيئي التي تفرط في تقدير حساسية درجة الحرارة المناخية للكربون المحمي عبر المناخات، فإن تأثير هذا التقدير المفرط على توقعات ردود الفعل لدورة الكربون والمناخ ربما يكون أضعف لأن هذه البرك تتسم بطبيعتها ببطء الدورة في نماذج التربة من الدرجة الأولى وبالتالي تتغير قليلاً جدًا على فترات زمنية ذات صلة بسياسة المناخ (الأشكال التكميلية 6-8). يمكن أن تؤدي الاستجابات الخاصة بالبرك المتباينة في النهاية إلى اختلافات في تركيبة ووظيفة الكربون في التربة. لذلك، من الضروري أن تقوم النماذج بتقييم ليس فقط حساسية المناخ الكلية ولكن أيضًا تلك الخاصة بالبرك الأساسية للكربون في التربة، من أجل التنبؤ بثقة بديناميات الكربون في التربة في المستقبل.
بروتوكول CMIP يطلب ولكن لا يتطلب الإبلاغ عن توزيعات خزانات الكربون في التربة. ، وبالتالي، فإن هذه المعلومات متاحة حاليًا فقط لفئة فرعية من نماذج المحاكاة المناخية من الجيل السادس (CMIP6). تظهر نتائجنا أنه مع التقدم الأخير في التقديرات العالمية لمخزونات الكربون في التربة المحمية وغير المحمية إعادة تعريف وتحديد معايير هذه المجموعات الأساسية من الكربون في التربة يمكن أن يكون بمثابة قيد مهم لنماذج النظام البيئي. لذلك، نحث على أن تقوم جميع النماذج العالمية بالإبلاغ عن توزيع الكربون في التربة بين المجموعات الأساسية في المرحلة السابعة من CMIP وما بعدها، حتى تتمكن الدراسات المستقبلية من الاستفادة من هذا المعيار لتقييم النماذج عبر تدرجات المناخ. على الرغم من أن المزيد من الدراسة للاستجابات العابرة أمر ضروري أيضًا لتقييد النماذج الديناميكية. تعتبر العلاقات الثابتة المعروضة هنا مؤشرات هامة لتأثيرات درجات الحرارة على المدى الطويل على تشكيل وتحلل خزانات الكربون في التربة.

المحتوى عبر الإنترنت

أي طرق، مراجع إضافية، ملخصات تقارير Nature Portfolio، بيانات المصدر، بيانات موسعة، معلومات إضافية، شكر وتقدير، معلومات مراجعة الأقران؛ تفاصيل مساهمات المؤلفين والمصالح المتنافسة؛ وبيانات توفر البيانات والرموز متاحة علىhttps://doi.org/10.1038/s41561-024-01384-7.

References

  1. Friedlingstein, P. et al. Uncertainties in CMIP5 climate projections due to carbon cycle feedbacks. J. Clim. 27, 511-526 (2014).
  2. Davidson, E. A. & Janssens, I. A. Temperature sensitivity of soil carbon decomposition and feedbacks to climate change. Nature 440, 165-173 (2006).
  3. García-Palacios, P. et al. Evidence for large microbial-mediated losses of soil carbon under anthropogenic warming. Nat. Rev. Earth Environ. 2, 507-517 (2021).
  4. Koven, C. D., Hugelius, G., Lawrence, D. M. & Wieder, W. R. Higher climatological temperature sensitivity of soil carbon in cold than warm climates. Nat. Clim. Chang. 7, 817-822 (2017).
  5. Crowther, T. et al. Quantifying global soil C losses in response to warming. Nature 104, 104-108 (2016).
  6. Todd-Brown, K., Zheng, B. & Crowther, T. W. Field-warmed soil carbon changes imply high 21st-century modeling uncertainty. Biogeosciences 15, 3659-3671 (2018).
  7. Van Gestel, N. et al. Predicting soil carbon loss with warming. Nature 554, E4-E5 (2018).
  8. Hicks Pries, C. E., Castanha, C., Porras, R. & Torn, M. S. The whole-soil carbon flux in response to warming. Science 355, 1420-1423 (2017).
  9. Rocci, K. S., Lavallee, J. M., Stewart, C. E. & Cotrufo, M. F. Soil organic carbon response to global environmental change depends on its distribution between mineral-associated and particulate organic matter: a meta-analysis. Sci. Total Environ. 793, 148569 (2021).
  10. Conant, R. T. et al. Temperature and soil organic matter decomposition rates – synthesis of current knowledge and a way forward. Glob. Chang. Biol. 17, 3392-3404 (2011).
  11. Soong, J. L. et al. Five years of whole-soil warming led to loss of subsoil carbon stocks and increased efflux. Sci. Adv. 7, eabd1243 (2021).
  12. Nottingham, A. T., Meir, P., Velasquez, E. & Turner, B. L. Soil carbon loss by experimental warming in a tropical forest. Nature 584, 234-237 (2020).
  13. Pellegrini, A. F. A. et al. Low-intensity frequent fires in coniferous forests transform soil organic matter in ways that may offset ecosystem carbon losses. Glob. Chang. Biol. 27, 3810-3823 (2021).
  14. Lugato, E., Lavallee, J. M., Haddix, M. L., Panagos, P. & Cotrufo, M. F. Different climate sensitivity of particulate and mineral-associated soil organic matter. Nat. Geosci. 14, 295-300 (2021).
  15. Sokol, N. W. et al. Global distribution, formation and fate of mineral-associated soil organic matter under a changing climate: a trait-based perspective. Funct. Ecol. 36, 1411-1429 (2022).
  16. Lavallee, J. M., Soong, J. L. & Cotrufo, M. F. Conceptualizing soil organic matter into particulate and mineral-associated forms to address global change in the 21st century. Glob. Chang. Biol. 26, 261-273 (2020).
  17. Kögel-Knabner, I. et al. Organo-mineral associations in temperate soils: integrating biology, mineralogy, and organic matter chemistry. J. Plant Nutr. Soil Sci. 171, 61-82 (2008).
  18. Heckman, K. et al. Beyond bulk: density fractions explain heterogeneity in global soil carbon abundance and persistence. Glob. Chang. Biol. 28, 1178-1196 (2022).
  19. Wieder, W. R., Allison, S. D., Davidson, E. A., Georgiou, K. & Hararuk, O. Explicitly representing soil microbial processes in Earth system models. Glob. Biogeochem. Cycles 29, 1782-1800 (2015).
  20. Sulman, B. N., Phillips, R. P., Oishi, A. C., Shevliakova, E. & Pacala, S. W. Microbe-driven turnover offsets mineral-mediated storage of soil carbon under elevated . Nat. Clim. Chang. 4, 1099-1102 (2014).
  21. Ahrens, B., Braakhekke, M. C., Guggenberger, G., Schrumpf, M. & Reichstein, M. Contribution of sorption, DOC transport and microbial interactions to the age of a soil organic carbon profile: Insights from a calibrated process model. Soil Biol. Biochem. 88, 390-402 (2015).
  22. Sulman, B. N. et al. Multiple models and experiments underscore large uncertainty in soil carbon dynamics. Biogeochemistry 141, 109-123 (2018).
  23. Wieder, W. R., Sulman, B. N., Hartman, M. D., Koven, C. D. & Bradford, M. A. Arctic soil governs whether climate change drives global losses or gains in soil carbon. Geophys. Res. Lett. 46, 14486-14495 (2019).
  24. Berardi, D. et al. 21st-century biogeochemical modeling: challenges for Century-based models and where do we go from here? Glob. Chang. Biol. Bioenergy 12, 774-788 (2020).
  25. Kleber, M. et al. Dynamic interactions at the mineral-organic matter interface. Nat. Rev. Earth Environ. 2, 402-421 (2021).
  26. Melillo, J. M. et al. Long-term pattern and magnitude of soil carbon feedback to the climate system in a warming world. Science 358, 101-105 (2017).
  27. Walker, T. W. N. et al. A systemic overreaction to years versus decades of warming in a subarctic grassland ecosystem. Nat. Ecol. Evol. 4, 101-108 (2020).
  28. Bradford, M. Thermal adaptation of decomposer communities in warming soils. Front. Microbiol. 4, 333 (2013).
  29. Hartley, I. P., Hill, T. C., Chadburn, S. E. & Hugelius, G. Temperature effects on carbon storage are controlled by soil stabilisation capacities. Nat. Commun. 12, 6713 (2021).
  30. Doetterl, S. et al. Soil carbon storage controlled by interactions between geochemistry and climate. Nat. Geosci. 8, 780-783 (2015).
  31. Abramoff, R. Z., Torn, M. S., Georgiou, K., Tang, J. & Riley, W. J. Soil organic matter temperature sensitivity cannot be directly inferred from spatial gradients. Glob. Biogeochem. Cycles 33, 761-776 (2019).
  32. Luo, Z. et al. Convergent modelling of past soil organic carbon stocks but divergent projections. Biogeosciences 12, 4373-4383 (2015).
  33. Georgiou, K. et al. Global stocks and capacity of mineral-associated soil organic carbon. Nat. Commun. 13, 3797 (2022).
  34. Eyring, V. et al. Overview of the Coupled Model Intercomparison Project Phase 6 (CMIP6) experimental design and organization. Geosci. Model Dev. 9, 1937-1958 (2016).
  35. Jobbágy, E. G. & Jackson, R. B. The vertical distribution of soil organic carbon and its relation to climate and vegetation. Ecol. Appl. 10, 423-436 (2000).
  36. Ahrens, B. et al. Combination of energy limitation and sorption capacity explains depth gradients. Soil Biol. Biochem. 148, 107912 (2020).
  37. Gentsch, N. et al. Temperature response of permafrost soil carbon is attenuated by mineral protection. Glob. Chang. Biol. 24, 3401-3415 (2018).
  38. Giardina, C. P. & Ryan, M. G. Evidence that decomposition rates of organic carbon inmineral soil do not vary with temperature. Nature 404, 858-861 (2000).
  39. Giardina, C. P., Litton, C. M., Crow, S. E. & Asner, G. P. Warming-related increases in soil efflux are explained by increased below-ground carbon flux. Nat. Clim. Chang. 4, 822-827 (2014).
  40. Wang, C. et al. The temperature sensitivity of soil: microbial biodiversity, growth, and carbon mineralization. ISME J. 15, 2738-2747 (2021).
  41. Shi, Z. et al. The age distribution of global soil carbon inferred from radiocarbon measurements. Nat. Geosci. 13, 555-559 (2020).
  42. He, Y. et al. Radiocarbon constraints imply reduced carbon uptake by soils during the 21st century. Science 353, 1419-1424 (2016).
  43. Todd-Brown, K. E. O. et al. Causes of variation in soil carbon simulations from CMIP5 Earth system models and comparison with observations. Biogeosciences 10, 1717-1736 (2013).
  44. Ito, A. et al. Soil carbon sequestration simulated in CMIP6-LUMIP models: implications for climatic mitigation. Environ. Res. Lett. 15, 124061 (2019).
  45. Abramoff, R. Z. et al. Improved global-scale predictions of soil carbon stocks with Millennial Version 2. Soil Biol. Biochem. 164, 108466 (2022).
  46. Zimmermann, M., Leifeld, J., Schmidt, M. W. I., Smith, P. & Fuhrer, J. Measured soil organic matter fractions can be related to pools in the RothC model. Eur. J. Soil Sci. 58, 658-667 (2007).
  47. Pierson, D. et al. Optimizing process-based models to predict current and future soil organic carbon stocks at high-resolution. Sci. Rep. 12, 10824 (2022).
  48. Koven, C. et al. On the formation of high-latitude soil carbon stocks: effects of cryoturbation and insulation by organic matter in a land surface model. Geophys. Res. Lett. https://doi. org/10.1029/2009GL040150 (2009).
  49. Koven, C. D. et al. The effect of vertically resolved soil biogeochemistry and alternate soil C and N models on C dynamics of CLM4. Biogeosciences 10, 7109-7131 (2013).
  50. Plaza, C. et al. Direct observation of permafrost degradation and rapid soil carbon loss in tundra. Nat. Geosci. 12, 627-631 (2019).
  51. Parton, W. J., Schimel, D. S., Cole, C. V. & Ojima, D. S. Analysis of factors controlling soil organic matter levels in Great Plains grasslands. Soil Sci. Soc. Am. J. 51, 1173-1179 (1987).
  52. Haaf, D., Six, J. & Doetterl, S. Global patterns of geo-ecological controls on the response of soil respiration to warming. Nat. Clim. Chang. 11, 623-627 (2021).
  53. Jones, C. D. et al. C4MIP – the Coupled Climate-Carbon Cycle Model Intercomparison Project: experimental protocol for CMIP6. Geosci. Model Dev. 9, 2853-2880 (2016).
  54. Bouskill, N. J., Riley, W. J., Zhu, Q., Mekonnen, Z. A. & Grant, R. F. Alaskan carbon-climate feedbacks will be weaker than inferred from short-term experiments. Nat. Commun. 11, 5798 (2020).
Publisher’s note Springer Nature remains neutral with regard to jurisdictional claims in published maps and institutional affiliations.
Open Access This article is licensed under a Creative Commons Attribution 4.0 International License, which permits use, sharing,
adaptation, distribution and reproduction in any medium or format, as long as you give appropriate credit to the original author(s) and the source, provide a link to the Creative Commons licence, and indicate if changes were made. The images or other third party material in this article are included in the article’s Creative Commons licence, unless indicated otherwise in a credit line to the material. If material is not included in the article’s Creative Commons licence and your intended use is not permitted by statutory regulation or exceeds the permitted use, you will need to obtain permission directly from the copyright holder. To view a copy of this licence, visit http://creativecommons. org/licenses/by/4.0/.
(c) The Author(s) 2024
Physical and Life Sciences Directorate, Lawrence Livermore National Laboratory, Livermore, CA, USA. Climate and Ecosystem Sciences Division, Lawrence Berkeley National Laboratory, Berkeley, CA, USA. Climate and Global Dynamics Laboratory, National Center for Atmospheric Research, Boulder, CO, USA. Institute of Arctic and Alpine Research, University of Colorado, Boulder, CO, USA. Natural Resource Ecology Laboratory, Colorado State University, Fort Collins, CO, USA. Department of Life and Environmental Sciences, University of California Merced, Merced, CA, USA. Ronin Institute, Montclair, NJ, USA. Department of Ecology and Evolutionary Biology, Yale University, New Haven, CT, USA. Department of Physical Geography and Ecosystem Science, Lund University, Lund, Sweden. Department of Plant Sciences, University of Cambridge, Cambridge, UK. Rocky Mountain Research Station, United States Forest Service, Boise, ID, USA. Climate Change Science Institute and Environmental Sciences Division, Oak Ridge National Laboratory, Oak Ridge, TN, USA. Department of Earth System Science, Stanford University, Stanford, CA, USA. Woods Institute for the Environment and Precourt Institute for Energy, Stanford University, Stanford, CA, USA. e-mail: georgiou1@lnl.gov

طرق

مصادر البيانات والمعالجة

كان الهدف الرئيسي من هذه الدراسة هو استخدام التدرجات المكانية الملحوظة في مخزونات الكربون في التربة – وخاصة في الأحواض غير المحمية (الجزيئية) والمحميّة (المعتمدة على المعادن) – وعلاقاتها مع درجة الحرارة، لتطوير معايير لنماذج النظام البيئي. على الرغم من أن هذه المعايير المستمدة من التدرجات المكانية غير كافية لتقييد الاستجابات العابرة أو إجراء التوقعات (أي افتراضات المكان مقابل الزمن). إنها تعكس الفروق في الحالة المستقرة والحساسيات الحرارية المناخية طويلة الأجل لبرك الكربون في التربة. يجب، من حيث المبدأ، أن تتنبأ نماذج الكربون الديناميكية في التربة بهذه الفروق الملحوظة عبر تدرجات المناخ المكاني، وبالتالي، فإن هذه المعايير تعتبر اختبارات مهمة. ومع ذلك، فإن تلبية هذا القيد ليست كافية لضمان قدرة النماذج على إنتاج توقعات دقيقة تحت التغيرات العالمية، لذا نحث على إجراء تجارب تقيس الاستجابات المؤقتة لمخزونات الكربون في التربة عبر مناخات وبيئات حيوية متنوعة. .
تم استخدام مجموعات البيانات المناخية والتربة المستمدة من الملاحظات لجميع التحليلات العالمية في تم تقدير MAT من مجموعة بيانات CRU (الإصدار 3.10) ومتوسط هطول الأمطار السنوي من مجموعة بيانات GPCC كلاهما كمتوسطات سنوية على مدى 30 عامًا. تم الحصول على تغطية الأرض من منتج MODIS MCD12C1 ، وتم تقدير الإنتاجية من منتج الإنتاجية الأولية الصافية من MODIS . وفقًا لـ شي وآخرون تم تقدير مخزونات الكربون العضوي في التربة حتى عمق 1 متر كمتوسط لقاعدة بيانات التربة العالمية المنسقة. و SoilGrids خرائط تعكس أفضل تقدير وعدم اليقين عبر منتجات البيانات. المخزونات المرتبطة بالمعادن من الكربون المقابلة و تم تقدير فترات التنبؤ في جورجيو وآخرون. باستخدام خوارزمية تعلم الآلة (الغابة العشوائية)، تم استخدام عدة طرق للتحقق المتقاطع لتقديم تقييمات دقيقة للقدرة على التنبؤ. . نلاحظ أيضًا أن استنتاجاتنا كانت قوية بالنسبة لطريقة الفصل المختارة (وهي الحجم والكثافة؛ الشكل التوضيحي 5 والجدول التوضيحي 5) وتعكس أفضل تقدير عالمي وعدم اليقين بالنظر إلى الملاحظات الحالية. ومع ذلك، نشجع على إجراء مزيد من القياسات في المناخات الأكثر برودة والتربة الرملية، حيث قد تكون المساهمة النسبية للمواد العضوية الدقيقة أكثر أهمية. في الدراسة الحالية، ركزنا تحليلاتنا على التربة المعدنية غير المتجمدة ذات متوسط درجة الحرارة السنوي. نظرًا لقيود البيانات في خطوط العرض العليا . لاستبعاد التربة التي يحد من تحللها تشبع المياه أو الجفاف، قمنا أيضًا بإزالة خلايا الشبكة التي تحتوي على تغطية تزيد عن 50% من الخث، المحددة كترتيب التربة Histosol أو تحت ترتيب Histel، وتلك التي هي شديدة الجفاف (مع مؤشر جفاف ) أو تتلقى أقل من من الهطول. تم تظليل هذه الخلايا الشبكية باللون الأبيض في جميع الخرائط (الشكل 3) وتم استبعادها من التحليلات اللاحقة.

ناتج نموذج الأرض العالمي

تم الحصول على مخرجات النموذج من نماذج CMIP6 ESMs وثلاثة نماذج اختبار حيوية كيميائية غير متصلة بالإنترنت للتوقعات الحالية (‘تاريخية’) والمستقبلية (‘ssp585’، أو RCP8.5). تم استخدام نماذج CMIP6 التي أبلغت عن توزيعات خزانات الكربون في التربة فقط في هذه الدراسة. تفاصيل النموذج مدرجة في الجداول التكميلية 1-3. تم أخذ مخزونات الكربون والمتغيرات المناخية من كل نموذج على مدى الفترة التاريخية كمتوسطات سنوية لمدة عشر سنوات لمخزونات الكربون ومتوسطات سنوية لمدة ثلاثين سنة للمناخ (تمتد من 2005-2015 و1985-2015، على التوالي) لمطابقة الكميات المستندة إلى الملاحظات. على وجه التحديد، تم استخدام MAT (‘tas’ لنماذج CMIP6)، ومتوسط هطول الأمطار السنوي (‘pr’)، والإنتاجية الأولية الصافية (‘npp’) من كل نموذج. نظرًا لأن النماذج لا تقدم مخزونات كربون محددة العمق، استخدمنا مخزونات الكربون الكلية في التربة (‘cSoil’ لنماذج CMIP6) في تحليلاتنا. على الرغم من أن عمق كربون التربة في نماذج CMIP6 غير محدد بوضوح، فقد قارنته الدراسات السابقة مع مخزونات كربون التربة المتكاملة . نعتقد أن هذا يمثل أفضل معيار للنماذج الحالية ونتبع هذا التوافق العمقي في المقارنة مع البيانات، ولكن نلاحظ أن أي أخطاء في التوافق مع العمق يمكن تقليلها مع النماذج المستقبلية التي تحدد العمق و/أو تحدد فترة العمق بشكل صريح .
بالنسبة للنماذج غير المتصلة بالإنترنت من اختبار حيوية كيميائية (أي CASA-CNP وMIMICS وCORPSE)، تم تقدير كربون المرتبط بالمعادن (المحمي) من خلال الخزانات المحمية فيزيائيًا وكيميائيًا لـ MIMICS وCORPSE، وأبطأ خزانات الدورة (الخاملة) لنموذج CASA-CNP من الدرجة الأولى (انظر Wieder et al. للتفاصيل حول الحماية الفيزيائية والكيميائية داخل النماذج الثلاثة لاختبار حيوية كيميائية). بالمثل، بالنسبة لنماذج CMIP6 من الدرجة الأولى، تم استخدام خزانات كربون أبطأ دورة (‘cSoilSlow’) لتمثيل كربون محمي بالمعادن (انظر ‘قابلية تفسير خزانات النموذج’ في الطرق). نلاحظ أن مستودع مخرجات نموذج CMIP6 يستخدم المصطلح cSoil لمخزونات كربون التربة الكلية و’cSoilFast’ و’cSoilMedium’ وcSoilSlow لثلاث خزانات كربون التربة التي تتوافق مع الخزانات ‘النشطة’ و’البطيئة’ و’الخاملة’، على التوالي.
من بين عشرة نماذج CMIP6 ESM التي أبلغت عن توزيعات خزانات كربون التربة، كان نموذج واحد فقط يمثل تصورا لم يتماشى مع الحماية المعدنية؛ وهو، في TaiESM1، تم تحديد ديناميات كربون التربة ككاسكيد تحلل بناءً على تجميع دراسات الميكروكوزم باستخدام الركائز المشعة . لذلك استبعدنا TaiESM1 من تحليلاتنا، ونلاحظ أن النموذج يمكن إعادة تعريفه وتحديده للمقارنة مع المعايير الخاصة بالخزانات في العمل المستقبلي. كما نؤكد أن ليس كل نماذج كربون التربة من الدرجة الأولى تم صياغتها ككاسكيد تحلل بناءً على المقاومة. بدلاً من ذلك، تمثل عدة نماذج كربون التربة من الدرجة الأولى العمليات الرئيسية بشكل ضمني من خلال إعادة توجيه التدفقات وفرض ضوابط معينة (على سبيل المثال، اللجنين، وملمس التربة، والمناخ) على تشكيل خزانات مختارة (انظر ‘قابلية تفسير خزانات النموذج’ في الطرق؛ الشكل التكميلية 12). إلى أفضل معرفتنا، تشكل النماذج التسع المتبقية من CMIP6 ESM (وهي ACCESS-ESM1-5 وBCC-CSM2-MR وCESM2 وCNRM-ESM2-1 وE3SM-1-1-ECA وMIROC-ES2L وMRI-ESM2-0 وIPSL-CM6A-LR وNorESM2) صياغات تعتمد بشكل واسع على نموذج القرن ومشتقاته، حيث يتماشى خزانات الدورة الأبطأ (الخاملة) مع الحماية الفيزيائية والكيميائية. على الرغم من أن التحديدات في نماذج التربة المنفذة قد تكون انحرفت عن القيم المنشورة، يبدو أن كربون المحمي يتم تعريفه بشكل متسق عبر النماذج التسع المتبقية من CMIP6 ESM (الجدول التكميلية 3). لتسهيل دراسات المعايير المستقبلية وتقليل الشكوك المحتملة، نشجع بشدة على توثيق أكثر تفصيلاً حول التحديدات المنفذة في نماذج التربة ضمن CMIP ESMs.
تمت مقارنة خزانات كربون المحمي في كل نموذج بعد ذلك مع كربون التربة الكلي لكل خلية شبكة على مستوى العالم لحساب نسبة كربون المحمي (الشكل التكميلية 4). تم حساب المتوسط العالمي (مع CIs) لكل نموذج وفي كل نظام درجة حرارة محدد (الشكل 3 والشكل التكميلية 5). ثم قمنا بحساب المتوسط المكاني الواضح عبر مجموعة نماذج كربون التربة (الشكل 3c)، بالإضافة إلى المتوسطات العرضية للبيانات المستمدة من الملاحظات ومن مجموعة النماذج المتعددة (الشكل 3b). كما قمنا بت quantifying التغيرات في خزانات كربون التربة لكل نموذج تحت سيناريو RCP8.5 (أو ssp585) من خلال مقارنة التوقعات من نهاية القرن الواحد والعشرين (2090-2100) مع اليوم الحالي (2005-2015). تظهر النتائج كتغيرات مطلقة ونسبية في مخزونات كربون التربة على مستوى العالم (الأشكال التكميلية 6 و7 والجدول التكميلية 4) وعبر الزمن والعرض (كخرائط هوفمولر؛ الشكل التكميلية 8).

قابلية تفسير خزانات النموذج

تم اقتراح مقارنة كربون المحمي عبر صيغ نماذج مختلفة، وفقًا لتسمية الخزانات أعلاه، في عدة دراسات سابقة مع نماذج من الدرجة الأولى . نحن ندرك أن هناك لا تزال عدم تطابقات جوهرية بين خزانات كربون العضوي القابلة للقياس المحددة عمليًا والدول التي يتم محاكاتها بواسطة نماذج حيوية كيميائية مختلفة . على الرغم من أن التقدم يتم إحرازه للمساعدة في سد هذه الفجوة , فإن النماذج على نطاق عالمي التي تركز عليها هذه العمل تتبنى افتراضات تتماشى بشكل عام مع خصائص كربون التربة المرتبط بالمعادن وكربون التربة الجزيئي (الشكل التكميلية 12).
في الواقع، في التربة المعدنية غير المتجمدة، تم صياغة تشكيل وتركيب الخزان الخامل في بعض نماذج الدرجة الأولى (على سبيل المثال، في نموذج القرن لبارتون وآخرين ) ليشبه الجزء المرتبط بالمعادن، ويعكس التمثيلات الرياضية لكربون المحمي فيزيائيًا وكيميائيًا في عدة نماذج دقيقة ميكروبيًا، بما في ذلك MIMICS وCORPSE . على وجه التحديد، يتم تشكيل الخزان المحمي (الخامد في نماذج الدرجة الأولى) بشكل أساسي من الخزان الميكروبي (النشط)، حيث يتم تعديل معامل النقل هذا بواسطة محتوى الطين والسلت في التربة، بحيث يتم تخزين كربون أكثر نسبيًا داخل الخزان المحمي في التربة ذات الملمس الناعم . يدخل اللتر القابل للتحلل (التمثيل الغذائي) فقط إلى الخزان الميكروبي (النشط)، بينما يدخل اللتر الهيكلي (الذي يتحكم فيه محتوى اللجنين) بشكل أساسي إلى الخزان الجزيئي (البطيء) . يتشكل مقدار صغير من الخزان المحمي من الامتصاص المباشر للخزان الجزيئي . وبالتالي، فإن نسبة C:N للخزان المحمي (الخامد) غالبًا ما تشبه تلك الخاصة بالخزان الميكروبي (النشط) (أي، عادةً لخزان المحمي في نموذج القرن )، وهو ما يتماشى مع النسبة الكيميائية للمواد العضوية المرتبطة بالمعادن . بالمقابل، فإن نسبة C:N للخزان البطيء تتماشى بشكل أقرب مع النسبة الكيميائية للمواد العضوية الجزيئية (أي، في نموذج القرن ).
أخيرًا، يتم تمثيل الخسائر من الخزان المحمي كعملية من الدرجة الأولى في معظم نماذج كربون التربة ، بما في ذلك تلك المقدمة هنا، مع أوقات دوران داخلية نموذجية تتراوح بين 75 و1,000 سنة، والتي تتماشى بشكل عام مع تقديرات الكربون المشع (انظر الجدول التكميلية 3 والشكل التكميلية 13). بينما هناك تباين داخل جميع الخزانات التحتية في الممارسة العملية، فإنه مقبول جيدًا أن كربون العضوي المرتبط بالمعادن عمومًا أبطأ دورة (عقود إلى آلاف السنين) من كربون العضوي الجزيئي (أيام إلى عقود) . في الواقع، تراوحت أوقات الدوران الداخلية لكربون المحمي (الخامد) من 200 إلى 450 سنة في جميع نماذج CMIP6 ESMs التي تم تحليلها، باستثناء MIROC-ES2L وMRI-ESM2-0 حيث كانت أوقات الدوران 1,000 سنة (الجدول التكميلية 3). بالمقابل، تراوحت أوقات الدوران الداخلية للخزان الجزيئي (البطيء) من 5 إلى 10 سنوات في جميع نماذج CMIP6 ESMs التي تم تحليلها، باستثناء MIROC-ES2L حيث كانت مدة الدوران 25 سنة. هذه الأوقات الدورانية الداخلية هي قيم أساسية (حد أدنى) خاصة بالخزانات، بحيث تزيد العوامل البيئية (استنادًا إلى درجة الحرارة والرطوبة) من وقت الدوران في معظم خلايا الشبكة؛ على سبيل المثال، بمقدار في الغابات المعتدلة حتى مقدار في المناطق القطبية لنموذج القرن . تعتبر هذه الضوابط البيئية مهمة عند مقارنة أوقات دوران محددة للمسابح مع بيانات الكربون المشع العالمية (الشكل التكميلي 14)، ويمكن أن تقدر الأعمال المستقبلية توزيع أعمار الكربون لكل حوض تم نمذجته عبر خلايا الشبكة على مستوى العالم. الاستفادة من القياسات من قاعدة بيانات الكربون المشع الدولية ، واتباع شي وآخرون للتحويل بين وقت الدوران و ، نظهر أن وقت دوران الحوض المحمي (السلبي) ضمن العديد من النماذج من الدرجة الأولى يتماشى بشكل عام مع متوسط أعمار الكربون للجزء المرتبط بالمعادن (الجدول التكميلي 3 والأشكال التكملية 13 و14). ومع ذلك، قد تحسن إصدارات النماذج المستقبلية من التوافق من خلال تقليل وقت الدوران الداخلي للكربون المحمي، خاصة في MIROC-ES2L وMRI-ESM2-0، وتعزيز ضوابطه البيئية لتتناسب بشكل أفضل مع التوزيع العالمي لـ القياسات (الشكل التكميلي 14).
على النقيض من ذلك، يتم تثبيت وقت دوران الكربون المحمي عند 75 عامًا في CORPSE ويتراوح من 15 إلى 80 عامًا في MIMICS بناءً على اعتماد على نسيج التربة . نلاحظ أن أوقات الدوران في MIMICS وCORPSE تبدو منخفضة مقارنة ببيانات الكربون المشع لجزء التربة (الأشكال التكملية 13 و14)، مما قد يفسر استجابتها القوية في ظل الظروف المستقبلية (الأشكال التكملية 6-8) ويقترح أن أعمار الكربون في التربة الكلية قد تكون أيضًا صغيرة جدًا في هذه النماذج. في الواقع، قامت الإصدارات اللاحقة من MIMICS التي لم يتم دمجها بعد في منصة الاختبار البيوجيوكيميائية العالمية بتنفيذ أوقات دوران أطول بكثير للكربون المحمي – على سبيل المثال، تتراوح من 180 إلى 1,000 عام (أي، زادت بمقدار 12.5 مرة) في MIMICS-CN ، وفي MIMICS فقط للكربون الذي تم ضبطه بشكل مستقل على بيانات مستوى الموقع في
حوض رينولدز كريك التجريبي . أدت هذه التعديلات في الإصدارات اللاحقة من MIMICS أيضًا إلى نتائج أعلى بكثير من الكربون المحمي (أي، ) التي تتماشى بشكل أفضل مع القيود الملاحظة. وبالتالي، نؤكد أن جميع النماذج، بما في ذلك النماذج الدقيقة من حيث الميكروبات والصيغ من الدرجة الأولى، لديها الفرصة لأن يتم دحضها أو تحسينها في التكرارات المستقبلية، لكن هذا لا يمنع القدرة على تقييمها هنا.
تقدم مجموعة من التمثيلات المفاهيمية والمعلمات للحماية الفيزيائية والكيميائية عبر النماذج البيئية إلى النماذج العالمية (على سبيل المثال، انظر المخطط في سولمان وآخرون ) حاجة ملحة لتطوير وتطبيق القيود المستمدة من الملاحظات. نفترض أن كل من النماذج الدقيقة من حيث الميكروبات ونماذج الكربون في التربة من الدرجة الأولى في هذه الدراسة (الجداول التكملية 1-3) تشكل تصورات تتوافق مع تقييم الكربون المحمي في التربة لتحسين معلمات النموذج المستقبلية. على الرغم من أننا ندرك أن هناك لا تزال عدم يقين جوهري في قابلية تفسير الأحواض النموذجية والكسور المعرفة عمليًا، نعتقد أن هذه الدراسة تمثل معيارًا قيمًا على الأحواض النموذجية عالميًا. تظهر التوليفات الملاحظة أن الكربون المرتبط بالمعادن عادة ما يكون قديمًا (الشكل التكميلي 13 والجدول التكميلي 3) وكبيرًا (الشكل 3 والشكل التكميلي 5) جزءًا من إجمالي كربون التربة. وبالتالي، يجب أن يمثل الحوض السلبي الأبطأ في النماذج من الدرجة الأولى – الذي يتماشى بشكل عام مع قياسات الكربون المشع للكربون المرتبط بالمعادن (الأشكال التكملية 13 و14) – أيضًا جزءًا كبيرًا من إجمالي حوض كربون التربة في الترب المعدنية. ستحسن مثل هذه المطابقة أيضًا مقاييس أداء النموذج بناءً على أعمار كربون التربة الكلية . نظرًا لأن أوقات الدوران المحددة للأحواض تبدو متماشية بشكل عام مع الملاحظات، قد تسعى الدراسات المستقبلية إلى تحسين معلمات أخرى تؤثر بشكل كبير على نسبة الكربون المحمي – على سبيل المثال، زيادة نسبة الحوض النشط الذي يتدفق إلى الحوض السلبي (الأشكال التكملية 12 و15) وضوابطه المعدنية . قد يتم أيضًا إبلاغ مثل هذه المعلمات من خلال التقديرات الملاحظة للتدفقات النسبية للكربون المشتق من النباتات أو الميكروبات إلى الكربون المرتبط بالمعادن . في النهاية، نرى أن تقييم توزيعات أحواض كربون التربة بالتزامن مع أعمار الكربون المشع في الأعمال المستقبلية سيقدم قيدًا قويًا على ديناميات كربون التربة عبر النماذج العالمية.

تحليل البيانات

حققنا في العلاقة بين مخزونات كربون التربة (داخل الأحواض غير المحمية والمحميّة) وMAT عبر المنتج العالمي للبيانات والنماذج. تم تحويل مخزونات كربون التربة لكل حوض إلى لوغاريتم واستخدمت الانحدار الخطي لعكس علاقة أسية مفترضة مع درجة الحرارة (كما في هارتلي وآخرون ). لضمان أن الأنماط العالمية الملاحظة لم تكن مدفوعة بعوامل بيئية متداخلة، استخدمنا انحدارًا خطيًا متعددًا للتحكم في الإنتاجية الأولية الصافية، ومتوسط هطول الأمطار السنوي ومحتوى الطين والسلت في تحليلاتنا. في جميع الحالات، تم الحصول على متغيرات المناخ والإنتاجية من مخرجات النموذج أو منتج البيانات الخاص بها. تم الحصول على محتوى الطين والسلت من قاعدة بيانات التربة العالمية المتناغمة حيث لم يتم الإبلاغ عنها لمعظم نماذج CMIP6. ثم تم حساب حساسية درجة الحرارة المناخية من ميل العلاقة اللوغاريتمية الخطية لدرجة الحرارة، وبعد ذلك، كما هو ملخص في هارتلي وآخرون ، تم تلخيصها كالتراجع النسبي في مخزونات الكربون لكل (مماثل لـ المناخية، ولكن لمخزونات الكربون) مع فترات ثقة بارامترية 95% المقابلة (الجدول التكميلي 6).
ثم تم تكرار هذا الحساب لأحواض كربون التربة المحمية وغير المحمية في البيانات والنماذج، عبر جميع متوسطات درجات الحرارة فوق (الشكل 4) وعبر نظامين أساسيين من درجات الحرارة، وهما البارد ( ) والدافئ ( ) (الشكل 5 والشكل التكميلي 9). لم يتم اعتبار الترب ذات متوسط درجات الحرارة أقل من في تحليلاتنا بسبب الضوابط المميزة على تحلل كربون التربة (على سبيل المثال، ديناميات التربة المتجمدة ) والآثار الناتجة على قابلية تفسير الأحواض المحمية في النماذج من الدرجة الأولى في هذه المناطق (الشكل التكميلي 3)، بالإضافة إلى عدم اليقين الأعلى في منتج البيانات ضمن هذا النظام الحراري . علاوة على ذلك، تم إجراء نفس
التحليلات على توليف ملاحظي (الأشكال التكملية 10 و11). يوفر الاتفاق العام بين الملاحظات ومنتج البيانات مزيدًا من الأدلة على قوة الاتجاهات المبلغ عنها لحساسية درجة الحرارة بين كربون التربة المحمي وغير المحمي عبر أنظمة المناخ (الشكل 2c). تم اعتبار الفروق في حساسية درجة الحرارة المناخية بين أحواض كربون التربة المحمية وغير المحمية، وعبر البيانات والنماذج، ذات دلالة إحصائية عندما لم تتداخل فترات الثقة 95% (الجدول التكميلي 6).

توفر البيانات

جميع البيانات المستخدمة في هذه المخطوطة متاحة بالكامل ومفتوحة الوصول ومتاحة في المراجع المقدمة. مخرجات نموذج CMIP6 متاحة من اتحاد شبكة نظام الأرض في https://esgf-node.llnl.gov/search/ cmip6/، ومخرجات نموذج اختبار البيوجيوكيمياء متاحة على بوابة بيانات المناخ في https://doi.org/10.5065/d6nc600w ومجموعة البيانات المستمدة من الملاحظات متاحة على زينودو في https://doi. org/10.5281/zenodo.6539765.

توفر الكود

جميع الأكواد المتعلقة بهذه الدراسة متاحة من المؤلف المراسل على GitHubathttps://github.com/katerina-georgiou/global-soilCpools ومؤرشفة على زينودو في https://doi.org/10.5281/zenodo.10515706.

References

  1. Harris, I., Jones, P. D., Osborn, T. J. & Lister, D. H. Updated high-resolution grids of monthly climatic observations – the CRU TS3.10 Dataset. Int. J. Climatol. 34, 623-642 (2014).
  2. Schneider, U. et al. GPCC Full Data Reanalysis Version 6.0 at : Monthly Land-Surface Precipitation from Rain-Gauges built on GTS-based and Historic Data (GPCC, 2011); https://doi. org/10.5676/DWD_GPCC/FD_M_V6_050
  3. Friedl, M. A. et al. MODIS Collection 5 global land cover: algorithm refinements and characterization of new datasets. Remote Sens. Environ. 114, 168-182 (2010).
  4. Zhao, M., Heinsch, F. A., Nemani, R. R. & Running, S. W. Improvements of the MODIS terrestrial gross and net primary production global data set. Remote Sens. Environ. 95, 164-176 (2005).
  5. Wieder, W. R., Boehnert, J., Bonan, G. B. & Langseth, M. Regridded Harmonized World Soil Database v1.2 (ORNL DAAC, 2014); https:// doi.org/10.3334/ORNLDAAC/1247
  6. Hengl, T. et al. SoilGrids250m: global gridded soil information based on machine learning. PLoS ONE https://doi.org/10.1371/ journal.pone. 0169748 (2017).
  7. Georgiou, K. et al. Globally-gridded data for manuscript: global stocks and capacity of mineral-associated soil organic carbon. Zenodo https://doi.org/10.5281/zenodo. 6539765 (2022)
  8. Ploton, P. et al. Spatial validation reveals poor predictive performance of large-scale ecological mapping models. Nat. Commun. 11, 4540 (2020).
  9. Meyer, H. & Pebesma, E. Machine learning-based global maps of ecological variables and the challenge of assessing them. Nat. Commun. 13, 2208 (2022).
  10. Thornton, P. E. & Rosenbloom, N. A. Ecosystem model spin-up: estimating steady state conditions in a coupled terrestrial carbon and nitrogen cycle model. Ecol. Modell. 189, 25-48 (2005).
  11. Lawrence, D. M. et al. Parameterization improvements and functional and structural advances in Version 4 of the Community Land Model. J. Adv. Model. Earth Syst. https://doi. org/10.1029/2011MS00045 (2011).
  12. Lee, W. L. et al. Taiwan Earth System Model Version 1: description and evaluation of mean state. Geosci. Model Dev. 13, 3887-3904 (2020).
  13. Christensen, B. T. in Evaluation of Soil Organic Matter Models Vol. 38 (eds Powlson, D. S. et al.) 143-159 (Springer, 1996).
  14. Elliot, E. T., Paustian, K. & Frey, S. D. in Evaluation of Soil Organic Matter Models Vol. 38 (eds Powlson, D. S. et al.) 161-179 (Springer, 1996).
  15. Lehmann, J. & Kleber, M. The contentious nature of soil organic matter. Nature 528, 60-68 (2015).
  16. Zhang, Y. et al. Simulating measurable ecosystem carbon and nitrogen dynamics with the mechanistically defined MEMS 2.0 model. Biogeosciences 18, 3147-3171 (2021).
  17. Dangal, S. R. S. et al. Improving soil carbon estimates by linking conceptual pools against measurable carbon fractions in the DAYCENT model version 4.5. J. Adv. Model. Earth Syst. 14, e2021MSOO2622 (2022).
  18. Abramoff, R. et al. The Millennial model: in search of measurable pools and transformations for modeling soil carbon in the new century. Biogeochemistry 137, 51-71 (2018).
  19. Parton, W. J. & Rasmussen, P. E. Long-term effects of crop management in wheat-fallow: II. CENTURY model simulations. Soil Sci. Soc. Am. J. 58, 530-536 (1994).
  20. Cotrufo, M. F., Ranalli, M. G., Haddix, M. L., Six, J. & Lugato, E. Soil carbon storage informed by particulate and mineral-associated organic matter. Nat. Geosci. 12, 989-994 (2019).
  21. Rocci, K. S. et al. Aligning theoretical and empirical representations of soil carbon-to-nitrogen stoichiometry with process-based terrestrial biogeochemistry models. Soil Biol. Biochem. 189, 109272 (2024).
  22. Lawrence, C. R. et al. An open-source database for the synthesis of soil radiocarbon data: International Soil Radiocarbon Database (ISRaD) version 1.0. Earth Syst. Sci. Data 12, 61-76 (2020).
  23. Kyker-Snowman, E., Wieder, W. R., Frey, S. D. & Grandy, A. S. Stoichiometrically coupled carbon and nitrogen cycling in the MIcrobial-MIneral Carbon Stabilization model version 1.0 (MIMICS-CN v1.0). Geosci. Model Dev. 13, 4413-4434 (2020).
  24. Georgiou, K. et al. Divergent controls of soil organic carbon between observations and process-based models. Biogeochemistry 2, 775-792 (2021).
  25. Angst, G., Mueller, K. E., Nierop, K. G. J. & Simpson, M. J. Plant- or microbial-derived? A review on the molecular composition of stabilized soil organic matter. Soil Biol. Biochem. 156, 108189 (2021).

الشكر والتقدير

تم دعم K.G. كزميل لورانس في مختبر لورانس ليفرمور الوطني (LLNL) من قبل برنامج LLNL-LDRD تحت مشروع رقم 21-ERD-045 و24-LW-053. تم دعم J.P.-R. وE.W.S. من قبل مكتب العلوم بوزارة الطاقة الأمريكية (DOE) ومكتب الأبحاث البيولوجية والبيئية، برنامج العلوم الجينومية كجزء من منطقة التركيز العلمية لميكروبات LLNL Persist، SCW1632. تم إجراء العمل في LLNL تحت رعاية عقد DOE DE-AC5207NA27344. تم دعم W.R.W. من قبل منح مؤسسة العلوم الوطنية 1926413 و2031238 ومنحة USDA NIFA-AFRI 2020-67019-31395. تم دعم C.D.K. وW.J.R. وQ.Z. من قبل برنامج الأبحاث البيولوجية والبيئية (BER) بوزارة الطاقة الأمريكية في LBNL تحت عقد DOE DE-ACO2-05CH11231 من خلال برنامج تحليل النماذج الإقليمية والعالمية (RUBISCO SFA). تم دعم N.J.B. من قبل برنامج الأبحاث المبكرة BER بوزارة الطاقة الأمريكية تحت عقد FPOOOO5182. تم دعم R.Z.A. وB.N.S. من قبل BER بوزارة الطاقة الأمريكية في مختبر أوك ريدج الوطني تحت عقد DOE DE-AC05-000R22725. يشكر A.A. بيئة البحث حول التنوع البيولوجي وخدمات النظام البيئي في مناخ متغير (BECC) في جامعة لوند والتمويل من مجلس البحث السويدي (2021-05344).

مساهمات المؤلفين

صمم K.G. الدراسة بناءً على أفكار تم تطويرها من خلال المناقشات مع C.D.K. وW.R.W. وW.J.R. وR.B.J. ساهم جميع المؤلفين في تطوير الدراسة. جمع K.G. وW.R.W. وM.D.H. وQ.Z. وقدموا المخرجات النموذجية. قدم M.D.H. وW.J.P. وW.R.W. وC.D.K. وA.A. وR.Z.A. وD.P. وB.N.S. رؤى حول النموذج
الصيغ، وقدم J.P.-R. وN.J.B. وE.W.S. وA.F.A.P. ملاحظات حول تحليلات البيانات. قام K.G. بإجراء جميع التحليلات وكتب المسودة الأولى من الورقة. ساهم جميع المؤلفين في مراجعات الورقة اللاحقة.

المصالح المتنافسة

يعلن المؤلفون عدم وجود مصالح متنافسة.

معلومات إضافية

المعلومات التكميلية النسخة الإلكترونية تحتوي على مواد تكميلية متاحة على https://doi.org/10.1038/s41561-024-01384-7.
يجب توجيه المراسلات وطلبات المواد إلى كاترينا جورجيو.
معلومات مراجعة الأقران تشكر Nature Geoscience إيمانويل لوغاتو والمراجعين الآخرين المجهولين على مساهمتهم في مراجعة الأقران لهذا العمل. المحرر الرئيسي: شوجيا جيانغ، بالتعاون مع فريق Nature Geoscience.
معلومات إعادة الطبع والتصاريح متاحة على www.nature.com/reprints.

Journal: Nature Geoscience, Volume: 17, Issue: 3
DOI: https://doi.org/10.1038/s41561-024-01384-7
Publication Date: 2024-02-20

Emergent temperature sensitivity of soil organic carbon driven by mineral associations

Received: 23 October 2022
Accepted: 23 January 2024
Published online: 20 February 2024
(D) Check for updates

Katerina Georgiou © ®, Charles D. Koven (1) , William R. Wieder , Melannie D. Hartman , William J. Riley , Jennifer Pett-Ridge (1) , Nicholas J. Bouskill (1) , Rose Z. Abramoff (1) , Eric W. Slessarev , Anders Ahlström © , William J. Parton , Adam F. A. Pellegrini © , Derek Pierson © , Benjamin N. Sulman (1) , Qing Zhu (1) & Robert B. Jackson (1)

Abstract

Soil organic matter decomposition and its interactions with climate depend on whether the organic matter is associated with soil minerals. However, data limitations have hindered global-scale analyses of mineral-associated and particulate soil organic carbon pools and their benchmarking in Earth system models used to estimate carbon cycle-climate feedbacks. Here we analyse observationally derived global estimates of soil carbon pools to quantify their relative proportions and compute their climatological temperature sensitivities as the decline in carbon with increasing temperature. We find that the climatological temperature sensitivity of particulate carbon is on average higher than that of mineral-associated carbon, and up to 53% higher in cool climates. Moreover, the distribution of carbon between these underlying soil carbon pools drives the emergent climatological temperature sensitivity of bulk soil carbon stocks. However, global models vary widely in their predictions of soil carbon pool distributions. We show that the global proportion of model pools that are conceptually similar to mineral-protected carbon ranges from 16 to 85% across Earth system models from the Coupled Model Intercomparison Project Phase 6 and offline land models, with implications for bulk soil carbon ages and ecosystem responsiveness. To improve projections of carbon cycle-climate feedbacks, it is imperative to assess underlying soil carbon pools to accurately predict the distribution and vulnerability of soil carbon.

Soil carbon-climate feedbacks represent a major uncertainty in the response of the terrestrial biosphere to climate change . This uncertainty stems, in part, from poorly constrained relationships between the temperature sensitivities of the decomposition and stabilization processes of soil organic carbon (C), which are key parameters in soil biogeochemical models . Whereas many empirical and modelling
studies have explored the effects of temperature on bulk soil C stocks and turnover rates at ecosystem to global scales , they largely ignore heterogeneity in soil organic matter. This is a key oversight given that underlying soil organic matter fractions or ‘pools’ (for example, particulate or mineral-associated organic matter) can exhibit different responses to warming in laboratory- and field-based manipulations .
Fig. 1 | Global distribution of observationally derived soil C stocks as a function of climatological temperature and clay and silt minerals. a,b, Total soil C stocks (a) and the proportion of total soil C that is protected (mineralassociated) (b) as a function of the mean annual temperature (MAT) globally.
Each gridcell is coloured by the percentage of clay and silt minerals, and best-fit trends are depicted for fine- and coarse-textured soils; here, fine-textured soils were classified as those with clay + silt content and coarse-textured soils with clay + silt content.
Understanding and quantifying the temperature sensitivity of these underlying pools at the global scale is thus critical for accurately predicting emergent feedbacks and soil organic C vulnerabilities to a changing climate.
Warmer soil temperatures accelerate the rate of organic matter decomposition, often leading to losses in bulk soil C stocks . However, the potential decomposability of organic matter in a given soil can depend on its association with minerals . Mineral-associated organic matter consists of small plant- or microbial-derived monomers and biopolymers that are chemically or physically bound to clay- and silt-sized minerals, whereas particulate organic matter is largely comprised of coarser, partially decomposed fragments of plant material . Mineral associations can limit access of microbial constituents and their enzymes to organic matter, and as a result, mineral-associated C is often older than particulate . In soil biogeochemical models, these pools can be represented explicitly or implicitly (see ‘Model pool interpretability’ in the Methods), with implications for their transient dynamics and long-term response to novel conditions. For consistency across the data and models, we refer to mineral-associated C (and slowest-cycling pools) as ‘protected’ and particulate C (and all other model pools) as ‘unprotected’, while acknowledging that the bioavailability and persistence of each pool is more complex in practice . Importantly, much uncertainty remains in the responses of protected and unprotected soil C to warming across broad spatial scales , hindering model benchmarking efforts.
Evaluating the transient dynamics of soil biogeochemical models to warming remains a challenge, in part because observations of soil C at multi-decadal to centennial timescales are limited . Laboratory incubations and field studies demonstrate that decomposition rates increase, and C stocks often decrease, with warming . However, at multi-decadal timescales, acclimatory responses in microbial activity may limit the effect of warming on decomposition rates . Furthermore, many experiments focus on the response of bulk soil C stocks, and neither measure nor report the relative responses of underlying soil C fractions. Given these data limitations, an alternative approach is to benchmark global models using spatial gradients -although this approach is insufficient for constraining transient dynamics (that is, space-for-time assumptions) , climate gradients do reflect long-term climatological temperature sensitivities that should, in principle, be captured by soil C models.
Here we assess the climatological temperature sensitivity of bulk soil C stocks, and the role of mineral-associated and particulate soil C pools in driving this emergent property in data and models. We first leverage a globally gridded data product of mineral-associated
and particulate soil C (derived from an observational synthesis of soil fractions ) to quantify the distribution of soil organic C between these two pools and their respective climatological temperature sensitivities at the global scale. We then evaluate the distributions and temperature sensitivities of protected (mineral-associated-like) and unprotected (particulate-like) soil C stocks across an ensemble of 12 global models-namely, nine Earth system models (ESMs) from the Coupled Model Intercomparison Project Phase 6 (CMIP6) and three offline land models , including two microbially explicit soil C models (Supplementary Tables 1-3). Although there are important considerations regarding the interpretability of modelled pools and measured fractions (see ‘Model pool interpretability’ in the Methods), pool-specific benchmarks offer a critical opportunity to refine model formulations and reduce uncertainties. We argue that resolving the distribution and temperature sensitivities of underlying soil C pools is imperative for developing a predictive understanding of the emergent temperature dependence of bulk soil C decomposition and constraining global biogeochemical models.

Climatological temperature sensitivity of soil carbon pools

Soil organic C stocks are known to broadly decrease with increasing temperature across climate gradients . However, the magnitude of this climatological temperature sensitivity can vary across soils . Indeed, this relationship appears to be modulated by clay and silt content, where fine-textured soils (that is, soils containing higher amounts of clay and silt minerals) have a lower climatological temperature sensitivity compared with coarse-textured sandy soils (inferred from the relative strengths of relationships in Fig. 1a). These contrasting temperature sensitivities can be attributed in part to the mineralogical capacity of each soil , but more specifically to its effect on the distribution of soil C among mineral-associated and particulate C pools. Since mineral-associated C often has a lower temperature sensitivity than particulate , the proportion of C that is mineral-associated can play a dominant role in driving the emergent bulk soil temperature sensitivity (see conceptual schematic in Supplementary Fig. 1).
Globally, our results indicate that the proportion of soil C that is mineral-associated (hereafter termed ‘protected’ for consistency with model pools ) increases with increasing mean temperature (Fig.1b;a trend that is not captured in most global models (Supplementary Figs. 2 and 3)). Furthermore, fine-textured soils have greater proportions of protected C than do coarse-textured soils across all temperatures. We therefore expect fine-textured soils to exhibit a lower climatological temperature sensitivity compared with coarse-textured sandy
Fig. 2 | Global distribution of observationally derived protected and unprotected soil stocks as a function of climatological temperature. , Protected (mineral-associated) (a) and unprotected (particulate) (b) soil C stocks as a function of MAT in regions above globally. Linear regressions are shown for and warm ( ) regions (solid lines) and across all temperatures above (dashed lines). c, Climatological temperature sensitivity calculated as the proportional decline of each soil C pool for a increase in MAT (analogous to a climatological , but for C stocks) while
accounting for potential confounding variables (see ‘Data analysis’ in the Methods). Points depict the proportional decline of each soil C pool (derived from the regression slopes; gridcells for non-permafrost mineral soils above globally, with in cool regions and in warm regions), and error bars denote the CIs (Supplementary Table 6). Higher values ( ) indicate greater decreases in C with increasing climatological temperature.
soils where higher unprotected C stocks drive a higher temperature sensitivity. The climatological temperature sensitivity of bulk soil C emerges from the underlying pool distributions and their respective temperature dependencies.
To assess the climatological temperature sensitivity of each soil C pool, we calculated the proportional decline in C stocks for every increase in mean temperature while controlling for potential confounding factors that include primary productivity, precipitation, and clay and silt content (Methods). Our approach builds upon previous studies and provides a benchmarking metric analogous to a climatological (that is, the increase in process rates for each increase in temperature) but for C stocks instead of respiration or turnover rates . We find that, at the global scale, unprotected C stocks have a ( confidence interval (CI): 26,30%) greater climatological temperature sensitivity than protected C stocks (Fig. 2). This pattern is especially pronounced in cool regions ( ) where unprotected C is , ) more temperature sensitive than protected C , compared with warm regions ( ) where the relative difference is only . Both soil C pools show weak climatological temperature sensitivities in warm regions (Fig. 2c). This latter result suggests that decomposition in cool regions is more temperature-limited, and that warm regions do not experience as stark a decline in soil C for a given increase in mean temperature. This difference is supported by gradient studies in tropical soils , and is consistent with incubation studies showing that warm-adapted microbial communities typically show lower temperature sensitivities (namely, ) and higher microbial growth efficiencies . Furthermore, warm regions contain higher proportions of protected C (Fig. 1b), such that the emergent bulk soil C temperature sensitivity more closely mirrors that of the protected C pool. Therefore, the proportion of protected addition to its climatological temperature sensitiv-ity-may serve as an important benchmark for evaluating global models.

Global patterns in soil carbon pools across data and models

Soil C models vary in their underlying assumptions, mathematical representations and parameterizations. However, several studies have proposed that the slowest-cycling (‘passive’) pool of soil C in many ESMs corresponds broadly to mineral-associated (protected) . This reflects a common conceptualization of donor-pool sources,
mineralogical controls, turnover times and stoichiometry of protected C that are used to approximate the formation and characteristics of mineral-associated organic matter (see ‘Model pool interpretability’ in the Methods). We thus adopt this convention here, while recognizing that there are still inherent uncertainties in the interpretability of modelled pools and operationally defined fractions. We posit that benchmarks based on relative pool distributions, in tandem with radiocarbon ages , will be critical for refining future model parameterizations and constraining transient dynamics.
Global soil C models are typically benchmarked on the basis of bulk soil C metrics . However, even models that predict similar bulk soil C stocks can vary widely in their underlying pool distributions (Supplementary Fig. 4). Whereas bulk soil C stocks in non-permafrost mineral soils vary 2.5 -fold across the CMIP6 ESMs and offline land models in this study, protected soil stocks vary nearly sevenfold. As a result, the proportion of protected C ranges from 16 to across the global models (Fig. 3 and Supplementary Table 4). This large spread in model predictions presents a critical opportunity to apply data-driven constraints and reduce uncertainty. We find that about half of the analysed ESMs underestimate the proportion of protected C in soils globally compared with the observationally derived data product, and consequently, contain too much C in faster-cycling, unprotected C pools. This result is especially true in non-permafrost mineral soils, where several of the global models underestimate the proportion of protected C in both cool and warm regions (Supplementary Fig. 5 and Supplementary Table 5). In particular, six models (CESM2, CNRM-ESM2-1, E3SM-1-1-ECA, IPSL-CM6A-LR, NorESM2 and the microbially explicit model CORPSE) roughly capture the proportion of protected C , whereas the other six models (ACCESS-ESM1-5, BCC-CSM2-MR, MIROC-ES2L, MRI-ESM2-0, CASA-CNP and the microbially explicit model MIMICS) considerably underestimate this proportion (Fig. 3d). However, we note that all of the models in this study are amenable to matching pool-specific constraints in future work-indeed, both first-order and microbially explicit formulations with refined parameterizations have been able to better match observations in past studies . Nevertheless, our results generally suggest that soil C is skewed towards faster-cycling C pools in several global models, consistent with radiocarbon-based benchmarking studies that have shown that current ESMs underestimate the mean age of soil C across latitudes .
Fig. 3 | Proportion of soil C in protected pools globally across data and models. a-c, The percentage of total soil C that is protected in the observationally derived data product and in the multi-model mean of the ensemble of CMIP6 ESMs and offline land models, shown globally (a,c) and as latitudinal means ( ; solid lines). Shaded uncertainty ranges in correspond to prediction intervals for the data product , and 5th and 95th quantiles of the multi-model ensemble across each latitudinal band. d, The global percentage of total soil C that is protected across the individual ESMs and offline land models.
Protected was estimated as the mineral-associated fraction for the data product, physicochemically protected pools in MIMICS and CORPSE, and the slowest-cycling passive pool in the CMIP6 ESMs and CASA-CNP (see ‘Model pool interpretability’ in the Methods). Global means are given for non-permafrost mineral soils, excluding tundra, deserts and peatlands ( gridcells for resolution), and the data product uncertainty range corresponds to the prediction interval (summarized in Supplementary Table 5).
At higher latitudes, the two microbially explicit models depict a lower proportion of protected C (Supplementary Fig. 4), consistent with recent studies . The observationally derived data product also supports this latitudinal trend (Fig. 3b). By contrast, several CMIP6 models show a larger proportion of protected C at higher latitudes (particularly above ; Supplementary Fig. 3), which suggests that the interpretability of the protected pool as mineral-associated may break down in these regions within certain CMIP6 models. For instance, in models with vertically resolved soil biogeochemistry (CESM2, E3SM-1-1-ECA and NorESM2) these larger proportions of protected C may be caused by the relative timescales of decomposition and vertical mixing processes. This is because high-latitude active-layer C is transported to permafrost layers via a slow constant diffusion rate representing cryoturbation , which consequently transports a greater fraction of slower-cycling C relative to fast-cycling C pools. Whereas soil C is indeed old in these high latitudes , its decomposition is limited more by low temperatures that reduce the availability of liquid water than by association with minerals . Given that temperature and hydrology can change at decadal timescales, representing long-lived organic matter at high latitudes as an inherently slow-cycling pool (as opposed to unprotected, particulate forms that can be more sensitive to disturbance ) has important implications for the responsiveness of vast permafrost soil C pools to projected climate change (Supplementary Figs. 6-8).

Temperature sensitivity of soil carbon in global models

The climatological temperature sensitivity of bulk soil C is an emergent property that ultimately depends on the distribution of C within underlying pools and their respective temperature sensitivities. Whereas
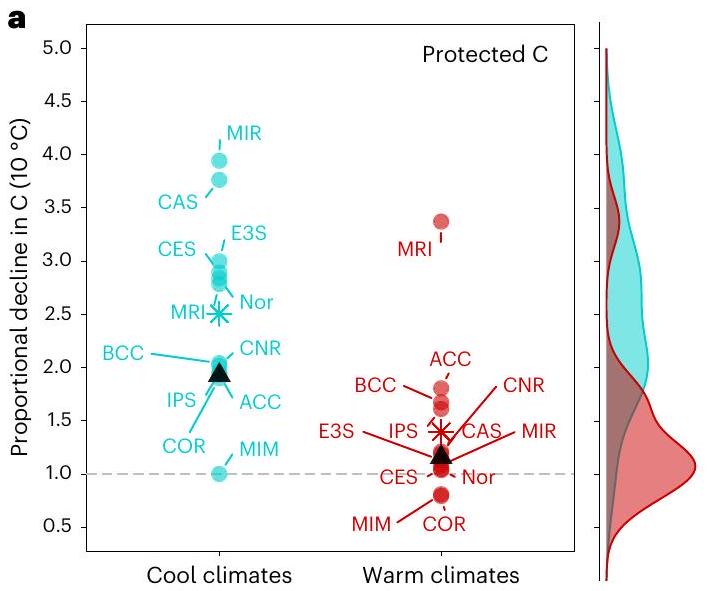
some models may appear to capture the observationally derived climatological temperature sensitivity of bulk soil C stocks, this agreement does not always occur for the right reasons and may break down when considering the contribution of underlying protected and unprotected soil C pools. For example, six of the CMIP6 ESMs (ACCESS-ESM1-5, CESM2, CNRM-ESM2-1, E3SM-1-1-ECA, IPSL-CM6A-LR and NorESM2) and two microbially explicit models (MIMICS and CORPSE) roughly capture the temperature sensitivity of bulk soil C stocks (Fig. 4 and Supplementary Table 6). However, these same models show divergent distributions and climatological temperature sensitivities of underlying protected and unprotected soil C pools (Fig. 4). Only a few models roughly capture the climatological temperature sensitivity of protected C (CESM2, CNRM-ESM2-1, IPSL-CM6A-LR, NorESM2 and CORPSE) and even fewer of unprotected C (ACCESS-ESM1-5, MIMICS and CORPSE).
The observationally derived data product broadly suggests that protected C has a lower climatological temperature sensitivity than unprotected C (Fig. 2). The models generally agree with this trend, although the difference in climatological temperature sensitivities of pools is less pronounced in the CMIP6 models than in the microbially explicit models (Fig. 4). This difference may arise because many first-order soil models impose the same temperature-dependence parameters across all pools , and consequently the emergent climatological temperature sensitivities are often similar between pools. There are a few notable exceptions among the CMIP6 models, in which unprotected C appears less temperature sensitive than protected C (namely, MRI-ESM2-0 and to a lesser degree E3SM-1-1-ECA (Fig. 4), as well as CESM2, CNRM-ESM2-1, MIROC-ES2L and NorESM in cool regions (Supplementary Fig. 9)). This could arise due to temperature-sensitivity parameterizations based on a presumed greater molecular complexity
Fig. 4 | Climatological temperature sensitivity of total soil C and the contribution of protected and unprotected pools. The climatological temperature sensitivity of total soil C (denoted by a diamond) is an emergent property of the climatological temperature sensitivity of protected (brown circles) and unprotected (green circles) soil C pools, as well as the proportion of within each of these pools (denoted by the marker area). The proportional decline in C for increase in MAT was calculated for each C pool, controlling
for potential confounding variables (see ‘Data analysis’ in the Methods). Results are shown for the data product and an ensemble of ESMs and offline land models across gridcells with MAT globally; 95% CIs are given in Supplementary Table 6. Higher values ( ) indicate greater decreases in C with increasing climatological temperature, lower values (<1) indicate increases in C and values equal to 1 (grey dashed line) indicate thermal independence.
of protected C in select models . Ultimately, the distinct climatological temperature sensitivities of underlying soil C pools observed in the data product and process-based models can have important implications for transient projections, especially with regard to C ages and ecosystem responsiveness, and constitute an important benchmark for evaluating model performance.
Since protected C makes up the majority of bulk soil C globally in the data product (Fig. 3d), it also dominates the climatological temperature sensitivity of bulk soil C stocks (Fig. 4). However, many models do not capture this pattern. In fact, unprotected C dominates the bulk soil C stocks and climatological temperature sensitivity in a few models (BCC-CSM2-MR, MRI-ESM2-0, CASA-CNP and MIMICS), whereas most other ESMs have similar proportions and temperature sensitivities of underlying C pools. Only a couple of global models have high enough proportions of protected C to drive bulk climatological temperature sensitivities that are dominated by the protected C pool (for example, E3SM-1-1-ECA and CORPSE), as observed in the data product (Fig. 4 and Supplementary Fig. 9).
Furthermore, climatological temperature sensitivities of bulk soil C stocks and turnover can vary across climates, where temperature dependencies are typically higher in cooler climates than in warmer climates . However, the temperature sensitivities of underlying soil C pools within these climate regimes have not been explored in global-scale models or observations. We find that both protected and unprotected C pools show greater climatological temperature sensitivities in cool than warm climates, but interestingly, this contrast across climates is more pronounced for unprotected C than for protected C , and especially in the observationally derived data product compared with the global models (Figs. 2 and 5 and Supplementary Figs. 9-11).
Overall, our analysis shows that global models tend to overestimate the climatological temperature sensitivity of protected stocks in
both cool and warm climates, and of both C pools in warm climates (Fig. 5). This is especially true of MIROC-ES2L, CASA-CNP and MRI-ESM2-0, which overestimate the climatological sensitivity of protected by more than a factor of two. However, the global models tend to underestimate the climatological temperature sensitivity of unprotected C in cool climates (Fig. 5). The inability of most ESMs to match these regional patterns suggests that the transient response to warming may also be biased, particularly in cool climates. Protected (slower-cycling) C in ESMs may be overly sensitive to warming in cool regions, whereas unprotected (faster-cycling) C may not be sensitive enough to warming, with implications on soil C dynamics and age distributions under future scenarios.

Implications and future perspectives

We propose that the distributions and climatological temperature sensitivities of underlying soil C pools are ecosystem properties that global models should be expected to reproduce. Our results highlight that even ESMs that predict similar bulk soil C stocks and climatological temperature sensitivities can vary widely in their predictions of underlying soil C pools, with implications for C ages and ecosystem responsiveness under changing conditions. In particular, owing to an overestimation of C in unprotected (faster-cycling) pools, several CMIP6 ESMs may be too responsive to C inputs and may overestimate the effects of increased primary production on potential soil C sequestration (for example, with large increases in unprotected C; Supplementary Fig. 6); a finding that agrees with independent radiocarbon-based studies . This implies that model estimates of the amount of C sequestration that may result from climate change and fertilization of terrestrial ecosystems may be too strong. Furthermore, most ESMs tend to underestimate the climatological temperature sensitivity of unprotected C in cool climates, potentially leading to an underestimation of C losses from
b
A Data product ACC ACCESS-ESM1-5 E3S E3SM-1-1-ECA Nor NorESM2
* Multi-model mean BCC BCC-CSM2-MR IPS IPSL-CM6A-LR CAS CASA-CNP
* Model output CES CESM2 MIR MIROC-ES2L MIM MIMICS
CNR CNRM-ESM2-1 MRI MRI-ESM2-0 COR CORPSE
Fig. 5|Climatological temperature sensitivity of protected and unprotected soil across temperature regimes. a,b, The proportional decline in protected (a) and unprotected (b) soil C stocks for increase in MAT, controlling for potential confounding variables. Proportional declines are shown for cool climates ( MAT ; blue circles) and warm climates (MAT ; red circles). Results are shown for the data product (black triangles), the multimodel ensemble mean (asterisks) and each ESM and offline land model (solid
circles; labelled with abbreviations); 95% CIs are given in Supplementary Table 6. Kernel density estimates are shown for each panel, illustrating the distribution of climatological temperature sensitivities across the model ensemble for each pool and temperature regime. Higher values ( ) indicate greater decreases in C with increasing climatological temperature, lower values ( ) indicate increases in and values equal to 1 (grey dashed line) indicate thermal independence.
these unprotected pools with warming, an underestimation of the global carbon cycle-climate feedback and compounding projections of higher productivity-driven C accumulation in these regions. Whereas this bias may be partially offset in ESMs that overestimate the climatological temperature sensitivity of protected C across climates, the effect of this latter overestimate on projections of carbon cycle-climate feedbacks is probably weaker because these pools are intrinsically slow-cycling in first-order soil models and consequently change very little on timescales relevant to climate policy (Supplementary Figs. 6-8). Divergent pool-specific responses can ultimately lead to differences in soil C composition and functioning. It is therefore imperative that models benchmark not only bulk climatological sensitivities but also those of underlying soil C pools, to confidently project soil C dynamics into the future.
The CMIP protocol requests but does not require the reporting of soil C pool distributions , and, thus, this information is currently available only for a subset of CMIP6 ESMs. Our results show that, with recent advances in global estimates of protected and unprotected soil C stocks , redefining and benchmarking these underlying soil C pools can serve as an important constraint for ESMs. We therefore urge that all global models report the distribution of soil C among underlying pools in CMIP Phase 7 and beyond, so that future studies may leverage this benchmark for model evaluation across climate gradients. Although further study of transient responses is also imperative for constraining dynamic models , the static relationships presented here serve as important benchmarks of long-term temperature effects on the formation and decomposition of soil C pools.

Online content

Any methods, additional references, Nature Portfolio reporting summaries, source data, extended data, supplementary information, acknowledgements, peer review information; details of author contributions and competing interests; and statements of data and code availability are available at https://doi.org/10.1038/s41561-024-01384-7.

References

  1. Friedlingstein, P. et al. Uncertainties in CMIP5 climate projections due to carbon cycle feedbacks. J. Clim. 27, 511-526 (2014).
  2. Davidson, E. A. & Janssens, I. A. Temperature sensitivity of soil carbon decomposition and feedbacks to climate change. Nature 440, 165-173 (2006).
  3. García-Palacios, P. et al. Evidence for large microbial-mediated losses of soil carbon under anthropogenic warming. Nat. Rev. Earth Environ. 2, 507-517 (2021).
  4. Koven, C. D., Hugelius, G., Lawrence, D. M. & Wieder, W. R. Higher climatological temperature sensitivity of soil carbon in cold than warm climates. Nat. Clim. Chang. 7, 817-822 (2017).
  5. Crowther, T. et al. Quantifying global soil C losses in response to warming. Nature 104, 104-108 (2016).
  6. Todd-Brown, K., Zheng, B. & Crowther, T. W. Field-warmed soil carbon changes imply high 21st-century modeling uncertainty. Biogeosciences 15, 3659-3671 (2018).
  7. Van Gestel, N. et al. Predicting soil carbon loss with warming. Nature 554, E4-E5 (2018).
  8. Hicks Pries, C. E., Castanha, C., Porras, R. & Torn, M. S. The whole-soil carbon flux in response to warming. Science 355, 1420-1423 (2017).
  9. Rocci, K. S., Lavallee, J. M., Stewart, C. E. & Cotrufo, M. F. Soil organic carbon response to global environmental change depends on its distribution between mineral-associated and particulate organic matter: a meta-analysis. Sci. Total Environ. 793, 148569 (2021).
  10. Conant, R. T. et al. Temperature and soil organic matter decomposition rates – synthesis of current knowledge and a way forward. Glob. Chang. Biol. 17, 3392-3404 (2011).
  11. Soong, J. L. et al. Five years of whole-soil warming led to loss of subsoil carbon stocks and increased efflux. Sci. Adv. 7, eabd1243 (2021).
  12. Nottingham, A. T., Meir, P., Velasquez, E. & Turner, B. L. Soil carbon loss by experimental warming in a tropical forest. Nature 584, 234-237 (2020).
  13. Pellegrini, A. F. A. et al. Low-intensity frequent fires in coniferous forests transform soil organic matter in ways that may offset ecosystem carbon losses. Glob. Chang. Biol. 27, 3810-3823 (2021).
  14. Lugato, E., Lavallee, J. M., Haddix, M. L., Panagos, P. & Cotrufo, M. F. Different climate sensitivity of particulate and mineral-associated soil organic matter. Nat. Geosci. 14, 295-300 (2021).
  15. Sokol, N. W. et al. Global distribution, formation and fate of mineral-associated soil organic matter under a changing climate: a trait-based perspective. Funct. Ecol. 36, 1411-1429 (2022).
  16. Lavallee, J. M., Soong, J. L. & Cotrufo, M. F. Conceptualizing soil organic matter into particulate and mineral-associated forms to address global change in the 21st century. Glob. Chang. Biol. 26, 261-273 (2020).
  17. Kögel-Knabner, I. et al. Organo-mineral associations in temperate soils: integrating biology, mineralogy, and organic matter chemistry. J. Plant Nutr. Soil Sci. 171, 61-82 (2008).
  18. Heckman, K. et al. Beyond bulk: density fractions explain heterogeneity in global soil carbon abundance and persistence. Glob. Chang. Biol. 28, 1178-1196 (2022).
  19. Wieder, W. R., Allison, S. D., Davidson, E. A., Georgiou, K. & Hararuk, O. Explicitly representing soil microbial processes in Earth system models. Glob. Biogeochem. Cycles 29, 1782-1800 (2015).
  20. Sulman, B. N., Phillips, R. P., Oishi, A. C., Shevliakova, E. & Pacala, S. W. Microbe-driven turnover offsets mineral-mediated storage of soil carbon under elevated . Nat. Clim. Chang. 4, 1099-1102 (2014).
  21. Ahrens, B., Braakhekke, M. C., Guggenberger, G., Schrumpf, M. & Reichstein, M. Contribution of sorption, DOC transport and microbial interactions to the age of a soil organic carbon profile: Insights from a calibrated process model. Soil Biol. Biochem. 88, 390-402 (2015).
  22. Sulman, B. N. et al. Multiple models and experiments underscore large uncertainty in soil carbon dynamics. Biogeochemistry 141, 109-123 (2018).
  23. Wieder, W. R., Sulman, B. N., Hartman, M. D., Koven, C. D. & Bradford, M. A. Arctic soil governs whether climate change drives global losses or gains in soil carbon. Geophys. Res. Lett. 46, 14486-14495 (2019).
  24. Berardi, D. et al. 21st-century biogeochemical modeling: challenges for Century-based models and where do we go from here? Glob. Chang. Biol. Bioenergy 12, 774-788 (2020).
  25. Kleber, M. et al. Dynamic interactions at the mineral-organic matter interface. Nat. Rev. Earth Environ. 2, 402-421 (2021).
  26. Melillo, J. M. et al. Long-term pattern and magnitude of soil carbon feedback to the climate system in a warming world. Science 358, 101-105 (2017).
  27. Walker, T. W. N. et al. A systemic overreaction to years versus decades of warming in a subarctic grassland ecosystem. Nat. Ecol. Evol. 4, 101-108 (2020).
  28. Bradford, M. Thermal adaptation of decomposer communities in warming soils. Front. Microbiol. 4, 333 (2013).
  29. Hartley, I. P., Hill, T. C., Chadburn, S. E. & Hugelius, G. Temperature effects on carbon storage are controlled by soil stabilisation capacities. Nat. Commun. 12, 6713 (2021).
  30. Doetterl, S. et al. Soil carbon storage controlled by interactions between geochemistry and climate. Nat. Geosci. 8, 780-783 (2015).
  31. Abramoff, R. Z., Torn, M. S., Georgiou, K., Tang, J. & Riley, W. J. Soil organic matter temperature sensitivity cannot be directly inferred from spatial gradients. Glob. Biogeochem. Cycles 33, 761-776 (2019).
  32. Luo, Z. et al. Convergent modelling of past soil organic carbon stocks but divergent projections. Biogeosciences 12, 4373-4383 (2015).
  33. Georgiou, K. et al. Global stocks and capacity of mineral-associated soil organic carbon. Nat. Commun. 13, 3797 (2022).
  34. Eyring, V. et al. Overview of the Coupled Model Intercomparison Project Phase 6 (CMIP6) experimental design and organization. Geosci. Model Dev. 9, 1937-1958 (2016).
  35. Jobbágy, E. G. & Jackson, R. B. The vertical distribution of soil organic carbon and its relation to climate and vegetation. Ecol. Appl. 10, 423-436 (2000).
  36. Ahrens, B. et al. Combination of energy limitation and sorption capacity explains depth gradients. Soil Biol. Biochem. 148, 107912 (2020).
  37. Gentsch, N. et al. Temperature response of permafrost soil carbon is attenuated by mineral protection. Glob. Chang. Biol. 24, 3401-3415 (2018).
  38. Giardina, C. P. & Ryan, M. G. Evidence that decomposition rates of organic carbon inmineral soil do not vary with temperature. Nature 404, 858-861 (2000).
  39. Giardina, C. P., Litton, C. M., Crow, S. E. & Asner, G. P. Warming-related increases in soil efflux are explained by increased below-ground carbon flux. Nat. Clim. Chang. 4, 822-827 (2014).
  40. Wang, C. et al. The temperature sensitivity of soil: microbial biodiversity, growth, and carbon mineralization. ISME J. 15, 2738-2747 (2021).
  41. Shi, Z. et al. The age distribution of global soil carbon inferred from radiocarbon measurements. Nat. Geosci. 13, 555-559 (2020).
  42. He, Y. et al. Radiocarbon constraints imply reduced carbon uptake by soils during the 21st century. Science 353, 1419-1424 (2016).
  43. Todd-Brown, K. E. O. et al. Causes of variation in soil carbon simulations from CMIP5 Earth system models and comparison with observations. Biogeosciences 10, 1717-1736 (2013).
  44. Ito, A. et al. Soil carbon sequestration simulated in CMIP6-LUMIP models: implications for climatic mitigation. Environ. Res. Lett. 15, 124061 (2019).
  45. Abramoff, R. Z. et al. Improved global-scale predictions of soil carbon stocks with Millennial Version 2. Soil Biol. Biochem. 164, 108466 (2022).
  46. Zimmermann, M., Leifeld, J., Schmidt, M. W. I., Smith, P. & Fuhrer, J. Measured soil organic matter fractions can be related to pools in the RothC model. Eur. J. Soil Sci. 58, 658-667 (2007).
  47. Pierson, D. et al. Optimizing process-based models to predict current and future soil organic carbon stocks at high-resolution. Sci. Rep. 12, 10824 (2022).
  48. Koven, C. et al. On the formation of high-latitude soil carbon stocks: effects of cryoturbation and insulation by organic matter in a land surface model. Geophys. Res. Lett. https://doi. org/10.1029/2009GL040150 (2009).
  49. Koven, C. D. et al. The effect of vertically resolved soil biogeochemistry and alternate soil C and N models on C dynamics of CLM4. Biogeosciences 10, 7109-7131 (2013).
  50. Plaza, C. et al. Direct observation of permafrost degradation and rapid soil carbon loss in tundra. Nat. Geosci. 12, 627-631 (2019).
  51. Parton, W. J., Schimel, D. S., Cole, C. V. & Ojima, D. S. Analysis of factors controlling soil organic matter levels in Great Plains grasslands. Soil Sci. Soc. Am. J. 51, 1173-1179 (1987).
  52. Haaf, D., Six, J. & Doetterl, S. Global patterns of geo-ecological controls on the response of soil respiration to warming. Nat. Clim. Chang. 11, 623-627 (2021).
  53. Jones, C. D. et al. C4MIP – the Coupled Climate-Carbon Cycle Model Intercomparison Project: experimental protocol for CMIP6. Geosci. Model Dev. 9, 2853-2880 (2016).
  54. Bouskill, N. J., Riley, W. J., Zhu, Q., Mekonnen, Z. A. & Grant, R. F. Alaskan carbon-climate feedbacks will be weaker than inferred from short-term experiments. Nat. Commun. 11, 5798 (2020).
Publisher’s note Springer Nature remains neutral with regard to jurisdictional claims in published maps and institutional affiliations.
Open Access This article is licensed under a Creative Commons Attribution 4.0 International License, which permits use, sharing,
adaptation, distribution and reproduction in any medium or format, as long as you give appropriate credit to the original author(s) and the source, provide a link to the Creative Commons licence, and indicate if changes were made. The images or other third party material in this article are included in the article’s Creative Commons licence, unless indicated otherwise in a credit line to the material. If material is not included in the article’s Creative Commons licence and your intended use is not permitted by statutory regulation or exceeds the permitted use, you will need to obtain permission directly from the copyright holder. To view a copy of this licence, visit http://creativecommons. org/licenses/by/4.0/.
(c) The Author(s) 2024
Physical and Life Sciences Directorate, Lawrence Livermore National Laboratory, Livermore, CA, USA. Climate and Ecosystem Sciences Division, Lawrence Berkeley National Laboratory, Berkeley, CA, USA. Climate and Global Dynamics Laboratory, National Center for Atmospheric Research, Boulder, CO, USA. Institute of Arctic and Alpine Research, University of Colorado, Boulder, CO, USA. Natural Resource Ecology Laboratory, Colorado State University, Fort Collins, CO, USA. Department of Life and Environmental Sciences, University of California Merced, Merced, CA, USA. Ronin Institute, Montclair, NJ, USA. Department of Ecology and Evolutionary Biology, Yale University, New Haven, CT, USA. Department of Physical Geography and Ecosystem Science, Lund University, Lund, Sweden. Department of Plant Sciences, University of Cambridge, Cambridge, UK. Rocky Mountain Research Station, United States Forest Service, Boise, ID, USA. Climate Change Science Institute and Environmental Sciences Division, Oak Ridge National Laboratory, Oak Ridge, TN, USA. Department of Earth System Science, Stanford University, Stanford, CA, USA. Woods Institute for the Environment and Precourt Institute for Energy, Stanford University, Stanford, CA, USA. e-mail: georgiou1@lnl.gov

Methods

Data sources and processing

The overarching goal of this study was to use observed spatial gradients in soil C stocks-particularly in underlying unprotected (particulate) and protected (mineral-associated) C pools-and their relationships with temperature, to develop benchmarks for ESMs. Although such benchmarks derived from spatial gradients are insufficient for constraining transient responses or making projections (that is, space-for-time assumptions) , they do reflect steady-state differences and long-term climatological temperature sensitivities of soil C pools. These observed differences across spatial climate gradients should, in principle, be predicted by dynamical soil C models, and, thus, these benchmarks serve as important tests . However, meeting this constraint is not sufficient for ensuring the ability of models to produce accurate projections under global change, and so we urge experimental work that quantifies the transient responses of soil C pools across diverse climates and biomes .
Observationally derived climate and edaphic datasets for all global analyses were used at resolution. MAT was estimated from the CRU dataset (version 3.10 ) and mean annual precipitation from the GPCC dataset , both as 30 year annual averages. Land cover was obtained from the MODIS MCD12C1 product , and productivity was estimated from the MODIS net primary productivity product . Following Shi et al. , soil organic C stocks to 1 m depth were estimated as the mean of Harmonized World Soil Database and SoilGrids maps to reflect a best estimate and uncertainty across data products. Corresponding mineral-associated C stocks and prediction intervals were estimated in Georgiou et al. using a machine-learning (random forest) algorithm, and multiple cross-validation approaches were used to provide rigorous assessments of predictability . We also note that our conclusions were robust to the selected fractionation method (namely, size and density; Supplementary Fig. 5 and Supplementary Table 5) and reflect a global best estimate and uncertainty given existing observations. However, we encourage further measurements in cooler climates and sandy soils, where the relative contribution of fine particulate organic matter may be more substantial . In the present study, we focused our analyses on non-permafrost mineral soils with MAT given data limitations at higher latitudes . To exclude soils whose decomposition is limited by water saturation or aridity, we also removed gridcells that contain a coverage of more than 50% peat, defined as the Histosol soil order or Histel suborder, and those that are hyperarid (with an aridity index of ) or receive less than of precipitation. These gridcells were masked in white in all maps (Fig. 3) and were excluded from subsequent analyses.

Global land model output

Model output was sourced from CMIP6 ESMs and three offline biogeochemical testbed models for present-day (‘historical’) and future projections (‘ssp585’, or RCP8.5). Only CMIP6 models that reported soil C pool distributions were used in this study. Model details are listed in Supplementary Tables 1-3. Carbon stocks and climate covariates from each model were taken over the historical period as ten year annual averages for C stocks and 30 year annual averages for climate (spanning 2005-2015 and 1985-2015, respectively) to match the observation-based quantities. Specifically, MAT (‘tas’ for CMIP6 models), mean annual precipitation (‘pr’) and net primary productivity (‘npp’) were used from each model. Since the models do not provide depth-resolved C stocks, we used total soil C stocks (‘cSoil’ for CMIP6 models) in our analyses. Although the depth of soil C in CMIP6 models is not clearly defined, previous studies have compared with integrated soil C stocks . We believe that this represents the best benchmark on current models and follow this depth correspondence in comparison with the data, but note that any errors in the correspondence with depth could be reduced with future models that are depth-resolved and/or explicitly define a depth interval .
For the offline models of the biogeochemical testbed (that is, CASA-CNP, MIMICS and CORPSE), mineral-associated (protected) C was estimated by the explicit physicochemically protected pools for MIMICS and CORPSE, and the slowest-cycling (passive) pool for the first-order CASA-CNP model (see Wieder et al. for details on physicochemical protection within the three biogeochemical testbed models). Analogously, for the first-order CMIP6 models, the slowest-cycling C pool (‘cSoilSlow’) was used to represent mineral-protected C (see ‘Model pool interpretability’ in the Methods). We note that the CMIP6 model output repository uses the terminology cSoil for total soil C stocks and ‘cSoilFast’, ‘cSoilMedium’ and cSoilSlow for the three soil C pools that correspond to the ‘active’, ‘slow’, and passive pools, respectively.
Of the ten CMIP6 ESMs that reported soil C pool distributions, only one model constituted a conceptualization that did not align with mineral protection; namely, in TaiESM1, the soil C dynamics were parameterized as a decomposition cascade based on a synthesis of microcosm studies using radio-labelled substrates . We thus excluded TaiESM1 from our analyses, and note that the model can be redefined and parameterized for comparison with pool-specific benchmarks in future work. We also emphasize that not all first-order soil C models were formulated as a decomposition cascade based on recalcitrance. Rather, several first-order soil C models implicitly represent key processes by rerouting flows and imposing particular controls (for example, lignin, soil texture and climate) on the formation of select pools (see ‘Model pool interpretability’ in the Methods;Supplementary Fig. 12). To the best of our knowledge, the nine remaining CMIP6 ESMs (namely, ACCESS-ESM1-5, BCC-CSM2-MR, CESM2, CNRM-ESM2-1, E3SM-1-1-ECA, MIROC-ES2L, MRI-ESM2-0, IPSL-CM6A-LR, NorESM2) constitute formulations broadly based on the Century model and its derivatives, for which the slowest-cycling (passive) pool is conceptually aligned with physicochemical protection. Although parameterizations in implemented soil models may have diverged from published values, protected C appears to be defined consistently across the nine remaining CMIP6 ESMs (Supplementary Table 3). To facilitate future benchmarking studies and reduce potential uncertainties, we highly encourage more detailed documentation on parameterizations implemented in soil models within CMIP ESMs.
The protected C pool in each model was then compared with the total soil C for each gridcell globally to calculate the proportion of protected C (Supplementary Fig. 4). The global mean (with CIs) was calculated for each model and in each indicated temperature regime (Fig. 3 and Supplementary Fig. 5). We then calculated the spatially explicit multi-model mean across the ensemble of soil C models (Fig. 3c), as well as the latitudinal means of the observationally derived data product and multi-model ensemble (Fig. 3b). We also quantified changes in soil C pools for each model under an RCP8.5 (or ssp585) scenario by comparing projections from the end of the twenty-first century (2090-2100) with the present day (20052015). Results are shown as absolute and relative changes in soil C stocks globally (Supplementary Figs. 6 and 7 and Supplementary Table 4) and across time and latitude (as Hovmöller diagrams; Supplementary Fig. 8).

Model pool interpretability

The comparison of protected C across different model formulations, following the above pool nomenclature, has been proposed in several past studies with first-order models . We recognize that there are still inherent mismatches between operationally defined, measurable pools of soil organic C fractions and the modelled states that are simulated by different soil biogeochemical models . Although progress is being made to help bridge this divide , the global-scale models that are the focus of this work make assumptions that are broadly consistent with characteristics of mineral-associated and particulate soil C fractions (Supplementary Fig. 12).
Indeed, in non-permafrost mineral soils, the formation and composition of the passive pool in select first-order models (for example, in the Century model of Parton et al. ) was formulated to resemble the mineral-associated fraction, and mirrors the mathematical representations of physicochemically protected C in several microbially explicit models, including MIMICS and CORPSE . Namely, the protected (passive in the first-order models) pool is formed primarily from the microbial (active) pool, where this transfer coefficient is modulated by soil clay and silt content, such that proportionally more C is stored within the protected pool in fine-textured soils . More decomposable (metabolic) litter enters only the microbial (active) pool, whereas structural litter (controlled by lignin content) primarily enters the particulate (slow) pool . A small amount of the protected pool forms from direct sorption of the particulate pool . Consequently, the C:N ratio of the protected (passive) pool often resembles that of the microbial (active) pool (that is, typically for the protected pool in the Century model ), which is consistent with the stoichiometry of mineral-associated organic matter . By contrast, the C:N ratio of the slow pool is more closely aligned with the stoichiometry of particulate organic matter (that is, in the Century model ).
Finally, losses from the protected pool are represented as a first-order process in most soil C models , including the ones presented here, with typical intrinsic turnover times ranging between 75 and 1,000 years, which are broadly consistent with radiocarbon estimates (see Supplementary Table 3 and Supplementary Fig. 13). Whereas there is heterogeneity within all underlying soil fractions in practice, it is well accepted that mineral-associated organic C is generally slower-cycling (decades to millennia) than particulate organic C (days to decades) . Indeed, the intrinsic turnover times for protected (passive) C ranged from 200 to 450 years in all analysed CMIP6 ESMs, except for MIROC-ES2L and MRI-ESM2-0 for which the turnover times were 1,000 years (Supplementary Table 3). By contrast, intrinsic turnover times of the particulate (slow) pool ranged from 5 to 10 years in all analysed CMIP6 ESMs, except for MIROC-ES2L for which the turnover time was 25 years. These intrinsic turnover times are baseline (minimum) pool-specific values, such that environmental modifiers (based on temperature and moisture) further increase the turnover time in most gridcells; for example, by a factor of in temperate forests up to a factor of in Arctic regions for the Century model . These environmental controls are important when comparing pool-specific turnover times with global radiocarbon data (Supplementary Fig. 14), and future work could estimate the distribution of C ages for each modelled pool across gridcells globally. Leveraging measurements from the International Soil Radiocarbon Database , and following Shi et al. to convert between turnover time and , we show that the protected (passive) pool turnover time within many first-order models is broadly aligned with mean C ages of the mineral-associated fraction (Supplementary Table 3 and Supplementary Figs. 13 and 14). However, future model versions may further improve the correspondence by reducing the intrinsic turnover time of protected C , especially in MIROC-ES2L and MRI-ESM2-0, and strengthening its environmental controls to better match the global distribution of measurements (Supplementary Fig. 14).
By contrast, the turnover time of protected C is fixed at 75 years in CORPSE and ranges from 15 to 80 years in MIMICS based on a dependence on soil texture . We note that the turnover times of MIMICS and CORPSE appear to be biased low compared with radiocarbon data of soil fractions (Supplementary Figs. 13 and 14), which may explain their strong responses under future conditions (Supplementary Figs. 6-8) and suggests that bulk soil C ages may also be too young in these models. In fact, subsequent versions of MIMICS that have yet to be integrated into the global biogeochemical testbed have implemented much longer turnover times of protected C -for instance, ranging from 180 to 1,000 years (that is, increased by a factor of 12.5) in MIMICS-CN , and in the C-only MIMICS independently fitted to site-level data at
the Reynolds Creek Experimental Watershed . These modifications in subsequent versions of MIMICS have also resulted in much higher proportions of protected C (namely, ) that are better aligned with observational constraints. Thus, we emphasize that all models, including microbially explicit and first-order formulations, have the opportunity to be falsified or refined in future iterations, but this does not preclude the ability to benchmark them here.
The range of conceptual representations and parameterizations of physicochemical protection across ecosystem to global-scale models (for example, see the schematic in Sulman et al. ) presents an urgent need to develop and apply observationally derived constraints. We posit that both the microbially explicit and first-order soil C models in this study (Supplementary Tables 1-3) constitute conceptualizations that are compatible with benchmarking protected soil to refine future model parameterizations. Although we recognize that there are still inherent uncertainties in the interpretability of modelled pools and operationally defined fractions, we believe that this study represents a valuable benchmark on model pools globally. Observational syntheses show that mineral-associated C is typically an old (Supplementary Fig. 13 and Supplementary Table3) and large (Fig. 3 and Supplementary Fig. 5) component of total soil C. Thus, the slowest-cycling passive pool in first-order models-which broadly aligns with radiocarbon measurements of mineral-associated C (Supplementary Figs. 13 and 14)-should similarly represent a large fraction of the total soil C pool in mineral soils. Such a correspondence would also improve model performance metrics based on bulk soil C ages . Since pool-specific turnover times appear to be broadly aligned with observations, future studies may seek to refine other parameters that strongly affect the proportion of protected C -for example, increasing the fraction of the active pool that flows to the passive pool (Supplementary Figs. 12 and 15) and its mineralogical controls . Such parameters may also be informed by observational estimates of the relative flows of plant- or microbial-derived C to mineral-associated . Ultimately, we contend that benchmarking soil C pool distributions concurrently with radiocarbon ages in future work will present a powerful constraint on soil C dynamics across global models.

Data analysis

We investigated the relationship between soil C stocks (within unprotected and protected C pools) and MAT across the global data product and models. Soil C stocks for each pool were log-transformed and a linear regression was used to reflect a hypothesized exponential relationship with temperature (as in Hartley et al. ). To ensure that the observed global patterns were not driven by confounding environmental variables, we used a multiple linear regression to control for net primary productivity, mean annual precipitation and clay and silt content in our analyses. In all cases, the climate and productivity covariates were sourced from their respective model output or data product. Clay and silt content was obtained from the Harmonized World Soil Database as it was not reported for most CMIP6 models. The climatological temperature sensitivity was then calculated from the slope of the log-linear temperature relationship and, following Hartley et al. , summarized as the proportional decline in C stocks for every (analogous to a climatological , but for C stocks) with corresponding parametric 95% CIs (Supplementary Table 6).
This calculation was then repeated for protected and unprotected soil C pools in the data and models, across all mean temperatures above (Fig. 4) and across two underlying temperature regimes, namely cool ( ) and warm ( ) (Fig. 5 and Supplementary Fig. 9). Soils with mean temperatures below were not considered in our analyses due to distinct controls on soil C decomposition (for example, permafrost dynamics ) and consequent implications on the interpretability of protected pools in first-order models in these regions (Supplementary Fig. 3), as well as higher uncertainties in the data product within this temperature regime . Furthermore, the same
analyses were performed on an observational synthesis (Supplementary Figs. 10 and 11). The general agreement between the observations and data product provides further evidence for the robustness of the reported temperature sensitivity trends between protected and unprotected soil C across climate regimes (Fig. 2c). Differences in climatological temperature sensitivity between protected and unprotected soil C pools, and across the data and models, were deemed statistically significant when the 95% CIs did not overlap (Supplementary Table 6).

Data availability

All data used in this manuscript are fully open-access and available at the references provided. The CMIP6 model output is available from the Earth System Grid Federation at https://esgf-node.llnl.gov/search/ cmip6/,the Biogeochemical Testbed model output is available on the Climate Data Gateway at https://doi.org/10.5065/d6nc600w and the observationally derived dataset is available on Zenodo at https://doi. org/10.5281/zenodo.6539765.

Code availability

All code relating to this study is available from the corresponding author on GitHubathttps://github.com/katerina-georgiou/global-soilCpools and is archived on Zenodo at https://doi.org/10.5281/zenodo.10515706.

References

  1. Harris, I., Jones, P. D., Osborn, T. J. & Lister, D. H. Updated high-resolution grids of monthly climatic observations – the CRU TS3.10 Dataset. Int. J. Climatol. 34, 623-642 (2014).
  2. Schneider, U. et al. GPCC Full Data Reanalysis Version 6.0 at : Monthly Land-Surface Precipitation from Rain-Gauges built on GTS-based and Historic Data (GPCC, 2011); https://doi. org/10.5676/DWD_GPCC/FD_M_V6_050
  3. Friedl, M. A. et al. MODIS Collection 5 global land cover: algorithm refinements and characterization of new datasets. Remote Sens. Environ. 114, 168-182 (2010).
  4. Zhao, M., Heinsch, F. A., Nemani, R. R. & Running, S. W. Improvements of the MODIS terrestrial gross and net primary production global data set. Remote Sens. Environ. 95, 164-176 (2005).
  5. Wieder, W. R., Boehnert, J., Bonan, G. B. & Langseth, M. Regridded Harmonized World Soil Database v1.2 (ORNL DAAC, 2014); https:// doi.org/10.3334/ORNLDAAC/1247
  6. Hengl, T. et al. SoilGrids250m: global gridded soil information based on machine learning. PLoS ONE https://doi.org/10.1371/ journal.pone. 0169748 (2017).
  7. Georgiou, K. et al. Globally-gridded data for manuscript: global stocks and capacity of mineral-associated soil organic carbon. Zenodo https://doi.org/10.5281/zenodo. 6539765 (2022)
  8. Ploton, P. et al. Spatial validation reveals poor predictive performance of large-scale ecological mapping models. Nat. Commun. 11, 4540 (2020).
  9. Meyer, H. & Pebesma, E. Machine learning-based global maps of ecological variables and the challenge of assessing them. Nat. Commun. 13, 2208 (2022).
  10. Thornton, P. E. & Rosenbloom, N. A. Ecosystem model spin-up: estimating steady state conditions in a coupled terrestrial carbon and nitrogen cycle model. Ecol. Modell. 189, 25-48 (2005).
  11. Lawrence, D. M. et al. Parameterization improvements and functional and structural advances in Version 4 of the Community Land Model. J. Adv. Model. Earth Syst. https://doi. org/10.1029/2011MS00045 (2011).
  12. Lee, W. L. et al. Taiwan Earth System Model Version 1: description and evaluation of mean state. Geosci. Model Dev. 13, 3887-3904 (2020).
  13. Christensen, B. T. in Evaluation of Soil Organic Matter Models Vol. 38 (eds Powlson, D. S. et al.) 143-159 (Springer, 1996).
  14. Elliot, E. T., Paustian, K. & Frey, S. D. in Evaluation of Soil Organic Matter Models Vol. 38 (eds Powlson, D. S. et al.) 161-179 (Springer, 1996).
  15. Lehmann, J. & Kleber, M. The contentious nature of soil organic matter. Nature 528, 60-68 (2015).
  16. Zhang, Y. et al. Simulating measurable ecosystem carbon and nitrogen dynamics with the mechanistically defined MEMS 2.0 model. Biogeosciences 18, 3147-3171 (2021).
  17. Dangal, S. R. S. et al. Improving soil carbon estimates by linking conceptual pools against measurable carbon fractions in the DAYCENT model version 4.5. J. Adv. Model. Earth Syst. 14, e2021MSOO2622 (2022).
  18. Abramoff, R. et al. The Millennial model: in search of measurable pools and transformations for modeling soil carbon in the new century. Biogeochemistry 137, 51-71 (2018).
  19. Parton, W. J. & Rasmussen, P. E. Long-term effects of crop management in wheat-fallow: II. CENTURY model simulations. Soil Sci. Soc. Am. J. 58, 530-536 (1994).
  20. Cotrufo, M. F., Ranalli, M. G., Haddix, M. L., Six, J. & Lugato, E. Soil carbon storage informed by particulate and mineral-associated organic matter. Nat. Geosci. 12, 989-994 (2019).
  21. Rocci, K. S. et al. Aligning theoretical and empirical representations of soil carbon-to-nitrogen stoichiometry with process-based terrestrial biogeochemistry models. Soil Biol. Biochem. 189, 109272 (2024).
  22. Lawrence, C. R. et al. An open-source database for the synthesis of soil radiocarbon data: International Soil Radiocarbon Database (ISRaD) version 1.0. Earth Syst. Sci. Data 12, 61-76 (2020).
  23. Kyker-Snowman, E., Wieder, W. R., Frey, S. D. & Grandy, A. S. Stoichiometrically coupled carbon and nitrogen cycling in the MIcrobial-MIneral Carbon Stabilization model version 1.0 (MIMICS-CN v1.0). Geosci. Model Dev. 13, 4413-4434 (2020).
  24. Georgiou, K. et al. Divergent controls of soil organic carbon between observations and process-based models. Biogeochemistry 2, 775-792 (2021).
  25. Angst, G., Mueller, K. E., Nierop, K. G. J. & Simpson, M. J. Plant- or microbial-derived? A review on the molecular composition of stabilized soil organic matter. Soil Biol. Biochem. 156, 108189 (2021).

Acknowledgements

K.G. was supported as a Lawrence Fellow at Lawrence Livermore National Laboratory (LLNL) by the LLNL-LDRD Program under Project No. 21-ERD-045 and 24-LW-053. J.P.-R. and E.W.S. were supported by the US Department of Energy (DOE) Office of Science, Office of Biological and Environmental Research, Genomic Science Program as part of the LLNL Microbes Persist Scientific Focus Area, SCW1632. Work at LLNL was conducted under the auspices of DOE Contract DE-AC5207NA27344. W.R.W. was supported by National Science Foundation Grants 1926413 and 2031238 and by USDA NIFA-AFRI Grant 2020-67019-31395. C.D.K., W.J.R. and Q.Z. were supported by the US DOE Biological and Environmental Research (BER) Program at LBNL under DOE Contract DE-ACO2-05CH11231 through the Regional and Global Model Analysis Program (RUBISCO SFA). N.J.B. was supported by the US DOE BER Early Career Research Program under Contract FPOOOO5182. R.Z.A. and B.N.S. were supported by the US DOE BER at Oak Ridge National Laboratory under DOE Contract DE-AC05-000R22725. A.A. acknowledges the research environment Biodiversity and Ecosystem Services in a Changing Climate (BECC) at Lund University and funding from the Swedish Research Council (2021-05344).

Author contributions

K.G. conceived and designed the study, based on ideas developed through discussions with C.D.K., W.R.W., W.J.R. and R.B.J. All authors contributed to the study development. K.G., W.R.W., M.D.H. and Q.Z. collected and contributed to the model output. M.D.H., W.J.P., W.R.W., C.D.K., A.A., R.Z.A., D.P. and B.N.S. provided insights on the model
formulations, and J.P.-R., N.J.B., E.W.S. and A.F.A.P. provided feedback on the data analyses. K.G. performed all analyses and wrote the first draft of the paper. All authors contributed to subsequent paper revisions.

Competing interests

The authors declare no competing interests.

Additional information

Supplementary information The online version contains supplementary material available at https://doi.org/10.1038/s41561-024-01384-7.
Correspondence and requests for materials should be addressed to Katerina Georgiou.
Peer review information Nature Geoscience thanks Emanuele Lugato and the other, anonymous, reviewer(s) for their contribution to the peer review of this work. Primary Handling Editor: Xujia Jiang, in collaboration with the Nature Geoscience team.
Reprints and permissions information is available at www.nature.com/reprints.