الشيخوخة تدفع مقاومة العلاج المناعي من خلال تحفيز بيئة ورمية مثبطة للمناعة Senescence drives immunotherapy resistance by inducing an immunosuppressive tumor microenvironment
قد تكون إمكانيات مثبطات نقاط التفتيش المناعية (ICI) محدودة في الحالات التي تتعرض فيها لياقة خلايا المناعة للضعف. هنا، نوضح أن فعالية العلاجات المناعية للسرطان تتأثر بتراكم الخلايا الشيخوخة في الفئران وفي سياق الشيخوخة الناتجة عن العلاج (TIS). يرتبط مقاومة العلاج المناعي بانخفاض تراكم وتفعيل خلايا CD8 T داخل الأورام. إن القضاء على الخلايا الشيخوخة يعيد التوازن المناعي داخل بيئة الورم الدقيقة (TME) ويزيد من بقاء الفئران استجابة للعلاج المناعي. باستخدام تحليل النسخ الجيني على مستوى الخلية الواحدة، نلاحظ أن حقن ABT263 (نافيوتوكلاكس) يعكس الملف المناعي المثبط المتفاقم للخلايا النخاعية في TME. إن القضاء على هذه الخلايا النخاعية يعيد أيضًا تكاثر خلايا CD8 T في المختبر ويقضي على مقاومة العلاج المناعي في الجسم الحي. بشكل عام، تشير دراستنا إلى أن استخدام الأدوية السنو ليتية قبل ICI قد يشكل نهجًا دوائيًا لتحسين فعالية العلاجات المناعية للسرطان.
تعتبر العلاجات المناعية المستندة إلى مثبطات نقاط التفتيش المناعية (ICI)، من خلال تخفيف المسارات المثبطة للمناعة، تغييرًا جذريًا في علاجات السرطان.. ومع ذلك، اعتمادًا على نوع السرطان، من المرضى المعالجين إما أنهم مقاومون للعلاج المناعي أو يتعرضون للانتكاس بعد بضع سنواتنتيجة لذلك، هناك حاجة ملحة لتحديد الآليات التي تؤثر على الإمكانيات الكاملة لعلاج حجب المناعة، خاصة في الأورام الصلبة.
نعتقد أن تراكم الخلايا الشيخوخة بعد التعرض للإجهادات الجينية، مثل علاجات السرطان (العلاج الإشعاعي والعلاج الكيميائي)يمكن أن يؤدي إلى مقاومة العلاج المناعي. في الواقع، من المعروف أن تراكم الخلايا الشيخوخة يحفز الأمراض المرتبطة بالعمر، وقد أظهرنا مؤخرًا أن الشيخوخة الناتجة عن الإشعاع المؤين تؤثر بشكل كبير على وظائف خلايا المناعة في الفئران.. يمكن عكس هذا النمط الظاهري بعد الإزالة الجينية لـ الخلايا المتقدمة في السنعلاوة على ذلك، أظهرت دراسة حديثة زيادة في عدد خلايا T الشيخوخة ذات القدرة التناسلية المعطلة في دم الإنسان خلال الشيخوخة.أظهرت دراسات أخرى أن حجب إشارات تلف الحمض النووي يمكن أن يمنع شيخوخة خلايا T الخاصة بالأورام ويعزز فعالية مثبطات المناعة ضد الأورام.. وبالمثل، أظهر استخدام السبيرميدين في الفئران المسنّة تحسين فعالية العلاج المناعي من خلال استعادة الأيض الميتوكوندري في خلايا CD8 T.تراكم الخلايا النخاعية، وخاصة خلايا المثبطات المشتقة من النخاع (MDSC)، هو آلية مهمة تم إثبات أنها تعيق استجابة الجهاز المناعي للورم.علاوة على ذلك، أظهرت الشيخوخة والتعرض للعلاج الإشعاعي أنهما يفضلان الانحراف النخاعي.تؤدي هذه الملاحظات إلى افتراضنا أن الأدوية السينوبيوتية قد تكون قادرة على تحسين العلاجات المعتمدة على مثبطات المناعة من خلال تجديد خلايا المناعة. تم تطوير الأدوية السينوبيوتية مؤخرًا للقضاء بشكل خاص على الخلايا الشيخوخة، والتي أظهرت
تقليل شدة الأمراض المرتبطة بالعمرعلى وجه الخصوص، تم إثبات أن ABT263 (نافوتوكلاكس)، وهو مثبط قوي لبروتينات عائلة BCL-2، يزيل الخلايا المسنّة بكفاءة من الأنسجة اللمفاوية ويقلل من انحراف الخلايا النخاعية في الفئران المسنّة.. أخيرًا، أظهرت الأدلة الحديثة أنه من الممكن إزالة الخلايا الشيخوخة في البشر باستخدام أدوية السينوبيوتيك.
هنا، باستخدام نماذج سرطان الفأر، نوضح أنالعلاج المناعي PD-L1 يتعرض للخطر في الفئران التي تعرضت سابقًا للعلاج من السرطان وفي سياق الشيخوخة الناتجة عن العلاج (TIS). كما نوضح أن الشيخوخة تؤثر سلبًا على التأثير الأبسكوبال، الذي يُعرف برفض المناعة لورم ثانوي بعيد عن ورم أولي تم علاجه بالإشعاع.ميكانيكياً، نوضح أن كلا الأثرين الضارين مرتبطان بضعف تنشيط خلايا CD8 T الناتج عن بيئة الورم المثبطة للمناعة، ويمكن عكسهما عند معالجة الفئران بـ ABT263 أو استنفاد خلايا المايلود Ly6c+. تشير نتائجنا إلى أن الجمع بين دواء سينيوليتيك و ICI قد يكون استراتيجية لتحسين فعالية العلاجات المناعية.
النتائج
تؤدي الشيخوخة إلى مقاومة العلاج المناعي في الفئران
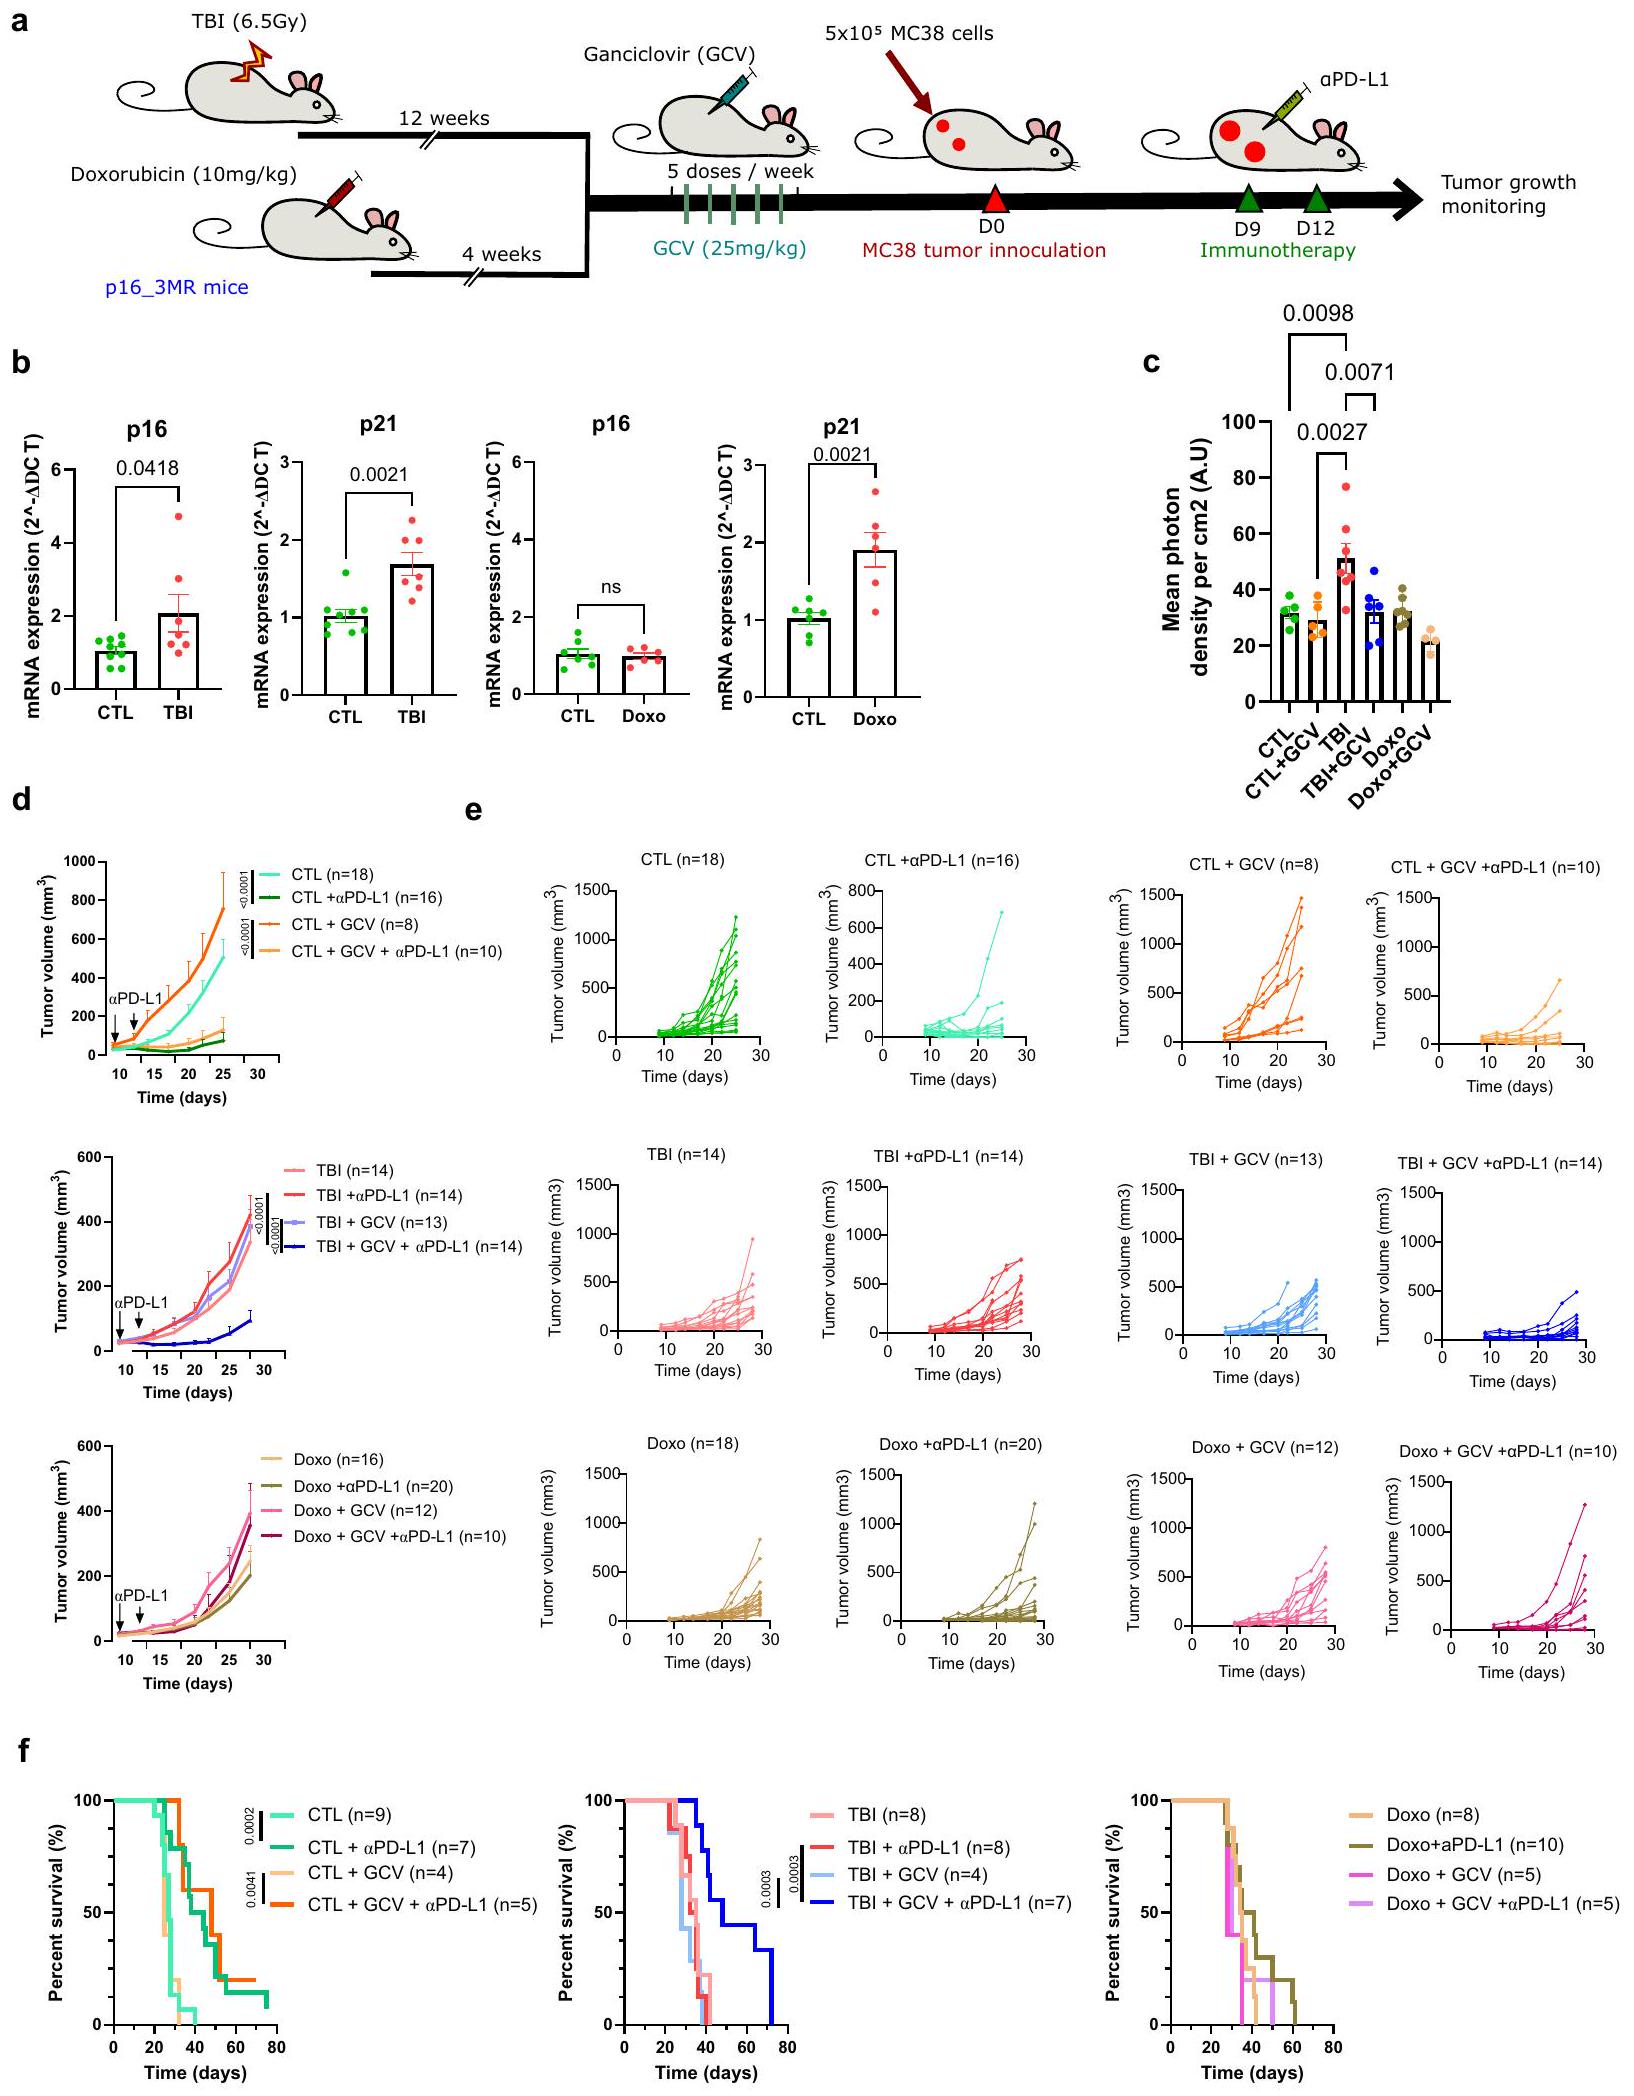
توجد الخلايا الشيخوخة في الناجين من السرطان الذين خضعوا للعلاج الكيميائي والعلاج الإشعاعي خلال فترة علاجهم.للتحقق من تأثير الشيخوخة في سياق العلاج المناعي للسرطان، استخدمنا نموذجين موثوقين من الفئران لتحفيز الشيخوخة. تم إنشاء أحدهما عن طريق الإشعاع الكلي للجسم (TBI) بجرعة تحت القاتلة تبلغ 6.5 غيغا، وتم تحفيز الثاني عن طريق حقنة واحدة من دوكسوروبيسين بجرعة من (Doxo؛ الشكل 1أ). هذه النماذج ذات صلة حيث أن مرضى السرطان غالبًا ما يكونون مسنين و/أو قد تعرضوا سابقًا للأدوية السامة للخلايا قبل علاجات المناعة. لقد أظهرنا نحن وآخرون أن نمط الشيخوخة يتشكل تدريجيًا في هذه النماذج الفأرية ويظل مستقرًا على الأقلأسابيع بعدوأربعة أسابيع بعد حقن الدوكسوروبيسين. في الواقع، تعبير و/أويزداد في الطحال لدى الفئران المعالجة بإصابة الدماغ الرضحية أو دوكسوروبيسين (الشكل 1ب). من المهم أن عدد خلايا الدم المكونة للدم يمكن أن يتعافى بالكامل في كلا النموذجين (الشكل التكميلي 1). علاوة على ذلك، للتحقيق في الدور المحدد للخلايا الشيخوخة، استفدنا من نموذج الفأر p16-3MR الذي يسمح بتتبع وإزالة الخلايا الشيخوخة p16+ بعد حقن جانسيكلوفير (GCV).كما هو متوقع من عملنا السابق، يؤدي تعرض فئران p16-3MR المعالجة بـ GCV إلى القضاء على خلايا p16+ في الطحال (الشكل 1c).. ومن ثم، لتقييم تأثير الشيخوخة على فعالية علاجات المناعية PD-L1 قمنا بحقن خلايا ورم MC38 في فئران p163MR التي تعرضت سابقًا للإشعاع المؤين أو دوكسوروبيسين. حقن الـالأجسام المضادة حدت من نمو أورام MC38 وحسنت من بقاء الفئران الضابطة (CTL). ومع ذلك، فإن نفس العلاجات في كل من الفئران المعالجة بالإشعاع الكلي (TBI) والفئران المعالجة بدوكسوروبيسين (Doxo) فشلت في كبح نمو الورم ولم تحسن البقاء (الشكل 1d-f). لم تكن هذه الملاحظات محدودة بسلالة خلايا MC38 حيث أن فعاليةتم تقليل علاجات PD-L1 أيضًا في الفئران المعالجة بإصابة الدماغ المؤلمة (TBI) التي تم حقنها بخط خلايا اللمفوما EL4 (الشكل التوضيحي 2).من المهم أن القضاء على خلايا p16+ عن طريق حقن GCV يمكن أن يعيد فعاليةPD-L1 وتحسين البقاء في الفئران التي تعرضت سابقًا للإشعاع المؤين (الشكل 1d-f). لاحظ أنه كما هو متوقع، لم يكن لجزيء GCV أي تأثير مفيد في الفئران المعالجة بدوكسوروبسين حيث لم يزداد تعبير p16 في هذه الحيوانات، وهو نمط ظاهري لوحظ أيضًا من قبل آخرين.من المثير للاهتمام أن نمو الورم تأخر في الفئران التي تعرضت سابقًا للإشعاع المؤين أو دوكسوروبيسين مقارنة بالفئران الضابطة، وهو نمط تم ملاحظته أيضًا في الفئران المسنّة.لم يتغير معدل نمو الورم بسبب العلاجات باستخدام GCV وحده، حيث توفيت الفئران المعالجة بـ TBI بعد حوالي 40 يومًا من حقن خلايا الورم مقارنةً بحوالي 25 يومًا في حالة الفئران الضابطة، مما يشير إلى أن تأخير نمو الورم مستقل عن الشيخوخة. بشكل عام، تُظهر هذه النتائج التأثير الضار للخلايا الشيخوخة على استجابة الجهاز المناعي للورم وأن إزالتها يمكن أن تعيد فعالية العلاج المناعي.
الشيخوخة المستحثة محليًا كافية لتقليل فعالية العلاج المناعي
ثم سألنا إذا كانت الشيخوخة التي تحدث محليًا في سياق TIS ستؤثر أيضًا على فعاليةعلاجات PD-L1. للإجابة على هذا السؤال، استخدمنا نموذجًا حيث تم إنشاء أورام MC38 (حواليفي الحجم) تم تعريضها لجرعة واحدة قدرها 12 غي من العلاج الإشعاعي المحلي (RT) (الشكل التكميلي 3A). من الممكن تعريض الورم فقط للعلاج الإشعاعي عن طريق حماية باقي الفأر بلوحة رصاصية. عند هذه الجرعة، تم تحفيز الشيخوخة في الأورام كما تم تحديده من خلال تعبير SA-إشارة بيولومينسنت تعتمد على Gal و p16 مرتبطة بتعبير رينيللا-لوكفيراز للخلايا المتقدمة في العمر في فئران p16-3MR (الشكل التكميلي 3B، C). تزامن تحفيز الشيخوخة مع توقف نمو الورم مؤقتًا لمدة تقارب 14 يومًا بعد ذلك استؤنف النمو. وبالتالي، بعد 14 و 17 يومًا من العلاج الإشعاعي المحلي، تم حقن الفئران بـتمت مراقبة جسم مضاد PD-L1 ونمو الورم. كما لاحظنا في الفئران التي تعرضت سابقًا للإشعاع الكلي للجسم (TBI) والدوكسوروبيسين (Doxo)، فإن الشيخوخة المستحثة محليًا كافية لتقليل فعاليةعلاجات PD-L1 (الشكل التكميلي 3D).
إزالة الخلايا الشيخوخة باستخدام ABT263 تعيد فعالية العلاج المناعي في الفئران
في محاولة لتوفير نهج أكثر ترجمة، أردنا بعد ذلك إزالة الخلايا الشيخوخة باستخدام علاج دوائي ورؤية ما إذا كان ذلك سيحسن أيضًا نجاح العلاج المناعي. بناءً على ذلك، قمنا بتقييم ما إذا كان ABT263، وهو دواء سِنوليتك موثق“، ستقوم بكفاءة بإزالة الخلايا الشيخوخة في الفئران المعالجة بإصابة الدماغ الرضحية. لهذا الغرض، قمنا بمراقبة الإشارة البيولومينيسنت المرتبطة بالخلايا الشيخوخة في فئران p163MR. لاحظنا انخفاضًا في إشارة اللوسيفيراز ومستويات التعبير الجيني p16/p21، من الطحال لفئران p16-3MR المعالجة بإصابة الدماغ الرضحية والمُعالجة بـ ABT263 (الشكل 2a-c). كما لوحظ مع GCV، فإن علاج ABT263 حسّن فعاليةالعلاج المناعي PD-L1 ضد خلايا ورم MC38 في الفئران المعرضة للإشعاع (الشكل 2d، e). بالإضافة إلى ذلك، زاد ABT263 بشكل كبير من بقاء الفئران التي تعرضت سابقًا للإشعاع بينما لم يكن له تأثير على الفئران الضابطة (الشكل 2f). لفهم كيف حسّن إزالة الخلايا المسنّة الاستجابة المناعية المضادة للورم، استخدمنا تحليل تدفق الخلايا لتقييم تسلل الخلايا المناعية في الأورام التي تم فصلها بعد يومين من آخرحقن PD-L1 (اليوم 14 بعد حقن الورم). من المثير للاهتمام، أننا لاحظنا نسبة أعلى من خلايا CD8 T في أورام جميع المجموعات التي تتلقىحقن PD-L1 باستثناء الأورام المنفصلة عن فئران TBI (الشكل 2g). لم تكن هناك اختلافات كبيرة في خلايا CD4 T وكان هناك اتجاه تنازلي في نسبة الخلايا النخاعية (CD11b +) في جميع المجموعات التي تلقتحقن PD-L1 باستثناء الفئران المصابة بإصابة دماغية رضحية (TBI) التي لم تُعالج بـ ABT263 (الشكل 2g). وهذا يتماشى مع تقرير سابق يُظهر أن خلايا CD8 T تتكاثر بشكل كبير استجابةً لعلاج ICIs.. وبالتالي، زادت نسبة خلايا CD8 T إلى خلايا CD11b + بعد العلاج المناعي في جميع المجموعات باستثناء مجموعة الفئران المعرضة للإشعاع (TBI) التي لم تُعالج بـ ABT263 (الشكل 2h). من المهم أن ABT263 لم يكن له تأثير كبير على معدل نمو الورم وعلى التسلل المناعي في غياب علاجات PD-L1. تشير هذه الملاحظات إلى أن الشيخوخة، إما بشكل مباشر أو من خلال تأثيرها على البيئة المجهرية للورم، تتداخل مع فعاليةالعلاج المناعي PD-L1 من خلال تقييد توسع خلايا CD8 T داخل الأورام.
ABT263 يحسن التأثير الأبسكوبال
بعد ذلك، أردنا تقييم ما إذا كانت الشيخوخة ستؤثر أيضًا على الاستجابة المناعية المعنية في التأثير البعيد. يُعرف التأثير البعيد بأنه إزالة المناعة لورم ثانوي بعيد عن ورم أولي تم علاجه بالإشعاع. عندما يرتبط مع مثبطات نقاط التفتيش المناعية، أظهر الإشعاع أنه يحسن بشكل كبير التأثير البعيد على الأرجح من خلال المساعدة في إطلاق وتقديم مستضدات الورم.قمنا بالتحقيق في التأثير الأبسكوبال عن طريق تلقيح الفئران على كل جانب بخلايا ورم MC38، وهو ورم أولي وورم ثانوي أصغر. البروتوكول الذي استخدمناه شمل تعريض الورم الأولي بجرعة مجزأة من العلاج الإشعاعي. ) تليها حقن CTLA-4 في الأيام 14 و 17 و 20 (الشكل 3أ). هنا مرة أخرى، من الممكن فقط تعريض الورم الأساسي لـ
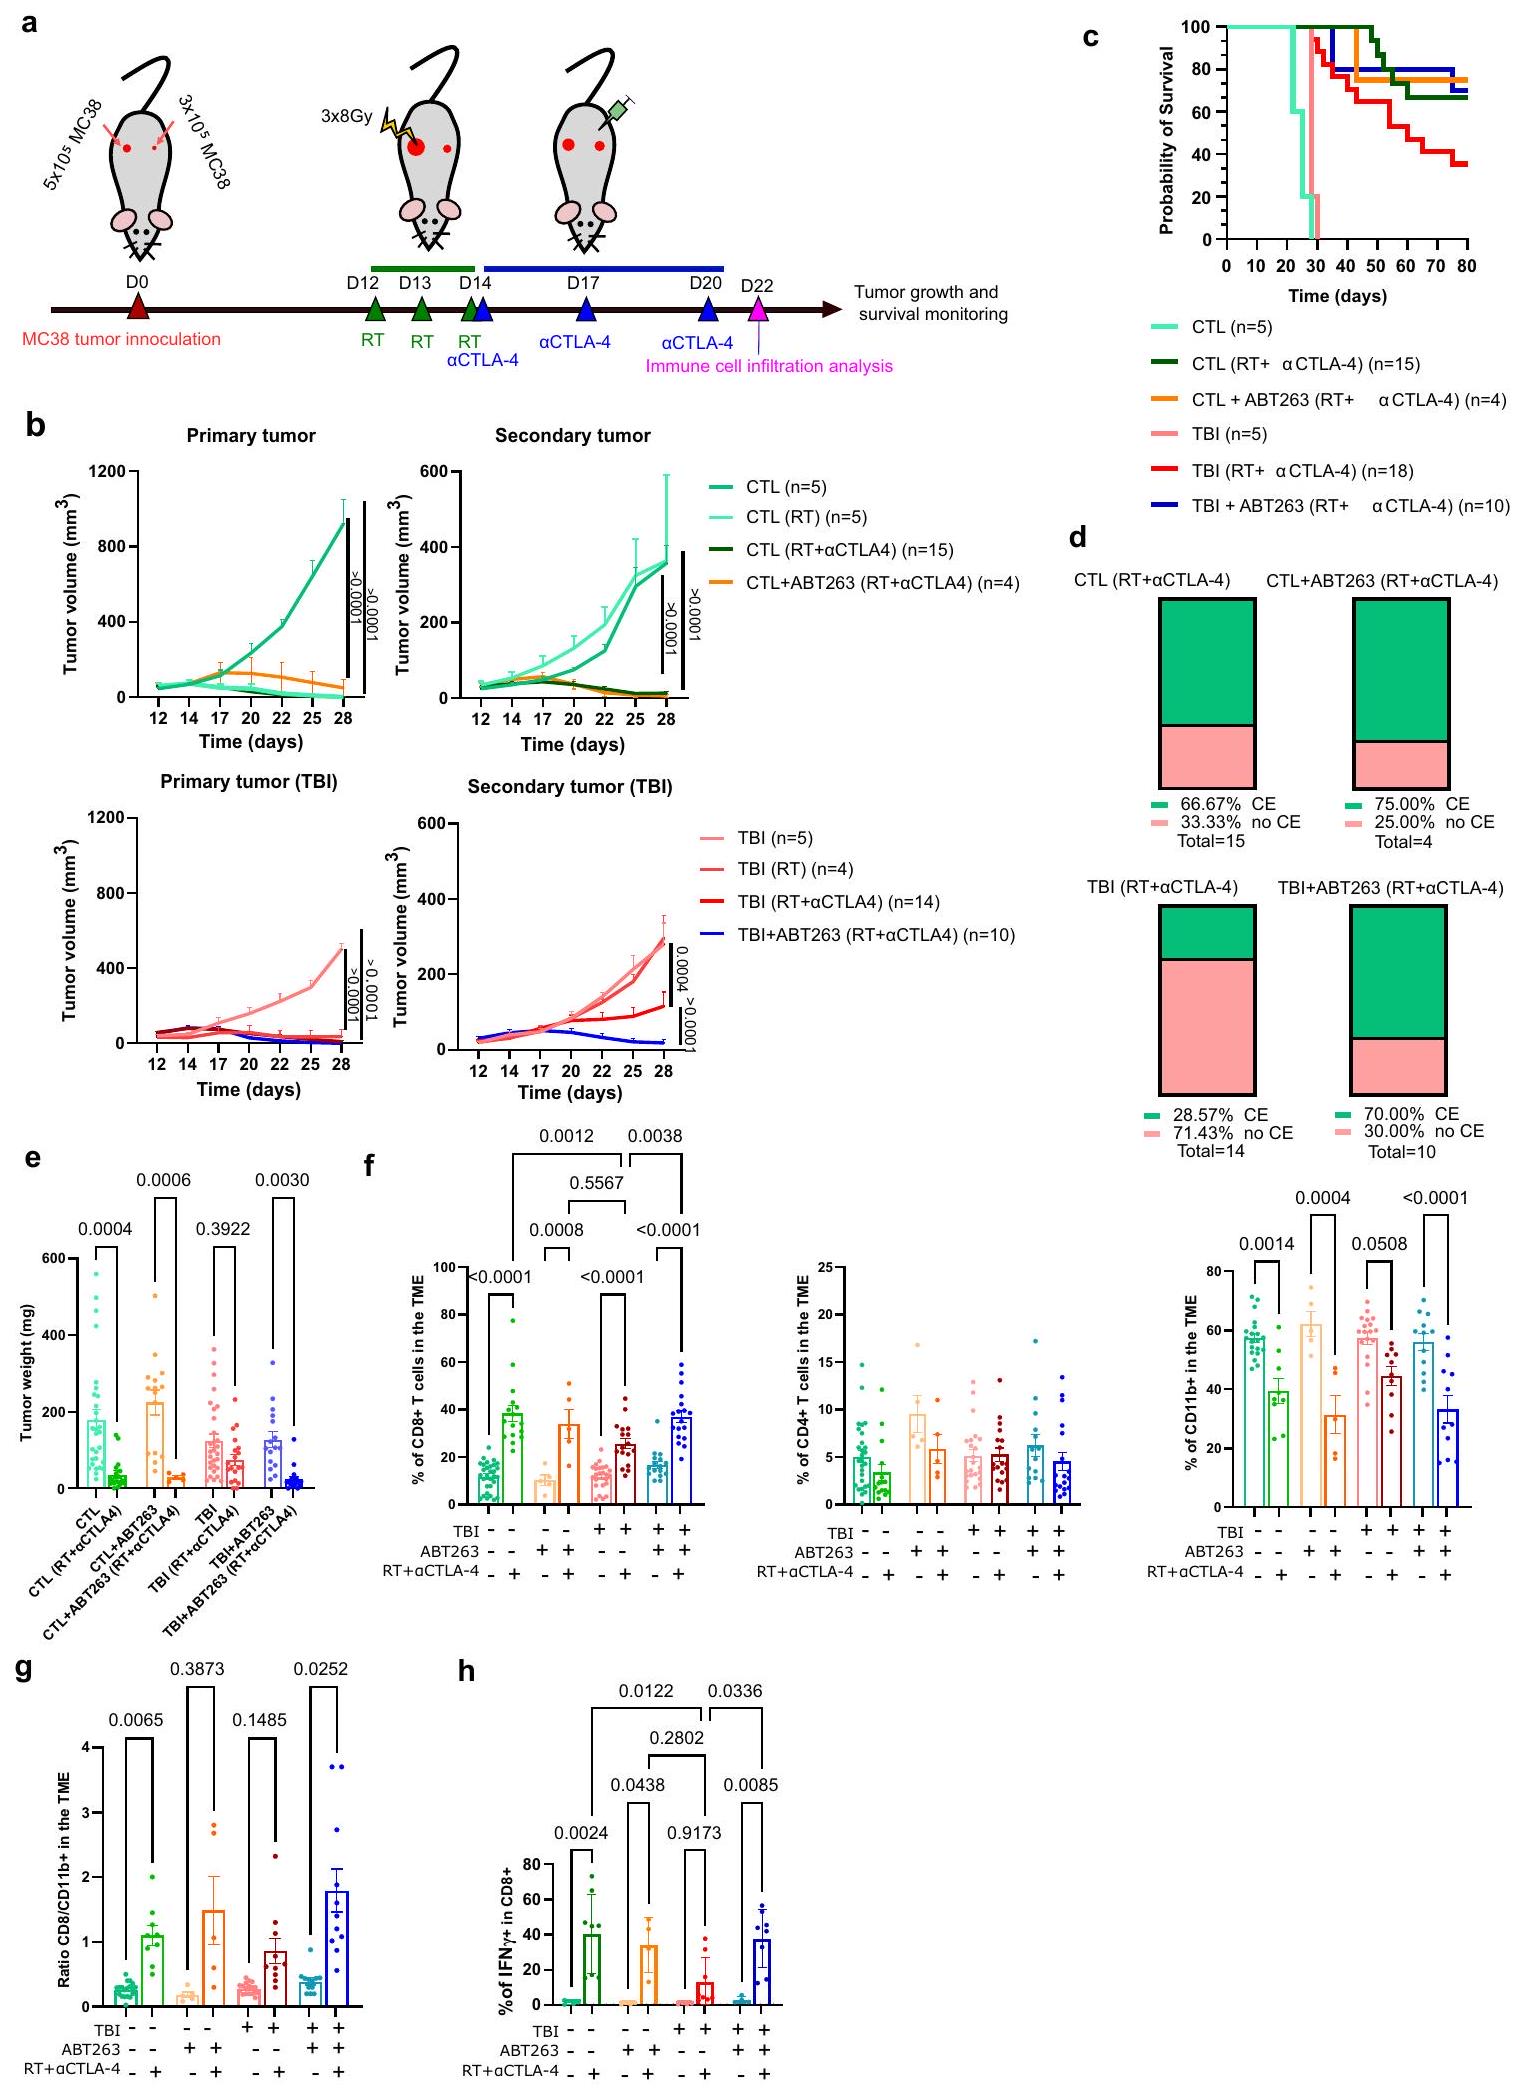
RT عن طريق حماية باقي الفأر بلوحة LED. في هذه التجربة، اخترنا استخدام حجبلقد أظهر جسم مضاد CTLA-4 منذ حقنه أنه ليس له تأثير على نمو أورام MC38، بينما يؤدي دمجه مع العلاج الإشعاعي إلى تحسين كبير في التأثير البعيد.لاحظ أنه في هذا النموذج، يتم القضاء على الورم الأساسي تقريبًا بالكامل استجابةً للعلاج الإشعاعي وحده في كل من الفئران الضابطة وفئران TBI. ومع ذلك، فإن إزالة الورم المناعي للورم الثانوي البعيد الورم يعتمد بالكامل علىعلاج CTLA-4. باستخدام هذا المزيج، لاحظنا أن التأثير الأبسكوبال سمح بالقضاء تقريبًا على الورم الثانوي في الفئران الضابطة بينما كانت الفعالية منخفضة في فئران TBI (الشكل 3ب، د، هـ). حقن الفئران بـ ABT263 قبل العلاج الإشعاعي عزز فعالية التأثير الأبسكوبال في فئران TBI وحسن من بقائهم إلى مستوى مشابه لما لاحظناه في الفئران الضابطة (الشكل 3ب، ج). هنا مرة أخرى، قمنا بالتحقيق
الشكل 1 | الشيخوخة تؤدي إلى مقاومة العلاج المناعي. أ رسم تخطيطي للتجربة. باختصار، تم تحفيز الشيخوخة في فئران p16-3MR بجرعة واحدة قدرها 6.5 غيغا من الإشعاع الكلي للجسم (TBI) أو بعد حقن دوكسو. ). بعد 12 أسبوعًا من إصابة الدماغ الرضحية أو 4 أسابيع بعد حقن الدوكسوروبيسين، تم حقن الفئران عن طريق البطن بـ GCV ( ) لمدة 5 أيام متتالية لإزالة الخلايا الشيخوخة. بعد 5 أيام من آخر حقنة من GCV، تم حقن الفئران في كل جانب بـخلايا ورم MC38 التي تعبر عن بروتين الفلورسنت mPlum. تم حقن الفئران بـالأجسام المضادة المثبطة لـ PD-L1 في اليومين 9 و12 وتم تقييم نمو الورم حتى الوصول إلى نقطة الحد. ب التعبير النسبي لـ و تم قياسه بواسطة RT_qPCR في الطحال بعد 10 أسابيع من تحفيز الشيخوخة باستخدام TBI أو 4 أسابيع بعد علاجات Doxo. و و دوكسو من الحيوانات المستقلة. ذو ذيلين غير متزاوجين-اختبار لـفي مجموعة دوكسو، واختبار مان-ويتني لـفي مجموعة إصابة الدماغ الرضحية. ما هو معروض هو المتوسطSEM. ج. 16 تم قياس التعبير بواسطة الومضات الحيوية في الطحال لفئران p16-3MR قبل وبعد العلاج بـ GCV.، دوكسودوكسو+جي سي في من حيوانات مستقلة. تحليل التباين الأحادي العادي مع تصحيح توكي. المعروض هو المتوسطSEM. يظهر متوسط نمو الورمتمت دراسة SEM على مدى 25 يومًا لفئران CTL و28 يومًا لفئران TBI/Doxo. الفئران الضابطة التي لم تتعرض لـ TBI أو Doxo تُشير إليها كـ CTL. العدد الإجمالي للأورام لكل مجموعة موضح بين قوسين. تم استخدام تحليل التأثيرات المختلطة أو ANOVA ثنائي الاتجاه مع تصحيح Tukey. e موضح حجم كل ورم فردي في النقطة الزمنية المحددة. العدد الإجمالي للأورام لكل مجموعة موضح بين قوسين. f مخططات بقاء Kaplan-Meyer لفئران CTL وTBI وDoxo لكل من الشروط المحددة. العدد الإجمالي للفئران لكل مجموعة موضح بين قوسين. اختبار Log-rank (اختبار Mantel-Cox). تم توفير بيانات المصدر كملف بيانات مصدر. التسلل المناعي في البيئة المجهرية للورم من خلال فصل الأورام الثانوية في اليوم 22 بعد حقن الورم أو بعد يومين من آخر حقنةCTLA-4. في هذه النقطة الزمنية، يكون التأثير الأبسكوبال في أقوى حالاته وتبدأ الأورام الثانوية في الرفض في جميع المجموعات. أظهر تحليل تدفق الخلايا أن نسبة خلايا CD8 T التي تتسلل إلى بيئة الورم بعد العلاج الإشعاعيعلاجات CTLA-4 أعلى في المجموعة الضابطة مقارنةً بفئران TBI (الشكل 3f). انخفضت نسبة خلايا المايلويد CD11b+ بعد العلاج الإشعاعي.علاجات CTLA-4 في جميع المجموعات على الرغم من أنها كانت أكثر تواضعًا في الفئران المعرضة للإشعاع (TBI) (الشكل 3f). وبالتالي، كانت نسبة خلايا CD8 T إلى CD11b+ أقل في الأورام المفككة من الفئران المعرضة للإشعاع التي لم تتلقَ ABT263 (الشكل 3g). على العكس، زادت حقن ABT263 من نسبة خلايا CD8 T في الفئران المعرضة للإشعاع التي تم علاجها بـ RT+aCTLA-4 وحسنت النسبة إلى الخلايا النخاعية. لم يكن لـ ABT263 تأثير كبير على معدل نمو الورم وعلى التسلل المناعي في غياب علاجات المناعة. أخيرًا، لاحظنا اختلافات مهمة في نسبة خلايا CD8 T التي تعبر عن IFN.في أورام الفئران الضابطة مقابل الفئران المصابة بإصابة دماغية رضحية المعالجة بالإشعاعCTLA-4. مرة أخرى، أدى علاج فئران TBI بـ ABT263 إلى استعادة نسبة خلايا CD8 T التي تعبر عن IFN. (الشكل 3h). تعزز هذه النتائج الفكرة القائلة بأن الاستجابة المناعية لعلاج مثبطات المناعة تتأثر بالتقدم في السن وأن هذا التأثير يمكن عكسه عند العلاج بدواء سنوليتك.
تتراكم الخلايا الوحيدة ذات النمط الظاهري المثبط للمناعة في بيئة الورم المجهرية لدى الفئران المصابة بإصابة دماغية رضحية
قد تكون هناك آليات متميزة عديدة مسؤولة عن انخفاض تراكم خلايا CD8 T في بيئة الورم (TME) لدى الفئران المصابة بإصابة الدماغ الرضحية (TBI). على سبيل المثال، قد يكون للتعبير المتزايد عن الروابط المثبطة للمناعة على سطح خلايا الورم دور في ذلك.. ومع ذلك، لم يتم الكشف عن أي فرق في تعبير Galectin9 و PD-L1 و Tnfrs4 و CD86 بواسطة قياس التدفق عند سطح خلايا الورم المفككة في اليوم 22 بعد الحقن في مجموعاتنا المختلفة (الشكل التوضيحي 4). قد يكمن تفسير آخر في قدرة الخلايا الطحالية على معالجة وتقديم المستضدات إلى خلايا T. وبالتالي، قمنا بقياس قدرة خلايا تقديم المستضد (الخلايا الشجرية والبلعمية المشار إليها فيما بعد بـ APC) المجمعة من الطحال من الفئران الضابطة وفئران TBI. لم نلاحظ أي فرق في قدرة هذه الخلايا على البلعمة ومعالجة بروتين OVA-DQ (الشكل التوضيحي 5A). وبالمثل، لم تتناقص قدرة APC المجمعة من فئران TBI على تقديم ببتيد GP-33 إلى خلايا T CD8 التي تعبر عن TCR محدد لـ GP-33 (الشكل التوضيحي 5B). ومع ذلك، لا يمكننا استبعاد أن APC في العقد اللمفاوية أو داخل الأورام لم تتأثر. ثم، تساءلنا أيضًا عما إذا كانت قدرة هجرة وتسلل خلايا T CD8 المجمعة من فئران TBI قد تأثرت. وجدنا أن هذه الخلايا لم تكن معاقة في قدرتها على التسلل إلى كريات MC38 في المختبر (الشكل التوضيحي 5C). مع ملاحظتنا السابقة أن خلايا T CD8 المنقاة من فئران TBI يمكن أن تتكاثر بشكل طبيعي عند التحفيز.تشير هذه النتائج إلى أن بيئة الورم المثبطة للمناعة من المحتمل أن تكون مسؤولة عن التراكم المنخفض لخلايا CD8 T داخل الورم.
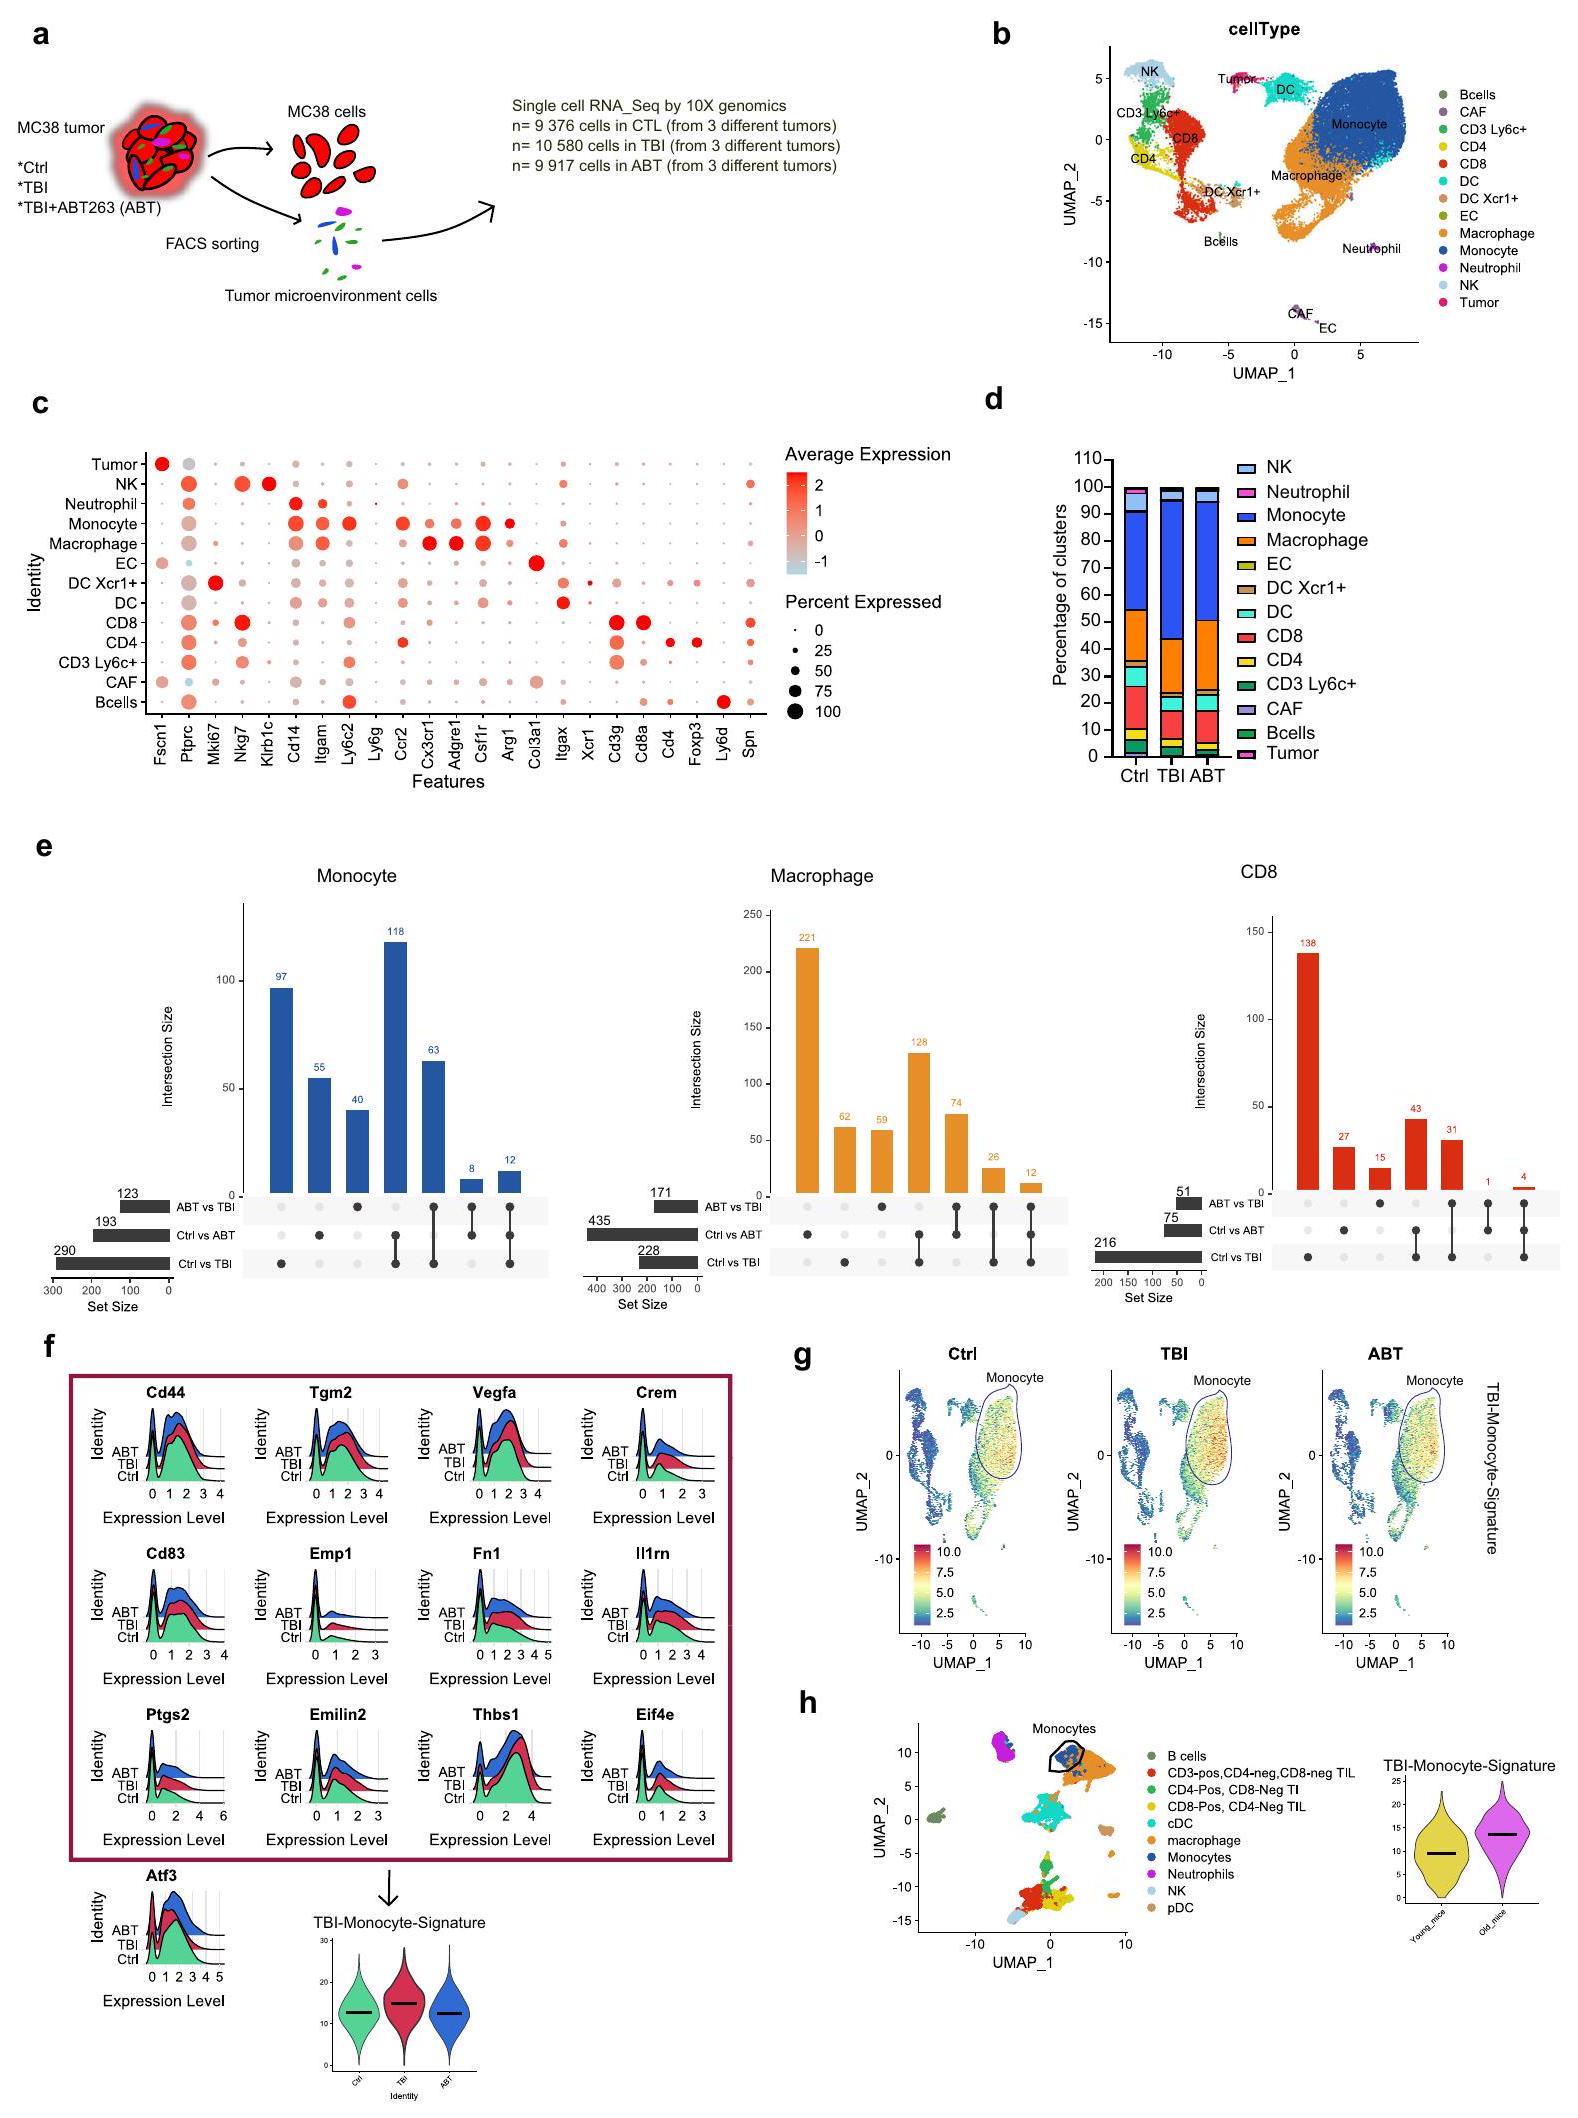
لذا قمنا بإجراء تحليل غير متحيز لتكوين البيئة المجهرية للورم باستخدام تحليل النسخ الجيني على مستوى الخلية المفردة للخلايا المفصولة من الأورام المجمعة من المجموعة الضابطة (Ctrl) وTBI وTBI + ABT263 (ABT) تمت معالجة الفئران. تم تحليل متوسط 10,000 خلية تم جمعها وتجميعها من 3 أورام مختلفة في كل مجموعة (الشكل 4أ). تم تجميع جميع الخلايا وتضمينها في بعدين باستخدام تمثيل UMAP (الشكل 4ب). تم تحديد جميع المجموعات وتسميتها بناءً على قائمة من العلامات المستخدمة تقليديًا لتحديد الخلايا المناعية (الشكل 4ج والبيانات التكميلية 1). الملاحظة الأولى هي أن حجم المجموعة التي تمثل وحيدات النوى (Itgamأدجرل ) كانت تميل إلى الزيادة في أورام الفئران المصابة بإصابة الدماغ الرضحية. من ناحية أخرى، كان حجم الكتل التي تمثل خلايا CD8 T ( الخلايا القاتلة الطبيعية (NK، إيتجام، الخلايا الشجرية (DC، Itgax) وDC تعبر عن Xcr1 (DC Xcr1، Itgax“) كانت تميل إلى أن تكون أصغر في مجموعة إصابة الدماغ الرضحية. أخيرًا، كانت الكتل التي تمثل خلايا CD4 T (فوكس بي 3، الخلايا B (Cd 3، Itgamلي6) والبلعميات (Itgamسي سي آر 2, Cxc3cr1 أدجر1 ) ظلت كما هي إلى حد كبير (الشكل 4د).
قمنا بعد ذلك بتحليل الجينات المعبر عنها بشكل مختلف (DEGs) ضمن مجموعات الخلايا الرئيسية في مجموعة إصابة الدماغ الرضحية (TBI) مقارنة بنفس مجموعة الخلايا في مجموعات التحكم أو ABT (البيانات التكميلية 2). باستخدام تمثيلات UpSetPlot، لتحديد التقاطع (DEGs المشتركة) بين المجموعات، وجدنا أن العدلات والبلعميات تظهر أعلى عدد من DEGs في TBI مقابل Ctrl (290 و 228 على التوالي) وفي ABT مقابل TBI (123 و 171 على التوالي)، مما يعني أن هذه الأنواع من الخلايا هي الأكثر تأثراً بإصابة الدماغ الرضحية (الشكل 4e). والأهم من ذلك، 63 DEG (من 290) في وحيدات النواة و 26 جينًا مختلفًا ( من 228) في البلعميات موجودة في تقاطع مجموعات Ctrl مقابل TBI و ABT مقابل TBI، مما يشير إلى أن تعبير تلك الجينات قد تم استعادته بالكامل بعد علاجات ABT263 (الشكل 4e والشكل التوضيحي 6). ركزنا أولاً على العدلات حيث تحتوي تلك الخلايا على أكبر عدد من الجينات المعبر عنها بشكل مختلف المستعادة وتمثل أكبر مجموعة. من بين 63 جينًا معبرًا عنه بشكل مختلف في العدلات، أنشأنا توقيعًا مكونًا من 12 جينًا معبرًا عنه بشكل مفرط يظهر وظائف مثبطة للمناعة و/أو مرتبطًا بتوقعات سيئة للسرطان:Cd83، الموظف 1إيف4 إيثبس1فيجفاإميلين2تجم2Ptgs2، Fn1 ، إل1رن (الشكل 4f). أطلقنا على مجموعة الجينات هذه اسم توقيع الخلايا الوحيدة المرتبطة بإصابة الدماغ، وتم قياس تعبيرها العالمي (الشكل 4f اللوحة السفلية). بالإضافة إلى ذلك، لاحظنا انخفاض تعبير Atf3، وهو عامل نسخ يرتبط انخفاضه بنتيجة ورمية سيئة. (الشكل 4f). أكدت تمثيلات FeaturePlot أن هذه التوقيع الجيني مرتبط بالفعل بالوحيدات (الشكل 4g). كما وجدنا توقيعًا جينيًا مشابهًا في البلعميات، خاصةً بالنسبة لتقليل التعبير عن Atf3 وزيادة التعبير عن Crem وCd83 وCd44 وTgm2 وThbs1 التي تم استعادتها بواسطة ABT263 (الشكل التكميلية 7). أخيرًا، قمنا بمقارنة توقيع TBI-Monocyte مع مجموعة بيانات النسخ الجيني المنشورة سابقًا والتي تم إنشاؤها من أورام B16F10 المستخرجة من فئران صغيرة (3 أشهر) وكبيرة في السن ( أشهر) باستخدام البيانات الوصفية التي أنشأها المؤلفون لعدلات الدم البيضاء (Ly6c2 +، Ccr2 +) وجدنا أن توقيع العدلات بعد إصابة الدماغ (TBI-Monocyte-Signature) يتم التعبير عنه بشكل مفرط في العدلات القديمة مقارنة بالعدلات الشابة، مما يشير إلى أن التعرض لإصابة الدماغ يؤدي إلى نمط شيخوخة مبكر (الشكل 4h). من بين 63 جينًا مختلفًا تم العثور عليها في العدلات، لا يرتبط أي منها بالأنماط الكلاسيكية لعملية الشيخوخة مثل تلف الحمض النووي، أو تعبير CDKi، أو النمط الإفرازي المرتبط بالشيخوخة. تشير هذه الملاحظة إلى أن العدلات ليست شيخوخة في بيئة الورم.
نقص خلايا النخاع الشوكي يعيد جزئيًا فعاليةعلاجات L1
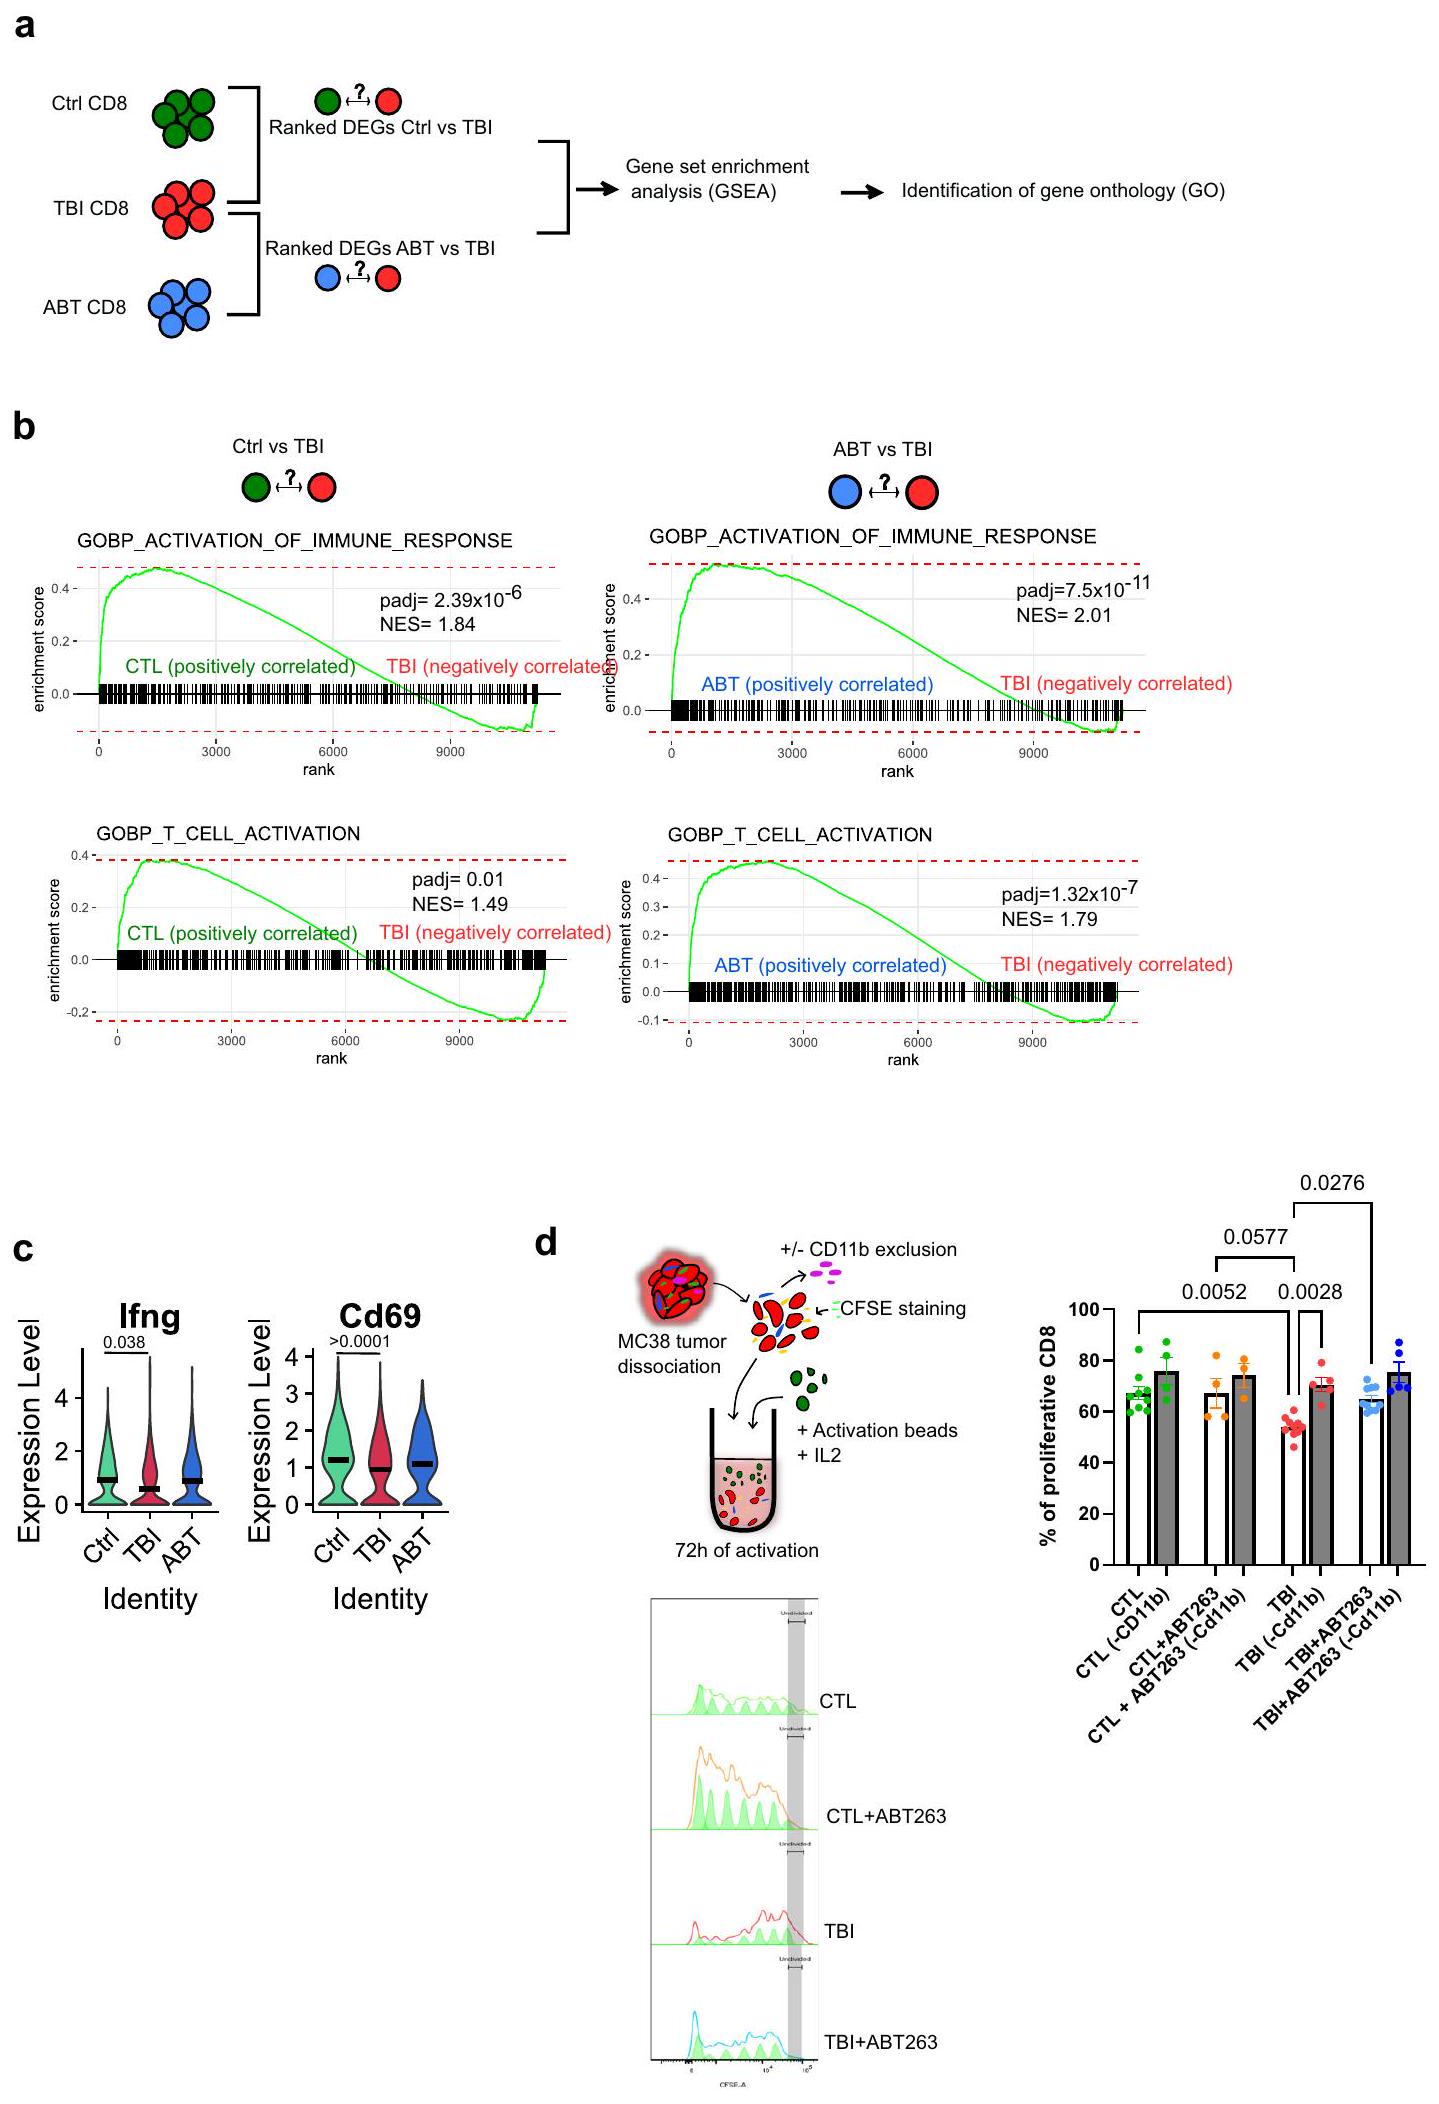
تشير نتائجنا حتى الآن إلى أن الملف المناعي المثبط للوحيدات والبلاعم هو المسؤول عن تراكم خلايا CD8 T المعيب في أورام الفئران المعرضة للإصابة الدماغية. في الواقع، أظهر تحليل المسار الجيني المعتمد على التعبير الجيني المختلف (GSEA) الذي تم إجراؤه على الجينات المعبر عنها بشكل مختلف من خلايا CD8 T حالة تنشيط منخفضة لخلايا CD8 T المجمعة من الفئران المعرضة للإصابة الدماغية مقارنةً بمجموعة التحكم (الشكل 5 أ، ب). كما أظهر تحليل المسار الجيني المعتمد على التعبير الجيني المختلف أيضاً أظهرت استعادة تنشيط خلايا CD8 T بعد علاجات ABT263 (الشكل 5 أ، ب). تماشيًا مع هذه الملاحظات، كانت تعبيرات جينات وظيفة المؤثر Ifng و Cd69 تميل إلى الانخفاض في خلايا CD8 T المجمعة من أورام TBI. (الشكل 5 ج). لذلك، صممنا اختبارًا في المختبر لقياس تأثير خلايا CD11b+ المايلويدية على تكاثر خلايا CD8 T. على هذا النحو، تم جمع خلايا CD8 T من الأورام المفككة وتم تنشيطها باستخدام IL2 وكرات CD3/CD28 في
الشكل 2 | تحسين القضاء على الخلايا الشيخوخة باستخدام علاجات ABT263العلاج المناعي للسرطان في الفئران المعرضة للإشعاع. مخطط التجربة. باختصار، تم تحفيز الشيخوخة باستخدام الإشعاع الكلي تحت القاتل، وبعد 10 أسابيع تلقت الفئران ABT263. )، عن طريق التغذية داخل المعدة لمدة دورتين من 5 أيام متتالية، لإزالة الخلايا المسنّة. بعد 5 أيام من آخر تغذية، تم إما التضحية بالفئران لقياس الشيخوخة في الطحال خارج الجسم أو حقنها بخلايا ورم MC38. ب تقييم بواسطة التألق الحيوي للتعبير عن p16 في الطحال قبل وبعد العلاج بـ ABT263. المعروض هو المتوسطSEM.CTL،CTL + ABT263،من حيوانات مستقلة. تحليل التباين الأحادي العادي مع تصحيح توكي. ج تقييم بواسطة qPCR للتعبير عن p 16 و p 21 في الطحال قبل وبعد العلاج بـ ABT263.، من حيوانات مستقلة. تحليل التباين الأحادي العادي مع تصحيح توكي. ما هو معروض هو المتوسطSEM.تم تقييم نمو الورم لكل من المجموعات المحددة من الفئران. كل خط يمثل متوسط النموSEM للورم على مدى 25 يومًا أو حتى تم إزالة الفأر من الدراسة. العدد الإجمالي للأورام لكل مجموعة موضح بين قوسين. تحليل التأثيرات المختلطة أو
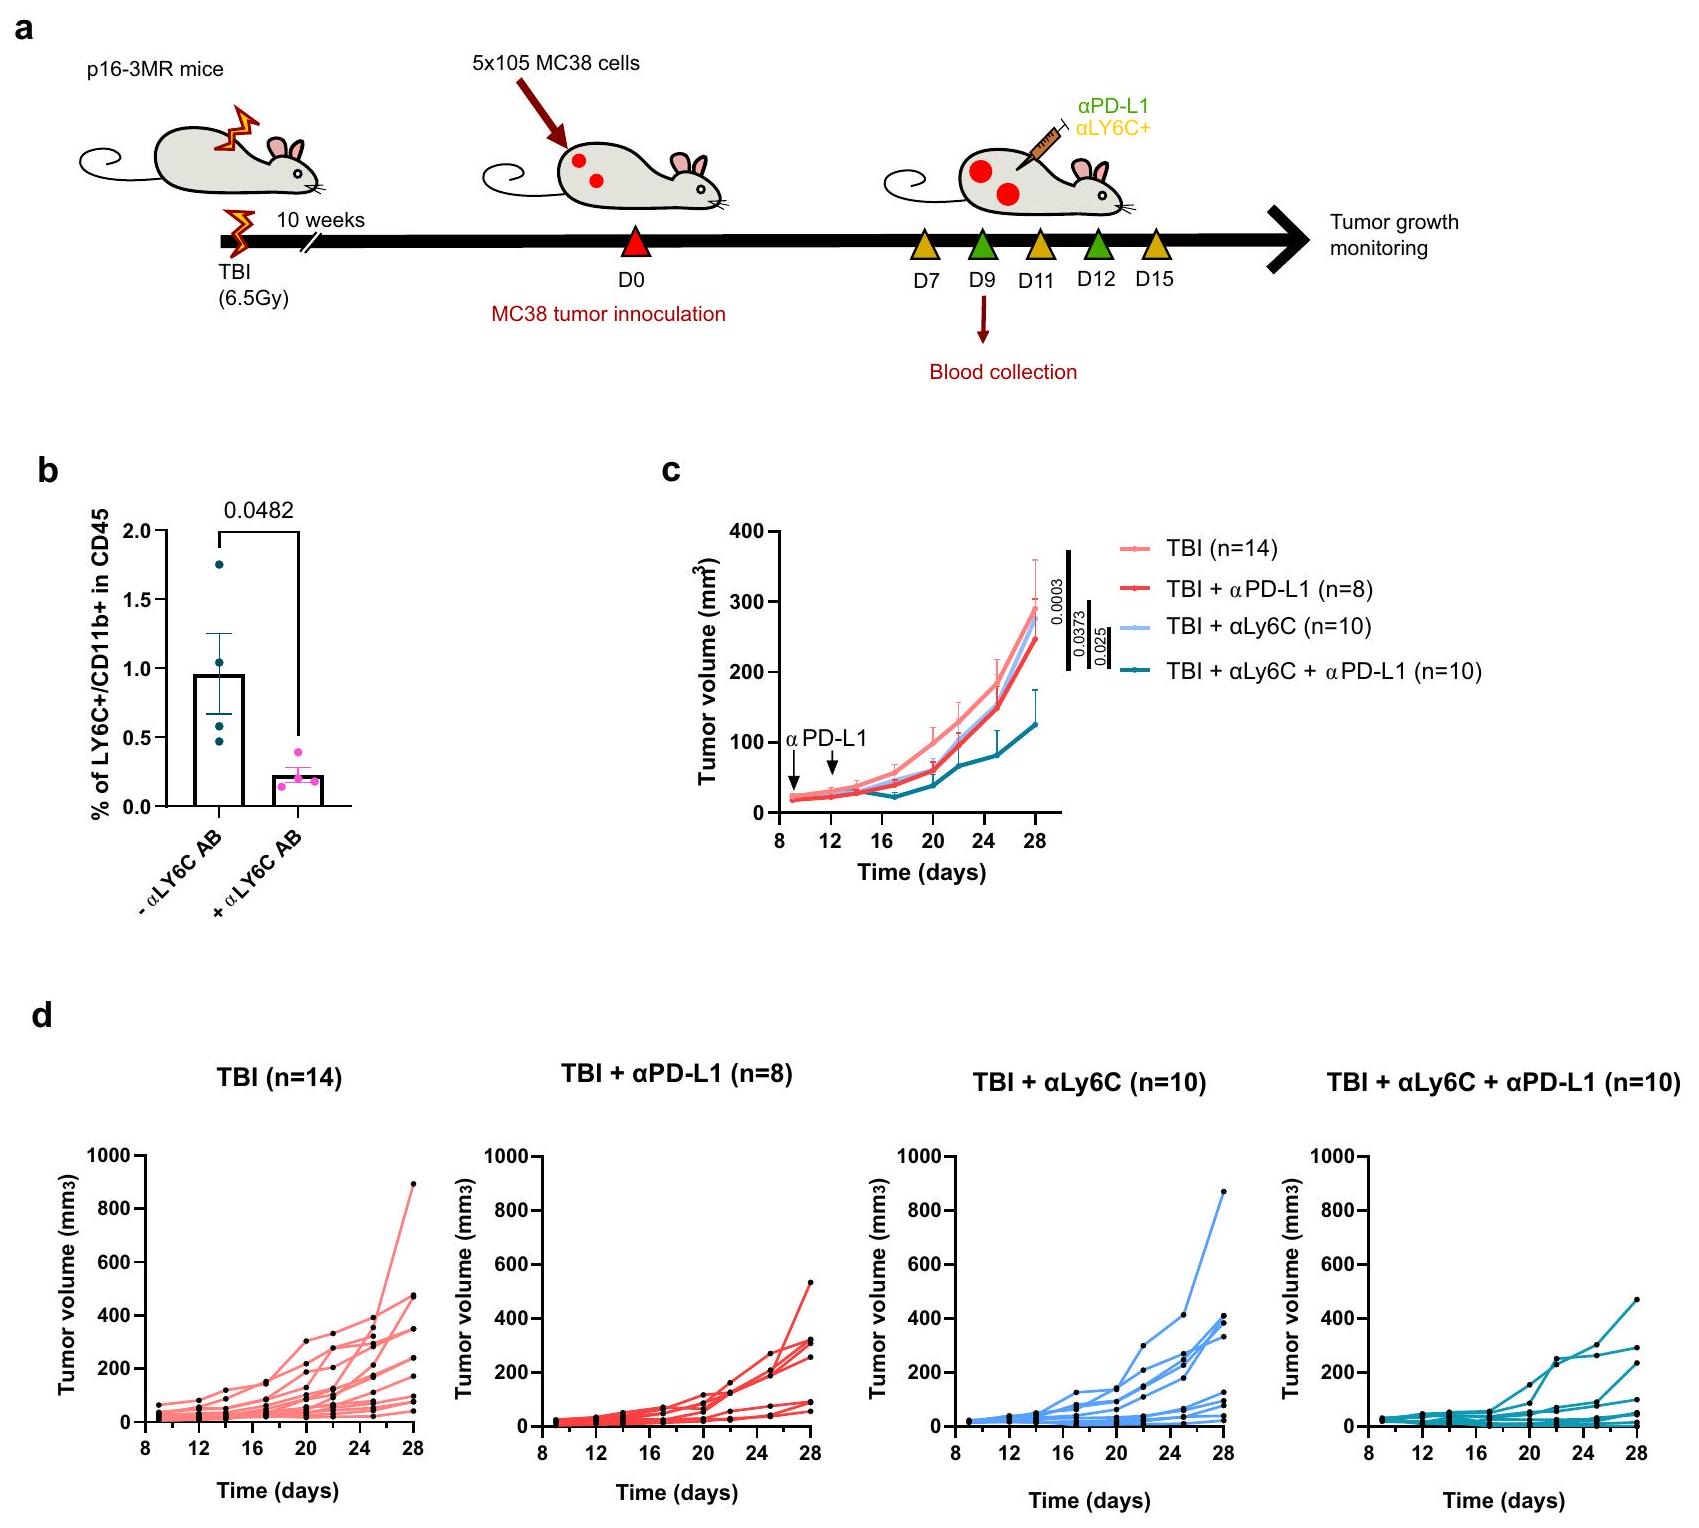
تحليل التباين ثنائي الاتجاه مع تصحيح توكي. e يظهر حجم كل ورم فردي في النقطة الزمنية المحددة. الفئران التي لم تتعرض لإصابة الدماغ الرضحية تشير إليها كتحكم (CTL). العدد الإجمالي للأورام لكل مجموعة موضح بين قوسين. f مخططات بقاء كابلان-ماير لكل من الفئران التحكم وفئران TBI لكل من الظروف المحددة. اختبار لوغ-رانك (اختبار مانتل-كوكس). g تم تحليل تسلل خلايا المناعة الورمية بواسطة قياس التدفق بعد تفكيك الورم في اليوم 14 بعد الحقن. يظهر النسب المئوية لخلايا CD4 T، خلايا CD8 T وخلايا CD11b+ ضمن مجموعة CD45+.CTL،CTL (PD-L1)CTL + ABT263 (PD-L1 TBI + ABT263 أورام PD-L1) لكل مجموعة. تحليل التباين الأحادي العادي مع تصحيح توكي. المعروض هو المتوسطSEM.يوضح النسبة بين خلايا CD8 T وخلايا CD11b + في الأورام.CTL،CTL (PD-L1CTL + ABT263PD-L1CTL + ABT263PD-L1إصابة الدماغ الرضحية إصابة الدماغ الرضحية ( PD-L1) TBI + ABT263، TBI + ABT263 أورام PD-L1) لكل مجموعة. تحليل التباين براون-فورسيث وWelch مع تصحيح غيمس-هاويل. المعروض هو المتوسطSEM. يتم توفير بيانات المصدر كملف بيانات المصدر. وجود أو بعد إزالة خلايا CD11b+. لاحظنا أن خلايا CD8 T المجمعة من أورام الفئران المعرضة للإصابة بالإشعاع (TBI) كانت تتكاثر بشكل أقل عند التحفيز مما يشير إلى أن خلايا CD11b+ كانت مسؤولة عن هذا التثبيط (الشكل 5d). أخيرًا، قمنا بإزالة المونوسيتات Ly6c+ في الفئران المعرضة للإصابة بالإشعاع باستخدام جسم مضاد مانع وقمنا بقياس ما إذا كان هذا سيتجاوز المقاومة إلىعلاجات PD-L1 (الشكل 6أ). أولاً، أكدنا استنفاد خلايا Ly6c + /CD11b + الإيجابية في دم الفئران المصابة بإصابة دماغية رضحية (الشكل 6ب). ثم، لاحظنا أن الجمع بين Ly6c ويمكن أن تؤخر الأجسام المضادة التي تحجب PD-L1 نمو الورم بشكل فعال في الفئران المعرضة للإصابة بالدماغ (الشكل 6c، d). تظهر هذه النتائج أن الخلايا النخاعية في سياق بيئة الشيخوخة لديها ملف مناعي مثبط متفاقم وتسبب مقاومة للعلاج المناعي.
نقاش
كشفت هذه الدراسة أن تراكم الخلايا الشيخوخة يتداخل مع العلاجات المناعية للسرطان وأن إزالتها، باستخدام نهج جيني أو دوائي، يعكس النمط الظاهري. من الناحية الميكانيكية، أظهرنا أن الشيخوخة، من خلال تأثيرها على الخلايا النخاعية، تضعف فعالية العلاج المناعي من خلال الحد من تراكم خلايا CD8 T داخل البيئة المجهرية للورم. هذه النتائج، بالتزامن مع بياناتنا المنشورة سابقًا التي تظهر أن خلايا T المنقاة من فئران TBI يمكن تنشيطها وتوسيعها بمستوى مشابه للخلايا المجمعة من الفئران الضابطة.، تشير إلى أن التأثير على خلايا T يتم بشكل رئيسي بطريقة غير ذاتية الخلايا. علاوة على ذلك، أظهرنا أن خلايا T من الفئران المصابة بإصابة دماغية مؤلمة يتم تحفيزها بكفاءة بواسطة خلايا تقديم المستضد (الخلايا الشجرية والبلعميات) ولا تزال قادرة على التسلل إلى كريات الورم MC38 في المختبر. بدلاً من ذلك، يبدو أن التأثير الضار ينشأ من انخفاض نسبة خلايا CD8 T / الخلايا النخاعية ( ) لوحظ في الفئران المصابة بإصابة دماغية رضحية بعد العلاج المناعي. أظهرت منشورة حديثة أن علاجات PD-L1 تؤدي إلى زيادة موت الخلايا المكونة للدم.لم نلاحظ المزيد من موت الخلايا النخاعية في الفئران المصابة بإصابة دماغية رضحية التي تم علاجها بـPD-L1. ومع ذلك، نظرًا لأن نسبة خلايا CD8 T كانت منخفضة في بيئة الورم المجهرية (TME) لجرذان TBI، فإن هذا يشير إلى أن الخلايا النخاعية، على الرغم من عدم كونها أكثر وفرة بشكل ملحوظ، كانت وظيفيًا أكثر تثبيطًا للمناعة. لقد أكدنا هذه الظاهرة باستخدام بيانات النسخ الجيني على مستوى الخلية الواحدة واختبارات وظيفية في المختبر وفي الجسم الحي.
أظهر آخرون أن تسلل المونوسيتات التي تعبر عن مستويات عالية من Thbs1 و Vegfa، وهما جينان من توقيع المناعة المثبطة الناتجة عن إصابة الدماغ الرضحية، يمكن أن يعيق فعاليةعلاجات PD-L1 ضد أورام سرطان الرئة لويستشير التحليلات النسخية على مستوى الخلية الواحدة لكل من الطحال ونخاع العظام في الفئران الضابطة وفئران إصابة الدماغ الرضحية إلى أن العدلات كانت قد تم استقطابها جزئيًا بالفعل بواسطة البيئة الشيخخية النظامية في غياب خلايا الورم (الأشكال التكميلية 8 و 9). ومع ذلك، فإن هذا ليس شرطًا مسبقًا حيث أظهرنا أيضًا أن العلاج الإشعاعي المحلي في سياق متلازمة الورم هو كافٍ لتقليل فعاليةعلاجات PD-L1 (الشكل التوضيحي التكميلي 3). من بين العديد من الجينات المثبطة للمناعة التي لاحظناها، فإن Thbs1 هو جين يتم إفرازه. جليكوبروتين متورط في مجموعة واسعة من العملياتتم إظهار أن حجب Thbs1 باستخدام نهج وراثي في سرطان الثدي الثلاثي السلبي (TNBC) يزيد من تسلل/تكاثر خلايا CD8 T ويحسن الاستجابة إلىالعلاج المناعي PD-L1 في الفئرانحسب علمنا، لا يوجد مثبط دوائي موثق لـ Thbs1 متاح. وبالمثل، فإن زيادة تعبير Vegfa بواسطة وحيدات النواة من المحتمل أن تكون ضارة، حيث أظهرت الدراسات أن الجزيئات المضادة لتكوين الأوعية الدموية تحسن من فعالية العلاجات المناعية.. جين آخر من توقيعنا هو الذي يتم تقليل تعبيره في وحيدات النوى المجمعة من أورام إصابات الدماغ. Atf3 هو جين معروف بدوره الحاسم في عدة عمليات بيولوجية، مثل تنظيم استجابة المناعة. وقد تم الإبلاغ عن أن تقليل تعبيره في البلعميات مرتبط بنتيجة أسوأ لدى المرضى الذين يعانون من سرطان الكبد الخلوي.تم أيضًا إظهار أن Atf3 يتم تقليله في خلايا الجذع والسلائف الدموية خلال الشيخوخة، وتم استعادة تعبيره بعد تجربة التزاوج مع فئران صغيرة.لا يزال يتعين تحديد ما إذا كان يمكن رسم علاقة بين فعالية العلاج المناعي وتعبير Atf3 بعد TIS. أخيرًا، أظهرت دراسة حديثة أن تعبير IL-6 يمكن أن يساعد في التنبؤ بالاستجابة إلىعلاج PD-L1ومع ذلك، في دراستنا، لم يتغير تعبير IL-6 بين المجموعات. بشكل عام، نعتقد أن التوقيع المناعي المثبط وتأثيره على الخلايا النخاعية من المحتمل أن يكون متعدد العوامل.
من الجدير بالذكر أنه في نموذجنا الأبسكوبال لاحظنا أن القضاء على الورم الأساسي لم يتأثر بالشيخوخة. وهذا يشير إلى أن الجرعات المجزأة من العلاج الإشعاعي كانت كافية لقتل خلايا السرطان، على الأرجح من خلال تحفيز موت الخلايا المبرمج الناتج عن تلف الحمض النووي، وأن العلاج الإشعاعي لم يكن مثبطًا من قبل البيئة المجهرية المثبطة للمناعة. وبالمثل، نظرًا للأدبيات المتزايدة التي تربط تراكم الخلايا الشيخوخة بالأمراض المرتبطة بالعمر، فإنه من المغري التكهن بأن السينوبيوتيك قد تكون قادرة أيضًا على زيادة فعالية العلاج المناعي القائم على الأجسام المضادة في الأفراد المسنين. في الواقع، تم الإبلاغ عن أن انخفاض وظائف المناعة في الفئران المسنّة كان مرتبطًا بانخفاض فعالية العلاج المناعي القائم على الأجسام المضادة.. هذا يتناقض مع الدراسات على البشر التي لم تظهر علاقة بين انخفاض فعالية ICB والتقدم في العمرعلى سبيل المثال، لم يُلاحظ أي انخفاض في فعالية العلاج المناعي في مرضى سرطان الرئة المسنين (أكثر من 70 عامًا).. ومع ذلك، في هذه الدراسة تم علاج جميع المرضى (صغاراً وكباراً) سابقاً بعلاج كيميائي بالبلاتين قبل تلقيهم علاج ICB. نظرًا لأن البلاتين أظهر أنه يحفز الشيخوخة، فمن الممكن أن تكون كلا المجموعتين قد تعرضت لاستجابة مناعية compromised بغض النظر عن أعمارهم في وقت علاجات ICB. في هذه الدراسة، اخترنا استخدام ABT263 بسبب فعاليته المثبتة في القضاء على الخلايا الشيخوخة في الفئران. ومع ذلك، من المعروف أن ABT263 يسبب نقص الصفائح الدموية في المرضى وبالتالي له فائدة سريرية محدودة.لكي يتم اختبار نهجنا في المرضى في النهاية، من المحتمل أن نحتاج إلى استخدام نهج سنوليتك مختلف. قد يكون من الممكن استخدام سنوليتك مثبتة أخرى مثل الكيرسيتين + الداساتينيب.وفيستينبافتراض أنهم يمكنهم تحسين وظائف خلايا المناعة بكفاءة.
بشكل عام، تظهر نتائجنا أنه من الممكن زيادة استجابة الجهاز المناعي للورم عن طريق الأدوية، وتقترح أن الأدوية السينوبيوتية التي تُحقن قبل العلاج المناعي يجب أن تؤخذ بعين الاعتبار. كما حددنا توقيعًا مثبطًا للمناعة في الخلايا النخاعية قد يكون من الممكن استغلاله للتنبؤ بفعالية العلاج المناعي. نتوقع أن العلاجات السرطانية التي لا تسبب تلفًا في الحمض النووي أو شيخوخة خلوية لن تتداخل مع فعالية العلاج المناعي.
طرق
الحيوانات
تمت تربية فئران p16-3MR على خلفية C57BL/6 وتم التبرع بها بلطف من قبل الدكتورة جوديث كامبيسي (معهد باك) وفقًا لاتفاقية نقل المواد. تم تربية جميع الفئران في الموقع وتمت الموافقة على التلاعبات الحية من قبل اللجنة المؤسسية للممارسات الجيدة في البحث الحيواني في مستشفى CHU Ste-Justine (البروتوكول 2023-5331). كلا الذكور
الشكل 3 | التأثير غير المباشر المتعطل في الفئران التي تم تعريضها للإشعاع سابقًا يتم استعادته بواسطة ABT263. أ رسم تخطيطي للتجربة. تم حقن فئران CTL أو TBI المعالجة أو غير المعالجة بـ ABT263 على كل جانب بـ 3 أوخلايا الورم. في الأيام 12 و13 و14 بعد حقن الورم، تم تعريض الورم الأساسي الأكبر لثلاث جولات (8 غراي لكل منها) من العلاج الإشعاعي. ثم تم حقن الفئران في الأيام 14 و17 و20 بـتم تقييم الأجسام المضادة المثبطة لـ CTLA-4 ونمو الورم حتى الوصول إلى نقطة الحد. بدلاً من ذلك، تم euthanizing بعض الفئران في اليوم 22 وإزالة الأورام جراحيًا للسماح بتحليل تسلل المناعة.تم تقييم نمو الورم لكل من المجموعات المحددة من الفئران. تمثل كل خط نمو ورم فردي على مدى 28 يومًا أو حتى تم إزالة الفأر من الدراسة. العدد الإجمالي للأورام لكل مجموعة موضح بين قوسين. تم استخدام تحليل التباين الثنائي مع تصحيح توكي. ما هو معروض هو المتوسط.SEM. جداول بقاء كابلان-ماير لكل من الظروف المشار إليها. هيستوجرام يوضح نسبة الفئران في كل مجموعة التي حققت القضاء التام على الأورام الثانوية (الابسكوبال) (CE). يظهر وزن الأورام الثانوية في اليوم 22 قبل التفكك.CTL،CTLA4)إصابة الدماغ الرضحيةإصابة الدماغ الرضحية (RTCTLA4) TBI + ABT263، TBI + ABT263 (RTورم CTLA4) من حيوانات مستقلة. اختبار ANOVA براون-فورسيث وWelch مع تصحيح غيمس-هاويل. ما هو معروض هو المتوسطSEM. ف infiltración de células inmunitarias tumorales كما تحددها قياسات التدفق من الأورام المنفصلة في اليوم 22 بعد التلقيح. تظهر النسب المئوية لخلايا CD8 T، وخلايا CD4 T والخلايا على العدد الإجمالي منالخلايا المجمعة من الأورام. بالنسبة لـ CD8 و CD4،CTLCTLA4) TBI + ABT263، TBI + ABT263 (RTأورام CTLA4) من حيوانات مستقلة. بالنسبة لـ CD11b،CTLCTLA4) TBI + ABT263، TBI + ABT263 (RTأورام (CTLA4) من حيوانات مستقلة. تحليل التباين الأحادي العادي مع تصحيح توكي. ما هو معروض هو المتوسطSEM.موضح هو نسبة خلايا CD 8 Tالخلايا في الأورام في اليوم 22.ABT263 (RTCTLA4)إصابة الدماغ الرضحية إصابة الدماغ الرضحية (RTCTLA4) TBI + ABT263، TBI + ABT263 (RTأورام CTLA4) من حيوانات مستقلة. تحليل التباين براون-فورسيث وويلش مع تصحيح غيمس-هاول. ما هو معروض هو المتوسطSEM.يوضح الكمية المعبر عنها من IFNكما تم قياسه بواسطة تحليل تدفق الخلايا في خلايا CD8 T المتسللة في اليوم 22.CTL، (RT CTLA4)CTLA4) TBI + ABT263، TBI + ABT263 (RTأورام CTLA4) من حيوانات مستقلة. تحليل التباين الأحادي العادي مع تصحيح توكي. المعروض هو المتوسطSEM. يتم توفير بيانات المصدر كملف بيانات المصدر. تم استخدام إناث الفئران حيث لم نلاحظ فرقًا في نمو الورم واستجابة للعلاج المناعي بين الجنسين.
نماذج الفئران الشيخوخة
تم تعريض الفئران التي تتراوح أعمارها بين 12 و 14 أسبوعًا لإصابة الدماغ الرضحية بجرعة واحدة تحت القاتلة منباستخدام جهاز Faxitron CP-160. خلال الأيام العشرة التي تلت إصابة الدماغ الرضحية، بايتريلتم إضافة المضاد الحيوي إلى الماء لمنع العدوى. بدلاً من ذلك، تم إعطاء دوكسوروبيسين (صيدلية مستشفى سانت-جوستين) بجرعة واحدة عن طريق الحقن داخل البطن..
علاجات داخل الجسم
10 إلى 12 أسبوعًا بعد إصابة الدماغ الرضحية أو أسبوع واحد بعد الدوكسوروبيسين، تلقت الفئران تغذية عن طريق الفم مع المركب وحده (إيثانول: بولي إيثيلين جلايكول 400: فوسال 50 بي جي بنسبة 10:30:60) أو مع ABT263 (MedChemExpress، نافيتوكلاكس) عندوزن الجسم. تم إعطاء المركبة و ABT263 للفئران لدورتين من 5 أيام متتالية، مع أسبوع من الراحة بين الدورتين. تم حقن GCV (CHU Sainte-Justine-Pharmacy) بعد 10-12 أسبوعًا من إصابة الدماغ الرضحية. تم إعطاء GCV عن طريق الحقن البطني لمدة 5 أيام متتالية بجرعة منفي PBS (متعدد الخلايا) بعد التنشيط في 0.1 م من حمض الهيدروكلوريك (سيغما).
زراعة الخلايا
تم زراعة خلايا MC38 و EL-4 في DMEM أو RPMI1640 على التوالي (Multicell) مع إضافة 10% من مصل العجل الجنيني و 1% من البنسلين-ستربتوميسين فيتحتفي جو رطب. تم نقل خلايا ورم MC38 باستخدام ناقل لنتي للتعبير عنوتم فرزها للحصول على مجموعة نقية تقريبًا مع فلوريسنس عالي من mPlum. يتم اختبار الخلايا بانتظام لضمان غياب تلوث الميكوبلازما.
حقن الورم وعلاجات المناعة
تم حقن خلايا الورم MC38 و EL-4 تحت الجلد (كانت هدية من الدكتور جون ستاج والدكتورة هيلين ديكالوي على التوالي). و الخلايا في PBS على التوالي) في كل من الجانبين الأيمن والأيسر من الفئران المخدرة بالإيزوفلوران. حجبتم حقن جسم مضاد PD-L1 (BioXcell، النسخة 10 F.9G2) عن طريق الحقن داخل الصفاق.في PBS لكل فأر) في اليوم 9 و 12 بعد حقن خلايا الورم عندما كان حجم الورم حواليتم حقن جسم مضاد Ly6c المثبط (استنساخ BioXcell Monts 1) عن طريق البطن. في PBS لكل فأر) في اليوم 7 و 11 و 15. بالنسبة للاختبار البعيد، تم تلقيح خلايا MC38 بتركيزين مختلفين، الخلايا في موقع الورم الأساسي (الجانب الأيمن)الخلايا في موقع الورم الثانوي (الجانب الأيسر). تم علاج الورم الأساسي بثلاث جرعات من العلاج الإشعاعي ( ) في الأيام 12 و 13 و 14. حظرتم حقن جسم مضاد CTLA-4 (BioXcell، النسخة 9H10) عن طريق الحقن داخل الصفاق.في PBS لكل فأر) في اليوم 14 و17 و20 بعد حقن خلايا الورم عندما كان حجم الورم الأولي بينوالورم الثانوي بينتمت مراقبة نمو الورم من خلال اكتساب الفلورسنت (تكنولوجيا لابيو) وقياس الكالبر. لأغراض تحليل البقاء، تم التضحية بالفئران عندما تم الوصول إلى نقطة حد معينة وفقًا لإرشادات لجنة الحيوانات لدينا. وقد حددت لجنتنا نقاط الحد على ألا تتجاوز فقدان الوزن، لا توجد علامات توتر مثل تساقط الشعر أو انخفاض النشاط، حجم ورم MC38 لا يتجاوزدون تقرحات أومع وجود تقرحات، حجم ورم EL-4 لا يتجاوز أكثر منفي بعض الحالات، تم تجاوز أحد نقاط الحد هذه في اليوم الأخير من القياس وتم euthanized الفئران على الفور. تم استئصال الأورام والطحال ونخاع العظام بعد أن تم التضحية بالفئران عن طريق حقن مميت داخل البطن بمادة باربيتورية تلاها خلع الرقبة.
تفكيك الأنسجة
تم جمع الأورام وتفكيكها باستخدام مجموعة تفكيك الأورام للفئران (مجموعة تفكيك الأورام للفئران، ميلتيني). استخدمنا البرنامج 37C_m_TDK2 في جهاز التفكيك أوكتو مع سخانات (ميلتيني). بعد التفكيك، تم إيقاف التفاعل الإنزيمي بإضافة 10 مل من RPMI1640 المضاف إليه FBS و تعليق الخلايا المصفى من خلال شبكة. كانت الخلايا جاهزة بعد ذلك للتحليل أو تم تجميدها في النيتروجين السائل للاستخدام لاحقًا. تم الحصول على خلايا الطحال عن طريق سحق الطحال بين غطاء حقنة ثم تم تصفيتها باستخدامشبكة. تم إزالة كريات الدم الحمراء عن طريق إضافة محلول تحليل كريات الدم الحمراء لمدة دقيقتين.و EDTAتم الحصول على الخلايا من نخاع العظام بعد شطف المركز اللين لعظام الساق والفخذ بإبرة.
تدفق الخلايا
تم حجب الخلايا باستخدام PBS يحتوي على 2% FBS وتم صبغها باستخدام أجسام مضادة ضد CD16/CD32 (تخفيف 1/100 من Biolegend) لمدة 30 دقيقة فيثم تم غسل الخلايا في محلول PBS يحتوي على FBS وصبغت بأجسام مضادة مرتبطة لقياس الخلايا لمدة 20 دقيقة في في الظلامتم غسل الخلايا مرة أخرى وتم صبغ الخلايا الميتة بصبغة التلوين Zombie (Biolegend) لمدة 15 دقيقة في درجة حرارة الغرفة في PBS بدون FBS. تم غسل الخلايا ومعالجتها على جهاز Fortessa (BD Biosciences) للتحليل. لتحليل البيئة المجهرية للورم (TME)، تم صبغ الخلايا المفككة باستخدام الأجسام المضادة التالية: CD45 (CD45-BV785، Biolegend)، CD3 (CD3-AF700، Biolegend)، CD4 (CD4-PE، Biolegend)، CD8 (CD8-PercpCy5، Biolegend)، CD11b (CD11b-BUV395، Biolegend)، وكانت خلايا الورم ذاتية التلألؤ (mPlum). كانت الخلايا الميتة ملون بصبغة Zombie-Aqua (Biolegend) ثم تم تحليله بواسطة قياس التدفق الخلوي. لتلوين IFNتم معالجة الخلايا بمومنسين-أ 1X (بايو ليجند) وبـ PMA-لونوميسين (إنفيتروجن)إي بايوساينسخليط تحفيز الخلايا 500X) لمدة ساعتين عندتحتCO2 في جو رطب في RPMI1640 كامل. ثم تم تثبيت الخلايا وتمريرها باستخدام BD Cytofix/Cytoperm.عدة وملطخة بمضاد IFNأجسام مضادة (IFN – BV785، بيو ليجند). الكامل قائمة الأجسام المضادة المستخدمة في هذه الدراسة متاحة في البيانات التكميلية 3. جميع استراتيجيات التصفية موضحة في الشكل التكميلية 10.
SA-تلطيخ جال
تم عزل الأورام الكاملة وتثبيتها فييرجى العثور على 20 دقيقة. بعد غسلتين في PBS، تم نقع الورم بالكامل فيمحلول صبغة جال في-غال، 40 مللي مول من حمض الستريك محلول فوسفات الصوديوم عند
الشكل 4 | يتم استعادة النمط المناعي المثبط للوحيدات جزئيًا بعد العلاج بـ ABT263. أ تم جمع الأورام من المجموعات المحددة من الفئران في اليوم 22 بعد التلقيح وتم تفكيكها. تم فرز الخلايا غير الورمية (المشار إليها بخلايا بيئة الورم) واستخدامها لتحليل النسخ الجيني على مستوى الخلية الواحدة في تجربتين مستقلتين. تحتوي كل مجموعة على مجموعة من الخلايا من ثلاثة أورام. تم تحليل حوالي 10,000 خلية لكل مجموعة. ب تم إنشاء ما مجموعه 12 مجموعة مختلفة تمثل تقريبًا جميع الخلايا من TME بواسطة حزمة Seurat في R-studio وتم وضعها باستخدام تمثيل U-MAP. ج يظهر DotPlot الذي يسرد الجينات التي تم استخدامها لتحديد مجموعات الخلايا التي تم إنشاؤها في اللوحة (ب). د يظهر النسبة المئوية للسكان الخلويين الفرديين من جميع الخلايا التي تم تحليلها. هـ يظهر UpsetPlot حجم التفاعل (عدد DEGs) بعد مقارنة العينات في الوحيدات. البلاعم وخلايا T CD8.من بين 63 جينًا في مجموعة المونوسيت التي تم استعادة تعبيرها في الفئران المعالجة بـ ABT، تم اختيار 13 جينًا بناءً على ارتباطها بالتحكم المناعي / مقاومة العلاج المناعي. يتم عرض تعبيرها الفردي في RidgePlot لإظهار النمط الظاهري المناعي الكلي لهذه خلايا المونوسيت. يشكل التعبير العالمي للجينات المفرطة التعبير (بدون Atf3) توقيع TBI-Monocyte ويتم تمثيله باستخدام ViolinPlot. يتم قياس توقيع TBI-Monocyte المحدد في اللوحة F في خلايا كاملة باستخدام FeaturePlot لتسليط الضوء على تعبيرها داخل مجموعة المونوسيت كما هو محدد في اللوحة (ب).مجموعات بيانات الخلايا المفردة التي أنشأها زانغ وآخرون.تم استخدام أورام B16F10 المجمعة من الفئران المسنّة (20-22 شهرًا) والشابة (6-8 أسابيع) لتحليل تعبير توقيع TBI-مونوسيت في المونوسيتات كما هو موضح في مخططات الكمان. تم توفير بيانات المصدر كملف بيانات مصدر. البوتاسيوم فيروسيانيد، 5 مللي مول من البوتاسيوم فيريسيانيد، 150 مللي مول من كلوريد الصوديوم، 2 مللي مول من كلوريد المغنيسيوم) لمدة 4 ساعات. تم غسل الأورام الملونة بمحلول PBS وتم التقاط صورة باستخدام ميكروسكوب ستيريو (Leika M205FA).
تحليل الخلايا المفردة
لتحليل البيئة المجهرية للورم، تم فصل الأورام وتم فرز خلايا الورم الموجبة لـ mPlum بواسطة تقنية فرز الخلايا بالتدفق. بالنسبة لتحليلات خلايا الطحال وخلايا نخاع العظام، تم فصل الخلايا كما هو موضح أعلاه وتم فرز الخلايا الحية بواسطة تقنية فرز الخلايا بالتدفق. الخلايا المفروزة (تم تلوين (الخلايا) باستخدام كواشف CellPlex وفقًا لبروتوكول 10 X genomics. بعد التوسيم، تم تجميع الخلايا ومعالجتها على جهاز Chromium Controller وفقًا لبروتوكول الشركة المصنعة باستخدام مجموعة GEX 3′ v3 بهدف التقاط 10,000 خلية لكل عينة. تم إنشاء مكتبات التسلسل وفقًا لتعليمات الشركة المصنعة وتم تسلسلها على جهاز NovaSeq S6000 بهدف الحصول على 20,000 قراءة لكل خلية لمكتبات التعبير الجيني و5000 قراءة لكل خلية لمكتبة تعدد الخلايا. تم محاذاة ملفات Fastq إلى الجينوم وتم عد القراءات باستخدام CellRanger الإصدار 6. تم تحليل مصفوفات العد باستخدام Seurat v4.https://satijalab.org/تم تطبيع قراءات CellPlex باستخدام طريقة CLR. تم تأكيد التبادلية المتبادلة لعلامة تعدد الخلايا بصريًا. تم تطبيع قراءات التعبير الجيني باستخدام لوغاريتم مع عامل مقياس قدره 10,000، وتم إجراء تحليل المكونات الرئيسية باستخدام 2000 من أكثر الجينات تباينًا وتم تضمين البيانات في بعدين باستخدام تقريب وتوقع متعدد الأشكال الموحد المحسوب على أول 15 مكونًا رئيسيًا. تم تعريف المكونات الرئيسية المستخدمة في التحليل باستخدام ‘ElbowPlot’. تم إزالة الخلايا التي كانت نسبة قراءات الميتوكوندريا فيها أكبر من انحرافين معياريين فوق المتوسط. تم تجميع الخلايا بناءً على بناء رسم الجوار الأقرب باستخدام Seurat V4 مع المعلمات الافتراضية ومعامل الدقة عند 0.4. تم توضيح المجموعات من خلال فحص تعبير الجينات المعبر عنها بشكل مختلف مع تغير مضاعف لا يقل عن 0.15، فرق في نسبة الخلايا الإيجابية لا يقل عن 0.01 وتعديل-قيمة أقل من 0.05 بناءً على اختبار ويلكوكسون لمجموع الرتب. كما قمنا بفحص تعبير العلامات المبلغ عنها تقليديًا في الأدبيات.
تحديد الجينات المعبر عنها بشكل مختلف وتحليل إثراء مجموعة الجينات
تم إجراء تحليل إثراء مجموعة الجينات (GSEA) على الجينات المعبر عنها بشكل مختلف (DEG) المحددة كما هو موضح أعلاه باستخدام حزمة fgsea (الإصدار 3.17). تم اختبار العمليات البيولوجية: GO بعد تنزيل المسارات من قاعدة بيانات MSIgb (BP: مجموعة فرعية من GO، “https://www.gseamsigdb.org/gsea/msigdb/mouse/genesets.jsp?collection=GO:BP). فقط المسارات التي تحتوي على .قيمة صفةاعتُبرت مختلفة إحصائيًا.
اختبار تسلل الكريات السطحية
تم تشكيل الكريات بعد الزرعخلايا في لوحة خلايا ذات قاع دائري بعمق 96 بئرًا (LSBio، PrimeSurface)أطباق ثقافة ثلاثية الأبعاد: أطباق الالتصاق المنخفض للغاية (ULA). بعد 3 أيام، عندما تم تشكيل الكريات.خلايا الطحال المعزولة حديثًا تمت إضافتها وزرعها معًا لمدة 5 أيام، بعد ذلك تم غسل الكريات ثلاث مرات في PBS وتفكيكها إنزيميًا في التربسين 0.25% (مالتي سيل) مع تكرار السحب خلال العملية.تم تحليل خلايا الكريات المنفصلة بواسطة قياس التدفق الخلوي.
اختبار الومضية الحيوية
لقياس الومضات الحيوية في الجسم الحي، تم تخدير فئران p16-3MR باستخدام الإيزوفلوران وتم حقنها داخل البطن بمادة الكويلينترازين القابلة للذوبان في الماء (CTZ؛ تكنولوجيا نانو لايت) ) بتركيز في (سيغما). بعد 12 دقيقة من الحقن، تم تصوير الفئران باستخدام نظام تصوير الفلورسنت السطحي والفلورسنت العابر (تكنولوجيا لابيو). لتصوير الأنسجة المستأصلة، تم نقع الطحال مباشرة في محلول مخفف من الكويلينترازين (في PBS)، وتم تحليله على الفور.
تعبير الجينات بواسطة RT-qPCR
تم استخراج RNA من الخلايا الطحالية والوحيدة باستخدام RNeasyميني (كياجن) بعد تكسير الأنسجة والخلايا باستخدام دوار-ثابت. إجماليتم تحويل RNA المستخرج إلى cDNA باستخدام مجموعة تحويل النسخ العكسي QuantiTect (Qiagen). تم تخفيف cDNA الناتج عن النسخ العكسيماء خالي من RNAase. تم إجراء تفاعل PCR في الوقت الحقيقي على نظام ضوء الدوار (روش) في 96 بئرًا باستخدام مادة SYBRGreen (PowerUP Thermofisher) وبرايمرات محددة في حجم نهائي منتم تطبيع نسخ الجينات إلى Gapdh و B2mg. تم حساب مستوى mRNA النسبي مقارنة بمجموعة التحكم باستخدام طريقة عتبة الدورة المقارنة (CT) (2- ). تم استخدام البرايمرات التالية لتفاعل البوليميراز المتسلسل (PCR):
اختبار تكاثر خلايا T CD8 في المختبر
تم استئصال الأورام في اليوم 22 بعد الحقن وتم تفكيكها باستخدام مجموعة تفكيك أورام الفئران (ميلتيني). تم صبغ جميع الخلايا بـمن CFSE (سيلتريس-ثيرمو فيشر) لمدة 20 دقيقة قبل إضافة وسط كامل يحتوي علىتم استخدام FBS لامتصاص أي صبغة غير مرتبطة. ثم تم زراعة الخلايا في لوحة 96 بئرًا.خلايا/بئر) في RPMI 1640 الكامل المدعوم بـميركابتو-إيثانول، 2 مللي مول من L-جلوتامين و30UI.mLمن IL-2. لتفعيل خلايا T، تم إضافة كريات CD3/CD28 (Dynabeads، Thermofisher) بنسبة 2 كريات لكل خلية (2:1). تم تقييم القدرة التكاثرية لخلايا T بعد 72 ساعة من التفعيل باستخدام تحليل التدفق الخلوي مع صبغة الزومبي-NIR الحية (Biolegend)، والأجسام المضادة CD3-AF700 وCD8-BV421 (Biolegend). تم تقييم نسبة خلايا CD8 T غير التكاثرية باستخدام برنامج FlowJo v10. حيثما كان ذلك مناسبًا، تم إزالة خلايا CD11b + باستخدام مجموعة تفكيك PE-Selective لخلايا الفئران (StemCell) وفقًا لخطوات الشركة المصنعة و باستخدامأجسام مضادة مرتبطة بـ CD11b PE (بيوليجند). تم استخدام جزء من خلايا النخاع الشوكي لتحليل qPCR بعد التحلل في RLT (كياجين).
تنشيط خلايا CD8 T الطحالية بواسطة APC
تم زراعة خلايا الطحال في لوحة 96 بئرًا (خلايا/بئر) في RPMI 1640 معززة بـميركابتو-إيثانول، 2 مللي مول من L-جلوتامين و30UI.mLمن IL-2. ثم تم تحميل الخلايا ببتيد gp33 (إيبا- علوم الحياة) بتركيز قدره لمدة 12 ساعة مع 50 نانوغرام/مل من LPS (سيغما). تم تنقية خلايا T المتحولة حديثًا التي تتعرف بشكل محدد على ببتيد gp33 من طحال فئران P14 (جاكسون، P14 TCRV ) باستخدام مجموعة عزل خلايا T من الفئران EasySep (Stem cells). ثم تم صبغ خلايا T المنقاة بـمن CFSE (Celtrace-Thermo fisher) وزُرعت مع خلايا محملة بـ gp33 بتركيز منخلايا لكل بئر. بعدتم تحليل تكاثر الخلايا بواسطة
الشكل 5 | تمثل تنشيط وتكاثر خلايا CD8 T المعطلة بواسطة الخلايا الوحيدة جزئيًا بواسطة ABT263. أ جرى تحليل GSEA لخلايا CD8 T من بياناتنا النسخية باستخدام حزمة fgsea لتحديد GO الغني.خلايا CD8 T في CTL (من ثلاثة أورام مختلفة)،خلايا CD8 T في TBI (من 3 أورام مختلفة)،خلايا CD8 T في ABT (من ثلاثة أورام مختلفة). ب تم عرض مخطط EnrichmentPlot مع معلومات إحصائية (-قيمة معدلة أو padj، ودرجة الإثراء المعدلة أو NES) من GSEA لخلايا CD8 T لـ GO المحدد: تنشيط خلايا T وتنشيط الاستجابة المناعية. ج تظهر مخططات الكمان التعبير النسخي لمؤشرات Ifnو Cd69 في خلايا CD8 T. وظيفة FindMarkers مع اختبار Wilcoxon Rank Sum.CD8
خلايا T في CTL (من ثلاثة أورام مختلفة)،خلايا CD8 T في TBI (من 3 أورام مختلفة)،خلايا CD8 T في ABT (من ثلاثة أورام مختلفة). د تمثل مخططًا يوضح القدرة التكاثرية لخلايا CD8 T الملونة بـ CFSE داخل TME، مع أو بدون خلايا نقي (CD11b+)، من المجموعات المحددة بعد التحفيز باستخدام كريات التنشيط. تم تقييم نسبة خلايا CD8 T التكاثرية باستخدام برنامج FlowJo وأدوات التكاثر.CTL،CTL (-CD11b)،CTL + ABT263،CTL + ABT263 (-CD11b)،TBI،TBI (-CD11b)،TBI + ABT263،TBI + ABT263 (-CD11b). ANOVA أحادي الاتجاه مع تصحيح Tukey. تم عرض المتوسطSEM. تم توفير بيانات المصدر كملف بيانات مصدر.
الشكل 6 | نقص خلايا نقي Ly6c+ يتغلب جزئيًا على المقاومة لـ
L1. أ مخطط للتجربة. باختصار، تم حقن فئران p16-3MR في كل جانب بـخلايا ورمية تعبر عن بروتين الفلورسنت mPlum. تلقت الفئرانأجسام مضادة مانعة لـ Ly6c عن طريق الحقن داخل البطن في الأيام 7 و11 و15 و/أوأجسام مضادة مانعة لـ PD-L1 في الأيامو 12.تم عرض النسبة في الدم من خلايا CD11b + /Ly6c+ في مجموعة CD45+ كما تم قياسها بواسطة تدفق الخلايا بعد يومين من الحقن الأول لـالأجسام المضادة (اليوم 9 بعد حقن الورم).حيوانات مستقلة. اختبارين غير متطابقين-اختبار. تم عرض
المتوسطSEM.تم تقييم نمو الورم لكل من المجموعات المحددة من الفئران. تمثل كل خط متوسط نمو الورم على مدى 28 يومًا أو حتى تم إزالة الفأر من الدراسة. العدد الإجمالي للأورام لكل مجموعة موضح بين قوسين. ANOVA ثنائي الاتجاه أو تحليل مختلط مع تصحيح Tukey. تم عرض المتوسطSEM. مجموعة TBI هي نفسها كما في الشكل 1d وتم عرضها هنا مرة أخرى لتسهيل المقارنة. د تم عرض حجم كل ورم فردي في النقطة الزمنية المحددة. العدد الإجمالي للأورام لكل مجموعة موضح بين قوسين. تم توفير بيانات المصدر كملف بيانات مصدر.
تدفق الخلايا باستخدام CD3 (CD3-AF700، Biolegend)، CD8 (CD8-BV421، Biolegend)، وصبغة حيوية (NIR-Zombie، Biolegend). يتم استخدام برنامج FlowJo V10 لتحليل تكاثر الخلايا.
اختبار البلعمة ومعالجة OVA-DQ
تم وضع خلايا الطحال في طبق 96 بئر (خلايا/بئر) وتم إضافة OVA-DQ (DQ Ovalbumin، Thermofisher) بتركيز منلمدة 30 دقيقة للسماح ببلعها بواسطة APC. ثم تم غسل OVA-DQ وتم تحليل معالجته بواسطة البلعميات (F4/80+، CD45+) والخلايا الشجرية (CD45+، CD11c) بعد 3 ساعات بواسطة تدفق الخلايا (القطع المهضومة تحتوي على صبغة BODIPY). تم استخدام الأجسام المضادة التالية: CD11c-APC (Biolegend)، F4/80-APC/Cy7 (Biolegend)، CD45-PE-Cy7 (Biolegend)، 7AAD (Biolegend).
التحليل الإحصائي
تم استخدام Graph-pad Prism الإصدار 9 للتحليل الإحصائي والتمثيلات البيانية. جميع البيانات المعروضة هي المتوسط +/SEM. تم تقييم الأهمية الإحصائية لـ RT-qPCR، وتسلل المناعة للورم، وتكاثر خلايا T باستخدام ANOVA أحادي الاتجاه (انحرافات معيارية متساوية، SDs) أو Brown-Forsythe (انحرافات معيارية غير متساوية). بالنسبة لنمو الورم، استخدمنا ANOVA ثنائي الاتجاه أو تحليل مختلط عندما كانت أحجام المجموعات غير متساوية. نستخدم اختبارات Tukey للاختبارات المقارنة المتعددة وفقًا لتوصيات Prism. تم حساب اختلافات SDs باستخدام Brown-Forsythe واختبار Bartlett. تم قياس طبيعة وتوزيعات البيانات الغاوسية باستخدام اختبار D’Agostino & Pearson واختبار Shapiro-Wilk.
ملخص التقرير
معلومات إضافية حول تصميم البحث متاحة في ملخص تقرير Nature Portfolio المرتبط بهذه المقالة.
توفر البيانات
تم إيداع بيانات النسخ الخلوية المفردة التي تم إنشاؤها في هذه الدراسة في قاعدة بيانات GEO تحت رمز الوصول GSE256486. البيانات المستخدمة في الشكل 5g، h من Zhang C، Lei L، Yang X، وآخرون (المرجع 30. في المخطوطة) متاحة في قاعدة بيانات scRNA تحت اسم المستودع SCP1261. البيانات المتبقية متاحة ضمن المقالة، المعلومات التكميلية أو ملف بيانات المصدر. تم توفير بيانات المصدر مع هذه الورقة.
Waldman, A. D., Fritz, J. M. & Lenardo, M. J. A guide to cancer immunotherapy: from T cell basic science to clinical practice. Nat. Rev. Immunol. 20, 651-668 (2020).
Vu, S. H., Vetrivel, P., Kim, J. & Lee, M.-S. Cancer resistance to immunotherapy: molecular mechanisms and tackling strategies. Int. J. Mol. Sci. 23, 10906 (2022).
Wang, S., Xie, K. & Liu, T. Cancer immunotherapies: from efficacy to resistance mechanisms – not only checkpoint matters. Front. Immunol. 12, 690112 (2021).
Le, O. N. L. et al. lonizing radiation-induced long-term expression of senescence markers in mice is independent of p53 and immune status. Aging Cell 9, 398-409 (2010).
Shafqat, S., Arana Chicas, E., Shafqat, A. & Hashmi, S. K. The Achilles’ heel of cancer survivors: fundamentals of accelerated cellular senescence. J. Clin. Investig. https://doi.org/10.1172/ jci158452 (2022).
Marcoux, S. et al. Expression of the senescence marker p16INK4a in skin biopsies of acute lymphoblastic leukemia survivors: a pilot study. Radiat. Oncol. 8, 252 (2013).
Sanoff, H. K. et al. Effect of cytotoxic chemotherapy on markers of molecular age in patients with breast cancer. J. Natl Cancer Inst. 106, djuO57 (2014).
Childs, B. G. et al. Senescent cells: an emerging target for diseases of ageing. Nat. Rev. Drug Discov. 16, 718-735 (2017).
Baker, D. J. et al. Naturally occurring p16Ink4a-positive cells shorten healthy lifespan. Nature 530, 184-189 (2016).
Demaria, M. et al. Cellular senescence promotes adverse effects of chemotherapy and cancer relapse. Cancer Discov. 7, 165-176 (2017).
Palacio, L. et al. Restored immune cell functions upon clearance of senescence in the irradiated splenic environment. Aging Cell 18, e12971 (2019).
Martínez-Zamudio, R. I., Dewald, H. K., Vasilopoulos, T., GittensWilliams, L., Fitzgerald-Bocarsly, P. & Herbig, U. Senescence-associated -galactosidase reveals the abundance of senescent CD8+ T cells in aging humans. Aging Cell https://doi.org/10.1111/acel. 13344 (2021).
Liu, X. et al. Blockades of effector T cell senescence and exhaustion synergistically enhance antitumor immunity and immunotherapy. J. Immunother. Cancer 10, e005020 (2022).
Al-Habsi, M. et al. Spermidine activates mitochondrial trifunctional protein and improves antitumor immunity in mice. Science 378, eabj3510 (2022).
Groth, C. et al. Immunosuppression mediated by myeloid-derived suppressor cells (MDSCs) during tumour progression. Br. J. Cancer 120, 16-25 (2019).
Li, K. et al. Myeloid-derived suppressor cells as immunosuppressive regulators and therapeutic targets in cancer. Signal Transduct. Target. Ther. https://doi.org/10.1038/s41392-021-00670-9 (2021).
Chang, J. et al. Clearance of senescent cells by ABT263 rejuvenates aged hematopoietic stem cells in mice. Nat. Med. 22, 78-83 (2016).
Carbonneau, C. L. et al. Ionizing radiation-induced expression of INK4a/ARF in murine bone marrow-derived stromal cell populations interferes with bone marrow homeostasis. Blood 119, 717-726 (2012).
Xu, M. et al. Senolytics improve physical function and increase lifespan in old age. Nat. Med. 24, 1246-1256 (2018).
van Deursen, J. M. Senolytic therapies for healthy longevity. Science 364, 636-637 (2019).
Chaib, S., Tchkonia, T. & Kirkland, J. L. Cellular senescence and senolytics: the path to the clinic. Nat. Med. 28, 1556-1568 (2022).
Demaria, S. & Formenti, S. C. The abscopal effect 67 years later: from a side story to center stage. Br. J. Radiol. 93, 20200042 (2020).
Demaria, S. et al. Ionizing radiation inhibition of distant untreated tumors (abscopal effect) is immune mediated. Int. J. Radiat. Oncol. Biol. Phys. 58, 862-870 (2004).
Demaria, M. et al. An essential role for senescent cells in optimal wound healing through secretion of PDGF-AA. Dev. Cell 31, 722-733 (2014).
Xue, W. et al. p>Anti-PD1 up-regulates PD-L1 expression and inhibits T-cell lymphoma progression: possible involvement of an IFN- associated JAK-STAT pathway</p>. OncoTargets Ther. 12, 2079-2088 (2019).
Rong, Q.-X. et al. GM-CSF mediates immune evasion via upregulation of PD-L1 expression in extranodal natural killer/T cell lymphoma. Mol. Cancer https://doi.org/10.1186/s12943-021-01374-y (2021).
Postmus, A. C. et al. The chemotherapeutic drug doxorubicin does not exacerbate p16(Ink4a)-positive senescent cell accumulation and cardiometabolic disease development in young adult female LDLR-deficient mice. Toxicol. Appl Pharmacol. 468, 116531 (2023).
Oh, J., Magnuson, A., Benoist, C., Pittet, M. J. & Weissleder, R. Agerelated tumor growth in mice is related to integrin in T cells. JCI Insight https://doi.org/10.1172/jci.insight. 122961 (2018).
Zhang, C. et al. Single-cell sequencing reveals antitumor characteristics of intratumoral immune cells in old mice. J. Immunother. Cancer https://doi.org/10.1136/jitc-2021-002809 (2021).
Beyrend, G. et al. PD-L1 blockade engages tumor-infiltrating lymphocytes to co-express targetable activating and inhibitory receptors. J. Immunother. Cancer https://doi.org/10.1186/s40425-019-0700-3 (2019).
Ngwa, W., Irabor, O. C., Schoenfeld, J. D., Hesser, J., Demaria, S. & Formenti, S. C. Using immunotherapy to boost the abscopal effect. Nat. Rev. Cancer 18, 313-322 (2018).
Vanpouille-Box, C. et al. DNA exonuclease Trex1 regulates radiotherapy-induced tumour immunogenicity. Nat. Commun. 8, 15618 (2017).
Benci, J. L. et al. Tumor interferon signaling regulates a multigenic resistance program to immune checkpoint blockade. Cell 167, 1540-1554.e1512 (2016).
Jang, J. H. et al. Breast cancer cell-derived soluble CD44 promotes tumor progression by triggering macrophage IL1beta production. Cancer Res. 80, 1342-1356 (2020).
Horvatinovich, J. M. et al. Soluble CD83 inhibits t cell activation by binding to the TLR4/MD-2 complex on CD14(+) monocytes. J. Immunol. 198, 2286-2301 (2017).
Liu, Y., Ding, Y., Nie, Y. & Yang, M. EMP1 promotes the proliferation and invasion of ovarian cancer cells through activating the MAPK pathway. Onco Targets Ther. 13, 2047-2055 (2020).
Hsieh, A. C. & Ruggero, D. Targeting eukaryotic translation initiation factor 4E (elf4E) in cancer. Clin. Cancer Res. 16, 4914-4920 (2010).
Jin, A., Zhou, J., Yu, P., Zhou, S. & Chang, C. High expression of THBS1 leads to a poor prognosis in papillary thyroid cancer and suppresses the anti-tumor immune microenvironment. Technol. Cancer Res Treat. 21, 15330338221085360 (2022).
Wang, Q., Gao, J., Di, W. & Wu, X. Anti-angiogenesis therapy overcomes the innate resistance to PD-1/PD-L1 blockade in VEGFAoverexpressed mouse tumor models. Cancer Immunol., Immunother. 69, 1781-1799 (2020).
Fejza, A. et al. The efficacy of anti-PD-L1 treatment in melanoma is associated with the expression of the ECM molecule EMILIN2. Int. J. Mol. Sci. 22, 7511 (2021).
Sima, L. E. et al. Loss of host tissue transglutaminase boosts antitumor T cell immunity by altering STAT1/STAT3 phosphorylation in ovarian cancer. J. Immunother. Cancer 9, e002682 (2021).
Thumkeo, D. et al. PGE(2)-EP2/EP4 signaling elicits immunosuppression by driving the mregDC-Treg axis in inflammatory tumor microenvironment. Cell Rep. 39, 110914 (2022).
Zhang, X. X., Luo, J. H. & Wu, L. Q. FN1 overexpression is correlated with unfavorable prognosis and immune infiltrates in breast cancer. Front. Genet. 13, 913659 (2022).
Yu, K. et al. CREM is correlated with immune-suppressive microenvironment and predicts poor prognosis in gastric adenocarcinoma. Front. Cell Dev. Biol. 9, 697748 (2021).
Xie, Z. et al. Analysis of the expression and potential molecular mechanism of interleukin-1 receptor antagonist (IL1RN) in papillary thyroid cancer via bioinformatics methods. BMC Cancer https://doi. org/10.1186/s12885-020-07620-8 (2020).
Li, L., Song, S., Fang, X. & Cao, D. Role of ATF3 as a prognostic biomarker and correlation of ATF3 expression with macrophage infiltration in hepatocellular carcinoma. BMC Med. Genom. https:// doi.org/10.1186/s12920-020-00852-4 (2021).
Chen, J. et al. Reprogramming immunosuppressive myeloid cells by activated T cells promotes the response to anti-PD-1 therapy in colorectal cancer. Signal Transduct. Target. Ther. https://doi.org/ 10.1038/s41392-020-00377-3 (2021).
Kwart, D. et al. Cancer cell-derived type I interferons instruct tumor monocyte polarization. Cell Rep. 41, 111769 (2022).
Kaur, S., Bronson, S. M., Pal-Nath, D., Miller, T. W., Soto-Pantoja, D. R. & Roberts, D. D. Functions of thrombospondin-1 in the tumor microenvironment. Int. J. Mol. Sci. 22, 4570 (2021).
Marcheteau, E. et al. Thrombospondin-1 silencing improves lymphocyte infiltration in tumors and response to anti-PD-1 in triplenegative breast cancer. Cancers 13, 4059 (2021).
Fukumura, D., Kloepper, J., Amoozgar, Z., Duda, D. G. & Jain, R. K. Enhancing cancer immunotherapy using antiangiogenics: opportunities and challenges. Nat. Rev. Clin. Oncol. 15, 325-340 (2018).
Ma, S. et al. Heterochronic parabiosis induces stem cell revitalization and systemic rejuvenation across aged tissues. Cell Stem Cell 29, 990-1005.e1010 (2022).
Huseni, M. A. et al. CD8+ T cell-intrinsic IL-6 signaling promotes resistance to anti-PD-L1 immunotherapy. Cell Rep. Med. 4, 100878 (2023).
Ladomersky, E. et al. Advanced Age Increases Immunosuppression in the Brain and Decreases Immunotherapeutic Efficacy in Subjects with Glioblastoma. Clin. Cancer Res. 26, 5232-5245 (2020).
Kaur, A. et al. sFRP2 in the aged microenvironment drives melanoma metastasis and therapy resistance. Nature 532, 250-254 (2016).
Sceneay, J. et al. Interferon signaling is diminished with age and is associated with immune checkpoint blockade efficacy in triplenegative breast cancer. Cancer Discov. 9, 1208-1227 (2019).
Maggiorani, D. & Beausejour, C. Senescence and Aging: Does It Impact Cancer Immunotherapies? Cells https://doi.org/10.3390/ cells10071568 (2021).
Elkrief, A. et al. Efficacy of immune checkpoint inhibitors in older patients with non-small cell lung cancer: real-world data from multicentric cohorts in Canada and France. J. Geriatr. Oncol. 11, 802-806 (2020).
Gandhi, L. et al. Phase I study of navitoclax (ABT-263), a novel Bcl-2 family inhibitor, in patients with small-cell lung cancer and other solid tumors. J. Clin. Oncol. 29, 909-916 (2011).
Zhu, Y. et al. The Achilles’ heel of senescent cells: from transcriptome to senolytic drugs. Aging Cell 14, 644-658 (2015).
Yousefzadeh, M. J. et al. Fisetin is a senotherapeutic that extends health and lifespan. EBioMedicine 36, 18-28 (2018).
Moquin-Beaudry, G. et al. Autologous humanized mouse models of iPSC-derived tumors enable characterization and modulation of cancer-immune cell interactions. Cell Rep. Methods 2, 100153 (2022).
الشكر والتقدير
يقر المؤلفون بخدمة منصات CHUSJ ومرافق الحيوانات لمساعدتهم في هذا المشروع. تم دعم هذا العمل من خلال منحة من المعهد الكندي للبحوث الصحية (PJT-169017) إلى C.B. ومن قبل جمعية أبحاث السرطان (CRP-159385) إلى C.B. نود أيضًا أن نعرب عن شكرنا لدعم مؤسسة تشارلز برونو لمساعدتهم في تكلفة استخدام تدفق الخلايا وغيرها من المنصات المتخصصة. D.M. مدعوم من زمالة من Fonds de recherche Santé Québec.
مساهمات المؤلفين
D.M. أجرى التجارب؛ D.M.، V.L.، G.M.B.، و S.L. عالجوا العينات لتجربة الخلايا المفردة وحللوا البيانات المرتبطة؛ O.L. أنشأ وحقق في الفئران؛ V-P.L. و H.D.، صمموا وأشرفوا على التجارب الفردية؛ C.B. صمم وأشرف على الدراسة؛ D.M و C.B. كتبوا المخطوطة بمساهمات من جميع المؤلفين.
¹مركز أبحاث CHU Sainte-Justine، مونتريال، QC، كندا.قسم علم الأدوية وعلم وظائف الأعضاء (جامعة مونتريال، مونتريال، QC، كندا.معهد غاستاف روسي، باريس، فرنسا.قسم طب الأطفال (جامعة مونتريال، مونتريال، QC، كندا.قسم علم الميكروبات والمناعة وعلم الأمراض (جامعة مونتريال، مونتريال، QC، كندا.البريد الإلكتروني:c.beausejour@umontreal.ca
The potential of immune checkpoint inhibitors (ICI) may be limited in situations where immune cell fitness is impaired. Here, we show that the efficacy of cancer immunotherapies is compromised by the accumulation of senescent cells in mice and in the context of therapy-induced senescence (TIS). Resistance to immunotherapy is associated with a decrease in the accumulation and activation of CD8 T cells within tumors. Elimination of senescent cells restores immune homeostasis within the tumor micro-environment (TME) and increases mice survival in response to immunotherapy. Using single-cell transcriptomic analysis, we observe that the injection of ABT263 (Navitoclax) reverses the exacerbated immunosuppressive profile of myeloid cells in the TME. Elimination of these myeloid cells also restores CD8 T cell proliferation in vitro and abrogates immunotherapy resistance in vivo. Overall, our study suggests that the use of senolytic drugs before ICI may constitute a pharmacological approach to improve the effectiveness of cancer immunotherapies.
Immunotherapies based on immune checkpoint inhibitors (ICI), by alleviating immunosuppressive pathways, constitute a game changer in cancer treatments . However, depending on the cancer type, of treated patients are either resistant to immunotherapy or eventually relapse a few years after . As a result, there is an urgent need to identify mechanisms that compromise the full potential of ICIblockade therapy, especially in solid tumors.
We believe that the accumulation of senescent cells following exposure to genotoxic stresses, such as cancer treatments (radiotherapy and chemotherapy) , can induce immunotherapy resistance. Indeed, the accumulation of senescent cells is known to trigger agerelated pathologies, and we recently showed that ionizing radiationinduced senescence greatly impairs immune cell functions in mice . This phenotype could be reversed following the genetic elimination of
senescent cells . Moreover, a recent study showed an increase in the number of senescent T cells with impaired proliferative capacity in human blood during aging . Others showed that blocking DNA damage signaling can prevent tumor-specific T-cell senescence and enhance ICI efficacy against tumors . Likewise, the use of spermidine in aged mice was shown to improve the efficacy of immunotherapy by restoring mitochondrial metabolism in CD8 T cells . The accumulation of myeloid cells, especially myeloid-derived suppressor cells (MDSC), is an important mechanism that was shown to impair the tumor immune response . Moreover, aging and exposure to radiotherapy were shown to favor myeloid skewing . These observations lead us to hypothesize that senolytic drugs may be able to improve ICI based therapies by rejuvenating immune cell. Senolytic drugs were recently developed to specifically eliminate senescent cells which was shown to
decrease the severity of the age-related pathologies . In particular, ABT263 (Navitoclax), a potent BCL-2 family protein inhibitor was shown to efficiently remove senescent cells from lymphoid tissue and to decrease myeloid skewing in aged mice . Finally, recent evidences have shown it is possible to clear senescent cells in human using senolytic drugs .
Here, using mouse carcinoma models, we show that PD-L1 immunotherapy is compromised in mice previously exposed to cancer therapy and in the context of therapy-induced senescence (TIS). We also demonstrate that senescence impairs the abscopal effect, defined by the immune rejection of a secondary tumor distant from a primary tumor treated by radiotherapy . Mechanistically, we show that both of these deleterious effects are associated with impaired CD8 T cell activation mediated by an immunosuppressive TME and are reversible upon treatment of mice with ABT263 or depletion of Ly6c+ myeloid cells. Our results suggest that the combination of a senolytic drug with ICI may be a strategy to improve the efficacy of immunotherapies.
Results
Senescence leads to immunotherapy resistance in mice
Senescent cells are found in cancer-survivors subjected to chemotherapy and radiotherapy in the course of their treatments . To verify the impact of senescence in the context of cancer immunotherapy, we used two validated mouse models of senescence induction. One was generated by total body irradiation (TBI) at the sub-lethal dose of 6.5 Gy and the second was induced by a single injection of doxorubicin at a dose of (Doxo; Fig. 1a). These models are relevant as cancer patients are often aged and/or have been previously exposed to cytotoxic drugs prior to their immunotherapy treatments. We and others have shown that the senescence phenotype is established gradually in these mouse models and remains stable at least weeks after and 4 weeks after the injection of Doxo . Indeed, the expression of and/or is increased in the spleen of TBI or Doxo-treated mice (Fig. 1b). Importantly, hematopoietic cell counts in blood can fully recover in both models (Supplementary Fig. 1). Moreover, to investigate the specific role of senescent cells we took advantage of the p16-3MR mouse model which allows the tracking and the elimination of p16+ senescent cells following the injection of ganciclovir (GCV) . As expected from our previous work, exposure of p16-3MR mice treated with GCV leads to the elimination of p16+ cells in the spleen (Fig.1c) . Hence, to evaluate the impact of senescence on the efficacy of PD-L1 immunotherapy treatments we injected MC38 tumor cells in p163MR mice previously exposed to TBI or Doxo. The injection of the antibody limited the growth of MC38 tumors and improved the survival of control (CTL) mice. However, the same treatments in both TBI and Doxo treated mice failed restraining tumor growth and did not improve survival (Fig. 1d-f). These observations were not limited to the MC38 cell line as the efficacy of PD-L1 treatments was also diminished in TBI-treated mice injected with the EL4 lymphoma cell line (Supplementary Fig. 2) . Importantly, the elimination of p16+ cells by the injection of GCV could restore the efficacy of PD-L1 and improve survival in mice previously exposed to TBI (Fig. 1d-f). Note that as expected, GCV had no beneficial effect in Doxo-treated mice as p16 expression was not increased in these animals, a phenotype also observed by others . Intriguingly, tumor growth was delayed in mice previously exposed to TBI or Doxo compared to control mice, a phenotype also observed in aged mice . Tumor growth rate was not changed by treatments with GCV alone as TBItreated mice still died around 40 days after the injection of tumor cells compared to approximately 25 days in the case of control mice, suggesting tumor growth delay is independent of senescence. Altogether, these results demonstrate the detrimental impact of senescent cells on the tumor immune response and that their removal can restores the efficacy of immunotherapy.
Locally induced senescence is sufficient to decrease the efficacy of immunotherapy
We next asked if senescence induced locally in the context of TIS would also compromise the efficacy of PD-L1 treatments. To answer this question, we used a model where established MC38 tumors (approximately in size) were exposed to a single 12 Gy dose of local radiotherapy (RT) (Supplementary Fig. 3A). It is possible to only expose the tumor to RT by shielding the remaining of the mouse with a led plate. At this dose, senescence was induced in tumors as determined by expression of SA- Gal and p16-dependent bioluminescent signal associated with the Renilla-luciferase expression of senescent cells in p16-3MR mice (Supplementary Fig. 3B, C). Senescence induction coincided with the tumor growth being temporarily halted for more or less 14 days after which growth resumes. Hence, 14 and 17 days after local RT, mice were injected with an PD-L1 antibody and tumor growth monitored. As we observed in mice previously exposed to TBI and Doxo, locally induced senescence is sufficient to decrease the efficacy of PD-L1 treatments (Supplementary Fig. 3D).
Elimination of senescent cells using ABT263 restores immunotherapy efficacy in mice
In an effort to provide a more translational approach, we next wanted to remove senescent cells using a pharmacological treatment and see if it would also improve the success of immunotherapy. As such, we evaluated if ABT263, a validated senolytic drug , would efficiently clear senescent cells in TBI-treated mice. For that purpose, we monitored the bioluminescent signal associated with senescent cells in p163MR mice. We observed a decreased luciferase signal and p16/p21 gene expression levels, from the spleen of p16-3MR TBI mice treated with ABT263 (Fig. 2a-c). As observed with GCV, ABT263 treatment improved the efficacy of PD-L1 immunotherapy against MC38 tumor cells in TBI mice (Fig. 2d, e). In addition, ABT263 significantly prolonged the survival of mice previously exposed to TBI while it had no impact on control mice (Fig. 2f). To understand how senescent cell clearance improved anti-tumor immune response, we used flow cytometry to evaluate immune cell infiltration in tumors dissociated 2 days following the last PD-L1 injection (day 14 post tumor inoculation). Interestingly, we observed a higher proportion of CD8 T cells in tumors of all groups receiving PD-L1 injections except in tumors dissociated from TBI mice (Fig. 2g). There was no significant differences in CD4 T cells and a downward trend in the proportion of myeloid cells (CD11b + ) in all groups receiving PD-L1 injections except in TBI mice not treated with ABT263 (Fig. 2g). This is in accordance with a previous report showing that CD8 T cells significantly proliferate in response to ICIs therapy . Consequently, the ratio of CD8 T to CD11b + cells was increased after immunotherapy in all groups excluding the group of TBI mice not treated with ABT263 (Fig. 2h). Importantly, ABT263 had no significant impact on the tumor growth rate and on the immune infiltrate in absence of PD-L1 treatments. These observations suggest that senescence, either directly or through its impact on the TME, interferes with the efficacy of PD-L1 immunotherapy by limiting the expansion of CD8 T cells within tumors.
ABT263 improves the abscopal effect
We next wanted to evaluate if senescence would also compromise the immune response involved in the abscopal effect. The abscopal effect is defined by the immune clearance of a secondary tumor distant from a primary tumor treated by RT. When associated with ICIs, RT was shown to greatly improve the abscopal effect presumably by helping with the release and presentation of tumor antigens . We investigated the abscopal effect by inoculating mice on each flank with MC38 tumor cells, a primary tumor and a smaller secondary tumor. The protocol we used involved exposing the primary tumor with a fractionated dose of RT ( ) followed by CTLA- 4 injections on days 14, 17, and 20 (Fig. 3a). Here again, it is possible to only expose the primary tumor to
RT by shielding the remaining of the mouse with a led plate. For this experiment, we choose to use a blocking CTLA-4 antibody since its injection alone was shown to have no effect on the growth of MC38 tumors while its combination with RT greatly improves the abscopal effect . Note that in this model, the primary tumor is almost completely eliminated in response to RT alone in both control and TBI mice. However, the immune clearance of the secondary abscopal
tumor is entirely dependent on CTLA-4 treatment. Using this combination, we observed that the abscopal effect allowed for almost the complete elimination (CE) of the secondary tumor in control mice while the efficacy was reduced in TBI mice (Fig. 3b, d, e). The injection of mice with ABT263 prior to RT enhanced the efficacy of the abscopal effect in TBI mice and improved their survival to a level similar to what we observed in control mice (Fig. 3b, c). Here again, we investigated
Fig. 1 | Senescence leads to immunotherapy resistance. a Schematic of the experiment. In brief, senescence was induced in p16-3MR mice with a single 6.5 Gy sub-lethal dose of total body irradiation (TBI) or following the injection of Doxo ( ). 12 weeks after TBI or 4 weeks after doxorubicin injection, mice were injected intraperitoneally with GCV ( ) for 5 consecutive days to remove senescent cells. 5 days after the last injection of GCV, mice were injected on each flank with MC38 tumor cells expressing mPlum fluorescent protein. Mice were injected with a PD-L1 blocking antibody on days 9 and 12 and tumor growth was evaluated until reaching a limit point. b Relative expression of and was quantified by RT_qPCR in the spleen 10 weeks after induction of senescence with TBI or 4 weeks after Doxo treatments. and and Doxo from independent animals. Two-tailed unpaired -test for in Doxo group, and Mann-Whitney test for in TBI group. Shown is the mean SEM. c p16
expression measured by bioluminescence in the spleen of p16-3MR mice before and after treatment with GCV. , Doxo, Doxo+GCV from independent animals. Ordinary one-way ANOVA with Tukey correction. Shown is the mean SEM. d Shown is the mean tumor growth SEM over 25 days for CTL mice and 28 days for TBI/Doxo mice. Control mice that were not subjected to TBI or Doxo are indicated as CTL. The total number of tumors per group is indicated in parenthesis. Mixed-effect analysis or Two-way ANOVA with Tukey correction. e Shown is the size of each individual tumors at the indicated timepoint. The total number of tumors per group is indicated in parenthesis. f Kaplan-Meyer survival plots of CTL, TBI and Doxo mice for each of the indicated conditions. The total number mice per group is indicated in parenthesis. Log-rank (Mantel-Cox test). Source data are provided as a Source Data file.
the immune infiltration in the TME by dissociating secondary tumors on day 22 post tumor inoculation or two days after the last injection of CTLA-4. At this timepoint, the abscopal effect is at his strongest and secondary tumors start to be rejected in all groups. Flow cytometry analysis revealed that the proportion of CD8 T cells infiltrating the TME after RT CTLA- 4 treatments is higher in control compared to TBI mice (Fig. 3f). The proportion of myeloid CD11b+ cells decreased following RT CTLA- 4 treatments in all groups although more modestly in TBI mice (Fig. 3f). Consequently, the ratio of CD8 T to CD11b+ was lower in tumors dissociated from TBI mice that did not receive ABT263 (Fig. 3g). Inversely, the injection of ABT263 increased the proportion of CD8 T cells in TBI mice treated with RT+aCTLA-4 and improved the ratio to myeloid cells. ABT263 had no significant impact on the tumor growth rate and on the immune infiltrate in absence of immunotherapy treatments. Finally, we observed important differences in the proportion of CD8 T cells expressing IFN in tumors of control vs TBI mice treated with RT CTLA- 4 . Again, treatment of TBI mice with ABT263 restored the proportion of CD8 T cells expressing IFN (Fig. 3h). These results reinforce the notion that the immune response to ICIs therapy is compromised by senescence and that the effect is reversible upon treatment with a senolytic drug.
Monocytes with an immunosuppressive phenotype accumulate in the TME of TBI mice
Many distinct mechanisms may be responsible for the reduced accumulation of CD8 T cells in the TME of TBI mice. For one, increased expression of immunosuppressive ligands at the surface of tumor cells may be implicated . However, no difference in the expression of Galectin9, PD-L1, Tnfrs4, and CD86 expression was detected by flow cytometry at the surface of dissociated tumor cells at day 22 post inoculation in our different groups (Supplementary Fig. 4). Another explanation may reside in the capacity of splenocytes to process and present antigens to T cells. As such, we measured the capacity of antigen-presenting cells (dendritic cells and macrophages here after referred as APC) collected from the spleen of control and TBI mice. We observed no difference in the capacity of these cells to phagocyte and process the OVA-DQ protein (Supplementary Fig. 5A). Similarly, the capacity of APC collected from TBI mice to cross-present the GP-33 peptide to CD8 T cells expressing a GP-33-specific TCR was not diminished (Supplementary Fig. 5B). However, we cannot rule out that APC in lymph nodes or within tumors were not impaired. Then, we also asked if the migration and infiltration potential of CD8 T cells collected from TBI mice was compromised. We found these cells were not incapacitated in their ability to infiltrate MC38 spheroid in vitro (Supplementary Fig. 5C). Combined with our previous observation that purified CD8 T cells from TBI mice can proliferate normally upon stimulation , these results suggest that an immunosuppressive TME is likely responsible for the reduced accumulation of CD8 T cells within the tumor.
We thus performed an unbiased analysis of the TME composition using single-cell transcriptomic analysis of cells dissociated from tumors collected from control (Ctrl), TBI and TBI + ABT263 (ABT)
treated mice. An average of 10,000 cells collected and pooled from 3 different tumors in each group were analyzed (Fig. 4a). All cells were clustered and embedded in two dimensions using UMAP representation (Fig. 4b). All clusters were identified and named based on a list of classically used markers to identify immune cells (Fig. 4c and Supplementary Data 1). First observation is that the size of the cluster representing monocytes (Itgam , Adgrel ) tended to increase in tumors of TBI mice. On the other hand, the size of the clusters representing CD8 T cells ( ), natural killer ( NK , Itgam , ), dendritic cells (DC, Itgax ) and DC expressing Xcr1 (DC Xcr1, Itgax ) tended to be smaller in the TBI group. Finally, the clusters representing CD4 T cells ( , Foxp3 , ), B cells ( Cd 3 , Itgam Ly6 ) and macrophages (Itgam , Ccr2 , Cxc3cr1 , Adgre1 ) remained mostly unchanged (Fig. 4d).
We next analyzed the differently expressed genes (DEGs) within major cell clusters in the TBI group compared to the same cell population in the control or ABT groups (Supplementary Data 2). By using UpSetPlot representations, to identify intersection (shared DEGs) between groups, we found that monocytes and macrophages exhibit the highest number of DEGs in TBI vs Ctrl (290 and 228 respectively) and in ABT vs TBI (123 and 171 respectively), meaning that these cell types are those most affected by TBI (Fig. 4e). More importantly, 63 DEGs ( of 290) in monocytes and 26 DEGs ( of 228) in macrophages are in the intersection of Ctrl vs TBI and ABT vs TBI groups, indicating the expression of those genes are fully restored after ABT263 treatments (Fig. 4e and Supplementary Fig. 6). We first focused on monocytes since those cells contained the highest number of restored DEGs and represent the largest cluster. Of the 63 DEGs in monocytes, we generated a signature of 12 overexpressed genes exhibiting immunosuppressive functions and/or associated with a poor cancer prognosis: , Cd83 , Emp1 , Eif4e , Thbs1 , Vegfa , Emilin2 , Tgm2 , Ptgs2 , Fn1 , , Il1rn (Fig. 4f). We referred that combination of gene as the TBI-Monocyte-Signature, and its global expression was quantified (Fig. 4 f lower panel). In addition we observed the downregulation of Atf3, a transcription factor whose the downregulation is associated with a poor tumor outcome (Fig. 4f). FeaturePlot representations confirmed this gene signature is indeed associated with monocytes (Fig. 4g). We also found a similar gene signature in macrophages, especially for the downregulation of Atf3 and the upregulation of Crem, Cd83, Cd44, Tgm2 and Thbs1 which were restored by ABT263 (Supplementary Fig. 7). Finally, we then compared the TBI-Monocyte-Signature with a previously published transcriptomic data set generated from B16F10 tumors extracted from young ( 3 months) and old mice ( months) . Using the metadata generated by the authors for monocytes (Ly6c2 + , Ccr2 +) we found that the TBI-Monocyte-Signature is overexpressed in old monocytes vs young monocytes, suggesting that exposure to TBI induces a premature aging phenotype (Fig. 4h). Among the 63 DEGs founds in monocytes, none of them are associated with the classic patterns of senescence process such as DNA damage, CDKi expression or the senescence-associated secretory phenotype. This observation suggests that monocytes are not senescent in the tumor microenvironment.
Depletion of myeloid cells partially restores the efficacy of L1 treatments
Our results so far suggest that the immunosuppressive profile of monocytes and macrophages are responsible for the impaired accumulation of CD8 T cells in tumors of TBI mice. Indeed, GSEA performed on DEGs from CD8 T cells showed a reduced activation state of CD8 T cells collected from TBI mice compared to Ctrl (Fig. 5a, b). GSEA also
showed restored activation of CD8 T cells after ABT263 treatments (Fig. 5a, b). In line with these observations, the expression of the effector function genes Ifng and Cd69 tended to decreased in CD8 T cells collected from TBI tumors. (Fig. 5c). Therefore, we designed an in vitro assay to measure the impact of myeloid CD11b+ cells on the proliferation of CD8 T cells. As such, CD8 T cells were collected from dissociated tumors and activated with IL2 and CD3/CD28 beads in
Fig. 2 | Senescent cells elimination using ABT263 treatments improves cancer immunotherapy in irradiated mice. a Schematic of the experiment. In brief, senescence was induced using sub-lethal TBI and 10 weeks later mice received ABT263 ( ), by intragastric gavage for two cycles of 5 consecutive days, to remove senescent cells. 5 days after the last gavage, mice were either sacrificed to measure senescence in spleen ex-vivo or injected with MC38 tumor cells. b Evaluation by bioluminescence of p16 expression in the spleen before and after treatment with ABT263. Shown is the mean SEM. CTL, CTL + ABT263, from independent animals. Ordinary one-way ANOVA with Tukey correction. c Evaluation by qPCR of p 16 and p 21 expression in the spleen before and after treatment with ABT263. , from independent animals. Ordinary one-way ANOVA with Tukey correction. Shown is the mean SEM. Tumor growth was evaluated for each of the indicated groups of mice. Each line represents the mean growth SEM of tumor over 25 days or until the mouse had to be removed from the study. The total number of tumors per group is indicated in parenthesis. Mixed-effect analysis or
Two-way ANOVA with Tukey correction. e Shown is the size of each individual tumors at the indicated timepoint. Mice that were not subjected to TBI are indicated as control (CTL). The total number of tumors per group is indicated in parenthesis. f Kaplan-Meyer survival plots of both control and TBI mice for each of the indicated conditions. Log-rank (Mantel-Cox test). g Tumor immune cells infiltration was analyzed by flow cytometry after tumor dissociation on day 14 post inoculation. Shown is the proportions of CD4 T cells, CD8 T cells and CD11b+ cells within the CD45+ population. CTL, CTL ( PD-L1), CTL + ABT263 ( PD-L1), TBI + ABT263 ( PD-L1) tumors per group. Ordinary one-way ANOVA with Tukey correction. Shown is the mean SEM. Shown is the ratio of the CD8 T cells over CD11b + in tumors. CTL, CTL ( PD-L1), CTL + ABT263 PD-L1 CTL + ABT263 PD-L1 TBI, TBI ( PD-L1), TBI + ABT263, TBI + ABT263 ( PD-L1) tumors per group. Brown-Forsythe and Welch ANOVA with Games-Howell correction. Shown is the mean SEM. Source data are provided as a Source Data file.
presence or after removal of CD11b+ cells. We observed that CD8 T cells collected from tumors of TBI mice proliferated less upon stimulation suggesting that CD11b+ cells were responsible for this inhibition (Fig. 5d). Finally, we depleted Ly6c+ monocytes in TBI mice using a blocking antibody and measured if this would bypass resistance to PD-L1 treatments (Fig. 6a). We first confirmed the depletion of Ly6c + /CD11b + positive cells in blood of TBI mice (Fig. 6b). Then, we observed that only the combination of Ly6c and PD-L1 blocking antibodies could efficiently delay tumor growth in TBI mice (Fig. 6c, d). These results demonstrate that myeloid cells in the context of a senescent environment have an exacerbated immunosuppressive profile and induce resistance to immunotherapy.
Discussion
This work revealed that the accumulation of senescent cells interferes with cancer immunotherapies and that their removal, using a genetic or pharmacological approach, reverses the phenotype. Mechanistically, we showed that senescence, through its action on myeloid cells, compromises the efficacy of immunotherapy by limiting the accumulation of CD8 T cells within the TME. These results in combination with our previously published data showing that T cells purified from TBI mice can be activated and expanded at a level similar to cells collected from control mice , suggest that the effect on T cells is mostly mediated in a non-cell autonomous manner. Moreover, we demonstrated that T cells from TBI mice are efficiently primed by antigen-presenting cells (dendritic cells and macrophages) and are still capable of infiltrating MC38 tumor cell spheroids in vitro. Instead, it appears that the deleterious effect arises from the lower ratio of CD8 T cells/myeloid cells ( ) observed in TBI mice after immunotherapy. A recent publication showed that PD-L1 treatments lead to increase apoptosis of myeloid cells . We did not observe more myeloid cells death in TBI mice treated with PD-L1. Yet, because the proportion of CD8 T cells was decreased in the TME of TBI mice, this suggested that myeloid cells, despite not significantly more abundant, were functionally more immunosuppressive. We confirmed this phenotype using both single-cell transcriptomic data and functional assays in vitro and in vivo.
Others have shown that infiltrating monocytes expressing high levels of Thbs1 and Vegfa, two genes from our TBI-induced Immunosuppressive signature, can inhibit the efficacy of PD-L1 treatments against Lewis lung carcinoma tumors . Single-cell transcriptomic analysis of both the spleen and BM of control and TBI mice suggest that monocytes were already partially polarized by the systemic senescent environment in absence of tumor cells (Supplementary Figs. 8 and 9). However, this is not a prerequisite as we also showed that local RT in the context of TIS is sufficient to impair the efficacy of PD-L1 treatments (Supplementary Fig. 3). Of the many immunosuppressive genes we observed, Thbs1 is a secreted
glycoprotein implicated in a wide range of processes . Blocking Thbs1 with a genetic approach in triple-negative breast cancer (TNBC) was shown to increase CD8 T cells infiltration/proliferation and improve response to PD-L1 immunotherapy in mice . To our knowledge, there is no validated pharmacological inhibitor of Thbs1 available. Similarly, increase Vegfa expression by monocytes is likely detrimental since it was shown that antiangiogenics molecules improve the efficacy of immunotherapies . Another gene from our signature is , whose expression is downregulated in monocytes collected from TBI tumors. Atf3 is a gene known to play a crucial role in several biological processes, such as immune response regulation. It has been reported that its downregulation in macrophages is associated with a worse outcome in patients with hepatocellular carcinoma . Atf3 was also shown to be downregulated in hematopoietic stem and progenitor cells during aging, and its expression restored after a parabiosis experiment with young mice . It remains to be determined if a correlation can be drawn between immunotherapy efficacy and Atf3 expression after TIS. Finally, a recent study showed that IL-6 expression can help predict the response to PD-L1 therapy . However, in our study, IL-6 expression was not changed between groups. Overall, we believe the immunosuppressive signature and its impact on myeloid cells is likely multifactorial.
Noteworthy, in our abscopal model we observed that the elimination of the primary tumor was not compromised by senescence. This suggest that fractionated doses of RT were sufficient to kill cancer cells, likely through DNA damage-induced apoptosis, and that RT was not inhibited by the immunosppressive TME. Likewise, given the growing literature linking the accumulation of senescent cells with age-associated diseases, it is tempting to speculate that senolytics may also be able to increase ICB efficacy in aged subjects. Indeed, decrease immune functions in aged mice was reported to be associated with a decline in ICB efficacy . This is in contrast to studies in humans who did not show a correlation between decrease ICB efficacy and aging . For example, no decrease in the efficacy of ICB was observed in aged (over 70 years old) lung cancer patients . However, in this study all patients (younger and old) were previously treated with platinum chemotherapy prior to receiving ICB therapy. Given platinum was shown to induce senescence it is possible that both groups had a compromised immune response independently of their age at the time of ICB treatments. For this study, we choose to use ABT263 because of its proven efficacy at eliminating senescent cells in mice. However, ABT263 is known to induce thrombocytopenia in patients and therefore has limited clinical utility . For our approach to be eventually tested in patients, one would likely need to employ a different senolytic approach. It may be possible to use other proven senolytics such as quercetin+dasatinib and fisetin , assuming they can efficiently improve immune cell functions.
Overall, our results demonstrate that it is possible to pharmacologically increase the tumor immune response and suggest senolytic drugs injected prior to ICB should be considered. We also identified an immunosuppressive signature in myeloid cells that it may be possible to exploit to predict the efficacy of immunotherapy. We foresee that cancer treatments that do not induce DNA damage and cellular senescence will not interfere with ICB efficacy.
Methods
Animals
p16-3MR mice on a C57BL/6 background were kindly donated by Dr. Judith Campisi (Buck Institute) according to a material transfer agreement. All mice were bred on-site and in vivo manipulations were approved by the Comité Institutionnel des Bonnes Pratiques Animales en Recherche of the CHU Ste-Justine (protocol 2023-5331). Both males
Fig. 3 | Impaired abscopal effect in previously irradiated mice is restored by ABT263. a Schematic of the experiment. CTL or TBI mice treated or not with ABT263 were inoculated on each flank with 3 or tumor cells. On days 12,13 , and 14 after tumor inoculation, the larger primary tumor was exposed to 3 rounds ( 8 Gy each) of radiotherapy (RT). Mice were then injected on days 14,17 , and 20 with a CTLA- 4 blocking antibody and tumor growth evaluated until reaching a limit point. Alternatively, some mice were euthanized at day 22 and tumors surgically removed to allow immune infiltration analysis. Tumor growth was evaluated for each of the indicated groups of mice. Each line represents the growth of an individual tumor over 28 days or until the mouse had to be removed from the study. The total number of tumors per group is indicated in parenthesis. 2way ANOVA with Tukey correction. Shown is the mean SEM. c Kaplan-Meyer survival plots for each of the indicated conditions. d Histogram showing the proportion of mice in each group achieving complete secondary (abscopal) tumor elimination (CE). e Shown is the weight of the secondary tumors at day 22 prior to dissociation. CTL, CTLA4), TBI, TBI (RT CTLA4), TBI + ABT263, TBI + ABT263 (RT CTLA4) tumor from independent animals. Brown-Forsythe and Welch ANOVA test with Games-Howell correction. Shown is the mean SEM. f Tumor immune cells infiltration as determined by flow cytometry from
dissociated tumors on day 22 post inoculation. Shown are the proportions of CD8 T cells, CD 4 T cells and cells over the total number of cells collected from tumors. For CD8 and CD4, CTL CTLA4), TBI + ABT263, TBI + ABT263 (RT CTLA4) tumors from independent animals. For CD11b, CTL CTLA4), TBI + ABT263, TBI + ABT263 (RT CTLA4) tumors from independent animals. Ordinary one-way ANOVA with Tukey correction. Shown is the mean SEM. Shown is the ratio of CD 8 T cells over cells in tumors at day 22. ABT263 (RT CTLA4), TBI, TBI (RT CTLA4), TBI + ABT263, TBI + ABT263 (RT CTLA4) tumors from independent animals. BrownForsythe and Welch ANOVA with Games-Howell correction. Shown is the mean SEM. Shown is the quantification of the expression of IFN as measured by flow cytometry in infiltrated CD8 T cells at day 22. CTL, (RT CTLA4), CTLA4), TBI + ABT263, TBI + ABT263 (RT CTLA4) tumors from independent animals. Ordinary one-way ANOVA with Tukey correction. Shown is the mean SEM. Source data are provided as a Source Data file.
and females mice were used as we did not observed difference in tumor growth and response to immunotherapy between sex.
Senescence mouse models
12- to 14 -week-old mice were exposed to TBI at the single sub-lethal dose of using a Faxitron CP-160. During the 10 days following TBI, Baytril antibiotic was added to the water to prevent infections. Alternatively, doxorubicin (CHU Sainte-Justine-Pharmacy) was administrated with a single intraperitoneal injection at a dose of .
In vivo treatments
10 to 12 weeks after TBI or 1 week after doxorubicin, mice received intragastric gavage with vehicle alone (ethanol: polyethylene glycol 400:Phosal 50 PG at 10:30:60) or with ABT263 (MedChemExpress, Navitoclax) at body weight. Vehicle and ABT263 was given to mice for two cycles of 5 consecutive days, with a week of rest between cycles. GCV (CHU Sainte-Justine-Pharmacy), was injected 10-12 weeks after TBI. GCV was administrated intraperitoneal for 5 consecutive days at a dose of in PBS (Multicell) after activation in 0.1 M of hydrochloric acid (Sigma).
Cell culture
MC38 and EL-4 cells were grown in DMEM or RPMI1640 respectively (Multicell) supplemented with 10% FBS and 1% penicillin-streptomycin at under in a humidified atmosphere. MC38 tumor cells were transduced with a lentivector to express and sorted to obtain a nearly pure population with high mPlum fluorescence. Cells are routinely tested to ensure the absence of mycoplasma contamination.
Tumor inoculation and immunotherapy treatments
MC38 and EL-4 tumor cells (were a gift from Dr. John Stagg and Dr. Hélène Decaluwe respectively) were inoculated subcutaneously ( and cells in PBS respectively) in both the right and left flanks of mice anesthetized with isoflurane. A blocking PD-L1 antibody (BioXcell, clone 10 F.9G2) was injected intraperitoneally ( in PBS per mouse) on day 9 and 12 post tumor cells inoculation when tumor size was around . Blocking Ly6c antibody (BioXcell clone Monts 1) was injected intraperitoneally ( in PBS per mouse) at day 7,11 and 15. For the abscopal assay, MC38 cells were inoculated with two different concentrations, cells at the primary tumor site (right flank) and cells in the secondary tumor site (left flank). The primary tumor was treated with three doses of radiotherapy ( )
on days 12,13 , and 14 . A blocking CTLA- 4 antibody (BioXcell, clone 9H10) was injected intraperitoneally ( in PBS per mouse) on day 14,17 , and 20 post tumor cells inoculation when the size of the primary tumor was between and the secondary tumor between . Tumor growth was monitored by fluorescence acquisition (Labeo Technologies) and caliper measurement. For survival analysis, mice were sacrificed when one limit point was reached according to our animal comity guidelines. Our comity established limit points as no more than weight loss, no destress signs such as alopecia or decreasing activity, MC38 tumor size does not reach more than without ulceration or with ulceration, EL-4 tumor size does not reach more than . In some cases, one of these limit point has been exceeded the last day of measurement and the mice were immediately euthanized. Tumors, spleen, and BM were excised after mice were sacrificed by lethal intraperitoneal injection of a barbituric followed by neck dislocation.
Tissues dissociation
Tumors were collected and dissociated with the mouse tumor dissociation kit (Tumor dissociation kit for mice, Miltenyi). We used the program 37C_m_TDK2 in an Octo-Dissociator with heaters (Miltenyi). After dissociation, the enzymatic reaction was stopped by adding 10 mL of RPMI1640 supplemented with FBS and the cell suspension filtered through a mesh. The cells were then ready for analysis or frozen in nitrogen liquid for later usage. Splenocytes were obtained by crushing the spleen between a syringe cap and then filtered with a mesh. Red blood cells were removed by adding for 2 min a Red Blood cell lysis solution ( , and EDTA ). Cells from the BM were obtained after flushing with a needle the soft center of tibias and femurs.
Flow cytometry
Cells were blocked with PBS containing 2% FBS and stained using antibodies against CD16/CD32 (1/100 dilution from Biolegend) for 30 min at . Cells were then washed in PBS containing FBS and stained with conjugated antibodies for cytometry during 20 min at in the dark ( dilution). Cells were washed again and dead cells stained with the Zombie staining dye (Biolegend) for 15 min at room temperature in PBS without FBS. Cells were washed and processed on a Fortessa (BD Biosciences) for analysis. For the analysis of the TME, dissociated cells were stained using the following antibodies: CD45 (CD45-BV785, Biolegend), CD3 (CD3-AF700, Biolegend), CD4 (CD4-PE, Biolegend), CD8 (CD8-PercpCy5, Biolegend), CD11b (CD11b-BUV395, Biolegend), tumor cells were self-fluorescent (mPlum). Dead cells were
stained with the Zombie-Aqua dye (Biolegend) and then analyzed by flow cytometry. For the staining of IFN , cells were treated with Momensin-A 1X (BioLegend) and with PMA-lonomicine (Invitrogen eBioscience Cell Stimulation Cocktail 500X) for 2 h at under CO2 in a humidified atmosphere in complete RPMI1640. Cells were then fixed and permeabilized with the BD Cytofix/Cytoperm Kit and stained with an anti IFN antibody (IFN – BV785, Biolegend). The full
list of antibodies used in this study is available in Supplementary Data 3. All gating strategy are presented in Supplementary Fig. 10.
SA- Gal staining
Whole tumors were isolated and fixed in PFA for 20 min . After two washes in PBS, the whole tumor was soaked in -Gal staining solution at -Gal, 40 mM Citric acid Sodium phosphate buffer at
Fig. 4 | The immunosuppressive phenotype of monocytes is partially restored after treatment with ABT263. a Tumors from the indicated groups of mice were collected at day 22 post inoculation and dissociated. Non tumorigenic cells (referred as tumor microenvironment cells) were sorted and used for single-cell transcriptomic analysis in two independent experiments. Each group contains a pool of cells from three tumors. Approximately 10,000 cells for each group were analyzed. b A total of 12 different clusters representing nearly all cells from the TME were generated by Seurat package in R-studio and positioned with U-MAP representation. c Shown is a DotPlot listing the genes which the expression was used to identify the cell clusters generated in panel (b). d Shown is the proportion of individual cell populations from all cells analyzed. e UpsetPlot showing the interaction size (number of DEGs) after samples comparison in monocytes,
macrophages and CD8 T cells. Of the 63 genes in the monocyte cluster which the expression was restored in ABT treated mice, 13 were selected following their association with immunosuppression/immunotherapy resistance. Their individual expression are shown in RidgePlot to demonstrate the overall immunosuppressive phenotype of these monocyte cells. The global expression of the overexpressed genes (without Atf3) constitutes the TBI-Monocyte-Signature and is represented with a ViolinPlot. g The TBI-Monocyte-Signature identified in panel F is quantified in whole cells using FeaturePlot to highlight their expression within the monocyte cluster as defined in panel (b). Single cell data sets generated by Zhang et al. in B16F10 tumors collected from aged (20-22 months old) and young (6-8 weeks old) mice were used to analyze the expression of the TBI-Monocyte-Signature in monocytes as show by violin plots. Source data are provided as a Source Data file. potassium ferrocyanide, 5 mM potassium ferricyanide, 150 mM Sodium chloride, 2 mM of magnesium chloride) for 4 h . Stained tumors were washed with PBS and a picture was taken with a stereo microscope (Leika M205FA).
Single-cell analysis
For the analysis of the TME, tumors were dissociated and mPlum+ tumor cells sorted out by FACS. For the analyses of splenocytes and BM cells, cells were dissociated as indicated above and live cells sorted by FACS. Sorted cells ( ) were stained using CellPlex reagents according to the 10 X genomics protocol. After labeling, cells were pooled and processed on the Chromium Controller according to manufacturer’s protocol using the GEX 3′ v3 kit aiming at a capture of 10,000 cells per sample. Sequencing libraries were generated as per manufacturer’s instructions and sequenced on a NovaSeq S6000 aiming at 20,000 reads per cell for the gene expression libraries and 5000 reads per cells for the cell multiplexing library. Fastq files were aligned to the genome and reads counted using CellRanger version 6. Count matrices were analyzed using Seurat v4 (https://satijalab.org/ seurat/index.html). CellPlex reads were normalized using CLR method. Mutual exclusivity of cell multiplexing label was visually confirmed. Gene expression reads were log-normalized with a scaling factor of 10,000, principal component analysis was performed using the 2000 most variable genes and data was embedded in two dimensions using Uniform Manifold Approximation and Projection computed on the first 15 principal components. Principal components used for analysis was defined by using ‘ElbowPlot’. Cells with a fraction of mitochondria reads greater than two standard deviations above the mean were removed. Cells were clustered based on a nearest-neighbor graph construction using Seurat V4 with default parameters and resolution parameter at 0.4 . Clusters were annotated by inspecting the expression of the differentially expressed genes with a fold change of at least 0.15, a difference in proportion of positive cells of at least 0.01 and an adjusted -value of less than 0.05 based on a wilcoxon rank sum test. We also inspected the expression of classically reported markers in the literature.
Differentially expressed genes identification and gene set enrichment analysis
Gene set enrichment analysis (GSEA) analysis were performed on the DEG identified as above using the fgsea package (Release 3.17). The Biological process:GO were tested after downloading pathways from the MSIgb database (BP: subset of GO, https://www.gseamsigdb.org/ gsea/msigdb/mouse/genesets.jsp?collection=GO:BP). Only the pathways with an adjusted .value adj were considered as statistically different.
Spheroid infiltration assay
Spheroids were formed following plating cells in a 96 -well round bottom ultra-low attachment cell plate (LSBio, PrimeSurface 3D Culture Spheroid plates: Ultra-low Attachment (ULA) Plates). 3 days after, when spheroids were formed, freshly isolated splenocytes
were added and coculture for 5 days after which spheroids were washed 3 times in PBS and enzymatically dissociated in trypsin 0.25% (Multicell) coupled with frequent pipetting during . Dissociated spheroid cells were analyzed by flow cytometry.
Bioluminescence assay
To measure in vivo bioluminescence, p16-3MR mice were anesthetized using isoflurane and injected intraperitoneally with water-soluble coelenterazine (CTZ; NanoLight Technology ) at a concentration of in (Sigma). 12 min post-injection, mice were imaged using the Epi-Fluorescence & Trans-Fluorescence Imaging System (Labeo Technologies). For the imaging of resected tissues, spleens were directly soaked in a diluted coelenterazine solution (in PBS), and immediately analyzed.
Gene expression by RT-qPCR
RNA from splenocytes and monocytes was extracted with the RNeasy Mini (Qiagen) after tissue and cell disruption with a rotor-stator. A total of of extracted RNA was reverse-transcripted into cDNA using the QuantiTect Reverse Transcription Kit (Qiagen). Retrotranscipt cDNA was diluted with RNAase-free water. The real-time PCR reaction was performed on a light cycler system (Roche) in 96 wells using the SYBRGreen reagent (PowerUP Thermofisher) and specific primers in a final volume of . Gene transcripts were normalized to Gapdh and B2mg. Relative mRNA compared to the control group was calculated using the comparative cycle threshold (CT) method (2- ). The following primers used for PCR:
CD8 T cell proliferation in vitro assay
Tumors were excised on day 22 after inoculation and dissociated with the mouse tumor dissociation kit (Miltenyi). All cells were stained with of CFSE (Celtrace-Thermo fisher) for 20 min before adding complete media containing FBS to absorb any unbound dye. Then, cells were plated in a 96 -well plate ( cells/well) in complete RPMI 1640 supplemented with mercapto-ethanol, 2 mM l-glutamine and 30 UI.mL of IL-2. To activate T cells, CD3/CD28 beads (Dynabeads, Thermofisher) were added at a ratio of 2 beads per cell (2:1). The proliferative capacity of T cells was evaluated 72 h after activation by flow cytometry using the zombie-NIR live staining (Biolegend), CD3-AF700, and CD8-BV421 antibodies (Biolegend). The proportion of non-proliferative CD8 T cells was evaluated using the FlowJo v10 software. Were indicated, CD11b + cells were removed using the PE-Selective dissociation kit for mouse cells (StemCell) following the manufacturer steps and using of CD11b PE-coupled antibody
(Biolegend). A fraction of myeloid cells were used for qPCR analysis after lysing in RLT (Qiagen).
Splenic CD8 T cell activation by APC
Splenocytes were plated in a 96 -well plate ( cells/well) in RPMI 1640 supplemented with mercapto-ethanol, 2 mM L-glutamine and 30 UI.mL of IL-2. Cells were then loaded with the gp33 peptide (Iba-
lifesciences) at a concentration of for 12 h with 50 ng mL of LPS (Sigma). Fresh transgenic T cells specifically recognizing the gp33 peptide were purified from the spleen of P14 mice (Jackson, P14 TCRV ) using the EasySep Mouse T cell isolation kit (Stem cells). Purified T cells were then stained with of CFSE (Celtrace-Thermo fisher) and cultivated with gp33 loaded cells at a concentration of cells per well. After cells proliferation was analyzed by
Fig. 5 | Impaired activation and proliferation of CD8 T is mediated by monocytes and partially rescued by ABT263. a GSEA of CD8 T cells from our RNA transcriptomic data using the fgsea package to identify enriched GO. CD8 T cells in CTL (from three different tumors), CD8 T cells in TBI (from 3 different tumors), CD8 T cells in ABT (from three different tumors). b Shown are the EnrichmentPlot with statistical information ( -value adjusted or padj, and the Normalized Enrichment Score or NES) from CD8 T cells GSEA for the selected specific GO: T cell activation and Activation of immune response. c Violin plots showing the transcriptomic expression of Ifn and Cd69 effector markers in CD8 T cells. FindMarkers function with Wilcoxon Rank Sum test. CD8
T cells in CTL (from three different tumors), CD8 T cells in TBI (from 3 different tumors), CD8 T cells in ABT (from three different tumors). d Schematic representing the ex vivo proliferative capacity of CFSE stained CD8 T cells within the TME, with or without myeloid cells (CD11b+), from the indicated groups following stimulation with activation beads. The percentage of proliferative CD8 T cells was evaluated using the FlowJo software and proliferation tools. CTL, CTL (-CD11b), CTL + ABT263, CTL + ABT263 (-CD11b), TBI, TBI (-CD11b), TBI + ABT263, TBI + ABT263 (-CD11b). Ordinary one-way ANOVA with Tukey correction. Shown is the mean SEM. Source data are provided as a Source Data file.
Fig. 6 | Depletion of Ly6c+ myeloid cells partially overcomes resistance to
L1. a Schematic of the experiment. In brief, p16-3MR mice were injected on each flank with tumor cells expressing the mPlum fluorescent protein. Mice received a Ly6c blocking antibody by intraperitoneal injection on days 7,11 , and 15 and/or a PD-L1 blocking antibody on days and 12. Shown is the proportion in blood of CD11b + /Ly6c+ cells in the CD45+ population as measured by flowcytometry two days after the first injection of antibodies (day 9 post tumor inoculation). independent animals. Two unpaired -test. Shown is the
mean SEM. Tumor growth was evaluated for each of the indicated groups of mice. Each line represents the mean tumor growth over 28 days or until the mouse had to be removed from the study. The total number of tumors per group is indicated in parenthesis. 2way ANOVA or Mixed-effect analysis with Tukey correction. Shown is the mean SEM. TBI group is the same as in Fig.1d and shown here again to facilitate comparison. d Shown is the size of each individual tumors at the indicated timepoint. The total number of tumors per group is indicated in parenthesis. Source data are provided as a Source Data file.
flow cytometry using CD3 (CD3-AF700, Biolegend), CD8 (CD8-BV421, Biolegend), and a viability dye (NIR-Zombie, Biolegend). FlowJo V10 software is used to analyze cell proliferation.
OVA-DQ phagocytosis and processing assay
Splenocytes were plated in a 96 -well plate ( cells/well) and OVA-DQ (DQ Ovalbumin, Thermofisher) was added at a concentration of for 30 min to allow its phagocytosis by APC. OVA-DQ was then washed and its processing by macrophages (F4/80+, CD45+) and dendritic cells (CD45+, CD11c) analyzed 3 h later by flow cytometry (Digested fragment have BODIPY dye). The following antibodies were used: CD11c-APC (Biolegend), F4/80-APC/Cy7 (Biolegend), CD45-PE-Cy7 (Biolegend), 7AAD (Biolegend).
Statistical analysis
Graph-pad Prism version 9 was used for the statistical analysis and graphical representations. All data showed are the mean +/SEM. A one-way ANOVA (equal standard deviations, SDs) or Brown-Forsythe (unequal SDs) assessed the statistical significance for RT-qPCR, tumor immune infiltration, and T cell proliferation. For tumor growth, we used a two-way ANOVA or the mixed-effect analysis when the group sizes were unequal. We use the Tukey tests for the multiple comparison tests following Prism’s recommendations. SDs differences were calculated with Brown-Forsythe and Bartlett’s test. Normality and gaussian distributions of data set were measured with D’Agostino & Pearson test and Shapiro-Wilk test.
Reporting summary
Further information on research design is available in the Nature Portfolio Reporting Summary linked to this article.
Data availability
The single-cell transcriptomic data generated in this study have been deposited in the GEO database under accession code GSE256486. Data used in Fig. 5g, h from Zhang C, Lei L, Yang X, et al. (ref. 30. in the manuscript) are available in the scRNA database under the repository name SCP1261. The remaining data are available within the Article, Supplementary Information or Source Data file. Source data are provided with this paper.
Waldman, A. D., Fritz, J. M. & Lenardo, M. J. A guide to cancer immunotherapy: from T cell basic science to clinical practice. Nat. Rev. Immunol. 20, 651-668 (2020).
Vu, S. H., Vetrivel, P., Kim, J. & Lee, M.-S. Cancer resistance to immunotherapy: molecular mechanisms and tackling strategies. Int. J. Mol. Sci. 23, 10906 (2022).
Wang, S., Xie, K. & Liu, T. Cancer immunotherapies: from efficacy to resistance mechanisms – not only checkpoint matters. Front. Immunol. 12, 690112 (2021).
Le, O. N. L. et al. lonizing radiation-induced long-term expression of senescence markers in mice is independent of p53 and immune status. Aging Cell 9, 398-409 (2010).
Shafqat, S., Arana Chicas, E., Shafqat, A. & Hashmi, S. K. The Achilles’ heel of cancer survivors: fundamentals of accelerated cellular senescence. J. Clin. Investig. https://doi.org/10.1172/ jci158452 (2022).
Marcoux, S. et al. Expression of the senescence marker p16INK4a in skin biopsies of acute lymphoblastic leukemia survivors: a pilot study. Radiat. Oncol. 8, 252 (2013).
Sanoff, H. K. et al. Effect of cytotoxic chemotherapy on markers of molecular age in patients with breast cancer. J. Natl Cancer Inst. 106, djuO57 (2014).
Childs, B. G. et al. Senescent cells: an emerging target for diseases of ageing. Nat. Rev. Drug Discov. 16, 718-735 (2017).
Baker, D. J. et al. Naturally occurring p16Ink4a-positive cells shorten healthy lifespan. Nature 530, 184-189 (2016).
Demaria, M. et al. Cellular senescence promotes adverse effects of chemotherapy and cancer relapse. Cancer Discov. 7, 165-176 (2017).
Palacio, L. et al. Restored immune cell functions upon clearance of senescence in the irradiated splenic environment. Aging Cell 18, e12971 (2019).
Martínez-Zamudio, R. I., Dewald, H. K., Vasilopoulos, T., GittensWilliams, L., Fitzgerald-Bocarsly, P. & Herbig, U. Senescence-associated -galactosidase reveals the abundance of senescent CD8+ T cells in aging humans. Aging Cell https://doi.org/10.1111/acel. 13344 (2021).
Liu, X. et al. Blockades of effector T cell senescence and exhaustion synergistically enhance antitumor immunity and immunotherapy. J. Immunother. Cancer 10, e005020 (2022).
Al-Habsi, M. et al. Spermidine activates mitochondrial trifunctional protein and improves antitumor immunity in mice. Science 378, eabj3510 (2022).
Groth, C. et al. Immunosuppression mediated by myeloid-derived suppressor cells (MDSCs) during tumour progression. Br. J. Cancer 120, 16-25 (2019).
Li, K. et al. Myeloid-derived suppressor cells as immunosuppressive regulators and therapeutic targets in cancer. Signal Transduct. Target. Ther. https://doi.org/10.1038/s41392-021-00670-9 (2021).
Chang, J. et al. Clearance of senescent cells by ABT263 rejuvenates aged hematopoietic stem cells in mice. Nat. Med. 22, 78-83 (2016).
Carbonneau, C. L. et al. Ionizing radiation-induced expression of INK4a/ARF in murine bone marrow-derived stromal cell populations interferes with bone marrow homeostasis. Blood 119, 717-726 (2012).
Xu, M. et al. Senolytics improve physical function and increase lifespan in old age. Nat. Med. 24, 1246-1256 (2018).
van Deursen, J. M. Senolytic therapies for healthy longevity. Science 364, 636-637 (2019).
Chaib, S., Tchkonia, T. & Kirkland, J. L. Cellular senescence and senolytics: the path to the clinic. Nat. Med. 28, 1556-1568 (2022).
Demaria, S. & Formenti, S. C. The abscopal effect 67 years later: from a side story to center stage. Br. J. Radiol. 93, 20200042 (2020).
Demaria, S. et al. Ionizing radiation inhibition of distant untreated tumors (abscopal effect) is immune mediated. Int. J. Radiat. Oncol. Biol. Phys. 58, 862-870 (2004).
Demaria, M. et al. An essential role for senescent cells in optimal wound healing through secretion of PDGF-AA. Dev. Cell 31, 722-733 (2014).
Xue, W. et al. p>Anti-PD1 up-regulates PD-L1 expression and inhibits T-cell lymphoma progression: possible involvement of an IFN- associated JAK-STAT pathway</p>. OncoTargets Ther. 12, 2079-2088 (2019).
Rong, Q.-X. et al. GM-CSF mediates immune evasion via upregulation of PD-L1 expression in extranodal natural killer/T cell lymphoma. Mol. Cancer https://doi.org/10.1186/s12943-021-01374-y (2021).
Postmus, A. C. et al. The chemotherapeutic drug doxorubicin does not exacerbate p16(Ink4a)-positive senescent cell accumulation and cardiometabolic disease development in young adult female LDLR-deficient mice. Toxicol. Appl Pharmacol. 468, 116531 (2023).
Oh, J., Magnuson, A., Benoist, C., Pittet, M. J. & Weissleder, R. Agerelated tumor growth in mice is related to integrin in T cells. JCI Insight https://doi.org/10.1172/jci.insight. 122961 (2018).
Zhang, C. et al. Single-cell sequencing reveals antitumor characteristics of intratumoral immune cells in old mice. J. Immunother. Cancer https://doi.org/10.1136/jitc-2021-002809 (2021).
Beyrend, G. et al. PD-L1 blockade engages tumor-infiltrating lymphocytes to co-express targetable activating and inhibitory receptors. J. Immunother. Cancer https://doi.org/10.1186/s40425-019-0700-3 (2019).
Ngwa, W., Irabor, O. C., Schoenfeld, J. D., Hesser, J., Demaria, S. & Formenti, S. C. Using immunotherapy to boost the abscopal effect. Nat. Rev. Cancer 18, 313-322 (2018).
Vanpouille-Box, C. et al. DNA exonuclease Trex1 regulates radiotherapy-induced tumour immunogenicity. Nat. Commun. 8, 15618 (2017).
Benci, J. L. et al. Tumor interferon signaling regulates a multigenic resistance program to immune checkpoint blockade. Cell 167, 1540-1554.e1512 (2016).
Jang, J. H. et al. Breast cancer cell-derived soluble CD44 promotes tumor progression by triggering macrophage IL1beta production. Cancer Res. 80, 1342-1356 (2020).
Horvatinovich, J. M. et al. Soluble CD83 inhibits t cell activation by binding to the TLR4/MD-2 complex on CD14(+) monocytes. J. Immunol. 198, 2286-2301 (2017).
Liu, Y., Ding, Y., Nie, Y. & Yang, M. EMP1 promotes the proliferation and invasion of ovarian cancer cells through activating the MAPK pathway. Onco Targets Ther. 13, 2047-2055 (2020).
Hsieh, A. C. & Ruggero, D. Targeting eukaryotic translation initiation factor 4E (elf4E) in cancer. Clin. Cancer Res. 16, 4914-4920 (2010).
Jin, A., Zhou, J., Yu, P., Zhou, S. & Chang, C. High expression of THBS1 leads to a poor prognosis in papillary thyroid cancer and suppresses the anti-tumor immune microenvironment. Technol. Cancer Res Treat. 21, 15330338221085360 (2022).
Wang, Q., Gao, J., Di, W. & Wu, X. Anti-angiogenesis therapy overcomes the innate resistance to PD-1/PD-L1 blockade in VEGFAoverexpressed mouse tumor models. Cancer Immunol., Immunother. 69, 1781-1799 (2020).
Fejza, A. et al. The efficacy of anti-PD-L1 treatment in melanoma is associated with the expression of the ECM molecule EMILIN2. Int. J. Mol. Sci. 22, 7511 (2021).
Sima, L. E. et al. Loss of host tissue transglutaminase boosts antitumor T cell immunity by altering STAT1/STAT3 phosphorylation in ovarian cancer. J. Immunother. Cancer 9, e002682 (2021).
Thumkeo, D. et al. PGE(2)-EP2/EP4 signaling elicits immunosuppression by driving the mregDC-Treg axis in inflammatory tumor microenvironment. Cell Rep. 39, 110914 (2022).
Zhang, X. X., Luo, J. H. & Wu, L. Q. FN1 overexpression is correlated with unfavorable prognosis and immune infiltrates in breast cancer. Front. Genet. 13, 913659 (2022).
Yu, K. et al. CREM is correlated with immune-suppressive microenvironment and predicts poor prognosis in gastric adenocarcinoma. Front. Cell Dev. Biol. 9, 697748 (2021).
Xie, Z. et al. Analysis of the expression and potential molecular mechanism of interleukin-1 receptor antagonist (IL1RN) in papillary thyroid cancer via bioinformatics methods. BMC Cancer https://doi. org/10.1186/s12885-020-07620-8 (2020).
Li, L., Song, S., Fang, X. & Cao, D. Role of ATF3 as a prognostic biomarker and correlation of ATF3 expression with macrophage infiltration in hepatocellular carcinoma. BMC Med. Genom. https:// doi.org/10.1186/s12920-020-00852-4 (2021).
Chen, J. et al. Reprogramming immunosuppressive myeloid cells by activated T cells promotes the response to anti-PD-1 therapy in colorectal cancer. Signal Transduct. Target. Ther. https://doi.org/ 10.1038/s41392-020-00377-3 (2021).
Kwart, D. et al. Cancer cell-derived type I interferons instruct tumor monocyte polarization. Cell Rep. 41, 111769 (2022).
Kaur, S., Bronson, S. M., Pal-Nath, D., Miller, T. W., Soto-Pantoja, D. R. & Roberts, D. D. Functions of thrombospondin-1 in the tumor microenvironment. Int. J. Mol. Sci. 22, 4570 (2021).
Marcheteau, E. et al. Thrombospondin-1 silencing improves lymphocyte infiltration in tumors and response to anti-PD-1 in triplenegative breast cancer. Cancers 13, 4059 (2021).
Fukumura, D., Kloepper, J., Amoozgar, Z., Duda, D. G. & Jain, R. K. Enhancing cancer immunotherapy using antiangiogenics: opportunities and challenges. Nat. Rev. Clin. Oncol. 15, 325-340 (2018).
Ma, S. et al. Heterochronic parabiosis induces stem cell revitalization and systemic rejuvenation across aged tissues. Cell Stem Cell 29, 990-1005.e1010 (2022).
Huseni, M. A. et al. CD8+ T cell-intrinsic IL-6 signaling promotes resistance to anti-PD-L1 immunotherapy. Cell Rep. Med. 4, 100878 (2023).
Ladomersky, E. et al. Advanced Age Increases Immunosuppression in the Brain and Decreases Immunotherapeutic Efficacy in Subjects with Glioblastoma. Clin. Cancer Res. 26, 5232-5245 (2020).
Kaur, A. et al. sFRP2 in the aged microenvironment drives melanoma metastasis and therapy resistance. Nature 532, 250-254 (2016).
Sceneay, J. et al. Interferon signaling is diminished with age and is associated with immune checkpoint blockade efficacy in triplenegative breast cancer. Cancer Discov. 9, 1208-1227 (2019).
Maggiorani, D. & Beausejour, C. Senescence and Aging: Does It Impact Cancer Immunotherapies? Cells https://doi.org/10.3390/ cells10071568 (2021).
Elkrief, A. et al. Efficacy of immune checkpoint inhibitors in older patients with non-small cell lung cancer: real-world data from multicentric cohorts in Canada and France. J. Geriatr. Oncol. 11, 802-806 (2020).
Gandhi, L. et al. Phase I study of navitoclax (ABT-263), a novel Bcl-2 family inhibitor, in patients with small-cell lung cancer and other solid tumors. J. Clin. Oncol. 29, 909-916 (2011).
Zhu, Y. et al. The Achilles’ heel of senescent cells: from transcriptome to senolytic drugs. Aging Cell 14, 644-658 (2015).
Yousefzadeh, M. J. et al. Fisetin is a senotherapeutic that extends health and lifespan. EBioMedicine 36, 18-28 (2018).
Moquin-Beaudry, G. et al. Autologous humanized mouse models of iPSC-derived tumors enable characterization and modulation of cancer-immune cell interactions. Cell Rep. Methods 2, 100153 (2022).
Acknowledgements
The authors acknowledge the service of the CHUSJ platforms and animal facility for their help on this project. This work was supported by a grant from the Canadian Institute of Health Research (PJT-169017) to C.B. and by the Cancer Research Society (CRP-159385) to C.B. We also would like to acknowledge the support of the Fondation Charles Bruneau for their support in the cost of using flow cytometry and other specialized platforms. D.M. is supported by a fellowship from le Fonds de recherche Santé Québec.
Author contributions
D.M. performed the experiments; D.M., V.L., G.M.B., and S.L. processed samples for single-cell experiment and analyzed the associated data; O.L. generated and validated mice; V-P.L. and H.D., designed and supervised individual experiments; C.B. designed and supervised the study; D.M and C.B. wrote the manuscript with the contributions from all the authors.
Correspondence and requests for materials should be addressed to Christian Beauséjour.
Peer review information Nature Communications thanks Manuel Collado, Guangyong Peng and the other, anonymous, reviewer(s) for their contribution to the peer review of this work. A peer review file is available.
¹Centre de recherche du CHU Sainte-Justine, Montréal, QC, Canada. Département de pharmacologie et physiologie (Université de Montréal, Montréal, QC, Canada. Institut Gustave Roussy, Paris, France. Département de pédiatrie (Université de Montréal, Montréal, QC, Canada. Département de microbiologie, immunologie et infectiologie (Université de Montréal, Montréal, QC, Canada. e-mail: c.beausejour@umontreal.ca