DOI: https://doi.org/10.1038/s41586-025-08687-8
PMID: https://pubmed.ncbi.nlm.nih.gov/40108454
تاريخ النشر: 2025-03-19
الصمت العابر للتغيرات المفرطة يحافظ على ألفة خلايا B خلال الانفجار النسلي
تاريخ الاستلام: 15 أبريل 2024
تم القبول: 22 يناير 2025
نُشر على الإنترنت: 19 مارس 2025
الوصول المفتوح
الملخص
خلال عملية نضوج تقارب الأجسام المضادة، تقوم خلايا B في المركز الجرثومي (GC) بتحوير جينات السلاسل الثقيلة والخفيفة للأجسام المضادة في عملية تُعرف بالتحوير المفرط الجسمي (SHM).
الانتقاء الانتقائي الملحوظ – الذي أطلقنا عليه اسم الانفجارات النسيلية – حيث تتولى ذرية خلية B واحدة هيكل GC مكون من 2000 خلية بالكامل في غضون أيام.
لحل هذا الصراع الظاهر، بدأنا بفحص أنماط الطفرات في الانفجارات الكلونية بدقة جزيء واحد. ولهذا الغرض، استخدمنا Aicda
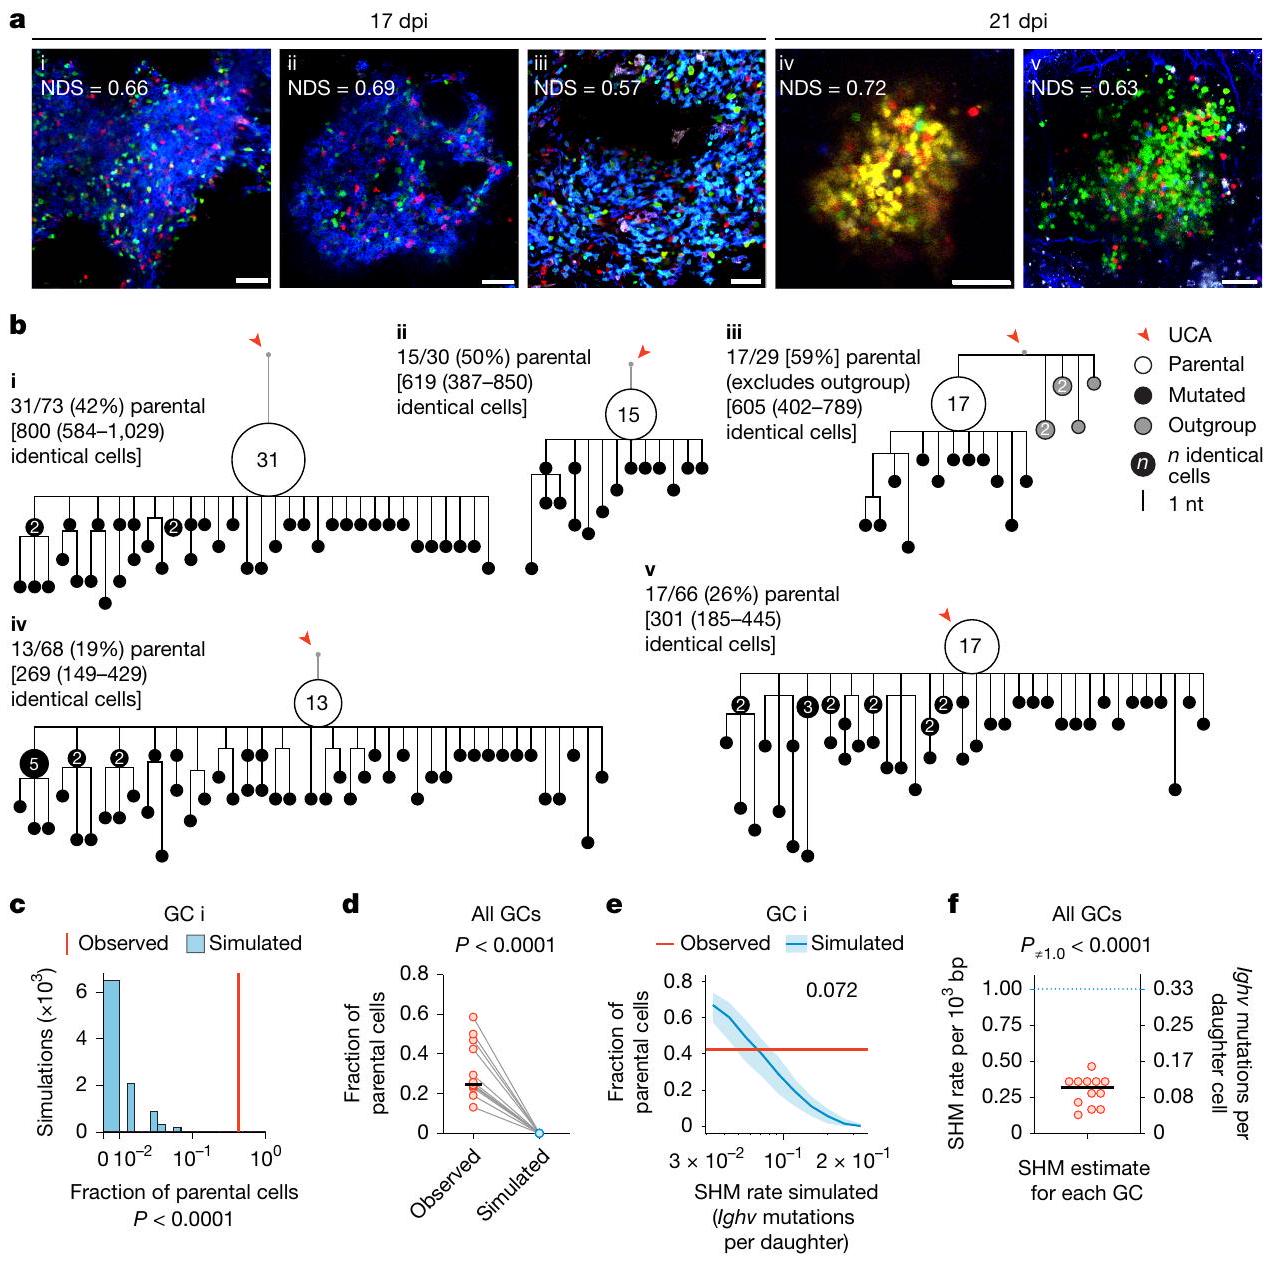
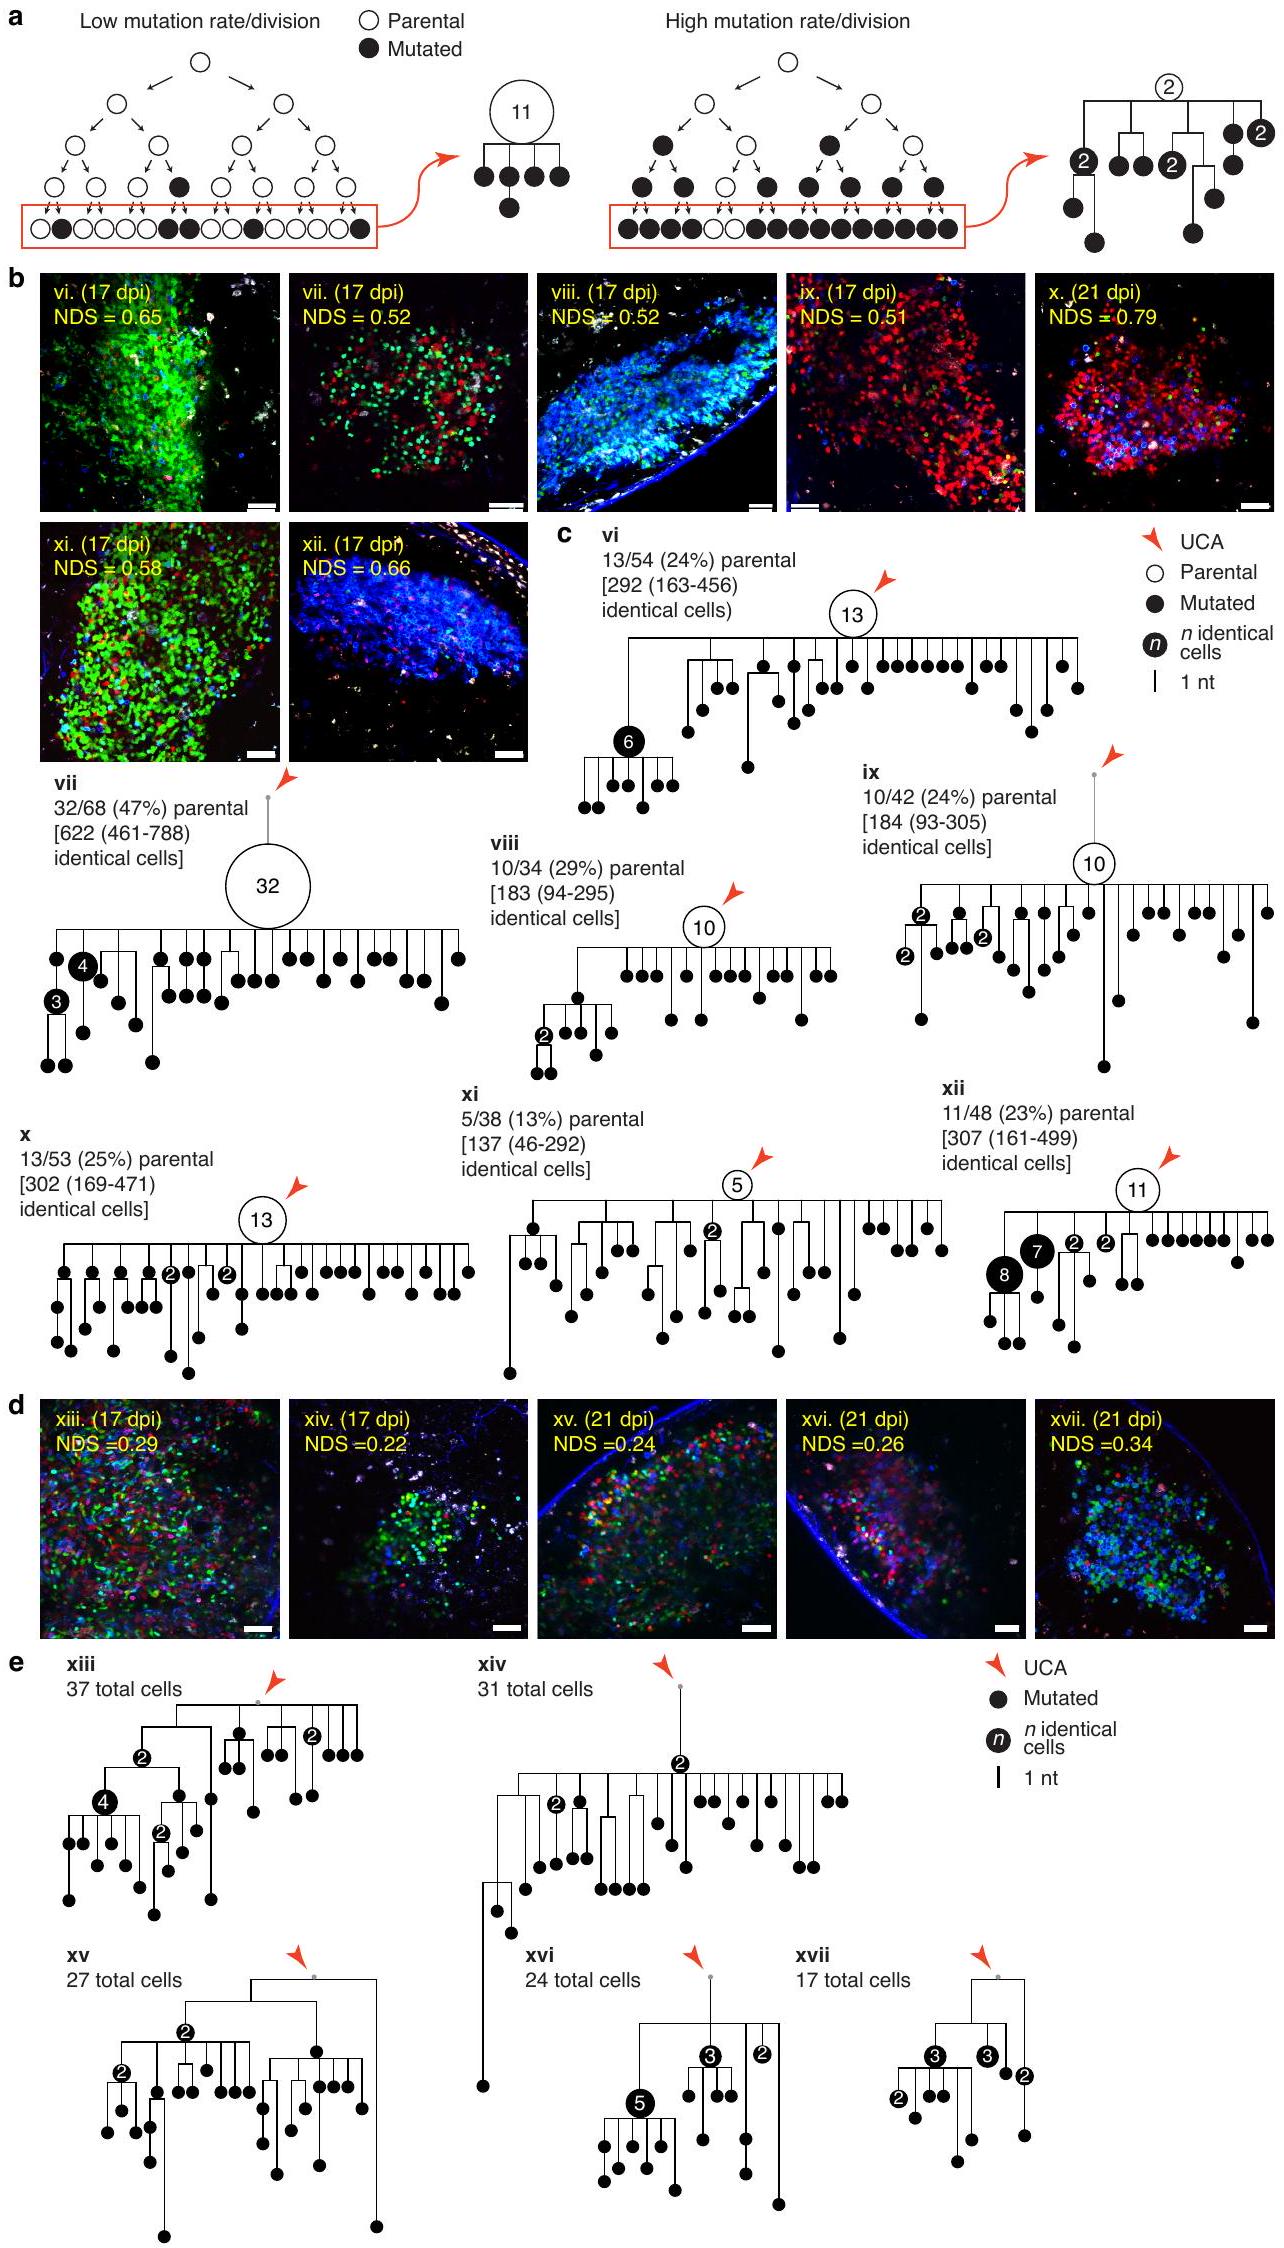
معدلات SHM. أ، صور متعددة الفوتونات لخلية واحدة ملونة تشير إلى الانفجار النسلي، تم الحصول عليها عند 17 أو 21 يومًا بعد الحقن (10-14 يومًا بعد الجرعة النهائية من التاموكسيفين). يمثل معدل الهيمنة المنظم (NDS) نسبة الخلايا التي تنتمي إلى اللون السائد، مع تعديل كثافة الخلايا الفلورية.
في الألمنيوم كعامل مساعد لتشكيل مراكز التكاثر الجرثومي (GCs)، تم تحفيز إعادة التركيب في Brainbow عن طريق العلاج بالتاموكسيفين بدءًا من اليوم الخامس بعد التطعيم (dpi) وتم مسح العقد اللمفاوية الفخذية (pLNs) التي تم جمعها في 17 أو 21 dpi بحثًا عن مراكز التكاثر الجرثومي ذات اللون الواحد مع درجة الهيمنة المنضبطة (NDS؛ مقياس لنسبة الخلايا ذات اللون السائد داخل المركز) أكبر من 0.5، مما يدل على توسع شبيه بالانفجار النسلي.
احتمالية الطفرة لكل انقسام (الشكل 1 أ من البيانات الموسعة). كانت الأنماط الوراثية السائدة المستمدة من 12 انفجارًا كلونيًا تم تسلسلها (9 من 17 يومًا بعد الإصابة و3 من 21 يومًا بعد الإصابة) تتكون بشكل موحد من هياكل تحتوي على عقد أبوية كبيرة، مع متوسط نسبة الخلايا الأبوية من
معدل الطفرة 1 لكل
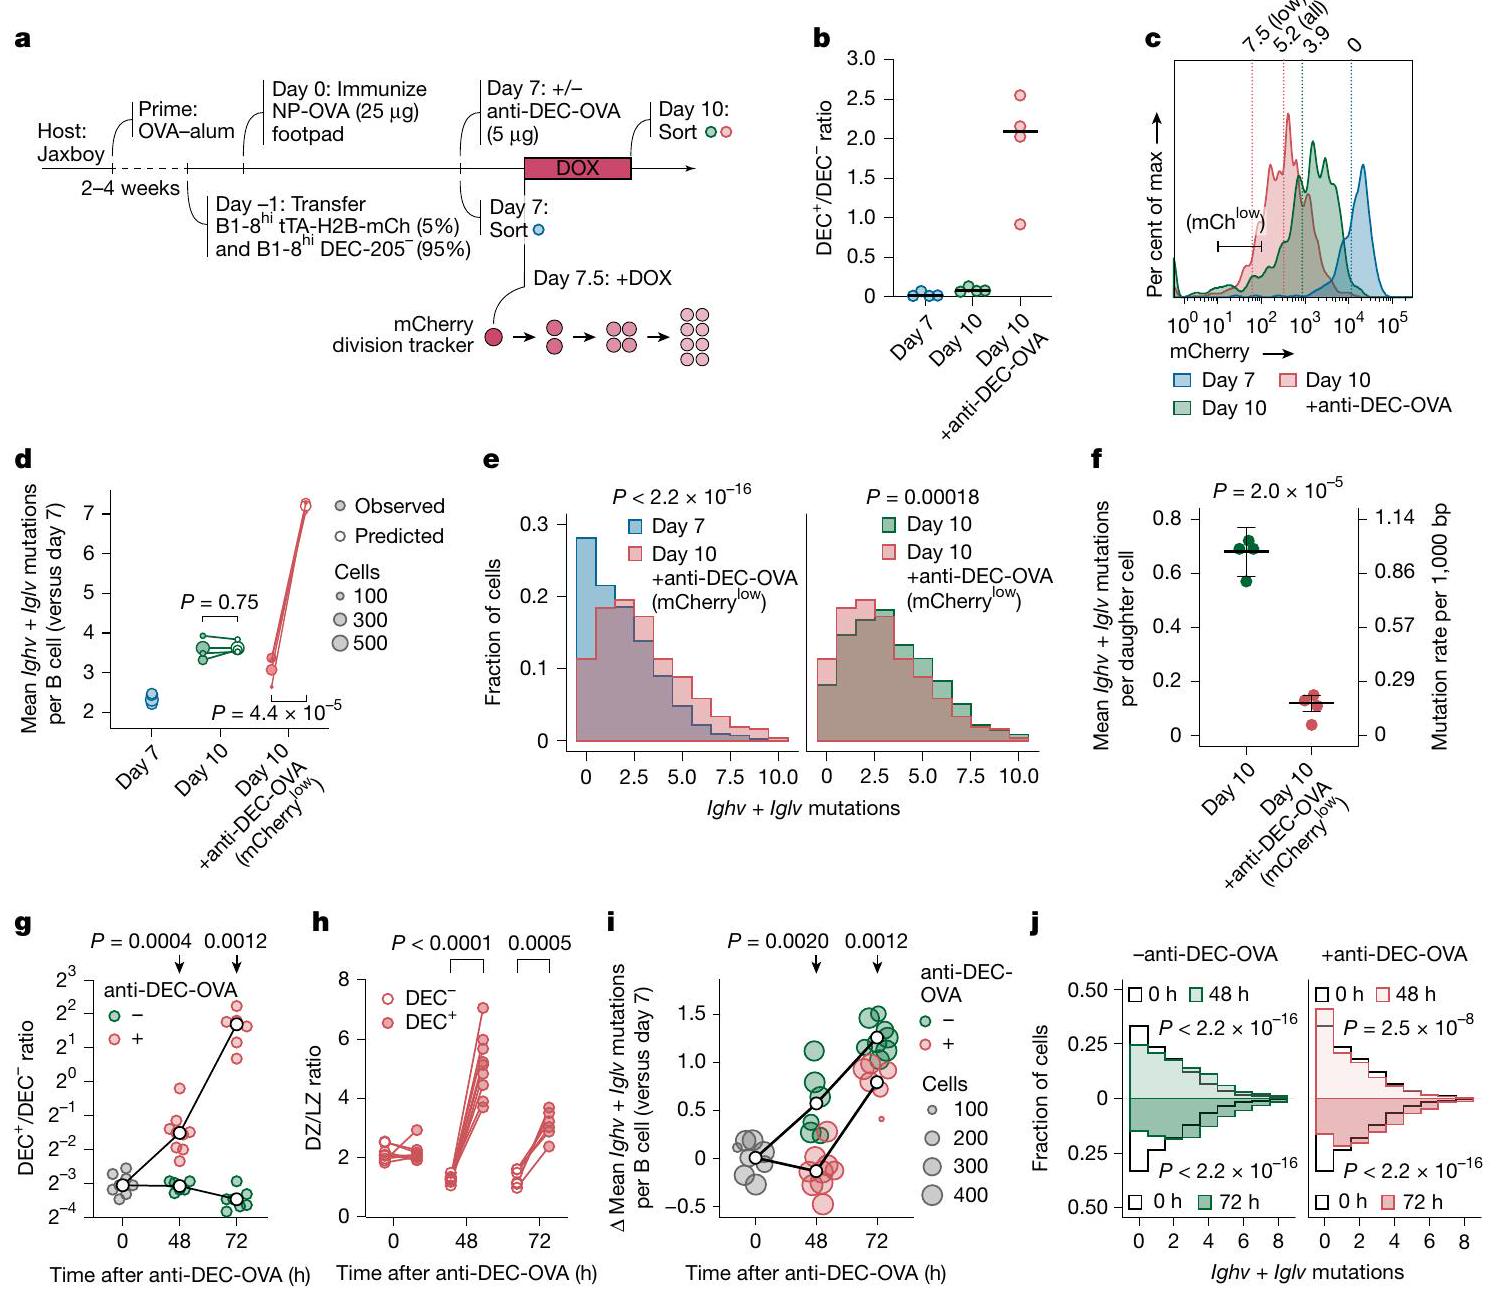
تخفيف بروتين الفلورسنت mCherry
مقارنة تعبير جينات خلايا B بعد 48 و72 ساعة من علاج anti-DEC-OVA استبعدت انخفاض تنظيم Aicda (والذي أكدناه بواسطة تحليل التدفق باستخدام تقرير اندماج AID-GFP)
معدل SHM المستنتج للفئران الفردية من د. الخطوط السوداء الأفقية تشير إلى المتوسط المرجح بالعكس للتباين مع الانحراف المعياري الذي يأخذ في الاعتبار التباينات داخل الفئران الفردية. ج، نسبة DEC-205
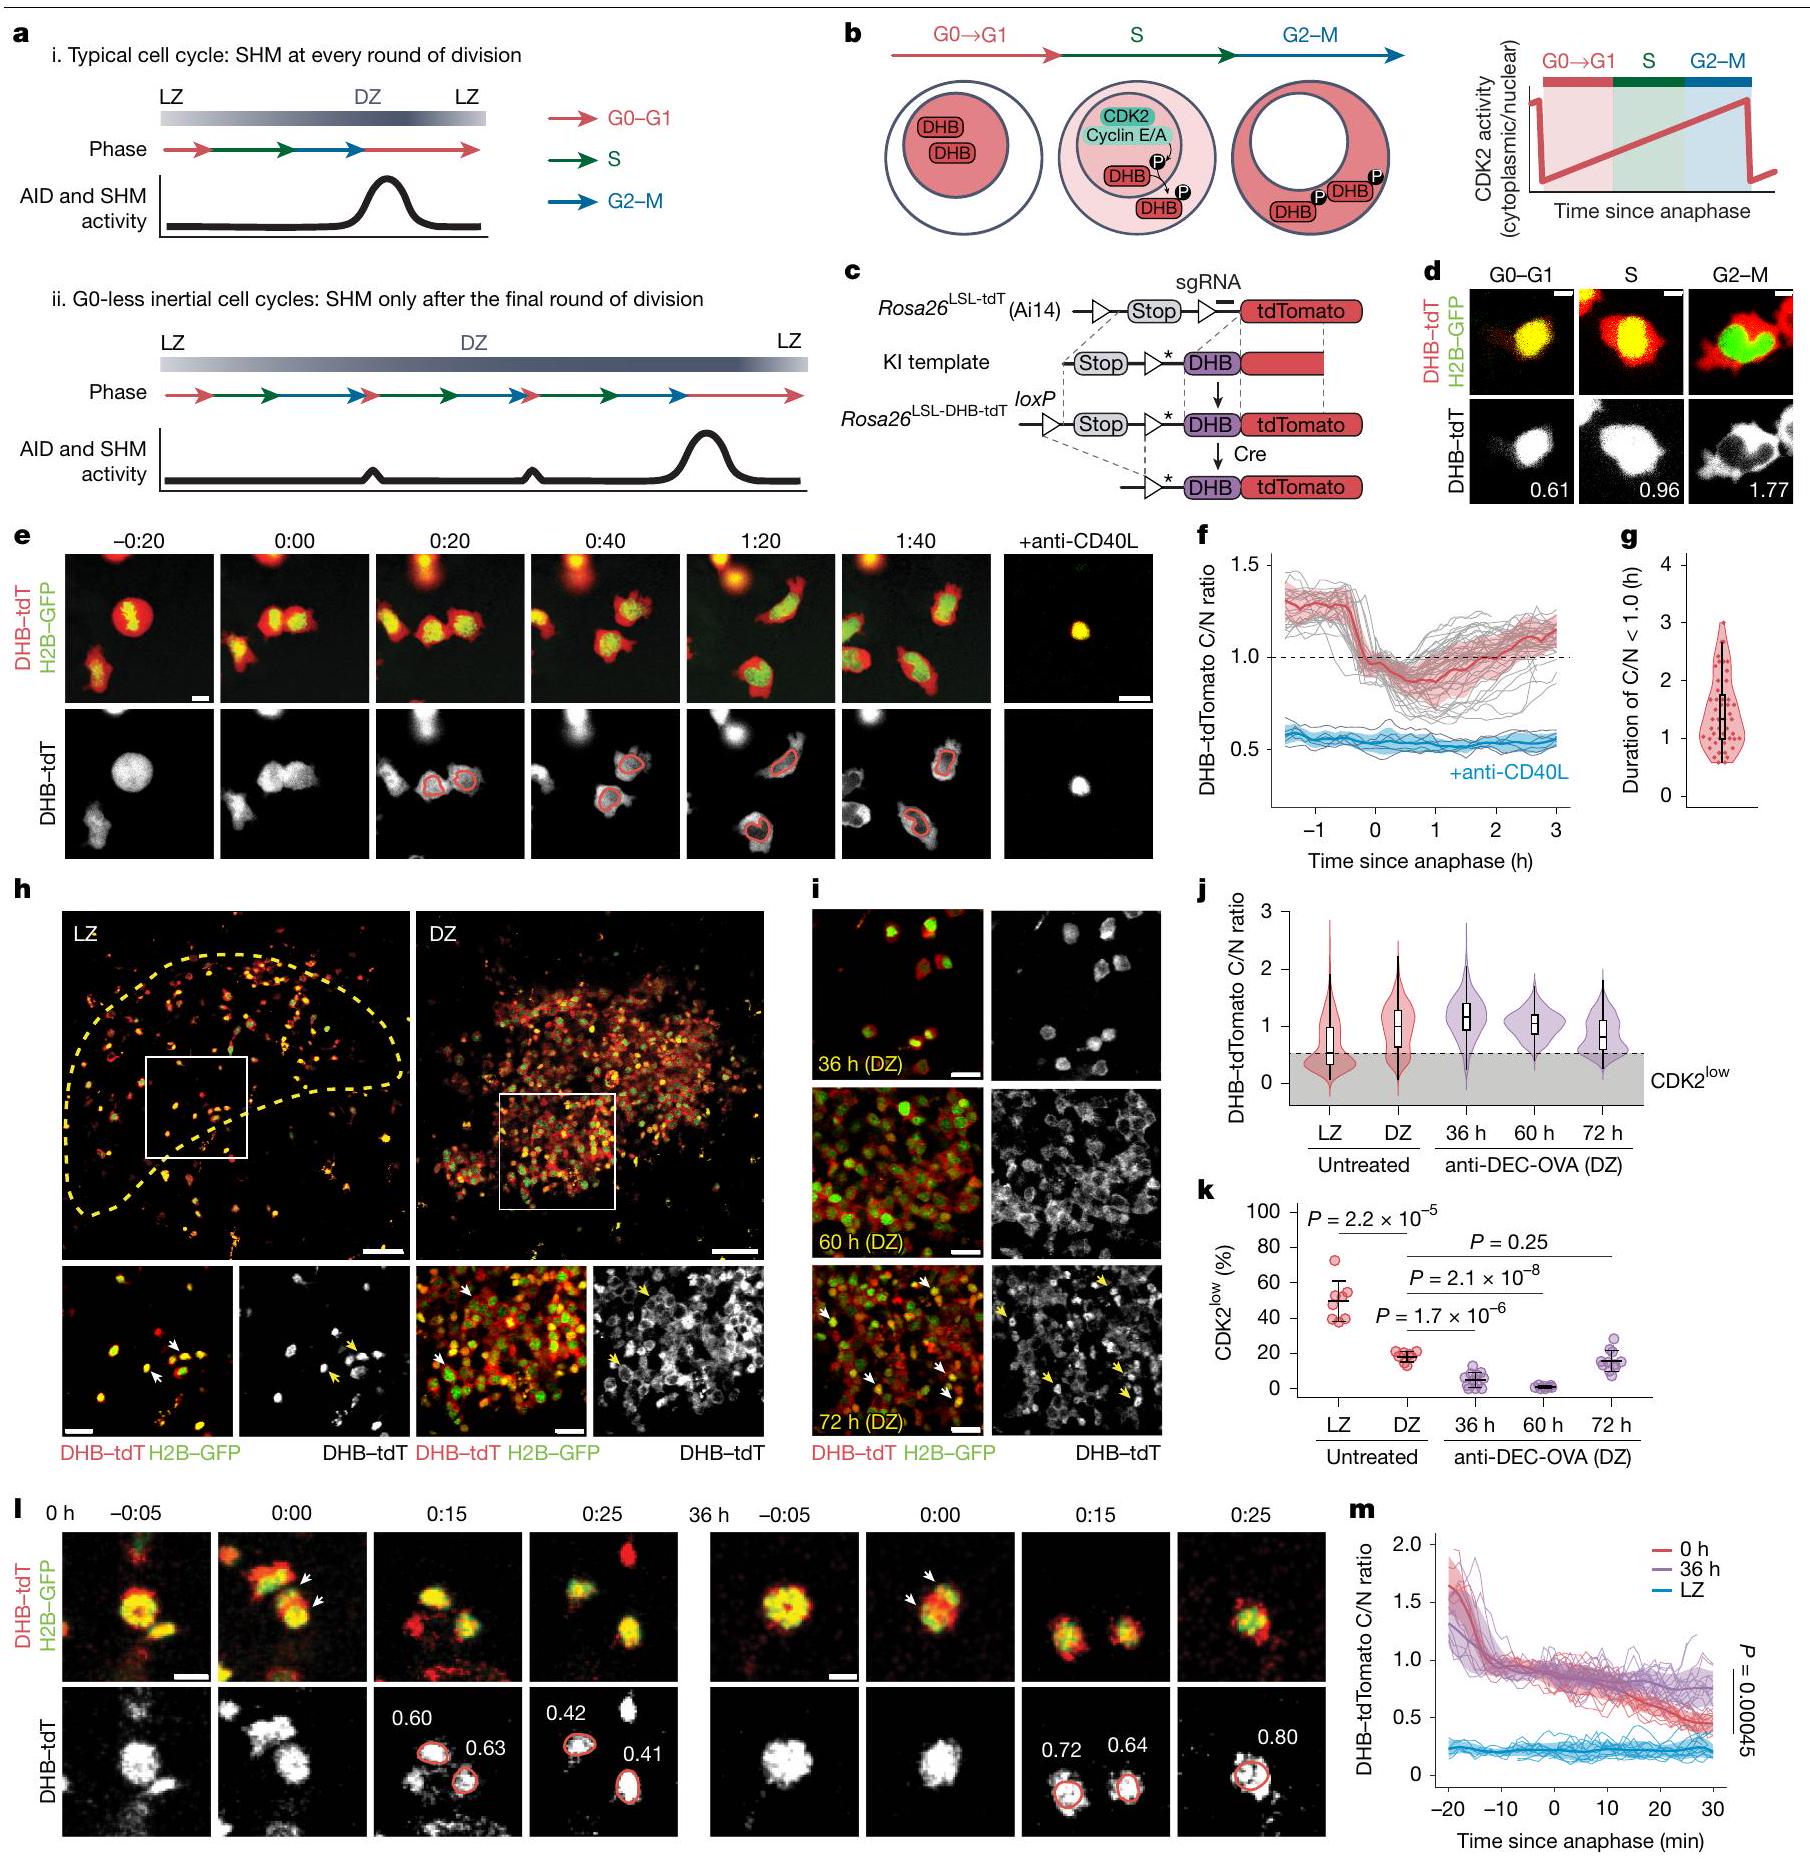
من منطقة إيغف، شرط لاستهداف المساعدات
السيكلين E، يعزز التقدم خلال المرحلة G1 وبدء المرحلة S
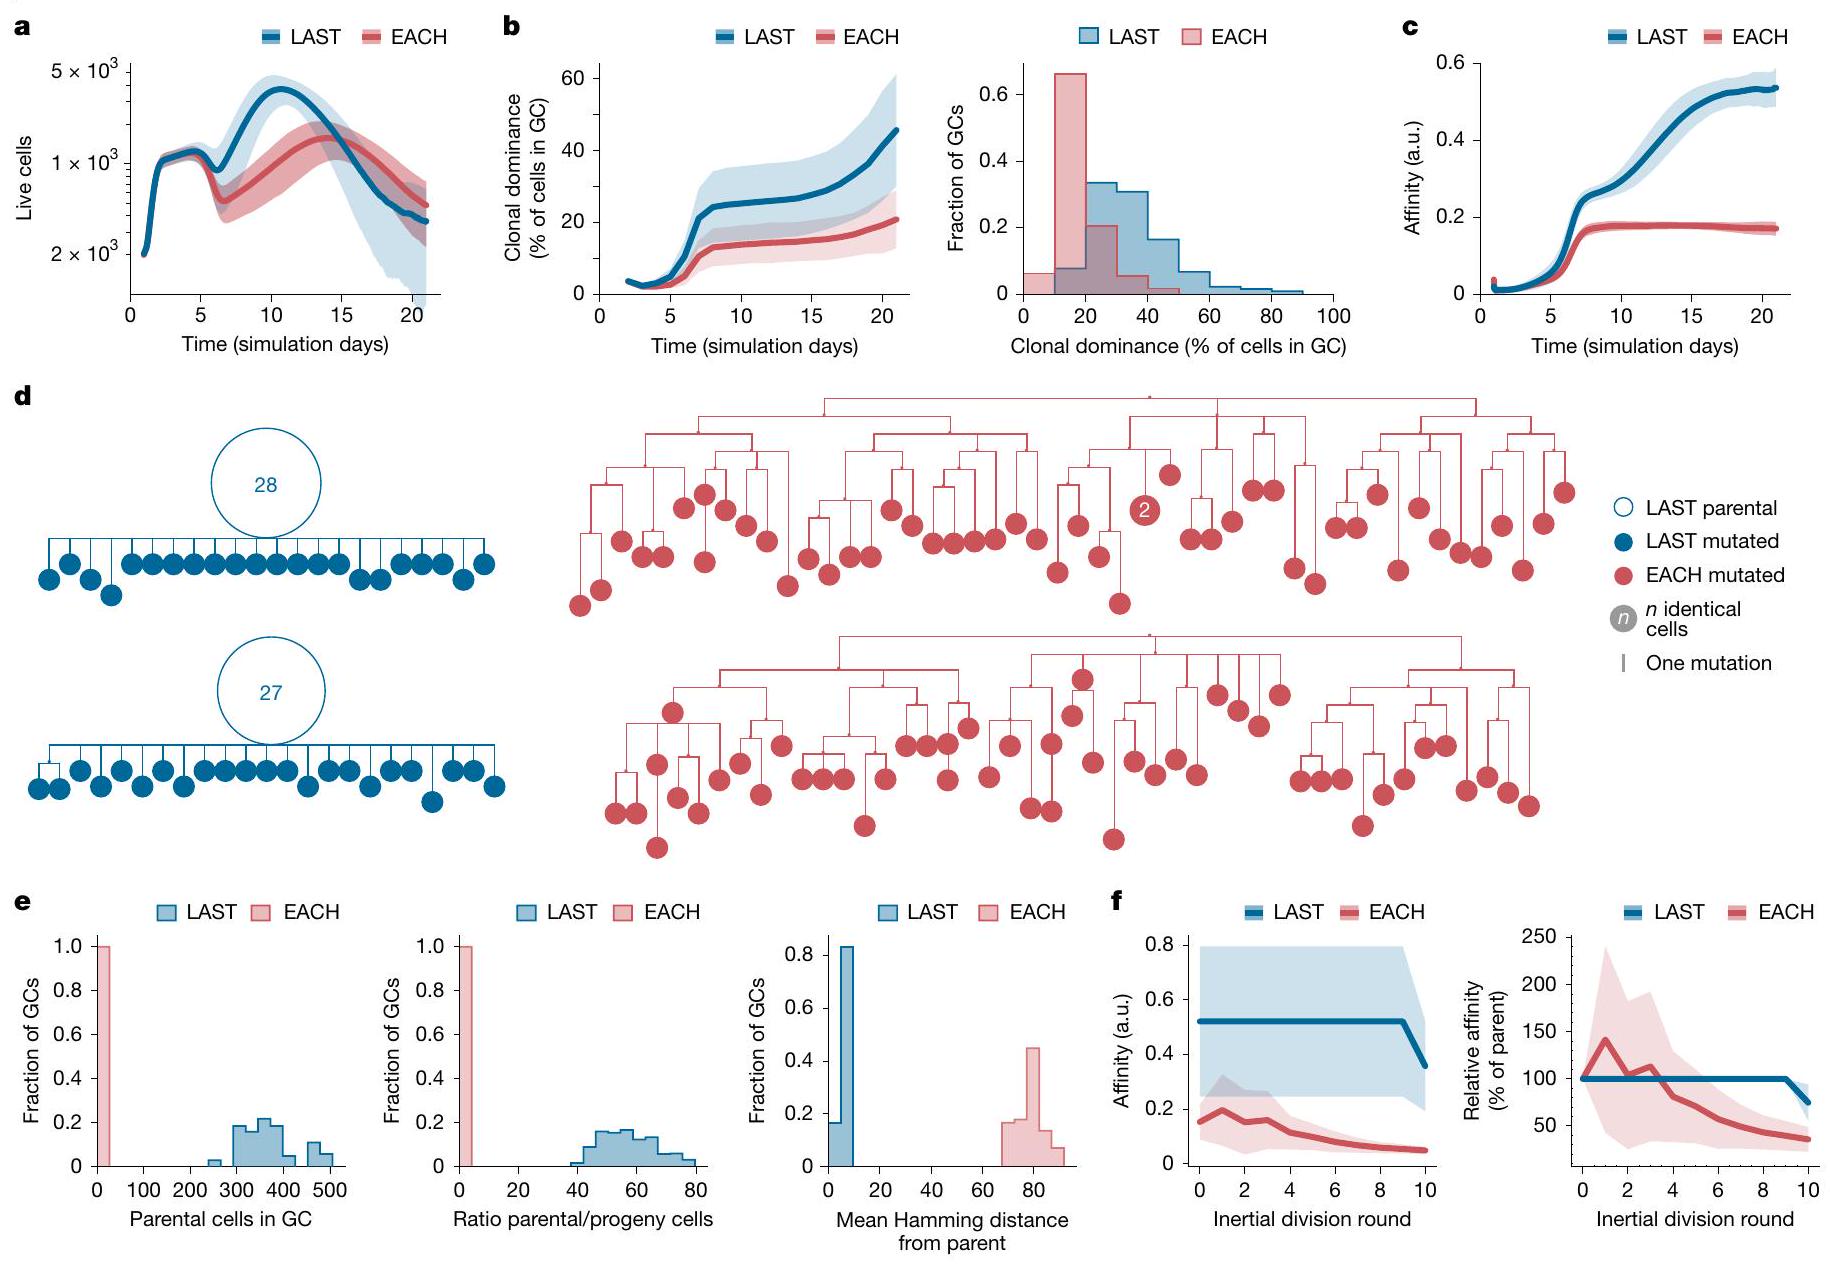
القسم قبل العودة إلى منطقة الهبوط (LAST)؛ و (ii) نموذج يتم فيه تعطيل هذه الميزة، ويتم الحفاظ على معدل SHM ثابت خلال كل جولة من تقسيم DZ (EACH). عندما تم السماح للخلايا بالتحور، تم تعيين العدد المتوقع من الطفرات في خلية ناتجة مقارنة بوالدها إلى 2.2، بحيث ينتج معدل SHM متوسط قدره 0.66 طفرة لكل جيل في LAST. قمنا بإجراء إجمالي 1,000 محاكاة لكل سيناريو؛ تم محاكاة GCs لمدة 20 يومًا بعد الاندماج الأولي (الذي يتوافق مع حوالي 23 يومًا في الجسم الحي)، وتمت إزالة GCs المتأخرة من التحليل عندما انخفض عددها إلى أقل من 200 خلية.
في ظل الظروف، تم سحب عينات من 100 خلية من كل مجموعة GC، وتم تضمين جميع الخلايا التي تنتمي إلى النسخة المتفجرة في النشوء والتطور. أظهرت نشوء LAST وجود عقد أبوية كبيرة تحتوي على خلايا متعددة ذات تسلسل متطابق، بينما كانت نشوء EACH أكثر تفرعًا وعادة ما تفتقر إلى العقد الموسعة (الشكل 5d)، مما يتطابق نوعيًا مع الأنماط الظاهرية لمجموعات GC المتفجرة وغير المتفجرة في بياناتنا التجريبية (الشكل 1b، c والشكل الممتد 1). وبناءً عليه، كان عدد الخلايا في أكبر عقدة من كل نشوء متفجر أعلى بشكل ملحوظ (193
ميكانيكياً، فإن أبسط تفسير لوجود ارتباط بين الدورة الحركية الساكنة وتخفيف SHM هو أن الوقت الإجمالي الذي تقضيه الخلية في مرحلة GO-G1 يتم تقصيره خلال التوسع الحركي، مما يسمح بوقت أقل لعمل AID على جينات الأجسام المضادة قبل بدء تكرار الحمض النووي. هذا النموذج يتماشى مع معدل التحلل البطيء لـ AID للسايتوزينات في المختبر.
تم استدعاء معدل ديناميكي من الحركة التوافقية البسيطة في خلايا B في مركز الجريبات في النماذج الرياضية السابقة بالضبط لأنه، في المحاكاة، وُجد أن تقليل احتمالات الطفرات في الخلايا ذات الألفة العالية، وهي تلك التي تنقسم أكثر، يحسن نضوج الألفة.
إن القضاء التام على SHM خلال الدورات الحركية ينتج عنه شجرات عائلية تهيمن عليها العقدة الأبوية بشكل أقوى مما لاحظناه في vivo (قارن الشكل 1b والشكل الإضافي 1c مع الشكل 5d). باستثناء التفسيرات التقنية المتعلقة بعدم الدقة في توقيت الانفجارات النسيلية بالنسبة لأخذ العينات في vivo، فإن هذا يشير إلى أن الطفرة مضغوطة بشدة ولكن قد لا تكون غائبة تمامًا خلال الدورات الحركية.
المحتوى عبر الإنترنت
- أيزن، هـ. ن. وسيسكيند، ج. و. تباينات في تقارب الأجسام المضادة خلال الاستجابة المناعية. الكيمياء الحيوية 3، 996-1008 (1964).
- ويغرت، م. ج.، تشيساري، إ. م.، يونكوفيتش، س. ج. وكوهين، م. تباين في تسلسلات سلسلة الضوء لامدا من الأجسام المضادة للفئران. الطبيعة 228، 1045-1047 (1970).
- بيريك، سي. وميلشتاين، سي. انحراف الطفرة وتغير المجموعة في نضوج الاستجابة المناعية. مراجعة المناعة 96، 23-41 (1987).
- جاكوب، ج.، كيلسوي، ج.، راجيفسكي، ك. ووايس، أ. التوليد داخل النسيلة لطفرات الأجسام المضادة في المراكز الجرثومية. ناتشر 354، 389-392 (1991).
- ميسين، ل.، إيرشينغ، ج. وفكتوريا، ج. د. ديناميات خلايا ب في المركز الجرثومي. المناعة 45، 471-482 (2016).
- شلومشيك، م. ج.، ليتوين، س. وويغرت، م. في التقدم في علم المناعة (تحرير ميلشرز، ف. وآخرون) 415-423 (سبرينغر، 1989).
- تاس، ج. م. وآخرون. تصور نضوجAffinity الأجسام المضادة في المراكز الجرثومية. ساينس 351، 1048-1054 (2016).
- فيكتورا، ج. د. وآخرون. ديناميات المركز الجرثومي التي كشفت عنها المجهر الضوئي متعدد الفوتونات مع مُبلغ فلوري قابل للتنشيط بالضوء. خلية 143، 592-605 (2010).
- ماير-هيرمان، م. وآخرون. نظرية اختيار خلايا B في المركز الجرثومي، والانقسام، والخروج. تقارير الخلايا. 2، 162-174 (2012).
- جيتلين، أ. د.، شولمان، ز. ونوسنزاويغ، م. ج. الاختيار النسلي في المركز الجرثومي من خلال التكاثر المنظم والطفرة المفرطة. الطبيعة 509، 637-640 (2014).
- كيبلر، ت. ب. و بيرلسون، أ. س. إعادة دخول دورات خلايا B المركز الجرثومي وكفاءة نضوج الألفة. مناعة. اليوم 14، 412-415 (1993).
- أوبريا، م. و بيرلسون، أ. س. الطفرة الجسدية تؤدي إلى نضوج كفاءة الارتباط عندما تعود السنتروسايتات إلى السنتروبلاستات. ج. المناعة. 158، 5155-5162 (1997).
- أوبريا، م.، فان نيمويجن، إ. و بيرلسون، أ. س. ديناميات نماذج مراكز الجراثيم ذات المرور الواحد: الآثار المترتبة على نضوج الألفة. نشرة الرياضيات الحيوية 62، 121-153 (2000).
- ماكيان، د. وآخرون. توليد تنوع الأجسام المضادة في الاستجابة المناعية لفئران BALB/c لفيروس الإنفلونزا هيماغلوتينين. وقائع الأكاديمية الوطنية للعلوم في الولايات المتحدة الأمريكية 81، 3180-3184 (1984).
- ألين، د. وآخرون. توقيت ومتطلبات وراثية ونتائج وظيفية للطفرات الهيكلية أثناء تطور خلايا B. مراجعة المناعة 96، 5-22 (1987).
- كلينشتاين، س. هـ.، لوزون، ي. و شلومشيك، م. ج. تقدير معدلات الهايبرموتيشن من بيانات الشجرة النسيلية. مجلة المناعة 171، 4639-4649 (2003).
- شلومشيك، م. ج.، واتس، ب.، ويغرت، م. ج. ولتوين، س. كلون: محاكاة حاسوبية مونت كارلو لتوسع الخلايا البائية، الطفرة الجسدية، والاختيار المدفوع بالمستضد. المواضيع الحالية في الميكروبيولوجيا والمناعة 229، 173-197 (1998).
- إيرشينغ، ج. وآخرون. تتطلب عملية اختيار المركز الجرثومي ونضوج الألفة تنظيمًا ديناميكيًا لإنزيم mTORC1. المناعة 46، 1045-1058 (2017).
- هاينزل، س. وآخرون. مؤقت انقسام يعتمد على Myc يكمل مؤقت موت الخلايا لتنظيم استجابات خلايا T وخلايا B. نات. إيمونول. 18، 96-103 (2017).
- فينكين، س.، هارتويجر، هـ.، أوليفيرا، ت. ي.، كارا، إ. إ. ونوسنزاويغ، م. س. تحدد كميات بروتين عامل النسخ MYC قدرة انقسام خلايا B في المركز الجرثومي. المناعة 51، 324-336 (2019).
- باي، ج. وآخرون. السايتوكين D3 يقود دورة الخلايا الساكنة في خلايا B في مركز الجريبات الظلامية. ج. التجريب. الطب. 218، e20201699 (2021).
- لونغ، ز.، فيليبس، ب.، رادتكي، د.، ماير-هيرمان، م. وبانارد، أ. المنافسة على إعادة التزود بالوقود بدلاً من بدء الدخول الدوري واضحة في المراكز الجرثومية. ساي. إيمونول. 7، eabm0775 (2022).
- دوغان، إ. وآخرون. طبقات متعددة من ذاكرة خلايا B مع وظائف فعالة مختلفة. نات. إيمونول. 10، 1292-1299 (2009).
- سنipperت، هـ. ج. وآخرون. توازن الكريبت المعوي ينتج عن المنافسة المحايدة بين خلايا جذعية Lgr5 التي تنقسم بشكل متماثل. خلية 143، 134-144 (2010).
- ليفيت، ج. وآخرون. استراتيجيات نقل الجينات للتعبير المركب عن البروتينات الفلورية في الجهاز العصبي. ناتشر 450، 56-62 (2007).
- ماير-هيرمان، م.، بيندر، س. س.، ميسين، ل. وفيكتورا، ج. د. محاكاة حاسوبية لتلوين Brainbow متعدد الألوان والتطور النسلي لخلايا B في المراكز الجرثومية. Front. Immunol. 9، 2020 (2018).
مقالة
- دي ويت، و. س.، ميسين، ل.، فيكتورا، ج. د.، مينيين، ف. ن. وماتسن، ف. أ. ت. استخدام وفرة الجينوتيب لتحسين الاستدلال النشوء والتطور. مول. بيول. إيفول. 35، 1253-1265 (2018).
- دي ويت، و. س. وآخرون. BDMS v0.2.0-a.2. زينودوhttps://doi.org/10.5281/zenodo.10467425 (2024).
- كازانوفاس، أ.، جاوموت، م.، باوليس، أ. ب.، أجيل، ن. وباكس، أ. P38
يفسفوريل cyclin D3 عند Thr-283 ويستهدفه للتدهور البروتوزومي. Oncogene 23، 7537-7544 (2004). - رامزاني-راد، ب.، تشين، ج.، زو، ز. وريكرت، ر. س. تتحكم السيكلين D3 في التوسع النسلي لخلايا B في مركز الجريبات الظلامية. تقارير الخلايا 33، 108403 (2020).
- كراوتش، إي. إي. وآخرون. تنظيم تعبير AID في الاستجابة المناعية. ج. إكسب. ميد. 204، 1145-1156 (2007).
- ماول، ر. و. & جيرهارت، ب. ج. AID والطفرات الهيكلية. تقدم في المناعة. 105، 159-191 (2010).
- تينغ، ج. وآخرون. MicroRNA-155 هو منظم سلبي لإنزيم إزالة الأمين السيتيديني الناتج عن التحفيز. المناعة 28، 621-629 (2008).
- دي نوا، ج. م. ونيوبرجر، م. س. الآليات الجزيئية لتحور الأجسام المضادة. مراجعة سنوية في الكيمياء الحيوية 76، 1-22 (2007).
- فينغ، ي.، سيجا، ن.، دي نوا، ج. م. ومارتن، أ. AID في تنويع الأجسام المضادة: هناك والعودة مرة أخرى. اتجاهات المناعة. 41، 586-600 (2021).
- وو، ل. وآخرون. HMCES يحمي جينات الأجسام المضادة بشكل خاص من الحذف خلال الطفرات الهيكلية. جينات التطور. 36، 433-450 (2022).
- روجيه، م. وآخرون. Fam72a يعزز إصلاح الحمض النووي المعرض للأخطاء أثناء تنويع الأجسام المضادة. ناتشر 600، 329-333 (2021).
- فنغ، ي. وآخرون. FAM72A يعارض UNG2 لتعزيز الإصلاح المسبب للطفرات خلال نضوج الأجسام المضادة. ناتشر 600، 324-328 (2021).
- تشودري، ج. وآخرون. نزع الأمين من الحمض النووي المستهدف بواسطة إنزيم تنويع الأجسام المضادة AID. ناتشر 422، 726-730 (2003).
- بيترسن، س. وآخرون. AID مطلوب للبدء
تشكيل التركيز والطفرات في مواقع تغيير الفئة. الطبيعة 414، 660-665 (2001). - شربين، ج.، يي، س. و.، سميث، أ. ل. وجولي، س. ج. إن تقييد إصلاح الحمض النووي خارج الموقع يكشف أن UNG2 يزيل اليوراسيلات الناتجة عن AID بشكل أساسي أو حصري خلال مرحلة G1. ج. تجريب. ميد. 209، 965-974 (2012).
- وانغ، ق. وآخرون. دورة الخلية تقيد نشاط إنزيم إزالة الأمين السيتيدين المستحثة بالتنشيط إلى المرحلة المبكرة من G1. ج. تجارب. ميد. 214، 49-58 (2017).
- سبنسر، س. ل. وآخرون. يتم التحكم في قرار التكاثر والركود من خلال انقسام في نشاط CDK2 عند الخروج من الانقسام الميتوزي. خلية 155، 369-383 (2013).
- هان، أ. ت.، جونز، ج. ت. & ماير، ت. التحليل الكمي لمدد مراحل دورة الخلية وتمايز PC12 باستخدام المستشعرات الحيوية الفلورية. دورة الخلية 8، 1044-1052 (2009).
- أرورا، م. وآخرون. التكيف السريع مع تثبيط CDK2 يكشف عن مرونة الدورة الخلوية الداخلية. خلية 186، 2628-2643 (2023).
- ساكاوي-ساوانو، أ. وآخرون. تصور الديناميات الزمانية المكانية لتقدم دورة الخلية متعددة الخلايا. خلية 132، 487-498 (2008).
- هادجانتاكيس، أ. ك. وبابايواننو، ف. إ. التصوير الديناميكي الحي وتتبع الخلايا باستخدام بروتين هيستون فلوري متصل في الفئران. BMC Biotechnol. 4، 33 (2004).
- نوجيما، ت. وآخرون. خلايا مركز الجراثيم B المستمدة من الزرع في المختبر تولد بشكل مختلف خلايا الذاكرة B أو خلايا البلازما في الجسم الحي. نات. كوميونيك. 2، 465 (2011).
- كوراوك، م. وآخرون. المستضدات المعقدة تحفز الاختيار النسلي المسموح به في المراكز الجرثومية. المناعة 44، 542-552 (2016).
- فيرل، د. ج.، ديغن، س. إ.، باديرا، ت. وكارول، م. س. التقاط التغير في التركيب النسلي بين مراكز الجراثيم الفردية في الفئران. إي لايف 7، e33051 (2018).
- جاكوبسن، ج. ت. وآخرون. تعبير Foxp3 بواسطة خلايا المساعدة الجريبية T في المراكز الجرثومية في المرحلة النهائية. ساينس 373، eabe5146 (2021).
- ماير-هيرمان، م. نظرية جزيئية لاختيار وانقسام خلايا B في المركز الجرثومي. تقارير الخلايا. 36، 109552 (2021).
- Larijani، م. وآخرون. AID يرتبط بالحمض النووي أحادي السلسلة بفاعلية عالية ونصف عمر معقد طويل بطريقة غير معتمدة على التسلسل. مول. سيل. بيو. 27، 20-30 (2007).
- ويلسون، ت. م. وآخرون. MSH2-MSH6 يحفز بوليميراز الحمض النووي η، مما يشير إلى دور للطفرات A:T في جينات الأجسام المضادة. ج. تجريب. ميد. 201، 637-645 (2005).
- بينا-دياز، ج. وآخرون. إصلاح عدم التطابق غير الكنسي كمصدر لعدم استقرار الجينوم في الخلايا البشرية. مول. خلية 47، 669-680 (2012).
- رونا، ج. وآخرون. دور السيكلينات من النوع D المستقل عن CDK في تنظيم إصلاح عدم تطابق الحمض النووي. مول. خلية 84، 1224-1242 (2024).
- ماير-هيرمان، م. التغلب على ثنائية الكمية والجودة في استجابات الأجسام المضادة. مجلة المناعة 193، 5414-5419 (2014).
(ج) المؤلفون 2025
طرق
C57BL/6، B6.SJL (CD45.1)، روزا26
تسمية AID-Confetti
تصوير وتحليل متعدد الفوتونات لخلايا جرانولوزا Brainbow
عزل خلايا جذرية مفردة لتحليل التدفق وفرز الخلايا
تم فرزها حسب الفهرس الخلوي الفردي على جهاز فرز BD FACSymphony S6. تم تعيين الألوان بعد الاكتساب باستخدام برنامج Diva (الإصدار 8.0.2).
نقل الخلايا المتبناة
تسلسل وتحليل VDJ على مستوى الخلية الواحدة باستخدام الألواح
تسلسل وتحليل التعبير الجيني وVDJ على مستوى الخلية الواحدة المعتمد على القطرات
أجسام مضادة موسومة بأوليجونوكليوتيد وسم فردي (HTO) لـ CD45 و MHC-I (Biolegend) لتمييز العينات قبل الفرز. تم تجميع الخلايا في أنبوب ميكروفيوج في PBS مضاف إليه
تصوير بتقنية تسريع الزمن لخلايا GCB في الثقافة
التصوير داخل الكائن الحي
تحديد نشاط CDK2
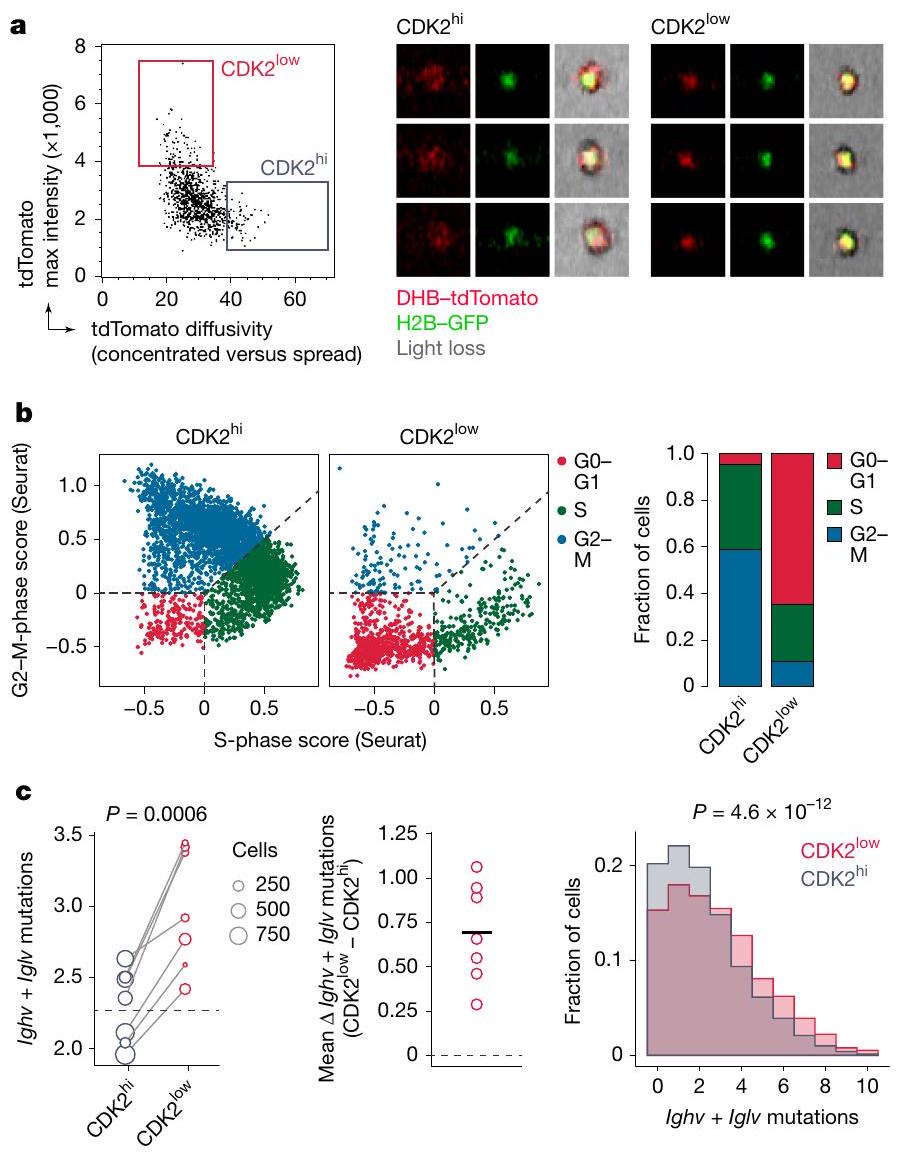
فرز الخلايا المعتمد على الصور
صبغة القابلية للحياة، ثم تم فرزها على جهاز BD S8 FACSDiscover الفرز الطيفي مع تقنية صورة BDCellView. تم فرز الخلايا بناءً على الحد الأقصى من الكثافة وانتشار فلوروسنت tdTomato، وفقًا لاستراتيجية التصفية الموضحة في الشكل 7a وb من البيانات الموسعة.
محاكاة عمليات الولادة والموت الناتجة عن الانفجار النسلي
تقدير معدلات انقسام خلايا GCB والطفرات
نموذج محاكاة GC القائم على الوكلاء
مسافة واحدة من الموضع السابق. تحدث طفرة خلايا B بعد انقسام الخلية، وفقًا لنماذج الطفرة الموضحة أدناه.
بعد الاختيار، تخضع كل خلية باء لعدد من الانقسامات،
- كل سيناريو: كل خلية ابنة تكتسب
طفرات كل انقسام. - السيناريو الأخير: فقط خلايا الابنة في الجولة الأخيرة من التكاثر تكتسب
طفرات.
لكلا السيناريوهين،تم تعيينه إلى 2.2؛ أي أن كل descendant يخضع لاثنين من الطفرات بالنسبة لوالده ولديه احتمال 0.2 لاكتساب طفرة ثالثة. تم اختياره بحيث يتطابق معدل الطفرة المتوسط مع القيمة المرصودة لـ الطفرات لكل خلية ابنة في النموذج الأخير.
لتحليل المشهد الطفري لمركز التكاثر، قمنا بترجمة مواقع فضاء الشكل إلى تسلسلات BCR. يتم تتبع الطفرات في خلايا فضاء الشكل طوال مسار تفاعل مركز التكاثر. يتم تعيين تسلسل نوكليوتيد عشوائي فريد من 300 قاعدة لكل خلية مُنتِجة، يمثل جزء Ighv من تسلسل BCR حقيقي. نظرًا لأننا قيدنا التسلسل المودل إلى جزء Ighv، فإن الطفرات في فضاء الشكل تتوافق مع استبدال نوكليوتيد عشوائي في تسلسل Ighv مع
التحليل الإحصائي
ملخص التقرير
توفر البيانات
58. إغلي، د.، روزاينس، ج.، بيركهوف، ج. وإيغان، ك. إعادة برمجة التطور بعد نقل الكروموسومات إلى الزيجوتات الفأرية الانقسامية. ناتشر 447، 679-685 (2007).
59. ويسنر، س. م.، جونز، ج. م.، هاز، د. إ. ولارجاسبادا، د. أ. نموذج ترانسجيني قابل للكبت لمرض خلايا الص mast المدفوع بجين NRAS في الفأر. بلود 106، 1054-1062 (2005).
60. حبيقة، إ. وآخرون. اختبار وظيفة الجين مبكرًا في سلالة خلايا B في فئران mb1-cre. وقائع الأكاديمية الوطنية للعلوم في الولايات المتحدة الأمريكية 103، 13789-13794 (2006).
61. شيه، ت. أ.، روديرر، م. & نوسنزاويغ، م. س. دور affinity مستقبلات المستضد في استجابات الأجسام المضادة المستقلة عن الخلايا التائية في الجسم الحي. نات. إيمونول. 3، 399-406 (2002).
62. إينابا، ك. وآخرون. توزيع الأنسجة لبروتين DEC-205 الذي يتم الكشف عنه بواسطة الأجسام المضادة وحيدة النسيلة NLDC-145: I. التعبير على الخلايا الشجرية ومجموعات أخرى من كريات الدم البيضاء في الفئران. مناعة الخلايا. 163، 148-156 (1995).
63. ماديسن، ل. وآخرون. نظام قوي وعالي الإنتاجية لتقارير كري وتوصيفه لدماغ الفأر بالكامل. نات. نيوروساينس. 13، 133-140 (2010).
مقالة
- تشين، س. وآخرون. CRISPR-READI: توليد فعال لفئران knockin بواسطة electroporation CRISPR RNP وعدوى AAV. تقرير الخلية. 27، 3780-3789 (2019).
- باسكوال، ج.، أنجليني، أ. وفيكتورا، ج. د. تحفيز الانتقاء الإيجابي لخلايا B في مراكز التكاثر عن طريق استهداف المستضد إلى DEC-205. طرق البيولوجيا الجزيئية 1291، 125-134 (2015).
- ماسلا، أ. ب.، بارترام، أ. ك.، ترسزكوفسكي، ج. م.، براون، د. ج. ونيوفيلد، ج. د. باندا سيك: مجمع نهاية مزدوج لتسلسلات إلومينا. بي إم سي بايوإنفورماتيكس 13، 31 (2012).
- لفرانك، م. ب. وآخرون. IMGT، نظام المعلومات الدولي لعلم المناعة الوراثية. أبحاث الأحماض النووية 37، D1006-D1012 (2009).
- فيكتورا، ج. د. وآخرون. تحديد خلايا مركز الجريبات البشرية في المناطق الفاتحة والداكنة وعلاقتها بالأورام اللمفاوية لبائية الخلايا البشرية. الدم 120، 2240-2248 (2012).
- ماير، إ. ف. ج. وآخرون. نافذة الغدد الليمفاوية المزمنة في الفئران لتصوير الغدد الليمفاوية داخل الجسم على المدى الطويل. بروتوكولات الطبيعة 12، 1513-1520 (2017).
- باي، ج. وآخرون. بيانات الدعم لـ ‘الصمت العابر للتغيرات المفرطة يحافظ على Affinity خلايا B خلال الانفجار النسلي’. زينودوhttps://doi.org/10.5281/zenodo. 14516289 (2025).
تم دعم نيدرساكسن من مؤسسة فولكس فاجن لمشروع ‘CAIMed – مركز ساكسونيا السفلى للذكاء الاصطناعي والأساليب السببية في الطب’ (منحة ZN4257، الممنوحة لـ M.M.-H.). كان J.P. زميل مؤسسة بيرجر من مؤسسة دامون رونيون لأبحاث السرطان. تم دعم W.S.D. من خلال زمالة في فهم الأنظمة الديناميكية ومتعددة المقاييس من مؤسسة جيمس س. مكدونيل. حصل N.S. و A.G. على تمويل من المبادرة الابتكارية للأدوية 2 (JU) بموجب اتفاقية المنحة 101007799. تتلقى JU دعمًا من برنامج أفق 2020 للبحث والابتكار التابع للاتحاد الأوروبي و EFPIA. G.D.V. و F.A.M. هما باحثان في HHMI.
معلومات إضافية
يجب توجيه المراسلات والطلبات للحصول على المواد إلى غابرييل د. فيكتورا.
معلومات مراجعة الأقران تشكر Nature المراجعين المجهولين على مساهمتهم في مراجعة هذا العمل.
معلومات إعادة الطباعة والتصاريح متاحة علىhttp://www.nature.com/reprints.
مقالة
تم استخدام تسلسلات Ighv المستخرجة من GCs في لبناء شجرة النشوء والتطور
الأشجار. لكل GC، نسبة الخلايا الأبوية والعدد الإجمالي المقدر للخلايا المتطابقة
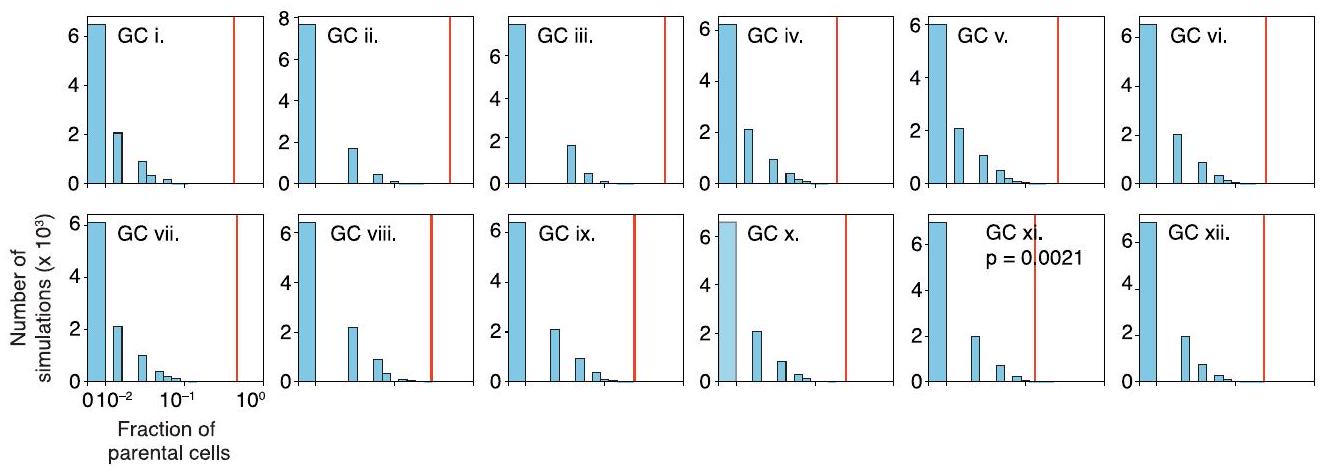
محاكاة 0.033، الأولى منها مستنسخة من الشكل 1c. تُعطى قيم P كنسبة من المحاكاة التي تتجاوز النسبة الأبوية لـ GC المرصود (الموضح كخط أحمر منقط). تُظهر القيم الوسيطة لمجموعة المحاكاة كخط أزرق. المحاكاة التي تقترب قيمتها الوسيطة أكثر من القيمة المرصودة لذلك GC مميزة باللون الأحمر. ج، النسب الأبوية الوسيطة (± نطاق الربيع الرباعي) لعمليات المسح المعلمية كما في ب لمجموعة الـ 12-GC الكاملة في الشكل 1a، b والشكل البياني الممتد 1b، c. تم استنساخ الرسم البياني لـ GC i. من الشكل 1e. تُظهر النسبة الأبوية لـ GC المرصود كخط أحمر. الأرقام تشير إلى معدل SHM المحاكى مع النسبة الأبوية الأقرب إلى ما تم ملاحظته لكل GC.
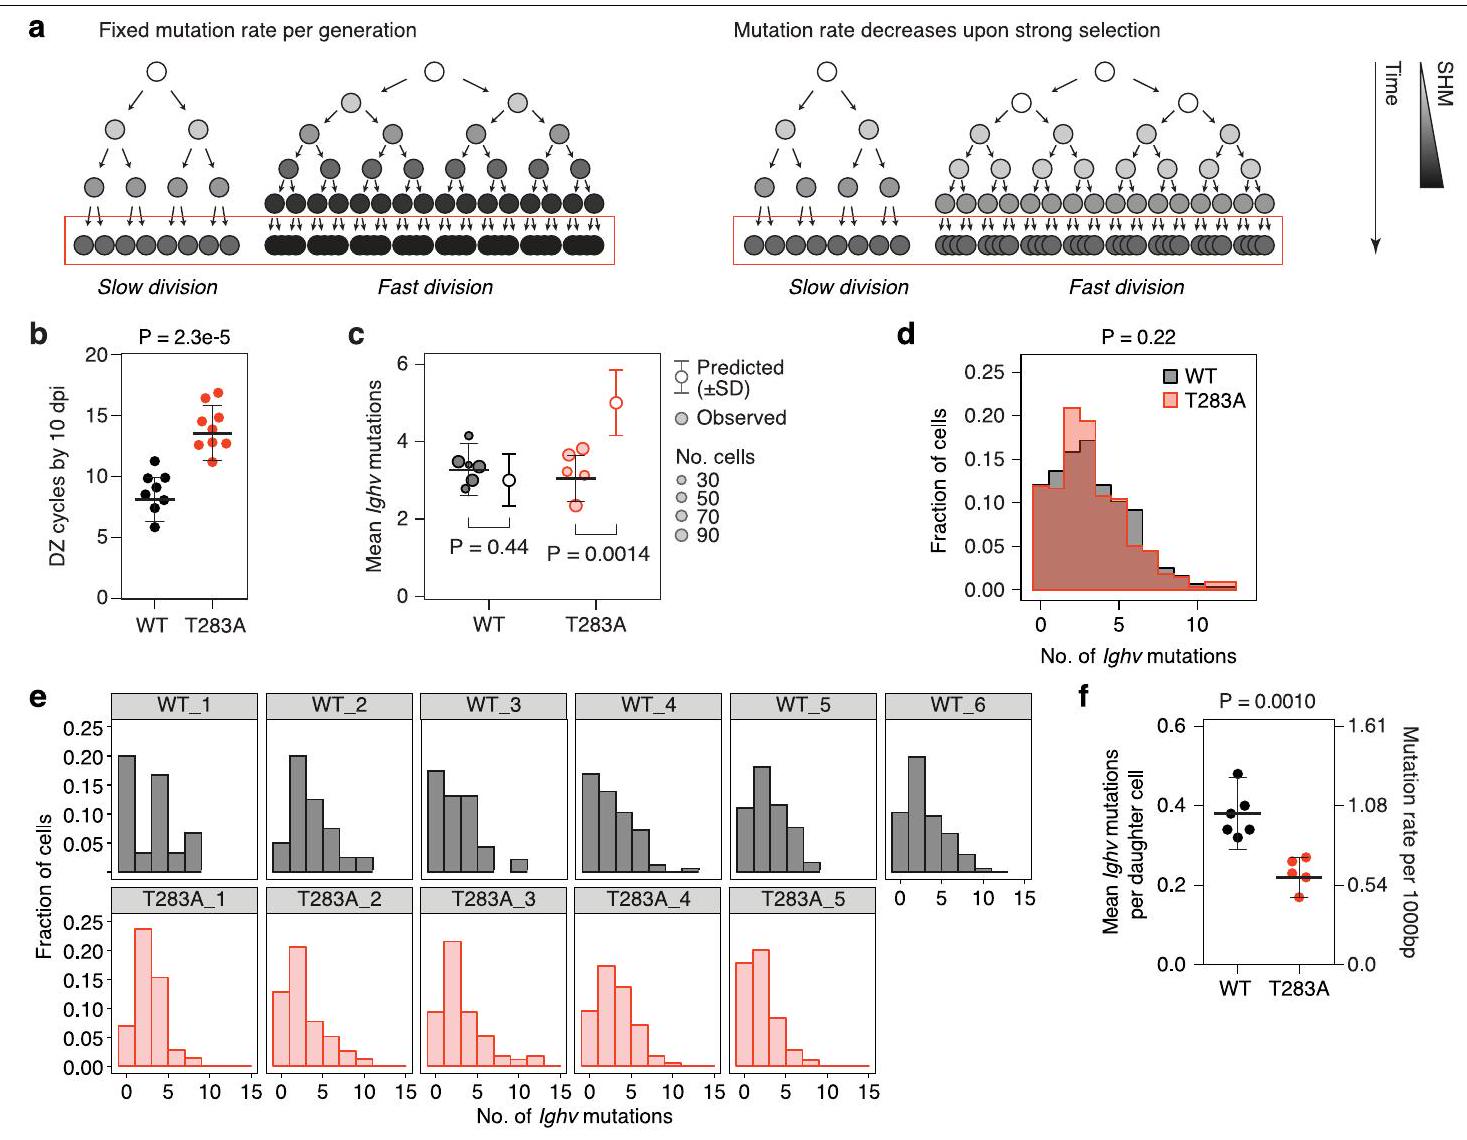
الشكل البياني الممتد 3 | معدل التحول النمائي ينخفض خلال دورة الخلايا الحركية في Ccnd3
قسم الطرق. كل رمز يمثل فأرًا واحدًا من تجربتين مستقلتين. حجم الرمز يمثل عدد الخلايا التي تم تسلسلها وتحليلها من كل فأر. المتوسط المتوقع مُوزون بالعكس للانحرافات المعيارية ويأخذ في الاعتبار التباينات داخل الفئران الفردية. قيم P هي لاختبار t لستودنت. د، توزيع الطفرات في خلايا WT وT283A المجمعة من ج. قيم P هي لاختبار t لستودنت. هـ، توزيع الطفرات في خلايا B GC من WT الفردي وCcnd3.
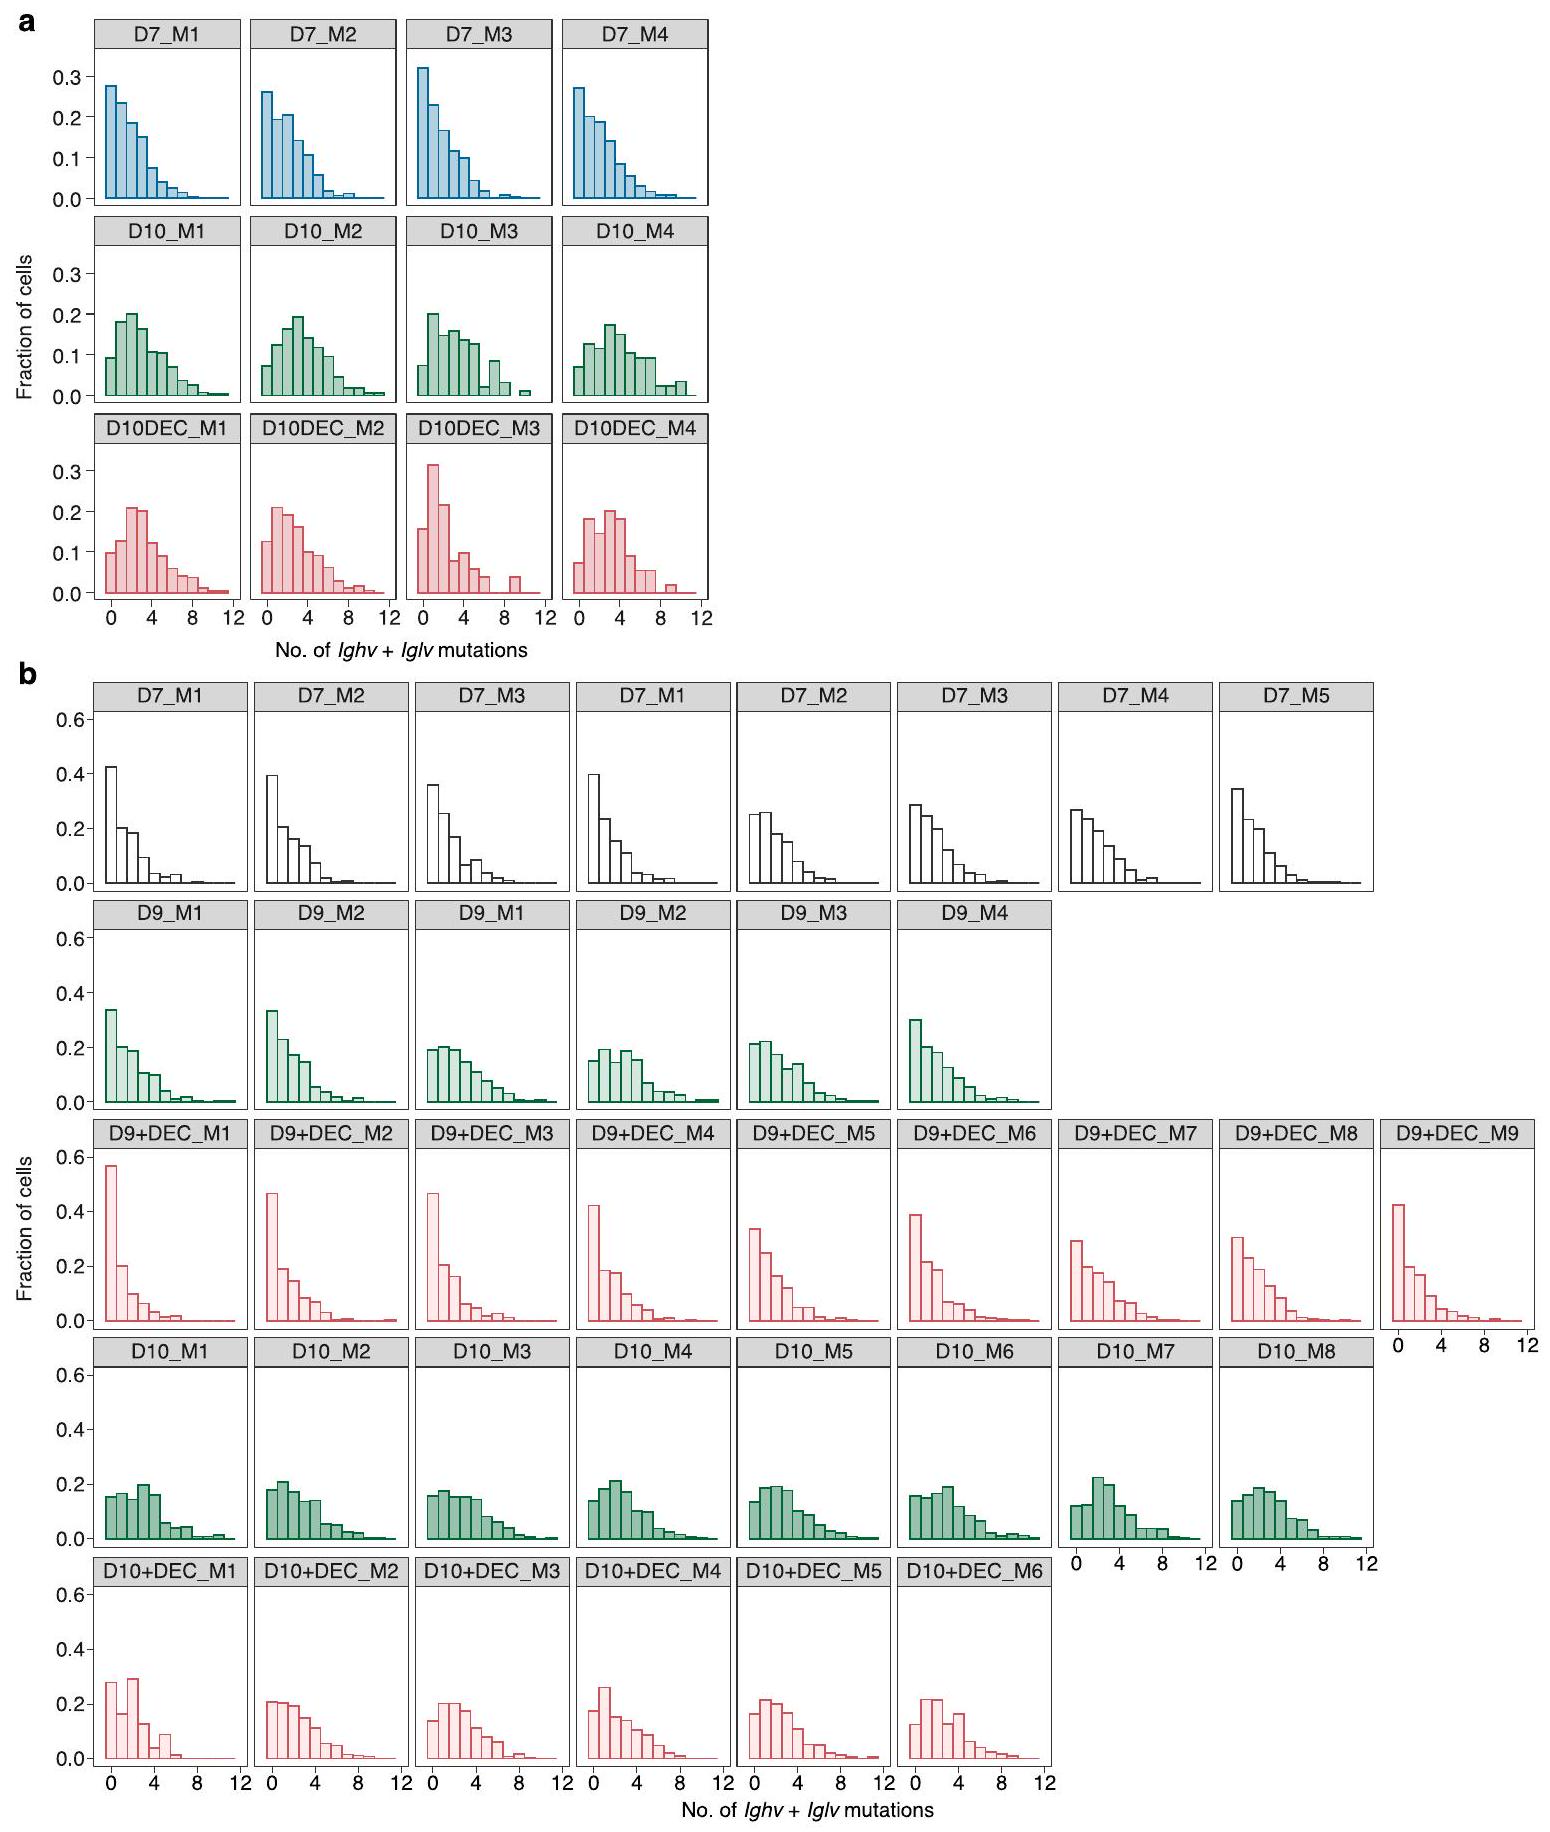
الشكل 4 من البيانات الموسعة | بيانات عدد الطفرات مقسمة حسب الفأر.
طفرة في DEC-
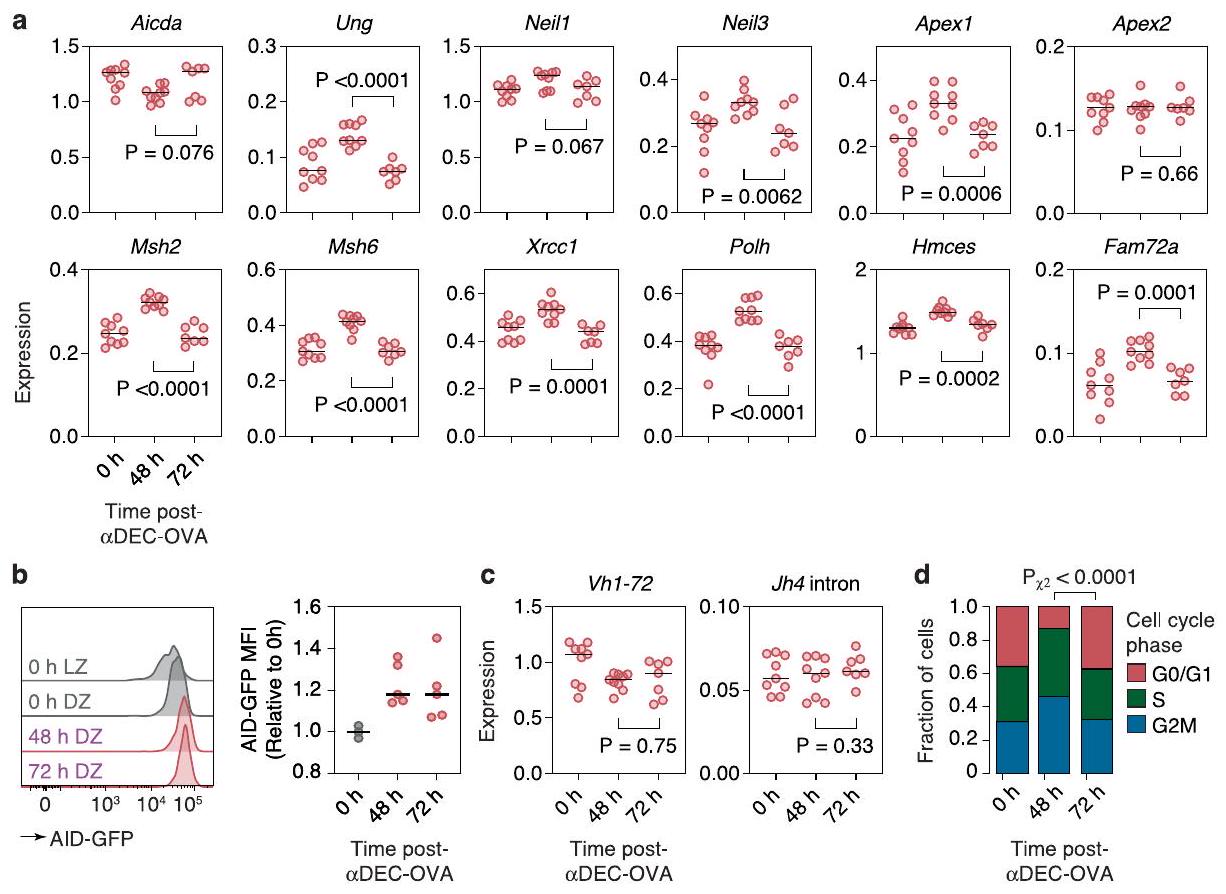
العلاج. يسار، هيستوجرامات تمثيلية؛ يمين، قياس 2-4 عينات لكل نقطة زمنية. كل رمز يمثل فأراً واحداً. ج، الكشف عن mRNA Vh1-72 (الذي يشفر السلسلة الثقيلة لبروتين B1-8
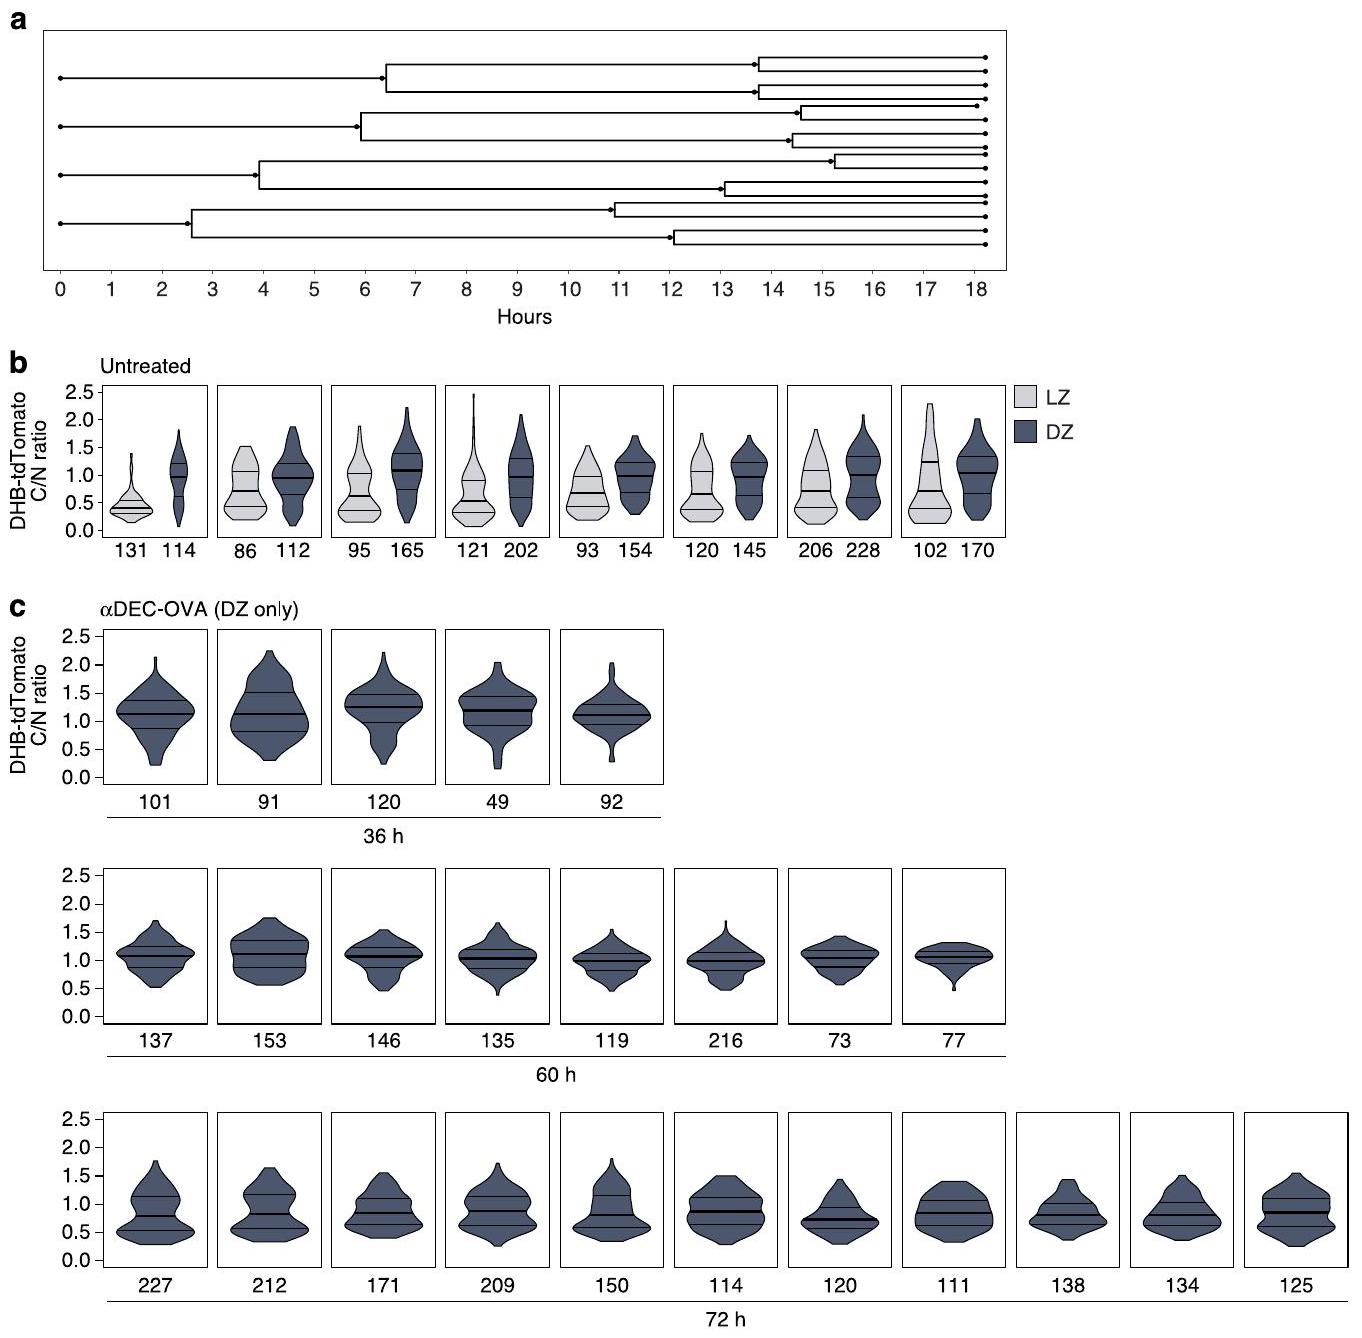
تم تحديد عدد الخلايا لكل GC أدناه لكل كمان. البيانات المجمعة موضحة في الشكل 3j. ج، مخططات كمان لنسبة C/N لـ DHB-tdTomato في خلايا B من DZ داخل GCs بعد 36 أو 60 أو 72 ساعة من علاج anti-DEC-OVA، مقسمة حسب GC الفردي ومعروضة مع الوسيط ونطاق الربع. يتم الإشارة إلى عدد الخلايا التي تم تسلسلها أدناه لكل كمان. البيانات المجمعة موضحة في الشكل 3j.
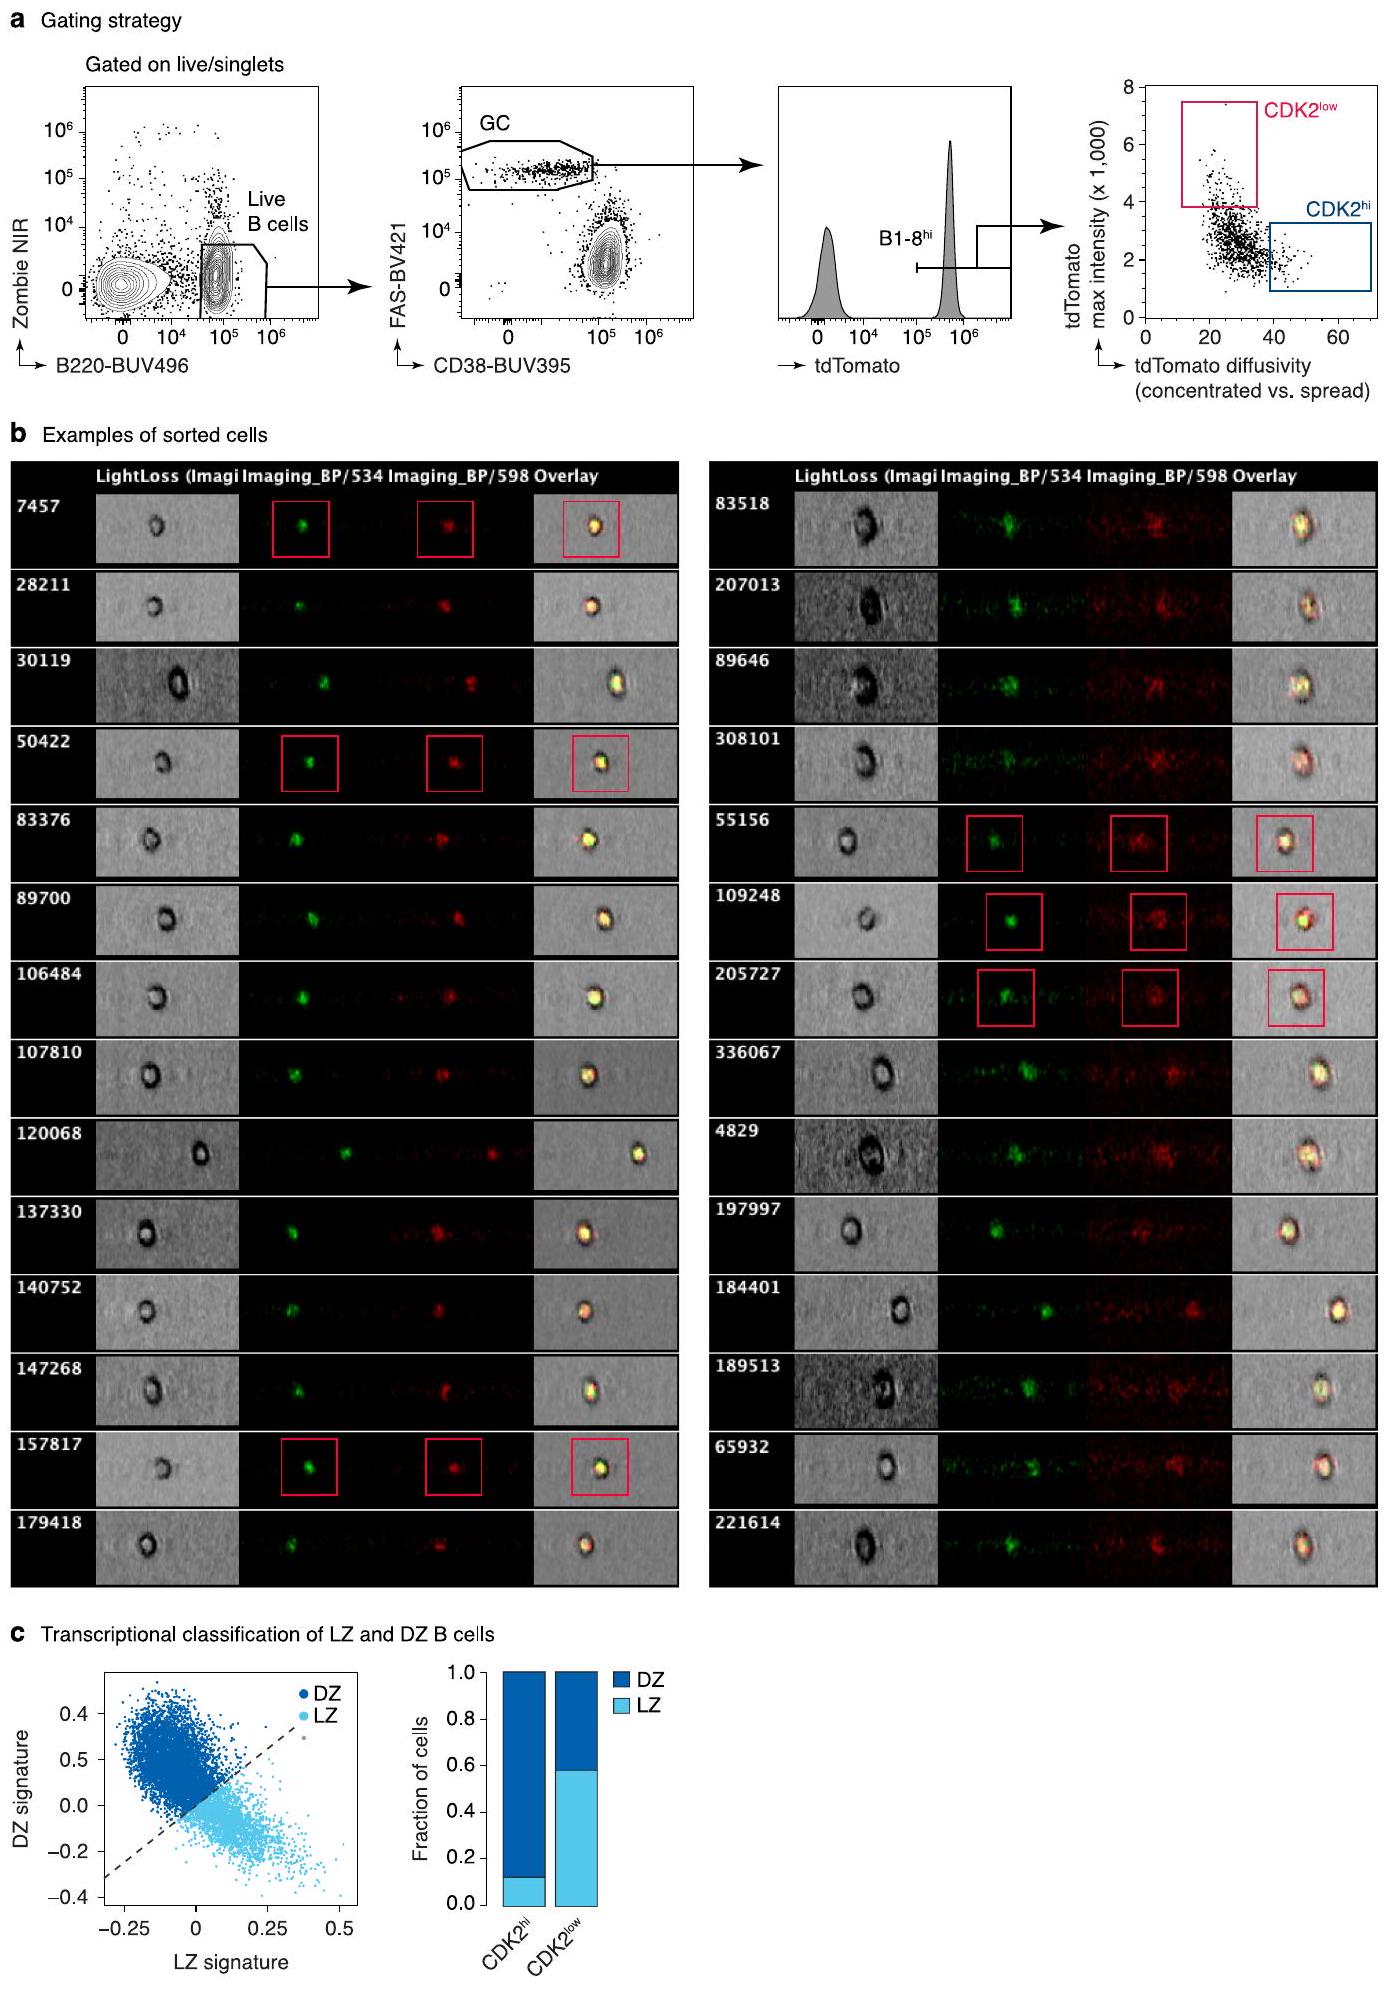
أمثلة على صور CDK2 المرتبة
| أجسام مضادة | استنساخ | فلوروفور | التخفيف النهائي | شركة | رقم الكتالوج |
| B220 | RA3-6B2 | BV785 | 1:400 | بيوليجند | ١٠٣٢٤٦ |
| TCRب | H57-597 | APC-Cy7 | 1:400 | إنفيتروجين | ٤٧-٥٩٦١-٨٢ |
| CD38 | 90/CD38 | PerCP-Cy5.5 | 1:400 | بي دي بيوساينس | 17-0381-82 |
| فاس/CD95 | جو2 | PE/Cy7 | 1:800 | بي دي بيوساينس | 557653 |
| فاس/CD95 | جو2 | بي في 421 | 1:800 | بي دي بيوساينس | 562633 |
| جي إل 7 | GL7 | أليكسا فلور 647 | 1:400 | بي دي بيوساينس | 561529 |
| CXCR4 | 2B11 | التربية البدنية | 1:100 | إنفيتروجين | 12-9991-82 |
| CD86 | جي إل-1 | AF488 | 1:400 | بيوليجند | ١٠٥٠١٨ |
| CD45.1 | A20 | BUV395 | 1:400 | بي دي بيوساينس | 565212 |
| CD45.2 | ١٠٤ | APC | 1:400 | بيوليجند | ١٠٩٨١٤ |
محفظة الطبيعة
ملخص التقرير
الإحصائيات
غير متوفر
□

□
اختبار(ات) الإحصاء المستخدمة وما إذا كانت أحادية الجانب أو ثنائية الجانب
يجب أن تُوصف الاختبارات الشائعة فقط بالاسم؛ وصف التقنيات الأكثر تعقيدًا في قسم الطرق.
□
□
□
□
□ لتحليل بايزي، معلومات حول اختيار القيم الأولية وإعدادات سلسلة ماركوف مونت كارلو
□ لتصميمات هرمية ومعقدة، تحديد المستوى المناسب للاختبارات والتقارير الكاملة عن النتائج
□ تقديرات أحجام التأثير (مثل حجم تأثير كوهين)
تحتوي مجموعتنا على الإنترنت حول الإحصائيات لعلماء الأحياء على مقالات تتناول العديد من النقاط المذكورة أعلاه.
تم التأكيد
□
اختبار(ات) الإحصاء المستخدمة وما إذا كانت أحادية الجانب أو ثنائية الجانب
وصف لجميع المتغيرات المشتركة التي تم اختبارها
ل،
تحتوي مجموعة الويب الخاصة بنا حول الإحصائيات لعلماء الأحياء على مقالات حول العديد من النقاط المذكورة أعلاه.
البرمجيات والشيفرة
جمع البيانات
لم يتم استخدام كود جمع البيانات في هذه الدراسة
تحليل البيانات
تم رسم الرسوم البيانية باستخدام R (الإصدار 4.3.1)، وتم تنسيقها في Adobe Illustrator CS. تم إجراء الاختبارات الإحصائية في R (الإصدار 4.3.1). تم تحليل بيانات تدفق الخلايا باستخدام FlowJo الإصدار 10. استخدمت التحليلات الحاسوبية لبيانات تسلسل RNA على مستوى الخلية الواحدة CellRanger الإصدار 6.0.1، 7.0.1، و8.0.1؛ وR الإصدار 4.3.1. الكود الذي ينفذ محاكاة عمليات ولادة-موت الانفجارات النسيلية المستخدمة في الشكل 1 متاح فيhttps://github.com/WSDeWitt/aid-sim. تم تقديم الوصف الكامل لنموذج محاكاة GC القائم على الوكلاء المستخدم في الشكل 4 في النص التكميلي. تم إجراء تحليل تسلسل Igh باستخدام PANDASeq v.2.11 و HighVQUEST v. 1.6.9 و GCtree (deWitt et. al. 2018).
بيانات
معلومات السياسة حول توفر البيانات
- رموز الانضمام، معرفات فريدة، أو روابط ويب لمجموعات البيانات المتاحة للجمهور
- وصف لأي قيود على توفر البيانات
- بالنسبة لمجموعات البيانات السريرية أو بيانات الطرف الثالث، يرجى التأكد من أن البيان يتماشى مع سياستنا
البحث الذي يتضمن مشاركين بشريين، بياناتهم، أو مواد بيولوجية
| التقارير عن الجنس والنوع الاجتماعي | غير متوفر |
| التقارير عن العرق أو الإثنية أو غيرها من المجموعات الاجتماعية ذات الصلة | غير متوفر |
| خصائص السكان | غير متوفر |
| التوظيف | غير متوفر |
| رقابة الأخلاقيات | غير متوفر |
التقارير المتخصصة في المجال
علوم الحياة
العلوم السلوكية والاجتماعية
العلوم البيئية والتطورية والبيئية
لنسخة مرجعية من الوثيقة بجميع الأقسام، انظرnature.com/documents/nr-reporting-summary-flat.pdf
تصميم دراسة علوم الحياة
| حجم العينة | لم تُستخدم أي طرق إحصائية لتحديد حجم العينة. كانت أعداد الفئران لكل مجموعة ضمن كل تجربة مستقلة محدودة بالأعداد المستخدمة عادة في هذا المجال. تم إجراء تجربة خط الخلايا مرتين مع تكرارات فنية ثلاثية، كما هو المعتاد في مثل هذه الاختبارات. |
| استبعاد البيانات | بالنسبة للبيانات المعروضة في الشكل 4، تم جمع عينة بحجم GC صغير ولكن تم استبعادها من التحليل. |
| استنساخ | تم إجراء التجارب عدة مرات بشكل مستقل، كما هو موضح في أساطير الأشكال. |
| التوزيع العشوائي | تم استخدام فئران من نفس القمامة للتحكم في تأثيرات القمامة والقفص والعمر. تم تقسيم الفئران بشكل عشوائي (على الرغم من عدم وجود إجراء عشوائي محدد) بين المجموعات التجريبية. |
| عمى | لم يكن الباحثون معزولين عن المجموعة التجريبية، حيث أن معظم القراءات (مثل شدة الفلورسنت في FACS) ليست ذات طابع شخصي. |
التقارير عن مواد وأنظمة وطرق محددة
غير متوفر
مشارك في الدراسة
- الأجسام المضادة
□ علم الحفريات وعلم الآثار
الحيوانات وغيرها من الكائنات الحية
□ البيانات السريرية
□ البحث الثنائي الاستخدام الذي يثير القلق
□ نباتات
□ تسلسل ChIP
□ قياس التدفق الخلوي
□ التصوير العصبي القائم على الرنين المغناطيسي
الأجسام المضادة
| الأجسام المضادة المستخدمة | انظر الجدول البياني الموسع 1. |
| التحقق | جميع الأجسام المضادة تم التحقق منها على مواقع الشركات المصنعة. |
| خطوط خلايا حقيقية النواة | |
| معلومات السياسة حول خطوط الخلايا والجنس والنوع في البحث | |
| مصدر(s) خط الخلايا | تم توفير خلايا التغذية NB-21.2D9 بواسطة ج. كيلسوي (جامعة ديوك) |
| المصادقة | تم استخدام خطوط الخلايا فقط لغرض الحفاظ على خلايا B المناعية في الثقافة، والتي تم تأكيد نجاحها وفقًا للبيانات التجريبية. لم يتم إجراء أي مصادقة إضافية بخلاف ما تم توفيره من المصدر الأصلي. |
| تلوث الميكوبلازما | لم يتم اختبار خطوط الخلايا بعد استلامها من المصدر الأصلي ولكن تم استخدامها بأعداد تمرير منخفضة.
|
| الخطوط التي يتم التعرف عليها بشكل خاطئ بشكل شائع (انظر سجل ICLAC) | لم يتم استخدام خطوط خلوية يتم التعرف عليها بشكل خاطئ بشكل شائع. |
الحيوانات وغيرها من الكائنات البحثية
| الحيوانات المخبرية | تم استخدام ذكور وإناث الفئران البالغة التي تتراوح أعمارها بين 5-12 أسبوعًا من سلالة C57BL/6J. انظر قسم ‘الفئران’ في الطرق لمزيد من التفاصيل. تم إيواء الفئران في
|
| الحيوانات البرية | لم تتضمن الدراسة حيوانات برية. |
| التقارير عن الجنس | تم استخدام كلا الجنسين من الفئران طوال الدراسة. لم تُلاحظ أي اختلافات ملحوظة بين الجنسين. |
| عينات تم جمعها من الميدان | لم تتضمن الدراسة عينات تم جمعها من الميدان. |
| رقابة الأخلاقيات | تمت الموافقة على جميع البروتوكولات من قبل لجان رعاية واستخدام الحيوانات في جامعة روكفلر (رقم البروتوكول 22058-H). |
| يرجى ملاحظة أنه يجب أيضًا تقديم معلومات كاملة حول الموافقة على بروتوكول الدراسة في المخطوطة. | |
النباتات
| مخزونات البذور | تقرير عن مصدر جميع مخزونات البذور أو المواد النباتية الأخرى المستخدمة. إذا كان ذلك مناسبًا، يرجى ذكر مركز مخزون البذور ورقم الفهرس. إذا تم جمع عينات نباتية من الحقل، يرجى وصف موقع الجمع، التاريخ وإجراءات أخذ العينات. | ||
| أنماط جينية نباتية جديدة | وصف الطرق التي تم من خلالها إنتاج جميع الأنماط الجينية النباتية الجديدة. يشمل ذلك تلك التي تم إنشاؤها من خلال الأساليب الجينية المتحولة، وتحرير الجينات، والطفرات المعتمدة على المواد الكيميائية/الإشعاع، والتهجين. بالنسبة لخطوط الجينات المتحولة، وصف طريقة التحويل، وعدد الخطوط المستقلة التي تم تحليلها، والجيل الذي أجريت عليه التجارب. بالنسبة لخطوط تحرير الجينات، وصف المحرر المستخدم، والتسلسل الداخلي المستهدف للتحرير، وتسلسل RNA الدليل المستهدف (إذا كان ذلك مناسبًا) وكيفية عمل المحرر. | ||
| المصادقة |
|
المؤامرات
توضح تسميات المحاور العلامة والفلوركروم المستخدم (مثل CD4-FITC).
المقاييس على المحاور واضحة تمامًا. قم بتضمين الأرقام على المحاور فقط للرسم البياني في أسفل اليسار من المجموعة (المجموعة هي تحليل للعلامات المتطابقة).
جميع الرسوم البيانية هي رسوم بيانية متساوية الارتفاع مع نقاط شاذة أو رسوم بيانية بالألوان الزائفة.
تم توفير قيمة عددية لعدد الخلايا أو النسبة المئوية (مع الإحصائيات).
المنهجية
| تحضير العينة | تم عزل الخلايا من العقد اللمفاوية عن طريق الطحن باستخدام مدقات ميكروية disposable (Axygen) في
|
| آلة | BD FACSSymphony A5 لقياس التدفق الخلوي، BD FACSymphony S6 لفرز الخلايا، BD FACSDiscover S8 للفرز القائم على الصور |
| برمجيات | برنامج FlowJo الإصدار 10 |
| وفرة تجمع الخلايا | تم إجراء فرز الخلايا لتسلسل RNA أحادي الخلية باستخدام كروميم. تم تأكيد وفرة مجموعة الخلايا من خلال قياس أوليغو الوسم المستخدم لتحديد عينات وأنواع خلايا مختلفة. |
| استراتيجية البوابة | تم تحديد جميع السكان الإيجابيين والسالبين من خلال التعويض مع ضوابط أحادية اللون. من أجل الفرز والتحليل، تم أولاً تحديد جميع اللمفاويات بناءً على SSC-A مقابل FSC-A، تليها بوابتين أحاديتين (FSC-H مقابل FSC-A و SSC-H مقابل SSC-A). بالنسبة لبوابة GC، تم تحديد الخلايا على أنها B220+، TCRb-، CD38-، وFas+. استراتيجية البوابة لفرز الخلايا المعتمد على الصور موضحة في الشكل 6a من البيانات الموسعة. |
مختبر ديناميات اللمفاويات، جامعة روكفلر، نيويورك، نيويورك، الولايات المتحدة الأمريكية. قسم المناعة النظامية، مركز هيلمهولتز لأبحاث العدوى، براونشفايغ، ألمانيا.
مركز الدراسات في الفيزياء وعلم الأحياء، جامعة روكفلر، نيويورك، نيويورك، الولايات المتحدة الأمريكية. قسم علوم الجينوم، جامعة واشنطن، سياتل، واشنطن، الولايات المتحدة الأمريكية. معهد هوارد هيوز الطبي، نيويورك، نيويورك، الولايات المتحدة الأمريكية. برنامج البيولوجيا الحاسوبية، مركز فريد هاتشينسون لأبحاث السرطان، سياتل، واشنطن، الولايات المتحدة الأمريكية. معهد هوارد هيوز الطبي، سياتل، واشنطن، الولايات المتحدة الأمريكية.
قسم الإحصاءات، جامعة واشنطن، سياتل، واشنطن، الولايات المتحدة الأمريكية. مركز ساكسونيا السفلى للذكاء الاصطناعي والأساليب السببية في الطب (CAIMed)، هانوفر، ألمانيا.
ساهم هؤلاء المؤلفون بالتساوي: نيكلاس شوان، برتراند أوتينو-لوفلر، ويليام س. ديويت، أمار غارغ. البريد الإلكتروني: victora@rockefeller.edu
DOI: https://doi.org/10.1038/s41586-025-08687-8
PMID: https://pubmed.ncbi.nlm.nih.gov/40108454
Publication Date: 2025-03-19
Transient silencing of hypermutation preserves B cell affinity during clonal bursting
Received: 15 April 2024
Accepted: 22 January 2025
Published online: 19 March 2025
Open access
Abstract
In the course of antibody affinity maturation, germinal centre (GC) B cells mutate their immunoglobulin heavy- and light-chain genes in a process known as somatic hypermutation (SHM)
marked selective sweeps-which we termed clonal bursts-in which the descendants of a single B cell take over an entire 2,000 -cell GC structure in a matter of days
To resolve this apparent conflict, we began by examining the mutational patterns of clonal bursts at single-GC resolution. To this end, we used Aicda
SHM rates. a, Multiphoton images of single-coloured GCs indicative of clonal bursting, obtained at 17 or 21 dpi (10-14 days after the final dose of tamoxifen). The normalized dominance score (NDS) represents the fraction of cells belonging to the dominant colour, adjusted for fluorescent cell density
in alum adjuvant to form GCs, triggered Brainbow recombination by treatment with tamoxifen starting on day 5 post-immunization (dpi) and scanned popliteal lymph nodes (pLNs) collected at 17 or 21 dpi for single-coloured GCs with a normalized dominance score (NDS; a measure of the proportion of cells of the dominant colour within the GC) greater than 0.5 , indicative of clonal-burst-like expansion
mutational probability per division (Extended Data Fig.1a). Dominant phylogenies derived from the 12 sequenced clonal bursts ( 9 from 17 dpi and 3 from 21 dpi ) consisted uniformly of structures with large parental nodes, with an average fraction of parental cells of
mutation rate of 1 per
dilution of mCherry fluorescent protein
A comparison of B cell gene expression at 48 and 72 h after anti-DEC-OVA treatment ruled out downregulation of Aicda (which we confirmed by flow cytometry using an AID-GFP fusion reporter
f, Inferred SHM rate for individual mice from d. Horizontal black lines indicate inverse variance-weighted mean with s.d. accounting for variances within individual mice.g, Ratio of DEC-205
of the Ighv region, a requirement for AID targeting
cyclin E, promotes progression through G1 and S-phase initiation
division before returning to the LZ (LAST); and (ii) a model in which this feature is disabled, and SHM is kept at a constant rate during each round of DZ division (EACH). When cells were allowed to mutate, the expected number of mutations in a descendant cell compared to its parent was set to 2.2, so as to yield an average SHM rate of 0.66 mutations per generation in LAST. We performed a total of 1,000 simulations for each scenario;GCs were simulated for 20 days after initial coalescence (corresponding to approximately 23 days in vivo), and late GCs were removed from analysis when they contracted to fewer than 200 cells.
conditions, samples of 100 cells were drawn from each GC, and all cells belonging to the bursting clone were included in the phylogeny. LAST phylogenies exhibited large parental nodes containing multiple cells with identical sequence, whereas EACH phylogenies were more branched and generally lacked expanded nodes (Fig.5d), qualitatively matching the phenotypes of bursting and non-bursting GCs in our experimental data (Fig. 1b,c and Extended Data Fig. 1). Accordingly, the number of cells in the largest node of each bursting phylogeny was notably higher (193
Mechanistically, the simplest explanation for an association between inertial cycling and dampened SHM would be that the total time a cell spends in the GO-G1 phase is shortened during inertial expansion, allowing less time for AID to act on Ig genes before the onset of DNA replication. Such a model is in agreement with the relatively slow rate of AID deamination of cytosines in vitro
A dynamic rate of SHM in GC B cells had been invoked in previous mathematical models precisely because, in silico, reducing mutational probabilities in high-affinity cells, which are those that divide the most, was found to improve affinity maturation
completely eliminating SHM during inertial cycles yields phylogenies that are more strongly dominated by the parental node than are those we observed in vivo (compare Fig. 1b and Extended Data Fig. 1c to Fig. 5d). Barring technical explanations related to imprecisions in the timing of clonal bursts in relation to sampling in vivo, this suggests that mutation is strongly suppressed but may not be entirely absent during inertial cycling.
Online content
- Eisen, H. N. & Siskind, G. W. Variations in affinities of antibodies during the immune response. Biochemistry 3, 996-1008 (1964).
- Weigert, M. G., Cesari, I. M., Yonkovich, S. J. & Cohn, M. Variability in the lambda light chain sequences of mouse antibody. Nature 228, 1045-1047 (1970).
- Berek, C. & Milstein, C. Mutation drift and repertoire shift in the maturation of the immune response. Immunol. Rev. 96, 23-41 (1987).
- Jacob, J., Kelsoe, G., Rajewsky, K. & Weiss, U. Intraclonal generation of antibody mutants in germinal centres. Nature 354, 389-392 (1991).
- Mesin, L., Ersching, J. & Victora, G. D. Germinal center B cell dynamics. Immunity 45, 471-482 (2016).
- Shlomchik, M. J., Litwin, S. & Weigert, M. in Progress in Immunology (eds Melchers, F. et al.) 415-423 (Springer, 1989).
- Tas, J. M. et al. Visualizing antibody affinity maturation in germinal centers. Science 351, 1048-1054 (2016).
- Victora, G. D. et al. Germinal center dynamics revealed by multiphoton microscopy with a photoactivatable fluorescent reporter. Cell 143, 592-605 (2010).
- Meyer-Hermann, M. et al. A theory of germinal center B cell selection, division, and exit. Cell Rep. 2, 162-174 (2012).
- Gitlin, A. D., Shulman, Z. & Nussenzweig, M. C. Clonal selection in the germinal centre by regulated proliferation and hypermutation. Nature 509, 637-640 (2014).
- Kepler, T. B. & Perelson, A. S. Cyclic re-entry of germinal center B cells and the efficiency of affinity maturation. Immunol. Today 14, 412-415 (1993).
- Oprea, M. & Perelson, A. S. Somatic mutation leads to efficient affinity maturation when centrocytes recycle back to centroblasts. J. Immunol. 158, 5155-5162 (1997).
- Oprea, M., van Nimwegen, E. & Perelson, A. S. Dynamics of one-pass germinal center models: implications for affinity maturation. Bull. Math. Biol. 62, 121-153 (2000).
- McKean, D. et al. Generation of antibody diversity in the immune response of BALB/c mice to influenza virus hemagglutinin. Proc. Natl Acad. Sci. USA 81, 3180-3184 (1984).
- Allen, D. et al. Timing, genetic requirements and functional consequences of somatic hypermutation during B-cell development. Immunol. Rev. 96, 5-22 (1987).
- Kleinstein, S. H., Louzoun, Y. & Shlomchik, M. J. Estimating hypermutation rates from clonal tree data. J. Immunol. 171, 4639-4649 (2003).
- Shlomchik, M. J., Watts, P., Weigert, M. G. & Litwin, S. Clone: a Monte-Carlo computer simulation of B cell clonal expansion, somatic mutation, and antigen-driven selection. Curr. Top. Microbiol. Immunol. 229, 173-197 (1998).
- Ersching, J. et al. Germinal center selection and affinity maturation require dynamic regulation of mTORC1 kinase. Immunity 46, 1045-1058 (2017).
- Heinzel, S. et al. A Myc-dependent division timer complements a cell-death timer to regulate T cell and B cell responses. Nat. Immunol. 18, 96-103 (2017).
- Finkin, S., Hartweger, H., Oliveira, T. Y., Kara, E. E. & Nussenzweig, M. C. Protein amounts of the MYC transcription factor determine germinal center B cell division capacity. Immunity 51, 324-336 (2019).
- Pae, J. et al. Cyclin D3 drives inertial cell cycling in dark zone germinal center B cells. J. Exp. Med. 218, e20201699 (2021).
- Long, Z., Phillips, B., Radtke, D., Meyer-Hermann, M. & Bannard, O. Competition for refueling rather than cyclic reentry initiation evident in germinal centers. Sci. Immunol. 7, eabm0775 (2022).
- Dogan, I. et al. Multiple layers of B cell memory with different effector functions. Nat. Immunol. 10, 1292-1299 (2009).
- Snippert, H. J. et al. Intestinal crypt homeostasis results from neutral competition between symmetrically dividing Lgr5 stem cells. Cell 143, 134-144 (2010).
- Livet, J. et al. Transgenic strategies for combinatorial expression of fluorescent proteins in the nervous system. Nature 450, 56-62 (2007).
- Meyer-Hermann, M., Binder, S. C., Mesin, L. & Victora, G. D. Computer simulation of multi-color Brainbow staining and clonal evolution of B cells in germinal centers. Front. Immunol. 9, 2020 (2018).
Article
- DeWitt, W. S., Mesin, L., Victora, G. D., Minin, V. N. & Matsen, F. A. T. Using genotype abundance to improve phylogenetic inference. Mol. Biol. Evol. 35, 1253-1265 (2018).
- DeWitt, W. S. et al. BDMS v0.2.0-a.2. Zenodo https://doi.org/10.5281/zenodo.10467425 (2024).
- Casanovas, O., Jaumot, M., Paules, A. B., Agell, N. & Bachs, O. P38
phosphorylates cyclin D3 at Thr-283 and targets it for proteasomal degradation. Oncogene 23, 7537-7544 (2004). - Ramezani-Rad, P., Chen, C., Zhu, Z. & Rickert, R. C. Cyclin D3 governs clonal expansion of dark zone germinal center B cells. Cell Rep. 33, 108403 (2020).
- Crouch, E. E. et al. Regulation of AID expression in the immune response. J. Exp. Med. 204, 1145-1156 (2007).
- Maul, R. W. & Gearhart, P. J. AID and somatic hypermutation. Adv. Immunol. 105, 159-191 (2010).
- Teng, G. et al. MicroRNA-155 is a negative regulator of activation-induced cytidine deaminase. Immunity 28, 621-629 (2008).
- Di Noia, J. M. & Neuberger, M. S. Molecular mechanisms of antibody somatic hypermutation. Annu. Rev. Biochem. 76, 1-22 (2007).
- Feng, Y., Seija, N., Di Noia, J. M. & Martin, A. AID in antibody diversification: there and back again. Trends Immunol. 41, 586-600 (2021).
- Wu, L. et al. HMCES protects immunoglobulin genes specifically from deletions during somatic hypermutation. Genes Dev. 36, 433-450 (2022).
- Rogier, M. et al. Fam72a enforces error-prone DNA repair during antibody diversification. Nature 600, 329-333 (2021).
- Feng, Y. et al. FAM72A antagonizes UNG2 to promote mutagenic repair during antibody maturation. Nature 600, 324-328 (2021).
- Chaudhuri, J. et al. Transcription-targeted DNA deamination by the AID antibody diversification enzyme. Nature 422, 726-730 (2003).
- Petersen, S. et al. AID is required to initiate
focus formation and mutations at sites of class switching. Nature 414, 660-665 (2001). - Sharbeen, G., Yee, C. W., Smith, A. L. & Jolly, C. J. Ectopic restriction of DNA repair reveals that UNG2 excises AID-induced uracils predominantly or exclusively during G1 phase. J. Exp. Med. 209, 965-974 (2012).
- Wang, Q. et al. The cell cycle restricts activation-induced cytidine deaminase activity to early G1. J. Exp. Med. 214, 49-58 (2017).
- Spencer, S. L. et al. The proliferation-quiescence decision is controlled by a bifurcation in CDK2 activity at mitotic exit. Cell 155, 369-383 (2013).
- Hahn, A. T., Jones, J. T. & Meyer, T. Quantitative analysis of cell cycle phase durations and PC12 differentiation using fluorescent biosensors. Cell Cycle 8, 1044-1052 (2009).
- Arora, M. et al. Rapid adaptation to CDK2 inhibition exposes intrinsic cell-cycle plasticity. Cell 186, 2628-2643 (2023).
- Sakaue-Sawano, A. et al. Visualizing spatiotemporal dynamics of multicellular cell-cycle progression. Cell 132, 487-498 (2008).
- Hadjantonakis, A. K. & Papaioannou, V. E. Dynamic in vivo imaging and cell tracking using a histone fluorescent protein fusion in mice. BMC Biotechnol. 4, 33 (2004).
- Nojima, T. et al. In-vitro derived germinal centre B cells differentially generate memory B or plasma cells in vivo. Nat. Commun. 2, 465 (2011).
- Kuraoka, M. et al. Complex antigens drive permissive clonal selection in germinal centers. Immunity 44, 542-552 (2016).
- Firl, D. J., Degn, S. E., Padera, T. & Carroll, M. C. Capturing change in clonal composition amongst single mouse germinal centers. eLife 7, e33051 (2018).
- Jacobsen, J. T. et al. Expression of Foxp3 by T follicular helper cells in end-stage germinal centers. Science 373, eabe5146 (2021).
- Meyer-Hermann, M. A molecular theory of germinal center B cell selection and division. Cell Rep. 36, 109552 (2021).
- Larijani, M. et al. AID associates with single-stranded DNA with high affinity and a long complex half-life in a sequence-independent manner. Mol. Cell. Biol. 27, 20-30 (2007).
- Wilson, T. M. et al. MSH2-MSH6 stimulates DNA polymerase η, suggesting a role for A:T mutations in antibody genes. J. Exp. Med. 201, 637-645 (2005).
- Pena-Diaz, J. et al. Noncanonical mismatch repair as a source of genomic instability in human cells. Mol. Cell 47, 669-680 (2012).
- Rona, G. et al. CDK-independent role of D-type cyclins in regulating DNA mismatch repair. Mol. Cell 84, 1224-1242 (2024).
- Meyer-Hermann, M. Overcoming the dichotomy of quantity and quality in antibody responses. J. Immunol. 193, 5414-5419 (2014).
(c) The Author(s) 2025
Methods
C57BL/6, B6.SJL (CD45.1), Rosa26
AID-Confetti labelling
Multiphoton imaging and analysis of Brainbow GCs
Isolation of single GCs for flow cytometry and cell sorting
were single-cell index-sorted on a BD FACSymphony S6 sorter. Colour assignment was done after acquisition using Diva software (v. 8.0.2).
Adoptive cell transfers
Plate-based single-cell VDJ sequencing and analysis
Droplet-based single-cell VDJ and gene-expression sequencing and analysis
individual hashtag oligonucleotide (HTO)-labelled antibodies to CD45 and MHC-I (Biolegend) for sample-level barcoding before sorting. Cells were pooled in a microfuge tube in PBS supplemented with
Time-lapse imaging of GCB cells in culture
Intravital imaging
Quantification of CDK2 activity
Image-based cell sorting
viability dye, then sorted on a BD S8 FACSDiscover spectral sorter with BDCellView Image Technology. Cells were sorted on the basis of the maximum intensity and diffusivity of tdTomato fluorescence, following the gating strategy indicated in Extended Data Fig. 7a,b.
Simulation of clonal-burst birth-death processes
Estimation of GCB cell division and mutation rates
Agent-based GC simulation model
a distance of one from the previous position. The B cell mutation occurs after cell division, according to the mutation models described below.
After selection, each B cell undergoes a number of divisions,
- EACH scenario: every daughter cell acquires
mutations each division. - LAST scenario: only daughter cells in the last round of proliferation acquire
mutations.
For both scenarios,is set to 2.2; that is, each descendant undergoes two mutations relative to its parent and has a 0.2 probability of acquiring a third mutation. was chosen so that the average mutation rate matches the observed value of mutations per daughter cell in the LAST model.
To analyse the mutational landscape of the GC, we translated the shape space positions into BCR sequences. The mutations of cells in the shape space are tracked throughout the course of the GC reaction. Each seeder cell is assigned a unique random nucleotide sequence of 300 base pairs, representing the Ighv segment of a real BCR sequence. Because we restricted the modelled sequence to the Ighv segment, mutations in the shape space correspond to a random nucleotide replacement in the Ighv sequence with a
Statistical analysis
Reporting summary
Data availability
58. Egli, D., Rosains, J., Birkhoff, G. & Eggan, K. Developmental reprogramming after chromosome transfer into mitotic mouse zygotes. Nature 447, 679-685 (2007).
59. Wiesner, S. M., Jones, J. M., Hasz, D. E. & Largaespada, D. A. Repressible transgenic model of NRAS oncogene-driven mast cell disease in the mouse. Blood 106, 1054-1062 (2005).
60. Hobeika, E. et al. Testing gene function early in the B cell lineage in mb1-cre mice. Proc. Natl Acad. Sci. USA 103, 13789-13794 (2006).
61. Shih, T. A., Roederer, M. & Nussenzweig, M. C. Role of antigen receptor affinity in T cellindependent antibody responses in vivo. Nat. Immunol. 3, 399-406 (2002).
62. Inaba, K. et al. Tissue distribution of the DEC-205 protein that is detected by the monoclonal antibody NLDC-145: I. Expression on dendritic cells and other subsets of mouse leukocytes. Cell. Immunol. 163, 148-156 (1995).
63. Madisen, L. et al. A robust and high-throughput Cre reporting and characterization system for the whole mouse brain. Nat. Neurosci. 13, 133-140 (2010).
Article
- Chen, S. et al. CRISPR-READI: efficient generation of knockin mice by CRISPR RNP electroporation and AAV donor infection. Cell Rep. 27, 3780-3789 (2019).
- Pasqual, G., Angelini, A. & Victora, G. D. Triggering positive selection of germinal center B cells by antigen targeting to DEC-205. Methods Mol. Biol. 1291, 125-134 (2015).
- Masella, A. P., Bartram, A. K., Truszkowski, J. M., Brown, D. G. & Neufeld, J. D. PANDAseq: paired-end assembler for illumina sequences. BMC Bioinformatics 13, 31 (2012).
- Lefranc, M. P. et al. IMGT, the international ImMunoGeneTics information system. Nucleic Acids Res. 37, D1006-D1012 (2009).
- Victora, G. D. et al. Identification of human germinal center light and dark zone cells and their relationship to human B-cell lymphomas. Blood 120, 2240-2248 (2012).
- Meijer, E. F. J. et al. Murine chronic lymph node window for longitudinal intravital lymph node imaging. Nat. Protoc. 12, 1513-1520 (2017).
- Pae, J. et al. Supporting data for ‘Transient silencing of hypermutation preserves B cell affinity during clonal bursting’. Zenodo https://doi.org/10.5281/zenodo. 14516289 (2025).
niedersachsen of the Volkswagen Foundation for the ‘CAIMed – Lower Saxony Center for Artificial Intelligence and Causal Methods in Medicine’ project (grant ZN4257, awarded to M.M.-H.). J.P. was the Berger Foundation Fellow of the Damon Runyon Cancer Research Foundation. W.S.D. was supported by a Fellowship in Understanding Dynamic and Multiscale Systems from the James S. McDonnell Foundation. N.S. and A.G. received funding from the Innovative Medicines Initiative 2 Joint Undertaking (JU) under grant agreement 101007799. The JU receives support from the European Union’s Horizon 2020 research and innovation programme and EFPIA. G.D.V. and F.A.M. are HHMI investigators.
Additional information
Correspondence and requests for materials should be addressed to Gabriel D. Victora.
Peer review information Nature thanks the anonymous reviewers for their contribution to the peer review of this work.
Reprints and permissions information is available at http://www.nature.com/reprints.
Article
c, Ighv sequences obtained from the GCs in a were used to construct phylogenetic
trees. For each GC, the fraction of parental cells and the estimated total number of identical cells
the 0.033 simulation, the first of which is reproduced from Fig.1c.P values are given as the fraction of simulations that exceed the parental fraction of the observed GC (shown as a dotted red line). Median values for the set of simulations are shown as a blue line. The simulation whose median value most closely approaches the observed value for that GC is highlighted in red. c, Median ( ± interquartile range) parental fractions for parameter sweeps as in b for the entire 12-GC set in Fig. 1a,b and Extended Data Fig. 1b,c. The plot for GC i. is reproduced from Fig.1e. The parental fraction of the observed GC is shown as a red line. Numbers indicate the simulated SHM rate with parental fraction closest to that observed for each GC.
Extended Data Fig. 3 | SHM rate decreases during inertial cell cycling in Ccnd3
methods section. Each symbol represents one mouse from 2 independent experiments. The symbol size represents the number of cells sequenced and analysed from each mouse. Predicted mean is inverse-variance-weighted and standard deviation accounts for variances within individual mice.P values are for Student’s t-test. d, Distribution of mutations in pooled WT and T283A cells from c. P values are for Student’s t-test. e, Distribution of mutations in GC B cells from individual WT and Ccnd3
Extended Data Fig. 4 | Mutation count data segregated by mouse.
of mutations in DEC-
treatment. Left, representative histograms; right, quantification of 2-4 samples for each time point. Each symbol represents one mouse.c, Detection of Vh1-72 mRNA (encoding for the heavy chain of the B1-8
cells quantified for each GC is indicated below each violin. Aggregated data are shown in Fig. 3j. c, Violin plots of DHB-tdTomato C/N ratio in DZ B cells within GCs 36, 60, or 72 h post-anti-DEC-OVA treatment, segregated by individual GC and displayed with median and interquartile range. Numbers of cells sequenced are indicated below each violin. Aggregated data are shown in Fig. 3j.
examples of images of sorted CDK2
| Antibody | Clone | Fluorophore | Final Dilution | Company | Catalog number |
| B220 | RA3-6B2 | BV785 | 1:400 | Biolegend | 103246 |
| TCRb | H57-597 | APC-Cy7 | 1:400 | Invitrogen | 47-5961-82 |
| CD38 | 90/CD38 | PerCP-Cy5.5 | 1:400 | BD Biosciences | 17-0381-82 |
| Fas/CD95 | Jo2 | PE/Cy7 | 1:800 | BD Biosciences | 557653 |
| Fas/CD95 | Jo2 | BV421 | 1:800 | BD Biosciences | 562633 |
| GL7 | GL7 | Alexa Fluor 647 | 1:400 | BD Biosciences | 561529 |
| CXCR4 | 2B11 | PE | 1:100 | Invitrogen | 12-9991-82 |
| CD86 | GL-1 | AF488 | 1:400 | Biolegend | 105018 |
| CD45.1 | A20 | BUV395 | 1:400 | BD Biosciences | 565212 |
| CD45.2 | 104 | APC | 1:400 | Biolegend | 109814 |
natureportfolio
Reporting Summary
Statistics
n/a
□
□
The statistical test(s) used AND whether they are one- or two-sided
Only common tests should be described solely by name; describe more complex techniques in the Methods section.
□
□
□
□
□ For Bayesian analysis, information on the choice of priors and Markov chain Monte Carlo settings
□ For hierarchical and complex designs, identification of the appropriate level for tests and full reporting of outcomes
□ Estimates of effect sizes (e.g. Cohen’s
Our web collection on statistics for biologists contains articles on many of the points above.
Confirmed
□
The statistical test(s) used AND whether they are one- or two-sided
A description of all covariates tested
L ,
ur web collection on statistics for biologists contains articles on many of the points above.
Software and code
Data collection
Data collection code was not used in this study
Data analysis
Graphs were plotted using R (v.4.3.1), and formatted in Adobe Illustrator CS. Statistical tests were performed in R (v.4.3.1). Flow cytometry data was analyzed using FlowJo v10. Computational analysis of single-cell RNA sequencing data used CellRanger v6.0.1, v7.0.1, and v8.0.1; and R v. v.4.3.1. Code implementing simulations of clonal burst birth-death processes used in Figure 1 is available at https://github.com/ WSDeWitt/aid-sim. Full description of Agent-Based GC Simulation Model used in Figure 4 is provided in the Supplementary Text. Igh sequencing analysis was carried out using PANDASeq v.2.11, HighVQUEST v. 1.6.9, and GCtree (deWitt et. al. 2018).
Data
Policy information about availability of data
- Accession codes, unique identifiers, or web links for publicly available datasets
- A description of any restrictions on data availability
- For clinical datasets or third party data, please ensure that the statement adheres to our policy
Research involving human participants, their data, or biological material
| Reporting on sex and gender | N/A |
| Reporting on race, ethnicity, or other socially relevant groupings | N/A |
| Population characteristics | N/A |
| Recruitment | N/A |
| Ethics oversight | N/A |
Field-specific reporting
Life sciences
Behavioural & social sciences
Ecological, evolutionary & environmental sciences
For a reference copy of the document with all sections, see nature.com/documents/nr-reporting-summary-flat.pdf
Life sciences study design
| Sample size | No statistical methods were used to determine sample size. Numbers of mice per group within each independent experiment were limited to numbers typically used in the field. The cell line experiment was performed twice with triplicate technical replicates, as is the standard for such assays. |
| Data exclusions | For 10x data presented in Fig. 4, a sample with small GC size was collected but excluded for analysis. |
| Replication | Experiments were performed multiple times independently, as described in the figure legends. |
| Randomization | Littermate mice were used to control for litter, cage, and age effects. Mice were divided stochastically (albeit without a specific randomization procedure) between experimental groups. |
| Blinding | Experimenters were not blinded to experimental group, since most readouts (e.g. FACS fluorescence intensities) are not subjective. |
Reporting for specific materials, systems and methods
n/a
Involved in the study
- Antibodies
□ Palaeontology and archaeology
【 Animals and other organisms
□ Clinical data
□ Dual use research of concern
□ Plants
□ ChIP-seq
□ Flow cytometry
□ MRI-based neuroimaging
Antibodies
| Antibodies used | See Extended Data Table 1. |
| Validation | All antibodies validated on the manufacturers’ websites. |
| Eukaryotic cell lines | |
| Policy information about cell lines and Sex and Gender in Research | |
| Cell line source(s) | NB-21.2D9 feeder cells were provided by G. Kelsoe (Duke University) |
| Authentication | Cell lines were used solely for the purpose of maintaining GC B cells in culture, which were confirmed successful as per the experimental data. No further authentication was performed beyond that provided by the original source. |
| Mycoplasma contamination | Cell lines were not tested after receipt from the original source but are were used at low passage numbers (
|
| Commonly misidentified lines (See ICLAC register) | No commonly misidentified cell lines were used. |
Animals and other research organisms
| Laboratory animals | 5-12 week old adult male and female mice on the C57BL/6J background were used. See ‘mice’ section in the methods for further details. Mice were housed at
|
| Wild animals | The study did not involve wild animals. |
| Reporting on sex | Both sexes of mice were used throughout the study. No significant differences were noted between sexes. |
| Field-collected samples | The study did not involve samples collected from the field. |
| Ethics oversight | All protocols were approved by the Rockefeller University Institutional Animal Care and Use Committees (protocol number 22058-H). |
| Note that full information on the approval of the study protocol must also be provided in the manuscript. | |
Plants
| Seed stocks | Report on the source of all seed stocks or other plant material used. If applicable, state the seed stock centre and catalogue number. If plant specimens were collected from the field, describe the collection location, date and sampling procedures. | ||
| Novel plant genotypes | Describe the methods by which all novel plant genotypes were produced. This includes those generated by transgenic approaches, gene editing, chemical/radiation-based mutagenesis and hybridization. For transgenic lines, describe the transformation method, the number of independent lines analyzed and the generation upon which experiments were performed. For gene-edited lines, describe the editor used, the endogenous sequence targeted for editing, the targeting guide RNA sequence (if applicable) and how the editor | ||
| Authentication |
|
Plots
The axis labels state the marker and fluorochrome used (e.g. CD4-FITC).
The axis scales are clearly visible. Include numbers along axes only for bottom left plot of group (a ‘group’ is an analysis of identical markers).
All plots are contour plots with outliers or pseudocolor plots.
A numerical value for number of cells or percentage (with statistics) is provided.
Methodology
| Sample preparation | Cells were isolated from lymph nodes by maceration with disposable micropestles (Axygen) in
|
| Instrument | BD FACSSymphony A5 for flow cytometry, BD FACSymphony S6 for cell sorting, BD FACSDiscover S8 for image-based sorting |
| Software | FlowJo v. 10 software |
| Cell population abundance | Cell sorting was performed for Chromium single cell RNA sequencing. Cell population abundance was confirmed by quantification of hashtag oligos used to identify different samples and cell types. |
| Gating strategy | All positive and negative populations were determined by compensation with single color controls. For sorting and analysis, all lymphocytes were first gated based on SSC-A vs FSC-A, followed by 2 singlet gates (FSC-H vs FSC-A and SSC-H vs SSC-A). For GC gating, cells were gated on B220+, TCRb-, CD38-, and Fas+. Gating strategy for image-based cell sorting is shown in Extended Data Figure 6a. |
Laboratory of Lymphocyte Dynamics, The Rockefeller University, New York, NY, USA. Department of Systems Immunology, Helmholtz Center for Infection Research, Braunschweig, Germany.
Center for Studies in Physics and Biology, The Rockefeller University, New York, NY, USA. Department of Genome Sciences, University of Washington, Seattle, WA, USA. Howard Hughes Medical Institute, New York, NY, USA. Computational Biology Program, Fred Hutchinson Cancer Research Center, Seattle, WA, USA. Howard Hughes Medical Institute, Seattle, WA, USA.
Department of Statistics, University of Washington, Seattle, WA, USA. Lower Saxony Center for Artificial Intelligence and Causal Methods in Medicine (CAIMed), Hannover, Germany.
These authors contributed equally: Niklas Schwan, Bertrand Ottino-Loffler, William S. DeWitt, Amar Garg. e-mail: victora@rockefeller.edu