العوامل البيئية لزيادة تنفس النظام البيئي في التندرا المتزايدة الحرارة Environmental drivers of increased ecosystem respiration in a warming tundra

المجلة: Nature، المجلد: 629، العدد: 8010
DOI: https://doi.org/10.1038/s41586-024-07274-7
PMID: https://pubmed.ncbi.nlm.nih.gov/38632407
تاريخ النشر: 2024-04-17

العوامل البيئية لزيادة تنفس النظام البيئي في التندرا المتزايدة الحرارة

https://doi.org/10.1038/s41586-024-07274-7
تاريخ الاستلام: 29 نوفمبر 2022
تم القبول: 6 مارس 2024
نُشر على الإنترنت: 17 أبريل 2024
الوصول المفتوح
س. ل. ميس ج. ديترش جي. ميدولو س. شفيجر م. كومو ف. فاندفيك ر. أرتس ،
إي. إتش. جي. ألتويزن سي. بيازي R. G. بيورك هـ. بوهـنر م. كاربوجناني جي. كيارى ،
C. ت. كريستيانسن كي. إي. كليمنسن إي. جي. كوبر ج. هـ. س. كورنيليسن ب. إلبيرلينغ ،
P. فوبيرت ن. فيتشر تي. جي. دبليو. فورت ج. غودار ك. غافازوف ز. جوان ،
ج. غودموندسون ر. جيا س. هالين ب. ب. هانسن س. ف. هاوجوم ج.-س. ،
C. هيكس برايس م. ج. هوفندن م. جالافا آي. إس. يونسدوتير ج. جوهانسون جي. واي. جونغ ،
إي. كارليجارفي م. ج. كوان ر. إ. لامبريشت م. لو مولك ، هـ. لي ،
م. إ. ماروشتشاك أ. ميشيلسن ت. م. منير إي. إم. ميرسكي سي. إس. نيلسن ،
م. نايبرغ ج. أولوفسون ، هـ. أوسكارسون تي. سي. باركر إي. بي. بيدرسن م. بيتي بون ،
أ. بيتراغليا كي. راوندروب “، ن. م. ر. رافن ر. رينان هـ. رودنهزر آي. رايد ،
N. م. شميت إي. إيه. جي. شور س. سيوجيرستين س. ستارك م. ستراك ج. تانغ ،
أ. تولفانن جي. بي. توبير م. ك. فايزنين R. S. P. فان لوغتستين سي. فويت ج. وولز ،
ج. ت. ويدون ي. يانغ ، هـ. يلانـة م. ب. بيوركمان ج. م. سارنييل و إي. دوريبال

الملخص

تعتبر نظم التندرا القطبية والجبال العالية خزانات كبيرة للكربون العضوي قد يحفز ارتفاع درجة حرارة المناخ تنفس النظام البيئي ويطلق الكربون في الغلاف الجوي. لا تزال شدة واستمرارية هذه التحفيز والآليات البيئية التي تحرك تباينها غير مؤكدة. . هذا يعيق دقة توقعات تغذية الكربون الأرضي المناخي العالمية . هنا نقوم بتجميع 136 مجموعة بيانات من 56 تجربة تسخين في الموقع باستخدام غرف مفتوحة تقع في 28 موقعًا من التندرا القطبية والجبال، والتي كانت تعمل لمدة تقل عن سنة واحدة حتى 25 سنة. نوضح أن متوسط الارتفاع في فترة الثقة (CI) ] في الهواء و في درجة حرارة التربة يؤدي إلى زيادة في تنفس النظام البيئي خلال موسم النمو بـ [CI 22-38%] ( تشير نتائجنا إلى أن تحفيز تنفس النظام البيئي كان نتيجة لزيادة كل من تنفس النباتات والتنفس الميكروبي. ) واستمر لمدة لا تقل عن 25 عامًا ( كانت شدة تأثيرات الاحترار على التنفس مدفوعة بتغيرات الاحترار في الظروف المحلية للتربة، أي التغيرات في تركيز النيتروجين الكلي ودرجة الحموضة، وكذلك بالتغيرات المكانية المعتمدة على السياق في هذه الظروف، وخاصة تركيز النيتروجين الكلي ونسبة الكربون إلى النيتروجين. بدت المواقع التندرا التي تعاني من قيود نيتروجين أقوى والمواقع التي حفز فيها الاحترار دوران المغذيات للنباتات والميكروبات أكثر حساسية في استجابتها للتنفس للاحتباس الحراري. تسلط النتائج الضوء على أهمية الظروف المحلية للتربة والتغيرات الناتجة عن الاحترار فيها للتأثيرات المناخية المستقبلية على التنفس.

سيتم تحديد مصير المخزون الكربوني (C) المهم عالميًا لبيئة التندرا القطبية والجبال (المشار إليها فيما بعد بـ ‘التندرا’) من خلال التوازن بين التأثيرات المناخية على امتصاص الكربون (التمثيل الضوئي للنباتات) وإطلاقه (تنفس النظام البيئي (ER)). ؛ أي، مجموع تنفس النبات أو التنفس الذاتي التغذية وتنفس الميكروبات أو التنفس غير الذاتي التغذية . حيث تخزن التندرا كميات هائلة من الكربون وتزداد حرارة بمعدلات أعلى من المتوسط العالمي لقد كانت عواقب الاحتباس الحراري على انبعاث الكربون من هذه البيئة موضوع نقاش ساخن على مدى العقود الماضية. تزداد شدة واستمرارية ومحركات التغير في معدل الانبعاثات مع ارتفاع درجات الحرارة، ومع ذلك، تظل هذه الأمور غير مؤكدة للغاية، خاصة على مقاييس زمنية متعددة العقود. ويرجع ذلك إلى التباين الكبير في استجابة معدل الانبعاثات للاختبارات التجريبية لارتفاع درجات الحرارة عبر دراسات فردية أو متعددة المواقع (على سبيل المثال، الزيادات في
8-52٪؛ المراجع 5، 9، 18-20)، بالإضافة إلى تمثيل ضعيف لمواقع التندرا في التحليلات الميتا المتعددة لمعدل التنفس .

آثار الاحترار غير المباشرة

يمكن أن تكون التغيرات في استجابة معدل التنفس التبادلي (ER) للاحتباس الحراري بين مواقع التندرا ناتجة عن اختلافات في التأثيرات المباشرة للاحتباس الحراري على ER، على سبيل المثال من خلال تغيير معدلات الحركة للعمليات البيولوجية الأساسية، بالإضافة إلى التأثيرات غير المباشرة، من خلال اختلافات في التغيرات الناتجة عن الاحتباس الحراري في العوامل غير الحية (على سبيل المثال، المناخ المحلي). ظروف التربة وذوب التربة المتجمدة ) أو حيوي (تركيب مجتمع النباتات ومجتمع المحللات ) الظروف. على سبيل المثال، يمكن أن يؤدي جفاف التربة المرتبط بالاحترار إلى زيادة التنفس غير الذاتي من خلال زيادة الأكسجين
الشكل 1| منطقة الدراسة، مدة التجارب وسياق البيئة لتجارب الاحترار عبر بيئة التندرا. أ-ج، تم جمع بيانات معدل التنفس التربة (ER) في 136 سنة قياس خلال موسم النمو عبر 56 تجربة احترار مستقلة باستخدام غلاف حراري (OTC)، تغطي 28 موقعًا جغرافيًا متميزًا عبر بيئة التندرا (أ)، مما يعكس مجموعة واسعة من مدد الاحترار التجريبية في وقت قياسات ER (ب) والتنوع البيئي (ج). يشير نصف قطر النقاط في (أ) إلى عدد السنوات التي تم قياس ER فيها لكل تجربة (النطاق من 1-13 سنة؛ 63% من التجارب بنطاق أكبر من سنة واحدة)، بينما يشير لون النقاط إلى عدد الملاحظات لكل مجموعة بيانات، أي عدد قياسات ER في موسم النمو عبر جميع السنوات التي تم فيها القياسات.
تم إجراء (التفاصيل في الشكل 1 من البيانات الموسعة، الطرق التكميلية 1 والجداول التكميلية 1 و2). يتم عرض توزيع مجموعات البيانات عبر مدة التسخين التجريبي قبل أخذ قياسات ER، مقسمة إلى أربع فئات (المدة سنة قياس ER – سنة بدء علاج OTC؛ لاحظ أن ‘0’ تشير إلى الصيف الأول من الاحترار التجريبي) (ب) والمتغيرات الفئوية التي تصف السياقات البيئية (ج)، من اليسار إلى اليمين: المنطقة؛ فئة رطوبة التربة؛ فئة pH التربة؛ ونوع الغطاء النباتي (B، قاحل؛ G، عشب؛ P، شجيرة مائلة؛ S، شجيرة قائمة؛ W، التندرا الرطبة). تم إنشاء الخرائط باستخدام .
الإمداد للميكروبات في التربة المشبعة بالمياه أو التربة اللاهوائية، بينما يمكن أن يقلل من التنفس من خلال تعزيز نقص المياه في الأيض الميكروبي في التربة الجافة أو الهوائية. كما أن التغيرات المدفوعة بالاحترار في تغطية أو تركيب الغطاء النباتي قد تؤثر على استجابات التنفس من خلال تغيير كمية جذور النباتات أو كمية وجودة الأوراق المتساقطة، مما يؤثر في النهاية على معدلات التنفس الذاتية وغير الذاتية. .

اعتماديات السياق

نظم التندرا البيئية، التي تغطي مجموعة واسعة من الظروف البيئية تتميز بشدة بالتنوع في ظروفها المناخية والتربة، فضلاً عن تنوع الغطاء النباتي والمجتمعات الميكروبية. قد تختلف استجابات انبعاثات الكربون نتيجة للاحتباس الحراري بسبب هذه الاعتمادات السياقية أو الظروف البيئية المحددة للسياق. على سبيل المثال، يجب أن تزداد ER نظريًا أكثر مع الاحترار في المناخات الماكروية الأكثر برودة. أو في التربة التي تحتوي على كميات أكبر من الكربون العضوي في التربة (SOC)، على الرغم من أن هذا لا يزال موضوع نقاش ومن المحتمل أن يعتمد على عوامل متفاعلة مثل رطوبة التربة. أو قابلية SOC وبالمثل، قد يتسبب الرقم الهيدروجيني للتربة في تباين شدة استجابة ER من خلال التأثير على توفر العناصر الغذائية الأساسية للنباتات والمحللات. . علاوة على ذلك، الغطاء النباتي والميكروبي يمكن أن تؤثر وفرة المجتمع أو تركيبه على تنفس الكائنات الذاتية التغذية وإمكانات تنفس الكائنات غير الذاتية التغذية. وبالتالي حجم استجابة غرفة الطوارئ، من خلال
اختلافات في الإنتاجية الأولية الصافية (NPP) وكمية ونوعية اللتر وكفاءة استخدام الكربون.
فهم مثل هذه التأثيرات غير المباشرة للاحتباس الحراري بالإضافة إلى الاعتماد على السياق قد يفسر التباين في استجابات معدل التنفس التربة للاحتباس الحراري عبر التندرا. علاوة على ذلك، قد يوضح الآليات الأساسية المهمة لهذه الاستجابات. لقد ركزت معظم التحليلات الميتا متعددة المواقع بشكل كبير على الحجم والاتجاه والعوامل المناخية التي تؤثر على استجابة معدل التنفس التربة. بينما يعد فهم الآليات البيئية وراء استجابة الشبكة الإندوبلازمية أمرًا أساسيًا للتنبؤ بدقة بتأثير تغير المناخ على المدى الطويل على دورة الكربون الأرضية لتحسين توقعات انبعاثات الكربون للتندرا نحن بحاجة ماسة إلى تحسين التقدير وفهم آليات أكبر لكيفية تأثير الاحترار على معدل التنفس في النظام البيئي.

الهدف وتصميم الدراسة

هنا نهدف إلى قياس حجم وتنوع تأثير الاحترار على التنفس البيئي (ER) عبر التندرا وفهم كيف يعتمد تباين استجابة ER على مدة الاحترار، وتأثيرات الاحترار غير المباشرة، والاعتماد على السياق من خلال نماذج الانحدار الميتا. لذلك، جمعنا 24,035 قياسًا للتنفس البيئي خلال النهار، في موسم النمو من 28 موقعًا عبر بيئة التندرا، تغطي 56 تجربة تسخين في غرف مفتوحة (OTC) في الموقع. عبر أربع قارات، مع مدة تسخين تتراوح من
الشكل 2 | تأثيرات تسخين OTC التجريبي على التنفس البيئي. زاد التسخين التجريبي من التنفس البيئي عبر بيئة التندرا ولكن حجم
صيف واحد إلى 25 عامًا في وقت قياسات التنفس البيئي (الشكل 1أ والجدول التكميلي 1). لم تقيم أي دراسة واحدة استجابة التنفس البيئي للتسخين التجريبي في الموقع بعد عبر تدرج بيئي مكاني زمني كبير في التندرا، مع إعداد تجريبي موحد بينما تشمل أيضًا مجموعة واسعة من المحركات البيئية. استنادًا إلى الدراسات السابقة، نتوقع استجابة إيجابية عامة للتنفس البيئي تجاه الاحترار (كلا من التنفس الذاتي والتنفسي غير الذاتي) عبر جميع التجارب ولكن مع تباين كبير في حجم الاستجابة عبر الزمن والمكان. نتوقع أن تكون هذه الاختلافات في الحجم مدفوعة (1) بشكل غير مباشر من خلال التغيرات الناتجة عن الاحترار في الظروف البيئية المحلية، وكذلك (2) بشكل مباشر من خلال التباين المعتمد على السياق في الظروف البيئية. نركز على موسم النمو (يونيو-أغسطس)، وهو الوقت الذي يتم فيه أخذ معظم قياسات التنفس البيئي والتربة

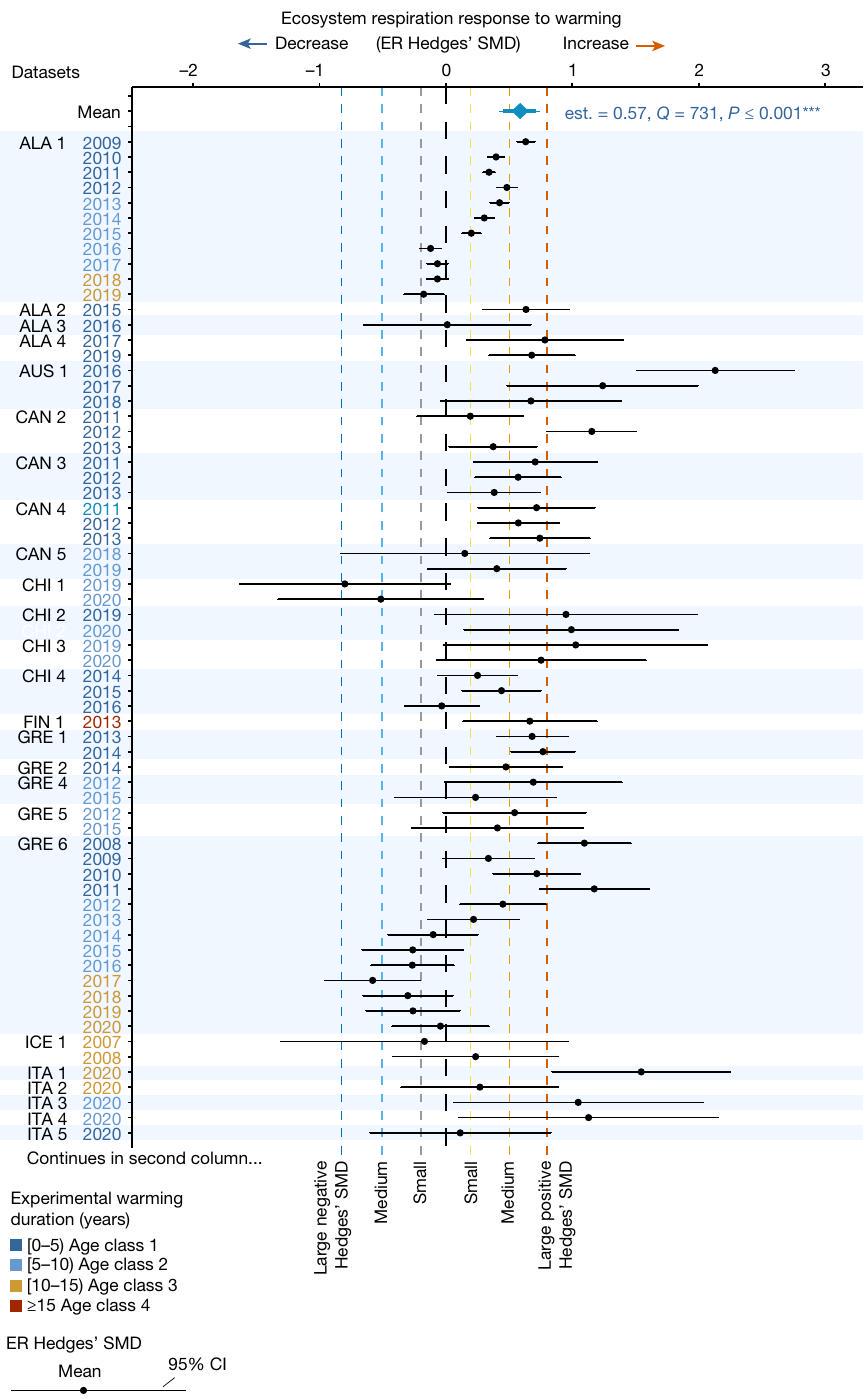
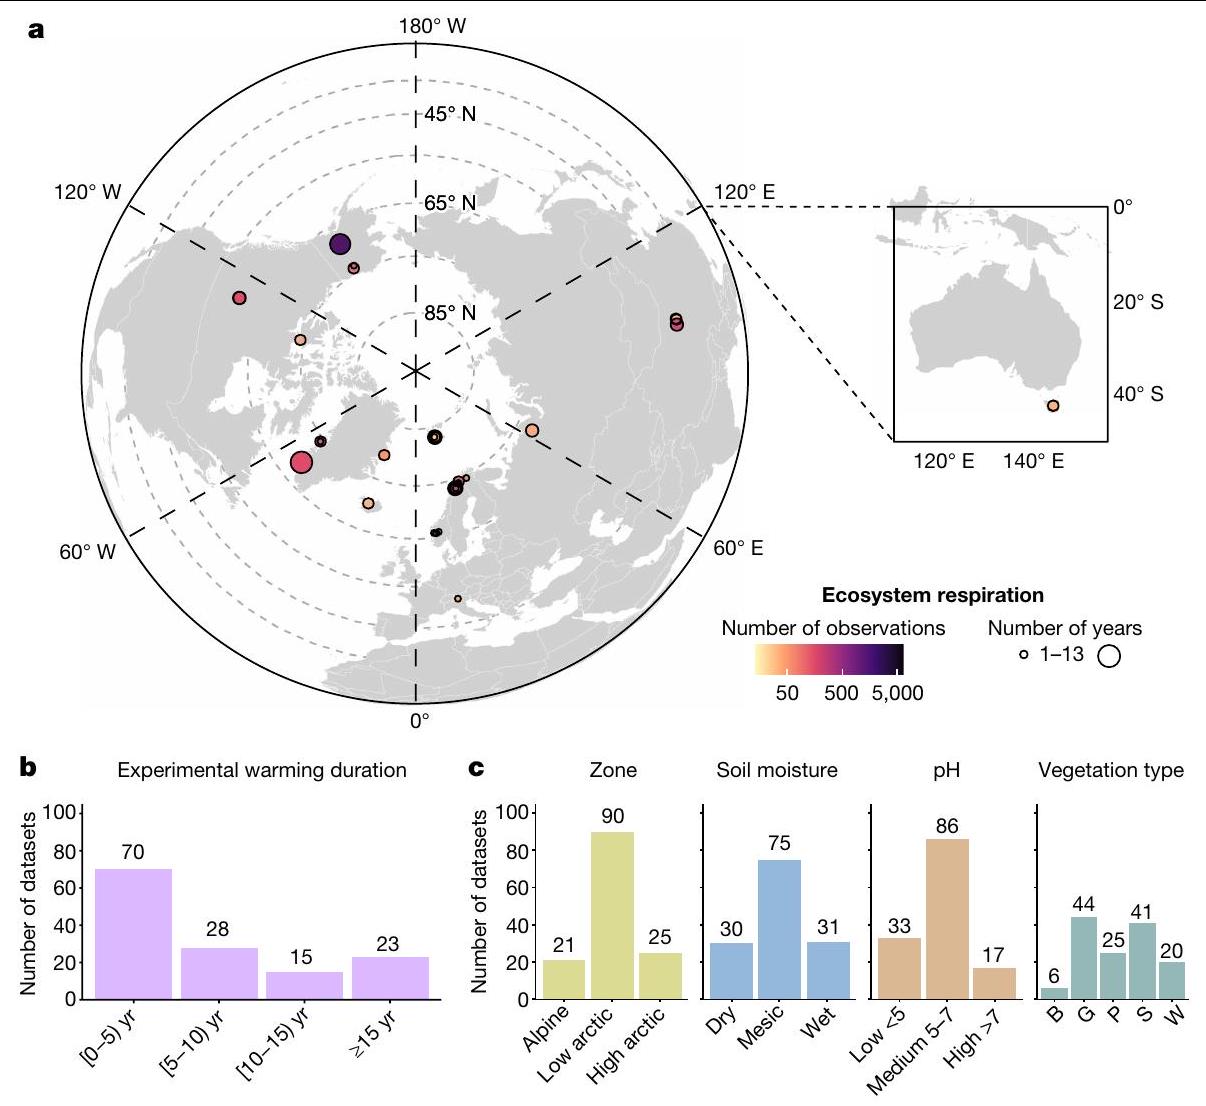
ممثلة بواسطة معرف التجربة باللون الأسود (يسار) وسنة قياس التنفس البيئي (يمين) في مقياس لوني يتراوح من الأزرق الداكن، الأزرق الفاتح، البرتقالي إلى الأحمر والذي يمثل مدة تسخين أطول بشكل متزايد في وقت قياسات التنفس البيئي. تم تجميع التجارب التي تحتوي على أكثر من سنة واحدة من بيانات التنفس البيئي. انظر الجداول التكملية 1 و2 و4 للحصول على تفاصيل حول مجموعات البيانات وقيم SMD وCI. يمثل الخط العمودي المنقط الأسود (SMD ) عدم وجود تغيير في التنفس البيئي مع الاحترار بينما تمثل المناطق إلى اليمين واليسار منه زيادة (SMD > 0) مقابل انخفاض (SMD < 0) في التنفس البيئي مع الاحترار. تعكس الخطوط العمودية المنقطة ( و ) اختلافات صغيرة ومتوسطة وكبيرة في SMD هيدجز، أي، زيادات وانخفاضات أكبر بشكل متزايد في التنفس البيئي مع الاحترار.
الأكثر نشاطًا. قمنا بحساب استجابة التنفس البيئي كـ SMD هيدجز الفرق المعياري المتوسط (SMD) ، الفرق في متوسط التنفس البيئي لموسم النمو بين المواقع غير المعالجة والمواقع المسخنة OTC، مقسومًا على الانحراف المعياري المجمّع. تم حساب قيم SMD هيدجز للتنفس البيئي لكل مجموعة بيانات، والتي كانت سنة قياس تنفس بيئي متميزة ضمن تجربة وضمن موقع أكبر، مما أسفر عن 136 قيمة SMD للتنفس البيئي (الشكل 1). باستخدام نهج التحليل الميتا الذي يمنح أهمية أكبر لمجموعات البيانات ذات الدقة الأعلى (أي، تباين أقل)، قمنا بتقييم حجم وتنوع استجابة التنفس البيئي للاحتباس الحراري عبر بيئة التندرا. كانت مدة التسخين الطويلة في وقت قياسات التنفس البيئي في عدة تجارب (الشكل 1ب والجدول التكميلي 1) وتوفر قياسات متكررة في العديد من التجارب (حتى 13 مجموعة بيانات أو سنوات قياس تنفس بيئي متكررة لكل تجربة؛ الجدول التكميلي 1) قد مكنتنا
الشكل 3 | الأنماط الزمنية في استجابات التنفس البيئي مع مدة التسخين التجريبي. تراجعت استجابات التنفس البيئي تجاه الاحترار حول نهاية العقد الأول من التسخين ولكنها لم تتراجع على المدى الطويل. أ، متوسط استجابة التنفس البيئي تجاه الاحترار (SMD هيدجز) عبر أربع فئات عمرية للتجارب، تظهر تقدير كثافة النواة للتوزيعات الأساسية في مخططات الكمان بالإضافة إلى تقديرات نموذج الانحدار الميتا ذو العامل الواحد و95% CI (بالأسود). ب، العلاقة بين مدة التسخين التجريبي واستجابة التنفس البيئي تجاه الاحترار عبر الفئات العمرية الأربع (الجدول البياني الممتد 2) مع 95% CI (المنطقة الرمادية الفاتحة). تظهر SMD هيدجز لمجموعات البيانات الفردية (فقاعات رمادية) في أ وب، محسوبة كـ (متوسط المواقع المسخنة – متوسط المواقع الضابطة) / الانحراف المعياري المجمّع. تشير حجم الفقاعات إلى وزن الملاحظة المستخدمة في نموذج الانحدار الميتا، مقاسة كعكس الجذر التربيعي
للتباين داخل الدراسة، مع الفقاعات الأكبر تشير إلى أوزان أكبر. تظهر قيم Qm، قيم وأحجام العينات ( ) لنماذج الانحدار، مع تمثل قيمة أهمية فئة عمر مدة التسخين عبر جميع البيانات في ومن مدة التسخين التجريبي لكل فئة عمر في . تظهر خطوط الانحدار المهمة في باللون الأزرق. يمثل الخط الأفقي المنقط الأسود ( ) عدم وجود تغيير في التنفس البيئي مع الاحترار بينما تمثل المناطق أعلاه وأسفل زيادة (SMD > 0) مقابل انخفاض (SMD < 0) في التنفس البيئي مع الاحترار. تعكس الخطوط الأفقية المنقطة ( و ) اختلافات صغيرة ومتوسطة وكبيرة في SMD هيدجز، أي، زيادات وانخفاضات أكبر بشكل متزايد في التنفس البيئي مع الاحترار. للحصول على مخرجات نموذج مفصلة، انظر الجدول البياني الممتد 2.
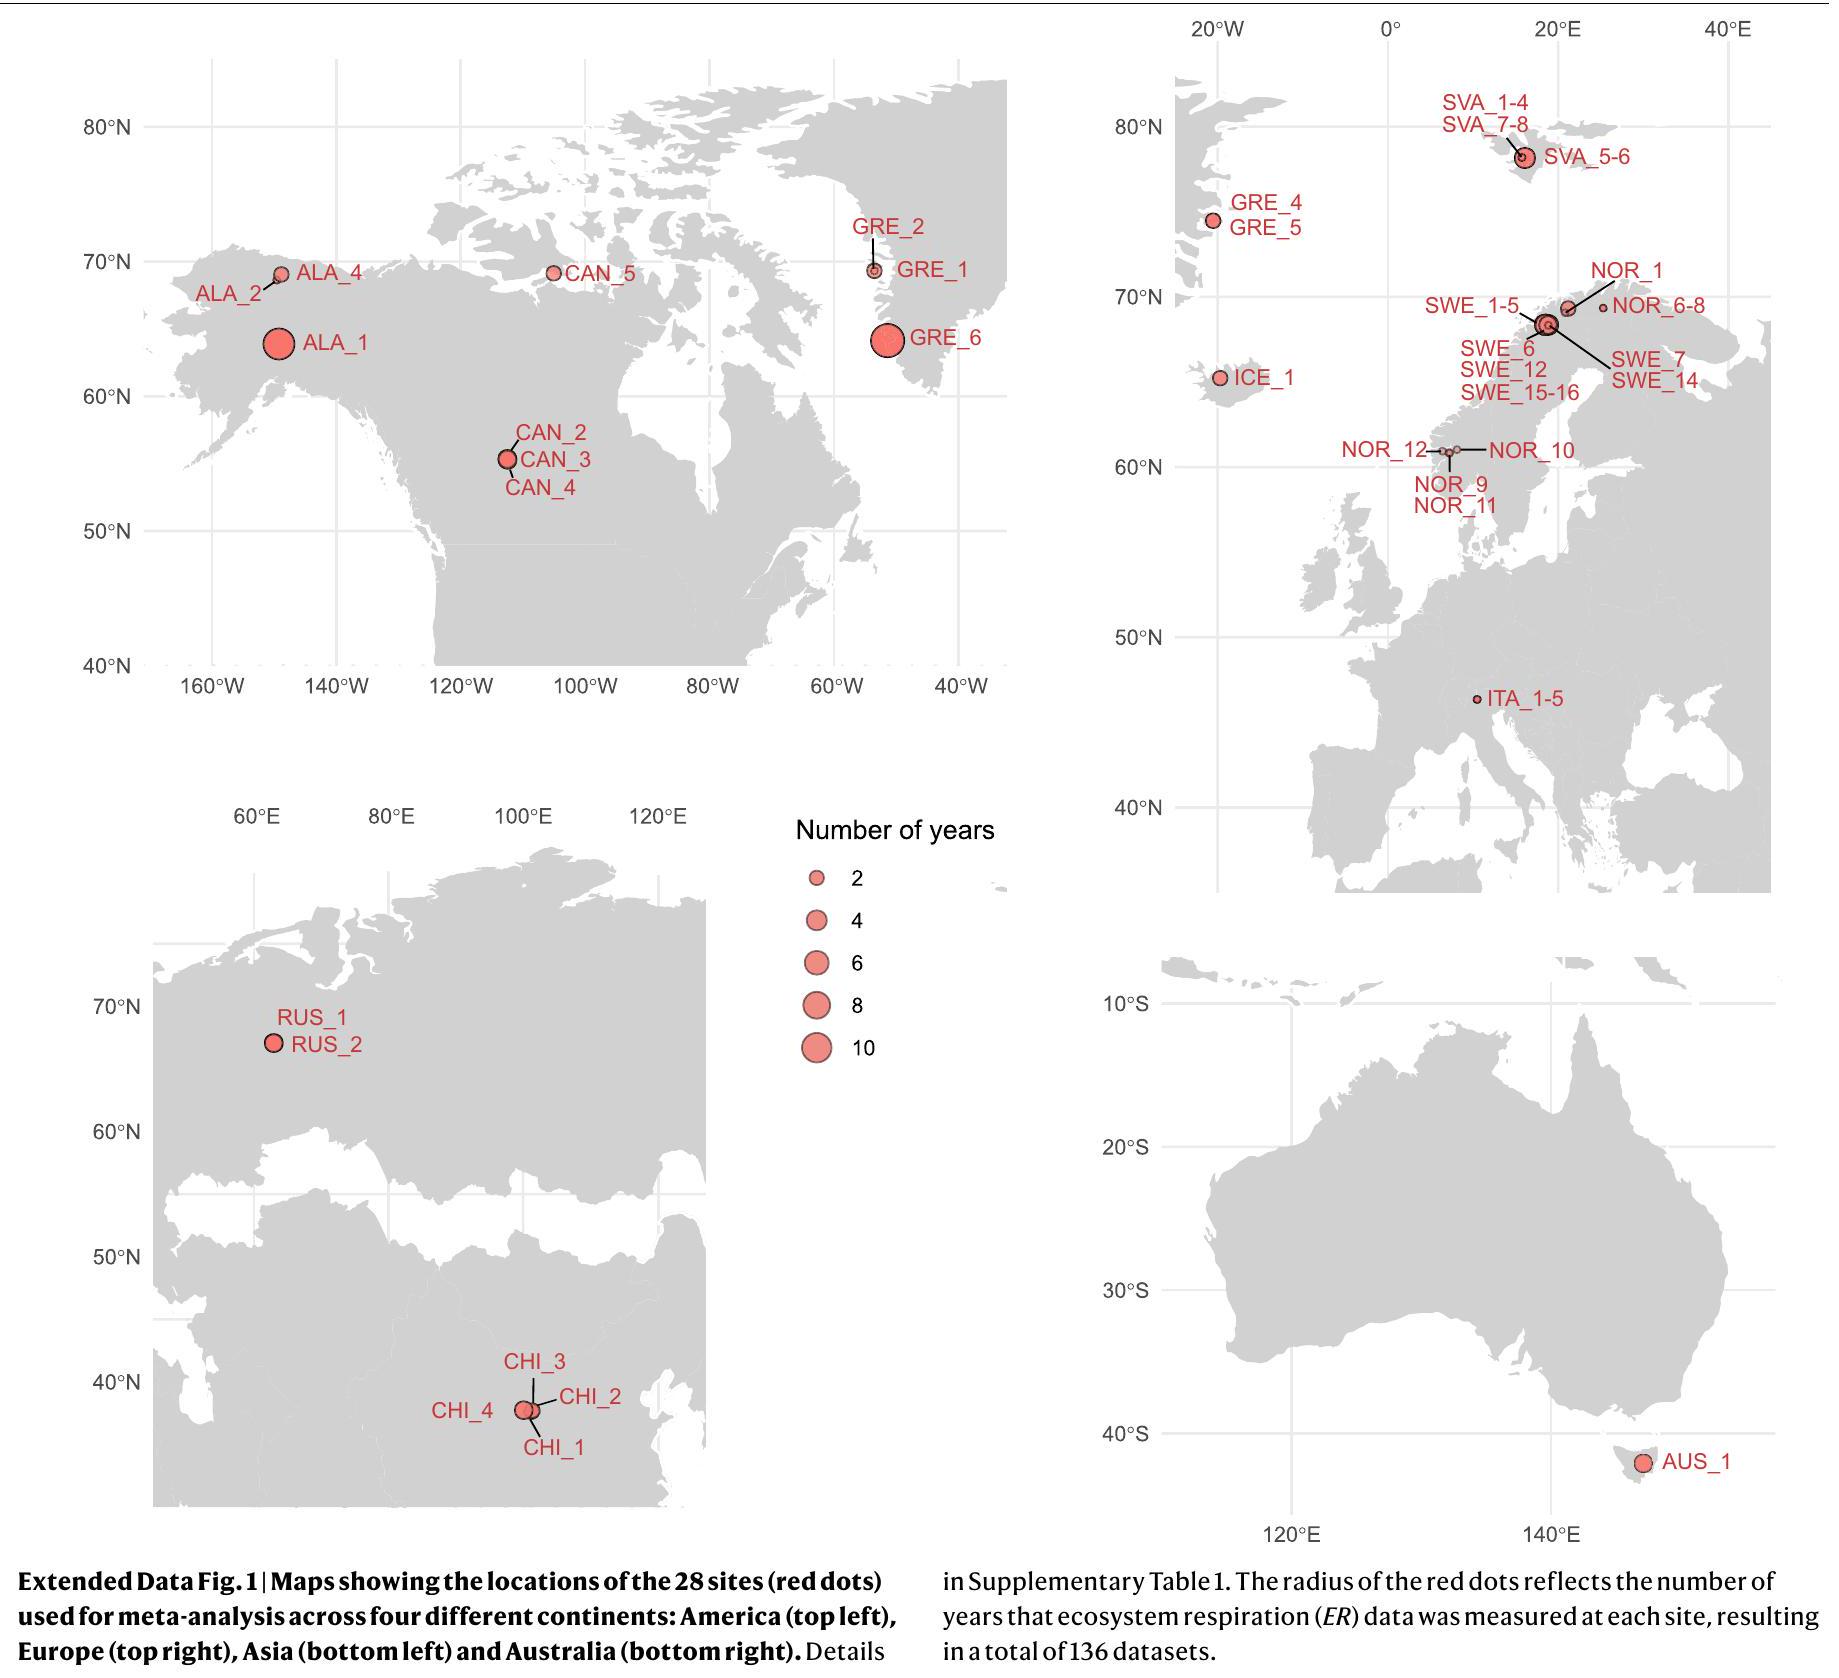
لنا لتقييم ما إذا كانت وكيف اختلفت استجابة التنفس البيئي تجاه الاحترار على مر الزمن (الجدول البياني الممتد 2). علاوة على ذلك، سمح العدد الكبير والنطاق الجغرافي والمناخي والموائل الواسعة لمواقع التندرا المدرجة (الشكل 1ج) لنا بتحليل المحركات التي تؤثر على تباين استجابة التنفس البيئي باستخدام الانحدار الميتا (الجداول البيانية الممتدة 3 و4). شملت هذه المحركات (1) التغيرات في الظروف غير الحية والحية الناتجة عن معالجة الاحترار (أي، الخصائص المناخية والتربة والنباتات وخصائص المجتمع الميكروبي) و(2) السياق البيئي غير الحي والحيوي (أي، الخصائص المناخية والتربة وخصائص مجتمع النباتات؛ الطرق التكميلية 1). سمحت لنا هذان النوعان من المحركات بتقييم كيف يعتمد تباين حجم استجابة التنفس البيئي على، على التوالي، التأثيرات غير المباشرة للاحتباس الحراري وكذلك الاعتماد على السياق. لا تتضمن قاعدة البيانات بيانات الإنتاجية الأولية الإجمالية (GPP)، حيث أن تضمينها في مجموعات بيانات التنفس البيئي يمثل تحديًا بسبب الاعتماد على الضوء لعملية التمثيل الضوئي والتباين المكاني الزمني العالي المرتبط بقياسات GPP (الطرق). ومع ذلك، من خلال التركيز على التنفس البيئي وأخذ GPP في الاعتبار بشكل غير مباشر من خلال NPP وكتلة النبات، تتضمن تحليلاتنا استجابة نمو النبات تجاه الاحترار في توازن الكربون في النظام البيئي.

معالجة التسخين التجريبي

أدى التسخين باستخدام OTC إلى متوسط (فترة الثقة 95% (CI) زيادة في درجات حرارة الهواء خلال موسم النمو، ومتوسط درجة حرارة التربة خلال موسم النمو ومتوسط 1.6% [CI 0.8-2.4%] (P<0.001؛ ) انخفاض في رطوبة التربة خلال موسم النمو مقارنة بالظروف المحيطة (استنادًا إلى نماذج التحليل الميتا؛ الجدول التكميلي 3 والطرق التكميلية 1). بما يتماشى مع الدراسات السابقة ، زاد التسخين التجريبي أيضًا من محتوى المادة العضوية في التربة (SOM) في الطبقة المعدنية، والكتلة الحيوية فوق الأرض ومتوسط ارتفاع مجتمع النباتات، بينما انخفضت تغطية الطحالب (الجدول التكميلي 3).

زيادة في تنفس النظام البيئي

نتيجة لمعالجة التسخين، زاد تنفس النظام البيئي بمتوسط SMD هيدجز قدره 0.57 [CI 0.44-0.70] ( ) ( )، مما يعكس أن [CI 22-38] ( ) تم تنفس المزيد من ، في المتوسط، في المواقع المسخنة تجريبيًا مقارنة بالضوابط غير المعالجة (الشكل 2 والجدول البياني الممتد 1). هذا الحجم المتوسط يقارب أربعة أضعاف الزيادة السابقة للتندرا، المحسوبة في تحليل ميتا استنادًا إلى 18 موقعًا في التندرا . أظهرت تحليلات ميتا إضافية لجميع البيانات المتعلقة بتقسيم التنفس البيئي إلى التنفس المرتبط بالنباتات (الذاتي) والتنفس غير الذاتي المتاحة في جميع التجارب المدرجة في هذه الدراسة ( ) أن كل من التنفس الذاتي والتنفس غير الذاتي زاد بشكل كبير مع الاحترار (متوسط SMD هيدجز للتنفس الذاتي [CI وللتنفس غير الذاتي [CI 0.36-1.48], ; الجدول البياني الموسع 1 والنقاش التكميلية 1). استنادًا إلى هذه البيانات المحدودة، من المحتمل أن الزيادة في معدل التنفس البيئي (ER) الناتجة عن الاحترار كانت نتيجة لزيادة كبيرة في كل من التنفس المرتبط بالنباتات والتنفس غير الذاتي، حيث ساهم كل منهما في التأثير العام للاحتباس الحراري على ER. على الرغم من أن استجابة ER للاحتباس الحراري كانت إيجابية وقوية بشكل عام، إلا أن هناك تباينًا كبيرًا عبر مجموعات البيانات. القيمة 731، ؛ الشكل 2 والجدول الممتد 1)، مما يوحي بأن استجابات ER للاحتباس الحراري تختلف عبر الزمن و/أو المكان. ظلت الاستجابة المتوسطة لـ ER إيجابية ولم تختلف بشكل كبير عبر الفئات العمرية الأربع (الشكل 3أ)، وبالتالي استمر التأثير الإيجابي العام للاحتباس الحراري على مدى فترة 2.5 عقود من الزمن لهذه التجارب. أظهرت التحقيقات في الأنماط الزمنية مزيدًا من المؤشرات على استجابات غير خطية وإيجابية مع مرور الوقت (الشكل 3أ، ب والجدول الممتد 2): انخفاض في حجم الاستجابة الإيجابية لـ ER (لا تزال) خلال 5-9 سنوات من الاحتباس الحراري (قيمة أهمية الوسيط أو ; الشكل 3ب) تلاه زيادة في الحجم خلال 10-14 سنة من الاحترار ( ; الشكل 3ب). جنبًا إلى جنب مع عدم وجود تغيير في حجم استجابة ER بمرور الوقت خلال أكثر من 15 عامًا من الاحترار
الشكل 4 | التأثيرات غير المباشرة للاحتباس الحراري على استجابة ER للاحتباس الحراري.
التغيرات الناتجة عن الاحترار في تركيز النيتروجين الكلي (أ) ودرجة حموضة التربة في الطبقة المعدنية (ب) أثرت على استجابة معدل التنفس التجريبي للاحتباس الحراري. التغيرات الناتجة عن الاحترار في النيتروجين الكلي ودرجة الحموضة على تُقاس المحاور كقيم SMDs لـ Hedges لظروف التربة بين المواقع المدفأة والمراقبة، على سبيل المثال، (متوسط TN للمواقع المدفأة – متوسط TN للمواقع المراقبة) / الانحراف المعياري المجمّع. تُظهر قيم SMDs لـ Hedges لـ ER لمجموعات البيانات الفردية على محور مع فقاعات رمادية، تم حسابه كالتالي (متوسط ER للرسوم المدفأة – متوسط الرسوم الضابطة) / الانحراف المعياري المجمّع. حجم الفقاعة يدل على وزن الملاحظة المستخدمة في التحليل التراجعي الكمي، والذي يتم تحديده كعكس الجذر التربيعي لتباين داخل الدراسة، مع وجود فقاعات أكبر تشير إلى أوزان أكبر. خطوط الانحدار المهمة مع مُظهَرة بخطوط زرقاء
والمناطق المظللة، على التوالي. في أسفل اليسار من كل لوحة يظهر Qm (قيمة أهمية العوامل البيئية)، قيمة نموذج الميتا-انحدار وحجم العينة ( ، عدد مجموعات البيانات). الخط الأفقي المنقط الأسود تمثل عدم وجود تغيير في ER مع الاحترار، بينما تمثل المناطق أعلاه وأدناه زيادة (SMD > 0) مقابل انخفاض (SMD < 0) في ER مع الاحترار. الخطوط الأفقية المتقطعة ( و تعكس القيم الصغيرة والمتوسطة والكبيرة من SMD هيدجز الإيجابية والسلبية، على التوالي. ، أو تزايد أكبر في الزيادة والنقصان في ER مع الاحترار. الخط العمودي المنقط الأسود ( لا يعكس أي تغيير في حالة التربة مع الاحترار (حيث تمثل المناطق على اليمين واليسار منه ظروفًا متزايدة مقابل ظروف متناقصة مع الاحترار). لمخرجات النموذج التفصيلية، انظر الجدول 3 في البيانات الموسعة.
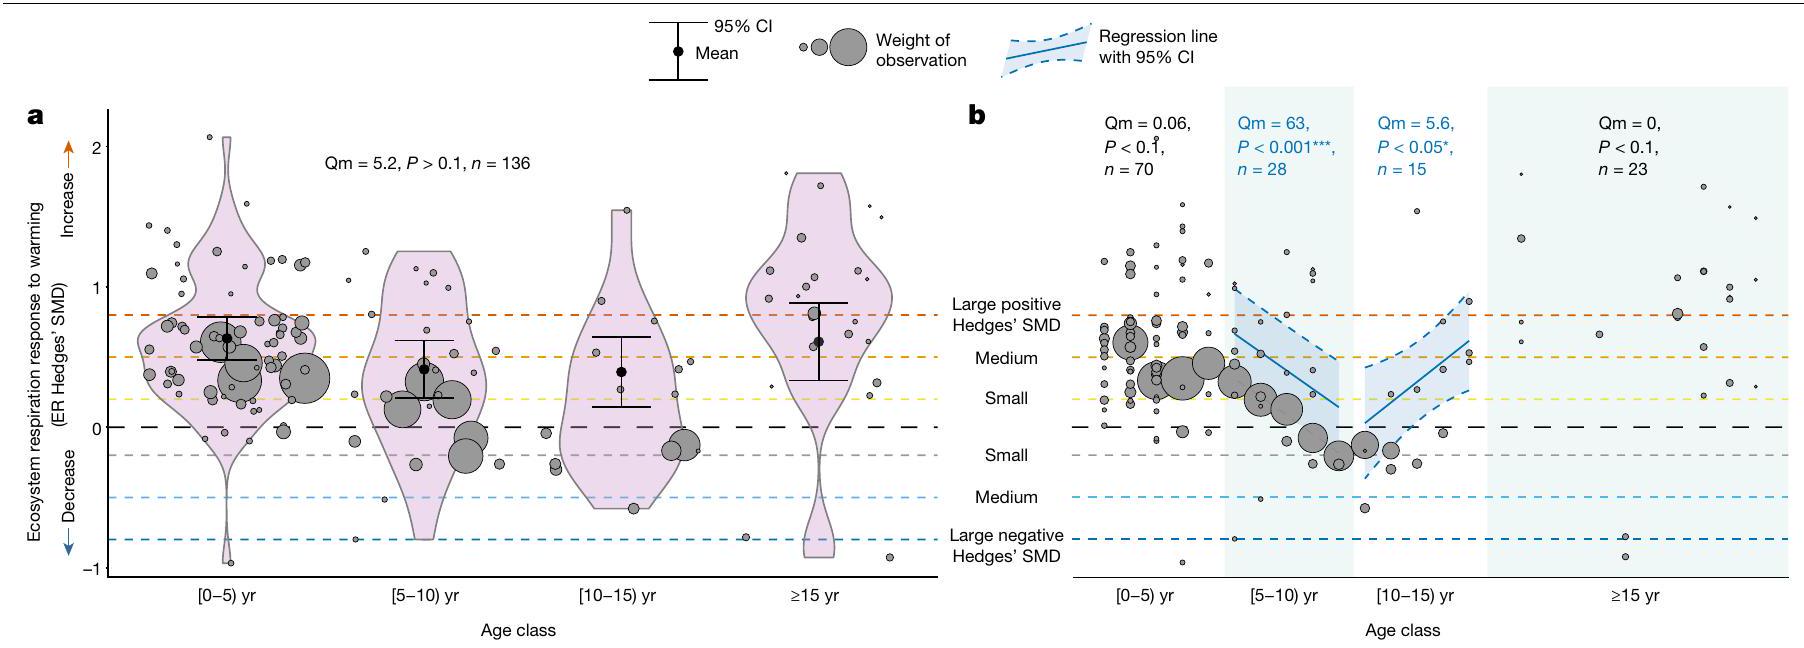
كان الميل العام عبر جميع السنوات غير ذي دلالة، مما يشير إلى أن ER استمر في أن يكون إيجابيًا في المواقع ذات تاريخ الاحترار الأطول (الشكل 3 أ والجدول 2 من البيانات الموسعة). على الرغم من أن استجابة ER للاحتباس الحراري التجريبي قد تتراجع في نهاية العقد الأول من الاحترار، إلا أن بياناتنا لا تقدم دليلًا على أن استجابات ER للاحتباس الحراري التجريبي تتراجع على المدى الطويل (أي، على مدى عدة عقود).

آثار الاحترار غير المباشرة

تم دفع التباين في حجم استجابة معدل التنفس التربة (ER) للاحتباس الحراري في التندرا بواسطة التباين في كيفية تغيير الاحتباس الحراري بشكل غير مباشر لظروف التربة في الطبقة المعدنية، أي تركيز النيتروجين الكلي (TN) ودرجة الحموضة (pH) (الشكل 4 والبيانات الموسعة الجدول 3). على النقيض من ذلك، لم يكن التباين في استجابة ER مدفوعًا بالاختلافات في كيفية تغيير الاحتباس الحراري للمناخ المحلي أو هيكل مجتمع النباتات (على سبيل المثال، الكتلة الحيوية) وتكوينها (على سبيل المثال، تغطية الطحالب) (البيانات الموسعة الجدول 3)، على الرغم من أن الاحتباس الحراري أدى إلى تغييرات في الأخيرة (الجدول التكميلي 3). على وجه التحديد، زاد ER أكثر مع الاحتباس الحراري في التجارب التي عزز فيها الاحتباس الحراري الزيادات الأكبر في تركيز TN في الطبقة المعدنية. ; الشكل 4أ) أو تسبب في تقليلات أصغر في طبقة المعادن ، ; الشكل 4ب). تشير الزيادات الأكبر في تركيز TN والانخفاضات الأصغر في pH مع الاحترار إلى زيادات أكبر في تَحَول النيتروجين ودورة النيتروجين مع الاحترار أو تنشيط النشاط الميكروبي. . جنبًا إلى جنب مع نتائج تقسيم ER لدينا التي تظهر زيادة في التنفس غير الذاتي وكذلك التنفس الذاتي مع ارتفاع درجات الحرارة ( قد تؤدي تحفيز كل من النشاط الميكروبي والنباتي إلى الزيادة الملحوظة في انبعاثات الكربون مع ارتفاع درجات الحرارة (البيانات الموسعة الجدول 1 والنقاش التكميلية 1). تستند هذه النتيجة إلى 9 من أصل 136 مجموعة بيانات ويجب التحقق منها من خلال دراسات تقسيم انبعاثات الكربون واسعة النطاق في المستقبل. تمثل هذه المجموعات التسع جميع بيانات التقسيم المتاحة الآن من 56 تجربة، مما يبرز التحديات المنهجية في قياس تقسيم انبعاثات الكربون في تجربة تسخين طويلة الأمد.

استجابات التنفس المعتمدة على السياق

من المدهش أن التباين في استجابة انبعاثات الكربون إلى الاحترار لم يكن مرتبطًا بأي من العوامل البيئية المحددة المتوقعة التي تعكس الظروف المناخية المتنوعة للتندرا أو تركيبة المجتمع النباتي. لم تؤثر أي من العوامل المناخية (مثل متوسط درجة الحرارة المحيطة واحتمالية وجود التربة المتجمدة) أو عوامل المجتمع النباتي (مثل فئة النبات وإنتاجية الكتلة الحيوية الصافية) على استجابة انبعاثات الكربون عبر التدرج البيئي الزمني والمكاني الكبير الذي تغطيه 56 تجربة (الشكل 1، الشكل الإضافي 2 والجدول الإضافي 4). ومع ذلك، أكدت تحليلاتنا بعض الاعتماديات السياقية المتوقعة في استجابة انبعاثات الكربون المتعلقة بظروف التربة (الشكل 5، الجدول الإضافي 4 والطرق التكميلية). أظهرت المواقع الفقيرة بالمغذيات، أي المواقع ذات تركيز النيتروجين الكلي المنخفض أو ذات نسب الكربون إلى النيتروجين الأعلى في الطبقة المعدنية، زيادات أكبر في انبعاثات الكربون مع الاحترار مقارنة بالمواقع الغنية بالمغذيات. , نسبة الكربون إلى النيتروجين: قد يرتبط زيادة معدل استجابة التنفس (ER) مع ارتفاع درجات الحرارة في المواقع الفقيرة بالمغذيات بالتغيرات في تخصيص الكربون تحت الأرض المحفز من قبل النباتات والتعزيز اللاحق للتربة بواسطة عصارات الجذور. “. أي أن الاحترار قد أظهر أنه يزيد من إنتاج الجذور وبالتالي يتوفر الكربون القابل للتغير للكائنات الحية في منطقة الجذور (أي تنشيط منطقة الجذور) ). خاصة في الظروف الفقيرة بالمغذيات، يعزز هذا التهيئة التحلل، مما يزيد من توفر المغذيات للنباتات (وربما TN في الطبقة المعدنية) وفي النهاية يحفز التنفس الذاتي والتنفسي غير الذاتي. يلعب تأثير التهيئة دورًا أكبر في هذه الأنظمة بسبب ارتفاع تكاليف اكتساب النيتروجين وبالتالي عائد الاستثمار الأكبر من التهيئة، للنباتات في الأنظمة المحدودة بالنيتروجين. وبالتالي، تشير نتائجنا إلى أن تنشيط الجذور والاستجابات المرتبطة بتسريع التحلل من خلال التنشيط قد تعتمد على درجة نقص النيتروجين في مواقع التندرا. على الرغم من أننا لم نجد عوامل نباتية أو مجتمعية ميكروبية تؤثر على حجم استجابة انبعاثات الكربون، فإن أهمية هذه المعلمات التربة تشير بشكل غير مباشر إلى أن كل من العمليات النباتية والميكروبية تلعب دورًا في حساسية استجابة انبعاثات الكربون للاحتباس الحراري.
شكل. | الاعتماديات السياقية في استجابة نظام الإيكولوجيا للتسخين. أ، ب، TN
تركيز (%) (أ) ونسبة C:N (ب) لطبقة التربة المعدنية أثرت على استجابة ER للاحتباس الحراري التجريبي. العوامل البيئية على محور يعكس القيم المتوسطة لظروف التربة المقاسة في قطع التحكم لكل تجربة مع البيانات المتاحة. يتم عرض SMDs لـ ER Hedges لمجموعات البيانات الفردية على محور مع فقاعات رمادية، تم حسابه كالتالي (متوسط ER للرسوم البيانية المدفأة – متوسط الرسوم البيانية الضابطة) / الانحراف المعياري المجمّع. حجم الفقاعة يدل على وزن الملاحظة المستخدمة في التحليل التلوي، والذي يتم قياسه كعكس الجذر التربيعي لتباين داخل الدراسة، مع وجود فقاعات أكبر تشير إلى أوزان أكبر. خطوط الانحدار المهمة مع هم

الآثار العالمية لروابط النبات والتربة

قد تكون نسبة الاحترار في بيئة التندرا تصل إلى لكل عقد (التندرا القطبية )، التي تتجاوز بشكل كبير المعدل العالمي لـ لكل عقد . إن الاحترار التجريبي الكبير لـ ، أي ما يعادل عقدين من الاحترار الإقليمي عبر التندرا، زاد من معدل التنفس في موسم النمو بمعدل لكن مع تباين كبير في حجم هذه الاستجابة. كانت العوامل البيئية التي تؤثر على تباين استجابة معدل التنفس للاحتباس الحراري مرتبطة بالمدى الذي أثر فيه الاحتباس الحراري على معايير التربة المتعلقة بالنيتروجين وسياق الكيمياء الحيوية للتربة المحددة. من المهم أن يؤثر تباين هذه العوامل البيئية على حجم استجابة معدل التنفس للاحتباس الحراري، حيث ظلت الاستجابة العامة إيجابية.
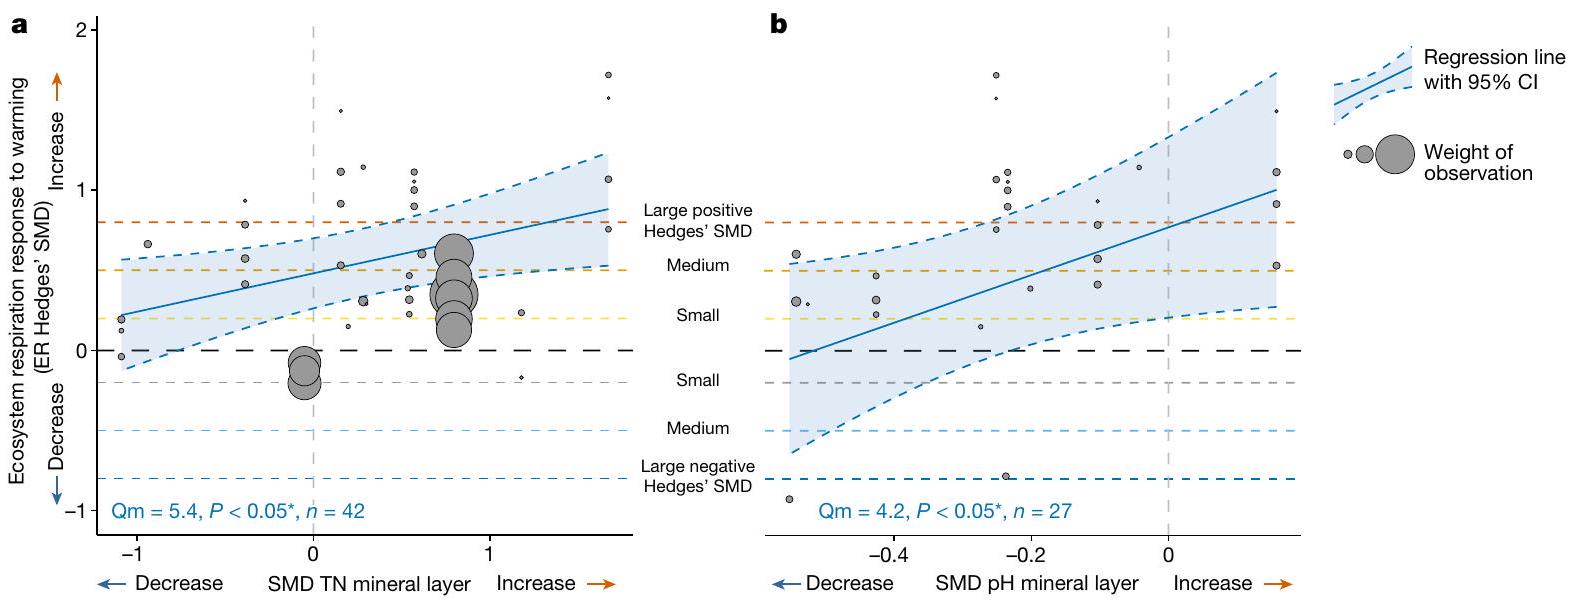
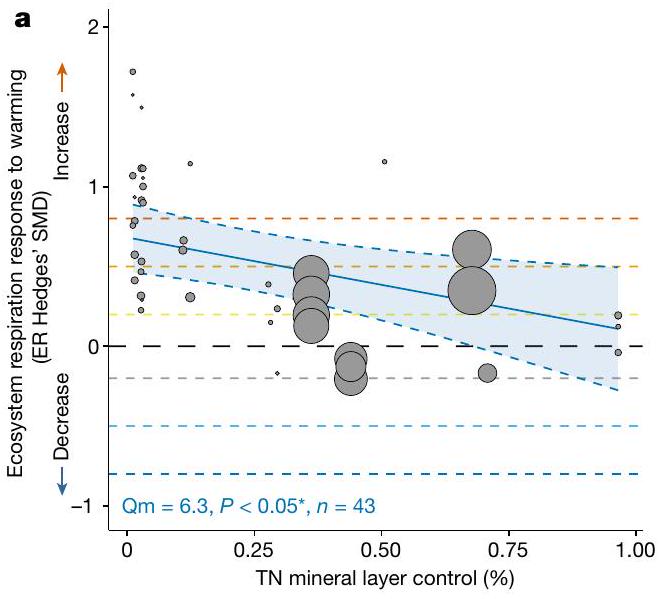
تظهر نتائجنا أهمية الظروف المحلية للتربة في التوسط في تأثيرات الاحترار المستقبلية على التنفس، وبشكل خاص من طبقة التربة المعدنية الأعمق في ملف التربة. يمكن أن يحفز الاحترار التجريبي بشكل غير متناسب كل من النشاط الميكروبي ونشاط جذور النباتات، وبالتالي معدل التنفس، في طبقات التربة المعدنية أو الأعمق لكن القليل من الدراسات حددت العمق الذي ينشأ منه معظم الزيادة في معدل التنفس بسبب القيود المنهجية. تظهر بياناتنا أن حجم الزيادة في معدل التنفس الناتجة عن الاحترار في مواقع التندرا مرتبط ارتباطًا وثيقًا بالظروف الكيميائية الحيوية، خاصة لدورة النيتروجين والتغيرات فيها، في الطبقة المعدنية الأعمق. هذا يؤكد النتائج السابقة التي تشير إلى أن الاحترار قد يكون له أقوى تأثير على الظروف الكيميائية الحيوية في العمق بدلاً من الطبقات العضوية السطحية أو تحت السطحية. قد تحدد التوافر النسبي للنيتروجين في طبقة التربة المعدنية معدل دوران النيتروجين الناتج عن الاحترار في أنظمة التندرا من خلال الروابط بين النباتات والتربة المعنية في عمليات التحلل وعمليات تنشيط الجذور . نفترض أن مواقع التندرا المحدودة بالنيتروجين، التي تتميز بتكاليف أعلى لاكتساب النيتروجين، تستجيب بشكل أكبر في استجابتها لمعدل التنفس للاحتباس الحراري من خلال تأثيرات أقوى للاحتباس الحراري على التحلل وتنشيط الجذور في هذه المواقع . يتوافق هذا مع العلاقة السلبية بين تركيز النيتروجين الكلي في الطبقة المعدنية والتغير في النيتروجين الكلي مع الاحترار (معامل الارتباط = -0.43)، مما يشير إلى أن المواقع المحدودة بالنيتروجين أظهرت أيضًا تحفيزًا أقوى لدوران المغذيات للنباتات والميكروبات في ظل ظروف أكثر دفئًا.

موضحة بخطوط زرقاء ومناطق مظللة باللون الأزرق، على التوالي. في أسفل اليسار في كل لوحة يظهر Qm ( قيمة أهمية العوامل البيئية)، قيمة نموذج الميتا-انحدار وحجم العينة ( ، عدد مجموعات البيانات). تمثل الخط الأفقي المنقط الأسود عدم وجود تغيير في معدل التنفس مع الاحترار بينما تمثل المناطق أعلاه وأسفل زيادة (SMD > 0) مقابل انخفاض (SMD < 0) في معدل التنفس مع الاحترار. تعكس الخطوط الأفقية المنقطة ( ، و ) تأثيرات صغيرة ومتوسطة وكبيرة إيجابية وسلبية على التوالي ، أو زيادات وانخفاضات متزايدة في معدل التنفس مع الاحترار. للحصول على مخرجات نموذج مفصلة، انظر الجدول 4 من البيانات الموسعة.

أنماط مكانية

من خلال توسيع نتائج الميتا-انحدار لدينا، التي تتنبأ باستجابة معدل التنفس للاحتباس الحراري بناءً على العوامل المهمة المعتمدة على السياق (إجمالي النيتروجين و في الطبقة المعدنية، نسبة المتوسطات (ROM) = (الشكل 5)، نقوم بتصوير الفروق المكانية في حساسية استجابة معدل التنفس للاحتباس الحراري عبر المنطقة القطبية والمنطقة الجبلية المحيطة بالقطب. المناطق الأكثر حساسية للاحتباس الحراري هي الأجزاء الغربية والشرقية من سيبيريا وأجزاء من أرخبيل كندا القطبي (الشكل 6). ومع ذلك، فإن عدم اليقين العالي في هذه التقديرات (الشكل 6ب) يبرز الحاجة الملحة لمعالجة فجوات العينة المكانية في الدراسات اللاحقة . نوضح أيضًا أن معظم عدم اليقين ينشأ من بيانات الإدخال لتوسيع النطاق (الشكل 6ج)، أي من بيانات التربة العالمية الموزعة على الشبكة (الطرق)، والتي تمثل حوالي من إجمالي عدم اليقين. بالنظر إلى هذه الشكوك، لا يزال بإمكاننا استخدام نموذجنا لتقديم تقدير لمقدار الكربون الذي سيتم تنفسه بواسطة الاحترار مقارنةً بدرجات الحرارة الحالية، عبر منطقة التندرا (الشكل 6 والشكل التكميلية 7). بالنسبة لمنطقة التندرا القطبية وحدها، تشير تماريننا في التوسيع إلى أن ارتفاع درجة الحرارة بمقدار سيعزز معدل التنفس من 1.2 إلى (زيادة بمقدار مع انحراف معياري قدره )، وهو ما يتوافق مع زيادة قدرها (انحراف معياري ). عبر مناطق التندرا القطبية والجبلية مجتمعة، سيزداد معدل التنفس من 3.4 إلى (زيادة بمقدار مع انحراف معياري قدره ) مما يتوافق مع زيادة قدرها (انحراف معياري ).
تتطلب نماذج المناخ العالمية والإقليمية التي تتنبأ بانبعاثات الكربون المستقبلية فهمًا قويًا للآليات وراء الفروق المكانية في استجابة معدل التنفس للاحتباس الحراري. يجب أن يسهل الفهم الآلي الذي توفره هذه الدراسة والمستند إلى بيانات تجريبية ميدانية في إعدادات العالم الحقيقي (على سبيل المثال، العلاقة بين النيتروجين في التربة ودرجة الحموضة واستجابة معدل التنفس للاحتباس الحراري) تطوير النماذج وتحسين التنبؤات بالتغيرات في دورة الكربون مع الاحترار المستقبلي . من خلال تقدير الفروق المكانية في حساسية استجابة معدل التنفس للاحتباس الحراري، يمكن استخدام نتائجنا كمعيار لمكونات رئيسية من دورة الكربون لأنظمة التندرا في هذه النماذج المناخية. تركز دراستنا على أنماط موسم النمو ولكن التحقيق في كيفية تغير معدل التنفس مع الاحترار على مدار العام بأكمله سيكون أيضًا مهمًا لتحسين نماذج المناخ . لأن التوسع
الشكل 6 | الأنماط المكانية وعدم اليقين في حساسية معدل التنفس للاحتباس الحراري عبر التندرا. خرائط توضح التوسع المكاني لنتائج الميتا-انحدار لتأثيرات الاحترار على تنفس النظام البيئي (معدل التنفس) والشكوك المرتبطة بها عبر التندرا القطبية والجبلية المحيطة بالقطب. أ، التوزيع المكاني للتغيرات النسبية المتوقعة في معدل التنفس الناتجة عن الاحترار الهوائي. تم الحصول على القيم من خلال دمج نموذج الميتا-انحدار متعدد العوامل المهم مع بيانات التربة العالمية الموزعة على الشبكة لتركيز النيتروجين الكلي ونسبة الكربون إلى النيتروجين في الطبقة المعدنية (الطرق). القيم المرسومة هي قيم متوسطة متوقعة معبرة كنسبة مئوية من التغير عن مستويات معدل التنفس الحالية. بالنسبة للمنطقة بأكملها، زاد معدل التنفس من 3.4 إلى (زيادة بمقدار مع انحراف معياري قدره ) أو بمقدار (انحراف معياري ). ب، عدم اليقين في التغيرات المقدرة في معدل التنفس معبرًا عنه كمعاملات التباين (الانحرافات المعيارية لتنبؤات النموذج مقسومة على القيم المتوقعة المتوسطة). يتم حساب هذه الانحرافات المعيارية باستخدام انتشار خطأ مونت كارلو الذي يتضمن عدم اليقين المرتبط بـ
(1) معلمات نموذج الميتا-انحدار و(2) قيم إدخال قاعدة بيانات التربة (الطرق). ج، المساهمة النسبية لعدم اليقين في معلمات النموذج مقابل عدم اليقين في بيانات إدخال التربة لتقديرات الانحراف المعياري لمونت كارلو. تم إجراء انتشار الخطأ مرتين، أولاً من خلال دمج كلا مصدرين من عدم اليقين كما في ب، ثم من خلال تثبيت معلمات الميتا-انحدار على تقديراتها المتوسطة والسماح فقط لبيانات إدخال التربة بالتغير. تظهر القيم المرسومة نسبة الانحرافات المعيارية الناتجة، أي، عدم اليقين في إدخال التربة فقط/عدم اليقين المدمج. الألوان الأقرب إلى الأخضر تشير إلى خلايا الشبكة التي يقود فيها عدم اليقين في استجابات معدل التنفس للاحتباس الحراري بشكل أساسي خطأ في تقديرات معلمات نموذج الميتا-انحدار؛ الألوان الأقرب إلى الأرجواني تشير إلى خلايا الشبكة التي يقود فيها عدم اليقين في توقع معدل التنفس بشكل أكبر عدم الدقة في بيانات قاعدة بيانات التربة. تم إنشاء الخرائط باستخدام Natural Earth (https://www.naturalearthdata.com/).
سيعزز فهمنا فقط من خلال توسيع قاعدة البيانات عبر الزمن والمكان ، نرحب بمساهمات قياسات معدل التنفس التي تم أخذها في تجارب الاحترار الجديدة عبر التندرا، أو في سنوات جديدة للتجارب المدرجة: http://www.tundrafluxdatabase.com/.
تعتمد شدة التغذية الراجعة للكربون والمناخ على المدى الطويل بشكل حاسم على التوازن بين امتصاص الكربون من خلال التغيرات في نشاط التمثيل الضوئي وإطلاق الكربون من خلال التغيرات في . ركزنا على معدل التنفس كعنصر حاسم في هذا التوازن وقيمنا كيف قد يتغير معدل التنفس مع الاحترار المستقبلي. وجدنا زيادات مستدامة في معدل التنفس عبر 25 عامًا من الاحترار التجريبي. تم ملاحظة زيادات قصيرة الأمد في معدل التنفس لمدة عامًا من الاحترار التجريبي في عدة دراسات لموقع واحد ولكن ليس جميعها بالإضافة إلى الدراسات العالمية أو الدراسات في المناطق ذات العروض العليا تحليلات ميتا وفي بعض الدراسات طويلة الأمد تم متابعة زيادات متجددة في التنفس مع استمرار مدة الاحترار وجدنا نمطًا زمنيًا متناقصًا ومتزايدًا في حجم استجابة التنفس الإيجابي (ER) للاحتباس الحراري بين 5-10 سنوات و10-15 سنة من الاحتباس الحراري، على التوالي، وعدم وجود ميل عام ملحوظ عند التقييم عبر 25 سنة من الاحتباس الحراري (الشكل 3). تسلط هذه النتائج الضوء على نتيجتين رئيسيتين. أولاً، في نظم التندرا البيئية، يبقى التنفس الإيجابي معززًا مع استمرار الاحتباس الحراري، على الأقل حتى 2.5 عقود. ثانيًا، تُظهر استجابة التنفس الإيجابي للاحتباس الحراري اتجاهًا غير خطي على مر الزمن بين 5 و15 سنة من الاحتباس الحراري، حيث تنخفض استجابة التنفس الإيجابي في الحجم، وبعد ذلك ترتفع مرة أخرى. قد يكون هذا النمط غير الخطي لزيادة التنفس الإيجابي مع مرور الوقت ناتجًا عن العمليات الميكروبية والنباتية الأساسية التي تستجيب للاحتباس الحراري بمعدلات مختلفة، على سبيل المثال، تتراوح بين التأثيرات الفورية للاحتباس الحراري على تنفس الميكروبات والنباتات من خلال تسريع التحلل مقابل التأثيرات الأبطأ من خلال التغيرات في الظروف البيوجيوكيميائية والهيدرولوجية للتربة وكذلك في تركيب المجتمع الميكروبي أو النباتي. . يتم تأكيد ذلك من خلال الأهمية الواضحة للتغيرات في الظروف البيوجيوكيميائية للتربة كعوامل تؤثر على التغير في زيادة معدل التنفس التربة. تشير نتائجنا إلى أن العديد من هذه الآليات الأبطأ وغير المباشرة لتأثيرات الاحترار على معدل التنفس التربة، أي غير المباشرة
تأثيرات الاحترار على الإنتاجية البيئية من خلال التغيرات في توفر العناصر الغذائية في التربة، أصبحت واضحة بالفعل خلال فترة تصل إلى 25 عامًا من دراسات الاحترار التجريبية في التندرا.
أخيرًا، أظهرت تحليلات تقسيم ER لدينا أن الزيادات في ER مع الاحترار كانت مدفوعة على الأرجح بكل من زيادة التنفس المرتبط بالنباتات والتنفس غير الذاتي. تشير هذه النتائج مجتمعة إلى أن المخزونات الكبيرة من الكربون في أنظمة التندرا لديها القدرة على التحول من العمل كمصيدة كربون عالمية إلى مصدر إذا زادت درجات الحرارة إلى حد يجعل التنفس الإضافي للكربون لا يمكن تعويضه بزيادات قوية مماثلة في النباتات. امتصاص .

المحتوى عبر الإنترنت

أي طرق، مراجع إضافية، ملخصات تقارير Nature Portfolio، بيانات المصدر، بيانات موسعة، معلومات إضافية، شكر وتقدير، معلومات مراجعة الأقران؛ تفاصيل مساهمات المؤلفين والمصالح المتنافسة؛ وبيانات توفر البيانات والرموز متاحة علىhttps://doi.org/10.1038/s41586-024-07274-7.
  1. شور، إ. أ. ج. وآخرون. التربة المتجمدة وتغير المناخ: ردود فعل دورة الكربون من القطب الشمالي الدافئ. مراجعة سنوية للموارد البيئية 47، 343-371 (2022).
  2. تارنوكاي، سي. وآخرون. خزانات الكربون العضوي في التربة في منطقة التربة الصقيعية القطبية الشمالية. الدورات البيوجيوكيميائية العالمية.https://doi.org/10.1029/2008GBO03327 (2009).
  3. فيركالا، أ.-م. وآخرون. الترقية الإحصائية للنظام البيئي التدفقات عبر التندرا الأرضية والنطاق الشمالي: الأنماط الإقليمية والشكوك. تغير المناخ العالمي 27، 4040-4059 (2021).
  4. كارهو، ك. حساسية درجة الحرارة لمعدلات تنفس التربة المعززة باستجابة المجتمع الميكروبي. ناتشر 513، 81-83 (2014).
  5. راستاد، ل. إ. وآخرون. تحليل ميتا لاستجابة تنفس التربة، وتحرير النيتروجين الصافي، ونمو النباتات فوق الأرض للاحترار التجريبي للنظام البيئي. أوكولوجيا 126، 543-562 (2001).
  6. كاري، ج. سي. وآخرون. استجابة درجة حرارة تنفس التربة لم تتغير بشكل كبير مع التسخين التجريبي. وقائع الأكاديمية الوطنية للعلوم في الولايات المتحدة الأمريكية 113، 13797-13802 (2016).
  7. بوسكيل، ن. ج.، رايلي، و. ج. وغرانت، ر. ف. ستكون ردود الفعل الكربونية المناخية في ألاسكا أضعف مما تم استنتاجه من التجارب قصيرة الأجل. نات. كوميون. 11، 5798 (2020).
  8. شادل، سي. وآخرون. أنماط متباينة من الديناميات الكربونية لنظام التربة المتجمدة المستندة إلى التجارب والنماذج استجابةً للاحتباس الحراري في القطب الشمالي. رسائل البحث البيئي 13، 105002 (2018).
  9. لو، م. وآخرون. استجابات دورة الكربون في النظام البيئي للاحتباس الحراري التجريبي: تحليل شامل. علم البيئة 94، 726-738 (2013).
  10. ناتالي، س. م. وآخرون. خسارة كبيرة من في الشتاء لوحظ عبر منطقة التربة المتجمدة الشمالية. Nat. Clim. Change 9، 852-857 (2019).
  11. أوبر باور، س. ف. وآخرون. التندرا التدفقات استجابةً للتسخين التجريبي عبر التدرجات العرضية والرطوبة. المجلة البيئية. 77، 221-238 (2007).
  12. شور، إ. أ. ج. وآخرون. ضعف الكربون في التربة المتجمدة أمام تغير المناخ: الآثار على الدورة الكربونية العالمية. علوم الحياة 58، 701-714 (2008).
  13. بوند-لامبرتي، ب.، وانغ، ج. وغاور، س. ت. علاقة عالمية بين المكونات غير الذاتية والذاتية للتنفس التربة؟ بيولوجيا التغير العالمي 10، 1756-1766 (2004).
  14. تحديث تغير المناخ في القطب الشمالي 2021: الاتجاهات الرئيسية والتأثيرات. ملخص لصانعي السياسات (AMAP، 2021).
  15. رانتانين، م. وآخرون. لقد ارتفعت درجة حرارة القطب الشمالي تقريبًا أربع مرات أسرع من الكرة الأرضية منذ عام 1979. اتصالات الأرض والبيئة 3، 168 (2022).
  16. بوسكيل، ن. ج.، رايلي، و. ج. وتانغ، ج. ي. تحليل ميتا لدراسات إضافة النيتروجين والتسخين في المناطق ذات العرض العالي يشير إلى آليات بيئية تم تجاهلها من قبل نماذج الأراضي. علوم البيوجيوكيمياء 11، 6969-6983 (2014).
  17. فان جيستيل، ن. وآخرون. توقع فقدان الكربون في التربة مع ارتفاع درجات الحرارة. ناتشر 554، E4-E5 (2018).
  18. هيكس برايز، سي. إي. وآخرون. تسبب الاحترار العقدي في تحول متسق ومستمر من التنفس غير الذاتي إلى التنفس الذاتي في نظم بيئية مختلفة من التربة المتجمدة. بيولوجيا التغير العالمي 21، 4508-4519 (2015).
  19. دورباال، إ. وآخرون. تنفس الكربون من الخث تحت السطح تسارع بفعل الاحترار المناخي في المناطق شبه القطبية. ناتشر 460، 616-619 (2009).
  20. ناتالي، س. م. وآخرون. آثار التسخين التجريبي للهواء والتربة والتربة المتجمدة على توازن الكربون في التندرا الألاسكية. التغير العالمي في البيولوجيا 17، 1394-1407 (2011).
  21. روميرو-أوليفاريس، أ. ل.، أليسون، س. د. وتريسييدر، ك. ك. ميكروبات التربة واستجابتها للاحتباس الحراري التجريبي على مر الزمن: تحليل شامل للدراسات الميدانية. علم الأحياء والتغذية في التربة 107، 32-40 (2017).
  22. وانغ، إكس. وآخرون. تنفس التربة تحت ارتفاع درجة حرارة المناخ: استجابة مختلفة للتنفس غير الذاتي والتنفس الذاتي. التغير العالمي في البيولوجيا 20، 3229-3237 (2014).
  23. شافر، ج. ر. وآخرون. الاحترار العالمي والنظم البيئية الأرضية: إطار مفاهيمي للتحليل: ستكون استجابات النظم البيئية للاحتباس الحراري معقدة ومتنوعة. علوم الحياة 50، 871-882 (2000).
  24. كريستيانسن، سي. تي. وآخرون. زيادة الاحترار الصيفي تقلل من تنوع الفطريات المحللة وفقدان كتلة الأوراق بشكل أقوى في التندرا الجافة مقارنة بالتندرا الرطبة. التغير العالمي في البيولوجيا 23، 406-420 (2017).
  25. شارن، ر.، ليتل، ج. ج.، بيكون، ج. د.، ألاتالو، ج. م. وأنتونيلي، أ. انخفاض رطوبة التربة بسبب الاحترار يدفع التنوع النشوء والتطور وانتقالات المجتمع في التندرا. رسائل البحث البيئي 16، 064031 (2021).
  26. شور، إ. أ. ج. وآخرون. تغير المناخ واستجابة الكربون في التربة المتجمدة. ناتشر 520، 171-179 (2015).
  27. بولد، ج.، بايلاجيون، ن.، ليبي، أ.، راستتر، إ. ب. وسستلا، س. أ. تأثيرات الاحترار على الكيمياء الحيوية للتندرا القطبية محدودة ولكن تعتمد على الموائل: تحليل شامل. إيكوسفير 12، e03777 (2021).
  28. إلمندورف، س. ج. وآخرون. أدلة على تغيير نباتات التندرا على مستوى القطعة وروابطها مع الاحترار الصيفي الأخير. نات. مناخ. تغيير 2، 453-457 (2012).
  29. جانبيل، م. وآخرون. استجابات محددة للموقع لوفرة الفطريات والبكتيريا للتسخين التجريبي في النفايات والتربة عبر التندرا القطبية والتندرا الجبلية. العلوم القطبية. https:// doi.org/10.1139/as-2020-0053 (2021).
  30. بيوركمان، أ. د. وآخرون. تغيير الصفات الوظيفية للنباتات عبر بيئة التندرا المتزايدة الحرارة. ناتشر 562، 57-62 (2018).
  31. نيبرغ، م. & هوفندن، م. ج. زيادة درجة الحرارة تزيد من تنفس التربة في تربة غنية بالكربون دون تغيير الإمكانات التنفسية الميكروبية. علوم الأحياء الجيولوجية 17، 4405-4420 (2020).
  32. كيبر، ف. وآخرون. فقدان الكربون من تربة الجليد الدائم في المناطق القطبية الشمالية المعزز بواسطة تنشيط الجذور. نات. جيوسي. 13، 560-565 (2020).
  33. شافر، أ. ج. ر.، ستريت، ل. إ.، راستتر، إ. ب.، فان ويك، م. ت. وويليامز، م. التقارب الوظيفي في تنظيم صافي التدفق في المناظر الطبيعية التندرا غير المتجانسة في ألاسكا والسويد. J. Ecol. 95، 802-817 (2007).
  34. كونانت، ر. ت. وآخرون. حساسية تحلل المادة العضوية للاحتباس الحراري تختلف حسب جودتها. التغيرات العالمية في البيولوجيا 14، 868-877 (2008).
  35. باو، ت.، زو، ر.، لي، إكس.، يي، و. وتشينغ، إكس. تأثيرات المتغيرات البيئية المتعددة على تنفس نظام التندرا البيئي في القارة القطبية الجنوبية البحرية. تقارير العلوم. 8، 12336 (2018).
  36. ستيوارت تشابين، ف. الثالث وآخرون. دورة الكربون العالمية المتغيرة: ربط ديناميات الكربون في النبات والتربة بالعواقب العالمية. مجلة علم البيئة 97، 840-850 (2009).
  37. أليسون، س. د.، روميرو-أوليفاريس، أ. ل.، لو، ي.، تايلور، ج. و تريسييدر، ك. ك. حساسية درجات الحرارة للإنزيمات خارج الخلوية و عبر البيئات الحرارية. التغير العالمي في علم الأحياء 24، 2884-2897 (2018).
  38. ديفيدسون، إ. أ. وجانسنس، إ. أ. حساسية درجة الحرارة لتحلل الكربون في التربة والتغذية الراجعة لتغير المناخ. ناتشر 440، 165-173 (2006).
  39. باو، ت.، جيا، ج. & شو، إكس. ضعف مصدات غازات الدفيئة في الأراضي الرطبة البكر تحت تأثير الاحترار. نات. تغير المناخhttps://doi.org/10.1038/s41558-023-01637-0 (2023).
  40. جيزلر، ر.، إسبيرغ، س.، لاجيرستروم، أ. وغراي، ب. توافر الفوسفور والتنفس الميكروبي عبر أنواع مختلفة من نباتات التندرا. الكيمياء الحيوية 108، 429-445 (2012).
  41. ميكونن، ز. أ.، رايلي، و. ج. وغرانت، ر. ف. قد تؤدي شجيرات التندرا في القرن الحادي والعشرين إلى تعزيز امتصاص الكربون الصافي في تندرا القطب الشمالي في أمريكا الشمالية تحت مسار مناخ RCP8.5. رسائل البحث البيئي 13، 054029 (2018).
  42. باركر، ت. س. وآخرون. تخصيص الجذور بواسطة الأنواع التي تشكل المظلة تهيمن على التربة تدفق في منظر طبيعي شبه قطبي. نيو فيتولوجي. 227، 1818-1830 (2020).
  43. سيستلا، س. أ. وآخرون. الاحترار على المدى الطويل يعيد هيكلة التندرا القطبية دون تغيير صافي تخزين الكربون في التربة. الطبيعة 497، 615-617 (2013).
  44. ماريون، ج. م. وآخرون. تصاميم مفتوحة من الأعلى للتلاعب بدرجة حرارة الحقل في النظم البيئية ذات العرض العالي. التغير العالمي في البيولوجيا 3، 20-32 (1997).
  45. وو، ز.، ديكسترا، ب.، كوتش، ج. و.، بينويلاس، ج. وهونغيت، ب. أ. استجابات النظم البيئية الأرضية لتغيرات درجة الحرارة وهطول الأمطار: تحليل شامل للتلاعب التجريبي. بيولوجيا التغير العالمي 17، 927-942 (2011).
  46. هادجز، ل. ف. نظرية التوزيع لمقدّر غلاس لحجم التأثير والمقدّرات ذات الصلة. مجلة الإحصاء التعليمي 6، 107-128 (1981).
  47. ديكسترا، ف. أ.، كاريّلو، ي.، بيندال، إ. ومورغان، ج. أ. تنشيط منطقة الجذور: منظور غذائي. فرونت. ميكروبيول. 4، 216 (2013).
  48. فينغ، ج. وزو، ب. الأنماط العالمية والعوامل المرتبطة بتأثير التهيئة استجابةً لإضافة المغذيات. علم الأحياء والتغذية التربة 153، 108118 (2021).
  49. ين، هـ. وآخرون. زيادة إفراز الجذور تحفز تحولات النيتروجين في التربة في غابة صنوبرية تحت التجارب الحرارية. التغير العالمي في البيولوجيا 19، 2158-2167 (2013).
  50. جيانغ، ز.، ليو، ي.، يانغ، ج.، تشو، ز. وغونينا، أ. تأثيرات تخصيب النيتروجين على تنشيط منطقة الجذور. تربة النبات 462، 489-503 (2021).
  51. تيرير، سي. وآخرون. استجابات النظام البيئي لارتفاع تحكمها تفاعلات النبات والتربة وتكلفة الحصول على النيتروجين. نيو فيتولوجي. 217، 507-522 (2018).
  52. الهيئة الحكومية الدولية المعنية بتغير المناخ: ملخص لصانعي السياسات. في تغير المناخ 2022: الآثار، التكيف والهشاشة (تحرير بورتنر، هـ.-أو. وآخرون) (مطبعة جامعة كامبريدج، 2022).
  53. بلوم-ويري، ج.، ميلباو، أ.، تيوبير، ل. م.، يوهانسون، م. ودورباال، إ. السكن في الأعماق – زيادة كبيرة في نمو الجذور وعمق الجذور تعزز تفاعلات النباتات مع تربة الجليد المتجمد الذائبة. نيو فيتولوجي. 223، 1328-1339 (2019).
  54. فويت، سي. وآخرون. ارتفاع درجة حرارة التندرا تحت القطبية يزيد من انبعاثات جميع غازات الدفيئة الثلاثة المهمة – ثاني أكسيد الكربون، والميثان، وأكسيد النيتروز. التغير العالمي في البيولوجيا 23، 3121-3138 (2017).
  55. لي، ف. وآخرون. تأثيرات الاحترار على تدفقات الميثان تختلف بين مرعيين جبليين بحالة مائية للتربة متباينة. الزراعة. الغابات. الأرصاد الجوية 290، 107988 (2020).
  56. بيورك، ر. ج. وآخرون. الروابط بين دوران النيتروجين وبنية مجتمع النباتات في منظر طبيعي من التندرا. التربة والنبات 294، 247-261 (2007).
  57. سوليفان، ب. و هارت، س. سي. تقييم الآليات التي تتحكم في تنشيط الكربون في التربة على طول تدرج عمر الركيزة. علم الأحياء والتغذية في التربة 58، 293-301 (2013).
  58. ميلكو، أ.، هايم، أ.، إليس، ر. ج.، شيو، س. & مانينغ، ب. تحديد الأنماط العامة للتحكم في المغذيات والكربون القابل للتغير على ديناميات الكربون في التربة عبر تدرج الخلافة. النظم البيئية 14، 710-719 (2011).
  59. ميتكلف، د. ب. وآخرون. التحيزات في أخذ عينات الحقول المتقطعة تؤثر على فهم تأثيرات تغير المناخ عبر القطب الشمالي. نات. إيكول. إيفول. 2، 1443-1448 (2018).
  60. بيوركمان، م. ب. وآخرون. تدفقات ثاني أكسيد الكربون في الشتاء من النظم البيئية القطبية: نظرة عامة ومقارنة للمنهجيات. الدورات البيوجيوكيميائية العالميةhttps://doi.org/10.1029/2009 GB003667 (2010).
  61. بلوك، د.، إلبيرلينغ، ب. & ميشيلسن، أ. قد تتسارع المراحل الأولية لتحلل أوراق شجيرات التندرا بسبب الثلوج العميقة في الشتاء ولكنها تتباطأ بسبب ارتفاع درجات الحرارة في الربيع. النظم البيئية 19، 155-169 (2016).
  62. مورغنر، إ.، إلبيرلينغ، ب.، ستريبل، د. وكوبر، إ. ج. أهمية الشتاء في تنفس النظام البيئي السنوي في القطب الشمالي العالي: آثار عمق الثلج في نوعين من الغطاء النباتي. أبحاث قطبية. 29، 58-74 (2010).
  63. تشين، هـ.، جوزيف، ر. وزينغ، ن. زيادة امتصاص الكربون الأرضي في العروض العليا الشمالية في القرن الحادي والعشرين من توقعات نماذج مشروع المقارنة بين نماذج دورة الكربون المناخية المتصلة. التغير العالمي في البيولوجيا 16، 641-656 (2010).
  64. ميللو، ج. م. وآخرون. نمط وحجم تغذية الكربون في التربة للنظام المناخي على المدى الطويل في عالم دافئ. ساينس 358، 101-105 (2017).
  65. هيكس برايز، سي. إي.، شور، إي. إيه. جي.، ناتالي، إس. إم. وكرومر، ك. جي. خسائر الكربون القديمة في التربة تزداد مع تنفس النظام البيئي في التندرا التي تم إذابتها تجريبياً. تغير المناخ الطبيعي 6، 214-218 (2016).
  66. هيكس برايز، سي. إي.، شور، إي. إيه. جي. وكرومر، ك. جي. ذوبان التربة المتجمدة يزيد من تنفس التربة القديمة والتنفّس الذاتي في التندرا: تقسيم تنفس النظام البيئي باستخدام و {increment} تغير المناخ العالمي البيولوجي 19، 649-661 (2013).
  67. وي، د. وآخرون. امتصاص النبات لـ يتجاوز الخسائر الناتجة عن التربة المتجمدة وتنفس النباتات على هضبة التبت. نشر في الأكاديمية الوطنية للعلوم في الولايات المتحدة الأمريكية 118، e2015283118 (2021).
ملاحظة الناشر: تظل شركة سبرينغر ناتشر محايدة فيما يتعلق بالمطالبات القضائية في الخرائط المنشورة والانتماءات المؤسسية.
الوصول المفتوح هذه المقالة مرخصة بموجب رخصة المشاع الإبداعي النسب 4.0 الدولية، التي تسمح بالاستخدام والمشاركة والتكيف والتوزيع وإعادة الإنتاج بأي وسيلة أو صيغة، طالما أنك تعطي الائتمان المناسب للمؤلفين الأصليين والمصدر، وتوفر رابطًا لرخصة المشاع الإبداعي، وتوضح إذا ما تم إجراء تغييرات. الصور أو المواد الأخرى من طرف ثالث في هذه المقالة مشمولة في رخصة المشاع الإبداعي الخاصة بالمقالة، ما لم يُشار إلى خلاف ذلك في سطر الائتمان للمواد. إذا لم تكن المادة مشمولة في رخصة المشاع الإبداعي الخاصة بالمقالة وكان استخدامك المقصود غير مسموح به بموجب اللوائح القانونية أو يتجاوز الاستخدام المسموح به، فسيتعين عليك الحصول على إذن مباشرة من صاحب حقوق الطبع والنشر. لعرض نسخة من هذه الرخصة، قم بزيارةhttp://creativecommons.org/licenses/by/4.0/.
© المؤلف(ون) 2024
مركز أبحاث تأثيرات المناخ، قسم علم البيئة والعلوم البيئية، جامعة أوميو، أبيسكو، السويد. مجموعة علم البيئة وإدارة الغابات (FORECOMAN)، قسم علوم الأرض والبيئة، جامعة KU Leuven، لوفين، بلجيكا. قسم العلوم المكانية، كلية العلوم البيئية، جامعة الحياة الزراعية التشيكية في براغ، براغ-سودول، جمهورية التشيك. قسم علم البيئة والعلوم البيئية، جامعة أوميو، أوميو، السويد. مجموعة أبحاث المياه والتنمية، جامعة آلتو، إسبو، فنلندا. قسم العلوم البيولوجية، جامعة بيرغن، بيرغن، النرويج. مركز بييركنيس لأبحاث المناخ، جامعة بيرغن، بيرغن، النرويج. معهد أمستردام للحياة والبيئة (A-LIFE)، جامعة فري، أمستردام، هولندا. نورك للبيئة والمناخ، المركز النرويجي للبحوث، بيرغن، النرويج. قسم العلوم البيئية والبيولوجية، جامعة شرق فنلندا، كويوبيو، فنلندا. قسم علم البيئة، جامعة إنسبروك، إنسبروك، النمسا.
قسم علوم الأرض، جامعة غوتنبرغ، غوتنبرغ، السويد.
مركز غوتنبرغ العالمي للتنوع البيولوجي، غوتنبرغ، السويد. قسم البيولوجيا القطبية والبحرية، كلية علوم الحياة، مصايد الأسماك والاقتصاد، الجامعة القطبية النرويجية، ترومسو، النرويج. قسم الكيمياء وعلوم الحياة والاستدامة البيئية، جامعة بارما، بارما، إيطاليا. قسم علم البيئة الأرضية، كلية البيولوجيا، جامعة كوبنهاغن، كوبنهاغن، الدنمارك. مركز الجليد الدائم، قسم علوم الأرض وإدارة الموارد الطبيعية، جامعة كوبنهاغن، كوبنهاغن، الدنمارك. قسم علم الفطريات الحرجية وعلم أمراض النباتات، الجامعة السويدية للعلوم الزراعية، أوبسالا، السويد. قسم علم الأحياء القطبي والبحري، جامعة UiT – الجامعة القطبية النرويجية، ترومسو، النرويج. كاربون بوريال، قسم العلوم الأساسية، جامعة كيبك في شيكوتيمي، شيكوتيمي، كيبيك، كندا. معهد العلوم البيئية والاستدامة، جامعة ويلكس، ويلكس-بار، بنسلفانيا، الولايات المتحدة الأمريكية. المعهد الفيدرالي السويسري لأبحاث الغابات والثلوج والمناظر الطبيعية WSL، لوزان، سويسرا. المختبر الرئيسي للدولة لتحسين الأعشاب والأنظمة البيئية الزراعية، وكلية علوم وتكنولوجيا الزراعة الرعوية، جامعة لانتشو، لانتشو، الصين. الجامعة الزراعية في آيسلندا، ريكيافيك، آيسلندا.
قسم علم البيئة الأرضية، المعهد النرويجي لأبحاث الطبيعة، تروندهايم، النرويج. مركز جياريفول لتحليل التنوع البيولوجي وقسم البيولوجيا، الجامعة النرويجية للعلوم والتكنولوجيا، تروندهايم، النرويج. مركز هيثلاند، ألفر، النرويج. معهد علم البيئة، كلية العلوم الحضرية والبيئية، المختبر الرئيسي لعمليات سطح الأرض بوزارة التعليم، جامعة بكين، بكين، الصين. قسم العلوم البيولوجية، كلية دارتموث، هانوفر، نيوهامبشير، الولايات المتحدة الأمريكية. العلوم البيولوجية، كلية العلوم الطبيعية، جامعة تسمانيا، هوبارت، تسمانيا، أستراليا. مرفق أبحاث الجبال الأسترالية، كانبيرا، إقليم العاصمة الأسترالية،
أستراليا. علوم الحياة والبيئة، جامعة آيسلندا، ريكيافيك، آيسلندا.
قسم علوم الحياة، معهد أبحاث القطب الكوري، إنشيون، كوريا الجنوبية. البحث
مركز التغيير البيئي، برنامج أبحاث علم الأحياء العضوي والتطوري، كلية العلوم البيولوجية والبيئية، جامعة هلسنكي، هلسنكي، فنلندا. معهد أبحاث القطب الكوري، إنشيون، كوريا. معهد علوم التربة، جامعة هامبورغ، هامبورغ، ألمانيا. جامعة شرق فنلندا، قسم العلوم البيئية والبيولوجية، كويوبيو، فنلندا. معهد غرينلاند للموارد الطبيعية، نوك، غرينلاند. نورك، مركز الأبحاث النرويجي AS، مركز بيركنس لأبحاث المناخ، بيرغن، النرويج. قسم البيولوجيا، الجامعة النرويجية للعلوم والتكنولوجيا، تروندهايم، النرويج. قسم الجغرافيا، جامعة كالغاري، كالغاري، ألبرتا، كندا. المركز القطبي، جامعة لابلاند، روفانييمي، فنلندا. كلية العلوم البيولوجية والبيئية، جامعة هلسنكي، هلسنكي، فنلندا. سيغيس للابتكار P/S، آرهوس، الدنمارك. العلوم البيئية، معهد جيمس هوتون، أبردين، المملكة المتحدة. قسم موارد الأراضي البرية، كلية كوينى للموارد الطبيعية ومركز علم البيئة، جامعة ولاية يوتا، لوغان، يوتا، الولايات المتحدة الأمريكية. قسم علم الأحياء القطبي، المركز الجامعي في سفالبارد، لونغياربين، النرويج. مركز التفاعلات المتطايرة، قسم البيولوجيا، جامعة كوبنهاغن، كوبنهاغن، الدنمارك. مركز علوم النظام البيئي والمجتمع، جامعة شمال أريزونا، فلاجستاف، أريزونا، الولايات المتحدة الأمريكية. قسم علوم البيئة، جامعة آرهوس، روسكيلد، الدنمارك. مركز الأبحاث القطبية، جامعة آرهوس، آرهوس، الدنمارك. قسم العلوم البيولوجية، جامعة شمال أريزونا، فلاجستاف، أريزونا، الولايات المتحدة الأمريكية. مدرسة العلوم البيولوجية، جامعة نوتنغهام، حرم سوتون بونينغتون، لوغبره، المملكة المتحدة. قسم الجغرافيا وإدارة البيئة، جامعة واترلو، واترلو، أونتاريو، كندا. مركز النظم البيئية، مختبر الأحياء البحرية، وودز هول، ماساتشوستس، الولايات المتحدة الأمريكية. معهد الموارد الطبيعية في فنلندا، هلسنكي، فنلندا. المعهد النرويجي لأبحاث الطبيعة، بيرغن، النرويج. وحدة أبحاث علم البيئة والوراثة، جامعة أولو، أولو، فنلندا. المختبر الرئيسي للدولة للنباتات والتغير البيئي، معهد علم النبات، الأكاديمية الصينية للعلوم، بكين، الصين. مدرسة علوم الغابات، جامعة شرق فنلندا، جوينسيو، فنلندا. البريد الإلكتروني: sybryn.maes@gmail.com

جمع البيانات

تصميم الدراسة. قمنا بتحديد وتحليل تأثير الاحترار على تنفس النظام البيئي (ER) عبر نظم التندرا البيئية من خلال جمع بيانات أصلية، منشورة وغير منشورة، من تجارب الاحترار OTC في بيئة التندرا. تعتبر OTCs بيوت زجاجية صغيرة تزيد بشكل سلبي من درجات حرارة الهواء خلال موسم عدم وجود الثلوج مع السماح بدخول هطول الأمطار بحرية . وغالبًا ما تستخدم لمحاكاة الاحترار المناخي على نطاق قطعة في نظم التندرا الألبية والقطبية ذات الارتفاع المنخفض (شبكة التجربة الدولية للتندرا، ITEX ). اتصلنا بمساهمي البيانات المحتملين (1) عبر البريد الإلكتروني باستخدام الشبكات ITEX وWARM وInterAct وPermafrost Carbon، (2) في الاجتماع العشرين لـ ITEX من 9-13 سبتمبر 2019 في بارما، إيطاليا، و(3) من خلال استرجاع تفاصيل الاتصال بمؤلفي التحليلات الميتا المنشورة سابقًا لقياسات ER التي تم قياسها في تجارب الاحترار. تم تضمين مجموعات بيانات ER فقط إذا (1) كانت التجارب تقع في تندرا ألبية أو قطبية، (2) كانت قياسات ER الأصلية متاحة من كل من OTC وقطع التحكم غير المعالجة (درجة الحرارة المحيطة) و(3) تم قياس ER خلال موسم نمو النباتات (أي، من يونيو إلى أغسطس لجميع المواقع، باستثناء الموقع الأسترالي AUS_1: من أكتوبر إلى فبراير؛ الشكل التوضيحي التكميلي 2). أسفر ذلك عن 24,035 نقطة بيانات من 136 مجموعة بيانات ER (أي، موقع فريد تجربة سنة قياس ER؛ الجداول التكميلية 1 و2) من 56 تجربة OTC فريدة عبر 28 موقع تندرا.
يمكن أن يتكون موقع واحد من تجربة أو عدة تجارب احترار (على سبيل المثال، تغطي الفروق المحلية في مجتمعات النباتات أو ظروف التربة) وتساهم بقياسات ER من مناسبة واحدة أو عدة مناسبات خلال سنة أو عدة سنوات (الجدول التكميلي 1 والأشكال التوضيحية التكميلية 1 و2). اختلفت التجارب في الظروف غير الحيوية (على سبيل المثال، وجود الجليد الدائم، المناخ المحيط ونوع التربة) و/أو الحيوية (على سبيل المثال، النباتات وحجم المجتمعات الميكروبية) وكذلك في مواصفات معالجة الاحترار. أولاً، في وقت قياسات ER، اختلفت التجارب في مدة معالجة الاحترار الخاصة بها ( سنوات، متوسط 7). ثانيًا، على الرغم من إعداد الاحترار التجريبي الشائع، اختلفت التجارب في حجم OTC ( الارتفاع)، ومدة نشر OTC (على سبيل المثال، وضعها على مدار السنة أو إزالتها في الشتاء) ومنهجية قياسات التدفق. لذلك جمعنا بيانات منهجية حول (1) ارتفاع OTC، (2) ما إذا كانت OTCs قد أزيلت خلال الشتاء أم لا، (3) منتج المحلل (Los Gatos Research، LICOR، PP-system أو Vaisala)، (4) نوع المحلل (الأشعة تحت الحمراء أو الليزر)، (5) نظام القياس (آلي أو يدوي ومغلق أو مفتوح)، (6) توقيت قياسات ER (نهارًا أو ليلاً) و(7) حجم قطعة قياس ER. تفاصيل الإجراء المستخدم للتحقق من التحيزات المنهجية التي أدخلتها العوامل الموضحة أعلاه موجودة في المناقشة التكميلية 2. نظرًا لأننا لم نلاحظ أي تأثيرات كبيرة لهذه العوامل المنهجية على استجابة ER، نفترض أنه لا يوجد تحيز منهجي في نتائجنا.
تنفس النظام البيئي. لكل مجموعة بيانات، طلبنا بيانات ER اليومية المتوسطة المحددة للقطع وقمنا بتوحيد جميع نقاط البيانات الفردية إلى نفس الوحدة، أي، . قمنا بإزالة 339 نقطة بيانات شاذة ( من البيانات) لحساب أخطاء القياس (نقاط البيانات خارج نطاق متوسط ER الانحراف المعياري في مجموعة بيانات تتبع المرجع 69). بعد ذلك، قمنا بحساب متوسط ER خلال موسم النمو لكل معالجة تجريبية (التحكم مقابل الاحترار) لكل مجموعة بيانات كجرامات من الكربون في . لمزيد من التفاصيل حول تكرار العينة، انظر الشكل التوضيحي التكميلي 2 والجدول التكميلية 2. قامت جميع التجارب بقياس ER خلال النهار باستخدام غرف مظلمة أو غير شفافة، باستثناء ALA_1، التي استخدمت غرفًا آلية شفافة. بالنسبة لهذه التجربة، استخرجنا قياسات الليل بناءً على قيم الإشعاع النشط للتمثيل الضوئي (PAR ) وأدرجناها كقياسات ER.

حساب حجم التأثير

قمنا بحساب أحجام التأثير استجابة متوسط فترة النمو لارتفاع درجة الحرارة، بشكل منفصل لكل مجموعة بيانات. استخدمنا هيدجز حجم التأثير الأساسي SMD عبر جميع النماذج وبتحويل اللوغاريتم تم استخدام ROM كحجم تأثير إضافي لقياس نسبة التغير في ER مع التسخين. تم حساب Hedges SMD لكل مجموعة بيانات على أنه (متوسط ER في plots المدفأة خلال موسم النمو – متوسط ER في plots التحكم) / الانحراف المعياري المدمج. يُعتبر هذا حجم تأثير مناسب للاستخدام هنا لأنه يتغلب على البيانات المقاسة بمقاييس مختلفة من خلال التوحيد، بالإضافة إلى تصحيح تباين التباين الذي قد يتم تقديمه مع أحجام العينات الصغيرة. ) من خلال تضمين الانحراف المعياري المجمّع كانت قيم SMD المتوسطة لـ Hedges لكل مجموعة بيانات مصحوبة بفواصل ثقة 95% للأخطاء المعيارية، والتي تعكس دقة حجم التأثير لكل مجموعة بيانات. تم حساب ROM كمتوسط ​​معدل ER في المواقع المدفأة / متوسط ​​معدل ER في المواقع الضابطة، والذي قمنا بتحويله إلى متوسط ​​نسبة الزيادة كـ أي، مقياس أكثر بديهية للتغيرات في ER. انظر الجدول التكميلي 2 لعدد قياسات متوسط ​​اليوم من ER وعدد الرسوم البيانية المستخدمة لكل من 136 مجموعة بيانات، وانظر الشكل 2 والجدول التكميلي 4 للحصول على نظرة عامة على متوسط ​​Hedges’ SMD وفواصل الثقة 95% لكل مجموعة بيانات.

أنماط زمنية

لتقييم استجابة انبعاثات الكربون إلى الاحترار مع مرور الوقت، قمنا بتحديد مدة الاحترار التجريبي لكل مجموعة بيانات كفرق بين سنة قياس انبعاثات الكربون والسنة التي بدأت فيها معالجة الاحترار (الشكل التكميلي 1 والجدول التكميلي 1). كما قمنا بتصنيف مجموعات البيانات إلى أربع ‘فئات عمرية’ بناءً على مدة الاحترار، حيث تشمل الفئة 1 مجموعات البيانات التي فيها كانت سنوات الاحترار مستمرة في وقت قياسات ER والفئات 2 و3 و4 التي كانت فيها سنوات الاحترار 5-10 و10-15 وأكثر من أو يساوي 15 عامًا على التوالي (الشكل 1). لاحظ أن المدة يشير إلى عندما حدثت أقل من سنة واحدة من الاحترار، أي صيف واحد فقط من الاحترار.

محركات بيئية ER

لتحديد العوامل البيئية التي قد تفسر التباين في استجابة معدل التنفس التربة (ER) خلال موسم النمو لظاهرة الاحترار، حصلنا على عدة أنواع من البيانات البيئية على مستوى الموقع أو التجربة أو قياس ER واستخدمناها لتحليل التأثيرات غير المباشرة للاحتباس الحراري والاعتماد على السياق كعوامل لتباين استجابة ER للاحتباس الحراري. انظر الجدول التكميلية 5 لأحجام العينات لجميع العوامل البيئية المستخدمة لتقييم التأثيرات غير المباشرة للاحتباس الحراري والاعتماد على السياق، والطرق التكميلية 1 لشرح مفصل حول كيفية الحصول على العوامل المختلفة وحسابها.
آثار الاحترار غير المباشرة. للتحقيق فيما إذا كانت التغيرات في الظروف البيئية الناتجة عن معالجة الاحترار قد أثرت على استجابة ER للاحتباس الحراري، قمنا بتحديد التغيرات في الظروف المناخية والتربة المذكورة أدناه بالإضافة إلى الغطاء النباتي والمجتمعات الميكروبية لكل مجموعة بيانات، من خلال حساب أحجام التأثير لهذه العوامل: حساب حجم التأثير لبيانات ER (أعلاه)، على سبيل المثال، (متوسط درجة حرارة الهواء في المواقع المدفأة – متوسط درجة حرارة الهواء في المواقع الضابطة) / الانحراف المعياري المجمّع. من خلال القيام بذلك، اختبرنا بعد ذلك ما إذا كانت التغيرات في العوامل البيئية بسبب الاحترار قد أثرت على التغيرات في ER بسبب الاحترار (انظر القسم اللاحق حول ‘التحليل الميتا’). العوامل البيئية المدرجة في هذا الجزء من تحليلاتنا تتعلق بـ (1) الظروف المناخية في وقت قياس ER، أي درجة حرارة الهواء ( درجة حرارة التربة ( ) ورطوبة التربة (%); (2) ظروف التربة على مستوى القطعة، أي، نسبة المادة العضوية في التربة (SOM) (%)، تركيز الكربون الكلي (TC) (%)، تركيز النيتروجين الكلي (TN) (%)، نسبة الكربون إلى النيتروجين، الكثافة الظاهرية (BD) ( ) ودرجة الحموضة من الطبقة المعدنية و/أو العضوية؛ بالإضافة إلى عمق الطبقة العضوية (OLdepth) (سم)؛ (3) مجتمع النباتات
على مستوى القطعة، أي نسبة التغطية لكل مجموعة وظيفية (الأعشاب، الزهور، الشجيرات المتساقطة، الشجيرات دائمة الخضرة، الطحالب والطحالب الجليدية)، الكتلة الحيوية فوق الأرض ومتوسط ارتفاع المجتمع، على مستوى القطعة؛ و(4) المجتمع الميكروبي على مستوى القطعة، أي مؤشرات للكتلة الحيوية البكتيرية والفطرية ونسب الفطريات إلى البكتيريا المستمدة (البيانات الموسعة الجدول 3). على الرغم من أن معدل التنفس التربة يمكن أن يكون مرتبطًا بشكل قوي بالإنتاجية الأولية للنباتات، إلا أن قاعدة بياناتنا لا تتضمن بيانات الإنتاجية الأولية، حيث أن تضمينها ومقارنتها عبر الزمن وعبر عدة تجارب يمثل تحديًا بسبب اعتماد الضوء في عملية التمثيل الضوئي والتغير العالي في الزمان والمكان لقياسات الإنتاجية الأولية. ومع ذلك، فإن كلا العمليتين مدفوعتان جزئيًا بنشاط النباتات، والذي بدوره يتأثر بالاستجابات المباشرة لبيئتها (على سبيل المثال، المناخ المحلي) وكذلك، على سبيل المثال، بكتلتها الحيوية وتركيب المجتمع. لذلك، نرى أنه من أجل زيادة فهمنا الميكانيكي للعوامل البيئية الأساسية التي تؤثر على استجابة معدل التنفس التربة للاحتباس الحراري، من الأكثر معنى دمج دور استجابة نمو النباتات للاحتباس الحراري في تنفس النظام البيئي من خلال تضمين (التغيرات في) الكتلة الحيوية للنباتات وتركيب المجتمع، بالإضافة إلى الإنتاجية الأولية (انظر قسم “اعتماديات السياق”) كعوامل محتملة لمعدل التنفس التربة، كما نفعل هنا. لاحظ أننا نشير إلى تركيز الكربون والنيتروجين الكلي في التربة طوال المخطوطة، لأن هذه العوامل تم قياسها على التربة الصلبة (المجففة) باستخدام محللات عناصر الكربون والنيتروجين. لذلك، فإنها تشير إلى مجموع تركيزات كل من المركبات غير العضوية والعضوية من الكربون والنيتروجين، على الرغم من أن الكربون الكلي من المحتمل أن يعكس بشكل أساسي تركيز الكربون العضوي في التربة لأن تربة التندرا تحتوي على كربون غير عضوي محدود أو معدوم.
اعتماديات السياق. لتقييم ما إذا كان وكيف أثر السياق البيئي على استجابة معدل التنفس التربة (ER) للاحتباس الحراري، قمنا بتضمين العوامل التي تقيس المناخ وظروف التربة ومجتمع النباتات (البيانات التكميلية 4 والأساليب التكميلية 1). لكل مجموعة بيانات، (1) تضمنت العوامل المناخية المنطقة (القطب الشمالي المنخفض، القطب الشمالي العالي والجبال الألبية) واحتمالية وجود التربة المتجمدة (قيم بين 0 و 1) على مستوى الموقع ومتوسط درجة حرارة الهواء ودرجة حرارة التربة ورطوبة التربة في المواقع الضابطة في وقت قياس ER. علاوة على ذلك، (2) تضمنت عوامل ظروف التربة القيم المتوسطة للمواد العضوية في التربة (SOM)، الكربون الكلي (TC)، النيتروجين الكلي (TN)، نسبة الكربون إلى النيتروجين (CN)، كثافة التربة (BD)، درجة الحموضة (pH) وعمق المواد العضوية (OLdepth) من المواقع الضابطة لكل مجموعة بيانات (انظر أعلاه). بالإضافة إلى ذلك، قمنا بتضمين فئة درجة حموضة التربة (درجة حموضة منخفضة أقل من 5، متوسطة 5-7، عالية أكثر من 7)، فئة رطوبة التربة (جافة، متوسطة ورطبة) واحتياطي الكربون في التربة. ) هنا على مستوى التجربة. أخيرًا، (3) تضمنت محركات مجتمع الغطاء النباتي فئة نباتية (خمسة فئات: الأراضي القاحلة (B)، التندرا العشبية (G، الأعشاب والقصب)، تندرا الشجيرات الممدودة (P)، تندرا الشجيرات القائمة (S) والأراضي الرطبة (W)، وذلك استنادًا إلى خريطة الغطاء النباتي القطبي الشمالي (CAVM) ) و NPP ( ) على مستوى التجربة.

التحليلات الإحصائية

تم إجراء جميع التحليلات باستخدام R v.4.0.3 ما لم يُذكر خلاف ذلك .
نهج النمذجة. التحليل التلوي. لتقييم آثار الاحترار التجريبي على معدل التنفس، قمنا بإجراء تحليل تلوي متعدد المتغيرات معrma.mvوظيفة من حزمة metafor في R ، باستخدام حجم التأثير الأساسي لمتوسط بيانات ER خلال موسم النمو وفقًا لمقياس Hedges’ SMD (الشكل 2 والجدول الإضافي 1). من خلال ذلك، حصلنا على حجم تأثير متوسط مجمع للاحتباس الحراري، مع الأخذ في الاعتبار التداخل والقياسات المتكررة في مجموعات البيانات الـ 136 لدينا. تم وزن كل مجموعة بيانات بعكس تقدير تباين العينة الخاص بها لزيادة كل من دقة أحجام التأثير المقدرة والقوة الإحصائية في التحليلات التلوية. قمنا أيضًا بإجراء تحليل تلوي على نطاق الحركة كحجم تأثير ثانوي (انظر القسم السابق حول ‘حساب حجم التأثير’)، والذي قدم متوسط نطاق حركة مجمع للاحترار (البيانات الموسعة الجدول 1). علاوة على ذلك، لاختبار ما إذا كانت الظروف البيئية (المناخ، التربة، الغطاء النباتي والميكروبات: انظر القسم السابق حول ‘العوامل البيئية’) قد تغيرت بشكل كبير بسبب معالجة الاحترار، قمنا بإجراء تحليلات تلوي منفصلة لاختبار تأثير الاحترار على كل من هذه العوامل، باستخدام حجم تأثير هيدجز كحجم تأثير أساسي.
حجم الفروق المتوسطة الخام (أي الفرق في القيم المطلقة للسائق بين متوسطات العلاج والتحكم) كحجم تأثير ثانوي لأن الأخير يوفر تقديرات للتغيرات المطلقة في السائقين (الجدول التكميلي 3).
التحليل الميتا. الأنماط الزمنية. لتقييم ما إذا كانت استجابة ER وكيفية اختلافها مع مدة التسخين التجريبي، قمنا بإجراء نوعين من نماذج التحليل الميتا ذات العامل الواحد. أولاً، اختبرنا ما إذا كانت المدة (عدد سنوات التسخين عند قياسات ER) تؤثر على حجم استجابة ER (SMD هيدجز). تم إجراء هذه النماذج عبر التجارب و (1) عبر الفئات العمرية الأربع للمدة، لتحليل الأنماط العامة طويلة الأجل لتأثيرات التسخين و (2) في كل فئة عمرية ( , وأكثر من 15 عامًا). وهذا أتاح استكشاف عدم الخطية المحتملة للأنماط في معدلات استجابة ER مع التسخين بمرور الوقت (الشكل 3ب والجدول التكميلي 2أ). ثانياً، اختبرنا (1) ما إذا كانت الفئة العمرية تؤثر على استجابة ER، أي ما إذا كانت متوسط استجابة ER تختلف بين الفئات العمرية الأربع من حيث الإشارة أو الاتجاه، وكذلك (2) ما إذا كانت متوسط استجابة ER لكل فئة عمرية تختلف بشكل كبير عن الصفر (الشكل 3أ والجدول التكميلي 2ب). وهذا أتاح تقييم الاستمرارية (الوجود المستمر) لاستجابة ER بمرور الوقت.
تأثيرات التسخين غير المباشرة. لتقييم ما إذا كانت التغيرات في استجابة ER للتسخين مدفوعة بتأثيرات غير مباشرة للتسخين على الظروف البيئية، قمنا بتشغيل نماذج تحليل ميتا ذات عامل واحد باستخدام SMD هيدجز للسائقين البيئيين المختلفين (التي تعكس التغيرات الناتجة عن التسخين في المناخ والتربة والنباتات وظروف المجتمع الميكروبي) كمتنبئات فردية وSMD هيدجز كاستجابة (انظر القسم السابق حول ‘تأثيرات التسخين غير المباشرة’؛ الشكل 4 والجدول التكميلي 3).
اعتماديات السياق. لتقييم ما إذا كان يمكن تفسير التغير في استجابة ER للتسخين من خلال السائقين البيئيين المحددين بالسياق والمتعلقين بالمناخ أو التربة أو النباتات، قمنا بإجراء نماذج تحليل ميتا ذات عامل واحد لاختبار تأثير كل من هؤلاء السائقين على SMD هيدجز لـ ER (انظر القسم السابق حول ‘اعتماديات السياق’؛ الشكل 5 والجدول التكميلي 4).
اخترنا نماذج ذات عامل واحد لتحليل تأثيرات التسخين غير المباشرة واعتماديات السياق لأن بيانات السائقين البيئيين كانت موزعة بشكل غير متساو عبر مجموعات البيانات (الجدول التكميلي 5) مع وجود سائقين مختلفين مفقودين من مجموعات بيانات مختلفة. وبالتالي، كانت النماذج متعددة العوامل ستؤدي إلى تقليل كبير في حجم العينة وبالتالي القوة. قبل جميع التحليلات الميتا، تحققنا من مشاكل التداخل و/أو التعدد الخطي من خلال الرسوم البيانية الصندوقية والخرائط التكرارية.
هيكل التأثيرات العشوائية. لأننا لم نفترض أن جميع مجموعات البيانات لها نفس حجم التأثير الحقيقي ولأخذ الاختلافات المنهجية عبر مجموعات البيانات في الاعتبار، قمنا بتضمين هيكل التأثيرات العشوائية في جميع النماذج . تم ضبط النماذج مع هيكل التأثيرات العشوائية المتقاطعة والمتداخلة التالي: (~1 | التجربة/مجموعة البيانات) + (~السنة | التجربة). يتوافق المكون الأول (الهيكل متعدد المستويات) مع تحليل ميتا ثلاثي المستويات، مما يسمح بتعشيش التقديرات الفردية لكل ملاحظة (مجموعة بيانات) في مستوى تجميع التجربة . المكون الثاني (المكون التلقائي) يأخذ في الاعتبار العينات المتكررة في نفس الموقع على مدى عدة نقاط زمنية (سنوات)، من خلال استخدام هيكل تباين تلقائي مستمر للتأثيرات الحقيقية بمرور الوقت . قمنا بنمذجة مثل هذا الهيكل عن طريق تعيين struct = ‘CAR’ في rma.mv وظيفة من حزمة metafor R . هذا حسن بشكل كبير نموذج التحليل الميتا الرئيسي، أي أن النموذج مع هيكل CAR كان لديه قيم أقل لمعيار معلومات أكايك من النموذج بدون؛ أيضًا، أظهر مخطط acf لـ ‘المتبقيات العادية أو شوليكي’ المحسوبة أن الارتباط الذاتي قد تم إزالته بإضافة CAR. تم استخدام هيكل التأثير العشوائي هذا بعد ذلك لجميع التحليلات الميتا ونماذج التحليل الميتا.
تصور النموذج والتحقق من صحته. اعتبرنا وفسرنا النتائج على أنها ذات دلالة في دراستنا إذا , كما هو شائع في

المقال

التحليلات الميتا , بينما يتم وصف الاتجاهات ( ) ولكن لا يتم تفسيرها على أنها ذات دلالة (الشكل التكميلي 3). قمنا بتصور نتائج التحليل الميتا من خلال مخططات الغابة باستخدام وظيفة الغابة من حزمة metafor . تم تصور نتائج التحليل الميتا ذات الدلالة من خلال عرض الملاحظات الفعلية مع مخططات التشتت ومخططات الكمان للسائقين المستمرين والفئويين، على التوالي؛ بالإضافة إلى توقعات النموذج، أي خطوط الانحدار أو متوسطات المجموعات CIs، على التوالي. تم التحقق من صحة النماذج من خلال تقييم مخططات القمع والملف واختبار المتبقيات لافتراض الطبيعية وتجانس التباين . أظهرت مخططات القمع للتحليل الميتا الرئيسي عدم تماثل، مما يشير إلى احتمال وجود ‘تحيز نشر’ ولكن لأننا لم نعمل فقط مع مجموعات بيانات منشورة (أي، ليست تحليل ميتا بالمعنى الضيق) نجادل بأن هذا التماثل المكتشف من المحتمل أن يكون ناتجًا عن تباين حقيقي بدلاً من تحيز النشر . لم نلاحظ أي شذوذات أخرى. علاوة على ذلك، قمنا بحساب من نماذج التحليل الميتا ذات الدلالة باستخدام زيف مكفادن من خلال مقارنة قيم الاحتمالية اللوغاريتمية للنماذج مع تلك الخاصة بالنموذج الصفري الذي تم ضبطه من خلال تقدير الاحتمالية القصوى. نحن نبلغ عن إحصائية اختبار Qm لتقدير مقدار التباين المتبقي الذي يفسره كل سائق في نماذج التحليل الميتا، بالإضافة إلى أو إحصائية اختبار QE للتباين لتحليل الميتا أو نماذج التحليل الميتا، على التوالي.

التحليلات التكملية

لاختبار قوة نتائجنا وللحصول على رؤى آلية يمكن أن تساعد في مزيد من تفسير نتائجنا، قمنا بإجراء عدة تحليلات تكملية (النقاش التكميلي). أولاً، للإجابة على ما إذا كانت زيادة ER مدفوعة بزيادة تنفس النبات (التمثيل الضوئي) أو تنفس الميكروبات (التمثيل غير الضوئي)، أو كليهما، جمعنا جميع البيانات المتاحة حول تقسيم ER في تجارب تسخين التندرا وأجرينا تحليلات ميتا على ER، والتنفس التمثيلي والتنفس غير التمثيلي لهذه المجموعة الفرعية (الجدول التكميلي 1ب والنقاش التكميلي 1). قياسات تقسيم التنفس مدمرة وبالتالي تغير ديناميات النظام البيئي، مما يجعل القياسات طويلة الأجل صعبة. وبالتالي، هناك توفر محدود للقياسات المستمرة والمتزامنة لإجمالي ER وتقسيم ER في نفس الموقع. ثانيًا، قمنا بتحليل ما إذا كانت الاختلافات في منهجية قياس ER أو إعداد تجربة OTC أدت إلى تحيز منهجي في نتائجنا (الشكل التكميلي 3 والنقاش التكميلي 2). ثالثًا، قمنا بتحليل التفاعلات المحتملة لتأثيرات المناخ المحلي لـ OTC على استجابة ER (النقاش التكميلي 3). رابعًا، قمنا بتقييم ما إذا كانت عدم تطابق ER مع بيانات السائقين البيئيين من سنوات قياس مختلفة قد أثرت على نتائجنا من خلال إجراء تحليل حساسية، أي إعادة تشغيل نماذج التحليل الميتا لدينا بناءً على عدة سيناريوهات حجم عينة مقيدة (الشكل التكميلي 4 والنقاش التكميلي 4). خامسًا، قمنا بتقييم ما إذا كان تصميم العينة غير المتوازن من تضمين تجربتين مع سلسلة زمنية أطول بكثير من قياسات ER المتكررة (ALA_1 وGRE_6؛ الجدول التكميلي 2) من التجارب الأخرى له تأثير قوي على نتيجة التحليل الميتا؛ النقاش التكميلي 5). أخيرًا، قمنا بتحليل الأنماط الزمنية في التجارب أيضًا، لنرى ما إذا كانت تختلف عن نتائجنا عند تحليل هذه الأنماط عبر التجارب (الشكل التكميلي 5 والنقاش التكميلي 6). بشكل عام، أكدت هذه التحليلات التكملية قوة نتائجنا.

التوسع المكاني

قمنا بتقدير الأنماط المكانية في حساسية ER للتسخين التجريبي والتغير الناتج في ER، من خلال توسيع نتائجنا حول اعتماديات السياق عبر القطب الشمالي والجبال الألبية المحيطة بالقطب الشمالي منطقة التندرا (الشكل التوضيحي التكميلي 6). قمنا بإجراء عملية التوسيع بناءً على المحركات المعتمدة على السياق التي كانت مؤشرات مهمة لاستجابة ER للاحتباس الحراري استنادًا إلى نماذج الميتا-تحليل ذات العامل الواحد لدينا، وهي تركيز TN ونسبة C:N لطبقة التربة المعدنية. بالنسبة للتوسيع، تم استخدام نموذج ميتا-تحليل ذو عاملين
تم استخدامه (انظر التفاصيل أدناه). الإجراء التفصيلي موضح أدناه ومصور في الطرق التكميلية 2.
بيانات مدخلات التربة. كمدخلات للتوسيع، قمنا بتنزيل بيانات التربة المتوسطة، النسبة المئوية الخامسة والنسبة المئوية الخامسة والتسعين (لتركيز TN وSOC (%) وBD) لمنطقة الدراسة بدقة 250 م من مركز بيانات التربة ISRIC . نظرًا لأن منطقة الدراسة كانت حوالي 10 ملايين , لم تكن دقة 250 م قابلة للحساب لتحليل عدم اليقين مونت كارلو (انظر القسم ‘تحليل عدم اليقين مونت كارلو’) وبالتالي، قمنا بتجميع البيانات إلى دقة 1 كم (المتوسط عبر كل خلية شبكة 1 كم، متجاهلين خلايا الشبكة بدون قيم). تم استخدام حاسوب فائق لإجراء التحليل بناءً على دقة 1 كم المجمعة. أولاً، استخرجنا متوسط تركيز TN وSOC لطبقة المعادن لكل خلية شبكة من خلال تحديد طبقات التربة المعدنية ضمن العمق باستخدام عتبة TN من ، وعتبة SOC من ، وعتبة BD من . ثم قمنا بحساب المتوسطات الموزونة حسب العمق لكل محرك تربة (TN وSOC) عبر طبقة المعادن لكل خلية شبكة 1 كم. لتقدير الانحراف المعياري (s.d.) لكل خلية شبكة، استخدمنا النسب المئوية الخامسة والتسعين لطبقات SOC وTN المحسوبة كـ s.d. norm ، حيث q .95 و q. 05 هما النسب المئوية الخامسة والتسعين وqnorm هو دالة التوزيع التراكمي العكسية لتوزيع طبيعي قياسي. نظرًا لعدم توفر مجموعة بيانات لنسبة C:N، استخدمنا المتوسطات والانحرافات المعيارية لبيانات TN وSOC لاشتقاق نسب C:N الخاصة بكل خلية شبكة كـ SOC/TN، كما نصح موظفو مركز بيانات التربة ISRIC. يتم وصف هذا الاشتقاق وعدم اليقين المرتبط به أدناه في قسم تحليل عدم اليقين مونت كارلو.
نموذج التوسيع. تم بناء نموذج الانحدار للتوسيع باستخدام ROM المحول لوغاريتميًا كحجم التأثير (متغير الاستجابة)، مما سمح بحساب التنفس المتوقع كنسبة مئوية للتغيير في ER مع الاحتباس الحراري (أي، متوسط الاحتباس الحراري الذي حققته OTCs في قاعدة بياناتنا)، بدءًا من ER الأساسي. استخدمنا نموذج ميتا-تحليل ذو عاملين استنادًا إلى جميع مجموعات بيانات ER التي كانت متاحة لكل من تركيز TN و نسب طبقة التربة المعدنية، مع المعاملات المقدرة التالية: ROM TN .
تحليل عدم اليقين مونت كارلو. لدمج عدم اليقين في بيانات التربة وعلاقتها بتغيرات ER في تقديرات التوسيع لدينا، قمنا بإجراء محاكاة مونت كارلو. لنشر عدم اليقين في بيانات التربة المدخلة، قمنا بإنشاء 100 قيمة لـ TN وSOC لكل خلية شبكة باستخدام المتوسطات والانحرافات المعيارية المستمدة من بيانات التربة ISRIC. لكل خلية، أخذنا عينة من توزيع طبيعي متعدد المتغيرات مقطوع (rtmvnorm من حزمة R tmvtnorm)، مقطوعًا توزيع كلا المتغيرين إلى الحد الأدنى من من القيمة المتوسطة لتجنب القيم السلبية. نظرًا لأن القطع يغير خصائص العينة، قمنا بضبط المتوسطات بحيث يتطابق متوسط التوزيع المقطوع مع المتوسط المستهدف المستمد من ISRIC. تم تعيين الارتباط بين TN وSOC عند 0.8273. لكل عينة من TN وSOC، تم حساب نسبة C:N. أخذنا في الاعتبار التحيز المحتمل لاستخدام نسبة C:N استنادًا إلى TN وSOC كبديل لنسبة C:N من خلال ملاءمة انحدار خطي بين قيم C:N المبلغ عنها من قاعدة بيانات هذه الدراسة والقيم المحسوبة استنادًا إلى TN وTC المبلغ عنه (الشكل التوضيحي التكميلي 8). قمنا بملاءمة 100 انحدار إلى الرسم البياني المتناثر واستخدمنا كل انحدار لتقدير نسبة C:N لكل تكرار ( ) في كل خلية شبكة.
لنشر المزيد من عدم اليقين المستمد من العلاقة المقدرة بين ROM وTN وC:N، استخدمنا بعد ذلك 100 زوج من TN وC:N لكل خلية شبكة كمدخلات لنموذج التوسيع باستخدام دالة predict.rma من حزمة R metafor . أدى ذلك إلى 100 توقعات لتغيير نسبة ER (مع الأخطاء المعيارية المرتبطة بالتوقع) لكل خلية شبكة. تم دمج هذه المجموعات من المعلمات الـ 100 لإنتاج قيمة متوقعة إجمالية من خلال أخذ المتوسط، مع حساب الانحراف المعياري المرتبط من خلال اعتبار توزيع التوقع
كتوزيع مختلط من 100 فترة توقع. يتم إعطاء الانحراف المعياري للتوزيع الناتج بواسطة:
حيث هو عدد مجموعات بيانات التربة المحاكاة وMEAN وSE هما متجهات المتوسطات المتوقعة والأخطاء المعيارية المقابلة.
أدى ذلك إلى تغيير نسبي متوقع ناتج عن الاحتباس الحراري متوسط عبر 100 زوج من التوقعات والانحراف المعياري المدمج المقابل، لكل خلية شبكة (الشكل 6 والشكل التوضيحي التكميلي 7). لتقدير الأنماط المكانية في التغيير المطلق في ER، قمنا بعد ذلك بضرب هذا التغيير النسبي في التنفس مع ER الأساسي المحدد مكانيًا (المستمد من جمع بيانات التنفس التربة (بيانات مجمعة من 1960 إلى 2011) والتنفس النباتي (بيانات من 2015)).
ثم قدرنا المساهمة النسبية لعدم اليقين في معلمات النموذج مقابل عدم اليقين في بيانات التربة المدخلة لتقديرات مونت كارلو لانحراف ER المعياري (الشكل 6). تم إجراء توقعات النموذج مرتين على مجموعات المدخلات الـ 100، أولاً بنشر كلا مصدرين عدم اليقين (الشكل 6b) ثم من خلال تثبيت معلمات الميتا-تحليل على تقديراتها المتوسطة والسماح فقط لبيانات التربة المدخلة بالتغير. تم استخدام نفس محاكاة بيانات المدخلات في كلا التشغيلين للحفاظ على عدم اليقين المتعلق بالبيانات ثابتًا. يوضح الشكل 6c نسبة الانحرافات المعيارية الناتجة، أي، عدم اليقين في مدخلات التربة فقط/عدم اليقين المدمج.
أخيرًا، استكشفنا مدى جودة توزيع مجموعة بياناتنا مقارنة بتوزيع بيانات التربة المجمعة المستخدمة للتوسيع. لهذا، أنشأنا رسمًا بيانيًا متفرقًا لنسبة TN وC:N حيث قمنا بتراكب كل من القيم الملاحظة (من مجموعة بياناتنا) والقيم المجمعة (مجموعة بيانات التربة المجمعة المستخدمة للتوسيع) (الشكل التوضيحي التكميلي 9). على الرغم من أن القيم الملاحظة من مجموعة بياناتنا تميل قليلاً نحو قيم TN المنخفضة، إلا أن القيم الملاحظة تغطي بشكل عام التركيز الرئيسي لتوزيع نسبة TN-C:N (حوالي 64% عند قياسها باستخدام مضلع Convex Hull).

توفر البيانات

ستكون البيانات متاحة على Zenodo علىhttps://doi.org/10.5281/zenodo. 10572479 (مرجع 88). تم إنشاء الخرائط في الشكل 1 والشكل التوضيحي الموسع 1 باستخدام R (حزم ggplot2 ورمز الدولة) وللخرائط في الشكل 6 والأشكال التوضيحية التكميلية 6 و7 تم استخدام حدود الدول من Natural Earth وتم إنشاء الخرائط باستخدام R (حزمة tmap).

توفر الكود

ستكون نصوص R متاحة على GitHub علىhttps://github.com/mjalava/ tundraflux (مرجع 89).
68. هنري، ج. هـ. ر. ومولاو، أ. نباتات التندرا وتغير المناخ: التجربة الدولية للتندرا (ITEX). تغير المناخ العالمي 3، 1-9 (1997).
69. روسيو، ب. ج. وهوبير، م. إحصائيات قوية لاكتشاف القيم الشاذة. WIREs Data Mining Knowl. Discov. 1، 73-79 (2011).
70. بورنشتاين، م.، هيدجز، ل. ف.، هيغينز، ج. ب. ت. وروثشتاين، هـ. ر. مقدمة في الميتا-تحليل (وايلي، 2009).
71. ووكر، د. أ. وآخرون. خريطة نباتات القطب الشمالي الدائرية. J. Veg. Sci. 16، 267-282 (2005).
72. فريق R الأساسي. R: لغة وبيئة للحوسبة الإحصائية (مؤسسة R للحوسبة الإحصائية، 2021).
73. فيشتباور، و. إجراء الميتا-تحليلات في R باستخدام الميتافور. J. Stat. Softw. 36، 1-48 (2010).
74. هيدجز، ل. ف.، غوريفيتش، ج. وكيرتس، ب. س. الميتا-تحليل لنسب الاستجابة في علم البيئة التجريبية. علم البيئة 80، 1150-1156 (1999).
75. كونستانتوبولوس، س. تقدير التأثيرات الثابتة ومكونات التباين في الميتا-تحليل ثلاثي المستويات. Res. Synth. Methods 2، 61-76 (2011).
76. ناكاغاوا، س. وسانتوس، إ. س. أ. القضايا المنهجية والتقدم في الميتا-تحليل البيولوجي. Evol. Ecol. 26، 1253-1274 (2012).
77. I shak، K. J.، Platt، R. W.، Joseph، L.، Hanley، J. A. & Caro، J. J. تحليل ميتا للدراسات الطولية. التجارب السريرية 4، 525-539 (2007).
78. تريكالينوس، ت. أ. وأولكين، إ. تحليل ميتا لحجم التأثير المبلغ عنه في نقاط زمنية متعددة: نهج متعدد المتغيرات. التجارب السريرية 9، 610-620 (2012).
79. Signorini، م.، Midolo، ج.، Cesco، س.، Mimmo، ت. & Borruso، ل. مسألة المعادن: النحاس ولكن ليس الكادميوم يؤثر على التنوع الألفا الميكروبي للتربة والرواسب – تحليل ميتا. علم البيئة الميكروبية.https://doi.org/10.1007/s00248-022-02115-4 (2022).
80. جنكينز، د. ج. وآخرون. تحليل ميتا لعزل المسافة: أثر أو معيار مرجعي لعلم الوراثة المنظري؟ إيكوغرافي 33، 315-320 (2010).
81. فاسن، ت. وآخرون. العلاقة بين الضغط النفسي المبلغ عنه ذاتياً وقياسات القلب والأوعية الدموية في الحياة اليومية: مراجعة منهجية. PLoS ONEhttps://doi.org/10.1371/journal. بون. 0259557 (2021).
82. راوي، أ. وآخرون. تحليل التعرف الهيكلي والعملي للنماذج الديناميكية الملاحظة جزئيًا من خلال استغلال احتمال الملف الشخصي. المعلوماتية الحيوية 25، 1923-1929 (2009).
83. جينيونز، م. د. ومولر، أ. ب. انحياز النشر في علم البيئة والتطور: تقييم تجريبي باستخدام طريقة ‘التقليم والملء’. مراجعة بيولوجية 77، 211-222 (2002).
84. تيستولين، ر.، أتوور، ف. وجيمينيز-ألفارو، ب. التوزيع العالمي والتوصيف البيوكيميائي للبيئات الجبلية. إيكوغرافي 43، 779-788 (2020).
85. بوجيو، ل. وآخرون. SoilGrids 2.0: إنتاج معلومات عن التربة للعالم مع عدم اليقين المكاني الكمي. SOIL 7، 217-240 (2021).
86. وارنر، د. ل.، بوند-لامبرتي، ب. ب.، جيان، ج.، ستيل، إ. وفارغاس، ر. التنفس السنوي للتربة بدقة 1 كم على مستوى العالم وعدم اليقين المستمد من SRDB V3 (ORNL DAAC، 2019)؛https://doi.org/10.3334/ORNLDAAC/1736.
87. هنتنجفورد، سي. وآخرون. تداعيات تحسين تمثيلات تنفس النبات في مناخ متغير. نات. كوميونيك. 8، 1602 (2017).
88. مجموعة البيانات لـ “العوامل البيئية لزيادة تنفس النظام البيئي في التندرا الدافئة”. زينودوhttps://doi.org/10.5281/zenodo. 10572479 (2024).
89. نصوص لـ “العوامل البيئية لزيادة تنفس النظام البيئي في التندرا الدافئة”. GitHubhttps://github.com/mjalava/tundraflux (2024).
الشكر والتقدير نود أن نشكر محطة أبيسكو للبحوث العلمية على حسن الضيافة والدعم اللوجستي. نحن ممتنون لقائمة البريد R-sig-meta-analysis على الملاحظات حول التحليلات الإحصائية. كما نود أن نعرب عن تقديرنا لمركز CSC-IT للعلوم في فنلندا على الموارد الحاسوبية والعديد من الطلاب والمساعدين الميدانيين المشاركين في المراقبة والقياسات ومعالجة العينات في مواقع التندرا على مدى عقود من جمع البيانات المضمنة في هذه الدراسة. شكر خاص لـ U. Molau و O. Khitoun على مساهمتهما في البيانات من مواقع SWE_12 و 14 و 15، ولـ Dries VDL على الدعم المستمر. نحن نعترف بأن بعض الأعمال الميدانية قد أُجريت على أراضٍ تقليدية. نشعر بالحزن العميق لوفاة J. Tang، أحد مؤلفينا المشاركين، خلال كتابة المخطوطة ونود أن نبرز المساهمات الأساسية التي قدمها كعالم بيئي في مجال علم دورة الكربون. خلال إعداد المخطوطة، تم تمويل S.L.M. من قبل مؤسسة الأبحاث الفلمنكية (منحة FWO رقم 12ZZV21N) وتم تمويل E.D. من قبل مجلس الأبحاث السويدي VR (منحة رقم 2018-04004) ومؤسسة كنوت وأليس والينبرغ (منحة رقم KAW 2020.0126). نود أيضًا أن نشكر الوكالات التمويلية التالية على الدعم في العمل الميداني أو المختبري أو الرواتب كجزء من جمع البيانات في الموقع وتوليف البيانات: مركز أبحاث تأثير المناخ، المجلس الأوروبي للبحوث (منحة رقم 819202 الممنوحة لـ M.K. ومنحة رقم 77102 لـ I.R.)، أكاديمية فنلندا (أرقام المنح N-PERM 341348 لـ C.B.، THAW-N 349503 و ACCC 337550 لـ M.E.M.، ورقم 347188 لـ E.K.)، صندوق العلوم النمساوي FWF (منحة Lise Meitner رقم M-3335 لـ C.B.)، برنامج العلم الرائد لمجلس أبحاث فنلندا تحت مشروع المياه الرقمية (منحة رقم 359248 لـ M.K.)، المديرية العامة للبحث في المفوضية الأوروبية (منحة رقم EVK2-2001-00235 لـ E.J.C. ومنحة رقم 771012 لـ R.R.)، مؤسسة الأبحاث الوطنية الدنماركية (منحة رقم CENPERM DNRF 100 الممنوحة لـ B.E. و A.M. و C.S.N.)، المؤسسة الوطنية للعلوم في الولايات المتحدة (أرقام المنح PLR 1418010 لـ N.F.، PLR 1417763 لـ T.C.P. و ANS-211364 لدعم M. Petit Bon)، مجلس الأبحاث النرويجي (منحة FRIMEDBIO رقم 274712 لـ J.G. و J.P.T. و V.V.، منحة رقم 274712 لـ R.G. و S.V.H.، أرقام المنح 276080 و 343398 لـ B.B.H.، منحة رقم SFF-III 223257 لجامعة العلوم والتكنولوجيا النرويجية لـ M.L.M.، أرقام المنح FEEDBACK، 250740 و EMERALD، 294948 لـ H.L. ومنحة Arctic Field رقم 269957 لـ M. Petit Bon)، أموال مراقبة النظام البيئي في غرينلاند لـ K.R.، ARCUM، مؤسسة Ymer-80 و SNSF (منحة رقم PZOOP2_174047 لـ K.G.)، مجلس الأبحاث السويدي FORMAS (أرقام المنح 2013-655 لـ S.H. و 2021-02449 لـ J.M.S.)، Alberta Innovates Technology Futures وبرنامج كراسي الأبحاث الكندية لـ M.S.، مشاريع اكتشاف مجلس الأبحاث الأسترالي (منحة رقم DP220100915 لـ M.J.H.)، صندوق الأبحاث الأيسلندي (لـ I.S.J.)، المؤسسة الوطنية للبحث في كوريا (أرقام المنح NRF-2021M1A5A1075508 و KOPRI-PN22012 لـ J.Y.J.)، صندوق حماية البيئة في سفالبارد (منحة رقم 15/128 لـ M. Petit Bon ومنحة رقم 16/113 لـ B.B.H.)، وكالة حماية البيئة الدنماركية (لتمويل N.M.S.)، أكاديمية فنلندا (منحة رقم MUFFIN 332196 لـ C.V.)، مؤسسة Maj و Tor Nessling (لتمويل H.Y.)، مجموعة دعم تكنولوجيا المياه (لـ M.J.)، برنامج الأبحاث والابتكار Horizon 2020 للاتحاد الأوروبي بموجب اتفاقية ماري سكلودوفسكا كوري (منحة رقم 657627 لـ M.P. Björkman)، FORMAS مجلس الأبحاث السويدي للتنمية المستدامة (لتمويل M.P. Björkman)، المرصد المناخي-الإيكولوجي للتندرا القطبية-COAT و UNIS (الدعم اللوجستي للعمل الميداني لـ M.L.M. و B.B.H.). البيئة البحثية الاستراتيجية BECC-التنوع البيولوجي وخدمات النظام البيئي في مناخ متغير (لـ M. P. Björkman) ومن أجل تمويل T.S.، نشكر وزارة الطاقة الأمريكية، مكتب الأبحاث البيولوجية والبيئية (برنامج علوم النظام البيئي الأرضي أرقام DE-SC0006982، DE-SC0014085 و DE-SCOO2O227 وشبكة كربون التربة المتجمدة (أرقام مشاريع NSF 1331083 و 1931333).
مساهمات المؤلفين: E.D. و J.M.S. و M.P. Björkman اقترحوا الفكرة و S.L.M. و M.P. Björkman و J.M.S. و E.D. صمموا الدراسة. قدم كل من E.D. و G.M. و J.D. و J.M.S. و M.P. Björkman و S. Schwieger و V.V. ملاحظات شاملة على التحليلات والمخطوطة. جمع كل من S.L.M. و J.D. بيانات ER للتحليل التلوي والانحدار التلوي الذي أجراه S.L.M. جمع S. Schwieger وحلل بيانات AR/HR للتحليل التلوي. قام M.J. و J.T.W. و M.K. بإجراء التوسيع المكاني وصمموا جميع الأشكال ذات الصلة. قام S. Schwieger و J.D. و S.L.M. بتصميم الشكل 1 بشكل مشترك. قام S. Schwieger و S.L.M. بتصميم الملخص الرسومي بشكل مشترك، الذي أعده S. Schwieger. أنتج J.M.S. الشكل التكميلية 4. أنتج S. Schwieger الشكل التكميلية 5. صمم S.L.M. جميع الأشكال والجداول الأخرى وكتب المخطوطة. قام M.K. بالتنسيق النهائي للأشكال. ساهم جميع المؤلفين، باستثناء G.M. و J.D. و J.M.S. و S.L.M. و S. Schwieger، بالبيانات. V.V. و R.A. و I.A. و R.B. و M.C. و G.C. و C.T.C. و P.F. و T.F. و K.G. و S.V.H. و C.H.P. و I.S.J. و J.Y.J. و T.M. و C.S.N. و T.C.P. و E.P.P. و M. Petit Bon و A.P. و K.R. و N.M.R.R. و R.R. و I.R. و M.V. و C.V. و H.O. و S. Sjögersten,

مقالة

شارك م.ب. بيوركمان وE.D. أيضًا في جمع البيانات في الموقع. جمع I.A. وC.B. وJ.H.C. وC.T.C. وE.D. وH.L. وS. سيوجرستين وV.V. وC.V. بيانات تقسيم التدفق في الموقع. طور M.J. مستودعات البيانات والرموز. راجع جميع المؤلفين المخطوطة، باستثناء G.C. وH.B. وH.O. وJ.T. وJ. غودموندسون وM.J. وM.N. وN.M.R.R. وR.E.L. وR.S.V.L. وR.A. وZ.G. الذين ساهموا فقط بالبيانات.
تمويل تمويل الوصول المفتوح مقدم من جامعة أوميا.
المصالح المتنافسة يعلن المؤلفون عدم وجود مصالح متنافسة.
معلومات إضافية
معلومات إضافية النسخة الإلكترونية تحتوي على مواد إضافية متاحة علىhttps://doi.org/10.1038/s41586-024-07274-7.
يجب توجيه المراسلات والطلبات للحصول على المواد إلى S. L. Maes.
تُعرب مجلة Nature عن شكرها لجيسيكا غوريفيتش، إيفان يانسنس والمراجعين الآخرين المجهولين على مساهمتهم في مراجعة هذا العمل. تقارير مراجعي الأقران متاحة.
معلومات إعادة الطباعة والتصاريح متاحة علىhttp://www.nature.com/reprints.

الشكل البياني الممتد 2 | توزيع موحد لـ استجابة للاحتباس الحراري في سياق بيئي لجميع مجموعات البيانات. استجابة للاحتباس الحراري التجريبي عبر السياق البيئي المكاني (انظر الشكل 1 في النص الرئيسي). مخططات الكمان للبيانات الفعلية عبر المحركات البيئية الفئوية، وهي منطقة المناخ (أ)، فئة رطوبة التربة (ب)، التربة فئة (ج) وفئة الغطاء النباتي (د) معروضة، تظهر تقدير كثافة النواة للتوزيعات الأساسية. يتم عرض قيم SMDs للبيانات الفردية مع فقاعات رمادية، محسوبة كـ (المتوسط من القطع المدفأة – المتوسط من الانحراف المعياري المجمّع لقطع التحكم. حجم الفقاعات يدل على وزن الملاحظة المستخدمة في نماذج الميتا-تحليل، والذي يتم قياسه كعكس الجذر التربيعي للتباين داخل الدراسة، مع وجود فقاعات أكبر تشير إلى وزن أكبر.
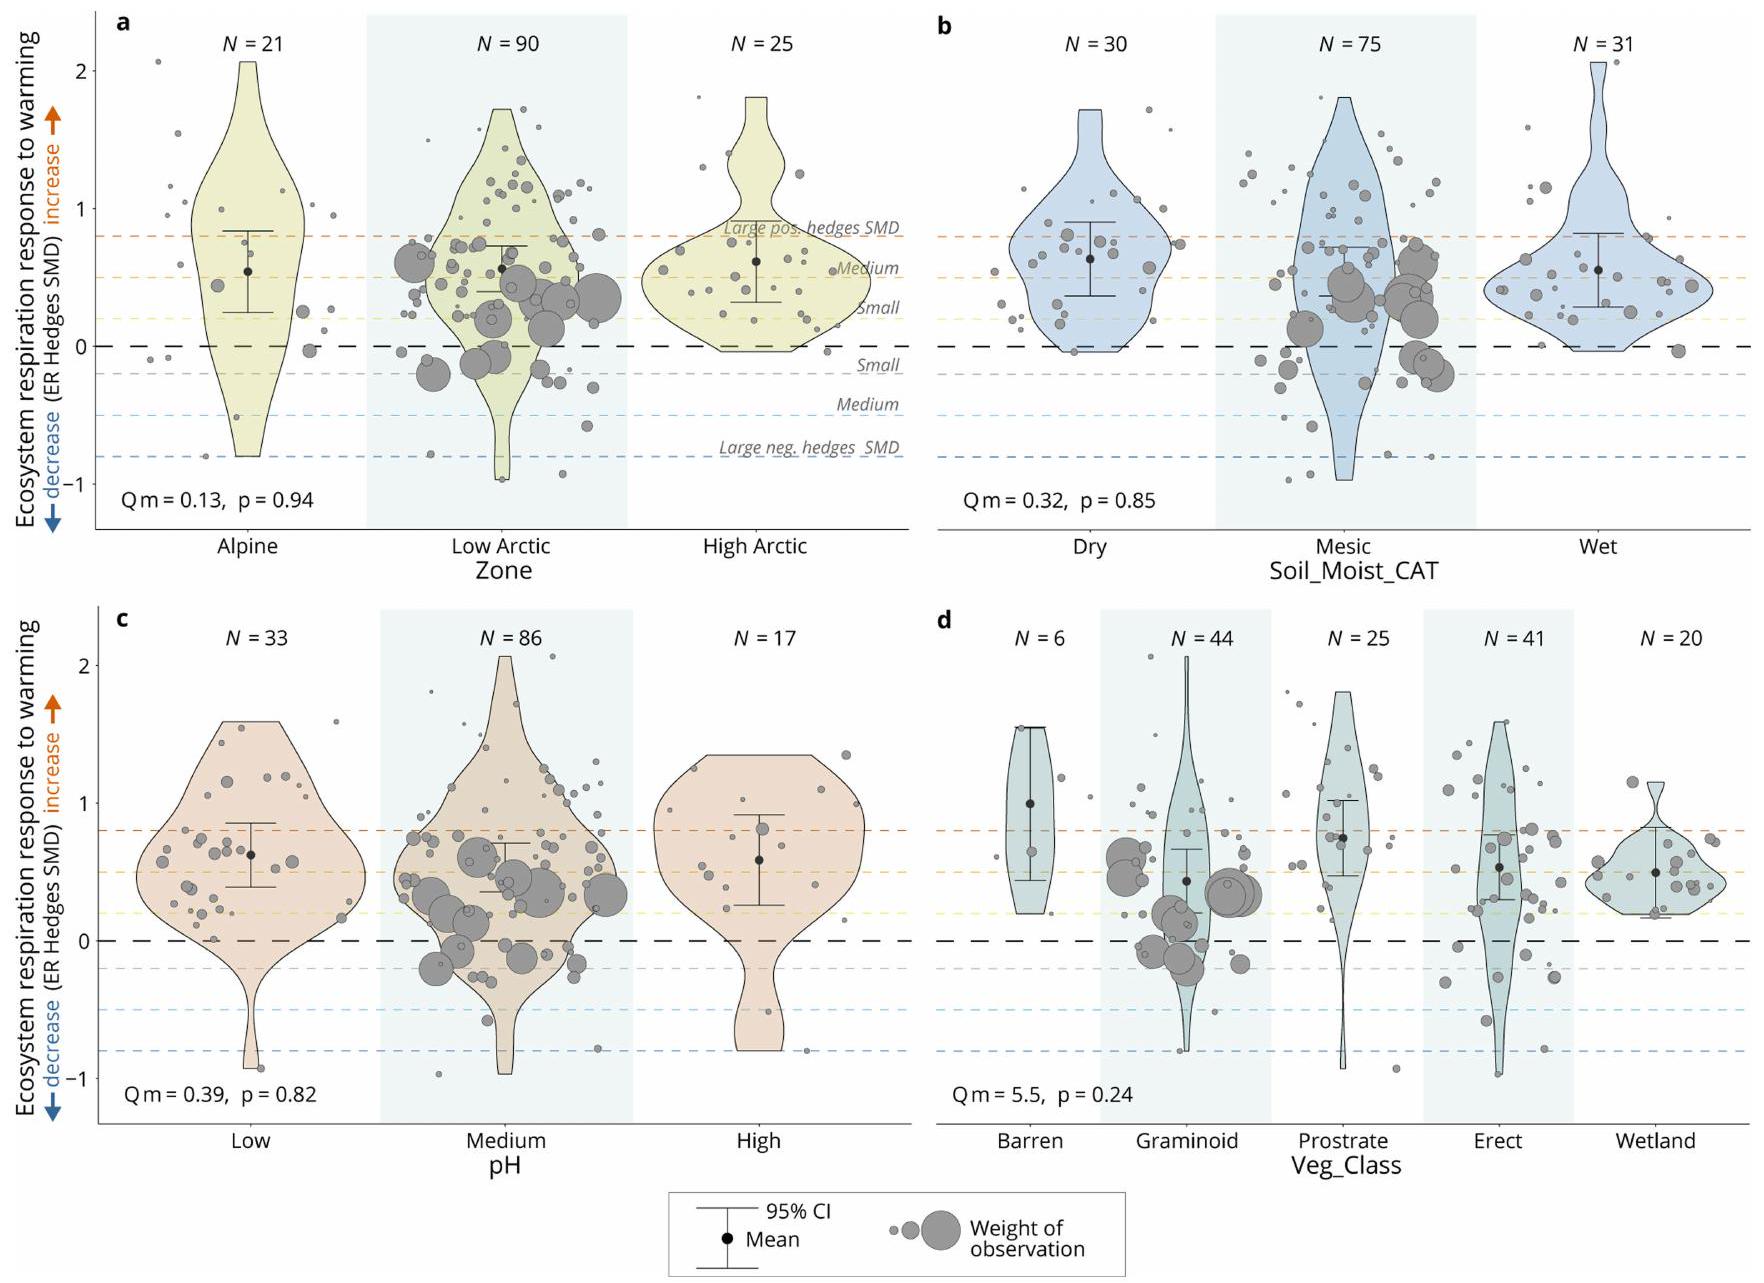
الأوزان. ضمن مخططات الكمان، تقديرات نموذج الميتا-تحليل أحادي العامل و تُعرض فترات الثقة بدوائر سوداء وأشرطة خطأ. فوق محور السينات، يمثل قيمة ‘Qm’ أهمية الوسيط أو المحرك البيئي مع -قيمة (‘ -فال’) لكل نموذج. عدد مجموعات البيانات (‘N’) لكل محرك بيئي حسب الفئة موضح فوق مخططات الكمان. الخط الأفقي المنقط الأسود (SMD ) تمثل عدم وجود تغيير في ER مع الاحترار بينما تمثل المناطق أعلاه وأدناه زيادة (SMD > 0) مقابل انخفاض (SMD < 0) في ER مع الاحترار. الخطوط الأفقية المتقطعة ( ، 0.8 و تعكس أحجام تأثير الحواجز الإيجابية والسلبية الصغيرة والمتوسطة والكبيرة أو بشكل متزايد أكبر يزيد وينقص مع الاحترار. لمخرجات النموذج التفصيلية، انظر الجدول 4 في البيانات الموسعة.
الشكل البياني الموسع 3| التغيرات الناتجة عن الاحترار في ظروف التربة تؤثر على استجابة انبعاثات الكربون. الاتجاهات في التغيرات الناتجة عن الاحترار في ظروف التربة وفي مجتمع النباتات الذي يقود استجابة للاحتباس الحراري التجريبي ): سياج SMD لكثافة الكتلة (BD) (أ) ونسبة الكربون إلى النيتروجين (ب) لطبقة المعادن في التربة وإجمالي تركيز الطبقة العضوية للتربة (ج) والكتلة الحيوية فوق الأرض (د) وتغطية الأعشاب (هـ) لمجتمع النباتات. يتم عرض قيم ER Hedges SMDs لمجموعات البيانات الفردية على المحور الصادي مع فقاعات رمادية، محسوبة كـ (المتوسط من متوسط المؤامرات المدفأة – متوسط المؤامرات الضابطة) / الانحراف المعياري المجمّع. حجم الفقاعات يدل على وزن الملاحظة المستخدمة في التحليل التلوي، والذي يتم تحديده كعكس الجذر التربيعي لتباين داخل الدراسة، مع وجود فقاعات أكبر تشير إلى أوزان أكبر. في أعلى اليسار من كل لوحة يظهر حجم العينة (‘N’، عدد مجموعات البيانات) و
الزاوية السفلى اليسرى تظهر ‘Qm’ (قيمة Q لأهمية العوامل البيئية) و -قيمة نماذج الميتا-تحليل. الخط الأفقي المنقط الأسود تمثل عدم وجود تغيير في ER مع الاحترار بينما تمثل المناطق أعلاه وأدناه زيادة (SMD > 0) مقابل انخفاض (SMD < 0) في ER مع الاحترار. الخطوط الأفقية المتقطعة ( و تعكس HedgesSMD الصغيرة والمتوسطة والكبيرة الإيجابية والسلبية، على التوالي. أو بشكل متزايد أكبر يزيد وينقص مع الاحترار. الخط العمودي المنقط الأسود لا يعكس أي تغيير في الحالة البيئية مع الاحترار (حيث تمثل المناطق على اليمين واليسار منه ظروفًا متزايدة مقابل ظروف متناقصة مع الاحترار). لمخرجات النموذج التفصيلية، انظر الجدول 3 في البيانات الموسعة.

مقالة

البيانات الموسعة الجدول 1 | التحليلات الميتا التي تقيم تأثيرات الاحترار التجريبي على التنفس البيئي (ER) والتنفس الذاتي (Ra) والتنفس غير الذاتي (Rh)

استجابة الانحدار [95%CI]* قيمة Q هيكل متعدد المستويات مكون الانحدار الذاتي (داخلي | خارجي) ن نسبة التغيير
تاو تربيع رو
التحليل التلوي الرئيسي
نظام بيئي
التنفس (ER)
تحوطات SMD
[0.44، 0.70] *** 731 0.00 0.00 0.19 0.92 ١٣٦ غير متوفر
نسبة المتوسطات (ROM)
[0.20، 0.32] *** 907 0.00 0.00 0.04 0.94 ١٣٦
تحليل فرعي
تنفس النظام البيئي (ER) تحوطات SMD
[0.42، 1.02] *** 19 0.02 0.09 0.00 0.00 ٩ غير متوفر
روم [0.18، 0.48] *** 23
0.03 0.00 0.00 0.35 9 [19.6, 62.1] %
تحوطات SMD
التنفس التلقائي (Ra) [0.08، 0.80] *** 26 0.00 0.20 0.00 0.00 9 غير متوفر
روم
[0.08، 0.83] *** 27 0.07 0.13 0.00 0.00 ٩ [6.9، 130.2] %
التنفس غير الذاتي (Rh) تحوطات SMD [0.36، 1.48] ***
43 0.00 0.00 0.50 0.84 9 غير متوفر
19 0.03 0.00 0.00 1.00 9 %
نتائج هامة مميزة بخط عريض: * ; ** <0.01; *** <0.001. نسبة التغيير روم
من الأعلى إلى الأسفل: الأنواع المختلفة من استجابات التنفس المستخدمة في التحليلات الميتا، أي، تنفس النظام البيئي (ER) مقابل التنفس الذاتي أو النباتي (Ra) مقابل التنفس غير الذاتي أو الميكروبي (Rh)، مع ; الأنواع المختلفة من أحجام التأثير المستخدمة في التحليلات التلوية، أي، Hedges SMD مقابل نسبة المتوسطات (ROM). من اليسار إلى اليمين: نوع التنفس الذي تم التحقيق فيه (‘الاستجابة’)؛ نتائج النموذج لكل استجابة، اختبار ما إذا كان التنفس يتغير بشكل كبير مع الاحترار التجريبي (‘الانحدار’)؛ قيمة Q للتباين؛ ناتج هيكل النموذج متعدد المستويات (يمثل بـ و ) ومكون النموذج الذاتي الانحدار (تاو و rho)؛ حجم العينة (‘ N ‘ أو عدد مجموعات البيانات)؛ ونسبة التغيير المحسوبة من ROM كـ 100*( تُعرض نتائج التحليل التلوي كمتوسط تقدير النموذج (الميل) وفواصل الثقة 95%، مع سهم للأسفل/للأعلى ( ) تشير إلى انخفاض أو زيادة ملحوظة في التنفس مع الاحترار ومستوى الأهمية بناءً على -القيم. المحركات والنتائج الهامة بالخط العريض.
البيانات الموسعة الجدول 2 | نماذج الميتا-تحليل التي تقيم تأثيرات مدة التسخين التجريبي على استجابة معدل التنفس للتسخين
سائق المنحدر [95% فترة الثقة]* التيسير الكمي QM هيكل متعدد المستويات مكون الانحدار الذاتي (داخلي | خارجي) ن
مدة التسخين عبر فئات العمر (جميع البيانات) تاو^2 رو ١٣٦
داخل فئات العمر
[0-5 سنوات)
[-0.08، 0.06] [5-10 سنوات) 186 0.1 0.00 0.06 0.03 0.00 0.05 70
[10-15 سنة) 63 63 0.45 0.23 0.00 0.00 1.00 ٢٨
سنوات ٣٦ ٥.٦ 0.33 0.13 0.00 0.00 1.00 15
0.00 [-0.13, 0.13] 85 0.0 0.00 0.51 0.00 0.00 1.00 23
فئة العمر أثر فئة العمر ٤٦٨ 5.2 0.03 0.00 0.00 0.20 0.93 ١٣٦
الأهمية من الصفر
[0-5 سنوات)
0.63 [0.48، 0.79]***
[5-10 سنوات)
0.41 [0.21، 0.62]***
[10-15 سنة)
0.40 [0.14، 0.64]***
سنوات
0.61 [0.33، 0.89]***
النتائج الهامة مميزة بالخط العريض: * p<0.05; **<0.01; ***<0.001.
من الأعلى إلى الأسفل: نتائج نموذج الميتا-تحليل لاختبار تأثيرات مدة التسخين التجريبي و فئات العمر بناءً على مدة التسخين التجريبي، على تحوطات لكل البيانات أو لفئات العمر المنفصلة. من اليسار إلى اليمين: السائق المحدد المستخدم كمتنبئ لاختبار التأثير على تحوطات SMDs (‘السائق’)؛ نتائج النموذج لكل سائق، اختبار ما إذا كان تتأثر التحوطات SMDs بشكل كبير بالعامل (‘المنحدر’)؛ قيمة ‘QE’ للتباين، بالإضافة إلى قيمة ‘QM’، التي تعكس أهمية العامل و (‘ ); ناتج هيكل النموذج متعدد المستويات (الممثل بـ و ) ومكون النموذج الذاتي الانحدار (تاو و rho)؛ وحجم العينة (‘ أو عدد مجموعات البيانات). يتم تقديم نتائج الميتا-تحليل كمتوسط تقدير النموذج و فترات الثقة (‘الميل ( )’), مع سهم لأعلى/لأسفل ( ) مما يشير إلى أن القيم الأعلى للسائق قد انخفضت أو زادت بشكل كبير الاستجابات للاحتباس الحراري ومستوى الأهمية بناءً على -القيم. المحركات والنتائج الهامة بالخط العريض.

مقالة

البيانات الموسعة الجدول 3 | نماذج الميتا-تحليل التي تقيم تأثيرات العوامل البيئية (تأثيرات الاحترار غير المباشرة) على استجابة معدل التنفس للاحتباس الحراري

سائق الانحدار [95%CI]* التيسير الكمي QM هيكل متعدد المستويات مكون الانحدار الذاتي (داخلي | خارجي) ن
نوع رو
المناخ
درجة حرارة الهواء SMD ٤٦٧ 0.2 0.00 0.00 0.00 0.16 0.90 77
درجة حرارة التربة SMD [-0.04, 0.26] ٥٣٦ 2.0 0.02 0.00 0.00 0.12 0.95 ١١٨
رطوبة التربة SMD [-0.14, 0.08] 621 0.3 0.00 0.00 0.00 0.18 0.93 111
التربة
SMD SOM (دقيقة، منظمة) [-0.40، 0.79] ٨٠ 0.4 0.01 0.49 0.00 0.00 1.00 ٢٨
[-0.29, 0.66] 93 0.6 0.01 0.00 0.00 0.26 1.00 41
SMD TC (الحد الأدنى، المنظمة) [-0.17، 0.52] ٢٧٠ 1.0 0.04 0.00 0.00 0.14 0.95 42
٣٧٩ 0.1 0.00 0.00 0.00 0.12 0.94 65
SMD TN (الحد الأدنى، المنظم) [0.04، 0.44] * 186 ٥.٤ 0.22 0.00 0.00 0.11 0.95 42
[0.00، 0.54] (*) 341 3.7 0.08 0.00 0.00 0.11 0.95 65
SMD CN (الحد الأدنى، المنظم) 185 3.8 0.12 0.00 0.00 0.13 0.96 ٣٨
[-0.16, 0.08] 404 0.6 0.00 0.00 0.00 0.11 0.94 71
SMD pH (الحد الأدنى، العضوي) [0.06, 2.91] * 65 ٤.٢ 0.12 0.37 0.00 0.00 1.00 27
[-0.17, 0.11] ١١٥ 0.2 0.00 0.00 0.00 0.18 0.99 53
كثافة الكتلة SMD 231 3.2 0.27 0.00 0.00 0.12 0.94 31
(دقيقة، منظمة) [-0.13، 0.50] ٣٧٩ 1.3 0.03 0.00 0.00 0.31 0.98 ٤٩
نباتات
نباتات الحشائش [-0.04، 0.36] (*) 565 2.6 0.02 0.00 0.00 0.18 0.91 100
فوربس SMD [-0.17, 0.25] 593 0.1 0.00 0.00 0.00 0.18 0.91 111
شجيرات SMD Decid [-0.19, 0.08] 579 0.6 0.01 0.00 0.00 0.20 0.93 90
شجيرات SMD إيفرجرين [-0.11, 0.28] 566 0.7 0.01 0.00 0.00 0.19 0.91 ٨٨
طحالب SMD [-0.05, 0.23] 585 1.6 0.02 0.00 0.00 0.20 0.91 ٨٨
الطحالب SMD [-0.13, 0.33] 518 0.7 0.01 0.00 0.00 0.20 0.93 78
الكتلة الحيوية SMD [-0.03، 0.45] (*) 222 2.9 0.06 0.00 0.00 0.12 0.95 61
ارتفاع SMD Comm ١٠٢ 0.4 0.01 0.00 0.00 0.16 1.00 43
ميكروبي
وفرة البكتيريا SMD [-0.05, 0.37] 11 2.2 0.27 0.01 0.00 0.00 0.99 16
وفرة الفطريات SMD [-0.52, 0.33] 14 0.2 0.03 0.04 0.00 0.00 0.94 16
نسبة FB-SMD ١٣ 0.4 0.07 0.04 0.00 0.00 1.00 16
البيانات الموسعة الجدول 4 | نماذج الميتا-تحليل التي تقيم تأثيرات العوامل البيئية (اعتماد السياق) على استجابة معدل التنفس للارتفاع في درجات الحرارة
سائق المنحدر [95% فترة الثقة]* التيسير الكمي QM هيكل متعدد المستويات مكون الانحدار الذاتي (داخلي | خارجي) ن
نوع تاو تربيع رو
المناخ
منطقة غير مهم 713 0.1 0.00 0.00 0.00 0.20 0.93 ١٣٦
مشكلة الجليد الدائم [-0.25, 0.38] 709 0.2 0.00 0.00 0.00 0.19 0.93 ١٣٣
درجة حرارة الهواء 0.00 [-0.02, 0.03] 479 0.1 0.00 0.00 0.00 0.16 0.90 77
درجة حرارة التربة [-0.01, 0.04] ٥٠٠ 1.2 0.01 0.00 0.00 0.12 0.94 ١١٨
التربة
رطوبة التربة 0.00 [0.00، 0.00] 612 0.1 0.00 0.00 0.00 0.18 0.93 111
فئة رطوبة التربة غير مهم 673 0.3 0.00 0.00 0.00 0.20 0.93 ١٣٦
SOM (حد أدنى، منظمة) [-0.14, 0.24] 79 0.2 0.01 0.46 0.00 0.00 1.00 ٢٨
0.00 [-0.02, 0.01] 96 0.8 0.02 0.00 0.00 0.27 1.00 41
رصيد الكربون في التربة 0.00 [-0.00, 0.00] 682 0.0 0.00 0.00 0.00 0.20 0.93 131
TC (دقيقة، منظمة) -0.02 [-0.04, 0.01] 263 1.9 0.08 0.00 0.00 0.11 0.92 42
0.00 [-0.01, 0.01] ٣٥٧ 0.1 0.00 0.00 0.00 0.17 0.96 70
TN (دقيقة، منظمة) 302 6.3 0.27 0.00 0.00 0.08 0.91 43
0.00 [-0.26, 0.26] 394 0.0 0.02 0.00 0.00 0.17 0.96 70
C:N (دقيقة، عضوي) [0.00, 0.06] * 244 ٤.٧ 0.22 0.00 0.00 0.13 0.96 ٣٩
370 1.1 0.02 0.00 0.00 0.13 0.95 75
فئة pH غير مهم 666 0.4 0.00 0.00 0.00 0.20 0.93 ١٣٦
درجة الحموضة (الحد الأدنى، العضوي) [-0.39, 0.64] 82 0.2 0.01 0.46 0.00 0.00 1.00 ٢٩
[-0.06، 0.30] ١٣٣ 1.6 0.02 0.00 0.00 0.20 0.93 ٥٥
الكثافة الظاهرية [-0.62, 0.81] ٢٨٠ 0.1 0.01 0.00 0.00 0.16 0.95 ٣٨
(دقيقة، منظمة) -0.26 [-2.62, 2.10] ٤٤٩ 0.0 0.00 0.00 0.00 0.24 0.96 69
نباتات
فئة الغطاء النباتي غير مهم 624 ٥.٥ 0.04 0.00 0.00 0.19 0.92 ١٣٦
الإنتاج الأولي الصافي 0.00 [-0.89, 0.88] 721 0.0 0.00 0.00 0.00 0.20 0.93 ١٣٦
تُبرز النتائج المهمة بالخط العريض: * . الاتجاهات ( ) يتم الإشارة إليها بـ ().
من الأعلى إلى الأسفل: نتائج نموذج الميتا-تحليل لاختبار تأثيرات الظروف البيئية المحددة بالسياق على SMD حواف ER (‘اعتماديات السياق’). من اليسار إلى اليمين: نوع المحرك البيئي الذي تم التحقيق فيه؛ المحرك المحدد المستخدم كمتنبئ لاختبار التأثير على SMD حواف ER (‘المحرك’); نتائج النموذج لكل محرك، لاختبار ما إذا كانت SMD حواف ER تتأثر بشكل كبير بالمحرك (‘الانحدار’); قيمة ‘QE’ للتباين، بالإضافة إلى قيمة ‘QM’، التي تعكس أهمية المحرك و زائف- (‘ ‘); ناتج هيكل النموذج متعدد المستويات (الممثل بـ و ) ومكون النموذج الذاتي الانحدار (تاو و rho)؛ وحجم العينة (‘ أو عدد مجموعات البيانات). يتم تقديم نتائج الميتا-تحليل كمتوسط تقدير النموذج و فترات الثقة (‘الميل ( )’), مع سهم لأعلى/لأسفل ( ) مما يشير إلى أن القيم الأعلى للسائق قد انخفضت أو زادت بشكل كبير الاستجابات للاحتباس الحراري ومستوى الأهمية بناءً على -القيم. المحركات والنتائج الهامة بالخط العريض.

  1. *تُبرز النتائج المهمة بالخط العريض:* ; **<0.01; **<0.001. الاتجاهات ( ) يتم الإشارة إليها بـ ().
    من الأعلى إلى الأسفل: نتائج نموذج الميتا-تحليل التي تختبر تأثيرات التغيرات البيئية المحلية الناتجة عن الاحترار على قيم Hedges SMD الخاصة بـ ER (‘التأثيرات غير المباشرة للاحتباس الحراري’). من اليسار إلى اليمين: نوع المحرك البيئي الذي تم التحقيق فيه؛ المحرك المحدد المستخدم كمتنبئ لاختبار التأثير على قيم Hedges SMD الخاصة بـ ER (‘المحرك’)؛ نتائج النموذج لكل محرك، تختبر ما إذا كانت قيم Hedges SMD الخاصة بـ ER تتأثر بشكل كبير بالمحرك (‘الانحدار’); قيمة ‘QE’ للتباين، بالإضافة إلى قيمة ‘QM’، التي تعكس أهمية المحرك و زائف- (‘ ‘); ناتج هيكل النموذج متعدد المستويات (الممثل بـ و ) ومكون النموذج الذاتي الانحدار ( و rho)؛ وحجم العينة (‘N’ أو عدد مجموعات البيانات).
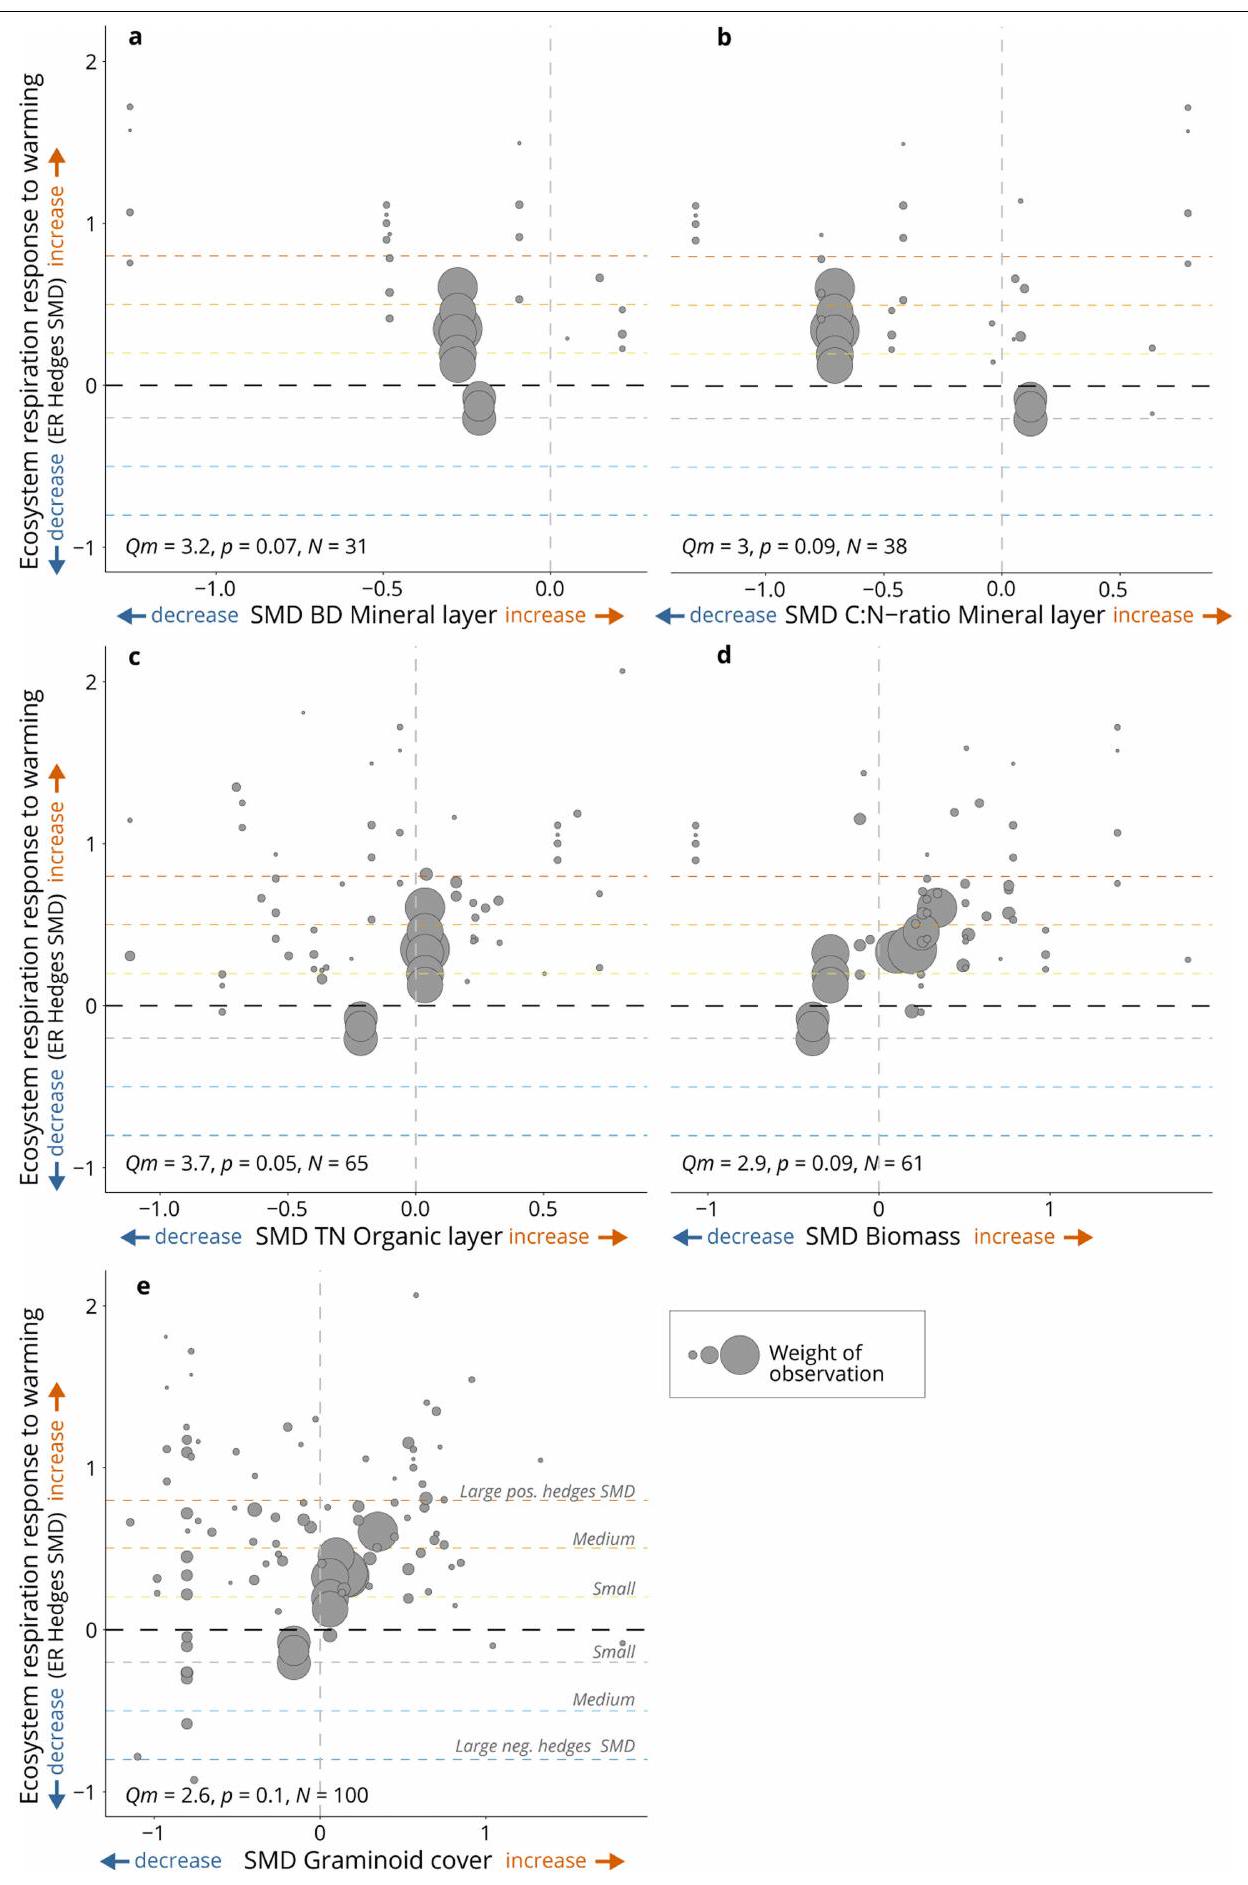
    تُعرض نتائج الميتا-تحليل كمتوسط تقدير النموذج و فترات الثقة (‘الميل ( )’), مع سهم لأعلى/لأسفل ( ) مما يشير إلى أن القيم الأعلى للسائق قد انخفضت أو زادت بشكل كبير الاستجابات للاحتباس الحراري ومستوى الأهمية بناءً على -القيم. المحركات والنتائج الهامة بالخط العريض.

Journal: Nature, Volume: 629, Issue: 8010
DOI: https://doi.org/10.1038/s41586-024-07274-7
PMID: https://pubmed.ncbi.nlm.nih.gov/38632407
Publication Date: 2024-04-17

Environmental drivers of increased ecosystem respiration in a warming tundra

https://doi.org/10.1038/s41586-024-07274-7
Received: 29 November 2022
Accepted: 6 March 2024
Published online: 17 April 2024
Open access
S. L. Maes , J. Dietrich , G. Midolo , S. Schwieger , M. Kummu , V. Vandvik , R. Aerts ,
I. H. J. Althuizen , C. Biasi , R. G. Björk , H. Böhner , M. Carbognani , G. Chiari ,
C. T. Christiansen , K. E. Clemmensen , E. J. Cooper , J. H. C. Cornelissen , B. Elberling ,
P. Faubert , N. Fetcher , T. G. W. Forte , J. Gaudard , K. Gavazov , Z. Guan ,
J. Guðmundsson , R. Gya , S. Hallin , B. B. Hansen , S. V. Haugum , J.-S. ,
C. Hicks Pries , M. J. Hovenden , M. Jalava , I. S. Jónsdóttir , J. Juhanson , J. Y. Jung ,
E. Kaarlejärvi , M. J. Kwon , R. E. Lamprecht , M. Le Moullec , H. Lee ,
M. E. Marushchak , A. Michelsen , T. M. Munir , E. M. Myrsky , C. S. Nielsen ,
M. Nyberg , J. Olofsson , H. Óskarsson , T. C. Parker , E. P. Pedersen , M. Petit Bon ,
A. Petraglia , K. Raundrup , N. M. R. Ravn , R. Rinnan , H. Rodenhizer , I. Ryde ,
N. M. Schmidt , E. A. G. Schuur , S. Sjögersten , S. Stark , M. Strack , J. Tang ,
A. Tolvanen , J. P. Töpper , M. K. Väisänen , R. S. P. van Logtestijn , C. Voigt , J. Walz ,
J. T. Weedon , Y. Yang , H. Ylänne , M. P. Björkman , J. M. Sarneel & E. Dorrepaal

Abstract

Arctic and alpine tundra ecosystems are large reservoirs of organic carbon . Climate warming may stimulate ecosystem respiration and release carbon into the atmosphere . The magnitude and persistency of this stimulation and the environmental mechanisms that drive its variation remain uncertain . This hampers the accuracy of global land carbon-climate feedback projections . Here we synthesize 136 datasets from 56 open-top chamber in situ warming experiments located at 28 arctic and alpine tundra sites which have been running for less than 1 year up to 25 years. We show that a mean rise of [confidence interval (CI) ] in air and in soil temperature results in an increase in growing season ecosystem respiration by [CI 22-38%] ( ). Our findings indicate that the stimulation of ecosystem respiration was due to increases in both plant-related and microbial respiration ( ) and continued for at least 25 years ( ). The magnitude of the warming effects on respiration was driven by variation in warming-induced changes in local soil conditions, that is, changes in total nitrogen concentration and pH and by context-dependent spatial variation in these conditions, in particular total nitrogen concentration and the carbon:nitrogen ratio. Tundra sites with stronger nitrogen limitations and sites in which warming had stimulated plant and microbial nutrient turnover seemed particularly sensitive in their respiration response to warming. The results highlight the importance of local soil conditions and warming-induced changes therein for future climatic impacts on respiration.

The fate of the globally important carbon (C) stock of the arctic and alpine tundra biome (hereafter referred to as ‘the tundra’) will be determined by the balance between climatic impacts on C uptake (plant photosynthesis) and release (ecosystem respiration (ER) ); that is, the sum of plant or autotrophic respiration and microbial or heterotrophic respiration . As the tundra stores vast amounts of carbon and is warming at rates higher than the global average , the consequences of global warming for C release from this biome have been a topic of hot debate over the past decades . The overall magnitude, persistency and drivers causing variability of the ER increase with warming, however, remain highly uncertain, especially for multidecadal timescales. This is due to large variability in the ER response to experimental warming across single- or multisite studies (for example, increases of
8-52%; refs. 5,9,18-20), as well as poor representation of tundra sites in multisite meta-analyses of respiration .

Indirect warming effects

Variability in the ER response to warming among tundra sites can be caused by differences in direct effects of warming on ER, for instance through changing kinetic rates of the underlying biological processes, as well as by indirect effects, through differences in warming-induced changes in abiotic (for example, microclimate , soil conditions and permafrost thawing ) or biotic (vegetation and decomposer community composition ) conditions. For example, warming-associated soil drying can increase heterotrophic respiration by increasing oxygen
Fig. 1|Study area, duration and environmental context of warming experiments across the tundra biome. a-c, ER was collected in 136 growing season measurement years across 56 independent OTC warming experiments, covering 28 distinct geographical sites across the tundra biome (a), capturing a wide range of experimental warming durations at the time of ER measurements (b) and environmental heterogeneity (c). The radius of the dots in a indicates the number of years in which ER was measured per experiment (range 1-13 years; 63% of experiments with range greater than 1 year), the colour of the dots indicates the number of observations per dataset, that is, number of ER measurements in the growing season across all years in which measurements
were conducted (details in Extended Data Fig. 1, Supplementary Methods 1 and Supplementary Tables 1 and 2). The distribution of datasets is shown across the duration of experimental warming before ER measurements were taken, grouped into four classes (duration ER measurement year – OTC treatment start year; note that ‘0’ refers to the first summer of experimental warming) (b) and categorical variables describing environmental contexts (c), from left to right: zone; soil moisture class; soil pH class; and vegetation type (B, barren; G, graminoid; P, prostrate shrub; S, erect shrub; W, wetland tundra). The maps were made with .
supply for microbes in waterlogged or anaerobic soils, whereas it can decrease respiration by promoting water limitation of microbial metabolism in dry or aerobic soils . Also, warming-driven changes in vegetation cover or composition may affect ER responses by altering the quantity of plant roots or the quantity and quality of litter, ultimately influencing autotrophic and heterotrophic respiration rates .

Context-dependencies

Tundra ecosystems, covering a wide range of environmental conditions , are strongly heterogeneous in their climatic and soil conditions, as well as in their vegetation and microbial communities. ER responses to warming may vary as a result of these context-dependencies or context-specific environmental conditions . For example, ER should theoretically increase more with warming in colder macroclimates or in soils with greater soil organic carbon (SOC) pools, although this remains debated and probably depends on interacting factors such as soil moisture or SOC lability . Similarly, soil pH may cause variability in the ER response magnitude by influencing the availability of key nutrients for plants and decomposers . Further, the vegetation and microbial community abundance or composition can affect the autotrophic respiration and heterotrophic respiration potential and thus the ER response magnitude, through
differences in net primary productivity (NPP), litter quantity and quality and carbon-use efficiency.
Understanding such indirect warming effects as well as contextdependencies might explain the variability in ER responses to warming across the tundra. Further, it might elucidate important underlying mechanisms of the responses. Most multisite meta-analyses have focused strongly on the magnitude, direction and climatological drivers of the ER response , whereas understanding the ecological mechanisms behind the ER response is essential to accurately predict the long-term impact of climate change on the terrestrial carbon cycle . To improve predictions of C emissions for the tundra , we urgently need better quantification and greater mechanistic understanding of how warming influences ER across the biome.

Objective and study design

Here we aim to quantify with meta-analysis the magnitude and variability of the impact of warming on ER across the tundra and to understand with metaregression models how variation in the ER response depends on warming duration, indirect effects of warming and context-dependencies. We therefore collated 24,035 daytime, growing season ER measurements from 28 sites across the tundra biome, covering 56 passive in situ open-top chamber (OTC) warming experiments across four continents, with warming duration ranging from
Fig. 2 | Effects of experimental OTC warming on ecosystem ER. Experimental warming increased ER across the tundra biome but the magnitude of the
one summer to 25 years at the time of ER measurements (Fig. 1a and Supplementary Table 1). No single study has assessed the ER response to in situ experimental warming yet across a large spatiotemporal environmental gradient in the tundra, with a standardized experimental setup while including also an extensive set of environmental drivers . On the basis of previous studies, we expect an overall positive ER response to warming (both autotrophic respiration and heterotrophic respiration) across all experiments but significant variation in the magnitude of the response across time and space. We expect these differences in the magnitude to be driven (1) indirectly by variation in warming-induced changes in local environmental conditions, as well as (2) directly by context-dependent variation in environmental conditions. We focus on the growing season (JuneAugust), which is when most ER measurements are taken and soils

represented by the experiment ID in black (left) and ER measurement year (right) in a colour scale ranging from dark blue, light blue, orange to red which represents increasingly longer warming duration at the time of ER measurements. Experiments with more than 1 year of ER data are grouped. See Supplementary Tables 1, 2 and 4 for details on the datasets and SMD and CI values. The black dashed vertical line (SMD ) represents no change in ER with warming whereas the areas to the right and left of it represent increased (SMD > 0) versus decreased (SMD < 0) ER with warming. Dashed vertical lines ( and ) reflect small, medium and large positive and negative Hedges’ SMD, that is, increasingly greater ER increases and decreases with warming.
are most active. We calculated the ER response as Hedges’ standardized mean difference (SMD) , the difference in mean growing season ER of the unmanipulated control and the warmed OTC plots, divided by the pooled standard deviation. ERHedges’ SMD values were calculated for every dataset, which was a distinct ER measurement year within an experiment and within a larger site, resulting in 136 ER SMD values (Fig. 1). Using a meta-analysis approach assigning higher importance to datasets with higher precision (that is, lower variance), we evaluated the magnitude and variability in the ER response to warming across the tundra biome. The long duration of warming at the time of ER measurements in several experiments (Fig. 1b and Supplementary Table 1) and the availability of repeated measurements in many of the experiments (up to 13 datasets or repeated ER measurement years per experiment; Supplementary Table 1) enabled
Fig. 3 | Temporal patterns in ER responses with experimental warming duration. ER responses to warming faltered around the end of the first decade of warming but did not wane in the long term. a, Mean ER response to warming (ER Hedges’SMD) across the four experimental duration age classes, showing the kernel density estimation of the underlying distributions in violin plots as well as the single-factor metaregression model estimates and 95% CIs (in black). b, Relation between experimental warming duration and ER response to warming across the four age classes (Extended Data Table2) with 95% CI (light grey area). Hedges’ SMDs for individual datasets (grey bubbles) are shown in a and b, calculated as (mean of the warmed plots – mean of the control plots)/ pooled standard deviation. Bubble size denotes the weight of the observation used in the metaregression model, quantified as the inverse of the square root
of within-study variance, with greater bubbles indicating greater weights. Qm values, values and sample sizes ( ) are shown for the regression models, with representing the value of importance of duration age class across all data in and of experimental warming duration per age class in . Significant regression lines in are shown in blue. The black dashed horizontal line ( ) represents no change in ER with warming whereas the areas above and below represent increased (SMD > 0) versus decreased (SMD < 0) ER with warming. Dashed horizontal lines ( and ) reflect small, medium and large positive and negative Hedges’ SMD, that is, increasingly greater ER increases and decreases with warming. For detailed model output, see Extended Data Table2.
us to evaluate whether and how the ER response to warming varied over time (Extended Data Table 2). Furthermore, the high number and wide geographic, climatic and habitat range of the included tundra sites (Fig. 1c), allowed us to analyse the drivers of variability in the ER response using metaregression (Extended Data Tables 3 and 4). These drivers included (1) changes in abiotic and biotic conditions induced by the warming treatment (that is, climatic, soil, vegetation and microbial community properties) and (2) the abiotic and biotic environmental context (that is, climatic, soil and vegetation community properties; Supplementary Methods 1). These two types of drivers allowed us to assess how the variation in the ER response magnitude depended on, respectively, indirect effects of warming as well as on context-dependencies. The database does not include gross primary productivity (GPP) data, as its inclusion in ER datasets is challenging because of the light-dependency of photosynthesis and associated high spatiotemporal variability of GPP measurements (Methods). However, by focusing on ER and accounting for GPP indirectly through NPP and plant biomass, our analysis incorporates the response of plant growth to warming in the ecosystem carbon balance.

Experimental warming treatment

Warming with OTCs led to a mean (95% confidence interval (CI) increase in growing season air temperatures, a mean ing season soil temperature and a mean 1.6% [CI 0.8-2.4%] (P<0.001; ) decrease in growing season soil moisture compared to ambient conditions (based on meta-analysis models; Supplementary Table 3 and Supplementary Methods 1). In line with previous studies , experimental warming also increased soil organic matter (SOM) content of the mineral layer, aboveground biomass and mean height of the vegetation community, whereas it decreased the lichen cover (Supplementary Table 3).

Increased ecosystem respiration

As a result of the warming treatment, ecosystem respiration increased by a mean Hedges’ SMD of 0.57 [CI 0.44-0.70] ( ) ( ), reflecting that [CI 22-38] ( ) more was respired, on average, in the experimentally warmed plots than in the unmanipulated controls (Fig. 2 and Extended Data Table 1). This mean magnitude is nearly four times greater than the previous increase for the tundra, calculated in a meta-analysis based on 18 tundra sites . Further meta-analyses of all data on partitioned ER into plant-related (autotrophic) and heterotrophic respiration available in all experiments included in this study ( ) demonstrated that both autotrophic and heterotrophic respiration increased significantly with warming (mean Hedges’ SMD for autotrophic respiration [CI ], and for heterotrophic respiration [CI 0.36-1.48], ; Extended Data Table 1 and Supplementary Discussion 1). On the basis of these limited data, the warming-induced increase in ER probably resulted from a significant increase in both plant-related and heterotrophic respiration, each contributing to the overall effect of warming on ER. Although the ER response to warming was overall positive and strong, there was significant heterogeneity across the datasets ( value 731, ; Fig. 2 and Extended Data Table 1), implying that ER responses to warming vary across time and/or space. The mean ER response remained positive and did not differ significantly across the four age classes (Fig. 3a), hence the overall positive warming effect persisted for the 2.5 decades timescale of these experiments. Investigating the temporal patterns further showed indications for nonlinear, positive responses over time (Fig. 3a,b and Extended Data Table 2): a decrease in the magnitude of the (still) positive ER response during 5-9 years of warming (moderator importance value or ; Fig. 3b) was followed by an increasing magnitude during 10-14 years of warming ( ; Fig. 3b). Combined with the lack of change in the magnitude of the ER response over time during and more than 15 years of warming,
Fig. 4 | Indirect warming effects on the ER response to warming.
, Warming-induced changes in TN concentration (a) and soil pH of the mineral layer (b) affected the ER response to experimental warming. Warminginduced changes in TN and pH on the axis are quantified as Hedges’ SMDs of the soil conditions between the warmed and control plots, for example, (mean TN of the warmed plots – mean TN of the control plots)/pooled standard deviation. ER Hedges’ SMDs for individual datasets are shown on the axis with grey bubbles, calculated as (mean ER of the warmed plots – mean of the control plots)/pooled standard deviation. Bubble size denotes the weight of the observation used in the metaregression quantified as the inverse of the square root of within-study variance, with larger bubbles indicating greater weights. The significant regression lines with are shown with blue lines
and shaded areas, respectively. Bottom left in each panel shows the Qm (Qvalue of importance of the environmental drivers), value of the metaregression model and the sample size ( , number of datasets). The black dashed horizontal line represents no change in ER with warming whereas the areas above and below represent increased (SMD > 0) versus decreased (SMD < 0) ER with warming. Dashed horizontal lines ( and ) reflect small, medium and large positive and negative Hedges’ SMD, respectively , or increasingly greater ER increases and decreases with warming. The black dashed vertical line ( ) reflects no change in the soil condition with warming (with areas right and left of it representing increased versus decreased conditions with warming). For detailed model output, see Extended Data Table 3.
the overall slope across all years was non-significant, indicating that ER continued to be positive in locations with longer warming histories (Fig. 3a and Extended Data Table2). Although the ER response to experimental warming may thus falter around the end of the first decade of warming, our data do not provide evidence that ER responses to experimental warming wane in the longer term (that is, multidecadal duration).

Indirect warming effects

Variation in the magnitude of the ER response to warming in the tundra was driven by variation in how warming indirectly changed soil conditions of the mineral layer, that is, of total N (TN) concentration and pH (Fig. 4 and Extended Data Table 3). In contrast, the variation in the ER response was not driven by differences in how warming changed the microclimate or the vegetation community structure (for example, biomass) and composition (for example, lichen cover) (Extended Data Table 3), despite warming inducing changes in the latter (Supplementary Table 3). Specifically, ER increased more with warming in experiments in which warming promoted greater increases in mineral layer TN concentration ( ; Fig. 4a) or caused smaller reductions in mineral layer , ; Fig. 4b). Greater increases in TN concentration and smaller reductions in pH with warming suggest larger increases in N mineralization and N cycling with warming or stimulated microbial activity . Combined with our ER partitioning results showing increased heterotrophic as well as autotrophic respiration with warming ( ), stimulation of both microbial and plant activity might lead to the observed increase in ER with warming (Extended Data Table 1 and Supplementary Discussion 1). This result is based on 9 out of the 136 datasets and should be verified with future large-scale ER partitioning studies. These nine datasets represent all the partitioning data that are now available from the 56 experiments, highlighting the methodological challenges in measuring ER partitioning in a long-term warming experiment.

Context-dependent respiration responses

Surprisingly, variation in the ER response to warming was not related to any of the expected context-specific environmental drivers that reflect the tundra’s heterogeneous climatic conditions or vegetation community composition. None of the climatic (for example, ambient mean temperature and permafrost probability) or vegetation community drivers (for example, vegetation class and NPP) influenced the ER response across the large spatiotemporal environmental gradient covered by the 56 experiments (Fig. 1, Extended Data Fig. 2 and Extended Data Table 4). Yet, our analyses did corroborate some expected context-dependencies in the ER response related to the soil conditions (Fig. 5, Extended Data Table 4 and Supplementary Methods1).Nutrient-poorsites,that is,sites with lower TN concentration or with higher C:N ratios in the mineral layer, showed greater ER increases with warming than did nutrient-rich sites ( , , Fig. 5a; C:N ratio: , Fig. 5b). Greater ER increases with warming in nutrient-poor sites may be linked to changes in stimulated belowground C allocation by the plants and subsequent soil priming by root leachates . That is, warming has been shown to increase root production and thus labile C availability for rhizosphere organisms (that is, rhizosphere priming ). Especially in nutrient-poor conditions, this priming enhances decomposition, thereby increasing nutrient availability for plants (and potentially TN in the mineral layer) and ultimately stimulating autotrophic and heterotrophic respiration. This priming effect plays a larger role in these systems because of higher N -acquisition costs and thus greater ‘return on investment’ of priming, for plants in N -limited systems . Thus, our results indicate that rhizosphere priming and the associated ER responses that come with the accelerated decomposition through priming, might depend on the degree of N limitation in tundra sites. Even though we did not find vegetation or microbial community drivers to influence the magnitude of the ER response, the importance of these soil parameters indirectly suggest that both plant and microbial processes play a role in the sensitivity of the ER response to warming.
Fig. | Context-dependencies in the ER response to warming. a,b, TN
concentration (%) (a) and C:N ratio (b) of the mineral soil layer affected the ER response to experimental warming. The environmental drivers on the axis reflect mean values of measured soil conditions at the control plots of each experiment with available data. ER Hedges’ SMDs for individual datasets are shown on the axis with grey bubbles, calculated as (mean ER of the warmed plots – mean of the control plots)/pooled standard deviation. Bubble size denotes the weight of the observation used in the metaregression quantified as the inverse of the square root of within-study variance, with larger bubbles indicating greater weights. The significant regression lines with are

Global implications of plant-soil linkages

The rate of warming in the tundra biome might be as much as per decade (arctic tundra ), which greatly surpasses the global rate of per decade . The significant experimental warming of , that is, equivalent to two decades of regional warming across the tundra, increased growing season ER on average by but with substantial variation in the magnitude of this response. Environmental drivers of variation in the ER response to warming were related to the extent to which warming had affected N -related soil parameters and to context-specific soil biogeochemistry in the mineral layer. Importantly, variation in these environmental drivers influenced the magnitude but not the direction of the ER response to warming, as the overall response remained positive.
Our results demonstrate the importance of local soil conditions in mediating future warming impacts on respiration, specifically of the mineral soil layer deeper in the soil profile. Experimental warming can disproportionately stimulate both microbial and plant root activity, and thus ER, in deeper or mineral soil layers but only few studies have determined the depth at which most of the increase in ER originates because of methodological constraints. Our data show that the magnitude of the warming-induced ER increase in tundra sites is tightly linked to biogeochemical conditions, especially of the N cycle and changes therein, in the deeper mineral layer. This corroborates earlier findings that warming may have the strongest impact on biogeochemical conditions at depth , instead of at surface or subsurface organic soil layers. Particularly the relative availability of N in the mineral soil layer may determine warming-induced N turnover in tundra systems through plant-soil linkages involved in decomposition and rhizosphere priming processes . We postulate that N-limited tundra sites, characterized by higher N -acquisition costs, are more responsive in their ER response to warming through stronger impacts of warming on decomposition and rhizosphere priming in these sites . This is corroborated by the negative correlation between TN concentration in the mineral layer and the change in TN with warming (correlation coefficient = -0.43), indicating that N-limited sites also showed stronger stimulation of plant and microbial nutrient turnover under warmer conditions.

shown with blue lines and blue shaded areas, respectively. Bottom left in each panel shows the Qm (
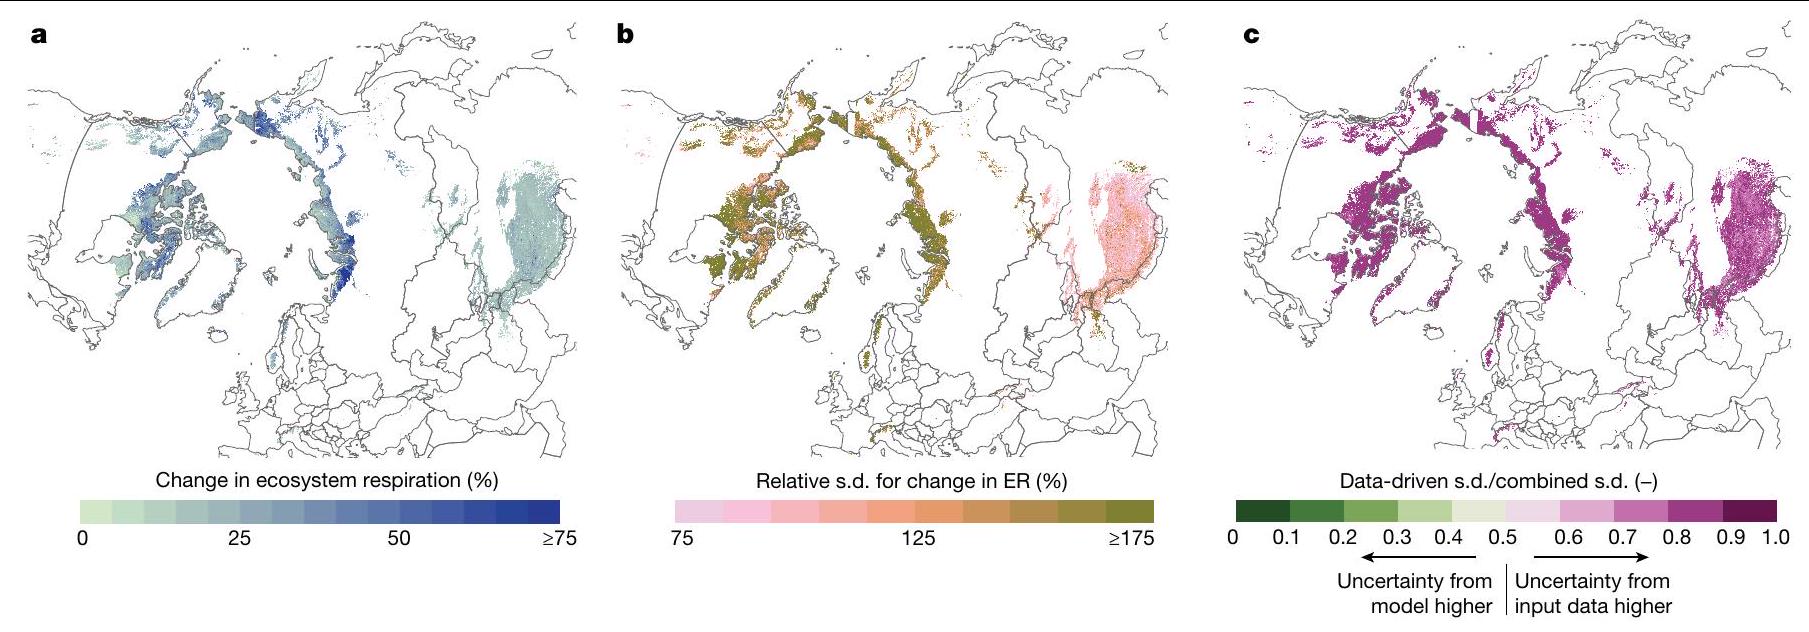
 value of importance of the environmental drivers), value of the metaregression model and the sample size ( , number of datasets). The black dashed horizontal line represents no change in ER with warming whereas the areas above and below represent increased (SMD > 0) versus decreased (SMD < 0) ER with warming. Dashed horizontal lines ( , and ) reflect small, medium and large positive and negative Hedges’ SMD, respectively , or increasingly greater ER increases and decreases with warming. For detailed model output, see Extended Data Table 4.

Spatial patterns

By upscaling our metaregression results, which predict the ER response to warming on the basis of the significant context-dependent drivers (total N and in the mineral layer, ratio of means (ROM) = (Fig. 5), we visualize spatial differences in the sensitivity of the ER response to warming across the arctic and circumarctic alpine region. Particularly sensitive areas to warming are the western and eastern parts of Siberia and parts of the Canadian arctic archipelago (Fig. 6). High uncertainty on these estimates (Fig. 6b), however, highlights an urgent need to address spatial sampling gaps in follow-up studies . We also show that most of the uncertainty originates from the input data to the upscaling (Fig. 6c), that is, from the global gridded soil data (Methods), accounting for about of total uncertainty. Considering these uncertainties, we can still use our model to provide an approximation of how much more C would be respired by warming compared to present temperatures, across the tundra region (Fig. 6 and Supplementary Fig. 7). For the arctic tundra region alone, our upscaling exercise suggests that a temperature rise of would enhance ER from 1.2 to (increase of with s.d. of ), which corresponds to an increase of (s.d. ). Across the arctic and alpine tundra regions combined, ER would increase from 3.4 to (increase of with s.d. of ) corresponding to an increase of (s.d. ).
Global and regional climate models which predict future C emissions require robust understanding of the mechanisms behind spatial differences in the ER response to warming. The mechanistic understanding provided by this study and based on field experimental data in real-world settings (for example, the relationship between soil nitrogen and pH and the ER response to warming), should therefore facilitate model development and improve predictions of changes in carbon cycling with future warming . By estimating spatial differences in sensitivity of the ER response to warming, our results can be used to benchmark key components of the C cycle for tundra systems in these climate models. Our study focuses on growing season patterns but investigating how ER changes with warming across the whole year will also be important to improve climate models . Because expansion
Fig. 6 | Spatial patterns and uncertainty in the sensitivity of ER to warming across the tundra. Maps showing spatial extrapolation of metaregression results for warming effects on ecosystem respiration (ER) and associated uncertainties across the arctic and circumarctic alpine tundra. a, Spatial distribution of predicted relative changes in ER resulting from air warming. Values were obtained by combining the significant metaregression multifactor model with global gridded soil data for TN concentration and C:N ratio of the mineral layer (Methods). Plotted values are predicted mean values expressed as percentage change from present ER levels. For the whole region, ER increased from 3.4 to (increase of with s.d. of ) or by (s.d. ). b, Uncertainty of estimated ER changes expressed as coefficients of variation (standard deviations of model predictions divided by mean predicted values). These standard deviations are computed with Monte Carlo error propagation incorporating uncertainty associated with
(1) metaregression model parameters and (2) soil database input values (Methods).c, Relative contribution of model parameter uncertainty versus input soil data uncertainty to Monte Carlo estimates of standard deviation. Error propagation was conducted twice, first combining both uncertainty sources as in b and subsequently by fixing metaregression parameters to their mean estimates and only allowing soil input data to vary. The plotted values show the ratio of the resulting standard deviations, that is, soil input uncertainty only/combined uncertainty. Colours closer to green indicate grid cells for which uncertainty in ER responses to warming are primarily driven by error in model metaregression model parameter estimates; colours closer to purple indicate grid cells for which ER prediction uncertainty is driven more by imprecision in soil database data. The maps were generated using Natural Earth (https://www.naturalearthdata.com/).
of the database across time and space will only further strengthen our understanding , we welcome contributions of ER measurements taken in new warming experiments across the tundra, or in new years for included experiments: http://www.tundrafluxdatabase.com/.
The magnitude of the long-term land carbon-climate feedback critically depends on the balance between C uptake through changes in photosynthesis activity and C release through changes in . We focused on ER as a critical component in this balance and evaluated how ER might change with future warming. We found sustained ER increases across 25 years of experimental warming. Short-lived respiration increases to years of experimental warming have been observed in several but not all single-site studies as well as global or high-latitude meta-analyses and have in some longer term studies been followed by renewed respiration increases as the duration of warming continued . We found a decreasing and increasing temporal pattern in the magnitude of the positive ER response to warming between 5-10 years and 10-15 years of warming, respectively, and no significant overall slope when evaluating across 25 years of warming (Fig. 3). These results highlight two key findings. First, in tundra ecosystems, ER remains enhanced with continued warming, at least up to 2.5 decades. Second, the ER response to warming shows a nonlinear trend over time between 5 and 15 years of warming, during which the positive respiration response drops in magnitude, after which it rises again. This nonlinear pattern of ER increase over time may be due to the underlying microbial and plant processes responding to warming at different rates, for example, ranging from more immediate effects of warming on microbial and plant respiration through accelerated decomposition versus slower effects through changes in biogeochemical and hydrological soil conditions as well as in microbial or vegetation community composition . The latter is corroborated by the clear importance of changes in soil biogeochemical conditions as drivers of variation in the ER increase. Our results indicate that several of these slower, indirect mechanisms of warming impacts on ER, that is, indirect
effects of warming on ER through changes in soil nutrient availability, are already apparent during the time-span of up to 25 years of experimental warming studies in the tundra.
Finally, our ER partitioning analyses demonstrated that the ER increases with warming were probably driven by both increased plant-related and heterotrophic respiration . Taken together, these findings imply that the large soil C stocks in tundra systems have the potential to transform from acting as a global C sink to a source if warming were to increase ER to such an extent that the extra C respiration cannot be compensated by equally strong increases in plant uptake .

Online content

Any methods, additional references, Nature Portfolio reporting summaries, source data, extended data, supplementary information, acknowledgements, peer review information; details of author contributions and competing interests; and statements of data and code availability are available at https://doi.org/10.1038/s41586-024-07274-7.
  1. Schuur, E. A. G. et al. Permafrost and climate change: carbon cycle feedbacks from the warming arctic. Annu. Rev. Environ. Resour. 47, 343-371 (2022).
  2. Tarnocai, C. et al. Soil organic carbon pools in the northern circumpolar permafrost region. Glob. Biogeochem. Cycles https://doi.org/10.1029/2008GBO03327 (2009).
  3. Virkkala, A.-M. et al. Statistical upscaling of ecosystem fluxes across the terrestrial tundra and boreal domain: regional patterns and uncertainties. Glob. Change Biol. 27, 4040-4059 (2021).
  4. Karhu, K. Temperature sensitivity of soil respiration rates enhanced by microbial community response. Nature 513, 81-83 (2014).
  5. Rustad, L. E. et al. A meta-analysis of the response of soil respiration, net nitrogen mineralization and aboveground plant growth to experimental ecosystem warming. Oecologia 126, 543-562 (2001).
  6. Carey, J. C. et al. Temperature response of soil respiration largely unaltered with experimental warming. Proc. Natl Acad. Sci. USA 113, 13797-13802 (2016).
  7. Bouskill, N. J., Riley, W. J. & Grant, R. F. Alaskan carbon-climate feedbacks will be weaker than inferred from short-term experiments. Nat. Commun. 11, 5798 (2020).
  8. Schadel, C. et al. Divergent patterns of experimental and model-derived permafrost ecosystem carbon dynamics in response to Arctic warming. Environ. Res. Lett. 13, 105002 (2018).
  9. Lu, M. et al. Responses of ecosystem carbon cycle to experimental warming: a metaanalysis. Ecology 94, 726-738 (2013).
  10. Natali, S. M. et al. Large loss of in winter observed across the northern permafrost region. Nat. Clim. Change 9, 852-857 (2019).
  11. Oberbauer, S. F. et al. Tundra fluxes in response to experimental warming across latitudinal and moisture gradients. Ecol. Monogr. 77, 221-238 (2007).
  12. Schuur, E. A. G. et al. Vulnerability of permafrost carbon to climate change: Implications for the global carbon cycle. Bioscience 58, 701-714 (2008).
  13. Bond-Lamberty, B., Wang, C. & Gower, S. T. A global relationship between the heterotrophic and autotrophic components of soil respiration? Glob. Change Biol. 10, 1756-1766 (2004).
  14. Arctic Climate Change Update 2021: Key Trends and Impacts. Summary for Policy-makers (AMAP, 2021).
  15. Rantanen, M. et al. The Arctic has warmed nearly four times faster than the globe since 1979. Commun. Earth Environ. 3, 168 (2022).
  16. Bouskill, N. J., Riley, W. J. & Tang, J. Y. Meta-analysis of high-latitude nitrogen-addition and warming studies implies ecological mechanisms overlooked by land models. Biogeosciences 11, 6969-6983 (2014).
  17. van Gestel, N. et al. Predicting soil carbon loss with warming. Nature 554, E4-E5 (2018).
  18. Hicks Pries, C. E. et al. Decadal warming causes a consistent and persistent shift from heterotrophic to autotrophic respiration in contrasting permafrost ecosystems. Glob. Change Biol. 21, 4508-4519 (2015).
  19. Dorrepaal, E. et al. Carbon respiration from subsurface peat accelerated by climate warming in the subarctic. Nature 460, 616-619 (2009).
  20. Natali, S. M. et al. Effects of experimental warming of air, soil and permafrost on carbon balance in Alaskan tundra. Glob. Change Biol. 17, 1394-1407 (2011).
  21. Romero-Olivares, A. L., Allison, S. D. & Treseder, K. K. Soil microbes and their response to experimental warming over time: a meta-analysis of field studies. Soil Biol. Biochem. 107, 32-40 (2017).
  22. Wang, X. et al. Soil respiration under climate warming: differential response of heterotrophic and autotrophic respiration. Glob. Change Biol. 20, 3229-3237 (2014).
  23. Shaver, G. R. et al. Global warming and terrestrial ecosystems: a conceptual framework for analysis: ecosystem responses to global warming will be complex and varied. Bioscience 50, 871-882 (2000).
  24. Christiansen, C. T. et al. Enhanced summer warming reduces fungal decomposer diversity and litter mass loss more strongly in dry than in wet tundra. Glob. Change Biol. 23, 406-420 (2017).
  25. Scharn, R., Little, C. J., Bacon, C. D., Alatalo, J. M. & Antonelli, A. Decreased soil moisture due to warming drives phylogenetic diversity and community transitions in the tundra. Environ. Res. Lett. 16, 064031 (2021).
  26. Schuur, E. A. G. et al. Climate change and the permafrost carbon feedback. Nature 520, 171-179 (2015).
  27. Pold, G., Baillargeon, N., Lepe, A., Rastetter, E. B. & Sistla, S. A. Warming effects on arctic tundra biogeochemistry are limited but habitat-dependent: a meta-analysis. Ecosphere 12, e03777 (2021).
  28. Elmendorf, S. C. et al. Plot-scale evidence of tundra vegetation change and links to recent summer warming. Nat. Clim. Change 2, 453-457 (2012).
  29. Jeanbille, M. et al. Site-specific responses of fungal and bacterial abundances to experimental warming in litter and soil across Arctic and alpine tundra. Arct. Sci. https:// doi.org/10.1139/as-2020-0053 (2021).
  30. Bjorkman, A. D. et al. Plant functional trait change across a warming tundra biome. Nature 562, 57-62 (2018).
  31. Nyberg, M. & Hovenden, M. J. Warming increases soil respiration in a carbon-rich soil without changing microbial respiratory potential. Biogeosciences 17, 4405-4420 (2020).
  32. Keuper, F. et al. Carbon loss from northern circumpolar permafrost soils amplified by rhizosphere priming. Nat. Geosci. 13, 560-565 (2020).
  33. Shaver, A. G. R., Street, L. E., Rastetter, E. B., Van Wijk, M. T. & Williams, M. Functional convergence in regulation of net flux in heterogeneous tundra landscapes in Alaska and Sweden. J. Ecol. 95, 802-817 (2007).
  34. Conant, R. T. et al. Sensitivity of organic matter decomposition to warming varies with its quality. Glob. Change Biol. 14, 868-877 (2008).
  35. Bao, T., Zhu, R., Li, X., Ye, W. & Cheng, X. Effects of multiple environmental variables on tundra ecosystem respiration in maritime Antarctica. Sci Rep. 8, 12336 (2018).
  36. Stuart Chapin, F. III et al. The changing global carbon cycle: linking plant-soil carbon dynamics to global consequences. J. Ecol. 97, 840-850 (2009).
  37. Allison, S. D., Romero-Olivares, A. L., Lu, Y., Taylor, J. W. & Treseder, K. K. Temperature sensitivities of extracellular enzyme and across thermal environments. Glob. Change Biol. 24, 2884-2897 (2018).
  38. Davidson, E. A. & Janssens, I. A. Temperature sensitivity of soil carbon decomposition and feedbacks to climate change. Nature 440, 165-173 (2006).
  39. Bao, T., Jia, G. & Xu, X. Weakening greenhouse gas sink of pristine wetlands under warming. Nat. Clim. Change https://doi.org/10.1038/s41558-023-01637-0 (2023).
  40. Giesler, R., Esberg, C., Lagerström, A. & Graae, B. J. Phosphorus availability and microbial respiration across different tundra vegetation types. Biogeochemistry 108, 429-445 (2012).
  41. Mekonnen, Z. A., Riley, W. J. & Grant, R. F. 21st century tundra shrubification could enhance net carbon uptake of North America Arctic tundra under an RCP8.5 climate trajectory. Environ. Res. Lett. 13, 054029 (2018).
  42. Parker, T. C. et al. Rhizosphere allocation by canopy-forming species dominates soil efflux in a subarctic landscape. New Phytol. 227, 1818-1830 (2020).
  43. Sistla, S. A. et al. Long-term warming restructures Arctic tundra without changing net soil carbon storage. Nature 497, 615-617 (2013).
  44. Marion, G. M. et al. Open-top designs for manipulating field temperature in high-latitude ecosystems. Glob. Change Biol. 3, 20-32 (1997).
  45. Wu, Z., Dijkstra, P., Koch, G. W., Peñuelas, J. & Hungate, B. A. Responses of terrestrial ecosystems to temperature and precipitation change: a meta-analysis of experimental manipulation. Glob. Change Biol. 17, 927-942 (2011).
  46. Hedges, L. V. Distribution theory for Glass’s estimator of effect size and related estimators. J. Educ. Stat. 6, 107-128 (1981).
  47. Dijkstra, F. A., Carrillo, Y., Pendall, E. & Morgan, J. A. Rhizosphere priming: a nutrient perspective. Front. Microbiol. 4, 216 (2013).
  48. Feng, J. & Zhu, B. Global patterns and associated drivers of priming effect in response to nutrient addition. Soil Biol. Biochem. 153, 108118 (2021).
  49. Yin, H. et al. Enhanced root exudation stimulates soil nitrogen transformations in a subalpine coniferous forest under experimental warming. Glob. Change Biol. 19, 2158-2167 (2013).
  50. Jiang, Z., Liu, Y., Yang, J., Zhou, Z. & Gunina, A. Effects of nitrogen fertilization on the rhizosphere priming. Plant Soil 462, 489-503 (2021).
  51. Terrer, C. et al. Ecosystem responses to elevated governed by plant-soil interactions and the cost of nitrogen acquisition. New Phytol. 217, 507-522 (2018).
  52. IPCC: Summary for Policymakers. In Climate Change 2022: Impacts, Adaptation and Vulnerability (eds Pörtner, H.-O. et al.) (Cambridge Univ. Press, 2022).
  53. Blume-Werry, G., Milbau, A., Teuber, L. M., Johansson, M. & Dorrepaal, E. Dwelling in the deep-strongly increased root growth and rooting depth enhance plant interactions with thawing permafrost soil. New Phytol. 223, 1328-1339 (2019).
  54. Voigt, C. et al. Warming of subarctic tundra increases emissions of all three important greenhouse gases-carbon dioxide, methane and nitrous oxide. Glob. Change Biol. 23, 3121-3138 (2017).
  55. Li, F. et al. Warming effects on methane fluxes differ between two alpine grasslands with contrasting soil water status. Agric. For. Meteorol. 290, 107988 (2020).
  56. Björk, R. G. et al. Linkages between N turnover and plant community structure in a tundra landscape. Plant Soil 294, 247-261 (2007).
  57. Sullivan, B. W. & Hart, S. C. Evaluation of mechanisms controlling the priming of soil carbon along a substrate age gradient. Soil Biol. Biochem. 58, 293-301 (2013).
  58. Milcu, A., Heim, A., Ellis, R. J., Scheu, S. & Manning, P. Identification of general patterns of nutrient and labile carbon control on soil carbon dynamics across a successional gradient. Ecosystems 14, 710-719 (2011).
  59. Metcalfe, D. B. et al. Patchy field sampling biases understanding of climate change impacts across the Arctic. Nat. Ecol. Evol. 2, 1443-1448 (2018).
  60. Björkman, M. P. et al. Winter carbon dioxide effluxes from arctic ecosystems: an overview and comparison of methodologies. Global Biogeochem. Cycles https://doi.org/10.1029/ 2009 GB003667 (2010).
  61. Blok, D., Elberling, B. & Michelsen, A. Initial stages of tundra shrub litter decomposition maybe accelerated by deeper winter snow but slowed down by spring warming. Ecosystems 19, 155-169 (2016).
  62. Morgner, E., Elberling, B., Strebel, D. & Cooper, E. J. The importance of winter in annual ecosystem respiration in the High Arctic: effects of snow depth in two vegetation types. Polar Res. 29, 58-74 (2010).
  63. Qian, H., Joseph, R. & Zeng, N. Enhanced terrestrial carbon uptake in the northern high latitudes in the 21st century from the Coupled Carbon Cycle Climate Model Intercomparison Project model projections. Glob. Change Biol. 16, 641-656 (2010).
  64. Melillo, J. M. et al. Long-term pattern and magnitude of soil carbon feedback to the climate system in a warming world. Science 358, 101-105 (2017).
  65. Hicks Pries, C. E., Schuur, E. A. G., Natali, S. M. & Crummer, K. G. Old soil carbon losses increase with ecosystem respiration in experimentally thawed tundra. Nat. Clim. Change 6, 214-218 (2016).
  66. Hicks Pries, C. E., Schuur, E. A. G. & Crummer, K. G. Thawing permafrost increases old soil and autotrophic respiration in tundra: partitioning ecosystem respiration using and {increment} C. Glob. Change Biol. 19, 649-661 (2013).
  67. Wei, D. et al. Plant uptake of outpaces losses from permafrost and plant respiration on the Tibetan Plateau. Proc. Natl Acad. Sci. USA 118, e2015283118 (2021).
Publisher’s note Springer Nature remains neutral with regard to jurisdictional claims in published maps and institutional affiliations.
Open Access This article is licensed under a Creative Commons Attribution 4.0 International License, which permits use, sharing, adaptation, distribution and reproduction in any medium or format, as long as you give appropriate credit to the original author(s) and the source, provide a link to the Creative Commons licence, and indicate if changes were made. The images or other third party material in this article are included in the article’s Creative Commons licence, unless indicated otherwise in a credit line to the material. If material is not included in the article’s Creative Commons licence and your intended use is not permitted by statutory regulation or exceeds the permitted use, you will need to obtain permission directly from the copyright holder. To view a copy of this licence, visit http://creativecommons.org/licenses/by/4.0/.
© The Author(s) 2024
Climate Impacts Research Centre, Department of Ecology and Environmental Science, Umeå University, Abisko, Sweden. Forest Ecology and Management Group (FORECOMAN), Department of Earth and Environmental Sciences, KU Leuven, Leuven, Belgium. Department of Spatial Sciences, Faculty of Environmental Sciences, Czech University of Life Sciences Prague, Praha-Suchdol, Czech Republic. Department of Ecology and Environmental Science, Umeå University, Umeå, Sweden. Water and development research group, Aalto University, Espoo, Finland. Department of Biological Sciences, University of Bergen, Bergen, Norway. Bjerknes Centre for Climate Research, University of Bergen, Bergen, Norway. Amsterdam Institute for Life and Environment (A-LIFE), Vrije Universiteit, Amsterdam, The Netherlands. NORCE Climate and Environment, Norwegian Research Centre AS, Bergen, Norway. Department of Environmental and Biological Sciences, University of Eastern Finland, Kuopio, Finland. Department of Ecology, University of Innsbruck, Innsbruck, Austria.
Department of Earth Sciences, University of Gothenburg, Gothenburg, Sweden.
Gothenburg Global Biodiversity Centre, Gothenburg, Sweden. Department of Arctic and Marine Biology, Faculty of Biosciences, Fisheries and Economics, The Arctic University of Norway, Tromsø, Norway. Department of Chemistry, Life Sciences and Environmental Sustainability, University of Parma, Parma, Italy. Terrestrial Ecology Section, Department of Biology, University of Copenhagen, Copenhagen, Denmark. Center for Permafrost, Department of Geosciences and Natural Resource Management, University of Copenhagen, Copenhagen, Denmark. Department of Forest Mycology and Plant Pathology, Swedish University of Agricultural Sciences, Uppsala, Sweden. Department of Arctic and Marine Biology, UiT-the Arctic University of Norway, Tromsø, Norway. Carbone Boréal, Département des Sciences Fondamentales, Université du Québec à Chicoutimi, Chicoutimi, Quebec, Canada. Institute for Environmental Science and Sustainability, Wilkes University, Wilkes-Barre, PA, USA. Swiss Federal Institute for Forest, Snow and Landscape Research WSL, Lausanne, Switzerland. State Key Laboratory of Herbage Improvement and Grassland Agro-Ecosystems and College of Pastoral Agriculture Science and Technology, Lanzhou University, Lanzhou, China. Agricultural University of Iceland, Reykjavik, Iceland.
Department of Terrestrial Ecology, Norwegian Institute for Nature Research, Trondheim, Norway. Gjærevoll Centre for Biodiversity Foresight Analyses & Department of Biology, Norwegian University of Science and Technology, Trondheim, Norway. The Heathland Centre, Alver, Norway. Institute of Ecology, College of Urban and Environmental Sciences, Key Laboratory for Earth Surface Processes of the Ministry of Education, Peking University, Beijing, China. Department of Biological Sciences, Dartmouth College, Hanover, NH, USA. Biological Sciences, School of Natural Sciences, University of Tasmania, Hobart, Tasmania, Australia. Australian Mountain Research Facility, Canberra, Australian Capital Territory,
Australia. Life and Environmental Sciences, University of Iceland, Reykjavík, Iceland.
Division of Life Sciences, Korea Polar Research Institute, Incheon, South Korea. Research
Centre for Ecological Change, Organismal and Evolutionary Biology Research Programme, Faculty of Biological and Environmental Sciences, University of Helsinki, Helsinki, Finland. Korea Polar Research Institute, Incheon, Korea. Institute of Soil Science, Universität Hamburg, Hamburg, Germany. University of Eastern Finland, Department of Environmental and Biological Sciences, Kuopio, Finland. Greenland Institute of Natural Resources, Nuuk, Greenland. NORCE, Norwegian Research Centre AS, Bjerknes Centre for Climate Research, Bergen, Norway. Department of Biology, Norwegian University of Science and Technology, Trondheim, Norway. Department of Geography, University of Calgary, Calgary, Alberta, Canada. Arctic Centre, University of Lapland, Rovaniemi, Finland. Faculty of Biological and Environmental Sciences, University of Helsinki, Helsinki, Finland. SEGES Innovation P/S, Aarhus, Denmark. Ecological Sciences, The James Hutton Institute, Aberdeen, UK. Department of Wildland Resources, Quinney College of Natural Resources and Ecology Center, Utah State University, Logan, UT, USA. Department of Arctic Biology, University Centre in Svalbard, Longyearbyen, Norway. Center for Volatile Interactions, Department of Biology, University of Copenhagen, Copenhagen, Denmark. Center for Ecosystem Science and Society, Northern Arizona University, Flagstaff, AZ, USA. Department of Ecoscience, Aarhus University, Roskilde, Denmark. Arctic Research Centre, Aarhus University, Aarhus, Denmark. Department of Biological Sciences, Northern Arizona University, Flagstaff, AZ, USA. School of Biosciences, University of Nottingham, Sutton Bonington Campus, Loughborough, UK. Department of Geography and Environmental Management, University of Waterloo, Waterloo, Ontario, Canada. The Ecosystems Center, Marine Biological Laboratory, Woods Hole, MA, USA. Natural Resources Institute Finland, Helsinki, Finland. Norwegian Institute for Nature Research, Bergen, Norway. Ecology and Genetics Research Unit, University of Oulu, Oulu, Finland. State Key Laboratory of Vegetation and Environmental Change, Institute of Botany, Chinese Academy of Sciences, Beijing, China. School of Forest Sciences, University of Eastern Finland, Joensuu, Finland. e-mail: sybryn.maes@gmail.com

Data collection

Study design. We quantified and analysed the effect of warming on ecosystem respiration (ER) across tundra ecosystems by collecting original, previously published and unpublished, data from OTC warming experiments in the tundra biome. OTCs are small greenhouses which passively increase air temperatures during the snow-free season while allowing free entry of precipitation . They are commonly used to simulate climate warming at a plot-scale in low-stature alpine and arctic tundra systems (International Tundra Experiment network, ITEX ). We contacted potential data contributors (1) through email using the networks ITEX, WARM, InterAct and Permafrost Carbon, (2) at the 20th ITEX Meeting 9-13 September 2019 in Parma, Italy, and (3) by retrieving contact details of authors of earlier published meta-analyses of ER measured in warming experiments. ER datasets were only included if (1) experiments were located in alpine or arctic tundra, (2) original ER measurements were available from both OTC and unmanipulated control (ambient temperature) plots and (3) ER was measured during the plant growing season (that is, June through August for all sites, except for the Australian site AUS_1: October through February; Supplementary Fig. 2). This resulted in 24,035 data points from 136 ER datasets (that is, a unique site experiment ER measurement year; Supplementary Tables 1and 2) from 56 unique OTC experiments across 28 tundra sites.
One site could consist of one or several warming experiments (for example, covering local differences in vegetation communities or soil conditions) and contribute ER measurements from one or several occasions during one or several years (Supplementary Table 1 and Supplementary Figs. 1 and 2). Experiments differed in abiotic (for example, permafrost presence, ambient climate and soil type) and/ or biotic (for example, vegetation and size of microbial communities) conditions, as well as in warming treatment specifications. First, at the time of ER measurements, experiments differed in duration of their warming treatment ( years, mean 7). Second, despite the common experimental warming setup, experiments differed in OTC size ( height), duration of OTC deployment (for example, year-round placement or winter removal of OTCs) and methodology of flux measurements. We therefore collected methodological data on (1) OTC height, (2) whether or not OTCs were removed during winter, (3) analyser producer (Los Gatos Research, LICOR, PP-system or Vaisala), (4) analyser type (infrared or laser), (5) measurement system (automated or manual and closed or open), (6) the timing of ER measurements (daytime or night time) and (7) ER measurement plot size. Details on the procedure used to check for methodological biases introduced by the factors described above are presented in the Supplementary Discussion 2. Because we observed no significant effects of these methodological factors on the ER response, we assume there is no methodological bias in our results.
Ecosystem respiration. For each dataset, we requested plot-specific daily average ER data and standardized all individual data points to the same unit, that is, . We removed 339 outliers ( of the data) to account for measurement errors (data points outside the range of mean ER s.d. in a dataset following ref. 69). Subsequently, we calculated growing season average ER per experimental treatment (control versus warmed) per dataset as grams of carbon in . For details on the sampling frequency, see Supplementary Fig. 2 and Supplementary Table 2. All experiments measured daytime ER using dark or opaque chambers, except for ALA_1, which used automated clear chambers. For this experiment, we extracted night-time measurements based on the photosynthetically active radiation values (PAR ) and included these as ER measurements.

Effect size calculation

We calculated effect sizes of the mean growing season ER response to warming, separately for each dataset. We used Hedges’ SMD as primary effect size across all models and the log-transformed ROM as additional effect size to quantify percentage change in ER with warming. Hedges SMD for each dataset was calculated as the (mean growing season average ER in warmed plots – mean growing season average ER in control plots)/pooled standard deviation. This is deemed an appropriate effect size to use here because it overcomes data measured on different scales through standardization, as well as corrects for variance heterogeneity that may be introduced with small sample sizes ( ) by including the pooled standard deviation . Mean Hedges’ SMD values for each dataset were accompanied by 95% CIs of the standard errors, which reflect the precision of the effect size for each dataset . The ROM was calculated as the log-transformed mean growing season average ER in warmed plots/mean growing season average ER in control plots, which we transformed to a mean percentage increase as , that is, a more intuitive measure of changes in ER. See Supplementary Table 2 for the number of day-average ER measurements and number of plots used for each of the 136 datasets and see Fig. 2 and Supplementary Table 4 for an overview of mean Hedges’ SMD and 95% CIs per dataset.

Temporal patterns

To assess the ER response to warming over time, we quantified the duration of experimental warming for each dataset as the difference between the year of ER measurement and the year in which the warming treatment started (Supplementary Fig. 1 and Supplementary Table 1). We further categorized the datasets into four ‘age classes’ on the basis of warming duration, with class 1 including datasets in which years of warming had been ongoing at the time of ER measurements and classes 2,3 and 4 in which 5-10, 10-15 and more than or equal to 15 years of warming had been ongoing, respectively (Fig.1). Note that duration refers to when less than 1 year of warming took place, that is, one single summer of warming.

Environmental drivers ER

To quantify environmental drivers that might explain the variation in the growing season ER response to warming, we obtained several types of environmental data on a site-, experiment- or ER-measurement level and used these to analyse indirect warming effects and contextdependencies as drivers of variability in ER response to warming. See Supplementary Table 5 for sample sizes of all environmental drivers used to assess indirect warming effects and context-dependencies and Supplementary Methods 1 for a detailed explanation on how the different drivers were obtained and calculated.
Indirect warming effects. To investigate whether and how changes in environmental conditions induced by the warming treatment influenced the ER response to warming, we quantified changes in the below-mentioned climatic and soil conditions as well as in vegetation and microbial communities for each dataset, by calculating effect sizes for these drivers: effect size calculation of ER data (above), for example, (mean air temperature warmed plots – mean air temperature in control plots)/pooled standard deviation. In doing so, we then tested whether changes in the environmental drivers due to warming influenced the changes in ER due to warming (see later section on ‘Metaregression’). The included environmental drivers for this part of our analyses are related to (1) climatic conditions at ER measurement time, that is, air temperature ( ), soil temperature ( ) and soil moisture (%); (2) soil conditions at plot level, that is, SOM (%), total C concentration (TC) (%), total N concentration (TN) (%), C:N ratio, bulk density (BD) ( ) and pH from the mineral, and/or organic, layer; as well as organic layer depth (OLdepth) (cm); (3) the vegetation community
at plot level, that is, percentage cover per functional group (graminoids, forbs, deciduous shrubs, evergreen shrubs, mosses and lichens), aboveground biomass and mean community height, at plot level; and (4) the microbial community at plot level, that is, proxies for bacterial and fungal biomass and derived fungal:bacterial (FB) ratios (Extended Data Table 3). Although ER can be strongly correlated to GPP of the vegetation, our database does not include GPP data, as its inclusion and comparison across time and across several experiments is challenging because of the light-dependency of photosynthesis and associated high spatiotemporal variability of GPP measurements. However, both processes are (partly) driven by the activity of the vegetation, which in turn is driven by direct responses to their environment (for example, microclimate) as well as by, for example, its biomass and community composition. We therefore argue that to increase our mechanistic understanding of the underlying ecological drivers of ER response to warming, it is more meaningful to incorporate the role of the response of plant growth to warming for ecosystem respiration by including (changes in) plant biomass and community composition, as well as NPP (see section ‘Context-dependencies’) as potential drivers of ER, as we do here. Note that we refer to the soil total C and N concentration throughout the manuscript, because these drivers were measured on solid (dried) soil with CNS element analysers. Therefore, they refer to the sum of concentrations of both inorganic and organic compounds of C and N , even though TC most likely reflects primarily the SOC concentration because tundra soils contain limited-to-no inorganic C .
Context-dependencies. To evaluate whether and how the environmental context influenced the ER response to warming, we included drivers quantifying the climate, soil conditions and vegetation community (Extended Data Table 4 and Supplementary Methods 1). For each dataset, (1) climate drivers included zone (low arctic, high arctic and alpine) and permafrost probability (values between 0 and 1 ) at site level and mean air temperature, soil temperature and soil moisture in the control plots at ER measurement time. Further, (2) soil conditions drivers comprised mean values of the SOM, TC, TN, CN, BD, pH and OLdepth data from the control plots per dataset (see above). In addition, we included soil pH class (pH low less than 5, medium 5-7, high more than 7), soil moisture class (dry, mesic and wet) and soil carbon stock ( ) here at the experiment level. Finally, (3) vegetation community drivers included a vegetation class (five categories: barrens (B), graminoid tundra (G, grasses and sedges), prostrate shrub tundra (P), erect shrub tundra (S) and wetlands (W), that is, based on the circumpolar arctic vegetation map (CAVM) ) and NPP ( ) at the experiment level.

Statistical analyses

All analyses were performed using R v.4.0.3 unless specified otherwise .
Modelling approach. Meta-analysis. To evaluate the effects of experimental warming on ER, we performed multivariate meta-analysis with the rma.mv function from the metafor R package , using the Hedges’ SMD of the growing season average ER data as primary effect size (Fig. 2 and Extended Data Table 1). In doing so, we obtained a mean pooled effect size of warming, taking into account the nestedness and repeated measurements in our 136 datasets. Each dataset was weighted by the inverse of its estimated sampling variance to increase both the precision of the estimated effect sizes and the statistical power in the meta-analyses . We also performed a meta-analysis on the ROM as secondary effect size (see previous section on ‘Effect size calculation’), which provided a mean pooled ROM of warming (Extended Data Table1). Further, to test whether environmental conditions (climate, soil, vegetation and microbial: see previous section on ‘Environmental drivers’) significantly changed themselves because of the warming treatment, we performed separate meta-analyses testing the effect of warming on each of these drivers, using Hedges’ SMD as primary effect
size and raw mean differences (that is, the difference in absolute values of the driver between treatment and control means) as secondary effect size because the latter provides estimates of absolute changes in the drivers (Supplementary Table 3).
Metaregression. Temporal patterns. To evaluate whether and how the ER response varied with duration of experimental warming, we performed two types of single-factor metaregression models. First, we tested whether duration (number of years of warming at time of ER measurements) influenced the magnitude of the ER response (ER Hedges’ SMD). These models were performed across experiments and both (1) across the four age classes of duration, to analyse overall long-term patterns of warming effects and (2) in each age class ( , and more than 15 years). This enabled to explore potential nonlinearity of patterns in ER response rates with warming over time (Fig. 3b and Extended Data Table 2a). Second, we tested (1) whether the age class influenced the ER response, that is, whether the mean ER response differed among the four age classes in sign or direction, as well as (2) whether the mean ER response per age class was significantly different from zero (Fig. 3a and Extended Data Table 2b). This enabled to evaluate the persistency (continued existence) of the ER response over time.
Indirect warming effects. To assess whether the variation in the ER response to warming was driven by indirect effects of warming on environmental conditions, we ran single-factor metaregression models using the Hedges’ SMD of the different environmental drivers (reflecting warming-induced changes in climate, soil, vegetation and microbial community conditions) as individual predictors and ER Hedges’ SMD as response (see previous section on ‘Indirect warming effects’; Fig. 4 and Extended Data Table 3).
Context-dependencies. To assess whether variation in the ER response to warming could be explained by context-specific environmental drivers related to climate, soil or vegetation, we performed single-factor metaregression models testing the influence of each of these drivers on ER Hedges’ SMD (see previous section on ‘Context-dependencies’; Fig. 5 and Extended Data Table 4).
We chose single-factor models to analyse the indirect warming effects and context-dependencies because the environmental driver data were unevenly spread across datasets (Supplementary Table 5) with different drivers missing from different datasets. Hence, multifactor models would have led to significant reductions in sample size and thus power. Before all metaregressions, we checked for confounding and/or collinearity issues through boxplots and correlograms.
Random-effects structure. Because we did not assume all datasets to have the same true effect size and to account for methodological differences across the datasets, we included a random-effects structure in all models . Models were fitted with the following crossed and nested random effect structure: (~1 | experiment/dataset) + (~year | experiment). The first component (the multilevel structure) corresponds to a three-level meta-analysis, allowing the individual estimates of each observation (dataset) to be nested in the experiment grouping-level . The second component (the autoregressive component) accounts for repeated samplings in the same site over several time points (years), by using a continuous autoregressive variance structure of true effects over time . We modelled such a structure by setting struct = ‘CAR’ in the rma.mv function from the metafor R package . This significantly improved the main meta-analysis model, that is, the model with the CAR structure had lower Akaike information criterion values than the model without; also, the acf-plot of computed ‘normalized or Cholesky residuals’ showed that autocorrelation was removed by adding the CAR. This random effect structure was then used for all meta-analyses and metaregression models.
Model visualization and validation. We considered and interpreted results as significant in our study if , as is commonly done in

Article

meta-analyses , whereas trends ( ) are described but not interpreted as significant (Extended Data Fig. 3). We visualized meta-analysis results through forest plots using the forest function from the metafor package . Significant metaregression results were visualized by showing the actual observations with scatterplots and violin plots for continuous and categorical drivers, respectively; as well as the model predictions, that is, regression lines or group means CIs, respectively. Models were validated by evaluating funnel and profile plots and testing the residuals for the assumption of normality and variance homogeneity . Funnel plots of the main meta-analysis showed asymmetry, indicating possible ‘publication bias’ but because we did not work with only published datasets (that is, not a meta-analysis sensu stricto) we argue that this detected asymmetry most likely originated from true heterogeneity rather than publication bias . We did not observe any other irregularities. Further, we calculated of the significant metaregression models using McFadden’s pseudo- by comparing log-likelihood values of the models to the one of the null model fitted through maximum-likelihood estimation. We report the omnibus test statistic Qm to estimate the amount of residual heterogeneity explained by each driver in the metaregression models, as well as the or QE value test statistic for heterogeneity for meta-analysis or metaregression models, respectively.

Supplementary analyses

To test the robustness of our results and to gain mechanistic insights which could help with further interpretation of our results, we performed several supplementary analyses (Supplementary Discussion). First, to answer whether the increased ER was driven by increased plant (autotrophic) or microbial (heterotrophic) respiration, or by both, we collected all the available data on ER partitioning in tundra warming experiments and performed meta-analyses on ER, autotrophic respiration and heterotrophic respiration for this subset (Extended Data Table 1b and Supplementary Discussion 1). Respiration partitioning measurements are destructive and hence alter ecosystem dynamics, making long-term measurements difficult. Hence, there is limited availability of continuous, simultaneous measurements of total ER and ER partitioning at the same site. Second, we analysed whether the differences in ER measurement methodology or OTC experiment setup resulted in methodological bias in our results (Supplementary Fig. 3 and Supplementary Discussion 2). Third, we analysed potential interactions of OTC microclimate effects on the ER response (Supplementary Discussion 3). Fourth, we assessed whether mismatching of ER with environmental driver data from different measurement years influenced our results through performing a sensitivity analysis, that is, rerunning our metaregression models on the basis of several restrictive sample size scenarios (Supplementary Fig. 4 and Supplementary Discussion 4). Fifth, we assessed whether the unbalanced sampling design from including two experiments with a much longer time series of repeated ER measurements (ALA_1 and GRE_6; Supplementary Table 2) than other experiments had a strong influence on the meta-analysis outcome; Supplementary Discussion 5). Finally, we analysed the temporal patterns in experiments as well, to see if they differed from our results when analysing these patterns across experiments (Supplementary Fig. 5 and Supplementary Discussion 6). Overall, these supplementary analyses confirmed the robustness of our results.

Spatial upscaling

We estimated spatial patterns in the sensitivity of ER to experimental warming and the resulting change in ER, by upscaling our findings on context-dependencies across the arctic and circumarctic alpine tundra region (Supplementary Fig. 6). We performed the upscaling on the basis of the two context-dependent drivers which were significant predictors of ER responses to warming based on our single-factor metaregression models, that is, TN concentration and C:N ratio of the mineral soil layer. For the upscaling, a two-factor metaregression model
was used (see details below). The detailed procedure is outlined below and visualized in Supplementary Methods 2.
Soil input data. As input for the upscaling, we downloaded the mean, 5th percentile and 95th percentile soil data (of TN, SOC concentration (%) and BD) for the study area with 250 m resolution from the ISRIC soil data hub . Given that the study area was about 10 million , the 250 m resolution was not computationally feasible for Monte Carlo uncertainty analysis (see section ‘Monte Carlo uncertainty analysis’) and thus, we aggregated the data to 1 km resolution (mean over each 1 km grid cell, ignoring the grid cells without values). A supercomputer was used to perform the analysis on the basis of the aggregated 1 km resolution. We first extracted the mean TN and SOC concentration for the mineral layer of each grid cell by defining the mineral soil layers within depth using a TN threshold of , a SOC threshold of and a BD threshold of . We then calculated depth-weighted averages of each soil driver (TN and SOC) over the mineral layer for each 1 km grid cell. To estimate standard deviation (s.d.) for each grid cell, we used the 5th and 95th percentiles of the SOC and TN layers calculated as s.d. norm , where q .95 and q. 05 are 95 th and 5 th percentiles and qnorm is the inverse cumulative distribution function of a standard normal distribution. Because there was no dataset available for C:N ratio, we used the means and standard deviations of TN and SOC data to derive grid-cell-specific C:N ratios as SOC/TN, as advised by ISRIC soil data hub personnel. This derivation and the related uncertainty are described below in the section Monte Carlo uncertainty analysis.
Upscaling model. The regression model for upscaling was built with the log-transformed ROM as effect size (response variable), which allowed to calculate projected respiration as percentage change in ER with warming (that is, the average warming achieved by the OTCs in our database), starting from a baseline ER. We used a two-factor metaregression model based on all ER datasets for which both TN concentration and ratios of the mineral soil layer were available, with the following estimated coefficients: ROM TN .
Monte Carlo uncertainty analysis. To incorporate the uncertainty in the soil data and their relationship with ER changes into our upscaling estimates, we performed Monte Carlo simulations. To propagate uncertainty in the input soil data, we generated 100 values for TN and SOC for each grid cell using the means and standard deviations derived from the ISRIC soil data. For each cell we sampled from a truncated multivariate random normal distribution (rtmvnorm from R package tmvtnorm), truncating the distribution of both variables to minimum of of the mean value to avoid negatives. Because truncation alters the characteristics of the sample, we adjusted the means so that the mean of the truncated distribution matched the target mean obtained from ISRIC. The correlation between TN and SOC was set at 0.8273 . For each sample of TN and SOC, a C:N ratio was calculated. We took the potential bias of using C:N ratio based on TN and SOC as a proxy for C:N ratio into account by fitting a linear regression between the reported C : N values from the database of this study and the calculated values based on the reported TN and TC (Supplementary Fig. 8). We fitted 100 regressions to the scatter plot and used each regression to estimate the C:N ratio of each iteration ( ) in each grid cell.
To propagate more uncertainty derived from the estimated relationship between ROM and TN and C:N, we then used the 100 pairs of TN and C:N of each grid cell as input for the upscaling model using predict.rma function from the metafor R package . This resulted in 100 predictions for ER percentage change (with associated prediction standard errors) for each grid cell. These 100 parameter sets were combined to produce an overall predicted value by taking the average, with the associated standard deviation computed by treating the prediction
distribution as a mixture of the 100 prediction intervals. The standard deviation of the resulting distribution is given by:
where is the number of simulated soil datasets and MEAN and SE are the vectors of the corresponding predicted means and standard errors.
This resulted in a predicted relative change in induced by warming averaged over the 100 predictions pairs and the corresponding combined standard deviation, for each grid cell (Fig. 6 and Supplementary Fig. 7). To estimate spatial patterns in the absolute change in ER, we then multiplied this relative change in respiration with spatially explicit baseline ER (obtained by summing gridded data of soil respiration (data compiled from 1960 to 2011) and plant respiration (data from 2015)).
We then estimated the relative contribution of model parameter uncertainty versus input soil data uncertainty to Monte Carlo estimates of the ER standard deviation (Fig. 6). Model predictions were conducted twice on the 100 input sets, first propagating both uncertainty sources (Fig. 6b) and subsequently by fixing metaregression parameters to their mean estimates and only allowing soil input data to vary. The same input data simulations were used in both runs to keep the data-related uncertainty constant. Figure 6c shows the ratio of the resulting standard deviations, that is, soil input uncertainty only/combined uncertainty.
Finally, we explored how well the distribution of our dataset compares to the distribution of gridded soil data used for upscaling. Thereto, we created a scatter plot for TN and C:N ratio in which we overlaid both the observed (from our dataset) and gridded values (gridded soil dataset used for upscaling) (Supplementary Fig. 9). Although the observed values from our dataset are slightly biased towards low TN values, overall, the observed values cover the main concentration of TN-C:N ratio distribution (about 64% when measured with Convex Hull polygon).

Data availability

Data will be available on Zenodo at https://doi.org/10.5281/zenodo. 10572479 (ref. 88). The maps in Fig. 1 and Extended Data Fig. 1 were made with R (packages ggplot2 and country code) and for the maps in Fig. 6 and Supplementary Figs. 6 and 7 country borders from Natural Earth were used and maps were done with R (package tmap).

Code availability

R scripts will be available on GitHub at https://github.com/mjalava/ tundraflux (ref. 89).
68. Henry, G. H. R. & Molau, U. Tundra plants and climate change: the international tundra experiment (ITEX). Glob. Change Biol. 3, 1-9 (1997).
69. Rousseeuw, P. J. & Hubert, M. Robust statistics for outlier detection. WIREs Data Mining Knowl. Discov. 1, 73-79 (2011).
70. Borenstein, M., Hedges, L. V., Higgins, J. P. T. & Rothstein, H. R. Introduction to Meta-analysis (Wiley, 2009).
71. Walker, D. A. et al. The Circumpolar Arctic vegetation map. J. Veg. Sci. 16, 267-282 (2005).
72. R Core Team. R: A Language and Environment for Statistical Computing (R Foundation for Statistical Computing, 2021) .
73. Viechtbauer, W. Conducting meta-analyses in R with the metafor. J. Stat. Softw. 36, 1-48 (2010).
74. Hedges, L. V., Gurevitch, J. & Curtis, P. S. The meta-analysis of response ratios in experimental ecology. Ecology 80, 1150-1156 (1999).
75. Konstantopoulos, S. Fixed effects and variance components estimation in three-level meta-analysis. Res. Synth. Methods 2, 61-76 (2011).
76. Nakagawa, S. & Santos, E. S. A. Methodological issues and advances in biological meta-analysis. Evol. Ecol. 26, 1253-1274 (2012).
77. I shak, K. J., Platt, R. W., Joseph, L., Hanley, J. A. & Caro, J. J. Meta-analysis of longitudinal studies. Clin. Trials 4, 525-539 (2007).
78. Trikalinos, T. A. & Olkin, I. Meta-analysis of effect sizes reported at multiple time points: a multivariate approach. Clin. Trials 9, 610-620 (2012).
79. Signorini, M., Midolo, G., Cesco, S., Mimmo, T. & Borruso, L. A Matter of metals: copper but not cadmium affects the microbial alpha-diversity of soils and sediments-a metaanalysis. Microb. Ecol. https://doi.org/10.1007/s00248-022-02115-4 (2022).
80. Jenkins, D. G. et al. A meta-analysis of isolation by distance: relic or reference standard for landscape genetics? Ecography 33, 315-320 (2010).
81. Vaessen, T. et al. The association between self-reported stress and cardiovascular measures in daily life: a systematic review. PLoS ONE https://doi.org/10.1371/journal. pone. 0259557 (2021).
82. Raue, A. et al. Structural and practical identifiability analysis of partially observed dynamical models by exploiting the profile likelihood. Bioinformatics 25, 1923-1929 (2009).
83. Jennions, M. D. & Møller, A. P. Publication bias in ecology and evolution: an empirical assessment using the ‘trim and fill’ method. Biol. Rev. 77, 211-222 (2002).
84. Testolin, R., Attorre, F. & Jiménez-Alfaro, B. Global distribution and bioclimatic characterization of alpine biomes. Ecography 43, 779-788 (2020).
85. Poggio, L. et al. SoilGrids 2.0: producing soil information for the globe with quantified spatial uncertainty. SOIL 7, 217-240 (2021).
86. Warner, D. L., Bond-Lamberty, B. P., Jian, J., Stell, E. & Vargas, R. Global Gridded 1-km Annual Soil Respiration and Uncertainty Derived from SRDB V3 (ORNL DAAC, 2019); https://doi.org/10.3334/ORNLDAAC/1736.
87. Huntingford, C. et al. Implications of improved representations of plant respiration in a changing climate. Nat. Commun. 8, 1602 (2017).
88. Dataset for “Environmental drivers of increased ecosystem respiration in a warming tundra”. Zenodo https://doi.org/10.5281/zenodo. 10572479 (2024).
89. Scripts for “Environmental drivers of increasd ecosystem respiration in a warming tundra”. GitHub https://github.com/mjalava/tundraflux (2024).
Acknowledgements We wish to thank the Abisko Scientific Research Station for hospitality and logistic support. For feedback on the statistical analyses, we are grateful to the R-sig-meta-analysis mailing list. We also wish to acknowledge CSC-IT Center for Science, Finland, for computational resources and the many students and field assistants involved in the monitoring, measurements and sample processing at the tundra sites over the decades of data collection included in this study. Thank you to U. Molau and O. Khitoun for data contribution from the SWE_12, 14, 15 sites and to Dries VDL for permanent support. We acknowledge that some of the fieldwork has been conducted on traditional lands. We deeply regret the passing of J. Tang, one of our co-authors, during the writing of the manuscript and wish to highlight the fundamental contributions he has made as an ecosystem ecologist to the field of carbon cycle science. During the preparation of the manuscript, S.L.M. was funded by the Flemish Research Foundation (FWO grant no. 12ZZV21N) and E.D. was funded by the Swedish Research Council VR (grant no. 2018-04004) and Knut and Alice Wallenberg Foundation (grant no. KAW 2020.0126). We also want to thank the following funding agencies for support in field- or laboratory-work or salaries as part of the in situ data collection and data synthesis: Climate Impact Research Centre, European Research Council (grant no. 819202 awarded to M.K. and grant no. 77102 to I.R.), Academy of Finland (grant nos. N-PERM 341348 to C.B., THAW-N 349503 and ACCC 337550 to M.E.M., and no. 347188 to E.K.), the Österreichischer Wissenschaftsfonds FWF (Lise Meitner grant no M-3335 to C.B.), the Research Council of Finland’s Flagship Programme under project Digital Waters (grant no. 359248 to M.K.), European Commission Directorate-General for Research (grant no. EVK2-2001-00235 to E.J.C. and grant no. 771012 to R.R.), Danish National Research Foundation (grant no. CENPERM DNRF 100 awarded to B.E. and A.M. and C.S.N.), National Science Foundation of United States (grant nos. PLR 1418010 to N.F., PLR 1417763 to T.C.P. and ANS-2113641 supported M. Petit Bon), Norwegian Research Council (FRIMEDBIO grant no. 274712 to J.G. and J.P.T. and V.V., grant no. 274712 to R.G. and S.V.H., grant nos. 276080 and 343398 to B.B.H., grant no. SFF-III 223257 to Norwegian University of Science and Technology to M.L.M., grant nos. FEEDBACK, 250740 and EMERALD, 294948 to H.L. and Arctic Field grant no. 269957 to M. Petit Bon), Greenland Ecosystem Monitoring funds to K.R., ARCUM, Stiftelsen Ymer-80 and SNSF (grant no. PZOOP2_174047 to K.G.), Swedish Research Council FORMAS (grant nos. 2013-655 to S.H. and 2021-02449 to J.M.S.), Alberta Innovates Technology Futures and Canada Research Chairs programme to M.S., Australian Research Council Discovery Projects (grant no. DP220100915 to M.J.H.), Icelandic Research Fund (to I.S.J.), National Research Foundation of Korea (grant nos. NRF-2021M1A5A1075508 and KOPRI-PN22012 to J.Y.J.), Svalbard Environmental Protection Fund (grant no. 15/128 to M. Petit Bon and grant no. 16/113 to B.B.H.), Danish Environmental Protection Agency (for funding N.M.S.), Academy of Finland (grant no. MUFFIN 332196 to C.V.), Maj and Tor Nessling Foundation (for funding H.Y.), Maaja vesitekniikan tukiry (to M.J.), European Union’s Horizon 2020 research and innovation programme under the Marie SkłodowskaCurie agreement (grant no. 657627 to M.P. Björkman), FORMAS Swedish Research Council for Sustainable Development (for funding M.P. Björkman), Climate-ecological Observatory for Arctic Tundra-COAT and UNIS (logistical support for fieldwork M.L.M. and B.B.H.). The strategic research environment BECC-Biodiversity and Ecosystem Services in a Changing Climate (to M. P. Björkman) and for funding T.S., we thank the US Department of Energy, Office of Biological and Environmental Research (Terrestrial Ecosystem Science Program nos. DE-SC0006982, DE-SC0014085 and DE-SCOO2O227 and the Permafrost Carbon Network (NSF project nos. 1331083 and 1931333).
Author contributions E.D., J.M.S. and M.P. Björkman conceived the idea and S.L.M., M.P. Björkman, J.M.S. and E.D. designed the study. E.D., G.M., J.D., J.M.S., M.P. Björkman, S. Schwieger, and V.V. gave extensive feedback on the analyses and manuscript. S.L.M. and J.D. assembled the ER data for meta-analysis and metaregression performed by S.L.M. S. Schwieger assembled and analysed the AR/HR data for meta-analysis. M.J., J.T.W. and M.K. performed the spatial upscaling and designed all related figures. S. Schwieger, J.D. and S.L.M. codesigned Fig. 1. S. Schwieger and S.L.M. codesigned the Graphical Abstract, made by S. Schwieger. J.M.S. produced Supplementary Fig. 4. S. Schwieger produced Supplementary Fig. 5. S.L.M. designed all other figures and tables and wrote the manuscript. M.K. did the final formatting of the figures. All authors, excluding G.M., J.D., J.M.S., S.L.M. and S. Schwieger, contributed data. V.V., R.A., I.A., R.B., M.C., G.C., C.T.C., P.F., T.F., K.G., S.V.H., C.H.P., I.S.J., J.Y.J., T.M., C.S.N., T.C.P., E.P.P., M. Petit Bon, A.P., K.R., N.M.R.R., R.R., I.R., M.V., C.V., H.O., S. Sjögersten,

Article

M.P. Björkman and E.D. also participated in in situ data collection. I.A., C.B., J.H.C., C.T.C., E.D., H.L., S. Sjögersten, V.V. and C.V. collected in situ flux partitioning data. M.J. developed the data and code repositories. All authors reviewed the manuscript, excluding G.C., H.B., H.O., J.T., J. Guðmundsson, M.J., M.N., N.M.R.R., R.E.L., R.S.V.L., R.A. and Z.G. who only contributed data.
Funding Open access funding provided by Umea University.
Competing interests The authors declare no competing interests.
Additional information
Supplementary information The online version contains supplementary material available at https://doi.org/10.1038/s41586-024-07274-7.
Correspondence and requests for materials should be addressed to S. L. Maes.
Peer review information Nature thanks Jessica Gurevitch, Ivan Janssens and the other, anonymous, reviewer(s) for their contribution to the peer review of this work. Peer reviewer reports are available.
Reprints and permissions information is available at http://www.nature.com/reprints.

Extended Data Fig. 2 | Uniform distribution of response to warming across the environmental context of all datasets. response to experimental warming across the spatial environmental context (See Fig. 1 in Main text). Violin plots of the actual data across the categorical environmental drivers, that is, Climate Zone (a), Soil moisture class (b), Soil class (c) and Vegetation class (d), are displayed, showing the kernel density estimation of the underlying distributions. ER Hedges SMDs for individual datasets are displayed with grey bubbles, calculated as (mean of the warmed plots – mean of the control plots)/pooled standard deviation. Bubble size denotes the weight of the observation used in the metaregression models quantified as the inverse of the square root of within-study variance, with greater bubbles indicating greater
weights. Within the violin plots, single-factor metaregression model estimates and confidence intervals are displayed with black circles and error bars. Above the x -axis, the ‘ Qm ‘ value represents the importance of the moderator or environmental driver with -value (‘ -val’) for each model. Number of datasets (‘ N ‘) for each environmental driver per category is shown above the violin plots. The black dashed horizontal line (SMD ) represents no change in ER with warming while the areas above and below represent increased (SMD > 0) vs. decreased (SMD < 0) ER with warming. Dashed horizontal lines ( , 0.8 and ) reflect small, medium and large positive and negative Hedges SMD effect sizes or increasingly greater increases and decreases with warming. For detailed model output, see Extended Data Table 4.
Extended Data Fig. 3| Warming-induced changes in soil conditions drive ER response. Trends in warming-induced changes in soil conditions and in the vegetation community driving the response to experimental warming ( ): Hedges SMD of bulk density (BD) (a) and C:N ratio (b) of the soil mineral layer and of total concentration of the soil organic layer (c) and aboveground biomass (d) and graminoid cover (e) of the vegetation community. ER Hedges SMDs for individual datasets are displayed on the y -axis with grey bubbles, calculated as (mean of the warmed plots – mean of the control plots)/pooled standard deviation. Bubble size denotes the weight of the observation used in the metaregression quantified as the inverse of the square root of within-study variance, with larger bubbles indicating greater weights. Top left in each panel shows the sample size (‘N’, number of datasets) and
bottom left shows the ‘Qm’ (Q-value of importance of the environmental drivers) and ‘ ‘-value of the metaregression models. The black dashed horizontal line represents no change in ER with warming while the areas above and below represent increased (SMD > 0) vs. decreased (SMD < 0) ER with warming. Dashed horizontal lines ( and ) reflect small, medium and large positive and negative HedgesSMD, respectively or increasingly greater increases and decreases with warming. The black dashed vertical line reflects no change in the environmental condition with warming (with areas right and left of it representing increased vs. decreased conditions with warming). For detailed model output, see Extended Data Table 3.

Article

Extended Data Table 1 | Meta-analyses evaluating effects of experimental warming on Ecosystem (ER), Autotrophic (Ra) and Heterotrophic Respiration (Rh)

Response Slope [95%CI]* Q value Multilevel structure Autoregressive component (inner | outer) N Percentage change
tau^2 rho
Main meta-analysis
Ecosystem
Respiration (ER)
Hedges SMD
[0.44, 0.70] *** 731 0.00 0.00 0.19 0.92 136 NA
Ratio of Means (ROM)
[0.20, 0.32] *** 907 0.00 0.00 0.04 0.94 136
Sub meta-analysis
Ecosystem Respiration (ER) Hedges SMD
[0.42, 1.02] *** 19 0.02 0.09 0.00 0.00 9 NA
ROM [0.18, 0.48] *** 23
0.03 0.00 0.00 0.35 9 [19.6, 62.1] %
Hedges SMD
Autotrophic Respiration (Ra) [0.08, 0.80] *** 26 0.00 0.20 0.00 0.00 9 NA
ROM
[0.08, 0.83] *** 27 0.07 0.13 0.00 0.00 9 [6.9, 130.2] %
Heterotrophic Respiration (Rh) Hedges SMD [0.36, 1.48] ***
43 0.00 0.00 0.50 0.84 9 NA
19 0.03 0.00 0.00 1.00 9 %
“Significant results are highlighted in bold: * ; ** <0.01; *** <0.001. Percentage change ROM
From top to bottom: The different types of respiration responses used for meta-analyses, that is, ecosystem (ER) vs. autotrophic or plant (Ra) vs. heterotrophic or microbial (Rh) respiration, with ; the different types of effect sizes used for meta-analyses, that is, Hedges SMD vs. Ratio of Means (ROM). From left to right: The type of respiration investigated (‘Response’); the model results for each response, testing whether respiration significantly changes with experimental warming (‘Slope’); the Q-value of heterogeneity; the output of the multilevel model structure (represented by and ) and of the autoregressive model component (tau and rho); the sample size (‘ N ‘ or number of datasets); and the percentage change calculated from the ROM as 100*( -1). Meta-analysis results are presented as the mean model estimate (slope) and 95% confidence intervals, with a down/upward arrow ( ) indicating significantly decreased or increased respiration with warming and the significance level based on -values. Significant drivers and results are in bold.
Extended Data Table 2 | Metaregression models evaluating effects of experimental warming duration on ER response to warming
Driver Slope [95%CI]* QE QM Multilevel structure Autoregressive component (inner | outer) N
a Warming duration Across age classes (all data) tau^2 rho 136
Within age classes
[0-5 years)
[-0.08, 0.06] [5-10 years) 186 0.1 0.00 0.06 0.03 0.00 0.05 70
[10-15 years) 63 63 0.45 0.23 0.00 0.00 1.00 28
years 36 5.6 0.33 0.13 0.00 0.00 1.00 15
0.00 [-0.13, 0.13] 85 0.0 0.00 0.51 0.00 0.00 1.00 23
b Age class Age class effect 468 5.2 0.03 0.00 0.00 0.20 0.93 136
Significance from zero
[0-5 years)
0.63 [0.48, 0.79]***
[5-10 years)
0.41 [0.21, 0.62]***
[10-15 years)
0.40 [0.14, 0.64]***
years
0.61 [0.33, 0.89]***
“Significant results are highlighted in bold:* p<0.05; **<0.01; ***<0.001.
From top to bottom: Metaregression model results testing the effects of ) experimental warming duration and ) age classes based on experimental warming duration, on Hedges for all data or for separate age classes. From left to right: The specific driver used as predictor to test the effect on Hedges SMDs (‘Driver’); the model results for each driver, testing whether Hedges SMDs are significantly influenced by the driver (‘Slope’); the ‘ QE ‘-value of heterogeneity, as well as the ‘ QM ‘-value, reflecting importance of the driver and the (‘ ); the output of the multilevel model structure (represented by and ) and of the autoregressive model component (tau and rho); and the sample size (‘ or number of datasets). Metaregression results are presented as the mean model estimate and confidence intervals (‘Slope ( )’), with a down/upward arrow ( ) indicating that higher values of the driver significantly decreased or increased responses to warming and the significance level based on -values. Significant drivers and results are in bold.

Article

Extended Data Table 3 | Metaregression models evaluating effects of environmental drivers (indirect warming effects) on ER response to warming

Driver Slope [95%CI]* QE QM Multilevel structure Autoregressive component (inner | outer) N
Type rho
Climate
SMD Air temperature 467 0.2 0.00 0.00 0.00 0.16 0.90 77
SMD Soil temperature [-0.04, 0.26] 536 2.0 0.02 0.00 0.00 0.12 0.95 118
SMD Soil moisture [-0.14, 0.08] 621 0.3 0.00 0.00 0.00 0.18 0.93 111
Soil
SMD SOM (min, org) [-0.40, 0.79] 80 0.4 0.01 0.49 0.00 0.00 1.00 28
[-0.29, 0.66] 93 0.6 0.01 0.00 0.00 0.26 1.00 41
SMD TC (min, org) [-0.17, 0.52] 270 1.0 0.04 0.00 0.00 0.14 0.95 42
379 0.1 0.00 0.00 0.00 0.12 0.94 65
SMD TN (min, org) [0.04, 0.44] * 186 5.4 0.22 0.00 0.00 0.11 0.95 42
[0.00, 0.54] (*) 341 3.7 0.08 0.00 0.00 0.11 0.95 65
SMD CN (min, org) 185 3.8 0.12 0.00 0.00 0.13 0.96 38
[-0.16, 0.08] 404 0.6 0.00 0.00 0.00 0.11 0.94 71
SMD pH (min, org) [0.06, 2.91] * 65 4.2 0.12 0.37 0.00 0.00 1.00 27
[-0.17, 0.11] 115 0.2 0.00 0.00 0.00 0.18 0.99 53
SMD Bulk density 231 3.2 0.27 0.00 0.00 0.12 0.94 31
(min, org) [-0.13, 0.50] 379 1.3 0.03 0.00 0.00 0.31 0.98 49
Vegetation
SMD Graminoids [-0.04, 0.36] (*) 565 2.6 0.02 0.00 0.00 0.18 0.91 100
SMD Forbs [-0.17, 0.25] 593 0.1 0.00 0.00 0.00 0.18 0.91 111
SMD Decid shrubs [-0.19, 0.08] 579 0.6 0.01 0.00 0.00 0.20 0.93 90
SMD Evergr shrubs [-0.11, 0.28] 566 0.7 0.01 0.00 0.00 0.19 0.91 88
SMD Mosses [-0.05, 0.23] 585 1.6 0.02 0.00 0.00 0.20 0.91 88
SMD Lichens [-0.13, 0.33] 518 0.7 0.01 0.00 0.00 0.20 0.93 78
SMD Biomass [-0.03, 0.45] (*) 222 2.9 0.06 0.00 0.00 0.12 0.95 61
SMD Comm height 102 0.4 0.01 0.00 0.00 0.16 1.00 43
Microbial
SMD Bacterial Abund [-0.05, 0.37] 11 2.2 0.27 0.01 0.00 0.00 0.99 16
SMD Fungal Abund [-0.52, 0.33] 14 0.2 0.03 0.04 0.00 0.00 0.94 16
SMD FB-Ratio 13 0.4 0.07 0.04 0.00 0.00 1.00 16
Extended Data Table 4 | Metaregression models evaluating effects environmental drivers (context-dependencies) on ER response to warming
Driver Slope [95%CI]* QE QM Multilevel structure Autoregressive component (inner | outer) N
Type tau^2 rho
Climate
Zone Non-significant 713 0.1 0.00 0.00 0.00 0.20 0.93 136
Permafrost prob [-0.25, 0.38] 709 0.2 0.00 0.00 0.00 0.19 0.93 133
Air temperature 0.00 [-0.02, 0.03] 479 0.1 0.00 0.00 0.00 0.16 0.90 77
Soil temperature [-0.01, 0.04] 500 1.2 0.01 0.00 0.00 0.12 0.94 118
Soil
Soil moisture 0.00 [0.00, 0.00] 612 0.1 0.00 0.00 0.00 0.18 0.93 111
Soil moisture class Non-significant 673 0.3 0.00 0.00 0.00 0.20 0.93 136
SOM (min, org) [-0.14, 0.24] 79 0.2 0.01 0.46 0.00 0.00 1.00 28
0.00 [-0.02, 0.01] 96 0.8 0.02 0.00 0.00 0.27 1.00 41
Soil Carbon stock 0.00 [-0.00, 0.00] 682 0.0 0.00 0.00 0.00 0.20 0.93 131
TC (min, org) -0.02 [-0.04, 0.01] 263 1.9 0.08 0.00 0.00 0.11 0.92 42
0.00 [-0.01, 0.01] 357 0.1 0.00 0.00 0.00 0.17 0.96 70
TN (min, org) 302 6.3 0.27 0.00 0.00 0.08 0.91 43
0.00 [-0.26, 0.26] 394 0.0 0.02 0.00 0.00 0.17 0.96 70
C:N (min, org) [0.00, 0.06] * 244 4.7 0.22 0.00 0.00 0.13 0.96 39
370 1.1 0.02 0.00 0.00 0.13 0.95 75
pH class Non-significant 666 0.4 0.00 0.00 0.00 0.20 0.93 136
pH (min, org) [-0.39, 0.64] 82 0.2 0.01 0.46 0.00 0.00 1.00 29
[-0.06, 0.30] 133 1.6 0.02 0.00 0.00 0.20 0.93 55
Bulk density [-0.62, 0.81] 280 0.1 0.01 0.00 0.00 0.16 0.95 38
(min, org) -0.26 [-2.62, 2.10] 449 0.0 0.00 0.00 0.00 0.24 0.96 69
Vegetation
Vegetation class Non-significant 624 5.5 0.04 0.00 0.00 0.19 0.92 136
Net primary prod 0.00 [-0.89, 0.88] 721 0.0 0.00 0.00 0.00 0.20 0.93 136
Significant results are highlighted in bold: * . Trends ( ) are indicated with ().
From top to bottom: Metaregression model results testing the effects of context-specific environmental conditions on ER Hedges SMD (‘context-dependencies’). From left to right: The type of environmental driver investigated; the specific driver used as predictor to test the effect on ER Hedges SMDs (‘Driver’); the model results for each driver, testing whether ER Hedges SMDs are significantly influenced by the driver (‘Slope’); the ‘ QE ‘-value of heterogeneity, as well as the ‘ QM ‘-value, reflecting importance of the driver and the pseudo- (‘ ‘); the output of the multilevel model structure (represented by and ) and of the autoregressive model component (tau and rho); and the sample size (‘ ‘ or number of datasets). Metaregression results are presented as the mean model estimate and confidence intervals (‘Slope ( )’), with a down/upward arrow ( ) indicating that higher values of the driver significantly decreased or increased responses to warming and the significance level based on -values. Significant drivers and results are in bold.

  1. *Significant results are highlighted in bold: * ; **<0.01; **<0.001. Trends ( ) are indicated with ().
    From top to bottom: Metaregression model results testing the effects of warming-induced changes in local environmental conditions on ER Hedges SMD (‘indirect warming effects’). From left to right: The type of environmental driver investigated; the specific driver used as predictor to test the effect on ER Hedges SMDs (‘Driver’); the model results for each driver, testing whether ER Hedges SMDs are significantly influenced by the driver (‘Slope’); the ‘ QE ‘-value of heterogeneity, as well as the ‘ QM ‘-value, reflecting importance of the driver and the pseudo- (‘ ‘); the output of the multilevel model structure (represented by and ) and of the autoregressive model component ( and rho); and the sample size (‘ N ‘ or number of datasets).
    Metaregression results are presented as the mean model estimate and confidence intervals (‘Slope ( )’), with a down/upward arrow ( ) indicating that higher values of the driver significantly decreased or increased responses to warming and the significance level based on -values. Significant drivers and results are in bold.