DOI: https://doi.org/10.1029/2023jg007638
تاريخ النشر: 2024-02-26
علوم الأرض البيولوجية JGR
مُكَلَّف
مخطوطة
- الاحترار السريع في منطقة التربة الصقيعية الشمالية يهدد النظم البيئية، واحتياطيات الكربون في التربة، والأهداف المناخية العالمية
- تظهر الملاحظات طويلة الأمد أهمية الاضطرابات وفترات الموسم البارد لكنها غير قادرة على اكتشاف الاتجاهات المكانية والزمانية في تدفق الكربون.
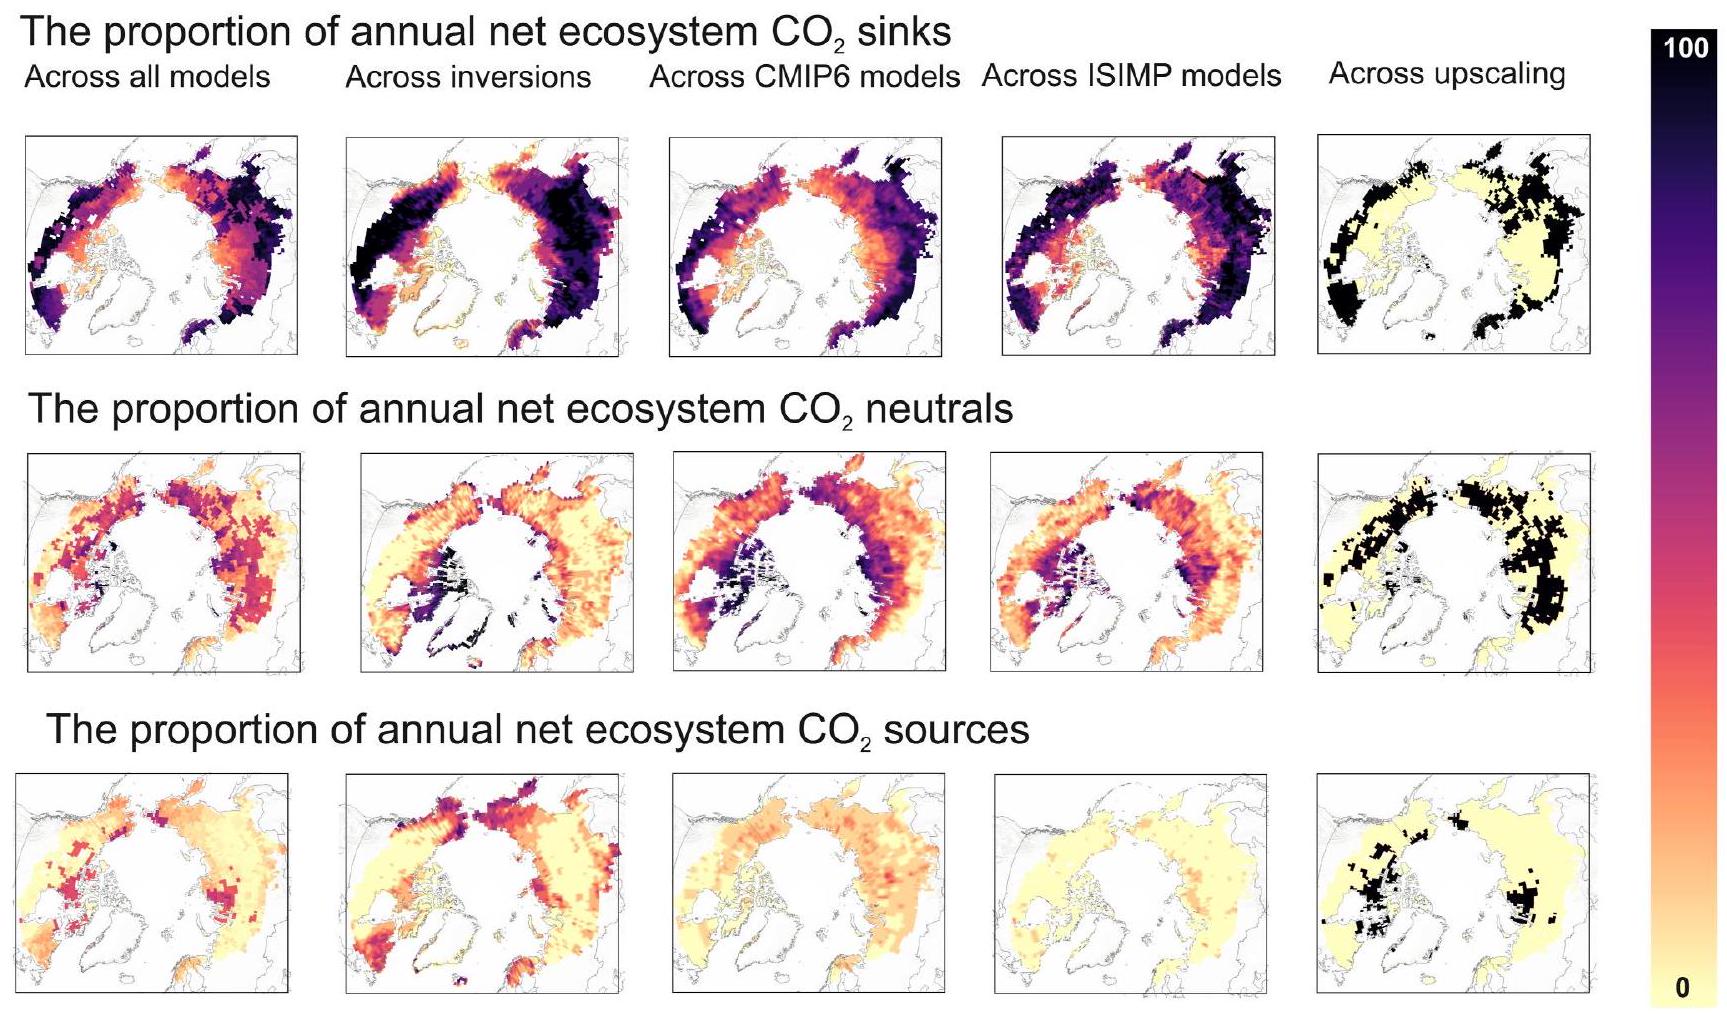
- تظهر النمذجة والتركيبات المشتركة أن منطقة التربة المتجمدة هي منطقة أرضية صغيرة
حوض ذو تباين مكاني كبير وصافي مصدر
المعلومات الداعمة:
المراسلة إلى:
اقتباس:
تم القبول في 7 فبراير 2024
© 2024 المؤلفون.
الكربون في التربة المتجمدة: تقدم في فهم المخزونات والتدفقات عبر النظم البيئية الأرضية الشمالية
الملخص
التقدم الملحوظ في علم كربون التربة المتجمدة الذي تم إحرازه على مدى العقود الماضية يشمل تحديد مخزونات كبيرة من كربون التربة المتجمدة، وتطوير خرائط جديدة للتربة المتجمدة عبر القطب الشمالي، وزيادة في مواقع القياس الأرضية لـ
ملخص بلغة بسيطة يهدد تغير المناخ وذوبان التربة الصقيعية الناتج عنه بتحويل منطقة التربة الصقيعية من مصدَر للكربون إلى مصدر للكربون، مما يشكل تحديًا للأهداف المناخية العالمية. لقد حددت العديد من الدراسات على مدى العقود الماضية عوامل مهمة تؤثر على دورة الكربون.
بما في ذلك تغييرات الغطاء النباتي، وفترات تجمد التربة وذوبانها، والحرائق البرية، وغيرها من أحداث الاضطراب. بشكل عام، تظهر الدراسات انبعاثات عالية من الميثان في الأراضي الرطبة وقوة صغيرة لامتصاص ثاني أكسيد الكربون في منطقة التربة المتجمدة الأرضية، لكن النتائج تختلف بين أساليب النمذجة والتوسع. هناك حاجة إلى جهود مستمرة ومنسقة بين مجتمعات الميدان والنمذجة والاستشعار عن بُعد لدمج المعرفة الجديدة من الملاحظات إلى النمذجة والتنبؤات وأخيرًا إلى السياسات.
1. المقدمة
1.1. نظرة عامة على منطقة التربة المتجمدة: المدى والخصائص
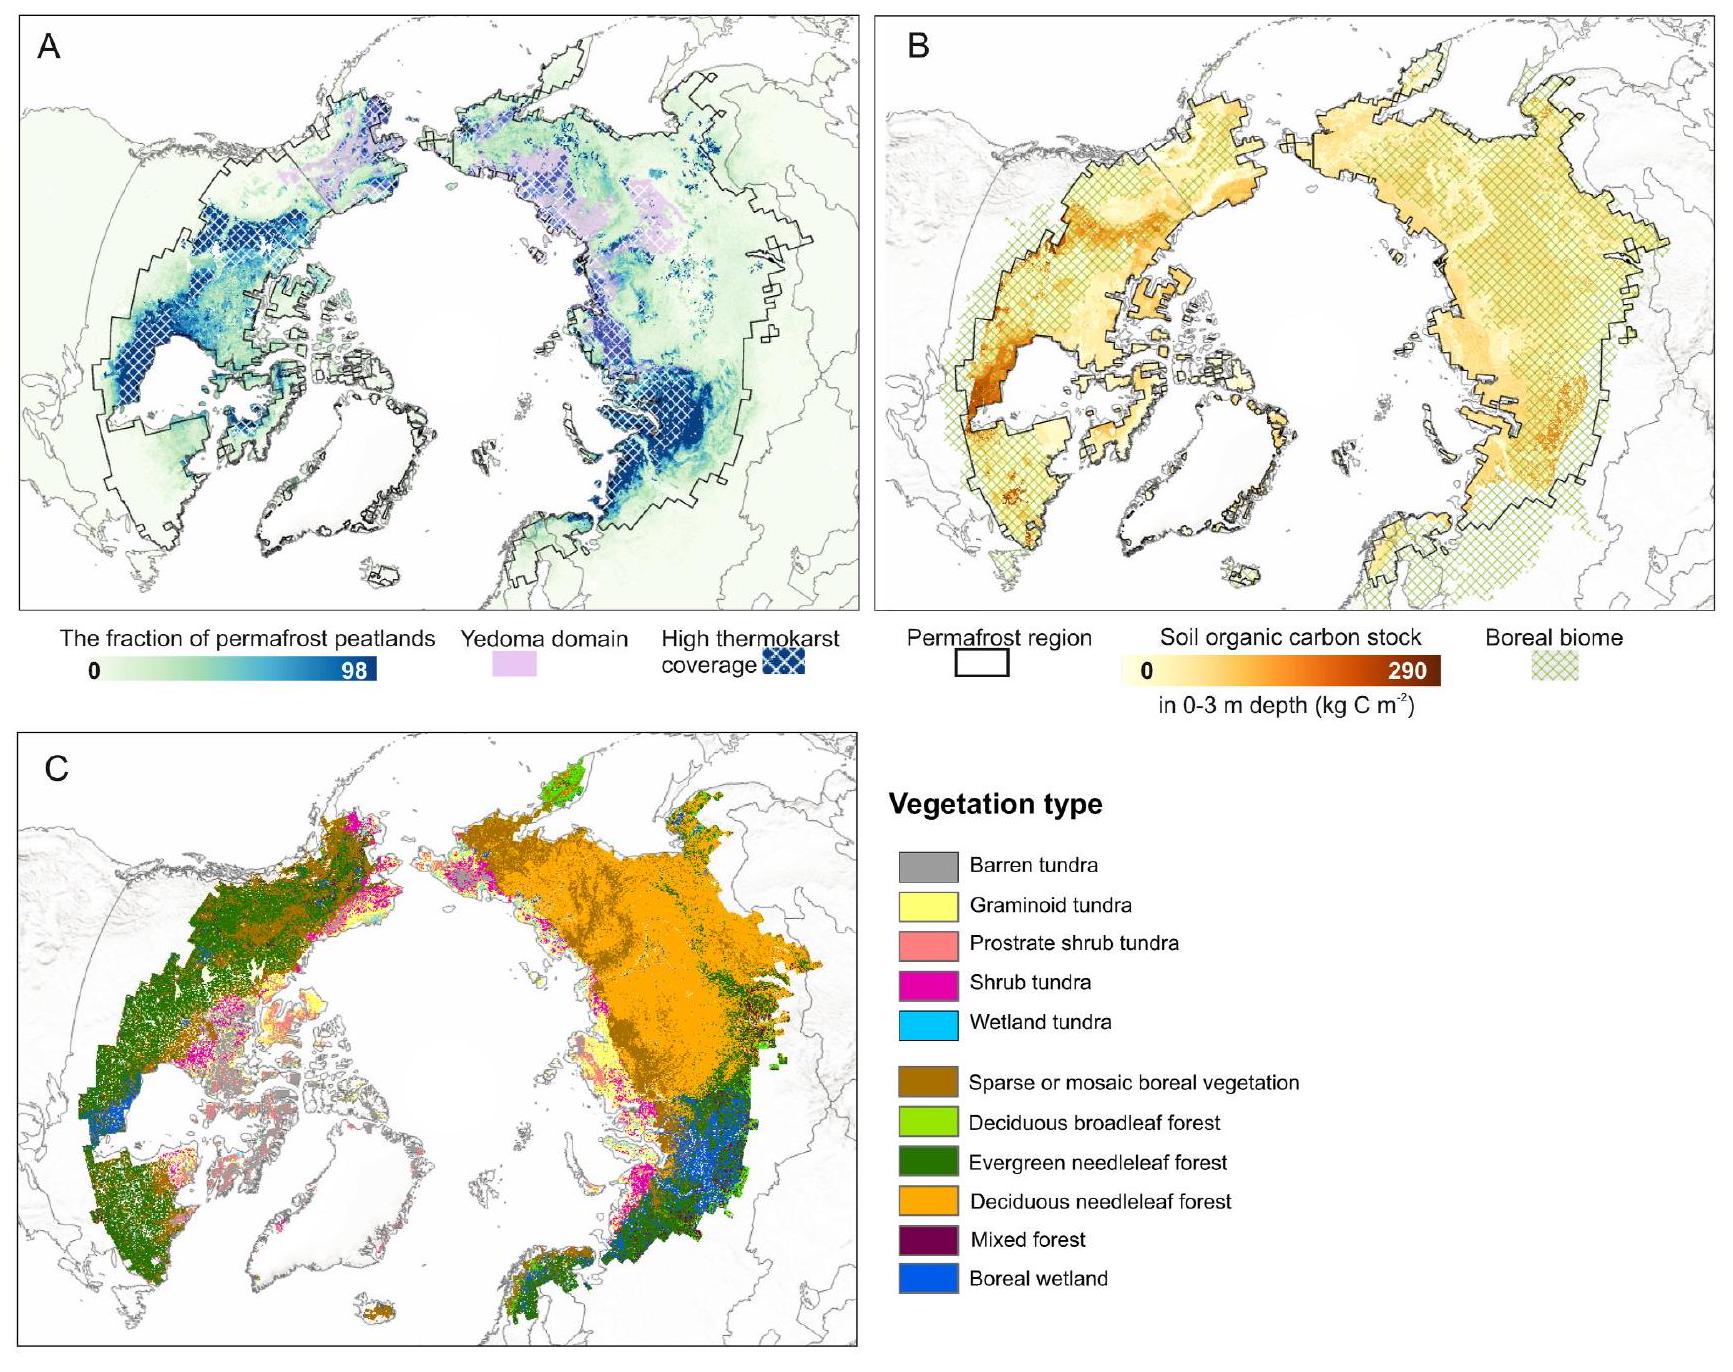
منتجات الخرائط الموضوعية المختارة ذات الطابع المكاني المحيطي (التربة المتجمدة، التربة)
| موضوع | دراسة | اسم | وصف النهج | الامتداد المكاني | قرار | نوع الخريطة (متجهة/ مضلعة، نقطية) |
| خصائص ومدى المناظر الطبيعية للتربة المتجمدة | ||||||
| مدى الجليد الدائم | براون وآخرون، 1998 تم تنقيحه 2001 | خريطة الجليد الدائم IPA | رسم الخرائط الميدانية والرقمنة اليدوية | بان-أركتيك | 12.5 كم | راستر |
| مدى الجليد الدائم + التوزيع الجغرافي | غروبر (2012) | نموذج التوازن باستخدام متوسط درجة حرارة الهواء السنوية + التضاريس | عالمي | 1 كيلومتر | راستر | |
| مدى الجليد الدائم | أوبو وآخرون (2019) | نموذج درجة حرارة التوازن TTOP + التوصيف من بيانات الأقمار الصناعية | بان-أركتيك | 1 كيلومتر | راستر | |
| درجة حرارة التربة المتجمدة وسمك الطبقة النشطة | ألتو وآخرون (2018) | النمذجة الإحصائية بين ALT وبيانات المناخ والبيئة المحلية | المناطق الأرضية
|
1 كيلومتر | راستر | |
| درجة حرارة التربة المتجمدة، سمك الطبقة النشطة، سعة صفرية سنوية | ران وآخرون (2022) | النمذجة الإحصائية بين ALT، بيانات المناخ، البيئة المحلية، وخصائص التربة | بان-أركتيك | 1 كيلومتر | راستر | |
| توزيع المناظر الطبيعية للحرارة الكارستية | أوليفيلدت وآخرون (2016) | منتج دمج البيانات | بان-أركتيك | أشكال متعددة الأضلاع بأحجام متغيرة، مع
|
متجه | |
| التجمد تحت البحر | أوفر دوين وآخرون (2019) | سوبر ماب | تدفق الحرارة العابر في بعد واحد مع الأخذ في الاعتبار تغير مستوى البحر والرواسب | بان-أركتيك؛ المحيط القطبي | 12.5 كم | |
| نوع ووفرة الجليد الأرضي | أونيل وآخرون (2019) | نموذج دمج البيانات | كندا | 1 كم | راستر | |
| موضوع | دراسة | اسم | وصف النهج | الامتداد المكاني | قرار | نوع الخريطة (متجهة/ مضلعة، نقطية) |
| تربة مناطق التربة المتجمدة: الخصائص، النطاق، مخزونات الكربون | ||||||
| مدى نطاق ييدوما | (ستراوس وآخرون، 2021) | خرائط جيولوجية متناسقة، استشعار عن بُعد ورسم خرائط ميدانية، بما في ذلك الرقمنة اليدوية | بان-أركتيك | أشكال متعددة الأضلاع بأحجام متغيرة | مضلع | |
| مدى الأراضي الخثية، العمق، وكثافات الكربون | هوجيليوس وآخرون (2020) | خرائط التربة المتناغمة والنمذجة الإحصائية | شمال
|
10 كم | راستر | |
| فئة التربة، خصائص التربة، كثافة الكربون | تارنوكاي وآخرون (2009) | NCSCD | خرائط التربة المتناغمة والنمذجة الإحصائية | منطقة التربة المتجمدة | مضلع | |
| فئة التربة، خصائص التربة، كثافة الكربون | هوجيليوس وآخرون (2013) | NCSCDv2.0 | خرائط التربة المتناغمة والنمذجة الإحصائية | منطقة التربة المتجمدة | مضلع | |
| فئة التربة، خصائص التربة، كثافة الكربون | ميشرا وآخرون (2021) | تعلم الآلة باستخدام ملفات التربة المتناغمة ومنتجات بيانات الاستشعار عن بعد | منطقة التربة المتجمدة | 250 م | راستر | |
| فئة التربة، خصائص التربة، كثافة الكربون | هينجل وآخرون (2017)؛ بوجيو وآخرون (2021) | سول جريدز 250 م/ 2.0 | تعلم الآلة باستخدام ملفات التربة ومنتجات البيانات المستشعرة عن بُعد | عالمي | 250 م | راستر |
1.2. نباتات منطقة التربة المتجمدة: عنصر رئيسي في دورة الكربون
1.3. التربة المتجمدة: خزان كربون ذو أهمية عالمية
يتراوح من 1,014 (
2. تدفقات الكربون الأرضية في منطقة التربة المتجمدة
2.1.
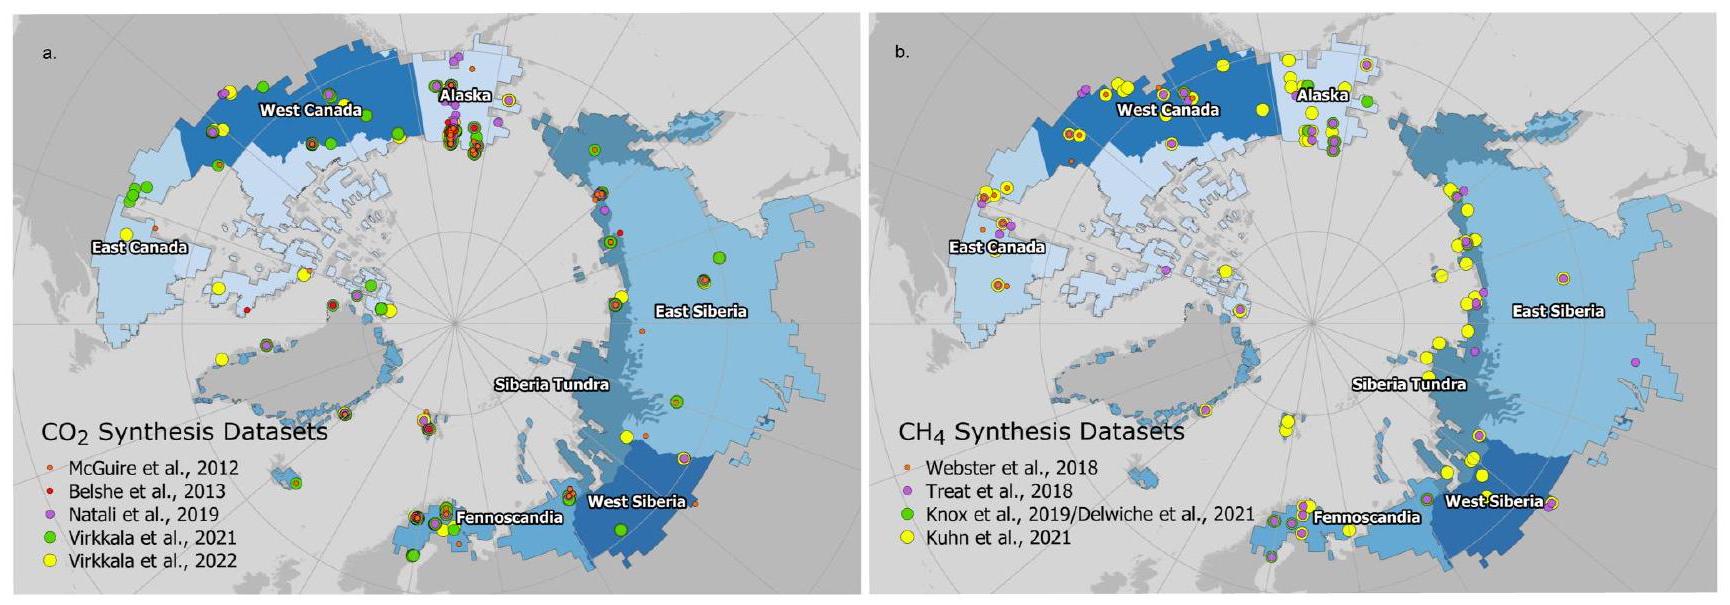
مراجعة للبيانات الموجودة من التوليفات
| دراسة | لا. المواقع الفريدة الإجمالية / منطقة التربة المتجمدة
|
مجالات تقنيات القياس والتدفقات المصنعة | مجال الدراسة | فترة الدراسة | تجميع التدفق | تنسيق | ملاحظات |
| بارتليت وهاريس (1993) |
|
غرفة وتباين إيدي | عالمي | القياسات من 1982 إلى 1991 | يومي، سنوي | مبني على النقاط | مجموعة البيانات في الجدول |
| نيلسون وآخرون (2001) | 619 ب/– | استطلاع تدفقات الغرف من مختلف الأراضي الرطبة في السويد | السويد | 1994 | يومي | يفتقر إلى المعلومات المكانية | تقارير خصائص تدفقات أنواع الأراضي الرطبة المختلفة |
| فروكين وآخرون (2011) |
|
غرفة وتباين إيدي | عالمي | القياسات من 1990 إلى 2008 | سنوي | مبني على النقاط | المتوسط السنوي
|
| ماكغواير وآخرون (2012) |
|
غرفة، تقديرات تدرج التركيز المعتمدة على تدفق الإدي، التبادل | القطب الشمالي | القياسات من 1974 إلى 2011 | يومي، موسمي، سنوي | مبني على النقاط | مجموعة البيانات في الملحق |
| أوليفيلدت وآخرون (2013) | 303 ب/– | غرفة | منطقة التربة المتجمدة | القياسات من 1984 إلى 2010 | يومي | مبني على النقاط | مجموعة البيانات غير متاحة للجمهور ولكنها مدرجة في كوهين وآخرون (2021) |
| توريستسكي وآخرون (2014) |
|
غرفة وتباين إيدي | عالمي | القياسات من 1980 إلى 2011 | يومي | مبني على النقاط | مجموعة البيانات غير متاحة للجمهور |
| ويبستر وآخرون (2018) | ٤٩/٢٣ | غرفة وتباين إيدي | كندا | القياسات من 1984 إلى 2016 | يومي، موسمي، سنوي | مبني على النقاط | مجموعة البيانات غير متاحة للجمهور |
| Treat وآخرون (2018ب) | 173/62 | غرفة، طريقة تباين الدوامة، وطريقة انتشار الثلوج | شمالي خارج المداري | 1974-2016 | يومي، موسمي، سنوي | مبني على النقاط | معايير الشمول: الحد الأدنى
|
| دلويتش وآخرون (2021)؛ نوكس وآخرون (2019) | 81/17 | تبادل إدي | عالمي | القياسات من 2006 إلى 2018 | نصف ساعتي، يومي | مبني على النقاط | تحميل البيانات متاح فقط لمواقع FluxNET الفردية، وليس كبيانات مجموعة. |
| كون وآخرون (2021ب) |
|
غرفة، تباين دوامي، تدرج التركيز | منطقة التربة الصقيعية الشمالية | القياسات من 1984 إلى 2019 | يومي | نقاط/ ملف شكل/ KML | يبني على ويك وآخرون (2016) وأوليفيلدت وآخرون (2013) |
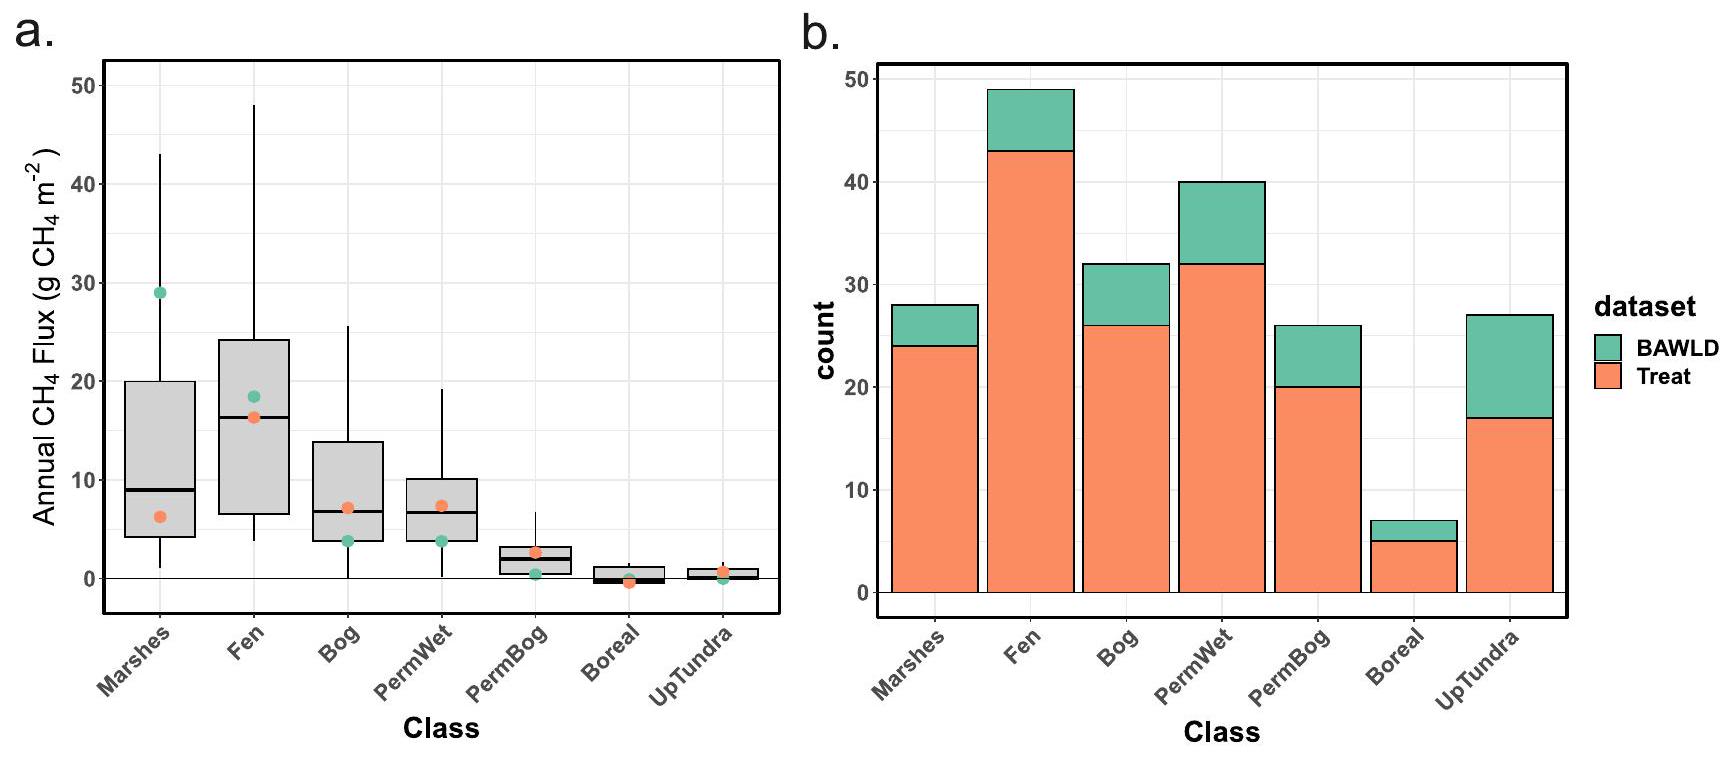
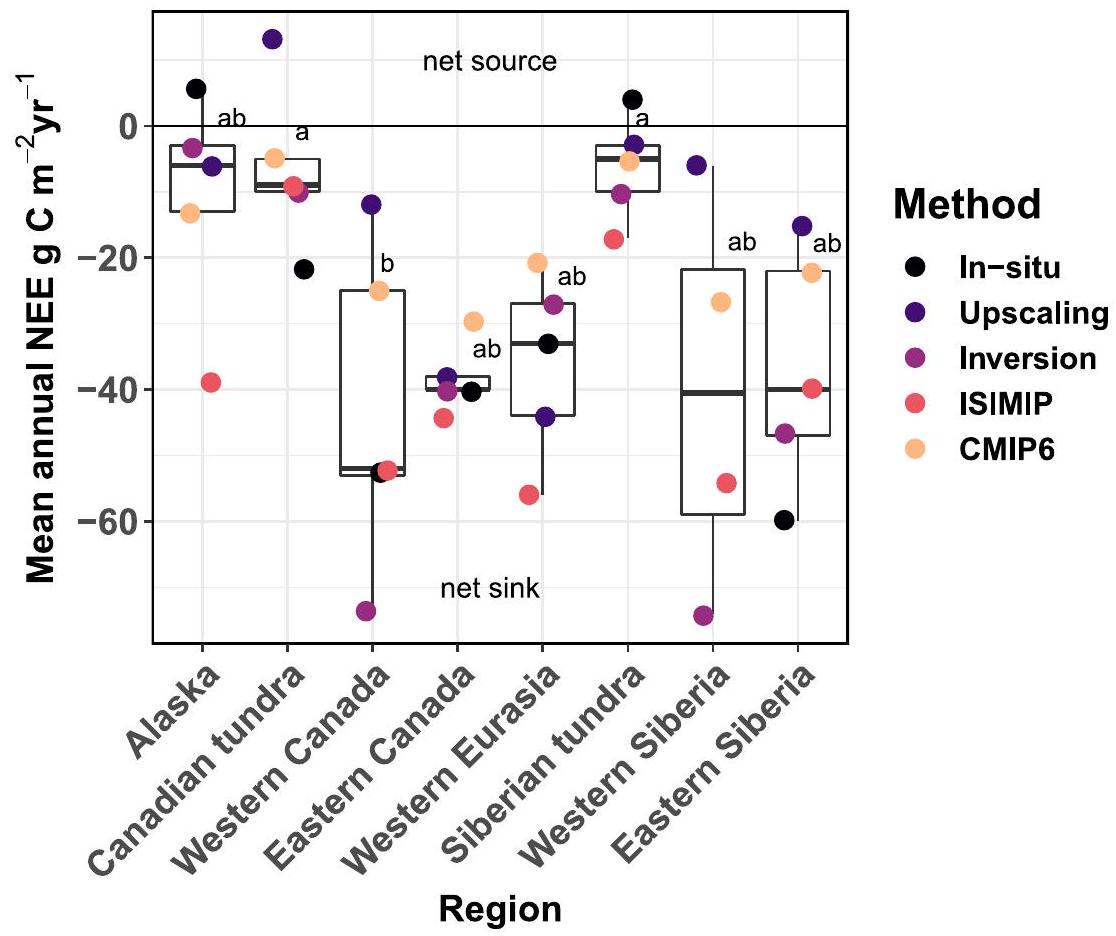
2.2. التباين الإقليمي في
المتوسط والانحراف المعياري للنيتروجين الصافي السنوي على اليابسة
| نوع النموذج | ألاسكا | التندرا الكندية | غرب كندا | شرق كندا | أوراسيا الغربية | التندرا السيبيرية | سيبيريا الشرقية | سيبيريا الغربية |
| في الموقع |
|
-22 (غير متاح) (موقعان؛ لم يتم قياس موسم النمو غير المباشر) |
|
|
|
|
|
غير متوفر |
| ترقية |
|
|
|
|
|
|
|
-6
|
| الانعكاس |
|
|
|
|
|
|
|
-74
|
| نموذج عملية CMIP6 |
|
|
|
|
|
|
|
-27
|
| نموذج عملية ISIMIP |
|
|
|
|
|
|
|
-54
|
2.3. الاتجاهات طويلة الأجل في
2.4.
السهول المنخفضة في كندا وألاسكا (Euskirchen وآخرون، 2017؛ Helbig وآخرون، 2017)، والانهيارات الأرضية من فنلندا (Varner وآخرون، 2022). ومع ذلك، فإن شبكة المواقع الحالية تفتقر إلى الانهيارات الناتجة عن الذوبان، والخنادق، والانفصالات في الطبقة النشطة (Cassidy وآخرون، 2016) التي تغطي
3. نمذجة تدفقات الكربون في منطقة التربة المتجمدة
3.1. الأساليب الرئيسية لنمذجة تبادل الكربون
قد تكون أنظمة الاستيعاب مثل نموذج بيانات الكربون (CARDAMOM) التي تدمج مصادر بيانات متنوعة مع نماذج عمليات أقل تعقيدًا حلاً لتوقعات أفضل (لوبيز-بلانكو وآخرون، 2019؛ ي. ك. لو وآخرون، 2012). بالإضافة إلى ذلك، فإن نماذج الانعكاس الجوي من الأعلى إلى الأسفل مقيدة بالبيانات الجوية حيث ترتبط تغييرات التركيز بالتدفق والنقل الجوي وغالبًا ما تكون أقل دقة من النهج من الأسفل إلى الأعلى (بروهويلي وآخرون، 2021؛ بيرن وآخرون، 2023؛ ز. ليو وآخرون، 2022).
3.2. رؤى النمذجة في
3.3. التقدمات الرئيسية والتحديات في نمذجة دورة الكربون في منطقة التربة المتجمدة
مما يؤدي إلى تقدير غير دقيق لإمكانات التغذية المرتدة المناخية من هذه التربة المتجمدة. فقط نموذجين من نماذج CMIP6 شملوا تمثيل الكربون في التربة تحت الصقيع (CESM وNorESM)، مما حسن تقديرات مخزونات الكربون في منطقة التربة تحت الصقيع. قد يكون الوقت القصير نسبيًا لبدء تشغيل بعض النماذج (على مدى قرون) مقارنةً بالوقت البطيء لتراكم الكربون تحت الصقيع على مدى آلاف السنين – خاصةً بالنسبة لرواسب ييدوما الغنية بالكربون من العصر الجليدي (Lindgren et al., 2018) والأراضي الخثية من العصر الهولوسيني (Yu et al., 2010) – أحد الأسباب وراء هذا التقدير غير الدقيق (Huntzinger et al., 2020; Schwalm et al., 2019). بدلاً من ذلك، قد تكون التمثيلات غير الدقيقة لتغطية النباتات والمشتقات النباتية
محاكاة التغيرات المفاجئة بعد الاضطرابات. بينما شملت خمسة من 11 نموذجًا من نماذج دورة الكربون الأرضية المستخدمة في نماذج المناخ العالمية CMIP6 محاكاة الحرائق، لم يتضمن أي منها تفاعلات الكربون الناتجة عن الحرائق والتربة المتجمدة (Canadell et al., 2021). كما أن عمليات التيرموكارست غائبة على الرغم من أنه يمكن تمثيلها إلى حد ما في نماذج الأرض (N. D. Smith et al., 2022). يمكن أن تؤثر الاضطرابات المحددة للنباتات مثل تفشي الحشرات، وأضرار الصقيع، والجفاف على توازن الكربون (Reichstein et al., 2013)، ولكن ينبغي أن تكون تحسينات ديناميات النباتات أولوية. علاوة على ذلك، فإن مساهمة الأراضي الخثية، والأنظمة المائية الداخلية، وتدفقات الكربون الجانبية بين الأنظمة الأرضية والمائية غير مدرجة في نماذج CMIP6 ولكنها مدرجة في دراسات النمذجة الإقليمية لتدفقات الكربون في منطقة التربة المتجمدة (Chaudhary et al., 2020; Kicklighter et al., 2013; Lyu et al., 2018; McGuire et al., 2018a). إن التمثيل المحدود للعمليات يعود إلى تعقيدها بالإضافة إلى نقص الملاحظات التي تدمج التفاعلات بين الأنظمة الأرضية والمائية (Vonk et al., 2019). بشكل عام، يجب أن يكون التركيز الرئيسي في تطوير النماذج المستقبلية على الإمكانية المحتملة لاحتجاز الكربون في الأراضي الخثية والتربة الأخرى (Treat et al., 2021)، والاضطرابات المحددة في المناطق الأخرى مثل ذوبان التربة المتجمدة المفاجئ (Turetsky et al., 2020) لتحقيق تقدير أكثر دقة لتغذية الكربون في التربة المتجمدة.
ميزانيات الكربون في التربة المتجمدة (Commane et al., 2017; Elder et al., 2021; Miller et al., 2016)؛ ستساعد التطورات في أنظمة تقييم النماذج ودمج البيانات أيضًا في تعزيز الفهم وتحسين التقديرات (Collier et al., 2018; Y. Q. Luo et al., 2012; Stofferahn et al., 2019).
4. ملخص الخطوات التالية
- المعرفة القائمة على العمليات: تؤدي الظروف الجوية المتطرفة والاضطرابات إلى تباين كبير بين السنوات في تدفقات الكربون وتغير مساهمات تدفقين رئيسيين للكربون.
و إلى إجمالي ميزانية الكربون. في الوقت نفسه، فإن التغيرات الهيدرولوجية المرتبطة بذوبان الجليد الدائم تجعل فهم تدرجات الرطوبة والواجهات الأرضية المائية أكثر أهمية لفهم ضوابط دورة الكربون. على هذا النحو، و التبادل بين النظم البيئية والغلاف الجوي لا يعكس الاستجابة الكاملة لفقدان الكربون من التربة المتجمدة؛ بل يجب أيضًا قياس تدفقات الكربون الجانبية. المعرفة الجديدة حول تأثيرات الأحداث المتطرفة مثل الجفاف في الشتاء والصيف، والحرائق، وتفشي الحشرات وتأثيراتها المركبة على دورة الكربون المستمدة من مواقع ميدانية طويلة الأمد أو تجارب محكومة تستهدف هذه الظروف المتطرفة، والقياسات في المناظر الطبيعية الجافة المرتفعة التي تعاني من نقص في البيانات والمناطق التي تشهد اضطرابات سريعة، مثل ذوبان التربة المتجمدة المفاجئ، هي أمور حاسمة. - الملاحظات والتركيبات: بينما تتزايد شبكة المواقع التي تحتوي على ملاحظات مستمرة بشكل مطرد وتزداد نطاقات التركيبات البيانية (من 30 إلى 200 موقع)، فإن اكتشاف النقاط الساخنة، واللحظات الساخنة، والاتجاهات طويلة الأمد في الموقع.
و تظل تدفقات الطاقة تحديًا. لذلك، يجب زيادة قدرة الشبكة الرصدية لدعم استمرارية قياسات التباين الدائري على المدى الطويل. و مواقع التدفق للمراقبة على مدار السنة وعلى المدى الطويل. يجب إنشاء مواقع جديدة في المناطق التي (أ) تفتقر حاليًا إلى البيانات، مثل روسيا وشمال وشرق كندا، و(ب) في المناطق التي تشهد اضطرابات. يمكن استخدام التدفقات المعتمدة على الغرف لسد الفجوات في بيانات شبكة التدفق في المواقع النائية، ولكنها تتطلب نمذجة لتوسيع التغطية الزمنية. تزداد توفر البيانات المستندة إلى الفضاء. و ستعالج بيانات الاستشعار عن بُعد بعض التحديات المتعلقة بالتغطية المكانية لشبكات المراقبة في الموقع، ولكن لا تزال هناك قيود في المناطق ذات العروض العالية. أخيرًا، هناك حاجة إلى جهود منسقة لتسهيل إنشاء بيانات معيارية وشاملة للأراضي والمياه. و مجموعات بيانات التدفق والملخصات لمنطقة التربة المتجمدة، تحسين قابلية المقارنة بين القياسات وتقليل زمن الاستجابة في جمع البيانات، وتحديد النقاط الحرجة
فجوات البيانات (من حيث المكان وأنواع النظم البيئية). ستساعد التحسينات الإضافية على البيانات البيئية مثل الكربون في التربة، والأنواع النباتية السائدة وخصائصها، وحالة ذوبان الجليد الدائم في وضع البيانات في سياقها وتوسيع نطاق بيانات التدفق.
3. النمذجة: الأنواع الثلاثة الواسعة من أساليب النمذجة – الترقية القائمة على الإحصاءات أو التعلم الآلي، نمذجة العمليات، وأساليب الانعكاس – جميعها ضرورية للتنبؤ بتدفقات الكربون في مجال التربة المتجمدة. تُعتبر نماذج العمليات التقنية الأكثر استخدامًا للتنبؤ بتدفقات الكربون، ولكن هناك قيود تتعلق بانبعاثات موسم البرد، والتغذية الراجعة بين النباتات والتربة تحت الأرض، وذوبان التربة المتجمدة، وتاريخ الاضطراب، بالإضافة إلى التقاط التأخيرات الزمنية، ونقاط التحول، والاستجابات غير الخطية. بالإضافة إلى ذلك، هناك حاجة إلى خرائط ديناميكية وذات دقة مكانية أعلى للمستنقعات، ورطوبة التربة، والاضطرابات لالتقاط المناظر الطبيعية المتجمدة التي تتغير بسرعة، على سبيل المثال، توزيع ذوبان التربة المتجمدة التدريجي والحاد. يمكن أن يسمح استخدام بيانات المراقبة لإبلاغ نماذج العمليات ونماذج الانعكاس من خلال تقنيات دمج البيانات بتقليل كبير في عدم اليقين في النماذج (Y. Luo & Schuur، 2020). مع توفر المزيد من منتجات البيانات الجغرافية المتعلقة بالتربة المتجمدة وقياس مواقع دراسات جديدة، تصبح المحاكاة والتحليلات الأفضل للعمليات الديناميكية التي تحرك التغيير في منطقة التربة المتجمدة ممكنة.
4. المقارنات بين النماذج والبيانات: من الضروري إجراء تقييمات منتظمة واستكشاف الكميات والاتجاهات والعوامل المرتبطة بتدفقات الكربون المستندة إلى النماذج لتحديد مجالات التوافق والاختلاف بين النماذج والقياسات الميدانية (Collier et al., 2018). يمكن أن يؤدي تحديد ما إذا كانت العمليات الرئيسية لمنطقة التربة المتجمدة التي حددتها الملاحظات مشمولة أو ممثلة بشكل كافٍ إلى تحسين كبير في أداء النماذج المستندة إلى العمليات (Koven et al., 2011)، كما هو الحال في تحديد مقاييس التقييم لتقييد التنبؤات (Schwalm et al., 2019). على وجه الخصوص، جديدة
بيان توافر البيانات
References
Alexandrov, G. A., Brovkin, V. A., & Kleinen, T. (2016). The influence of climate on peatland extent in Western Siberia since the last glacial maximum. Scientific Reports, 6(1), 24784. https://doi.org/10.1038/srep24784
Bartlett, K. B., & Harriss, R. C. (1993). Review and assessment of methane emissions from wetlands. Chemosphere, 26(1-4), 261-320. https://doi. org/10.1016/0045-6535(93)90427-7
Bastviken, D., Treat, C. C., Pangala, S. R., Gauci, V., Enrich-Prast, A., Karlson, M., et al. (2022). The importance of plants for methane emission at the ecosystem scale. Aquatic Botany, 184, 103596. https://doi.org/10.1016/j.aquabot.2022.103596
Basu, S., Lan, X., Dlugokencky, E., Michel, S., Schwietzke, S., Miller, J. B., et al. (2022). Estimating emissions of methane consistent with atmospheric measurements of methane and
Bellisario, L. M., Moore, T. R., & Bubier, J. L. (1998). Net ecosystem
Berner, L. T., Massey, R., Jantz, P., Forbes, B. C., Macias-Fauria, M., Myers-Smith, I., et al. (2020). Summer warming explains widespread but not uniform greening in the Arctic tundra biome. Nature Communications, 11(1), 4621. https://doi.org/10.1038/s41467-020-18479-5
Biskaborn, B. K., Smith, S. L., Noetzli, J., Matthes, H., Vieira, G., Streletskiy, D. A., et al. (2019). Permafrost is warming at a global scale. Nature Communications, 10(1), 1-11. https://doi.org/10.1038/s41467-018-08240-4
Blodau, C. (2002). Carbon cycling in peatlands- A review of processes and controls. Environmental Reviews, 10(2), 111-134. https://doi.org/10. 1139/a02-004
Bloom, A. A., Bowman, K. W., Lee, M., Turner, A. J., Schroeder, R., Worden, J. R., et al. (2017). A global wetland methane emissions and uncertainty dataset for atmospheric chemical transport models (WetCHARTs version 1.0). Geoscience Model Development, 10(6), 2141-2156. https://doi.org/10.5194/gmd-10-2141-2017
Bradshaw, C. J. A., & Warkentin, I. G. (2015). Global estimates of boreal forest carbon stocks and flux. Global and Planetary Change, 128, 24-30. https://doi.org/10.1016/j.gloplacha.2015.02.004
Braghiere, R. K., Fisher, J. B., Miner, K. R., Miller, C. E., Worden, J. R., Schimel, D. S., & Frankenberg, C. (2023). Tipping point in North American Arctic-Boreal carbon sink persists in new generation Earth system models despite reduced uncertainty. Environmental Research Letters, 18(2), 025008. https://doi.org/10.1088/1748-9326/acb226
Bridgham, S. D., Cadillo-Quiroz, H., Keller, J. K., & Zhuang, Q. (2013). Methane emissions from wetlands: Biogeochemical, microbial, and modeling perspectives from local to global scales. Global Change Biology, 19(5), 1325-1346. https://doi.org/10.1111/gcb. 12131
Brosius, L. S., Anthony, K. M. W., Treat, C. C., Lenz, J., Jones, M. C., Bret-Harte, M. S., & Grosse, G. (2021). Spatiotemporal patterns of northern lake formation since the Last Glacial Maximum. Quaternary Science Reviews, 253, 106773. https://doi.org/10.1016/j.quascirev.2020.106773
Brown, J., Ferrians Jr, O. J., Heginbottom, J. A., Melnikov, E. S., & (Cartographer). (1998). Circum-Arctic map of permafrost and ground-ice conditions, revised 2001. National Snow and Ice Data Center. https://doi.org/200021_215214
Bruhwiler, L., Basu, S., Butler, J. H., Chatterjee, A., Dlugokencky, E., Kenney, M. A., et al. (2021). Observations of greenhouse gases as climate indicators. Climatic Change, 165(1-2), 12. https://doi.org/10.1007/s10584-021-03001-7
Byrne, B., Baker, D. F., Basu, S., Bertolacci, M., Bowman, K. W., Carroll, D., et al. (2023). National CO2 budgets (2015-2020) inferred from atmospheric CO2 observations in support of the global stocktake. Earth System Science Data, 15(2), 963-1004. https://doi.org/10.5194/essd-15-963-2023
Canadell, J. G., Monteiro, P. M. S., Costa, M. H., Cotrim da Cunha, L., Cox, P. M., Eliseev, A. V., et al. (2021). Global carbon and other biogeochemical cycles and feedbacks. In V. Masson-Delmotte, P. Zhai, A. Pirani, S. L. Connors, C. Péan, S. Berger, et al. (Eds.), Climate change 2021: The physical science basis. Contribution of working group I to the sixth assessment report of the intergovernmental panel on climate change (pp. 673-816). Cambridge University Press.
Cassidy, A. E., Christen, A., & Henry, G. H. R. (2016). The effect of a permafrost disturbance on growing-season carbon-dioxide fluxes in a high Arctic tundra ecosystem. Biogeosciences, 13(8), 2291-2303. https://doi.org/10.5194/bg-13-2291-2016
Celis, G., Mauritz, M., Bracho, R., Salmon, V. G., Webb, E. E., Hutchings, J., et al. (2017). Tundra is a consistent source of CO2 at a site with progressive permafrost thaw during 6 years of chamber and eddy covariance measurements. Journal of Geophysical Research: Biogeosciences, 122(6), 1471-1485. https://doi.org/10.1002/2016JG003671
Chadburn, S. E., Burke, E., Essery, R., Boike, J., Langer, M., Heikenfeld, M., et al. (2015). An improved representation of physical permafrost dynamics in the JULES land-surface model. Geoscientific Model Development, 8(5), 1493-1508. https://doi.org/10.5194/gmd-8-1493-2015
Chapin, F. S., BretHarte, M. S., Hobbie, S. E., & Zhong, H. L. (1996). Plant functional types as predictors of transient responses of arctic vegetation to global change. Journal of Vegetation Science, 7(3), 347-358. https://doi.org/10.2307/3236278
Chapin, F. S., McGuire, A. D., Randerson, J., Pielke, R., Baldocchi, D., Hobbie, S. E., et al. (2000). Arctic and boreal ecosystems of western North America as components of the climate system. Global Change Biology, 6(S1), 211-223. https://doi.org/10.1046/j.1365-2486.2000.06022.x
Chasmer, L., Cobbaert, D., Mahoney, C., Millard, K., Peters, D., Devito, K., et al. (2020). Remote sensing of boreal wetlands 1: Data use for policy and management. Remote Sensing, 12(8), 1320. https://doi.org/10.3390/rs12081320
Chaudhary, N., Westermann, S., Lamba, S., Shurpali, N., Sannel, A. B. K., Schurgers, G., et al. (2020). Modelling past and future peatland carbon dynamics across the pan-Arctic. Global Change Biology, 26(7), 4119-4133. https://doi.org/10.1111/gcb.15099
Christensen, T. R., Panikov, N., Mastepanov, M., Joabsson, A., Stewart, A., Oquist, M., et al. (2003). Biotic controls on CO2 and CH4 exchange in wetlands: A closed environment study. Biogeochemistry, 64(3), 337-354. https://doi.org/10.1023/a:1024913730848
Christensen, T. R., Rysgaard, S., Bendtsen, J., Else, B., Glud, R. N., Van Huissteden, J., et al. (2017). Arctic carbon cycling. In C. AMAP (Ed.), Snow, water, ice and permafrost in the Arctic (SWIPA) (pp. 203-218). Arctic Monitoring and Assessment Programme (AMAP).
Ciais, P., Bastos, A., Chevallier, F., Lauerwald, R., Poulter, B., Canadell, J. G., et al. (2022). Definitions and methods to estimate regional land carbon fluxes for the second phase of the regional carbon cycle assessment and processes project (RECCAP-2). Geoscientific Model Development, 15(3), 1289-1316. https://doi.org/10.5194/gmd-15-1289-2022
Clein, J. S., & Schimel, J. P. (1995). Microbial activity of tundra and taiga soils at subzero temperatures. Soil Biology & Biochemistry, 27(9), 1231-1234. https://doi.org/10.1016/0038-0717(95)00044-f
Collier, N., Hoffman, F. M., Lawrence, D. M., Keppel-Aleks, G., Koven, C. D., Riley, W. J., et al. (2018). The international land model benchmarking (ILAMB) system: Design, theory, and implementation. Journal of Advances in Modeling Earth Systems, 10(11), 2731-2754. https://doi.org/10.1029/2018MS001354
Commane, R., Lindaas, J., Benmergui, J., Luus, K. A., Chang, R. Y.-W., Daube, B. C., et al. (2017). Carbon dioxide sources from Alaska driven by increasing early winter respiration from Arctic tundra. Proceedings of the National Academy of Sciences, 114(21), 5361-5366. https://doi.org/ 10.1073/pnas. 1618567114
Delwiche, K. B., Knox, S. H., Malhotra, A., Fluet-Chouinard, E., McNicol, G., Feron, S., et al. (2021). FLUXNET-CH4: A global, multiecosystem dataset and analysis of methane seasonality from freshwater wetlands. Earth System Science Data, 13(7), 3607-3689. https:// doi.org/10.5194/essd-13-3607-2021
Ekici, A., Beer, C., Hagemann, S., Boike, J., Langer, M., & Hauck, C. (2014). Simulating high-latitude permafrost regions by the JSBACH terrestrial ecosystem model. Geoscientific Model Development, 7(2), 631-647. https://doi.org/10.5194/gmd-7-631-2014
Elder, C. D., Thompson, D. R., Thorpe, A. K., Chandanpurkar, H. A., Hanke, P. J., Hasson, N., et al. (2021). Characterizing methane emission hotspots from thawing permafrost. Global Biogeochemical Cycles, 35(12), e2020GB006922. https://doi.org/10.1029/2020GB006922
Estop-Aragonés, C., Olefeldt, D., Abbott, B. W., Chanton, J. P., Czimczik, C. I., Dean, J. F., et al. (2020). Assessing the potential for mobilization of old soil carbon after permafrost thaw: A synthesis of 14C measurements from the northern permafrost region. Global Biogeochemical Cycles, 34(9), e2020GB006672. https://doi.org/10.1029/2020GB006672
Euskirchen, E. S., Edgar, C. W., Syndonia, B. H. M., Kade, A., Zimov, N., & Zimov, S. (2017). Interannual and seasonal patterns of carbon dioxide, water, and energy fluxes from ecotonal and thermokarst-impacted ecosystems on carbon-rich permafrost soils in Northeastern Siberia. Journal of Geophysical Research: Biogeosciences, 122(10), 2651-2668. https://doi.org/10.1002/2017JG004070
Euskirchen, E. S., Edgar, C. W., Turetsky, M. R., Waldrop, M. P., & Harden, J. W. (2014). Differential response of carbon fluxes to climate in three peatland ecosystems that vary in the presence and stability of permafrost. Journal of Geophysical Research: Biogeosciences, 119(8), 1576-1595. https://doi.org/10.1002/2014JG002683
Eyring, V., Bony, S., Meehl, G. A., Senior, C. A., Stevens, B., Stouffer, R. J., & Taylor, K. E. (2016). Overview of the coupled model intercomparison project phase 6 (CMIP6) experimental design and organization. Geoscientific Model Development, 9(5), 1937-1958. https://doi. org/10.5194/gmd-9-1937-2016
Fan, L., Wigneron, J. P., Ciais, P., Chave, J., Brandt, M., Sitch, S., et al. (2023). Siberian carbon sink reduced by forest disturbances. Nature Geoscience, 16(1), 56-62. https://doi.org/10.1038/s41561-022-01087-x
Farquharson, L. M., Romanovsky, V. E., Kholodov, A., & Nicolsky, D. (2022). Sub-aerial talik formation observed across the discontinuous permafrost zone of Alaska. Nature Geoscience, 15(6), 475-481. https://doi.org/10.1038/s41561-022-00952-z
Fewster, R. E., Morris, P. J., Ivanovic, R. F., Swindles, G. T., Peregon, A. M., & Smith, C. J. (2022). Imminent loss of climate space for permafrost peatlands in Europe and Western Siberia. Nature Climate Change, 12(4), 373-379. https://doi.org/10.1038/s41558-022-01296-7
Fisher, J. B., Hayes, D. J., Schwalm, C. R., Huntzinger, D. N., Stofferahn, E., Schaefer, K., et al. (2018). Missing pieces to modeling the ArcticBoreal puzzle. Environmental Research Letters, 13(2), 020202. https://doi.org/10.1088/1748-9326/aa9d9a
Fisher, J. B., Huntzinger, D. N., Schwalm, C. R., & Sitch, S. (2014). Modeling the terrestrial biosphere. Annual Review of Environment and Resources, 39(1), 91-123. https://doi.org/10.1146/annurev-environ-012913-093456
Foster, A. C., Wang, J. A., Frost, G. V., Davidson, S. J., Hoy, E., Turner, K. W., et al. (2022). Disturbances in North American boreal forest and arctic tundra: Impacts, interactions, and responses. Environmental Research Letters, 17(11), 113001. https://doi.org/10.1088/1748-9326/ ac98d7
Friedlingstein, P., Jones, M. W., O’Sullivan, M., Andrew, R. M., Bakker, D. C. E., Hauck, J., et al. (2022). Global Carbon Budget 2021. Earth System Science Data, 14(4), 1917-2005. https://doi.org/10.5194/essd-14-1917-2022
Friedrich, D., Hirnsperger, M., & Bauer, S. (Eds.) (2022). More than “nature, Research on infrastructure and Settlements in the North. LIT Verlag.
Frieler, K., Lange, S., Piontek, F., Reyer, C. P. O., Schewe, J., Warszawski, L., et al. (2017). Assessing the impacts of
Frolking, S., & Roulet, N. T. (2007). Holocene radiative forcing impact of northern peatland carbon accumulation and methane emissions. Global Change Biology, 13(5), 1079-1088. https://doi.org/10.1111/j.1365-2486.2007.01339.x
Frolking, S., Talbot, J., Jones, M. C., Treat, C. C., Kauffman, J. B., Tuittila, E.-S., & Roulet, N. (2011). Peatlands in the Earth’s 21st century climate systems. Environmental Reviews, 19(NA), 371-396. https://doi.org/10.1139/A11-014
Galera, L. d. A., Eckhardt, T., Beer, C., Pfeiffer, E.-M., & Knoblauch, C. (2023). Ratio of in situ CO2 to CH4 production and its environmental controls in polygonal tundra soils of Samoylov Island, Northeastern Siberia. Journal of Geophysical Research: Biogeosciences, 128(4), e2022JG006956. https://doi.org/10.1029/2022JG006956
Gorham, E., Lehman, C., Dyke, A., Janssens, J., & Dyke, L. (2007). Temporal and spatial aspects of peatland initiation following deglaciation in North America. Quaternary Science Reviews, 26(3-4), 300-311. https://doi.org/10.1016/j.quascirev.2006.08.008
Groendahl, L., Friborg, T., & Soegaard, H. (2007). Temperature and snow-melt controls on interannual variability in carbon exchange in the high Arctic. Theoretical and Applied Climatology, 88(1), 111-125. https://doi.org/10.1007/s00704-005-0228-y
Gruber, S. (2012). Derivation and analysis of a high-resolution estimate of global permafrost zonation. The Cryosphere, 6(1), 221-233. https://doi. org/10.5194/tc-6-221-2012
Gulev, S. K., Thorne, P. W., Ahn, J., Dentener, F. J., Domingues, C. M., Gerland, S., et al. (2021). Changing state of the climate system. In V. Masson-Delmotte, P. Zhai, A. Pirani, S. L. Connors, C. Péan, S. Berger, et al. (Eds.), Climate change 2021: The physical science basis. Contribution of working group I to the sixth assessment report of the intergovernmental panel on climate change (pp. 287-422). Cambridge University Press.
Harden, J. W., Koven, C. D., Ping, C.-L., Hugelius, G., McGuire, A. D., Camill, P., et al. (2012). Field information links permafrost carbon to physical vulnerabilities of thawing. Geophysical Research Letters, 39(15), L15704. https://doi.org/10.1029/2012gl051958
Harden, J. W., Manies, K. L., Turetsky, M. R., & Neff, J. C. (2006). Effects of wildfire and permafrost on soil organic matter and soil climate in interior Alaska. Global Change Biology, 12(12), 2391-2403. https://doi.org/10.1111/j.1365-2486.2006.01255.x
Harden, J. W., Sundquist, E. T., Stallard, R. F., & Mark, R. K. (1992). Dynamics of soil carbon during deglaciation of the Laurentide ice-sheet. Science, 258(5090), 1921-1924. https://doi.org/10.1126/science.258.5090.1921
Harris, S. A., French, H. M., Heginbottom, J. A., Johnston, G. H., Ladanyi, B., Sego, D. C., & Van Everdingen, R. O. (1988). Glossary of permafrost and related ground-ice terms (Technical Memorandum No. 142). Retrieved from Ottawa.
Hartley, I. P., Garnett, M. H., Sommerkorn, M., Hopkins, D. W., Fletcher, B. J., Sloan, V. L., et al. (2012). A potential loss of carbon associated with greater plant growth in the European Arctic. Nature Climate Change, 2(12), 875-879. https://doi.org/10.1038/nclimate1575
Hashemi, J., Zona, D., Arndt, K. A., Kalhori, A., & Oechel, W. C. (2021). Seasonality buffers carbon budget variability across heterogeneous landscapes in Alaskan Arctic tundra. Environmental Research Letters, 16(3), 035008. https://doi.org/10.1088/1748-9326/abe2d1
Hayes, D. J., Butman, D. E., Domke, G. M., Fisher, J. B., Neigh, C. S. R., & Welp, L. R. (2022). Chapter 6 – boreal forests. In B. Poulter, J. G. Canadell, D. J. Hayes, & R. L. Thompson (Eds.), Balancing greenhouse gas budgets (pp. 203-236). Elsevier. https://doi.org/10.1016/b978-0-12-814952-2.00025-3
Heijmans, M. M. P. D., Magnússon, R. Í., Lara, M. J., Frost, G. V., Myers-Smith, I. H., Van Huissteden, J., et al. (2022). Tundra vegetation change and impacts on permafrost. Nature Reviews Earth & Environment, 3(1), 68-84. https://doi.org/10.1038/s43017-021-00233-0
Helbig, M., Chasmer, L. E., Kljun, N., Quinton, W. L., Treat, C. C., & Sonnentag, O. (2017). The positive net radiative greenhouse gas forcing of increasing methane emissions from a thawing boreal forest-wetland landscape. Global Change Biology, 23(6), 2413-2427. https://doi.org/10. 1111/gcb. 13520
Hengl, T., Mendes de Jesus, J., Heuvelink, G. B. M., Ruiperez Gonzalez, M., Kilibarda, M., Blagotić, A., et al. (2017). SoilGrids250m: Global gridded soil information based on machine learning. Plos One, 12(2), e0169748. https://doi.org/10.1371/journal.pone. 0169748
Hewitt, R. E., Taylor, D. L., Genet, H., McGuire, A. D., & Mack, M. C. (2019). Below-ground plant traits influence tundra plant acquisition of newly thawed permafrost nitrogen. Journal of Ecology, 107(2), 950-962. https://doi.org/10.1111/1365-2745.13062
Hirst, C., Monhonval, A., Mauclet, E., Thomas, M., Villani, M., Ledman, J., et al. (2023). Evidence for late winter biogeochemical connectivity in permafrost soils. Communications Earth & Environment, 4(1), 85. https://doi.org/10.1038/s43247-023-00740-6
Hiyama, T., Ueyama, M., Kotani, A., Iwata, H., Nakai, T., Okamura, M., et al. (2021). Lessons learned from more than a decade of greenhouse gas flux measurements at boreal forests in eastern Siberia and interior Alaska. Polar Science, 27, 100607. https://doi.org/10.1016/j.polar.2020. 100607
Holloway, J. E., Lewkowicz, A. G., Douglas, T. A., Li, X., Turetsky, M. R., Baltzer, J. L., & Jin, H. (2020). Impact of wildfire on permafrost landscapes: A review of recent advances and future prospects. Permafrost and Periglacial Processes, 31(3), 371-382. https://doi.org/10.1002/ ppp. 2048
Hugelius, G., Bockheim, J. G., Camill, P., Elberling, B., Grosse, G., Harden, J. W., et al. (2013). A new data set for estimating organic carbon storage to 3 m depth in soils of the northern circumpolar permafrost region. Earth System Science Data, 5(2), 393-402. https://doi.org/10.5194/ essd-5-393-2013
Hugelius, G., Loisel, J., Chadburn, S., Jackson, R. B., Jones, M., MacDonald, G., et al. (2020). Large stocks of peatland carbon and nitrogen are vulnerable to permafrost thaw. Proceedings of the National Academy of Sciences, 117(34), 20438-20446. https://doi.org/10.1073/pnas. 1916387117
Hugelius, G., Ramage, J. L., Burke, E. J., Chatterjee, A., Smallman, T. L., Aalto, T., et al. (2023). Two decades of permafrost region CO2, CH4, and N 2 O budgets suggest a small net greenhouse gas source to the atmosphere. ESS Open Archive. https://doi.org/10.22541/essoar.169444320. 01914726/v1
Hugelius, G., Strauss, J., Zubrzycki, S., Harden, J. W., Schuur, E. A. G., Ping, C. L., et al. (2014). Estimated stocks of circumpolar permafrost carbon with quantified uncertainty ranges and identified data gaps. Biogeosciences, 11(23), 6573-6593. https://doi.org/10.5194/bg-11-65732014
Huntzinger, D. N., Schaefer, K., Schwalm, C., Fisher, J. B., Hayes, D., Stofferahn, E., et al. (2020). Evaluation of simulated soil carbon dynamics in Arctic-Boreal ecosystems. Environmental Research Letters, 15(2), 025005. https://doi.org/10.1088/1748-9326/ab6784
IPCC. (2021). In J. M. Gutiérrez & A. M. Tréguier (Eds.), Annex II: Models In V. Masson-delmotte, P. Zhai, A. Pirani, S. L. Connors, C. Péan, S. Berger, N. Caud, Y. Chen, L. Goldfarb, M. I. Gomis, M. Huang, K. Leitzell, E. Lonnoy, J. B. R. Matthews, T. K. Maycock, T. Waterfield, O. Yelekçi, R. Yu, & B. Zhou (Eds.), climate change 2021: The physical science basis. Contribution of working group I to the sixth assessment report of the intergovernmental panel on climate change (pp. 2087-2138). Cambridge University Press.
Ito, A., Li, T., Qin, Z., Melton, J. R., Tian, H., Kleinen, T., et al. (2023). Cold-season methane fluxes simulated by GCP-CH4 Models. Geophysical Research Letters, 50(14), e2023GL103037. https://doi.org/10.1029/2023GL103037
Jones, M. C., Grosse, G., Treat, C., Turetsky, M., Anthony, K. W., & Brosius, L. (2023). Past permafrost dynamics can inform future permafrost carbon-climate feedbacks. Communications Earth & Environment, 4(1), 272. https://doi.org/10.1038/s43247-023-00886-3
Jones, M. C., Harden, J., O’Donnell, J., Manies, K., Jorgenson, T., Treat, C., & Ewing, S. (2017). Rapid carbon loss and slow recovery following permafrost thaw in boreal peatlands. Global Change Biology, 23(3), 1109-1127. https://doi.org/10.1111/gcb. 13403
Jones, M. W., Abatzoglou, J. T., Veraverbeke, S., Andela, N., Lasslop, G., Forkel, M., et al. (2022). Global and regional trends and drivers of fire under climate change. Reviews of Geophysics, 60(3), e2020RG000726. https://doi.org/10.1029/2020RG000726
Jorgensen, C. J., Johansen, K. M. L., Westergaard-Nielsen, A., & Elberling, B. (2015). Net regional methane sink in high arctic soils of northeast Greenland. Nature Geoscience, 8(1), 20-23. https://doi.org/10.1038/ngeo2305
Jorgenson, M. T., & Osterkamp, T. E. (2005). Response of boreal ecosystems to varying modes of permafrost degradation. Canadian Journal of Forest Research-Revue Canadienne De Recherche Forestiere, 35(9), 2100-2111. https://doi.org/10.1139/X05-153
Jorgenson, M. T., Shur, Y. L., & Pullman, E. R. (2006). Abrupt increase in permafrost degradation in Arctic Alaska. Geophysical Research Letters, 33(2), L02503. https://doi.org/10.1029/2005GL024960
Jung, M., Schwalm, C., Migliavacca, M., Walther, S., Camps-Valls, G., Koirala, S., et al. (2020). Scaling carbon fluxes from eddy covariance sites to globe: Synthesis and evaluation of the FLUXCOM approach. Biogeosciences, 17(5), 1343-1365. https://doi.org/10.5194/bg-17-1343-2020
Karesdotter, E., Destouni, G., Ghajarnia, N., Hugelius, G., & Kalantari, Z. (2021). Mapping the vulnerability of Arctic wetlands to global warming. Earths Future, 9(5). https://doi.org/10.1029/2020ef001858
Keuper, F., Wild, B., Kummu, M., Beer, C., Blume-Werry, G., Fontaine, S., et al. (2020). Carbon loss from northern circumpolar permafrost soils amplified by rhizosphere priming. Nature Geoscience, 13(8), 560-565. https://doi.org/10.1038/s41561-020-0607-0
Kicklighter, D. W., Hayes, D. J., McClelland, J. W., Peterson, B. J., McGuire, A. D., & Melillo, J. M. (2013). Insights and issues with simulating terrestrial DOC loading of Arctic river networks. Ecological Applications, 23(8), 1817-1836. https://doi.org/10.1890/11-1050.1
Kim, J., Kim, Y., Zona, D., Oechel, W., Park, S.-J., Lee, B.-Y., et al. (2021). Carbon response of tundra ecosystems to advancing greenup and snowmelt in Alaska. Nature Communications, 12(1), 6879. https://doi.org/10.1038/s41467-021-26876-7
Kim, Y., Kimball, J. S., Zhang, K., & McDonald, K. C. (2012). Satellite detection of increasing Northern Hemisphere non-frozen seasons from 1979 to 2008: Implications for regional vegetation growth. Remote Sensing of Environment, 121, 472-487. https://doi.org/10.1016/j.rse.2012. 02.014
Kleber, G. E., Hodson, A. J., Magerl, L., Mannerfelt, E. S., Bradbury, H. J., Zhu, Y. Z., et al. (2023). Groundwater springs formed during glacial retreat are a large source of methane in the high Arctic. Nature Geoscience, 16(7), 597-604. https://doi.org/10.1038/s41561-023-01210-6
Klotz, L. A., Sonnentag, O., Wang, Z., Wang, J. A., & Kang, M. (2023). Oil and natural gas wells across the NASA ABoVE domain: Fugitive methane emissions and broader environmental impacts. Environmental Research Letters, 18(3), 035008. https://doi.org/10.1088/1748-9326/ acbe52
Knox, S. H., Jackson, R. B., Poulter, B., McNicol, G., Fluet-Chouinard, E., Zhang, Z., et al. (2019). FLUXNET-CH4 synthesis activity: Objectives, observations, and future directions. Bulletin of the American Meteorological Society, 100(12), 2607-2632. https://doi.org/10.1175/ bams-d-18-0268.1
Kohnert, K., Serafimovich, A., Metzger, S., Hartmann, J., & Sachs, T. (2017). Strong geologic methane emissions from discontinuous terrestrial permafrost in the Mackenzie Delta, Canada. Scientific Reports, 7(1), 5828. https://doi.org/10.1038/s41598-017-05783-2
Koven, C. D., Ringeval, B., Friedlingstein, P., Ciais, P., Cadule, P., Khvorostyanov, D., et al. (2011). Permafrost carbon-climate feedbacks accelerate global warming. Proceedings of the National Academy of Sciences, 108(36), 14769-14774. https://doi.org/10.1073/pnas. 1103910108
Kuhn, M. A., Varner, R., Bastviken, D., Crill, P., MacIntyre, S., Turetsky, M. R., et al. (2021a). BAWLD-CH4: Methane fluxes from boreal and arctic ecosystems [Dataset]. Arctic Data Center. https://doi.org/10.18739/A2DN3ZX1R
Kuhn, M. A., Varner, R. K., Bastviken, D., Crill, P., MacIntyre, S., Turetsky, M., et al. (2021b). BAWLD-CH4: A comprehensive dataset of methane fluxes from boreal and arctic ecosystems. Earth System Science Data, 13(11), 5151-5189. https://doi.org/10.5194/essd-13-5151-2021
Lai, D. Y. F. (2009). Methane dynamics in northern peatlands: A review. Pedosphere, 19(4), 409-421. https://doi.org/10.1016/S1002-0160(09) 00003-4
Lambert, M. S. A., Tang, H., Aas, K. S., Stordal, F., Fisher, R. A., Fang, Y., et al. (2022). Inclusion of a cold hardening scheme to represent frost tolerance is essential to model realistic plant hydraulics in the Arctic-boreal zone in CLM5.0-FATES-Hydro. Geoscientific Model Development, 15(23), 8809-8829. https://doi.org/10.5194/gmd-15-8809-2022
Lange, S. (2019). Trend-preserving bias adjustment and statistical downscaling with ISIMIP3BASD (v1.0). Geoscientific Model Development, 12(7), 3055-3070. https://doi.org/10.5194/gmd-12-3055-2019
Lawrence, D. M., Slater, A. G., & Swenson, S. C. (2012). Simulation of present-day and future permafrost and seasonally frozen ground conditions in CCSM4. Journal of Climate, 25(7), 2207-2225. https://doi.org/10.1175/jcli-d-11-00334.1
Le Mer, J., & Roger, P. (2001). Production, oxidation, emission and consumption of methane by soils: A review. European Journal of Soil Biology, 37(1), 25-50. https://doi.org/10.1016/S1164-5563(01)01067-6
Li, X.-Y., Jin, H.-J., Wang, H.-W., Marchenko, S. S., Shan, W., Luo, D.-L., et al. (2021). Influences of forest fires on the permafrost environment: A review. Advances in Climate Change Research, 12(1), 48-65. https://doi.org/10.1016/j.accre.2021.01.001
Li, Z.-L., Mu, C.-C., Chen, X., Wang, X.-Y., Dong, W.-W., Jia, L., et al. (2021). Changes in net ecosystem exchange of CO2 in Arctic and their relationships with climate change during 2002-2017. Advances in Climate Change Research, 12(4), 475-481. https://doi.org/10.1016/j.accre. 2021.06.004
Liu, C. X., Huang, H. B., & Sun, F. D. (2021). A pixel-based vegetation greenness trend analysis over the Russian tundra with all available landsat data from 1984 to 2018. Remote Sensing, 13(23), 15. https://doi.org/10.3390/rs13234933
Liu, Z., Kimball, J. S., Ballantyne, A. P., Parazoo, N. C., Wang, W. J., Bastos, A., et al. (2022). Respiratory loss during late-growing season determines the net carbon dioxide sink in northern permafrost regions. Nature Communications, 13(1), 5626. https://doi.org/10.1038/s41467-022-33293-х
López-Blanco, E., Exbrayat, J. F., Lund, M., Christensen, T. R., Tamstorf, M. P., Slevin, D., et al. (2019). Evaluation of terrestrial pan-Arctic carbon cycling using a data-assimilation system. Earth System Dynamics, 10(2), 233-255. https://doi.org/10.5194/esd-10-233-2019
Lund, M., Lafleur, P. M., Roulet, N. T., Lindroth, A., Christensen, T. R., Aurela, M., et al. (2010). Variability in exchange of CO2 across 12 northern peatland and tundra sites. Global Change Biology, 16(9), 2436-2448. https://doi.org/10.1111/j.1365-2486.2009.02104.x
Lund, M., Raundrup, K., Westergaard-Nielsen, A., López-Blanco, E., Nymand, J., & Aastrup, P. (2017). Larval outbreaks in West Greenland: Instant and subsequent effects on tundra ecosystem productivity and CO2 exchange. Ambio, 46(1), 26-38. https://doi.org/10.1007/s13280-016-0863-9
Luo, Y., & Schuur, E. A. G. (2020). Model parameterization to represent processes at unresolved scales and changing properties of evolving systems. Global Change Biology, 26(3), 1109-1117. https://doi.org/10.1111/gcb. 14939
Luo, Y. Q., Randerson, J. T., Abramowitz, G., Bacour, C., Blyth, E., Carvalhais, N., et al. (2012). A framework for benchmarking land models. Biogeosciences, 9(10), 3857-3874. https://doi.org/10.5194/bg-9-3857-2012
Lyu, Z., Genet, H., He, Y. J., Zhuang, Q. L., McGuire, A. D., Bennett, A., et al. (2018). The role of environmental driving factors in historical and projected carbon dynamics of wetland ecosystems in Alaska. Ecological Applications, 28(6), 1377-1395. https://doi.org/10.1002/eap.1755
Mack, M. C., Walker, X. J., Johnstone, J. F., Alexander, H. D., Melvin, A. M., Jean, M., & Miller, S. N. (2021). Carbon loss from boreal forest wildfires offset by increased dominance of deciduous trees. Science, 372(6539), 280-283. https://doi.org/10.1126/science.abf3903
Malhotra, A., Todd-Brown, K., Nave, L. E., Batjes, N. H., Holmquist, J. R., Hoyt, A. M., et al. (2019). The landscape of soil carbon data: Emerging questions, synergies and databases. Progress in Physical Geography: Earth and Environment, 43(5), 707-719. https://doi.org/10.1177/ 0309133319873309
Matthews, E., & Fung, I. (1987). Methane emission from natural wetlands: Global distribution, area, and environmental characteristics of sources. Global Biogeochemical Cycles, 1(1), 61-86. https://doi.org/10.1029/GB001i001p00061
McGuire, A. D., Anderson, L. G., Christensen, T. R., Dallimore, S., Guo, L. D., Hayes, D. J., et al. (2009). Sensitivity of the carbon cycle in the Arctic to climate change. Ecological Monographs, 79(4), 523-555. https://doi.org/10.1890/08-2025.1
McGuire, A. D., Christensen, T. R., Hayes, D., Heroult, A., Euskirchen, E., Kimball, J. S., et al. (2012). An assessment of the carbon balance of Arctic tundra: Comparisons among observations, process models, and atmospheric inversions. Biogeosciences, 9(8), 3185-3204. https://doi. org/10.5194/bg-9-3185-2012
McGuire, A. D., Genet, H., Lyu, Z., Pastick, N., Stackpoole, S., Birdsey, R., et al. (2018a). Assessing historical and projected carbon balance of Alaska: A synthesis of results and policy/management implications. Ecological Applications, 28(6), 1396-1412. https://doi.org/10.1002/eap. 1768
McGuire, A. D., Koven, C., Lawrence, D. M., Clein, J. S., Xia, J., Beer, C., et al. (2016). Variability in the sensitivity among model simulations of permafrost and carbon dynamics in the permafrost region between 1960 and 2009. Global Biogeochemical Cycles, 30(7), 1015-1037. https:// doi.org/10.1002/2016GB005405
McGuire, A. D., Lawrence, D. M., Koven, C., Clein, J. S., Burke, E., Chen, G., et al. (2018b). Dependence of the evolution of carbon dynamics in the northern permafrost region on the trajectory of climate change. Proceedings of the National Academy of Sciences, 115(15), 3882-3887. https://doi.org/10.1073/pnas. 1719903115
McNicol, G., Fluet-Chouinard, E., Ouyang, Z., Knox, S., Zhang, Z., Aalto, T., et al. (2023). Upscaling wetland methane emissions from the FLUXNET-CH4 Eddy covariance network (UpCH4 v1.0): Model development, network assessment, and budget comparison. AGU Advances, 4(5), e2023AV000956. https://doi.org/10.1029/2023AV000956
Mekonnen, Z. A., Riley, W. J., Berner, L. T., Bouskill, N. J., Torn, M. S., Iwahana, G., et al. (2021). Arctic tundra shrubification: A review of mechanisms and impacts on ecosystem carbon balance. Environmental Research Letters, 16(5), 28. https://doi.org/10.1088/1748-9326/abf28b
Meredith, M., Sommerkorn, M., Cassotta, S., Derksen, C., Ekaykin, A., Hollowed, A. B., et al. (2019). Polar regions. Cambridge.
Miller, S. M., Miller, C. E., Commane, R., Chang, R. Y. W., Dinardo, S. J., Henderson, J. M., et al. (2016). A multiyear estimate of methane fluxes in Alaska from CARVE atmospheric observations. Global Biogeochemical Cycles, 30(10), 1441-1453. https://doi.org/10.1002/ 2016GB005419
Miner, K. R., Turetsky, M. R., Malina, E., Bartsch, A., Tamminen, J., McGuire, A. D., et al. (2022). Permafrost carbon emissions in a changing Arctic. Nature Reviews Earth & Environment, 3(1), 55-67. https://doi.org/10.1038/s43017-021-00230-3
Mishra, U., Hugelius, G., Shelef, E., Yang, Y., Strauss, J., Lupachev, A., et al. (2021). Spatial heterogeneity and environmental predictors of permafrost region soil organic carbon stocks. Science Advances, 7(9), eaaz5236. https://doi.org/10.1126/sciadv.aaz5236
Myers-Smith, I. H., Kerby, J. T., Phoenix, G. K., Bjerke, J. W., Epstein, H. E., Assmann, J. J., et al. (2020). Complexity revealed in the greening of the Arctic. Nature Climate Change, 10(2), 106-117. https://doi.org/10.1038/s41558-019-0688-1
Natali, S. M., Bronen, R., Cochran, P., Holdren, J. P., Rogers, B. M., & Treharne, R. (2022). Incorporating permafrost into climate mitigation and adaptation policy. Environmental Research Letters, 17(9), 091001. https://doi.org/10.1088/1748-9326/ac8c5a
Natali, S. M., Watts, J. D., Rogers, B. M., Potter, S., Ludwig, S. M., Selbmann, A.-K., et al. (2019). Large loss of CO2 in winter observed across the northern permafrost region. Nature Climate Change, 9(11), 852-857. https://doi.org/10.1038/s41558-019-0592-8
Nicolsky, D. J., Romanovsky, V. E., Alexeev, V. A., & Lawrence, D. M. (2007). Improved modeling of permafrost dynamics in a GCM landsurface scheme. Geophysical Research Letters, 34(8). https://doi.org/10.1029/2007gl029525
Nilsson, M., Mikkela, C., Sundh, I., Granberg, G., Svensson, B. H., & Ranneby, B. (2001). Methane emission from Swedish mires: National and regional budgets and dependence on mire vegetation. Journal of Geophysical Research, 106(D18), 20847-20860. https://doi.org/10.1029/ 2001jd900119
Nitze, I., Grosse, G., Jones, B. M., Romanovsky, V. E., & Boike, J. (2018). Remote sensing quantifies widespread abundance of permafrost region disturbances across the Arctic and Subarctic. Nature Communications, 9(1), 5423. https://doi.org/10.1038/s41467-018-07663-3
Obu, J. (2021). How much of the Earth’s surface is underlain by permafrost? Journal of Geophysical Research: Earth Surface, 126(5), e2021JF006123. https://doi.org/10.1029/2021JF006123
Obu, J., Westermann, S., Bartsch, A., Berdnikov, N., Christiansen, H. H., Dashtseren, A., et al. (2019). Northern Hemisphere permafrost map based on TTOP modelling for 2000-2016 at 1 km 2 scale. Earth-Science Reviews, 193, 299-316. https://doi.org/10.1016/j.earscirev.2019. 04.023
Olefeldt, D., Euskirchen, E. S., Harden, J., Kane, E., McGuire, A. D., Waldrop, M. P., & Turetsky, M. R. (2017). A decade of boreal rich fen greenhouse gas fluxes in response to natural and experimental water table variability. Global Change Biology, 23(6), 2428-2440. https://doi. org/10.1111/gcb. 13612
Olefeldt, D., Goswami, S., Grosse, G., Hayes, D., Hugelius, G., Kuhry, P., et al. (2016). Circumpolar distribution and carbon storage of thermokarst landscapes. Nature Communications, 7(1), 13043. https://doi.org/10.1038/ncomms13043
Olefeldt, D., Hovemyr, M., Kuhn, M. A., Bastviken, D., Bohn, T. J., Connolly, J., et al. (2021). The boreal-Arctic wetland and lake dataset (BAWLD). Earth System Science Data, 13(11), 5127-5149. https://doi.org/10.5194/essd-13-5127-2021
Olefeldt, D., Roulet, N. T., Bergeron, O., Crill, P., B%ockstrand, K., & Christensen, T. R. (2012). Net carbon accumulation of a high-latitude permafrost palsa mire similar to permafrost-free peatlands. Geophysics Research Letter, 39(3), L03501. https://doi.org/10.1029/2011gl050355
Olefeldt, D., Turetsky, M. R., Crill, P. M., & McGuire, A. D. (2013). Environmental and physical controls on northern terrestrial methane emissions across permafrost zones. Global Change Biology, 19(2), 589-603. https://doi.org/10.1111/gcb. 12071
O’Neill, H. B., Wolfe, S. A., & Duchesne, C. (2019). New ground ice maps for Canada using a paleogeographic modelling approach. The Cryosphere, 13(3), 753-773. https://doi.org/10.5194/tc-13-753-2019
Öquist, M. G., Sparrman, T., Klemedtsson, L., Drotz, S. H., Grip, H., Schleucher, J., & Nilsson, M. (2009). Water availability controls microbial temperature responses in frozen soil CO2 production. Global Change Biology, 15(11), 2715-2722. https://doi.org/10.1111/j.1365-2486.2009. 01898.x
Outcalt, S. I., Nelson, F. E., & Hinkel, K. M. (1990). The zero-curtain effect: Heat and mass transfer across an isothermal region in freezing soil. Water Resources Research, 26(7), 1509-1516. https://doi.org/10.1029/WR026i007p01509
Overduin, P. P., Schneider von Deimling, T., Miesner, F., Grigoriev, M. N., Ruppel, C., Vasiliev, A., et al. (2019). Submarine permafrost map in the Arctic modeled using 1-D transient heat flux (SuPerMAP). Journal of Geophysical Research: Oceans, 124(6), 3490-3507. https://doi.org/ 10.1029/2018JC014675
Pallandt, M. M. T. A., Kumar, J., Mauritz, M., Schuur, E. A. G., Virkkala, A. M., Celis, G., et al. (2022). Representativeness assessment of the panArctic eddy covariance site network and optimized future enhancements. Biogeosciences, 19(3), 559-583. https://doi.org/10.5194/bg-19-5592022
Palmtag, J., Obu, J., Kuhry, P., Richter, A., Siewert, M. B., Weiss, N., et al. (2022). A high spatial resolution soil carbon and nitrogen dataset for the northern permafrost region based on circumpolar land cover upscaling. Earth System Science Data, 14(9), 4095-4110. https://doi.org/10. 5194/essd-14-4095-2022
Payette, S., Delwaide, A., Caccianiga, M., & Beauchemin, M. (2004). Accelerated thawing of subarctic peatland permafrost over the last 50 years. Geophysical Research Letters, 31(18), L18208. https://doi.org/10.1029/2004GL020358
Pedron, S. A., Welker, J. M., Euskirchen, E. S., Klein, E. S., Walker, J. C., Xu, X., & Czimczik, C. I. (2022). Closing the winter gap—Year-round measurements of soil CO2 emission sources in arctic tundra. Geophysical Research Letters, 49(6), e2021GL097347. https://doi.org/10.1029/ 2021GL097347
Peltola, O., Vesala, T., Gao, Y., Räty, O., Alekseychik, P., Aurela, M., et al. (2019a). Monthly gridded data product of northern wetland methane emissions based on upscaling eddy covariance observations. Earth System Science Data, 11(3), 1263-1289. https://doi.org/10.5194/essd-11-1263-2019
Peltola, O., Vesala, T., Gao, Y., Räty, O., Alekseychik, P., Aurela, M., et al. (2019b). Dataset for “monthly gridded data product of northern wetland methane emissions based on upscaling eddy covariance observations” [Dataset]. Zenodo. https://doi.org/10.5281/zenodo. 3247295
Pirk, N., Sievers, J., Mertes, J., Parmentier, F. J. W., Mastepanov, M., & Christensen, T. R. (2017). Spatial variability of CO2 uptake in polygonal tundra: Assessing low-frequency disturbances in eddy covariance flux estimates. Biogeosciences, 14(12), 3157-3169. https://doi.org/10.5194/ bg-14-3157-2017
Plaza, C., Pegoraro, E., Bracho, R., Celis, G., Crummer, K. G., Hutchings, J. A., et al. (2019). Direct observation of permafrost degradation and rapid soil carbon loss in tundra. Nature Geoscience, 12(8), 627-631. https://doi.org/10.1038/s41561-019-0387-6
Poggio, L., De Sousa, L. M., Batjes, N. H., Heuvelink, G. B. M., Kempen, B., Ribeiro, E., & Rossiter, D. (2021). SoilGrids 2.0: Producing soil information for the globe with quantified spatial uncertainty. SOIL, 7(1), 217-240. https://doi.org/10.5194/soil-7-217-2021
Ramage, J. L., Kuhn, M., Virkkala, A.-M., Voigt, C., Marushchak, M. E., Bastos, A., et al. (2023). The net GHG balance and budget of the permafrost region (2000-2020) from ecosystem flux upscaling. ESS Open Archive, 29. https://doi.org/10.22541/essoar.169462008. 85493456/v1
Ran, Y., Li, X., Cheng, G., Che, J., Aalto, J., Karjalainen, O., et al. (2022). New high-resolution estimates of the permafrost thermal state and hydrothermal conditions over the Northern Hemisphere. Earth System Science Data, 14(2), 865-884. https://doi.org/10.5194/essd-14-8652022
Rantanen, M., Karpechko, A. Y., Lipponen, A., Nordling, K., Hyvärinen, O., Ruosteenoja, K., et al. (2022). The Arctic has warmed nearly four times faster than the globe since 1979. Communications Earth & Environment, 3(1), 168. https://doi.org/10.1038/s43247-022-00498-3
Raynolds, M. K., Walker, D. A., Balser, A., Bay, C., Campbell, M., Cherosov, M. M., et al. (2019). A raster version of the circumpolar arctic vegetation map (CAVM). Remote Sensing of Environment, 232, 111297. https://doi.org/10.1016/j.rse.2019.111297
Reichstein, M., Bahn, M., Ciais, P., Frank, D., Mahecha, M. D., Seneviratne, S. I., et al. (2013). Climate extremes and the carbon cycle. Nature, 500(7462), 287-295. https://doi.org/10.1038/nature12350
Reid, K. A., Reid, D. G., & Brown, C. D. (2022). Patterns of vegetation change in Yukon: Recent findings and future research in dynamic subarctic ecosystems. Environmental Reviews, 30(3), 380-401. https://doi.org/10.1139/er-2021-0110
Romanovsky, V. E., & Osterkamp, T. E. (2000). Effects of unfrozen water on heat and mass transport processes in the active layer and permafrost. Permafrost and Periglacial Processes, 11(3), 219-239. https://doi.org/10.1002/1099-1530(200007/09)11:3<219::aid-ppp352>3.0.co;2-7
Rößger, N., Sachs, T., Wille, C., Boike, J., & Kutzbach, L. (2022). Seasonal increase of methane emissions linked to warming in Siberian tundra. Nature Climate Change, 12(11), 1031-1036. https://doi.org/10.1038/s41558-022-01512-4
Ruess, R. W., Winton, L. M., & Adams, G. C. (2021). Widespread mortality of trembling aspen (Populus tremuloides) throughout interior Alaskan boreal forests resulting from a novel canker disease. Plos One, 16(4), e0250078. https://doi.org/10.1371/journal.pone. 0250078
Salmon, V. G., Soucy, P., Mauritz, M., Celis, G., Natali, S. M., Mack, M. C., & Schuur, E. A. (2016). Nitrogen availability increases in a tundra ecosystem during five years of experimental permafrost thaw. Global Change Biology, 22(5), 1927-1941. https://doi.org/10.1111/gcb.13204
Saunois, M., Stavert, A. R., Poulter, B., Bousquet, P., Canadell, J. G., Jackson, R. B., et al. (2020). The global methane budget 2000-2017. Earth System Science Data, 12(3), 1561-1623. https://doi.org/10.5194/essd-12-1561-2020
Schädel, C., Bader, M. K. F., Schuur, E. A. G., Biasi, C., Bracho, R., Capek, P., et al. (2016). Potential carbon emissions dominated by carbon dioxide from thawed permafrost soils. Nature Climate Change, 6(10), 950-953. https://doi.org/10.1038/nclimate3054
Schaefer, K., Lantuit, H., Romanovsky, V. E., Schuur, E. A., & Witt, R. (2014). The impact of the permafrost carbon feedback on global climate. Environmental Research Letters, 9(8), 085003. https://doi.org/10.1088/1748-9326/9/8/085003
Scholten, R. C., Jandt, R., Miller, E. A., Rogers, B. M., & Veraverbeke, S. (2021). Overwintering fires in boreal forests. Nature, 593(7859), 399-404. https://doi.org/10.1038/s41586-021-03437-y
Schuur, E. A. G., Abbott, B. W., Commane, R., Ernakovich, J., Euskirchen, E., Hugelius, G., et al. (2022). Permafrost and climate change: Carbon cycle feedbacks from the warming arctic. Annual Review of Environment and Resources, 47(1), 343-371. https://doi.org/10.1146/annurev-environ-012220-011847
Schuur, E. A. G., Bockheim, J., Canadell, J. G., Euskirchen, E., Field, C. B., Goryachkin, S. V., et al. (2008). Vulnerability of permafrost carbon to climate change: Implications for the global carbon cycle. Bioscience, 58(8), 701-714. https://doi.org/10.1641/b580807
Schuur, E. A. G., Bracho, R., Celis, G., Belshe, E. F., Ebert, C., Ledman, J., et al. (2021). Tundra underlain by thawing permafrost persistently emits carbon to the atmosphere over 15 years of measurements. Journal of Geophysical Research-Biogeosciences, 126(6). https://doi.org/10. 1029/2020jg006044
Schuur, E. A. G., McGuire, A. D., Schädel, C., Grosse, G., Harden, J. W., Hayes, D. J., et al. (2015). Climate change and the permafrost carbon feedback. Nature, 520(7546), 171-179. https://doi.org/10.1038/nature14338
Schuur, E. A. G., Vogel, J. G., Crummer, K. G., Lee, H., Sickman, J. O., & Osterkamp, T. E. (2009). The effect of permafrost thaw on old carbon release and net carbon exchange from tundra. Nature, 459(7246), 556-559. https://doi.org/10.1038/nature08031
Schwalm, C. R., Schaefer, K., Fisher, J. B., Huntzinger, D., Elshorbany, Y., Fang, Y., et al. (2019). Divergence in land surface modeling: Linking spread to structure. Environmental Research Communications, 1(11), 111004. https://doi.org/10.1088/2515-7620/ab4a8a
Segers, R. (1998). Methane production and methane consumption: A review of processes underlying wetland methane fluxes. Biogeochemistry, 41(1), 23-51. https://doi.org/10.1023/a:1005929032764
Shaver, G. R., Billings, W. D., Chapin, F. S., Giblin, A. E., Nadelhoffer, K. J., Oechel, W. C., & Rastetter, E. B. (1992). Global change and the carbon balance of arctic ecosystems. Bioscience, 42(6), 433-441. https://doi.org/10.2307/1311862
Shevtsova, I., Heim, B., Kruse, S., Schroder, J., Troeva, E. I., Pestryakova, L. A., et al. (2020). Strong shrub expansion in tundra-taiga, tree infilling in taiga and stable tundra in central Chukotka (north-eastern Siberia) between 2000 and 2017. Environmental Research Letters, 15(8), 085006. https://doi.org/10.1088/1748-9326/ab9059
Shur, Y. L., Hinkel, K. M., & Nelson, F. E. (2005). The transient layer: Implications for geocryology and climate-change science. Permafrost and Periglacial Processes, 16(1), 5-17. https://doi.org/10.1002/ppp. 518
Shur, Y. L., & Jorgenson, M. T. (2007). Patterns of permafrost formation and degradation in relation to climate and ecosystems. Permafrost and Periglacial Processes, 18(1), 7-19. https://doi.org/10.1002/ppp. 582
Sistla, S. A., Moore, J. C., Simpson, R. T., Gough, L., Shaver, G. R., & Schimel, J. P. (2013). Long-term warming restructures Arctic tundra without changing net soil carbon storage. Nature, 497(7451), 615-618. https://doi.org/10.1038/nature12129
Sitch, S., Friedlingstein, P., Gruber, N., Jones, S. D., Murray-Tortarolo, G., Ahlström, A., et al. (2015). Recent trends and drivers of regional sources and sinks of carbon dioxide. Biogeosciences, 12(3), 653-679. https://doi.org/10.5194/bg-12-653-2015
Sjöberg, Y., Siewert, M. B., Rudy, A. C. A., Paquette, M., Bouchard, F., Malenfant-Lepage, J., & Fritz, M. (2020). Hot trends and impact in permafrost science. Permafrost and Periglacial Processes, 31(4), 461-471. https://doi.org/10.1002/ppp. 2047
Smith, S. L., O’Neill, H. B., Isaksen, K., Noetzli, J., & Romanovsky, V. E. (2022). The changing thermal state of permafrost. Nature Reviews Earth & Environment, 3(1), 10-23. https://doi.org/10.1038/s43017-021-00240-1
Song, X., Wang, D.-Y., Li, F., & Zeng, X.-D. (2021). Evaluating the performance of CMIP6 Earth system models in simulating global vegetation structure and distribution. Advances in Climate Change Research, 12(4), 584-595. https://doi.org/10.1016/j.accre.2021.06.008
Stofferahn, E., Fisher, J. B., Hayes, D. J., Schwalm, C. R., Huntzinger, D. N., Hantson, W., et al. (2019). The Arctic-Boreal vulnerability experiment model benchmarking system. Environmental Research Letters, 14(5), 055002. https://doi.org/10.1088/1748-9326/ab10fa
Strack, M., Hayne, S., Lovitt, J., McDermid, G. J., Rahman, M. M., Saraswati, S., & Xu, B. (2019). Petroleum exploration increases methane emissions from northern peatlands. Nature Communications, 10(1), 2804. https://doi.org/10.1038/s41467-019-10762-4
Strauss, J., Laboor, S., Schirrmeister, L., Fedorov, A. N., Fortier, D., Froese, D., et al. (2021). Circum-Arctic map of the Yedoma permafrost domain. Frontiers in Earth Science, 9. https://doi.org/10.3389/feart.2021.758360
Strauss, J., Laboor, S., Schirrmeister, L., Fedorov, A. N., Fortier, D., Froese, D. G., et al. (2022). Database of ice-rich Yedoma permafrost version 2 (IRYP v2). PANGAEA. https://doi.org/10.1594/PANGAEA. 940078
Strauss, J., Schirrmeister, L., Grosse, G., Fortier, D., Hugelius, G., Knoblauch, C., et al. (2017). Deep Yedoma permafrost: A synthesis of depositional characteristics and carbon vulnerability. Earth-Science Reviews, 172, 75-86. https://doi.org/10.1016/j.earscirev.2017.07.007
Sturm, M., Schimel, J., Michaelson, G., Welker, J. M., Oberbauer, S. F., Liston, G. E., et al. (2005). Winter biological processes could help convert arctic tundra to shrubland. Bioscience, 55(1), 17-26. https://doi.org/10.1641/0006-3568(2005)055[0017:wbpchc]2.0.co;2
Sweeney, C., Dlugokencky, E., Miller, C. E., Wofsy, S., Karion, A., Dinardo, S., et al. (2016). No significant increase in long-term CH4 emissions on North Slope of Alaska despite significant increase in air temperature. Geophysical Research Letters, 43(12), 6604-6611. https://doi.org/10. 1002/2016GL069292
Tank, S. E., Vonk, J. E., Walvoord, M. A., McClelland, J. W., Laurion, I., & Abbott, B. W. (2020). Landscape matters: Predicting the biogeochemical effects of permafrost thaw on aquatic networks with a state factor approach. Permafrost and Periglacial Processes, 31(3), 358-370. https://doi.org/10.1002/ppp. 2057
Tarnocai, C., Canadell, J. G., Schuur, E. A. G., Kuhry, P., Mazhitova, G., & Zimov, S. (2009). Soil organic carbon pools in the northern circumpolar permafrost region. Global Biogeochemical Cycles, 23(2), GB2023. https://doi.org/10.1029/2008gb003327
Thornton, B. F., Wik, M., & Crill, P. M. (2016). Double-counting challenges the accuracy of high-latitude methane inventories. Geophysical Research Letters, 43(24), 12569-12577. https://doi.org/10.1002/2016gl071772
Treat, C. C., Bloom, A. A., & Marushchak, M. E. (2018b). Non-growing season methane emissions-A significant component of annual emissions across northern ecosystems. Global Change Biology, 24(8), 3331-3343. https://doi.org/10.1111/gcb. 14137
Treat, C. C., Bloom, A. A., & Marushchak Maija, E. (2018a). Cumulative growing season, non-growing season, and annual methane fluxes from temperate, boreal, and tundra wetlands and uplands [Dataset]. PANGAEA. https://doi.org/10.1594/PANGAEA. 886976
Treat, C. C., Jones, M. C., Alder, J., Sannel, A. B. K., Camill, P., & Frolking, S. (2021). Predicted vulnerability of carbon in permafrost peatlands with future climate change and permafrost thaw in western Canada. Journal of Geophysical Research: Biogeosciences, e2020JG005872. https://doi.org/10.1029/2020JG005872
Treat, C. C., Jones, M. C., Camill, P., Gallego-Sala, A., Garneau, M., Harden, J. W., et al. (2016). Effects of permafrost aggradation on peat properties as determined from a pan-Arctic synthesis of plant macrofossils. Journal of Geophysical Research: Biogeosciences, 121(1), 78-94. https://doi.org/10.1002/2015JG003061
Treat, C. C., Kleinen, T., Broothaerts, N., Dalton, A. S., Dommain, R., Douglas, T. A., et al. (2019). Widespread global peatland establishment and persistence over the last 130,000 y. Proceedings of the National Academy of Sciences U.S.A., 116(4827). 201813305. https://doi.org/10.1073/ pnas. 1813305116
Treat, C. C., Natali, S. M., Ernakovich, J., Iversen, C. M., Lupascu, M., McGuire, A. D., et al. (2015). A pan-Arctic synthesis of
Treharne, R., Bjerke, J. W., Tømmervik, H., Stendardi, L., & Phoenix, G. K. (2019). Arctic browning: Impacts of extreme climatic events on heathland ecosystem CO2 fluxes. Global Change Biology, 25(2), 489-503. https://doi.org/10.1111/gcb.14500
Tsuruta, A., Kivimäki, E., Lindqvist, H., Karppinen, T., Backman, L., Hakkarainen, J., et al. (2023). CH4 fluxes derived from assimilation of TROPOMI XCH4 in carbontracker Europe-CH4: Evaluation of seasonality and spatial distribution in the northern high latitudes. Remote Sensing, 15(6), 1620. https://doi.org/10.3390/rs15061620
Turetsky, M. R., Abbott, B. W., Jones, M. C., Anthony, K. W., Olefeldt, D., Schuur, E. A. G., et al. (2020). Carbon release through abrupt permafrost thaw. Nature Geoscience, 13(2), 138-143. https://doi.org/10.1038/s41561-019-0526-0
Turetsky, M. R., Kotowska, A., Bubier, J., Dise, N. B., Crill, P., Hornibrook, E. R. C., et al. (2014). A synthesis of methane emissions from 71 northern, temperate, and subtropical wetlands. Global Change Biology, 20(7), 2183-2197. https://doi.org/10.1111/gcb. 12580
Ueyama, M., Iwata, H., Nagano, H., Tahara, N., Iwama, C., & Harazono, Y. (2019). Carbon dioxide balance in early-successional forests after forest fires in interior Alaska. Agricultural and Forest Meteorology, 275, 196-207. https://doi.org/10.1016/j.agrformet.2019.05.020
Van Wees, D., Van Der Werf, G. R., Randerson, J. T., Rogers, B. M., Chen, Y., Veraverbeke, S., et al. (2022). Global biomass burning fuel consumption and emissions at 500 m spatial resolution based on the Global Fire Emissions Database (GFED). Geoscientific Model Development, 15(22), 8411-8437. https://doi.org/10.5194/gmd-15-8411-2022
Varner, R. K., Crill, P. M., Frolking, S., McCalley, C. K., Burke, S. A., Chanton, J. P., et al. (2022). Permafrost thaw driven changes in hydrology and vegetation cover increase trace gas emissions and climate forcing in Stordalen Mire from 1970 to 2014. Philosophical Transactions of the Royal Society a-Mathematical Physical and Engineering Sciences, 380(2215). https://doi.org/10.1098/rsta.2021.0022
Varney, R. M., Chadburn, S. E., Burke, E. J., & Cox, P. M. (2022). Evaluation of soil carbon simulation in CMIP6 Earth system models. Biogeosciences, 19(19), 4671-4704. https://doi.org/10.5194/bg-19-4671-2022
Veraverbeke, S., Delcourt, C. J. F., Kukavskaya, E., Mack, M., Walker, X., Hessilt, T., et al. (2021). Direct and longer-term carbon emissions from arctic-boreal fires: A short review of recent advances. Current Opinion in Environmental Science & Health, 23, 100277. https://doi.org/10. 1016/j.coesh.2021.100277
Virkkala, A. M., Aalto, J., Rogers, B. M., Tagesson, T., Treat, C. C., Natali, S. M., et al. (2021b). Data for: “Statistical upscaling of ecosystem CO2 fluxes across the terrestrial tundra and boreal domain: Regional patterns and uncertainties” [Dataset]. Zenodo. https://doi.org/10.5281/zenodo. 4519583
Virkkala, A. M., Aalto, J., Rogers, B. M., Tagesson, T., Treat, C. C., Natali, S. M., et al. (2021a). Statistical upscaling of ecosystem CO2 fluxes across the terrestrial tundra and boreal domain: Regional patterns and uncertainties. Global Change Biology, 27(17), 4040-4059. https://doi. org/10.1111/gcb. 15659
Virkkala, A. M., Natali, S. M., Rogers, B. M., Watts, J. D., Savage, K., Connon, S. J., et al. (2022). The ABCflux database: Arctic-boreal CO2 flux observations and ancillary information aggregated to monthly time steps across terrestrial ecosystems. Earth System Science Data, 14(1), 179-208. https://doi.org/10.5194/essd-14-179-2022
Virkkala, A. M., Virtanen, T., Lehtonen, A., Rinne, J., & Luoto, M. (2018). The current state of CO2 flux chamber studies in the arctic tundra: A review. Progress in Physical Geography-Earth and Environment, 42(2), 162-184. https://doi.org/10.1177/0309133317745784
Vitt, D. H., Halsey, L. A., & Zoltai, S. C. (2000). The changing landscape of Canada’s western boreal forest: The current dynamics of permafrost. Canadian Journal of Forest Research-Revue Canadienne De Recherche Forestiere, 30(2), 283-287. https://doi.org/10.1139/cjfr-30-2-283
Voigt, C., Virkkala, A.-M., Hould Gosselin, G., Bennett, K. A., Black, T. A., Detto, M., et al. (2023). Arctic soil methane sink increases with drier conditions and higher ecosystem respiration. Nature Climate Change, 13(10), 1095-1104. https://doi.org/10.1038/s41558-023-01785-3
Vonk, J. E., Tank, S. E., Bowden, W. B., Laurion, I., Vincent, W. F., Alekseychik, P., et al. (2015). Reviews and syntheses: Effects of permafrost thaw on Arctic aquatic ecosystems. Biogeosciences, 12(23), 7129-7167. https://doi.org/10.5194/bg-12-7129-2015
Vonk, J. E., Tank, S. E., & Walvoord, M. A. (2019). Integrating hydrology and biogeochemistry across frozen landscapes. Nature Communications, 10(1), 5377. https://doi.org/10.1038/s41467-019-13361-5
Walker, D. A., Raynolds, M. K., Daniëls, F. J. A., Einarsson, E., Elvebakk, A., Gould, W. A., et al. (2005). The Circumpolar Arctic vegetation map. Journal of Vegetation Science, 16(3), 267-282. https://doi.org/10.1111/j.1654-1103.2005.tb02365.x(2005)016[0267:TCAVM]2.0.CO;2
Walker, H. J. (1998). Arctic deltas. Journal of Coastal Research, 14(3), 719-738.
Walker, X. J., Baltzer, J. L., Cumming, S. G., Day, N. J., Ebert, C., Goetz, S., et al. (2019). Increasing wildfires threaten historic carbon sink of boreal forest soils. Nature, 572(7770), 520-523. https://doi.org/10.1038/s41586-019-1474-y
Walter Anthony, K. M., Anthony, P., Grosse, G., & Chanton, J. (2012). Geologic methane seeps along boundaries of Arctic permafrost thaw and melting glaciers. Nature Geoscience, 5(6), 419-426. https://doi.org/10.1038/ngeo1480
Walter Anthony, K. M., Zimov, S. A., Grosse, G., Jones, M. C., Anthony, P. M., Iii, F. S. C., et al. (2014). A shift of thermokarst lakes from carbon sources to sinks during the Holocene epoch. Nature, 511(7510), 452-456. https://doi.org/10.1038/nature13560
Wang, J. A., Sulla-Menashe, D., Woodcock, C. E., Sonnentag, O., Keeling, R. F., & Friedl, M. A. (2020). Extensive land cover change across Arctic-Boreal Northwestern North America from disturbance and climate forcing. Global Change Biology, 26(2), 807-822. https://doi.org/10. 1111/gcb. 14804
Ward Jones, M. K., Schwoerer, T., Gannon, G. M., Jones, B. M., Kanevskiy, M. Z., Sutton, I., et al. (2022). Climate-driven expansion of northern agriculture must consider permafrost. Nature Climate Change, 12(8), 699-703. https://doi.org/10.1038/s41558-022-01436-z
Watts, J. D., Farina, M., Kimball, J. S., Schiferl, L. D., Liu, Z. H., Arndt, K. A., et al. (2023). Carbon uptake in Eurasian boreal forests dominates the high-latitude net ecosystem carbon budget. Global Change Biology, 29(7), 1870-1889. https://doi.org/10.1111/gcb. 16553
Watts, J. D., Natali, S. M., Minions, C., Risk, D., Arndt, K., Zona, D., et al. (2021). Soil respiration strongly offsets carbon uptake in Alaska and Northwest Canada. Environmental Research Letters, 16(8), 084051. https://doi.org/10.1088/1748-9326/ac1222
Webster, K. L., Bhatti, J. S., Thompson, D. K., Nelson, S. A., Shaw, C. H., Bona, K. A., et al. (2018). Spatially-integrated estimates of net ecosystem exchange and methane fluxes from Canadian peatlands. Carbon Balance and Management, 13(1), 16. https://doi.org/10.1186/ s13021-018-0105-5
Whalen, S. C. (2005). Biogeochemistry of methane exchange between natural wetlands and the atmosphere. Environmental Engineering Science, 22(1), 73-94. https://doi.org/10.1089/ees.2005.22.73
Wik, M., Varner, R. K., Anthony, K. W., MacIntyre, S., & Bastviken, D. (2016). Climate-sensitive northern lakes and ponds are critical components of methane release. Nature Geoscience, 9(2), 99-105. https://doi.org/10.1038/ngeo2578
Xu, X., Riley, W. J., Koven, C. D., Billesbach, D. P., Chang, R. Y. W., Commane, R., et al. (2016). A multi-scale comparison of modeled and observed seasonal methane emissions in northern wetlands. Biogeosciences, 13(17), 5043-5056. https://doi.org/10.5194/bg-13-5043-2016
Xu, X., Riley, W. J., Koven, C. D., & Jia, G. (2018). Observed and simulated sensitivities of spring greenup to preseason climate in northern temperate and boreal regions. Journal of Geophysical Research: Biogeosciences, 123(1), 60-78. https://doi.org/10.1002/2017JG004117
Xu, X., Yuan, F., Hanson, P. J., Wullschleger, S. D., Thornton, P. E., Riley, W. J., et al. (2016). Reviews and syntheses: Four decades of modeling methane cycling in terrestrial ecosystems. Biogeosciences, 13(12), 3735-3755. https://doi.org/10.5194/bg-13-3735-2016
Yang, M., Nelson, F. E., Shiklomanov, N. I., Guo, D., & Wan, G. (2010). Permafrost degradation and its environmental effects on the Tibetan plateau: A review of recent research. Earth-Science Reviews, 103(1), 31-44. https://doi.org/10.1016/j.earscirev.2010.07.002
Yu, Z., Loisel, J., Brosseau, D. P., Beilman, D. W., & Hunt, S. J. (2010). Global peatland dynamics since the last glacial maximum. Geophysical Research Letters, 37(13), L13402. https://doi.org/10.1029/2010g1043584
Zaehle, S., Jones, C. D., Houlton, B., Lamarque, J.-F., & Robertson, E. (2015). Nitrogen availability reduces CMIP5 projections of twenty-firstcentury land carbon uptake. Journal of Climate, 28(6), 2494-2511. https://doi.org/10.1175/JCLI-D-13-00776.1
Zhang, Z., Fluet-Chouinard, E., Jensen, K., McDonald, K., Hugelius, G., Gumbricht, T., et al. (2021). Development of the global dataset of wetland area and dynamics for methane modeling (WAD2M). Earth System Science Data, 13(5), 2001-2023. https://doi.org/10.5194/essd-13-2001-2021
Zhang, Z., Poulter, B., Feldman, A. F., Ying, Q., Ciais, P., Peng, S., & Li, X. (2023). Recent intensification of wetland methane feedback. Nature Climate Change, 13(5), 430-433. https://doi.org/10.1038/s41558-023-01629-0
Zimov, N. S., Zimov, S. A., Zimova, A. E., Zimova, G. M., Chuprynin, V. I., & Chapin, F. S., III. (2009). Carbon storage in permafrost and soils of the mammoth tundra-steppe biome: Role in the global carbon budget. Geophysics Research Letter, 36(2). https://doi.org/10.1029/ 2008g1036332
Zolkos, S., Tank, S. E., Kokelj, S. V., Striegl, R. G., Shakil, S., Voigt, C., et al. (2022). Permafrost landscape history shapes fluvial chemistry, ecosystem carbon balance, and potential trajectories of future change. Global Biogeochemical Cycles, 36(9), e2022GB007403. https://doi.org/ 10.1029/2022GB007403
References From the Supporting Information
DOI: https://doi.org/10.1029/2023jg007638
Publication Date: 2024-02-26
JGR Biogeosciences
COMMISSIONED
MANUSCRIPT
- Rapid warming of northern permafrost region threatens ecosystems, soil carbon stocks, and global climate targets
- Long-term observations show importance of disturbance and cold season periods but are unable to detect spatiotemporal trends in C flux
- Combined modeling and syntheses show the permafrost region is a small terrestrial
sink with large spatial variability and net source
Supporting Information:
Correspondence to:
Citation:
Accepted 7 FEB 2024
© 2024 The Authors.
Permafrost Carbon: Progress on Understanding Stocks and Fluxes Across Northern Terrestrial Ecosystems
Abstract
Significant progress in permafrost carbon science made over the past decades include the identification of vast permafrost carbon stocks, the development of new pan-Arctic permafrost maps, an increase in terrestrial measurement sites for
Plain Language Summary Climate change and the consequent thawing of permafrost threatens to transform the permafrost region from a carbon sink into a carbon source, posing a challenge to global climate goals. Numerous studies over the past decades have identified important factors affecting carbon cycling,
including vegetation changes, periods of soil freezing and thawing, wildfire, and other disturbance events. Overall, studies show high wetland methane emissions and a small net carbon dioxide sink strength over the terrestrial permafrost region but results differ among modeling and upscaling approaches. Continued and coordinated efforts among field, modeling, and remote sensing communities are needed to integrate new knowledge from observations to modeling and predictions and finally to policy.
1. Introduction
1.1. Permafrost Region Overview: Extent and Characteristics
Selected Spatial Circum-Polar Thematic (Permafrost, Soil) Map Products
| Theme | Study | Name | Description of approach | Spatial extent | Resolution | Type of map (vector/ polygon, raster) |
| Permafrost landscape characteristics and extent | ||||||
| Permafrost extent | Brown et al., 1998 revised 2001) | IPA Permafrost Map | Field mapping and manual digitalization | Pan-Arctic | 12.5 km | Raster |
| Permafrost extent + zonation | Gruber (2012) | Equilibrium model using mean annual air temperature + terrain | Global | 1 km | Raster | |
| Permafrost extent | Obu et al. (2019) | TTOP Equilibrium temperature model + parameterization from satellite data | Pan-Arctic | 1 km | Raster | |
| Permafrost ground temperature and active layer thickness | Aalto et al. (2018) | Statistical modeling between ALT, climate data, and local environment | Land areas
|
1 km | Raster | |
| Permafrost ground temperature, active layer thickness, zero annual amplitude | Ran et al. (2022) | Statistical modeling between ALT, climate data, local environment, soil characteristics | Pan-Arctic | 1 km | Raster | |
| Thermokarst landscape distribution | Olefeldt et al. (2016) | Data fusion product | Pan-Arctic | Polygons of variable size, with
|
Vector | |
| Subsea permafrost | Overduin et al. (2019) | SuPerMAP | 1-D transient heat flux accounting for sea level variation and sediments | Pan-Arctic; Arctic Ocean | 12.5 km | |
| Ground ice type and abundance | O’Neill et al. (2019) | Data fusion model | Canada | 1 km | Raster | |
| Theme | Study | Name | Description of approach | Spatial extent | Resolution | Type of map (vector/ polygon, raster) |
| Permafrost region soils: characteristics, extent, C stocks | ||||||
| Yedoma domain extent | (Strauss et al., 2021) | Harmonized geological maps, remote sensing and Field mapping, including manual digitalization | Pan-Arctic | Polygons of variable size | Polygon | |
| Peatland extent, depth, and C densities | Hugelius et al. (2020) | Harmonized soil maps and statistical modeling | North of
|
10 km | Raster | |
| Soil class, soil properties, C density | Tarnocai et al. (2009) | NCSCD | Harmonized soil maps and statistical modeling | Permafrost region | Polygon | |
| Soil class, soil properties, C density | Hugelius et al. (2013) | NCSCDv2.0 | Harmonized soil maps and statistical modeling | Permafrost region | polygon | |
| Soil class, soil properties, C density | Mishra et al. (2021) | Machine learning using harmonized soil profiles and remote-sensing data products | Permafrost region | 250 m | Raster | |
| Soil class, soil properties, C density | Hengl et al. (2017); Poggio et al. (2021) | SoilGrids250 m/ 2.0 | Machine learning using soil profiles and remote-sensing data products | Global | 250 m | Raster |
1.2. Permafrost Region Vegetation: A Key Control on C Cycling
1.3. Permafrost Soils: A Globally Significant C Reservoir
ranging from 1,014 (
2. Terrestrial Carbon Fluxes in the Permafrost Region
2.1.
Review of Existing Data Syntheses of
| Study | No. unique sites total/permafrost region
|
Synthesized fluxes and measurement techniques ecosystem domain | Study domain | Study period | Flux aggregation | Format | Notes |
| Bartlett and Harriss (1993) |
|
Chamber and eddy covariance | Global | Measurements from 1982 to 1991 | Daily, Annual | Point-based | Dataset in Table |
| Nilsson et al. (2001) | 619 b/– | Survey of chamber fluxes from across different wetlands in Sweden | Sweden | 1994 | Daily | Lacks spatial information | Reports characteristics fluxes of different wetland types |
| Frolking et al. (2011) |
|
Chamber and eddy covariance | Global | Measurements from 1990 to 2008 | Annual | Point-based | Mean annual
|
| McGuire et al. (2012) |
|
Chamber, eddy covariance, diffusionbased concentration gradient estimates | Arctic | Measurements from 1974 to 2011 | Daily, Seasonal, Annual | Point-based | Dataset in Appendix |
| Olefeldt et al. (2013) | 303 b/– | Chamber | Permafrost region | Measurements from 1984 to 2010 | Daily | Point-based | Dataset not publicly available but included in Kuhn et al. (2021) |
| Turetsky et al. (2014) |
|
Chamber and eddy covariance | Global | Measurements from 1980 to 2011 | Daily | Point-Based | Dataset not publicly available |
| Webster et al. (2018) | 49/23 | Chamber and eddy covariance | Canada | Measurements from 1984 to 2016 | Daily, Seasonal, Annual | Point-based | Dataset not publicly available |
| Treat et al. (2018b) | 173/62 | Chamber, eddy covariance, & snowpack diffusion method | northern extra-tropical | 1974-2016 | Daily, Seasonal, annual | Point-based | Inclusion criteria: minimum
|
| Delwiche et al. (2021); Knox et al. (2019) | 81/17 | Eddy covariance | Global | Measurements from 2006 to 2018 | Halfhourly, Daily | Point-based | Data download only available for individual FluxNET sites, not as dataset |
| Kuhn et al. (2021b) |
|
Chamber, eddy covariance, concentration gradient | northern permafrost region | Measurements from 1984 to 2019 | Daily | Point-based/ Shapefile/ KML | Builds on Wik et al. (2016) and Olefeldt et al. (2013) |
2.2. Regional Variability in
Mean and Standard Deviation of Annual Terrestrial NEE
| Model type | Alaska | Canadian tundra | Western Canada | Eastern Canada | Western Eurasia | Siberian tundra | Eastern Siberia | Western Siberia |
| In-situ |
|
-22 (NA)(2 sites; nongrowing season not directly measured) |
|
|
|
|
|
NA |
| Upscaling |
|
|
|
|
|
|
|
-6
|
| Inversion |
|
|
|
|
|
|
|
-74
|
| CMIP6 process model |
|
|
|
|
|
|
|
-27
|
| ISIMIP process model |
|
|
|
|
|
|
|
-54
|
2.3. Long-Term Trends in
2.4.
lowlands in Canada and Alaska (Euskirchen et al., 2017; Helbig et al., 2017), and collapsing palsas from Fennoscandia (Varner et al., 2022). However, the current site network misses thaw slumps, gullies, and active layer detachments (Cassidy et al., 2016) that cover
3. Modeling the Carbon Fluxes in the Terrestrial Permafrost Region
3.1. Main Modeling Approaches for C Exchange
assimilation systems such as the CARbon DAta MOdel (CARDAMOM) that integrates various data sources with less complex process models might be a solution for better predictions (López-Blanco et al., 2019; Y. Q. Luo et al., 2012). Additionally, top-down atmospheric inversion models are constrained by atmospheric data where concentration changes are linked to flux and atmospheric transport and are often spatially coarser than the bottomup approaches (Bruhwiler et al., 2021; Byrne et al., 2023; Z. Liu et al., 2022).
3.2. Modeling Insights Into
3.3. Key Advancements and Challenges in Modeling Carbon Cycling in the Permafrost Region
leading to an underestimation of the potential for C -climate feedbacks from these frozen soils. Only two of the CMIP6 models included a representation of permafrost C in soils (CESM and NorESM), which improved C stocks estimates in the permafrost region. The relatively short spin-up time of some models (on the order of centuries) compared to the slow build-up time of permafrost C over many millennia-especially for C -rich Pleistocene Yedoma deposits (Lindgren et al., 2018) and Holocene peatlands (Yu et al., 2010)-may be one reason for this underestimation (Huntzinger et al., 2020; Schwalm et al., 2019). Alternatively, inaccurate representations of vegetation cover and plant-derived
simulate abrupt changes following disturbances. While five of 11 models included in the land carbon cycle models used in CMIP6 ESMs simulated fire, none of them included fire-permafrost-carbon interactions (Canadell et al., 2021). Thermokarst processes are also absent although they can to a certain extent be represented in LSMs (N. D. Smith et al., 2022). Vegetation-specific disturbances such as insect outbreaks, frost damage, and droughts can affect the C balance (Reichstein et al., 2013), but improvements to vegetation dynamics should be priority. Furthermore, the contribution of peatland, inland aquatic ecosystems, and the lateral carbon fluxes between terrestrial and aquatic systems are not included in CMIP6 models but are included in regional modeling studies of C fluxes in the permafrost region (Chaudhary et al., 2020; Kicklighter et al., 2013; Lyu et al., 2018; McGuire et al., 2018a). The limited representation of processes is due to their complexity as well as the lack of observations integrating interactions between terrestrial and aquatic systems (Vonk et al., 2019). Overall, the potential for C sequestration in peatland and other soils (Treat et al., 2021), and other region-specific disturbances such as abrupt permafrost thaw (Turetsky et al., 2020) should be a major focus of future model development to achieve a more accurate quantification of the permafrost C feedback.
permafrost C budgets (Commane et al., 2017; Elder et al., 2021; Miller et al., 2016); developments in model benchmarking systems and data assimilation will also help with furthering understanding and refining estimates (Collier et al., 2018; Y. Q. Luo et al., 2012; Stofferahn et al., 2019).
4. Summary of the Next Steps
- Process-based knowledge: Weather extremes and disturbances cause large inter-annual variability in C fluxes and change the contributions of the two key C fluxes-
and to the total C budget. At the same time, hydrological changes associated with permafrost thaw make understanding moisture gradients and terrestrial-aquatic interfaces more important to understand the controls of C cycling. As such, and exchange between ecosystems and the atmosphere do not capture the full response of permafrost C losses; lateral C fluxes also need to be quantified. New knowledge about extreme event impacts such as winter and summer droughts, fires, and insect outbreaks and their compound effects on C cycling derived from long-term field sites or controlled experiments targeting these extremes, and measurements in currently under-sampled drier upland landscapes and areas experiencing rapid disturbances, such as abrupt permafrost thaw, are crucial. - Observations and syntheses: While the network of sites with continuous observations is steadily increasing and subsequent data syntheses grow in scope (from 30 to 200 sites), detecting hotspots, hot moments, and longterm trends of in-situ
and fluxes remains a challenge. Therefore, the observational network capacity must be increased to support the continuity of long-term eddy covariance and flux sites for yearround and long-term monitoring. New sites need to be established in areas where (a) data are currently lacking, such as in Russia and northern and eastern Canada, and (b) in areas experiencing disturbances. Chamber-based fluxes could be used to fill gaps in flux network data in remote locations but requires modeling to expand temporal coverage. The increasing availability of space-based and remote sensing data will address some of the spatial coverage challenges of the in-situ observation networks, but limitations remain for high latitudes. Finally, coordinated efforts are required to facilitate the creation of standardized and comprehensive terrestrial and aquatic and flux datasets and summaries for the permafrost region, improve inter-comparability of measurements and reduce latency in data collection, and to identify critical
data gaps (spatially and across ecosystem types). Further improvements to environmental data such as soil C , dominant plant species and their traits, and permafrost thaw status would help contextualize and upscale flux data.
3. Modeling: The three broad types of modeling approaches – statistical or machine learning-based upscaling, process modeling, and inversion approaches – are all needed to predict C fluxes in the permafrost domain. Process models are the most widely used technique to predict C fluxes but there are limitations related to coldseason emissions, belowground plant-soil feedbacks, permafrost thaw, disturbance history, as well as capturing temporal lags, tipping points, and non-linear responses. In addition, dynamic and spatially higher resolution wetland, soil moisture, and disturbance maps are needed to capture the rapidly changing permafrost landscapes, for example, the distribution of gradual and abrupt permafrost thaw. Using monitoring data to inform process-based and inversion models through data assimilation techniques could allow substantial decrease in model uncertainties (Y. Luo & Schuur, 2020). As more geospatial permafrost-related data products become available and new study sites are measured, better simulations and analyses of the dynamic processes that drive change in the permafrost region are possible.
4. Model and data intercomparisons: Regularly benchmarking and exploring the model-based magnitudes, trends, and drivers of C fluxes is necessary to identify areas of convergence and divergence between models and in-situ measurements (Collier et al., 2018). Determining whether key processes for the permafrost region identified by observations are included or adequately represented can significantly improve process-based model performance (Koven et al., 2011), as is identifying benchmarking metrics to constrain predictions (Schwalm et al., 2019). In particular, new
Data Availability Statement
References
Alexandrov, G. A., Brovkin, V. A., & Kleinen, T. (2016). The influence of climate on peatland extent in Western Siberia since the last glacial maximum. Scientific Reports, 6(1), 24784. https://doi.org/10.1038/srep24784
Bartlett, K. B., & Harriss, R. C. (1993). Review and assessment of methane emissions from wetlands. Chemosphere, 26(1-4), 261-320. https://doi. org/10.1016/0045-6535(93)90427-7
Bastviken, D., Treat, C. C., Pangala, S. R., Gauci, V., Enrich-Prast, A., Karlson, M., et al. (2022). The importance of plants for methane emission at the ecosystem scale. Aquatic Botany, 184, 103596. https://doi.org/10.1016/j.aquabot.2022.103596
Basu, S., Lan, X., Dlugokencky, E., Michel, S., Schwietzke, S., Miller, J. B., et al. (2022). Estimating emissions of methane consistent with atmospheric measurements of methane and
Bellisario, L. M., Moore, T. R., & Bubier, J. L. (1998). Net ecosystem
Berner, L. T., Massey, R., Jantz, P., Forbes, B. C., Macias-Fauria, M., Myers-Smith, I., et al. (2020). Summer warming explains widespread but not uniform greening in the Arctic tundra biome. Nature Communications, 11(1), 4621. https://doi.org/10.1038/s41467-020-18479-5
Biskaborn, B. K., Smith, S. L., Noetzli, J., Matthes, H., Vieira, G., Streletskiy, D. A., et al. (2019). Permafrost is warming at a global scale. Nature Communications, 10(1), 1-11. https://doi.org/10.1038/s41467-018-08240-4
Blodau, C. (2002). Carbon cycling in peatlands- A review of processes and controls. Environmental Reviews, 10(2), 111-134. https://doi.org/10. 1139/a02-004
Bloom, A. A., Bowman, K. W., Lee, M., Turner, A. J., Schroeder, R., Worden, J. R., et al. (2017). A global wetland methane emissions and uncertainty dataset for atmospheric chemical transport models (WetCHARTs version 1.0). Geoscience Model Development, 10(6), 2141-2156. https://doi.org/10.5194/gmd-10-2141-2017
Bradshaw, C. J. A., & Warkentin, I. G. (2015). Global estimates of boreal forest carbon stocks and flux. Global and Planetary Change, 128, 24-30. https://doi.org/10.1016/j.gloplacha.2015.02.004
Braghiere, R. K., Fisher, J. B., Miner, K. R., Miller, C. E., Worden, J. R., Schimel, D. S., & Frankenberg, C. (2023). Tipping point in North American Arctic-Boreal carbon sink persists in new generation Earth system models despite reduced uncertainty. Environmental Research Letters, 18(2), 025008. https://doi.org/10.1088/1748-9326/acb226
Bridgham, S. D., Cadillo-Quiroz, H., Keller, J. K., & Zhuang, Q. (2013). Methane emissions from wetlands: Biogeochemical, microbial, and modeling perspectives from local to global scales. Global Change Biology, 19(5), 1325-1346. https://doi.org/10.1111/gcb. 12131
Brosius, L. S., Anthony, K. M. W., Treat, C. C., Lenz, J., Jones, M. C., Bret-Harte, M. S., & Grosse, G. (2021). Spatiotemporal patterns of northern lake formation since the Last Glacial Maximum. Quaternary Science Reviews, 253, 106773. https://doi.org/10.1016/j.quascirev.2020.106773
Brown, J., Ferrians Jr, O. J., Heginbottom, J. A., Melnikov, E. S., & (Cartographer). (1998). Circum-Arctic map of permafrost and ground-ice conditions, revised 2001. National Snow and Ice Data Center. https://doi.org/200021_215214
Bruhwiler, L., Basu, S., Butler, J. H., Chatterjee, A., Dlugokencky, E., Kenney, M. A., et al. (2021). Observations of greenhouse gases as climate indicators. Climatic Change, 165(1-2), 12. https://doi.org/10.1007/s10584-021-03001-7
Byrne, B., Baker, D. F., Basu, S., Bertolacci, M., Bowman, K. W., Carroll, D., et al. (2023). National CO2 budgets (2015-2020) inferred from atmospheric CO2 observations in support of the global stocktake. Earth System Science Data, 15(2), 963-1004. https://doi.org/10.5194/essd-15-963-2023
Canadell, J. G., Monteiro, P. M. S., Costa, M. H., Cotrim da Cunha, L., Cox, P. M., Eliseev, A. V., et al. (2021). Global carbon and other biogeochemical cycles and feedbacks. In V. Masson-Delmotte, P. Zhai, A. Pirani, S. L. Connors, C. Péan, S. Berger, et al. (Eds.), Climate change 2021: The physical science basis. Contribution of working group I to the sixth assessment report of the intergovernmental panel on climate change (pp. 673-816). Cambridge University Press.
Cassidy, A. E., Christen, A., & Henry, G. H. R. (2016). The effect of a permafrost disturbance on growing-season carbon-dioxide fluxes in a high Arctic tundra ecosystem. Biogeosciences, 13(8), 2291-2303. https://doi.org/10.5194/bg-13-2291-2016
Celis, G., Mauritz, M., Bracho, R., Salmon, V. G., Webb, E. E., Hutchings, J., et al. (2017). Tundra is a consistent source of CO2 at a site with progressive permafrost thaw during 6 years of chamber and eddy covariance measurements. Journal of Geophysical Research: Biogeosciences, 122(6), 1471-1485. https://doi.org/10.1002/2016JG003671
Chadburn, S. E., Burke, E., Essery, R., Boike, J., Langer, M., Heikenfeld, M., et al. (2015). An improved representation of physical permafrost dynamics in the JULES land-surface model. Geoscientific Model Development, 8(5), 1493-1508. https://doi.org/10.5194/gmd-8-1493-2015
Chapin, F. S., BretHarte, M. S., Hobbie, S. E., & Zhong, H. L. (1996). Plant functional types as predictors of transient responses of arctic vegetation to global change. Journal of Vegetation Science, 7(3), 347-358. https://doi.org/10.2307/3236278
Chapin, F. S., McGuire, A. D., Randerson, J., Pielke, R., Baldocchi, D., Hobbie, S. E., et al. (2000). Arctic and boreal ecosystems of western North America as components of the climate system. Global Change Biology, 6(S1), 211-223. https://doi.org/10.1046/j.1365-2486.2000.06022.x
Chasmer, L., Cobbaert, D., Mahoney, C., Millard, K., Peters, D., Devito, K., et al. (2020). Remote sensing of boreal wetlands 1: Data use for policy and management. Remote Sensing, 12(8), 1320. https://doi.org/10.3390/rs12081320
Chaudhary, N., Westermann, S., Lamba, S., Shurpali, N., Sannel, A. B. K., Schurgers, G., et al. (2020). Modelling past and future peatland carbon dynamics across the pan-Arctic. Global Change Biology, 26(7), 4119-4133. https://doi.org/10.1111/gcb.15099
Christensen, T. R., Panikov, N., Mastepanov, M., Joabsson, A., Stewart, A., Oquist, M., et al. (2003). Biotic controls on CO2 and CH4 exchange in wetlands: A closed environment study. Biogeochemistry, 64(3), 337-354. https://doi.org/10.1023/a:1024913730848
Christensen, T. R., Rysgaard, S., Bendtsen, J., Else, B., Glud, R. N., Van Huissteden, J., et al. (2017). Arctic carbon cycling. In C. AMAP (Ed.), Snow, water, ice and permafrost in the Arctic (SWIPA) (pp. 203-218). Arctic Monitoring and Assessment Programme (AMAP).
Ciais, P., Bastos, A., Chevallier, F., Lauerwald, R., Poulter, B., Canadell, J. G., et al. (2022). Definitions and methods to estimate regional land carbon fluxes for the second phase of the regional carbon cycle assessment and processes project (RECCAP-2). Geoscientific Model Development, 15(3), 1289-1316. https://doi.org/10.5194/gmd-15-1289-2022
Clein, J. S., & Schimel, J. P. (1995). Microbial activity of tundra and taiga soils at subzero temperatures. Soil Biology & Biochemistry, 27(9), 1231-1234. https://doi.org/10.1016/0038-0717(95)00044-f
Collier, N., Hoffman, F. M., Lawrence, D. M., Keppel-Aleks, G., Koven, C. D., Riley, W. J., et al. (2018). The international land model benchmarking (ILAMB) system: Design, theory, and implementation. Journal of Advances in Modeling Earth Systems, 10(11), 2731-2754. https://doi.org/10.1029/2018MS001354
Commane, R., Lindaas, J., Benmergui, J., Luus, K. A., Chang, R. Y.-W., Daube, B. C., et al. (2017). Carbon dioxide sources from Alaska driven by increasing early winter respiration from Arctic tundra. Proceedings of the National Academy of Sciences, 114(21), 5361-5366. https://doi.org/ 10.1073/pnas. 1618567114
Delwiche, K. B., Knox, S. H., Malhotra, A., Fluet-Chouinard, E., McNicol, G., Feron, S., et al. (2021). FLUXNET-CH4: A global, multiecosystem dataset and analysis of methane seasonality from freshwater wetlands. Earth System Science Data, 13(7), 3607-3689. https:// doi.org/10.5194/essd-13-3607-2021
Ekici, A., Beer, C., Hagemann, S., Boike, J., Langer, M., & Hauck, C. (2014). Simulating high-latitude permafrost regions by the JSBACH terrestrial ecosystem model. Geoscientific Model Development, 7(2), 631-647. https://doi.org/10.5194/gmd-7-631-2014
Elder, C. D., Thompson, D. R., Thorpe, A. K., Chandanpurkar, H. A., Hanke, P. J., Hasson, N., et al. (2021). Characterizing methane emission hotspots from thawing permafrost. Global Biogeochemical Cycles, 35(12), e2020GB006922. https://doi.org/10.1029/2020GB006922
Estop-Aragonés, C., Olefeldt, D., Abbott, B. W., Chanton, J. P., Czimczik, C. I., Dean, J. F., et al. (2020). Assessing the potential for mobilization of old soil carbon after permafrost thaw: A synthesis of 14C measurements from the northern permafrost region. Global Biogeochemical Cycles, 34(9), e2020GB006672. https://doi.org/10.1029/2020GB006672
Euskirchen, E. S., Edgar, C. W., Syndonia, B. H. M., Kade, A., Zimov, N., & Zimov, S. (2017). Interannual and seasonal patterns of carbon dioxide, water, and energy fluxes from ecotonal and thermokarst-impacted ecosystems on carbon-rich permafrost soils in Northeastern Siberia. Journal of Geophysical Research: Biogeosciences, 122(10), 2651-2668. https://doi.org/10.1002/2017JG004070
Euskirchen, E. S., Edgar, C. W., Turetsky, M. R., Waldrop, M. P., & Harden, J. W. (2014). Differential response of carbon fluxes to climate in three peatland ecosystems that vary in the presence and stability of permafrost. Journal of Geophysical Research: Biogeosciences, 119(8), 1576-1595. https://doi.org/10.1002/2014JG002683
Eyring, V., Bony, S., Meehl, G. A., Senior, C. A., Stevens, B., Stouffer, R. J., & Taylor, K. E. (2016). Overview of the coupled model intercomparison project phase 6 (CMIP6) experimental design and organization. Geoscientific Model Development, 9(5), 1937-1958. https://doi. org/10.5194/gmd-9-1937-2016
Fan, L., Wigneron, J. P., Ciais, P., Chave, J., Brandt, M., Sitch, S., et al. (2023). Siberian carbon sink reduced by forest disturbances. Nature Geoscience, 16(1), 56-62. https://doi.org/10.1038/s41561-022-01087-x
Farquharson, L. M., Romanovsky, V. E., Kholodov, A., & Nicolsky, D. (2022). Sub-aerial talik formation observed across the discontinuous permafrost zone of Alaska. Nature Geoscience, 15(6), 475-481. https://doi.org/10.1038/s41561-022-00952-z
Fewster, R. E., Morris, P. J., Ivanovic, R. F., Swindles, G. T., Peregon, A. M., & Smith, C. J. (2022). Imminent loss of climate space for permafrost peatlands in Europe and Western Siberia. Nature Climate Change, 12(4), 373-379. https://doi.org/10.1038/s41558-022-01296-7
Fisher, J. B., Hayes, D. J., Schwalm, C. R., Huntzinger, D. N., Stofferahn, E., Schaefer, K., et al. (2018). Missing pieces to modeling the ArcticBoreal puzzle. Environmental Research Letters, 13(2), 020202. https://doi.org/10.1088/1748-9326/aa9d9a
Fisher, J. B., Huntzinger, D. N., Schwalm, C. R., & Sitch, S. (2014). Modeling the terrestrial biosphere. Annual Review of Environment and Resources, 39(1), 91-123. https://doi.org/10.1146/annurev-environ-012913-093456
Foster, A. C., Wang, J. A., Frost, G. V., Davidson, S. J., Hoy, E., Turner, K. W., et al. (2022). Disturbances in North American boreal forest and arctic tundra: Impacts, interactions, and responses. Environmental Research Letters, 17(11), 113001. https://doi.org/10.1088/1748-9326/ ac98d7
Friedlingstein, P., Jones, M. W., O’Sullivan, M., Andrew, R. M., Bakker, D. C. E., Hauck, J., et al. (2022). Global Carbon Budget 2021. Earth System Science Data, 14(4), 1917-2005. https://doi.org/10.5194/essd-14-1917-2022
Friedrich, D., Hirnsperger, M., & Bauer, S. (Eds.) (2022). More than “nature, Research on infrastructure and Settlements in the North. LIT Verlag.
Frieler, K., Lange, S., Piontek, F., Reyer, C. P. O., Schewe, J., Warszawski, L., et al. (2017). Assessing the impacts of
Frolking, S., & Roulet, N. T. (2007). Holocene radiative forcing impact of northern peatland carbon accumulation and methane emissions. Global Change Biology, 13(5), 1079-1088. https://doi.org/10.1111/j.1365-2486.2007.01339.x
Frolking, S., Talbot, J., Jones, M. C., Treat, C. C., Kauffman, J. B., Tuittila, E.-S., & Roulet, N. (2011). Peatlands in the Earth’s 21st century climate systems. Environmental Reviews, 19(NA), 371-396. https://doi.org/10.1139/A11-014
Galera, L. d. A., Eckhardt, T., Beer, C., Pfeiffer, E.-M., & Knoblauch, C. (2023). Ratio of in situ CO2 to CH4 production and its environmental controls in polygonal tundra soils of Samoylov Island, Northeastern Siberia. Journal of Geophysical Research: Biogeosciences, 128(4), e2022JG006956. https://doi.org/10.1029/2022JG006956
Gorham, E., Lehman, C., Dyke, A., Janssens, J., & Dyke, L. (2007). Temporal and spatial aspects of peatland initiation following deglaciation in North America. Quaternary Science Reviews, 26(3-4), 300-311. https://doi.org/10.1016/j.quascirev.2006.08.008
Groendahl, L., Friborg, T., & Soegaard, H. (2007). Temperature and snow-melt controls on interannual variability in carbon exchange in the high Arctic. Theoretical and Applied Climatology, 88(1), 111-125. https://doi.org/10.1007/s00704-005-0228-y
Gruber, S. (2012). Derivation and analysis of a high-resolution estimate of global permafrost zonation. The Cryosphere, 6(1), 221-233. https://doi. org/10.5194/tc-6-221-2012
Gulev, S. K., Thorne, P. W., Ahn, J., Dentener, F. J., Domingues, C. M., Gerland, S., et al. (2021). Changing state of the climate system. In V. Masson-Delmotte, P. Zhai, A. Pirani, S. L. Connors, C. Péan, S. Berger, et al. (Eds.), Climate change 2021: The physical science basis. Contribution of working group I to the sixth assessment report of the intergovernmental panel on climate change (pp. 287-422). Cambridge University Press.
Harden, J. W., Koven, C. D., Ping, C.-L., Hugelius, G., McGuire, A. D., Camill, P., et al. (2012). Field information links permafrost carbon to physical vulnerabilities of thawing. Geophysical Research Letters, 39(15), L15704. https://doi.org/10.1029/2012gl051958
Harden, J. W., Manies, K. L., Turetsky, M. R., & Neff, J. C. (2006). Effects of wildfire and permafrost on soil organic matter and soil climate in interior Alaska. Global Change Biology, 12(12), 2391-2403. https://doi.org/10.1111/j.1365-2486.2006.01255.x
Harden, J. W., Sundquist, E. T., Stallard, R. F., & Mark, R. K. (1992). Dynamics of soil carbon during deglaciation of the Laurentide ice-sheet. Science, 258(5090), 1921-1924. https://doi.org/10.1126/science.258.5090.1921
Harris, S. A., French, H. M., Heginbottom, J. A., Johnston, G. H., Ladanyi, B., Sego, D. C., & Van Everdingen, R. O. (1988). Glossary of permafrost and related ground-ice terms (Technical Memorandum No. 142). Retrieved from Ottawa.
Hartley, I. P., Garnett, M. H., Sommerkorn, M., Hopkins, D. W., Fletcher, B. J., Sloan, V. L., et al. (2012). A potential loss of carbon associated with greater plant growth in the European Arctic. Nature Climate Change, 2(12), 875-879. https://doi.org/10.1038/nclimate1575
Hashemi, J., Zona, D., Arndt, K. A., Kalhori, A., & Oechel, W. C. (2021). Seasonality buffers carbon budget variability across heterogeneous landscapes in Alaskan Arctic tundra. Environmental Research Letters, 16(3), 035008. https://doi.org/10.1088/1748-9326/abe2d1
Hayes, D. J., Butman, D. E., Domke, G. M., Fisher, J. B., Neigh, C. S. R., & Welp, L. R. (2022). Chapter 6 – boreal forests. In B. Poulter, J. G. Canadell, D. J. Hayes, & R. L. Thompson (Eds.), Balancing greenhouse gas budgets (pp. 203-236). Elsevier. https://doi.org/10.1016/b978-0-12-814952-2.00025-3
Heijmans, M. M. P. D., Magnússon, R. Í., Lara, M. J., Frost, G. V., Myers-Smith, I. H., Van Huissteden, J., et al. (2022). Tundra vegetation change and impacts on permafrost. Nature Reviews Earth & Environment, 3(1), 68-84. https://doi.org/10.1038/s43017-021-00233-0
Helbig, M., Chasmer, L. E., Kljun, N., Quinton, W. L., Treat, C. C., & Sonnentag, O. (2017). The positive net radiative greenhouse gas forcing of increasing methane emissions from a thawing boreal forest-wetland landscape. Global Change Biology, 23(6), 2413-2427. https://doi.org/10. 1111/gcb. 13520
Hengl, T., Mendes de Jesus, J., Heuvelink, G. B. M., Ruiperez Gonzalez, M., Kilibarda, M., Blagotić, A., et al. (2017). SoilGrids250m: Global gridded soil information based on machine learning. Plos One, 12(2), e0169748. https://doi.org/10.1371/journal.pone. 0169748
Hewitt, R. E., Taylor, D. L., Genet, H., McGuire, A. D., & Mack, M. C. (2019). Below-ground plant traits influence tundra plant acquisition of newly thawed permafrost nitrogen. Journal of Ecology, 107(2), 950-962. https://doi.org/10.1111/1365-2745.13062
Hirst, C., Monhonval, A., Mauclet, E., Thomas, M., Villani, M., Ledman, J., et al. (2023). Evidence for late winter biogeochemical connectivity in permafrost soils. Communications Earth & Environment, 4(1), 85. https://doi.org/10.1038/s43247-023-00740-6
Hiyama, T., Ueyama, M., Kotani, A., Iwata, H., Nakai, T., Okamura, M., et al. (2021). Lessons learned from more than a decade of greenhouse gas flux measurements at boreal forests in eastern Siberia and interior Alaska. Polar Science, 27, 100607. https://doi.org/10.1016/j.polar.2020. 100607
Holloway, J. E., Lewkowicz, A. G., Douglas, T. A., Li, X., Turetsky, M. R., Baltzer, J. L., & Jin, H. (2020). Impact of wildfire on permafrost landscapes: A review of recent advances and future prospects. Permafrost and Periglacial Processes, 31(3), 371-382. https://doi.org/10.1002/ ppp. 2048
Hugelius, G., Bockheim, J. G., Camill, P., Elberling, B., Grosse, G., Harden, J. W., et al. (2013). A new data set for estimating organic carbon storage to 3 m depth in soils of the northern circumpolar permafrost region. Earth System Science Data, 5(2), 393-402. https://doi.org/10.5194/ essd-5-393-2013
Hugelius, G., Loisel, J., Chadburn, S., Jackson, R. B., Jones, M., MacDonald, G., et al. (2020). Large stocks of peatland carbon and nitrogen are vulnerable to permafrost thaw. Proceedings of the National Academy of Sciences, 117(34), 20438-20446. https://doi.org/10.1073/pnas. 1916387117
Hugelius, G., Ramage, J. L., Burke, E. J., Chatterjee, A., Smallman, T. L., Aalto, T., et al. (2023). Two decades of permafrost region CO2, CH4, and N 2 O budgets suggest a small net greenhouse gas source to the atmosphere. ESS Open Archive. https://doi.org/10.22541/essoar.169444320. 01914726/v1
Hugelius, G., Strauss, J., Zubrzycki, S., Harden, J. W., Schuur, E. A. G., Ping, C. L., et al. (2014). Estimated stocks of circumpolar permafrost carbon with quantified uncertainty ranges and identified data gaps. Biogeosciences, 11(23), 6573-6593. https://doi.org/10.5194/bg-11-65732014
Huntzinger, D. N., Schaefer, K., Schwalm, C., Fisher, J. B., Hayes, D., Stofferahn, E., et al. (2020). Evaluation of simulated soil carbon dynamics in Arctic-Boreal ecosystems. Environmental Research Letters, 15(2), 025005. https://doi.org/10.1088/1748-9326/ab6784
IPCC. (2021). In J. M. Gutiérrez & A. M. Tréguier (Eds.), Annex II: Models In V. Masson-delmotte, P. Zhai, A. Pirani, S. L. Connors, C. Péan, S. Berger, N. Caud, Y. Chen, L. Goldfarb, M. I. Gomis, M. Huang, K. Leitzell, E. Lonnoy, J. B. R. Matthews, T. K. Maycock, T. Waterfield, O. Yelekçi, R. Yu, & B. Zhou (Eds.), climate change 2021: The physical science basis. Contribution of working group I to the sixth assessment report of the intergovernmental panel on climate change (pp. 2087-2138). Cambridge University Press.
Ito, A., Li, T., Qin, Z., Melton, J. R., Tian, H., Kleinen, T., et al. (2023). Cold-season methane fluxes simulated by GCP-CH4 Models. Geophysical Research Letters, 50(14), e2023GL103037. https://doi.org/10.1029/2023GL103037
Jones, M. C., Grosse, G., Treat, C., Turetsky, M., Anthony, K. W., & Brosius, L. (2023). Past permafrost dynamics can inform future permafrost carbon-climate feedbacks. Communications Earth & Environment, 4(1), 272. https://doi.org/10.1038/s43247-023-00886-3
Jones, M. C., Harden, J., O’Donnell, J., Manies, K., Jorgenson, T., Treat, C., & Ewing, S. (2017). Rapid carbon loss and slow recovery following permafrost thaw in boreal peatlands. Global Change Biology, 23(3), 1109-1127. https://doi.org/10.1111/gcb. 13403
Jones, M. W., Abatzoglou, J. T., Veraverbeke, S., Andela, N., Lasslop, G., Forkel, M., et al. (2022). Global and regional trends and drivers of fire under climate change. Reviews of Geophysics, 60(3), e2020RG000726. https://doi.org/10.1029/2020RG000726
Jorgensen, C. J., Johansen, K. M. L., Westergaard-Nielsen, A., & Elberling, B. (2015). Net regional methane sink in high arctic soils of northeast Greenland. Nature Geoscience, 8(1), 20-23. https://doi.org/10.1038/ngeo2305
Jorgenson, M. T., & Osterkamp, T. E. (2005). Response of boreal ecosystems to varying modes of permafrost degradation. Canadian Journal of Forest Research-Revue Canadienne De Recherche Forestiere, 35(9), 2100-2111. https://doi.org/10.1139/X05-153
Jorgenson, M. T., Shur, Y. L., & Pullman, E. R. (2006). Abrupt increase in permafrost degradation in Arctic Alaska. Geophysical Research Letters, 33(2), L02503. https://doi.org/10.1029/2005GL024960
Jung, M., Schwalm, C., Migliavacca, M., Walther, S., Camps-Valls, G., Koirala, S., et al. (2020). Scaling carbon fluxes from eddy covariance sites to globe: Synthesis and evaluation of the FLUXCOM approach. Biogeosciences, 17(5), 1343-1365. https://doi.org/10.5194/bg-17-1343-2020
Karesdotter, E., Destouni, G., Ghajarnia, N., Hugelius, G., & Kalantari, Z. (2021). Mapping the vulnerability of Arctic wetlands to global warming. Earths Future, 9(5). https://doi.org/10.1029/2020ef001858
Keuper, F., Wild, B., Kummu, M., Beer, C., Blume-Werry, G., Fontaine, S., et al. (2020). Carbon loss from northern circumpolar permafrost soils amplified by rhizosphere priming. Nature Geoscience, 13(8), 560-565. https://doi.org/10.1038/s41561-020-0607-0
Kicklighter, D. W., Hayes, D. J., McClelland, J. W., Peterson, B. J., McGuire, A. D., & Melillo, J. M. (2013). Insights and issues with simulating terrestrial DOC loading of Arctic river networks. Ecological Applications, 23(8), 1817-1836. https://doi.org/10.1890/11-1050.1
Kim, J., Kim, Y., Zona, D., Oechel, W., Park, S.-J., Lee, B.-Y., et al. (2021). Carbon response of tundra ecosystems to advancing greenup and snowmelt in Alaska. Nature Communications, 12(1), 6879. https://doi.org/10.1038/s41467-021-26876-7
Kim, Y., Kimball, J. S., Zhang, K., & McDonald, K. C. (2012). Satellite detection of increasing Northern Hemisphere non-frozen seasons from 1979 to 2008: Implications for regional vegetation growth. Remote Sensing of Environment, 121, 472-487. https://doi.org/10.1016/j.rse.2012. 02.014
Kleber, G. E., Hodson, A. J., Magerl, L., Mannerfelt, E. S., Bradbury, H. J., Zhu, Y. Z., et al. (2023). Groundwater springs formed during glacial retreat are a large source of methane in the high Arctic. Nature Geoscience, 16(7), 597-604. https://doi.org/10.1038/s41561-023-01210-6
Klotz, L. A., Sonnentag, O., Wang, Z., Wang, J. A., & Kang, M. (2023). Oil and natural gas wells across the NASA ABoVE domain: Fugitive methane emissions and broader environmental impacts. Environmental Research Letters, 18(3), 035008. https://doi.org/10.1088/1748-9326/ acbe52
Knox, S. H., Jackson, R. B., Poulter, B., McNicol, G., Fluet-Chouinard, E., Zhang, Z., et al. (2019). FLUXNET-CH4 synthesis activity: Objectives, observations, and future directions. Bulletin of the American Meteorological Society, 100(12), 2607-2632. https://doi.org/10.1175/ bams-d-18-0268.1
Kohnert, K., Serafimovich, A., Metzger, S., Hartmann, J., & Sachs, T. (2017). Strong geologic methane emissions from discontinuous terrestrial permafrost in the Mackenzie Delta, Canada. Scientific Reports, 7(1), 5828. https://doi.org/10.1038/s41598-017-05783-2
Koven, C. D., Ringeval, B., Friedlingstein, P., Ciais, P., Cadule, P., Khvorostyanov, D., et al. (2011). Permafrost carbon-climate feedbacks accelerate global warming. Proceedings of the National Academy of Sciences, 108(36), 14769-14774. https://doi.org/10.1073/pnas. 1103910108
Kuhn, M. A., Varner, R., Bastviken, D., Crill, P., MacIntyre, S., Turetsky, M. R., et al. (2021a). BAWLD-CH4: Methane fluxes from boreal and arctic ecosystems [Dataset]. Arctic Data Center. https://doi.org/10.18739/A2DN3ZX1R
Kuhn, M. A., Varner, R. K., Bastviken, D., Crill, P., MacIntyre, S., Turetsky, M., et al. (2021b). BAWLD-CH4: A comprehensive dataset of methane fluxes from boreal and arctic ecosystems. Earth System Science Data, 13(11), 5151-5189. https://doi.org/10.5194/essd-13-5151-2021
Lai, D. Y. F. (2009). Methane dynamics in northern peatlands: A review. Pedosphere, 19(4), 409-421. https://doi.org/10.1016/S1002-0160(09) 00003-4
Lambert, M. S. A., Tang, H., Aas, K. S., Stordal, F., Fisher, R. A., Fang, Y., et al. (2022). Inclusion of a cold hardening scheme to represent frost tolerance is essential to model realistic plant hydraulics in the Arctic-boreal zone in CLM5.0-FATES-Hydro. Geoscientific Model Development, 15(23), 8809-8829. https://doi.org/10.5194/gmd-15-8809-2022
Lange, S. (2019). Trend-preserving bias adjustment and statistical downscaling with ISIMIP3BASD (v1.0). Geoscientific Model Development, 12(7), 3055-3070. https://doi.org/10.5194/gmd-12-3055-2019
Lawrence, D. M., Slater, A. G., & Swenson, S. C. (2012). Simulation of present-day and future permafrost and seasonally frozen ground conditions in CCSM4. Journal of Climate, 25(7), 2207-2225. https://doi.org/10.1175/jcli-d-11-00334.1
Le Mer, J., & Roger, P. (2001). Production, oxidation, emission and consumption of methane by soils: A review. European Journal of Soil Biology, 37(1), 25-50. https://doi.org/10.1016/S1164-5563(01)01067-6
Li, X.-Y., Jin, H.-J., Wang, H.-W., Marchenko, S. S., Shan, W., Luo, D.-L., et al. (2021). Influences of forest fires on the permafrost environment: A review. Advances in Climate Change Research, 12(1), 48-65. https://doi.org/10.1016/j.accre.2021.01.001
Li, Z.-L., Mu, C.-C., Chen, X., Wang, X.-Y., Dong, W.-W., Jia, L., et al. (2021). Changes in net ecosystem exchange of CO2 in Arctic and their relationships with climate change during 2002-2017. Advances in Climate Change Research, 12(4), 475-481. https://doi.org/10.1016/j.accre. 2021.06.004
Liu, C. X., Huang, H. B., & Sun, F. D. (2021). A pixel-based vegetation greenness trend analysis over the Russian tundra with all available landsat data from 1984 to 2018. Remote Sensing, 13(23), 15. https://doi.org/10.3390/rs13234933
Liu, Z., Kimball, J. S., Ballantyne, A. P., Parazoo, N. C., Wang, W. J., Bastos, A., et al. (2022). Respiratory loss during late-growing season determines the net carbon dioxide sink in northern permafrost regions. Nature Communications, 13(1), 5626. https://doi.org/10.1038/s41467-022-33293-х
López-Blanco, E., Exbrayat, J. F., Lund, M., Christensen, T. R., Tamstorf, M. P., Slevin, D., et al. (2019). Evaluation of terrestrial pan-Arctic carbon cycling using a data-assimilation system. Earth System Dynamics, 10(2), 233-255. https://doi.org/10.5194/esd-10-233-2019
Lund, M., Lafleur, P. M., Roulet, N. T., Lindroth, A., Christensen, T. R., Aurela, M., et al. (2010). Variability in exchange of CO2 across 12 northern peatland and tundra sites. Global Change Biology, 16(9), 2436-2448. https://doi.org/10.1111/j.1365-2486.2009.02104.x
Lund, M., Raundrup, K., Westergaard-Nielsen, A., López-Blanco, E., Nymand, J., & Aastrup, P. (2017). Larval outbreaks in West Greenland: Instant and subsequent effects on tundra ecosystem productivity and CO2 exchange. Ambio, 46(1), 26-38. https://doi.org/10.1007/s13280-016-0863-9
Luo, Y., & Schuur, E. A. G. (2020). Model parameterization to represent processes at unresolved scales and changing properties of evolving systems. Global Change Biology, 26(3), 1109-1117. https://doi.org/10.1111/gcb. 14939
Luo, Y. Q., Randerson, J. T., Abramowitz, G., Bacour, C., Blyth, E., Carvalhais, N., et al. (2012). A framework for benchmarking land models. Biogeosciences, 9(10), 3857-3874. https://doi.org/10.5194/bg-9-3857-2012
Lyu, Z., Genet, H., He, Y. J., Zhuang, Q. L., McGuire, A. D., Bennett, A., et al. (2018). The role of environmental driving factors in historical and projected carbon dynamics of wetland ecosystems in Alaska. Ecological Applications, 28(6), 1377-1395. https://doi.org/10.1002/eap.1755
Mack, M. C., Walker, X. J., Johnstone, J. F., Alexander, H. D., Melvin, A. M., Jean, M., & Miller, S. N. (2021). Carbon loss from boreal forest wildfires offset by increased dominance of deciduous trees. Science, 372(6539), 280-283. https://doi.org/10.1126/science.abf3903
Malhotra, A., Todd-Brown, K., Nave, L. E., Batjes, N. H., Holmquist, J. R., Hoyt, A. M., et al. (2019). The landscape of soil carbon data: Emerging questions, synergies and databases. Progress in Physical Geography: Earth and Environment, 43(5), 707-719. https://doi.org/10.1177/ 0309133319873309
Matthews, E., & Fung, I. (1987). Methane emission from natural wetlands: Global distribution, area, and environmental characteristics of sources. Global Biogeochemical Cycles, 1(1), 61-86. https://doi.org/10.1029/GB001i001p00061
McGuire, A. D., Anderson, L. G., Christensen, T. R., Dallimore, S., Guo, L. D., Hayes, D. J., et al. (2009). Sensitivity of the carbon cycle in the Arctic to climate change. Ecological Monographs, 79(4), 523-555. https://doi.org/10.1890/08-2025.1
McGuire, A. D., Christensen, T. R., Hayes, D., Heroult, A., Euskirchen, E., Kimball, J. S., et al. (2012). An assessment of the carbon balance of Arctic tundra: Comparisons among observations, process models, and atmospheric inversions. Biogeosciences, 9(8), 3185-3204. https://doi. org/10.5194/bg-9-3185-2012
McGuire, A. D., Genet, H., Lyu, Z., Pastick, N., Stackpoole, S., Birdsey, R., et al. (2018a). Assessing historical and projected carbon balance of Alaska: A synthesis of results and policy/management implications. Ecological Applications, 28(6), 1396-1412. https://doi.org/10.1002/eap. 1768
McGuire, A. D., Koven, C., Lawrence, D. M., Clein, J. S., Xia, J., Beer, C., et al. (2016). Variability in the sensitivity among model simulations of permafrost and carbon dynamics in the permafrost region between 1960 and 2009. Global Biogeochemical Cycles, 30(7), 1015-1037. https:// doi.org/10.1002/2016GB005405
McGuire, A. D., Lawrence, D. M., Koven, C., Clein, J. S., Burke, E., Chen, G., et al. (2018b). Dependence of the evolution of carbon dynamics in the northern permafrost region on the trajectory of climate change. Proceedings of the National Academy of Sciences, 115(15), 3882-3887. https://doi.org/10.1073/pnas. 1719903115
McNicol, G., Fluet-Chouinard, E., Ouyang, Z., Knox, S., Zhang, Z., Aalto, T., et al. (2023). Upscaling wetland methane emissions from the FLUXNET-CH4 Eddy covariance network (UpCH4 v1.0): Model development, network assessment, and budget comparison. AGU Advances, 4(5), e2023AV000956. https://doi.org/10.1029/2023AV000956
Mekonnen, Z. A., Riley, W. J., Berner, L. T., Bouskill, N. J., Torn, M. S., Iwahana, G., et al. (2021). Arctic tundra shrubification: A review of mechanisms and impacts on ecosystem carbon balance. Environmental Research Letters, 16(5), 28. https://doi.org/10.1088/1748-9326/abf28b
Meredith, M., Sommerkorn, M., Cassotta, S., Derksen, C., Ekaykin, A., Hollowed, A. B., et al. (2019). Polar regions. Cambridge.
Miller, S. M., Miller, C. E., Commane, R., Chang, R. Y. W., Dinardo, S. J., Henderson, J. M., et al. (2016). A multiyear estimate of methane fluxes in Alaska from CARVE atmospheric observations. Global Biogeochemical Cycles, 30(10), 1441-1453. https://doi.org/10.1002/ 2016GB005419
Miner, K. R., Turetsky, M. R., Malina, E., Bartsch, A., Tamminen, J., McGuire, A. D., et al. (2022). Permafrost carbon emissions in a changing Arctic. Nature Reviews Earth & Environment, 3(1), 55-67. https://doi.org/10.1038/s43017-021-00230-3
Mishra, U., Hugelius, G., Shelef, E., Yang, Y., Strauss, J., Lupachev, A., et al. (2021). Spatial heterogeneity and environmental predictors of permafrost region soil organic carbon stocks. Science Advances, 7(9), eaaz5236. https://doi.org/10.1126/sciadv.aaz5236
Myers-Smith, I. H., Kerby, J. T., Phoenix, G. K., Bjerke, J. W., Epstein, H. E., Assmann, J. J., et al. (2020). Complexity revealed in the greening of the Arctic. Nature Climate Change, 10(2), 106-117. https://doi.org/10.1038/s41558-019-0688-1
Natali, S. M., Bronen, R., Cochran, P., Holdren, J. P., Rogers, B. M., & Treharne, R. (2022). Incorporating permafrost into climate mitigation and adaptation policy. Environmental Research Letters, 17(9), 091001. https://doi.org/10.1088/1748-9326/ac8c5a
Natali, S. M., Watts, J. D., Rogers, B. M., Potter, S., Ludwig, S. M., Selbmann, A.-K., et al. (2019). Large loss of CO2 in winter observed across the northern permafrost region. Nature Climate Change, 9(11), 852-857. https://doi.org/10.1038/s41558-019-0592-8
Nicolsky, D. J., Romanovsky, V. E., Alexeev, V. A., & Lawrence, D. M. (2007). Improved modeling of permafrost dynamics in a GCM landsurface scheme. Geophysical Research Letters, 34(8). https://doi.org/10.1029/2007gl029525
Nilsson, M., Mikkela, C., Sundh, I., Granberg, G., Svensson, B. H., & Ranneby, B. (2001). Methane emission from Swedish mires: National and regional budgets and dependence on mire vegetation. Journal of Geophysical Research, 106(D18), 20847-20860. https://doi.org/10.1029/ 2001jd900119
Nitze, I., Grosse, G., Jones, B. M., Romanovsky, V. E., & Boike, J. (2018). Remote sensing quantifies widespread abundance of permafrost region disturbances across the Arctic and Subarctic. Nature Communications, 9(1), 5423. https://doi.org/10.1038/s41467-018-07663-3
Obu, J. (2021). How much of the Earth’s surface is underlain by permafrost? Journal of Geophysical Research: Earth Surface, 126(5), e2021JF006123. https://doi.org/10.1029/2021JF006123
Obu, J., Westermann, S., Bartsch, A., Berdnikov, N., Christiansen, H. H., Dashtseren, A., et al. (2019). Northern Hemisphere permafrost map based on TTOP modelling for 2000-2016 at 1 km 2 scale. Earth-Science Reviews, 193, 299-316. https://doi.org/10.1016/j.earscirev.2019. 04.023
Olefeldt, D., Euskirchen, E. S., Harden, J., Kane, E., McGuire, A. D., Waldrop, M. P., & Turetsky, M. R. (2017). A decade of boreal rich fen greenhouse gas fluxes in response to natural and experimental water table variability. Global Change Biology, 23(6), 2428-2440. https://doi. org/10.1111/gcb. 13612
Olefeldt, D., Goswami, S., Grosse, G., Hayes, D., Hugelius, G., Kuhry, P., et al. (2016). Circumpolar distribution and carbon storage of thermokarst landscapes. Nature Communications, 7(1), 13043. https://doi.org/10.1038/ncomms13043
Olefeldt, D., Hovemyr, M., Kuhn, M. A., Bastviken, D., Bohn, T. J., Connolly, J., et al. (2021). The boreal-Arctic wetland and lake dataset (BAWLD). Earth System Science Data, 13(11), 5127-5149. https://doi.org/10.5194/essd-13-5127-2021
Olefeldt, D., Roulet, N. T., Bergeron, O., Crill, P., B%ockstrand, K., & Christensen, T. R. (2012). Net carbon accumulation of a high-latitude permafrost palsa mire similar to permafrost-free peatlands. Geophysics Research Letter, 39(3), L03501. https://doi.org/10.1029/2011gl050355
Olefeldt, D., Turetsky, M. R., Crill, P. M., & McGuire, A. D. (2013). Environmental and physical controls on northern terrestrial methane emissions across permafrost zones. Global Change Biology, 19(2), 589-603. https://doi.org/10.1111/gcb. 12071
O’Neill, H. B., Wolfe, S. A., & Duchesne, C. (2019). New ground ice maps for Canada using a paleogeographic modelling approach. The Cryosphere, 13(3), 753-773. https://doi.org/10.5194/tc-13-753-2019
Öquist, M. G., Sparrman, T., Klemedtsson, L., Drotz, S. H., Grip, H., Schleucher, J., & Nilsson, M. (2009). Water availability controls microbial temperature responses in frozen soil CO2 production. Global Change Biology, 15(11), 2715-2722. https://doi.org/10.1111/j.1365-2486.2009. 01898.x
Outcalt, S. I., Nelson, F. E., & Hinkel, K. M. (1990). The zero-curtain effect: Heat and mass transfer across an isothermal region in freezing soil. Water Resources Research, 26(7), 1509-1516. https://doi.org/10.1029/WR026i007p01509
Overduin, P. P., Schneider von Deimling, T., Miesner, F., Grigoriev, M. N., Ruppel, C., Vasiliev, A., et al. (2019). Submarine permafrost map in the Arctic modeled using 1-D transient heat flux (SuPerMAP). Journal of Geophysical Research: Oceans, 124(6), 3490-3507. https://doi.org/ 10.1029/2018JC014675
Pallandt, M. M. T. A., Kumar, J., Mauritz, M., Schuur, E. A. G., Virkkala, A. M., Celis, G., et al. (2022). Representativeness assessment of the panArctic eddy covariance site network and optimized future enhancements. Biogeosciences, 19(3), 559-583. https://doi.org/10.5194/bg-19-5592022
Palmtag, J., Obu, J., Kuhry, P., Richter, A., Siewert, M. B., Weiss, N., et al. (2022). A high spatial resolution soil carbon and nitrogen dataset for the northern permafrost region based on circumpolar land cover upscaling. Earth System Science Data, 14(9), 4095-4110. https://doi.org/10. 5194/essd-14-4095-2022
Payette, S., Delwaide, A., Caccianiga, M., & Beauchemin, M. (2004). Accelerated thawing of subarctic peatland permafrost over the last 50 years. Geophysical Research Letters, 31(18), L18208. https://doi.org/10.1029/2004GL020358
Pedron, S. A., Welker, J. M., Euskirchen, E. S., Klein, E. S., Walker, J. C., Xu, X., & Czimczik, C. I. (2022). Closing the winter gap—Year-round measurements of soil CO2 emission sources in arctic tundra. Geophysical Research Letters, 49(6), e2021GL097347. https://doi.org/10.1029/ 2021GL097347
Peltola, O., Vesala, T., Gao, Y., Räty, O., Alekseychik, P., Aurela, M., et al. (2019a). Monthly gridded data product of northern wetland methane emissions based on upscaling eddy covariance observations. Earth System Science Data, 11(3), 1263-1289. https://doi.org/10.5194/essd-11-1263-2019
Peltola, O., Vesala, T., Gao, Y., Räty, O., Alekseychik, P., Aurela, M., et al. (2019b). Dataset for “monthly gridded data product of northern wetland methane emissions based on upscaling eddy covariance observations” [Dataset]. Zenodo. https://doi.org/10.5281/zenodo. 3247295
Pirk, N., Sievers, J., Mertes, J., Parmentier, F. J. W., Mastepanov, M., & Christensen, T. R. (2017). Spatial variability of CO2 uptake in polygonal tundra: Assessing low-frequency disturbances in eddy covariance flux estimates. Biogeosciences, 14(12), 3157-3169. https://doi.org/10.5194/ bg-14-3157-2017
Plaza, C., Pegoraro, E., Bracho, R., Celis, G., Crummer, K. G., Hutchings, J. A., et al. (2019). Direct observation of permafrost degradation and rapid soil carbon loss in tundra. Nature Geoscience, 12(8), 627-631. https://doi.org/10.1038/s41561-019-0387-6
Poggio, L., De Sousa, L. M., Batjes, N. H., Heuvelink, G. B. M., Kempen, B., Ribeiro, E., & Rossiter, D. (2021). SoilGrids 2.0: Producing soil information for the globe with quantified spatial uncertainty. SOIL, 7(1), 217-240. https://doi.org/10.5194/soil-7-217-2021
Ramage, J. L., Kuhn, M., Virkkala, A.-M., Voigt, C., Marushchak, M. E., Bastos, A., et al. (2023). The net GHG balance and budget of the permafrost region (2000-2020) from ecosystem flux upscaling. ESS Open Archive, 29. https://doi.org/10.22541/essoar.169462008. 85493456/v1
Ran, Y., Li, X., Cheng, G., Che, J., Aalto, J., Karjalainen, O., et al. (2022). New high-resolution estimates of the permafrost thermal state and hydrothermal conditions over the Northern Hemisphere. Earth System Science Data, 14(2), 865-884. https://doi.org/10.5194/essd-14-8652022
Rantanen, M., Karpechko, A. Y., Lipponen, A., Nordling, K., Hyvärinen, O., Ruosteenoja, K., et al. (2022). The Arctic has warmed nearly four times faster than the globe since 1979. Communications Earth & Environment, 3(1), 168. https://doi.org/10.1038/s43247-022-00498-3
Raynolds, M. K., Walker, D. A., Balser, A., Bay, C., Campbell, M., Cherosov, M. M., et al. (2019). A raster version of the circumpolar arctic vegetation map (CAVM). Remote Sensing of Environment, 232, 111297. https://doi.org/10.1016/j.rse.2019.111297
Reichstein, M., Bahn, M., Ciais, P., Frank, D., Mahecha, M. D., Seneviratne, S. I., et al. (2013). Climate extremes and the carbon cycle. Nature, 500(7462), 287-295. https://doi.org/10.1038/nature12350
Reid, K. A., Reid, D. G., & Brown, C. D. (2022). Patterns of vegetation change in Yukon: Recent findings and future research in dynamic subarctic ecosystems. Environmental Reviews, 30(3), 380-401. https://doi.org/10.1139/er-2021-0110
Romanovsky, V. E., & Osterkamp, T. E. (2000). Effects of unfrozen water on heat and mass transport processes in the active layer and permafrost. Permafrost and Periglacial Processes, 11(3), 219-239. https://doi.org/10.1002/1099-1530(200007/09)11:3<219::aid-ppp352>3.0.co;2-7
Rößger, N., Sachs, T., Wille, C., Boike, J., & Kutzbach, L. (2022). Seasonal increase of methane emissions linked to warming in Siberian tundra. Nature Climate Change, 12(11), 1031-1036. https://doi.org/10.1038/s41558-022-01512-4
Ruess, R. W., Winton, L. M., & Adams, G. C. (2021). Widespread mortality of trembling aspen (Populus tremuloides) throughout interior Alaskan boreal forests resulting from a novel canker disease. Plos One, 16(4), e0250078. https://doi.org/10.1371/journal.pone. 0250078
Salmon, V. G., Soucy, P., Mauritz, M., Celis, G., Natali, S. M., Mack, M. C., & Schuur, E. A. (2016). Nitrogen availability increases in a tundra ecosystem during five years of experimental permafrost thaw. Global Change Biology, 22(5), 1927-1941. https://doi.org/10.1111/gcb.13204
Saunois, M., Stavert, A. R., Poulter, B., Bousquet, P., Canadell, J. G., Jackson, R. B., et al. (2020). The global methane budget 2000-2017. Earth System Science Data, 12(3), 1561-1623. https://doi.org/10.5194/essd-12-1561-2020
Schädel, C., Bader, M. K. F., Schuur, E. A. G., Biasi, C., Bracho, R., Capek, P., et al. (2016). Potential carbon emissions dominated by carbon dioxide from thawed permafrost soils. Nature Climate Change, 6(10), 950-953. https://doi.org/10.1038/nclimate3054
Schaefer, K., Lantuit, H., Romanovsky, V. E., Schuur, E. A., & Witt, R. (2014). The impact of the permafrost carbon feedback on global climate. Environmental Research Letters, 9(8), 085003. https://doi.org/10.1088/1748-9326/9/8/085003
Scholten, R. C., Jandt, R., Miller, E. A., Rogers, B. M., & Veraverbeke, S. (2021). Overwintering fires in boreal forests. Nature, 593(7859), 399-404. https://doi.org/10.1038/s41586-021-03437-y
Schuur, E. A. G., Abbott, B. W., Commane, R., Ernakovich, J., Euskirchen, E., Hugelius, G., et al. (2022). Permafrost and climate change: Carbon cycle feedbacks from the warming arctic. Annual Review of Environment and Resources, 47(1), 343-371. https://doi.org/10.1146/annurev-environ-012220-011847
Schuur, E. A. G., Bockheim, J., Canadell, J. G., Euskirchen, E., Field, C. B., Goryachkin, S. V., et al. (2008). Vulnerability of permafrost carbon to climate change: Implications for the global carbon cycle. Bioscience, 58(8), 701-714. https://doi.org/10.1641/b580807
Schuur, E. A. G., Bracho, R., Celis, G., Belshe, E. F., Ebert, C., Ledman, J., et al. (2021). Tundra underlain by thawing permafrost persistently emits carbon to the atmosphere over 15 years of measurements. Journal of Geophysical Research-Biogeosciences, 126(6). https://doi.org/10. 1029/2020jg006044
Schuur, E. A. G., McGuire, A. D., Schädel, C., Grosse, G., Harden, J. W., Hayes, D. J., et al. (2015). Climate change and the permafrost carbon feedback. Nature, 520(7546), 171-179. https://doi.org/10.1038/nature14338
Schuur, E. A. G., Vogel, J. G., Crummer, K. G., Lee, H., Sickman, J. O., & Osterkamp, T. E. (2009). The effect of permafrost thaw on old carbon release and net carbon exchange from tundra. Nature, 459(7246), 556-559. https://doi.org/10.1038/nature08031
Schwalm, C. R., Schaefer, K., Fisher, J. B., Huntzinger, D., Elshorbany, Y., Fang, Y., et al. (2019). Divergence in land surface modeling: Linking spread to structure. Environmental Research Communications, 1(11), 111004. https://doi.org/10.1088/2515-7620/ab4a8a
Segers, R. (1998). Methane production and methane consumption: A review of processes underlying wetland methane fluxes. Biogeochemistry, 41(1), 23-51. https://doi.org/10.1023/a:1005929032764
Shaver, G. R., Billings, W. D., Chapin, F. S., Giblin, A. E., Nadelhoffer, K. J., Oechel, W. C., & Rastetter, E. B. (1992). Global change and the carbon balance of arctic ecosystems. Bioscience, 42(6), 433-441. https://doi.org/10.2307/1311862
Shevtsova, I., Heim, B., Kruse, S., Schroder, J., Troeva, E. I., Pestryakova, L. A., et al. (2020). Strong shrub expansion in tundra-taiga, tree infilling in taiga and stable tundra in central Chukotka (north-eastern Siberia) between 2000 and 2017. Environmental Research Letters, 15(8), 085006. https://doi.org/10.1088/1748-9326/ab9059
Shur, Y. L., Hinkel, K. M., & Nelson, F. E. (2005). The transient layer: Implications for geocryology and climate-change science. Permafrost and Periglacial Processes, 16(1), 5-17. https://doi.org/10.1002/ppp. 518
Shur, Y. L., & Jorgenson, M. T. (2007). Patterns of permafrost formation and degradation in relation to climate and ecosystems. Permafrost and Periglacial Processes, 18(1), 7-19. https://doi.org/10.1002/ppp. 582
Sistla, S. A., Moore, J. C., Simpson, R. T., Gough, L., Shaver, G. R., & Schimel, J. P. (2013). Long-term warming restructures Arctic tundra without changing net soil carbon storage. Nature, 497(7451), 615-618. https://doi.org/10.1038/nature12129
Sitch, S., Friedlingstein, P., Gruber, N., Jones, S. D., Murray-Tortarolo, G., Ahlström, A., et al. (2015). Recent trends and drivers of regional sources and sinks of carbon dioxide. Biogeosciences, 12(3), 653-679. https://doi.org/10.5194/bg-12-653-2015
Sjöberg, Y., Siewert, M. B., Rudy, A. C. A., Paquette, M., Bouchard, F., Malenfant-Lepage, J., & Fritz, M. (2020). Hot trends and impact in permafrost science. Permafrost and Periglacial Processes, 31(4), 461-471. https://doi.org/10.1002/ppp. 2047
Smith, S. L., O’Neill, H. B., Isaksen, K., Noetzli, J., & Romanovsky, V. E. (2022). The changing thermal state of permafrost. Nature Reviews Earth & Environment, 3(1), 10-23. https://doi.org/10.1038/s43017-021-00240-1
Song, X., Wang, D.-Y., Li, F., & Zeng, X.-D. (2021). Evaluating the performance of CMIP6 Earth system models in simulating global vegetation structure and distribution. Advances in Climate Change Research, 12(4), 584-595. https://doi.org/10.1016/j.accre.2021.06.008
Stofferahn, E., Fisher, J. B., Hayes, D. J., Schwalm, C. R., Huntzinger, D. N., Hantson, W., et al. (2019). The Arctic-Boreal vulnerability experiment model benchmarking system. Environmental Research Letters, 14(5), 055002. https://doi.org/10.1088/1748-9326/ab10fa
Strack, M., Hayne, S., Lovitt, J., McDermid, G. J., Rahman, M. M., Saraswati, S., & Xu, B. (2019). Petroleum exploration increases methane emissions from northern peatlands. Nature Communications, 10(1), 2804. https://doi.org/10.1038/s41467-019-10762-4
Strauss, J., Laboor, S., Schirrmeister, L., Fedorov, A. N., Fortier, D., Froese, D., et al. (2021). Circum-Arctic map of the Yedoma permafrost domain. Frontiers in Earth Science, 9. https://doi.org/10.3389/feart.2021.758360
Strauss, J., Laboor, S., Schirrmeister, L., Fedorov, A. N., Fortier, D., Froese, D. G., et al. (2022). Database of ice-rich Yedoma permafrost version 2 (IRYP v2). PANGAEA. https://doi.org/10.1594/PANGAEA. 940078
Strauss, J., Schirrmeister, L., Grosse, G., Fortier, D., Hugelius, G., Knoblauch, C., et al. (2017). Deep Yedoma permafrost: A synthesis of depositional characteristics and carbon vulnerability. Earth-Science Reviews, 172, 75-86. https://doi.org/10.1016/j.earscirev.2017.07.007
Sturm, M., Schimel, J., Michaelson, G., Welker, J. M., Oberbauer, S. F., Liston, G. E., et al. (2005). Winter biological processes could help convert arctic tundra to shrubland. Bioscience, 55(1), 17-26. https://doi.org/10.1641/0006-3568(2005)055[0017:wbpchc]2.0.co;2
Sweeney, C., Dlugokencky, E., Miller, C. E., Wofsy, S., Karion, A., Dinardo, S., et al. (2016). No significant increase in long-term CH4 emissions on North Slope of Alaska despite significant increase in air temperature. Geophysical Research Letters, 43(12), 6604-6611. https://doi.org/10. 1002/2016GL069292
Tank, S. E., Vonk, J. E., Walvoord, M. A., McClelland, J. W., Laurion, I., & Abbott, B. W. (2020). Landscape matters: Predicting the biogeochemical effects of permafrost thaw on aquatic networks with a state factor approach. Permafrost and Periglacial Processes, 31(3), 358-370. https://doi.org/10.1002/ppp. 2057
Tarnocai, C., Canadell, J. G., Schuur, E. A. G., Kuhry, P., Mazhitova, G., & Zimov, S. (2009). Soil organic carbon pools in the northern circumpolar permafrost region. Global Biogeochemical Cycles, 23(2), GB2023. https://doi.org/10.1029/2008gb003327
Thornton, B. F., Wik, M., & Crill, P. M. (2016). Double-counting challenges the accuracy of high-latitude methane inventories. Geophysical Research Letters, 43(24), 12569-12577. https://doi.org/10.1002/2016gl071772
Treat, C. C., Bloom, A. A., & Marushchak, M. E. (2018b). Non-growing season methane emissions-A significant component of annual emissions across northern ecosystems. Global Change Biology, 24(8), 3331-3343. https://doi.org/10.1111/gcb. 14137
Treat, C. C., Bloom, A. A., & Marushchak Maija, E. (2018a). Cumulative growing season, non-growing season, and annual methane fluxes from temperate, boreal, and tundra wetlands and uplands [Dataset]. PANGAEA. https://doi.org/10.1594/PANGAEA. 886976
Treat, C. C., Jones, M. C., Alder, J., Sannel, A. B. K., Camill, P., & Frolking, S. (2021). Predicted vulnerability of carbon in permafrost peatlands with future climate change and permafrost thaw in western Canada. Journal of Geophysical Research: Biogeosciences, e2020JG005872. https://doi.org/10.1029/2020JG005872
Treat, C. C., Jones, M. C., Camill, P., Gallego-Sala, A., Garneau, M., Harden, J. W., et al. (2016). Effects of permafrost aggradation on peat properties as determined from a pan-Arctic synthesis of plant macrofossils. Journal of Geophysical Research: Biogeosciences, 121(1), 78-94. https://doi.org/10.1002/2015JG003061
Treat, C. C., Kleinen, T., Broothaerts, N., Dalton, A. S., Dommain, R., Douglas, T. A., et al. (2019). Widespread global peatland establishment and persistence over the last 130,000 y. Proceedings of the National Academy of Sciences U.S.A., 116(4827). 201813305. https://doi.org/10.1073/ pnas. 1813305116
Treat, C. C., Natali, S. M., Ernakovich, J., Iversen, C. M., Lupascu, M., McGuire, A. D., et al. (2015). A pan-Arctic synthesis of
Treharne, R., Bjerke, J. W., Tømmervik, H., Stendardi, L., & Phoenix, G. K. (2019). Arctic browning: Impacts of extreme climatic events on heathland ecosystem CO2 fluxes. Global Change Biology, 25(2), 489-503. https://doi.org/10.1111/gcb.14500
Tsuruta, A., Kivimäki, E., Lindqvist, H., Karppinen, T., Backman, L., Hakkarainen, J., et al. (2023). CH4 fluxes derived from assimilation of TROPOMI XCH4 in carbontracker Europe-CH4: Evaluation of seasonality and spatial distribution in the northern high latitudes. Remote Sensing, 15(6), 1620. https://doi.org/10.3390/rs15061620
Turetsky, M. R., Abbott, B. W., Jones, M. C., Anthony, K. W., Olefeldt, D., Schuur, E. A. G., et al. (2020). Carbon release through abrupt permafrost thaw. Nature Geoscience, 13(2), 138-143. https://doi.org/10.1038/s41561-019-0526-0
Turetsky, M. R., Kotowska, A., Bubier, J., Dise, N. B., Crill, P., Hornibrook, E. R. C., et al. (2014). A synthesis of methane emissions from 71 northern, temperate, and subtropical wetlands. Global Change Biology, 20(7), 2183-2197. https://doi.org/10.1111/gcb. 12580
Ueyama, M., Iwata, H., Nagano, H., Tahara, N., Iwama, C., & Harazono, Y. (2019). Carbon dioxide balance in early-successional forests after forest fires in interior Alaska. Agricultural and Forest Meteorology, 275, 196-207. https://doi.org/10.1016/j.agrformet.2019.05.020
Van Wees, D., Van Der Werf, G. R., Randerson, J. T., Rogers, B. M., Chen, Y., Veraverbeke, S., et al. (2022). Global biomass burning fuel consumption and emissions at 500 m spatial resolution based on the Global Fire Emissions Database (GFED). Geoscientific Model Development, 15(22), 8411-8437. https://doi.org/10.5194/gmd-15-8411-2022
Varner, R. K., Crill, P. M., Frolking, S., McCalley, C. K., Burke, S. A., Chanton, J. P., et al. (2022). Permafrost thaw driven changes in hydrology and vegetation cover increase trace gas emissions and climate forcing in Stordalen Mire from 1970 to 2014. Philosophical Transactions of the Royal Society a-Mathematical Physical and Engineering Sciences, 380(2215). https://doi.org/10.1098/rsta.2021.0022
Varney, R. M., Chadburn, S. E., Burke, E. J., & Cox, P. M. (2022). Evaluation of soil carbon simulation in CMIP6 Earth system models. Biogeosciences, 19(19), 4671-4704. https://doi.org/10.5194/bg-19-4671-2022
Veraverbeke, S., Delcourt, C. J. F., Kukavskaya, E., Mack, M., Walker, X., Hessilt, T., et al. (2021). Direct and longer-term carbon emissions from arctic-boreal fires: A short review of recent advances. Current Opinion in Environmental Science & Health, 23, 100277. https://doi.org/10. 1016/j.coesh.2021.100277
Virkkala, A. M., Aalto, J., Rogers, B. M., Tagesson, T., Treat, C. C., Natali, S. M., et al. (2021b). Data for: “Statistical upscaling of ecosystem CO2 fluxes across the terrestrial tundra and boreal domain: Regional patterns and uncertainties” [Dataset]. Zenodo. https://doi.org/10.5281/zenodo. 4519583
Virkkala, A. M., Aalto, J., Rogers, B. M., Tagesson, T., Treat, C. C., Natali, S. M., et al. (2021a). Statistical upscaling of ecosystem CO2 fluxes across the terrestrial tundra and boreal domain: Regional patterns and uncertainties. Global Change Biology, 27(17), 4040-4059. https://doi. org/10.1111/gcb. 15659
Virkkala, A. M., Natali, S. M., Rogers, B. M., Watts, J. D., Savage, K., Connon, S. J., et al. (2022). The ABCflux database: Arctic-boreal CO2 flux observations and ancillary information aggregated to monthly time steps across terrestrial ecosystems. Earth System Science Data, 14(1), 179-208. https://doi.org/10.5194/essd-14-179-2022
Virkkala, A. M., Virtanen, T., Lehtonen, A., Rinne, J., & Luoto, M. (2018). The current state of CO2 flux chamber studies in the arctic tundra: A review. Progress in Physical Geography-Earth and Environment, 42(2), 162-184. https://doi.org/10.1177/0309133317745784
Vitt, D. H., Halsey, L. A., & Zoltai, S. C. (2000). The changing landscape of Canada’s western boreal forest: The current dynamics of permafrost. Canadian Journal of Forest Research-Revue Canadienne De Recherche Forestiere, 30(2), 283-287. https://doi.org/10.1139/cjfr-30-2-283
Voigt, C., Virkkala, A.-M., Hould Gosselin, G., Bennett, K. A., Black, T. A., Detto, M., et al. (2023). Arctic soil methane sink increases with drier conditions and higher ecosystem respiration. Nature Climate Change, 13(10), 1095-1104. https://doi.org/10.1038/s41558-023-01785-3
Vonk, J. E., Tank, S. E., Bowden, W. B., Laurion, I., Vincent, W. F., Alekseychik, P., et al. (2015). Reviews and syntheses: Effects of permafrost thaw on Arctic aquatic ecosystems. Biogeosciences, 12(23), 7129-7167. https://doi.org/10.5194/bg-12-7129-2015
Vonk, J. E., Tank, S. E., & Walvoord, M. A. (2019). Integrating hydrology and biogeochemistry across frozen landscapes. Nature Communications, 10(1), 5377. https://doi.org/10.1038/s41467-019-13361-5
Walker, D. A., Raynolds, M. K., Daniëls, F. J. A., Einarsson, E., Elvebakk, A., Gould, W. A., et al. (2005). The Circumpolar Arctic vegetation map. Journal of Vegetation Science, 16(3), 267-282. https://doi.org/10.1111/j.1654-1103.2005.tb02365.x(2005)016[0267:TCAVM]2.0.CO;2
Walker, H. J. (1998). Arctic deltas. Journal of Coastal Research, 14(3), 719-738.
Walker, X. J., Baltzer, J. L., Cumming, S. G., Day, N. J., Ebert, C., Goetz, S., et al. (2019). Increasing wildfires threaten historic carbon sink of boreal forest soils. Nature, 572(7770), 520-523. https://doi.org/10.1038/s41586-019-1474-y
Walter Anthony, K. M., Anthony, P., Grosse, G., & Chanton, J. (2012). Geologic methane seeps along boundaries of Arctic permafrost thaw and melting glaciers. Nature Geoscience, 5(6), 419-426. https://doi.org/10.1038/ngeo1480
Walter Anthony, K. M., Zimov, S. A., Grosse, G., Jones, M. C., Anthony, P. M., Iii, F. S. C., et al. (2014). A shift of thermokarst lakes from carbon sources to sinks during the Holocene epoch. Nature, 511(7510), 452-456. https://doi.org/10.1038/nature13560
Wang, J. A., Sulla-Menashe, D., Woodcock, C. E., Sonnentag, O., Keeling, R. F., & Friedl, M. A. (2020). Extensive land cover change across Arctic-Boreal Northwestern North America from disturbance and climate forcing. Global Change Biology, 26(2), 807-822. https://doi.org/10. 1111/gcb. 14804
Ward Jones, M. K., Schwoerer, T., Gannon, G. M., Jones, B. M., Kanevskiy, M. Z., Sutton, I., et al. (2022). Climate-driven expansion of northern agriculture must consider permafrost. Nature Climate Change, 12(8), 699-703. https://doi.org/10.1038/s41558-022-01436-z
Watts, J. D., Farina, M., Kimball, J. S., Schiferl, L. D., Liu, Z. H., Arndt, K. A., et al. (2023). Carbon uptake in Eurasian boreal forests dominates the high-latitude net ecosystem carbon budget. Global Change Biology, 29(7), 1870-1889. https://doi.org/10.1111/gcb. 16553
Watts, J. D., Natali, S. M., Minions, C., Risk, D., Arndt, K., Zona, D., et al. (2021). Soil respiration strongly offsets carbon uptake in Alaska and Northwest Canada. Environmental Research Letters, 16(8), 084051. https://doi.org/10.1088/1748-9326/ac1222
Webster, K. L., Bhatti, J. S., Thompson, D. K., Nelson, S. A., Shaw, C. H., Bona, K. A., et al. (2018). Spatially-integrated estimates of net ecosystem exchange and methane fluxes from Canadian peatlands. Carbon Balance and Management, 13(1), 16. https://doi.org/10.1186/ s13021-018-0105-5
Whalen, S. C. (2005). Biogeochemistry of methane exchange between natural wetlands and the atmosphere. Environmental Engineering Science, 22(1), 73-94. https://doi.org/10.1089/ees.2005.22.73
Wik, M., Varner, R. K., Anthony, K. W., MacIntyre, S., & Bastviken, D. (2016). Climate-sensitive northern lakes and ponds are critical components of methane release. Nature Geoscience, 9(2), 99-105. https://doi.org/10.1038/ngeo2578
Xu, X., Riley, W. J., Koven, C. D., Billesbach, D. P., Chang, R. Y. W., Commane, R., et al. (2016). A multi-scale comparison of modeled and observed seasonal methane emissions in northern wetlands. Biogeosciences, 13(17), 5043-5056. https://doi.org/10.5194/bg-13-5043-2016
Xu, X., Riley, W. J., Koven, C. D., & Jia, G. (2018). Observed and simulated sensitivities of spring greenup to preseason climate in northern temperate and boreal regions. Journal of Geophysical Research: Biogeosciences, 123(1), 60-78. https://doi.org/10.1002/2017JG004117
Xu, X., Yuan, F., Hanson, P. J., Wullschleger, S. D., Thornton, P. E., Riley, W. J., et al. (2016). Reviews and syntheses: Four decades of modeling methane cycling in terrestrial ecosystems. Biogeosciences, 13(12), 3735-3755. https://doi.org/10.5194/bg-13-3735-2016
Yang, M., Nelson, F. E., Shiklomanov, N. I., Guo, D., & Wan, G. (2010). Permafrost degradation and its environmental effects on the Tibetan plateau: A review of recent research. Earth-Science Reviews, 103(1), 31-44. https://doi.org/10.1016/j.earscirev.2010.07.002
Yu, Z., Loisel, J., Brosseau, D. P., Beilman, D. W., & Hunt, S. J. (2010). Global peatland dynamics since the last glacial maximum. Geophysical Research Letters, 37(13), L13402. https://doi.org/10.1029/2010g1043584
Zaehle, S., Jones, C. D., Houlton, B., Lamarque, J.-F., & Robertson, E. (2015). Nitrogen availability reduces CMIP5 projections of twenty-firstcentury land carbon uptake. Journal of Climate, 28(6), 2494-2511. https://doi.org/10.1175/JCLI-D-13-00776.1
Zhang, Z., Fluet-Chouinard, E., Jensen, K., McDonald, K., Hugelius, G., Gumbricht, T., et al. (2021). Development of the global dataset of wetland area and dynamics for methane modeling (WAD2M). Earth System Science Data, 13(5), 2001-2023. https://doi.org/10.5194/essd-13-2001-2021
Zhang, Z., Poulter, B., Feldman, A. F., Ying, Q., Ciais, P., Peng, S., & Li, X. (2023). Recent intensification of wetland methane feedback. Nature Climate Change, 13(5), 430-433. https://doi.org/10.1038/s41558-023-01629-0
Zimov, N. S., Zimov, S. A., Zimova, A. E., Zimova, G. M., Chuprynin, V. I., & Chapin, F. S., III. (2009). Carbon storage in permafrost and soils of the mammoth tundra-steppe biome: Role in the global carbon budget. Geophysics Research Letter, 36(2). https://doi.org/10.1029/ 2008g1036332
Zolkos, S., Tank, S. E., Kokelj, S. V., Striegl, R. G., Shakil, S., Voigt, C., et al. (2022). Permafrost landscape history shapes fluvial chemistry, ecosystem carbon balance, and potential trajectories of future change. Global Biogeochemical Cycles, 36(9), e2022GB007403. https://doi.org/ 10.1029/2022GB007403