الكشف الانتقائي والحساس للغاية عن المركبات العضوية المتطايرة باستخدام ليزر كوانتم كاسكيد القائم على InAs بطول موجي طويل من خلال طيف الصوت الضوئي المعزز بالكوارتز Highly selective and sensitive detection of volatile organic compounds using long wavelength InAs-based quantum cascade lasers through quartz-enhanced photoacoustic spectroscopy
مراجعات الفيزياء التطبيقية – موضوع خاص: المواد الميتامادية الكمومية
الكشف الانتقائي والحساس للغاية عن المركبات العضوية المتطايرة باستخدام ليزر كوانتم كاسكيد القائم على InAs بطول موجي طويل من خلال طيف الصوت الضوئي المعزز بالكوارتز
مختبر بولي سينس، قسم الفيزياء بين الجامعات، جامعة بوليتكنيك باري، شارع أماندولا 173، باري 70126، إيطاليا IES، جامعة مونبلييه، CNRS، 34095 مونبلييه، فرنسا المختبر الوطني الرئيسي للبصريات الكمومية وأجهزة البصريات الكمومية، معهد طيف الليزر، جامعة شانشي، تاييوان 030006، الصين مركز الابتكار التعاوني للبصريات المتطرفة، جامعة شانشي، تاييوان 030006، الصين بوليسنس إنوفيشنز SRL، فيا أماندولا 173، باري 70126، إيطاليا ملاحظة: هذه الورقة هي جزء من الموضوع الخاص في APR حول المركبات العضوية المتطايرة وتطبيقاتها. المؤلفون الذين يجب توجيه المراسلات إليهم:wuhp@sxu.edu.cn و angelo.sampaolo@poliba.it
الملخص
تعتبر الكشف الدقيق عن المركبات العضوية المتطايرة دورًا محوريًا في معالجة القضايا البيئية، والسلامة الصناعية، والتشخيص الطبي. لقد أدى التعرف الدقيق وقياس هذه المركبات بسبب انتشارها وتهديداتها المحتملة للصحة إلى تعزيز تطوير تقنيات الاستشعار المتقدمة. يقدم هذا العمل نظام استشعار في مجال مطيافية الأشعة تحت الحمراء ذات الطول الموجي الطويل لتحقيق تحسين الانتقائية والحساسية في الكشف عن البنزين، والتولوين، والبروبان من خلال مطيافية الصوت الضوئي المعززة بالكوارتز. يتم تحقيق مطيافية الغاز عالية الدقة من خلال استخدام تصميم خاص.ليزر كاسكيد الكم القائم على، ينبعث في نطاق الطول الموجي، وأوتار التوليف الكوارتزية. يتميز نظام المستشعر، الذي يتميز بمتانته ودقته، بقدرات استثنائية في الكشف عن البنزين والتولوين والبروبان. يتم إثبات قدرة النظام على التطبيقات العملية في مراقبة البيئة والتشخيص الطبي من خلال قدرته على تمييز هذه المركبات العضوية المتطايرة بحد أدنى من حدود الكشف ، و3 جزء في المليون للزيلين، والبنزين، والبروبان في وقت تكامل قدره 10 ثوانٍ، حتى في مصفوفات الغاز المعقدة. يعزز هذا العمل تكنولوجيا استشعار الغاز بينما يقدم أيضًا معلومات قيمة حول التداخلات الطيفية، وهي مشكلة مستمرة في هذا المجال. تفتح النتائج عصرًا جديدًا من تقنيات استشعار الغاز المتطورة والموثوقة التي تلبي الطلب المتزايد على أجهزة الكشف الدقيقة عن المركبات العضوية المتطايرة لأغراض مراقبة البيئة.
لقد حصلت الحاجة إلى الكشف الدقيق والتقدير الكمي للمركبات العضوية المتطايرة (VOCs) مثل الهيدروكربونات وBTEX (البنزين، التولوين، الإيثيل بنزين، والزيلين) أخيرًا، خلال العقد الماضي، على المستوى المستحق من الاهتمام داخل مجتمع البحث البيئي بسبب مستوى تطايرها العالي وسميتها. إن التعرف الدقيق على مثل هذه المركبات أمر بالغ الأهمية للرصد. جودة الهواء، تحديد مصادرها، وتقييم المخاطر الصحية والبيئية المحتملة بسبب انتشار إنتاجها/استخدامها في العمليات الصناعية، والنقل، ومجموعة متنوعة من المجالات الأخرى.
تم تحديد BTEX كمساهمين رئيسيين في تلوث الهواء مع آثار ضارة على صحة الإنسان. وقد حددت الوكالة الدولية لبحوث السرطان (IARC) ووكالة حماية البيئة الأمريكية (EPA) البنزين. كعامل مسرطن للبشر.لقد تم ربط اللوكيميا والأمراض العصبية وأمراض الجهاز التنفسي بالتعرض طويل الأمد للبنزين.التولوين، الإيثيل بنزين، والزيلين تسبب أيضًا مشاكل صحية بسبب قدرتها على المساهمة في تطوير الأوزون على مستوى الأرض.والضباب الدخاني، بالإضافة إلى تأثيراته على الجهاز العصبي المركزي والجهاز التنفسي.من ناحية أخرى، يُعتبر البروبان عمومًا آمنًا. ومع ذلك، فإن اكتشافه يلعب دورًا حاسمًا في التعامل الآمن، والتخزين، واستخدام النفط والغاز الطبيعي. في البيئات الصناعية، يُعتبر الكشف الدقيق عن البروبان أمرًا حيويًا لمنع التسريبات، وضمان الامتثال لبروتوكولات السلامة، وتحسين استخدام الوقود.
لذلك، فإن التطبيق الواسع النطاق والمخاطر المحتملة لهذه المركبات العضوية المتطايرة يتطلبان طرق كشف عالية التحديد والحساسية. علاوة على ذلك، في مجال التشخيص الطبي، أظهرت عدد متزايد من الدراسات وجود مستويات مرتفعة بشكل غير طبيعي من هذه المركبات في النفس الزفير كعلامة على بعض الأمراض.في حالة BTEXs، يمكن العثور عليها في الزفير بشكل رئيسي كعلامات حيوية خارجية، في معظم الأحيان لدى المدخنين والأفراد الذين تعرضوا لتركيزات شاذة من BTEX في البيئة. وبالتالي، يمكن أن تكون أجهزة استشعار التنفس المحمولة والحساسة والانتقائية أدوات تشخيصية مبكرة غير جراحية محتملة لفحص الكتلة في نقطة الرعاية.
لقد اعتمد تحليل BTEX تقليديًا على تقنيات معروفة، مثل الجمع بين الكروماتوغرافيا الغازية وقياس الطيف الكتلي،التي تم اعتبارها على نطاق واسع معيار الذهب. إن استخدام مثل هذه التقنيات يوفر درجة ملحوظة من الدقة والحساسية، مما يسهل القياس الدقيق والتفريق بين مكونات BTEX المختلفة. على الرغم من فعاليتها، تميل هذه الطرق إلى أن تكون بطيئة، وتتطلب موظفين ذوي كفاءة، وتستلزم التحليل في بيئة مختبرية، مما يجعلها أقل ملاءمة للرصد السريع في الموقع. مؤخرًا، لمعالجة هذه القضايا، تم تطوير أنواع مختلفة من المستشعرات، بما في ذلك، ولكن لا تقتصر على، الكهروكيميائية.والحالة الصلبة،تم تطويرها. تقدم هذه المستشعرات حساسية كشف محسّنة، وانتقائية، وسرعة، وقابلية للنقل، وسهولة في الاستخدام. ومع ذلك، فإن الاستقرار، والعمر الافتراضي، وأداء هذه المستشعرات يتأثر بشدة بالظروف البيئية، مثل درجات الحرارة ومستويات الرطوبة.
في هذا السياق، تم تحديد المستشعرات البصرية كحل قابل للتطبيق للكشف عن الغازات النادرة نظرًا لقدرتها على توفير حساسية عالية وانتقائية من خلال استغلال تحفيز الليزر للانتقالات الجزيئية في الأشعة تحت الحمراء. تقدم المستشعرات البصرية وظائف متطورة لتحليل الغاز بدقة وموثوقية، معتمدة على تقنيات الامتصاص المباشر أو غير المباشر واستفادة من الميزات الفريدة لأجهزة الليزر من حيث عرض الطيف الضيق وتشغيل الموجة المستمرة عالية القدرة.عدة أعمال أبلغت عن مستشعرات الأشعة تحت الحمراء لاستغلال الـنطاق امتصاص البنزين من خلال تقنيات مثل الطيفية المعززة بالحُفرواستشعار الامتصاص المتعدد العبور من خلال توليد الترددات المختلفة.بالإضافة إلى ذلك،فرقة فيتمت دراسته باستخدام مطيافية الليزر الثنائي القابل للتعديل من خلال استخدام خلية هيريوت متعددة المرور بطول مسار
ومع ذلك، تتميز هذه المناطق الطيفية بانخفاض الانتقائية، بسبب التداخل القوي بين BTEX والهيدروكربونات الأخف، حيث تشترك في نفس فئة الاهتزازات الجزيئية.يمتد حول و الانحناء حول ). بديل لهذه النطاقات الطيفية يتم تمثيله بالمنطقةحيث تحدث ميزات طيفية شديدة وواضحة لمركبات BTEX.
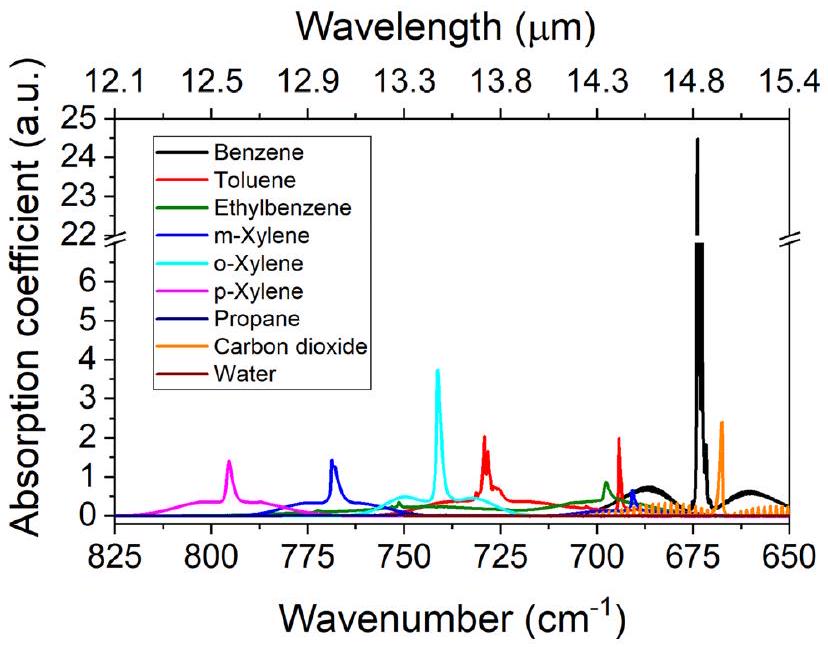
السيناريو الطيفي الذي يتضمن نطاقات امتصاص BTEX وأهم الممتصات الجوية / العوامل المداخلة المحتملة، مثل بخار الماء وثاني أكسيد الكربون، فينطاق الطول الموجي موضح في الشكل 1.
تم محاكاة معامل الامتصاص بشكل منفصل للمركبات النقية فقط لمقارنة الشكل والاحتمالية لتداخل نطاقات الامتصاص، بغض النظر عن النطاقات التركيزية الواقعية للتطبيقات المحددة. خطوط امتصاص بخار الماء غائبة تقريبًا في هذا النطاق، أو على الأقل غير ذات صلة، بينماعلى الرغم من وجود الطيف، إلا أنه يظهر خطوطًا حادة يمكن تمييزها تمامًا عن المركبات العضوية المتطايرة الأخرى ذات الاهتمام من خلال اختيار ضغوط تشغيل وعمق تعديل مناسبين في تكوين الطيف الضوئي بتعديل الطول الموجي.
ومع ذلك، في منطقة الطيف تحت الأحمر ذات الأطوال الموجية الطويلة، فإن الحالة الراهنة لمصادر الضوء المتماسك ضعيفة. إن نقص المصادر المناسبة لقياس امتصاص الليزر الثنائي القابل للتعديل (TDLAS) فوقيعود ذلك إلى القيود الأساسية في أداء ليزر أشباه الموصلات ذات الطول الموجي الطويل. يمكن أن تعمل ليزرات الدايود بين الأشرطة في المبدأ فقط عند درجات حرارة منخفضة للغاية بسبب إعادة التركيب غير الإشعاعي القوي في المواد ذات الفجوة النطاقية الصغيرة. ليزرات بين الأشرطة غير متاحة حاليًا على الإطلاق في النطاق الطيفي المعني. يمكن التغلب على هذه المشكلة في المصادر التي تستخدم انتقالات بين مستويات تحت النطاق حيث تكون عمليات أوغر أضعف بكثير. ومع ذلك، فإن عمر الإلكترون في المستوى العلوي لانتقال الليزر بين مستويات تحت النطاق، وهو المعامل الرئيسي المسؤول عن كسب الضوء في ليزر السلسلة الكمومية (QCL)، ينخفض بسرعة مع زيادة طول الموجة المنبعثة، والليزرات التي تصدر فوقتظهر أداءً ضعيفًا. لهذا السبب، فإن ليزر الأشعة تحت الحمراء التقليدي القائم على InP غير قادر على العمل في نظام الموجة المستمرة بالقرب من درجة حرارة الغرفة. يعتمد الكسب البصري بين النطاقات على الكتلة الفعالة للإلكترون.في الآبار الكمومية كـ، مما يجعل المواد ذات حجم صغيرجذابة جدًا لتطوير ليزر الأشعة تحت الحمراء طويلة الموجة. في هذا العمل، استخدمنا ليزر الأشعة تحت الحمراء حيث تحدث انتقالات الليزر في آبار الكم من InAs. نظرًا لصغر الكتلة الفعالة للإلكترون، تظهر ليزرات الأشعة تحت الحمراء القائمة على InAs مكاسب بصرية أعلى مقارنةً
الشكل 1. محاكاة معامل الامتصاص عند الضغط الجوي لبيوتيل بنزين، بخار الماء، وثاني أكسيد الكربون فينطاق الطول الموجي، من قاعدة بيانات HITRAN.
مع النظائر المعتمدة على InPوأظهرت أداءً أفضل بكثير. سمحت التعديلات التصميمية المتتالية بتحقيق تشغيل مستمر عند درجة حرارة الغرفة (CW) لمثل هذه الليزر عند أطوال موجية تصل إلىيمكن العثور على مناقشة مفصلة حول تصميم وخصائص ليزر الأشعة تحت الحمراء الطويلة القائم على InAs في المرجع 25. في هذه الدراسة، تم تصميم هيكل الليزر ليضع ذروة الكسب في النطاقات الطيفية المطلوبة. ثم تم معالجة الشرائح البلورية التي نمت بواسطة تقنية ترسيب الطبقات الجزيئية إلى ليزر بتغذية راجعة موزعة بتردد واحد (DFB) مع شبكة معدنية علوية.باستخدام تقنية الليثوغرافيا بالأشعة الإلكترونية وحفر المواد الكيميائية الجافة والرطبة. تظهر الأجهزة نقاء طيفي جيد مع نسبة كبح الوضع الجانبي (SMSR)وقابلية الضبط لـمما يتيح استهدافًا دقيقًا لخطوط الامتصاص للبنزين والتولوين والبروبان.
مؤخراً، تم تطوير مصفوفة ليزر كوانتيوم باند واحد قابل للتعديل، تصدر في النطاقلقد تم إثبات ملاءمته لطيف الموجات الطويلة لأسيتيلين وأوكسيلاين، من خلال تنفيذ ألياف ذات نواة مجوفة وكاشف ضوئي يتمتع بعرض نطاق محسن يصل إلىالقيود الرئيسية التي تؤثر على تقنيات الامتصاص المباشر، مثل TDLASوطيف الامتصاص المعزز بالتجويف (CEAS)،يتكون بشكل رئيسي من نقص الكواشف المتاحة تجارياً ذات الطول الموجي الطويل المناسبة لمنصات الاستشعار المخصصة للكشف عن الغاز في الموقع وفي الوقت الحقيقي، ومن النطاق الطيفي المحدود للمكونات البصرية عالية الجودة (خصوصاً في تكوينات CEAS). يهيمن سوق الكواشف الضوئية القريبة والمتوسطة للأشعة تحت الحمراء (PD) على الكواشف المعززة و الكواشف الضوئية الموصلية (PC) والكواشف الضوئية (PV) المبردة حرارياً، والتي تقدم استجابة عالية ولكن في نطاق طيفي ضيق نسبياً من التشغيل.ما وراءيمكن استخدام مجموعة ضيقة من الأجهزة، تعتمد بشكل رئيسي على الكواشف القائمة على تكنولوجيا HgCdTe (MCT) الفوتوكونductive، والتي تنخفض حساسيتها بأكثر من مرتبتين من حيث الحجم مقارنة بتلك التي تعمل حتى. يمكن استغلال أجهزة الكشف الحرارية المتاحة تجارياً، مثل الكواشف الحرارية الكهروحرارية (PYDs) وخلايا غولاي (GC) بما يتجاوزمع عيوب (1) قدرة ضوضاء مكافئة (NEP) صغيرة نسبيًا وعرض نطاق كشف بالنسبة لـ PYDs مقارنةً بـ PV و PC و (2) أوقات استجابة منخفضة للغاية لـ GCs. تعتمد الإعدادات المتطورة التي تتطلب أداءً عاليًا من حيث NEP عادةً على بولومترات فائقة التوصيل تجارية، والتي تحتاج إلى تبريد بالهيليوم السائل. لقد تم إثبات أن الجرافين هو مادة واعدة للكاشفات الضوئية واسعة النطاق في الأشعة تحت الحمراء بسبب هيكله النطاقي الخالي من الفجوات،لكن امتصاصه البصري المنخفض يحد بشكل كبير من استجابته، وبشكل عام، يمثل تقنية جديدة لا تزال بعيدة عن الوصول إلى النضج التجاري.منذ عام 2019، تم استغلال أوتار الكوارتز (QTFs) ككواشف ضوئية في الطيفية الحرارية الضوئية، مستفيدين من تحويل الضوء الحراري المرن داخل هيكل الرنان الميكانيكي وإثبات استجابة طيفية مسطحة منإلىومع ذلك، فإن فعالية هذه العملية الفيزيائية تصل إلىلا يزال بحاجة إلى أن يتم إثباته.
في السنوات الأربع الماضية، تم إثبات طرق طيفية غير مباشرة يمكن أن تتجنب استخدام الكواشف الضوئية، مثل التكوينات الصوتية الضوئية، بنجاح باستخدام ليزر كوانتي يعمل عندلكشف البنزين بالاقتران مع (ط) شوكة ضبط قياسية بتردد 32 كيلوهرتز في نظام طيفية صوتية معززة بالكوارتز (QEPAS)،ومع (ii) جهاز استشعار ضوئي صوتي قائم على الكانتليفر.تظهر هذه التطورات التطور المستمر وتنويع تقنيات الاستشعار بالأشعة تحت الحمراء، مما يوسع نطاق التطبيقات وتحسين قدرات الكشف في مناطق طيفية مختلفة.
ومع ذلك، فإن اكتشاف مركبات BTEX، بالإضافة إلى الألكانات الأثقل مثل البروبان والبيوتان والبيتان، يقدم تحديات فريدة ناتجة عن التداخلات الطيفية المحتملة بينها أو مع مركبات أخرى. يمكن أن يؤدي وجود المركبات العضوية المتطايرة المتزامنة التي تتميز بنفس الروابط إلى إدخال تداخلات طيفية، خاصة في المنطقة الطيفية حيث تقع الأطياف الأساسية لانتقالات الأشعة تحت الحمراء، مما يؤدي إلى تداخل ميزات الامتصاص أو تشويه الإشارات. على سبيل المثال، بينما تم إثبات أن الميثان (C1) والإيثان (C2) يمكن فصلهما بسهولة واكتشافهما بشكل مستقل حتى عند الضغط الجوي فيتبدو ميزات طيف البروبان (C3) متداخلة تمامًا مع امتصاص الخلفية C2، مما يجعل من الصعب تمييز وقياس C3 إلا من خلال أساليب متعددة الخطوط أو حتى متعددة المتغيرات المتطورة.يجب القضاء على هذه المشكلة المتعلقة بالتداخل الطيفي عند الأطوال الموجية الأطول. حيث تظهر مركبات BTEX والهيدروكربونات الأثقل ميزات امتصاص مميزة ومعزولة، مثل البروبان الانتقال فيللأسف، فإن نقص مصادر الليزر المناسبة قد قيد تطوير هذه المستشعرات عند أطوال الموجات الطويلة.
في هذا السياق، تهدف الدراسة التالية إلى إظهار فعالية مستشعر بصري عالي الحساسية والانتقائية للكشف عن اثنين من المركبات النموذجية BTEX (البنزين والتولوين) والهيدروكربونات الثقيلة، مثل البروبان. يعتمد المستشعر على تقنية QEPAS ويجمع بين شوكات الكوارتز المصممة خصيصًا ومصادر الليزر الكمي غير التجارية التي تصدر في النطاق. فيما يتعلق بـ QTFs القياسية المستخدمة حتى الآن، فإن التردد المنخفض للرنانات المخصصة يساعد في تحسين كفاءة استرخاء الطاقة، بينما يساعد التصميم والأبعاد المخصصة في تقليل الضوضاء البصرية الناتجة عن أشعة الليزر ذات الجودة الرديئة. بعد تحليل دقيق لشرائط امتصاص كل VOC، تم تصميم QCLs للعمل عند أطوال موجية محددة، مما يثير الميزات الأكثر ملاءمة وكثافة للامتصاص لاكتشاف تعديل الطول الموجي. تم مناقشة تصميم هيكل QCL المستخدم في هذه الدراسة بشكل موسع في الأعمال السابقة.تظهر هذه الأجهزة نقاء طيفيًا جيدًا مع نسبة كبح الوضع الجانبي (SMSR)وقابلية الضبط لـ، مما يتيح استهدافًا دقيقًا لخطوط الامتصاص المرتبطة بالبنزين والتولوين والبروبان. باستخدام نظام الاستشعار المطور، قمنا بفحص وتأكيد غياب كل من التداخل الطيفي وغير الطيفي بين BTEX. علاوة على ذلك، قمنا أيضًا بالتحقق من انتقائية اكتشاف البروبان ضمن مصفوفات الغاز الغنية بـ C 1 و C 2. في هذه الحالة أيضًا، أظهرت الحساسية المتقاطعة غير الطيفية أنها غير مهمة.
يُمهِّد هذا البحث الطريق لتطوير كواشف QEPAS النقطية المودولارية، القابلة للتكيف بشكل كبير مع (i) طول موجة الإثارة، (ii) جودة شعاع الليزر، و(iii) تركيبة مصفوفة الغاز.
إعداد تجريبي
تتكون مصادر الليزر المستخدمة في هذه الدراسة من ثلاثة ليزرات كوانتية من نوع كاسكيد ذات تغذية مرتدة موزعة تعتمد على InAs، مصممة للإصدار عند أطوال موجية تتوافق مع نطاقات الامتصاص للتولوين. )، البنزين ( ) و البروبان ( تم تصميم ونمو وتصنيع هذه الأجهزة في IES، جامعة مونبلييه. تم تثبيت ليزر QCLs من نوع DFB المصنوعة على مبرد من نيتريد الألمنيوم (ALN)، وتم توجيهها وتعبئتها في غلاف مخصص مزود بجهاز PT100. مستشعر درجة الحرارة وعنصر تبريد بيلتيه. يتوفر أيضًا تبريد مائي خارجي في الحاوية للمساعدة في استخراج الحرارة الناتجة عن عنصر بيلتيه. يمتد نطاق درجة حرارة التشغيل لهذه QCLs في نظام CW منللاقتراب من درجة حرارة الغرفة. في هذه التجربة، تم اختيار درجات حرارة تشغيل محددة لاستهداف وتمكين استغلال فعال للبصمات الطيفية المحددة:، و لـ، و ، على التوالي.
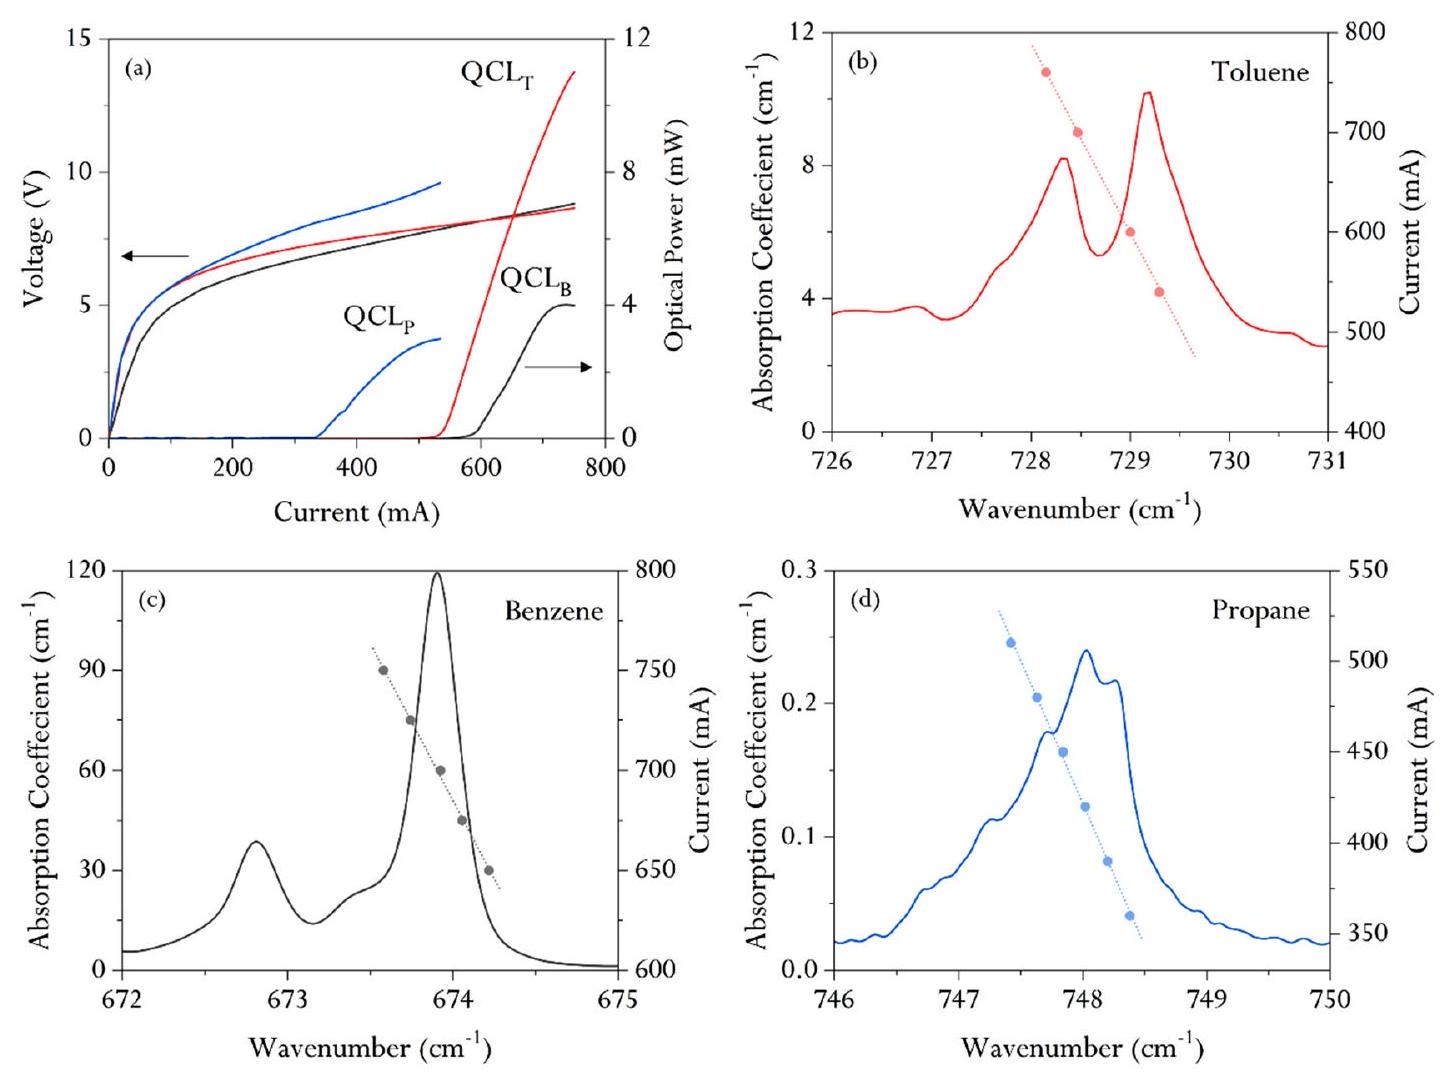
الشكل 2(أ) يوضح خصائص القدرة الضوئية مقابل التيار والجهد مقابل التيار لـ، و عند درجات الحرارة المحددة. تصل القدرة الضوئية إلى 11.4 و 3 مللي واط، على التوالي.
تظهر الأشكال 2(b)-2(d) معامل الامتصاص للتولوين، والبنزين، والبروبان عند الضغط الجوي كدالة لعدد الموجات (الخطوط الصلبة)، كما تم الحصول عليها من NIST [الأشكال 2(b) و2(c)]وقاعدة بيانات HITRAN [الشكل 2 (د)]. بالإضافة إلى ذلك، تُظهر نقاط البيانات نطاق ضبط الطول الموجي للأجهزة كدالة للتيار المدخل، عند درجات الحرارة التشغيلية المختارة. كما تم الإبلاغ في قسم المقدمة، فإن هذه الميزات الامتصاصية تتعلق بتذبذبات جزيئية مختلفة. تتوافق نطاقات البنزين والتولوين (BT) مع انحناء C-H خارج المستوى، بينما تشير بنية دوران البروبان إلى نوع C.-الوضع الأساسي المتأرجح.الفرق أكثر تباعدًا وأكثر كثافة بالنسبة لـنافذة طيفية حيث يكون تمدد C-D الأريلي متورطًا بشكل أساسي، بينما البروبان يظهر معاملات الامتصاصأقوى بمقدار 3369 نانومتر، ولكن هناك تداخل شبه كامل مع الهيدروكربونات الأخف.
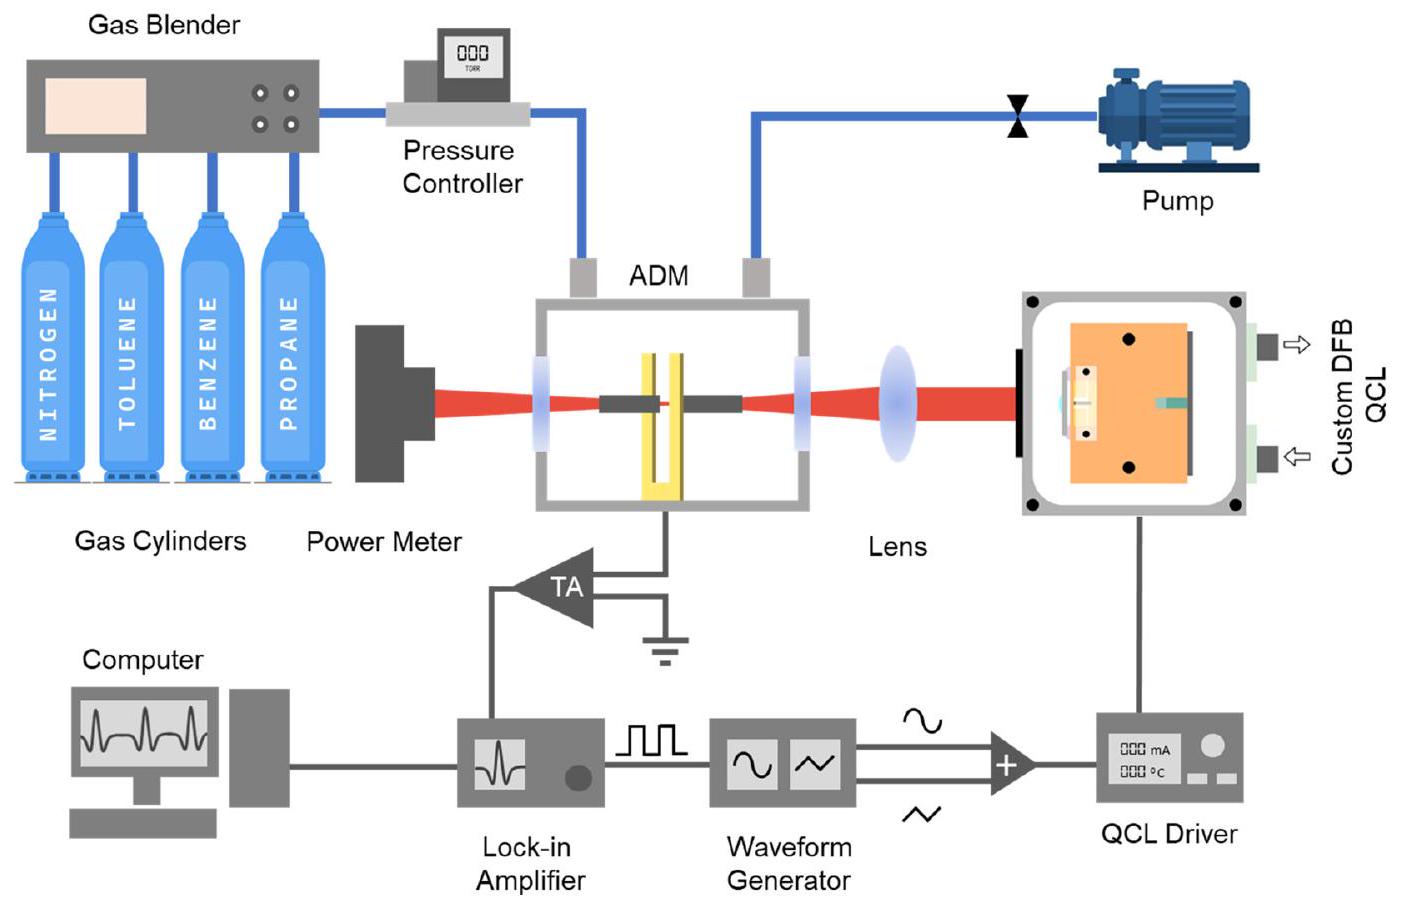
نظام استشعار QEPAS مع إمكانية تبديل ثلاثة ليزر كوانتيوم نقطي (DFB QCLs) موضح بشكل تخطيطي في الشكل 3. يتضمن المخطط رأس المستشعر، وخط الغاز، والمكونات الإلكترونية المستخدمة لتشغيل الليزر الكوانتيوم النقطي وجمع البيانات.
يتضمن رأس المستشعر وحدة كشف صوتية (ADM) مزودة بنوافذ بصرية من الجرمانيوم، موصلات دخول وخروج لتنظيم تدفق الغاز، ويحتوي على ميكروفون طيفي يتكون من QTF على شكل حرف T متصل صوتيًا مع زوج من أنابيب الرنين، مما يشكل ميكروفون طيفي. تم توثيق أبعاد QTF على شكل حرف T في المرجع 43. تقع أنابيب الرنين بحجم المليمتر (mRes) على بعد 2 مم أسفل قمة QTF، عموديًا على مستواه، وتفصلها فجوة تبلغ 0.2 مم. يبلغ طول mRes 12.4 مم وقطرها الداخلي 1.59 مم وقطرها الخارجي 1.83 مم. تم اختيار الرنان المخصص على شكل حرف T لثلاثة أسباب رئيسية: (i) تردد الرنين الاسمي، أي 12.5 كيلوهرتز، (ii) فجوة الأذرع البالغة 0.8 مم، و(iii) القيمة التجريبية لتعزيز نسبة الإشارة إلى الضوضاء (SNR) التي يوفرها الميكروفون الطيفي بالنسبة لـ QTF العاري. في الواقع، أوضاع الرنين الأساسية في النطاقتم إثبات أنها أفضل حل وسط بين عوامل جودة QTF وتوافق ترددات الرنين مع أوقات الاسترخاء الطاقية النموذجية للجزيئات في النطاق.
الشكل 2. (أ) خصائص القدرة الضوئية مقابل التيار والجهد مقابل التيار لـ (المنحنيات الحمراء)، (المنحنيات السوداء)، و (المنحنيات الزرقاء) تعمل عند ، و ، على التوالي. (ب)-(د) تمثل الخطوط الصلبة محاكاة معامل الامتصاص للتولوين النقي، والبنزين، والبروبان عند الضغط الجوي. تم الحصول على طيف معامل الامتصاص للتولوين والبنزين من قاعدة بيانات NIST، بينما تم الحصول على طيف البروبان من قاعدة بيانات HITRAN. تحدد الخطوط المنقطة والرموز الصلبة نطاقات ضبط طول موجة QCL كدالة لتيار حقن QCL.
الشكل 3. المخطط التخطيطي لنظام مستشعر QEPAS الذي يستخدم ليزر QCL (ليزر كاسكيد كوانتي موزع التغذية الراجعة) طويل الموجة القائم على InAs. ADM: وحدة الكشف الصوتي و TA: مضخم الترانسيميدنس.
100-760 تورعلاوة على ذلك، تحسين نسبة الإشارة إلى الضوضاء التجريبية لـلـ QTF على شكل حرف T هو الأكبر الذي تم إثباته حتى الآن.تباعد الأوتاد الأكبر بالنسبة إلى 0.3 مم من QTF القياسي مفيد بشكل خاص لاستيعاب عرض شعاع كبير للأطوال الموجية الطويلة بالإضافة إلى الأشعة ذات الجودة الرديئة.تم استرجاع تردد الرنين وعامل الجودة للوضع الانحنائي الأساسي في المستوى المحدد للموصل المستخدم في هذا العمل من خلال تأثير البيزوكهربائية العكسي، أي عن طريق إثارة الموصل بإشارة جهد جيبية وإجراء مسح ترددي. كلا من الرنين منحنى وتُرسم القيم كدالة للضغط في الشكل 4. تحت الضغط الجوي وفي خليط من النقاء، يظهر QTF تردد رنين قدره وعامل جودة.
تشمل مكونات خط الغاز أسطوانات غاز معتمدة، خالط غاز، منظم ضغط، صمام إبرة، ومضخة تفريغ. مع الغاز النقيكغاز ناقل، يتم استخدام خالط الغاز (MCQ Instruments) للتحكم بدقة في معدل تدفق كل قناة غاز فردية وإنتاج الخليط الغازي المطلوب. جهاز التحكم في الضغط من Alicat/
الشكل 4. (يسار) تردد رنين QTF (دوائر خضراء) وعامل الجودة (مربعات برتقالية) كدالة للضغط. (يمين) منحنى الرنين لـ QTF عند 760 تور. يتم رسم مربع سعة إشارة QTF كدالة لتردد الإثارة. تمثل الدوائر الحمراء البيانات المكتسبة، بينما يمثل المنحنى الأحمر ملاءمة البيانات باستخدام دالة لورنتز. تشير الخطوط الزرقاء المنقطة إلى ذروة الرنين المقابلة لتردد QTF.
مقياس التدفق، بالتعاون مع صمام إبرة ومضخة، يُستخدم لتنظيم ضغط الغاز ومعدل التدفق بدقة داخل خط الغاز. يتم الحفاظ على معدل تدفق الغاز عند قيمة ثابتة تبلغ 50 سم³/دقيقة، بدقةلنقطة ضبط التدفق لكل قناة. للتحكم في QCLs، يتم استخدام جهاز تحكم تيار الليزر وجهاز تحكم TEC مجتمعة (Thorlabs ITC4002QCL). يوفر جهاز التحكم في التيار التيار اللازم لتشغيل QCLs ويتحكم جهاز TEC في درجة حرارة التشغيل. يتم تركيز الشعاع المتوازي بين أسنان QTF، من خلال نافذة بصرية من Ge وأنابيب الرنين، إلى ADM، باستخدام عدسة زنك سيلينيد محدبة مسطحة بتركيز يبلغ 50 مم تحتوي علىطلاء مضاد للانعكاس. يتم تثبيت ADM على منصة ذات خمسة محاور لضمان المحاذاة الدقيقة. المحاذاة أمر حاسم في منع ذيل شعاع الليزر من الاصطدام بأنابيب الرنين و/أو أسنان شوكة الكوارتز، مما يمكن أن ينتج عنه خلفية غير صفرية ويؤثر سلبًا على حساسية الكشف في المستشعر.تساعد عملية المحاذاة مقياس القدرة الضوئية (THORLABS PM100D).
لإجراء قياسات QEPAS، يتم استخدام طريقة تعديل الطول الموجي وكشف 2f.يتضمن ذلك تطبيق تذبذب جيبي، يتطابق مع نصف تردد رنين QTF، على محرك تيار QCL. ثم يتم استخدام مضخم تحويل التimpedance لتحويل الشحنة البيزوالكهربائية الناتجة إلى إشارة كهربائية. يتم تعديل إشارة QTF المحولة بواسطة مضخم قفل (مضخم قفل MFIA 500 كيلوهرتز، أدوات زيورخ) عند تردد رنين QTF. يتم استخدام ثابت زمن قفل قدره 100 مللي ثانية في هذه العملية. ثم يتم رقمنة الإشارة المعدلة وحفظها على جهاز كمبيوتر شخصي باستخدام لوحة اكتساب البيانات، مع ضبط زمن العينة على ثلاثة أضعاف ثابت زمن القفل.
تحسين المستشعر، الحساسية، والحد الأدنى من حدود الكشف
في نظام QEPAS، تعتبر تحسين ضغط الغاز وعمق التعديل أمرين في غاية الأهمية لتعزيز حساسية نظام QEPAS. عند التعامل مع الانتقالات البصرية اللورنتزية النقية والمعزولة، يكون الهدف الرئيسي من تحسين ضغط التشغيل هو إيجاد توازن بين زيادة إشارة QEPAS كهدف. تزداد جزيئات الغاز (وبالتالي الضغط)، ويتدهور عامل جودة QTF بسبب زيادة الضغط العامل. بمجرد تحديد الضغط الأمثل الذي يزيد من إشارة QEPAS، يتم تحديد عمق التعديل الأمثل لميزة لورنتزية بحتة ومعزولة بشكل رئيسي من خلال عرض خطها.في حالة ميزات الامتصاص العريضة مع وجود مواد متداخلة، تصبح تحديد الضغط الأمثل للعمل أكثر مسألة تتعلق بالتوازن بينزيادة إشارة QEPAS والانتقائية الطيفية، مما يطرح مسألة إعادة بناء دقيقة لبصمة الطيف للميزات المستهدفة. على سبيل المثال، عند ضغط تشغيل ثابت، قد يوفر تأثير الإفراط في التعديل طيف إشارة عام مكثف، ولكن مع عيب كونه مكونًا من ميزات أقل تميزًا لتمييز الإشارة بالنسبة للتداخلات المحتملة.في هذا السياق، من الضروري الحفاظ على الشكل المشتق لملف الامتصاص بالإضافة إلى منع عمق التعديل من إثارة ميزات الامتصاص القريبة من الملوثات المحتملة. في الواقع، تهدف التحديد التجريبي لأفضل ظروف التشغيل من حيث الضغط وعمق تعديل تيار QCL إلى تحقيق التوازن الصحيح بين تعزيز الإشارة والتمييز الطيفي لميزات الامتصاص لكل جزيء مستهدف.
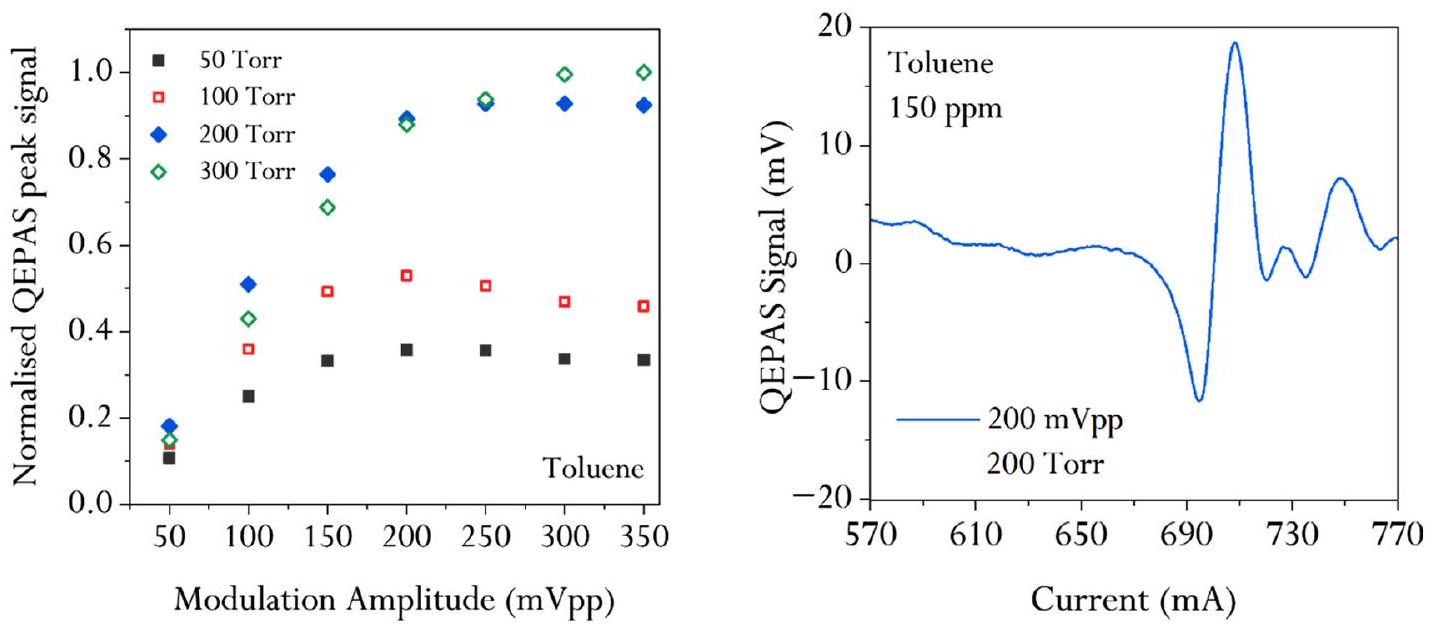
تظهر الأشكال 5-7 (يسار) إشارات قمة QEPAS المعايرة كدالة لعمق التعديل عند ضغوط مختلفة لتركيزات معتمدة من التولوين (150 جزء في المليون في )، البنزين ( 100 جزء في المليون في ) و البروبان ( 1000 جزء في المليون في ) عن طريق تبادل ، ، و على التوالي، في نظام QEPAS الموضح في الشكل 3. تختلف نطاقات الضغط التي تم التحقيق فيها من مادة تحليلية إلى أخرى. لم يتم اعتبار الضغوط التي تقل عن 50 تور للبنزين والتولوين و200 تور للبروبان لأن إشارة QEPAS كانت منخفضة جدًا في النطاق العام الذي تم التحقيق فيه لعمق التعديل. من الواضح من الأشكال 5-7 (يسار) أنه مع زيادة الضغط، هناك زيادة متCorresponding في إشارة قمة QEPAS. ومع ذلك، مع زيادة الضغط وعمق التعديل، تتعرض الميزة المستهدفة لتشويه متزايد وكذلك الطيف بأكمله، مما يؤدي إلى تدهور خصوصيتها الطيفية. في الواقع، فإن ميزة الامتصاص المرجعية للتولوين
الشكل 5. (يسار) إشارة قمة QEPAS المعيارية للتولوين مرسومة مقابل سعة تعديل الذبذبة من قمة إلى قمة لليزر عند ضغوط مختلفة. (يمين) إشارة QEPAS لـ 150 جزء في المليون من التولوين تم الحصول عليها من خلال تغيير تيار حقن الليزر ضمن نطاق ضبط QCL في ظروف العمل المثلى، أي، 200 مللي فولت سعة تعديل تيار الليزر من قمة إلى قمة و200 تور.
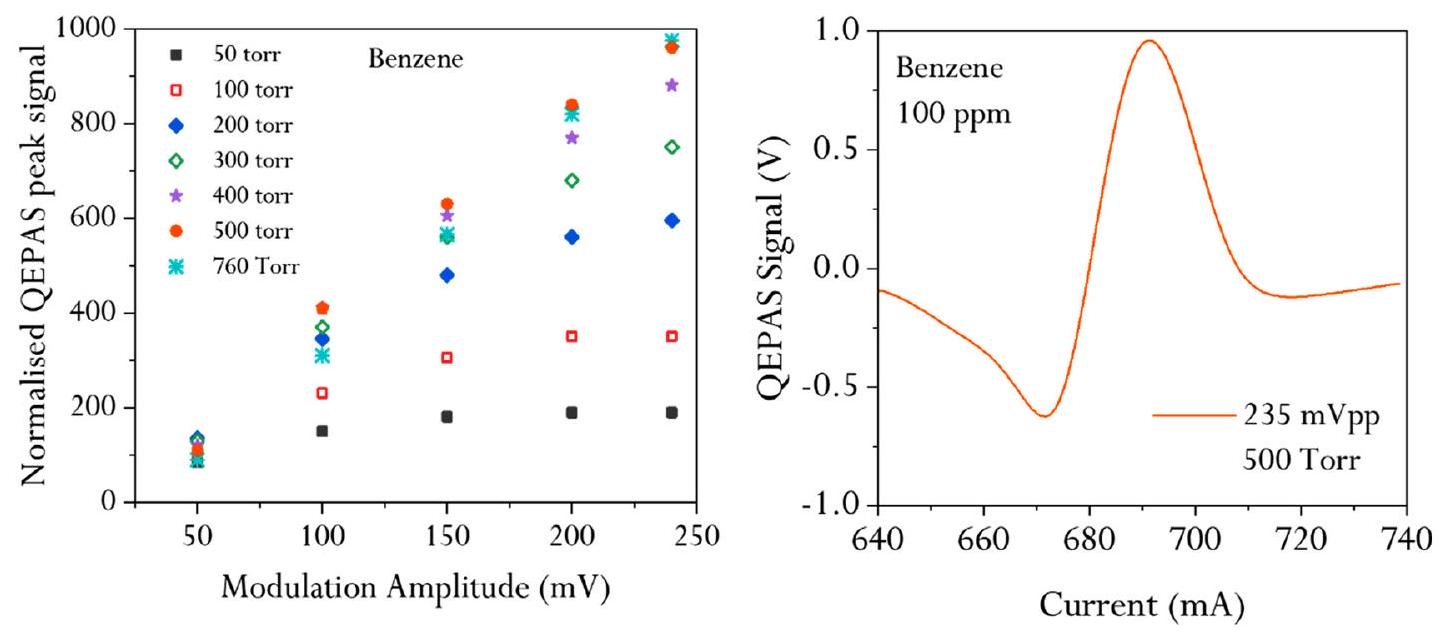
الشكل 6. (يسار) إشارة قمة QEPAS المعيارية للبنزين مرسومة مقابل سعة تعديل الذروة إلى الذروة لليزر عند ضغوط مختلفة. (يمين) إشارة QEPAS لـ 100 جزء في المليون من البنزين تم الحصول عليها عن طريق تغيير تيار حقن الليزر ضمننطاق الضبط في ظروف العمل المثلى، أي 235 مللي فولت ذروة إلى ذروة في سعة تعديل تيار الليزر و500 تور.
نتجت بالفعل مشوهة بشدة عند ضغوط أعلى من 300 تور: لهذا السبب، تم تقييد التحقيق في النطاقتُور. استنادًا إلى هذه الملاحظات، تم اختيار الضغط الأمثل وعمق التعديل، مع الأخذ في الاعتبار الحد الأقصى لسعة الإشارة المسجلة لأكثر الميزات كثافة في طيف كل مادة تحليلية، مع الحفاظ دائمًا على الشكل المميز للطيف لأغراض الانتقائية. بالنسبة للتولوين، تم تحديد الضغط الأمثل ليكون 200 تُور، مع عمق تعديل مثالي يبلغ 200 مللي فولت ذروة إلى ذروة. بالنسبة للبنزين، وُجد أن الضغط الأمثل هو 500 تُور، مع عمق تعديل مثالي يبلغ 235 مللي فولت ذروة إلى ذروة. أخيرًا، بالنسبة للبروبان، تم تحديد الضغط الأمثل ليكون 400 تُور، مصحوبًا بعمق تعديل مثالي يبلغ 300 مللي فولت ذروة إلى ذروة. طيف QEPAS الذي يعرض تم تقديم قمم الامتصاص لكل غاز في ظروف العمل المثلى المحددة في الأشكال 5-7 (اليمين) للتولوين، والبنزين، والبروبان، على التوالي.
لتحديد الحساسية لكل نوع من الغاز، تم إجراء عملية معايرة من خلال الحصول على مسح طيفي عند تركيزات مختلفة من الغاز المستهدف تم الحصول عليها عن طريق تخفيف خليط الغاز المعتمد مع النيتروجين المرطب. )، كما هو موضح في الأشكال 8-10 (يسار). تم استخراج القيمة القصوى لأكثر ميزات الامتصاص كثافة لكل مادة تحليل ورسمها كدالة لتركيز الجزيء المقابل. تم ملاءمة هذه البيانات بواسطة استيفاء خطي، مما يظهر خطية ممتازة لكل جزيء، كما هو موضح في الأشكال 8-10 (يمين). سمحت هذه المعايرات بتحديد مستويات الحساسية من خلال الميل النسبي، مما أدى إلى ، و للتولوين،
الشكل 7. (يسار) إشارة قمة QEPAS المعيارية للبروبان مرسومة مقابل سعة تعديل الذبذبة من قمة إلى قمة لليزر عند ضغوط مختلفة. (يمين) إشارة QEPAS لـ 10000 جزء في المليون من البروبان تم الحصول عليها عن طريق تغيير تيار حقن الليزر ضمن نطاق ضبط QCL في ظروف العمل المثلى، أي، 300 مللي فولت سعة تعديل تيار الليزر من قمة إلى قمة و400 تور.
الشكل 8. (يسار) إشارة QEPAS للتولوين التي تم الحصول عليها عن طريق تغيير تيار حقن الليزر ضمن نطاق ضبط QCL في ظروف العمل المثلى، أي، 200 مللي فولت سعة تعديل تيار الليزر من قمة إلى قمة و200 تور. (يمين) قمم الميزة الأكثر كثافة مرسومة مقابل تركيز التولوين (دوائر سوداء). تم الإبلاغ عن الميل وقيم R-squared للملاءمة الخطية (خط منقط أسود).
تم الكشف عن البنزين والبروبان، على التوالي. تم حساب مستوى الضوضاء (0.07 و 0.15 و 0.07 مللي فولت للتولوين والبنزين والبروبان، على التوالي) كمعيار انحراف ( ) استجابة المستشعر عندما لا يوجد امتصاص بصري، وعادة ما يتم تحقيق ذلك عن طريق تدفق النيتروجين النقي عبر خلية QEPAS.
لتقدير الحد الأدنى القابل للتحقيق للكشف (MDL) كدالة لوقت تكامل القفل، تم إجراء تحليل انحراف ألان-ويرل على اكتساب الضوضاء لمدة 2.5 ساعة. يظهر تحليل انحراف ألان-ويرل في الشكل 11. أظهر المستشعر MDL قدره، و15 جزء في المليون للتولوين، والبنزين، والبروبان، على التوالي، في وقت تكامل قفل قدره 0.1 ثانية. من خلال زيادة وقت التكامل، من الممكن تعزيز الحساسية وبالتالي تحسين حد الكشف لنظام الاستشعار. حدود الكشف الدنيا
يتوافق مع وقت تكامل قدره 10 ثوانٍ كما هو موضح في الشكل 11. توضح تحليل انحراف ألان أنه بالنسبة لأوقات التكامل التي تقل عن 100 ثانية (التولوين والبروبان) و60 ثانية (البنزين)، يتبع مستوى الضوضاء عن كثب اعتمادًا على هذه الملاحظة تشير إلى أن المصدر الرئيسي للضوضاء في QEPAS هو الضوضاء الحرارية في شوكة التوليف الكوارتزية (QTF). بالنسبة لأوقات التكامل الأطول، تتدهور الحساسية. يمكن أن يُعزى هذا السلوك بشكل أساسي إلى حدوث تأثيرات طويلة الأمد أخرى، مثل عدم استقرار الليزر والميكانيكا، بالإضافة إلى انحرافات درجة الحرارة البطيئة.
تحليل الانتقائية
لضمان الدقة والموثوقية في الكشف عن الغازات المحددة، لا يمكن المبالغة في أهمية الانتقائية في المستشعرات. عالية
الشكل 9. (يسارًا) إشارة QEPAS للبنزين التي تم الحصول عليها عن طريق تغيير تيار حقن الليزر ضمن نطاق التوليف في ظروف العمل المثلى، أي، 235 مللي فولت سعة تعديل تيار الليزر من ذروة إلى ذروة و500 تور. (يمينًا) قمم الميزة الأكثر كثافة تم رسمها مقابل تركيز البنزين (دوائر سوداء). تم الإبلاغ عن الميل وقيم R-squared للملاءمة الخطية (خط منقط أسود).
الشكل 10. (يسارًا) طيف QEPAS للبروبان الذي تم الحصول عليه عن طريق تغيير تيار حقن الليزر ضمن نطاق التوليف QCLp في ظروف العمل المثلى، أي، 300 مللي فولت سعة تعديل تيار الليزر من ذروة إلى ذروة و400 تور. (يمينًا) قمم الميزة الأكثر كثافة تم رسمها مقابل تركيز البروبان (دوائر سوداء). تم الإبلاغ عن الميل وقيم R-squared للملاءمة الخطية (خط منقط أسود).
الشكل 11. (أ)-(ج) تحليل انحراف ألان-ويرل للتولوين والبنزين والبروبان، على التوالي، مع الإبلاغ عن الحد الأدنى من حد الكشف كدالة لوقت تكامل القفل. تم وضع علامة على الحد الأدنى من حد الكشف الذي تم تحقيقه لوقت تكامل قدره 10 ثوانٍ لكل نوع من الغاز.
الشكل 12. (أ) مقارنة بين إشارة QEPAS التي تم الحصول عليها لـ 240 جزء في المليون من البنزين في النيتروجين (خط أسود)، لـ 150 جزء في المليون من الإيثيل بنزين في النيتروجين (خط أحمر)، وللنيتروجين النقي (خط أزرق) التي تم الحصول عليها عن طريق تغيير تيار حقن الليزر ضمن نطاق التوليف QCL عند 200 مللي فولت سعة تعديل تيار الليزر من ذروة إلى ذروة و200 تور. (ب) مقارنة بين إشارات QEPAS لـ 30 جزء في المليون من التولوين في النيتروجين (خط أزرق) ومزيجين: 30 جزء في المليون من التولوين مختلط مع 40 جزء في المليون من الإيثيل بنزين في النيتروجين (خط أخضر) و30 جزء في المليون من التولوين مختلط مع 192 جزء في المليون من البنزين في النيتروجين (خط أحمر) التي تم الحصول عليها في نفس الظروف التجريبية كما في (أ). (ج) مقارنة بين إشارات QEPAS لـ 10 أجزاء في المليون من البنزين في النيتروجين (خط أخضر) ومزيج من 10 أجزاء في المليون من البنزين و68 جزء في المليون من التولوين و20 جزء في المليون من الإيثيل بنزين في النيتروجين (خط أحمر) التي تم الحصول عليها عن طريق تغيير تيار حقن الليزر ضمن نطاق التوليف في 235 مللي فولت سعة تعديل تيار الليزر من ذروة إلى ذروة و500 تور.
تسمح الانتقائية بإجراء قياسات دقيقة من خلال التركيز على الغاز المستهدف مع تقليل تأثير المركبات الأخرى، وبالتالي القضاء على القراءات الخاطئة. بالإضافة إلى ذلك، تؤدي الانتقائية العالية إلى حساسية أفضل، مما يمكّن المستشعرات من اكتشاف حتى التركيزات المنخفضة أو التغيرات الطفيفة في الخلطات متعددة المكونات. وبالتالي، تم التحقيق في التداخلات الطيفية المحتملة التي تسببها الإيثيل بنزين على كشف التولوين والبنزين، بالإضافة إلى التداخل الذي تسببه الميثان والإيثان على البروبان. تم إجراء تحليل مقارن لإشارات QEPAS التي تم الحصول عليها في النيتروجين النقي، دون وجود BTEX أو البروبان، مع الإشارات التي تم الحصول عليها في وجود التولوين والبنزين والبروبان. علاوة على ذلك، تم تحليل مزيج هذه الغازات لتقييم أي تغييرات محتملة في الميزات الطيفية أو أقصى قوة لإشارة QEPAS. يهدف هذا التحليل إلى التحقق مما إذا كانت تعقيد مزيج الغاز يؤثر على كفاءة تحويل الإشعاع إلى صوت للعملية، والتي هي
رقم يصف مدى فعالية استرخاء الطاقة لجزيء مستهدف في مصفوفة غاز معينة عند ضغط معين، بعد إثارة ضوئية تتميز بتردد تعديل
تظل كل من الضغوط العاملة وعمق التعديل كما تم تحسينها كما تم مناقشته سابقًا.
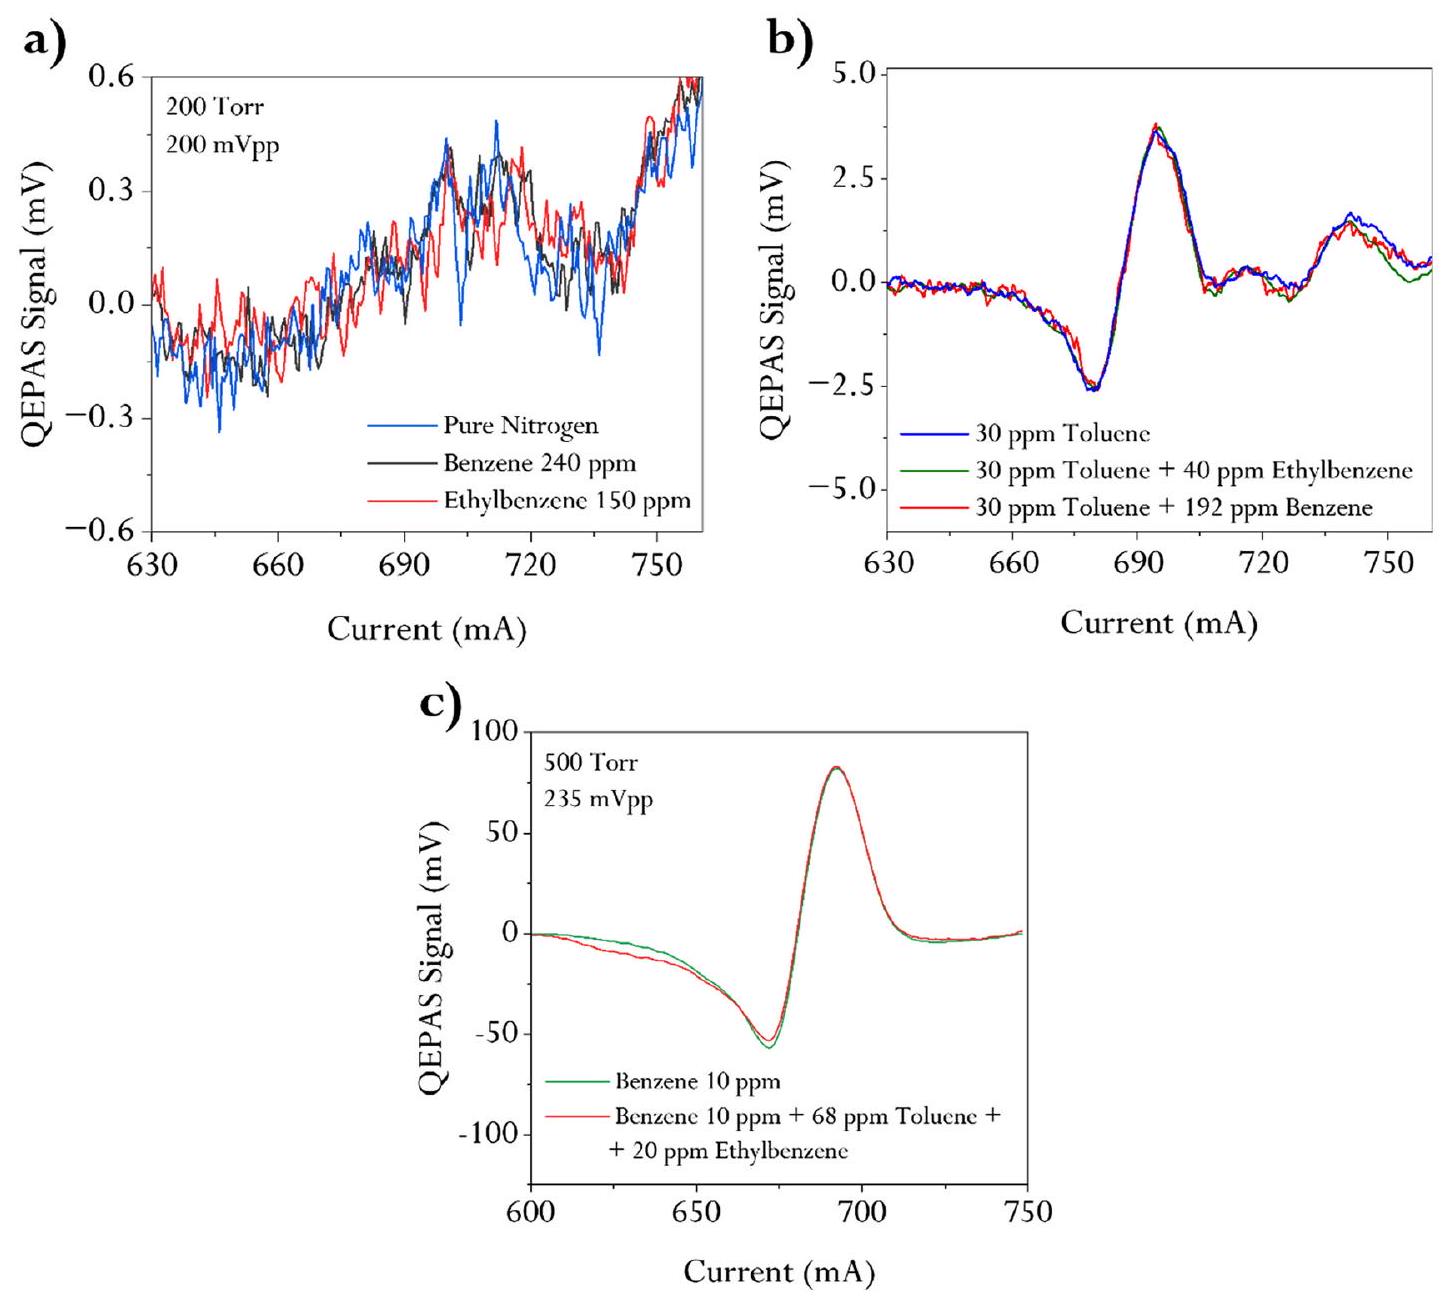
يوضح الشكل 12(أ) مقارنة لإشارة QEPAS التي تم الحصول عليها لـ 240 جزء في المليون من البنزين و150 جزء في المليون من الإيثيل بنزين والنيتروجين النقي، باستخدام الإعداد الموضح في الشكل 3 مع كمصدر للضوء. تؤكد النتيجة أن كل من البنزين والإيثيل بنزين ليس لهما ميزات امتصاص يمكن اكتشافها ضمن النطاق الديناميكي الحالي لـ . تم تأكيد ذلك من خلال تقييم الفرق نقطة بنقطة بين الطيفين الثلاثة، مما أدى إلى تقلبات أقل من تقلبات إشارة QEPAS عند أي قيمة تيار ثابتة. يمكن أن يُعزى الهيكل الطيفي الخلفي الضعيف المرئي في جميع الحالات الثلاث إلى
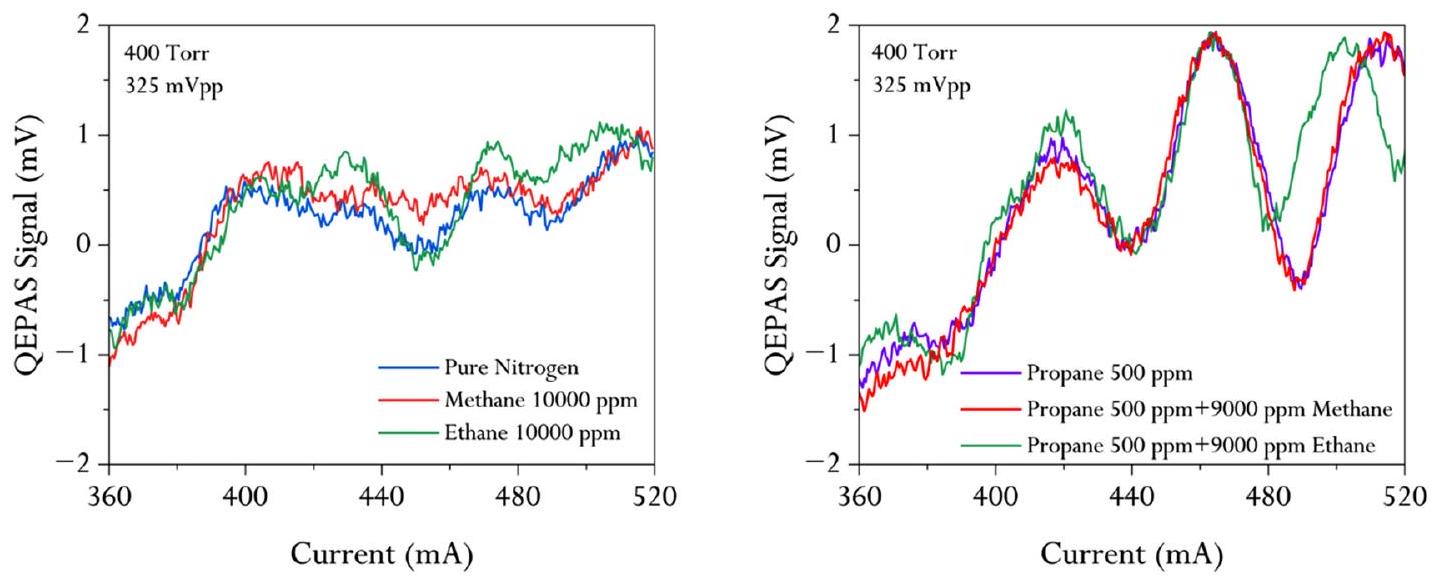
الشكل 13. (اللوحة اليسرى) مقارنة بين إشارة QEPAS التي تم الحصول عليها لـ 10000 جزء في المليون من الميثان في النيتروجين (خط أحمر)، 10000 جزء في المليون من الإيثان في النيتروجين (خط أخضر)، والنيتروجين النقي (خط أزرق) التي تم الحصول عليها عن طريق تغيير تيار حقن الليزر ضمن نطاق التوليف QCL عند 300 مللي فولت سعة تعديل تيار الليزر من ذروة إلى ذروة و400 تور. (اللوحة اليمنى) مقارنة لإشارة QEPAS لـ 500 جزء في المليون من البروبان في النيتروجين (خط بنفسجي) مع مزيجين: 500 جزء في المليون من البروبان مختلط مع 9000 جزء في المليون من الميثان في النيتروجين (خط أحمر) و500 جزء في المليون من البروبان مختلط مع 9000 جزء في المليون من الإيثان في النيتروجين (خط أخضر).
إلى التغيرات في نفاذية نوافذ Ge البصرية عند الأطوال الموجية الأطول.
التحقق الإضافي الذي يجب القيام به يتكون في تقييم ما إذا كان الكشف عن التولوين سيتأثر بوجود البنزين والإيثيل بنزين من حيث كفاءة تحويل الإشعاع إلى صوت، وبالتالي، في شكل تأثير المصفوفة. الشكل 12(ب) يقارن ميزة QEPAS الطيفية للتولوين المكتسبة في ثلاث تخفيفات مختلفة: 30 جزء في المليون من التولوين في من التولوين مع 40 جزء في المليون من الإيثيل بنزين في ، و30 جزء في المليون من التولوين مع 192 جزء في المليون من البنزين في . يشير التداخل الكامل للطيفين الثلاثة إلى أن كل من قيمة الذروة وشكل الميزة محفوظان، ضمن تقلبات إشارة QEPAS لأقوى ذروة. نظرًا لأن إشارة QEPAS تتناسب طرديًا مع تؤكد هذه النتيجة أن حتى التلوث الضخم من الإيثيل بنزين و/أو البنزين في المزيج لا يؤثر على كفاءة تحويل الإشعاع إلى صوت في الكشف عن التولوين، مما يلغي مشكلة اعتماد إشارة QEPAS على تغييرات المصفوفة بالنسبة لهذين الملوثين.
الشكل 12(ج) يقارن إشارة QEPAS التي تم الحصول عليها مع لـ 10 أجزاء في المليون من البنزين في مع مزيج غازي يتكون من 10 أجزاء في المليون من البنزين مختلط مع 68 جزء في المليون من التولوين و20 جزء في المليون من الإيثيل بنزين في . هنا أيضًا، يبقى كل من شكل المسح الطيفي وسعة الذروة كما هي، مما يشير إلى تأثير ضئيل في كفاءة تحويل الإشعاع إلى صوت.
أخيرًا، اللوحة اليسرى في الشكل 13 تُبلغ عن المقارنة بين المسحات الطيفية لـ QEPAS التي تم الحصول عليها لمزيج من 10000 جزء في المليون من الميثان في ومزيج من 10000 جزء في المليون من الإيثان، جنبًا إلى جنب مع الاكتساب في النيتروجين النقي. بالنسبة لهذا التكوين الطيفي، تم استخدامه في الإعداد التجريبي في الشكل 3. الاختلافات الطفيفة بين المسحات الطيفية ضمن النطاق العام للتوليف لـ بالكاد يمكن تمييزها، حتى عند استكشاف نطاقات تركيز عالية جدًا للعنصرين التحليليين.
علاوة على ذلك، تقارن اللوحة اليمنى في الشكل 13 إشارات QEPAS التي تم الحصول عليها لـ 500 جزء في المليون من البروبان في مع مزيجين غازيين مختلفين. يتكون المزيج الأول من 500 جزء في المليون من البروبان مختلط مع 9000 جزء في المليون من الميثان في ، بينما يتكون المزيج الثاني من 500 جزء في المليون من البروبان مختلط مع 9000 جزء في المليون من الإيثان في . من
اللوحة اليمنى، يمكن القول بسهولة أن هناك تطابقًا مثاليًا بين مسح QEPAS للبروبان في النقي والاستحواذ المتعلق بالمزيج الذي يحتوي على البروبان والميثان. من الواضح أيضًا أنه عندما يكون الإيثان موجودًا في عينة الغاز، تظهر بعض الاختلافات من حيث شكل طيف QEPAS بالنسبة للعينة التي تحتوي فقط على البروبان، خاصة عند الاقتراب من الحد الأعلى لنطاق تيار الحقن. ويرجع ذلك إلى امتصاص غير صفري للإيثان ضمن النطاق الطيفي الذي تم التحقيق فيه. ومع ذلك، إذا تم اعتبار السمة المركزية الوحيدة للبروبان التي بلغت ذروتها عند 470 مللي أمبير، فإن الطيفين الثلاثة يميلون إلى التداخل تمامًا بالقرب من قيمة الذروة. وهذا يؤكد مرة أخرى مدى أهمية تحديد عمق التعديل الأكثر ملاءمة، بهدف إجراء قياسات على الذروة بشكل انتقائي دون أي نوع من التداخل الطيفي/غير الطيفي للبروبان، حتى في وجود ألكانات أخف أخرى، والتي من المتوقع عادة أن تكون بوفرة أعلى في المزيجات الشبيهة بالغاز الطبيعي.
الخاتمة والآفاق
طيفية الطول الموجي الطويل هي مجال بحث لا يزال غير مستكشف بشكل كبير يمكن أن يسمح بالكشف عن المركبات العضوية المتطايرة ذات بصمات طيفية مميزة. في الواقع، في نطاق الطول الموجي بين 10 ويمكن فصل ميزات الامتصاص للأنواع مثل BTEXs أو الهيدروكربونات بشكل جيد جداً بالنسبة لنطاق الأشعة تحت الحمراء المتوسطة والقريبة، مما يفتح الطريق لاكتشافها الانتقائي حتى في الخلطات المعقدة.
في هذه المخطوطة البحثية، تم تصميم وإظهار بنية QEPAS للكشف عن اثنين من المركبات النموذجية BTEX مثل البنزين والتولوين، مع البروبان. البروبان هو أول هيدروكربون من الألكانات الخفيفة بدون ميزات طيفية مميزة في نافذة الهيدروكربونات، أي،النطاق، فيما يتعلق بالميثان والإيثان، بينما تظهر جميع مركبات BTEX نطاقات امتصاص واسعة ومتداخلة في نافذة الهيدروكربونات. تم معايرة وتوصيف استجابة هذه الثلاثة من المحللات تجاه الإثارة الضوئية الصوتية بالنسبة لبعض من أكثر الملوثات شيوعًا.
خطية الاستجابة وحدود الكشف لـ، و 3 جزء في المليون، على التوالي، قد تم إثباتها للتولوين، والبنزين، والبروبان في مصفوفة نيتروجين نقية في وقت تكامل قدره 10 ثوانٍ. ومع ذلك، الأهم من ذلك، هو مستوى عالٍ من الانتقائية فيما يتعلق بـ تم إثبات تباينات التركيب للمصفوفة الغازية لكل من الثلاثة مواد تحليلية المدروسة. هذه النتيجة مهمة جدًا لأنها تم الحصول عليها من نظام استشعار مثل QEPAS، الذي يتمتع بالصلابة والقدرة على التكيف، ولكنه لا يزال يعتمد على تقنية غير مباشرة وبالتالي يخضع للاعتماد على المصفوفة الغازية. سيتم تكريس الأبحاث المستقبلية لسيناريوهات طيفية أكثر دقة، مثل التمييز والتقدير لتركيز متساويات الزيلين. سيتم أيضًا استكشاف نفس المنطقة الطيفية باستخدام أساليب طيفية بديلة تعتمد على شوكة التوليف، مثل الطيف الحراري الناتج عن الضوء (LITES)، مستفيدة من الامتصاص العالي للكوارتز عند الأطوال الموجية الطويلة.
الشكر والتقدير
يقر المؤلفون بالدعم المالي من برنامج البحث والابتكار التابع للاتحاد الأوروبي Horizon 2020 بموجب اتفاقية منحة ماري سكلودوفسكا-كوري رقم 860808. وقد تم دعم هذا العمل من قبل المؤسسة الوطنية للعلوم الطبيعية في الصين (NSFC) (الأرقام 62122045، 62075119، 62235010، و62175137)؛ برنامج الخبراء الأجانب رفيعي المستوى (رقم G2023004005L)؛ وصندوق شانشي للعلوم للعلماء الشباب المتميزين (رقم 20210302121003). يقر المؤلفون من قسم الفيزياء بين الجامعات بالدعم المالي من خلال مشروع PNC 0000001 D3-4-الصحة-التشخيصات المدفوعة رقمياً، والتنبؤات والعلاجات للرعاية الصحية المستدامة (CUP: B83C22006120001)، والخطة الوطنية للاستثمارات التكميلية لـ NRRP، الممولة من الاتحاد الأوروبي – NextGenerationEU، ومشروع خطة التعافي والقدرة على الصمود (NRRP) “BRIEF-مرافق البحث والابتكار في علم الروبوتات الحيوية” (CUP: J13C22000400007)، الممول من الاتحاد الأوروبي-NextGenerationEU، ومشروع التعاون العلمي والتكنولوجي بين إيطاليا وسنغافورة MAECI “مستشعر متعدد الغازات ذو حساسية فائقة للكشف عن المركبات العضوية المتطايرة (VOCs)” (CUP D93C23000800004)، وTHORLABS GmbH، ضمن PolySense، مختبر بحث مشترك. يعرب المؤلفون من جامعة مونبلييه عن امتنانهم لـ R.Teissier وZ.Loghmari وH.Philip من MirSense لمساهمتهم القيمة في تطوير QCLs المستخدمة في هذا العمل.
إعلانات المؤلفين
تعارض المصالح
ليس لدى المؤلفين أي تضارب في المصالح للإفصاح عنه.
مساهمات المؤلفين
كومار كينجالك: التصور (متساوي)؛ تنظيم البيانات (رائد)؛ التحليل الرسمي (رائد)؛ التحقيق (متساوي)؛ المنهجية (متساوي)؛ البرمجيات (متساوي)؛ الإشراف (متساوي)؛ التحقق (متساوي)؛ التصور (متساوي)؛ الكتابة – المسودة الأصلية (رائد)؛ الكتابة – المراجعة والتحرير (متساوي). فرانشيسكو باتشيولا: التصور (متساوي)؛ تنظيم البيانات (متساوي)؛ التحليل الرسمي (متساوي)؛ التحقيق (متساوي)؛ المنهجية (متساوي)؛ البرمجيات (متساوي)؛ التحقق (متساوي)؛ التصور (متساوي)؛ الكتابة – المسودة الأصلية (رائد)؛ الكتابة – المراجعة والتحرير (متساوي). بو صن: تنظيم البيانات (متساوي)؛ التحليل الرسمي (متساوي)؛ التحقيق (متساوي)؛ البرمجيات (متساوي)؛ التحقق (متساوي)؛ الكتابة – المراجعة والتحرير (متساوي). أندريا زيفاريلي: التصور (متساوي)؛ تنظيم البيانات (متساوي)؛ التحليل الرسمي (متساوي)؛ البرمجيات (متساوي)؛ الإشراف (متساوي)؛ التحقق (متساوي)؛
“الكتابة – المراجعة والتحرير (متساوي). جيان سيرجيو ميندوني: التصور (متساوي)؛ تنسيق البيانات (متساوي)؛ التحليل الرسمي (متساوي)؛ التحقيق (متساوي)؛ المنهجية (متساوي)؛ البرمجيات (متساوي)؛ الإشراف (متساوي)؛ التحقق (متساوي)؛ الكتابة – المراجعة والتحرير (متساوي). ماريلينا جيليو: التصور (متساوي)؛ تنسيق البيانات (متساوي)؛ التحليل الرسمي (متساوي)؛ التحقيق (متساوي)؛ المنهجية (متساوي)؛ البرمجيات (متساوي)؛ الإشراف (متساوي)؛ التحقق (متساوي)؛ الكتابة – المراجعة والتحرير (متساوي). هونغبينغ وو: التصور (متساوي)؛ التحقيق (متساوي)؛ المنهجية (متساوي)؛ الإشراف (متساوي)؛ التحقق (متساوي)؛ الكتابة – المراجعة والتحرير (متساوي). لي دونغ: التصور (متساوي)؛ التحقيق (متساوي)؛ المنهجية (متساوي)؛ الإشراف (متساوي)؛ التحقق (متساوي)؛ الكتابة – المراجعة والتحرير (متساوي). ديبا عياش: التصور (متساوي)؛ التحليل الرسمي (متساوي)؛ التحقيق (متساوي)؛ المنهجية (متساوي)؛ الكتابة – المراجعة والتحرير (متساوي). دافيد بينتو: التحليل الرسمي (متساوي)؛ التحقيق (متساوي)؛ الكتابة – المراجعة والتحرير (متساوي). أورو فيسيت: التصور (متساوي)؛ التحليل الرسمي (متساوي)؛ التحقيق (متساوي)؛ المنهجية (متساوي)؛ الكتابة – المراجعة والتحرير (متساوي). أليكسي بارانوف: التصور (متساوي)؛ التحقيق (متساوي)؛ المنهجية (متساوي)؛ الموارد (متساوي)؛ الإشراف (متساوي)؛ الكتابة – المراجعة والتحرير (متساوي). بييترو باتيميسكو: التصور (متساوي)؛ التحقيق (متساوي)؛ المنهجية (متساوي)؛ الموارد (متساوي)؛ الإشراف (متساوي)؛ الكتابة – المراجعة والتحرير (متساوي). أنجيلو سامباولو: التصور (رائد)؛ التحليل الرسمي (متساوي)؛ التحقيق (متساوي)؛ المنهجية
توفر البيانات
البيانات التي تدعم نتائج هذه الدراسة متاحة من المؤلفين المراسلين عند الطلب المعقول.
REFERENCES
A. Trakoli, Occup. Med. 62, 232 (2012). M. T. Smith, Annu. Rev. Public Health 31, 133 (2010). A. N. Baghani, A. Sorooshian, M. Heydari, R. Sheikhi, S. Golbaz, Q. Ashournejad, M. Kermani, F. Golkhorshidi, A. Barkhordari, A. J. Jafari, M. Delikhoon, and A. Shahsavani, Environ. Pollut. 247, 607 (2019). A. Garg, N. C. Gupta, and S. K. Tyagi, Environ. Claims J. 31, 5 (2019). M. M. Greenberg, Environ. Res 72, 1-7 (1997). B. Yu, Z. Yuan, Z. Yu, and F. Xue-song, Chem. Eng. J. 435, 134825 (2022). Committee on Acute Exposure Guideline Levels, Committee on Toxicology, Board on Environmental Studies and Toxicology, Division on Earth and Life Studies, and National Research Council, Acute Exposure Guideline Levels for Selected Airborne Chemicals (National Academies Press, Washington, DC, 2012). F. S. Cikach and R. A. Dweik, Prog. Cardiovasc. Dis. 55, 34 (2012). C. Lourenço and C. Turner, Metabolites 4, 465 (2014). A. Sharma, R. Kumar, and P. Varadwaj, Mol. Diagn. Ther. 27, 321 (2023). D. Poli, P. Carbognani, M. Corradi, M. Goldoni, O. Acampa, B. Balbi, L. Bianchi, M. Rusca, and A. Mutti, Respir. Res. 6, 71 (2005). F. W. Karasek and R. E. Clement, in Basic Gas Chromatography-Mass Spectrometry (Elsevier, 1988), pp. 79-159. D. O. Sparkman, Z. E. Penton, and F. G. Kitson, in Gas Chromatography and Mass Spectrometry: A Practical Guide (Elsevier, 2011), pp. xv-xvii. F. Opekar and K. Štulík, In Encyclopedia of Analytical Chemistry (John Wiley & Sons, Ltd, Chichester, UK, 2009). M. J. Madou and S. R. Morrison, Chemical Sensing with Solid State Devices (Elsevier, 1989). J. Hodgkinson and R. P. Tatam, Meas. Sci. Technol. 24, 012004 (2013). K. Ruxton, A. L. Chakraborty, W. Johnstone, M. Lengden, G. Stewart, and K. Duffin, Sens. Actuators, B 150, 367 (2010). J. Cousin, W. Chen, D. Bigourd, M. Fourmentin, and S. Kassi, Appl. Phys. B 97, 919 (2009). J. Waschull, B. Sumpf, Y. Heiner, and H.-D. Kronfeldt, Infrared Phys. Technol. 37, 193 (1996). M. Mhanna, M. Sy, A. Arfaj, J. Llamas, and A. Farooq, Opt. Lett. 47(13), 32473250 (2022). I. E. Gordon, L. S. Rothman, R. J. Hargreaves, R. Hashemi, E. V. Karlovets, F. M. Skinner, E. K. Conway, C. Hill, R. V. Kochanov, Y. Tan, P. Wcisło, A. A. Finenko, K. Nelson, P. F. Bernath, M. Birk, V. Boudon, A. Campargue, K. V. Chance, A. Coustenis, B. J. Drouin, J. M. Flaud, R. R. Gamache, J. T. Hodges, D. Jacquemart, E. J. Mlawer, A. V. Nikitin, V. I. Perevalov, M. Rotger, J. Tennyson, G. C. Toon, H. Tran, V. G. Tyuterev, E. M. Adkins, A. Baker, A. Barbe, E. Canè, A. G. Császár, A. Dudaryonok, O. Egorov, A. J. Fleisher, H. Fleurbaey, A. Foltynowicz, T. Furtenbacher, J. J. Harrison, J. M. Hartmann, V. M. Horneman, X. Huang, T. Karman, J. Karns, S. Kassi, I. Kleiner, V. Kofman, F. KwabiaTchana, N. N. Lavrentieva, T. J. Lee, D. A. Long, A. A. Lukashevskaya, O. M. Lyulin, V. Y. Makhnev, W. Matt, S. T. Massie, M. Melosso, S. N. Mikhailenko, D. Mondelain, H. S. P. Müller, O. V. Naumenko, A. Perrin, O. L. Polyansky, E. Raddaoui, P. L. Raston, Z. D. Reed, M. Rey, C. Richard, R. Tóbiás, I. Sadiek, D. W. Schwenke, E. Starikova, K. Sung, F. Tamassia, S. A. Tashkun, J. Vander Auwera, I. A. Vasilenko, A. A. Vigasin, G. L. Villanueva, B. Vispoel, G. Wagner, A. Yachmenev, and S. N. Yurchenko, J. Quant. Spectrosc. Radiat. Transfer 277, 107949 (2022). A. Sampaolo, P. Patimisco, M. Giglio, A. Zifarelli, H. Wu, L. Dong, and V. Spagnolo, Anal. Chim. Acta 1202, 338894 (2022). E. Benveniste, A. Vasanelli, A. Delteil, J. Devenson, R. Teissier, A. Baranov, A. M. Andrews, G. Strasser, I. Sagnes, and C. Sirtori, Appl. Phys. Lett. 93, 131108 (2008). H. Nguyen Van, Z. Loghmari, H. Philip, M. Bahriz, A. Baranov, and R. Teissier, Photonics 6, 31 (2019). M. Carras, M. Garcia, X. Marcadet, O. Parillaud, A. De Rossi, and S. Bansropun, Appl. Phys. Lett. 93, 11109 (2008). Y. Jin, F. Sun, J. Li, C. S. Tan, K. H. Tan, S. Wicaksono, C. Sirtori, S. F. Yoon, and Q. J. Wang, Opt. Express 31, 27543 (2023). S. Lin, J. Chang, J. Sun, and P. Xu, Front. Phys. 10, 853966 (2022). S. Brown, Chem. Rev. 103, 5219 (2003). VIGO Photonics, see https://Vigophotonics.Com/Product/Pci-4te-14/ for “HgCdTe (MCT) Photoconductive Detector PCI-4TE-14.” K. F. Mak, L. Ju, F. Wang, and T. F. Heinz, Solid State Commun. 152, 1341 (2012). C.-H. Liu, Y.-C. Chang, T. B. Norris, and Z. Zhong, Nat. Nanotechnol. 9, 273 (2014). T. Wei, A. Zifarelli, S. Dello Russo, H. Wu, G. Menduni, P. Patimisco, A. Sampaolo, V. Spagnolo, and L. Dong, Appl. Phys. Rev. 8, 041409 (2021). D. Ayache, W. Trzpil, R. Rousseau, K. Kinjalk, R. Teissier, A. N. Baranov, M. Bahriz, and A. Vicet, Opt. Express 30, 5531 (2022). J. Karhu, H. Philip, A. Baranov, R. Teissier, and T. Hieta, Opt. Lett. 45, 5962 (2020). P. Luo, J. Harrist, G. Menduni, R. Mesdour, N. StMichel, and A. Sampaolo, ACS Omega 7, 3395 (2022). A. Sampaolo, S. Csutak, P. Patimisco, M. Giglio, G. Menduni, V. Passaro, F. K. Tittel, M. Deffenbaugh, and V. Spagnolo, Sens. Actuators, B 282, 952 (2019). A. Zifarelli, M. Giglio, G. Menduni, A. Sampaolo, P. Patimisco, V. M. N. Passaro, H. Wu, L. Dong, and V. Spagnolo, Anal. Chem. 92, 11035 (2020). G. Gassler, B. Reißenauer, and W. Hüttner, Z. Naturforsch., A 44, 316 (1989). K. Kinjalk, D. A. Díaz-Thomas, Z. Loghmari, M. Bahriz, R. Teissier, and A. N. Baranov, Photonics 9, 747 (2022). Thorlabs, see https://www.Thorlabs.Com/Thorproduct.Cfm?Partnumber for “TH100PT Platinum Resistance Temperature Detector.” P. M. Chu, F. R. Guenther, G. C. Rhoderick, and W. J. Lafferty, J. Res. Natl. Inst. Stand. Technol. 104, 59 (1999). M. Margoshes and V. A. Fassel, Spectrochim. Acta 7, 14 (1955). P. Patimisco, A. Sampaolo, M. Giglio, S. dello Russo, V. Mackowiak, H. Rossmadl, A. Cable, F. K. Tittel, and V. Spagnolo, Opt. Express 27, 1401 (2019). S. Dello Russo, A. Sampaolo, P. Patimisco, G. Menduni, M. Giglio, C. Hoelzl, V. M. N. Passaro, H. Wu, L. Dong, and V. Spagnolo, Photoacoustics 21, 100227 (2021). P. Patimisco, A. Sampaolo, H. Zheng, L. Dong, F. K. Tittel, and V. Spagnolo, Adv. Phys. X 2, 169 (2016). P. Patimisco, A. Sampaolo, Y. Bidaux, A. Bismuto, M. Scott, J. Jiang, A. Muller, J. Faist, F. K. Tittel, and V. Spagnolo, Opt. Express 24, 25943 (2016). See https://www.Thorlabs.Com/Newgrouppage9.Cfm?Objectgroup_id=3980&g clid=CjwKCAjwvfmoBhAwEiwAG2tqzPVYZtwLMNdhxMOQ46kA_wMauM H3V1h2Ws_cdSCHxjv0SG7LYtVgAhoC0HcQAvD_BwE for “THORLABSGermanium Windows.”
Kumar Kinjalk, (D) Francesco Paciolla, (D Bo Sun, Andrea Zifarelli, (D) Giansergio Menduni, (D Marilena Giglio, Hongpeng Wu, (D) Lei Dong, (D) Diba Ayache, Davide Pinto, (D) Aurore Vicet, (D) Alexei Baranov, (D) Pietro Patimisco, (D Angelo Sampaolo, (D) and Vincenzo Spagnolo (D)
AFFILIATIONS
PolySense Lab, Dipartimento Interateneo di Fisica, University and Polytechnic of Bari, Via Amendola 173, Bari 70126, Italy IES, University of Montpellier, CNRS, 34095 Montpellier, France State Key Laboratory of Quantum Optics and Quantum Optics Devices, Institute of Laser Spectroscopy, Shanxi University, Taiyuan 030006, China Collaborative Innovation Center of Extreme Optics, Shanxi University, Taiyuan 030006, China PolySense Innovations srl, Via Amendola 173, Bari 70126, Italy
Note: This paper is part of the APR Special Topic on Volatile Organic Compounds and their Applications. Authors to whom correspondence should be addressed: wuhp@sxu.edu.cn and angelo.sampaolo@poliba.it
Abstract
The precise detection of volatile organic compounds plays a pivotal role in addressing environmental concerns, industrial safety, and medical diagnostics. The accurate identification and quantification of these compounds because of their ubiquity and potential health hazards has fueled the development of advanced sensing technologies. This work presents a sensing system in the realm of long-wavelength infrared spectroscopy for achieving enhanced selectivity and sensitivity of benzene, toluene, and propane detection through quartz-enhanced photoacoustic spectroscopy. High-resolution gas spectroscopy is made possible by the use of specially designed -based quantum cascade lasers, emitting in the wavelength range , and quartz tuning forks. The sensor system, characterized by its robustness and precision, demonstrates exceptional capabilities in benzene, toluene, and propane detection. The system’s capacity for practical applications in environmental monitoring and medical diagnostics is demonstrated by its ability to distinguish these volatile organic compounds with a minimum detection limit of , and 3 ppm for toluene, benzene, and propane at an integration time of 10 s , even in complex gas matrices. This work advances gas sensing technology while also offering insightful information on spectral interferences, a persistent problem in the field. The results usher in a new era of sophisticated and reliable gas sensing techniques meeting the growing demand for precise volatile organic compounds detectors for environmental monitoring purposes.
The need for accurate detection and quantification of volatile organic compounds (VOCs) such as hydrocarbons and BTEX (benzene, toluene, ethylbenzene, and xylene) has finally gained, during the last decade, the deserved level of attention within the environmental research community due to their high level of volatilization and toxicity. The exact identification of such compounds is crucial for monitoring
air quality, identifying their origins, and evaluating possible health and environmental hazards because of their widespread production/use in industrial processes, transportation, and a variety of other areas.
BTEX have been identified as significant contributors to air pollution with detrimental effects on human health. The International Agency for Research on Cancer (IARC) and the United States Environmental Protection Agency (EPA) have both identified benzene
as a human carcinogen. Leukemia, neurological diseases, and respiratory illnesses have all been related to long-term exposure to benzene. Toluene, ethylbenzene, and xylene also provoke health problems due to their ability to contribute to the development of ground-level ozone and smog, as well as their effects on the central nervous and respiratory system. Propane on the other hand is generally considered safe. However, its detection plays a crucial role in safe handling, storage, and usage of petroleum and natural gas. In industrial environments, accurate detection of propane is critical for preventing leaks, ensuring compliance with safety protocols, and optimizing fuel usage.
Therefore, the widespread application and potential hazards of these VOCs necessitate highly specific and sensitive detection methods. Moreover, in the field of medical diagnostics, an increasing number of studies has demonstrated the presence of abnormally elevated levels of these VOCs in exhaled breath as an indicator of certain diseases. In the case of BTEXs, they can be found in exhaled breath mainly as exogenous biomarkers, most of the times in smokers and in individuals who have been exposed to BTEX anomalous concentrations in the environment. Hence, portable, sensitive, and selective breath sensors could potentially serve as noninvasive early diagnostic tools for point-of-care mass screening.
BTEX analysis has conventionally relied on established techniques, such as the combination of gas chromatography and mass spectrometry, which have been widely regarded as the gold standard. The utilization of such techniques provides a notable degree of accuracy and sensitivity, facilitating precise measurement and differentiation of distinct BTEX constituents. Notwithstanding their efficacy, these methods tend to be slow, demand proficient personnel, and entail analysis in a laboratory setting, thereby rendering them less appropriate for expeditious on-site monitoring. Lately, to address these issues, various sensor types, including, but not limited to, electrochemi and solid-state, have been developed. These sensors offer improved detection sensitivity, selectivity, speed, portability, and ease of use. Nevertheless, stability, lifetime, and performances of these sensors are strongly affected by environmental conditions, such as temperature and humidity levels.
In this context, optical sensors have been identified as a viable solution for trace gas detection due to their capability to provide high sensitivity and selectivity by exploiting laser excitation of infrared molecular transitions. Optical sensors offer sophisticated functionalities for accurate and dependable gas analysis, relying on direct or indirect absorption techniques and taking advantages from the unique features of the laser devices in terms of narrow spectral bandwidth and high-power continuous wave operation. Several works reported on infrared sensors to exploit the absorption range of benzene through techniques such as cavity-enhanced spectroscopy and multipass absorption sensing via difference frequency generation. Additionally, the band at has been investigated using tunable diode laser spectroscopy by employing a multi-pass Herriott cell with a path length of
However, these spectral regions are characterized by a low selectivity, due to the strong overlap of BTEX and lighter hydrocarbons, as they share the same class of molecular vibrations ( stretching around and bending around ). alternative to these spectral ranges is represented by the region , where intense and well-separated BTEX spectral features occur.
The spectroscopic scenario involving BTEX absorption bands and the most relevant atmospheric absorbers/potential interferents, such as water vapor and carbon dioxide, in the wavelength range is represented in Fig. 1.
The absorption coefficient was simulated separately for pure compounds just for comparing shape and potential overlap of the absorption bands, regardless of the realistic concentration ranges of specific applications. Water vapor absorption lines are almost completely absent in this range, or at least irrelevant, while spectrum although present, exhibits sharp lines that can be perfectly discriminated from the other VOCs of interest by suitably choosing operating pressures and modulation depths in a wavelength modulation spectroscopic configuration.
However, in the long-wavelength IR spectral region, the state-of-the-art for coherent light sources is meager. The lack of sources suitable for tunable diode laser absorption spectroscopy (TDLAS) above is due to fundamental performance limitations of long wavelength semiconductor lasers. Interband diode lasers could in principle operate only at cryogenic temperatures because of the strong nonradiative Auger recombination in the materials with a small bandgap. Interband lasers are currently not available at all in the considered spectral range. This problem can be overcome in sources employing intersubband transitions where the Auger processes are much weaker. However, the electron lifetime in the upper level of an intersubband lasing transition, the main parameter responsible for the quantum cascade laser (QCL) optical gain, quickly drops with increasing emission wavelength, and the lasers emitting above exhibit poor performance. For this reason, conventional long wavelength QCLs based on InP are unable to operate in the continuous wave regime close to room temperature. The intersubband optical gain depends on the electron effective mass in the quantum wells as , which makes materials with a small very attractive for the development of long wavelength QCLs. In this work, we employed QCLs where the lasing transitions occur in InAs quantum wells. Due to the small electron effective mass, InAs-based QCLs exhibit higher optical gain compared
FIG. 1. Simulation of the absorption coefficient at atmospheric pressure of pure BTEX, water vapor, and carbon dioxide in the wavelength range, from HITRAN database.
with the InP-based counterparts and demonstrated much better performance. Consecutive design adjustments allowed achieving room temperature continuous wave (CW) operation of such lasers at wavelengths up to A detailed discussion on the design and characteristics of recent InAs-based long wavelength QCLs can be found in Ref. 25. For this study, the QCL structure was tailored to place the peak gain in the required spectral bands. The epitaxial wafers grown by molecular beam epitaxy were then processed into single frequency distributed feedback (DFB) lasers with a top metal grating using electron beam lithography and dry and wet chemical etching. The devices exhibit good spectral purity with side mode suppression ratio (SMSR) , and tunability of , enabling precise targeting of the absorption lines of benzene, toluene, and propane.
Recently, a tunable single-mode slot waveguide QCL array, emitting in the range has been demonstrated to be suitable for long wavelength spectroscopy of acetylene and oxylene, implementing a hollow core fiber and a photovoltaic detector having a bandwidth optimized up to The main limitation affecting direct absorption techniques, such as TDLAS and cavityenhanced absorption spectroscopy (CEAS), mainly consists in the lack of commercially available long wavelength detectors suitable for sensing platform devoted to in situ and real time gas detection, and in the limited spectral bandwidth of high-quality optical components (for CEAS configurations in particular). The market of near- and midinfrared photodetectors (PD) is dominated by amplified-PDs and thermoelectrically cooled photoconductive (PC) and photovoltaic (PV) detectors, respectively, which offer high responsivity but in a relatively narrow spectral range of operation below . Beyond , a narrow range of devices can be employed, mainly detectors based on photoconductive HgCdTe (MCT) technology, whose detectivity decreases by more than two orders of magnitude compared to those operating up to . Commercially available thermal PDs, such as pyroelectric detectors (PYDs) and Golay-cells (GC) can be exploited beyond , with the drawbacks of (i) a relatively small noise equivalent power (NEP) and detection bandwidth for PYDs with respect to PV and PC and (ii) extremely low response times for GCs. Sophisticated setups requiring high performance in terms of NEP usually rely on commercial superconducting bolometers, which need liquid-helium cooling. Graphene has been demonstrated to be a promising material for infrared broadband photodetectors due to its gapless band structure, but its low optical absorption limits drastically its responsivity and, in general, represents a novel technology far from reaching a commercial maturity. From 2019, quartz tuning forks (QTFs) have been exploited as photodetectors in light-induced thermoelastic spectroscopy, exploiting the photo-thermo-elastic conversion of light within the structure of the mechanical resonator and proving a flat spectral response from to Nevertheless, the effectiveness of this physical process up to still needs to be demonstrated.
In the last 4 years, indirect spectroscopic approaches that can avoid the use of optical detectors, such as photoacoustic configurations, have been successfully demonstrated employing a QCL operating at for benzene detection combined with (i) a standard 32 kHz tuning fork in a quartz-enhanced photoacoustic spectroscopy (QEPAS) system, and with (ii) a cantilever-based photoacoustic sensor. These advancements demonstrate the ongoing development and diversification of infrared sensing technologies, expanding the range of
applications and improving the detection capabilities in various spectral regions.
However, the detection of BTEX compounds, as well as the heavier alkanes like propane, butane, and pentane, presents unique challenges stemming from the potential spectral interferences among themselves or with other compounds. The presence of coexisting VOCs characterized by the same bonds can normally introduce spectral interferences especially in the spectral region where the fundamental bands of IR transitions lie, resulting in overlapping absorption features or distorted signals. For instance, while methane (C1) and ethane (C2) have been demonstrated to be easily separated and independently detected even at atmospheric pressure at propane (C3) spectral features seem to be totally overlapping with C2 background absorption, making it difficult to discriminate and quantify C3 except through sophisticated multilinear or even multivariate approaches. This issue of spectral interference should be eliminated at longer wavelength ( ) where BTEX and heavier hydrocarbons show distinct and isolated absorption features, like propane transition at Unfortunately, the lack of suitable laser sources has limited the development of these sensors at such long wavelengths.
In this landscape, the following study aims to demonstrating the effectiveness of an optical sensor with high sensitivity and selectivity for detecting two representative BTEXs (benzene and toluene) and heavy hydrocarbons, such as propane. The sensor is based on QEPAS technique and combines custom-designed quartz tuning forks with noncommercial long-wavelength QCLs emitting in the range . With respect to standard QTFs employed so far, the lower frequency of the custom resonators helps in improving the energy relaxation efficiency, while the custom design and dimensions help in reducing the optical noise introduced by poor quality laser beams. Following a careful analysis of each VOC’s absorption bands, the QCLs have been designed to operate at specific wavelengths, exciting the most suitable and intense absorption features for wavelength modulation detection. The design of the QCL structure used in this study has been extensively discussed in previous works. These devices exhibit good spectral purity with side mode suppression ratio (SMSR) , and tunability of , enabling precise targeting of the absorption lines associated with benzene, toluene, and propane. Using the developed sensing system, we have examined and confirmed the absence of both spectral and non-spectral interference among BTEX. Moreover, we have also verified the selectivity of propane detection within gas matrices rich in C 1 and C 2 . In this case as well, nonspectral cross sensitivities have been shown to be insignificant.
This research work paves the way to the development of modular point-sensing QEPAS detectors, highly adaptable to the (i) excitation wavelength, (ii) quality of the laser beam, and (iii) composition of the gas matrix.
EXPERIMENTAL SETUP
The laser sources employed for this investigation consist in three InAs-based distributed feedback quantum cascade lasers designed to emit at wavelengths resonant with absorption bands of toluene ( ), benzene ( ), and propane ( ). The design, growth, and fabrication of these devices were carried out at IES, University of Montpellier. The fabricated DFB QCLs are mounted on aluminum nitride (ALN) heatsink, collimated, and packaged in a customized enclosure equipped with a PT100
temperature sensor and a Peltier cooling element. External water cooling is also available in the enclosure to aid in extracting heat generated by the Peltier element. The operating temperature range for these QCLs in a CW regime extends from to close to room temperature. In this experiment, specific operating temperatures have been selected to target and allow an efficient exploitation of the identified spectral fingerprints: , and for , and , respectively.
Figure 2(a) illustrates the optical power vs current and voltage vs current characteristics of , and at the specified temperatures. The optical power reaches 11,4 , and 3 mW , respectively.
Figure 2(b)-2(d) displays the absorption coefficient for toluene, benzene, and propane at atmospheric pressure as a function of wavenumber (solid lines), as obtained from the NIST [Figs. 2(b) and 2(c)] and HITRAN [Fig. 2(d)] database. Additionally, datapoints depict the wavelength tuning range of the devices as a function of the injection current, at the selected operating temperatures. As reported in the introduction section, these absorption features are related to different molecular vibrations. The benzene and toluene (BT) bands correspond to aryl C-H out-of-plane bending, while the propane rotational structure refers to C -type -rocking fundamental mode. bands are both more separated and more intense with respect to the spectral window where aryl C-D stretching is mostly involved, while
propane shows absorption coefficients times stronger at 3369 nm , but an almost total overlap with lighter hydrocarbons.
The QEPAS sensing system with the possibility to interchange the three DFB QCLs is schematically depicted in Fig. 3. The sensor head, the gas line, and the electronic components used to drive the QCLs and acquire data are included in the schematic.
The sensor head includes an acoustic detection module (ADM) equipped with two germanium optical windows, inlet and outlet connectors to regulate gas flow, and houses a spectrophone composed of a T-shaped QTF acoustically coupled with a pair of resonator tubes, composing a spectrophone. The dimensions of the T-shaped QTF are documented in Ref. 43. The millimeter-size resonator tubes (mRes) are positioned 2 mm below the top of the QTF, perpendicular to its plane, and separated by a gap measuring 0.2 mm . The mRes are 12.4 mm long and have an internal diameter of 1.59 mm and an external diameter of 1.83 mm . The T-shaped custom resonator was selected because of three main reasons: (i) its nominal resonance frequency, i.e., 12.5 kHz , (ii) the prongs’ gap of 0.8 mm , and (iii) the experimental value of the SNR enhancement provided by the spectrophone with respect to the bare QTF. In fact, fundamental resonance modes in the range were demonstrated to be the best trade-off between QTF quality factors and compatibility of the resonance frequencies with the typical energy relaxation times of molecules in the range
FIG. 2. (a) Optical power vs current and voltage vs current characteristics of (red curves), (black curves), and (blue curves) operating at , and , respectively. (b)-(d) Solid lines represent the simulation of the absorption coefficient for pure toluene, benzene, and propane at atmospheric pressure. The spectra of the absorption coefficient of toluene and benzene are obtained from the NIST database, while the propane spectrum is obtained from the HITRAN database. Dotted lines and solid symbols mark the QCL wavelength tuning ranges as a function of the QCLs’ injection current.
FIG. 3. The schematic diagram of the QEPAS sensor system employing custom InAs-based long wavelength DFB QCL (distributed feedback quantum cascade laser). ADM: acoustic detection module and TA: transimpedance amplifier.
100-760 Torr. Moreover, the experimental SNR enhancement of for the T-shaped QTF is the largest demonstrated so far. The larger prongs’ spacing with respect to the 0.3 mm of the standard QTF is particularly useful for accommodating large beam waist of long wavelengths as well as poor quality beams. The resonance frequency and quality factor of the fundamental in-plane flexural mode for the specific resonator employed in this work have been retrieved via inverse piezoelectric effect, i.e., by exciting the resonator with a sinusoidal voltage signal and performing a frequency sweep. Both resonance
curve and values as a function of pressure are plotted in Fig. 4. Under atmospheric pressure and in a mixture of pure , the QTF exhibits a resonance frequency of and a quality factor of .
Components of the gas line include certified gas cylinders, a gas blender, a pressure regulator, a needle valve, and a vacuum pump. With pure as the carrier gas, the gas blender (MCQ Instruments) is used to precisely control the flow rate of each individual gas channel and produce the desired gas mixture. An Alicat pressure controller/
FIG. 4. (left) QTF resonance frequency (green circles) and quality factor (orange squares) as a function of pressure. (right) Resonance curve of the QTF at 760 Torr. The squared amplitude of the QTF signal is plotted as a function of the excitation frequency. The red circles represent acquired data, while the red curve is a fit of the data using a Lorentzian function. The blue dotted line indicates the resonance peak corresponding to the QTF frequency.
flow meter, in conjunction with a needle valve and a pump, is used to precisely regulate gas pressure and flow rate within the gas line. The gas flow rate is maintained at a constant value of 50 sccm , with a precision of for the flow setpoint for every channel. To control the QCLs, a combined laser current driver and TEC controller (Thorlabs ITC4002QCL) is used. The current driver provides the necessary current to operate the QCLs and the TEC controls operation temperature. The collimated beam is focused between the prongs of the QTF, through Ge optical window and the resonator tubes, into the ADM, using a ZnSe plano-convex lens with a focal length of 50 mm having a antireflection coating. The ADM is mounted on a five-axis stage to ensure precise alignment. Alignment is critical in preventing the laser beam tail from hitting the resonator tubes and/or the quartz tuning fork prongs, which can produce a non-zero background and negatively impact the sensor’s detection sensitivity. The alignment process is aided by an optical power meter (THORLABS PM100D).
To carry out QEPAS measurements, the wavelength modulation and 2 f detection method is employed. This involves applying a sinusoidal dither, which matches half of the QTF resonance frequency, to the QCL current driver. A transimpedance amplifier is then used to convert the resulting piezoelectric charge into an electrical signal. The transduced QTF signal is demodulated by a lock-in amplifier (MFIA 500 kHz Lock-in Amplifier, Zurich Instruments) at the QTF resonance frequency. A lock-in time constant of 100 ms is used in this process. The demodulated signal is then digitized and saved on a personal computer using a data acquisition board, with the sampling time set to three times the lock-in time constant.
SENSOR OPTIMIZATION, SENSITIVITY, AND MINIMUM DETECTION LIMIT
In QEPAS, the optimization of gas pressure and modulation depth is of critical importance to enhance the sensitivity of the QEPAS system. When dealing with purely Lorentzian and isolated optical transitions, the operating pressure optimization has the main goal of finding a trade-off between the increase in the QEPAS signal as the target
molecules increases (and so the pressure), and the QTF’s quality factor deterioration due to increasing of the working pressure. Once the optimum pressure maximizing the QEPAS signal is identified, the optimum modulation depth for a purely Lorentzian and isolated feature is mainly determined by its linewidth. In the case of broadband absorption features with the presence of interferents, the identification of the optimum working pressure becomes more a matter of trade-off between maximizing the QEPAS signal and the spectral selectivity, posing the issue of an accurate reconstruction of the spectral fingerprint of the target features. For example, at a fixed operating pressure, the effect of overmodulation may provide a generally intense signal spectrum, but with the drawback of being composed of lesscharacteristic features for signal discrimination with respect to potential interferents. In this perspective, it is thus crucial to preserve the derivative shape of the absorption profile as well as to prevent the modulation depth from exciting nearby absorption features of potential interferents. In fact, the experimental determination of the best operating conditions in terms of pressure and QCL current modulation depth aims at achieving the right balance between signal enhancement and spectral distinctiveness of the absorption features for each target molecule.
Figures 5-7 (left) show the normalized QEPAS peak signals as a function of modulation depth at different pressures for certified concentrations of toluene ( 150 ppm in ), benzene ( 100 ppm in ), and propane ( 1000 ppm in ) by interchanging , , and , respectively, in the QEPAS system depicted in Fig. 3. The pressure ranges of investigation are different from analyte to analyte. Pressures lower than 50 Torr for benzene and toluene and 200 Torr for propane were not considered because the QEPAS signal was too low in the overall investigated range of modulation depth. It is evident from Figs. 5-7 (left) that as the pressure increases, there is a corresponding rise in the QEPAS peak signal. However, as the pressure and the modulation depth increase, the target feature experiences a rising distortion as well as the whole spectrum, with the result of deteriorating its spectral specificity. In fact, the reference absorption feature for toluene
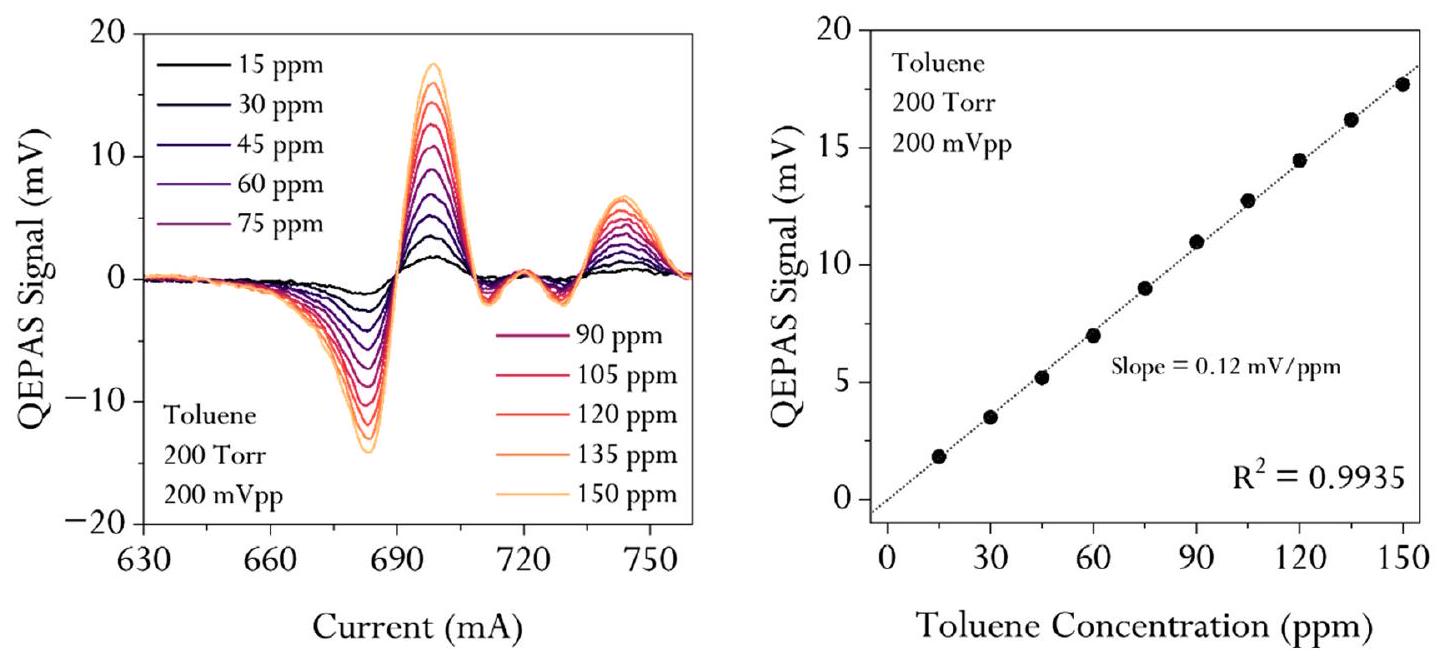
FIG. 5. (left) Normalized QEPAS peak signal of toluene plotted against the laser peak-to-peak modulation amplitude at various pressures. (right) QEPAS signal of 150 ppm of toluene obtained by sweeping the laser injection current within the QCL tuning range at optimal working conditions, i.e., 200 mV peak-to-peak laser current modulation amplitude and 200 Torr.
FIG. 6. (left) Normalized QEPAS peak signal of benzene plotted against the laser peak-to-peak modulation amplitude at various pressures. (right) QEPAS signal of 100 ppm of benzene obtained by sweeping the laser injection current within the tuning range at optimal working conditions, i.e., 235 mV peak-to-peak laser current modulation amplitude and 500 Torr.
resulted already heavily distorted at pressures higher than 300 Torr: for this reason, the investigation was restricted in the range Torr. Based on these observations, the optimum pressure and modulation depth were selected, considering the maximum signal amplitude recorded for the most intense feature of each analyte’s spectrum but always preserving the characteristic shape of the spectra for selectivity issues. For toluene, the optimal pressure was determined to be 200 Torr, with a corresponding optimal modulation depth of 200 mVpp . For benzene, the optimal pressure was found to be 500 Torr, with an optimal modulation depth of 235 mVpp . Finally, for propane, the optimal pressure was determined to be 400 Torr, accompanied by an optimum modulation depth of 300 mVpp . The QEPAS spectrum showcasing the
absorption peaks for each gas at respective identified optimum working conditions are presented in Figs. 5-7 (right) for toluene, benzene, and propane, respectively.
To determine the sensitivity for each gas species, a calibration process was conducted by acquiring spectral scans at different gas target concentrations obtained by diluting the certified gas mixture with humidified nitrogen ( ), as shown in Figs. 8-10 (left). The peak value of the most intense absorption feature for each analyte was extracted and plotted as a function of the corresponding molecule concentration. These data have been fitted by a linear interpolation, showing an excellent linearity for each molecule, as depicted in Figs. 8-10 (right). These calibrations allowed determining the sensitivity levels through the relative slopes, resulting in , and for toluene,
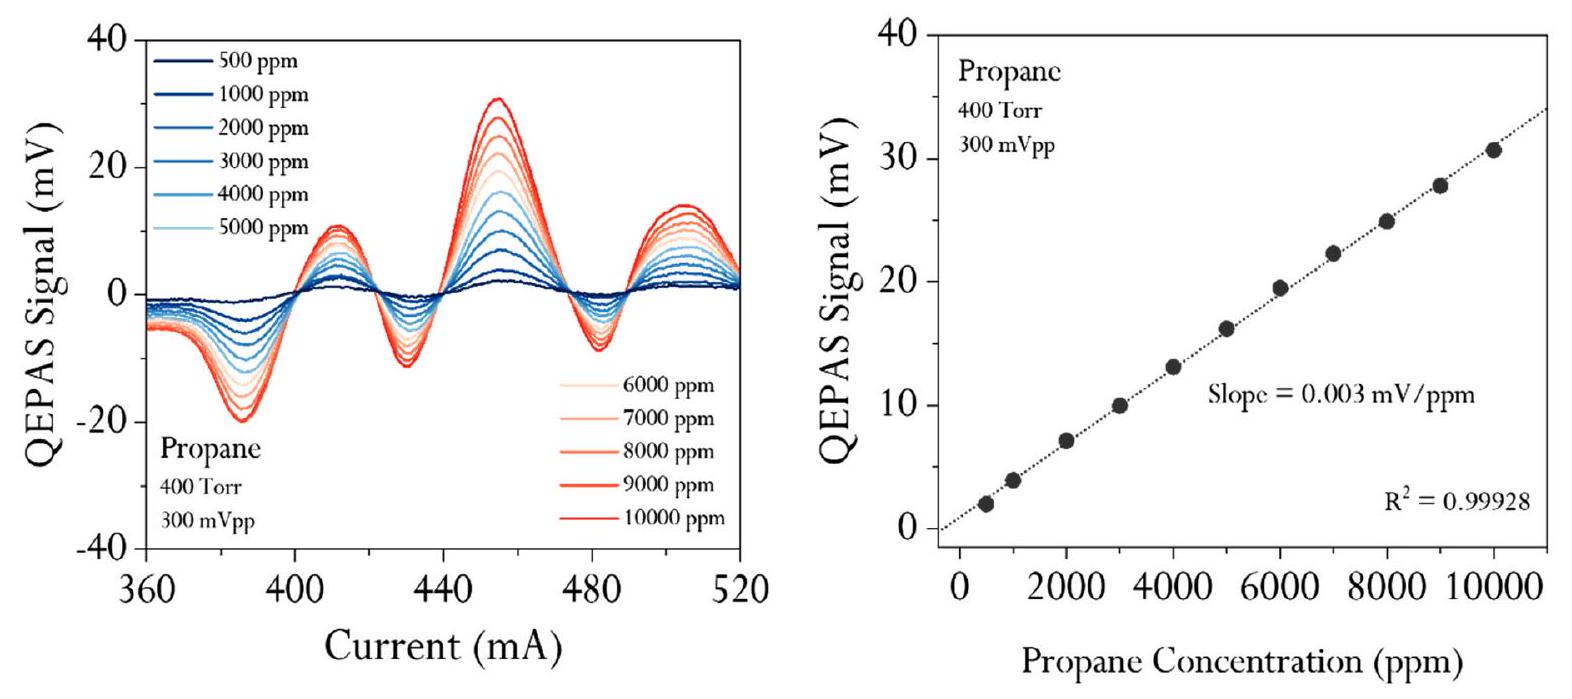
FIG. 7. (left) Normalized QEPAS peak signal of propane plotted against the laser peak-to-peak modulation amplitude at various pressures. (right) QEPAS signal of 10000 ppm of propane obtained by sweeping the laser injection current within the QCL tuning range at optimal working conditions, i.e., 300 mV peak-to-peak laser current modulation amplitude and 400 Torr.
FIG. 8. (left) QEPAS signal of toluene obtained by sweeping the laser injection current within the QCL tuning range at optimal working conditions, i.e., 200 mV peak-to-peak laser current modulation amplitude and 200 Torr. (right) Peaks of most intense feature plotted against toluene concentration (black circles). The slope and R-squared values of the linear fit (black dotted line) are reported.
benzene, and propane detection, respectively. The noise level ( 0.07 , 0.15 , and 0.07 mV for toluene, benzene, and propane, respectively) was calculated as the standard deviation ( ) of the sensor response when there is no optical absorption, typically achieved by flowing pure nitrogen through the QEPAS cell.
To estimate the achievable minimum detection limit (MDL) as a function of the lock-in integration time, an Allan-Werle deviation analysis was performed on a noise acquisition of 2.5 h . The AllanWerle deviation analysis is shown in Fig. 11. The sensor exhibited an MDL of , and 15 ppm for toluene, benzene, and propane, respectively, at a lock-in integration time of 0.1 s . By increasing the integration time, it is possible to enhance the sensitivity and thus improve the detection limit of the sensing system. The MDLs
corresponding to a 10 s integration time are marked in Fig. 11. The Allan deviation analysis demonstrates that for integration times less than 100 s (toluene and propane) and 60 s (benzene), the noise level closely follows a dependence. This observation suggests that the dominant source of noise in QEPAS is the thermal noise in the quartz tuning fork (QTF). For longer integration times, sensitivity deteriorates. This behavior can be primarily attributed to the occurrence of other long-term effects, such as laser and mechanical instabilities, as well as slow temperature drifts.
SELECTIVITY ANALYSIS
To ensure accuracy and reliability in detecting specific gases, the importance of selectivity in sensors cannot be overstated. High
FIG. 9. (left) QEPAS signal of benzene obtained by sweeping the laser injection current within the tuning range at optimal working conditions, i.e., 235 mV peak-to-peak laser current modulation amplitude and 500 Torr. (right) Peaks of most intense feature plotted against benzene concentration (black circles). The slope and R-squared values of the linear fit (black dotted line) are reported.
FIG. 10. (left) QEPAS spectra of propane obtained by sweeping the laser injection current within the QCLp tuning range at optimal working conditions, i.e., 300 mV peak-topeak laser current modulation amplitude and 400 Torr. (right) Peaks of most intense feature plotted against propane concentration (black circles). The slope and R-squared values of the linear fit (black dotted line) are reported.
FIG. 11. (a)-(c) Allan-Werle deviation analysis of toluene, benzene, and propane, respectively, reporting the minimum detection limit as a function of lock-in integration time. The minimum detection limit achieved for an integration time of 10 s is marked for each gas species.
FIG. 12. (a) Comparison between the QEPAS signal obtained for 240 ppm of benzene in nitrogen (black line), for 150 ppm of ethylbenzene in nitrogen (red line), and for pure nitrogen (blue line) obtained by sweeping the laser injection current within the QCL tuning range at 200 mV peak-to-peak laser current modulation amplitude and 200 Torr. (b) Comparison between the QEPAS signals of 30 ppm of toluene in nitrogen (blue line) and two mixtures: 30 ppm of toluene mixed with 40 ppm ethylbenzene in nitrogen (green line) and 30 ppm toluene mixed with 192 ppm of benzene in nitrogen (red line) obtained in the same experimental conditions as in (a). (c) Comparison between the QEPAS signals of 10 ppm of benzene in nitrogen (green line) and a mixture of 10 ppm of benzene, 68 ppm of toluene, and 20 ppm of ethylbenzene in nitrogen (red line) obtained by sweeping the laser injection current within the tuning range at 235 mV peak-to-peak laser current modulation amplitude and 500 Torr.
selectivity allows for precise measurements by concentrating on the target gas while reducing the impact of other compounds, thus eliminating false readings. Additionally, high selectivity results in better sensitivity, enabling sensors to detect even lower concentrations or subtle changes in multi-component mixtures. Thereby, the potential spectral interferences caused by ethylbenzene on toluene and benzene detection, as well as the interference caused by methane and ethane on propane have been investigated. A comparative analysis of the QEPAS signals obtained in pure nitrogen, without the presence of BTEX or propane, with the signals obtained in the presence of toluene, benzene, and propane has been performed. Furthermore, the mixture of these gases has been analyzed to assess any potential alterations in the spectral features or the maximum strength of the QEPAS signal. This analysis aims at verifying whether the complexity of the gas mixture affects the radiation-to-sound conversion efficiency of the process, which is
a figure of merit describing how effective the energy relaxation of a target molecule is in a specific gas matrix at a given pressure, following a photoacoustic excitation characterized by a modulation frequency
Both the working pressures and the modulation depths remain those optimized as discussed previously.
Figure 12(a) illustrates a comparison of the QEPAS signal obtained for 240 ppm of benzene, 150 ppm of ethylbenzene, and pure nitrogen, by employing the setup depicted in Fig. 3 with as the light source. The result confirms that both benzene and ethylbenzene have no absorption features detectable within the current dynamic range of . This was confirmed by evaluating the point-by-point difference among the three spectra, resulting in fluctuations lower than the fluctuations of the QEPAS signal at any fixed current value. The weak background spectral structure visible in all three cases can be attributed
FIG. 13. (left panel) Comparison between the QEPAS signal obtained for 10000 ppm of methane in nitrogen (red line), 10000 ppm of ethane in nitrogen (green line), and pure nitrogen (blue line) obtained by sweeping the laser injection current within the QCL tuning range at 300 mV peak-to-peak laser current modulation amplitude and 400 Torr. (Right panel) Comparison of QEPAS signal for 500 ppm of propane in nitrogen (purple line) with two mixtures: 500 ppm of propane mixed with 9000 ppm of methane in nitrogen (red line) and 500 ppm of propane mixed with 9000 ppm of ethane in nitrogen (green line).
to the changes in the transmissivity of Ge optical windows at longer wavelengths.
The further verification to carry out consists in evaluating whether toluene detection would be affected by the presence of benzene and ethylbenzene in terms of radiation-to-sound conversion efficiency, thus, in the form of matrix effect. Figure 12(b) compares the QEPAS spectral feature of toluene acquired in three different dilutions: 30 ppm of toluene in of toluene with 40 ppm of ethylbenzene in , and 30 ppm of toluene with 192 ppm of benzene in . The full overlap of the three spectra indicates that both the peak value and the shape of the feature is preserved, within the fluctuations of the QEPAS signal for the strongest peak. Since the QEPAS signal is directly proportional to this result confirms that even a massive contamination from ethylbenzene and/or benzene in the mixture does not affect the efficiency of radiation-to-sound conversion in the toluene detection, eliminating the problem of the QEPAS signal dependence on matrix variations with respect to those two contaminants.
Figure 12(c) compares the QEPAS signal obtained with for 10 ppm of benzene in with a gas mixture comprising 10 ppm of benzene combined with 68 ppm of toluene and 20 ppm of ethylbenzene in . Here as well, both the shape of the spectral scans and the peak amplitude remain the same, indicating a negligible influence in the radiation-to-sound conversion efficiency.
Finally, the left panel in Fig. 13 reports the comparison between the QEPAS spectral scans obtained for a mixture of 10000 ppm of methane in and a mixture of 10000 ppm of ethane, together with the acquisition in pure nitrogen. For this spectral configuration, was employed in the experimental setup of Fig. 3. Slight differences among the spectral scans within the overall tuning range of are hardly distinguishable, even exploring very high concentration ranges for the two analytes.
Furthermore, the right panel in Fig. 13 compares the QEPAS signals obtained for 500 ppm of propane in with two different gas mixtures. The first mixture comprises 500 ppm of propane combined with 9000 ppm of methane in , while the second mixture consists of 500 ppm of propane combined with 9000 ppm of ethane in . From
the right panel, it can be easily argued that there is a perfect correspondence between the QEPAS scan of propane in pure and the acquisition related to the mixture containing propane and methane. It is also clear that when ethane is present in the gas sample, some differences in terms of QEPAS spectrum shape arise with respect to the sample containing only propane, especially approaching the upper limit of the injection current span. This is due to a nonzero absorption of ethane within the investigated spectral range. Nevertheless, if the only central feature of propane peaked at 470 mA is considered, the three spectra tend to perfectly overlap in proximity to the peak value. This confirms one more time how important the identification of the most suitable modulation depth is, with the aim of selectively performing on-peak measurements without any kind of spectral/non spectral interference for propane, even in the presence of other lighter alkanes, which are normally expected at higher abundances in natural gas-like mixtures.
CONCLUSION AND PERSPECTIVES
Long wavelength spectroscopy is a still substantially unexplored research field that could allow the detection of VOCs with distinctive spectral fingerprints. Indeed, in the wavelength range between 10 and , the absorption features of species like BTEXs or hydrocarbons can be very well separated with respect to the mid- and near-IR range, opening the way to their selective detection even in complex mixtures.
In this research manuscript, a QEPAS architecture for detection of two representative BTEXs such as benzene and toluene, together with propane, has been designed and demonstrated. Propane is the first hydrocarbon of the light alkanes without distinctive spectral features in the hydrocarbon window, i.e., range, with respect to methane and ethane, while all the BTEXs show broad and overlapped absorption bands in the hydrocarbon window. The response of these three analytes to the photoacoustic excitation has been calibrated and characterized with respect to some of their most common interferents.
Response linearity and detection limits of , and 3 ppm , respectively, have been demonstrated for toluene, benzene, and propane in pure nitrogen matrix at an integration time of 10 s . However, more importantly, a high level of selectivity with respect to
the composition variations of the gaseous matrix has been demonstrated for each of the three analytes considered. This result is very important because it has been obtained for a sensing system such as QEPAS, which is very robust and compact, but still based on an indirect technique and therefore subject to dependence on the gaseous matrix. Future research work will be dedicated to even more delicate spectroscopic scenarios, like discrimination and quantification of xylene isomers’ concentration. The same spectral region will also be explored with alternative tuning fork-based spectroscopic approaches, like light-induced thermoelastic spectroscopy (LITES), exploiting the high absorbance of quartz at long wavelengths.
ACKNOWLEDGMENTS
The authors acknowledge financial support from the European Union’s Horizon 2020 research and innovation programme under the Marie Skłodowska-Curie Grant Agreement No. 860808. This work was supported by the National Natural Science Foundation of China (NSFC) (Nos. 62122045, 62075119, 62235010, and 62175137); the High-end Foreign Expert Program (No. G2023004005L); and the Shanxi Science Fund for Distinguished Young Scholars (No. 20210302121003). The authors from Dipartimento Interateneo di Fisica acknowledge financial support through Project PNC 0000001 D3-4-Health-Digital Driven Diagnostics, prognostics and therapeutics for sustainable Health care (CUP: B83C22006120001), the National Plan for Complementary Investments to the NRRP, funded by the European Union – NextGenerationEU, the National Recovery and Resilience Plan (NRRP) project “BRIEF-Biorobotics Research and Innovation Engineering Facilities” (CUP: J13C22000400007), funded by the European Union-NextGenerationEU, the MAECI ItalySingapore Science and technology cooperation project “Ultrahigh sensitive photoacoustic multi-gas sensor for volatile organic compounds (VOCs) detections” (CUP D93C23000800004), and THORLABS GmbH, within PolySense, a joint-research laboratory. The authors from Montpellier University are grateful to R.Teissier, Z.Loghmari, and H.Philip from MirSense for their valuable contribution to the development of QCLs used in this work.
The data that support the findings of this study are available from the corresponding authors upon reasonable request.
REFERENCES
A. Trakoli, Occup. Med. 62, 232 (2012). M. T. Smith, Annu. Rev. Public Health 31, 133 (2010). A. N. Baghani, A. Sorooshian, M. Heydari, R. Sheikhi, S. Golbaz, Q. Ashournejad, M. Kermani, F. Golkhorshidi, A. Barkhordari, A. J. Jafari, M. Delikhoon, and A. Shahsavani, Environ. Pollut. 247, 607 (2019). A. Garg, N. C. Gupta, and S. K. Tyagi, Environ. Claims J. 31, 5 (2019). M. M. Greenberg, Environ. Res 72, 1-7 (1997). B. Yu, Z. Yuan, Z. Yu, and F. Xue-song, Chem. Eng. J. 435, 134825 (2022). Committee on Acute Exposure Guideline Levels, Committee on Toxicology, Board on Environmental Studies and Toxicology, Division on Earth and Life Studies, and National Research Council, Acute Exposure Guideline Levels for Selected Airborne Chemicals (National Academies Press, Washington, DC, 2012). F. S. Cikach and R. A. Dweik, Prog. Cardiovasc. Dis. 55, 34 (2012). C. Lourenço and C. Turner, Metabolites 4, 465 (2014). A. Sharma, R. Kumar, and P. Varadwaj, Mol. Diagn. Ther. 27, 321 (2023). D. Poli, P. Carbognani, M. Corradi, M. Goldoni, O. Acampa, B. Balbi, L. Bianchi, M. Rusca, and A. Mutti, Respir. Res. 6, 71 (2005). F. W. Karasek and R. E. Clement, in Basic Gas Chromatography-Mass Spectrometry (Elsevier, 1988), pp. 79-159. D. O. Sparkman, Z. E. Penton, and F. G. Kitson, in Gas Chromatography and Mass Spectrometry: A Practical Guide (Elsevier, 2011), pp. xv-xvii. F. Opekar and K. Štulík, In Encyclopedia of Analytical Chemistry (John Wiley & Sons, Ltd, Chichester, UK, 2009). M. J. Madou and S. R. Morrison, Chemical Sensing with Solid State Devices (Elsevier, 1989). J. Hodgkinson and R. P. Tatam, Meas. Sci. Technol. 24, 012004 (2013). K. Ruxton, A. L. Chakraborty, W. Johnstone, M. Lengden, G. Stewart, and K. Duffin, Sens. Actuators, B 150, 367 (2010). J. Cousin, W. Chen, D. Bigourd, M. Fourmentin, and S. Kassi, Appl. Phys. B 97, 919 (2009). J. Waschull, B. Sumpf, Y. Heiner, and H.-D. Kronfeldt, Infrared Phys. Technol. 37, 193 (1996). M. Mhanna, M. Sy, A. Arfaj, J. Llamas, and A. Farooq, Opt. Lett. 47(13), 32473250 (2022). I. E. Gordon, L. S. Rothman, R. J. Hargreaves, R. Hashemi, E. V. Karlovets, F. M. Skinner, E. K. Conway, C. Hill, R. V. Kochanov, Y. Tan, P. Wcisło, A. A. Finenko, K. Nelson, P. F. Bernath, M. Birk, V. Boudon, A. Campargue, K. V. Chance, A. Coustenis, B. J. Drouin, J. M. Flaud, R. R. Gamache, J. T. Hodges, D. Jacquemart, E. J. Mlawer, A. V. Nikitin, V. I. Perevalov, M. Rotger, J. Tennyson, G. C. Toon, H. Tran, V. G. Tyuterev, E. M. Adkins, A. Baker, A. Barbe, E. Canè, A. G. Császár, A. Dudaryonok, O. Egorov, A. J. Fleisher, H. Fleurbaey, A. Foltynowicz, T. Furtenbacher, J. J. Harrison, J. M. Hartmann, V. M. Horneman, X. Huang, T. Karman, J. Karns, S. Kassi, I. Kleiner, V. Kofman, F. KwabiaTchana, N. N. Lavrentieva, T. J. Lee, D. A. Long, A. A. Lukashevskaya, O. M. Lyulin, V. Y. Makhnev, W. Matt, S. T. Massie, M. Melosso, S. N. Mikhailenko, D. Mondelain, H. S. P. Müller, O. V. Naumenko, A. Perrin, O. L. Polyansky, E. Raddaoui, P. L. Raston, Z. D. Reed, M. Rey, C. Richard, R. Tóbiás, I. Sadiek, D. W. Schwenke, E. Starikova, K. Sung, F. Tamassia, S. A. Tashkun, J. Vander Auwera, I. A. Vasilenko, A. A. Vigasin, G. L. Villanueva, B. Vispoel, G. Wagner, A. Yachmenev, and S. N. Yurchenko, J. Quant. Spectrosc. Radiat. Transfer 277, 107949 (2022). A. Sampaolo, P. Patimisco, M. Giglio, A. Zifarelli, H. Wu, L. Dong, and V. Spagnolo, Anal. Chim. Acta 1202, 338894 (2022). E. Benveniste, A. Vasanelli, A. Delteil, J. Devenson, R. Teissier, A. Baranov, A. M. Andrews, G. Strasser, I. Sagnes, and C. Sirtori, Appl. Phys. Lett. 93, 131108 (2008). H. Nguyen Van, Z. Loghmari, H. Philip, M. Bahriz, A. Baranov, and R. Teissier, Photonics 6, 31 (2019). M. Carras, M. Garcia, X. Marcadet, O. Parillaud, A. De Rossi, and S. Bansropun, Appl. Phys. Lett. 93, 11109 (2008). Y. Jin, F. Sun, J. Li, C. S. Tan, K. H. Tan, S. Wicaksono, C. Sirtori, S. F. Yoon, and Q. J. Wang, Opt. Express 31, 27543 (2023). S. Lin, J. Chang, J. Sun, and P. Xu, Front. Phys. 10, 853966 (2022). S. Brown, Chem. Rev. 103, 5219 (2003). VIGO Photonics, see https://Vigophotonics.Com/Product/Pci-4te-14/ for “HgCdTe (MCT) Photoconductive Detector PCI-4TE-14.” K. F. Mak, L. Ju, F. Wang, and T. F. Heinz, Solid State Commun. 152, 1341 (2012). C.-H. Liu, Y.-C. Chang, T. B. Norris, and Z. Zhong, Nat. Nanotechnol. 9, 273 (2014). T. Wei, A. Zifarelli, S. Dello Russo, H. Wu, G. Menduni, P. Patimisco, A. Sampaolo, V. Spagnolo, and L. Dong, Appl. Phys. Rev. 8, 041409 (2021). D. Ayache, W. Trzpil, R. Rousseau, K. Kinjalk, R. Teissier, A. N. Baranov, M. Bahriz, and A. Vicet, Opt. Express 30, 5531 (2022). J. Karhu, H. Philip, A. Baranov, R. Teissier, and T. Hieta, Opt. Lett. 45, 5962 (2020). P. Luo, J. Harrist, G. Menduni, R. Mesdour, N. StMichel, and A. Sampaolo, ACS Omega 7, 3395 (2022). A. Sampaolo, S. Csutak, P. Patimisco, M. Giglio, G. Menduni, V. Passaro, F. K. Tittel, M. Deffenbaugh, and V. Spagnolo, Sens. Actuators, B 282, 952 (2019). A. Zifarelli, M. Giglio, G. Menduni, A. Sampaolo, P. Patimisco, V. M. N. Passaro, H. Wu, L. Dong, and V. Spagnolo, Anal. Chem. 92, 11035 (2020). G. Gassler, B. Reißenauer, and W. Hüttner, Z. Naturforsch., A 44, 316 (1989). K. Kinjalk, D. A. Díaz-Thomas, Z. Loghmari, M. Bahriz, R. Teissier, and A. N. Baranov, Photonics 9, 747 (2022). Thorlabs, see https://www.Thorlabs.Com/Thorproduct.Cfm?Partnumber for “TH100PT Platinum Resistance Temperature Detector.” P. M. Chu, F. R. Guenther, G. C. Rhoderick, and W. J. Lafferty, J. Res. Natl. Inst. Stand. Technol. 104, 59 (1999). M. Margoshes and V. A. Fassel, Spectrochim. Acta 7, 14 (1955). P. Patimisco, A. Sampaolo, M. Giglio, S. dello Russo, V. Mackowiak, H. Rossmadl, A. Cable, F. K. Tittel, and V. Spagnolo, Opt. Express 27, 1401 (2019). S. Dello Russo, A. Sampaolo, P. Patimisco, G. Menduni, M. Giglio, C. Hoelzl, V. M. N. Passaro, H. Wu, L. Dong, and V. Spagnolo, Photoacoustics 21, 100227 (2021). P. Patimisco, A. Sampaolo, H. Zheng, L. Dong, F. K. Tittel, and V. Spagnolo, Adv. Phys. X 2, 169 (2016). P. Patimisco, A. Sampaolo, Y. Bidaux, A. Bismuto, M. Scott, J. Jiang, A. Muller, J. Faist, F. K. Tittel, and V. Spagnolo, Opt. Express 24, 25943 (2016). See https://www.Thorlabs.Com/Newgrouppage9.Cfm?Objectgroup_id=3980&g clid=CjwKCAjwvfmoBhAwEiwAG2tqzPVYZtwLMNdhxMOQ46kA_wMauM H3V1h2Ws_cdSCHxjv0SG7LYtVgAhoC0HcQAvD_BwE for “THORLABSGermanium Windows.”