الكشف الفلوري النسبي للبيوروفوسفات باستخدام أنابيب الكربون النانوية أحادية الجدار المفعلة بـ sp³ Ratiometric fluorescent sensing of pyrophosphate with sp³-functionalized single-walled carbon nanotubes
البي pyrophosphate غير العضوي هو جزيء رئيسي في العديد من العمليات البيولوجية من تخليق الحمض النووي إلى استقلاب الخلايا. هنا نقدم-مفعلأنابيب الكربون النانوية ذات الجدار الواحد (SWNTs) مع انبعاث عيوب متحولة نحو الأحمر كأدوات مضيئة في نطاق الأشعة تحت الحمراء القريبة للكشف البصري وقياس الفوسفات غير العضوي. تعتمد خطة الاستشعار على تثبيتالأيونات على سطح SWNT التي تعززها التنسيق مع مجموعات الأريل الألكاين المرتبطة تساهميًا ومعقد الترايازول. وجودالأيونات على سطح SWNT تسبب ت quenching الفلورية عبر نقل الإلكترون المحفز بالضوء، والذي يتم عكسه بواسطة مواد تحليل معقدة بالنحاس مثل البيروفوسفات. الاختلافات في استجابة الفلورية لـعيب في انبعاث الأنابيب النانوية النقية يمكّن قياسات نسبة قابلة للتكرار في نطاق تركيز واسع. أنابيب الكربون النانوية المغلفة بالفوسفوليبيد-بولي إيثيلين جلايكول المتوافقة حيوياً مع مثل هذهتُستخدم العيوب للكشف عن البيروفوسفات في lysate الخلايا ولمراقبة تقدم تخليق الحمض النووي في تفاعل البوليميراز المتسلسل. قد تكون هذه المجس القوي الذي يعتمد على النسبة والضوء القريب من تحت الحمراء للبيروفوسفات نقطة انطلاق للتصميم العقلاني لأجهزة الاستشعار الحيوية المعتمدة على الأنابيب النانوية.
تعتبر الأنابيب النانوية الكربونية أحادية الجدار منصة واعدة للاستشعار الطيفي في النافذة البيولوجية الثانية (NIR-II، ) حيث أن خصائصها البصرية حساسة جداً لبيئتها يمكن اعتبار الأنابيب النانوية الكربونية المفردة (SWNTs) كأوراق جرافين مطوية بزاويا وأقطار مختلفة تؤدي إلى أنواع مختلفة من الأنابيب النانوية، أي، التدويرات. كل نوع من الأنابيب النانوية المفردة له خصائص بصرية مميزة ويظهر قمم ضوئية ضيقة ضمن نافذة NIR-II.بالإضافة إلى ثباتها الضوئي العالي وقابليتها للتوافق الحيوي، تعتبر الأنابيب النانوية الكربونية المفردة مادة ممتازة لتطوير أجهزة الاستشعار الحيوية.على مدار العقد الماضي، تم تطوير مجموعة متنوعة من أجهزة الاستشعار الحيوية المعتمدة على أنابيب الكربون النانوية المفردة (SWNT) التي تستجيب، على سبيل المثال، للأنماط البكتيرية.تفاعلي أنواع الأكسجينأيونات المعادنالبروتيناتوالناقلات العصبية مثل الدوبامينأحد عيوب الأنابيب النانوية الكربونية المفردة هو عائد الفلورية الكمي المنخفض عادةً (PLQY) ) في التشتت المائي وانخفاض نقاء المادة الخام. لمعالجة هذه القضايا، توسع المجال مؤخرًا نحو استخدام أنابيب الكربون النانوية المفردة (أي، نوع واحد) المصفاة ودمج المواد المتلألئةالعيوب، التي تُسمى أيضًا العيوب الكمية.
الإدخال المتعمد لـلقد أظهر تحويل العيوب عن طريق الوظائف التساهمية أنه يعزز خصائص الفلورية لأنابيب الكربون النانوية المفردة ويزيد من PLQ الخاصة بها.عند الكثافات المنخفضة،العيوب تؤدي إلى ظهور نطاقات انبعاث جديدة ومشرقة (عادة ما تُسمى بـالتي تكون حمراء-
انتقل من الحالة المثيرة الأصلية الانبعاث. إنها توفر إشارات فلورية إضافية عند أطوال موجية مختلفة ومع استجابات مختلفة للتغيرات في بيئة الأنابيب النانوية وللتحليلات. وبالتالي، فإنها تمكّن من أنظمة الكشف متعددة الأوضاع والنسبية. بالنسبة للأنواع التي يمكن فرزها وتنقيتها بسهولة من أنابيب الكربون النانوية المفردة (قطر 0.76 نانومتر)،يحدث الانبعاث عند و الـ انبعاث عندفي تشتت مائي. مؤخرًا جدًا مثل هذاتم استخدام العيوب بنجاح من قبل كيم وآخرين كأدوات فلورية للكشف عن سرطان المبيض، واستخدمها سبراينات وآخرون لاستشعار الدوبامين.. حاليًا، تعتمد معظم استراتيجيات الكشف على تفاعل معقد بين المحلل المستهدف والهجائن غير التساهمية من البوليمرات الحيوية-أنابيب الكربون النانوية (مثل أنابيب الكربون النانوية المغلفة بـ ssDNA) التي تحفز تغييرات في البيئة الكيميائية أو العازلة للأنبوب النانوي. ومع ذلك، غالبًا ما يعتمد آلية الاستشعار على تفاعلات ضعيفة جدًا وغالبًا ما تتطلب تحليلًا معقدًا يعتمد على عدد كبير من مجموعات البيانات. عادةً ما تتطلب مخططات الكشف الأكثر مباشرة تفاعلًا أكثر تحديدًا للمحلل مع الأنبوب النانوي. مع المجموعات الكيميائية والمجموعات الوظيفية المرتبطة بـيمكن تخصيص العيوب، فهي تتيح التصميم العقلاني لارتباطات المحللات المستهدفة وأنظمة نقل الإشارة. أحد الأمثلة الحديثة هو تطبيق الأنابيب النانوية الكربونية المفعلّة استجابةً لدرجة الحموضة.-مجموعات ثنائي إيثيل أمين. إنها تعزز الاستجابة البصرية للتغيرات الصغيرة في درجة حموضة الليزوزومات وتدل على فرط حموضة الإندوليزوزوم الناتج عن البلعمة الذاتية في الخلايا الحية من خلال تحول في طول موجة انبعاث العيب.. وبالتالي، فإن التصميم الدقيق لخطط الاستشعار باستخدام التفاعلات المتحكم بها بين المحللات وسطح أنابيب الكربون النانوية المفردة والمجموعات الوظيفية المرتبطة تساهم في الكشف البصري عن علامات حيوية مهمة كانت سابقًا بعيدة المنال. واحدة من هذه العلامات الحيوية هي البيروفوسفات غير العضوي.
ثنائي الفوسفات غير العضوييلعب دورًا حاسمًا في الأنظمة البيولوجية. إنه أحد المنتجات الثانوية الرئيسية للتفاعلات البيوكيميائية مثل تخليق الحمض النووي والحمض النووي الريبي وتحلل الأدينوزين ثلاثي الفوسفات (ATP) داخل الخلايا. ومن ثم، فإنه مرتبط ارتباطًا وثيقًا بعمليات تخزين الطاقة البيولوجية وأصبح علامة حيوية مهمة لقياس نشاط التيلوميراز لتشخيص السرطان. بالإضافة إلى ذلك، الفائضقد تعزز الأمراض المتعلقة بالعظام والمفاصل. مستويات عالية منتُلاحظ في السائل الزليلي للمرضى الذين يعانون من بلورات ثنائي هيدرات فوسفات الكالسيوم (CPPD) ، وتآكل العظام، وتكلس الغضاريف.. وبالتالي، الكشف عن وقياس مطلوب بشدة وقد كان تطوير المجسات المقابلة موضوعًا لبحث مكثف في السنوات الأخيرة.
تُستخدم المجسات الفلورية غالبًا للعلامات الحيوية نظرًا لاستجابتها السريعة وقراءة البيانات الكمية في الوقت الحقيقي، بالإضافة إلى إمكانية استخدامها في التصوير داخل الكائن الحي. المجسات الفلورية القابلة للذوبان في الماء لـعادةً ما تعتمد على اختبارات إزاحة المعادن، حيث يتم ربط جزيء المستقبل بمادة فلورية تتبدل بين حالة انبعاثية وحالة مظلمة بناءً على تفاعل تشكل مع أيونات المعادن القابلة للعكس (على سبيل المثال، ) من المستقبل . بينما يمكن أن تصل هذه الطريقة إلى حساسية تصل إلى مستوى النانومولار بالإضافة إلى انتقائية عالية في وجود فوسفات أخرى، فإن الضوء المنبعث عادة ما يكون مقصورًا على الطيف المرئي ( ) أو في أفضل الأحوال نافذة NIR-I في السنوات الأخيرة، ظهرت تقنية التصوير داخل الجسم في نطاق الأشعة تحت الحمراء القريبة II كطريقة تستفيد من تشتت الضوء المنخفض للغاية والاختراق الأعمق من خلال الأنسجة البيولوجية.تم تطوير مجموعة متنوعة من المجسات الفلورية NIR-II، بما في ذلك الأصباغ العضويةكتل نانوية من الذهبنقاط الكم وبلورات النانيد اللانثانيد. ومع ذلك، غالبًا ما تعاني من توافق حيوي محدود بسبب وجود المعادن الانتقالية السامة (على سبيل المثال، ) أو استقرار محدود بسبب تلاشي الضوء .
هنا، نقدم الكشف المباشر والكمي عنمع تخصيص-مفعلأنابيب الكربون النانوية المفردة كمجسات فلورية في نافذة NIR-II. مصنفةتُعطَّر الأنابيب النانوية الكربونية المفردة (SWNTs) بعيوب مضيئة تحمل مجموعة الألكاين وتظهر حساسية عالية تجاه وجودالأيونات، مما يؤدي إلى إخماد قوي لـ و الانبعاث. يتم عكس تأثير الإخماد عن طريق إضافة مواد تحليل معقدة للنحاس مثل التي يمكن مراقبتها كمياً بواسطة عدة مقاييس طيفية مختلفة. نسبة شدة العيب الناتج عنانبعاث إلى الـيمكن أن يمكّن الانبعاث القياس النسبي وبالتالي الكشف الأكثر موثوقية عن. بعد استكشاف التبريد PL وبالتالي آلية الكشف، نوضح أن أنابيب الكربون النانوية المفردة المستقرة بواسطة الفوسفوليبيد-بولي إيثيلين جلايكول والمتوافقة حيوياً معيمكن استخدام العيوب بشكل موثوقالقياس حتى في الوسائط البيولوجية المعقدة (مثل lysate الخلايا) وللكشف البصري السريع عنتم إصدارها أثناء تخليق الحمض النووي في تفاعل البوليميراز المتسلسل (PCR) كتطبيق محتمل.
النتائج
-تFunctionalization أنابيب الكربون النانوية المفردة وتصميم المجسات الفلورية
لإنشاء-أنابيب الكربون النانوية المفعلّة القابلة للكشف عنتم فرز الأنابيب النانوية الكربونية المفردة (SWNTs) عبر استخراج الطورين المائيين (ATPE) ونقلها إلى تشتت مائي مع السطح النشط كبريتات الصوديوم دوديسيل (SDS) كما تم الإبلاغ عنه سابقًا.. بعد ذلك، كانت الأنابيب النانوية -تمت عملية التFunctionalization من خلال إضافة كميات مناسبة من 4-إيثينيل بنزين دايزونيوم تترافلوروبورات وتخزينها لمدة 7 أيام تحت استبعاد الضوء لضمان التحلل الكامل لملح الدايسونيوم (انظر الطرق للتفاصيل). عرضت طيف PL للـ SWNTs (6,5) المFunctionalized تساهميًا مع وحدات 4-إيثينيل بنزين (المشار إليها باسم Dz-alkyne) انزياحًا نحو الأحمر.ميزة الانبعاث الناتجة عن العيوب ) حوالي 1135 نانومتر بالإضافة إلى الأصلية انبعاث عند 988 نانومتر (انظر الشكل 1). خليط بنسبة 1:1 من كبريتات النحاس (II) خماسية الماءوتم إضافة ثلاثي (3-هيدروكسي بروبيل – تريازوليل ميثيل) أمين (THPTA) إلى تشتت المواد الوظيفيةأنابيب نانوية أحادية الجزيء. وTHPTA تشكل تعريفًا جيدًا -معقد (من هنا فصاعدًا يُشار إليه بـ ) الذي يُستخدم بشكل متكرر في الكيمياء العضوية عند إضافةكلاهما و انخفضت الانبعاثات بشكل كبير وتحولت قمم الانبعاثات إلى الأحمر بمقدار 7 و 5 نانومتر، على التوالي (الشكل 1c). من المهم، أنتم تقليل الانبعاثات بشكل أقوى، مما أدى إلى انخفاض عام فينسبة شدة PL (انظر الشكل التوضيحي 1). تم ملاحظة تلاشي PL عند تركيزات منفوقوأصبحت أقوى مع زيادة التركيزات منحتى و وصلت PL إلى مستوى مستقر لـتركيزات. سلوك مشابه لـ تمت ملاحظة إخماد الفلورية للأنابيب النانوية بواسطة وولف وآخرين، ومع ذلك لم يتم الإبلاغ عن أي انزياح أحمر في موضع الذروة في تلك الدراسة.. للارتفاعتركيزات (على سبيل المثال، ) الـ انخفضت شدة الذروة بمقداربينماانخفضت شدة الذروة بمقدار. في التجارب اللاحقة، منتم استخدامه إذا لم يُذكر خلاف ذلك. بهذه الطريقة، يمكن ملاحظة تأثير قوي لتبريد PL مع الحفاظ علىتركيز منخفض قدر الإمكان.
لتحقيق في أصل عملية التثبيط، تم إضافة حمض الإيثيلينديامين تتراسيتيك (EDTA)، وهو ربيط قوي لخلائط المعادن، إلى تشتت SWNT. تم عكس التخفيف الناتج عن التحفيز الأولي لشدة PL وتحول موضع قمة PL على الفور، وتمت استعادة الخصائص البصرية للمواد الوظيفية.تم استرداد SWNTs (انظر الشكل التوضيحي 2). لذا، يمكننا أن نفترض أنالأيونات لا تؤدي إلى تغييرات دائمة ولكن إلى تغييرات قابلة للعكس في خصائص اللمعان لأنابيب الكربون النانوية المفردة (SWNTs) عندما تكون موجودة في بيئتها المباشرة. سيتم مناقشة آلية التثبيط بمزيد من التفصيل لاحقًا. من المهم أن هذه العملية القابلة للعكس هي الأساس لتطبيق-مفعلأنابيب الكربون النانوية المفردة كمجسات مضيئة للجزيئات ذات الصلة الحيوية والتي تشكل معقدات قوية مع النحاس مثلتم توضيح نظام الكشف المقابل في الشكل 1a. عند إضافة، يدخل مجس الفلورسنت SWNT في حالة إيقاف ويظهر انخفاضًا كبيرًا في شدة PL بالإضافة إلى انزياح أحمر في مواقع الذروة. مماثل للتأثير الملحوظ مع EDTA، فإن إضافةيؤدي إلى استعادة كاملة لخصائص الانبعاث الأولية ويعود المستشعر إلى حالته التشغيلية (انظر الشكل 1d).
الكشف الكمي عن
لاستكشاف خصائص الأنابيب النانوية الكربونية المفعلّة كمجسات مضيئة في الأشعة تحت الحمراء القريبة، تم الكشف الكمي عنتم اختباره.
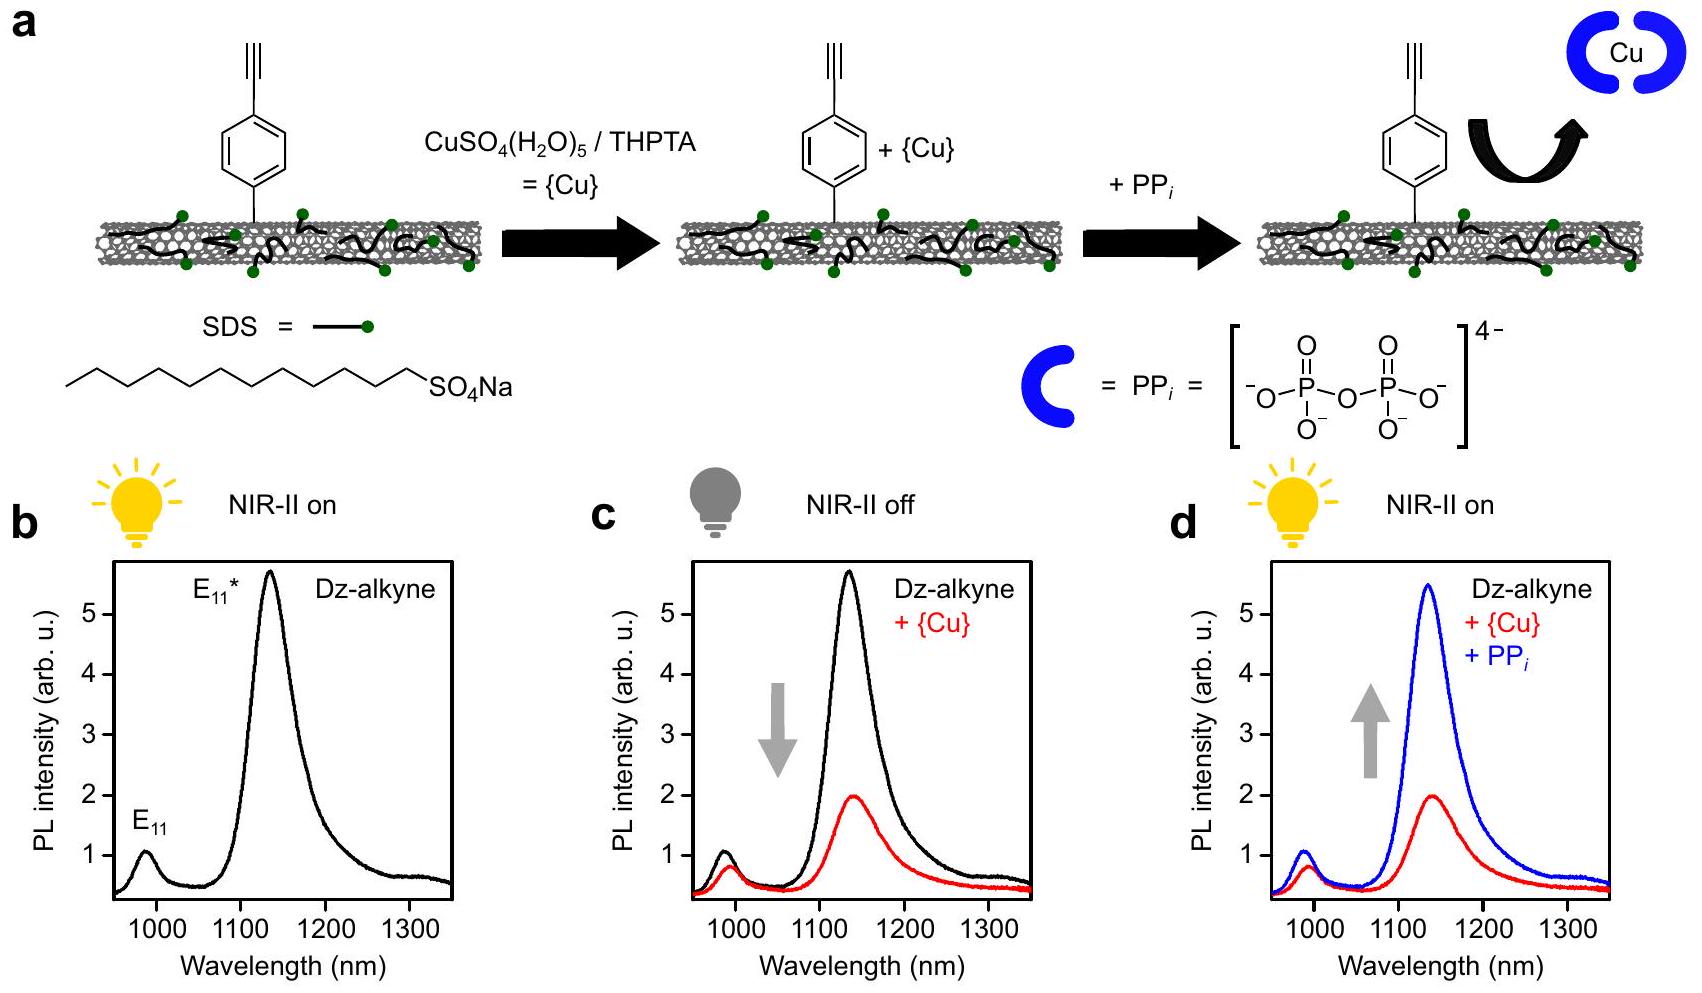
الشكل 1 | استراتيجية التصميم للكشف عنمع-مُفَعَّلأنابيب الكربون النانوية المفردة (SWNTs). تظهر أنابيب SWNTs المفعلة بالديزايلكين والموزعة مع SDS (المجموعات الأيونية موضحة باللون الأخضر) حساسية عالية تجاه وجودمجمع THPTA ); تقوية قوية للتبريد والمستحثة بالعيوبيحدث الانبعاث. يتم عكس هذا التأثير عند الإضافة من (نصف دائرة زرقاء). طيف PL لـ Dz-alkyne.طيف الانبعاث الضوئي قبل (أسود) وبعد إضافة {Cu} (أحمر). طيف الانبعاث الضوئي قبل (أحمر) وبعد إضافة (الأزرق). المصباح الأصفر يشير إلى السطوعالإصدار في الخطوة المقابلة في مخطط الكشف. يتم توفير بيانات المصدر كملف بيانات المصدر. منتمت إضافتها إلى تشتت من 4-إيثينيل بنزين مُفَعَّلتم تسجيل طيف SWNTs و PL بعد ضبط تركيزات مختلفة من و 15 دقيقة من وقت الحضانة (الشكل 2أ-ج). منحنى المعايرة لتقدير في المحلول المائي تم الحصول عليه كـ و انبعاثات تعافت تدريجياً لـتركيزات بين (انظر الشكل 2d). لتركزات أعلى من ، الـ و انخفضت الانبعاثات مرة أخرى. نفترض أن الانخفاض في شدة PL عند تركيزات أعلى منيحدث بسبب تجمع الأنابيب النانوية الكربونية المفردة كما لوحظ أيضًا عندما لاكان موجودًا (انظر الشكل التكميلي 3 والملاحظة التكميلية 1). هذا لا يؤثر على استخدام هذا المستشعر لأن هذه التركيزات أعلى بكثير من تلك الموجودة في الأنظمة البيولوجية النموذجية. من المهم، أننسبة شدة الذروة زادت أيضًا مع الزيادةتركيزات وظلت مستقرة حتى عند التركيزات العالية (انظر الشكل 2ب، هـ). وبالتالي، فإن نسبة شدة الذروة هي مقياس كشف أكثر موثوقية حيث أنها أقل تأثراً بتأثيرات التجميع. بالإضافة إلى نسبة شدة الذروة، تمثل نسبة منطقة PL أيضًا مقياسًا مناسبًا وتظهر اتجاهات متطابقة تقريبًا (انظر الشكل التكميلية 4أ). الـانبعاث العيوب من أنابيب الكربون النانوية المفعلّة وحساسيتها المختلفة لبيئتها تمكّن الكشف النسبي، الذي يكون عمومًا أكثر تكرارية وانتقائية من قياسات الشدة المطلقة.
أخيرًا، اختبرنا ملاءمة الـ (انظر الشكل 2ج، و) و (الشكل التوضيحي 4ب، ج) مواقع القمم كمعايير كمية. مرة أخرى، الانزياح الأحمر الناتج عند إضافة { Cuتقلصت باستمرار وارتبطت مباشرة بتركيز المضاف. جميع هذه المقاييس أظهرت ارتباطًا جيدًا مع تركيز لنطاق كشف واسع من، مما يؤكد قدرتهم على قياس تركيز الـفي الوسائط المائية مع Dz-alkyne المفعلةأنابيب الكربون النانوية المفردة كمجسات فلورية في نطاق الأشعة تحت الحمراء II.
انتقائية-مجسات SWNT المفعلة
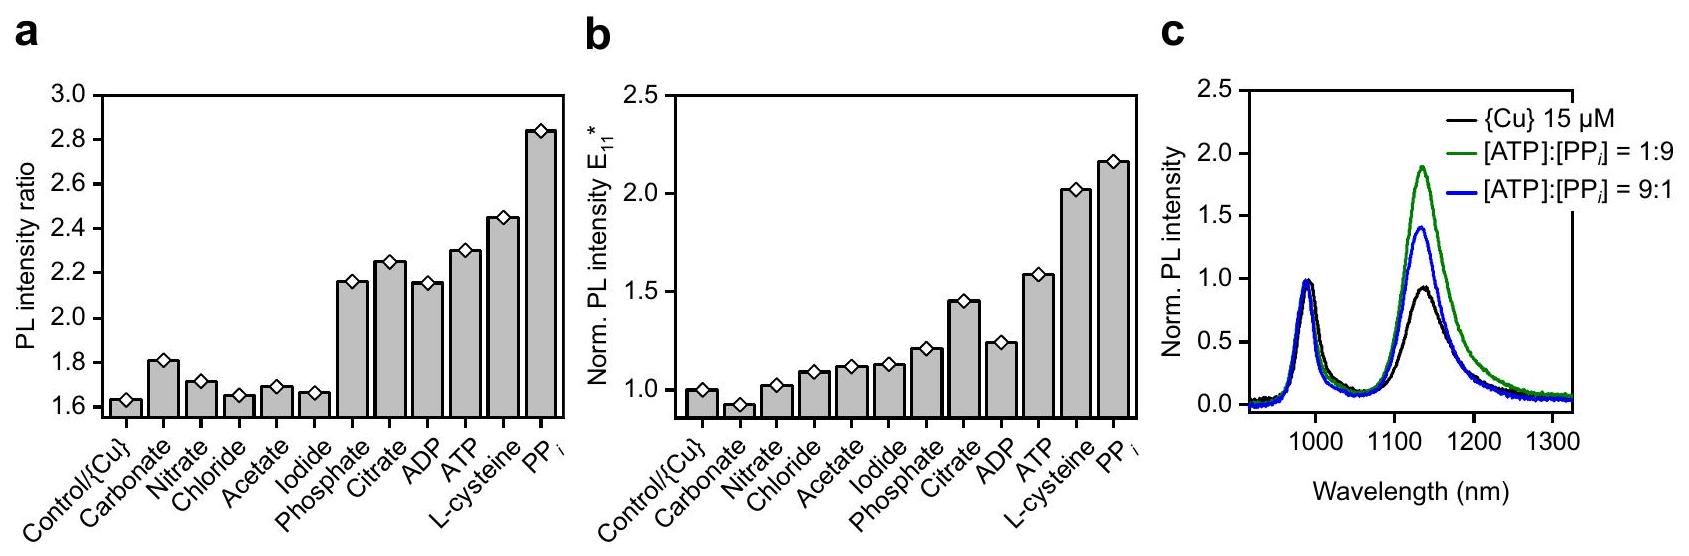
نظرًا للتكوين المعقد للبيئات البيولوجية، فإن الانتقائية العالية مهمة لأي مستشعر بالإضافة إلى الحساسية. لاستكشاف انتقائية المواد الوظيفيةأنابيب الكربون النانوية المفردة كمجسات مضيئة لـتم إخمادهم بواسطةمن وتم تسجيل طيف الانبعاث الضوئي بعد إضافة 1 مللي مول من المواد المتداخلة المحتملة. لاحظ أن تركيزات الجزيئات والأنيونات المختبرة عادة ما تكون أقل بكثير في الأنظمة ذات الصلة بيولوجياً. الشكل يظهر نسب شدة PL المستخرجة والمُعَيارَةالكثافات بعد الإضافة لـأسيتات ()، ، سترات، ADP، ATP، أوبالإضافة إلى L-cysteine. يتم عرض جميع طيف PL العادي والمطلق بما في ذلك مواقع القمم المستخرجة وعمق الفخ البصري في المعلومات التكميلية (الشكل التكميلية 5 والجدول التكميلية 1).
يمكن تصنيف الأنيونات المختبرة بشكل عام إلى جزيئات صغيرة معقدة للنحاس ضعيفة ومعقدة للنحاس قوية. بالنسبة لجميع المواد التحليلية، التي تتمتع بتنسيق ضعيف مع من المتوقع أن تكون الأيونات ، )، تغييرات طفيفة فقط في نسبة شدة PL و تمت ملاحظة شدة. وعلى النقيض من ذلك، فإن الجزيئات المعروفة بالتنسيق القوي مع أيونات ( سترات، ADP، ATP،، L-cysteine) أظهر زيادة ملحوظة في نسبة شدة PL. كانت هذه الاتجاهات صحيحة أيضًا للتغيرات فيالشدة، على الرغم من أنها أقل وضوحًا بكثير. في جميع الحالات، كانت استجابات نسبة شدة PL وكانت الشدة لا تزال الأقوى لـ. وبالتالي، قد لا يكون من الممكن الكشف عن تركيزات منخفضة من مع انتقائية عالية في وجود الآخرين-المحللات المعقدة، يجب أن يكون من الممكن الكشف عن التغيرات الديناميكية في مستويات التركيز ذات الصلة لـ.
تركيزات و ATP مرتبطان ارتباطًا وثيقًا في الخلايا الحية لأن هو منتج جانبي من تحلل ATP. للتحقيق في إمكانية تتبع تفاعل التحلل هذا، أضفنا
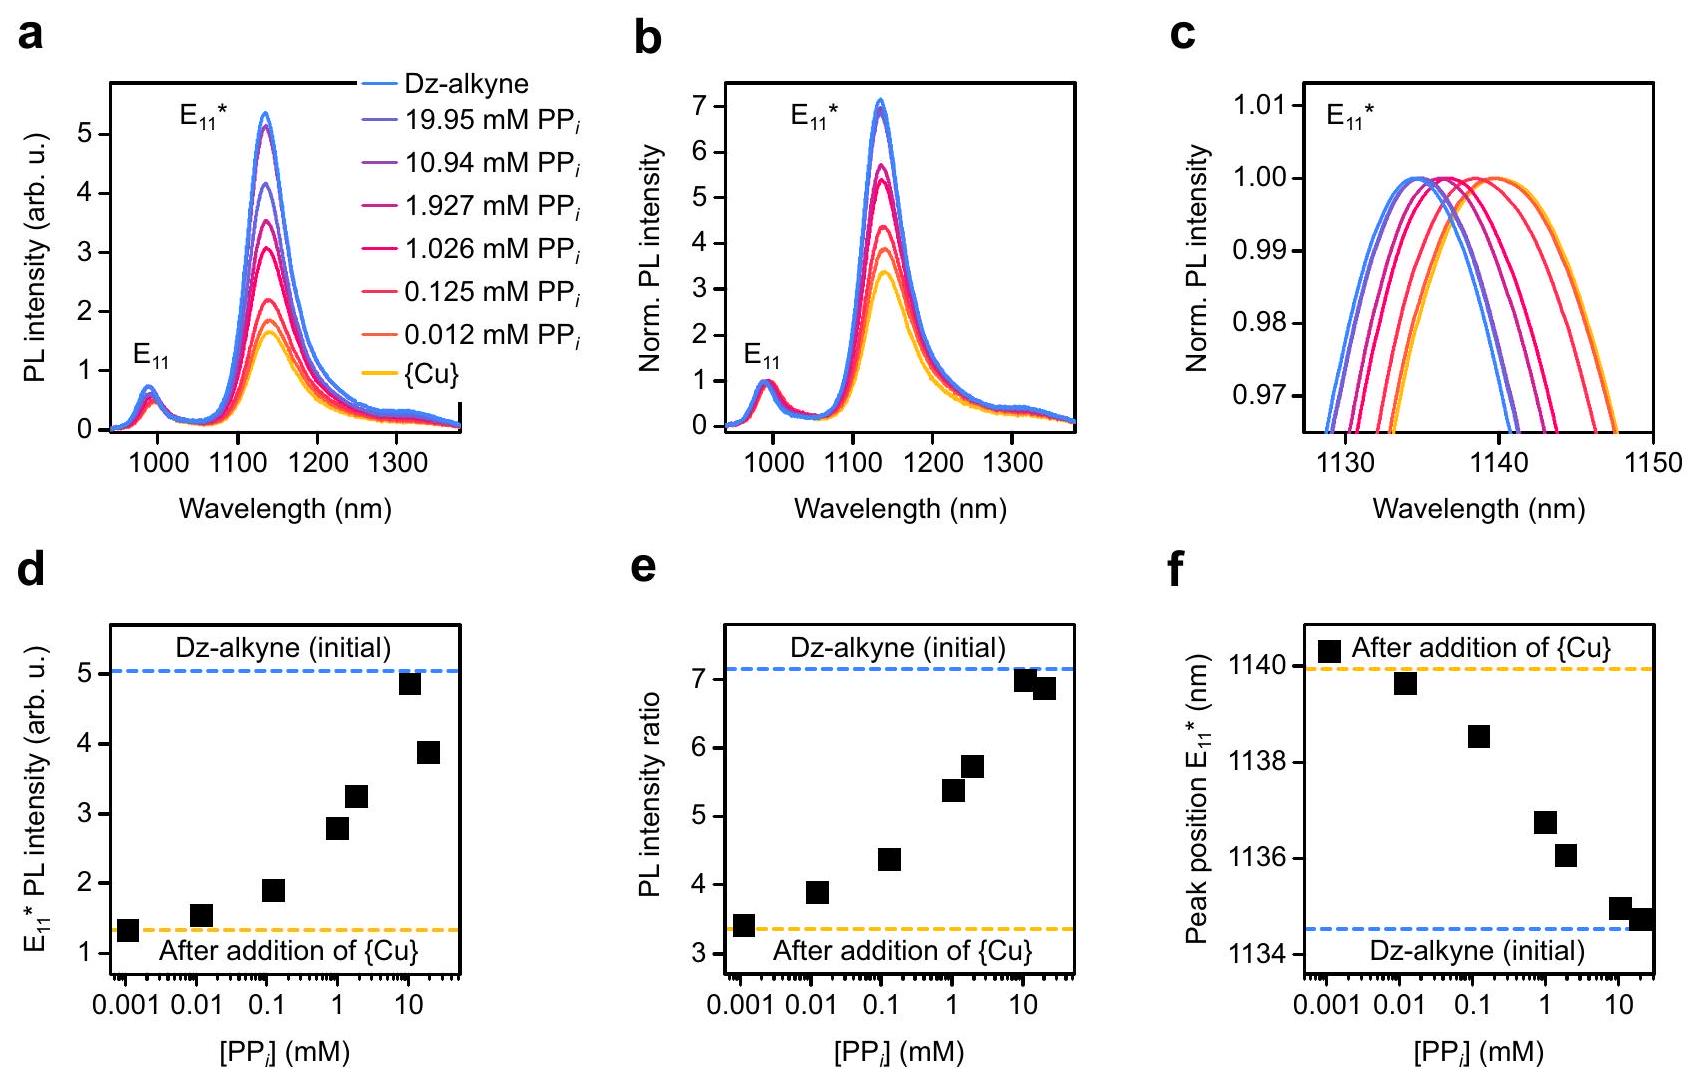
الشكل 2 | الكشف عنمع-مفعلأنابيب الكربون النانوية المفردة. أ، ب طيف الانبعاث الضوئي المطلق (أ) وطيف الانبعاث الضوئي المعياري إلى من Dz-alkyne (الأزرق) وحده وبعد إضافة ، الأصفر) وتركيزات مختلفة من . زوم إن على المعاييرالموقع الذروي.شدة PL ( ) ، نسبة شدة PL (هـ) وموضع الذروة (ف) مقابل تركيزتشير الخطوط المنقطة الزرقاء والصفراء إلى شدة PL الأولية، ونسبة شدة PL، وموقع الذروة لـ Dz-alkyne قبل وبعد إضافة {Cu}. يتم توفير بيانات المصدر كملف بيانات مصدر. خليط من ATP ومع تركيز إجمالي ثابت إلى تشتت مُفعلأنابيب الكربون النانوية المفردة التي تم إخمادها سابقًا بـتظهر الشكل 3c طيف PL المسجل قبل وبعد إضافة نوعين مختلفين من ATP:خليط و بتركيز إجمالي قدره 1 مللي مول. بينما كل من ATP ومن المتوقع أن تؤدي إلى استجابة من مستشعر SWNT، تركيز كبير منأسفر عن زيادة كبيرة فينسبة شدة PL أكبر من تركيز ATP العالي. وهذا يدل على وجود انتقائية، ومع ذلك، في العينات المختلطة يمكن قياس التركيز العام فقط للجزيئات المماثلة. تم ملاحظة نتائج مماثلة للقياسات مع تركيزات إجمالية للمحللات تبلغ 0.5 مللي مول و4.0 مللي مول (انظر الشكل التكميلية 6). علاوة على ذلك،تم إزاحة ذروة الموقع بمقدار 2 نانومتر لتركزات نسبية أعلى منلاحظ أن هذا التحول هو عكس الاتجاه المتوقع لزيادة الانزياح الأزرق لـموضع الذروة لنسب كثافة PL أعلى. نفترض أن التغيرات فيتكون مواقع القمم فريدة لكل مادة تحليلية وقد تقدم معلمات إضافية للتعرف.
باختصار،-مفعليمكن استخدام أنابيب الكربون النانوية المفردة ككواشف فلورية للكشف عن نسب الخلط لـ ATP و. وبالتالي، يمكن متابعة تحلل ATP في الوقت الحقيقي من خلال ملاحظة التغيرات في نسب شدة PL بالإضافة إلى التحولات في موضع الذروة. ومع ذلك، لتطوير مجسات فلورية أكثر انتقائية، من الضروري فهم سبب تلاشي PL واستعادته وأصل الانتقائية الجزئية لـ-مفعلأنابيب الكربون النانوية المفردة نحو.
آلية التبريد والاستشعار PL
لقد أظهرنا إخماد PL لـ-مُفَعَّلأنابيب الكربون النانوية المفردة بواسطةوالنتيجةقدرات الكشف. ومع ذلك، لم نناقش بعد دور الليغاند THPTA أو الجزء المرفق 4-إيثينيل بنزين في الاستشعار. يمكن توقع أن يكون لـ THPTA أثر كبير علىالكشف حيث أنه يشكل أيضًا معقدات معالأيونات. لا يؤثر الليجاند نفسه على انبعاث المركبات الوظيفيةأنابيب الكربون النانوية المفردة حتى عند تركيزات عالية، انظر الشكل التوضيحي التكميلي 7). وبالتالي، يمكن أن تُعزى جميع تغييرات PL (بشكل رئيسي التخميد) إلى الأيونات. ومع ذلك، عندما تتم إضافة الأيونات مباشرة إلى أنابيب الكربون النانوية المفعلّة كحلّ لـبدون THPTA، لوحظ فقط تراجع معتدل في PL (انظر الشكل 4a). يحدث تراجع أقوى بكثير عندما يكون THPTA موجودًا أيضًا. يمكن تفسير هذا التعزيز بتركيز فعال أعلى منالأيونات القريبة من سطح SWNT عند تعقيدها بواسطة THPTA. يلتصق الترايازول THPTA بقوة بالجراثين وSWNTs عبرالتفاعلاتامتصاص قوي لـ /مجموعة THPTA (أي، ) إلى سطح SWNT يجلب الأيونات في اتصال أقرب وأكثر مباشرة مع الأنابيب النانوية الكربونية.
الاتصال المباشر بـالأيونات مع شبكة SWNT أو موقع العيب تؤدي أيضًا إلى انزياحات حمراء لـ و الانبعاث. نفترض أن هذه التحولات في الطول الموجي ناتجة عن زيادة في قطبية المذيب بالقرب من سطح SWNT أو تغييرات محلية في ترطيب SWNT بسبب الغلاف المائي الإضافي حول المادة الممتصة.الأيونات. تم وصف تحولات السولفاتوكروميك المماثلة لـ SWNTs بواسطة لارسون وآخرون وشيراك وآخرون لـ SWNTs المفعلة..
بشكل عام، يمكن ملاحظة تقليل أقوى للإضاءة و shifts لمواقع ذروة الانبعاث للعينات التي تحتوي على THPTA مقارنة بالعينات التي لا تحتوي عليه. عندمايتم إضافته، الـ /THPTA يتفكك مع تكوين مركب أكثر استقرارًايتشكل المركب. التنافس المعقد في الأيونات بواسطة THPTA و يمكن مراقبته بواسطة مطيافية الامتصاص بسبب التغير القوي في امتصاص THPTA عند التكوين/فك التكوين، ومقارنته بالتغيرات فينسبة شدة مجس SWNT (انظر الشكل التوضيحي 8 والملاحظة التكميلية 2). التفكك
الشكل 3 | استجابة المستشعر في وجود مواد تحليلية أخرى معقدة للنحاس.استجابة لـنسبة شدة PL (أ) وموحدةشدة (ب) دزالكني معمعقد في وجود مجموعة متنوعة من المحللات التي تشكل معقدات نحاسية ضعيفة أو قوية (تركيز 1 مللي مول، قياسات فردية، ). لاحظ أن
تركيزات المواد المتداخلة أعلى بكثير مما يتوقع المرء في التحليلات التحليلية الواقعية.طيف PL بعد إضافة نسب مختلفة من ATP ومع تركيز إجمالي للمحلول 1 مللي مول. يتم توفير بيانات المصدر كملف بيانات مصدر.
الشكل 4 | دراسة آلية التبريد. أ طيف PL لـ Dz-alkyne قبل وبعد إضافة أو THPTA. ب طيف PL المعياري قبل وبعد إضافة لتركيزات مختلفة من THPTAبتركيز ثابت من ( ) المقابلة لنسب 1:1 و 1:2 و 1:5. ج طيف PL المنظم لـ 4-إيثينيل بنزين وبنزين مُفعل.أنابيب الكربون النانوية بعد الإضافة لـرسم بياني لتوزيع الزمن في TCSPC لزوال PL بعد إضافة تركيزات مختلفة منمتوسط العمر المستخرج (Amp-avg.) للأمبليتود انبعاث من التناسب الثنائي الأسي مقابل تركيزالقيم الأولية قبل وبعد الإضافةمشار إليها بخطوط منقطة زرقاء وصفراء، على التوالي.عرض تخطيطي لآلية الامتزاز والإخماد المقترحة.الأيونات محصورة بسبب القوة الشديدةتفاعلات ligand الترايازول (L = THPTA) مع جدار SWNT، والتي يتم تسهيلها بشكل أكبر من خلال التنسيق الضعيف مع مجموعات الإيثينيل. بعد تشكيل الإثيون وانتشاره إلى مواقع العيوب،تُخمد الإثيونات بواسطة نقل الإلكترون السريع (السهم الأحمر) إلى المركز المعدني. ثابت لـمعقد THPTA على سطح SWNT أعلى بمقدار 25 مرة من المعقد الحر، مما يشير إلى أنتضعف تشكيلات المعقد بسبب الحماية الستيرية لـالمركز عن طريق الامتزاز على سطح SWNT.
استنادًا إلى هذا المفهوم، يمكن تفسير انتقائية مجسات SWNT الفلورية تجاه مختلف المحللات (انظر أعلاه) من خلال التنافس في التكوين المعقد لـ الأيونات بواسطة THPTA والمحلل. عند تكوين المعقد من الأيونات بواسطة مادة التحليل، يتم إزالتها من البيئة المباشرة لـ SWNT والعيب. وبالتالي، يتم استعادة PL الأصلية. عندماعندما يتم إجراء الاستشعار عند تركيزات أعلى من THPTA، تكون الاستجابة أقل بشكل ملحوظ حيث يتم تحويل توازن التعقيد نحوتكوين معقد /THPTA (انظر الشكل 4ب). وبالتالي، يجب أن تكون الحساسية والانتقائية قابلة للتعديل من خلال اختيار وتركيز الليغاند، مما يخلق آفاقًا لتخصيص مجسات الفلورسنت SWNT بانتقائية أعلى تجاه مواد تحليل محددة. يجب أن تركز الأعمال المستقبلية على تصميم أنظمة الليغاند التي تظهر امتصاصًا فيزيائيًا قويًا على سطح SWNT وقوة تعقيد مناسبة معمقارنةً بـ، على سبيل المثال،. الـمعقد التريازول هو نقطة انطلاق جيدة حيث يظهر امتصاصًا قويًا، وانتقائية جيدة تجاه الفوسفات، وقد تم استخدامه سابقًا لتصميم حساسات جزيئية..
كما أن الامتزاز لـالأيونات على سطح SWNT تلعب بوضوح دورًا رئيسيًا في عملية إخماد PL،قد تكون الأنابيب النانوية الكربونية المفردة أيضًامُفَعَّلَة بمجموعات أخرى مثل مجموعات البنزين البسيطة بدلاً من 4-إيثينيل بنزين. ومع ذلك، وُجد أن ت quenching PL كان أقوى بشكل ملحوظ بالنسبة لـ SWNTs المُفَعَّلَة بـ 4-إيثينيل بنزين عند تركيزات أقل من (انظر الشكل 4c والشكل التكميلي 9). من المحتمل أن التنسيق الضعيف الإضافي لأيونات النحاس مع مجموعات الألكاين يعزز تفاعلها مع SWNT. هذه الفكرة مدعومة بالسلوك الملحوظ للتقليل من الإضاءة لـ الانبعاث، الذي يكون مشابهًا لأنابيب الكربون النانوية المفردة النقية والمفعلّة بالبنزين، ولكنه معزز لأنابيب الكربون النانوية المفردة المفعلّة بـ 4-إيثينيل بنزين (انظر الشكل التكميلي 10 والملاحظة التكملية 3). هذه الاعتمادية على التفعيل تبرز أنه بينما يمكن نقل نظام الكشف المقدم إلى تكون تأثيرات الأنابيب النانوية الكربونية ذات الجدران المفردة (SWNTs) مع مجموعات وظيفية مختلفة أقوى مع مجموعة الإيثينيل. ومع ذلك، يمكن تغيير نوع مجموعة الألكاين. على سبيل المثال، يمكن أن تكون وظيفةتؤدي SWNT مع 2-إيثينيل بنزين إلى ظهور نطاق انبعاث عيب آخر متحرك نحو الأحمر يقع حول 1242 نانومتر كما أظهره يو وآخرون سابقًا.أنابيب النانو التي تم تعديلها بهذه الطريقة أظهرت أيضًا و استجابة ولكن مع انبعاث حتى أبعد في NIRII (انظر الشكل التكميلي 11 والجدول التكميلي 2).
امتصاصعلى سطح SWNT يتسبب بوضوح في إخماد PL، والذي يتم استعادته عند إضافة المواد التحليلية التي تشكل معقدات مستقرة معومع ذلك، فإن السبب الأساسي للتبريد الأولي لا يزال سؤالاً مفتوحاً. طيف الامتصاص للأشعة فوق البنفسجية والمرئية والأشعة تحت الحمراء القريبة للمواد الوظيفيةتظهر أنابيب الكربون النانوية المفردة المسجلة قبل وبعد إضافة {Cu} فقط انزياحًا أحمر بمقدار 5 نانومتر.الانتقال (انظر الشكل التكميلي 12) وعدم التبييض. بينما قد يؤدي تجميع أو ربط أنابيب الكربون النانوية المفردة إلى تحول مشابه، يمكننا استبعاد هذا التفسير بسبب القابلية الكاملة لعكس عملية التثبيط.
للتحقيق في إمكانية تشكيل أنابيب الكربون النانوية المفردة غير المنبعثةالمجمعات في الحالة الأرضية، تدهور PL لـتم تسجيل حالة العيب بواسطة عدّ الفوتونات الفردية المرتبطة زمنياً (TCSPC) بعد إضافةوعند تركيزات مختلفة من (انظر الشكل 4د). لاحظ أن السرعة لم يمكن حل تدهور PL (انظر وظيفة استجابة الجهاز، IRF) ولن يتم النظر فيه هنا.عادةً ما يظهر انبعاث حالة العيب تدهورًا ثنائي الأسية. يمكن حساب متوسط مكونات العمر القصير والطويل وفقًا لأوزان سعاتها الطبيعية.. تم الحصول على متوسط عمر السعة (.) اعتمادًا على ما تم إضافتهتبعهايمكن استخدامه للتمييز بين التبريد الناتج عن مسارات التحلل غير الإشعاعي الإضافية أو التبريد في الحالة الأساسية.
عند إضافةالمتوسط المعتمد على السعةتقلل فترة الحياة من 151 إلى 79 بيكوثانية بعامل 1.9، وهو ما يتوافق بشكل جيد مع الانخفاض بمقدار 2.3 مرة في التكاملنسبة الشدة (انظر الجدول 1). تظل هذه العلاقة بين العمر الافتراضي وعامل الإخماد صحيحة عند إضافةوالأوليةتم استعادة عمر الخدمة لتركيزات عالية من (انظر الشكل 4e؛ لمجموعة البيانات الكاملة انظر الشكل التكميلي 13 والجدول التكميلي 3). ومن ثم، فإن تقليل الـيجب أن يكون الانبعاث ناتجًا بشكل رئيسي عن مسارات التحلل غير الإشعاعي الإضافية وليس مرتبطًا بتكوين مركب حالة أرضية غير مشعة، والذي لن يؤثر على الانبعاث الضوئي.
الجدول 1 | عمر PL المستخرج وعوامل التثبيط
عينة
QF( )
نسبة المساحة
QF
ديزاين
151
–
3.47
–
79
1.91
1.54
٢.٢٥
١٢٥
1.21
٢.٤٨
1.40
145
1.04
٣.٢٧
1.06
مستخرج و * نسب مساحة PL مع عوامل التبريد المقابلة (QF). لمجموعة البيانات الكاملة، انظر الجدول التكميلي 3. عمر الحياة. العلاقة القوية بينعمرقد يمكّن التركيز حتى من تنفيذ الوظائف المخصصةأنابيب الكربون النانوية المفردة كأدوات لتصوير الفلورية بتقنية الحياة الضوئية من الجيل التالي في الأشعة تحت الحمراء القريبة.
إخماد الفلوروفرات بواسطة يُنسب تأثير الأيونات في الغالب إما إلى خصائصها البارامغناطيسية أو إلى نقل الإلكترونات السريع إلى المركز المعدني. من غير المحتمل أن تسبب التأثيرات البارامغناطيسية التخفيف الملحوظ، حيث لم يتم العثور على أي ارتباط مع العزم المغناطيسي لتخفيف PL مع أيونات بارامغناطيسية أخرى مثل و (انظر الشكل التوضيحي التكميلي 14). هذه الغياب للتأثيرات البارامغناطيسية يتماشى مع الدراسات السابقة التي أجراها بريج وآخرون.وبالتالي، نقترح أن النقل السريع للإلكترونات المحفز بالضوء (PET) هو السبب الرئيسي لتقليل الإضاءة المرصود. تدعم هذه النسبة الطاقة الحرة المقدرة لجيبس للنقل الإلكتروني في هذا النظام، مما يؤكد أن نقل الإلكترونات هو أمر مواتٍ من الناحية الديناميكية الحرارية (انظر الملاحظة التكميلية 4)..
تقدم الشكل 4 ف نظرة عامة على المقترحآلية الامتزاز وتثبيط PL. تأثير التثبيط الأقوى لـأيونات علىيمكن تبرير الانبعاث من خلال تنسيقإلى مجموعات الإيثينيل القريبة من العيوب وعمر الإثارة المحلي للعيوب الأطول وبالتالي احتمال أكبر لعملية نقل الطاقة مقارنة بـ الإكسايتونات ذات أعمار حياة فقط في البيكوسكند. دراسات إضافية حول تأثير كثافة العيوب في الأنابيب النانوية الكربونية الوظيفية على الحساسية تجاه {Cu} وكشف أن عامل التبريد لـنسبة الشدة تتأثر بشكل كبير بـكثافة العيوب، أعلى حساسية لـيتم الحصول على الكشف عند كثافات عيوب منخفضة (انظر الشكل التكميلي 15 والملاحظة التكملية 5 لمزيد من المناقشة). هذه الرؤى حول التثبيط الأساسي للإشعاع الضوئيأيونات وآلية الاستشعار بواسطةيمكن استخدام الأنابيب النانوية الكربونية المفعلّة لتحسين أنظمة الكشف عن مواد معينة من خلال مجسات فلورية تعتمد على استبدال المعادن.
كشف عنفي البيئات البيولوجية
تم إجراء جميع التجارب السابقة باستخدام SDS الموزعأنابيب الكربون النانوية المفردة، التي ليست متوافقة حيوياً بسبب الحاجة إلى فائض من المواد السطحية. لتحقيق التوافق الحيوي وتمكينالكشف في البيئات البيولوجية، مادة السطح النشطة SDS المخصصةتم استبدال SWNTs بالفوسفوليبيد-بولي إيثيلين جلايكول (PL ) كما تم الإبلاغ عنه سابقًا من قبل ويلشر وآخرون. (للتفاصيل انظر الطرق). تم تأكيد نجاح تبادل السطح النشط بواسطة طيف الامتصاص وطيف PL. بما يتماشى مع التقارير السابقةانزياح أحمر بمقدار 6 نانومتر منتمت ملاحظة الانتقال بينما ظلت جميع الميزات الطيفية الأخرى كما هي (انظر الشكل التكميلي 16). مرة أخرى،تمت إضافته إلى-مغطى و-مُفَعَّلأنابيب الكربون النانوية المفردة. بعد 15 دقيقة من الحضانة، تم تصفية المشتت باستخدام الطرد المركزي (حد القطع من ) وإعادة توزيعها في محلول مائي من MOPS خالي من EDTA بتركيز 10 مللي مول. الفائض تمت إزالته بواسطة خطوة الترشيح بينما كان مرتبطًا فيزيائيًاكان من المتوقع أن يبقى على سطح SWNT. بعد التخفيف إلى تركيز يتوافق مع امتصاص قدره 0.1 عندتم تسجيل طيف الانبعاث الضوئي (طول المسار 1 سم) كما هو موضح في الشكل 5a و 5b. تم تقليل التثبيط الكلي للانبعاث الضوئي مقارنةً بأنابيب الكربون النانوية المفككة بواسطة SDS. قد يُعزى هذا التغيير إلى التغطية المختلفة لجوانب أنابيب الكربون النانوية بواسطة PL-PEG. مقارنةً بـ SDS. البوليمر PL-PEG كان يُقدَّر سابقًا أنه يغطي SWNT
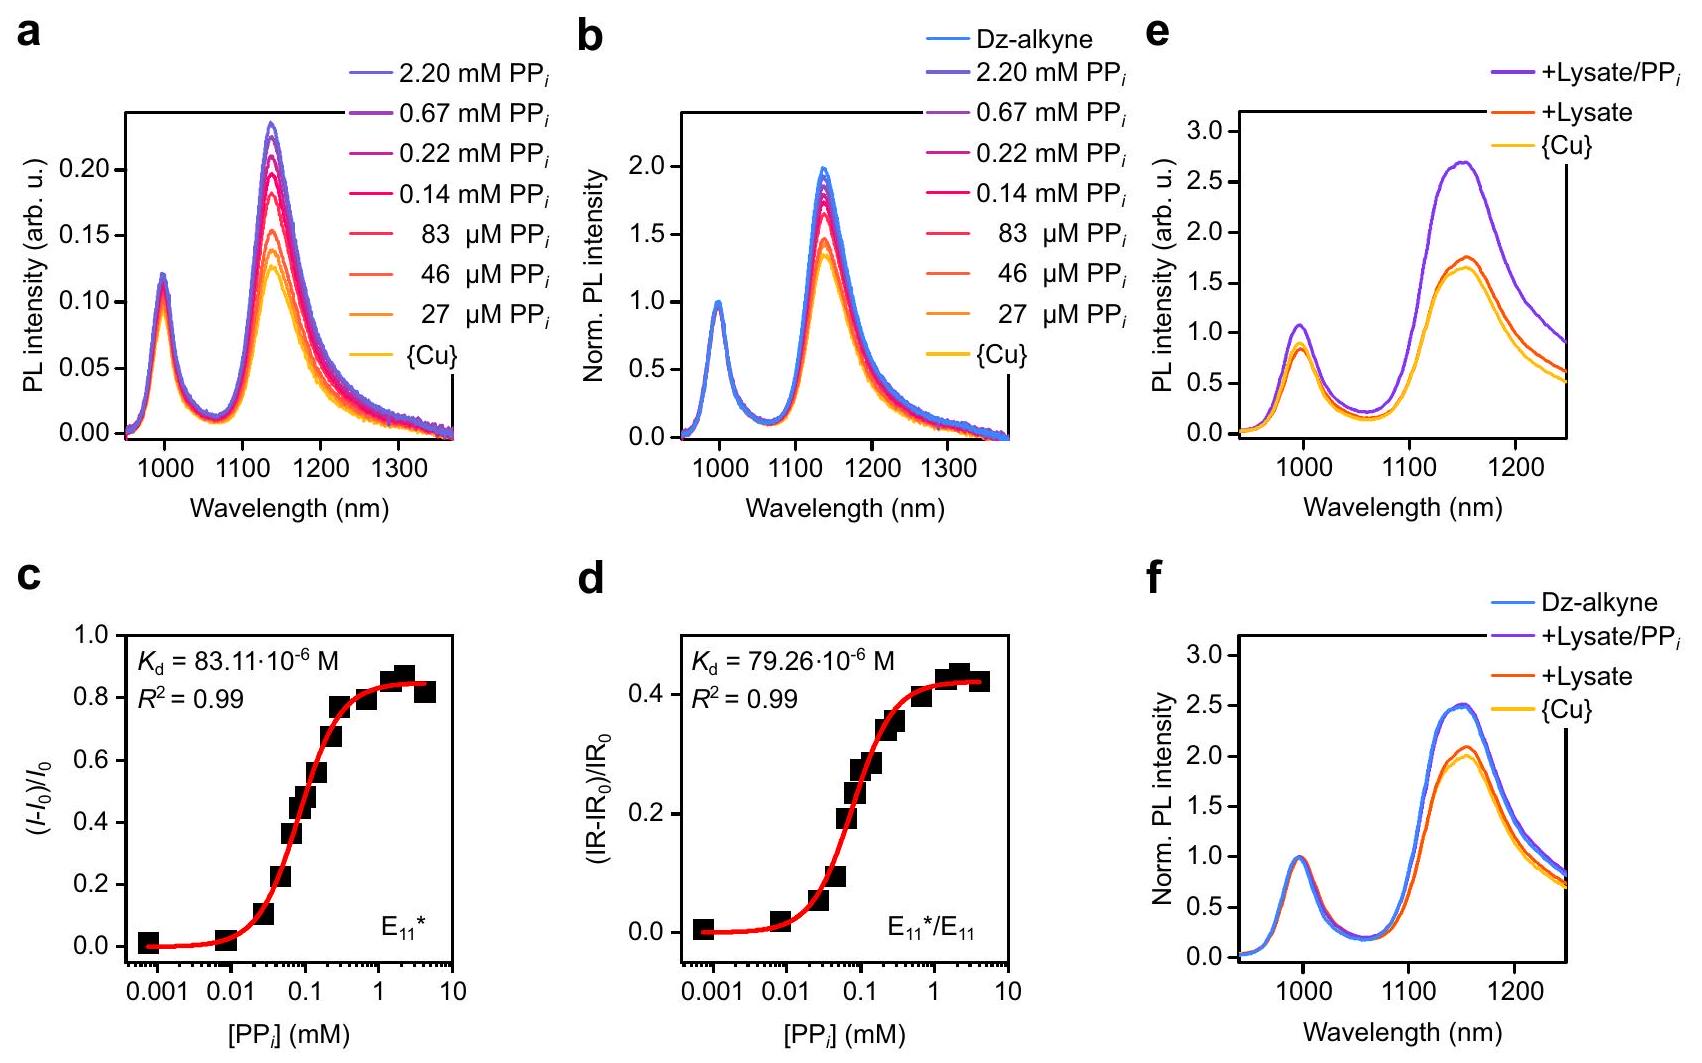
الشكل 5 | الكشف عنفي عازل بيولوجي خالٍ من السطحيات. أ،طيف PL المطلق (أ) والمطبع (ب) لأسطوانات الكربون النانوية المفعلة بالديزاين-ألكاين الموزعة في PLPEGو 10 مللي مولار من محلول مفسد MOPS بعد الإضافة لـ وتركيزات مختلفة من . تغيرات تعتمد على التركيز لـشدة معكـشدة وكـالشدة بعد الإضافة لـبما في ذلك ملاءمة دالة هيل للبيانات (الخط الأحمر). بي بي تغيرات تعتمد على التركيز فينسبة الشدة مع الأشعة تحت الحمراء كـنسبة الشدة و IRكوننسبة الشدة بعد الإضافةبما في ذلك ملاءمة دالة هيل للبيانات (الخط الأحمر). معامل التحديد ( ) و قيم الملاءمات موضحة في الجداول المعنية
المخططات. (e) و (f) طيف PL المطلق (e) والمعدل (f) قبل وبعد إضافة وإضافة مستخلص الخلايا، الذي تم إضافته لاحقًا بـتم تسجيل طيف PL في (e) و (f) عند تركيزات أقل من SWNT مما أدى إلى زيادة الحساسية عند إضافةتختلف مقاييس الطول الموجي بسبب استخدام مطياف مختلف وشبكة حيود (انظر الطرق). بالإضافة إلى ذلك، فإن توسيع القمة الإضافي لـقد تنشأ الانبعاثات من التFunctionalization عند تركيز أعلى من أملاح الديازونيوم، مما يؤدي إلى إنتاج نطاقات انبعاث متحولة نحو الأحمر بشكل أكبر.تُقدم بيانات المصدر كملف بيانات مصدر. تغطي السطح بشكل أكثر اكتمالاً من جزيئات SDS القصيرة، مما ينبغي أن يقلل من التفاعل مع وبالتالي التخميد بواسطة الممتصاتيمكن ملاحظة تأثير مشابه للمواد المغلفة بـ DOC والمفعلّة.أنابيب الكربون النانوية المفردة، التي لا يحدث فيها تقريبًا أي ت quenching للضوء بعد الإضافةالأيونات، على الأرجح بسبب التعبئة الكثيفة لمادة DOC على السطح (انظر الشكل التوضيحي 17).
بينما كانت الاستجابة تجاهتم تقليل الأيونات بواسطة PL-PEG، ظل المستشعر يعمل بكامل طاقته وأظهر حساسية جيدة تجاه وجود. علاوة على ذلك، الـ PL-PEGأظهرت أنابيب الكربون النانوية المفردة الموزعة عدم وجود تأثيرات تكتل حتى عند تركيزات عالية من (انظر الشكل التكميلي 18). الشكل 5c و d يعرض استجابة PL المعتمدة على التركيز لـنسب الانبعاث وشدة PL المقابلة التي تم ملاءمتها مع دالة هيل :
أين هو تركيز هو ثابت التفكك و معامل هيل (للاستجابة لـانبعاث، نسب منطقة PL ومواقع الذروة انظر الشكل التكميلي 19).
لتأكيد قابلية تكرار هذا المستشعر، قمنا بإجراء قياسات PL إضافية تعتمد على التركيز باستخدامأنابيب الكربون النانوية المفعلّة بمستوى أعلى-كثافة العيوب (انظر الأشكال التكميلية 20، 21). مرة أخرى، يمكن ملاحظة استجابة فلورية تعتمد على التركيز مماثلة، ويبدو أن شدة PL المطلقة ونسب شدة PL مناسبة بشكل متساوٍ للكشف عن. ومع ذلك، فإن كثافة شديدة الاعتماد على التركيز ومواضع الذروة لكل من دفعتي المواد الوظيفيةتظهر أنابيب الكربون النانوية المفردة انحرافًا كبيرًا. بالمقابل، يتم الحصول على منحنيات استجابة متطابقة تقريبًا عند استخدام النهج النسبي من خلال المقارنةنسب الشدة (انظر الشكل التكميلية 22).
نسب شدة PL تتفوق بوضوح على القيم المطلقة وتؤكد أن الفلورسنت النسبي المطورالمستشعر قوي وقابل للتكرار حتى بين دفعات الأنابيب النانوية المختلفة ذات درجات مختلفة من التFunctionalization. المقابليمكن العثور على قيم ومعلمات هيل لكثافات العيوب لكل من الكثافتين في الجدول التكميلي 4. نجد نطاق كشف قابل للاستخدام منإلىمن الحد الأقصى لاستجابة نسب كثافة PL لمجسات SWNT المتوافقة حيوياً في المحلولتركيز من 17 إلى. يعتمد هذا النطاق إلى حد ما على تركيز الأنابيب النانوية الكربونية المفردة ويمكن تعديله بالنسبة لنسبة الإشارة إلى الضوضاء والتطبيق.
تم تحديد حد الكشف (LOD) ليكونلـنسب شدة PL ( و لـ و الشدة، على التوالي، انظر الشكل التكميلي 23 والملاحظة التكميلية 6). العديد من الحالات السريرية التي تسبب زيادة في مستوياتفي البول، الميتوكوندريا داخل الخلايا أو السوائل الزليليةيمكن تتبعها ضمن نطاق الكشف هذا. على سبيل المثال، يُظهر المرضى الذين يعانون من نقص الفوسفاتاز مستويات مرتفعة منمع تركيزات تتراوح بين و في البلازما وفي البول.
بالنسبة لمعظم أجهزة الاستشعار الفلورية، يجب الحصول على منحنيات المعايرة لتحديد الكمية بشكل صحيح.تركيزات مستندة إلىنسب الشدة لبيئات بيولوجية محددة. مقاييس تكون
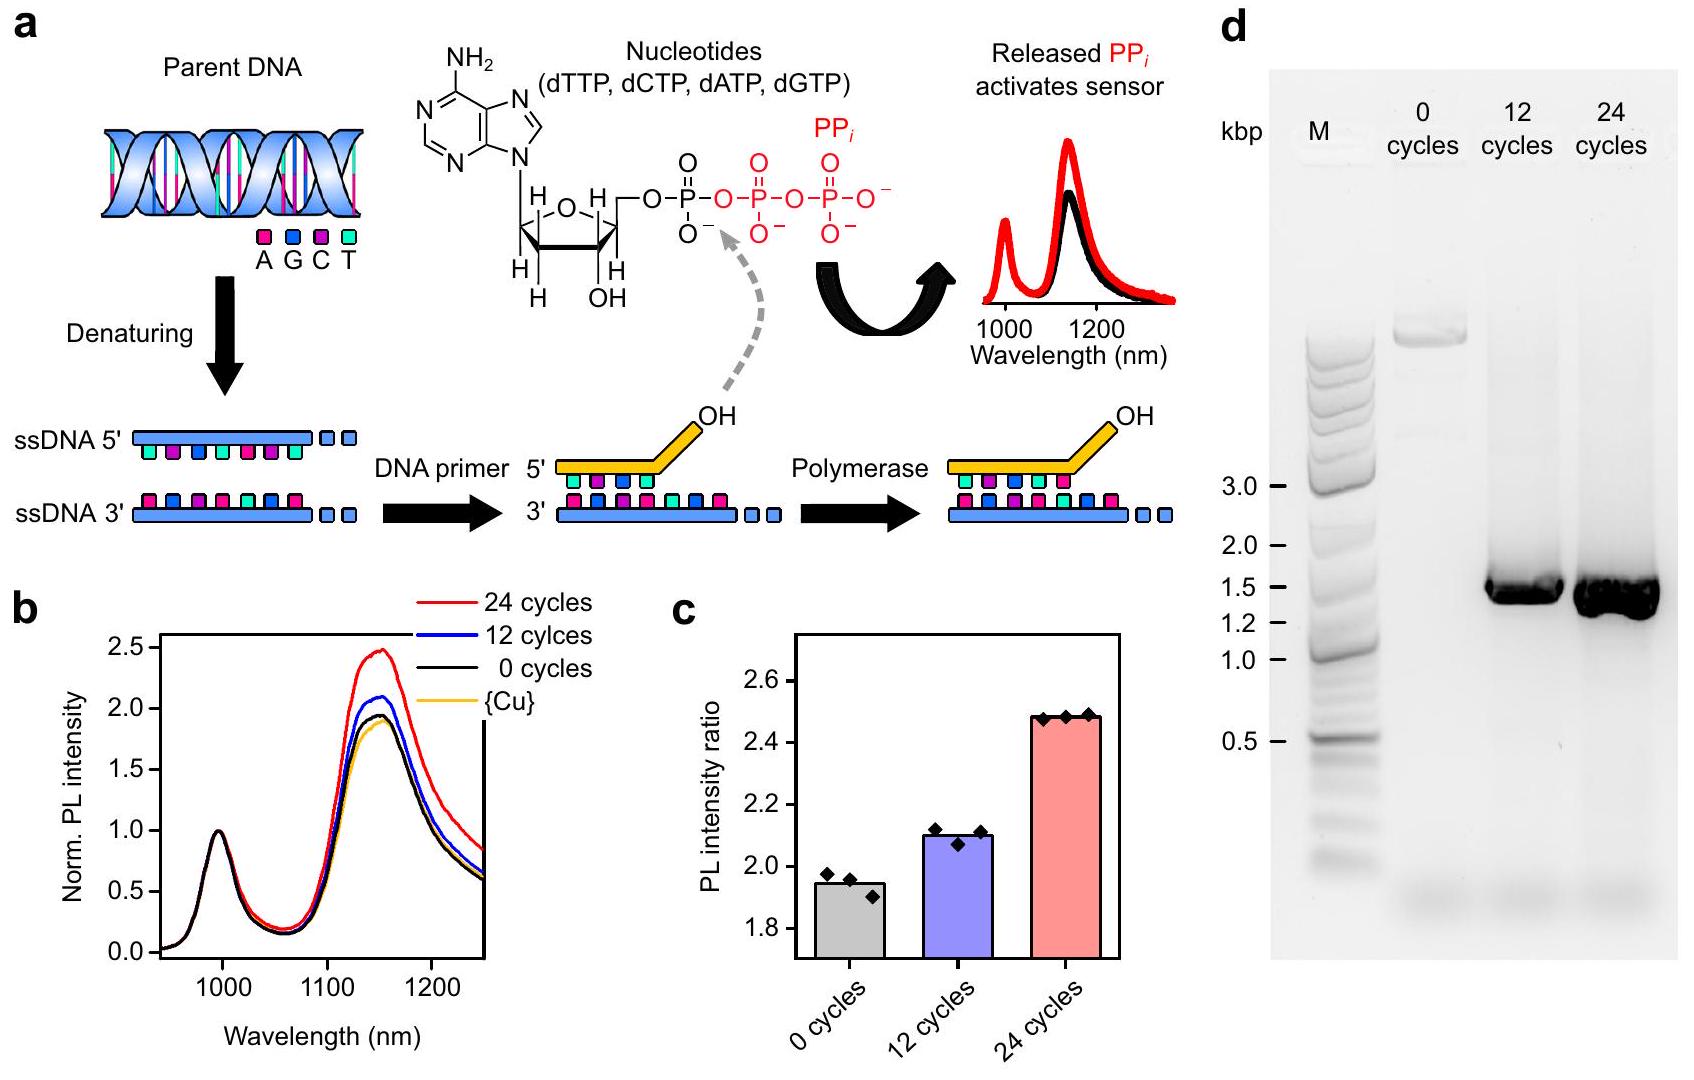
الشكل 6 | مراقبة دورات PCR من خلال الكشف عن المواد المحررة. مفهوم لقياس دورات PCR من خلال الكشف عن المادة المنطلقة مع مستشعر SWNT. يتم تقديم هيكل DNA باللون الأزرق، ويتم تقديم بادئ DNA باللون الأصفر. يتم عرض القواعد النووية كمربعات باللون الأرجواني (A، أدينين)، الأزرق الداكن (G، جوانين)، البنفسجي (C، سيتوزين) والفيروزي (T، ثايمين). تم الإفراج عن المصدر من dNPTs (هنا dATP) موضح باللون الأحمر.طيف PL المعدل والمعدل (3 قياسات) لدزالكين الموزع مع PL-PEGوعولجت بـبعد الإضافة لـمنتج PCR بعد 0 و 12 و 24 دورة. ج تم قياس PLنسب الشدة بعد
إضافةلمنتج PCR بعد 0 و 12 و 24 دورة. تم فحص عينة واحدة مستقلة بيولوجيًا.القياسات المستقلة باستخدام مستشعر SWNT، ويجب أن تمثل التباين في استجابة المستشعر. ارتفاع الشريط يمثل متوسط القياسات الثلاث.التحليل الكهربائي للهلام لمنتجات تفاعل البوليميراز المتسلسل بعد 0 و 12 و 24 دورة، علامة M-DNA مع طول قطع الحمض النووي بوحدات الكيلوباز. تم توفير بيانات المصدر كملف بيانات مصدر. ستتطلب الحساسية الأكبر تجاه البيئة العازلة لأنابيب الكربون النانوية المفردة مثل شدة الفلورسنت المطلقة ومواقع ذروة الفلورسنت تعديلات أكثر تقدمًا. تم الإبلاغ سابقًا عن مستشعر فلوري نير-2.استنادًا إلى جزيئات النانو من اللانثانيد أظهرت حساسية مماثلة وانتقائية أعلى تجاهلكنها كانت تفتقر إلى ميزة المعايرة الداخلية والاستشعار المتعدد الأنماط الذي تم تمكينه بواسطة SWNTs المفعلة بـ Dz-alkyne..
لاستكشاف إمكانيات هذا الفلورسنتمستشعر في بيئة بيولوجية، قمنا بزراعة خلايا HEK وأجرينا خطوة غسيل بعناية لإزالة وسط النمو المحتوي على الفوسفات قبل أن يتم تحلل الخلايا. عند إضافة lysate الخلايا إلىمستشعر SWNT المروي والتعزيز اللاحق بـ، حدث زيادة واضحة في شدة الانبعاث الضوئي (انظر الشكل 5e)، وتغيير في نسبة شدة الانبعاث الضوئي (انظر الشكل 5f) وموقع قمة الانبعاث الضوئي (انظر الشكل التكميلية 24). يجب ملاحظة أنه تحت الظروف المعطاة حدثت زيادة صغيرة فيالشدة وتمت ملاحظة نسبة الشدة بالفعل في lysate غير المعالج. كان من المتوقع حدوث هذا الانحراف، لأن كميات كبيرة من الفوسفات وكانت موجودة بالفعل لتركيز الليزات المختار. بشكل عام، PL-PEG-مغطى ويمكن استخدام الأنابيب النانوية الكربونية المفعلّة كفلوروسنت في نطاق الأشعة تحت الحمراء IIالمجسات تحت الظروف البيولوجية وفي الوسائط المعقدة. وبالتالي، يجب أن تكون مناسبة كأداة تحليل حيوي.
كشف عنأُطلق سراحه من PCR
أخيرًا، تم استخدام جهاز استشعار SWNT المطور لقياسالذي يتم إطلاقه أثناء تخليق خيط الحمض النووي بواسطة تفاعل البوليميراز المتسلسل (PCR) لتمكين الاتصال عبر الإنترنت المراقبة. في تفاعل البوليميراز المتسلسل (انظر الشكل 6أ)، يتم تحقيق النسخ الأسي لحمض نووي قالب.يتم إطلاقها من ثلاثي فوسفات الديوكسي نيوكليوزيد (dNPTs) عندما يحدث تخليق الحمض النووي بواسطة بوليميراز الحمض النووي. لتتبع ما تم إطلاقهخلال عملية التضخيم، من المهم اكتشاف كميات صغيرة منفي وجود dNPTs المتشابهة هيكليًا، وإنزيم بوليميراز الحمض النووي، وقالب الحمض النووي (بلازميد)، وأوليغو الحمض النووي، التي تُستخدم كبادئات ومحلول تفاعل البوليميراز المتسلسل (PCR).
لاختبار الـتم إجراء تفاعل البوليميراز المتسلسل (PCR) في مثل هذا النظام المعقد مع 0 و 12 و 24 دورة وتم إضافة المنتج النهائي من تفاعل البلمرة المتسلسل (PCR) إلى-مُطفَأ-مغطى و-مفعلتشتت SWNT. كما هو متوقع، تم ملاحظة استجابة طفيفة بالفعل لعدم وجود دورات بسبب التركيز العالي من dNPTs. كانت هناك استجابة مختلفة واضحة بعد إضافة منتج PCR، عندما تم إجراء PCR لمدة 12 و 24 دورة (انظر الشكل 6b). زيادة فيحدثت نسبة شدة PL على الفور ولم يكن هناك حاجة لوقت حضانة.
يجب أن نلاحظ أنه في الحالة المعروضة، تحويل dNPTs إلىيتم اكتشافه بواسطة مستشعر SWNT وليس المطلق التركيز. لهذا النوع من الاستجابة عدة تداعيات. مقارنةً بالبيانات السابقة، حيث تم جمع طيف PL عند إضافة ، لقد تغيرت التغيرات المتوقعة في موقع الذروة. كان هذا التأثير واضحًا بالفعل بالنسبة لنسب الخلط المختلفة لـ و ATP (انظر الشكل 3 والشكل التكميلي 6). نظرًا للتشابه الهيكلي بين dNPTs و ATP، نتوقع سلوكًا مشابهًا. تحويل dNPTs إلى يؤدي إلى انزياح نحو الأحمر لـ و الانبعاث على النقيض من الانزياح الأزرق الذي يُلاحظ عادةً (انظر الشكل التكميلية 25). علاوة على ذلك، من المتوقع أن تزيد نطاق حساسية مستشعر SWNT. تحويل dNPTs إلىيؤدي إلى استجابة أقل مقارنةً بالإضافة المباشرة لـ، مما يسمح للمستشعر بتتبع التغيرات في التركيز على نطاق تركيز أكبر. ومع ذلك، فإن الاستجابة الناتجة عن dNPTs إلى يجب أن تظل التحويلات تتوسع بشكل لوغاريتمي. مع إصدار بواسطة PCR واستجابة المستشعر كلاهما يزيدان على مقياس لوغاريتمي، من المتوقع وجود علاقة خطية بين نسبة شدة PL وعدد دورات PCR (12 و 24) وقد لوحظت بالفعل (انظر الشكل 6c). يمكن العثور على اتجاه مشابه بالنسبة لـ الشدة ونسبة مساحة PL (انظر الشكل التوضيحي 25). كشفت تقنية الرحلان الكهربائي للهلام عن النجاح في تضخيم الحمض النووي الأصلي بنفس الوزن الجزيئي (انظر الشكل 6d) وتتناسب شدة الشريط للمنتجات الحمض النووي المرئية مع الاتجاه الملحوظ لنسب شدة PL. باختصار، تم تطوير مستشعر SWNT الفلوري لـيمكن استخدامه كأداة بديلة وفورية لتتبع تضخيم الحمض النووي أثناء تفاعل البوليميراز المتسلسل (PCR) في الوقت الحقيقي على مدى نطاق كشف واسع، على عكس طرق الكشف الأخرى التي تستغرق وقتًا طويلاً مثل الرحلان الكهربائي للهلام.
نقاش
باختصار، لقد قمنا بتصميم وتقديم-مفعلأنابيب الكربون النانوية المفردة (SWNTs) ذات ميزات انبعاث محددة جيدًا في نطاق الأشعة تحت الحمراء القريبة II للكشف البصري النسبي عنفي البيئات البيولوجية. الـيعتمد نظام الاستشعار على استعادة الفلورسنت القريبة من الأشعة تحت الحمراء للأنابيب النانوية من خلال إزاحة أيونات النحاس. انبعاث المواد الوظيفية المرتبطة تساهم في ذلك. يتم إخماد SWNTs من خلال نقل الإلكترون المحفز بالضوء إلى الأيونات التي تم تثبيتها على سطح SWNT بواسطة ربيطة الترايازول وتنسيق ضعيف إضافي مع المجموعات الألكينية المرتبطة تساهميًا. إن تقليل الإضاءة (PL) يكون أكثر وضوحًا بالنسبة لـمتعلق بالعيوبانبعاث أكثر منانبعاثات ويؤدي إلى تغييرات متCorresponding فينسبة الشدة بالإضافة إلى مواقع الذروة. إزالةمن سطح SWNT بواسطةيؤدي إلى استعادة خصائص الانبعاث اعتمادًا على التركيز المطلق لـ، مما يمكّن من نظام كشف نسبي قوي. بينما تسبب مواد التحليل الأخرى التي تشكل مع النحاس بشكل قوي (مثل ATP) أيضًا استجابة فلورية، يمكن استخدام الفروق النسبية لتتبع العمليات البيولوجية ذات الصلة. بالمقارنة مع أجهزة الاستشعار متعددة الإشارات الأخرى المعتمدة على اختلاط الكيرالية لأنابيب الكربون النانوية، فإن ميزات الانبعاث للأنابيب الكربونية الأحادية الكيراليةتعتبر الأنابيب النانوية الكربونية المفردة (SWNTs) ضيقة، وتأتي من نفس النوع، وبالتالي توفر قراءة بصرية أكثر موثوقية. التغيرات الملحوظة في شدة الإضاءة الفلورية النسبية والمطلقة بما في ذلك التحولات المعتمدة على المادة المدروسة في و يمكن أيضًا استخدام المواقع الذروية لخطط الكشف المعتمدة على خوارزميات التعلم الآلي.
تشير الدراسات الميكانيكية إلى أن كفاءة إخماد PL بواسطةيعتمد على نوع المجموعة الوظيفية المرتبطة بـ العيوب (هنا أريل ألكاين) ونظام الربط (هنا تريازول قويالتفاعلات) التي تنسق أيونات النحاس القريبة من سطح SWNT وتمكن من نقل الإلكترونات السريع المحفز بالضوء. ستساعد هذه الرؤى في تصميم أنظمة الربط واستراتيجيات تثبيت أيونات المعادن لتطوير أجهزة استشعار بصرية تعتمد على-أنابيب الكربون النانوية المفعلّة.
تصميم المستشعر الحالي يسبب تغييرًا لا رجعة فيه في الفلورية في وجود، وهو ميزة عالمية لاختبارات إزاحة المعادن. في هذه الخطة للكشف، قد يكون من الممكن تحقيق القابلية للعكس فقط من خلال إضافة جديدة أيونات أو استراتيجية جديدة للتثبيت حيثالتعقيد بواسطةيؤثر فقط على مسافته إلى سطح SWNT وبالتالي درجة إخماد PL. ومع ذلك، تمثل اللاتراجع ميزة في الاختبارات التي من المفترض أن تقدم معلومات قوية وكمية في نقاط زمنية محددة.
من المهم أن جهاز الاستشعار الفلوري SWNT الذي تم إثباته يظل يعمل بكامل طاقته مع نافذة كشف تتجاوز مرتبتين من حيث الحجم عندما يتم جعله متوافقًا حيويًا عن طريق تغطيته بالفوسفوليبيد بولي إيثيلين جلايكول. يمكن استخدامه للكشف عنفي المستخلص مع عدد خلايا مرتفع وللكشف الفلوري الفوري عن تم إصدارها خلال تخليق الحمض النووي في تفاعل البوليميراز المتسلسل (PCR) مع تطبيقات محتملة في مراقبة جودة PCR. نظرًا لمعايرتها الداخلية والعديد من معلمات الاستشعار، فإن هذه الخطة للكشف توسع بشكل كبير الطرق المتاحة حاليًا للكشف عن العلامات الحيوية في نطاق الأشعة تحت الحمراء القريبة II (NIR-II) وتفتح الطريق نحو الكشف داخل الكائن الحي.مع ضوضاء خلفية منخفضة. بشكل عام، فإن الوظيفة التساهمية لـ SWNTs معتقدم العيوب ميزات فلورية إضافية ومجموعات وظيفية محددة للكشف البصري (الحيوي) الانتقائي والموثوق.
طرق
المواد
تم شراء الكواشف التالية من سيغما-ألدريتش: كبريتات النيكل (II) سداسية الماء ) ، كبريتات الكوبالت (II) هيدرات سباعية ) ، ملح الصوديوم لأدينوزين 5′-ثنائي الفوسفات (ADP، ، بكتيري، HPLC)، كربونات الصوديوم (أسيتات البوتاسيوم ( ) ، نترات البوتاسيوم ( ) ، يوديد البوتاسيوم ( ) ، كلوريد الكالسيوم سداسي الماء (98%)، سترات الصوديوم ثلاثي القاعدة ثنائي الماء، L-سيستين (97%)، حمض الإيثيلين ثنائي الأمين رباعي الأسيتيك ملح رباعي الصوديوم المائي (EDTA)، ثنائي فوسفات الصوديوم (98%)، DOC (BioXtra، )، SDS ( ) ، صوديوم كولات (SC، ) هيبوكلوريت الصوديوم (NaClO، الكلور النشط)، حمض التترافلوروبورونيك (48٪ وزناً)، نيتريت التيرت-بيوتيل (90٪)، 4-إيثينيل أنيلين (2-إيثينيلانيلينأنيلين ) ، تم شراء المواد الكيميائية التالية من TCI: أدينوزين 5′-ثلاثي الفوسفات ثنائي الصوديوم المائي (ATP، >98%، HPLC)، ديكستران ( )، THPTA ( بولي (إيثيلين جلايكول) (PEG،تم شراء PL-PEG من ألفا أيسر. (18:0 PEG5000PE، 1,2-ديستيارويل-سن-غليسيرول-3-فوسفوهيدروكسي إيثانولامين- [ميثوكسي (بولي إيثيلين جلايكول) -5000] تم شراءه من شركة أفانتي بولار ليبيدز، إنك.
تحضيرتشتتات SWNT
تشتتات أحادية الكيراليةتم تحضير SWNTs من مادة CoMoCAT الخام (CHASM SG65i-L58) بواسطة ATPEتم إجراء ATPE في نظام ثنائي الطور يتكون من ديكستران وPEG. تم فصل SWNTs في بروتوكول فرز القطر باستخدام DOC وSDS. عند تركيز ثابت من DOCتم زيادة تركيز SDS إلى لدفع جميع الأنواع ذات الأقطار الأكبر من تم إدخال الأنابيب النانوية الكربونية المفردة إلى المرحلة العليا للاستخراج. ثم تم زيادة تركيز SDS منإلىوكلتم جمع مراحل غنية بـ SWNT. تم تحقيق فصل SWNTs المعدنية وشبه الموصلة من خلال إضافة المزيد من SC وNaOCl كعامل مؤكسد. تم اختيارتم تركيز الأنابيب النانوية الكربونية المفردة (SWNTs) في خلية ترشيح فائق مضغوطة (Millipore) معغشاء القطع وتم ضبطه على SDS لمزيد من التفاعل الوظيفي.
طرق التوصيف
تم الحصول على طيف الامتصاص مع تصحيح الخط الأساسي باستخدام مطياف الأشعة فوق البنفسجية والمرئية والأشعة تحت الحمراء القريبة Cary 6000 i (Varian, Inc.). تم قياس طيف الانبعاث الضوئي عند كثافات تحفيز منخفضة فيالانتقال إما مع ناتج مرشح الطول الموجي غير المركّز من ليزر السوبركونتينوم ذو النبضات القصيرة (NKT Photonics SuperK Extreme) أو مصباح قوس زينون بقوة 450 واط وتم تسجيله باستخدام مطياف Acton SpectraPro SP2358 (شعاع الشبكةخطوط ) وكاميرا خطية من InGaAs مبردة بالنيتروجين السائل (Princeton Instruments, OMA-V:1024) أو مطياف فلورولوج (HORIBA) مزود بكاميرا خطية من InGaAs مبردة بالنيتروجين السائل. بالنسبة لتجارب التوصيل الكهربائي وPCR، تم قياس طيف PL تحت تحفيز بواسطة ليزر 561 نانومتر بقوة 100 مللي واط (Gem 561, Laser Quantum) وتم تسجيله مع وقت تكامل قدره 4 ثوانٍ باستخدام مطياف (Shamrock 193i, Andor Technology Ltd.) متصل بمجهر (IX73, Olympus). تم قياس وتحليل أوقات حياة حالات العيوب المتلألئة في نظام عدّ الفوتونات المفردة المرتبطة زمنياً.باختصار، مُفَعَّلتم إثارة SWNTs عندالانتقال باستخدام ليزر سوبركونتينوم مزود بنبضات PS (NKT Photonics SuperK Extreme) وتم تركيز الانبعاث المفلتر طيفياً على كاشف فوتوني من نوع InGaAs/InP (Micro Photon
تمت قراءة الأجهزة بواسطة وحدة عد الفوتونات PicoHarp 300 (PicoQuant). تم تسجيل طيف رامان باستخدام مجهر رامان التداخلي Renishaw inVia Reflex. تم إسقاط تشتتات SWNTs على ركائز زجاجية وتم شطفها بعناية بالماء النقي للغاية. تم استخدام ليزر بزاوية 532 نانومتر للتحفيز وتم جمع أكثر من 1000 طيف ومتوسطها. تم تصحيح الطيف يدويًا عن طريق ملاءمة منحنى مكعب سلس عبر النقاط التي كان من المتوقع أن تكون فيها الضوضاء الخلفية فقط.
تركيب تيترافلوروبورات الأرينيديازونيوم
تم تخليق الإيثينيل بنزين وأملاح بنزين ديازونيوم من الأنيلينات المقابلة (انظر أيضًا الشكل التوضيحي 26).في دورق سعة 25 مل، تم إذابة الأنيلين (0.85 مليمول) في الأسيتونيتريل (2 مل) ومحلول مائي من حمض التترافلوروبورونيك.تم إضافة (2.0 مكافئ). تم تبريد المحلول إلىفي حمام ثلج/ماء ونتريت التيرت بوتيل (تم إضافة (eq.) قطرة قطرة. تم تحريك المزيج عند لمدة 30 دقيقة وتم إضافة الإيثر الثنائي (10 مل) لترسيب تيترافلوروبورات الأرينيديازونيوم. تم تصفية الصلبة الناتجة، وغسلها بالإيثر الثنائي البارد (10 مل) وأعيد تبلوره من الأسيتون. تم تجفيف مركب أرينيديازونيوم تترافلوروبورات في الفراغ لمدة ساعة واحدة. تم تخليق تترافلوروبورات ديازونيوم 4-إيثينيل بنزين بدءًا من 4-إيثينيل أنيلين. تم استرداد المنتج الديازونيومي كمسحوق بلوري عديم اللون.تم تخليق رباعي فلوريد البورون ثنائي الزازونيم 2-إيثينيل بنزين بدءًا من 2-إيثينيل أنيلين. تم استرداد المنتج الزازوني كمسحوق بلوري عديم اللون.تم تخليق رباعي فلوريد البورون من ثنائي الزازونيوم البنزين بدءًا من الأنيلين. وتم استرداد المنتج الديازوني كمسحوق بلوري عديم اللون. ). تم تأكيد النجاح في التخليق بـ طيف الرنين المغناطيسي النووي (NMR، انظر الملاحظة التكميلية 7). تم تخزين أملاح الديازونيوم الناتجة في.
-بروتوكول الوظائف
للتFunctionalizationتم ضبط الكثافة الضوئية للتشتت المائي لـ SWNTs إلىفيالانتقال باستخدام الماء النقي للغاية. محاليل مخزنة من أملاح الديازونيوم المقابلة بتركيز نهائي منتم تحضيرها وتم إضافة كميات منها إلى المشتت. عادةً، كانت أحجام التفاعل 315 مل وتركيزات أملاح الديازونيوم تتراوح بين 0.025 وتم استخدامها. بالنسبة لوظيفة 2-إيثينيل بنزين ديازونيوم تترافلوروبورات، كانت التركيز النهائي لـتم استخدام ملح الديازونيوم. تم تخزين جميع خلطات التفاعل في الظلام لمدة 7 أيام. لاكتشاف البيروفوسفات باستخدام المواد الوظيفيةتمت إزالة الملح الديازوني الزائد من SWNTs مع مادة السطح SDS عبر خطوات ترشيح دورانية متعددة (أميكون ألترا- ) وموظف تم إعادة تعليق SWNTs في SDS. تم تسليط الموجات فوق الصوتية على جميع التشتتات لمدة 15 دقيقة قبل المزيد من التوصيف.
بروتوكول استشعار البيروفوسفات
للكشف عن البيروفوسفات في تشتتات المواد الوظيفيةأنابيب الكربون النانوية المفردة مع مادة السطح SDS، محاليل مخزنة جديدة في ماء نقي للغاية منوتم تحضير THPTA (12 مللي مول) ودمجهما بنسبة 1:1. عادةً، (مقابل تركيز نهائي لمركب النحاس قدره 15 مللي مول) أُضيفت إلى 1 مل من مُفَعَّلتشتت SWNT بكثافة بصرية منفيالانتقال وتم الحضانة لمدة 15 دقيقة.
للكشف عن البيروفوسفات باستخدام أنابيب الكربون النانوية ذات التوافق الحيوي، تم تحضير معلقات من-مفعلتم خلط SWNTs مع PLبحيث تكون التركيز النهائي لـ PL-PEGكانتم نقل الخليط إلىكيس الغسيل الكلوي (Spectra/Por، شركة سبيكتروم لابوراتوريز إنك.) وتمت عملية الغسيل لمدة 7 أيام ضد الماء النقي للغاية لإزالة SDS. وتمت معالجة التعليق الناتج بالموجات فوق الصوتية لمدة 15 دقيقة مما أسفر عن PL-PEGمشتت-مفعلأنابيب الكربون النانوية المفردة. تم تركيز 2 مل من التعليق بواسطة الترشيح الدوراني (أميكون ألترا-4، ) إلى حوالي محلول مخزون منتم خلطه فينسبة مع محلول مخزون من THPTA (60 مللي مول)تمت إضافة إلى التعليق المركز. بعد 15 دقيقة، تم تخفيف المزيج إلى 2 مل، وتم تصفيته بواسطة الترشيح الدوراني (أميكون ألترا-4، ) ومعلقة في تحضير طازج محلول مائع مكون من مفسد MOPS خالي من EDTA (Serva) (درجة الحموضة 7.4). تم تعديل تشتت SWNT إلى كثافة بصرية منفيالانتقال والجرعات الجزئيةتمت إضافة في الماء النقي للغاية لضبط التركيز النهائي للبيوروفوسفات. يمكن العثور على مخطط سير العمل في الشكل التوضيحي 27. لاكتشاففي lysate الخلايا المملوءةتم إصدارها في PCR وتم ضبط تشتت SWNT إلى كثافة ضوئية تبلغ حواليفيالانتقال في حجم القياس النهائي لـتركيزات SWNT تصل إلى (المقابل لكثافة بصرية من فيالانتقال لـكانت أنابيب الكربون النانوية (SWNTs) كافية لتحقيق نسبة عالية من الإشارة إلى الضوضاء.
تحضير زراعة الخلايا
تم شراء خلايا HEK293 من مجموعة DSMZ الألمانية للميكروبات وزراعة الخلايا (ACC 305) وزراعتها وفقًا لبروتوكول المورد في بيئة رطبة.جو فيفي قوارير T-75 (سارستيد) مع نسبة زراعة فرعية 1:5 كل 3-4 أيام. تم زراعة الخلايا في 16 مل من DMEM (ثيرمو فيشر ساينتيفيك) مضافًا إليه مصل جنين البقر (FBS) ( ) ، البنسلين ( 100 وحدة ) و ستربتوميسين ( تم زراعة الخلايا في أطباق بحجم 100 مم (سارستيد) بكثافة منتمت زراعة الخلايا لمدة 4 أيام حتى الوصول إلى التقاء الخلايا. قبل حصاد الخلايا، تمت إزالة وسط الزراعة وتم غسل الخلايا بعناية مرتين بالماء النقي. تم حصاد الخلايا عن طريق كشطها فيماء نقي للغاية، تم نقله فورًا إلى أكواب إيبندورف سعة 1.5 مل وتجميده بسرعة في النيتروجين السائل. تم إجراء التحلل بواسطة الموجات فوق الصوتية النبضية (1 ثانية تشغيلإيقاف) عندالسعة لمدة دقيقتين (نموذج Qsonica Q700 مع ملحق كوب هورن)، تليها الطرد المركزي عندلمدة دقيقتين لإزالة الحطام الخلوي والجزيئات الكبيرة. تم استخدام السائل العلوي للتجارب اللاحقة.
تفاعل PCR
تم إنشاء جميع التركيبات في هذه الدراسة باستخدام تقنيات تفاعل البوليميراز المتسلسل القياسية. تم تجميع خليط تفاعل PCR على الثلج في حجم إجمالي منتمت صياغة تفاعل PCR وفقًا لتعليمات الشركة المصنعة لبوليميراز DNA عالي الدقة Q5 (New England BioLabs، M0491S) مع التركيز النهائي لـ dNTPs (خليط dNTP بتركيز 10 مللي مول، بروميجا، U1511) ولكل من البادئات الأمامية (T7profwd TAATACGACTCACTATAGGGG) والخلفية (T7term-rev TGCTAGTTATTGCTCAGCGG) (يوروفينز جينومكس). تم استخدام 150 نانوغرام من متجه pET27b(+) مع جين ompc من بكتيريا الإشريكية القولونية كحمض نووي قالب. تم تقسيم الماسترمكس إلى ثلاث مجموعات فردية ومرت عبر دورات PCR في جهاز Eppendorf Mastercycler لمدة 12 دورة، 24 دورة، أو تم الاحتفاظ بها على الثلج، على التوالي. كان برنامج PCR برنامجًا قياسيًا مع إنكار أولي عند لمدة 30 ثانية، تليها 30 ثانية من التلدين عند وتمدد عندلمدة 35 ثانية للدورات المذكورة أعلاه 12 أو 24 دورة. تم تحليل تفاعلات PCR بواسطة الرحلان الكهربائي في الهلام. لمدة 45 دقيقة ) على هلام أagarose TAE يحتوي على 1X GelRed (Biotium, 41003-T) وتمت رؤيته تحت الضوء فوق البنفسجي بواسطة نظام تصوير الهلام Bio-Rad ChemiDoc.
ملخص التقرير
معلومات إضافية حول تصميم البحث متاحة في ملخص تقارير مجموعة نيتشر المرتبط بهذه المقالة.
توفر البيانات
تتوفر مجموعات البيانات التي تم إنشاؤها خلال و/أو تحليلها خلال الدراسة الحالية في مستودع heiDATA (https://doi.org/10. 11588/data/UOE7KX) ومن المؤلفين المعنيين عند الطلب. يتم توفير بيانات المصدر مع هذه الورقة.
References
Ackermann, J., Metternich, J. T., Herbertz, S. & Kruss, S. Biosensing with fluorescent carbon nanotubes. Angew. Chem. Int. Ed. 61, e202112372 (2022).
Balcı Leinen, M., Lindenthal, S., Heimfarth, D. & Zaumseil, J. Networks of as-dispersed, polymer-wrapped single-walled carbon nanotubes for selective and glyphosate sensing. Nanoscale 14, 13542-13550 (2022).
Barone, P. W., Baik, S., Heller, D. A. & Strano, M. S. Near-infrared optical sensors based on single-walled carbon nanotubes. Nat. Mater. 4, 86-92 (2005).
Kruss, S. et al. Carbon nanotubes as optical biomedical sensors. Adv. Drug Deliv. Rev. 65, 1933-1950 (2013).
Bachilo, S. M. et al. Structure-assigned optical spectra of singlewalled carbon nanotubes. Science 298, 2361-2366 (2002).
Galassi, T. V. et al. Long-term in vivo biocompatibility of singlewalled carbon nanotubes. PLoS ONE 15, e0226791 (2020).
Alidori, S. et al. Carbon nanotubes exhibit fibrillar pharmacology in primates. PLoS ONE 12, e0183902 (2017).
Welsher, K. et al. A route to brightly fluorescent carbon nanotubes for near-infrared imaging in mice. Nat. Nanotechnol. 4, 773-780 (2009).
Nissler, R. et al. Remote near infrared identification of pathogens with multiplexed nanosensors. Nat. Commun. 11, 5995 (2020).
Giraldo, J. P. et al. A ratiometric sensor using single chirality nearinfrared fluorescent carbon nanotubes: application to in vivo monitoring. Small 11, 3973-3984 (2015).
Flavel, B. S., Nambiar, M. & Shapter, J. G. Electrochemical detection of copper using a Gly-Gly-His modified carbon nanotube biosensor. Silicon 3, 163-171 (2011).
Bisker, G. et al. Protein-targeted corona phase molecular recognition. Nat. Commun. 7, 10241 (2016).
Kruss, S. et al. Neurotransmitter detection using corona phase molecular recognition on fluorescent single-walled carbon nanotube sensors. J. Am. Chem. Soc. 136, 713-724 (2014).
Nissler, R., Ackermann, J., Ma, C. & Kruss, S. Prospects of fluorescent single-chirality carbon nanotube-based biosensors. Anal. Chem. 94, 9941-9951 (2022).
Zaumseil, J. Luminescent defects in single-walled carbon nanotubes for applications. Adv. Opt. Mater. 10, 2101576 (2022).
Brozena, A. H., Kim, M., Powell, L. R. & Wang, Y. Controlling the optical properties of carbon nanotubes with organic colour-centre quantum defects. Nat. Rev. Chem. 3, 375-392 (2019).
Wang, H. & Boghossian, A. A. Covalent conjugation of proteins onto fluorescent single-walled carbon nanotubes for biological and medical applications. Mater. Adv. 4, 823-834 (2023).
Piao, Y. et al. Brightening of carbon nanotube photoluminescence through the incorporation of defects. Nat. Chem. 5, 840-845 (2013).
Berger, F. J. et al. Brightening of long, polymer-wrapped carbon nanotubes by functionalization in organic solvents. ACS Nano 13, 9259-9269 (2019).
Settele, S. et al. Synthetic control over the binding configuration of luminescent -defects in single-walled carbon nanotubes. Nat. Commun. 12, 2119 (2021).
Kim, M. et al. Detection of ovarian cancer via the spectral fingerprinting of quantum-defect-modified carbon nanotubes in serum by machine learning. Nat. Biomed. Eng. 6, 267-275 (2022).
Spreinat, A. et al. Quantum defects in fluorescent carbon nanotubes for sensing and mechanistic studies. J. Phys. Chem. C 125, 18341-18351 (2021).
Kim, M. et al. Nanosensor-based monitoring of autophagyassociated lysosomal acidification in vivo. Nat. Chem. Biol. 19, 1448-1457 (2023).
Mansurova, S. E. Inorganic pyrophosphate in mitochondrial metabolism. Biochim. Biophys. Acta-Bioenerg. 977, 237-247 (1989).
Nelson, D., Cox, M. & Hoskins, A. Lehninger Principles of Biochemistry 8 edn (Macmillan International, Higher Education, 2021).
Burke, C. R. & Luptak, A. DNA synthesis from diphosphate substrates by DNA polymerases. Proc. Natl. Acad. Sci. USA. 115, 980-985 (2018).
Xu, S. et al. A quantitative method to measure telomerase activity by bioluminescence connected with telomeric repeat amplification protocol. Anal. Biochem. 299, 188-193 (2001).
Wright, G. D. & Doherty, M. Calcium pyrophosphate crystal deposition is not always ‘wear and tear’ or aging. Ann. Rheum. Dis. 56, 586-588 (1997).
Rosenthal, A. K. & Ryan, L. M. Calcium pyrophosphate deposition disease. N. Engl. J. Med. 374, 2575-2584 (2016).
Kaur, J. & Singh, P. K. Nanomaterial based advancement in the inorganic pyrophosphate detection methods in the last decade: A review. Trends Anal. Chem. 146, 116483 (2022).
Anbu, S., Paul, A., Stasiuk, G. J. & Pombeiro, A. J. L. Recent developments in molecular sensor designs for inorganic pyrophosphate detection and biological imaging. Coord. Chem. Rev. 431, 213744 (2021).
Wongkongkatep, J., Ojida, A. & Hamachi, I. Fluorescence sensing of inorganic phosphate and pyrophosphate using small molecular sensors and their applications. Top. Curr. Chem. 375, 30 (2017).
Zhu, W. et al. A novel NIR fluorescent turn-on sensor for the detection of pyrophosphate anion in complete water system. Chem. Commun. 48, 1784-1786 (2012).
Hong, G., Antaris, A. L. & Dai, H. Near-infrared fluorophores for biomedical imaging. Nat. Biomed. Eng. 1, 0010 (2017).
Li, B., Lu, L., Zhao, M., Lei, Z. & Zhang, F. An efficient 1064 nm NIR-II excitation fluorescent molecular dye for deep-tissue high-resolution dynamic bioimaging. Angew. Chem. Int. Ed. 57, 7483-7487 (2018).
Antaris, A. L. et al. A small-molecule dye for NIR-II imaging. Nat. Mater. 15, 235-242 (2016).
Liu, Y. et al. A reversible NIR-II ratiometric fluorescent probe for realtime in vivo ATP detection. Adv. Opt. Mater. 2301144 (2023).
Chen, Y. et al. Shortwave infrared in vivo imaging with gold nanoclusters. Nano Lett. 17, 6330-6334 (2017).
Su, Y. et al. Sensing and imaging of in vivo using lanthanidebased second near-infrared luminescent probes. J. Mater. Chem. B. 10, 1055-1062 (2022).
Meng, X. et al. Recent advances in near-infrared-II fluorescence imaging for deep-tissue molecular analysis and cancer diagnosis. Small 18, e2202035 (2022).
He, H. et al. Ultrasmall quantum dots with uniform particle size and bright tunable fluorescence in the NIR-II window. Small 14, e1703296 (2018).
Kim, H. N., Ren, W. X., Kim, J. S. & Yoon, J. Fluorescent and colorimetric sensors for detection of lead, cadmium, and mercury ions. Chem. Soc. Rev. 41, 3210-3244 (2012).
Zhang, X. et al. Activatable NIR-II organic fluorescent probes for bioimaging. Theranostics 12, 3345-3371 (2022).
Sebastian, F. L. et al. Absolute quantification of defects in semiconducting single-wall carbon nanotubes by raman spectroscopy. J. Phys. Chem. Lett. 13, 3542-3548 (2022).
Chan, T. R., Hilgraf, R., Sharpless, K. B. & Fokin, V. V. Polytriazoles as copper(I)-stabilizing ligands in catalysis. Org. Lett. 6, 2853-2855 (2004).
Wulf, V. et al. Multicomponent system of single-walled carbon nanotubes functionalized with a melanin-inspired material for optical detection and scavenging of metals. Adv. Funct. Mater. 32, 2209688 (2022).
Wang, Z. et al. Graphene/ nanocomposite for effective removal of ten triazole fungicides from water solution: Tebuconazole as an example for investigation of the adsorption mechanism by experimental and molecular docking study. J. Taiwan Inst. Chem. Eng. 95, 635-642 (2019).
Léger, B. et al. Noncovalent functionalization of multiwall carbon nanotubes by methylated- -cyclodextrins modified by a triazole group. Chem. Commun. 46, 7382-7384 (2010).
Larsen, B. A. et al. Effect of solvent polarity and electrophilicity on quantum yields and solvatochromic shifts of single-walled carbon nanotube photoluminescence. J. Am. Chem. Soc. 134, 12485-12491 (2012).
Shiraki, T. et al. Solvatochromism of near infrared photoluminescence from doped sites of locally functionalized singlewalled carbon nanotubes. Chem. Commun. 55, 3662-3665 (2019).
Wu, J., Gao, Y., Lu, J., Hu, J. & Ju, Y. A steroid-coumarin conjugate for cascade recognition of copper ion and dihydrogen phosphate: Microstructural features and IMPLICATION logic gate properties. Sens. Actuators B: Chem. 206, 516-523 (2015).
Yu, B. et al. Ortho-substituted aryldiazonium design for the defect configuration-controlled photoluminescent functionalization of chiral single-walled carbon nanotubes. ACS Nano 16, 21452-21461 (2022).
He, X. et al. Solvent- and wavelength-dependent photoluminescence relaxation dynamics of carbon nanotube defect states. ACS Nano 12, 8060-8070 (2018).
Sistemich, L., Galonska, P., Stegemann, J., Ackermann, J. & Kruss, S. Near-infrared fluorescence lifetime imaging of biomolecules with carbon nanotubes. Angew. Chem. Int. Ed. 62, e202300682 (2023).
Brege, J. J., Gallaway, C. & Barron, A. R. Fluorescence quenching of single-walled carbon nanotubes with transition-metal ions. J. Phys. Chem. C 113, 4270-4276 (2009).
Miller, J. R., Calcaterra, L. T. & Closs, G. L. Intramolecular longdistance electron transfer in radical anions. The effects of free energy and solvent on the reaction rates. J. Am. Chem. Soc. 106, 3047-3049 (1984).
Park, M. et al. Measuring the accessible surface area within the nanoparticle corona using molecular probe adsorption. Nano Lett. 19, 7712-7724 (2019).
Blanch, A. J. & Shapter, J. G. Surfactant concentration dependent spectral effects of oxygen and depletion interactions in sodium dodecyl sulfate dispersions of carbon nanotubes. J. Phys. Chem. B 118, 6288-6296 (2014).
Bergler, F. F., Stahl, S., Goy, A., Schöppler, F. & Hertel, T. Substratemediated cooperative adsorption of sodium cholate on singlewall carbon nanotubes. Langmuir 32, 9598-9603 (2016).
Russell, R. G. G., Bisaz, S., Donath, A., Morgan, D. B. & Fleisch, H. Inorganic pyrophosphate in plasma in normal persons and in patients with hypophosphatasia, osteogenesis imperfecta, and other disorders of bone. J. Clin. Investig. 50, 961-969 (1971).
Russell, R. G. G. Excretion of inorganic pyrophosphate in hypophosphatasia. Lancet 286, 461-464 (1965).
Caballero, D. et al. Intraperitoneal pyrophosphate treatment reduces renal calcifications in Npt2a null mice. PLoS ONE 12, e0180098 (2017).
March, J. G., Simonet, B. M. & Grases, F. Determination of pyrophosphate in renal calculi and urine by means of an enzymatic method. Clin. Chim. Acta 314, 187-194 (2001).
Terkeltaub, R. A. Inorganic pyrophosphate generation and disposition in pathophysiology. Am. J. Physiol. Cell Physiol. 281, C1-C11 (2001).
Johnson, K. et al. Mitochondrial oxidative phosphorylation is a downstream regulator of nitric oxide effects on chondrocyte matrix synthesis and mineralization. Arthritis Rheumatism 43, 1560-1570 (2000).
Rachow, J. W., Ryan, L. M., Mccarty, D. J. & Halverson, P. C. Synovial fluid inorganic pyrophosphate concentration and nucleotide pyrophosphohydrolase activity in basic calcium phosphate deposition arthropathy and milwaukee shoulder syndrome. Arthritis Rheumatism 31, 408-413 (1988).
Xu, H., Yang, D., Jiang, D. & Chen, H.-Y. Phosphate assay kit in one cell for electrochemical detection of intracellular phosphate ions at single cells. Front. Chem 7, 360 (2019).
Zhang, K., Xu, X.-H. & Qing, F.-L. Copper-promoted ritter-type trifluoroethoxylation of (hetero)arenediazonium tetrafluoroborates: a method for the preparation of trifluoroethyl imidates. Eur. J. Org. 2016, 5088-5090 (2016).
Gifford, B. J. et al. Optical effects of divalent functionalization of carbon nanotubes. Chem. Mater. 31, 6950-6961 (2019).
شكر وتقدير
لقد حصل هذا المشروع على تمويل من المجلس الأوروبي للبحث (ERC) في إطار برنامج الأبحاث والابتكار الخاص بالاتحاد الأوروبي “أفق 2020” (اتفاقية منحة رقم 817494 “TRIFECTs”، S.S.، J.Z.). يقر كل من C.A.S. وS.J. وS.K. بالتمويل المقدم من مؤسسة الأبحاث الألمانية (DFG) في إطار استراتيجية التميز الألمانية – EXC 2033-390677874 – RESOLV، و”مركز علوم الحلول ZEMOS” الممول من وزارة التعليم والبحث الفيدرالية الألمانية BMBF ومن وزارة الثقافة والبحث في شمال الراين – وستفاليا، ومن مؤسسة فولكس فاجن. يقر كل من B.S.F. وH.L. بامتنان بالدعم المقدم من DFG بموجب أرقام المنح FL 834/5-1 وFL 834/9-1 وFL 834/12-1.
مساهمات المؤلفين
أعدت س.س. وقاست جميع العينات وحللت البيانات. ص.أ.س. و س.ج. و س.ك. صمموا وابتكروا تجارب التطفل وPCR. نفذت إ.م. تخليق وتوصيف أملاح الديازونيوم تحت إشراف أ.س.ك.هـ. قدمت هـ.ل. و ب.س.ف. فرز ATPE.أنابيب الكربون النانوية المفردة. قام ج. ز. بتصميم المشروع والإشراف عليه. كتب س. س. وج. ز. المخطوطة. ناقش جميع المؤلفين تحليل البيانات وعلقوا على المخطوطة.
تمويل
تم تمويل الوصول المفتوح وتنظيمه بواسطة مشروع DEAL.
معهد الكيمياء الفيزيائية، جامعة هايدلبرغ، هايدلبرغ D-69120، ألمانيا.قسم الكيمياء والكيمياء الحيوية، جامعة روهر-بوخوم، بوخوم D-44801، ألمانيا.معهد الكيمياء العضوية، جامعة هايدلبرغ، هايدلبرغ D-69120، ألمانيا.معهد النانو تكنولوجيا، معهد كارلسروه للتكنولوجيا، كايزرشتراسه 12، كارلسروه D-76131، ألمانيا.قسم الهندسة الميكانيكية ومواد الهندسة، جامعة توركو، توركو FI-20014، فنلندا.قسم الكيمياء، كلية العلوم، جامعة الملك عبد العزيز، جدة 21589، المملكة العربية السعودية.أجهزة استشعار نانوية حيوية، معهد فراونهوفر للدارات والأنظمة الدقيقة، دويسبورغ D-47057، ألمانيا. البريد الإلكتروني: sebastian.kruss@rub.de; zaumseil@uni-heidelberg.de
Inorganic pyrophosphate is a key molecule in many biological processes from DNA synthesis to cell metabolism. Here we introduce -functionalized single-walled carbon nanotubes (SWNTs) with red-shifted defect emission as near-infrared luminescent probes for the optical detection and quantification of inorganic pyrophosphate. The sensing scheme is based on the immobilization of ions on the SWNT surface promoted by coordination to covalently attached aryl alkyne groups and a triazole complex. The presence of ions on the SWNT surface causes fluorescence quenching via photoinduced electron transfer, which is reversed by copper-complexing analytes such as pyrophosphate. The differences in the fluorescence response of -defect to pristine nanotube emission enables reproducible ratiometric measurements in a wide concentration window. Biocompatible, phospholipid-polyethylene glycol-coated SWNTs with such defects are employed for the detection of pyrophosphate in cell lysate and for monitoring the progress of DNA synthesis in a polymerase chain reaction. This robust ratiometric and near-infrared luminescent probe for pyrophosphate may serve as a starting point for the rational design of nanotube-based biosensors.
SWNTs are a promising platform for spectroscopic sensing in the second biological window (NIR-II, ) as their optical properties are very sensitive to their environment . SWNTs can be seen as rolled-up sheets of graphene with different roll-up angles and diameters that lead to different nanotube species, i.e., chiralities. Each species of SWNTs has characteristic optical properties and exhibits narrow photoluminescence (PL) peaks within the NIR-II window . In combination with their high photostability and biocompatibility, SWNTs are an excellent material for the development of biosensors . Over the last decade various SWNT-based biosensors have been developed that are sensitive to, for example, bacterial motifs , reactive
oxygen species , metal ions , proteins , and neurotransmitters such as dopamine . One drawback of SWNTs is their typically low PL quantum yield (PLQY) ( ) in aqueous dispersion and the low purity of the raw material. To tackle these issues, the field has recently expanded toward the use of sorted monochiral (i.e., single species) SWNTs and the integration of luminescent defects, also named quantum defects .
The intentional introduction of defects by covalent functionalization has been shown to enhance the fluorescence properties of SWNTs and increase their PLQ . At low densities, defects lead to new and bright emission bands (typically labeled as ) that are red-
shifted from the native excitonic emission. They provide additional fluorescence signals at different wavelengths and with different responses to changes in the nanotube environment and to analytes. Thus, they enable multimodal and ratiometric detection schemes. For the easily sorted and purified species of SWNTs (diameter 0.76 nm ), the emission occurs at and the emission at in aqueous dispersion . Very recently such defects were successfully used by Kim et al. as fluorescent probes to detect ovarian cancer and employed by Spreinat et al. to sense dopamine . Currently, most detection strategies depend on a complex interplay of the target analyte with non-covalent biopolymer-SWNT hybrids (e.g., ssDNA-wrapped SWNTs) that induce changes in the chemical or dielectric environment of the nanotube. However, the sensing mechanism often relies on very weak interactions and frequently requires complex analysis based on a large number of data sets. More direct detection schemes typically require a more specific interaction of the analyte with the SWNT. As the chemical moieties and functional groups attached to defects can be tailored, they enable the rational design of targeted analyte bindings and signal transduction schemes. One recent example is the application of SWNTs functionalized with pH -responsive -diethylamino moieties. They enhance the optical response to small changes in lysosomal pH and indicate autophagymediated endolysosomal hyperacidification in live cells through a shift of the defect emission wavelength . Thus, careful design of sensing schemes using controlled interactions of analytes with the SWNT surface and covalently attached functional groups could facilitate the optical detection of important biomarkers that were previously out of reach. One of these biomarkers is inorganic pyrophosphate.
Inorganic pyrophosphate plays a critical role in biological systems . It is one of the main byproducts of biochemical reactions such as DNA and RNA synthesis and hydrolysis of adenosine triphosphate (ATP) within cells . Hence, it is closely related to biological energy storage processes and has become an important biomarker for measuring telomerase activity for cancer diagnosis . Additionally, excess may promote diseases related to bones and joints. High levels of are observed in the synovial fluid of patients with calcium pyrophosphate dihydrate (CPPD) crystals, bone attrition and chondrocalcinosis . Thus, the detection and quantification of is highly desirable and the development of corresponding probes has been the subject of extensive research in recent years .
Fluorescent probes are often used for biomarkers due to their fast response and quantitative real-time readout as well as the potential to use them for in vivo imaging. Water-soluble fluorescent probes for typically rely on metal displacement assays, in which an acceptor molecule is attached to a fluorophore that switches between an emissive on and dark off state depending on the reversible metal ion chelation (e.g., ) of the acceptor . While this approach can reach sensitivities down to the nanomolar level as well as high selectivity in the presence of other phosphates, the emitted light is typically restricted to the visible ( ) or at best NIR-I window . In recent years, in vivo imaging within the NIR-II has emerged as a method that benefits from ultralow light scattering and deeper penetration through biological tissues . Various NIR-II fluorescent probes have been developed, including organic dyes , gold nanoclusters , quantum dots and lanthanide nanocrystals . However, they often suffer from limited biocompatibility due to the presence of toxic transition metals (e.g., ) or limited stability due to photobleaching .
Here, we introduce the direct and quantitative detection of with tailored -functionalized SWNTs as fluorescent probes in the NIR-II window. Sorted SWNTs are functionalized with luminescent defects bearing an alkyne moiety and exhibit a high sensitivity towards the presence of ions, resulting in strong quenching of the and emission. The quenching effect is reversed by the addition of copper-complexing analytes such as , which can be monitored
quantitatively by several different spectroscopic metrics. The intensity ratio of the defect-induced emission to the emission enables ratiometric and thus the most robust detection of . After exploring the PL quenching and thus detection mechanism, we show that biocompatible, phospholipid-polyethylene glycol-stabilized SWNTs with defects can be used for reliable quantification even in complex biological media (e.g., cell lysate) and for fast optical detection of released during DNA synthesis in a polymerase chain reaction (PCR) as a potential application.
Results
-functionalization of SWNTs and fluorescent probe design
To create -functionalized SWNTs capable of detecting SWNTs were sorted via aqueous two-phase extraction (ATPE) and transferred into an aqueous dispersion with the surfactant sodium dodecyl sulfate (SDS) as reported previously . Subsequently, the nanotubes were -functionalized by the addition of appropriate aliquots of 4-ethynylbenzene diazonium tetrafluoroborate and stored for 7 days under the exclusion of light to ensure full decomposition of the diazonium salt (see Methods for details). PL spectra of the obtained covalently functionalized (6,5) SWNTs with 4-ethynylbenzene moieties (referred to as Dz-alkyne) displayed a red-shifted defect-induced emission feature ( ) around 1135 nm in addition to the original emission at 988 nm (see Fig. 1). A 1:1 mixture of copper (II) sulfate pentahydrate and tris(3-hydroxypropyl-triazolylmethyl) amine (THPTA) was added to the dispersion of functionalized SWNTs. and THPTA form a well-defined -complex (from here on labeled as ) that is frequently used in organic chemistry . Upon addition of , both the and emission greatly decreased and the emission peaks red-shifted by 7 and 5 nm , respectively (Fig. 1c). Importantly, the emission was reduced more strongly, which led to an overall decrease of the PL intensity ratio (see Supplementary Fig. 1). PL quenching was observed at concentrations of above and became stronger with increasing concentrations of until and PL reached a stable level for concentrations of . Similar behavior for the induced quenching of nanotube fluorescence was previously observed by Wulf et al., yet no red-shift in peak position was reported in that study . For high concentrations (e.g., ) the peak intensity decreased by a factor of while the peak intensity decreased by a factor of . In subsequent experiments, of was used if not stated otherwise. This way, a strong PL quenching effect could be observed while keeping the concentration as low as possible.
To investigate the origin of the quenching process, ethylenediaminetetraacetic acid (EDTA), a strong metal-chelating ligand, was added to the SWNT dispersion. The initially induced attenuation of PL intensity and shift of the PL peak position were immediately reversed and the optical properties of the functionalized SWNTs were recovered (see Supplementary Fig. 2). Hence, we can assume that ions do not lead to permanent but to reversible changes of the luminescent properties of SWNTs when present in their direct environment. The quenching mechanism will be discussed in more detail later. Importantly, this reversible quenching process is the basis for applying -functionalized SWNTs as luminescent probes for biorelevant and strongly copper-complexing molecules such as . The corresponding detection scheme is outlined in Fig. 1a. Upon addition of , the SWNT fluorescent probe goes into an off state and exhibits significantly reduced PL intensities as well as red-shifted peak positions. Identical to the observed effect with EDTA, the addition of leads to a full recovery of the initial emission properties and the probe returns to its on state (see Fig. 1d).
Quantitative detection of
To further explore the properties of functionalized SWNTs as nearinfrared fluorescent probes, quantitative detection of was tested.
Fig. 1 | Design strategy for detection of with -functionalized SWNTs. a Dz-alkyne-functionalized SWNTs dispersed with SDS (ionic headgroups are indicated in green) display a high sensitivity towards the presence of a THPTA complex ( ); strong quenching of the and defect-induced emission occurs. This effect is reversed upon addition
of (blue semicircle). PL spectrum of Dz-alkyne. PL spectra before (black) and after addition of { Cu } (red). d PL spectra before (red) and after addition of (blue). The yellow lightbulb indicates bright emission at the corresponding step in the detection scheme. Source data are provided as a Source Data file. of were added to a dispersion of 4-ethynyl benzene functionalized SWNTs and PL spectra were recorded after adjusting different concentrations of and 15 min of incubation time (Fig. 2a-c). A calibration curve for the quantification of in aqueous solution was obtained as the and emission gradually recovered for concentrations between (see Fig. 2d). For higher concentrations of , the and emission decreased again. We assume that the drop in PL intensity at higher concentrations of is caused by aggregation of SWNTs as it was also observed when no was present (see Supplementary Fig. 3 and Supplementary Note 1). This does not affect the use of this sensor because these concentrations are much higher than in typical biological systems. Importantly, the peak intensity ratio also increased for increasing concentrations and remained stable even at high concentrations (see Fig. 2b, e). Thus, the peak intensity ratio is a more reliable detection metric as it is less influenced by aggregation effects. In addition to the peak intensity ratio, the PL area ratio also represents a suitable metric and shows nearly identical trends (see Supplementary Fig. 4a). The defect emission of functionalized SWNTs and its different sensitivity to their environment enable ratiometric detection, which is generally more reproducible and selective than absolute intensity measurements.
Finally, we tested the suitability of the (see Fig. 2c, f) and (Supplementary Fig. 4b, c) peak positions as quantitative metrics. Again, the induced red-shift upon addition of { Cu continuously decreased and correlated directly with the concentration of added . All of these metrics showed a good correlation with the concentration for a wide detection window from , thus confirming their capability to quantify the concentration of in aqueous media with Dz-alkyne functionalized SWNTs as NIR-II fluorescent probes.
Selectivity of -functionalized SWNT probes
Due to the complex composition of biological environments, high selectivity is important for any sensor in addition to sensitivity. To explore the selectivity of functionalized SWNTs as fluorescent probes for , they were quenched by of and PL spectra were recorded after the addition of 1 mM of potentially interfering analytes. Note that the concentrations of the tested molecules and anions are typically much lower in biologically relevant systems. Figure shows the extracted PL intensity ratios and normalized intensities after the addition of , acetate ( ), , , citrate, ADP, ATP, or as well as L-cysteine. All normalized and absolute PL spectra including the extracted peak positions and optical trap depths are shown and listed in the Supplementary Information (Supplementary Fig. 5 and Supplementary Table 1).
The tested anions can be broadly categorized into weak coppercomplexing and strong copper-complexing small molecules. For all analytes, for which weak coordination to ions is expected ( , ), only minor changes of the PL intensity ratio and the intensity were observed. In clear contrast to that, molecules that are known to strongly coordinate to ions ( , citrate, ADP, ATP, , L-cysteine) showed a significant increase in the PL intensity ratio. This trend was also valid for changes in the intensity, although much less pronounced. In all cases, the responses of the PL intensity ratio and intensity were still strongest for . Thus, while it may not be possible to detect low concentrations of with high selectivity in the presence of other -complexing analytes, it should be possible to detect dynamic changes of the relevant concentration levels of .
The concentrations of and ATP are closely correlated in living cells because is a side-product of the hydrolysis of ATP. To investigate the possibility of tracking this hydrolysis reaction, we added
Fig. 2 | Detection of with -functionalized SWNTs. a, b Absolute PL spectra (a) and PL spectra normalized to of Dz-alkyne (blue) alone and after the addition of , yellow) and various concentrations of . c Zoom-in on the normalized peak position. PL intensity ( ), PL intensity ratio
(e) and peak position (f) versus concentration of . The initial PL intensity, PL intensity ratio, and peak position of Dz-alkyne before and after the addition of {Cu} are indicated by blue and yellow dashed lines, respectively. Source data are provided as a Source Data file.
mixtures of ATP and with a fixed overall concentration to a dispersion of functionalized SWNTs that had been previously quenched with . Figure 3c shows the recorded PL spectra before and after the addition of two different ATP: mixtures ( and ) with a total concentration of 1 mM . While both ATP and are expected to lead to a response by the SWNT sensor, a large concentration of resulted in a significantly higher PL intensity ratio than a large ATP concentration. It shows that there is selectivity, however, in mixed samples only the overall concentration of similar molecules can be measured. Similar results were observed for measurements with total analyte concentrations of 0.5 mM and 4.0 mM (see Supplementary Fig. 6). Furthermore, the peak position was redshifted by 2 nm for higher relative concentrations of . Note that this shift is opposite to the expected trend of an increasing blue-shift of the peak position for higher PL intensity ratios. We assume that the changes in peak positions are unique for each analyte and may offer additional parameters for identification.
In summary, -functionalized SWNTs can be used as fluorescent probes to detect mixing ratios for ATP and . Hence, the hydrolysis of ATP could be followed in real-time by observing changes in the PL intensity ratios as well as shifts in the peak position. However, to develop more selective fluorescent probes, it is essential to understand the cause of PL quenching and recovery and the origin of the partial selectivity of -functionalized SWNTs toward .
PL quenching and sensing mechanism
We have demonstrated PL quenching of -functionalized SWNTs by and the resulting detection capabilities. However, we have not yet discussed the role of the ligand THPTA or the attached 4-ethynylbenzene moiety for sensing. THPTA can be expected to have
a major impact on the detection as it also forms complexes with ions. The ligand itself has no effect on the emission of functionalized SWNTs even at high concentrations ( , see Supplementary Fig. 7). Thus, all PL changes (mainly quenching) can be attributed to the ions. However, when ions are added directly to functionalized SWNTs as a solution of without THPTA, only moderate PL quenching was observed (see Fig. 4a). Much stronger quenching takes place when THPTA is also present. This enhancement can be explained with a higher effective concentration of ions in close proximity to the SWNT surface when complexed by THPTA. The triazole THPTA strongly adsorbs to graphene and SWNTs via interactions . A strong adsorption of the /THPTA complex (i.e., ) to the SWNT surface brings ions in much closer and direct contact with the SWNTs.
The direct contact of ions with the SWNT lattice or defect site further leads to red-shifts of the and emission. We presume these wavelength shifts to be caused by an increase in solvent polarity close to the SWNT surface or local changes in SWNT solvation due to the additional hydration shell around the adsorbed ions. Similar solvatochromic shifts of SWNTs were described by Larsen et al. and Shiraki et al. for functionalized SWNTs .
Overall, stronger PL quenching and shifts of the emission peak positions can be observed for samples with THPTA compared to samples without it. When is added, the /THPTA complex dissociates and a more stable complex is formed. The competitive complexation of the ions by THPTA and can be monitored by absorption spectroscopy due to the strong change in THPTA absorption upon complexation/decomplexation and further compared to changes in the intensity ratio of the SWNT probe (see Supplementary Fig. 8 and Supplementary Note 2). The dissociation
Fig. 3 | Sensor response in the presence of other copper-complexing analytes. Response of PL intensity ratio (a) and normalized intensity (b) of Dzalknye with complex in the presence of various weakly or strongly coppercomplexing analytes (concentration 1 mM , single measurements, ). Note that
the concentrations of the interfering analytes are much higher than one would expect in realistic analytical assays. PL spectra after the addition of different ratios of ATP and with a total analyte concentration of 1 mM . Source data are provided as a Source Data file.
Fig. 4 | Investigation of quenching mechanism. a PL spectra of Dz-alkyne before and after the addition of or THPTA . b Normalized PL spectra before and after addition of for different concentrations of THPTA at a fixed concentration of ( ) corresponding to ratios of 1:1, 1:2 and 1:5. c Normalized PL spectra of 4-ethynylbenzene and benzene-functionalized SWNTs after the addition of TCSPC histogram of the PL decay after addition of different concentrations of . e Extracted amplitude averaged (Amp-avg.) lifetimes of
emission from biexponential fits vs. concentration of . Initial values before and after addition of are indicated by blue and yellow dashed lines, respectively. Schematic presentation of the proposed adsorption and quenching mechanism. ions are immobilized due to strong interactions of the triazole ligand (L = THPTA) with the SWNT sidewall, which is further facilitated by weak coordination to the ethynyl groups. After exciton formation and diffusion to defect sites, excitons are quenched by fast electron transfer (red arrow) to the metal center.
constant for the /THPTA complex on the SWNT surface is 25 times higher than that of the free complex, indicating that the complex formation is weakened due to steric shielding of the center by adsorption to the SWNT surface.
Based on this concept, the selectivity of the fluorescent SWNT probes toward different analytes (see above) can be rationalized by competitive complexation of ions by THPTA and the analyte. Upon complexation of ions by an analyte, they are removed from
the direct environment of the SWNT and the defect. Thus, the original PL is recovered. When sensing is performed at higher THPTA concentrations, the response is markedly lower as the complexation equilibrium is shifted towards the /THPTA complex formation (see Fig. 4b). Consequently, sensitivity and selectivity should be tunable by ligand choice and concentration, creating perspectives for tailoring SWNT fluorescent probes with higher selectivity towards specific analytes. Future work should focus on the design of ligand systems that show a strong physisorption to the SWNT surface and suitable complexation strength with compared to, for example, . The triazole complex is a good starting point as it shows strong adsorption, good selectivity toward phosphates and was previously used to design molecular sensors .
As the adsorption of ions on the SWNT surface clearly plays a key role in the PL quenching process, SWNTs may also be functionalized with other moieties such as simple benzene groups instead of 4-ethynylbenzene. However, PL quenching was found to be significantly stronger for 4-ethynylbenzene-functionalized SWNTs at lower concentrations of (see Fig. 4c and Supplementary Fig. 9). Presumably the additional weak coordination of copper ions to alkyne groups further enhances their interaction with the SWNT. This notion is corroborated by the observed quenching behavior of the emission, which is similar for pristine and benzene-functionalized SWNTs, but enhanced for 4 -ethynylbenzene-functionalized SWNTs (see Supplementary Fig. 10 and Supplementary Note 3). This dependence on functionalization highlights that while the presented detection scheme could be transferred to SWNTs with different functional groups, the effect is stronger with the ethynyl moiety. However, the type of alkyne moiety can be varied. For instance, the functionalization of SWNT with 2-ethynylbenzene, leads to another further redshifted defect-emission band located around 1242 nm as previously shown by Yu et al. . Nanotubes that were functionalized in this way also showed and responsiveness but with emission even further in the NIRII (see Supplementary Fig. 11 and Supplementary Table 2).
The adsorption of on the SWNT surface evidently causes PL quenching, which is recovered when analytes are added that form stable complexes with , however, the underlying cause for the initial quenching is still an open question. UV-Vis-NIR absorption spectra of functionalized SWNTs recorded before and after the addition of { Cu } reveal only a 5 nm red-shift of the transition (see Supplementary Fig. 12) and no bleaching. While aggregation or bundling of SWNTs would lead to a similar shift, we can exclude this explanation due to the full reversibility of the quenching process.
To investigate the possibility of the formation of non-emissive SWNT- ground-state complexes, PL decays of the defect-state were recorded by time-correlated single-photon counting (TCSPC) after the addition of and at different concentrations of (see Fig. 4d). Note that the fast PL decay could not be resolved (see instrument response function, IRF) and will not be considered here. The defect-state emission typically shows a biexponential decay. The short and long lifetime components can be averaged according to the weights of their normalized amplitudes . The obtained amplitudeaveraged lifetimes ( .) depending on the added followed by can be used to distinguish between quenching due to additional non-radiative decay paths or ground-state quenching.
Upon addition of the amplitude-averaged lifetime decreases from 151 to 79 ps by a factor of 1.9, which is in good agreement with the 2.3 -fold reduction of the integrated intensity ratio (see Table 1). This correlation of lifetime and quenching factor remains valid upon the addition of and the initial lifetime is restored for high concentrations of (see Fig. 4e; for full data set see Supplementary Fig. 13 and Supplementary Table 3). Hence, the reduction of the emission should be mainly due to additional nonradiative decay paths and not connected to the formation of a nonemissive ground state complex, which would have no impact on the PL
Table 1 | Extracted PL lifetimes and quenching factors
Sample
QF( )
Area ratio
QF
Dz-alkyne
151
–
3.47
–
79
1.91
1.54
2.25
125
1.21
2.48
1.40
145
1.04
3.27
1.06
Extracted and * PL area ratios with corresponding quenching factors (QF). For full data set see Supplementary Table 3.
lifetime. The robust correlation of the lifetime and concentration may even enable the implementation of functionalized SWNTs as probes for next-generation fluorescence-lifetime imaging microscopy in the near-infrared .
Quenching of fluorophores by ions is most commonly attributed to either their paramagnetic properties or fast electron transfer to the metal center. Paramagnetic effects are unlikely to cause the observed quenching as no correlation with the magnetic moment was found for PL quenching with other paramagnetic ions such as and (see Supplementary Fig. 14). This absence of paramagnetic effects is in agreement with previous studies by Brege et al. . Consequently, we suggest that fast photoinduced electron transfer (PET) is the primary cause for the observed PL quenching. This attribution is supported by the estimated Gibbs free energy for PET in this system, confirming that electron transfer is thermodynamically favorable (see Supplementary Note 4) .
Figure 4 f provides an overview of the proposed adsorption and PL quenching mechanism. The stronger quenching effect of ions on the emission can be rationalized by the coordination of to the ethynyl groups close to the defects and the longer lifetime of defect-localized excitons and hence more likely PET compared to excitons with only ps lifetimes. Further studies of the influence of the defect density of functionalized SWNTs on the sensitivity toward {Cu} and revealed that while the quenching factor of the intensity ratio is largely unaffected by the defect density, the highest sensitivity for detection is obtained at low defect densities (see Supplementary Fig. 15 and Supplementary Note 5 for further discussion). These insights into the underlying PL quenching by ions and sensing mechanism by -functionalized SWNTs can be used to further optimize detection schemes for specific analytes by metaldisplacement fluorescent probes.
Detection of in biological environments
All of the previous experiments were performed with SDS-dispersed SWNTs, which are not biocompatible due to the required excess surfactant. To achieve biocompatibility and enable detection in biological environments, the SDS surfactant of the functionalized SWNTs was replaced with phospholipid-polyethylene glycol (PL ) as previously reported by Welsher et al. (for details see Methods). Successful surfactant exchange was confirmed by absorption and PL spectroscopy. In agreement with previous reports , a 6 nm red-shift of the transition was observed while all other spectroscopic features remained the same (see Supplementary Fig. 16). Again, was added to -coated and -functionalized SWNTs. After 15 min of incubation the dispersion was spin-filtered (cutoff of ) and re-dispersed in 10 mM EDTA-free MOPS buffer. Excess was removed by the filtration step while physisorbed was expected to remain on the SWNT surface. After dilution to a concentration corresponding to an absorbance of 0.1 at the transition ( 1 cm path length), PL spectra were recorded and are shown in Fig. 5a, b. The total PL quenching was reduced compared to SDSdispersed SWNTs. This change might be attributed to the different coverage of the SWNT sidewalls by PL-PEG compared to SDS. The polymeric PL-PEG was previously estimated to cover the SWNT
Fig. 5 | Detection of in surfactant-free biological buffer. a, Absolute (a) and normalized (b) PL spectra of Dz-alkyne-functionalized SWNTs dispersed in PLPEG and 10 mM MOPS buffer after addition of and various concentrations of . concentration-dependent changes of the intensity with as the intensity and as intensity after addition of including Hill function fit to the data (red line). PP concentration-dependent changes of the intensity ratio with IR as the intensity ratio and IR being the intensity ratio after addition of including Hill function fit to the data (red line). The coefficient of determination ( ) and values of the fits are given in the respective
plots. e, f Absolute (e) and normalized (f) PL spectra before and after the addition of and addition of cell-lysate, which was subsequently spiked with . PL spectra in (e) and (f) were recorded at lower SWNT concentrations resulting in higher sensitivity upon addition of . Wavelength scales are different due to the use of a different spectrometer and diffraction grating (see Methods). Additional peak broadening of the emission may originate from functionalization at a higher diazonium salt concentration, yielding more red-shifted emission bands . Source data are provided as a Source Data file.
surface more completely than short SDS molecules, which should reduce interaction with and hence quenching by adsorbed . A similar effect can be observed for DOC-coated and functionalized SWNTs, for which almost no PL quenching occurs after the addition of ions, most likely due to the dense packing of DOC on the surface (see Supplementary Fig. 17) .
While the response toward ions was reduced by PL-PEG , the sensor remained fully operational and showed good sensitivity towards the presence of . Furthermore, the PL-PEG -dispersed SWNTs showed no aggregation effects even at high concentrations of (see Supplementary Fig. 18). Figure 5c, d displays the concentration-dependent PL response of the emission and corresponding PL intensity ratios fitted with a Hill function :
where is the concentration, is the dissociation constant and the Hill coefficient (for response of emission, PL area ratios and peak positions see Supplementary Fig. 19).
To confirm the reproducibility of this sensor, we performed additional concentration-dependent PL measurements using SWNTs functionalized with a higher -defect density (see Supplementary Figs. 20, 21). Again, a similar concentration-dependent fluorescence response can be observed and the absolute PL intensity and PL intensity ratios appear to be equally suited to detect . However, the
concentration-dependent absolute PL intensities and peak positions of both batches of functionalized SWNTs display significant deviation. In contrast to that, nearly identical response curves are obtained when using the ratiometric approach by comparing the intensity ratios (see Supplementary Fig. 22).
The PL intensity ratios are clearly superior to absolute values and confirm that the developed ratiometric fluorescent sensor is robust and reproducible even between different nanotube batches with different degrees of functionalization. Corresponding values and Hill parameters for both defect densities can be found in Supplementary Table 4. We find a usable detection range from to of the maximum response of the PL intensity ratios of the biocompatible SWNT-probes in buffer for a concentration from 17 to . This range depends to some degree on the SWNT concentration and could be adjusted with respect to signal-to-noise ratio and application.
The limit of detection (LOD) was determined to be for the PL intensity ratios ( and for and intensity, respectively, see Supplementary Fig. 23 and Supplementary Note 6). Many clinical conditions that cause increased levels of in urine, intracellular mitochondrial or synovial fluids could be traced within this detection range. For example, patients with hypophosphatasia show increased levels of with concentrations between and in plasma and in urine .
As for most fluorescent sensors, calibration curves must be obtained to correctly quantify concentrations based on the intensity ratios for specific biological environments. Metrics that are
Fig. 6 | Monitoring PCR cycles by detecting released . a Concept for measuring PCR cycles by detecting the released with the SWNT-sensor. The DNA backbone is presented in blue, the DNA primer is presented in yellow. Nucleobases are shown as magenta (A, adenine), dark blue (G, guanine), purple (C, cytosine) and turquoise (T, thymine) squares. Released originating from dNPTs (here dATP) is shown in red. Normalized and averaged (3 measurements) PL spectra of Dzalkyne dispersed with PL-PEG and treated with after addition of of PCR product after 0,12 , and 24 cycles. c Measured PL intensity ratios after
the addition of of PCR product after 0,12 , and 24 cycles. One biologically independent sample was examined over independent measurements with the SWNT sensor, and should represent the spread in the response of the sensor. The height of the bar represents the average of the three measurements. Gelelectrophoresis of PCR products after 0,12 , and 24 cycles, M-DNA marker with length of DNA fragments in kilo-base-pair (kbp). Source data are provided as a Source Data file.
more sensitive toward the dielectric environment of SWNTs such as absolute PL intensities and PL peak positions will require even more advanced adjustments. A previously reported NIR-II fluorescent sensor for based on lanthanide nanoparticles showed similar sensitivity and higher selectivity toward but lacked the advantage of internal calibration and multimodal sensing enabled by Dz-alkyne functionalized SWNTs .
To explore the potential of this fluorescent sensor in a biological environment, we cultured HEK cells and carefully performed a washing step to remove the phosphate-containing growth medium before the cells were lysed. Upon addition of cell lysate to the quenched SWNT sensor and subsequent spiking with , a clear increase in PL intensity (see Fig. 5e), a change in the PL intensity ratio (see Fig. 5f) and PL peak position (see Supplementary Fig. 24) occurred. It should be noted, that under the given conditions a small increase in intensity and intensity ratio were already observed for unspiked lysate. This offset was expected, because significant amounts of phosphate and were already present for the chosen lysate concentration . Overall, PL-PEG -coated and functionalized SWNTs can be used as NIR-II fluorescent probes under biological conditions and in complex media. Hence, they should be suitable as a bioanalytical tool.
Detection of released from PCR
Finally, the developed SWNT sensor was used to measure the that is released during DNA strand synthesis by PCR to enable online
monitoring. In a PCR (see Fig. 6a), exponential duplication of a template DNA is achieved and is released from deoxynucleoside triphosphates (dNPTs) when DNA synthesis takes place by DNA polymerase. To track the released during the amplification process, it is important to detect small amounts of in the presence of structurally similar dNPTs, DNA polymerase enzyme, DNA template (plasmid), and DNA oligos, which are used as primers and PCR buffer.
To test the sensor in such a complex system, PCR was performed with 0,12 , and 24 cycles and of the final PCR product was added to a -quenched -coated and -functionalized SWNT dispersion. As expected, a slight response was already observed for zero cycles due to the high concentration of dNPTs. A different response was evident after the addition of PCR product, when PCR was performed for 12 and 24 cycles (see Fig. 6b). An increase of the PL intensity ratio occurred immediately and no incubation time was required.
It should be noted that in the presented case the conversion of dNPTs to is detected by the SWNT sensor not the absolute concentration. This type of response has several implications. Compared to the previous data, where PL spectra were collected upon the addition of , the expected shifts in peak position have changed. This effect was already apparent for different mixing ratios of and ATP (see Fig. 3 and Supplementary Fig. 6). Due to the structural similarity of dNPTs to ATP we expect a similar behavior. The conversion of dNPTs to results in a red-shift of the and emission in contrast to the usually observed blue-shift (see Supplementary Fig. 25). Moreover, the
sensitivity range of the SWNT sensor is expected to increase. The conversion of dNPTs to leads to a lower response in comparison to the direct addition of , thus allowing the sensor to track changes in concentration over a larger concentration window. Nevertheless, the response resulting from the dNPTs to conversion should still scale logarithmically. As the release of by PCR and the response of the sensor both increase on a logarithmic scale, a linear correlation between the PL intensity ratio and the number of PCR cycles (12 and 24) is expected and is indeed observed (see Fig. 6c). A similar trend can be found for the absolute intensity and PL area ratio (see Supplementary Fig. 25). Gel-electrophoresis revealed the successful amplification of the parent DNA of the same molecular weight (see Fig. 6d) and the band intensity of the visualized DNA products matches the observed trend for the PL intensity ratios. In summary, the developed fluorescent SWNT-sensor for could be used as an alternative and instant probe to track DNA amplification during PCR in real-time over a large detection range in contrast to other time-consuming detection schemes such as gel-electrophoresis.
Discussion
In summary, we have designed and presented -functionalized SWNTs with well-defined emission features in the NIR-II for the ratiometric optical detection of in biological environments. The sensing scheme relies on the recovery of the near-infrared fluorescence of the nanotubes by copper ion displacement. The emission of covalently functionalized SWNTs is quenched through photoinduced electron transfer to ions that are immobilized on the SWNT surface by a triazole ligand and additional weak coordination to the covalently attached alkyne moieties. PL quenching is more pronounced for the defect-related emission than for the emission and leads to corresponding changes in the intensity ratio in addition to the peak positions. The removal of from the SWNT surface by results in a restoration of the emission properties depending on the absolute concentration of , which enables a robust ratiometric detection scheme. While other strongly copper-complexing analytes (e.g., ATP) also cause a fluorescence response, the relative differences can be used to track biologically relevant processes. In comparison to other multi-signal sensors based on mixed chiralities of SWNTs, the emission features of monochiral SWNTs are narrow, occur from the same species and thus offers a more reliable optical readout. The observed changes in relative and absolute PL intensities including analyte-dependent shifts in the and peak positions may also be used for detection schemes based on machine-learning algorithms.
Mechanistic studies indicate that the efficiency of PL quenching by depends on the type of functional moiety attached to the defects (here an aryl alkyne) and the ligand system (here a triazole with strong interactions) that coordinate the cupric ions close to the SWNT surface and enable fast photoinduced electron transfer. These insights will facilitate the design of ligand systems and metal-ion immobilization strategies for the development of optical sensors based on -functionalized SWNTs.
The current sensor design causes an irreversible change in fluorescence in the presence of , which is a universal feature of metaldisplacement assays. In this detection scheme reversibility might only be achievable by the addition of new ions or a new immobilization strategy where complexation by only impacts its distance to the SWNT surface and thus degree of PL quenching. Yet, irreversibility represents an advantage in assays that are supposed to provide robust and quantitative information at specific time points.
Importantly, the demonstrated SWNT fluorescent sensor remains fully operational with a detection window over two orders of magnitude when made biocompatible by coating with phospholipidpolyethylene glycol. It can be applied for the detection of in lysate with high cell count and for the instant fluorescent detection of released during DNA synthesis in PCR with potential applications in PCR quality control. Due to its internal calibration and multiple sensing parameters, this detection scheme greatly expands the currently available methods for the detection of biomarkers in the NIR-II and opens the path towards in vivo detection of with low background noise. Overall, the covalent functionalization of SWNTs with defects provides additional fluorescence features and specific functional groups for selective and reliable optical (bio)sensing.
Methods
Materials
The following reagents were purchased from Sigma-Aldrich: nickel(II) sulfate hexahydrate ( ), cobalt(II) sulfate heptahydrate ( ), adenosine 5 ‘-diphosphat sodium salt (ADP, , bacterial, HPLC), sodium carbonate ( ), potassium acetate ( ), potassium nitrate ( ), potassium iodide ( ), calcium dichloride hexahydrate (98%), sodium citrate tribasic dihydrate, L-cysteine (97%), ethylenediaminetetraacetic acid tetrasodium salt hydrate (EDTA), sodium pyrophosphate (98%), DOC (BioXtra, ), SDS ( ), sodium cholate (SC, ), sodium hypochlorite (NaClO, active chlorine), tetrafluoroboronic acid (48 wt.%), tert-butyl nitrite (90%), 4-ethynylaniline ( ), 2-ethynylaniline ( ), aniline ( ), . The following reagents were purchased from TCI: adenosine 5′-triphosphate disodium hydrate (ATP, >98%, HPLC), dextran ( ), THPTA ( ). Poly(ethylene glycol) (PEG, ) was purchased from Alfa Aesar. PL-PEG (18:0 PEG5000PE, 1,2-distearoyl-sn-glycero-3-phosphoethanolamine- [methoxy(polyethylene glycol)-5000], ) was purchased from Avanti Polar Lipids, Inc.
Preparation of SWNT dispersions
Dispersions of monochiral SWNTs were prepared from CoMoCAT raw material (CHASM SG65i-L58) by ATPE . ATPE was performed in a two-phase system composed of dextran and PEG. SWNTs were separated in a diameter sorting protocol with DOC and SDS. At a fixed DOC concentration of , the SDS concentration was increased to to push all species with diameters larger than SWNTs into the top phase for extraction. Then the SDS concentration was increased from to and all SWNT enriched phases were collected. Separation of metallic and semiconducting SWNTs was achieved by further addition of SC and NaOCl as an oxidant. The selected SWNTs were concentrated in a pressurized ultrafiltration stirred cell (Millipore) with a cut-off membrane and adjusted to SDS for further functionalization.
Characterization methods
Absorption spectra with baseline correction were acquired with a Cary 6000 i UV-VIS-NIR spectrophotometer (Varian, Inc.). PL spectra were measured at low excitation densities at the transition either with the unfocused wavelength-filtered output of a ps-pulsed supercontinuum laser (NKT Photonics SuperK Extreme) or a 450 W Xe arc lamp and recorded using an Acton SpectraPro SP2358 spectrograph (grating blaze lines ) and a liquid nitrogen-cooled InGaAs line camera (Princeton Instruments, OMA-V:1024) or a Fluorolog spectrofluorometer (HORIBA) equipped with a liquid nitrogencooled InGaAs line camera. For spiking and PCR experiments, PL spectra were measured under excitation with a 561 nm laser at 100 mW (Gem 561, Laser Quantum) and recorded with 4 s integration time using a spectrometer (Shamrock 193i, Andor Technology Ltd.) coupled to a microscope (IX73, Olympus). PL lifetimes of luminescent defect states were measured and analyzed in a time-correlated single photon counting scheme . Briefly, functionalized SWNTs were excited at the transition with a ps-pulsed supercontinuum laser (NKT Photonics SuperK Extreme) and the spectrally filtered emission was focused onto a gated InGaAs/InP avalanche photodiode (Micro Photon
Devices) with read-out by a PicoHarp 300 photon counting module (PicoQuant). Raman spectra were recorded with a Renishaw inVia Reflex confocal Raman microscope. Dispersions of SWNTs were dropcast on glass substrates and rinsed carefully with ultra-pure water. A 532 nm laser was used for excitation and more than 1000 spectra were collected and averaged. Spectra were manually baseline-corrected by fitting a smooth cubic spline curve through points where only background noise was expected.
Synthesis of arenediazonium tetrafluoroborates
Ethynyl benzene and benzene diazonium salts were synthesized from the corresponding anilines (see also Supplementary Fig. 26) . In a 25 mL flask, the aniline ( 0.85 mmol ) was dissolved in acetonitrile ( 2 mL ) and an aqueous solution of tetrafluoroboronic acid ( , 2.0 eq.) was added. The solution was cooled to in an ice/water bath and tert-butyl nitrite ( eq.) was added dropwise. The mixture was stirred at for 30 min and diethyl ether ( 10 mL ) was added to precipitate the arenediazonium tetrafluoroborate. The obtained solid was filtered off, washed with cold diethylether ( 10 mL ) and recrystallized from acetone. The arenediazonium tetrafluoroborate was dried in vacuo for 1 h . 4-ethynylbenzene diazonium tetrafluoroborate was synthesized starting from 4-ethynylaniline. The diazonium product was recovered as a crystalline colorless powder ( ). 2-ethynylbenzene diazonium tetrafluoroborate was synthesized starting from 2-ethynylaniline. The diazonium product was recovered as a crystalline colorless powder ( ). Benzene diazonium tetrafluoroborate was synthesized starting from aniline. The diazonium product was recovered as a crystalline colorless powder ( ). Successful synthesis was confirmed with nuclear magnetic resonance spectroscopy (NMR, see Supplementary Note 7). The obtained diazonium salts were stored at .
-functionalization protocol
For functionalization of SWNTs, the optical density of the aqueous dispersion was adjusted to at the transition with ultra-pure water. Stock solutions of the corresponding diazonium salts with a final concentration of were prepared and aliquots were added to the dispersion. Typically, reaction volumes of 315 mL and diazonium salt concentrations between 0.025 and were used. For the functionalization with 2-ethynyl benzene diazonium tetrafluoroborate a final concentration of of diazonium salt was used. All reaction mixtures were stored in the dark for 7 days. For pyrophosphate sensing with functionalized SWNTs with SDS surfactant, excess diazonium salt was removed via multiple spinfiltration steps (Amicon Ultra- ) and functionalized SWNTs were resuspended in SDS. All dispersions were sonicated for 15 min before further characterization.
Pyrophosphate sensing protocol
For sensing of pyrophosphates in dispersions of functionalized SWNTs with SDS surfactant, fresh stock solutions in ultra-pure water of and THPTA ( 12 mM ) were prepared and combined in a 1:1 ratio. Typically, (corresponding to a final concentration of the copper-complex of 15 mM ) were added to 1 mL of functionalized SWNT dispersion with an optical density of at the transition and incubated for 15 min .
For sensing of pyrophosphates with biocompatible SWNTs, dispersions of -functionalized SWNTs were mixed with PL such that the final concentration of PL-PEG was . The mixture was transferred to a dialysis bag (Spectra/Por , Spectrum Laboratories Inc.) and dialyzed for 7 days against ultra-pure water to remove SDS. The obtained dispersion was sonicated for 15 min yielding PL-PEG dispersed -functionalized SWNTs. 2 mL of dispersion were concentrated by spin-filtration (Amicon Ultra-4, ) to approximately . A stock solution of was mixed in a ratio with a stock solution of THPTA ( 60 mM ) and were added to the concentrated dispersion. After 15 min the mixture was diluted to 2 mL , filtered by spin-filtration (Amicon Ultra-4, ) and suspended in freshly prepared EDTAfree MOPS-buffer (Serva) solution ( pH 7.4 ). The SWNT dispersion was adjusted to an optical density of at the transition and aliquots of in ultra-pure water were added to adjust the final concentration of pyrophosphate. A schematic of the workflow can be found in Supplementary Fig. 27. For the detection of in spiked cell lysate and released in a PCR the SWNT dispersion was adjusted to an optical density of approximately at the transition in a final measurement volume of . SWNT concentrations down to (corresponding to an optical density of at the transition for SWNTs) were sufficient to achieve a high signal-to-noise ratio.
Preparation of cell cultures
HEK293 cells were purchased from DSMZ German Collection of Microorganisms and Cell Cultures (ACC 305) and cultivated according to the supplier’s protocol in a humidified atmosphere at in T-75 flasks (Sarstedt) with a sub-cultivation ratio of 1:5 every 3-4 days. Cells were grown in 16 mL DMEM (Thermo Fisher Scientific) supplemented with fetal bovine serum (FBS) ( ), penicillin ( 100 units ), and streptomycin ( , Thermo Fisher Scientific). Cells were seeded in 100 mm dishes (Sarstedt) at a density of cells and grown for 4 days until confluency. Prior to cell harvest, the cultivation media was removed and cells were carefully washed twice with ultrapure water. Cells were harvested by scraping in ultra-pure water, immediately transferred to 1.5 mL Eppendorf cups and shock frozen in liquid nitrogen. Lysis was performed by pulsed sonication ( 1 s on off) at amplitude for 2 min (Qsonica Model Q700 with cuphorn attachment), followed by centrifugation at for 2 min to remove cell debris and large particles. The supernatant was used for further experiments.
PCR reaction
All constructs created in this study were generated by standard PCR techniques. PCR reaction mix was assembled on ice in a total volume of . The PCR reaction formulation was according to the Q5 HighFidelity DNA polymerase manufacturer’s (New England BioLabs, M0491S) instructions with final concentration of dNTPs ( 10 mM dNTP mix, Promega, U1511) and of each forward (T7profwd TAATACGACTCACTATAGGGG) and reverse (T7term-rev TGCTAGTTATTGCTCAGCGG) primer (Eurofins Genomics). 150 ng of pET27b(+) vector with E. coli ompc gene served as template DNA. The mastermix was split into three individual sets and went through PCR cycling in an Eppendorf Mastercycler for 12 cycles, 24 cycles, or kept on ice, respectively. PCR program was a standard program with initial denaturation at for 30 s , followed by 30 s annealing at and elongation at for 35 s for the aforementioned 12 or 24 cycles. PCR reactions were analyzed by gel electrophoresis for 45 min ) on a agarose TAE gel containing 1X GelRed (Biotium, 41003-T) and visualized under ultraviolet light by Bio-Rad ChemiDoc Gel Imaging System.
Reporting summary
Further information on research design is available in the Nature Portfolio Reporting Summary linked to this article.
Data availability
The datasets generated during and/or analyzed during the current study are available in the heiDATA repository (https://doi.org/10. 11588/data/UOE7KX) and from the corresponding authors upon request. Source data are provided with this paper.
References
Ackermann, J., Metternich, J. T., Herbertz, S. & Kruss, S. Biosensing with fluorescent carbon nanotubes. Angew. Chem. Int. Ed. 61, e202112372 (2022).
Balcı Leinen, M., Lindenthal, S., Heimfarth, D. & Zaumseil, J. Networks of as-dispersed, polymer-wrapped single-walled carbon nanotubes for selective and glyphosate sensing. Nanoscale 14, 13542-13550 (2022).
Barone, P. W., Baik, S., Heller, D. A. & Strano, M. S. Near-infrared optical sensors based on single-walled carbon nanotubes. Nat. Mater. 4, 86-92 (2005).
Kruss, S. et al. Carbon nanotubes as optical biomedical sensors. Adv. Drug Deliv. Rev. 65, 1933-1950 (2013).
Bachilo, S. M. et al. Structure-assigned optical spectra of singlewalled carbon nanotubes. Science 298, 2361-2366 (2002).
Galassi, T. V. et al. Long-term in vivo biocompatibility of singlewalled carbon nanotubes. PLoS ONE 15, e0226791 (2020).
Alidori, S. et al. Carbon nanotubes exhibit fibrillar pharmacology in primates. PLoS ONE 12, e0183902 (2017).
Welsher, K. et al. A route to brightly fluorescent carbon nanotubes for near-infrared imaging in mice. Nat. Nanotechnol. 4, 773-780 (2009).
Nissler, R. et al. Remote near infrared identification of pathogens with multiplexed nanosensors. Nat. Commun. 11, 5995 (2020).
Giraldo, J. P. et al. A ratiometric sensor using single chirality nearinfrared fluorescent carbon nanotubes: application to in vivo monitoring. Small 11, 3973-3984 (2015).
Flavel, B. S., Nambiar, M. & Shapter, J. G. Electrochemical detection of copper using a Gly-Gly-His modified carbon nanotube biosensor. Silicon 3, 163-171 (2011).
Bisker, G. et al. Protein-targeted corona phase molecular recognition. Nat. Commun. 7, 10241 (2016).
Kruss, S. et al. Neurotransmitter detection using corona phase molecular recognition on fluorescent single-walled carbon nanotube sensors. J. Am. Chem. Soc. 136, 713-724 (2014).
Nissler, R., Ackermann, J., Ma, C. & Kruss, S. Prospects of fluorescent single-chirality carbon nanotube-based biosensors. Anal. Chem. 94, 9941-9951 (2022).
Zaumseil, J. Luminescent defects in single-walled carbon nanotubes for applications. Adv. Opt. Mater. 10, 2101576 (2022).
Brozena, A. H., Kim, M., Powell, L. R. & Wang, Y. Controlling the optical properties of carbon nanotubes with organic colour-centre quantum defects. Nat. Rev. Chem. 3, 375-392 (2019).
Wang, H. & Boghossian, A. A. Covalent conjugation of proteins onto fluorescent single-walled carbon nanotubes for biological and medical applications. Mater. Adv. 4, 823-834 (2023).
Piao, Y. et al. Brightening of carbon nanotube photoluminescence through the incorporation of defects. Nat. Chem. 5, 840-845 (2013).
Berger, F. J. et al. Brightening of long, polymer-wrapped carbon nanotubes by functionalization in organic solvents. ACS Nano 13, 9259-9269 (2019).
Settele, S. et al. Synthetic control over the binding configuration of luminescent -defects in single-walled carbon nanotubes. Nat. Commun. 12, 2119 (2021).
Kim, M. et al. Detection of ovarian cancer via the spectral fingerprinting of quantum-defect-modified carbon nanotubes in serum by machine learning. Nat. Biomed. Eng. 6, 267-275 (2022).
Spreinat, A. et al. Quantum defects in fluorescent carbon nanotubes for sensing and mechanistic studies. J. Phys. Chem. C 125, 18341-18351 (2021).
Kim, M. et al. Nanosensor-based monitoring of autophagyassociated lysosomal acidification in vivo. Nat. Chem. Biol. 19, 1448-1457 (2023).
Mansurova, S. E. Inorganic pyrophosphate in mitochondrial metabolism. Biochim. Biophys. Acta-Bioenerg. 977, 237-247 (1989).
Nelson, D., Cox, M. & Hoskins, A. Lehninger Principles of Biochemistry 8 edn (Macmillan International, Higher Education, 2021).
Burke, C. R. & Luptak, A. DNA synthesis from diphosphate substrates by DNA polymerases. Proc. Natl. Acad. Sci. USA. 115, 980-985 (2018).
Xu, S. et al. A quantitative method to measure telomerase activity by bioluminescence connected with telomeric repeat amplification protocol. Anal. Biochem. 299, 188-193 (2001).
Wright, G. D. & Doherty, M. Calcium pyrophosphate crystal deposition is not always ‘wear and tear’ or aging. Ann. Rheum. Dis. 56, 586-588 (1997).
Rosenthal, A. K. & Ryan, L. M. Calcium pyrophosphate deposition disease. N. Engl. J. Med. 374, 2575-2584 (2016).
Kaur, J. & Singh, P. K. Nanomaterial based advancement in the inorganic pyrophosphate detection methods in the last decade: A review. Trends Anal. Chem. 146, 116483 (2022).
Anbu, S., Paul, A., Stasiuk, G. J. & Pombeiro, A. J. L. Recent developments in molecular sensor designs for inorganic pyrophosphate detection and biological imaging. Coord. Chem. Rev. 431, 213744 (2021).
Wongkongkatep, J., Ojida, A. & Hamachi, I. Fluorescence sensing of inorganic phosphate and pyrophosphate using small molecular sensors and their applications. Top. Curr. Chem. 375, 30 (2017).
Zhu, W. et al. A novel NIR fluorescent turn-on sensor for the detection of pyrophosphate anion in complete water system. Chem. Commun. 48, 1784-1786 (2012).
Hong, G., Antaris, A. L. & Dai, H. Near-infrared fluorophores for biomedical imaging. Nat. Biomed. Eng. 1, 0010 (2017).
Li, B., Lu, L., Zhao, M., Lei, Z. & Zhang, F. An efficient 1064 nm NIR-II excitation fluorescent molecular dye for deep-tissue high-resolution dynamic bioimaging. Angew. Chem. Int. Ed. 57, 7483-7487 (2018).
Antaris, A. L. et al. A small-molecule dye for NIR-II imaging. Nat. Mater. 15, 235-242 (2016).
Liu, Y. et al. A reversible NIR-II ratiometric fluorescent probe for realtime in vivo ATP detection. Adv. Opt. Mater. 2301144 (2023).
Chen, Y. et al. Shortwave infrared in vivo imaging with gold nanoclusters. Nano Lett. 17, 6330-6334 (2017).
Su, Y. et al. Sensing and imaging of in vivo using lanthanidebased second near-infrared luminescent probes. J. Mater. Chem. B. 10, 1055-1062 (2022).
Meng, X. et al. Recent advances in near-infrared-II fluorescence imaging for deep-tissue molecular analysis and cancer diagnosis. Small 18, e2202035 (2022).
He, H. et al. Ultrasmall quantum dots with uniform particle size and bright tunable fluorescence in the NIR-II window. Small 14, e1703296 (2018).
Kim, H. N., Ren, W. X., Kim, J. S. & Yoon, J. Fluorescent and colorimetric sensors for detection of lead, cadmium, and mercury ions. Chem. Soc. Rev. 41, 3210-3244 (2012).
Zhang, X. et al. Activatable NIR-II organic fluorescent probes for bioimaging. Theranostics 12, 3345-3371 (2022).
Sebastian, F. L. et al. Absolute quantification of defects in semiconducting single-wall carbon nanotubes by raman spectroscopy. J. Phys. Chem. Lett. 13, 3542-3548 (2022).
Chan, T. R., Hilgraf, R., Sharpless, K. B. & Fokin, V. V. Polytriazoles as copper(I)-stabilizing ligands in catalysis. Org. Lett. 6, 2853-2855 (2004).
Wulf, V. et al. Multicomponent system of single-walled carbon nanotubes functionalized with a melanin-inspired material for optical detection and scavenging of metals. Adv. Funct. Mater. 32, 2209688 (2022).
Wang, Z. et al. Graphene/ nanocomposite for effective removal of ten triazole fungicides from water solution: Tebuconazole as an example for investigation of the adsorption mechanism by experimental and molecular docking study. J. Taiwan Inst. Chem. Eng. 95, 635-642 (2019).
Léger, B. et al. Noncovalent functionalization of multiwall carbon nanotubes by methylated- -cyclodextrins modified by a triazole group. Chem. Commun. 46, 7382-7384 (2010).
Larsen, B. A. et al. Effect of solvent polarity and electrophilicity on quantum yields and solvatochromic shifts of single-walled carbon nanotube photoluminescence. J. Am. Chem. Soc. 134, 12485-12491 (2012).
Shiraki, T. et al. Solvatochromism of near infrared photoluminescence from doped sites of locally functionalized singlewalled carbon nanotubes. Chem. Commun. 55, 3662-3665 (2019).
Wu, J., Gao, Y., Lu, J., Hu, J. & Ju, Y. A steroid-coumarin conjugate for cascade recognition of copper ion and dihydrogen phosphate: Microstructural features and IMPLICATION logic gate properties. Sens. Actuators B: Chem. 206, 516-523 (2015).
Yu, B. et al. Ortho-substituted aryldiazonium design for the defect configuration-controlled photoluminescent functionalization of chiral single-walled carbon nanotubes. ACS Nano 16, 21452-21461 (2022).
He, X. et al. Solvent- and wavelength-dependent photoluminescence relaxation dynamics of carbon nanotube defect states. ACS Nano 12, 8060-8070 (2018).
Sistemich, L., Galonska, P., Stegemann, J., Ackermann, J. & Kruss, S. Near-infrared fluorescence lifetime imaging of biomolecules with carbon nanotubes. Angew. Chem. Int. Ed. 62, e202300682 (2023).
Brege, J. J., Gallaway, C. & Barron, A. R. Fluorescence quenching of single-walled carbon nanotubes with transition-metal ions. J. Phys. Chem. C 113, 4270-4276 (2009).
Miller, J. R., Calcaterra, L. T. & Closs, G. L. Intramolecular longdistance electron transfer in radical anions. The effects of free energy and solvent on the reaction rates. J. Am. Chem. Soc. 106, 3047-3049 (1984).
Park, M. et al. Measuring the accessible surface area within the nanoparticle corona using molecular probe adsorption. Nano Lett. 19, 7712-7724 (2019).
Blanch, A. J. & Shapter, J. G. Surfactant concentration dependent spectral effects of oxygen and depletion interactions in sodium dodecyl sulfate dispersions of carbon nanotubes. J. Phys. Chem. B 118, 6288-6296 (2014).
Bergler, F. F., Stahl, S., Goy, A., Schöppler, F. & Hertel, T. Substratemediated cooperative adsorption of sodium cholate on singlewall carbon nanotubes. Langmuir 32, 9598-9603 (2016).
Russell, R. G. G., Bisaz, S., Donath, A., Morgan, D. B. & Fleisch, H. Inorganic pyrophosphate in plasma in normal persons and in patients with hypophosphatasia, osteogenesis imperfecta, and other disorders of bone. J. Clin. Investig. 50, 961-969 (1971).
Russell, R. G. G. Excretion of inorganic pyrophosphate in hypophosphatasia. Lancet 286, 461-464 (1965).
Caballero, D. et al. Intraperitoneal pyrophosphate treatment reduces renal calcifications in Npt2a null mice. PLoS ONE 12, e0180098 (2017).
March, J. G., Simonet, B. M. & Grases, F. Determination of pyrophosphate in renal calculi and urine by means of an enzymatic method. Clin. Chim. Acta 314, 187-194 (2001).
Terkeltaub, R. A. Inorganic pyrophosphate generation and disposition in pathophysiology. Am. J. Physiol. Cell Physiol. 281, C1-C11 (2001).
Johnson, K. et al. Mitochondrial oxidative phosphorylation is a downstream regulator of nitric oxide effects on chondrocyte matrix synthesis and mineralization. Arthritis Rheumatism 43, 1560-1570 (2000).
Rachow, J. W., Ryan, L. M., Mccarty, D. J. & Halverson, P. C. Synovial fluid inorganic pyrophosphate concentration and nucleotide pyrophosphohydrolase activity in basic calcium phosphate deposition arthropathy and milwaukee shoulder syndrome. Arthritis Rheumatism 31, 408-413 (1988).
Xu, H., Yang, D., Jiang, D. & Chen, H.-Y. Phosphate assay kit in one cell for electrochemical detection of intracellular phosphate ions at single cells. Front. Chem 7, 360 (2019).
Zhang, K., Xu, X.-H. & Qing, F.-L. Copper-promoted ritter-type trifluoroethoxylation of (hetero)arenediazonium tetrafluoroborates: a method for the preparation of trifluoroethyl imidates. Eur. J. Org. 2016, 5088-5090 (2016).
Gifford, B. J. et al. Optical effects of divalent functionalization of carbon nanotubes. Chem. Mater. 31, 6950-6961 (2019).
Acknowledgements
This project has received funding from the European Research Council (ERC) under the European Union’s Horizon 2020 research and innovation programme (Grant Agreement No. 817494 “TRIFECTs”, S.S., J.Z.). C.A.S., S.J., and S.K. acknowledge funding by the Deutsche Forschungsgemeinschaft (DFG, German Research Foundation) under Germany’s Excellence Strategy-EXC 2033-390677874 – RESOLV, the “Center for Solvation Science ZEMOS” funded by the German Federal Ministry of Education and Research BMBF and by the Ministry of Culture and Research of Nord Rhine-Westphalia, and the Volkswagen Stiftung. B.S.F. and H.L. gratefully acknowledge support by the DFG under grant numbers FL 834/5-1, FL 834/9-1, and FL 834/12-1.
Author contributions
S.S. prepared and measured all samples and analyzed the data. C.A.S., S.J. and S.K. designed and conceived spiking and PCR experiments. E.M. performed synthesis and characterization of diazonium salts under supervision of A.S.K.H. H.L. and B.S.F. provided ATPE-sorted SWNTs. J.Z. conceived and supervised the project. S.S. and J.Z. wrote the manuscript. All authors discussed the data analysis and commented on the manuscript.
Funding
Open Access funding enabled and organized by Projekt DEAL.
Correspondence and requests for materials should be addressed to Sebastian Kruss or Jana Zaumseil.
Peer review information Nature Communications thanks the anonymous reviewer(s) for their contribution to the peer review of this work. A peer review file is available.
Reprints and permissions information is available at http://www.nature.com/reprints
Publisher’s note Springer Nature remains neutral with regard to jurisdictional claims in published maps and institutional affiliations.
Institute for Physical Chemistry, Universität Heidelberg, Heidelberg D-69120, Germany. Department of Chemistry and Biochemistry, Ruhr-Universität Bochum, Bochum D-44801, Germany. Institute for Organic Chemistry, Universität Heidelberg, Heidelberg D-69120, Germany. Institute of Nanotechnology, Karlsruhe Institute of Technology, Kaiserstrasse 12, Karlsruhe D-76131, Germany. Department of Mechanical and Materials Engineering, University of Turku, Turku FI-20014, Finland. Chemistry Department, Faculty of Science, King Abdulaziz University, Jeddah 21589, Saudi Arabia. Biomedical Nanosensors, Fraunhofer Institute for Microelectronic Circuits and Systems, Duisburg D-47057, Germany. e-mail: sebastian.kruss@rub.de; zaumseil@uni-heidelberg.de