المجلة: Scientific Reports، المجلد: 15، العدد: 1
DOI: https://doi.org/10.1038/s41598-024-77864-y
PMID: https://pubmed.ncbi.nlm.nih.gov/39753610
تاريخ النشر: 2025-01-03
DOI: https://doi.org/10.1038/s41598-024-77864-y
PMID: https://pubmed.ncbi.nlm.nih.gov/39753610
تاريخ النشر: 2025-01-03
افتح
الميزات الرئيسية والإرشادات لتطبيق مقاييس تنوع الألفا الميكروبي
تختلف دراسات المجتمعات الميكروبية بشكل كبير من حيث طرق التحليل. في هذا المجال المتنامي، تجعل مجموعة متنوعة من مقاييس التنوع ونقص التناسق من الصعب مقارنة الدراسات المختلفة. معظم مقاييس تنوع الألفا الحالية مستمدة من تخصصات أخرى وفرضياتها ليست دائمًا ذات معنى مباشر أو صحيحة لبيانات الميكروبيوم. تطبق العديد من الدراسات الحالية للميكروبيوم مقياسًا واحدًا أو بعض مقاييس تنوع الألفا دون أسس ولكن أيضًا مع تفسير غير واضح للنتائج. يركز هذا العمل على تحليل نظري وتجريبي ومقارن لـ 19 مقياسًا لتنوع الألفا الميكروبي المستخدمة بشكل متكرر وأقل تكرارًا، مجمعة في
أدى تحليل تركيب المجتمعات الميكروبية إلى رؤى أفضل في الأدوار التي تلعبها الميكروبات في صحة الإنسان
مقياسان شائعان تم الإبلاغ عنهما في العديد من دراسات الميكروبيوم هما تنوع الألفا وتنوع البيتا. تنوع الألفا هو مصطلح عام للمقاييس التي تصف غنى الأنواع، التساوي، أو التنوع داخل عينة. في المقابل، تقارن مقاييس تنوع البيتا تشابه مجتمعين أو أكثر
معظم مقاييس تنوع الألفا الحالية مستمدة من تخصصات أخرى، مثل دراسات تنوع النباتات أو الحشرات
نظرًا لحداثة دراسات الميكروبيوم كعلم، هناك نقص في التوافق وعمليات التوحيد بين الباحثين والأطباء. يخلق هذا تحديات كبيرة في الحصول على وتحليل
تصور، تفسير، ومقارنة بيانات الميكروبيوم البشري بشكل قوي، خاصة مع انتقال هذه الممارسات نحو التطبيقات السريرية
النتائج
تم تجميع مقاييس الألفا المستخدمة في 68 دراسة ميكروبيوم أو في مجموعة QIIME 2 في أربع فئات بعد إجراء تحليل نظري مفصل لصيغة كل مقياس رياضي (انظر قسم الطرق للحصول على شرح مفصل). الفئات المقترحة مع مقاييسها المرتبطة هي:
- الغنى: Chao1، ACE، Fisher، Margalef، Menhinick، Observed، وRobbins.
- الهيمنة (المعروفة أيضًا بالتساوي): Berger-Parker، Dominance، Simpson، ENSPIE، Gini، McIntosh، وStrong.
- النشوء: Faith.
- المعلومات: Shannon، Brillouin، Heip وPielou.
تم حساب 19 مقياسًا مختارًا لتنوع الألفا لمجموعات البيانات التسلسلية التي تم الحصول عليها لعدد إجمالي من 4,596 عينة براز مدرجة في 13 مشروعًا متاحًا للجمهور عن الميكروبيوم البشري (الجدول S3). تم إعادة تحليل جميع بيانات التسلسل لهذا البحث باستخدام نفس خط معالجة البيانات، كما هو موضح في الطرق.
خلال هذه الدراسة، حددنا عاملين رئيسيين ذوي صلة بتقدير مقاييس تنوع ألفا المختلفة، كما تم مناقشته في قسم الطرق (التحليل النظري): العدد الإجمالي لمتغيرات تسلسل الأمبليكون (ASVs)، وASVs التي تحتوي على قراءة واحدة فقط (الوحيدة). تم التحقق من أن عمق التسلسل لم يكن له تأثير على العدد الإجمالي لـ ASVs والوحيدة (المعلومات التكميلية، الشكل S2، الجدول S3). بناءً على ذلك، تم حساب مقاييس تنوع ألفا باستخدام بيانات غير نادرة للحفاظ على أكبر قدر ممكن من المعلومات عند حسابها. كما تم التحقق من جميع النتائج باستخدام مجموعات بيانات نادرة. كما هو موضح في الطرق، تم معالجة جميع العينات باستخدام DADA2 وDEBLUR. من المهم ملاحظة أن DADA2 يزيل جميع الوحيدة من العينات كجزء من خوارزمية إزالة الضوضاء الخاصة به. نظرًا لأن عدد الوحيدة مطلوب لحساب بعض مقاييس تنوع ألفا، تم إجراء جميع التحليلات التالية باستخدام البيانات الناتجة عن DEBLUR. يظهر الشكل 1 جميع العينات وفقًا لخصائصها الملحوظة (العدد الإجمالي لـ ASVs الملحوظة) وقيم الوحيدة. يظهر الشكل 1A أن القيم من المقاييس المدرجة في فئة الثراء تعتمد على هذين العاملين الرئيسيين. توضح مقياس الألوان لكل رسم بياني القيمة العادية لكل مقياس (تطبيع الحد الأدنى – الحد الأقصى). تزداد جميع مقاييس الثراء مع زيادة عدد ASVs الملحوظة، باستثناء روبينز الذي يعتمد على عدد الوحيدة المحددة. يظهر الشكل 1B قيم مقاييس الهيمنة وفقًا للعوامل المقابلة. في هذه الفئة، يكون التحليل أكثر تعقيدًا ويتطلب اعتبارات مفصلة. تميل قيم بيرجر-باركر وENSPIE إلى الانخفاض عندما يزداد عدد ASVs. بسبب صيغة حساب سيمبسون، فإن الاتجاه السابق موجود أيضًا ولكن مع إشارة معاكسة (تميل قيم الهيمنة القريبة من الأصل إلى الانخفاض). تميل قيم الهيمنة إلى الانخفاض عندما تزداد الوحيدة ويكون عدد ASVs أقل من 200 (بالنسبة لمقاييس ستروك وسيمبسون، يجب تطبيق الإشارة المعاكسة بسبب حساب الصيغة). يحتوي الشكل 1C على نفس التحليل المطبق على المقاييس في فئة المعلومات. نظرًا لأن جميع مقاييس المعلومات تم بناؤها باستخدام صيغة شانون، فمن المتوقع أن تظهر سلوكًا مشابهًا، كما لوحظ. على العكس من ذلك، في مخططات شانون وبييلوا وبريلوين، يتم ملاحظة السلوك المحدد في فئة الهيمنة في العينات التي تحتوي على أقل من 60 وحيدة وأقل من 200 ASVs، ولكن بشكل معكوس، مع ميل القيم إلى الانخفاض. يظهر الشكل 1D قيم فيث وفقًا للعاملين، مما يشير إلى أن هذه المقياس يعتمد بشكل مستقل على كلا العاملين. العينات ذات القيم المنخفضة فيث التي لا تتبع الاتجاهات السابقة (الموجودة في وسط المخطط) معزولة إلى
داخل كل فئة مقترحة، تم حساب معامل الارتباط الخطي لبييرسون ومعاملات الارتباط المرتبة لسبيرمان لتحديد الارتباطات بين المقاييس. تم تضمين مصفوفات التشتت التفصيلية التي تظهر الارتباطات بين كل فئة في المعلومات التكميلية عبر الإنترنت (الأشكال التكميلية Sla إلى S1c). في فئة الغنى (S1a)، يظهر كل من تشاو وACE أقوى ارتباط خطي بينهما، بينما يظهر مارغالف وروبنس بعض التباين، لكنهما لا يزالان مرتبطين بشدة بتشاو وACE. يقدم منهينيك تباينًا في الميل يعتمد على مجموعة البيانات. يتم حساب روبنس، كما تم الإشارة إليه سابقًا، بناءً على العدد الإجمالي للأفراد الفريدين بدلاً من عدد ASVs، ولم يتم العثور على ارتباط قوي. جميع مقاييس الغنى باستثناء روبنس مرتبطة بشدة مع بعضها البعض ومع عدد ASVs، مما يعني أن الاختلافات في صيغتها ليس لها تأثير ذي صلة عند تطبيقها على بيانات الميكروبيوم.
يمكن أيضًا ملاحظة ارتباطات غير خطية قوية بين مقاييس الهيمنة (S1b). الهيمنة وENSPIE هما نوعان من مقياس سيمبسون، وهما مرتبطان ارتباطًا قويًا ببعضهما كما هو متوقع. كما أن مقياسي مكينتوش وبرغر-باركر مرتبطان بهذه المقاييس. من المثير للاهتمام بشكل خاص أن برغر-باركر له تفسير بيولوجي أوضح من صيغته الرياضية (نسبة الأنواع الأكثر وفرة). تقدم الشكل 2، لكل مقياس في فئة الهيمنة، تحليل انحدار خطي باستخدام جميع العينات، حيث يمثل المحور السيني قيمة برغر-باركر ويمثل المحور الصادي قيمة المقياس المقابل. تظهر نماذج مكينتوش وسيمبسون توافقًا جيدًا. في حالة ENSPIE، يتناسب التحويل الأسي بشكل أفضل من النموذج الخطي. لا يتناسب مؤشر جيني جيدًا في هذا النموذج، كما أنه لا يتناسب جيدًا عند تطبيق نموذج الارتباط على جميع مقاييس الهيمنة.
الإيمان هو المقياس التطوري الأكثر استخدامًا في الدراسات التجريبية (انظر الجدول التكميلي S1). الميزات الملحوظة والفرديات هي عوامل حاسمة، كما هو موضح في الشكل 1D. استنادًا إلى هذا التحليل، تم تطبيق انحدار بولينومي محلي على العلاقة بين الميزات الملحوظة (المقياس المختار المقترح).
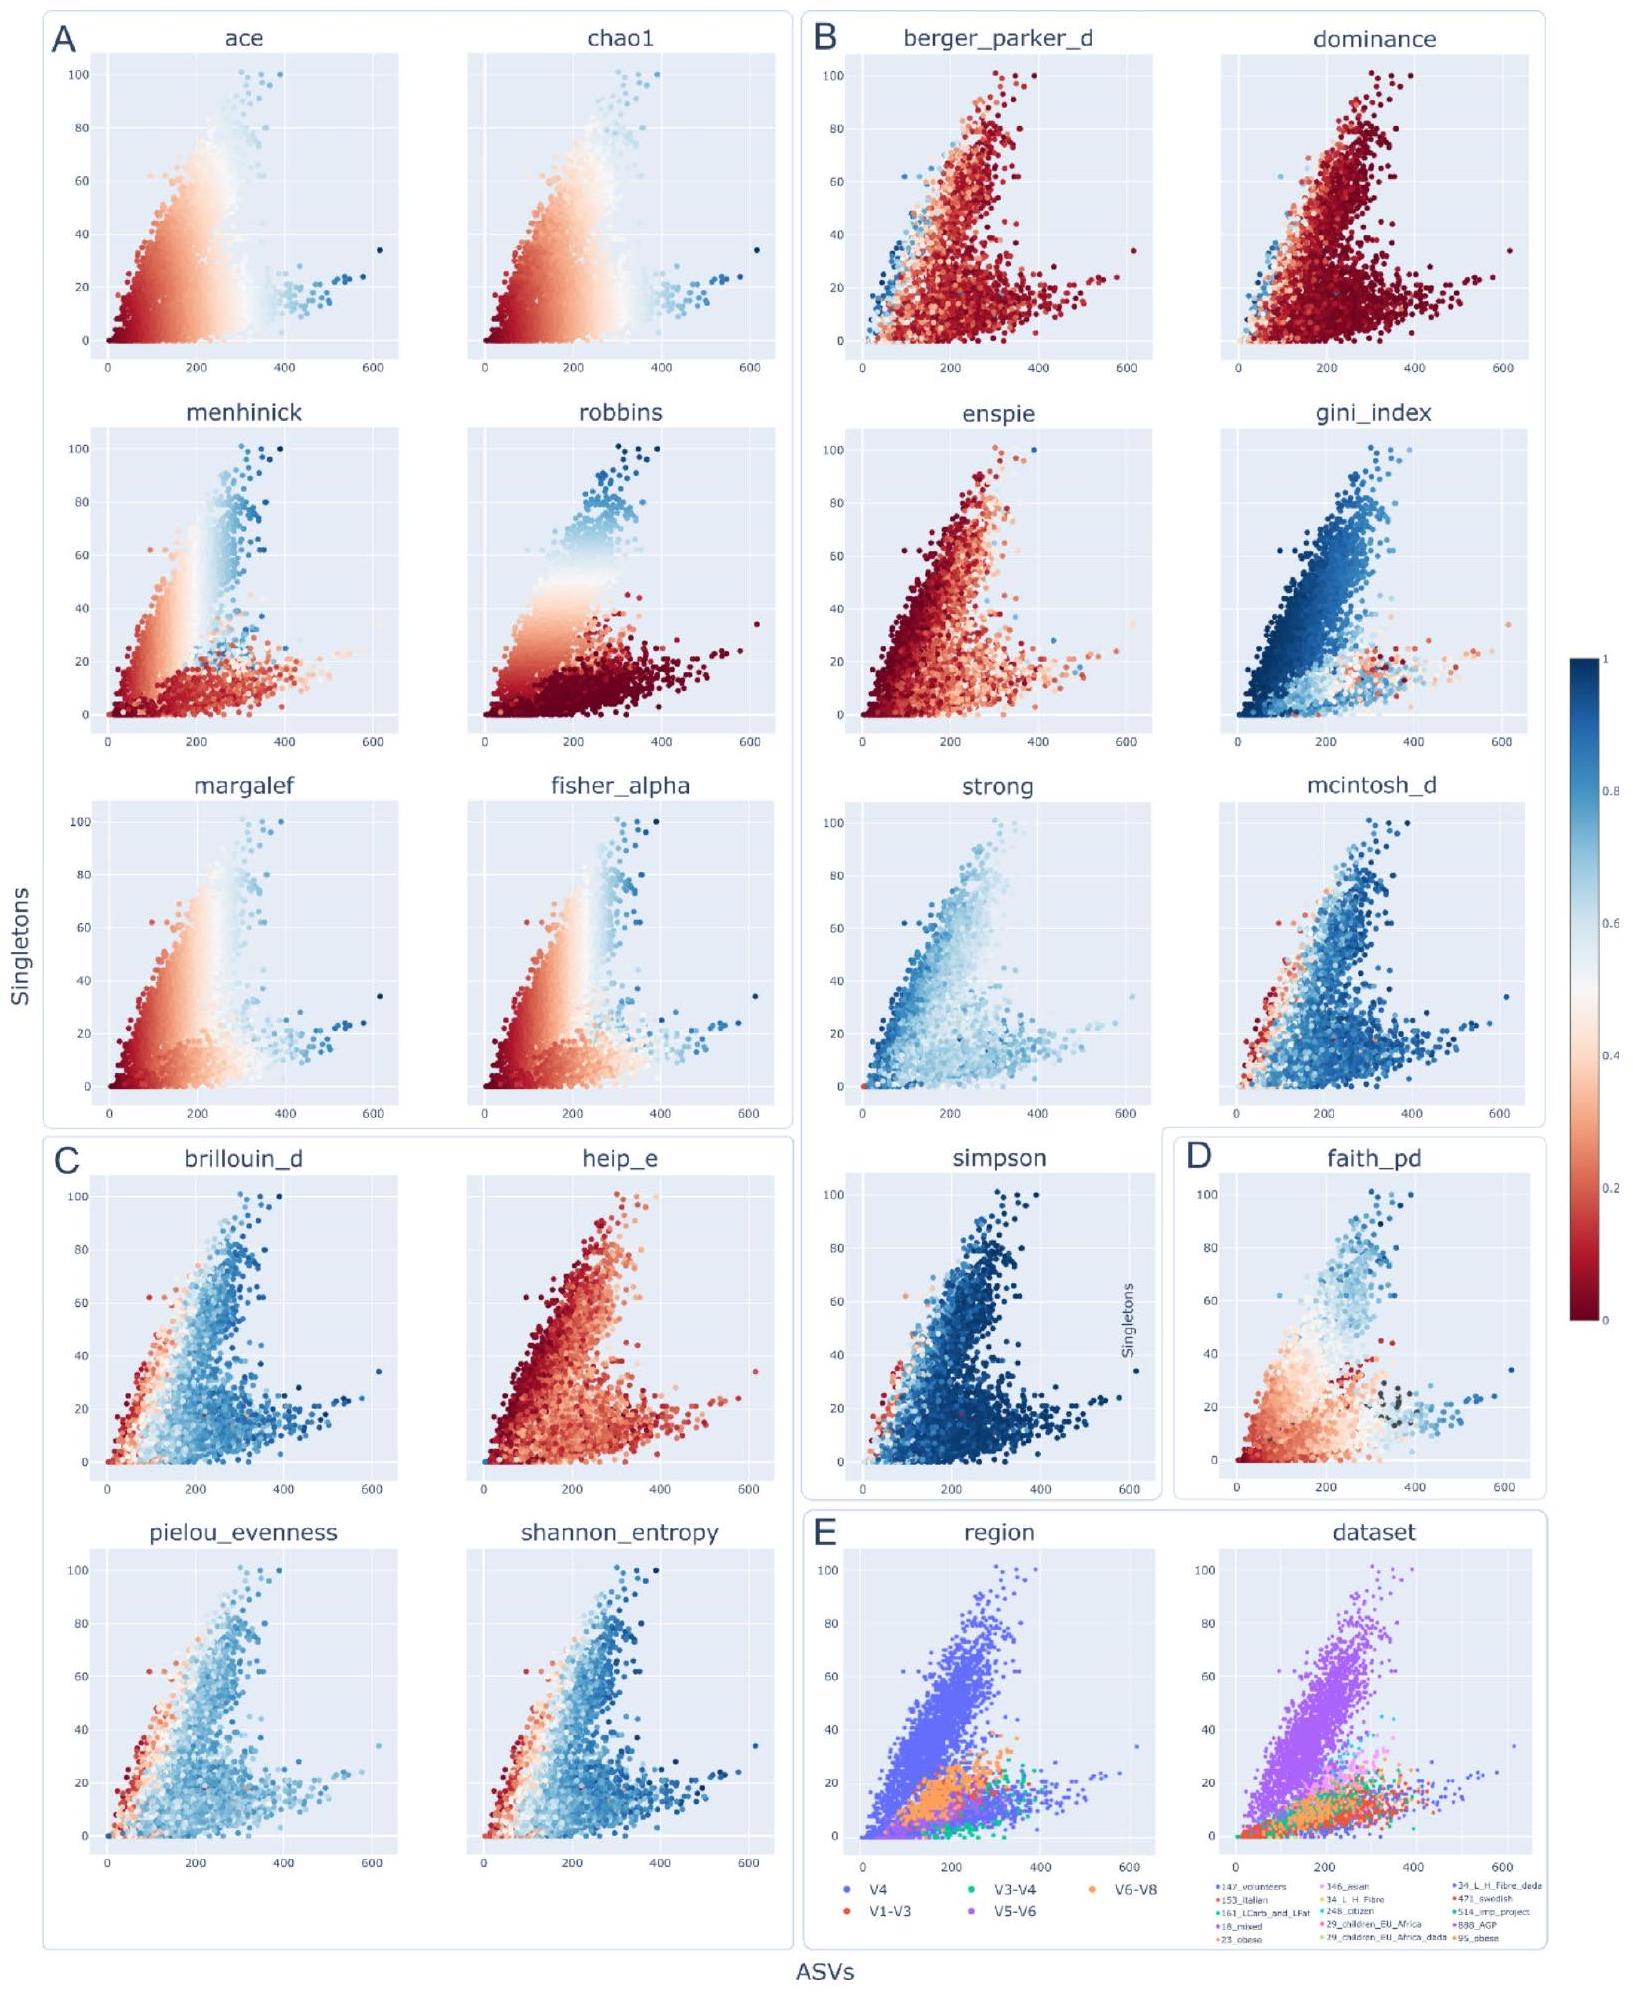
الشكل 1. العلاقة بين العناصر الفردية (محور Y) وعدد ASVs (محور X) من 4,596 عينة. تعرض جميع الرسوم البيانية نفس نقاط البيانات، ولكن تم تلوين كل رسم بياني وفقًا لمقياس تنوع ألفا مختلف. تتوافق الألوان في الرسوم البيانية A وB وC وD مع قيمة موحدة (نسبة) للمقياس ألفا المقابل. (A) الرسم البياني المتناثر للمقاييس المجمعة في فئة الغنى (باستثناء المقياس المرصود، الذي يمثل القيم على محور X)، (B) مقاييس الهيمنة، (C) تظهر مقاييس المعلومات و(D) مقياس فيث (علم النشوء). (E) يصور العينات الملونة وفقًا للمنطقة المعززة 16 S والدراسة الأصلية.
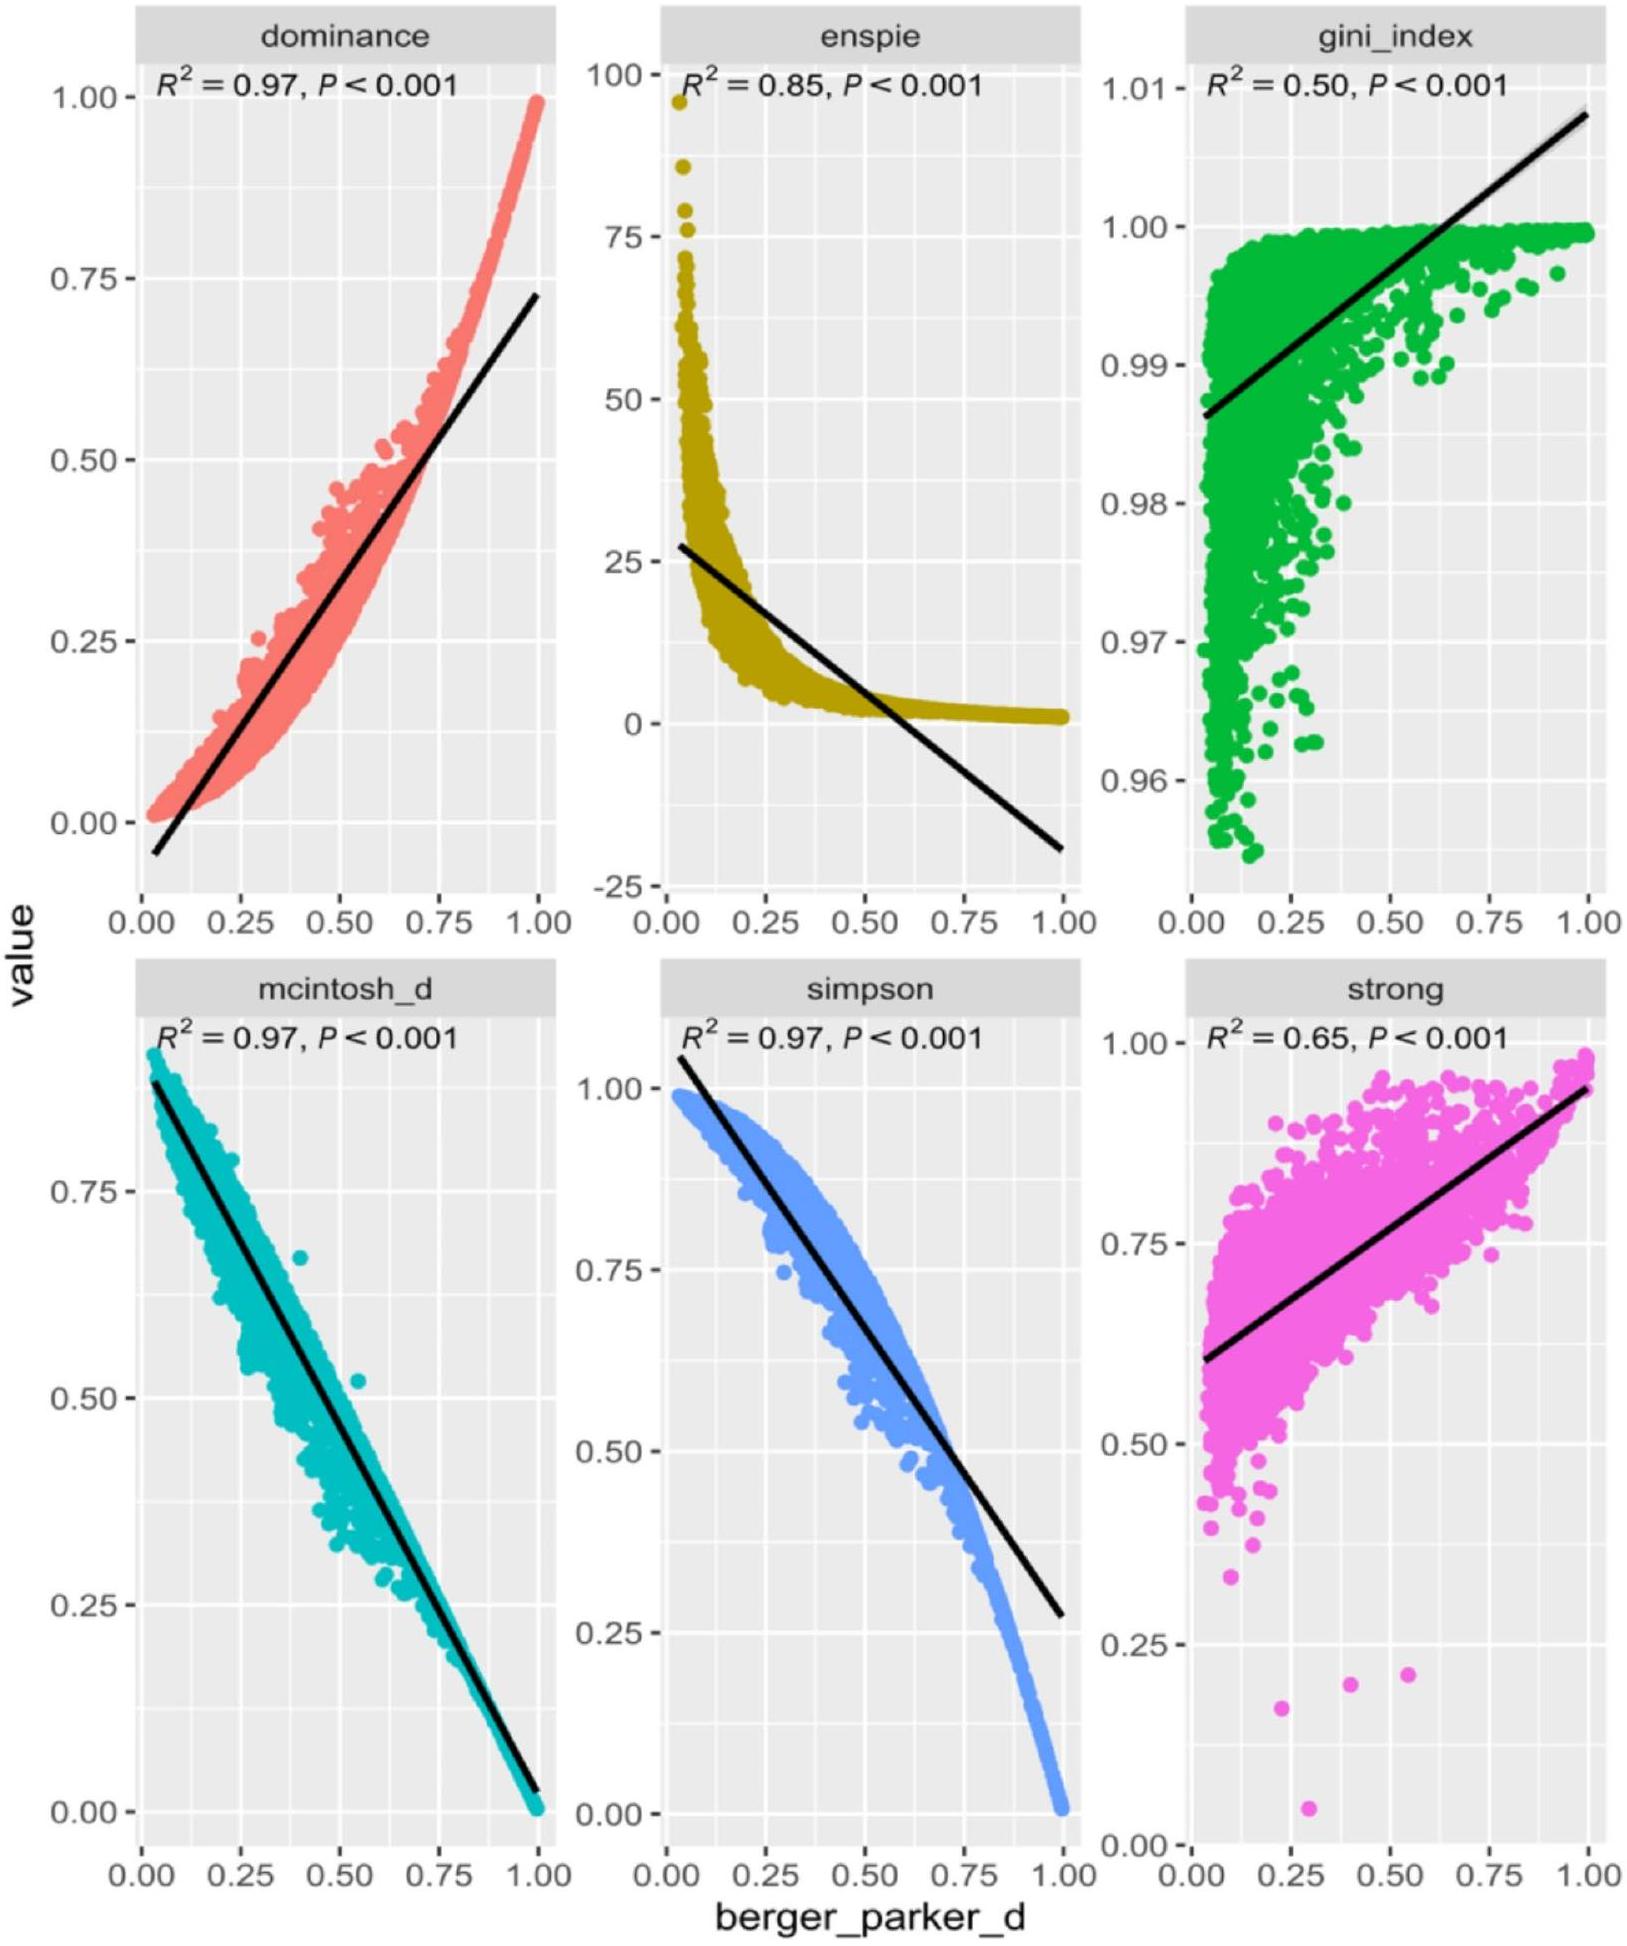
الشكل 2. مخطط تشتت لكل مقياس هيمنة بين القيمة المقابلة للمقياس (محور Y) وقيمة بيرجر-باركر (محور X) لـ 4,596 عينة.
كممثل لفئة الثراء في قسم المناقشة) والإيمان، لكل مجموعة بيانات. توضح الشكل 3A أن نماذج الانحدار المحسوبة قريبة من الانحدار المتعدد الحدود، وأن معاملات التحديد
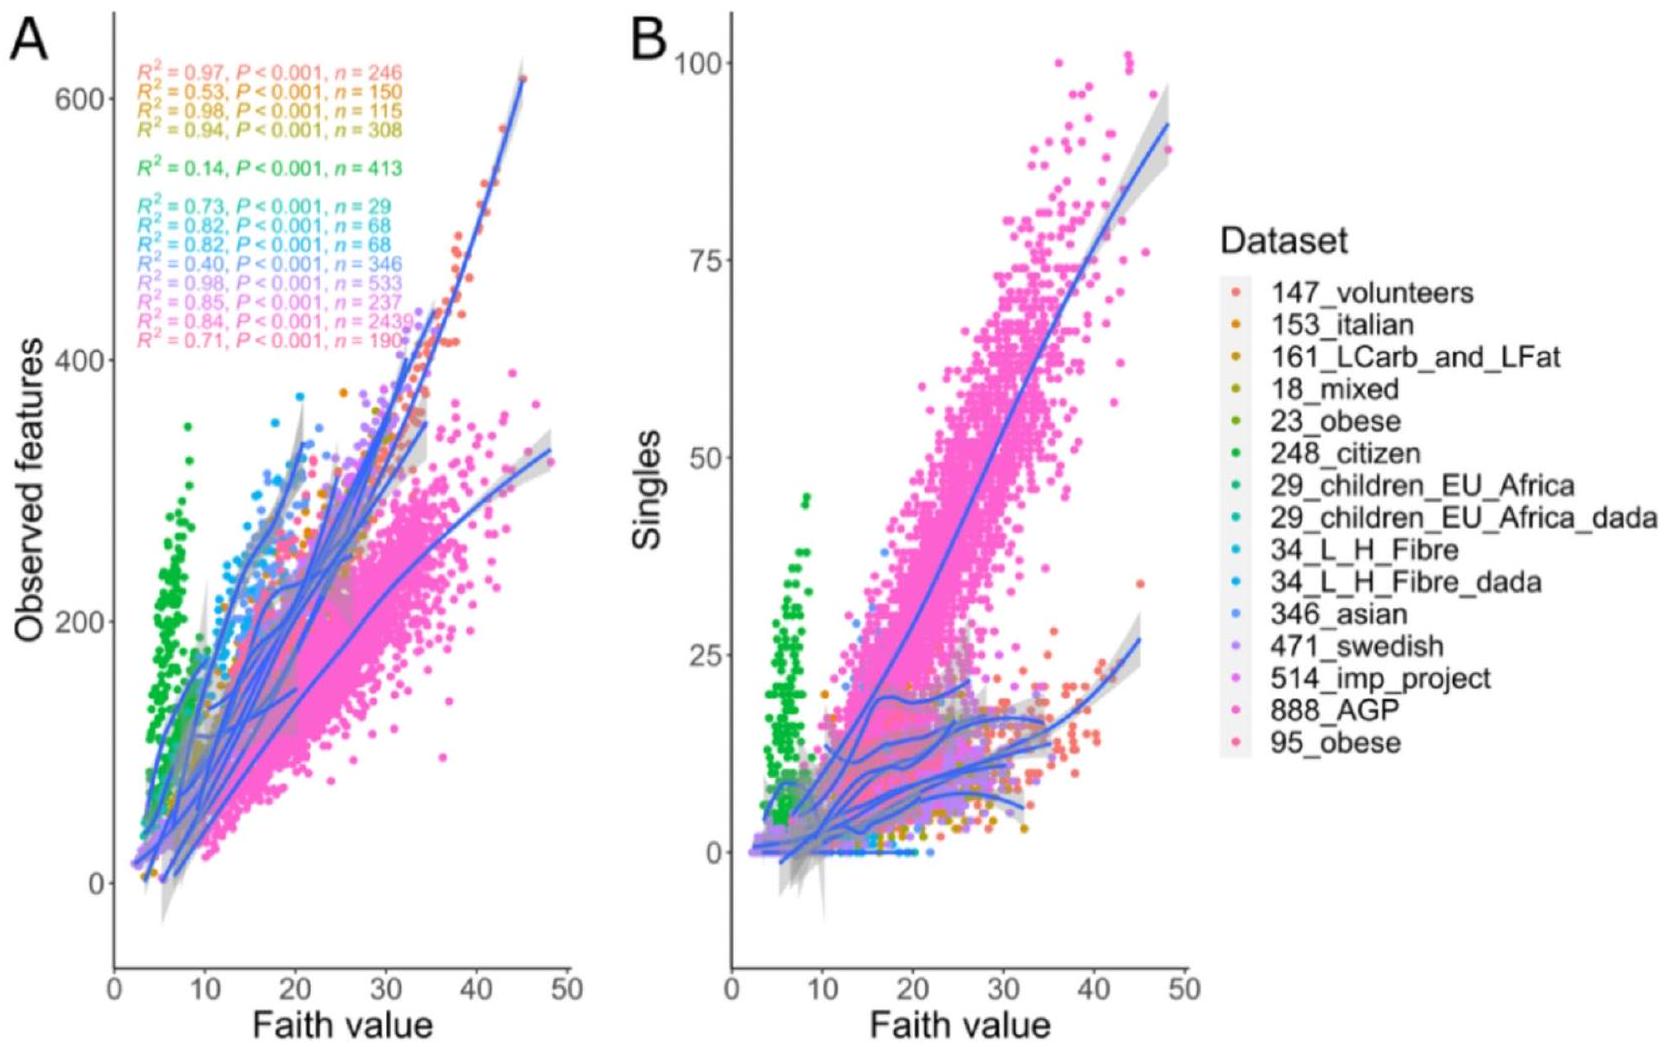
الشكل 3. مخطط تشتت وتناسب الانحدار المتعدد المحلي بين مقياس الإيمان (محور X) مقابل (A) الميزات الملحوظة و(
يمكن ملاحظة سلوك مشابه بين المقاييس في فئة المعلومات (S1c) حيث تظهر جميع المقاييس ارتباطًا قويًا بينها. وهذا متوقع حيث تستخدم جميع مقاييس المعلومات إنتروبيا شانون كمرجع في صياغتها الرياضية، وسيتم مناقشة تداعيات ذلك بشكل أعمق في قسم المناقشة.
بعد إجراء تجارب تجريبية على بيانات الميكروبيوم البشري المتاحة للجمهور، قمنا بالتحقق من نتائجنا من خلال تطبيق مقاييس التنوع الألفا على 7 مجموعات بيانات صناعية (انظر الطرق، الشكل التوضيحي S6 و S7). بالنسبة لمعظم المقاييس، تغير نطاق قيمها اعتمادًا على التوزيع، ولكن بعد إجراء تطبيع الحد الأدنى والحد الأقصى لتحليل سلوكها، لم نلاحظ اختلافات ذات دلالة تتعلق بهدف هذا العمل بين التوزيعات. وفقًا لنتائجنا السابقة، تزداد معظم مقاييس الوفرة وفقًا للتغيرات في العدد الإجمالي لوحدات التصنيف المتنوعة (ASVs)، باستثناء مقياس روبينز الذي يتأثر بوجود أو غياب الوحدات الفردية داخل العينة. تأثرت مقاييس الهيمنة بشكل خاص بنسب عدم التوازن الاصطناعية (2x، 10x و 100x). أخيرًا، زادت مقاييس المعلومات عندما زادت وحدات التصنيف المتنوعة، وانخفضت عندما كان هناك عدم توازن في الميكروبيوم.
توصيات عملية مستمدة من الملاحظات والتحليل النظري
من التحليل النظري الذي تم إجراؤه في قسم الطرق (انظر قسم التحليل النظري)، حددنا أربع فئات تجمع المقاييس وفقًا للجوانب التي تركز عليها في تنوع ألفا. داخل كل فئة، تشترك المقاييس في أهداف مشابهة وصيغ ذات صلة. بينما يؤدي النظر في جميع المقاييس إلى تنوع كبير في صيغها، فإن هذه التعقيد يجعل التحليل تحديًا. ومع ذلك، كشفت تحليلاتنا أن العديد من هذه المقاييس مرتبطة ارتباطًا وثيقًا ببعضها البعض، مما يشير إلى أن التعقيد في الصيغ لا ينعكس في النتائج المحققة. لذلك، نوصي باستخدام أبسط مقياس داخل كل فئة يظهر سلوكًا مشابهًا لنظرائه الأكثر تعقيدًا.
بالنظر إلى ذلك، جنبًا إلى جنب مع الملاحظات الموصوفة أعلاه والتحليل النظري للصياغة الرياضية لكل مقياس، قمنا بتطوير مجموعة من التوصيات العملية النهائية التي يجب أخذها بعين الاعتبار للدراسات المستقبلية:
- أبلغ عن أداة المعلوماتية الحيوية المستخدمة لتنفيذ عملية إزالة الضوضاء وأبلغ عن القيم الفردية لتقييم مقاييس الثراء والهيمنة بشكل أفضل.
- قدم مقياسًا واحدًا على الأقل من كل من الفئات التكميلية للتنوع الألفي التالية: الغنى، الهيمنة، المعلومات والفيولوجيا. يتم ذكر المقاييس المؤهلة الموصى بها في النقاط التالية.
- بالنسبة لفئة الثراء، يجب إبلاغ أحد المقاييس التالية: الملاحظ، ACE، تشاول، فيشر، مارغالف، مكينتوش و مينهينيك. يمكن استخدام أي من المقاييس السابقة لأنها جميعها مرتبطة.
ومع ذلك، نوصي بالإبلاغ عن عدد الميزات الملحوظة نظرًا لبساطة تقنية حسابها وتفسيرها البيولوجي البديهي. كما نقترح تضمين قيمة روبينز (احتمالية عدم ملاحظة الأنواع الموجودة في العينة). - بالنسبة لفئة الهيمنة، نوصي باستخدام مقياس بيرجر-باركر، الذي يشير إلى نسبة الأنواع الأكثر وفرة مقارنة بجميع الأنواع الأخرى. عندما يتم ملاحظة هيمنة عالية في عينة ما، يُنصح بتحديد الميكروب الأكثر هيمنة. إذا كان من الممكن تحديد الميكروب السائد على مستوى تصنيفي الأنواع، أو حتى على مستوى السلالة، يُوصى بالإبلاغ عن التوصيفات الوظيفية له كخطوة أولية للتحليل الوظيفي المحتمل. يمكن أن تشمل هذه التوصيفات مصطلحات GO، وفرة مجموعات الجينات المتجانسة (COGs)، أو التوصيفات المحتملة من KEGG، أو بيانات وظيفية مشابهة. ومع ذلك، إذا لم يكن من الممكن تحديد الميكروب على مستوى الأنواع وتم تحديد رتبة تصنيفية أعلى فقط، فلا يُنصح بالتوصيفات الوظيفية من تسلسل الأمبليكون. وذلك لأن دقتها القوية لا تزال محل نقاش وقد لا توفر رؤى موثوقة.
- بالنسبة لفئة النشوء والتطور، أبلغ عن قيمة فيث.
- قم بالإبلاغ عن قيمة شانون لإبلاغ ليس فقط عن الانتروبيا ولكن أيضًا كمعامل يلخص/يوازن بين فئات الثراء والسيطرة في قيمة واحدة (انظر قسم المناقشة).
- قم بتضمين تفسير بيولوجي واستنتاجات لكل مقياس تم الإبلاغ عنه مع الأخذ في الاعتبار جانب الميكروبيوم الذي يقيسه، بالإضافة إلى تفسير لجميع المقاييس بشكل جماعي.
- لا ينبغي مقارنة مقاييس التنوع الألفا للعينات المعالجة تحت أمبليكون 16S مختلف، حيث ثبت أن ذلك يؤثر على عدد الميزات الملحوظة والميزات الفردية المرصودة، وبالتالي، القيم المحسوبة للمقاييس.
نقاش
تقديم بيانات تسلسل الميكروبيوم الخام يواجه العديد من التحديات المعلوماتية الحيوية لتحقيق نتائج غير متحيزة، بما في ذلك مهام مثل دمج وإزالة البرايمرات والباركودات، وإزالة الضوضاء، وإزالة التكرارات، وإزالة الكيميرات، والتصنيف الضريبي، من بين أمور أخرى. علاوة على ذلك، فإن دراسة تنوع الميكروبات تشمل مفاهيم متنوعة ومتميزة يجب النظر فيها بشكل منفصل. على سبيل المثال، ضمن التنوع الألفا، تقيس مقاييس مثل الهيمنة والغنى جوانب متميزة من تركيب المجتمع وبنيته. في حين أن، ضمن التنوع البيتا، تعتبر المنهجيات مثل طرق حساب المسافة وتقنيات تقليل الأبعاد ضرورية لفهم الاختلافات التركيبية بين المجتمعات الميكروبية. لهذا الغرض، تم تكييف المقاييس المستخدمة لوصف هذه المفاهيم والأدوات التي تمكن من تقديرها من تخصصات أخرى، مثل دراسة مجتمعات الحيوانات والنباتات، والاقتصاد، وعلم الاجتماع، أو التعدين.
استنادًا إلى ذلك، كان تركيزنا على الأسس والافتراضات وحسابات الصيغ للمعايير المختارة. تم استبعاد بعض المعايير لأنها لم تُستخدم من قبل المجتمع العلمي في الدراسات الحديثة للميكروبيوتا (تغطية إستي، حسابات جود) أو لأن صيغتها الرياضية معقدة، مشتقة من صيغة سابقة، مع مفهومها الأساسي قريب من آخر له صيغة أبسط (إنتروبيا ريني، الذيل، Q لكيمبتون تايلور، تقدير نقطة لليدسر، راو، إنف سيمبسون) أو أن أسسها وفرضياتها ليست قابلة للتطبيق مباشرة على بيانات الميكروبيوتا (هيل، إستي). كانت المعايير المختارة تركز بشكل أساسي على جانب واحد من تنوع ألفا، مما يضمن التناسق في الافتراضات والصيغ. في ظل هذه الاعتبارات، حددنا أربع فئات متميزة تكمل بعضها البعض وتوفر معًا نظرة شاملة لتنوع ألفا. تتضمن الفقرات التالية شرحًا موجزًا لكل فئة مقترحة مع المعايير الموصى بها:
ثراء
عدد الكائنات الدقيقة المختلفة في عينة. في الدراسات التجريبية، بدلاً من عدد الكائنات الدقيقة المرصودة (المكتشفة بواسطة تقنية التسلسل)، يكون من الأكثر ملاءمة تقدير عدد الكائنات الدقيقة الموجودة في السكان. عادةً ما يتم تقدير عدد الكائنات الدقيقة غير المرصودة ولكن الموجودة في عينة من خلال قراءات الأحادية، أي تسلسل تم اكتشافه مرة واحدة فقط داخل العينة. من وجهة نظر المعلومات الحيوية، يمكن اعتبار هذه القراءات كمرشحات لأخطاء التسلسل أو، بالعكس، معلومات ذات صلة لاستنتاج الكائنات الدقيقة ذات الوفرة المنخفضة الموجودة في العينة ولكن لم يتم تسلسلها. بناءً على هذا الافتراض، تحاول بعض مقاييس تنوع ألفا (مثل تشاول) تقدير الغنى الحقيقي من معلومات الوفرة المنخفضة. بهذه الطريقة، فإن التحليل المعلوماتي الحيوي للأحادية يمثل أيضًا تحديًا لأن الأدوات التي تقوم بعملية إزالة الضوضاء لديها نهج خوارزمي مختلف. دادة2
الهيمنة
درجة التوازن (أو التساوي) الملاحظة في توزيع غنى الميكروبات في عينة. الهدف من هذه الفئة من المقاييس هو إبلاغ ما إذا كانت بعض الميكروبات مهيمنة على الأخرى من حيث الغنى. بعد ملاحظة كل صيغة حساب المقاييس المجمعة في فئة الهيمنة ونتيجة تطبيقها على 4,596 عينة، وُجد أن Berger-Parker (المقياس الذي يعكس النسبة بين الميكروب الأكثر هيمنة وجميع الميكروبات الأخرى في العينة) يمثل هذا بشكل أفضل.
الفئة. حيث أنه مرتبط بالنسبة بين الأكثر هيمنة والثاني الأكثر هيمنة (انظر المعلومات التكميلية على الإنترنت، الشكل S5)، يمكن اعتبار أن الميكروبين الأكثر هيمنة هما عاملان حاسمان لقيمة مقياس الهيمنة، بغض النظر عن المقياس المختار للإبلاغ عن هذه الفئة. إحدى الفوائد المحددة لتقديم Berger-Parker كمقياس مرجعي لفئة الهيمنة هي أن المعنى البيولوجي للمقياس المبلغ عنه أوضح وأسهل للإبلاغ عنه، وهو نسبة الميكروب الأكثر هيمنة إلى العدد الإجمالي للميكروبات الموجودة في العينة.
الفئة. حيث أنه مرتبط بالنسبة بين الأكثر هيمنة والثاني الأكثر هيمنة (انظر المعلومات التكميلية على الإنترنت، الشكل S5)، يمكن اعتبار أن الميكروبين الأكثر هيمنة هما عاملان حاسمان لقيمة مقياس الهيمنة، بغض النظر عن المقياس المختار للإبلاغ عن هذه الفئة. إحدى الفوائد المحددة لتقديم Berger-Parker كمقياس مرجعي لفئة الهيمنة هي أن المعنى البيولوجي للمقياس المبلغ عنه أوضح وأسهل للإبلاغ عنه، وهو نسبة الميكروب الأكثر هيمنة إلى العدد الإجمالي للميكروبات الموجودة في العينة.
علم الأنساب
إنه مقياس للتنوع البيولوجي الذي يُبلغ عن المسافة النسبية بين الميكروبات داخل عينة معينة. هذه الفئة، على عكس الفئات الأخرى، ليست موروثة من تخصصات أخرى. Faith هو المقياس الوحيد لعلم الأنساب الذي تم اعتماده على نطاق واسع في الدراسات التجريبية، وقيمته مرتبطة ارتباطًا وثيقًا بعدد الميزات المرصودة والعناصر الفردية.
المعلومات
إنه مقياس موروث من تخصص الفيزياء يُعتقد أنه يُبلغ عن الإنتروبيا لنظام ما. Shannon هو الأكثر استخدامًا في الدراسات التجريبية، وفي الواقع، تستخدم المقاييس الأخرى المدرجة في هذه الفئة (Brilloun وHeip وPielou) هذا المقياس كمرجع. في دراسات الميكروبيوم، يُفترض أن يعكس مؤشر Shannon عدد الميكروبات المختلفة في العينة ومدى توزيعها بالتساوي داخل العينة: إنه رقم يهدف إلى تضمين ودمج معلومات الغنى والهيمنة. كلما زاد عدد الميكروبات في العينة، زادت قيمة مؤشر Shannon؛ وكلما قلت عدم المساواة في الوفرة النسبية، زادت قيمة مؤشر Shannon أيضًا. نظرًا لأن المقاييس الثلاثة المقترحة كممثلة لفئات المعلومات (Shannon) والغنى (Observed_features) والهيمنة (Berger-Parker) مرتبطة (المعلومات التكميلية، الشكل S5) نؤكد أنه، إذا تم الإبلاغ عن مقاييس الغنى والهيمنة، فإن Shannon لا يوفر معلومات جديدة للصورة الكبيرة للتنوع ألفا. علاوة على ذلك، فإن قيمة Shannon يصعب تفسيرها من وجهة نظر بيولوجية. من ناحية أخرى، إذا كان Shannon هو المقياس الوحيد المبلغ عنه في دراسة معينة، يمكن أيضًا افتراض أنه يوفر تمثيلًا موزونًا/مركبًا لفئات المعلومات والغنى، في قيمة واحدة فقط. وبالتالي، تظل الطبيعة المعقدة للتفسير البيولوجي لهذا المقياس قضية.
أمثلة عملية وتطبيقات. مع الأخذ في الاعتبار المقاييس المقترحة سابقًا تحت فئاتها المعنية، فإن الأمثلة العملية حول كيفية تعزيز هذه التوصيات للدراسات هي كما يلي. تم توضيح ثلاثة أمثلة ووصفها (الشكل 4)، باستخدام بيانات من دراستين تم تحليلهما (المشاريع 471_swedish و514_imp_project، وفقًا لرموز الجدول S3). تهدف هذه الأمثلة العملية إلى إظهار كيف أن تنفيذ هذه التوصيات في تحليل النتائج يعزز جودة وشمولية المعلومات، مما يسهل تحسين التفسير عند العمل مع بيانات الميكروبيوم.
مثال 1 في هذه الحالة الأولى (المشروع 471_swedish)، لم يتم حساب فئة الهيمنة (أو التساوي). أبلغ المؤلفون عن زيادة في التنوع ألفا (تم الإبلاغ عنها بشكل محدد كغنى، تم حسابها باستخدام التنوع النسبى) مع تقدم الأطفال في العمر، وهو أمر دقيق. ومع ذلك، تقدم فئة الهيمنة رؤى إضافية حول هذه الملاحظة، مما يظهر أنه مع زيادة الغنى، تنخفض الهيمنة (الشكل 4.A). إن اعتبار ذلك يوفر معلومات تكميلية يمكن أن توضح جوانب لم يتم تناولها سابقًا، حيث كانت هذه محجوبة بواسطة مقاييس لا تتضمن هذه المعلومات. في جوهرها، مع تقدم الأفراد في التجربة في العمر، يزداد كل من عدد وتنوع الميكروبات المرصودة، كما تقيسه مقياس التنوع النسبى (وكذلك بواسطة الميزات المرصودة). علاوة على ذلك، يقدم هذا التفسير البيولوجي منظورًا جديدًا: مع زيادة العمر، هناك انخفاض في هيمنة الميكروبات التي كانت سائدة سابقًا والتي تم تحديدها في حالات حديثي الولادة، مما يعكس على الأرجح استعمار المجتمع الميكروبي واستقراره مع مرور الوقت.
مثال 2 في الحالة الثانية (المشروع 514_imp_project)، من بين المقاييس الخمسة المقترحة، أبلغ المؤلفون عن Shannon وFaith، اللذان أظهرا أعلى تباين. ومع ذلك، عند تحليل الميزات المرصودة الإجمالية، والعناصر الفردية (باستخدام Robbins)، والتساوي في الهيمنة، لم تُلاحظ أي اختلافات كبيرة (الشكل 4.B). في هذا السياق، قد يكون التأكيد على Faith له تأثير أكبر، مما يشير إلى أن أي اختلافات ملاحظة يمكن أن تُعزى أكثر إلى الأصول النسبية و/أو التكيفات. بالنظر إلى ذلك، فإن المقارنة الشاملة لجميع المقاييس الخمسة فقط تمكننا من الافتراض حول الأصول النسبية/التكيفات، حيث لم تُظهر الجوانب الأخرى اختلافات كبيرة. سيسهل توحيد الإبلاغ عن التنوع ألفا وفقًا لهذه المقاييس الموصى بها وصفًا أكثر شمولية لمثل هذه السيناريوهات، باستخدام جميع المعلومات المتاحة بشكل فعال.
مثال 3 أخيرًا، المثال الثالث مأخوذ من نفس المشروع 514_imp_project، حيث لم يتم حساب مقاييس الهيمنة. وفقًا لـ Robbins (الشكل 4.B)، يبدو أن هناك عيبًا في أخذ العينات في مجموعة KarenThai، مما يشير إلى تقدير متوسط أعلى للميكروبات غير المرصودة مقارنة بالآخرين. وهذا يشير إلى أن مقاييس التنوع ألفا قد تظهر اتجاهات مختلفة إذا كانت مجموعة KarenThai أكثر تمثيلًا لتنوعها الحقيقي. قد تؤدي هذه الفرضية، إذا تم التحقق منها، إلى نتائج مختلفة لهذه المجموعة مقارنة بالآخرين، مما يؤثر على التفسيرات البيولوجية بسبب مشاكل أخذ العينات المحتملة. في جوهرها، قد يختلف التنوع الملاحظ في مجموعة KarenThai عما هو مُبلغ عنه. للتحقق من ذلك، يجب أن تشمل طريقة أخذ العينات الجديدة نطاقًا أوسع من أنماط الميكروبيوم، مع تضمين حجم عينة أكبر من التجربة.
تُطبق هذه التوصيات على كل من الدراسات البحثية الحالية والمستقبلية، مما يعزز توحيد وتحسين وثبات التحليلات المنفذة. تهدف هذه الطريقة إلى تحسين التقاط التنوع البيولوجي، وبالتالي تعزيز تفسيرات بيانات الميكروبيوم.
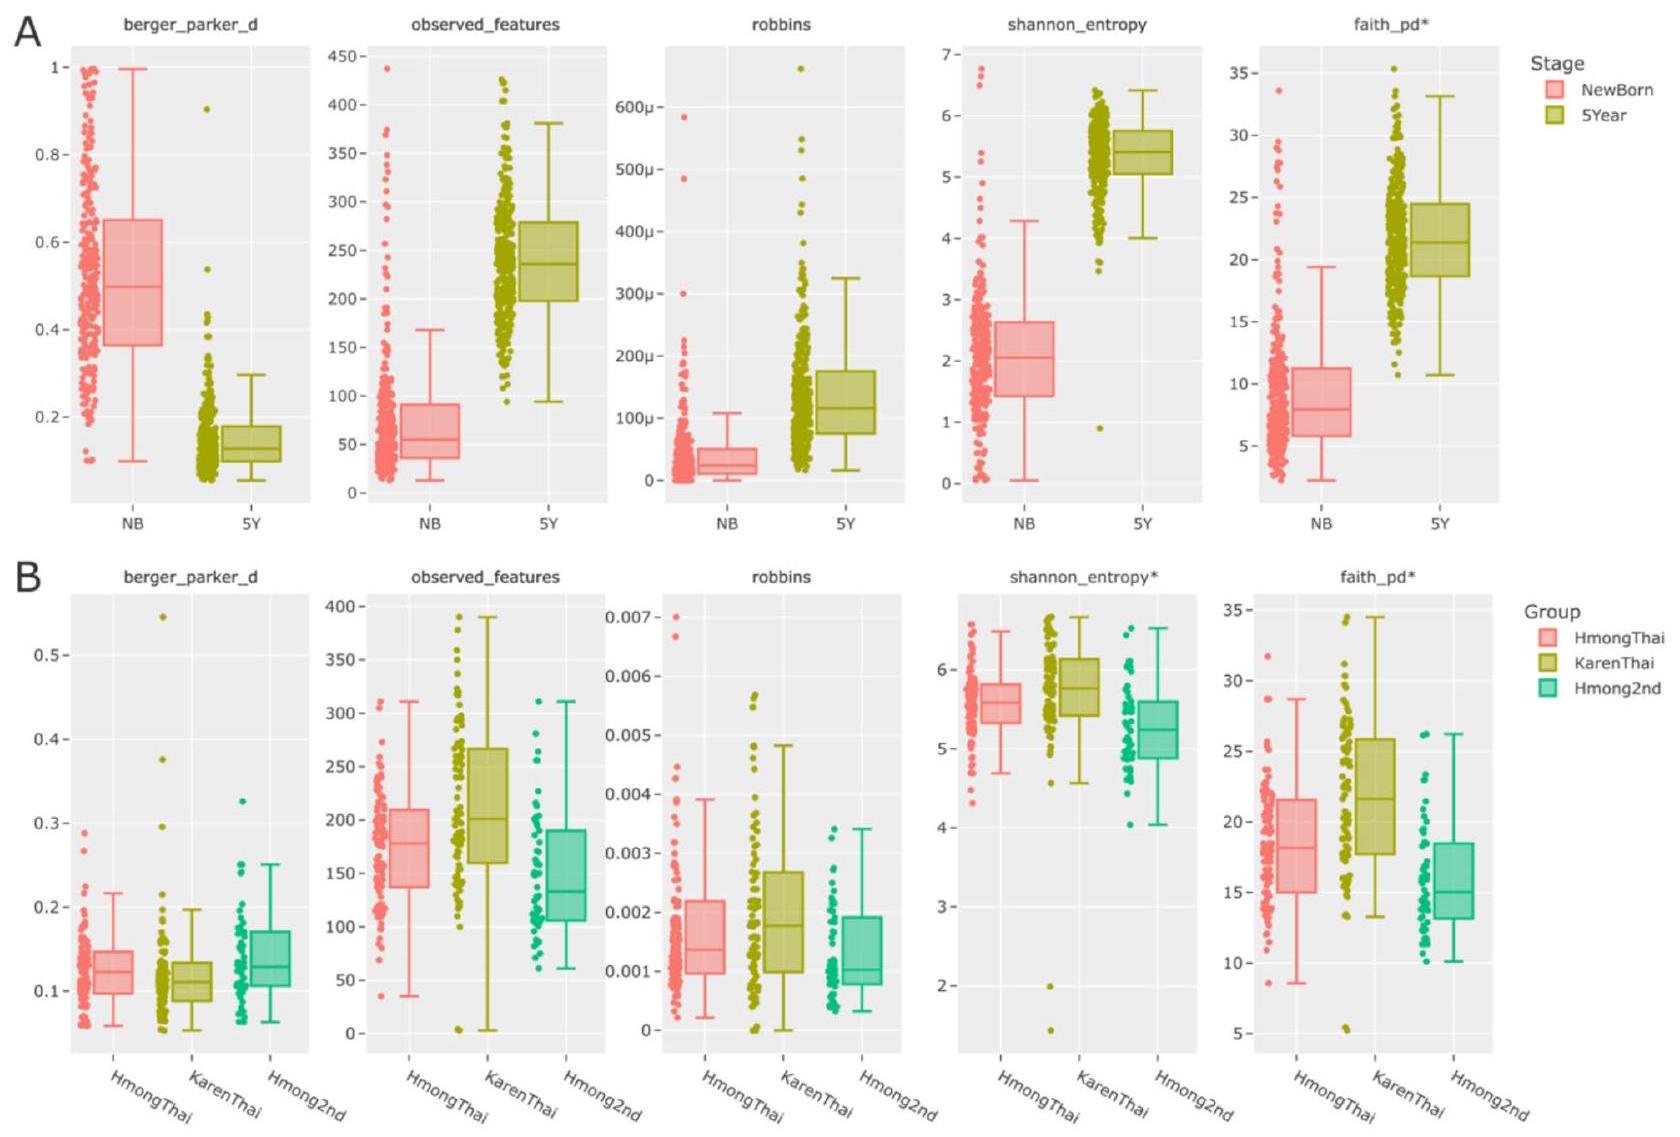
الشكل 4. مخططات الصندوق لكل مقياس تنوع ألفا الموصى به لمجموعتين من البيانات تم تحليلهما في هذه المقالة، 471_swedish (A) و514_imp_project (B). المقاييس التي تحمل نجمة (*) تم الإبلاغ عنها من قبل المؤلفين في دراساتهم الأصلية.
طرق
اختيار مقاييس التنوع ألفا
تم اختيار مقاييس التنوع ألفا المدرجة في هذه الدراسة من خلال فحص مفصل لـ 68 دراسة ميكروبيوم (انظر المعلومات التكميلية على الإنترنت، الجدول S1) أجريت على عينات بشرية أو حيوانية، أو التي تم تضمينها في مجموعة المعلومات الحيوية QIIME 2.
تم اختيار 68 دراسة لتحديد أكثر مقاييس تنوع ألفا تطبيقًا في المقالات البحثية. تم تضمين المشاريع العلمية المنشورة بعد عام 2008 التي أجرت تسلسل العلامة الحيوية الريبوسومية 16S. تم إعطاء الأولوية لأحدث الدراسات (10 من عام 2019، 12 من عام 2020 إلى 3 من عام 2021)، على الرغم من أنه تم تضمين ثلاث دراسات أقدم (2008، 2010 و2012) بسبب جودة تصميمها التجريبي وحجم عيناتها. تقوم هذه الدراسات بأداء واحد على الأقل من مقاييس تنوع ألفا التالية: تشاول، شانون، الغنى، بيرجر-باركر، ACE، سيمبسون، فيث وجوست. جميع هذه المقاييس مدرجة في هذا العمل باستثناء مقياس جوست، المصمم للمجتمعات البيئية. تعتمد فرضيته الرئيسية على المعادلة
بالإضافة إلى ذلك، تم تنفيذ مقاييس ألفا في QIIME2
التحليل النظري
تم إجراء التحليل النظري لكل مقياس من خلال النظر في أي جانب من جوانب التنوع البيولوجي يتم قياسه، وأي تخصص علمي تم اشتقاق المقياس منه، ومدى تكرار تطبيقه في مجال الميكروبيوتا، والمتغيرات التي تؤثر بشكل ملحوظ على المقياس المقترح وما إذا كان المقياس يتضمن تقديرًا أو يعكس بيانات ملحوظة، أي ما إذا كان المقياس يولد مفهومًا جديدًا (مثل نظرية المعلومات، الإنتروبيا، التساوي) أو إذا كان مجرد اسم مستعار لقيمة كمية متأصلة في مجموعة البيانات (عدد ASVs، المفردات).
كل مقياس ألفا المختار، مقسّم إلى هذه الفئات الأربع (انظر الجدول 1 للصيغ الرياضية المقابلة، مع المعلمات الرئيسية المعنية).
كل مقياس ألفا المختار، مقسّم إلى هذه الفئات الأربع (انظر الجدول 1 للصيغ الرياضية المقابلة، مع المعلمات الرئيسية المعنية).
غنى
تبلغ هذه المقاييس عن عدد الأنواع في عينة. نظرًا لأن تعريف الأنواع في الميكروبات أقل تحديدًا مقارنةً بالدراسات المتعلقة بالنباتات أو الحشرات، ونظرًا لأن دراسات الميكروبيوم عادةً ما تستند إلى التحليل الجيني، يمكن استخدام طرق أخرى للتجميع بدلاً من “الأنواع”. الأكثر شيوعًا، يتم تجميع التسلسلات الميكروبية المتشابهة للغاية في “وحدات التصنيف التشغيلية” (OTUs) أو “متغيرات تسلسل الأمبليكون” (ASVs)، والتي تعادل تقريبًا الأنواع أو السلالات، اعتمادًا على حدود هوية التسلسل المستخدمة. هنا، سنستخدم المصطلح الأكثر عمومية “التكسيات”، للإشارة إلى المعادل الميكروبي لـ “الأنواع”.
- تشاو1
مقدّر النقطة المعتمد على الغنى الملحوظ مع إضافة مصطلح يستنتج عدد الأنواع غير المرصودة -بسبب قيود تقنية التسلسل- ولكنها موجودة في العينة وفقًا لمعدل بين عدد الأنواع الفردية وعدد الأنواع المزدوجة. - ACE (مقدر التغطية المعتمد على الوفرة): مقدر نقطي يتبع نفس استراتيجية Chao1: خط أساس يتم تحديده من خلال الوفرة الملحوظة وإضافة تهدف إلى استنتاج الكائنات الدقيقة غير المرصودة ولكنها موجودة في العينة. الاختلاف يكمن في أن ACE يستخدم تقنية إحصائية أكثر تعقيدًا للاستنتاج. تتضمن هذه الاقتراح عتبة لتجميع الأنواع “النادرة” (غير الوفيرة) من الأنواع “غير النادرة”. في تقييم القيم التجريبية لهذا العمل، كانت نتائج Chaol و ACE مشابهة.
- صياد
” : مُقدِّر بارامتري أحادي المتغير ( القيمة) التي تفترض أن قيم الوفرة تتبع نموذج سلسلة لوغاريتمية. تم استخدامها على نطاق واسع في أبحاث الحشرات. المعامل ليس له تفسير بيولوجي. تأتي هذه المقياس من مجالات أخرى وبالتالي فإن اقتراحه البارامتري لا يتناسب جيدًا مع طبيعة العينات. - مارغاليف
تقترح هذه المقياس تصحيح التحيزات الناتجة عن التباينات في العينة من العدد الإجمالي للقراءات. - مينهينيك
: تتبع هذه المقياس نفس اقتراح مقياس مارغالييف، لكنه يختلف فقط في طريقة تحويل العدد الإجمالي للقراءات. يُبلغ مارغالييف عن غنى أقل مقارنةً بمقياس مينينك في العينات التي تحتوي على عدد كبير من الكائنات الدقيقة. تأتي إحدى القيود المحددة لكلا المقياسين (مارغالييف ومينينك) من حقيقة أنهما يستخدمان العدد الإجمالي للقراءات لتناسب التحيز المبلغ عنه. بهذه الطريقة، لا يميزون بين عدد الكائنات الدقيقة (الوفرة / الغنى) وكيفية توزيعها (الهيمنة). - الملاحظات: عدد الميزات الملاحظة الموجودة. قد تشير الميزات إلى متغيرات تسلسل الأمبليكون (ASVs) أو وحدات التصنيف التشغيلي (OTU) اعتمادًا على أداة إزالة الضوضاء.
- روبنز: هو نسبة بين عدد الأفراد الفردية وإجمالي عدد ASVs. بهذه الطريقة، نعتبر أن هذه المقياس لا ينبغي اعتباره كمقياس تنوع ألفا، بل كاحتمالية وجود الأنواع الموجودة وغير المرصودة في العينة.
هيمنة
- برجر-باركر
: هذه المقياس هو نسبة بين وفرة أكثر ASV وفرة وعدد ASVs في العينة. بهذه الطريقة، فإنه يُظهر المسافة بين ASV معين وأكثر ASV وفرة. بالمقارنة مع مقاييس الهيمنة الأخرى، فإنه سهل الحساب وله تفسير بيولوجي واضح. - سيمبسون
: يقيس احتمال أن ينتمي ميكروبيان تم اختيارهما عشوائيًا من عينة إلى نفس النوع. يُستخدم عادةً في أبحاث البيئة. بهذه الطريقة، يمثل الرقم 0 تنوعًا لانهائيًا و1، عدم وجود تنوع. أي أنه كلما زادت قيمة مقياس سيمبسون، انخفض التنوع. نظرًا لأن هذا غير بديهي، يتم عادةً طرح القيمة من 1. خيار آخر هو الحصول على القيمة العكسية ( في كلا الحالتين، القيمة الناتجة لا تتطابق مع تفسير بيولوجي. - الهيمنة: كما ورد في حزمة QIIME2 وغالبًا ما تستخدم في دراسات مختلفة. صيغتها هي 1-سيمبسون.
- ENSPIE (عدد الأنواع الفعال، احتمال اللقاء بين الأنواع): هذه المقياس يعادل عكس مقياس سيمبسون.
- جيني
: يقيس هذا المقياس عدم المساواة بين قيم توزيع التردد. يتم تطبيقه عادة في الاقتصاد ومن وجهة نظر مفاهيمية، هو الفرق في المساحة بين التوزيع التراكمي لثراء متساوي مثالي ومنحنى التوزيع الحقيقي للعينة، وفقًا لنموذج لورينز. يتراوح بين 0 و 1 حيث يشير 0 إلى أقصى درجة من التجانس و 1 تشير إلى أقصى درجة من عدم المساواة. بعد دراسة مفصلة ومحاكاة (لم يتم عرضها في هذا العمل) وُجد أن الافتراضات وإعدادات المعلمات المطلوبة لا تتناسب جيدًا مع بيانات الميكروبيوم. وهذا يتماشى مع نتائج الدراسة التجريبية لهذا العمل حيث وُجد أن متوسط قيمة جيني هو 0.99 وانحرافه المعياري هو 0.0083. - ماكنتوش
: تعبر هذه المقياس عن تباين عينة ما من الناحية الهندسية. تتطلب الصيغة استخدام متغير ( ) التي تحتوي على مسافة العينة من الأصل في حجم فرط بعدي S. لا توجد تفسير بيولوجي سهل الفهم يتعلق بهذه المتغير. لقد تم استخدامه قليلاً في الأدبيات. - قوي: هذه المقياس لديه اقتراح مفهومي مشابه لمؤشر جيني، ويتشاركون نفس الاستنتاجات والملاحظات.
التطور النشوء
- إيمان
: يقيس مقدار الشجرة النشوء والتطور التي تغطيها المجتمع. يتم حسابه بواسطة خوارزمية على الشجرة، وليس من صيغة رياضية. القيمة هي مجموع أطوال الفروع لشجرة النشوء والتطور التي تربط جميع الأنواع في التجمع المستهدف. بهذه الطريقة، تعني القيمة الأعلى المزيد
| فئة | اسم | تعبير | المعلمات | ||||
| غنى | تشاول |
|
|
||||
| ACE |
|
|
|||||
| Fisher |
|
|
|||||
| Margalef |
|
|
|||||
| Menhinick |
|
|
|||||
| Robbins |
|
|
|||||
| Dominance | Berger-Parker |
|
|
||||
| Simpson |
|
|
|||||
| ENSPIE |
|
|
|||||
| Gini |
|
|
|||||
| McIntosh |
|
|
|||||
| Strong |
|
|
|||||
| Information | Shannon |
|
|
||||
| Brillouin |
|
S: عدد الأنواع الملاحظة (مثل الأنواع، OTUs، ASVs، متغيرات التسلسل). | |||||
| Heip |
|
|
|||||
| Pielou |
|
|
الجدول 1. الصيغ الرياضية المستخدمة في مقاييس التنوع ألفا المدرجة في هذه الدراسة، مقسمة حسب الفئات المقترحة. لم يتم تضمين صيغة لمقياس فيث، تحت فئة النشوء، لأن المقياس لا يقوم بنهج رياضي ولكن نهج خوارزمي، والذي يتعرض لتغييرات مستمرة، ولكن بشكل أساسي يتم حسابه عن طريق جمع أطوال الفروع (أوزان الحواف) لشجرة النشوء التي تمثل حصريًا التسلسلات الموجودة في عينة بيولوجية.
الفروع، تعني المزيد من الثراء. لا يأخذ هذا المقياس في الاعتبار وفرة الأنواع ويعتمد على عمق التسلسل، وطريقة إزالة الضوضاء، وعمق التخفيف وشجرة النشوء
معلومات
- Shannon
: يقيس هذا المقياس عدم اليقين بشأن هوية الأنواع في العينة، ووحداته تقيس المعلومات. يأتي من نظرية المعلومات حيث يقيس إنتروبيا نظام، وقد كان أيضًا مؤشر تنوع شائع في الأدبيات البيئية. يعتمد هذا المقياس على حجم العينة ويهدف إلى تقديم متوسط مرجح، أو توليف، بين الثراء والهيمنة لعينة. تستمد مقاييس المعلومات الأخرى من هذه الصيغة. قد تكون العقبة الرئيسية في تفسير القيمة حيث أنه من غير الممكن معرفة ما إذا كانت التباين المعطى ناتجًا عن الثراء في العينة، أو هيمنتها أو كليهما. - Brillouin
: هذا المقياس لديه اقتراح نظري مشابه ونتائج لمقياس شانون، لكنه يفترض أنه لا يوجد عدم يقين في السكان الذين يتم تطبيق العينة عليهم. له أصول في علم البيئة وهو مفيد عندما يكون السكان بالكامل معروفين أو عندما لا يمكن ضمان عشوائية العينة. هذا المقياس غير قابل للتطبيق على بيانات التسلسل لأن اكتمال التعداد لا يمكن ضمانه. من الصعب حسابه، وتفسيره البيولوجي الصحيح أكثر صعوبة. - Heip
: يختلف هذا الاقتراح عن مؤشر شانون لأنه لا يعتمد على حجم العينة: إنه نسبة من الإنتروبيا. - Pielou
: هذا الاقتراح مشابه بشكل رئيسي لـ Heip لكنهما يختلفان في استراتيجية التطبيع. بينما يقسم Heip الإنتروبيا على العدد الإجمالي للأنواع، يقسم Pielou لوغاريتم العدد الإجمالي للأنواع.
اختيار مجموعات بيانات التسلسل لاختبار المقياس
تم تطبيق 19 مقياسًا مختارًا على بيانات تسلسل متاحة للجمهور من ملفات تسلسل العلامات الحيوية الريبوسومية 16 S، التي تم الحصول عليها من إجمالي 4,596 عينة براز تم وصفها في 13 دراسة ميكروبيوم بشري متاحة للجمهور نشرت من 2008 حتى الآن (انظر المعلومات التكميلية عبر الإنترنت، الجدول S2). تم استبعاد المشاريع إذا كانت تفتقر إلى بيانات وصفية مرتبطة، ولكن ليس إذا كانت هناك عينات مفقودة تم الإبلاغ عنها في البيانات الوصفية. يتم استخدام مصطلح “المجموعات المرجعية” لوصف ما يسمى عادةً “المشاركين الأصحاء”، وهو ما نجد أنه غير دقيق بسبب الطبيعة المعقدة للمجتمعات الميكروبية وتفاعلاتها مع المضيف. لذلك، من الأكثر دقة الإشارة إلى هذه المجموعات كمجموعات مرجعية أو مجموعات تحكم مرجعية
معالجة المعلومات الحيوية
تمت معالجة العينات التي تم تنزيلها باستخدام مجموعة أدوات QIIME2، المثبتة على بيئة conda على جهاز كمبيوتر شخصي يعمل بنظام Ubuntu 21.04. تمت إزالة العينات المحددة كأطراف مزدوجة التي كانت تحتوي فقط على قراءة واحدة. بعد إجراء QC لكل مجموعة بيانات بشكل مستقل (جودة القراءة، تقليم الموصل)، تم إجراء معالجة المعلومات الحيوية لجميع المشاريع معًا في خطين (qiime2 و dada2). كانت المعلمات وقواعد البيانات لتصنيف التصنيف هي نفسها لجميع المشاريع المعالجة. تم حساب مقاييس التنوع ألفا لكل عينة بشكل منفصل. بشكل خاص، تم استخدام DEBLUR لإزالة الضوضاء، وإزالة التكرار، وإزالة الشيميرا واختيار ASV.
تمت معالجة جميع مجموعات البيانات أيضًا باستخدام DADA2 للتحقق من تأثيرها على قيم الأحادية، ولكن تم إجراء جميع الاختبارات اللاحقة فقط على نتائج DEBLUR. وبالمثل، تم تخفيف جميع مجموعات البيانات إلى عمق تسلسل مناسب وفقًا للإجراءات القياسية للتحقق من ادعاءاتنا (البيانات متاحة في المستودع)، ولكن تم إجراء جميع الاختبارات باستخدام بيانات غير مخففة. تم إنشاء أشجار النشوء باستخدام مكون q2-phylogeny. تم حساب مقاييس التنوع ألفا المختارة لكل عينة باستخدام q2-diversity (من حزمة qiime2)، مجتمعة مع البيانات الوصفية، ومجمعة لجميع مجموعات البيانات. تم إنشاء نصوص Bash و Python لتوليد مقاييس ألفا بشكل منهجي على جميع الدراسات. بالنسبة لجميع التصورات والمقارنات اللاحقة، تم تصميم دفاتر Jupyter
مجموعات بيانات تركيبية
قمنا بإنشاء سبع مجموعات بيانات، كل منها يحتوي على حوالي 2,500 عينة. تضمنت كل عينة بين 50 و 500 ASVs مختلفة (بخطوات 10)، من 0 إلى 100 أحادية (أو
توفر البيانات
أرقام المشاريع (ورقم doi) لبيانات التسلسل الخاصة بالمشاريع الثلاثة عشر المستخدمة لإجراء التحليلات متاحة عبر الإنترنت في المعلومات التكميلية، الجدول S2. الشيفرة البرمجية ومجموعات البيانات التي تم إنشاؤها/تحليلها خلال الدراسة الحالية متاحة على https://github.com/MauroIb/alpha-diversities. المستودع متاح أيضًا مع
doi دائم عبر Zenodo على https://zenodo.org/record/8170289. لا تشمل العناصر الكاملة لـ QIIME حيث أن بيانات التسلسل الخام تعود لكل من مؤلفي مجموعة البيانات، ولكن يتم توفير المراجع الكاملة، ورموز SRA أو ما شابه، وجداول ASV والقيم المقابلة لتنوع ألفا لكل مجموعة بيانات داخل المستودع.
doi دائم عبر Zenodo على https://zenodo.org/record/8170289. لا تشمل العناصر الكاملة لـ QIIME حيث أن بيانات التسلسل الخام تعود لكل من مؤلفي مجموعة البيانات، ولكن يتم توفير المراجع الكاملة، ورموز SRA أو ما شابه، وجداول ASV والقيم المقابلة لتنوع ألفا لكل مجموعة بيانات داخل المستودع.
تاريخ الاستلام: 24 مارس 2024؛ تاريخ القبول: 25 أكتوبر 2024
تم النشر عبر الإنترنت: 03 يناير 2025
تم النشر عبر الإنترنت: 03 يناير 2025
References
- Leviatan, S., Shoer, S., Rothschild, D., Gorodetski, M. & Segal, E. An expanded reference map of the human gut microbiome reveals hundreds of previously unknown species. Nat. Commun. 13, 1-14 (2022).
- VanEvery, H., Franzosa, E. A., Nguyen, L. H. & Huttenhower, C. Microbiome epidemiology and association studies in human health. Nat. Rev. Genet. 1-16 (2022). https://doi.org/10.1038/s41576-022-00529-x
- After the Integrative Human Microbiome Project, what’s next for the microbiome community? Nature 569, 599 (2019).
- Lori, M. et al. Compared to conventional, ecological intensive management promotes beneficial proteolytic soil microbial communities for agro-ecosystem functioning under climate change-induced rain regimes. Sci. Rep. 101(10), 1-15 (2020).
- Aka, B. E. Z. et al. High-throughput 16 S rRNA gene sequencing of the microbial community associated with palm oil mill effluents of two oil processing systems. Sci. Rep.. 111(11), 1-12 (2021).
- Campanaro, S., Treu, L., Kougias, P. G., Zhu, X. & Angelidaki, I. Taxonomy of anaerobic digestion microbiome reveals biases associated with the applied high throughput sequencing strategies. Sci. Rep. 81(8), 1-12 (2018).
- Lawson, C. E. et al. Common principles and best practices for engineering microbiomes. Nat. Rev. Microbiol. 2019 1712(17), 725-741 (2019).
- Lloyd-Price, J. et al. Strains, functions and dynamics in the expanded Human Microbiome Project. Nat. 550, 61-66 (2017).
- Cullen, C. M. et al. Emerging priorities for microbiome research. Front. Microbiol. 11, 136 (2020).
- D’Argenio, V. & Salvatore, F. The role of the gut microbiome in the healthy adult status. Clin. Chim. Acta. 451, 97-102 (2015).
- Hughes, J. B., Hellmann, J. J., Ricketts, T. H. & Bohannan, B. J. M. Counting the uncountable: Statistical approaches to estimating microbial diversity. Appl. Environ. Microbiol. 67, 4399-4406 (2001).
- Thukral, A. K. A review on measurement of Alpha diversity in biology. Agric. Res. J. 54, 1 (2017).
- McIntosh, R. P. An index of diversity and the relation of certain concepts to diversity. Ecology. 48, 392-404 (1967).
- Goodrich, J. K., Davenport, E. R., Clark, A. G. & Ley, R. E. The relationship between the human genome and microbiome comes into view. Annu. Rev. Genet. 51, 413 (2017).
- Aydin, Ö., Nieuwdorp, M. & Gerdes, V. The gut microbiome as a target for the treatment of type 2 diabetes. Curr. Diab Rep. 18, 1-11 (2018).
- Ducarmon, Q. R., Hornung, B. V. H., Geelen, A. R., Kuijper, E. J. & Zwittink, R. D. Toward standards in clinical microbiota studies: Comparison of three DNA extraction methods and two bioinformatic pipelines. mSystems 5, (2020).
- Kim, B. R. et al. Deciphering diversity indices for a better understanding of microbial communities. J. Microbiol. Biotechnol. 27, 2089-2093 (2017).
- Lovell, D., Pawlowsky-Glahn, V., Egozcue, J. J., Marguerat, S. & Bähler, J. Proportionality: A valid alternative to correlation for relative data. PLOS Comput. Biol. 11, e1004075 (2015).
- Lozupone, C. A. & Knight, R. Species divergence and the measurement of microbial diversity. FEMS Microbiol. Rev. 32, 557-578 (2008).
- Reese, A. T. & Dunn, R. R. Drivers of microbiome biodiversity: A review of general rules, feces, and ignorance. MBio 9, (2018).
- Shen, X. J. et al. Molecular characterization of mucosal adherent bacteria and associations with colorectal adenomas. Gut Microbes. 1, 138-147 (2010).
- Su, X. Elucidating the beta-diversity of the microbiome: from global alignment to local alignment. mSystems. 6, 363-384 (2021).
- Callahan, B. J. et al. DADA2: High-resolution sample inference from Illumina amplicon data. Nat. Methods. 13, 581-583 (2016).
- Amir, A. et al. Deblur rapidly resolves single-nucleotide community sequence patterns. mSystems 2, (2017).
- Nearing, J. T., Douglas, G. M., Comeau, A. M. & Langille, M. G. I. Denoising the denoisers: An independent evaluation of microbiome sequence error- correction approaches. PeerJ e5364 (2018).
- Bolyen, E. et al. QIIME 2: Reproducible, interactive, scalable, and extensible microbiome data science. https://doi.org/10.7287/pee rj.preprints.27295v2
- Bolyen, E. et al. Reproducible, interactive, scalable and extensible microbiome data science using QIIME 2. Nat. Biotechnol. 37, 852-857 (2019).
- Willis, A. D. Rarefaction, alpha diversity, and statistics. Front. Microbiol. 10, 2407 (2019).
- Chao, A. Nonparametric estimation of the number of classes in a population. Scand. J. Stat. 11, 265-270 (1984).
- Fisher, R. A., Corbet, A. S. & Williams, C. B. The relation between the number of species and the number of individuals in a random sample of an animal population. J. Anim. Ecol. 12, 42-58 (1943).
- Margalef, R. Diversidad de especies en las comunidades naturales.
- Menhinick, E. F. A comparison of some species-individuals diversity indices applied to samples of field insects. Ecology. 45, 859861 (1964).
- Berger, W. H. & Parker, F. L. Diversity of planktonic foraminifera in deep-sea sediments. Sci. (80-). 168, 1345-1347 (1970).
- Simpson, E. H. Measurement of diversity [16]. Nature. 163, 688 (1949).
- Gini, C. Variabilità e mutabilità: Contributo allo studio delle distribuzioni e delle relazioni statistiche.[Fasc. I] (Tipogr. di P. Cuppini, 1912).
- Faith, D. P. Conservation evaluation and phylogenetic diversity. Biol. Conserv. 61, 1-10 (1992).
- Chao, A., Chiu, C. H. & Jost, L. Phylogenetic diversity measures based on Hill numbers. Philos. Trans. R. Soc. B Biol. Sci. 365, 3599-3609 (2010).
- Chao, A. et al. Rarefaction and extrapolation with Hill numbers: A framework for sampling and estimation in species diversity studies. Ecol. Monogr. 84, 45-67 (2014).
- Shannon, C. E. A mathematical theory of communication. Bell Syst. Tech. J. 27, 379-423 (1948).
- Pielou, E. C. Ecological Diversity (Wiley InterScience, 1975).
- Heip, C. A. New index measuring evenness. J. Mar. Biol. Assoc. United Kingd. 54, 555-557 (1974).
- Pielou, E. C. & others. An introduction to mathematical ecology. (New York, USA, Wiley-Inter-science, 1969).
- Moles, L. & Otaegui, D. The impact of diet on microbiota evolution and human health. Is diet an adequate tool for microbiota modulation? Nutrients 12, (2020).
- Rinninella, E. et al. What is the healthy gut microbiota composition? A changing ecosystem across age, environment, diet, and diseases. Microorganisms. 7, 14 (2019).
- Sayers, E. W. et al. Database resources of the national center for biotechnology information. Nucleic Acids Res. 50, D20 (2022).
- Kanz, C. et al. The EMBL nucleotide sequence database. Nucleic Acids Res. 33, D29 (2005).
- Kluyver, T. et al. Jupyter Notebooks — a publishing format for reproducible computational workflows. In Positioning and Power in Academic Publishing: Players, Agents and Agendas (eds. Loizides, F. & Schmidt, B.) 87-90 (2016).
- Balena, F. & Fawcette, J. Programming Microsoft Visual Basic 6.0 vol. 1 (Microsoft press Washington, 1999).
- pandas development team, T. pandas-dev/pandas: Pandas. (2020). https://doi.org/10.5281/zenodo. 3509134
- Harris, C. R. et al. Array programming with {NumPy}. Nature. 585, 357-362 (2020).
- Virtanen, P. et al. {SciPy} 1.0: Fundamental algorithms for scientific computing in python. Nat. Methods. 17, 261-272 (2020).
- R Core Team. R: A language and environment for statistical computing. (2021).
- Plotly Technologies Inc. Collaborative data science Publisher: Plotly Technologies Inc. (2015).
- Waskom, M. Seaborn: Statistical data visualization. J. Open. Source Softw. 6, 3021 (2021).
الشكر والتقدير
يرغب المؤلفون في شكر الدكتورة إليزابيث بيك على مراجعتها المفيدة والنقدية للمنشور بالكامل، وكذلك المراجعين على الملاحظات والاقتراحات الرئيسية التي حسنت من فهم وتأثير هذه المقالة.
مساهمات المؤلفين
جمع IC البيانات، واقترح أدوات التحليل الإحصائي، وكتب الورقة. جمع MI المراجعات النظرية والوصف الرياضي، وأنشأ مجموعات البيانات التركيبية، وأجرى التجارب، ونفذ الأدوات (الشيفرة والمستودعات)، وأجرى تحليل النتائج، وكتب الورقة. JPB: تصور البحث، وراجع المسودة بشكل نقدي للمحتوى الفكري المهم، والمراجعة، والتحرير. ساهم جميع المؤلفين في المقالة ووافقوا على النسخة المقدمة.
الإعلانات
المصالح المتنافسة
يعلن المؤلفون عدم وجود مصالح متنافسة.
معلومات إضافية
المعلومات التكميلية النسخة عبر الإنترنت تحتوي على مواد تكميلية متاحة على https://doi.org/1
يجب توجيه المراسلات والطلبات للحصول على المواد إلى J.P.B.
معلومات إعادة الطبع والتصاريح متاحة على www.nature.com/reprints.
ملاحظة الناشر تظل Springer Nature محايدة فيما يتعلق بالمطالبات القضائية في الخرائط المنشورة والانتماءات المؤسسية.
يجب توجيه المراسلات والطلبات للحصول على المواد إلى J.P.B.
معلومات إعادة الطبع والتصاريح متاحة على www.nature.com/reprints.
ملاحظة الناشر تظل Springer Nature محايدة فيما يتعلق بالمطالبات القضائية في الخرائط المنشورة والانتماءات المؤسسية.
الوصول المفتوح هذه المقالة مرخصة بموجب رخصة المشاع الإبداعي للاستخدام والمشاركة والتكيف والتوزيع وإعادة الإنتاج في أي وسيلة أو تنسيق، طالما أنك تعطي الائتمان المناسب للمؤلفين الأصليين والمصدر، وتوفر رابطًا لرخصة المشاع الإبداعي، وتوضح ما إذا كانت هناك تغييرات قد تم إجراؤها. الصور أو المواد الأخرى من طرف ثالث في هذه المقالة مشمولة في رخصة المشاع الإبداعي للمقالة، ما لم يُذكر خلاف ذلك في سطر الائتمان للمادة. إذا لم تكن المادة مشمولة في رخصة المشاع الإبداعي للمقالة واستخدامك المقصود غير مسموح به بموجب اللوائح القانونية أو يتجاوز الاستخدام المسموح به، ستحتاج إلى الحصول على إذن مباشرة من صاحب حقوق الطبع والنشر. لعرض نسخة من هذه الرخصة، قم بزيارة http://creativecommons.org/licenses/by/4.0/.
© المؤلفون 2025
© المؤلفون 2025
كلية الهندسة، جامعة أسترال، LIDTUA، CIC، بوينس آيرس، الأرجنتين. كلية الهندسة، الجامعة الوطنية في إنتري ريوس، أورو فيردي، الأرجنتين. كونيسيت، بوينس آيرس، الأرجنتين. إغناسيو كاسول وماورو إيبانيز: مساهمات متساوية. البريد الإلكتروني: jbustamante@austral.edu.ar
Journal: Scientific Reports, Volume: 15, Issue: 1
DOI: https://doi.org/10.1038/s41598-024-77864-y
PMID: https://pubmed.ncbi.nlm.nih.gov/39753610
Publication Date: 2025-01-03
DOI: https://doi.org/10.1038/s41598-024-77864-y
PMID: https://pubmed.ncbi.nlm.nih.gov/39753610
Publication Date: 2025-01-03
OPEN
Key features and guidelines for the application of microbial alpha diversity metrics
Studies of microbial communities vary widely in terms of analysis methods. In this growing field, the wide variety of diversity measures and lack of consistency make it harder to compare different studies. Most existing alpha diversity metrics are inherited from other disciplines and their assumptions are not always directly meaningful or true for microbiome data. Many existing microbiome studies apply one or some alpha diversity metrics with no fundamentals but also an unclear results interpretation. This work focuses on a theoretical, empirical, and comparative analysis of 19 frequently and less-frequently used microbial alpha diversity metrics grouped into
The analysis of the composition of microbial communities has led to better insights in the roles that microbes play in human health
Two common measures reported in many microbiome studies are alpha- and beta-diversity. Alpha diversity is a general term for metrics that describe the species richness, evenness, or diversity within a sample. In contrast, beta-diversity measures compare the similarity of two or more communities
Most existing alpha diversity metrics are inherited from other disciplines, such as plant or insect biodiversity studies
Due to the relative novelty of microbiome studies as a discipline, there is a lack of consensus and standardization processes among researchers and clinicians. This creates significant challenges in obtaining, analyzing,
visualizing, interpreting, and comparing human microbiome data robustly, particularly as these practices move towards clinical applications
Results
Alpha metrics used in 68 microbiome studies or in the QIIME 2 suite were grouped into four categories after performing a detailed theoretical analysis of each metric’s mathematical formula (see Methods section for a detailed explanation). The proposed categories with their associated metrics are:
- Richness: Chao1, ACE, Fisher, Margalef, Menhinick, Observed, and Robbins.
- Dominance (also known as evenness): Berger-Parker, Dominance, Simpson, ENSPIE, Gini, McIntosh, and Strong.
- Phylogenetics: Faith.
- Information: Shannon, Brillouin, Heip and Pielou.
The 19 selected alpha diversity metrics were calculated for the sequence datasets obtained for a total of 4,596 stool samples included in 13 publicly available human microbiome projects (Table S3). All sequence data were reanalyzed for this paper using the same data processing pipeline, as described in Methods.
Throughout this study, we identified two key factors relevant to the estimation of different alpha diversity metrics, as discussed in the Methods section (Theoretical Analysis): The total number of Amplicon Sequence Variants (ASVs), and ASVs with only one read (singletons). It was verified that sequencing depth had no impact on the total number of ASVs and singletons (Supplementary Information, Figure S2, Table S3). Given this, alpha diversity metrics were calculated with non-rarefied data to preserve as much information as possible when calculating them. All results were also validated using rarefied datasets. As described in Methods, all samples were processed using DADA2 and DEBLUR. It is important to note that DADA2 removes all singletons from the samples as part of its denoise algorithm. Since the number of singletons is needed to calculate some of the alpha diversity metrics, all following analyses were performed with the data produced with DEBLUR. Figure 1 shows all samples according to their observed features (total number of observed ASVs) and singletons values. Figure 1A shows that values from metrics included in the Richness category depend on these two key factors. The color scale for each graph depicts the normalized value of each metric (min-max normalization). All Richness metrics increase as there are more observed ASVs, except Robbins which depends on the number of identified singletons. Figure 1B shows Dominance metrics values according to the corresponding factors. In this category, analysis is more complex and requires detailed considerations. Berger-Parker and ENSPIE values tend to decrease when the number of ASVs increases. Due to the Simpson calculation formula, the previous trend is also present but with the opposite sign (dominance values close to the origin tend to decrease). Dominance values tend to decrease when singletons increase and the number of ASVs is less than 200 (for Strong and Simpson metrics, the opposite sign should be applied due to formula calculation). Figure 1C contains the same analysis applied to metrics in the Information category. Since all information metrics are constructed using the Shannon formula, they are expected to exhibit similar behavior, as observed. Conversely, in the Shannon, Pielou, and Brillouin plots, the behavior identified in the dominance category is observed in samples with fewer than 60 singletons and fewer than 200 ASVs, but reversed, with values tending to decrease. Figure 1D shows Faith values according to the two factors, indicating that this metric depends independently on both factors. Samples with low Faith values that do not follow previous trends (located in the center of the plot) are isolated to the
Within each proposed category, Pearson’s linear correlation coefficient and Spearman ‘s rank correlation coefficients were calculated to identify correlations among metrics. Detailed scatter matrices showing the correlations between each category are included in the online Supplementary information (Supplementary Figures Sla to S1c). In the richness category (S1a), Chaol and ACE show the strongest linear correlation between them, while Margalef and Robbins show some variation, but are still highly correlated to Chao and ACE. Menhinick presents a slope variation that is dataset dependent. Robbins, as shown before, is calculated based on the total number of singletons instead of number of ASVs, and no strong correlation is found. All richness metrics except Robbins are highly correlated with each other and the number of ASVs, implying that differences in their formula have no relevant impact when applied to microbiome data.
Strong nonlinear correlations can also be observed between dominance metrics (S1b). Dominance and ENSPIE are variations of the Simpson metric, and are strongly correlated with each other as expected. McIntosh and Berger-Parker are also correlated to these metrics. It is of particular interest that Berger-Parker has a clearer biological interpretation from its mathematical formula (the proportion of the most abundant taxa). Figure 2 presents, for each metric in the Dominance category, a linear regression using all samples, with the X -axis representing the Berger-Parker value and the Y -axis representing the corresponding metric value. The McIntosh and Simpson models show a good fit. In the case of ENSPIE, an exponential transformation fits better than a linear model. The Gini index does not fit well in this model, nor does it fit well when a correlation model is applied to all dominance metrics.
Faith is the phylogenetic metric most applied in experimental studies (See Supplementary table S1). Observed features and singletons are determinant factors, as shown in Fig. 1D. Based on this analysis, a local polynomial regression fitting was applied on the relationship between observed features (the selected metric proposed
Fig. 1. Relationship between singletons ( Y axis) and the number of ASVs ( X axis) of the 4,596 samples. All plots display the same data points, but each plot was colored according to a different alpha diversity metric. Colors on plots A, B, C and D correspond to a normalized value (proportion) of the corresponding alpha metric. (A) The scatter plot of the metrics grouped in the Richness category (minus the Observed metric, which are the values on the X axis), (B)Dominance metrics, (C) shows Information metrics and (D) Faith metric (phylogenetics). (E) Depicts samples colored according to the 16 S amplified region and the original study.
Fig. 2. Scatter plot of each dominance metric between the corresponding value of the metric ( Y axis) and Berger-Parker value ( X axis) of the 4,596 samples.
as representative for the Richness category in the Discussion section) and Faith, for each dataset. Figure 3A shows that the calculated regression models are close to a polynomial regression, and that the determination coefficients
Fig. 3. Scatter plot and local polynomial regression fitting between Faith metric ( X axis) versus (A) Observed features and (
A similar behavior can be observed between metrics in the Information category (S1c) where all metrics show strong correlation between them. This is expected as all information metrics use Shannon’s entropy as a reference in their mathematical formulation, and its implications will be further discussed in the Discussion section.
After carrying out empirical experiments on publicly available human microbiome data, we validated our findings by applying the alpha diversity metrics to 7 synthetics datasets (See Methods, Supplementary Figure S6 and S7). For most metrics their value range changed depending on the distribution, but after performing a min-max normalization to analyze their behavior, we did not see meaningful differences related to the aim of this work between distributions. Following our previous findings, most abundance metrics increase according to variations on the total number of ASVs, except for Robbins that is influenced by the presence or absence of singletons within the sample. Dominance metrics were particularly affected by the artificial unevenness ratios (2x, 10x and 100x). Finally, information metrics increased when ASVs also increased, and decreased when there is an imbalance in the microbiome.
Practical recommendations taken from observations and theoretical analysis
From the theoretical analysis conducted in the Methods section (see Theoretical Analysis subsection), we identified four categories that group the metrics according to the aspect of alpha diversity they focus on. Within each category, the metrics share similar objectives and related formulas. While considering all metrics results in significant diversity in their formulations, this complexity makes the analysis challenging. However, our analyses revealed that many of these metrics are highly correlated with each other, indicating that the complexity in the formulations is not reflected in the achieved results. Therefore, we recommend using the simplest metric within each category that demonstrates behavior similar to that of the more complex counterparts.
Taking this into account, along with the observations described above and the theoretical analysis of each metric’s mathematical formulation, we have developed a set of final practical recommendations to be considered for future studies:
- Report the bioinformatics tool used to perform the denoise process and inform the singleton values to better evaluate richness and dominance metrics.
- Provide at least one metric from each of the following complementary alpha diversity categories: Richness, Dominance, Information and Phylogenetics. The recommended eligible metrics are mentioned in the following bullet points.
- For the Richness category one of the following metrics should be informed: Observed, ACE, Chaol, Fisher, Margalef, McIntosh and Menhinick. Any of the previous metrics could be used because they are all correlated;
however, we recommend reporting the number of observed features given the simplicity of its calculation technique and its intuitive biological interpretation. We also propose the inclusion of the Robbins value (the probability of not observing present taxa in the sample). - For the Dominance category, we recommend using the Berger-Parker metric, which indicates the proportion of the most abundant taxa relative to all others. When high dominance is observed in a sample, it is advisable to identify the most predominant microbe. If the predominant microbe can be identified at the species taxonomic rank, or even at the strain level, it is recommended to report its functional annotations as a preliminary step for potential further functional analysis. These annotations could include GO terms, Clusters of Orthologous Genes (COGs) abundances, possible KEGG annotations, or similar functional data. However, if it is not possible to identify the microbe at the species level and only a higher taxonomic rank is identified, functional annotations from amplicon sequencing are not recommended. This is because their robust resolution is still debated and may not provide reliable insights.
- For the Phylogenetic category, report the Faith value.
- Report the Shannon value to inform not only the entropy but also as a parameter that summarizes/weighs both richness and dominance categories in one value (see Discussion section).
- Include a biological interpretation and conclusions for each reported metric considering the microbiome’s aspect it measures, as well as an interpretation of all metrics collectively.
- Alpha diversity metrics for samples processed under different 16 S amplicons should not be compared, as this was proven to affect the number of observed features and singletons observed, and consequently, the calculated values of the metrics.
Discussion
The processing of microbiome sequencing raw data presents numerous bioinformatic challenges to achieve unbiased results, including tasks such as merging and removing primers and barcodes, denoising, dereplication, chimera removal, and taxonomic classification, among others. Moreover, the study of microbiota diversity encompasses diverse and distinct concepts that should be separately considered. For instance, within alpha diversity, metrics like dominance and richness capture distinct aspects of community composition and structure. Meanwhile, within beta diversity, methodologies such as distance calculation methods and dimension reduction techniques are crucial for understanding compositional differences between microbial communities. For this purpose, metrics used to characterize these concepts and the tools that enable their estimation have been adapted from other disciplines, such as the study of animal and plant communities, economics, sociology, or mining
Based on this, our focus has been on the fundamentals, assumptions, and formula calculations for selected metrics. Some metrics were excluded because they were not used by the scientific community on recent microbiota studies (Esty, Good’s coverage of counts) or their mathematical formula is complex, derived from a previous one, with its underlying concept close to another with a simpler formula (Renyi entropy, Tails, Kempton Taylor’s Q, Lladser’s point estimate, Rao, InvSimpson) or their fundamentals and assumptions are not directly applicable to microbiota data (Hill, Esty). Metrics selected were primarily focused on one alpha diversity aspect, ensuring consistency in assumptions and formulas. Under these considerations, we identified four distinct categories that complement each other and collectively provide a comprehensive overview of alpha diversity. The following paragraphs include a brief explanation of each proposed category along with the recommended metrics:
Richness
The number of different microorganisms in a sample. In experimental studies, instead of the number of observed microorganisms (detected by the sequencing technique) it is more relevant to estimate the number of present microorganisms in the population. The number of microorganisms not observed but present in a sample is usually estimated through singletons reads, i.e., a sequence detected only once within the sample. From a bioinformatic point of view, these reads can be treated as sequencing error candidates or, conversely, relevant information to infer low-abundance microorganisms that are present in the sample but not sequenced. Under this assumption, some alpha diversity metrics (Chaol, for example) attempt to estimate the real richness from the low-abundance information. In this way, the bioinformatic analysis of singletons is also a challenge because tools that perform the denoise process have different algorithmic approaches. DADA2
Dominance
The degree of balance (or evenness) observed in the richness distribution of microorganisms in a sample. The goal of this category of metrics is to inform if some microorganisms are dominant over others in terms of richness. After observing each formula calculation of the metrics grouped in the dominance category and the result of applying them to the 4,596 samples, it was found that Berger-Parker (the metric that reflects the ratio between the most dominant microorganism and all other microorganisms in the sample) best represents this
category. As it is correlated with the proportion between the most dominant over the second most dominant microorganism (see online Supplementary Information, Figure S5), it could be considered that the two most dominant microorganisms are determinant factors of dominance metric value, no matter the selected metric to inform about this category. One identified benefit of providing Berger-Parker as a reference metric of Dominance category is that the biological meaning of the reported metric is clearer and easy to inform, namely the proportion of the most dominant microbe over the total number of microbes present in the sample.
category. As it is correlated with the proportion between the most dominant over the second most dominant microorganism (see online Supplementary Information, Figure S5), it could be considered that the two most dominant microorganisms are determinant factors of dominance metric value, no matter the selected metric to inform about this category. One identified benefit of providing Berger-Parker as a reference metric of Dominance category is that the biological meaning of the reported metric is clearer and easy to inform, namely the proportion of the most dominant microbe over the total number of microbes present in the sample.
Phylogenetics
It is a measure of biodiversity that informs the phylogenetic distance between microbes within a corresponding sample. This category, unlike the other ones, is not inherited from other disciplines. Faith is the only Phylogenetic metric broadly adopted in experimental studies, and its value is strongly linked to the number of observed features and singletons.
Information
It is a measure inherited from the physics discipline thought to inform the entropy of a system. Shannon is the most used in experimental studies and, in fact, other metrics included in this category (Brilloun, Heip y Pielou) use this metric as a reference. In microbiome studies the Shannon index is supposed to reflect how many different microbes are in the sample and how evenly they are distributed within a sample: it is a number that aims to encompass and integrate richness and dominance information. The more microbes in a sample are, the higher the value for the Shannon index is; and the less the inequality of relative abundances is, the higher the Shannon index is too. Since the three proposed metrics as representative for the categories Information (Shannon), Richness (Observed_features) and Dominance (Berger-Parker) are correlated (Supplementary information, Figure S5) we state that, if richness and dominance metrics are reported, then Shannon does not provide new information to the alpha diversity big picture. Furthermore, the Shannon value is elusive to interpret from a biological point of view. On the other hand, if Shannon is the only reported metric in a given study, it could also be assumed that it provides a weighted/synthesized representation of information and richness categories, in just one value. Thereby, the complex nature of the biological interpretation of this metric remains an issue.
Practical examples and applications. Taking into consideration the previously proposed metrics under their respective categories, practical examples of how these recommendations can enhance studies are as follows. Three examples are illustrated and described (Fig. 4), utilizing data from two analyzed studies (projects 471_ swedish and 514_imp_project, according to Table S3 codes). These practical examples aim to demonstrate how implementing these recommendations in result analysis enhances the quality and comprehensiveness of information, facilitating improved interpretation when working with microbiome data.
Example 1 In this first case (project 471_swedish), the dominance (or evenness) category was not computed. The authors reported an increase in alpha diversity (specifically reported as richness, computed using phylogenetic diversity) as children grew older, which is accurate. However, the dominance category offers additional insights into this observation, demonstrating that as richness increases, dominance decreases (Fig. 4.A). Considering this provides complementary information that can illuminate aspects not previously addressed, as these were obscured by metrics that do not incorporate this information. In essence, as individuals in the trial age, both the number and diversity of observed microbes increase, as measured by the phylogenetic diversity metric (and also by observed features). Furthermore, this biological interpretation introduces a new perspective: with increasing age, there is a reduced dominance of previously predominant microbes identified in newborn cases, possibly reflecting microbial community colonization and stabilization over time.
Example 2 In the second case (project 514_imp_project), among the five proposed metrics, the authors reported Shannon and Faith, which showed the highest variance. However, upon analyzing the total observed features, singletons (using Robbins), and evenness in dominance, no significant differences were observed (Fig. 4.B). In this context, emphasizing Faith may have a greater impact, suggesting that any observed differences could be attributed more to phylogenetic origins and/or adaptations. Considering this, only a comprehensive comparison of all five metrics enables us to hypothesize about phylogenetic origins/adaptations, as other aspects showed no substantial differences. Standardizing alpha diversity reporting according to these recommended metrics will facilitate a more comprehensive description of such scenarios, utilizing all available information effectively.
Example 3 Finally, the third example is drawn from the same project 514_imp_project, where no dominance metrics were computed. According to Robbins (Fig. 4.B), there appears to be a subsampling artifact in the KarenThai cohort, indicated by a higher mean estimate of unobserved microbes compared to the others. This suggests that alpha diversity metrics might exhibit different trends if the KarenThai cohort were more representative of its true diversity. This hypothesis, if validated, could yield different results for this cohort compared to others, influencing biological interpretations due to potential subsampling issues. Essentially, the diversity observed in the KarenThai cohort may differ from what is reported. To verify this, a new sampling approach should encompass a broader range of microbiome patterns, involving a larger sample size from the trial.
These recommendations are applicable to both existing and future research studies, enhancing the standardization, consistency, and robustness of analyses conducted. This approach aims to improve the capture of biological diversity and, consequently, enhance interpretations of microbiome data.
Fig. 4. Boxplots of each recommended alpha diversity metric for two datasets analyzed in this article, 471_ swedish (A) and 514_imp_project (B). Metrics with an asterisk (*) were reported by authors in their original studies.
Methods
Selection of alpha diversity metrics
Alpha diversity metrics included in this study were selected from a detailed examination of 68 microbiome studies (see online Supplementary Information, Table S1) conducted on human or animal samples, or that are included in the bioinformatics suite QIIME 2.
68 studies were selected to identify the most applied alpha diversity metrics in research articles. Scientific projects published after 2008 that performed the sequencing of the 16 S ribosomal biomarker were included. The most recent studies ( 10 from 2019, 12 from 2020 to 3 from 2021) were prioritized, although three older ones (2008, 2010 and 2012) were also included due to their experimental design quality and sample size. These studies perform at least one of the following alpha diversity metrics: Chaol, Shannon, richness, Berger-Parker, ACE, Simpson, Faith and Jost. All these metrics are included in this work except for the Jost metric, designed for ecological communities. Its main assumption is based on the formula
In addition, alpha metrics implemented in the QIIME2
Theoretical analysis
The theoretical analysis performed on each metric was carried out by considering which aspect of biodiversity is measured, which scientific discipline the metric was derived from, how often it is applied in the microbiota field, the variables that appreciably affect/impact the proposed metric and whether the metric includes an estimation or is reflecting observed data, i.e. if the metric is generating a new concept (like information theory, entropy, evenness) or is it just an alias for a quantitative value that is intrinsic to the dataset (number of ASVs, singletons)
each selected alpha metric, grouped into these four categories (see Table 1 for the corresponding mathematical formulas, together with their key involved parameters).
each selected alpha metric, grouped into these four categories (see Table 1 for the corresponding mathematical formulas, together with their key involved parameters).
Richness
These metrics report on the number of species in a sample. Since species definition in microbes is less defined than in e.g., plant or insect studies, and since microbiome studies usually are based on genetic analysis, other methods of grouping can be used instead of “species”. Most commonly, highly similar microbial sequences are grouped into “OTUs” (operational taxonomic units) or “ASVs” (amplicon sequence variants), which roughly equate species or strains, depending on which sequence identity cutoffs are used. Here, we will use the more general term “taxa”, to indicate the microbial equivalent of “species”.
- Chao1
: Point estimator based on observed richness with an added term that infers the number of taxa not observed -due to sequence technique constraints- but present in the sample according to a rate between the number of singletons and the number of doubletons. - ACE (Abundance-based Coverage Estimator): Point estimator that follows the same strategy of Chao1: a baseline given by the observed abundance and an addition aimed to infer the microorganisms not observed but present in the sample. The difference relies on the fact that ACE applies a more sophisticated statistical technique for the inference. This proposal includes a threshold to cluster “rare” taxa (not abundant) from “not rare” ones. In the empirical values evaluation of this work Chaol and ACE have similar results.
- Fisher
: A univariate parametric estimator ( value) that assume that abundance values follow a logarithmic series model. It was widely used in entomological research. The parameter has no biological interpretation. This metric comes from other disciplines and therefore its parametric proposal does not fit very well to the nature of the samples. - Margalef
: This metric proposes to correct biases caused by variations in sampling from the total number of reads. - Menhinick
: This metric follows the same proposal of Margalef metric, but it differs only in the way to transform the total number of reads. Margalef reports a lower richness over Menhinick in samples with a large number of microorganisms. An identified constraint of both metrics (Margalef and Menhinick) comes from the fact that they use the total number of reads to fit the reported bias. In this way they do not discriminate between the number of microorganisms (abundance / richness) and how they are distributed (dominance). - Observed: The number of observed features present. Features may refer to Amplicon Sequence Variant (ASVs) or Operational Taxonomic Units (OTU) depending on the denoising tool.
- Robbins: Is a proportion between the number of singletons and the total number of ASVs. In this way, we consider that this metric should not be considered as an alpha metric diversity but a likelihood of the existence of present and not observed taxa in the sample.
Dominance
- Berger-Parker
: This metric is a ratio between the abundance of the most abundant ASV and the number of ASVs in the sample. In this way, it informs the distance of a given ASV from the most abundant ASV. Compared with other dominance formula metrics, it is easy to calculate and has a clear biological interpretation. - Simpson
: Measures the probability that two microorganisms randomly selected from a sample belong to the same species. It is usually used in ecology research. In this way, 0 represents infinite diversity and 1 , no diversity. That is, the bigger the Simpson metric, the lower the diversity. As this is unintuitive the value is usually subtracted from 1 . Another option is to obtain the inverse value ( ). In both cases the resulting value does not match with a biological interpretation. - Dominance: As reported by the QIIME2 package and is often used in different studies. Its formula is 1-Simpson.
- ENSPIE (Effective Number of Species, Probability of Interspecific Encounter): This metric is equivalent to the inverse of the Simpson metric.
- Gini
: This metric measures the inequality among values of a frequency distribution. It is usually applied in economics and, from a conceptual point of view, is the area difference between the cumulative distribution of a perfect evenness richness and the real distribution curve of the sample, following the Lorenz model. It ranges between 0 and 1 where 0 corresponds to a maximum degree of homogeneity and 1 indicates the maximum degree of inequality. After a detailed study and a simulation (not shown in this work) it was found that assumptions and required parameter settings do not fit well to microbiome data. It is coherent with the empirical study results of this work where it was found that mean Gini value 0.99 and its standard deviation 0.0083. - McIntosh
: This metric expresses the heterogeneity of a sample in geometric terms. Formula requires the use of a variable ( ) that contains the distance of the sample from the origin in an S dimensional hypervolume. There is no easily understandable biological interpretation related to this variable. It has been little used in literature. - Strong: This metric has a similar Gini conceptual proposal, and they share the same conclusions and remarks.
Phylogenetic
- Faith
: Measures the amount of the phylogenetic tree covered by the community. Its calculation is performed by an algorithm on a tree, not from a mathematical formula. The value is the sum of the branch lengths of a phylogenetic tree connecting all species in the target assemblage. In this way, a higher value means more
| Category | Name | Expression | Parameters | ||||
| Richness | Chaol |
|
|
||||
| ACE |
|
|
|||||
| Fisher |
|
|
|||||
| Margalef |
|
|
|||||
| Menhinick |
|
|
|||||
| Robbins |
|
|
|||||
| Dominance | Berger-Parker |
|
|
||||
| Simpson |
|
|
|||||
| ENSPIE |
|
|
|||||
| Gini |
|
|
|||||
| McIntosh |
|
|
|||||
| Strong |
|
|
|||||
| Information | Shannon |
|
|
||||
| Brillouin |
|
S: number of observed taxa (e.g., species, OTUs, ASVs, sequence variants). | |||||
| Heip |
|
|
|||||
| Pielou |
|
|
Table 1. Mathematical formulas used in the alpha diversity metrics included in this study, grouped by suggested categories. A formula for the Faith metric, under the Phylogenetic category, was not included because the metric does not perform a mathematical approach but an algorithmic one, which is continuous suffering changes, but basically it is computed by summing the branch lengths (edge weights) of the phylogenetic tree that exclusively represents the sequences contained in a biological sample.
branches, means more richness. This metric does not consider species abundances and depends on the sequencing depth, denoising method, rarefaction depth and phylogenetic tree
Information
- Shannon
: This metric measures uncertainty about the identity of species in the sample, and its units quantify information. It comes from Information Theory where it quantifies the entropy of a system, and it has also been a popular diversity index in ecological literature. This metric depends on the sample size and intends to provide a weighted average, or a synthesis, between the richness and the dominance of a sample. Other information metrics derive from this formula. The main hurdle could be found in the interpretation of the value since it is not possible to know if a given variance is due to richness in the sample, or its dominance or both. - Brillouin
: This metric has a similar theoretical proposal and results than Shannon metric, but it assumes that there is no uncertainty in the population from where sampling is applied. It has its origins in ecology and is useful when the entire population is known or when the randomness of the sample cannot be guaranteed. This metric is not applicable to sequencing data because the completeness of the census cannot be guaranteed. It is difficult to calculate, and its correct biological interpretation even more difficult. - Heip
: This proposal differs on the Shannon index since it does not depend on the sample size: it is a proportion of entropy. - Pielou
: This proposal is mainly similar to Heip but they differ in the normalization strategy. While Heip divides the entropy by the total number of taxa, Pielou divides the log of the total number of taxa.
Selection of sequence datasets for metric testing
The 19 selected metrics were applied to publicly accessible sequence data from 16 S ribosomal biomarker sequencing files, obtained from a total of 4,596 stool samples described in 13 publicly available human microbiome studies published from 2008 to the present (see online Supplementary Information, Table S2). Projects were excluded if they lacked associated metadata, but not if there were missing samples reported in the metadata. The term “reference cohorts” is used to describe what are usually called “healthy participants”, which we find to be imprecise due to the complex nature of microbial communities and their interactions with the host. Therefore, it is more accurate to refer to these groups as reference cohorts or reference control groups
Bioinformatic processing
Downloaded samples were processed with the QIIME2 tool suite, installed on a conda environment on a personal computer with Ubuntu 21.04. Samples identified as paired-end that only had a single read were removed. After performing QC for each dataset independently (read quality, adapter trimming), bioinformatic processing of all projects was performed altogether in two pipelines (qiime2 and dada2). Parameters and databases for taxonomy classification were the same for all processed projects. Alpha diversity metrics were computed for each sample separately. Particularly, DEBLUR was used for noise removal, dereplication, chimera removal and ASV selection.
All datasets were also processed with DADA2 to verify its impact on singleton values, but all further tests were performed only on the DEBLUR results. Likewise, all datasets were rarefied to a suitable sequencing depth following standard procedures to validate our claims (data available in repository), but all tests were performed with non-rarefied data. Phylogenetic trees were created using the q2-phylogeny plugin. Selected alpha diversity metrics were calculated for each sample using q2-diversity (from qiime2 package), combined with the metadata, and aggregated for all datasets. For systematic alpha metrics generation on all studies, Bash and Python scripts were created. For all further visualizations and comparisons, Jupyter Notebooks
Synthethic datasets
We generated seven datasets, each with approximately 2,500 samples. Each sample included between 50 and 500 different ASVs (in steps of 10 ), 0 to 100 singletons (or
Data availability
Project numbers (and doi) for sequencing data of the 13 projects used to perform the analyses are available online at the Supplementary Information, Table S2. Computer code and datasets generated/analyzed along the current study are available at https://github.com/MauroIb/alpha-diversities. The repository is also available with
a permanent doi though Zenodo at https://zenodo.org/record/8170289. Complete QIIME artifacts are not inclu ded as the raw sequencing data belong to each of the dataset’s authors, but full references, SRA codes or similar, their ASV tables and the corresponding alpha diversity values are provided for each dataset within the repository.
a permanent doi though Zenodo at https://zenodo.org/record/8170289. Complete QIIME artifacts are not inclu ded as the raw sequencing data belong to each of the dataset’s authors, but full references, SRA codes or similar, their ASV tables and the corresponding alpha diversity values are provided for each dataset within the repository.
Received: 24 March 2024; Accepted: 25 October 2024
Published online: 03 January 2025
Published online: 03 January 2025
References
- Leviatan, S., Shoer, S., Rothschild, D., Gorodetski, M. & Segal, E. An expanded reference map of the human gut microbiome reveals hundreds of previously unknown species. Nat. Commun. 13, 1-14 (2022).
- VanEvery, H., Franzosa, E. A., Nguyen, L. H. & Huttenhower, C. Microbiome epidemiology and association studies in human health. Nat. Rev. Genet. 1-16 (2022). https://doi.org/10.1038/s41576-022-00529-x
- After the Integrative Human Microbiome Project, what’s next for the microbiome community? Nature 569, 599 (2019).
- Lori, M. et al. Compared to conventional, ecological intensive management promotes beneficial proteolytic soil microbial communities for agro-ecosystem functioning under climate change-induced rain regimes. Sci. Rep. 101(10), 1-15 (2020).
- Aka, B. E. Z. et al. High-throughput 16 S rRNA gene sequencing of the microbial community associated with palm oil mill effluents of two oil processing systems. Sci. Rep.. 111(11), 1-12 (2021).
- Campanaro, S., Treu, L., Kougias, P. G., Zhu, X. & Angelidaki, I. Taxonomy of anaerobic digestion microbiome reveals biases associated with the applied high throughput sequencing strategies. Sci. Rep. 81(8), 1-12 (2018).
- Lawson, C. E. et al. Common principles and best practices for engineering microbiomes. Nat. Rev. Microbiol. 2019 1712(17), 725-741 (2019).
- Lloyd-Price, J. et al. Strains, functions and dynamics in the expanded Human Microbiome Project. Nat. 550, 61-66 (2017).
- Cullen, C. M. et al. Emerging priorities for microbiome research. Front. Microbiol. 11, 136 (2020).
- D’Argenio, V. & Salvatore, F. The role of the gut microbiome in the healthy adult status. Clin. Chim. Acta. 451, 97-102 (2015).
- Hughes, J. B., Hellmann, J. J., Ricketts, T. H. & Bohannan, B. J. M. Counting the uncountable: Statistical approaches to estimating microbial diversity. Appl. Environ. Microbiol. 67, 4399-4406 (2001).
- Thukral, A. K. A review on measurement of Alpha diversity in biology. Agric. Res. J. 54, 1 (2017).
- McIntosh, R. P. An index of diversity and the relation of certain concepts to diversity. Ecology. 48, 392-404 (1967).
- Goodrich, J. K., Davenport, E. R., Clark, A. G. & Ley, R. E. The relationship between the human genome and microbiome comes into view. Annu. Rev. Genet. 51, 413 (2017).
- Aydin, Ö., Nieuwdorp, M. & Gerdes, V. The gut microbiome as a target for the treatment of type 2 diabetes. Curr. Diab Rep. 18, 1-11 (2018).
- Ducarmon, Q. R., Hornung, B. V. H., Geelen, A. R., Kuijper, E. J. & Zwittink, R. D. Toward standards in clinical microbiota studies: Comparison of three DNA extraction methods and two bioinformatic pipelines. mSystems 5, (2020).
- Kim, B. R. et al. Deciphering diversity indices for a better understanding of microbial communities. J. Microbiol. Biotechnol. 27, 2089-2093 (2017).
- Lovell, D., Pawlowsky-Glahn, V., Egozcue, J. J., Marguerat, S. & Bähler, J. Proportionality: A valid alternative to correlation for relative data. PLOS Comput. Biol. 11, e1004075 (2015).
- Lozupone, C. A. & Knight, R. Species divergence and the measurement of microbial diversity. FEMS Microbiol. Rev. 32, 557-578 (2008).
- Reese, A. T. & Dunn, R. R. Drivers of microbiome biodiversity: A review of general rules, feces, and ignorance. MBio 9, (2018).
- Shen, X. J. et al. Molecular characterization of mucosal adherent bacteria and associations with colorectal adenomas. Gut Microbes. 1, 138-147 (2010).
- Su, X. Elucidating the beta-diversity of the microbiome: from global alignment to local alignment. mSystems. 6, 363-384 (2021).
- Callahan, B. J. et al. DADA2: High-resolution sample inference from Illumina amplicon data. Nat. Methods. 13, 581-583 (2016).
- Amir, A. et al. Deblur rapidly resolves single-nucleotide community sequence patterns. mSystems 2, (2017).
- Nearing, J. T., Douglas, G. M., Comeau, A. M. & Langille, M. G. I. Denoising the denoisers: An independent evaluation of microbiome sequence error- correction approaches. PeerJ e5364 (2018).
- Bolyen, E. et al. QIIME 2: Reproducible, interactive, scalable, and extensible microbiome data science. https://doi.org/10.7287/pee rj.preprints.27295v2
- Bolyen, E. et al. Reproducible, interactive, scalable and extensible microbiome data science using QIIME 2. Nat. Biotechnol. 37, 852-857 (2019).
- Willis, A. D. Rarefaction, alpha diversity, and statistics. Front. Microbiol. 10, 2407 (2019).
- Chao, A. Nonparametric estimation of the number of classes in a population. Scand. J. Stat. 11, 265-270 (1984).
- Fisher, R. A., Corbet, A. S. & Williams, C. B. The relation between the number of species and the number of individuals in a random sample of an animal population. J. Anim. Ecol. 12, 42-58 (1943).
- Margalef, R. Diversidad de especies en las comunidades naturales.
- Menhinick, E. F. A comparison of some species-individuals diversity indices applied to samples of field insects. Ecology. 45, 859861 (1964).
- Berger, W. H. & Parker, F. L. Diversity of planktonic foraminifera in deep-sea sediments. Sci. (80-). 168, 1345-1347 (1970).
- Simpson, E. H. Measurement of diversity [16]. Nature. 163, 688 (1949).
- Gini, C. Variabilità e mutabilità: Contributo allo studio delle distribuzioni e delle relazioni statistiche.[Fasc. I] (Tipogr. di P. Cuppini, 1912).
- Faith, D. P. Conservation evaluation and phylogenetic diversity. Biol. Conserv. 61, 1-10 (1992).
- Chao, A., Chiu, C. H. & Jost, L. Phylogenetic diversity measures based on Hill numbers. Philos. Trans. R. Soc. B Biol. Sci. 365, 3599-3609 (2010).
- Chao, A. et al. Rarefaction and extrapolation with Hill numbers: A framework for sampling and estimation in species diversity studies. Ecol. Monogr. 84, 45-67 (2014).
- Shannon, C. E. A mathematical theory of communication. Bell Syst. Tech. J. 27, 379-423 (1948).
- Pielou, E. C. Ecological Diversity (Wiley InterScience, 1975).
- Heip, C. A. New index measuring evenness. J. Mar. Biol. Assoc. United Kingd. 54, 555-557 (1974).
- Pielou, E. C. & others. An introduction to mathematical ecology. (New York, USA, Wiley-Inter-science, 1969).
- Moles, L. & Otaegui, D. The impact of diet on microbiota evolution and human health. Is diet an adequate tool for microbiota modulation? Nutrients 12, (2020).
- Rinninella, E. et al. What is the healthy gut microbiota composition? A changing ecosystem across age, environment, diet, and diseases. Microorganisms. 7, 14 (2019).
- Sayers, E. W. et al. Database resources of the national center for biotechnology information. Nucleic Acids Res. 50, D20 (2022).
- Kanz, C. et al. The EMBL nucleotide sequence database. Nucleic Acids Res. 33, D29 (2005).
- Kluyver, T. et al. Jupyter Notebooks — a publishing format for reproducible computational workflows. In Positioning and Power in Academic Publishing: Players, Agents and Agendas (eds. Loizides, F. & Schmidt, B.) 87-90 (2016).
- Balena, F. & Fawcette, J. Programming Microsoft Visual Basic 6.0 vol. 1 (Microsoft press Washington, 1999).
- pandas development team, T. pandas-dev/pandas: Pandas. (2020). https://doi.org/10.5281/zenodo. 3509134
- Harris, C. R. et al. Array programming with {NumPy}. Nature. 585, 357-362 (2020).
- Virtanen, P. et al. {SciPy} 1.0: Fundamental algorithms for scientific computing in python. Nat. Methods. 17, 261-272 (2020).
- R Core Team. R: A language and environment for statistical computing. (2021).
- Plotly Technologies Inc. Collaborative data science Publisher: Plotly Technologies Inc. (2015).
- Waskom, M. Seaborn: Statistical data visualization. J. Open. Source Softw. 6, 3021 (2021).
Acknowledgements
Authors want to thank Dr. Elizabeth Bik for her immensely helpful and critical review of the whole manuscript, as well as the reviewers for key observations and suggestions that improved the comprehension and impact of this article.
Author contributions
IC collected the data, proposed statistical analysis tools, and wrote the paper. MI collected theoretical reviews and mathematical descriptors, generated the synthethic datasets, ran the experiments, implemented tools (code and repositories), performed the analysis of the results, and wrote the paper. JPB: Conceived the research, revising the draft critically for important intellectual content, review, and editing. All authors contributed to the article and approved the submitted version.
Declarations
Competing interests
The authors declare no competing interests.
Additional information
Supplementary Information The online version contains supplementary material available at https://doi.org/1
Correspondence and requests for materials should be addressed to J.P.B.
Reprints and permissions information is available at www.nature.com/reprints.
Publisher’s note Springer Nature remains neutral with regard to jurisdictional claims in published maps and institutional affiliations.
Correspondence and requests for materials should be addressed to J.P.B.
Reprints and permissions information is available at www.nature.com/reprints.
Publisher’s note Springer Nature remains neutral with regard to jurisdictional claims in published maps and institutional affiliations.
Open Access This article is licensed under a Creative Commons Attribution 4.0 International License, which permits use, sharing, adaptation, distribution and reproduction in any medium or format, as long as you give appropriate credit to the original author(s) and the source, provide a link to the Creative Commons licence, and indicate if changes were made. The images or other third party material in this article are included in the article’s Creative Commons licence, unless indicated otherwise in a credit line to the material. If material is not included in the article’s Creative Commons licence and your intended use is not permitted by statutory regulation or exceeds the permitted use, you will need to obtain permission directly from the copyright holder. To view a copy of this licence, visit http://creativecommons.org/licenses/by/4.0/.
© The Author(s) 2025
© The Author(s) 2025
Facultad de Ingeniería, Universidad Austral, LIDTUA, CIC, Buenos Aires, Argentina. Facultad de Ingeniería, Universidad Nacional de Entre Ríos, Oro Verde, Argentina. CONICET, Buenos Aires, Argentina. Ignacio Cassol and Mauro Ibañez: Equal contributions. email: jbustamante@austral.edu.ar