تساهم الميكروبات المرتبطة بالجذور في نمو النباتات وصحتها، وتتأثر ديناميكيًا بتطور النبات والتغيرات في بيئة التربة. ومع ذلك، لا يزال غير واضح كيف تؤثر أنظمة الأسمدة المختلفة على التغيرات الكمية في تجميع الميكروبات وتأثيرها على نمو النبات. هنا، نستكشف الديناميات الزمنية للبكتيريا المرتبطة بالجذور في فول الصويا باستخدام تحليل الميكروبات الكمي (QMP) لفحص استجابتها لعلاجات الأسمدة غير المتوازنة (أي، التي تفتقر إلى أي من) أو K ) ودورها في دعم نمو النباتات بعد أربعة عقود من التسميد غير المتوازن. نوضح أن البكتيريا المرتبطة بالجذور تظهر تسلسلًا قويًا خلال تطور النبات، وتزداد الأحمال البكتيرية بشكل كبير في المراحل اللاحقة، خاصة بالنسبة لبكتيريا Bacteroidetes. للتسميد غير المتوازن تأثير كبير على تجميع بكتيريا منطقة الجذور في فول الصويا، وفي غياب سماد النيتروجين، يتباعد المجتمع البكتيري عن ذلك الخاص بالنباتات المخصبة، بينما يفتقر إلى المخصبات تعيق الحمل الكلي ودوران بكتيريا منطقة الجذور. من المهم أن مجموعة الكائنات الحية الدقيقة المستمدة من الكتلة الغنية بالنيتروجين المنخفض قادرة على تحفيز نمو النباتات، مما يتوافق مع استقرار إنتاج فول الصويا في غياب مخصب النيتروجين. توفر هذه النتائج رؤى جديدة في الديناميات الكمية للميكروبيوم المرتبط بالجذور وتبرز مجموعة بيئية رئيسية مع آفاق لإدارة زراعية مستدامة.
تم التعرف على الميكروبات المرتبطة بالجذور على أنها “الجينوم الثاني” للنباتات، والتي تساهم بطرق متنوعة في نمو النبات وتطوره وصحته.توفر الأقسام المرتبطة بالجذور، بما في ذلك منطقة الجذور والداخل الجذري، موائل فريدة لاستعمار الميكروبات، مما يؤدي إلى اختلافات كبيرة في التصنيف والوظائف مقارنة بالتربة المحيطة. الميكروبيومات المرتبطة ديناميكية للغاية، وتتأثر بشدة بتطور النباتالذي يؤثر بشكل رئيسي من خلال تأثير إفرازات الجذور على نمو الميكروبات، مما يشير إلى قدرة النباتات على تعديل ميكروبيوماتها بنشاط طوال دورة حياتها بالكامل. قد يكون لهذه السمة آثار مهمة على اكتساب النباتات للعناصر الغذائية، كما يتضح من التوافق الزمني لـ
كفاءة استخدام النيتروجين بين الجذور والميكروبات (مثل الفطريات الم mycorrhizal) في القمححالياً، تم استخدام تحليل الميكروبيوم النسبي (RMP) على نطاق واسع للكشف عن التباين في الوفرة النسبية للأنواع في المجتمعات الميكروبية المعقدة، لكن RMP لا يوفر معلومات عن الوفرة المطلقة للميكروبات وليس مفيداً لمقارنة الأحمال الميكروبية بين العينات.تشير الأدلة المتزايدة إلى أن الحمل المحدد لمجموعات الميكروبات، كما تم تقديره من خلال تحليل الميكروبيوم الكمي (QMP)، يستجيب بشكل حساس للاضطرابات البيئية، حتى عندما تظل الوفرة النسبية للميكروبات كما هي.ومع ذلك، بسبب التحديات التقنية التي تطرحها QMP، لا يزال هناك نقص في المعلومات التفصيلية عالية الدقة حول الديناميات الكمية للميكروبات المرتبطة بالجذور. وبالتالي، هناك حاجة ماسة إلى بيانات من QMP لتعزيز فهمنا للعلاقة بين تجميع الميكروبات المرتبطة بالجذور وتطور النبات.
بصرف النظر عن جينوم المضيف ومرحلة التطور، فإن تجميع الميكروبيوم المرتبط بالجذور يتأثر أيضًا بالعوامل البيئية. على سبيل المثال، أدى الجفاف إلى تقليل التنوع وتعطيل الديناميات الزمنية للميكروبيومات الجذرية لمختلف أنواع النباتات.في الزراعة، ساهم استخدام الأسمدة الكيميائية، بما في ذلك النيتروجين (N) والفوسفور (P) والبوتاسيوم (K)، بشكل كبير في زيادة الغلات في العقود الأخيرة، مما جعل من الممكن إطعام السكان البشريين المتزايدين. ومع ذلك، فإن الزراعة المكثفة لا تسبب فقط تلوثًا بيئيًا شديدًا، بل تعطل أيضًا التفاعلات الإيجابية بين النباتات والميكروبات، مما يؤدي إلى تأثير متسلسل من الأضرار على سلامة النظام البيئي وصحته.التعديل مرتبط بتقليل الكتلة الحيوية الميكروبية في التربةوتم العثور على أن التسميد يقلل بشكل كبير من معدل التتابع الزمني للميكروبات في التربةومع ذلك، تفتقر الدراسات الكمية التي تقيم كيف تؤثر ظروف مغذيات التربة على الديناميات الزمنية للميكروبيوم المرتبط بالجذور، وخاصةً باستخدام طريقة QMP. إن فهم كيفية استجابة ديناميات الميكروبات الجذرية لأنظمة التسميد المختلفة وتأثيرها على إنتاجية المحاصيل أمر ضروري لتطوير الزراعة المستدامة.
يُعتقد أن النباتات تتلاعب بشكل غير ملحوظ بالميكروبيوم المرتبط بالجذور لديها في ظل نقص المغذيات، حيث تواجه معظم النظم البيئية الأرضية نقصًا في النيتروجين والفوسفور.أظهرت دراسة حديثة أن نباتات الذرة تستعين بعائلة الأوكسالوبكتيريا لتحسين أدائها في ظل الظروف المنخفضة.مما يوفر دليلاً قويًا على تأثير الميكروبيوم على نمو النباتات. على عكس الحبوب، يمكن للبقوليات، مثل فول الصويا والبازلاء والفاصوليا الشائعة، أن تشكل علاقة تعاونية مع البكتيريا المثبتة للنيتروجين التي تتجمع داخل العقد وتوفر كمية كبيرة من النيتروجين لنمو المضيف. ومع ذلك، فإن فوائد العقدة تقل بشكل كبير تحت تأثير التسميد بالنيتروجين.، مما يشير إلى وجود تناقض بين تقليل استخدام الكربون في النباتات وزيادة الحصول على النيتروجين الثابت. قد يكون إنتاج محاصيل البقوليات محدودًا بدلاً من ذلك بسبب توفر إمدادات النيتروجين الخاصة بها، و المدخلات، التي أظهرت أنها تساهم في تثبيت النيتروجين التبادلييمكن تعزيز الوصول إلى هذه العناصر الغذائية في النباتات من خلال الميكروبيوم الجذري، الذي أظهر أنه يثري بشكل خاص عملية استقلاب العناصر الغذائية المعدنية مقارنة بالتربة السائبة من خلال تأثيرات تنشيط الميكروبات التي تتوسطها إفرازات الجذور.لكن ما إذا كانت وكيف يمكن أن تعوض ميكروبات معينة عن نقص العناصر الغذائية في التربة لنمو النباتات لا يزال غير واضح. إن اكتشاف والتحقق من وظائف الميكروبات الرئيسية في تخفيف ضغط العناصر الغذائية على النباتات أمر بالغ الأهمية لإدارة النظم البيئية الزراعية المستدامة.
في هذه الدراسة، تم إجراء تجربة ميدانية لتوضيح تأثير نقص العناصر الغذائية (أي، استبعاد الأسمدة النيتروجينية أو الفوسفورية أو البوتاسية) على أداء فول الصويا وتطور الميكروبيوم البكتيري المرتبط بالجذور، وكشف الآليات التي يعمل بها الميكروبيوم المرتبط بالجذور في تشكيل ظاهرة النبات، بعد 40 عامًا من دوران فول الصويا والذرة والقمح. من خلال QMP، قمنا بمراقبة ديناميات المجتمعات البكتيرية في منطقة الجذور والداخلية على مدار عمر فول الصويا، وفككنا تأثيرات على أنواع بكتيرية محددة استجابةً لعلاجات التسميد المختلفة. ثم جمعنا تسلسل الميتاجينوم لاستكشاف الوظائف. تكيّف البكتيريا المرتبطة بالجذور استجابةً لنقص المغذيات. أخيرًا، قمنا بالتحقق من وظائف تعزيز نمو النباتات للمجتمعات الاصطناعية (SynCom) في الكتلة البيئية الميكروبية الغنية بالنيتروجين المنخفض باستخدام طريقة تعتمد على الزراعة. نفترض أن (1) QMP ستكشف عن نمط ديناميكي مميز في تجميع الميكروبيوم المرتبط بالجذور؛ (2) ستتأثر ديناميات البكتيريا المرتبطة بالجذور بشكل كبير بنقص الأسمدة N وP وK؛ (3) سيفيد التكيّف الوظيفي لبكتيريا منطقة الجذور تحت نقص المغذيات نمو فول الصويا.
النتائج
آثار التسميد على الخصائص الكيميائية للتربة وأداء فول الصويا
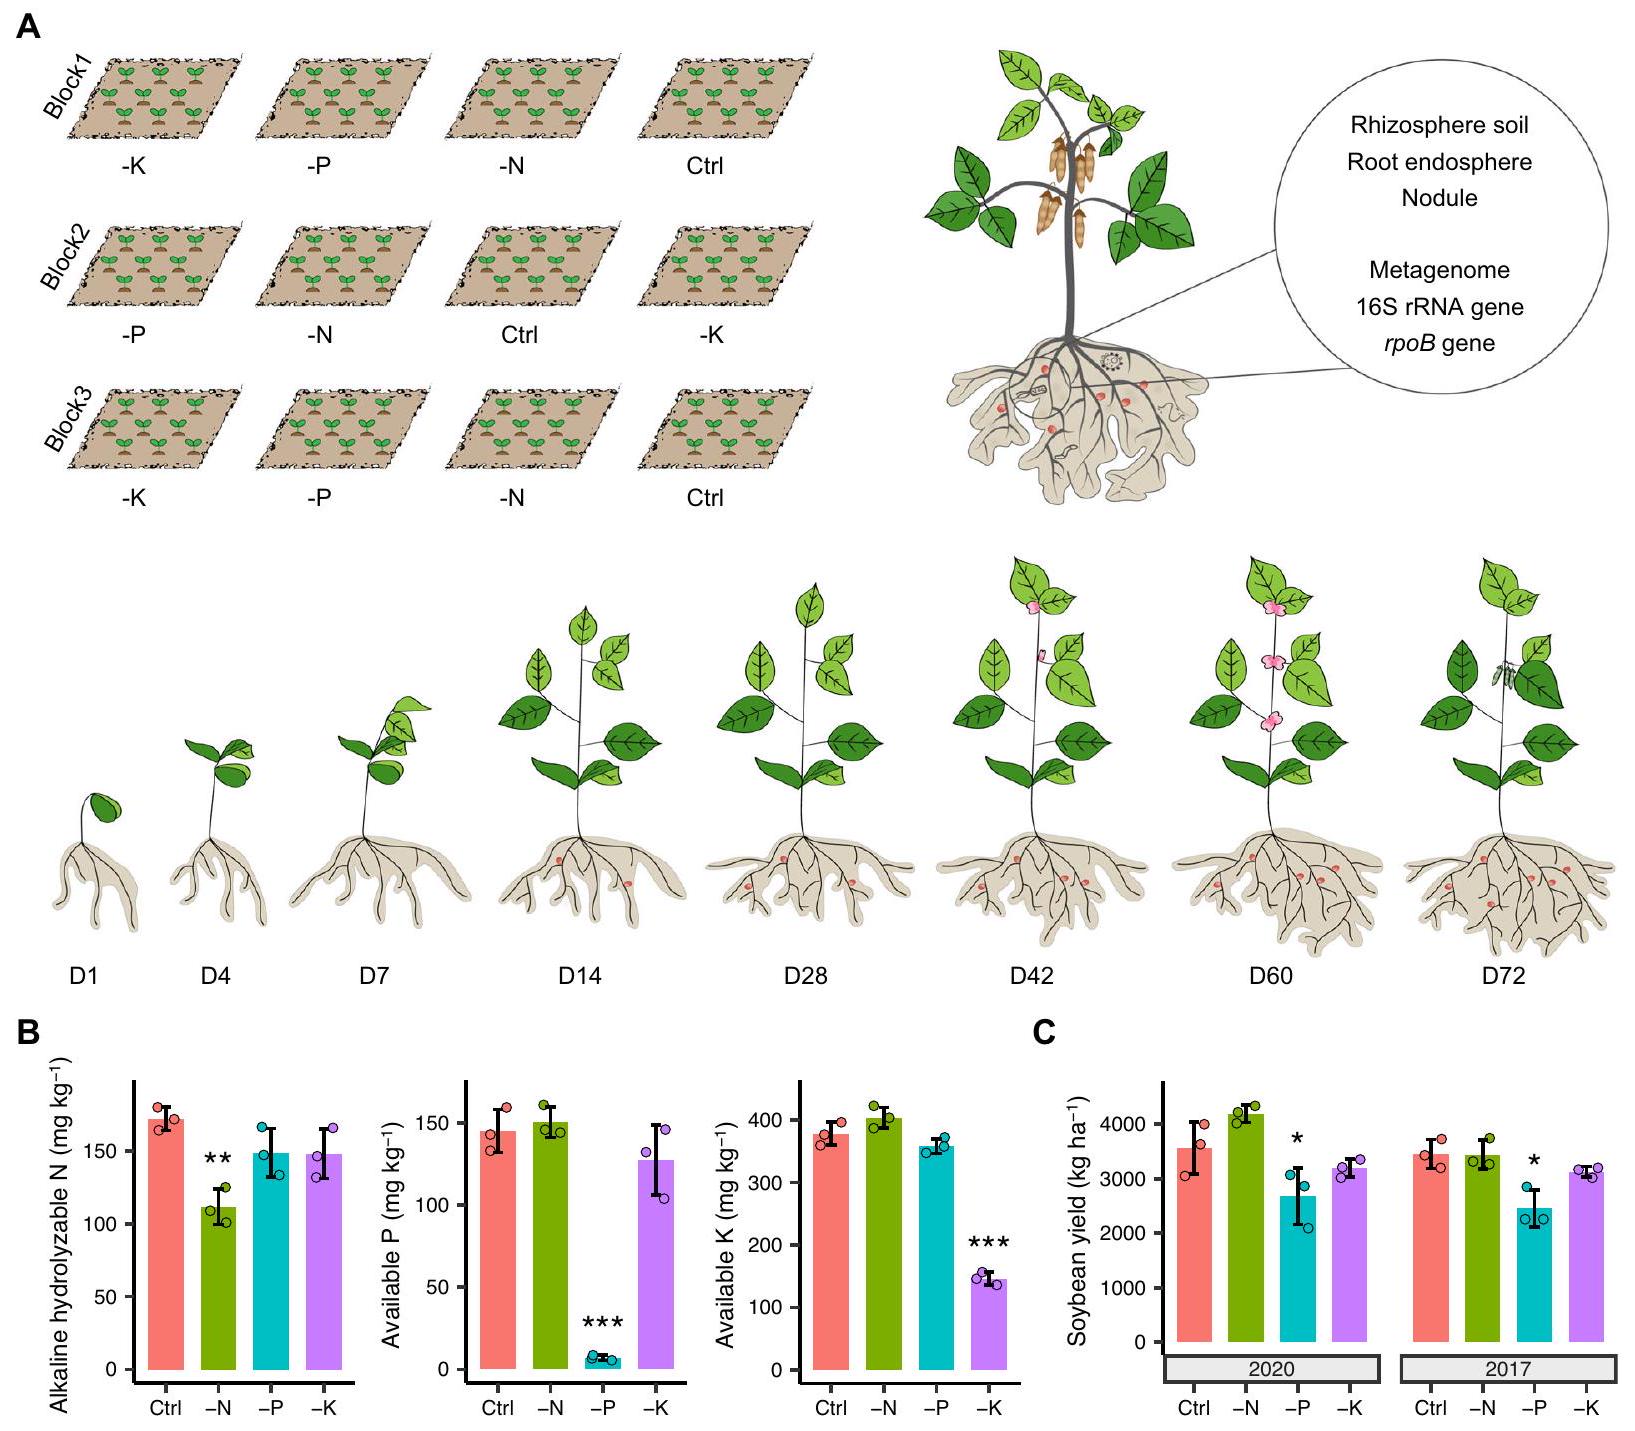
لكشف التركيب الكمي للميكروبات المرتبطة بالجذور في فول الصويا، قمنا بدراسة ديناميات الميكروبات عبر مراحل نمو النبات.، و72 يومًا بعد الإنبات) واستجابتها للتسميد. للقيام بذلك، درسنا نباتات فول الصويا المزروعة في الحقل باستخدام أربعة علاجات تسميد غير متوازنة، والتي كانت جزءًا من دورة المحاصيل المستمرة مع الذرة والقمح منذ عام 1979، بما في ذلك (1) تسميد كامل الجرعة (سماد NPK، التحكم)، (2) نقص سماد النيتروجين (-N)، (3) نقص سماد الفوسفور (-P)، و(4) نقص سماد البوتاسيوم (-K) (الشكل 1A). تم جمع التربة الكلية من كل قطعة أرض لمراقبة الخصائص الكيميائية للتربة قبل زراعة البذور في عام 2020. مقارنةً بالتحكم، تم تقليل محتوى النيتروجين القابل للتحلل القلوي في التربة (AHN) والفوسفور المتاح والبوتاسيوم المتاح بـ و ، إلى ، و ، في وعلاجات -K، على التوالي ( الشكل 1B)، مما يشير إلى أنكان الأكثر تقليلاً من العناصر الغذائية المدارة. كان الرقم الهيدروجيني للتربة أعلى بمقدار 1.1 وحدة وكان الكربون العضوي المذاب في التربة (DOC) أقل بمقدارفي علاج -N مقارنةً بالتحكمبينما لم تظهر المادة العضوية في التربة (SOM) أي فرق ذي دلالة إحصائية بين المعاملات (الشكل التوضيحي 1)، مما يشير إلى قدرة عالية على التحمل للمادة العضوية في التربة عبر أنظمة التسميد المختلفة.
من المثير للاهتمام أننا وجدنا أن محصول فول الصويا في الحقل لم يظهر فرقًا كبيرًا بين معاملة التحكم ومعاملة -N، بل أظهر حتى زيادة طفيفة.على مدار موسمي زراعة فول الصويا (أي، 2020 و2017، الشكل 1C). بالمقابل، تم تقليل محصول فول الصويا بشكل مستمر بواسطة في علاج -P مقارنة بالتحكم ( ). في هذه الأثناء، زادت معالجة -N بشكل كبير من عدد وقطر العقد الجذرية مقارنةً بالتحكم ( )، في حين أظهرت معالجة -P الاتجاه المعاكس ( الشكل التوضيحي الإضافي 2).
التغيرات في تنوع الميكروبات المرتبطة بالجذور عبر مراحل نمو النبات
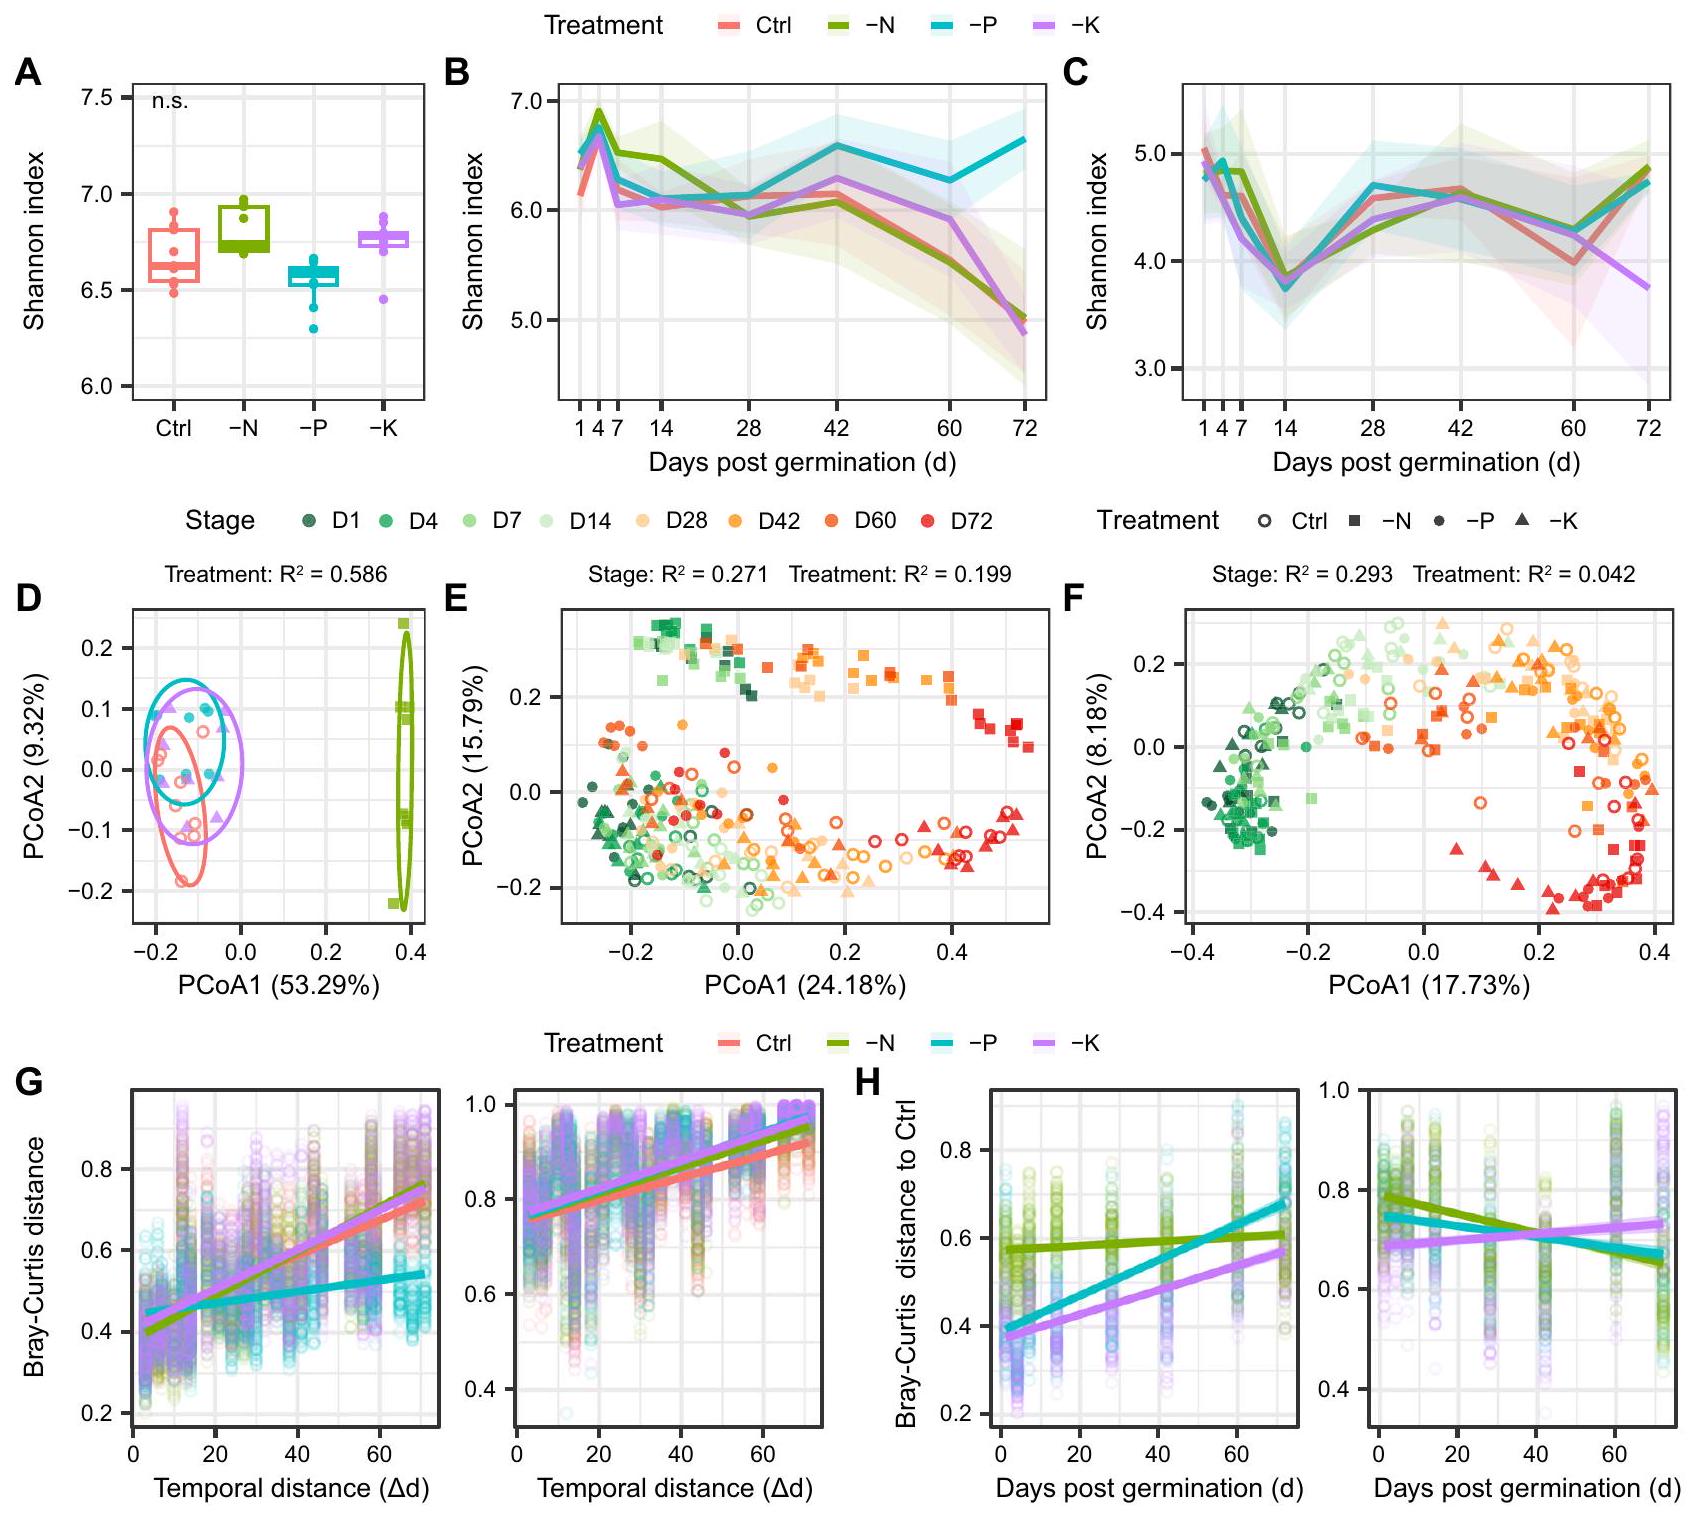
تم تطبيق التحليل الكمي للميكروبات (QMP) للتحقيق في ديناميات تنوع البكتيريا المرتبطة بالجذور، والحمل، والتركيب عبر مراحل نمو النبات واستجابتها للتسميد. أظهرت حجرة الجذر، ومرحلة نمو النبات، وعلاج التسميد تأثيرات كبيرة على البكتيريا.-تنوع ( )، مع ارتفاع مستمر في -تنوع في منطقة الجذور أكثر من المنطقة الداخلية (الشكل 2، الجدول التكميلي 1). في منطقة الجذور، البكتيرياانخفضت التنوع مع تطور النبات، خاصة من اليوم 42 إلى 72 (الشكل 2B). بالمقارنة مع التحكم، أظهر علاج -N مستوى أعلى-تنوع في المراحل التنموية المبكرة (أي، الأيام 4 و7 و14)، في حين أن معالجة -P زادت-تنوع في مراحل التطور اللاحقة (أي، الأيام 42 و60 و72) في منطقة الجذور ( )، مما يؤدي إلى استقرار -تنوع مع تطور النبات (الشكل 2B). على النقيض من ذلك،– كانت التنوع في النهاية الداخلية أقل حساسية للتسميد، حيث وصلت إلى أدنى مستوى لها في اليوم الرابع عشر وظلت مستقرة نسبيًا في المراحل اللاحقة.الشكل 2C)، الذي يتوافق مع بداية ملاحظة تكوين العقد الجذرية في الحقل بعد 14 يومًا من الإنبات، مما يشير إلى أن التعايش قد يقلل بشكل كبير من تنوع الميكروبات في الإندوسفير.
الشكل 1 | تصميم التجربة واستجابة مغذيات التربة المعدنية وعائد فول الصويا للتسميد غير المتوازن. تم ترتيب التجربة الميدانية في تصميم كتلي عشوائي بالكامل. تم تطبيق أربعة معالجات، بما في ذلك التسميد الكامل (سماد NPK، التحكم) ونقص سماد N أو P أو K (أي، المعالجات -N و -P و -K)، كجزء من دورة فول الصويا-الذرة-القمح (محصول واحد/سنة) منذ عام 1979. تم إخضاع الأقسام المرتبطة بالجذور لفول الصويا، بما في ذلك تربة الجذور، والإنسفيرة الجذرية، والعُقَد، لجين 16S rRNA.الجين، وتسلسل الميتاجينوم عبر مراحل نمو النبات. ب الخصائص الكيميائية للتربة الكلية في علاجات التسميد المختلفة قبل
زراعة فول الصويا في عام 2020 تأثير التسميد غير المتوازن على محصول فول الصويا في عام 2020 و 2017 ( المخططات). تمثل النجوم مستوى الدلالة (بين معالجة التحكم والمعالجة غير المتوازنة للأسمدة بناءً على اختبار ANOVA أحادي الاتجاه مع تحليل Dunnett اللاحق (لبيانات تتناسب مع التوزيعات الطبيعية والتباين المتجانس) أو اختبار Kruskal-Wallis مع تحليل Dunn اللاحق (لبيانات لا تتناسب مع التوزيعات الطبيعية أو التباين المتجانس). دقيق-القيم مدرجة في ملف البيانات المصدر. يتم تقديم البيانات كقيم متوسطةالانحراف المعياري (SD). يتم توفير بيانات المصدر كملف بيانات المصدر.
تحليل المكونات الرئيسية (PCoA) استنادًا إلى مسافة براى-كورتيس لمجموعات بيانات QMP كشف أن البكتيرياتم فصل التنوع بوضوح بين التربة السائبة، وتربة الجذور، والجزء الداخلي للجذور (الشكل التكميلي 3). وبالمثل، أشارت نتائج PERMANOVA إلى أن قسم الجذر (المنطقة المحيطة بالجذر مقابل الجزء الداخلي للجذر) كان المحرك الرئيسي للبكتيريا.-تنوع ( )، تليها مرحلة نمو النبات ( ) وعلاج التخصيب ( الجدول التكميلي 2). بالنسبة لكل من منطقة الجذور والداخلية، البكتيريا-التنوع كان مرتبطًا بوضوح بمرحلة نمو النبات في محور PCo1 (الشكل 2E، F). ومع ذلك، كانت معالجة -N تتجمع بشكل منفصل عن العلاجات الأخرى في منطقة الجذور والتربة الكلية، ولكن ليس في المنطقة الداخلية (الشكل 2D-F). وبالمثل، كان للتسميد تأثير أكبر بكثير على البكتيريا-تنوع في منطقة الجذور أكثر من المنطقة الداخلية، بغض النظر عن مرحلة نمو النبات (الشكل 2E، F، الشكل التوضيحي 3)، مما يشير إلى أن الميكروبيوم في منطقة الجذور يستجيب بشكل نسبي لـ التخصيب. أظهر نمط تدهور الزمن لميكروبيوم الجذور أن معالجة -P كانت لها انحدار أقل بشكل ملحوظ مع تطور النبات فيمقارنة معفي التحكم، ولكنها ظلت مشابهة في العلاجات الأخرى، في حين كان معدل دوران الميكروبات في الإندوسفير الجذري منخفضًا نسبيًا يتراوح بين 0.0024 إلى (الشكل 2G، الجدول التكميلي 3). كانت المسافة بين معالجة التحكم و -N في منطقة الجذور مستقرة نسبيًا عبر تطور النبات (الانحدار )، في حين أظهرت المعالجات -P و -K زيادة حادة في الاختلاف مع مرور الوقت مقارنةً بالتحكم (الشكل 2H، الجدول التكميلي 4)، مما يشير إلى أن المجتمعات الميكروبية في المعالجات -P و -K انحرفت تدريجياً عن التحكم مع تطور النبات. على الرغم من ملاحظة اتجاهات مماثلة في الميكروبات -التنوع استنادًا إلى ملف التعريف الميكروبي النسبي (RMP)، تأثير الحجرة على الميكروبات-تم تقليل التنوع بشكل محدد ( ) بالمقارنة مع QMP، والتخصيب
الشكل 2 | الديناميات الزمنية لتنوع البكتيريا المرتبطة بالجذور في علاجات مختلفة من خلال تحليل الميكروبيوم الكمي (QMP). بكتيريا -تنوع (مؤشر شانون) في التربة السائبة لكل معالجة (عينات التربة). تشير الرسوم البيانية الصندوقية إلى الوسيط (الخط المركزي) ، والنسب المئوية 25 و 75 (الصندوق) ، ونطاق القيم غير الشاذة (الخطوط المتفرعة). تمثل “n.s.” عدم دلالة مؤشر شانون بين معالجات التحكم والتسميد غير المتوازن بواسطة اختبار كروسكال-واليس مع تحليل دان بعد الاختبار. ديناميات البكتيريا-تنوع العلاجات المختلفة عبر مراحل نمو النبات في منطقة الجذور (B) والجزء الداخلي للجذر (C). تظهر أشرطة الخطأ الانحراف المعياري (SD). D البكتيريا
-تنوع في التربة السطحية التي تم تحليلها باستخدام تحليل الإحداثيات الرئيسية (PCoA). ألوان الرموز في (D) تتماشى مع الأسطورة في (A-C). E PCoA للبكتيرياتنوع في منطقة الجذور. تحليل المكونات الرئيسية للبيانات البكتيرية-تنوع في النهاية.الانحدارات الخطية بين المسافة الزمنية (تغيير يوم العينة بين كل عينتين، ) والمسافة بين العينات باستخدام مقياس براى-كورتيس في كل معالجة في منطقة الجذور (يسار) والداخلية (يمين).الانحدارات الخطية بين مرحلة أخذ العينات (أيام بعد الإنبات، د) والمسافة بين براي-كورتيس لكل معالجة تخصيب غير متوازنة مقارنة بالتحكم في منطقة الجذور (يسار) والداخلية (يمين). تم توفير بيانات المصدر كملف بيانات مصدر. كان التأثير قابلاً للمقارنة بين منطقة الجذور والداخلية عبر مراحل نمو النبات، مع معدلات تعاقب أقل نسبياً في جميع العلاجات في منطقة الجذور (الشكل التكميلي 4، الجدول التكميلي 3). على وجه التحديد، لاحظنا أنأظهرت ASVs في منطقة الجذور نمطًا مميزًا عبر تطور النبات بين مجموعات بيانات QMP و RMP (الشكل التوضيحي التكميلي 5)، مما يشير إلى وجود انحياز كبير عند تفسير البيانات الميكروبية مع الوفرة النسبية.
تجمع الميكروبيوم المرتبط بالجذور خلال تطور النبات
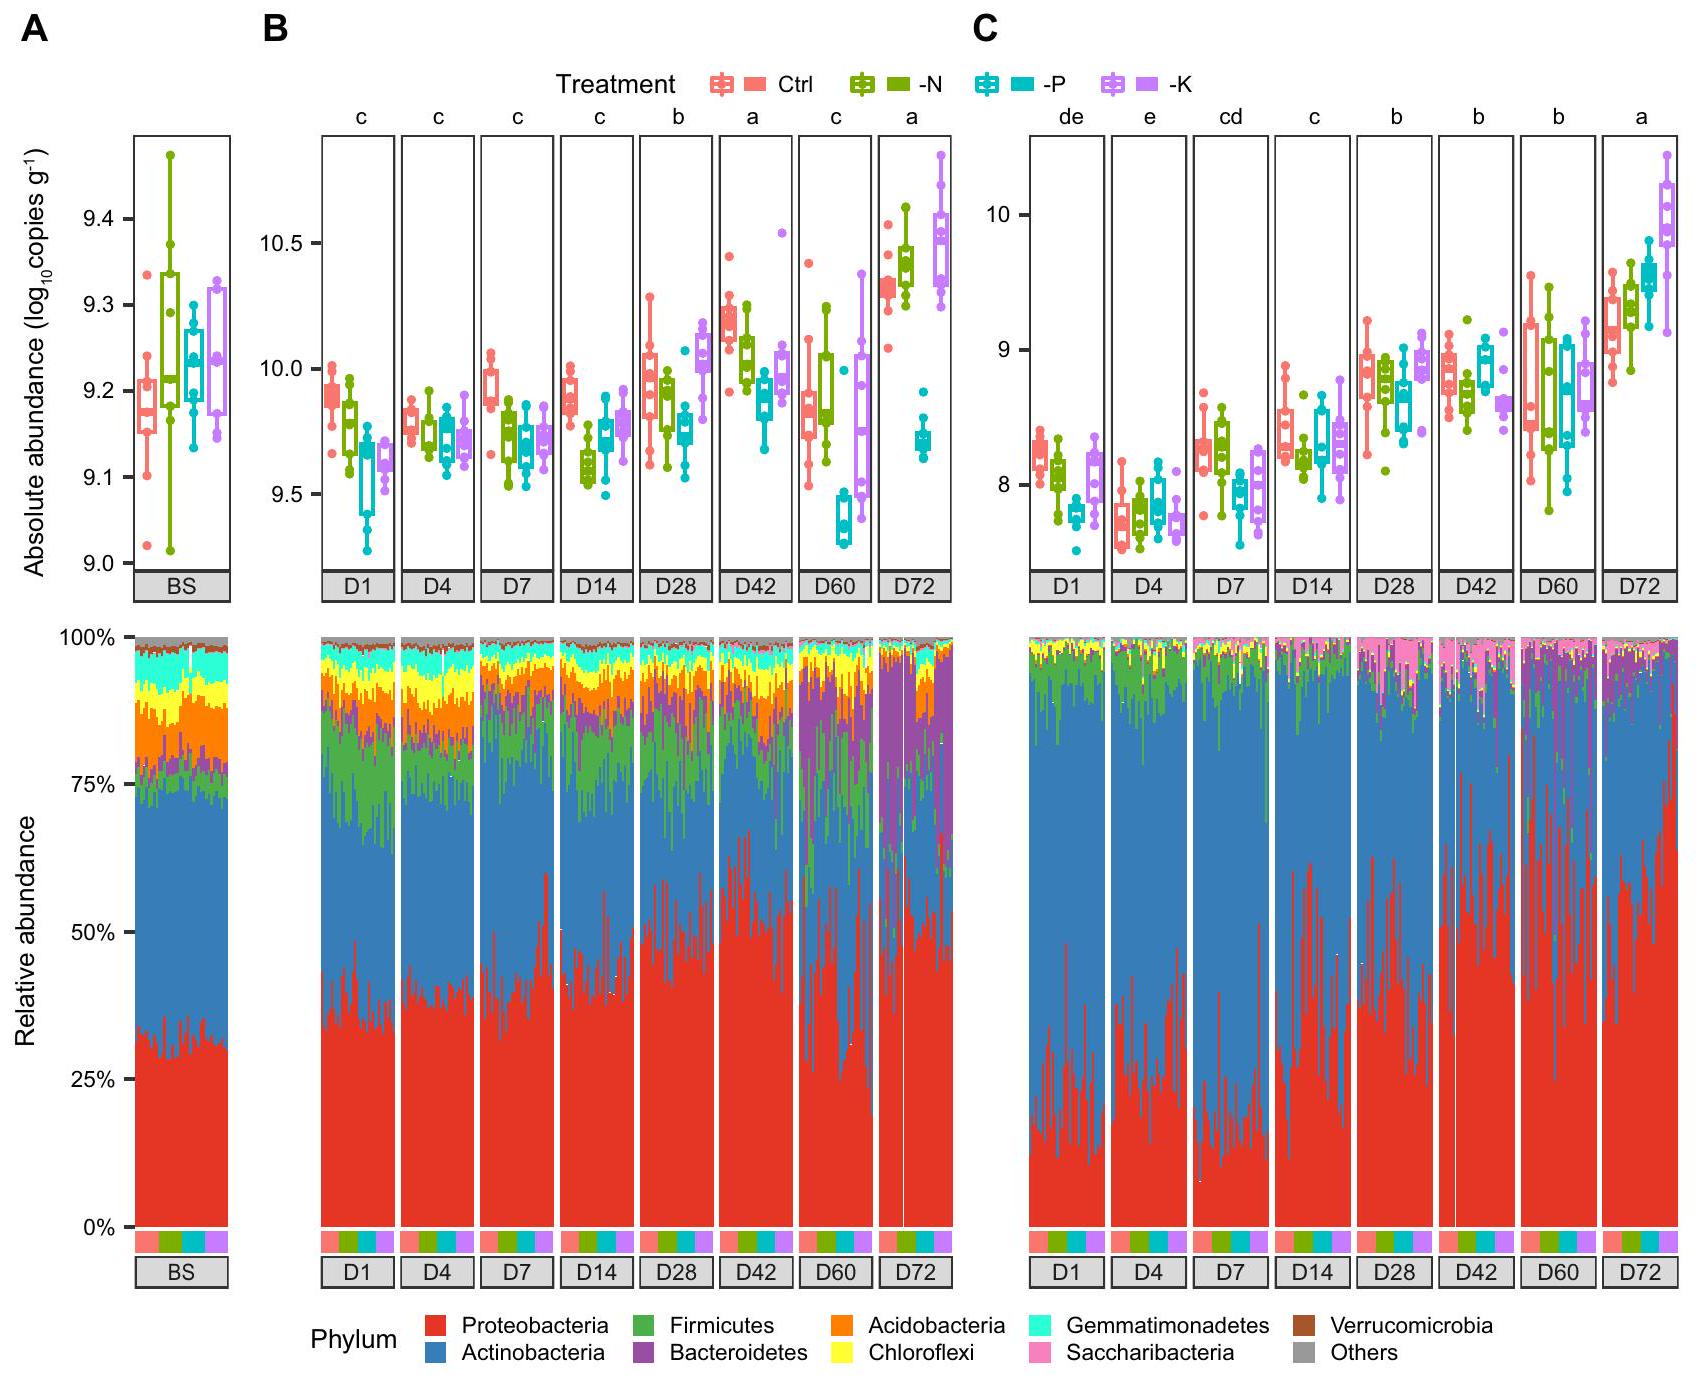
أظهرت الأحمال البكتيرية في كل من منطقة الجذور والداخلية اتجاهات متزايدة مع تطور النبات، ووفرة البكتيريا كانت قابلة للمقارنة عبر الأيام نسخ في منطقة الجذور و نسخ في النهاية)، ولكنها زادت تدريجياً وبلغت أعلى وفرتها في اليوم نسخ في منطقة الجذور و نسخ في النهاية) (الشكل 3، الشكل التكميلي 6). كان لعلاجات التسميد تأثير كبير على أحمال البكتيريا (الجدول التكميلي 5)، ووجد أن الحمل الميكروبي كان منخفضًا باستمرار في منطقة الجذور لعلاج -P مقارنةً بالتحكم، خاصة في مراحل التطور المتأخرة، مما يظهر انخفاضات في أحمال البكتيريا من و في الأيام 42 و60 و72، على التوالي (بالمقابل، لم يُلاحظ تغيير في أحمال البكتيريا بين المعالجة الضابطة والمعالجة -P في النهاية الداخلية للنبات، ولم يكن هناك اتساق خلال مراحل نمو النبات.
الشكل 3 | الأحمال البكتيرية والتركيب في التربة الكلية، منطقة الجذور والداخلية استنادًا إلى بيانات تسلسل 16S rRNA. أ. الوفرة المطلقة وتركيب المجتمع البكتيري على مستوى الشعبة في التربة الكلية (عينات التربة). الديناميات الزمنية لوفرة البكتيريا وتركيب المجتمع في منطقة الجذور ( ) ونهاية الجذر ( ). اللون في اللوحة العلوية يمثل علاجات مختلفة، واللون في اللوحة السفلية يمثل الفصائل البكتيرية، كما هو موضح في الأساطير المرفقة. الحروف المختلفة تشير إلى فرق كبير في متوسط الحمل البكتيري بين مراحل التطور في بواسطة اختبار كروسكال-واليس مع تحليل دان بعد الاختبار للمقارنات المتعددة. حجم العينة، النسخ وبدقة -تُدرج القيم في ملف البيانات المصدر. تشير الرسوم البيانية الصندوقية إلى الوسيط (الخط المركزي)، والنسبة المئوية 25 و 75 (الصندوق)، ونطاق القيم غير الشاذة (الخطوط المتفرعة). يتم توفير بيانات المصدر كملف بيانات مصدر.
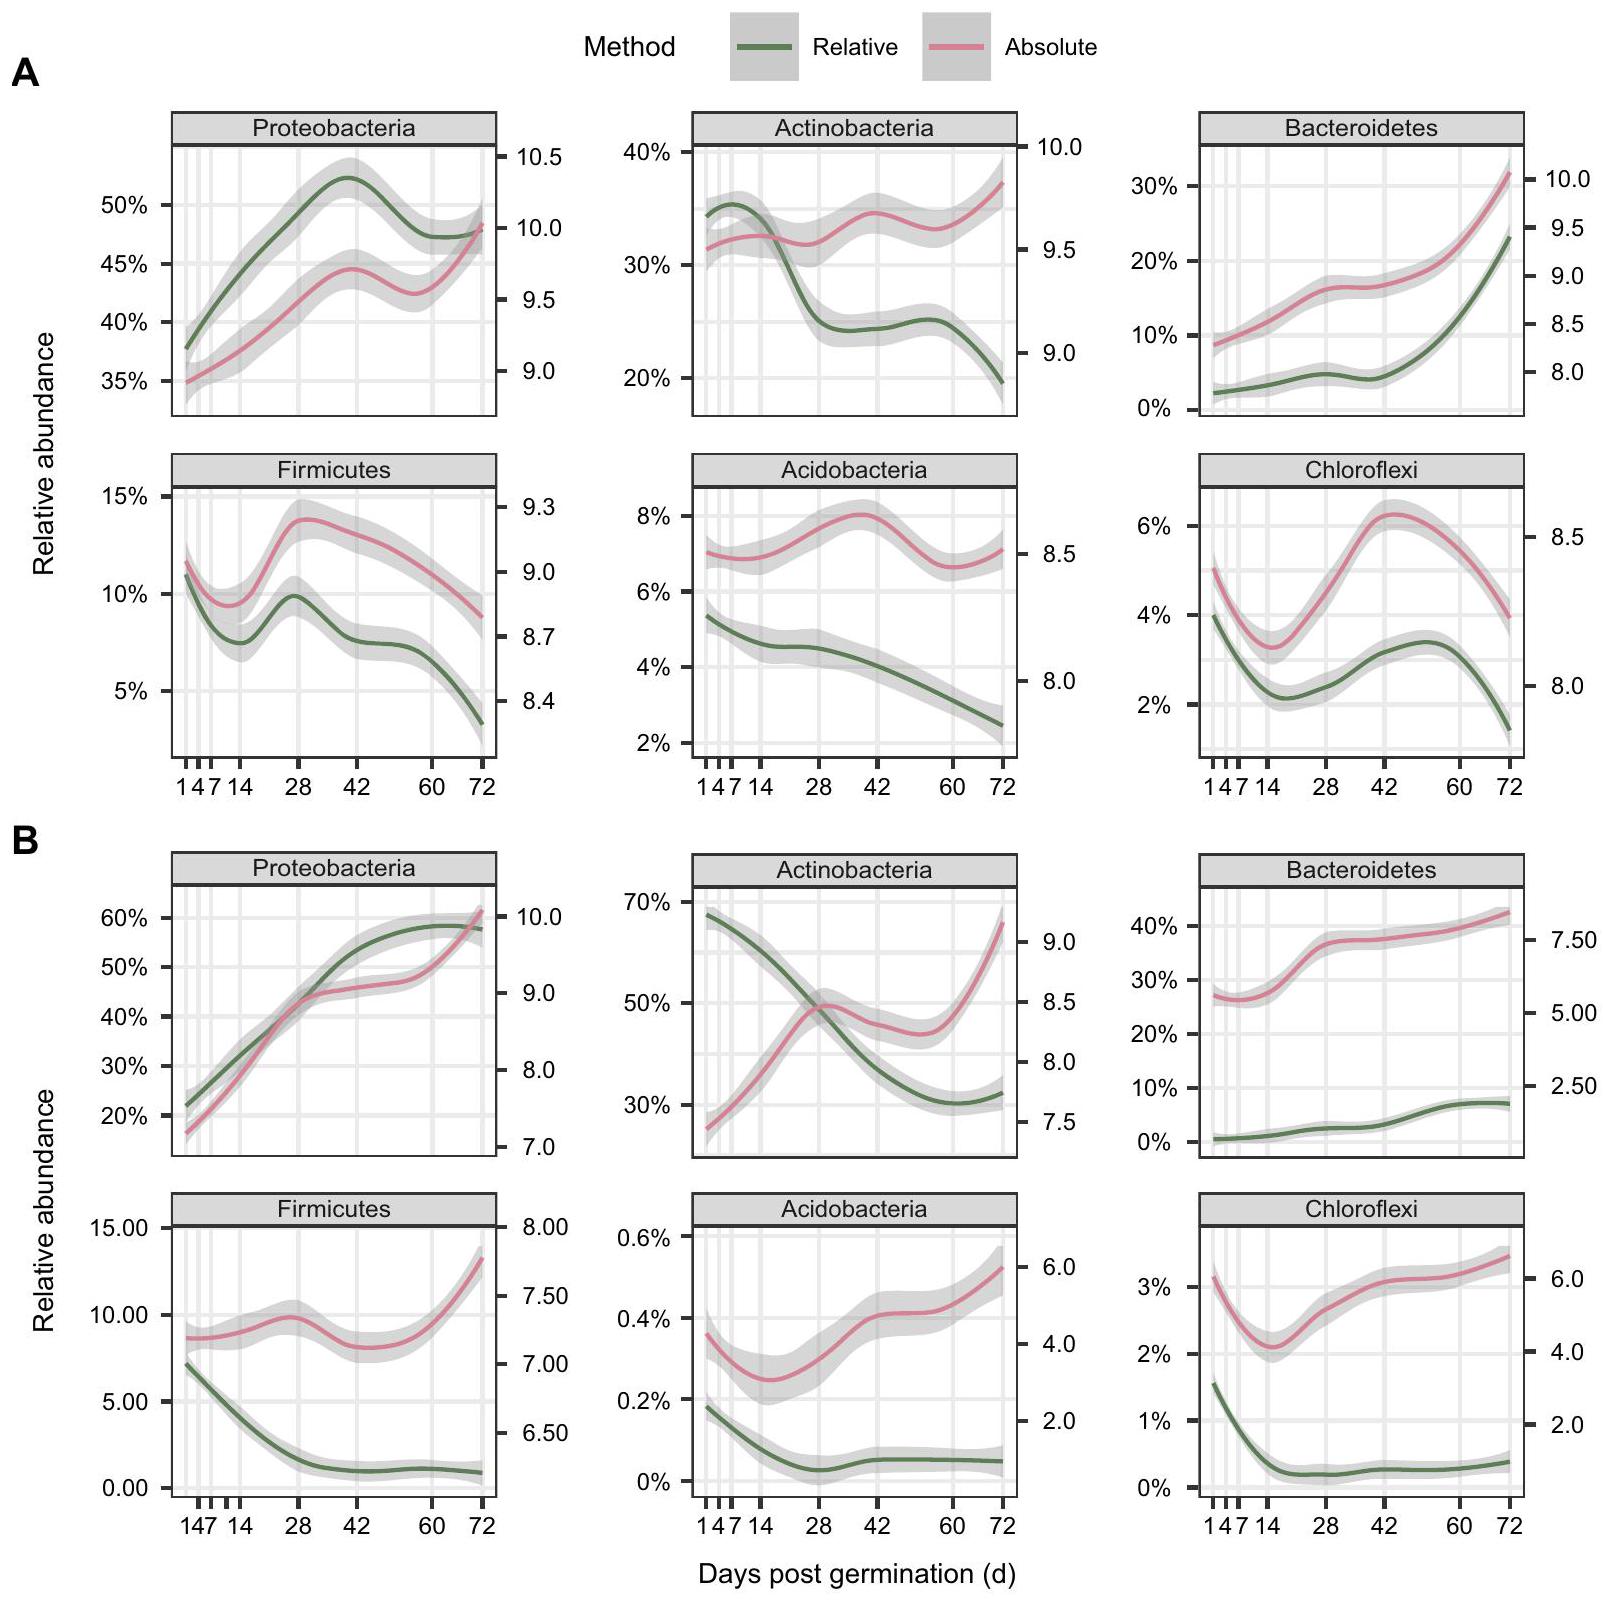
كانت البكتيريا المرتبطة بالجذور تنتمي بشكل رئيسي إلى البكتيريا البروتيوبكتيرية، والبكتيريا الأكتينوبكتيرية، والبكتيريا البكتيرودية، حيث كانت البكتيريا الأكتينوبكتيرية أكثر هيمنة في المراحل المبكرة، بينما كانت البكتيريا البروتيوبكتيرية أكثر هيمنة في المراحل اللاحقة، لا سيما في الإندوسفير (الشكل 3، الشكل التكميلي 6). على الرغم من أن الوفرة النسبية للبكتيريا الأكتينوبكتيرية أظهرت اتجاهًا تنازليًا تدريجيًا مع تطور النبات (تقلصت من و في اليوم الأول إلى و في اليوم 72 في منطقة الجذور والداخل الجذري، على التوالي)، زادت وفرتها المطلقة بمقدار 2.1 و 18.8 مرة في منطقة الجذور والداخل الجذري، على التوالي (الأشكال 3، 4)، مما يشير إلى أن النباتات تدعم حمولة متزايدة من البكتيريا الأكتينوبكتيرية على الرغم من انخفاض وفرتها النسبية. في الوقت نفسه، زاد عدد البكتيريا البروتيوبكتيرية بمقدار 5.4 و 119.2 مرة خلال مراحل نمو النبات في منطقة الجذور والداخل الجذري، على التوالي (الشكل 4). ومن المثير للاهتمام أن البكتيريا البكتيرودية لم تُكتشف تقريبًا في المراحل المبكرة. و من الوفرة النسبية في اليوم الأول في منطقة الجذور والداخل الجذري)، ولكن انتقل إلى نمو سريع في اليوم 60 وتضاعف بمعدل 48.8 و 460.7 مرة في اليوم 72 مقارنة باليوم الأول في منطقة الجذور والداخل الجذري، على التوالي، مع و من الوفرة النسبية (الأشكال 3، 4).
الميكروبيوم المرتبط بالجذور استجابةً للتسميد
كان لعلاجات التخصيب تأثير كبير على تركيبة وديناميات الميكروبيوم المرتبط بالجذور (الأشكال 2، 3). على مستوى الشعبة، كانت وفرة الأسيودوبكتيريا منخفضة باستمرار في معالجة -N مقارنة بالتحكم في كل من التربة العامة ومنطقة الجذور. )، في حين أنها ظلت مستقرة نسبيًا في الإندوسفير (الشكل التوضيحي 7). بالنسبة لعلاج -P، تم تقليل معظم الفصائل في منطقة الجذور بشكل خاص مقارنةً بالتحكم ( )، وخاصة البكتيريا من فصيلة البكتيرويديتس، لكن لم يكن هذا هو الحال في التربة السائبة والداخلية. لم تتأثر الفصائل البكتيرية بشكل كبير بتقليل تخصيب البوتاسيوم ( -K )، حيث أظهرت فقط السكاريبكتيريا وفرة أقل بشكل ملحوظ في منطقة الجذور مقارنةً بالتحكم ( ). في هذه الأثناء، زادت معالجة -N بشكل كبير، بينما قللت معالجة -P من وفرة الريزوبيا في منطقة الجذور مقارنةً بالتحكم استنادًا إلى جين rpoB ( الشكل التوضيحي التكميلي 8)، متسق مع الزيادة الملحوظة في عدد وقطر العقد الجذرية في معالجة -N مقارنةً بالتحكم (الشكل التوضيحي التكميلي 2). على وجه التحديد، كانت براجيريزوبيوم يابونيكوم، التي كانت النوع الوحيد من البكتيريا الجذرية الموجودة في العقد، أيضًا
الشكل 4 | المنحنيات الملائمة في الديناميات الزمنية للأنواع البكتيرية بواسطة QMP و RMP. ديناميات وفرة البكتيريا لأكثر ستة أنواع وفرة في منطقة الجذور (A) والجزء الداخلي للجذر (B) عبر مراحل نمو النبات استنادًا إلى مجموعات بيانات QMP (بالأحمر) و RMP (بالأخضر). المحور Y في اليسار هو الوفرة النسبية (%) لـ فصائل البكتيريا بناءً على RMP (نسبي، باللون الأخضر)، بينما المحور Y على اليمين هو الوفرة المطلقة نسخ ) من الفصائل البكتيرية بناءً على QMP (المطلق، باللون الأحمر). تمثل نطاقات الخطأ فترة الثقة. يتم توفير بيانات المصدر كملف بيانات المصدر. هيمنت على منطقة الجذور، مما يعكس الطبيعة الحصرية لتفاعلها التبادلي مع فول الصويا في التربة (الشكل التوضيحي 8).
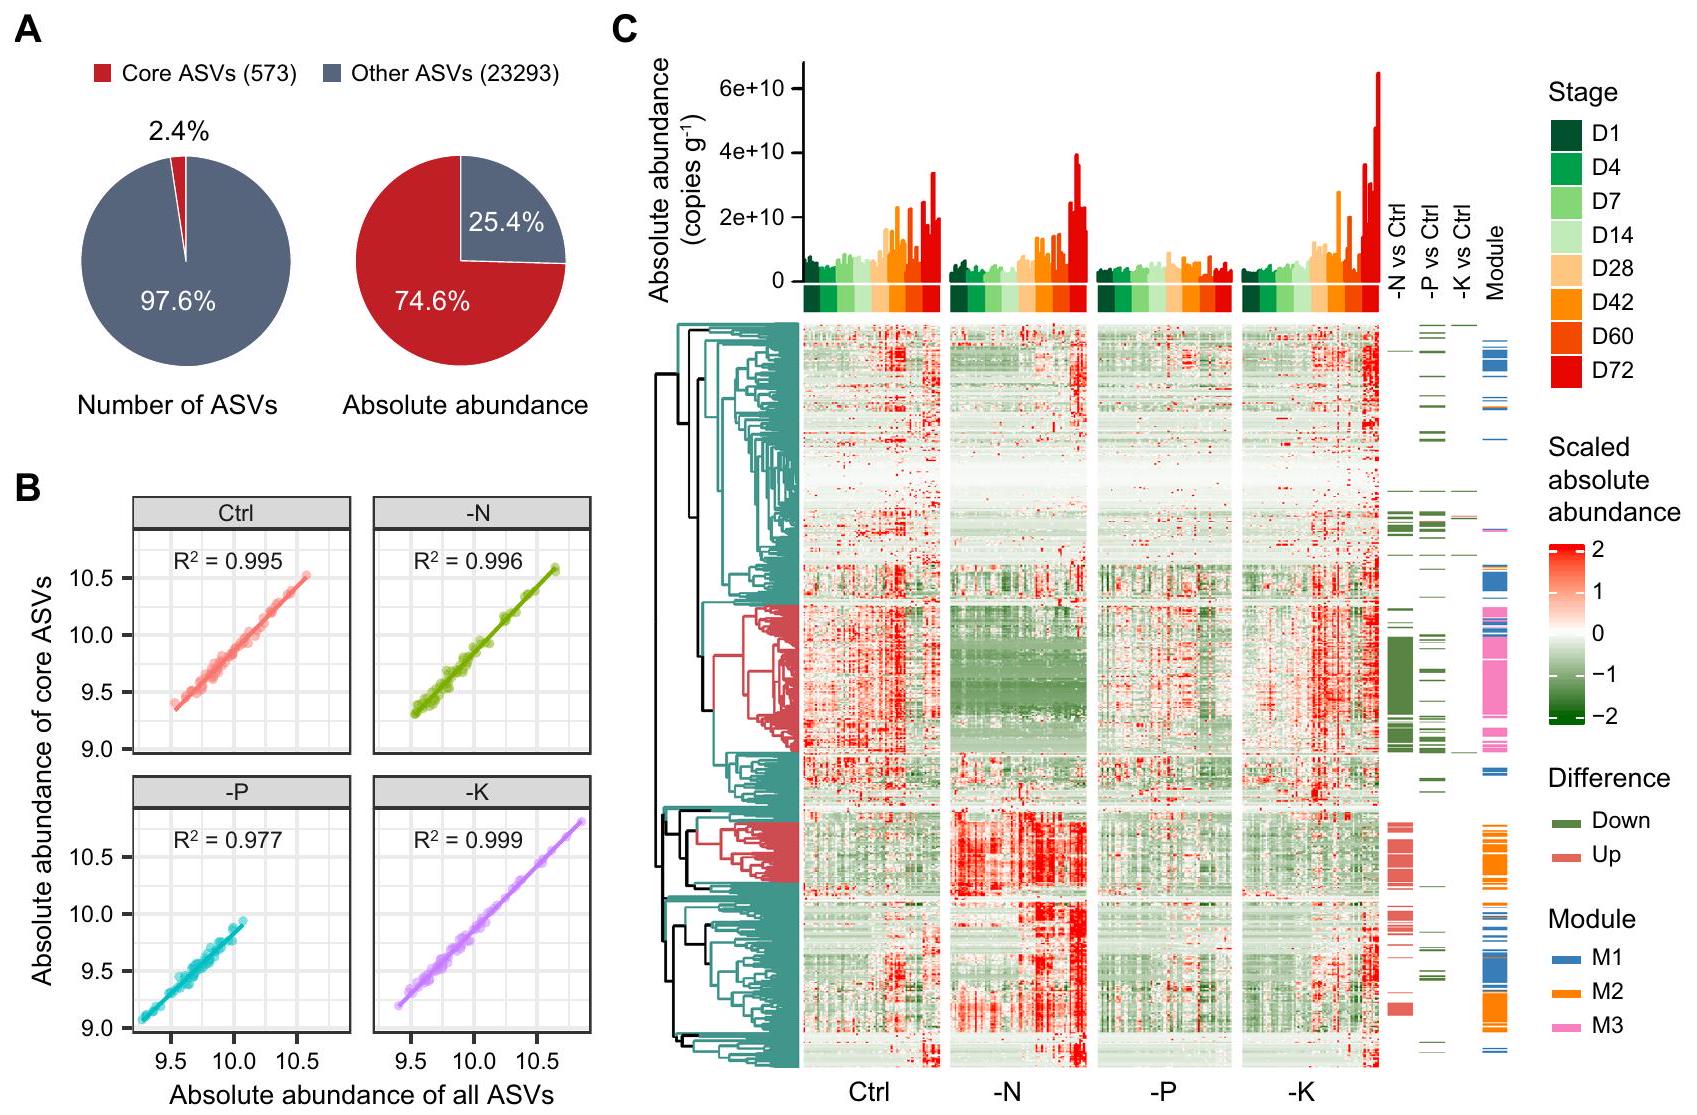
بالنظر إلى أن المجتمع البكتيري في منطقة الجذور كان أكثر حساسية للتسميد مقارنةً بما كان عليه في المنطقة الداخلية (الشكل 2، الشكل التكميلي 3)، ركزنا بعد ذلك بشكل أساسي على الاستجابات التصنيفية والوظيفية لبكتيريا منطقة الجذور تجاه التسميد، وحددنا الأنماط الأساسية في منطقة الجذور لتقليل تعقيد المجتمع البكتيري (الشكل 5). حددنا 573 نمطًا أساسيًا كأنماط أساسية، والتي تضمنت و من إجمالي ثراء البكتيريا ووفرتها، على التوالي، التي تمثل بشكل عام المجتمع البكتيري في كل معالجة (الشكل 5A، B). أظهرت تحليل التجميع الهرمي نمطًا مميزًا من ASVs الأساسية بين المعالجة الضابطة والمعالجة -N (الشكل 5C). من بين ASVs الأساسية، أظهر 172 فرقًا كبيرًا بين المعالجة الضابطة والمعالجة -N، مع 69 منها أظهرت زيادة (الشكل 5C، الشكل التكميلية 9). كانت ASVs المتزايدة في المعالجة -N تتكون بشكل رئيسي من Rhizobiales (12
ASVs)، Sphingomonadales (8)، Actinomycetales (8)، Rubrobacterales (7) و Gaiellales (6) (الشكل التوضيحي التكميلي 9). بالنسبة لعلاج -P، أظهرت 67 ASVs اختلافات ملحوظة بين العلاج Control و -P، لكن معظمها أظهر انخفاضًا في الوفرة في علاج -P، خاصةً Actinomycetales (24 ASVs)، Burkholderiales (7) و Rhizobiales (6). أما بالنسبة لعلاج -K، فقد اختلفت 6 ASVs فقط بشكل ملحوظ عن Control (الشكل التوضيحي التكميلي 9)، مما يشير إلى تأثير نسبي صغير لتسميد K على تركيبة الميكروبيوم.
التكيف الوظيفي لميكروبيوم الجذور
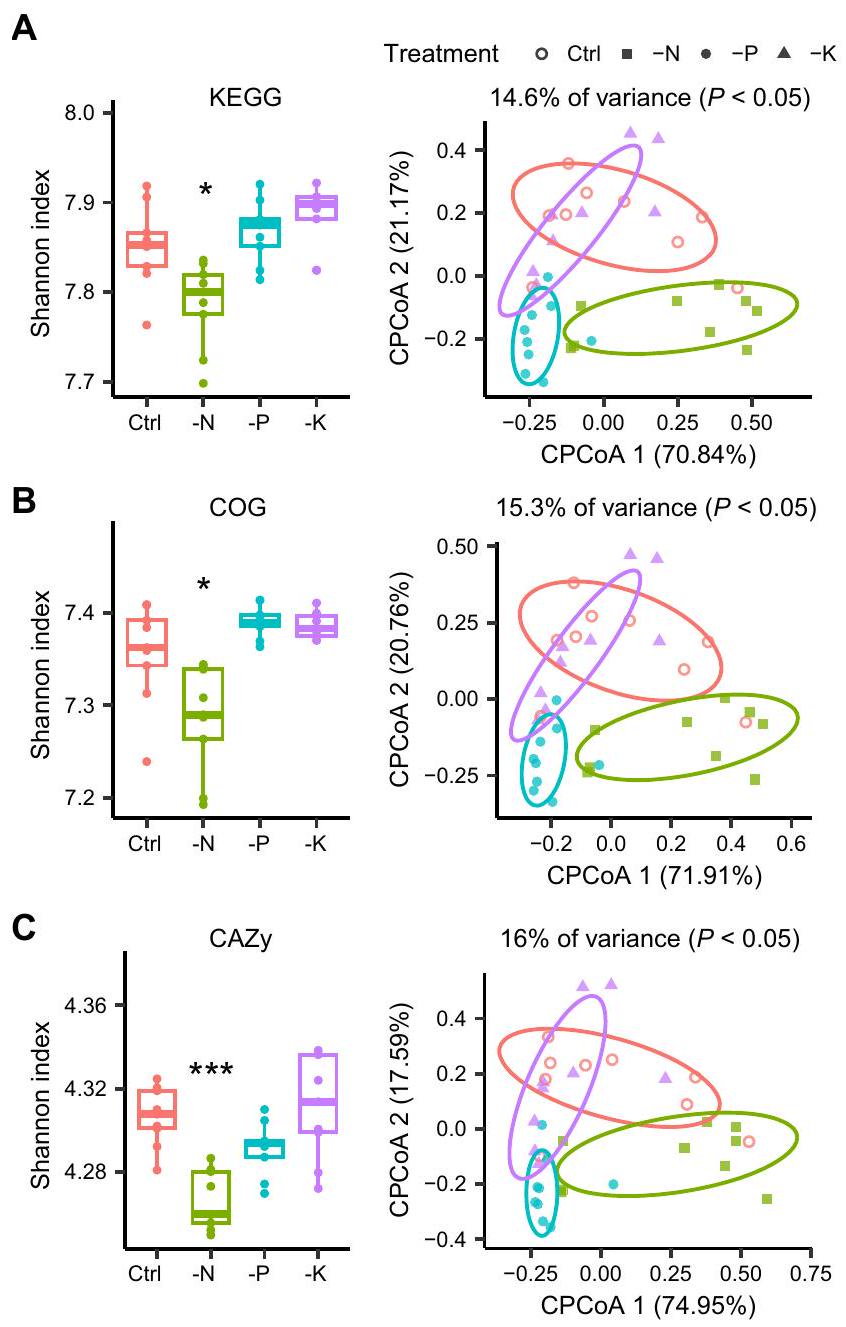
تم استخدام التحليل الميتاجينومي بعد ذلك للتحقيق في التغيرات التكيفية الوظيفية في ميكروبيوم الجذور عبر علاجات التسميد (الشكل 6). تم توضيح الجينات المكتشفة باستخدام قواعد بيانات KEGG و COG و CAZy، وأظهر التحليل انخفاضًا كبيرًا في وظائفها.-تنوع في معالجة -N مقارنة بالتحكم ( )، بينما لم تتأثر العلاجات -P و -K (الشكل 6A-C).
الشكل 5 | ASVs الأساسية في منطقة الجذور. أ غنى وتراكم وفرة ASVs الأساسية في منطقة الجذور. ب معامل الانحدار بين الوفرة المطلقة ( نسخ ) لجميع ASVs و ASVs الأساسية في كل علاج. خريطة حرارية للتجمعات الأساسية لـ ASVs في علاجات ومراحل تطوير مختلفة. العمود هو الوفرة المطلقة التراكمية لـ ASVs الأساسية في كل عينة. تشير اللوحة اليمنى إلى ASVs المتميزة بين معالجة التحكم ومعالجة التسميد غير المتوازن عبر مراحل نمو النبات، والمجموعات البيئية (وحدات الشبكة، في الشكل 7). تم توفير بيانات المصدر كملف بيانات مصدر.
تحليل المكونات الرئيسية المقيد (CPCoA) للوظائفأظهرت التنوع اختلافات واضحة بين العلاجات )، باستثناء وجود تداخل كبير بين مجموعة التحكم ومعالجة -K (الشكل 6A-C). قمنا بمزيد من التحقيق في الجينات المعنية في “، ودورة ك (الشكل 6D). في معالجة -N، تم إثراء الجينات المشاركة في عملية التمعدن النيتروجيني، بما في ذلك جينات تحلل اليوريا (ureC وURE) وجينات الجلوتامين (الأسباراجين) (aspQ)، في حين كانت الجينات المشاركة في اختزال النيتروجين (مثل narB وnarG وnarH)، ونزع النتروجين (مثل nirK)، وتحلل الفوسفور غير العضوي ( و ) ، ووسائل النقل K (على سبيل المثال، ، و تم استنفاد العمليات ( ) بشكل خاص، مقارنةً بالتحكم.
بالنسبة لعلاج -P، الجينات المرتبطة بتوفير الفوسفور (تحلل الفوسفور غير العضوي) واستجابة (الجوع) كانت غنية للغاية (الشكل 6D)، وأكدت الجينومات المجمعة من الميتاجينوم (MAGs) وجود جينات متعلقة بالمواد غير العضويةإذابة الفوسفات ونقص الفوسفور في معظم MAGs (الشكل التوضيحي 10)، مما يعكس بشدة ظروف ندرة الفوسفور. بالمقابل، كانت الجينات المعنية بعملية التمعدن النيتروجيني، وتقليل النيتروجين، وعمليات نقل البوتاسيوم ناقصة، بينما كانت عمليات النترجة وإزالة النترجة غنية في معالجة نقص الفوسفور مقارنةً بالتحكم (الشكل 6D). أظهر مقارنة نقص البوتاسيوم مقابل التحكم غنىً محددًا للجينات المرتبطة بنقل البوتاسيوم (مثل Kup) في معالجة نقص البوتاسيوم، ولكن لوحظت فقط بعض الاختلافات في الجينات الوظيفية المعنية بدورة المغذيات (الشكل 6D).
استنتاج الشبكة للميكروبيوم الجذري الأساسي
نظرًا للتأثير الكبير الذي لاحظناه على أنظمة التخصيب في الديناميات الزمنية لميكروبيوم الجذور، قمنا ببناء شبكات التعايش للـ ASVs الأساسية لعلاجات مختلفة لفك أنماط التعايش الخاصة بها عبر تطور النبات (المكملات
الشكل 11، الجدول التكميلي 6). بشكل عام، زادت تعقيد الشبكة (الدرجة المتوسطة) والصلابة تدريجياً مع مراحل نمو النبات، وتعزز تعقيد الشبكة بشكل حاد في المرحلة المتأخرة، مما يشير إلى أن أنماط التفاعل المحتملة للبكتيريا كانت ديناميكية ومكثفة استجابةً لتطور النبات. بعد ذلك، قمنا بمقارنة أنماط التجميع الميكروبي العامة وحددنا المحاور الأساسية في العلاجات المختلفة (الشكل التكميلي 12). أظهرنا أن تعقيد شبكة الجذور كان أعلى بكثير في علاجات -N و -K، بقيم 22.48 و 25.12 في علاجات -N و -K على التوالي، مقارنةً بـ 7.48 في التحكم (الشكل التكميلي 12A). وبالمثل، كانت صلابة الشبكة أعلى بكثير في جميع العلاجات الثلاثة مقارنةً بالتحكم.، الشكل التوضيحي التكميلي 12B). بالنسبة للمراكز الأساسية، وجدنا أنه لم يتم تحديد مركز وحدة في كل شبكة، باستثناء وجود مركز وحدة في شبكة معالجة -P (الشكل التوضيحي التكميلي 12C)، مما يشير إلى أن المجموعة الميكروبية بدلاً من نوع واحد هي التي تحكم وظيفة المجتمعات الميكروبية في منطقة الجذور.
عنقود غني بالنيتروجين المنخفض يعزز نمو النباتات
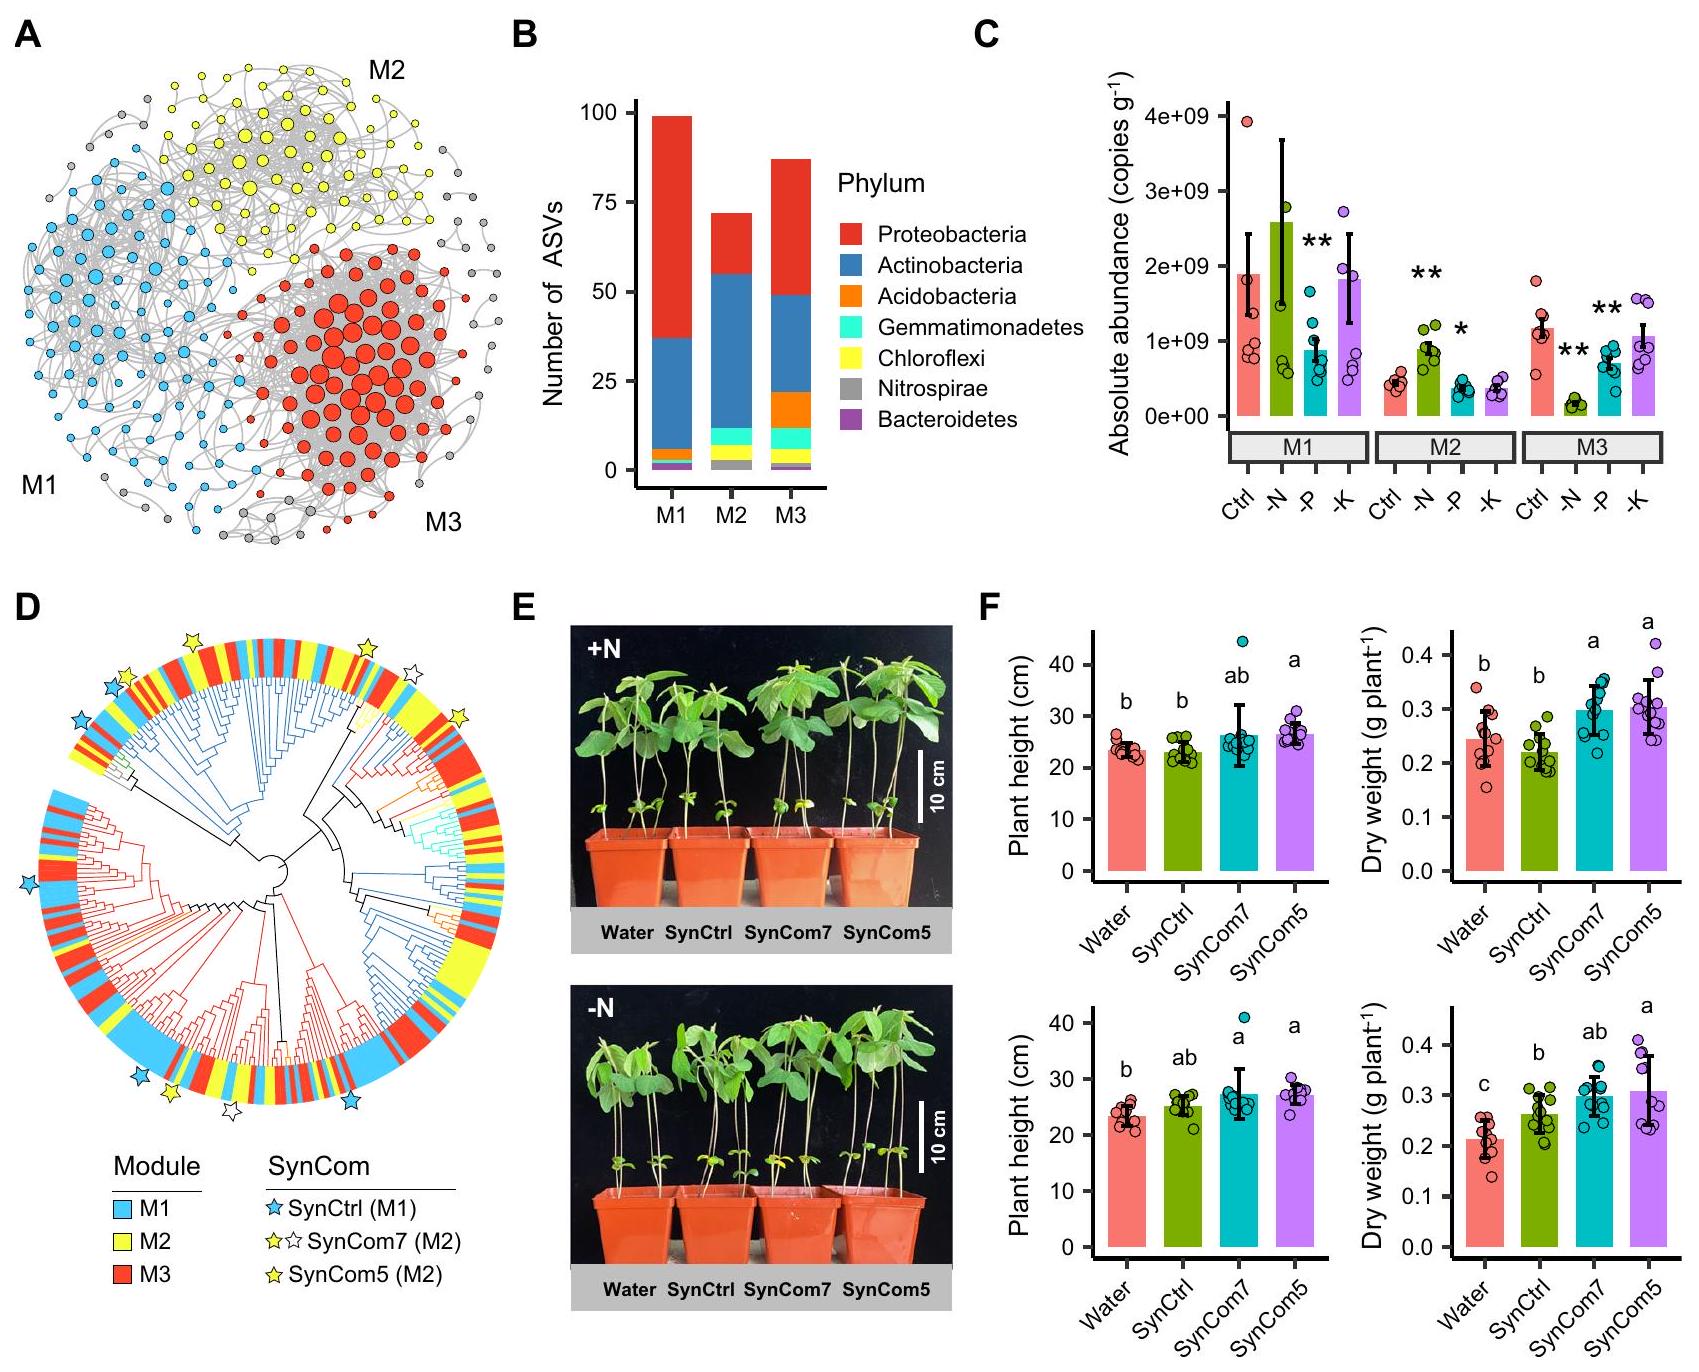
ثم قمنا بإنشاء شبكة لمقارنة التغيرات الناتجة عن التخصيب في الكتل البيئية (أي، وحدات الشبكة)“، وتم التحقيق في وظائفها في تعزيز نمو النباتات باستخدام مجتمع اصطناعي (SynCom) (الشكل 7). بشكل عام، تم تحديد ثلاثة وحدات رئيسية في الشبكة (الشكل 7A). كانت الوحدة رقم 1 والوحدة رقم 3 مهيمنة على البكتيريا البروتيوبكتيرية، بينما كانت الأنواع في الوحدة رقم 2 تتكون بشكل رئيسي من البكتيريا الأكتينوبكتيرية. )، حيث تم تقليل الأحماض البكتيرية (الشكل 7B). أظهرت الأحمال البكتيرية في الوحدة #2 والوحدة #3 استجابات متعارضة في معالجة -N مقارنة بالتحكم، مع وفرة أعلى بشكل ملحوظ في الوحدة #2 ولكن أقل في الوحدة #3
الشكل 6 | الملفات الوظيفية لميكروبيوم الجذور في علاجات مختلفة. الوظائف-تنوع (يسار) و-تنوع (يمين) ميكروبيوم الجذور في كل معالجة استنادًا إلى قواعد بيانات KEGG (A) و COG (B) و CAZy (C) (عينات التربة). تمثل النجوم مستوى الأهمية ( ) من الوظيفي -التنوع بين معالجة التحكم والمعالجة غير المتوازنة للتسميد استنادًا إلى اختبار كروسكال-واليس مع تحليل دان بعد الاختبار. مستوى الدلالة الوظيفيةتم تقييم التنوع بين العلاجات بواسطة تحليل التباين الشبيه بـ ANOVA
اختبار التبديل. دقيق-تُدرج القيم في ملف بيانات المصدر. تشير الرسوم البيانية الصندوقية إلى الوسيط (الخط المركزي)، والنسبة المئوية 25 و75 (الصندوق)، ونطاق القيم غير الشاذة (الخطوط المتفرعة).اختلافات الجينات الوظيفية المرتبطة بـ، و ركوب الدراجات. تمثل النجوم مستوى الأهمية، بين معالجة التحكم ومعالجة التسميد غير المتوازن استنادًا إلى اختبار ويلكوكسون المزدوج. تم توفير بيانات المصدر كملف بيانات مصدر.
(شكل 7C). من المثير للاهتمام أن الأنواع البكتيرية في الوحدة #2 والوحدة #3 أظهرت تداخلًا كبيرًا مع ASVs المتزايدة والمتناقصة في معالجة -N، على التوالي (شكل 5C). بالنسبة لمعالجة -K، كانت وفرة الوحدات الثلاث مشابهة للتحكم، بينما بالنسبة لمعالجة P كانت منخفضة باستمرار (شكل 7C).
لاختبار العلاقة السببية بين مجموعات الميكروبات البيئية وأداء النباتات، قمنا أولاً بعزل 1011 سلالة بكتيرية من منطقة جذور فول الصويا عن طريق الزراعة. كانت البكتيريا المعزولة تتكون بشكل رئيسي من البكتيريا البروتيوبكتيرية.بكتيريا الأكتينوبكتيريا ( )، Firmicutes (27.4%) وBacteroidetes (4.6%)، حيث يمكن تصنيف 78.9% من السلالات على مستوى الجنس، مع تحديد 56 جنسًا إجمالاً (الشكل التوضيحي 13A). بعد مقارنة السلالات البكتيرية المعزولة مع ASVs الأساسية، استعدنا و من وفرة ASVs الأساسية في مجموعات البيانات مع وفرة ASVs التراكمية إلى و من إجمالي التسلسلات، على التوالي (الشكل التكميلي 13B)، مما يشير إلى تغطية جيدة من قبل السلالات المعزولة لنوى ASVs في منطقة الجذور. في الوحدة #2 (أي، مجموعة غنية بالنيتروجين المنخفض، مجموعة LNE)، كانت هناك سبعة نوى ASVs أساسية (مرتبطة بـ Rhodococcus و Lysobacter و Terrabacter و Arthrobacter و Phyllobacterium و Bosea و Aeromicrobium) كانت تمت مطابقة سلالات بكتيرية وتم تعيينها كـ SynCom7 (الشكل 7D). بالنظر إلى أن الحمل البكتيري في الوحدة #1 أظهر فرقًا غير ذي دلالة بين المعالجة الضابطة والمعالجة -N، تم اختيار السلالات البكتيرية من الوحدة #1 كـ SynCom ضابطة (SynCtrl). بشكل عام، تم تجميع 5 ASVs (المرتبطة بـ Brevundimonas و Sediminibacterium و Mycobacterium و Herbaspirillum و Sphingomonas) التي تطابقت في الوحدة #1 لاستخدامها كـ SynCtrl (الشكل 7D). لاستبعاد احتمال حدوث تكتل ناتج عن Bradyrhizobiaceae وتنسيق التنوع الميكروبي مع SynCtrl، تم اختيار خمسة سلالات مستمدة من مجموعة LNE في التجربة (SynCom5) (باستثناء Bosea sp. و Aeromicrobium sp. من SynCom7).
تم تلقيح فول الصويا المزروع في الأص pots مع إما SynCom5 أو SynCom7 أو SynCtrl في الفيرميكوليت المعقم لمدة 2 و 3 أسابيع. بعد ذلك، تم قياس الأنماط الظاهرة للنبات، بما في ذلك ارتفاع الساق، والكتلة الحيوية الكلية، وتركيزات النيتروجين النترات. أظهرت النتائج أن كلا من SynComs المشتقة من مجموعة LNE (SynCom7 و SynCom5) كانت قادرة على تحفيز نمو النبات، بغض النظر عن إضافة النيتروجين الخارجي (الشكل 7E، F، الشكل التوضيحي 14). على وجه التحديد، زاد ارتفاع الساق لفول الصويا الملقح بـ SynCom 5 بنسبة و وزن الجفاف زاد بمقدار
الشكل 7 | تباين الكتل البيئية (وحدات الشبكة) في منطقة الجذور ووظائفها في تعزيز نمو النبات. A شبكة مرئية للعلاقات والتجزئة. B ثراء ASV والتصنيف لكل وحدة. C الوفرة المطلقة التراكمية لكل وحدة في العلاجات المختلفة. بيانات الوفرة المطلقة المتوسطة لكل مرحلة). تمثل النجوم في (C) مستوى الدلالة ( ) بين معالجة التحكم والمعالجة غير المتوازنة للتسميد استنادًا إلى اختبار كروسكال-واليس مع تحليل دان بعد الاختبار. دقيق تُدرج القيم في ملف بيانات المصدر. أربع نقاط بيانات ذات وفرة مطلقة تتجاوز نسخ لا تظهر بسبب قيود المحور Y. مطابقة ASVs المودولية مع سلالات بكتيرية معزولة للحصول على SynComs.
أنماط نمو E و F لفول الصويا الملقح بأنواع مختلفة من SynComs بعد أسبوعين من التلقيح تحت ظروف مضافة للنيتروجين (+N، اللوحة العلوية) أو خالية من النيتروجين (-N، اللوحة السفلية)لـ -N معالجة المياه،لعلاج -N SynCom5،للعلاجات الأخرى). تشير الحروف المختلفة إلى وجود فرق كبير في أنماط نمو النباتات في العلاجات المختلفة عندباستخدام اختبار ANOVA أحادي الاتجاه مع تحليل LSD بعد الاختبار (لبيانات تتناسب مع التوزيعات الطبيعية والتباين المتجانس) أو اختبار كروسكال-واليس مع تحليل دان بعد الاختبار (لبيانات لا تتناسب مع التوزيعات الطبيعية والتباين المتجانس). دقيق-القيم مدرجة في ملف البيانات المصدر. يتم تقديم البيانات كقيم متوسطةالانحراف المعياري (SD). يتم توفير بيانات المصدر كملف بيانات المصدر. وبعد أسبوعين من التلقيح، مقارنة بالنبات الذي تم تلقيحه بـ SynCtrl مع أو بدون تعديل النيتروجين، على التوالي (الشكل 7F). كما لوحظت نتائج مماثلة بعد 3 أسابيع من التلقيح، وزادت محتويات النيتروجين النترات في النباتات المعالجة بـ SynCom (SynCom7 و SynCom5) بـ و إلى علاج SynCtrl في ظروف تعديل النيتروجين وبدون نيتروجين، على التوالي (الشكل التكميلي 14). أخيرًا، قمنا بتقييم خصائص تعزيز نمو النبات (PGP) لكل من SynCom والسلالة (الشكل التكميلي 15). بالمقارنة مع SynCtrl، أظهرت كل من SynCom7 وSynCom5 تركيزًا أعلى من حمض الإندول-3-أسيتيك (IAA) ونشاط إنزيم 1-أمينوسايكلوبروبان-1-كربوكسيليك (ACC) دياميناز. أظهرت سلالتان في SynCom7 وSynCom5 القدرة على إذابة الفوسفور غير العضوي. ومع ذلك، لم يتم الكشف عن نشاط تثبيت النيتروجين في جميع السلالات، مما يشير إلى أن الريزوبيا قد تتفاعل بشكل إيجابي مع SynComs من خلال تسهيل تغذية النبات بالنيتروجين.
نقاش
يُعتقد أن النباتات تستقطب الأنواع الميكروبية طوال حياتها، حيث تؤدي إفرازات الجذور المحددة عمومًا إلى توجيه نمط استعمار الميكروبات في الأجزاء السفلية، مما يؤدي إلى طبيعة ديناميكية عالية لميكروبيومات الجذور المرتبطة.نظرًا لأن الحمل الميكروبي يتغير مع البيئةفشلت RMP في اكتشاف الكثير من التباين الذي يحدث بين العينات ولا تقدم صورة كاملة عن التغيرات التي تحدث بمرور الوقت. هنا، نكشف للمرة الأولى عن المشهد الكامل للتغيرات التي تحدث في بكتيريا جذور فول الصويا من خلال تطبيق QMP ونقترح أن الميكروبيوم الجذري الديناميكي قادر على تعزيز نمو فول الصويا. وجدنا أدلة على أن الأحمال البكتيرية في كل من منطقة الجذور والداخلية أظهرت اتجاهات متزايدة مع تطور النبات، حيث زادت معظم الأنواع الرئيسية بشكل ثابت مع مرور الوقت، على الرغم من اتجاهات وفرتها النسبية غير المتسقة (الأشكال 3، 4). لاحظنا تسلسلًا أقوى لمجتمع البكتيريا في منطقة الجذور عبر تطوير النبات بناءً على QMP ) مقارنة مع RMP ( )، باستثناء معالجة -P (الشكل 2، الشكل التوضيحي 4، الجدول التوضيحي 3)، مما يشير إلى أن الميكروبات في منطقة الجذور أكثر ديناميكية مما تم إدراكه سابقًا. هذه النتائج، جنبًا إلى جنب مع الاتجاه المتناقص المستمر للبكتيريا -تنوع الكائنات الحية في منطقة الجذور مع تقدم نمو النبات، يشير إلى أن النباتات تزيد من القدرة الاستيعابية للميكروبات ولكن تعزز الضغط الانتقائي مع تطور النباتات، وهو ما يمكن أن يتشكل بشكل كبير من خلال التطور المشترك الطويل الأمد بين النباتات والميكروبات.
استنادًا إلى تحليل QMP، وجدنا أن البكتيريا من فصائل البروتيوبكتيريا والأكتينوبكتيريا والباكتيرويديتس كانت غنية بشكل شائع عبر مراحل نمو النبات (الأشكال 3، 4). كانت الباكتيرويديتس غنية بشكل خاص، تليها البروتيوبكتيريا، مما يشير إلى أنها كانت الأكثر استجابة لنمو النبات (الأشكال 3، 4). تُعرف الباكتيرويديتس عمومًا بأنها بكتيريا محبة للمواد العضوية.-استراتيجية للازدهار في بيئات غنية بالمواردمع تداعيات على دورة النيتروجين والفوسفوركما زادت كمية الأكتينوبكتيريا بشكل ملحوظ مع مرور الوقت، على الرغم من انخفاض وفرتها النسبية (الأشكال 3، 4)، مما يشير إلى أن النباتات لا تنفر الأكتينوبكتيريا خلال تطور النبات، ولكن الأكتينوبكتيريا تتفوق عليها البكتيرويديتات والبروتيوبكتيريا. كشفت دراسة رائدة أن الأكتينوبكتيريا يتم استقطابها بشكل انتقائي بواسطة خلايا النبات النشطة بدلاً من الخلايا الخشبية غير النشطة.تُعرف أعضاء البكتيريا الفعالة بقدرتها على إنتاج مجموعة من المركبات المضادة للميكروبات التي تعزز لياقة المضيف.نظرًا لأن النباتات أكثر عرضة للأمراض في مراحل النمو المبكرةقد تفيد التكامل الزمني لمقاومة الميكروبات والمناعة الفطرية للنبات صحة النبات وتطوره. تشير هذه النتائج معًا إلى أن تطور النبات يدفع توسيع الميكروبيوم المرتبط بالجذور، الذي يتفاعل بشكل وثيق مع النباتات لتعزيز لياقة المضيف وقابليته للتكيف.
وجدنا أدلة قوية على أن بكتيريا منطقة الجذور كانت أكثر حساسية للتسميد من البكتيريا الموجودة في داخل النبات (الشكل 2، الشكل التكميلي 3). يمكن أن يُعزى ذلك إلى أن منطقة الجذور تعمل كواجهة للتفاعلات بين النبات والتربة وتعتبر نقطة ساخنة للمجتمعات الميكروبية مقارنة بالتربة العامة، بينما تحافظ المنطقة الداخلية على التوازن لصحة المضيف. على وجه الخصوص، أظهرنا أن معالجة -P قللت بشكل كبير من معدل التغير الزمني للميكروبات في منطقة الجذور، وأضعفت تغير الميكروبات.-تنوع، وانخفاض مستمر في الحمل البكتيري مقارنةً بالتحكم عبر تطور النبات (الأشكال 2، 3)، مما يشير إلىالحرمان يؤخر تطوير ميكروبيوم الجذور. وقد تم الإبلاغ عن أن الجفاف يؤخر بشكل مشابه نضوج ميكروبيوم الجذور في الذرة الرفيعة والأرز.مما يشير إلى أن إمدادات المغذيات من المضيف قد تتقلص خلال فترات الضغط غير الحيوي الشديد. في الوقت نفسه، تم الإبلاغ عن أن تغذية الفوسفور لها تأثير إيجابي على تثبيت النيتروجين في فول الصويا.وفقًا لذلك، لاحظنا أن عدد وأقطار العقد الجذرية لفول الصويا قد انخفضت، كما انخفضت وفرة البكتيريا الجذرية في منطقة الجذور تحت نقص الفوسفور (الأشكال التكميلية 2، 8). ومع ذلك، لاحظنا فقط انخفاضًا في المحصول بمقدار ربع في معالجة نقص الفوسفور مقارنةً بالتحكم (الشكل 1). ومن جهة أخرى، كانت الجينات الوظيفية الميكروبية التي تشفر عن إذابة الفوسفور غير العضوي ونقص الفوسفور متزايدة بشكل خاص في منطقة الجذور تحت نقص الفوسفور.العلاج، وكانت هذه الجينات شائعة في الجينومات المجمعة من الميتاجينوم (الشكل 6، الشكل التوضيحي 10). لسبب آخر، قد تتعزز العلاقة التبادلية بين النباتات والفطريات الميكوريزية الجذرية في ظل انخفاض توفر الفوسفور في التربة.لقد لاحظنا أيضًا أن عمليات تحويل النيتروجين، بما في ذلك النترجة وإزالة النيتروجين، كانت غنية بشكل ملحوظ في معالجة -P (الشكل 6). قد تكون هذه نتيجة لوجود فائض من النيتروجين في التربة نتيجة لانخفاض امتصاص النيتروجين بواسطة النباتات تحت ظروف نقص الفوسفور، مما يؤدي إلى زيادة عمليات تحويل النيتروجين في منطقة الجذور، وهو ما يتوافق مع العديد من الدراسات المعتمدة على التربة..
على النقيض، تم ملاحظة مسارات مختلفة بين أنظمة تخصيب P و N، مع-مسافة منطقة الجذور تباين الميكروبيوم في مرحلة مبكرة بين المعالجة الضابطة ومعالجة -N، مما أدى إلى التطور المتوازي لميكروبيوم الجذور المميز في المعالجتين (الشكل 2). يمكن أن يُعزى ذلك إلى التأثير الكبير للنيتروجين على العمليات الكيميائية والبيولوجية في التربة عبر أنظمة بيئية مختلفة.“، بالإضافة إلى تأثير الإرث للنيتروجين على المجتمعات البكتيرية في التربة السائبة على مدى أربعة عقود (الشكل 2). إن نقص سماد النيتروجين في المعاملة -N قد حسن بشكل عام من تكوين العقد الجذرية في فول الصويا وزاد من وفرة البكتيريا الجذرية (الأشكال التكميلية 2، 8)، وهو ما يتماشى مع العديد من الدراسات السابقة التي أظهرت أن نقص المدخلات غير العضوية من النيتروجين وارتفاع درجة الحموضة يفيدان تثبيت النيتروجين التبادلي.. بالإضافة إلى تثبيت النيتروجين التبادلي، يمكن أيضًا تحسين توفر النيتروجين من خلال تحلل النيتروجين العضوي. تشير زيادة الجينات الوظيفية المعنية بتوفر النيتروجين ولكن تقليل الجينات المتعلقة بتقليل النيتروجين في منطقة الجذور لعلاج -N إلى إمداد فعال بالنيتروجين في فول الصويا في غياب سماد النيتروجين (الشكل 6)، مما يتوافق مع استقرار إنتاجية فول الصويا في علاج -N (الشكل 1). وبالمثل، كشفت دراسة واسعة النطاق أجريت في الولايات المتحدة والأرجنتين عن فقط زيادة محصول فول الصويا في معالجة النيتروجين الكامل مقارنة بمعالجة عدم وجود النيتروجين، وتأثير الأسمدة النيتروجينية الإيجابي زاد مع زيادة إمكانيات المحصول.مما يشير إلى أن تغذية فول الصويا بالنيتروجين يمكن تلبيتها عبر مساحات واسعة دون الحاجة إلى إمدادات نيتروجين خارجية.
تم الإبلاغ عن أن الميكروبات المرتبطة بالجذور تتفاعل مع بعضها البعض للحفاظ على الوظائف الأساسية في اكتساب العناصر الغذائية من المضيف مما يؤدي إلى تعزيز لياقة النبات.وجدنا أدلة على أن أنماط التعايش للبكتيريا الأساسية في الميكروبيوم في منطقة الجذور قد تغيرت استجابةً للتسميد، مما أظهر زيادة في تعقيد الشبكة واستقرارها في معالجات -N و -K مقارنةً بالتحكم (الشكل التوضيحي التكميلي 12)، على الرغم من وجود اختلافات قليلة في التصنيف والوظائف بين التحكم ومعالجة -K. وقد تم الإبلاغ عن أن شبكة متصلة بشكل كبير يمكن أن تحدث تحت الاضطرابات البيئية، مثل ندرة المغذيات وغزو مسببات الأمراض.أظهرت دراسة مخبرية تفحص التفاعلات الميكروبية أيضًا أن الميكروبات أقامت درجة عالية من التعاون الأيضي في ظل توفر منخفض للمواد الغذائية.تعقيد واستقرار الشبكات هو سمة مهمة لوظيفة النظام البيئي.إن زيادتها في كل من معالجات -N و -K تشير بشكل محتمل إلى زيادة القدرة على تخفيف ضغط المغذيات من خلال تفاعلات أيضية مكثفة مثل التغذية المتبادلة والتسهيل.
الميكروبيوم المرتبط بالجذور هو نتيجة للتغذية الراجعة من العلاقات المعقدة بين النباتات المضيفة وبيئة التربة، ويمتد إلى ظواهر النباتات.. ومع ذلك، لا يزال فهمنا للتغيرات الديناميكية التي تحدث خلال هذه التفاعلات وتأثيرها على أداء النباتات غامضًا. لقد لاحظنا أن عدة تجمعات بيئية (وحدات الشبكة) من الأنواع الميكروبية الأساسية اختلفت في الوفرة والتركيب عبر العلاجات المختلفة (الأشكال 5، 7). قد تحتوي هذه الأنواع على سمات تمنحها وظائف أيضية متخصصة وتؤثر على عمليات النظام البيئي المحددة.بعد تصميم مجتمعات تركيبية (SynComs) من مجموعات بيئية مختلفة، أظهرنا أن المجتمعات التركيبية من مجموعة LNE (SynCom5 وSynCom7) كانت قادرة على تحسين نمو فول الصويا، بغض النظر عن إضافة النيتروجين، لكن المجتمعات التركيبية من الوحدة #1 (SynCtrl) لم يكن لها تأثير متسق (الشكل 7، الشكل التوضيحي 14). لم نلاحظ تشكيل عقيدات جذرية في علاجات المجتمعات التركيبية، مما يشير إلى أن التأثير لم يكن معتمدًا على وجود الريزوبيا. بالإضافة إلى التحسين المباشر لتوافر النيتروجين بواسطة ميكروبات منطقة الجذور، تُعرف الميكروبات أيضًا بتأثيراتها في تعزيز نمو النباتات، مثل إنتاج IAA وACC دياميناز. تشير نسبة الإنتاج الأعلى لـ IAA وACC دياميناز في مجموعة LNE إلى أن النباتات يمكن أن تستفيد من وجود مجموعات ميكروبية محددة بطرق متعددة (الشكل التوضيحي 15). علاوة على ذلك، تم الإبلاغ عن أن الميكروبيوم في منطقة الجذور يلعب أيضًا دورًا مهمًا في تسهيل تكوين عقيدات فول الصويا.وأن التكتل ينظم الميكروبات المتعايشة في منطقة الجذور. هذا يشير إلى وجود تفاعلات إيجابية بين الميكروبيوم في منطقة الجذور والعُقَد الجذرية. على الرغم من أن لدينا تتركز الدراسة على المجتمع البكتيري المرتبط بالجذور، ومن المهم أن نلاحظ أن كائنات أخرى، مثل الفطريات الخيطية والبروتستات، قد تلعب أيضًا دورًا في تشكيل الارتباطات الشبكية والوظائف البيئية من خلال تأثيرات “من الأعلى إلى الأسفل”.وكيف تتطلب تفاعلاتهم من أجل استفادة النباتات من التبادلات الثلاثية (مثل، الريزوبيا، والفطريات الميكوريزية، والنباتات) مزيدًا من التحقيقبشكل عام، توفر دراستنا أدلة تجريبية على تعزيز مجموعات بيئية ميكروبية محددة لزيادة ملاءمة النباتات وتؤسس إطارًا لتحديد وتصميم واختبار المجتمعات الميكروبية المهمة زراعيًا للحفاظ على إنتاجية المحاصيل.
طرق
تصميم التجارب، أخذ العينات، وقياس الخصائص الكيميائية للتربة
تم إطلاق التجربة الميدانية طويلة الأمد في عام 1979 في منطقة داوواي، هاربين، الصين.المناخ هو مناخ قاري موسمي معتدل، ونوع التربة مصنف كموليسول. نظرًا لأن المحصول يمكن زراعته مرة واحدة فقط في السنة، تم اعتماد نظام دوران المحاصيل من فول الصويا والذرة والقمح لمدة ثلاث سنوات. تم إعداد أربعة علاجات، بما في ذلك (1) التسميد بالجرعة الكاملة (سماد NPK، التحكم)؛ (2) نقص سماد النيتروجين (-N)؛ (3) نقص سماد الفوسفور (-P)؛ و(4) نقص سماد البوتاسيوم (-K) (الشكل 1A). كل علاج يتكون من ثلاث قطع مع تصميم كتلة عشوائية بالكامل، وكل قطعة تضم (الشكل 1A)، وتم فصل القطع المختلفة بواسطة جدران خرسانية (بعرض 0.15 م وعمق 1.1 م). كان سماد النيتروجين المستخدم في التجربة هو اليوريا، وكان سماد الفوسفور مزيجًا من و ، والأسمدة البوتاسية المستخدمة كانتبالنسبة لزراعة فول الصويا، كانت معدلات التطبيق، و لـ، و ، على التوالي، وتم تطبيق الزراعة التقليدية لزراعة فول الصويا. تم إنشاء التلال بواسطة محراث التلال، مع مسافة تباعد التلال 0.65 م. في كل تل، تم زراعة بذور فول الصويا في صفين، مع تباعد النباتات 0.1 م. بشكل إجمالي، كان هناك حوالي 1000 نبات لكل قطعة أرض. تم اعتماد إدارة الحقل، بما في ذلك الري وإزالة الأعشاب، وفقًا لممارسات المزارعين المحليين وكانت متطابقة للعلاجات المختلفة. بعد الحصاد، كانت الأرض بورا حتى موسم الزراعة في العام التالي.
تم جمع عينات التربة من منطقة الجذور والجذور من حقول فول الصويا في موسم الزراعة لعام 2020. قبل الزراعة، تم أخذ عينات من التربة الكلية لكل معالجة كخلفية. تم زراعة صنف فول الصويا “هاينونغ 84” في أوائل مايو وبدأ في الإنبات بعد 10 أيام. قمنا بجمع عينات التربة من منطقة الجذور والعينات الجذرية المقابلة في، وبعد 72 يومًا من الإنبات. يتم توضيح مراحل تطور النبات المتعلقة بالإزهار وتكوين القرون في الشكل 1A. لكل قطعة، تم اختيار ثلاث نباتات بحالة نمو مشابهة بشكل عشوائي لجمع العينات، وكان موقع أخذ العينات بعيدًا عن مراحل أخذ العينات السابقة لتجنب التأثير الهامشي المحتمل والاضطراب مع النباتات المجاورة، مع تسع عينات بيولوجية لكل معالجة في كل مرحلة. باختصار، تم استخراج نبات فول الصويا، وتم إزالة التربة المرتبطة بالجذر بشكل غير محكم عن طريق الاهتزاز وتم وضع جذر النبات في أنبوب معقم سعة 50 مل. بعد أخذ العينات، تم نقل عينات منطقة الجذور والجذور إلى المختبر في صندوق ثلج، ثم تم تخزينها فيحتى استخراج الحمض النووي. عند النضج، تم قياس العائد لكل من قطع فول الصويا باستخدام طرق قياسية.
تم قياس الخصائص الكيميائية للتربة السطحية لمراقبة حالة العناصر الغذائية في التربة. باختصار، تم قياس AHN للتربة باستخدام طريقة الانتشار القلوي. تم تحديد الفوسفور المتاح في التربة بواسطة طريقة الموليبدينوم الزرقاء بعد الاستخراج باستخدام بيكربونات الصوديوم، وتم تحديد البوتاسيوم المتاح (AK) بواسطة مقياس ضوء اللهب بعد الاستخراج باستخدام أسيتات الأمونيوم. تم تحديد SOM بواسطة طريقة الأكسدة الكيميائية بعد الهضم باستخدامتم قياس DOC بعد الاستخراج بـحل. تم قياس درجة حموضة التربة بنسبة ماء التربة عند.
عينة المعالجة المسبقة واستخراج الحمض النووي الكلي
تم استخدام التربة المتبقية الملتصقة بإحكام بالجذور كعينة من تربة الجذور. تم إجراء المعالجة المسبقة لعينة تربة الجذور وعينات الجذور كما هو موضح سابقًا في المراجع 7، 54، مع تعديلات طفيفة. أولاً، تم استخدام 25 مل من محلول PBS (الذي يحتوي على 137 مليمول) ) تم إضافة إلى أنبوب طرد مركزي سعة 50 مل يحتوي على عينات الجذور. تم استخدام الموجات فوق الصوتية على الخليط بتردد 40 هرتز لمدة دقيقة واحدة وتم هزّه لفصل التربة المحيطة بالجذور عن الجذور. ثم تم نقل التربة المحيطة بالجذور إلى أنبوب آخر معقم سعة 50 مل وتم طردها مركزيًا بسرعة 9000 دورة في الدقيقة لمدة 5 دقائق، وبعد ذلك تم تعريض التربة المحيطة بالجذور المتبقية للتبخر الدوار (Concentrator Plus، Eppendorf، ألمانيا). بعد ذلك، تم تجانس التربة المحيطة بالجذور عن طريق الطحن (Tissuelyser-48، Jingxin، الصين). بعد جمع التربة المحيطة بالجذور، تم استخدام الموجات فوق الصوتية وغسل الجذور المتبقية مرتين في محلول PBS. تم فصل العقد من الجذر باستخدام ملاقط، ثم تم تعقيم سطح الجذور أو العقد بواسطةحل لمدة دقيقة واحدة، على التوالي. تم تعقيم الجذور أو العقد السطحية، ثم تم تعريضها للموجات فوق الصوتية والهز عن طريق إضافة 25 مل من محلول PBS وتم تكرار ذلك ثلاث مرات. بعد ذلك، تم تعريض حوالي 200 ملغ من الجذور أو العقد المعقمة السطحية للتبخر الدوار، ثم تم تجانسها عن طريق الطحن في النيتروجين السائل لاستخراج الميكروبيوم الداخلي. كما تم تجفيف التربة السائبة في المبخر الدوار ثم تم تجانسها. تم تخزين العينات المعالجة بعد ذلك في.
تم عزل الحمض النووي الكلي من عينات التربة والجذور/العُقَد باستخدام FastDNAتم استخدام مجموعة SPIN للتربة (MP Biomedical، سولون، أوهايو، الولايات المتحدة الأمريكية) وفقًا لبروتوكول الشركة المصنعة. تم التحقق من جودة الحمض النووي عن طريق الرحلان الكهربائي على هلام أغاروز بنسبة 1%. ثم تم تأكيد تركيز ونقاء الحمض النووي المستخرج باستخدام مقياس الطيف الضوئي NanoDrop 2000 (Thermo Fisher Scientific، Inc.، الولايات المتحدة الأمريكية).
تسلسل الجينوم عالي الإنتاجية وتحليل المعلومات الحيوية
تم تطبيق QMP في التسلسل عالي الإنتاجية لـ 16S rRNA والجينات. تُستخدم هذه الطريقة لقياس الكميات المطلقة للأنواع الميكروبية الكلية والمحددة في عينة، من خلال إضافة قطع DNA مستهدفة أثناء تضخيم PCR.تم تصميم الأشواك الاصطناعية (SynSpike) كما هو موضح سابقًا في المراجع 7 و 8. بشكل عام، تم تصميم 12 تسلسلًا من الأشواك من منطقة V5-V7 من جين 16S rRNA، وتم اشتقاق تسلسل واحد من جين rpoB الخاص بالريزوبيا. تم نقل بلازميدات pUC57 التي تحتوي على كل تسلسل شوكة إلى الإشريكية القولونية TOP10 ثم تم استخراجها باستخدام مجموعة TIANpure Midi Plasmid Kit (Tiangen Biotec، الصين) (الشكل التوضيحي التكميلي 16). تم دمج تركيزات مختلفة من الأشواك لتشكيل SynSpike لتسلسل عينات التربة والجذور والعقد. أخيرًا،تم خلط الحمض النووي المستخرج معمن SynSpike لتضخيم PCR. تم تضخيم منطقة V5-V7 من جين 16S rRNA البكتيري، وجين rpoB من البكتيريا الجذرية المتعايشة من خلال أزواج البرايمر 799F (-AAC MGG ATT AGA TAC CCK G-3′) و 1193 R (-ACG TCA TCC CCA CCT TCC-3′)“، و rpoB1479F (-GAT CGA RAC GCC GGA AGG-3′) و rpoB1831R (-TGC ATG TTC GAR CCC AT-3′)، على التوالي. تم تسلسل منتجات تفاعل البوليميراز المتسلسل (PCR) المستمدة من 16S rRNA و rpoB على منصة MGISEQ-2000 التابعة لـ BGISEQ باستخدام وحدة النهاية الواحدة 400 نقطة أساس (SE400) في BGI شنتشن (BGI، شنتشن، الصين).
تم إجراء التحليل البيوانفورماتيكي الميكروبي باستخدام QIIME 2تم فصل بيانات التسلسل الخام وتصفيتها باستخدام ملحق q2-demux تلاها إزالة الضوضاء باستخدام DADA2.تمت توضيح متغيرات تسلسل الأمبليكون (ASVs) لجينات 16S rRNA و rpoB مقابل قاعدة بيانات Greengenes.وقواعد بيانات تسلسل المرجع rpoB للريزوبيا، باستخدام مصنف تصنيف بايزي الساذج classify-sklearn ومصنف تصنيف الإجماع classify-consensus-blast، على التوالي. بالنسبة لبيانات تسلسل 16S rRNA، تم تصفية ASVs غير البكتيرية في جميع العينات وASVs المرتبطة بعائلة Bradyrhizobiaceae في الإندوسفير الجذري، حيث أن Bradyrhizobiaceae الوفيرة من التعايش في العقد الجذرية قد تؤثر سلبًا على تقدير البكتيريا. التنوع في الإندوسفير. بالنسبة لبيانات تسلسل rpoB، تم الاحتفاظ فقط بـ ASVs المعلنة على مستوى الأنواع. تم محاذاة ASVs المفلترة باستخدام MAFFT.لبناء شجرة تطورية باستخدام FastTreeبكتيري-مقاييس التنوع،-تم تقدير مقاييس التنوع وتحليلات الإحداثيات الرئيسية (PCoA) باستخدام ملحق q2diversity بعد التخفيف (1030 تسلسل لكل عينة) لـ RMP، واستخدام حزمة R “vegan” بدون تخفيف لـ QMP. أظهرت منحنى التخفيف أن عمق التسلسل كان مناسبًا لحساب مؤشر شانون لمجتمعات البكتيريا (الشكل التوضيحي التكميلي 17).
تسلسل الميتاجينوم، التجميع، والتصنيف
تم إخضاع عينات منطقة الجذور من الأيام 1 و42 و72 بعد الإنبات للتسلسل الميتاجينومي على منصة DNBSEQ-T7 من BGISEQ باستخدام وحدة الطرفين 100 نقطة أساس (PE100) في BGI شنتشن (BGI، شنتشن، الصين). تم تجميع بيانات التسلسل الخام باستخدام إجراء تحليل الميتاجينوم السهل.باختصار، تم تصفية القراءات الخام لإزالة التسلسلات الجينومية منخفضة الجودة وذات الأصل (Glycine max) باستخدام KneadData (الإصدار 0.10.0). تم معالجة تجميع الميتاجينوم لعينات فردية بواسطة MEGAHIT (الإصدار 1.2.9) باستخدام المعلمات الافتراضية.تم استخدام Bowtie 2 (الإصدار 2.4.4) لتحديد مواقع القراءات الخام على الكنتيجات المجمعة لحساب تغطية القراءة لكل كنتيج، بعد تقييم جودة الكنتيجات بواسطة QUAST. ) تمت معالجة القطع لتوقع إطار القراءة المفتوح (ORF) باستخدام Prodigal (الإصدار 2.6.3)بعد ذلك، تم إنشاء كتالوج جيني غير متكرر باستخدام CD-HIT (الإصدار 4.8.1)تم قياس القراءات الخام وبيانات TPM (النسخ لكل كيلوباز مليون) بعد إجراء BLAST ضد كتالوج الجينات غير المتكررة بواسطة Salmon (الإصدار 1.6.0)تمت توضيح الجينات غير المتكررة باستخدام قواعد بيانات KEGG و COG بواسطة eggNOG-mapper (الإصدار 2.1.6)، واستخدام قاعدة بيانات CAZy بواسطة DIAMOND.
بالنسبة لتجميع الميتاجينوم، تم تجميع القطع الأطول من 2000 قاعدة في 6153 مجموعة باستخدام MaxBin2. وMetaBAT2 مع المعلمات الافتراضية. CheckM (الإصدار 1.0.12)تم استخدامه لتقييم جودة التجميع لجميع الحاويات. إجمالاً، 655 حاوية مع الاكتمال والتلوث تم الحصول عليها. تم تجميع جميع الحاويات المفلترة وإزالة التكرار باستخدام dRep (الإصدار 3.2.2)مع عتبة التداخل الافتراضية (-nc 0.1)، وتم تجميعها في صناديق جينومية على مستوى السلالة ومستوى الأنواع في و من متوسط هوية النوكليوتيدات، على التوالي. أخيرًا، حصلنا على مجموعة غير متكررة من 171 حاوية (MAGs) على مستوى السلالة و140 MAGs على مستوى النوع.
تحليل شبكة التواجد المشترك
تم اختيار ASVs البكتيرية الأساسية (مع وفرة نسبية > 0.1% على الأقل لعينة واحدة) في منطقة الجذور لبناء الشبكة. لكل معالجة، قمنا ببناء ثلاث شبكات لاستنتاج أنماط التواجد المتزامن الديناميكي لـ ASVs الأساسية مع تطور النبات من خلال فصل العينات إلى ثلاث مراحل (D1-D14، D28-D42، وD60D72)، وبناء تجميع لشبكة الارتباط الميكروبي لمقارنة التغيرات الناتجة عن التسميد في أنماط التواجد المتزامن الميكروبي وتحديد المحاور الأساسية. كما قمنا بدمج جميع عينات منطقة الجذور للعثور على وحدات الشبكة الميكروبية لـ ASVs البكتيرية الأساسية. تم حساب مصفوفة ارتباط سبيرمان الزوجية بناءً على الوفرة المطلقة لـ ASVs الأساسية باستخدام وظيفة “corr. test” في حزمة “psych” في R (v4.1.0). تم تعديل القيم باستخدام طريقة معدل الاكتشاف الخاطئ (FDR). تم تحديد حد لمعامل ارتباط سبيرمان.أعلى من 0.8 أو أقل من -0.8 معتم استخدامه لبناء الشبكة. تم توصيف خصائص الشبكة عبر حزمة “igraph” في R، وتم حساب متانة الشبكة كما هو موصوف سابقًا في المرجع 75. تُعرف الوحدات في الشبكة، التي تُعرف على أنها مجتمعات فرعية من العقد المترابطة بشدة، على أنها تجمعات بيئية ميكروبية تؤدي وظائف مختلفة.تم تحديد التجمعات البيئية في الشبكة باستخدام منصة Gephi (الإصدار 0.9.5) مع استخدام المعلمات الافتراضية.تم تحديد المحاور الرئيسية المفترضة في الشبكة وفقًا لارتباطها داخل الوحدة (Zi) و اتصال بين الوحدات (باي). العقد معتم تحديدها كمراكز وحدات، في حين أن العقد معتم التعرف عليهم كموصلاتتم تصور جميع الشبكات في Gephi (الإصدار 0.9.5).
عزل الميكروبات من منطقة الجذور والتحقق التجريبي
تم عزل سلالات البكتيريا من منطقة الجذور باستخدام وسائط LB و R2B. باختصار، تم وضع 3 جرام من تربة منطقة الجذور من كل معالجة في أنبوب طرد مركزي معقم يحتوي على 30 مل من محلول PBS، ثمتم التخفيف المتسلسل باستخدام محلول PBS.من كل من، و تم وضع التخفيفات على سطح الوسط. لعزل البكتيريا المنتجة للأبواغ، تم تخزين 3 جرام من تربة منطقة الجذور في مادة مجففة لمدة أسبوعين وتم تسخينها عند لمدة 30 دقيقة بعد الخلط مع 30 مل من محلول PBS، تليها التخفيف والزراعة كما هو موضح أعلاه. تم حضانة جميع أطباق الثقافة في لمدة 48 ساعة، وتم اختيار المستعمرات البكتيرية على الطبق لمزيد من التنقية. زوج البرايمر العالميتم استخدامه لتحديد البكتيريا. ثم تم تخزين سلالات البكتيريا المنقاة فيمحلول الجلسرين في.
تم إجراء تحليل BLAST للعقد (ASVs) في شبكة التواجد المشترك لكل وحدة من الشكل 7 ضد السلالات البكتيرية المعزولة، وتم اعتبار السلالات التي تتطابق بنسبة > 95% لجين 16S rRNA تنتمي إلى نفس ASVs. بالنسبة لـ ASVs التي تتعلق بمزيد من السلالات، اخترنا السلالة ذات أعلى تشابه لتحسين التمثيل. بعد ذلك، اخترنا سلالة واحدة لكل جنس لتقليل تعقيد المجتمعات الاصطناعية. بالنظر فقط إلى معالجة -N في الوحدة #2، أظهرت أحمال بكتيرية أعلى بشكل ملحوظ من تلك الموجودة في التحكم، اخترنا السلالات البكتيرية في الوحدة #2 كمجتمعات اصطناعية في تجربة التحقق، وأخذنا السلالات البكتيرية في الوحدة #1 كتحكم SynCom (لا تغيير ملحوظ في الأحمال البكتيرية بين المعالجتين). بشكل عام، تم تعيين 7 سلالات (أي Rhodococcus sp.، Lysobacter sp.، Terrabacter sp.، Arthrobacter sp.، Phyllobacterium sp.، Bosea sp. و Aeromicrobium sp.) في الوحدة #2 كـ SynCom، وتم تعيين خمس سلالات في الوحدة #1 كـ SynCtrl (أي Brevundimonas sp.، Sediminibacterium sp.، Mycobacterium sp.، Herbaspirillum sp. و Sphingomonas sp.). لاستبعاد احتمال حدوث تكتل ناتج عن Bradyrhizobiaceae وتنسيق التنوع الميكروبي مع SynCtrl، تم اختيار 5 سلالات من SynCom7 (باستثناء Bosea sp. و Aeromicrobium sp. من SynCom7)، والتي تم تعيينها كـ SynCom5.
ثم اختبرنا تأثير هذه المجتمعات الميكروبية على نمو نبات فول الصويا. للقيام بذلك، استخدمنا العلاجات التالية: التحكم (ماء معقم)، SynCtrl (5 سلالات من الوحدة #1)، SynCom7 (7 سلالات من الوحدة #2)، وSynCom5 (5 سلالات من الوحدة #2). تم استخدام الفيرميكوليت المعقم كركيزة ووسائط MFP مع أو بدون نيتروجين (أي، ) تم تطبيقها كحلول مغذية. تم تعقيم بذور فول الصويا على السطح بـ لمدة 5 دقائق ثم زرعت في الفيرميكوليت المعقم. كان لكل معالجة 12 نبتة. تم إعداد الـ SynComs عن طريق طرد محلول البكتيريا في جهاز الطرد المركزي بسرعة 9000 دورة في الدقيقة لمدة دقيقتين وإعادة تعليقها في ماء مقطر معقم تم ضبطه على كثافة بصرية نهائية (OD) تبلغ 0.1 لكل سلالة. بعد إنبات البذور (4 أيام بعد الزراعة)، تم تلقيح 1 مل من الـ SynComs أو الماء المعقم في الجذور، وتم تكرار ذلك بعد أسبوع. تم قياس ارتفاع الساق والكتلة الحيوية الكلية لنباتات فول الصويا بعد 2 و3 أسابيع من أول تلقيح، وتم قياس تركيزات النيتروجين النترات في نباتات فول الصويا الكاملة باستخدام عينات أخذت من 3 أسابيع بعد أول تلقيح. تم قياس تركيز نيتروجين النترات في النبات بطريقة اللونيمتر بعد الهضم بحمض الساليسيليك.ومحلول NaOH.
توصيف صفات تعزيز نمو النباتات (PGP) في المجتمعات الاصطناعية
تمت دراسة وظائف PGP لكل سلالة بكتيرية ومجتمع صناعي، بما في ذلك إنتاج IAA، ونشاط إنزيم ACC دياميناز، وتحلل الفوسفور غير العضوي، وثبات النيتروجين، في المختبر. تم تحديد تركيزات IAA كما هو موضح في المرجع 78، مع بعض التعديلات. باختصار، تم استخدام وسط لاندى لزراعة السلالات. لمدة 3 أيام و 200 دورة في الدقيقة عند. بعد ذلك، تم خلط 1 مل من السائل العلوي (المستخرج عن طريق الطرد المركزي بسرعة 9000 دورة في الدقيقة لمدة 5 دقائق) مع 2 مل من كاشف سالكوفسكي (150 مل من المركز)من المقطرمن ) وتم حضنها في الظلام لمدة 20 دقيقة. تم تحديد تركيز IAA بطريقة اللون عند 530 نانومتر، وتم إعداد منحنى قياسي من خلال سلسلة من تركيزات IAA النقية. لاختبار نشاط إنزيم ACC دياميناز في المجتمعات الاصطناعية، تم تلقيح سلالات بكتيرية في وسط أملاح DF المضاف إليه ACC كمصدر النيتروجين الوحيد لمدة 3 أيام وبسرعة 200 دورة في الدقيقة عند تم قياس نشاط إنزيم ACC دياميناز باستخدام الطريقة الموضحة سابقًا في المرجع 79. كمية الـتم تحديد الكيتوبوتيرات الناتج عن كل مجموعة متزامنة بواسطة منحنى قياسي من النقاء-كيتوبوتيرات عند 540 نانومتر. تم اختبار قدرة سلالات البكتيريا على إذابة الفوسفات غير العضوي على وسط بيئة بيكوفسكايا كما هو موصوف في المرجع 80. تم قياس مناطق الهالة المحيطة بالمستعمرات بعد 7 أيام من الثقافة فيتم قياس نشاط النيتروجيناز لسلالات البكتيريا بواسطة اختبار تقليل الأسيتيلين كما هو موضح في المرجع 81. باختصار، تم زراعة سلالات البكتيريا في وسط دوبراينر المعدل لمدة 3 أيام وبسرعة 200 دورة في الدقيقة.. ثم تم نقل الثقافة البكتيرية إلى قنينة المصل وتم استبدال غاز الفضاء برماد الأسيتيلين. تم تحديد تركيز الإيثيلين باستخدام جهاز الكروماتوغرافيا الغازية (HP7890B، أجيليت، الولايات المتحدة الأمريكية) بعد التلقيح لمدة 24 ساعة في.
التحليل الإحصائي
تم إجراء جميع التحليلات الإحصائية باستخدام R (الإصدار 4.1.0،http://www.rproject.orgتم اختبار بيانات الخصائص الكيميائية للتربة وأنماط فول الصويا للانتظام باستخدام اختبار شابيرو-ويلك واختبار تجانس التباين باستخدام اختبار بارتليت. بالنسبة للبيانات ذات التوزيعات الطبيعية والتباين المتجانس، تم استخدام اختبار ANOVA أحادي الاتجاه مع تحليلات ما بعد الاختبار لدونيت أو LSD للمقارنات المتعددة. تم تطبيق اختبارات كروسكال-واليس مع تحليل ما بعد الاختبار لدون للمقارنات المتعددة على البيانات ذات التوزيعات غير الغاوسية أو التباين غير المتجانس.
تم إجراء تحليل النموذج المختلط الخطي لتحديد العوامل الرئيسية التي تؤثر على الميكروبات-التنوع والوفرة باستخدام حزمة R “Ime4” تم إجراء اختبارات إحصائية غير معلمية (اختبارات كروسكال-واليس مع تحليل دان بعد الاختبار) لتقييم الفرق بين-التنوع بين مراحل التنمية المختلفة وعلاجات التخصيب المختلفة. تم اختبار المساهمة النسبية لعوامل مختلفة في تباين بكتيريا براى-كورتيس باستخدام PERMANOVA مع وظيفة Adonis2 في حزمة R “vegan”.تم استخدام تحليل الانحدار الخطي لفحص العلاقة بين المسافة الزمنية ومسافة براى-كورتيس بين عينتين في كل معالجة، وبين مرحلة أخذ العينات ومسافة براى-كورتيس لكل معالجة تخصيب غير متوازن مقارنة بالتحكم. تم تطبيق اختبار ويلكوكسون المزدوج لاختبار دلالة الفئات البكتيرية، وASVs الأساسية، والجينات الوظيفية بين التحكم وكل معالجة تخصيب غير متوازن، بعد حساب متوسط وفرة الفئات البكتيرية في كل مرحلة. تم تعريف ASVs التي تغيرت بشكل ملحوظ نتيجة للتخصيب غير المتوازن على أنها باستخدام اختبار ويلكوكسون المزدوج وتغير الطيجميع الاختبارات الإحصائيةتم تصحيح القيم باستخدام طريقة FDR، باستثناء تلك التي تم الحصول عليها باستخدام اختبار ويلكوكسون المزدوج. بالنسبة لجميع الاختبارات الإحصائية،اعتُبرت ذات دلالة، و-تم تحديد قيم – في أساطير الأشكال. تم إنشاء تصورات البيانات بشكل أساسي باستخدام حزمة R “ggplot2”. تم إنشاء خرائط الحرارة باستخدام حزمة R “ComplexHeatmap”.تم بناء الشجرة النشوية بشكل أساسي باستخدام جين 16S rRNA، باستثناء أن الشجرة النشوية لـ MAGs تم بناؤها استنادًا إلى الجينومات الكاملة. تم إجراء تصور الشجرة النشوية وتوضيح البيانات باستخدام iTOL v6..
ملخص التقرير
معلومات إضافية حول تصميم البحث متاحة في ملخص تقارير مجموعة نيتشر المرتبط بهذه المقالة.
توفر البيانات
تم إيداع بيانات الأمبليكون 16S rRNA (SAMN32647504-SAMN32648110) وبيانات الأمبليكون rpoB (SAMN32650334-SAMN32650836) وبيانات الميتاجينوم (SAMN32727371-SAMN32727406) المرتبطة بهذه الدراسة في أرشيف قراءة التسلسل NCBI (SRA) تحت رقم المشروع PRJNA922226. تم تحميل معلومات التصنيف للجينومات المجمعة الميتاجينومية (MAGs) والسلالات البكتيرية المعزولة إلى مستودع GitHub:https://github. com/mxwang2016/Soybean. تم توفير بيانات المصدر مع هذه الورقة.
Berendsen, R. L., Pieterse, C. M. J. & Bakker, P. A. The rhizosphere microbiome and plant health. Trends Plant Sci. 17, 478-486 (2012).
Chaparro, J. M., Badri, D. V. & Vivanco, J. M. Rhizosphere microbiome assemblage is affected by plant development. ISME J. 8, 790-803 (2014).
Xiong, C. et al. Plant developmental stage drives the differentiation in ecological role of the maize microbiome. Microbiome 9, 171 (2021).
Zhang, J. et al. Root microbiota shift in rice correlates with resident time in the field and developmental stage. Sci. China Life Sci. 61, 613-621 (2018).
Zhalnina, K. et al. Dynamic root exudate chemistry and microbial substrate preferences drive patterns in rhizosphere microbial community assembly. Nat. Microbiol. 3, 470-480 (2018).
Yang, H. et al. Temporal complementarity between roots and mycorrhizal fungi drives wheat nitrogen use efficiency. N. Phytol. 236, 1168-1181 (2022).
Wang, X. et al. An amplification-selection model for quantified rhizosphere microbiota assembly. Sci. Bull. 65, 983-986 (2020).
Tkacz, A., Hortala, M. & Poole, P. S. Absolute quantitation of microbiota abundance in environmental samples. Microbiome 6, 110 (2018).
Guo, X. et al. Host-associated quantitative abundance profiling reveals the microbial load variation of root microbiome. Plant Commun. 1, 100003 (2020).
. et al. Drought delays development of the sorghum root microbiome and enriches for monoderm bacteria. Proc. Natl Acad. Sci. USA 115, E4284-E4293 (2018).
Santos-Medellin, C. et al. Prolonged drought imparts lasting compositional changes to the rice root microbiome. Nat. Plants 7, 1065-1077 (2021).
Schulte-Uebbing, L. F., Beusen, A. H. W., Bouwman, A. F. & de Vries, W. From planetary to regional boundaries for agricultural nitrogen pollution. Nature 610, 507-512 (2022).
Mariotte, P. et al. Plant-soil feedback: bridging natural and agricultural sciences. Trends Ecol. Evol. 33, 129-142 (2018).
Zhang, T., Chen, H. Y. H. & Ruan, H. Global negative effects of nitrogen deposition on soil microbes. ISME J. 12, 1817-1825 (2018).
Dai, Z. et al. Long-term nitrogen fertilization decreases bacterial diversity and favors the growth of Actinobacteria and Proteobacteria in agro-ecosystems across the globe. Glob. Chang Biol. 24, 3452-3461 (2018).
Liang, Y. et al. Century long fertilization reduces stochasticity controlling grassland microbial community succession. Soil Biol. Biochem 151, 108023 (2020).
Du, E. et al. Global patterns of terrestrial nitrogen and phosphorus limitation. Nat. Geosci. 13, 221-226 (2020).
Yu, P. et al. Plant flavones enrich rhizosphere Oxalobacteraceae to improve maize performance under nitrogen deprivation. Nat. Plants 7, 481-499 (2021).
Ortiz-Barbosa, G. S., Torres-Martínez, L., Rothschild, J. & Sachs, J. L. Lotus japonicus regulates root nodulation and nitrogen fixation dependent on the molecular form of nitrogen fertilizer. Plant Soil 483, 533-545 (2023).
Santachiara, G., Salvagiotti, F. & Rotundo, J. L. Nutritional and environmental effects on biological nitrogen fixation in soybean: a meta-analysis. Field Crops Res. 240, 106-115 (2019).
Mendes, L. W., Kuramae, E. E., Navarrete, A. A., van Veen, J. A. & Tsai, S. M. Taxonomical and functional microbial community selection in soybean rhizosphere. ISME J. 8, 1577-1587 (2014).
Oppenheimer-Shaanan, Y. et al. A dynamic rhizosphere interplay between tree roots and soil bacteria under drought stress. eLife 11, e79679 (2022).
Fan, K. et al. Biodiversity of key-stone phylotypes determines crop production in a 4-decade fertilization experiment. ISME J. 15, 550-561 (2021).
Fierer, N., Bradford, M. A. & Jackson, R. B. Toward an ecological classification of soil bacteria. Ecology 88, 1354-1364 (2007).
Ling, N., Wang, T. & Kuzyakov, Y. Rhizosphere bacteriome structure and functions. Nat. Commun. 13, 836 (2022).
Lidbury, I. et al. Niche-adaptation in plant-associated Bacteroidetes favours specialisation in organic phosphorus mineralisation. ISME J. 15, 1040-1055 (2021).
Bulgarelli, D. et al. Revealing structure and assembly cues for Arabidopsis root-inhabiting bacterial microbiota. Nature 488, 91-95 (2012).
Viaene, T., Langendries, S., Beirinckx, S., Maes, M. & Goormachtig, S. Streptomyces as a plant’s best friend? FEMS Microbiol. Ecol. 92, 1-10 (2016).
Lee, S. M., Kong, H. G., Song, G. C. & Ryu, C. M. Disruption of Firmicutes and Actinobacteria abundance in tomato rhizosphere causes the incidence of bacterial wilt disease. ISME J. 15, 330-347 (2021).
Develey-Riviere, M. P. & Galiana, E. Resistance to pathogens and host developmental stage: a multifaceted relationship within the plant kingdom. N. Phytol. 175, 405-416 (2007).
Edwards, J. A. et al. Compositional shifts in root-associated bacterial and archaeal microbiota track the plant life cycle in field-grown rice. PLoS Biol. 16, e2003862 (2018).
Zhong, Y., Tian, J., Li, X. & Liao, H. Cooperative interactions between nitrogen fixation and phosphorus nutrition in legumes. N. Phytol. 237, 734-745 (2023).
Shi, J., Wang, X. & Wang, E. Mycorrhizal symbiosis in plant growth and stress adaptation: from genes to ecosystems. Annu. Rev. Plant Biol. 74, 569-607 (2023).
Shi, J. et al. A phosphate starvation response-centered network regulates mycorrhizal symbiosis. Cell 184, 5527-5540 (2021).
Ma, W. et al. Response of microbial functional groups involved in soil N cycle to N, P, and NP fertilization in Tibetan alpine meadows. Soil Biol. Biochem. 101, 195-206 (2016).
Wei, X. et al. Effect of P stoichiometry on the abundance of nitrogencycle genes in phosphorus-limited paddy soil. Biol. Fertil. Soils 53, 767-776 (2017).
Liu, W. et al. Long-term nitrogen input alters plant and soil bacterial, but not fungal beta diversity in a semiarid grassland. Glob. Chang Biol. 27, 3939-3950 (2021).
Cafaro La Menza, N., Monzon, J. P., Specht, J. E. & Grassini, P. Is soybean yield limited by nitrogen supply? Field Crops Res. 213, 204-212 (2017).
Hassani, M. A., Duran, P. & Hacquard, S. Microbial interactions within the plant holobiont. Microbiome 6, 58 (2018).
Layeghifard, M., Hwang, D. M. & Guttman, D. S. Disentangling interactions in the microbiome: a network perspective. Trends Microbiol. 25, 217-228 (2017).
Toju, H. et al. Core microbiomes for sustainable agroecosystems. Nat. Plants 4, 247-257 (2018).
Carrión, V. J. et al. Pathogen-induced activation of diseasesuppressive functions in the endophytic root microbiome. Science 366, 606-612 (2019).
Faust, K. & Raes, J. Microbial interactions: from networks to models. Nat. Rev. Microbiol. 10, 538-550 (2012).
Dai, T. et al. Nutrient supply controls the linkage between species abundance and ecological interactions in marine bacterial communities. Nat. Commun. 13, 175 (2022).
Bai, B. et al. The root microbiome: community assembly and its contributions to plant fitness. J. Integr. Plant Biol. 64, 230-243 (2022).
Xun, W. et al. Specialized metabolic functions of keystone taxa sustain soil microbiome stability. Microbiome 9, 35 (2021).
Delgado-Baquerizo, M. et al. A global atlas of the dominant bacteria found in soil. Science 359, 320-325 (2018).
Banerjee, S., Schlaeppi, K. & van der Heijden, M. G. A. Keystone taxa as drivers of microbiome structure and functioning. Nat. Rev. Microbiol 16, 567-576 (2018).
Han, Q. et al. Variation in rhizosphere microbial communities and its association with the symbiotic efficiency of rhizobia in soybean. ISME J. 14, 1915-1928 (2020).
Wang, X. et al. Mycorrhizal symbiosis modulates the rhizosphere microbiota to promote rhizobia-legume symbiosis. Mol. Plant 14, 503-516 (2021).
Zgadzaj, R. et al. Root nodule symbiosis in Lotus japonicus drives the establishment of distinctive rhizosphere, root, and nodule bacterial communities. Proc. Natl Acad. Sci. USA 113, E7996-E8005 (2016).
Gao, Z., Karlsson, I., Geisen, S., Kowalchuk, G. & Jousset, A. Protists: puppet masters of the rhizosphere microbiome. Trends Plant Sci. 24, 165-176 (2019).
Deveau, A. et al. Bacterial-fungal interactions: ecology, mechanisms and challenges. FEMS Microbiol. Rev. 42, 335-352 (2018).
Edwards, J. et al. Structure, variation, and assembly of the rootassociated microbiomes of rice. Proc. Natl Acad. Sci. USA 112, E911-920 (2015).
Bai, Y. et al. Functional overlap of the Arabidopsis leaf and root microbiota. Nature 528, 364-369 (2015).
Bolyen, E. et al. Reproducible, interactive, scalable and extensible microbiome data science using QIIME 2. Nat. Biotechnol. 37, 852-857 (2019).
Callahan, B. J. et al. DADA2: High-resolution sample inference from Illumina amplicon data. Nat. Methods 13, 581-583 (2016).
McDonald, D. et al. An improved Greengenes taxonomy with explicit ranks for ecological and evolutionary analyses of bacteria and archaea. ISME J. 6, 610-618 (2012).
Katoh, K., Misawa, K., Kuma, K. & Miyata, T. MAFFT: a novel method for rapid multiple sequence alignment based on fast Fourier transform. Nucleic Acids Res. 30, 3059-3066 (2002).
Price, M. N., Dehal, P. S. & Arkin, A. P. FastTree 2-approximately maximum-likelihood trees for large alignments. PLoS One 5, e9490 (2010).
Liu, Y. X. et al. A practical guide to amplicon and metagenomic analysis of microbiome data. Protein Cell 12, 315-330 (2021).
Li, D., Liu, C. M., Luo, R., Sadakane, K. & Lam, T. W. MEGAHIT: an ultra-fast single-node solution for large and complex metagenomics assembly via succinct de Bruijn graph. Bioinformatics 31, 1674-1676 (2015).
Gurevich, A., Saveliev, V., Vyahhi, N. & Tesler, G. QUAST: quality assessment tool for genome assemblies. Bioinformatics 29, 1072-1075 (2013).
Langmead, B. & Salzberg, S. L. Fast gapped-read alignment with Bowtie 2. Nat. Methods 9, 357-359 (2012).
Hyatt, D. et al. Prodigal: prokaryotic gene recognition and translation initiation site identification. BMC Bioinform. 11, 119 (2010).
Li, W. & Godzik, A. Cd-hit: a fast program for clustering and comparing large sets of protein or nucleotide sequences. Bioinformatics 22, 1658-1659 (2006).
Patro, R., Duggal, G., Love, M. I., Irizarry, R. A. & Kingsford, C. Salmon provides fast and bias-aware quantification of transcript expression. Nat. Methods 14, 417-419 (2017).
Cantalapiedra, C. P., Hernandez-Plaza, A., Letunic, I., Bork, P. & Huerta-Cepas, J. eggNOG-mapper v2: functional annotation, orthology assignments, and domain prediction at the metagenomic scale. Mol. Biol. Evol. 38, 5825-5829 (2021).
Buchfink, B., Reuter, K. & Drost, H. G. Sensitive protein alignments at tree-of-life scale using DIAMOND. Nat. Methods 18, 366-368 (2021).
Drula, E. et al. The carbohydrate-active enzyme database: functions and literature. Nucleic Acids Res. 50, D571-D577 (2022).
Wu, Y. W., Simmons, B. A. & Singer, S. W. MaxBin 2.0: an automated binning algorithm to recover genomes from multiple metagenomic datasets. Bioinformatics 32, 605-607 (2016).
Kang, D. D. et al. MetaBAT 2: an adaptive binning algorithm for robust and efficient genome reconstruction from metagenome assemblies. PeerJ 7, e7359 (2019).
Parks, D. H., Imelfort, M., Skennerton, C. T., Hugenholtz, P. & Tyson, G. W. CheckM: assessing the quality of microbial genomes recovered from isolates, single cells, and metagenomes. Genome Res. 25, 1043-1055 (2015).
Olm, M. R., Brown, C. T., Brooks, B. & Banfield, J. F. dRep: a tool for fast and accurate genomic comparisons that enables improved genome recovery from metagenomes through de-replication. ISME J. 11, 2864-2868 (2017).
Yuan, M. M. et al. Climate warming enhances microbial network complexity and stability. Nat. Clim. Chang 11, 343-348 (2021).
Bastian, M., Heymann, S., Jacomy, M. Gephi: an open source software for exploring and manipulating networks. In Proc. 3rd International ICWSM Conference, 361-362 https://ojs.aaai.org/index. php/ICWSM (AAAI Press, Palo Alto, California USA, 2009).
Shi, S. et al. The interconnected rhizosphere: High network complexity dominates rhizosphere assemblages. Ecol. Lett. 19, 926-936 (2016).
Penrose, D. M. & Glick, B. R. Methods for isolating and characterizing ACC deaminase-containing plant growth-promoting rhizobacteria. Physiol. Plant 118, 10-15 (2003).
Joshi, S., Gangola, S., Jaggi, V. & Sahgal, M. Functional characterization and molecular fingerprinting of potential phosphate solubilizing bacterial candidates from Shisham rhizosphere. Sci. Rep. 13, 7003 (2023).
Zhang, L. M. et al. Biochemical mechanism of phosphorus limitation impairing nitrogen fixation in diazotrophic bacterium Klebsiella variicola W12. J. Sustain. Agric. Environ. 1, 108-117 (2022).
Nakagawa, S., Schielzeth, H. & O’Hara, R. B. A general and simple method for obtaining from generalized linear mixed-effects models. Methods Ecol. Evol. 4, 133-142 (2013).
Oksanen, J. et al. The vegan package. Community Ecol. Package 10, 631-637 (2007).
Gu, Z., Eils, R. & Schlesner, M. Complex heatmaps reveal patterns and correlations in multidimensional genomic data. Bioinformatics 32, 2847-2849 (2016).
Letunic, I. & Bork, P. Interactive Tree Of Life (iTOL) v5: an online tool for phylogenetic tree display and annotation. Nucleic Acids Res. 49, W293-W296 (2021).
شكر وتقدير
نود أن نشكر البروفيسور لي لوو والسيد نينغنينغ لي على مساعدتهما السخية في عزل وتحديد سلالات البكتيريا. تم دعم E.W. من قبل مشروع الأكاديمية الصينية للعلوم للعلماء الشباب في البحث الأساسي (YSBR-011)، البرنامج الوطني الرئيسي للبحث والتطوير في الصين (2022YFF1001800)، مؤسسة العلوم الوطنية (32088102، 32050081، 31825003، 32001886 و31870218)، برنامج البحث الاستراتيجي ذو الأولوية “الآلية الجزيئية لنمو وتطور النباتات” للأكاديمية الصينية للعلوم (XDB27040207)، ومؤسسة العلوم الجديدة من خلال برنامج الباحثين الجدد وجائزة XPLORER. تم دعم X.C. من قبل برنامج البحث الاستراتيجي ذو الأولوية للأكاديمية الصينية للعلوم (XDA28030103).
مساهمات المؤلفين
قام E.W. وM.W. وX.M. وX.W. بتصميم هذا البحث؛ وشارك M.W. وX.M. وA.-H.G. وX.W. وQ.X. وL.W. وX.S. وM.J. وY.W. وH.L. في إجراء التجارب؛ و قام M.W. وA.-H.G. وX.W. بتحليل البيانات؛ وكتب A.-H.G. وM.W. وE.W. وJ.D.M. وW.Y. الورقة؛ وأشرف E.W. وX.C. على الدراسة بأكملها. قرأ جميع المؤلفين ووافقوا على المخطوطة.
مختبر العلوم الجديد، المختبر الوطني الرئيسي لعلم الوراثة الجزيئية للنباتات، مركز التميز في العلوم الجزيئية للنباتات، معهد فسيولوجيا النبات والبيئة، الأكاديمية الصينية للعلوم، شنغهاي 200032، الصين.جامعة الأكاديمية الصينية للعلوم، بكين 100049، الصين.أكاديمية هيلونغجيانغ لحفظ واستخدام التربة السوداء، هاربين 150086، الصين.كلية الزراعة، جامعة جنوب الصين الزراعية، قوانغتشو 510642، الصين.معهد الوراثة وعلم الأحياء التنموي، الأكاديمية الصينية للعلوم، بكين 100101، الصين.المختبر الوطني الرئيسي لعلم الجينوم الزراعي، المختبر الرئيسي لعلم الجينوم، وزارة الزراعة، أبحاث BGI، شنتشن 518083، الصين.مركز الأبحاث المشترك لعلوم الحياة BGI، جامعة الغابات الشمالية، هاربين 150040، الصين.مدرسة علوم الحياة والتكنولوجيا، جامعة شانغهاي للتكنولوجيا، شانغهاي 201210، الصين.ساهم هؤلاء المؤلفون بالتساوي: مينغشينغ وانغ، آن-هوي جي، شينغتشو ما. البريد الإلكتروني:xfcao@genetics.ac.cn; etwang@cemps.ac.cn
Dynamic root microbiome sustains soybean productivity under unbalanced fertilization
Received: 25 May 2023
Accepted: 7 February 2024
Published online: 23 February 2024
(T) Check for updates
Mingxing Wang , An-Hui , Xingzhu , Xiaolin Wang , Qiujin Xie , Like Wang , Xianwei Song , Mengchen Jiang , Weibing Yang , Jeremy D. Murray , Yayu Wang , Huan Liu , Xiaofeng Cao Ertao Wang
Root-associated microbiomes contribute to plant growth and health, and are dynamically affected by plant development and changes in the soil environment. However, how different fertilizer regimes affect quantitative changes in microbial assembly to effect plant growth remains obscure. Here, we explore the temporal dynamics of the root-associated bacteria of soybean using quantitative microbiome profiling (QMP) to examine its response to unbalanced fertilizer treatments (i.e., lacking either or K ) and its role in sustaining plant growth after four decades of unbalanced fertilization. We show that the root-associated bacteria exhibit strong succession during plant development, and bacterial loads largely increase at later stages, particularly for Bacteroidetes. Unbalanced fertilization has a significant effect on the assembly of the soybean rhizosphere bacteria, and in the absence of N fertilizer the bacterial community diverges from that of fertilized plants, while lacking fertilizer impedes the total load and turnover of rhizosphere bacteria. Importantly, a SynCom derived from the low-nitrogen-enriched cluster is capable of stimulating plant growth, corresponding with the stabilized soybean productivity in the absence of N fertilizer. These findings provide new insights in the quantitative dynamics of the root-associated microbiome and highlight a key ecological cluster with prospects for sustainable agricultural management.
Root-associated microbiomes have been recognized as the “second genome” of plants that contributes in various ways to plant growth, development and health . The root-associated compartments, including the rhizosphere and endosphere, provide unique habitats for microbial colonization, resulting in substantial taxonomic and functional differences compared with surrounding bulk soils. Root-
associated microbiomes are highly dynamic, and strongly affected by plant development , which exerts its effect mostly through the impact of root exudates on microbial growth , indicating the ability of plants to actively modify their microbiomes throughout entire lifecycle. This character may have important implications for plant nutrient acquisition, as evidenced by the temporal complementarity of
nitrogen use efficiency between roots and microbes (e.g., AMF) in wheat . Currently, relative microbiome profiling (RMP) has been widely used to detect variation in the relative abundance of taxa in complex microbial communities, but RMP fails to provide information on the absolute abundance of microbes and is not useful for comparing microbial loads among samples . Increasing evidence indicates that the specific load of microbial groups, as estimated by quantitative microbiome profiling (QMP), responds sensitively to environmental disturbance, even when the relative abundance of microbes remains the same . However, due to the technical challenges posed by QMP, there remains a lack of detailed high resolution information on the quantitative dynamics of root-associated microbiomes. Thus, data from QMP is urgently needed to advance our understanding of the relationship between root-associated microbiome assembly with plant development.
Apart from host genotype and developmental stage, the assembly of root-associated microbiome is also affected by environmental factors. For instance, drought reduced the diversity and disrupted the temporal dynamics of the root microbiomes of different plant species . In agriculture, the utilization of chemical fertilizers, including nitrogen (N), phosphorous (P) and potassium (K), has contributed greatly to yield increases in recent decades, making it possible to feed the expanding human population. However, intensified agriculture not only causes severe environmental pollution, but also inactivates positive plant-microbial interactions, leading to a cascade effect of damage on ecosystem integrity and health amendment is associated with reduced soil microbial biomass , and fertilization was found to significantly decrease the microbial temporal succession rate in soil . However, quantitative studies assessing how soil nutrient conditions affect the temporal dynamics of the root-associated microbiome, particularly by the QMP method, are lacking. Understanding how root microbial dynamics respond to different fertilization regimes and affect crop productivity is essential for the development of sustainable agriculture.
Plants are thought to subtly manipulate their root-associated microbiome under nutrient shortage, since most of terrestrial ecosystems facing N and P limitation . A recent study revealed that maize plants recruit Oxalobacteraceae to improve their performance under low , providing strong evidence for microbiome effects on plant growth. In contrast to cereals, legumes, such as soybean, pea and common bean, can form a mutualistic relationship with N-fixing bacteria which accumulate inside nodules and provide a large amount of N for host growth. However, the benefits of nodulation are substantially reduced under N fertilization , indicating a tradeoff between minimizing plant carbon usage and maximizing the acquisition of fixed N . Having access to their own N supply, legume crop production may instead be limited by and inputs, which have been shown to contribute to symbiotic N fixation . Access to these nutrients in plants can be bolstered by its rhizosphere microbiome, which was shown to specifically enrich mineral nutrient metabolism in comparison to bulk soil by microbial priming effects mediated with root exudates , but whether and how specific microbes can compensate for soil nutrient deficiency for plant growth remains elusive. Uncovering and validating the functions of key microbes in the alleviation of plant nutrient stress is of vital importance for sustainable agroecosystem management.
In this study, a field trail was conducted to illustrate the effect of nutrient deficiency (i.e., exclusion of N, P, or K fertilizers) on soybean performance and the development of the root-associated bacterial microbiome, and to unveil the mechanisms of the root-associated microbiome in conditioning plant phenotype, after 40 years of soybean-maize-wheat rotation. Through QMP, we monitored the dynamics of rhizosphere and endosphere bacterial communities across the lifespan of soybean, and deciphered effects on specific bacterial taxa in response to different fertilization treatments. We then combined metagenomic sequencing to explore the functional
adaptation of root-associated bacteria in response to nutrient deficiency. Finally, we validated the plant-growth-promoting functions of synthetic communities (SynCom) in the low-nitrogen-enriched microbial ecological cluster using a cultivation-dependent method. We hypothesize that (1) the QMP would reveal a distinctive dynamic pattern in root-associated microbiome assembly; (2) the dynamics of root-associated bacteria would be largely affected by the lack of N, P, or K fertilizers; (3) functional adaptation of the rhizosphere bacteria under nutrient deficiency would benefit soybean growth.
Results
Effects of fertilization on soil chemical properties and soybean performance
To unveil the quantitative assembly of root-associated microbiomes in soybean, we investigated microbiome dynamics across plant developmental stages , and 72 days after germination) and their response to fertilization. To do this, we studied soybean plants grown in the field using four unbalanced fertilization treatments, which have been part of an ongoing crop rotation with maize and wheat since 1979, including (1) full-dose fertilization (NPK fertilizer, Control), (2) lack of nitrogen fertilizer (-N), (3) lack of phosphorous fertilizer (-P), and (4) lack of potassium fertilizer (-K) (Fig. 1A). Bulk soil was collected from each plot to monitor soil chemical properties before seed sowing in 2020. Compared with Control, the content of soil alkaline hydrolyzable nitrogen (AHN), available phosphorous and available potassium was reduced by and , to , and , in and -K treatments, respectively ( , Fig. 1B), indicating that was the most severely reduced of the managed nutrients. Soil pH was higher by 1.1 units and soil dissolved organic carbon (DOC) was lower by in the -N treatment compared with the Control ( ), whereas soil organic matter (SOM) showed no significant difference among treatments (Supplementary Fig. 1), suggesting a high resilience of SOM across different fertilization regimes.
Interestingly, we found that the soybean yield in the field exhibited no significant difference between Control and -N treatment, and even showed slight increment by across two soybean planting seasons (i.e., 2020 and 2017, Fig. 1C). By contrast, soybean yield was consistently reduced by in the -P treatment compared with Control ( ). Meanwhile, the -N treatment significantly increased the number and diameter of root nodules compared to the Control ( ), whereas the -P treatment showed the opposite trend ( , Supplementary Fig. 2).
Changes in root-associated microbial diversity across plant developmental stages
Quantitative microbial profiling (QMP) was applied to investigate the dynamics of root-associated bacterial diversity, load, and composition across plant developmental stages and their response to fertilization. The root compartment, plant developmental stage, and fertilization treatment exhibited significant effects on bacterial -diversity ( ), with consistently higher -diversity in the rhizosphere than the endosphere (Fig. 2, Supplementary Table 1). In the rhizosphere, the bacterial -diversity decreased with plant development, especially from days 42 to 72 (Fig. 2B). Compared with Control, the -N treatment exhibited a higher -diversity at early developmental stages (i.e., days 4,7 , and 14 ), whereas -P treatment increased -diversity at later developmental stages (i.e., days 42,60, and 72) in the rhizosphere ( ), resulting a stable -diversity with plant development (Fig. 2B). By contrast, the -diversity in the endosphere was less sensitive to fertilization, reaching its minimum at day 14 and remaining relatively stable in subsequent stages ( , Fig. 2C), which corresponds to the observed onset of root nodulation in the field at 14 days after germination, indicating the symbiosis might drastically reduce endosphere microbial diversity.
Fig. 1 | The experimental design and the responses of soil mineral nutrients and soybean yield to unbalanced fertilization. A the field experiment was arranged in a completely randomized block design. Four treatments, including complete fertilization (NPK fertilizer, Control) and a lack of N, P, or K fertilizer (i.e., -N, -P, and -K treatments), have been applied as part of a soybean-maize-wheat rotation (one crop/year) since 1979. The root-associated compartments of soybean, including the rhizosphere soil, root endosphere, and nodules, were subjected to 16S rRNA gene, gene, and metagenomic sequencing across plant developmental stages. B chemical properties of the bulk soils in different fertilization treatments before
soybean planting in 2020 ( plots). C effect of unbalanced fertilization on soybean yield in 2020 and 2017 ( plots). The asterisks represent the level of significance ( ) between Control and unbalanced fertilization treatments based on one-way ANOVA test with Dunnett’s post hoc analysis (for data fit normal distributions and homogeneous variance) or KruskalWallis test with Dunn’s post hoc analysis (for data does not fit normal distributions or homogeneous variance). Exact -values are listed in the Source Data file. The data are presented as mean values standard deviation (SD). Source data are provided as a Source Data file.
Principle coordinate analysis (PCoA) based on Bray-Curtis distance of QMP datasets revealed that the bacterial -diversity was clearly separated among bulk soil, rhizosphere soil and root endosphere (Supplementary Fig. 3). Correspondingly, PERMANOVA results suggested that the root compartment (rhizosphere vs. endosphere) was the main driver of bacterial -diversity ( ), followed by the plant developmental stage ( ) and fertilization treatment ( , Supplementary Table 2). For both the rhizosphere and endosphere, the bacterial -diversity was clearly associated with the plant developmental stage in PCo1 axis (Fig. 2E, F). However, the -N treatment grouped separately from other treatments in the rhizosphere and bulk soils, but not in the endosphere (Fig. 2D-F). Similarly, fertilization had much higher effect on bacterial -diversity in the rhizosphere than the endosphere, irrespective of the plant developmental stage (Fig. 2E, F, Supplementary Fig. 3), suggesting the rhizosphere microbiome is relatively responsive to
fertilization. The temporal-decay pattern of the rhizosphere microbiome revealed that the -P treatment had a significantly lower regression slope with plant development at compared with in the Control, but remained similar in other treatments, while the root endosphere had a relatively low microbial turnover rate ranging from 0.0024 to (Fig. 2G, Supplementary Table 3). The Bray-Curtis distance between the Control and -N treatment in the rhizosphere was relative stable across plant development (Slope ), whereas the -P and -K treatments showed a sharp increase of dissimilarity with time compared with Control (Fig. 2H, Supplementary Table 4), indicating the microbial communities in the -P and -K treatments gradually diverged to the Control with plant development. Although similar trends were observed in the microbial -diversity based on the relative microbial profiling (RMP), the compartment effect of microbial -diversity was specifically reduced ( ) in comparison to QMP, and the fertilization
Fig. 2 | Temporal dynamics of root-associated bacterial diversity in different treatments by quantitative microbiome profiling (QMP). A bacterial -diversity (Shannon index) in the bulk soils of each treatment ( soil samples). The box plots indicate the median (center line), the 25th and 75th percentiles (box), and the range of non-outlier values (whiskers). The “n.s.” represents the non-significance of the Shannon index between Control and unbalanced fertilization treatments by Kruskal-Wallis test with Dunn’s post hoc analysis. Dynamics of bacterial -diversity in different treatments across plant developmental stages in the rhizosphere (B) and root endosphere (C). Error bands show the standard deviation (SD). D bacterial
-diversity in the bulk soils analyzed using principle coordinate analysis (PCoA). The symbol colors in (D) are consistent with legend in (A-C). E PCoA of bacterial diversity in the rhizosphere. F PCoA of bacterial -diversity in the endosphere. linear regressions between temporal distance (change of sampling day between each two samples, ) and Bray-Curtis distance among samples in each treatment in the rhizosphere (left) and endosphere (right). linear regressions between sampling stage (days post germination, d) and Bray-Curtis distance of each unbalanced fertilization treatment to the Control in the rhizosphere (left) and endosphere (right). Source data are provided as a Source Data file.
effect was comparable between the rhizosphere and endosphere across plant developmental stages, with relatively lower succession rates in all treatments in the rhizosphere (Supplementary Fig. 4, Supplementary Table 3). Specifically, we observed that of ASVs in the rhizosphere exhibited a distinctive pattern across plant development between QMP and RMP datasets (Supplementary Fig. 5), suggesting a substantial bias when interpreting microbial data with relative abundance.
Assembly of root-associated microbiome during plant development
The bacterial loads in both the rhizosphere and endosphere exhibited increasing trends with plant development, and bacterial abundances
were comparable across days copies in the rhizosphere and copies in the endosphere), but gradually increased and reached their highest abundance at day copies in the rhizosphere and copies in the endosphere) (Fig. 3, Supplementary Fig. 6). Fertilization treatments had a significant effect on bacterial loads (Supplementary Table 5), and the microbial load was found to be consistently reduced in the rhizosphere of the -P treatment compared to the Control, especially at later developmental stages, showing bacterial load reductions of and at days 42,60 , and 72 , respectively ( , Fig. 3B). By contrast, the change of bacterial loads between Control and -P treatment in the endosphere was hardly observed and not consistent during plant developmental stages (Fig. 3C).
Fig. 3 | Bacterial loads and composition in the bulk soil, rhizosphere and endosphere based on 16S rRNA sequencing data. A absolute abundance and bacterial community composition at the phylum level in the bulk soil ( soil samples). Temporal dynamics of bacterial abundance and community composition in the rhizosphere ( ) and root endosphere ( ). The color in the upper panel represents different treatments, and the color in the lower panel represents bacterial phyla, as indicated in the accompanying legends. Different letters indicate
significant difference of the average bacterial load among developmental stages at by Kruskal-Wallis test with Dunn’s post hoc analysis for multiple comparisons. Sample size, replicates and exact -values are listed in the Source Data file. The box plots indicate the median (center line), the 25th and 75th percentiles (box), and the range of non-outlier values (whiskers). Source data are provided as a Source Data file.
The root-associated bacteria mainly belonged to the Proteobacteria, Actinobacteria, and Bacteroidetes, with Actinobacteria being more dominant at early stages and Proteobacteria being more dominant at later stages, particularly in the endosphere (Fig. 3, Supplementary Fig. 6). Although the relative abundance of Actinobacteria exhibited a progressively decreasing trend with plant development (reducing from and at day 1 to and at day 72 in the rhizosphere and endosphere, respectively), their absolute abundances increased by 2.1 and 18.8 fold in the rhizosphere and endosphere, respectively (Figs. 3, 4), indicating that the plants support an increasing load of Actinobacteria despite their reduced relative abundance. Meanwhile, the number of Proteobacteria increased by 5.4 and 119.2 times during plant developmental stages in the rhizosphere and endosphere, respectively (Fig. 4). Intriguingly, the Bacteroidetes were hardly detected at early stages ( and of relative abundance at day 1 in the rhizosphere and endosphere), but transitioned to rapid growth at day 60 and multiplied by 48.8 and 460.7 fold at day 72 relative to day 1 in the rhizosphere and endosphere, respectively, with and of relative abundance (Figs. 3, 4).
Root-associated microbiome in response to fertilization
Fertilization treatments had a significant effect on the composition and dynamics of the root-associated microbiome (Figs. 2, 3). At the phylum level, the abundance of Acidobacteria was consistently reduced in the -N treatment compared to the Control in both bulk soils and the rhizosphere ( ), whereas it remained relatively stable in the endosphere (Supplementary Fig. 7). For the -P treatment, most of the phyla in the rhizosphere were specifically reduced relative to the Control ( ), especially the Bacteroidetes, but this was not the case in bulk soils and the endosphere. The bacterial phyla were not strongly impacted by a reduction in K fertilization ( -K ), with only Saccharibacteria showing a significantly lower rhizosphere abundance than in Control ( ). Meanwhile, the -N treatment significantly increased, and the -P treatment reduced, rhizobial abundance in the rhizosphere in comparison to the Control based on the rpoB gene ( , Supplementary Fig. 8), consistent with the observed increase in the number and diameter of root nodules in the -N treatment relative to the Control (Supplementary Fig. 2). Specifically, Bradyrhizobium japonicum, which was the only rhizobial species found in nodules, also
Fig. 4 | Fitted curves in temporal dynamics of bacterial phyla by QMP and RMP. Dynamics of bacterial abundance of the six most abundant phyla in the rhizosphere (A) and root endosphere (B) across plant developmental stages based on QMP (red) and RMP (green) datasets. The Y-axis in the left is the relative abundance (%) of
bacterial phyla based on RMP (relative, in green), whereas Y-axis in the right is the absolute abundance ( copies ) of bacterial phyla based on QMP (absolute, in red). Error bands represent the confidence interval. Source data are provided as a Source Data file.
dominated the rhizosphere, reflecting the exclusive nature of its symbiotic interaction with soybean in the soil (Supplementary Fig. 8).
Considering that the bacterial community in the rhizosphere was more sensitive to fertilization than it was in the endosphere (Fig. 2, Supplementary Fig. 3), we then mainly focused on the taxonomic and functional responses of rhizosphere bacteria to fertilization, and identified core ASVs in the rhizosphere to reduce the complexity of the bacterial community (Fig. 5). We identified 573 ASVs as core taxa, which comprised and of total bacterial richness and abundance, respectively, that broadly represent the overall bacterial community in each treatment (Fig. 5A, B). Hierarchical clustering analysis illustrated a distinctive pattern of core ASVs between the Control and -N treatment (Fig. 5C). Among the core ASVs, 172 showed a significant difference between the Control and -N treatment, with 69 showing an increase (Fig. 5C, Supplementary Fig. 9). The increased ASVs in the -N treatment were mainly comprised of Rhizobiales (12
ASVs), Sphingomonadales (8), Actinomycetales (8), Rubrobacterales (7) and Gaiellales (6) (Supplementary Fig. 9). For the -P treatment, 67 ASVs displayed significant differences between Control and -P treatment, but most of them showed reduced abundance in the -P treatment, especially the Actinomycetales (24 ASVs), Burkholderiales (7) and Rhizobiales (6). For the -K treatment, however, only 6 ASVs significantly differed from the Control (Supplementary Fig. 9), suggesting a relatively small impact of K fertilization on microbiome composition.
Functional adaptation of the rhizosphere microbiome
Metagenomic analysis was then used to investigate functional adaptive changes in the rhizosphere microbiome across fertilization treatments (Fig. 6). Detected genes were annotated using KEGG, COG and CAZy databases, and analysis showed a significant reduction of their functional -diversity in the -N treatment relative to the Control ( ), while the -P and -K treatments were not affected (Fig. 6A-C).
Fig. 5 | Core ASVs in the rhizosphere. A richness and accumulative abundance of core ASVs in the rhizosphere. B regression coefficient between absolute abundance ( copies ) of all ASVs and core ASVs in each treatment. clustering heatmap of core ASVs in different treatments and developmental stages. The
bar is the accumulative absolute abundance of core ASVs in each sample. The right panel indicates the differentiated ASVs between Control and unbalanced fertilization treatments across plant developmental stages, and the ecological clusters (network modules, in Fig. 7). Source data are provided as a Source Data file.
Constrained principal coordinate analysis (CPCoA) of functional diversity showed clear differences among treatments ( ), except for a high overlap between the Control and -K treatment (Fig. 6A-C). We further investigated genes involved in , and K cycling (Fig. 6D). In the -N treatment, genes involved in the N mineralization process, including urea hydrolysis genes (ureC and URE) and glutamin-(asparagin-)ase genes (aspQ), were enriched, whereas those involved in N reduction (e.g., narB, narG and narH), denitrification (e.g., nirK), inorganic P solubilization ( and ), and K transportation (e.g., , and ) processes were specifically depleted, compared with the Control.
For the -P treatment, genes associated with P supply (inorganic P solubilization) and response ( starvation) were highly enriched (Fig. 6D), and metagenomic assembled genomes (MAGs) further confirmed the presence of genes involved in inorganic solubilization and P starvation in most MAGs (Supplementary Fig. 10), strongly reflecting conditions of P scarcity. By contrast, genes involved in N mineralization, N reduction, and K transport processes were depleted but nitrification and denitrification processes were enriched in the -P treatment relative to the Control (Fig. 6D). The -K vs. Control comparison revealed a specific enrichment of genes associated with K transport (e.g., Kup) in the -K treatment, but only few differences were observed in functional genes involved in nutrient cycling (Fig. 6D).
Network inference of the core rhizosphere microbiome
Given the significant effect we observed for fertilization regimes on the temporal dynamics of the rhizosphere microbiome, we built cooccurrence networks of core ASVs for different treatments to decipher their co-occurrence patterns across plant development (Supplementary
Fig. 11, Supplementary Table 6). Generally, the network complexity (average degree) and robustness gradually increased with plant developmental stages, and the network complexity sharply strengthened at the later stage, implying that the bacterial potential interaction patterns were dynamic and intensive in response to plant development. Next, we compared overall microbial aggregation patterns and identified the keystone hubs in different treatments (Supplementary Fig. 12). We showed that the rhizosphere network complexity was much higher in the -N and -K treatments, with values of 22.48 and 25.12 in the -N and -K treatments, respectively, compared to 7.48 in the Control (Supplementary Fig. 12A). Similarly, the network robustness was significantly higher in all three treatments than in the Control ( , Supplementary Fig. 12B). For the keystone hubs, we found that there was no module hub identified in each network, except for the presence of a module hub in the network of -P treatment (Supplementary Fig. 12C), suggesting the microbial group rather than a single taxon governed the function of microbial communities in the rhizosphere.
A low-nitrogen-enriched cluster promotes plant growth
We then constructed a network to compare fertilization-induced changes in ecological clusters (i.e., network modules) , and investigated their functions in plant growth promotion using a synthetic community (SynCom) (Fig. 7). Overall, three major modules were identified in the network (Fig. 7A). Module#1 and module#3 were dominated by Proteobacteria, while the taxa in module#2 were mainly composed of Actinobacteria ( ), with Acidobacteria being diminished (Fig. 7B). The bacterial loads of module#2 and module#3 showed opposite responses in the -N treatment relative to the Control, with a significantly higher abundance in module#2 but lower in module#3
Fig. 6 | Functional profiles of rhizosphere microbiome in different treatments. Functional -diversity (left) and -diversity (right) of rhizosphere microbiome in each treatment based on the KEGG (A), COG (B), and CAZy (C) databases ( soil samples). The asterisks represent the level of significance ( ) of functional -diversity between Control and unbalanced fertilization treatments based on Kruskal-Wallis test with Dunn’s post hoc analysis. The significance level of functional -diversity among treatments was assessed by the ANOVA-like
permutation test. Exact -values are listed in the Source Data file. The box plots indicate the median (center line), the 25th and 75th percentiles (box), and the range of non-outlier values (whiskers). differences of functional genes associated with , and cycling. The asterisks represent the level of significance , ) between Control and unbalanced fertilization treatments based on the paired Wilcoxon test (two-sided). Source data are provided as a Source Data file.
( , Fig. 7C). Intriguingly, the bacterial taxa in module#2 and module#3 exhibited a significant overlap with the increased and decreased ASVs in the -N treatment, respectively (Fig. 5C). For the -K treatment, the abundances of the three modules were comparable with the Control, while for the P treatment they were consistently reduced (Fig. 7C).
To test the causal relationship between microbial ecological clusters and plant performance, we first isolated 1011 bacterial strains from the soybean rhizosphere by culturing. The isolated bacteria were mainly composed of Proteobacteria ( ), Actinobacteria ( ), Firmicutes (27.4%) and Bacteroidetes (4.6%), among which 78.9% of strains can be assigned at genus level, with totally 56 genera identified (Supplementary Fig. 13A). After comparing the isolated bacterial strains with core ASVs, we recovered and of the abundances of core ASVs in datasets with accumulative ASV abundances to and of the total sequences, respectively (Supplementary Fig. 13B), indicating a good coverage by isolated strains to rhizosphere core ASVs. In module#2 (i.e., Low-nitrogen-enriched cluster, LNE cluster), seven core ASVs (affiliated with Rhodococcus, Lysobacter, Terrabacter, Arthrobacter, Phyllobacterium, Bosea and Aeromicrobium) were
matched with bacterial strains and designated as SynCom7 (Fig. 7D). Considering the bacterial load in module#1 showed non-significant difference between Control and -N treatment, the bacterial strains from module#1 were chosen as a control SynCom (SynCtrl). Overall, 5 ASVs (affiliated with Brevundimonas, Sediminibacterium, Mycobacterium, Herbaspirillum and Sphingomonas) that matched in module#1 were assembled for use as a SynCtrl (Fig. 7D). To exclude potential Bradyrhizobiaceae-induced nodulation and coordinate the microbial diversity with SynCtrl, five strains derived from LNE cluster were chosen in the experiment (SynCom5) (excluding Bosea sp. and Aeromicrobium sp. from SynCom7).
Soybeans grown in pots were inoculated with either SynCom5, SynCom7, or SynCtrl in sterilized vermiculite for 2 and 3 weeks. Afterward, the plant phenotypes, including shoot height, total biomass, and nitrate nitrogen concentrations, were measured. The results showed that both SynComs derived from the LNE cluster (SynCom7 and SynCom5) were capable of stimulating plant growth, irrespective of external N addition (Fig. 7E, F, Supplementary Fig. 14). Specifically, the shoot height of soybean inoculated with SynCom 5 increased by and , and dry weight increased by
Fig. 7 | Variance of ecological clusters (network modules) in the rhizosphere and their functions in plant growth promotion. A visualized network associations and modularity. B ASV richness and taxonomy of each module. C Cumulative absolute abundance of each module in different treatments ( averaged absolute abundance data for each stage). The asterisks in (C) represent the level of significance ( ) between Control and unbalanced fertilization treatments based on Kruskal-Wallis test with Dunn’s post hoc analysis. Exact values are listed in the Source Data file. Four data points with absolute abundance exceeding copies are not shown because of the limitation of Y -axis. D Matching modular ASVs with isolated bacterial strains to obtain SynComs.
E, F Growth phenotypes of soybeans inoculated with different SynComs at 2 weeks post inoculation under N -amended ( +N , upper panel) or N -free ( -N , lower panel) conditions ( for -N Water treatment, for -N SynCom5 treatment, for other treatments). Different letters indicate significant difference of plant growth phenotypes in different treatments at by one-way ANOVA test with LSD’s post hoc analysis (for data fit normal distributions and homogeneous variance) or Kruskal-Wallis test with Dunn’s post hoc analysis (for data does not fit normal distributions and homogeneous variance). Exact -values are listed in the Source Data file. The data are presented as mean values standard deviation (SD). Source data are provided as a Source Data file.
and at 2 weeks post inoculation, compared with the plant inoculated with SynCtrl with or without N amendment, respectively (Fig. 7F). Similar results were also observed after 3 weeks of inoculation, and the plant nitrate nitrogen contents of SynCom treatments (SynCom7 and SynCom5) increased by and to the SynCtrl treatment in the N-amended and N-free conditions, respectively (Supplementary Fig. 14). Finally, we evaluated the plant growth-promoting (PGP) traits of each SynCom and strain (Supplementary Fig. 15). Compared with SynCtrl, both SynCom7 and SynCom5 exhibited higher concentration of indole-3acetic acid (IAA) and activity of 1-aminocyclopropane-1-carboxylic acid (ACC) deaminase. Two strains in SynCom7 and SynCom5 showed the ability of inorganic phosphorus solubilization. However, the N fixation activity was not detected in all strains, implying the rhizobia might positively interact with SynComs through facilitating plant N nutrition.
Discussion
Plants are thought to recruit microbial taxa throughout their lifespan, in which time specific root exudates generally drive the microbial colonization pattern in the underground compartments, resulting a highly dynamic nature of root-associated microbiomes . Due to the fact that microbial load changes with environment , RMP fails to detect much of the variance that occurs among samples and does not provide a full picture of the changes that occur over time. Here, for the first time, we reveal the full landscape of changes occurring in soybean root-associated bacteria through application of QMP and suggest that the dynamic root microbiome is able to promote soybean growth. We found evidence that bacterial loads in both the rhizosphere and endosphere exhibited increasing trends with plant development, with most of the major taxa increase steadily over time, despite their inconsistent relative abundance trends (Figs. 3, 4). We observed a stronger succession of the rhizosphere bacterial community across
plant development based on QMP ( ) compared with RMP ( ), except for the -P treatment (Fig. 2, Supplementary Fig. 4, Supplementary Table 3), suggesting that rhizosphere microbiomes are more dynamic than previous realized. These results, together with an ever-decreasing trend of bacterial -diversity in the rhizosphere as plant development progresses, suggest that the plants increase microbial carrying capacity but enhance selective pressure as plants develop, which could be largely shaped with long-time plantmicrobial co-evolution.
Based on QMP profiling, we found that Proteobacteria, Actinobacteria, and Bacteroidetes were commonly enriched across plant developmental stages (Figs. 3, 4). Bacteroidetes were particularly enriched, followed by Proteobacteria, indicating that they were the most responsive to plant growth (Figs. 3, 4). The Bacteroidetes are commonly recognized as copiotrophic bacteria with -strategy to flourish in environments with abundant resources , with implications for N and P cycling . The load of Actinobacteria also significantly increased with time, despite their having a reduced relative abundance (Figs. 3, 4), suggesting that plants do not repel Actinobacteria during plant development, but the Actinobacteria are out-grown by Bacteroidetes and Proteobacteria. A pioneer study revealed that Actinobacteria are selectively recruited by active plant cells over inert woody cells . Members of Actinobacteria are known for their ability to produce a range of antimicrobial compounds that promote host fitness . Given the fact that plants are more susceptible to disease at early growth stages , the temporal complementary of microbialconferred resistance and plant innate immunity might benefit plant health and development. Together, these results suggest that plant development drives the expansion of the root-associated microbiome, which intimately interacts with plants to enhance host fitness and adaptability.
We found strong evidences that rhizosphere bacteria were more sensitive to fertilization than endosphere (Fig. 2, Supplementary Fig. 3). This could be attributed to the fact that the rhizosphere serves as the interface of plant-soil interactions and is a hotspot for microbial communities compared to the bulk soils, whereas endosphere maintains homeostasis for host health. Particularly, we showed that -P treatment substantially reduced the microbial temporal turnover rate in the rhizosphere, diminished the change of microbial -diversity, and consistently reduced bacterial load compared to the Control across plant development (Figs. 2, 3), indicating deprivation delays the development of rhizosphere microbiome. Drought has been reported to similarly delay the maturity of the root microbiome in sorghum and rice , suggesting that the host nutrient supply may be curtailed during periods of severe abiotic stress. Meanwhile, it has been reported that P nutrition has a positive effect on N fixation in soybean . Consistent with this, we observed that soybean root nodules were reduced in number and diameter, and rhizobial abundance in the rhizosphere was decreased under P deprivation (Supplementary Figs. 2, 8). Even so, we observed only a one-fourth of yield reduction in the -P treatment than Control (Fig. 1). For one reason, microbial functional genes encoding inorganic P solubilization and P starvation were specifically enriched in the rhizosphere of – treatment, and these genes were prevalent in metagenomic assembled genomes (Fig. 6, Supplementary Fig. 10). For another reason, the symbiotic relationship between plants and arbuscular mycorrhizal fungi might be strengthened under low soil P availability . We also observed that N transformation processes, including nitrification and denitrification, were significantly enriched in the -P treatment (Fig. 6). These may result from the presence of surplus N in the soil resulting from reduced N uptake by the plants under limiting P , leading to an increase the N transformation processes in the rhizosphere, which corroborates several soil-based studies .
In contrast, different trajectories were observed between P and N fertilization regimes, with the -distance of the rhizosphere
microbiome diverging at early stage between the Control and -N treatment, resulting in the parallel development of distinctive rhizosphere microbiome in the two treatments (Fig. 2). This could be attributed to the substantial effect of N on soil chemical and biological processes across various ecosystems , as well as the legacy effect of N on bacterial communities in the bulk soil over four decades (Fig. 2). The lack of N fertilizer in the -N treatment generally improved soybean root nodulation and increased the abundance of rhizobia (Supplementary Figs. 2, 8), which is consistent with many previous studies showing that a lack of inorganic N inputs and a higher pH benefit symbiotic N fixation . Besides to symbiotic N fixation, N availability can also be improved by organic N mineralization. The increased functional genes involved in N availability but reduced genes related to N reduction in the rhizosphere of -N treatment suggested an effective soybean N supply in absence of N fertilizer (Fig. 6), corresponding with the stabilized soybean productivity in the -N treatment (Fig. 1). Similarly, a large-scale study conducted in the United States and Argentina revealed only an higher soybean yield in the full-N treatment compared to the zero-N treatment, and the positive effect of N fertilizer increased with the increasing yield potential , suggesting that the soybean N nutrition can be satisfied across large areas without the need for external N supply.
Root-associated microbiomes have been reported to interact with each other to maintain essential functions in host nutrient acquisition resulting in enhanced plant fitness . We found evidence that the cooccurrence patterns of the core bacterial microbiome in the rhizosphere altered in response to fertilization, showing an increased network complexity and stability in the -N and -K treatments relative to the Control (Supplementary Fig. 12), despite there being few taxonomic and functional differences between the Control and -K treatment. It has been reported that a highly connected network can occur under environmental perturbations, such as nutrient scarcity and pathogen invasion . An in vitro study examining microbial interactions also suggested that microbes established a high degree of metabolic cooperation under low nutrient availability . The complexity and stability of networks is an important trait for ecosystem function , their increase in both -N and -K treatments potentially indicates an increased capacity to alleviate nutrient stress by intensive metabolic interactions such as cross-feeding and facilitation.
The root-associated microbiome is the result of feedback from complex associations between host plants and the soil environment, and extends plant phenotypes . However, our understanding of the dynamic changes that occur during these interactions and their effect on plant performance remains elusive. We observed that several ecological clusters (network modules) of core microbial taxa varied in abundance and composition across different treatments (Figs. 5, 7). These taxa may have attributes that confer specialized metabolic functions and affect specific ecosystem processes . After designing synthetic communities (SynComs) from different ecological clusters, we showed that SynComs from the LNE cluster (SynCom5 and SynCom7) were able to improve soybean growth, irrespective of N addition, but SynComs from module#1 (SynCtrl) had no consistent effect (Fig. 7, Supplementary Fig. 14). We did not observe the formation of root nodules in SynCom treatments, suggesting that the effect was not dependent on the presence of rhizobia. Besides the direct improvement of N availability by rhizosphere microbes, microbes are also known for their PGP effects, such as IAA and ACC deaminase production. The higher production rate of IAA and ACC deaminase in the LNE cluster indicates that plants can benefit from the presence of specific microbial groups through multiple ways (Supplementary Fig. 15). Moreover, it has been reported that the rhizosphere microbiome also plays an important role in facilitating soybean nodulation , and that nodulation modulates commensal rhizosphere microbiomes . This suggests that positive interactions exist between the rhizosphere microbiome and root nodules. Although our
study focuses on the root-associated bacterial community, it is important to note that other organisms, such as filamentous fungi and protists, may also play a role in shaping network association and ecological functions through “top-down” effects , and how their interactions for benefiting plants through tripartite mutualisms (e.g., rhizobia, mycorrhizal fungi, and plants) requires further investigation . Taken together, our study provides experimental evidence for the promotion of specific microbial ecological clusters to increase plant fitness and establishes a framework for identifying, designing and testing agriculturally important microbial SynComs to sustaining crop productivity.
Methods
Experimental design, sampling, and measurement of soil chemical properties
The long-term field experiment launched in 1979 was located at Daowai District, Harbin, China ( ). The climate is typical mid-temperate continental monsoon, and the soil type is classified as Mollisol. Given that the crop can only be cultivated once a year, a 3-year soybean-maize-wheat rotation system was adopted. Four treatments were set, including (1) full-dose fertilization (NPK fertilizer, Control); (2) lack of nitrogen fertilizer (-N); (3) lack of phosphorous fertilizer (-P); and (4) lack of potassium fertilizer (-K) (Fig. 1A). Each treatment consisted of three plots with a completely randomized block design, and each plot comprised (Fig. 1A), and different plots were separated by concrete walls ( 0.15 m in width and 1.1 m in depth). The nitrogen fertilizer used in the experiment was urea, the phosphorous fertilizer was a combination of and , and the potassium fertilizer used was . For soybean cropping, the application rates were , and for , and , respectively, and conventional tillage was applied for soybean planting. Specifically, the ridge was established by a ridging plow, with ridge spacing of 0.65 m . In each ridge, the soybean seeds were sowed in the two rows, with the plant spacing of 0.1 m . Totally, there were around 1000 plants for each plot. The field management, included irrigation and weeding, was adopted according to local farmer practices and was identical for the different treatments. After harvest, the field was fallow until the planting season of next year.
The rhizosphere soil and root samples were collected from the soybean plots in the 2020 planting season. Before sowing, the bulk soils of each treatment were sampled as the background. The soybean variety “Heinong 84” was sown in early May and it germinated after 10 days. We collected the rhizosphere soil and corresponding root samples at , and 72 days after germination. The corresponding plant development stages with regard to flowering and pod set are illustrated in Fig. 1A. For each plot, three plants with similar growth state were randomly chosen for collection, and the sampling location was apart from previous sampling stages to prevent the potential marginal effect and disturbance with adjacent plants, with nine biological samples for each treatment at each stage. Briefly, a soybean plant was dug out, and the soil loosely attached to the root was removed by shaking and of the root was placed in a 50 mL sterilized tube. After sampling, the rhizosphere and root samples were taken to the laboratory in an ice box, and then stored at until DNA extraction. At maturity, the yield was measured for each of the soybean plots using standard methods.
The chemical properties of bulk soils were measured to monitor the soil nutrient status. Briefly, soil AHN was measured using alkaline diffusion method. Soil available phosphorus was determined by the molybdenum-blue method after extracting with sodium bicarbonate, and available potassium (AK) was determined by a flame photometer after extracting with ammonium acetate. SOM was determined by chemical oxidation method after digesting with . DOC was measured after extraction with solution. Soil pH was measured with a soil water ratio at .
Sample pretreatment and total DNA extraction
The soil remaining tightly adhered to the roots was used as the rhizosphere soil sample. The pretreatment of rhizosphere soil and root samples was performed as previously described in refs. 7,54, with minor modifications. First, 25 mL of PBS solution (containing 137 mM ) was added to a 50 mL centrifuge tube containing root samples. The mixture was sonicated at 40 Hz for 1 min and shaken to separate rhizosphere soil from the roots. The rhizosphere soil was then transferred to another sterilized 50 mL tube and centrifuged at 9000 rpm for 5 min , after which the precipitated rhizosphere soil was subjected to rotary evaporation (Concentrator Plus, Eppendorf, Germany). Next, the dry rhizosphere soil was homogenized by grinding (Tissuelyser-48, Jingxin, China). After collecting the rhizosphere soil, the remaining roots were sonicated and washed twice in the PBS solution. The nodules were separated from the root using tweezers, and then the roots or nodules were surface sterilized by solution for 1 min , respectively. The surface sterilized roots or nodules were further sonicated and shaken by adding 25 mL of PBS solution and this was repeated three times. Around 200 mg of surface sterilized root or nodules were then subjected to rotary evaporation, and then further homogenized through grinding in liquid nitrogen for extraction of the endophytic microbiome. The bulk soil was also desiccated in the rotary evaporator and then homogenized. The processed samples were then stored at .
The total DNA of soil and root/nodule samples was isolated using the FastDNA SPIN Kit for Soil (MP Biomedical, Solon, OH, USA) following the manufacturer’s protocol. The DNA quality was verified by electrophoresis on a 1% agarose gel. The concentration and purity of the extracted DNA was then confirmed using a NanoDrop 2000 Spectrophotometer (Thermo Fisher Scientific, Inc., USA).
High-throughput sequencing and bioinformatic analysis
QMP was applied in the high-throughput sequencing of 16S rRNA and genes. This method is used to measure the absolute abundances of total and specific microbial taxa in a sample, through spike-in targeted DNA fragments during PCR amplification . The synthetic spikes (SynSpike) were designed as previously described in refs. 7,8. Overall, 12 sequences of spikes were designed from the V5-V7 region of the 16S rRNA gene, and one sequence was derived from the rhizobial rpoB gene. The pUC57 plasmids containing each spike sequence were transferred into Escherichia coli TOP10 and then extracted using a TIANpure Midi Plasmid Kit (Tiangen Biotec, China) (Supplementary Fig. 16). Different concentrations of spikes were combined to form the SynSpike for sequencing of soil, root and nodule samples. Finally, of the extracted DNA was mixed with of the SynSpike for PCR amplification. The V5-V7 region of bacterial 16S rRNA gene, and rpoB gene of symbiotic rhizobia were amplified through primer pairs 799F ( -AAC MGG ATT AGA TAC CCK G-3′) and 1193 R ( -ACG TCA TCC CCA CCT TCC-3′) , and rpoB1479F ( -GAT CGA RAC GCC GGA AGG-3′) and rpoB1831R ( -TGC ATG TTC GAR CCC AT-3′) , respectively. The resultant 16S rRNA and rpoB derived PCR products were sequenced on the MGISEQ-2000 platform of BGISEQ using the singleend 400 bp (SE400) module in BGI Shenzhen (BGI, Shenzhen, China).
The microbial bioinformatic analysis was performed with QIIME 2 . The raw sequencing data was demultiplexed and filtered using the q2-demux plugin followed by denoising with DADA2 . The amplicon sequence variants (ASVs) of 16S rRNA and rpoB genes were annotated against the Greengenes and the rhizobial rpoB reference sequence databases , using classify-sklearn naive bayes taxonomy classifier and classify-consensus-blast taxonomy classifier, respectively. For 16 S rRNA sequencing data, the non-bacterial ASVs in all samples and Bradyrhizobiaceae-affiliated ASVs in the root endosphere were filtered out, as the abundant Bradyrhizobiaceae from the root nodule symbiosis might adversely affect the estimation of bacterial
diversity in the endosphere. For the rpoB sequencing data, only ASVs annotated at the species level were retained. The filtered ASVs were aligned with MAFFT to construct a phylogenetic tree using FastTree . Bacterial -diversity metrics, -diversity metrics, and principal coordinate analyses (PCoA) were estimated using q2diversity plugin after rarefication (1030 sequences per sample) for RMP, and using the R package “vegan” without rarefication for QMP. The rarefaction curve showed that sequencing depth was suitable to calculate Shannon index of bacterial communities (Supplementary Fig. 17).
Metagenomic sequencing, assembly, and binning
The rhizosphere samples from days 1,42 , and 72 after germination were subjected to metagenomic sequencing on the DNBSEQ-T7 platform of BGISEQ using the paired-end 100 bp (PE100) module in BGI Shenzhen (BGI, Shenzhen, China). The raw sequencing data was assembled using the Easy Metagenome analysis procedure . Briefly, raw reads were filtered to remove low-quality and host (Glycine max) genomic sequences using KneadData (v0.10.0). Metagenome assembly of individual samples was processed by MEGAHIT (v1.2.9) using the default parameters . Bowtie 2 (v2.4.4) was used to map the raw reads to assembled contigs to calculate the read coverage of each contig, after evaluating the quality of contigs by QUAST ( ) . The contigs were subjected open reading frame (ORF) prediction using Prodigal (v2.6.3) . Afterward, a non-redundant gene catalog was constructed using CD-HIT (v4.8.1) . The raw reads and normalized TPM (Transcripts Per kilobase Million) data was quantified after BLAST against the non-redundant gene catalog by Salmon (v1.6.0) . The nonredundant genes were annotated using KEGG and COG databases by eggNOG-mapper (v2.1.6) , and using CAZy database by DIAMOND .
For metagenomic binning, contigs longer than 2000 bp were grouped into 6153 bins using MaxBin2 and MetaBAT2 with the default parameters. CheckM (v.1.0.12) was used to assess the assembly quality of all bins. Totally, 655 bins with completeness and contamination were obtained. All filtered bins were aggregated and dereplicated using dRep (v.3.2.2) with the default overlap threshold (-nc 0.1), and were clustered into strain level and specieslevel genome bins at and of the average nucleotide identity, respectively. Finally, we obtained a non-redundant set of 171 bins (MAGs) at the strain level and 140 MAGs at the species level.
Co-occurrence network analysis
The core bacterial ASVs (with relative abundance > 0.1% for at least one sample) in the rhizosphere were selected for network construction. For each treatment, we constructed three networks to infer the dynamic co-occurrence patterns of core ASVs with plant development by separating samples into three stages (D1-D14, D28-D42, and D60D72), and built an aggregation of microbial association network to compare fertilization-induced change on microbial co-occurrence patterns and identify the keystone hubs. We also combined all rhizosphere samples to find microbial network modules of core bacterial ASVs. A pairwise Spearman correlation matrix was calculated based on the absolute abundance of the core ASVs with the “corr. test” function in the package “psych” in R (v4.1.0). The values were adjusted with the false discovery rate (FDR) method. A cutoff for the Spearman’s rank correlation coefficient ( ) of higher than 0.8 or lower than -0.8 with was used for network construction. Network properties were characterized via the “igraph” package in R , and network robustness was calculated as previously described in ref. 75. The modules in a network, defined as sub-communities of highly interconnected nodes, are recognized as microbial ecological clusters performing different functions . The identification of ecological clusters in the network was performed in Gephi (v0.9.5) platform, using default parameters . Putative keystone hubs in the network were identified according to its within-module connectivity (Zi) and
among-module connectivity (Pi). Nodes with were identified as modules hubs, whereas nodes with were identified as connectors . All networks were visualized in Gephi (v0.9.5) .
Rhizosphere microbial isolation and experimental validation
The rhizosphere bacterial strains were isolated using LB and R2B mediums. Briefly, 3 g of rhizosphere soil from each treatment was placed in a sterile centrifuge tube containing 30 mL of PBS buffer, and then serial diluted using PBS buffer. of each of the , and dilutions were placed on the surface of the medium. For the isolation of spore-forming bacteria, 3 g of rhizosphere soil was stored in a desiccant for 2 weeks and heated at for 30 min after mixing with 30 mL PBS buffer, followed by dilution and plating as described above. All culture dishes were incubated at for 48 h , and the bacterial colonies on the plate were picked for further purification. The universal primer pair was used for bacterial identification. The purified bacterial strains were then stored in glycerol solution at .
The nodes (ASVs) in the co-occurrence network of each module from Fig. 7 were BLASTed against the isolated bacterial strains, and strains with > 95% identity for the 16S rRNA gene were considered to belong to the same ASVs. For the ASVs affiliating to more strains, we chose the strain with the highest similarity to improve the representativeness. Afterwards, we selected one strain for each genus to reduce the complexity of synthetic communities. Considering only -N treatment in the module#2 showed significantly higher bacterial loads than that in Control, we chose bacterial strains in module#2 as synthetic communities in the validation experiment, and took bacterial strains in module#1 as the control SynCom (no significant change of bacterial loads between two treatments). Overall, 7 strains (i.e., Rhodococcus sp., Lysobacter sp., Terrabacter sp., Arthrobacter sp., Phyllobacterium sp., Bosea sp. and Aeromicrobium sp.) in the Module#2 were designated as SynCom, and five strains in the module#1 were designated as SynCtrl (i.e., Brevundimonas sp., Sediminibacterium sp., Mycobacterium sp., Herbaspirillum sp. and Sphingomonas sp.). To exclude potential Bradyrhizobiaceae-induced nodulation and coordinate the microbial diversity with SynCtrl, 5 strains from SynCom7 were further selected (excluding Bosea sp. and Aeromicrobium sp. from SynCom7), which was designated as SynCom5.
We then tested the effect of these SynComs on soybean plant growth. To do this we used the following treatments: Control (sterilized water), SynCtrl (5 strains from Module#1), SynCom7 (7 strains from Module#2), and SynCom5 (5 strains from Module#2). Sterilized vermiculite was used as substrate and MFP mediums with or without nitrogen (i.e., ) were applied as nutrient solutions. The soybean seeds were surface sterilized with for 5 min and then planted in sterilized vermiculite. Each treatment had 12 seedlings. The SynComs were prepared by centrifuging the bacteria solution at 9000 rpm for 2 min and re-suspended in sterilized distilled water adjusted to a final optical density (OD) of 0.1 for each strain. After seed germination ( 4 days after planting), 1 mL of the SynComs or sterilized water was inoculated into the roots, and this was repeated after 1 week. The shoot height and total biomass of the soybean plants were measured 2 and 3 weeks after first inoculation, and the nitrate nitrogen concentrations of whole soybean plants were measured using samples taken from 3 weeks after first inoculation. The concentration of plant nitrate nitrogen was measured by the colorimetric method after digestion with salicylic acid- and NaOH solution.
Characterization of plant growth-promoting (PGP) traits in synthetic communities
The PGP functions of each bacterial strain and synthetic community, including IAA production, ACC deaminase activity, inorganic phosphorus solubilization and nitrogen fixation, were investigated in vitro. IAA concentrations were determined as described in ref. 78 , with some modifications. Briefly, the Landy medium was used to culture strains
for 3 days and 200 rpm at . Afterwards, 1 mL of the supernatant (obtained by centrifugation at 9000 rpm for 5 min ) was mixed with 2 mL of Salkowski’s reagent ( 150 mL of concentrated of distilled of ) and incubated in darkness for 20 min . The IAA concentration was determined by colorimetric method at 530 nm , and a standard curve was prepared by a series of pure IAA concentrations. To test the ACC deaminase activity of synthetic communities, bacterial strains were inoculated in DF salts medium supplemented with ACC as the sole nitrogen source for 3 days and 200 rpm at . ACC deaminase activity was quantified using the method as previously described in ref. 79. The amount of ketobutyrate produced by each SynCom was determined by a standard curve of pure -ketobutyrate at 540 nm . Inorganic phosphate solubilizing capacity of the bacterial strains was tested on the Pikovskaya’s agar medium as described in ref. 80 . Halo zones surrounding the colonies were measured after 7 days of culture at . Nitrogenase activity of the bacterial strains was measured by acetylene reduction assay as described in ref. 81. Briefly, bacterial strains were cultured in the modified Döbereiner medium for 3 days and 200 rpm at . Then, the bacterial culture was transferred to the serum vial and of headspace gas was replaced with acetylene. The ethylene concentration was determined with a gas chromatograph (HP7890B, Agilent, USA) after inoculation for 24 h at .
Statistical analysis
All statistical analyses were performed in R (v4.1.0, http://www.rproject.org). The data for soil chemical properties and soybean phenotypes were tested for normality using the Shapiro-Wilk test and homogeneity of variance using Bartlett’s test. For data with normal distributions and homogeneous variance, one-way ANOVA test with Dunnett’s or LSD’s post hoc analyses was used for multiple comparisons. Kruskal-Wallis tests with Dunn’s post hoc analysis for multiple comparisons were applied to data with non-Gaussian distributions or heteroscedasticity.
The linear mixed model analysis was performed to identify the major drivers of microbial -diversity and abundance using the R package “Ime4” . Nonparametric statistical tests (Kruskal-Wallis tests with Dunn’s post hoc analysis) were performed to evaluate the difference of -diversity between different development stages and different fertilization treatments. The relative contribution of different factors on bacterial Bray-Curtis dissimilarity was tested with PERMANOVA using the Adonis2 function in R package “vegan” . Linear regression analysis was used to examine the relationship between temporal distance and Bray-Curtis distance between two samples in each treatment and between sampling stage and Bray-Curtis distance of each unbalanced fertilization treatment to the Control. Paired Wilcoxon test was applied to test the significance of bacterial phyla, core ASVs, and functional genes between Control and each unbalanced fertilization treatment, after averaging the abundance of bacterial taxa in each stage. The significantly changed ASVs to unbalanced fertilization were defined as the by paired Wilcoxon test and fold change . All statistical test -values were corrected using the FDR method, except for those obtained with the paired Wilcoxon test. For all statistical tests, were considered significant, and individual -values are specified in figure legends. Data visualizations were primarily generated using the “ggplot2” R package. Heatmaps were generated using the “ComplexHeatmap” R package . The phylogenetic tree was primarily constructed by 16 S rRNA gene, except that the phylogenetic tree of MAGs was constructed based on the complete genomes. The visualization of phylogenetic tree and data annotation were conducted with iTOL v6 .
Reporting summary
Further information on research design is available in the Nature Portfolio Reporting Summary linked to this article.
Data availability
The 16S rRNA amplicon data (SAMN32647504-SAMN32648110), rpoB amplicon data (SAMN32650334-SAMN32650836), and metagenome data (SAMN32727371-SAMN32727406) associated with this study have been deposited in the NCBI Sequence Read Archive (SRA) under the project accession PRJNA922226. The classification information of the metagenomic assembled genomes (MAGs) and isolated bacterial strains has been uploaded to the GitHub repository: https://github. com/mxwang2016/Soybean. Source data are provided with this paper.
Code availability
The R scripts for calculating and visualizing microbial diversity, load, and composition have been uploaded to the GitHub repository: https://github.com/mxwang2016/Soybean.
References
Berendsen, R. L., Pieterse, C. M. J. & Bakker, P. A. The rhizosphere microbiome and plant health. Trends Plant Sci. 17, 478-486 (2012).
Chaparro, J. M., Badri, D. V. & Vivanco, J. M. Rhizosphere microbiome assemblage is affected by plant development. ISME J. 8, 790-803 (2014).
Xiong, C. et al. Plant developmental stage drives the differentiation in ecological role of the maize microbiome. Microbiome 9, 171 (2021).
Zhang, J. et al. Root microbiota shift in rice correlates with resident time in the field and developmental stage. Sci. China Life Sci. 61, 613-621 (2018).
Zhalnina, K. et al. Dynamic root exudate chemistry and microbial substrate preferences drive patterns in rhizosphere microbial community assembly. Nat. Microbiol. 3, 470-480 (2018).
Yang, H. et al. Temporal complementarity between roots and mycorrhizal fungi drives wheat nitrogen use efficiency. N. Phytol. 236, 1168-1181 (2022).
Wang, X. et al. An amplification-selection model for quantified rhizosphere microbiota assembly. Sci. Bull. 65, 983-986 (2020).
Tkacz, A., Hortala, M. & Poole, P. S. Absolute quantitation of microbiota abundance in environmental samples. Microbiome 6, 110 (2018).
Guo, X. et al. Host-associated quantitative abundance profiling reveals the microbial load variation of root microbiome. Plant Commun. 1, 100003 (2020).
. et al. Drought delays development of the sorghum root microbiome and enriches for monoderm bacteria. Proc. Natl Acad. Sci. USA 115, E4284-E4293 (2018).
Santos-Medellin, C. et al. Prolonged drought imparts lasting compositional changes to the rice root microbiome. Nat. Plants 7, 1065-1077 (2021).
Schulte-Uebbing, L. F., Beusen, A. H. W., Bouwman, A. F. & de Vries, W. From planetary to regional boundaries for agricultural nitrogen pollution. Nature 610, 507-512 (2022).
Mariotte, P. et al. Plant-soil feedback: bridging natural and agricultural sciences. Trends Ecol. Evol. 33, 129-142 (2018).
Zhang, T., Chen, H. Y. H. & Ruan, H. Global negative effects of nitrogen deposition on soil microbes. ISME J. 12, 1817-1825 (2018).
Dai, Z. et al. Long-term nitrogen fertilization decreases bacterial diversity and favors the growth of Actinobacteria and Proteobacteria in agro-ecosystems across the globe. Glob. Chang Biol. 24, 3452-3461 (2018).
Liang, Y. et al. Century long fertilization reduces stochasticity controlling grassland microbial community succession. Soil Biol. Biochem 151, 108023 (2020).
Du, E. et al. Global patterns of terrestrial nitrogen and phosphorus limitation. Nat. Geosci. 13, 221-226 (2020).
Yu, P. et al. Plant flavones enrich rhizosphere Oxalobacteraceae to improve maize performance under nitrogen deprivation. Nat. Plants 7, 481-499 (2021).
Ortiz-Barbosa, G. S., Torres-Martínez, L., Rothschild, J. & Sachs, J. L. Lotus japonicus regulates root nodulation and nitrogen fixation dependent on the molecular form of nitrogen fertilizer. Plant Soil 483, 533-545 (2023).
Santachiara, G., Salvagiotti, F. & Rotundo, J. L. Nutritional and environmental effects on biological nitrogen fixation in soybean: a meta-analysis. Field Crops Res. 240, 106-115 (2019).
Mendes, L. W., Kuramae, E. E., Navarrete, A. A., van Veen, J. A. & Tsai, S. M. Taxonomical and functional microbial community selection in soybean rhizosphere. ISME J. 8, 1577-1587 (2014).
Oppenheimer-Shaanan, Y. et al. A dynamic rhizosphere interplay between tree roots and soil bacteria under drought stress. eLife 11, e79679 (2022).
Fan, K. et al. Biodiversity of key-stone phylotypes determines crop production in a 4-decade fertilization experiment. ISME J. 15, 550-561 (2021).
Fierer, N., Bradford, M. A. & Jackson, R. B. Toward an ecological classification of soil bacteria. Ecology 88, 1354-1364 (2007).
Ling, N., Wang, T. & Kuzyakov, Y. Rhizosphere bacteriome structure and functions. Nat. Commun. 13, 836 (2022).
Lidbury, I. et al. Niche-adaptation in plant-associated Bacteroidetes favours specialisation in organic phosphorus mineralisation. ISME J. 15, 1040-1055 (2021).
Bulgarelli, D. et al. Revealing structure and assembly cues for Arabidopsis root-inhabiting bacterial microbiota. Nature 488, 91-95 (2012).
Viaene, T., Langendries, S., Beirinckx, S., Maes, M. & Goormachtig, S. Streptomyces as a plant’s best friend? FEMS Microbiol. Ecol. 92, 1-10 (2016).
Lee, S. M., Kong, H. G., Song, G. C. & Ryu, C. M. Disruption of Firmicutes and Actinobacteria abundance in tomato rhizosphere causes the incidence of bacterial wilt disease. ISME J. 15, 330-347 (2021).
Develey-Riviere, M. P. & Galiana, E. Resistance to pathogens and host developmental stage: a multifaceted relationship within the plant kingdom. N. Phytol. 175, 405-416 (2007).
Edwards, J. A. et al. Compositional shifts in root-associated bacterial and archaeal microbiota track the plant life cycle in field-grown rice. PLoS Biol. 16, e2003862 (2018).
Zhong, Y., Tian, J., Li, X. & Liao, H. Cooperative interactions between nitrogen fixation and phosphorus nutrition in legumes. N. Phytol. 237, 734-745 (2023).
Shi, J., Wang, X. & Wang, E. Mycorrhizal symbiosis in plant growth and stress adaptation: from genes to ecosystems. Annu. Rev. Plant Biol. 74, 569-607 (2023).
Shi, J. et al. A phosphate starvation response-centered network regulates mycorrhizal symbiosis. Cell 184, 5527-5540 (2021).
Ma, W. et al. Response of microbial functional groups involved in soil N cycle to N, P, and NP fertilization in Tibetan alpine meadows. Soil Biol. Biochem. 101, 195-206 (2016).
Wei, X. et al. Effect of P stoichiometry on the abundance of nitrogencycle genes in phosphorus-limited paddy soil. Biol. Fertil. Soils 53, 767-776 (2017).
Liu, W. et al. Long-term nitrogen input alters plant and soil bacterial, but not fungal beta diversity in a semiarid grassland. Glob. Chang Biol. 27, 3939-3950 (2021).
Cafaro La Menza, N., Monzon, J. P., Specht, J. E. & Grassini, P. Is soybean yield limited by nitrogen supply? Field Crops Res. 213, 204-212 (2017).
Hassani, M. A., Duran, P. & Hacquard, S. Microbial interactions within the plant holobiont. Microbiome 6, 58 (2018).
Layeghifard, M., Hwang, D. M. & Guttman, D. S. Disentangling interactions in the microbiome: a network perspective. Trends Microbiol. 25, 217-228 (2017).
Toju, H. et al. Core microbiomes for sustainable agroecosystems. Nat. Plants 4, 247-257 (2018).
Carrión, V. J. et al. Pathogen-induced activation of diseasesuppressive functions in the endophytic root microbiome. Science 366, 606-612 (2019).
Faust, K. & Raes, J. Microbial interactions: from networks to models. Nat. Rev. Microbiol. 10, 538-550 (2012).
Dai, T. et al. Nutrient supply controls the linkage between species abundance and ecological interactions in marine bacterial communities. Nat. Commun. 13, 175 (2022).
Bai, B. et al. The root microbiome: community assembly and its contributions to plant fitness. J. Integr. Plant Biol. 64, 230-243 (2022).
Xun, W. et al. Specialized metabolic functions of keystone taxa sustain soil microbiome stability. Microbiome 9, 35 (2021).
Delgado-Baquerizo, M. et al. A global atlas of the dominant bacteria found in soil. Science 359, 320-325 (2018).
Banerjee, S., Schlaeppi, K. & van der Heijden, M. G. A. Keystone taxa as drivers of microbiome structure and functioning. Nat. Rev. Microbiol 16, 567-576 (2018).
Han, Q. et al. Variation in rhizosphere microbial communities and its association with the symbiotic efficiency of rhizobia in soybean. ISME J. 14, 1915-1928 (2020).
Wang, X. et al. Mycorrhizal symbiosis modulates the rhizosphere microbiota to promote rhizobia-legume symbiosis. Mol. Plant 14, 503-516 (2021).
Zgadzaj, R. et al. Root nodule symbiosis in Lotus japonicus drives the establishment of distinctive rhizosphere, root, and nodule bacterial communities. Proc. Natl Acad. Sci. USA 113, E7996-E8005 (2016).
Gao, Z., Karlsson, I., Geisen, S., Kowalchuk, G. & Jousset, A. Protists: puppet masters of the rhizosphere microbiome. Trends Plant Sci. 24, 165-176 (2019).
Deveau, A. et al. Bacterial-fungal interactions: ecology, mechanisms and challenges. FEMS Microbiol. Rev. 42, 335-352 (2018).
Edwards, J. et al. Structure, variation, and assembly of the rootassociated microbiomes of rice. Proc. Natl Acad. Sci. USA 112, E911-920 (2015).
Bai, Y. et al. Functional overlap of the Arabidopsis leaf and root microbiota. Nature 528, 364-369 (2015).
Bolyen, E. et al. Reproducible, interactive, scalable and extensible microbiome data science using QIIME 2. Nat. Biotechnol. 37, 852-857 (2019).
Callahan, B. J. et al. DADA2: High-resolution sample inference from Illumina amplicon data. Nat. Methods 13, 581-583 (2016).
McDonald, D. et al. An improved Greengenes taxonomy with explicit ranks for ecological and evolutionary analyses of bacteria and archaea. ISME J. 6, 610-618 (2012).
Katoh, K., Misawa, K., Kuma, K. & Miyata, T. MAFFT: a novel method for rapid multiple sequence alignment based on fast Fourier transform. Nucleic Acids Res. 30, 3059-3066 (2002).
Price, M. N., Dehal, P. S. & Arkin, A. P. FastTree 2-approximately maximum-likelihood trees for large alignments. PLoS One 5, e9490 (2010).
Liu, Y. X. et al. A practical guide to amplicon and metagenomic analysis of microbiome data. Protein Cell 12, 315-330 (2021).
Li, D., Liu, C. M., Luo, R., Sadakane, K. & Lam, T. W. MEGAHIT: an ultra-fast single-node solution for large and complex metagenomics assembly via succinct de Bruijn graph. Bioinformatics 31, 1674-1676 (2015).
Gurevich, A., Saveliev, V., Vyahhi, N. & Tesler, G. QUAST: quality assessment tool for genome assemblies. Bioinformatics 29, 1072-1075 (2013).
Langmead, B. & Salzberg, S. L. Fast gapped-read alignment with Bowtie 2. Nat. Methods 9, 357-359 (2012).
Hyatt, D. et al. Prodigal: prokaryotic gene recognition and translation initiation site identification. BMC Bioinform. 11, 119 (2010).
Li, W. & Godzik, A. Cd-hit: a fast program for clustering and comparing large sets of protein or nucleotide sequences. Bioinformatics 22, 1658-1659 (2006).
Patro, R., Duggal, G., Love, M. I., Irizarry, R. A. & Kingsford, C. Salmon provides fast and bias-aware quantification of transcript expression. Nat. Methods 14, 417-419 (2017).
Cantalapiedra, C. P., Hernandez-Plaza, A., Letunic, I., Bork, P. & Huerta-Cepas, J. eggNOG-mapper v2: functional annotation, orthology assignments, and domain prediction at the metagenomic scale. Mol. Biol. Evol. 38, 5825-5829 (2021).
Buchfink, B., Reuter, K. & Drost, H. G. Sensitive protein alignments at tree-of-life scale using DIAMOND. Nat. Methods 18, 366-368 (2021).
Drula, E. et al. The carbohydrate-active enzyme database: functions and literature. Nucleic Acids Res. 50, D571-D577 (2022).
Wu, Y. W., Simmons, B. A. & Singer, S. W. MaxBin 2.0: an automated binning algorithm to recover genomes from multiple metagenomic datasets. Bioinformatics 32, 605-607 (2016).
Kang, D. D. et al. MetaBAT 2: an adaptive binning algorithm for robust and efficient genome reconstruction from metagenome assemblies. PeerJ 7, e7359 (2019).
Parks, D. H., Imelfort, M., Skennerton, C. T., Hugenholtz, P. & Tyson, G. W. CheckM: assessing the quality of microbial genomes recovered from isolates, single cells, and metagenomes. Genome Res. 25, 1043-1055 (2015).
Olm, M. R., Brown, C. T., Brooks, B. & Banfield, J. F. dRep: a tool for fast and accurate genomic comparisons that enables improved genome recovery from metagenomes through de-replication. ISME J. 11, 2864-2868 (2017).
Yuan, M. M. et al. Climate warming enhances microbial network complexity and stability. Nat. Clim. Chang 11, 343-348 (2021).
Bastian, M., Heymann, S., Jacomy, M. Gephi: an open source software for exploring and manipulating networks. In Proc. 3rd International ICWSM Conference, 361-362 https://ojs.aaai.org/index. php/ICWSM (AAAI Press, Palo Alto, California USA, 2009).
Shi, S. et al. The interconnected rhizosphere: High network complexity dominates rhizosphere assemblages. Ecol. Lett. 19, 926-936 (2016).
Penrose, D. M. & Glick, B. R. Methods for isolating and characterizing ACC deaminase-containing plant growth-promoting rhizobacteria. Physiol. Plant 118, 10-15 (2003).
Joshi, S., Gangola, S., Jaggi, V. & Sahgal, M. Functional characterization and molecular fingerprinting of potential phosphate solubilizing bacterial candidates from Shisham rhizosphere. Sci. Rep. 13, 7003 (2023).
Zhang, L. M. et al. Biochemical mechanism of phosphorus limitation impairing nitrogen fixation in diazotrophic bacterium Klebsiella variicola W12. J. Sustain. Agric. Environ. 1, 108-117 (2022).
Nakagawa, S., Schielzeth, H. & O’Hara, R. B. A general and simple method for obtaining from generalized linear mixed-effects models. Methods Ecol. Evol. 4, 133-142 (2013).
Oksanen, J. et al. The vegan package. Community Ecol. Package 10, 631-637 (2007).
Gu, Z., Eils, R. & Schlesner, M. Complex heatmaps reveal patterns and correlations in multidimensional genomic data. Bioinformatics 32, 2847-2849 (2016).
Letunic, I. & Bork, P. Interactive Tree Of Life (iTOL) v5: an online tool for phylogenetic tree display and annotation. Nucleic Acids Res. 49, W293-W296 (2021).
Acknowledgements
We would like to thank Prof. Li Luo and Mr. Ningning Li for their generous help in bacterial strain isolation and identification. E.W. was supported by CAS Project for Young Scientists in Basic Research (YSBR-011), National Key R&D Program of China (2022YFF1001800), the National Science Foundation (32088102, 32050081, 31825003, 32001886 and 31870218), the Strategic Priority Research Program “Molecular Mechanism of Plant Growth and Development” of the Chinese Academy of Sciences (XDB27040207), and the New Cornerstone Science Foundation through the New Cornerstone Investigator Program and the XPLORER PRIZE. X.C. was supported by the Strategic Priority Research Program of the Chinese Academy of Sciences (XDA28030103).
Author contributions
E.W., M.W., X.M., and X.W. conceived and designed this research; M.W., X.M., A.-H.G., X.W., Q.X., L.W., X.S., M.J., Y.W., and H.L. performed experiments; M.W., A.-H.G., and X.W. analyzed data; A.-H.G., M.W., E.W., J.D.M., and W.Y. wrote the paper; E.W. and X.C. oversaw the entire study. All authors read and approved the manuscript.
Correspondence and requests for materials should be addressed to Xiaofeng Cao or Ertao Wang.
Peer review information Nature Communications thanks the anonymous reviewers for their contribution to the peer review of this work. A peer review file is available.
Reprints and permissions information is available at
New Cornerstone Science Laboratory, National Key Laboratory of Plant Molecular Genetics, CAS Center for Excellence in Molecular Plant Sciences, Institute of Plant Physiology and Ecology, Chinese Academy of Sciences, Shanghai 200032, China. University of Chinese Academy of Sciences, Beijing 100049, China. Heilongjiang Academy of Black Soil Conservation and Utilization, Harbin 150086, China. College of Agriculture, South China Agricultural University, Guangzhou 510642, China. Institute of Genetics and Developmental Biology, Chinese Academy of Sciences, Beijing 100101, China. State Key Laboratory of Agricultural Genomics, Key Laboratory of Genomics, Ministry of Agriculture, BGI Research, Shenzhen 518083, China. BGI Life Science Joint Research Center, Northeast Forestry University, Harbin 150040, China. School of Life Science and Technology, ShanghaiTech University, Shanghai 201210, China. These authors contributed equally: Mingxing Wang, An-Hui Ge, Xingzhu Ma. e-mail: xfcao@genetics.ac.cn; etwang@cemps.ac.cn