الهندسة الجينية المعقدة للبوليبلويد في قصب السكر The complex polyploid genome architecture of sugarcane

المجلة: Nature، المجلد: 628، العدد: 8009
DOI: https://doi.org/10.1038/s41586-024-07231-4
PMID: https://pubmed.ncbi.nlm.nih.gov/38538783
تاريخ النشر: 2024-03-27

الهندسة الجينية المعقدة للبوليبلويد في قصب السكر

https://doi.org/10.1038/s41586-024-07231-4
تاريخ الاستلام: 24 فبراير 2023
تم القبول: 23 فبراير 2024
نُشر على الإنترنت: 27 مارس 2024
الوصول المفتوح

أ. ل. هيلي أ. غارسميور جي. تي. لوفيل س. شينغكيانغ أ. سريداسيام ج. جنكينز سي. بي. بلوت ن. بيبيريديس ن. بومبيدو ، في. ليلاكا سي. جي. ميتكالف ج. دوليزل بي. كابال جي. دبليو. كارلسون ج. ي. هوار سي. هيرفويت سي. زيني أ. ديفار أ. ليبزين م. ويليامز ل. ب. بوسطن ج. ويبر كي. كيمانش س. تيجومورثولا س. راجاسيكار ر. سوشيكي أ. فورتادو جي. ماي ب. باراكال بي. إيه. سيمونز كي. باري ر. ج. هنري ج. غريمود ك. س. أيتكن ج. شمتز و أ. دي هونت

الملخص

قصب السكر، المحصول الأكثر حصادًا في العالم من حيث الوزن، قد شكل التاريخ العالمي والتجارة والجغرافيا السياسية، وهو مسؤول حاليًا عن إنتاج السكر على مستوى العالم بينما نجحت طرق تربية قصب السكر التقليدية في إنتاج أصناف متكيفة مع بيئات جديدة و مسببات الأمراض، فقد توقفت مؤخرًا تحسينات إنتاج السكر. قد يكون توقف زيادة العائدات بسبب محدودية التنوع الجيني داخل تجمعات التربية، ودورات التربية الطويلة، وتعقيد الجينوم الخاص بها، مما يمنع المربين من الاستفادة من الانفجار الأخير في تسلسل الجينوم الكامل الذي استفادت منه العديد من المحاصيل الأخرى. وبالتالي، فإن الهجائن الحديثة من قصب السكر هي المحصول الرئيسي الأخير الذي لا يمتلك جينومًا مرجعيًا عالي الجودة. هنا، نتخذ خطوة كبيرة نحو تقدم تكنولوجيا قصب السكر من خلال إنشاء جينوم مرجعي متعدد الصيغ لـ R570، وهو نوع حديث نموذجي مشتق من التهجين بين الأنواع المستأنسة (Saccharum officinarum) والأنواع البرية (Saccharum spontaneum). على عكس التمثيل الحالي لنمط أحادي واحد (‘مونوبلويد’) لـ R570، يحتوي تجميعنا الذي يبلغ 8.7 مليار قاعدة على تمثيل كامل لتسلسلات الحمض النووي الفريدة عبر حوالي 12 نسخة من الكروموسومات في هذا الجينوم متعدد الصيغ. باستخدام هذا التجميع الجينومي المتماسك للغاية، قمنا بملء فجوة لم يتم قياسها سابقًا ضمن خريطة الجينات الفيزيائية لـ R570 لوصف الجينات المحتملة المسؤولة عن موقع مقاومة الصدأ البني Bru1 ذو النسخة الواحدة. سيساعد هذا التجميع الجينومي متعدد الصيغ مع أوصاف دقيقة لهندسة الجينوم والأهداف الجزيئية لتكنولوجيا الحيوية في تسريع التربية الجزيئية والعابرة للجينات وتكييف قصب السكر مع الظروف البيئية المستقبلية.

بدأ استئناس قصب السكر منذ حوالي 10,000 عام مع أول الأصناف “الحلوة” (Saccharum officinarum) المستمدة من Saccharum robustum. ومع ذلك، فإن الأصناف الحديثة مستمدة جميعها من عدد قليل من التهجينات بين الأنواع التي أجراها المربون قبل قرن من الزمان بين ‘السكر’ ثماني الصبغيات S. officinarum و’البرية’ متعددة الصبغيات Saccharum spontaneum. لقد قدم التهجين بين الأنواع في قصب السكر اختراقات كبيرة في مقاومة الأمراض والتكيف مع الظروف البيئية الصعبة. ومع ذلك، كانت الهجائن من الأجيال المبكرة تتمتع أيضًا بعائد سكر أقل بكثير، بسبب المساهمة الجينية الكبيرة من الأنواع البرية. لإعادة تأسيس عائد سكر مرتفع، قام المربون بإعادة تهجين الهجائن مع . أوفيشيناروم “. تم تسريع هذه العملية بواسطة غير المخفضة (‘ نقل كروموسومات أوفيشيناروم
في الأجيال الأولى من السلالات المعادة التهجين (BC1) كانت تحتوي على تسلسل أكثر تدجينًا مما كان متوقعًا من قبل المعتاد ( أنماط الوراثة.
بينما تمثل الهجين بين الأنواع والتزاوج العكسي خطوات حاسمة في تربية قصب السكر الحديثة، فقد أنتجت أصنافًا ذات جينومات معقدة بشكل استثنائي. بالإضافة إلى جرعة متغيرة من تحت الجينوم للأجداد (بسبب عدم تقليل ‘ نقل الجاميتات)، إعادة التركيب الميوزي للقصب الهجين وتزاوج الكروموسومات متغير داخل وبين تحت الجينوم السلفي. تزاوج الكروموسومات هو في الغالب ثنائي القيمة (على الرغم من أنه يمكن أن تحدث شذوذات ميوزية). ولكن مع تباين في قوة الاقتران بين الكروموسومات، مما يؤدي إلى استمرارية من الوراثة متعددة الصيغ (مع ارتباط عشوائي)
الشكل 1| شجرة النسب وتنظيم الجينوم لـ قصب السكر الهجين. أ، صورة لقصب السكر R570 المزروع في الحقل (بارتفاع حوالي 4 أمتار). ب، النسب المقدرة المسجلة لـ R570 في أ. تساهم الجينومات الأصلية (الأحمر، S. spontaneum (Ss)، قصب السكر ‘البري’؛ الأزرق، S. officinarum (So) ‘الحلو’) بحجم الدوائر النسبية، بالنسبة للتوقعات. الوراثة. أسماء الأصناف لكل تقاطع من النسب
مقدمة بين علامات اقتباس مفردة. ‘ يدل على ‘ ‘ نقل الكروموسومات في الجيلين الأولين، و ‘ + ‘ يدل على هجين. على الرغم من أن النسب الدقيقة للأنواع ‘R331’ و ‘Co213’ غير معروفة، إلا أنه يُقدّر أنها BC2F2 و BC2:BC1F. على التوالي. IBD، متطابق عن طريق النسب. ج، تحضير الكروموسومات لـ R570 بعد التهجين في الموقع، مع مجسات محددة لـ S. spontaneum تظهر باللون الأحمر. د، مخطط الكروموسومات لـ R570 يعكس الألوان في ب.
بين المتجانسات) ووراثة ثنائية الصيغة (مع ارتباط منهجي بين زوج من المتجانسات) يمكن أن يؤدي التهجين بين تحت الجينوم السلفي إلى توليد كروموسومات ‘هجينة بين الأنواع’ تحتوي على كل من الأنساب ‘البرية’ و ‘الحلوة’. ونتيجة لذلك، قد تكون الكروموسومات عالية التغاير، أو متحركة، أو موروثة بشكل كامل من الجينومات السلفية، أو غير متساوية في العدد، أو هجينة بين الأنواع، أو متطابقة تمامًا من حيث النسب مع كروموسوم آخر. تؤدي هذه العمليات إلى جينوم معقد ومت diverse من قصب السكر الهجين.

الطريق إلى جينوم تمثيلي

تعكس تعقيد جينومات وأشجار عائلة قصب السكر الهجينة من خلال تطوير الصنف ‘R570’، الذي تم إنتاجه بواسطة المربين في جزيرة رينيون في عام 1980 (مرجع 11) (الشكل 1a، b). مشابهًا لغيره من الأصناف الحديثة، يبلغ حجم جينوم R570 (2 C) حوالي 10 مليارات قاعدة (‘جيجاباز’ (Gb))، ودرجة تعدد الصيغ الصبغية حوالي و الكروموسومات، التي تم إعادة تركيب العديد منها بين جينومات الأنواع السلفية (الشكل 1ج، د)؛ ومع ذلك، فإن عدم التوازن الصبغي شائع وعدد نسخ كل كروموسوم يختلف داخل وبين الأصناف. تم اختيار R570 كنموذج من قبل مجتمع قصب السكر لدراسة بنية الجينوم الحديثة والمقاومة المستدامة للصدأ البني (Puccinia melanocephala)، الذي كان مرضًا رئيسيًا في المناطق الاستوائية وشبه الاستوائية. . على الرغم من تطوير العديد من الموارد الجينية R570 (على سبيل المثال، علم الوراثة الخلوية، الخرائط الجينية، مكتبات استنساخ BAC، تجميع ‘أحادي الصيغة’) ) ومحاولات أخرى لتجميع أصناف أخرى لا تزال أصناف قصب السكر الحديثة تفتقر إلى جينوم مرجعي متعدد الصيغ الجينية عالي الجودة.
يمثل جينوم مثل R570 العديد من التحديات التقنية في التجميع وتمثيل الجينوم، حيث يحتوي R570 على جميع تعقيدات الجينومات المختلطة والمرباة. نظرًا للاختلافات في تفضيلات الاقتران بين كروموسومات R570، قد يكون من المناسب بيولوجيًا اتباع تمثيل الجينوم المختلط القياسي حيث يتم بناء تجميع لكل نظير ميوزي. ومع ذلك، نظرًا لسلالة التهجين الخلفي الخاصة به، نقل الكروموسومات والجدين من جهة الأم/الأب ‘POJ2878’ (الشكل 1ب)، نتوقع أن يكون الغالبية العظمى من الجينوم متماثل الزيجوت، بمتوسط من تسلسلات مكررة تمامًا. عادةً ما يتم تمثيل التسلسلات المتطابقة في الجينومات المرباة بشكل متكرر كأليل واحد مدمج (على سبيل المثال، خط خلايا CHM13 البشرية ) أو مكررة حسابياً في كل هابلوطيب (على سبيل المثال، جينوم البطاطس رباعي الصيغة الصبغية في حالة R570، من المستحيل وضع تسلسلات مكررة تمامًا بثقة بسبب عدد النسخ المتغير وأنماط إعادة التركيب المعقدة بين السلف.
السابجينومات. لذلك، اخترنا تجميع جينوم جزئي قياسي لـ R570، حيث يمثل التجميع ‘الرئيسي’ تمثيلاً كاملاً للأنماط الوراثية الفريدة في R570 بينما يمثل ‘البديل’ أنماطًا وراثية إضافية متطابقة تقريبًا. بينما لا يحمل ‘البديل’ هنا نفس المعنى مقارنةً بالكائنات الحية ذات الاقتران الثنائي الصارم، قمنا بترتيب جينوم R570 بطريقة مماثلة لتحسين الفائدة للمجتمع.
في الجينوم النموذجي، يمكن تنظيم تجميع عالي الاستمرارية (‘مدعوم’) في الكروموسومات فقط بواسطة تقنية Hi-C أو الخرائط البصرية؛ ومع ذلك، تتطلب كلا هاتين التقنيتين نقاط تسلسل فريدة قصيرة، والتي نادرة في جينوم R570. لذلك، تطلبت عملية الدعم خط أنابيب مخصص استند إلى عدة خطوط من الأدلة، بما في ذلك تسلسل الإجماع الدائري عالي الدقة من PacBio، والخرائط البصرية الموصوفة والمصبوغة من Bionano، ورسم الخرائط الوراثية، والتوافق الجيني، وتسلسل الكروموسوم المفصول. قمنا بدمج هذه الموارد المتنوعة من خلال خط أنابيب مخصص (الشكل 1a من البيانات الموسعة، البيانات التكميلية، الأشكال التكميلية 1-11 والجدول التكميلية 1) لبناء تجميع أولي بحجم 5.04 جيجابايت (N50 من 12.6 ميجابايت؛ متوسط 12 تجميع لكل كروموسوم) (الشكل 2a، b، الشكل 1b من البيانات الموسعة والشكل التكميلية 12) الذي يشمل تقريبًا نصف الـ 10 جيجابايت من التسلسل و114 كروموسوم (الطرق) المتوقع من تقدير قياس التدفق R570. . تمثل 3.7 جيجابايت من التسلسل الإضافي الموجود في التجميع ‘البديل’ تقريبًا نفس الشيء، ولكن ليس بالضرورة أزواج ميوزية، للكروموسومات الأساسية المقابلة. على سبيل المثال: Chr6E_alt (20.4 ميغابايت) هو مماثل لـ Chr6E (50.1 ميغابايت؛ الشكل التوضيحي للبيانات الممتدة 1c)، ولا يمكن تعيين قراءات HiFi بشكل فريد إلى للتجمع البديل (الجدول التكميلي 2). بالإضافة إلى هذه السلسلة المتشابهة للغاية، من المتوقع أن يكون R570 تقريبًا معامل زواج الأقارب بسبب وجود جد مشترك (POJ2878؛ الشكل 1ب). وبالتالي، نتوقع أن يكون حوالي 1.25 جيجا بايت من الجينوم غائبًا في التجميع البديل ومندمجًا في تمثيل واحد في التجميع الأساسي. يتماشى تجميعنا الأساسي والبديل المشترك البالغ 8.72 جيجا بايت بشكل وثيق مع هذا التوقع.
عالية الجودة الفجوات؛ مؤشر تجميع التكرار الطرفي الطويل (LTR) (LAI) : 22.82) التجميع الأساسي يلتقط تمثيلاً كاملاً للتنوع الموجود في R570 وسيكون بمثابة الأساس للتكنولوجيا الحيوية المعتمدة على الجينوم في قصب السكر. كما هو الحال مع الجينومات الثنائية الصبغيات الناتجة عن التهجين، يمكن أن تعقد النسخ المكررة بين الأنماط الوراثية أو تحرف التحليلات – عادةً ما يتم استخدام نمط وراثي واحد كمرجع للتخطيط. وبالتالي، هنا نركز على التجميع الأساسي للجهود المركزية لاكتشاف الجينات المرشحة، مثل تعبير الجينات و

مقالة

متوقع نسخ الكروموسومات أخبار الأيام الثاني 5 كر. 2 أخبار الأيام الثالث كر 10 كر. 7 كر. 8 كر. 9 أخبار الأيام الثاني 6 كر. 4
كر. 1 // !!
تجمع أولي متطابق من الأنماط الوراثية انهار كر. 2 |||||||| ج I I I I I I
سورغم بicolor v.3.1 |||||| ج
نيو نيو ني
1
|''''!!
كر. 8 1
جي، لي لي إي
كر. 10
خريطة التماثل بين R570 والجينومات ذات الصلة
الشكل 2 | تجميع الجينوم لنوع قصب السكر R570. أ، تمثيل تخطيطي للتجميع الأساسي للجينوم. على الرغم من أن R570 يحتوي على حوالي 12 نسخة من الكروموسومات لكل متماثل، فإن التهجين العكسي و أدى نقل الكروموسومات إلى هابلوطايب متطابقة تقريبًا تم تجميعها (ممثلة كظلال لونية) في تجميع الجينوم. ب، جينات الأورثولوج الأحادية بين الكروموسومات 1-10 من سورغوم بيكولور (الإصدار 3.1.1) والكروموسومات الأساسية لـ R570. كل منطقة ملونة بناءً على السلف.
كشف المتغيرات. لدعم هذه الجهود، استخدمنا تجانس الجينات وأدلة تسلسل RNA (RNA-seq) لوصف مجموعة كاملة من تسلسلات البروتين المشفرة وتوضيح الجينات في التجميع الأساسي R570. التوضيح الأساسي مكتمل للغاية (BUSCO الإجمالي، اكتمال النسخ المكررة مع 194,593 تسلسل ترميز (و 105,138 نسخ بديلة متداخلة). على عكس التجميعات الأحادية السابقة، التي احتوت على تمثيل واحد فقط لكل كروموسوم سلفي، فإن عائلات الجينات المدركة للتناظر (المبنية باستخدام GENESPACE كانوا حاضرين في ستة نسخ في الجينوم الأساسي (6.78 متوسط تغطية الكتل المتجانسة مع سورغم بيكولور (S. bicolor)؛ الشكل 2c، الجدول 1 والجدول التكميلي 3)، مما يعكس نصف المتوقع تعدد الصبغيات ويتطابق مع عدد النسخ المتوقع في التجميع الأساسي. هذه التباينات داخل الجينوم متاحة الآن للمربين، لكنها كانت مخفية باستخدام الطرق الحالية أحادية الصبغية (نسخة واحدة). مجتمعة، توفر التجميعات الأساسية والبديلة أكثر تسلسل جينومي اكتمالاً متاحاً لقصب السكر المزروع.
المساهمة ضمن R570.c، خريطة التماثل الناتجة عن GENESPACE بين (من الأسفل إلى الأعلى) سورغوم بيكولور (الإصدار 3.1)، S. spontaneum (النوع الجيني AP85-441)، تجميعات الجينوم الأولية لـ R570 وR570 أحادي الصيغة الصبغية. تشير القطاعات الأفقية إلى الكروموسومات؛ الألوان (الأحمر-الأرجواني) تشير إلى الكروموسومات المتجانسة لسورغوم بيكولور (1-10) و”الضفائر” تمثل الكتل التماثلية بين كل زوج من الجينومات. تُقاس مواضع المحور – بواسطة ترتيب رتبة الجين.

هندسة جينوم R570

المعرفة بهندسة الجينوم العالمية لأسلاف قصب السكر الحديثة مستمدة حاليًا بشكل رئيسي من علم الوراثة الخلوية الجزيئية. التخطيط الجيني ومقارنات تسلسل الهبلايوتوب تقدم تجميع R570 على مقياس الكروموسوم وصفًا دقيقًا لهيكل الجينوم لأسلاف قصب السكر الحديثة، وهو أساس لوصف أنماط التطور الجينومي والتنوع داخل هجين النيو-بوليبلويد، وهو مورد حاسم لجهود تربية قصب السكر الجزيئية المتزايدة. ربما يكون العنصر الأكثر أهمية في تربية قصب السكر بين الأنواع هو الحفاظ على تسلسل س. سبونتانوم الأجداد وإثرائه، مما يمنح مقاومة للأمراض وتكيفًا بيئيًا. إن الأنواع السلفية لـ R570 متباينة بشكل كبير (حوالي 1.6 مليون سنة؛ الجدول التكميلي 4 والشكل التكميلي 13)، مما أتاح استخراج تكرارات محددة للأنواع بطول 27 قاعدة تستخدم لتعيين كتل السلف في الجينوم (البيانات التكميلية). يتماشى ذلك مع التقديرات السيتوجينية السابقة. ،
الجدول 1 | إحصائيات تجميع الجينوم R570 والتعليق
بشكل عام س. أوفيشيناروم س. سبونتانيوم
حجم الجينوم الأساسي (N50 للكونتيغ) 3.66 جيجابايت 1.37 جيجابايت
حجم الجينوم البديل (N50 للكونتيغ) 3.01 جيجابايت 0.32 جيجابايت
حجم الجينوم مع الأخذ في الاعتبار الأنماط الوراثية المنهارة 9.32 جيجابايت
الأنماط الوراثية المنهارة في التجميع 2.31 جيجابايت 2.18 جيجابايت 0.116 جيجابايت
عدد الجينات (عدد المجموعات المتجانسة المتجانسة) في التوصيف الأساسي 194,593 ١٣٢٬٦١٨ ٦١,١٩٧
متوسط عدد الصبغيات للتجميع الأساسي (تغطية الكتل المتناظرة) 4.60x 2.16x
متوسط هوية الببتيد بين الأليلات 86% 83%
الجينات المتأثرة بالمتغيرات الهيكلية ٥٣٦٢ ٥٠٩٠ ٢٦٠
تخطيط فريد من نوعه HiFi العمق المتوقع. معلمات GENESPACE الافتراضية. تم حسابها بين الببتيدات من التوصيف الأساسي ضمن المجموعات المتجانسة. محسوب من المحاذاة الزوجية، بالنسبة إلى ChrA بين الكروموسومات المتجانسة.
وجدنا أن و تم اشتقاق تجميع الجينوم الأساسي R570 (5.04 جيجابايت) من S. officinarum و S. spontaneum، على التوالي (الجداول التكميلية 5 و 6). كما أن المسارات التطورية المنفصلة قد أنتجت مستويات متعددة الصبغيات وأعداد كروموسومات أساسية متميزة بين الأجداد (S. officinarum، عدد الكروموسومات الأساسي ; S. spontaneum، عدد الكروموسومات الأساسي النموذجي ). مجموعة الكروموسومات الأساسية ( ) من S.officinarum متجانس مباشرة مع الكروموسومات العشرة لـ S.bicolor، أقرب أقربائه الثنائي الصبغيات الأكثر دراسة وتوثيقًا. بالمقابل، فإن مجموعة الكروموسومات الأساسية ( ، ولكن يمكن أن تختلف . سبونتانيوم هو نتيجة لإعادة ترتيب ستة كروموسومات إلى أربعة حيث يتم ملاحظة كل منها في التجميع الأساسي R570 (Chr5_9A، Chr 6_9A، Chr 7_10A وChr 8_10A؛ الشكل 2ب).
على الرغم من إعادة الترتيبات في . في R570، معظم الكروموسومات الأصلية متجانسة وتشارك في تتابع متجانس، مما يسهل إعادة التركيب بين الأنواع. في الواقع، تشير التجارب السيتوجينية بين عدة أصناف هجينة من قصب السكر إلى أن الاقتران المتجانس وإعادة التركيب بين الكروموسومات من أصل مختلف من المحتمل أن يكون شائعًا. في التجميع الأساسي R570، لاحظنا 13 كروموسومًا هجينًا بين الأنواع من بين سبعة من عشرة كروموسومات أساسية (الشكل 2ب). كما أكد التجميع وجود كروموسوم متوقع من الناحية السيتوجينية ناتج عن انتقال بين كروموسوم 5 من S. spontaneum وكروموسوم 8 من S. officinarum (الشكل 2ب) والذي وُجد حتى الآن فقط في R570 وليس في أي صنف حديث آخر. تمت ملاحظة الإدخالات المتجانسة، التي يمكن أن تكون غنية في أهداف التربية، في أنظمة أخرى، سواء في التربية التقليدية (على سبيل المثال، الشوفان ) والبوليبلويد الاصطناعي (على سبيل المثال، براسكا والقمح تحتوي الكروموسومات المؤتلفة R570 على تنوع داخل الجينومات الأصلية لا يمكن التخلص منه بسهولة من خلال التزاوج الداخلي، مما يوفر على الأرجح تباينًا وراثيًا إضافيًا يمكن الوصول إليه من قبل المربين في التهجينات المتقدمة.
لقد أدت ممارسات التربية مثل العودة إلى التهجين، ونقل الكروموسومات ‘2n’، وأحجام السكان الصغيرة في التربية، إلى وجود تكرار عالٍ في تسلسل الحمض النووي ونسخ مطابقة تمامًا، خاصة تلك المشتقة من S. officinarum. على سبيل المثال، تم استخدام الصنف ‘POJ2878’ في العديد من برامج التربية حول العالم وهو جدّ لأب وجدة لأم لـ R570 (الشكل 1ب). لتوثيق الهيكل الجينومي لتنوع عدد النسخ وتنوع التسلسل الجزيئي داخل R570، استخدمنا قراءات PacBio HiFi عالية الدقة (الطول الوسيط
17 كيلوبايت)، للعثور على ما يقرب من نصف الجينوم (50.4%) متطابق بالوراثة حيث يتم دمج الأنماط الوراثية بين نسخ متعددة (2-4 مرات) (الجدول التكميلي 7، الشكل التكميلي 14 والشكل الممتد 1d). يحتوي باقي الجينوم (49.6%) على ما يكفي من تباين التسلسل (التغايرية) لتمكين محاذاة فريدة واحدة من قراءات PacBio التي تميز الأنماط الوراثية المنفصلة. كل من الكروموسومات الأساسية لـ R570 مغطاة بنمط وراثي واحد إلى أربعة من S. spontaneum (الشكل 2b) معظمها ( ) هو تسلسل متغاير الزيجوت، ذو نسخة واحدة. على النقيض، فقط جزء S. officinarum هو هتيروزيجوت، بينما الغالبية منه متداخلة بين عدة هابلوطايبات. في الواقع، 87% من التسلسل المكرر بين التجميعات الأولية والبديلة (39.7%; تم مناقشته سابقًا؛ الجدول التكميلية 2) مشتق من S. officinarum. نظرًا لأن التربية لزيادة محتوى السكر وخصائص أخرى تعتمد على المساهمات الإضافية لجرعة الجين، فإن هذه المناطق المكررة تمامًا تمثل أهدافًا محتملة للتصنيف الجيني الواعي بعدد النسخ وجهود التربية الجزيئية. ومع ذلك، فإن استكشاف المساهمة الجينومية للسلف المدجن أمر صعب حيث تتطلب تصنيف الهالوتايبات المتزاوجة أعدادًا كبيرة بشكل صارم من النسل للفحص (على سبيل المثال، تباين علامة ثلاثية في S1 = 143:1 (مرجع 36)). العلامة الجينية الأكثر شيوعًا المستخدمة في تربية قصب السكر (بسيطة، تباين في S1 = 3:1 (مرجع 37); البيانات التكميلية) متحيزة بشكل كبير نحو مناطق عشوائية من الجينوم من العلامات؛ اختبار فيشر الدقيق: إثراء )، ويُوجد تقريبًا حصريًا في الأنماط الوراثية المتغايرة (98%) (الشكل 1e من البيانات الموسعة). بينما يجعل هذا التحيز نحو المناطق المتغايرة الغالبية العظمى من الجينوم غير مرئية للتخطيط الجيني التقليدي، سيسمح تجميع R570 باستكشاف أسهل لمواقع الصفات الكمية (QTLs) من خلال توثيق هيكل الأنماط الوراثية ومساهمة السلف داخل الجينوم.

استكشاف الأهداف للتربية

العديد من الصفات الحاسمة لتحسين قصب السكر متعددة الأشكال في الأنواع السلفية وتعتمد على الجرعة في برامج التربية الهجينة. على سبيل المثال، يبدو أن مقاومة الصدأ البني (انظر أدناه) مشتقة من موضع ذو نسخة واحدة داخل الجينوم، بينما يتطلب محتوى السكر العالي مساهمات إضافية من نسخ الجينات من S. officinarum. لتسريع جهود التربية المماثلة وتطوير استراتيجيات اختيار مدعومة بالعلامات، وثقنا عدد النسخ وتنوع تسلسل البروتين بين وداخل تحت الجينوم R570 ضمن التجميع والتعليق الأساسي (الجدول 1، الشكل 2c والجدول التكميلي 3). باستخدام تصنيف الكتل السلفية، تمكنا من تخصيص نماذج الجينات ( ) إلى S. officinarum و إلى . عفوي ( ). تم فحص الهومولوجات بين الأجداد ووجدت نسخ الجينات المشتقة من S. officinarum و 95% المشتقة من S. spontaneum تحتوي على تباين غير مرادف (الجدول التكميلي 8)، ولكن من المهم ملاحظة أن العديد من هذه الجينات تقع في مناطق حيث تم دمج الأنماط الوراثية. تم تعيين S. officinarum؛ الجدول التكميلي 9)، وبالتالي من المحتمل أن تكون بعض نماذج الجينات ممثلة تمثيلاً ناقصاً. كانت تعددية الببتيد تعكس إلى حد كبير تحليلات النسبة المئوية للتماثل المتجانس، حيث كان لدى المتجانسات S. officinarum متوسط هوية زوجية (PID) من بينما . كان لدى المتجانسات العفوية تباين أكبر بشكل ملحوظ (متوسط PID ; مان-ويتني ، . إن التحقيق في الجينات المتأثرة بالمتغيرات الهيكلية، التي قد تمنع إعادة التركيب والتوليد اللاحق لمجموعات الأليلات المرغوبة، متحيز بشكل كبير نحو أجزاء من جينوم S. officinarum ( الجينات المتأثرة؛ اختبار فيشر الدقيق، نسبة الأرجحية: 9.03، ; الجدول التكميلي 10). استبيان لمادة فريدة (جينات لا تمتلك نظائر في السلف الآخر؛ ) وجد جينات أكثر مشتقة من S. officinarum مما كان متوقعًا (اختبار فيشر الدقيق، نسبة الأرجحية: 1.24، ); على الرغم من أن التحقيق في أكبر عائلة جينية جديدة ساهمت من . تم العثور على تكرار تسلسلي لتسعة جينات غنية بالليوسين على Chr7_10A.
الشكل 3 | موضع جين المرشح Bru1. أ، مقاومة مرض الصدأ البني في R570. اللوحة العلوية تظهر نسل R570 الملقح ذاتيًا مع موضع Bru1، بينما اللوحة السفلية تظهر نسل يفتقر إلى Bru1. ب، تحديد تجميع النمط الجيني المملوء بالفجوات يحدد TKP كجينات مرشحة سببية لمقاومة الصدأ البني الدائم Bru1.
تمثل الخماسيات الزرقاء نماذج الجينات المنسقة والخماسيات الرمادية هي عناصر قابلة للنقل كبيرة. يتم الإشارة إلى جينات المرشحة Bru1 TKP7 و TKP8 باللون الأحمر مع موقعها على الكروموسوم 3D.
توصيف نظائر جينات المقاومة (RGAs) في جميع أنحاء الجينوم (الجدول التكميلي 11) أظهر غنىً كبيرًا للأنماط المستمدة من S. spontaneum (اختبار فيشر الدقيق، نسبة الأرجحية 2.14، )، وخاصة في المناطق المتجانسة من الكروموسومات 3 و 6 و و الإثراء، على التوالي، ; الجدول التكميلي 12).
غالبًا ما تقدم برامج التربية الهجينة والتزاوج العكسي مساحات كبيرة من الأليلات المرتبطة غير التكيفية التي تقلل من إنتاجية المحاصيل في الأجيال المبكرة. في أصناف قصب السكر الحديثة، لم تؤدِ التهجين بين الأنواع فقط إلى إدخال أليلات مقاومة للأمراض من S. spontaneum، بل أيضًا أليلات تقلل من محتوى السكر العالي (‘بريكس’) في S. officinarum المدجنة. اقترحت الدراسات السابقة أن المواقع المنفصلة تفسر بشكل غير متناسب تباين محتوى السكر. لكن بعض هذه التجارب أُجريت في خلفيات جينية مختلفة، مع توفر التجميع الأحادي فقط أو S. bicolor لاكتشاف الجينات المرشحة، مما يقدم رؤية مختزلة للتنوع الأليلي الموجود في جينوم R570. باستخدام الجينوميات المقارنة بين S. bicolor BTx623 (النوع القصير القامة، النضج المبكر، نوع الحبوب) و rio (‘الذرة الحلوة’; الطويل، النضج المتأخر، محتوى عالي من السكر القابل للذوبان)، استكشفنا جينات نقل السكر التي تكمن وراء ظاهرة rio ‘الحلوة’ من التركيزات العالية للسكريات القابلة للذوبان داخل ساقها. ، وهو نمط ظاهري يهم أيضًا مربي قصب السكر. من بين المرشحين الموصوفين في المرجع 42، كانت جينات S. bicolor BTx623 موجودة كمرتكزات فردية ضمن مجموعات الأورثوغراف المتناظرة R570، مع 505 أورثولوجات متناظرة بين الجينومات الأخرى (سورغوم ‘ريو’: R570 أحادي الصيغة الصبغية: S. spontaneum (النمط الجيني AP85-441): R570؛ الأورثولوجات المتناظرة لكل جينوم = 39:37:130:299؛ متوسط نسخ الجينات لكل نظير لكل جينوم = 1:1:3:7).
نسبة PID بين النظير S. bicolor والأورثولوجيات المتناظرة التي تحتوي على جينات نقل السكر محفوظة بشكل كبير (Sorghum ‘rio’: R570 أحادي الصيغة الصبغية: S. spontaneum (النمط الجيني AP85-441): R570؛ الوسيط PIDs لكل جينوم = 100%:91%:94%:94%) (على سبيل المثال، SUT4-Sobic.008G193300، الشكل التمديدي 2a)، على الرغم من أن بعض أليلات R570 تحتوي على طفرات إطارية من المحتمل أن تؤثر على الوظيفة (على سبيل المثال، SoffiXspo nR570.05Bg071800-L744A-Sobic.002G075800-الأورثولوج لجليكوسيد هيدراز، أليل S.officinarum، الشكل التمديدي 2b) أو تمتلك أليلات متغيرة بشكل كبير مع مناطق يمكن تمييز الأهومولوجات الفردية فيها (على سبيل المثال، Sobic.005G082100-بكتينستراز جدار الخلية؛ الشكل التمديدي 2c). سيمكن توضيح R570، مع معلومات عن جرعة الجين، والتنوع الأليلي، ومساهمة السلف، مجتمع قصب السكر من فهم موارد الجينات المتاحة لديهم بشكل أفضل، لكل من R570 وغيرها من الأصناف الهجينة.
بصرف النظر عن إنتاج السكر العالي، فإن سمة مميزة من سمات أصناف قصب السكر الحديثة هي مقاومة الأمراض البيولوجية. واحدة من أهم
الأمراض التي تؤثر على جميع مناطق زراعة قصب السكر حول العالم هي الصدأ البني، الذي يسببه الفطر، Puccinia melanocephala. كان في السابق مسببا رئيسيا للأمراض في قصب السكر الذي تسبب في خسائر في المحصول تصل إلى 50%، وقد نجح المربون في التخفيف من خسائر P. melancocephala من خلال اختيار مقاومة الأمراض. تم تحديد موضع رئيسي (Bru1) يمنح مقاومة دائمة لهذه المرض (الشكل 3أ) في الصنف R570 (المراجع 43،44). لكشف الأليل المسبب الكامن وراء Bru1، استخدمت الدراسات السابقة نهج استنساخ قائم على الخريطة واسع النطاق الذي قام بفحص حوالي 2400 نسل ذاتي التلقيح من R570، مما قيد Bru1 إلى مجموعة من تسلسلات BAC التي امتدت لحوالي 209 كيلوبايت (المراجع 27،44) (الطرق). على الرغم من أن المنطقة احتوت على 13 نموذج جيني (الشكل 3ب والجدول التكميلي 13)، إلا أنها احتوت أيضًا على فجوة غير محددة وإدخال كبير من الهبلاي، وكلاهما يمنع المزيد من رسم الخرائط الدقيقة واكتشاف الجينات المرشحة بشكل شامل . ومع ذلك، فإن إدخال الهبلاي الثابت مكن من تصميم علامات PCR تشخيصية لـ Bru1. وقد تم استخدامها بفعالية في برامج تربية الأصناف الحديثة في جميع أنحاء العالم، مما يدل على أن موضع Bru1 ذو الجرعة الواحدة كان المصدر الرئيسي لمقاومة الصدأ البني الفعالة (أو ‘الدائمة’) لعقود عبر بيئات متعددة .
على عكس الموارد السابقة، يمتد تجميع جينوم R570 عبر كامل منطقة الهدف Bru1 (الكروموسوم 3D: 5944326-6253115 نقطة أساسية). من الأهمية بمكان أن يتضمن ذلك امتدادًا كاملًا يبلغ حوالي 100 كيلوبايت من تسلسل متصل عبر منطقة الفجوة غير المحددة سابقًا . كان ملء هذه الفجوة غير المحددة سابقًا وإثبات أنها لا تتضمن جينات مرشحة إضافية خطوة أساسية قبل الاستثمار في تحليل جميع الجينات المرشحة في المنطقة. أكدت المعالجة اليدوية للمنطقة المملوءة بالفجوة نماذج الجينات الـ 13، التي تم تقييم وظائفها، بحثًا عن جينات تشارك في آليات مقاومة الأمراض، مع تميز جينين كمرشحين رئيسيين (الطرق). تشترك الجينات 7 و8 (معرفات الجينات، SoffiXsponR570.03Dg024200 وSoffiXsponR570.03Dg024300) في التماثل (كلاهما مصنف ككينازات RLK-PELLE-DSLV )، وتقع ضمن حدود الإدخال المحدد بالهبلاي (الشكل 3ب)، وكل منهما نسخة واحدة في جينوم R570. بينما يحتوي الجين 7 (SoffiXsponR570.03Dg024200) على جميع 12 مجالًا وظيفيًا للكيناز، يحتوي الجين 8 (SoffiXsponR570.03Dg024300) على المجالات من I إلى VII فقط ومن المحتمل أن يكون كينازًا زائفًا. تمثل هذان الجينان كينازًا زائفًا متسلسلًا (TKP)، مشابهًا لمقاومة صدأ ساق الشعير (RPG1 (المراجع 46)) ومقاومة الصدأ الأصفر Yr15 (المراجع 47). النموذج الحالي للعمل الجزيئي لمقاومة TKP يقترح أن الكيناز الزائف يعمل كطُعم لمؤثرات الفطريات المسببة للأمراض , بينما ينتج الكيناز الوظيفي سلسلة من الإشارات، مما ينبه استجابة المناعة التي تحفزها المؤثرات النباتية. بسبب تنوعها وجديدها، فإن TKPs (وغيرها من
المتغيرات (على سبيل المثال، الكينازات المتسلسلة وما إلى ذلك)) يصعب العثور عليها باستخدام التماثل التسلسلي فقط. تم التنبؤ بهيكلها عبر نطاق الحياة النباتية، ولكن تم التحقق من خمسة أمثلة فقط وظيفيًا في أحاديات الفلقة، جميعها منحت مقاومة لمسببات الأمراض الفطرية . مجتمعة، تدعم هذه النتائج هذا الكيناز الزائف المتسلسل (TKP7 وTKP8) كالجين المسبب لمقاومة الصدأ البني Bru1 وستسمح بتحسينات بيولوجية مستقبلية لقصب السكر لمقاومة الصدأ البني.

الاستنتاجات

يعد تجميع الجينوم متعدد الصيغ الجينية وتوصيف صنف قصب السكر R570 خطوة أساسية في الثورة الجينومية الناشئة لقصب السكر. يكشف هذا العمل عن التأثيرات الجينومية لممارسات التربية التي حولت قصب السكر إلى مصانع لإنتاج السكر/الكتلة الحيوية، وهو إنجاز ملحوظ من قبل المربين بالنظر إلى تعقيد الجينوم والكشف عن أن الكثير من الأليلات ‘الحلوة’ المستأنسة التي تم الحصول عليها من . officinarum متطابقة وبالتالي فهي غير متاحة إلى حد كبير لجهود رسم خرائط QTL. علاوة على ذلك، فإن استمرار مساهمة الجينوم من السلف . spontaneum، على الرغم من عدة جولات من التهجين العكسي إلى S.officinarum و نقل الكروموسومات، يتم تسليط الضوء عليه من خلال إثراء كل من أنماط RGA ومساهمات عائلات الجينات الفريدة من الأنواع السلفية البرية. تتيح القدرة على فصل وحل واستكشاف الهبلاي الفردية والكروموسومات داخل R570 فهمًا أكبر بكثير للهيكل الدقيق لهذا الجينوم المعقد للغاية وستؤدي إلى تحسينات كبيرة في الفهم الجيني للسمات الزراعية من خلال استكشاف التنوع الأليلي، عدد النسخ وتنوع وجود/غياب الجينات .
واحدة من أهم الأسئلة، ولكن المعقدة، التي تكمن وراء اكتشاف السمات الزراعية في قصب السكر هي التفاعل الإيبيستاتي بين الأليلات. السمات المرغوبة مثل نقل السكروز وتراكمه معقدة بما فيه الكفاية في النباتات ثنائية الصيغة الصبغية، ناهيك عن قصب السكر متعدد الصيغ الجينية بشكل كبير مع حوالي نسخ من كل كروموسوم. ستساعد التوصيفات وشبكات التماثل في الجينوم الشامل في R570، المقترنة مع تحليلات التعبير التفاضلي الجديدة التي تم تمكينها من خلال هذا العمل، في الكشف عن التنظيم المعقد لعوامل النسخ والعديد من التسلسلات المستهدفة المتطابقة داخل قصب السكر. علاوة على ذلك، فإن إثبات أنه بينما نصف الجينوم متطابق/منهار بين الهبلاي، فإن التسلسل المتبقي هو غير متجانس ويمثل بشكل مفرط بواسطة S. spontaneum سيساعد في تحسين بناء وتصميم علامات جينية لا تعتمد فقط على الفصل لرسم خرائط QTL. بينما يمثل قصب السكر الهجين بين الأنواع أحد أكثر الجينومات النباتية تعقيدًا التي تم تسلسلها على الإطلاق، فمن المحتمل أنه ليس الجينوم الأكثر تعقيدًا الذي يمكن أن تقدمه مملكة النباتات. الاستراتيجيات الموضحة هنا التي تجمع بين تقنيات وتقنيات تسلسل متعددة قابلة للتطبيق على نطاق واسع ويمكن تطبيقها على الجينومات النباتية المعقدة التي سيتم تسلسلها في المستقبل. سيسمح وصف موضع مقاومة Bru1 للأمراض واكتشاف جينات مرشحة قوية تتوافق مع كيناز زائف متسلسل بإجراء تجارب تحقق مستهدفة. تدعم وظيفته الجزيئية المحتملة أن آليات مقاومة الكيناز المتسلسل دائمة وقادرة على حماية المحاصيل الموزعة عالميًا عبر العديد من البيئات. يمثل هذا العمل ذروة تعاون عالمي استمر لعقود بين مربي قصب السكر والباحثين لتطوير موارد جينومية لـ R570 لفهم أفضل لأحد أكثر المحاصيل قيمة في العالم، وهو صنف قصب السكر الهجين الحديث.

المحتوى عبر الإنترنت

أي طرق، مراجع إضافية، ملخصات تقارير Nature Portfolio، بيانات المصدر، بيانات موسعة، معلومات تكملية، شكر وتقدير، معلومات مراجعة الأقران؛ تفاصيل مساهمات المؤلفين والمصالح المتنافسة؛ وبيانات توفر البيانات والرموز متاحة علىhttps://doi.org/10.1038/s41586-024-07231-4.
  1. دينش بابو، ك. س. وآخرون. مراجعة قصيرة عن قصب السكر: استئناسه، التلاعبات الجزيئية وآفاق المستقبل. موارد جينية. تطور المحاصيل 69، 2623-2643 (2022).
  2. ياداف، س. وآخرون. تسريع المكاسب الجينية في تربية قصب السكر باستخدام الاختيار الجينومي. الزراعة 10، 585 (2020).
  3. غريفيت، ل.، غلازمان، ج.-سي. ودونت، أ. في حصاد داروين (تحرير موتلي، ت. ج. وآخرون) 49-66 (جامعة كولومبيا، 2006).
  4. بريمر، ج. مشاكل في تربية وعلم الخلايا لقصب السكر. يوفتيكا 10، 59-78 (1961).
  5. برنر، د. م. ولجندر، ب. ل. نقل الكروموسومات واستقرار الانقسام الميوزي لمشتقات قصب السكر (Saccharum spp.) الهجينة. علوم المحاصيل 33، 600-606 (1993).
  6. فييرا، م. ل. ج. وآخرون. إعادة النظر في الانقسام الميوزي في قصب السكر: عدم انتظامات الكروموسومات وانتشار التكوينات الثنائية. الجينات الأمامية 9، 213 (2018).
  7. أوليفيرا، ج. ك. وآخرون. الشذوذ الميوزي في قصب السكر (Saccharum spp.) والأنواع الأبوية: دليل على الانعكاسات المحيطية والبارامركزية. أن. أبليد. بيول.https://doi.org/ 10.1111/aab. 12855 (2023).
  8. هوار، ج.-ي. وآخرون. التحليل الجيني لنوع حديث من قصب السكر (Saccharum spp.). I. رسم الخرائط الجينومية باستخدام علامات AFLP. نظرية. تطبيق. علم الوراثة 103، 84-97 (2001).
  9. أيتكن، ك. س.، جاكسون، ب. أ. و مكينتاير، س. ل. توفر مجموعة من علامات AFLP و SSR تغطية شاملة للخريطة وتحديد المجموعات المرتبطة المتجانسة (أو المتشابهة) في صنف قصب السكر. نظرية. تطبيق. علم الوراثة. 110، 789-801 (2005).
  10. جانّو، ن.، غريفet، ل.، ديفيد، ج.، دُهُونت، أ. وغلازمان، ج.-سي. تباين في تفضيلات اقتران الكروموسومات أثناء الانقسام الاختزالي في قصب السكر متعدد الصيغ الصبغية كما كشفت عنه العلامات الجزيئية. الوراثة 93، 460-467 (2004).
  11. دومونت، ت. وآخرون. تربية قصب السكر في رينيون: التحديات والإنجازات وآفاق المستقبل. تكنولوجيا السكر 24، 181-192 (2022).
  12. دونت، أ. وآخرون. توصيف الهيكل الجيني المزدوج لأسلاف قصب السكر الحديثة (Saccharum spp.) بواسطة علم الوراثة الجزيئي. مول. جين. جينات. 250، 405-413 (1996).
  13. بايبيريديس، ن. ودي هونت، أ. تم فك شفرة بنية جينوم قصب السكر باستخدام مجسات أوليغو محددة الكروموسومات. مجلة النبات 103، 2039-2051 (2020).
  14. كوست، ل. وآخرون. هيكل الهبلايوت حول Bru1 يكشف عن أساس جيني ضيق لمقاومة الصدأ البني في أصناف قصب السكر الحديثة. نظرية. تطبيق. علم الوراثة. 125، 825-836 (2012).
  15. باركو، أ. س. وآخرون. توزيع وتكرار جين مقاومة الصدأ البني الرئيسي Bru1 في مجموعة قصب السكر العالمية. تربية النباتات. 136، 637-651 (2017).
  16. غارسميور، أ. وآخرون. تسلسل مرجعي أحادي الصيغة الجينية لمجموعة الجينوم المعقدة للغاية لقصب السكر. نات. كوم. 9، 2638 (2018).
  17. سوزا، ج. م. وآخرون. تجميع مساحة الجين 373k من جينوم قصب السكر متعدد الصيغ الصبغية يكشف عن خزانات من التنوع الوظيفي في المحصول الرائد في العالم للكتلة الحيوية. جيغا ساينس 8، giz129 (2019).
  18. شيرمان، ج. ر. وآخرون. مسودة تجميع الجينوم على مستوى الكروموسوم لقصب السكر التجاري. ساينس ريبورت. 12، 20474 (2022).
  19. نرك، س. وآخرون. التسلسل الكامل لجينوم الإنسان. ساينس 376، 44-53 (2022).
  20. سون، هـ. وآخرون. تجميع الجينوم على مستوى الكروموسوم وحل الهجينة لزراعة البطاطس رباعية الصيغة الصبغية. نات. جينت. 54، 342-348 (2022).
  21. أو، س.، تشين، ج. وجيانغ، ن. تقييم جودة تجميع الجينوم باستخدام مؤشر تجميع LTR (LAI). أبحاث الأحماض النووية 46، e126 (2018).
  22. سيمão، ف. أ.، ووترهاوس، ر. م.، إيوانيديس، ب.، كريفنتسيفا، إ. ف. وزدوبنوف، إ. م. BUSCO: تقييم اكتمال تجميع الجينوم والتعليق باستخدام الأورثولوجات ذات النسخة الواحدة. المعلوماتية الحيوية 31، 3210-3212 (2015).
  23. لوفيل، ج. ت. وآخرون. جين سبيس تتبع مناطق الاهتمام وتنوع عدد نسخ الجينات عبر عدة جينومات. إي لايف 11، e78526 (2022).
  24. كوادرا، أ.، أسيفيدو، ر.، مورينو دياث دي لا إسبينا، س.، جوف، ن. ودي لا توري، س. إعادة تشكيل الجينوم في ثلاثة أنواع حديثة من S. officinarum أصناف قصب السكر S. spontaneum. ج. إكسب. بوت. 55، 847-854 (2004).
  25. بايبيريديس، ج.، بايبيريديس، ن. ودي هونت، أ. تحقيق سيتوجينيتيكي جزيئي لتكوين الكروموسومات وانتقالها في قصب السكر. مول. جينت. جينومكس 284، 65-73 (2010).
  26. أيتكن، ك. س. وآخرون. خريطة جينية شاملة للقصب توفر تغطية محسّنة للخريطة وتدمج علامات تقنية مصفوفة التنوع عالية الإنتاجية (DArT). BMC جينوم. 15، 152 (2014).
  27. غارسميور، أ. وآخرون. الحفاظ العالي على الجينات المتجانسة على الرغم من الازدواجية الشديدة في الأوتوبوليبلويد في قصب السكر. نيو فيتولوجي. 189، 629-642 (2011).
  28. فيليلا، م. وآخرون. تحليل ثلاثة مناطق متجانسة/متجانسة من قصب السكر يقترح أحداث تعدد الصبغيات المستقلة لسكروم أوفيسيناروم وسكروم سبونتانيوم. علم الجينوم والتطور 9، 266-278 (2017).
  29. بومبيدور، ن. وآخرون. ثلاثة جينومات سلفية مؤسِّسة متورطة في أصل قصب السكر. آن. بوت. 127، 827-840 (2021).
  30. جانّو، ن. وآخرون. مقارنة الأشكال المتماثلة في منطقة غنية بالجينات بين الأعشاب تكشف عن الاستقرار في الجينوم متعدد الصيغ للسكر. مجلة النبات 50، 574-585 (2007).
  31. تشانغ، ق. وآخرون. رؤى جينومية حول الانخفاض الأخير في الكروموسومات في قصب السكر التلقائي متعدد الصيغ الصبغية Saccharum spontaneum. نات. جينت. 54، 885-896 (2022).
  32. Zhang، ج. وآخرون. الجينوم المحدد بالأليل من قصب السكر التلقائي Saccharum spontaneum L. نات. جينت. 50، 1565-1573 (2018).
  33. كمال، ن. وآخرون. جينوم الشوفان الموزاييك يقدم رؤى حول محصول حبوب صحي بشكل فريد. الطبيعةhttps://doi.org/10.1038/s41586-022-04732-y (2022).
  34. سونغ، ك.، لو، ب.، تانغ، ك. وأوزبورن، ت. سي. التغير السريع في الجينوم في البوليبloid الاصطناعي من براسكا وآثاره على تطور البوليبloid. وقائع الأكاديمية الوطنية للعلوم في الولايات المتحدة الأمريكية 92، 7719-7723 (1995).
  35. ليو، ب. وآخرون. تغييرات جينية سريعة في القمح متعدد الصيغ الوراثية والأنواع ذات الصلة: تداعيات على تطور الجينوم والتحسين الوراثي. مجلة الوراثة والجينوم 36، 519-528 (2009).
  36. لو، إكس. وآخرون. تحليل الفصل بين علامات الميكروساتلايت (SSR) في بوليبلود قصب السكر. جينات. مول. ريس. 14، 18384-18395 (2015).
  37. بايبيريديس، ن. وآخرون. الجينات المقارنة في قصب السكر تمكن من تحسين الخريطة الهيكلية والتحقق من ارتباطات العلامات والسمات. مول. بريد. 21، 233-247 (2008).
  38. ستورناغل، ب. وآخرون. أداة NLR-Annotator تمكّن من توضيح مجموعة مستقبلات المناعة داخل الخلوية. فيزيولوجيا النبات. 183، 468-482 (2020).

مقالة

  1. أيتكن، ك. س.، جاكسون، ب. أ. و مكينتاير، س. ل. تم تحديد مواقع الصفات الكمية للصفات المتعلقة بالسكر في صنف من قصب السكر (Saccharum spp.) سكان سكروم أوفيسيناروم. نظرية. تطبيق. علم الوراثة 112، 1306-1317 (2006).
  2. هوار، ج.-ي. وآخرون. التحليل الجيني لنوع حديث من قصب السكر (Saccharum spp.). II. الكشف عن QTLs لمكونات الإنتاج. نظرية. تطبيق. علم الوراثة 105، 1027-1037 (2002).
  3. مينغ، ر. وآخرون. التحليل الجزيئي للسمات المعقدة في الأوتوبوليبلويد: رسم خرائط QTLs التي تؤثر على إنتاج السكر والسمات ذات الصلة في قصب السكر. نظرية. تطبيق. علم الوراثة. 105، 332-345 (2002).
  4. كوبر، إ. أ. وآخرون. جينوم مرجعي جديد لسورغم بيكولور يكشف عن مستويات عالية من التشابه التسلسلي بين الأنماط الجينية الحلوة والحبوب: تداعيات على وراثيات استقلاب السكر. BMC Genom. 20، 420 (2019).
  5. داوغروس، ج. هـ. وآخرون. جين رئيسي محتمل لمقاومة الصدأ مرتبط بعلامة RFLP في صنف قصب السكر ‘R570’. نظرية. تطبيق. علم الوراثة. 92، 1059-1064 (1996).
  6. Le Cunff، L. وآخرون. رسم خرائط النقل المتناظر ثنائي الصيغة الصبغية/متعدد الصيغة الصبغية والمشي الكروموسومي المحدد بالنمط الوراثي نحو جين مقاومة الصدأ (Bru1) في قصب السكر عالي التعدد الصبغي. علم الوراثة 180، 649-660 (2008).
  7. جيش، ل. أ. وكلارك، س. إ. عائلة كينازات RLK/Pelle. مجلة النبات 66، 117-127 (2011).
  8. بروغمان، ر. وآخرون. جين مقاومة صدأ الساق في الشعير Rpg1 هو جين جديد لمقاومة الأمراض له تشابه مع كينازات المستقبلات. وقائع الأكاديمية الوطنية للعلوم في الولايات المتحدة الأمريكية 99، 9328-9333 (2002).
  9. كليميك، ف. وآخرون. استنساخ جين المقاومة Yr15 من القمح يسلط الضوء على عائلة كيناز-زائف الكيناز المت tandem في النباتات. نات. كوم. 9، 3735 (2018).
  10. لويس، ج. د.، لو، ت.، باستيدو، ب.، غوتمان، د. س. و ديسفيو، د. صعود الأموات الأحياء: الكينازات الزائفة كوسائط للمناعة المحفزة بواسطة المؤثرات. سلوك إشارة النبات. 9، e27563 (2014).
  11. كليميك، ف.، كوكير، ج.، فهيمة، ت. وبوزنياك، ج. ج. تظهر كينازات البروتين المتتالية كمنظمات جديدة لمناعة النباتات. تفاعل النبات والميكروبات الجزيئي 34، 1094-1102 (2021).
ملاحظة الناشر: تظل شركة سبرينجر ناتشر محايدة فيما يتعلق بالمطالبات القضائية في الخرائط المنشورة والانتماءات المؤسسية.
الوصول المفتوح هذه المقالة مرخصة بموجب رخصة المشاع الإبداعي النسب 4.0 الدولية، التي تسمح بالاستخدام والمشاركة والتكيف والتوزيع وإعادة الإنتاج بأي وسيلة أو صيغة، طالما أنك تعطي الائتمان المناسب للمؤلفين الأصليين والمصدر، وتوفر رابطًا لرخصة المشاع الإبداعي، وتوضح ما إذا كانت هناك تغييرات قد أُجريت. الصور أو المواد الأخرى من طرف ثالث في هذه المقالة مشمولة في رخصة المشاع الإبداعي الخاصة بالمقالة، ما لم يُشار إلى خلاف ذلك في سطر الائتمان للمواد. إذا لم تكن المادة مشمولة في رخصة المشاع الإبداعي الخاصة بالمقالة وكان استخدامك المقصود غير مسموح به بموجب اللوائح القانونية أو يتجاوز الاستخدام المسموح به، فستحتاج إلى الحصول على إذن مباشرة من صاحب حقوق الطبع والنشر. لعرض نسخة من هذه الرخصة، قم بزيارةhttp://creativecommons.org/licenses/by/4.0/.
(ج) المؤلف(ون) 2024

طرق

تسلسل الجينوم

مكتبات إلومينا. تم تسلسل مكتبات إلومينا لهذه المخطوطة على مجموعة من منصات إلومينا X10 و HiSeq و NovaSeq. تجميع HipMer والنسل الذاتي (الشكل البياني الممتد 1a): تم بناء مكتبات التسلسل باستخدام مجموعة مكتبات إلومينا TruSeq DNA بدون تفاعل البوليميراز باستخدام البروتوكولات القياسية. تم تسلسل المكتبات على جهاز إلومينا X10 باستخدام نهايات مزدوجة وطول قراءة يبلغ 150 قاعدة.
مكتبات الكروموسومات المفروزة بتدفق فردي. تم بناء مكتبات التسلسل باستخدام مجموعة مكتبة Illumina TruSeq DNA Nano وفقًا للبروتوكولات القياسية. تم تسلسل المكتبات إما على جهاز Illumina HiSeq2500 أو NovaSeq 6000 باستخدام نهايات متزاوجة وطول قراءة يبلغ 150 قاعدة.
المكتبات المتبقية من إلومينا. تم تقطيع شظايا الحمض النووي (DNA) بحجم 400 نقطة أساس (bp) إلى 2 ميكروغرام باستخدام جهاز كوفاريس LE220 وتم اختيار الحجم باستخدام جهاز بيبين (Sage Science). تم معالجة الشظايا بإصلاح الأطراف، وإضافة ذيول A، وربط المحولات المتوافقة مع إلومينا (IDT) باستخدام مجموعة إنشاء مكتبات كابا-إلومينا (KAPA Biosystems). تم قياس المكتبات المعدة باستخدام مجموعة qPCR لمكتبات تسلسل الجيل التالي من كابا بيوسيستمز (Roche) وتم تشغيلها على جهاز PCR الحقيقي من Roche LightCycler 480. ثم تم إعداد المكتبات المقاسة للتسلسل على منصة تسلسل إلومينا HiSeq باستخدام مجموعة TruSeq Rapid للعنقود المزدوج، الإصدار 2، مع جهاز تسلسل HiSeq 2500 لإنشاء خلية تدفق عنقودية للتسلسل. تم إجراء تسلسل خلية التدفق على جهاز تسلسل إلومينا HiSeq 2500 باستخدام مجموعات تسلسل HiSeq Rapid SBS، الإصدار 2، بعد وصفة تشغيل مفهرسة.
مكتبات PacBio. تم بعد ذلك ربط بادئ تسلسل PacBio طويل القراءة المستمر بمكتبة قالب SMRTbell وتم ربط بوليميراز التسلسل بها باستخدام مجموعة ربط Sequel v.2.1. ثم تم تسلسل مكتبات قالب SMRTbell المعدة على جهاز تسلسل Pacific Biosystems Sequel باستخدام بادئ تسلسل v. 3، وخلية واحدة من الجزيئات الحقيقية في الوقت الفعلي v. 2، وكيمياء التسلسل v. 2.1 مع تسلسل أوقات تشغيل الفيديو. تم إجراء تسلسل PacBio HiFi باستخدام وضع التسلسل التوافقي الدائري (CCS) على جهاز PacBio Sequel II. تم تقطيع الحمض النووي عالي الوزن الجزيئي إما باستخدام إبرة أو باستخدام جهاز Diagenode Megaruptor 3. تم بناء المكتبات باستخدام مجموعة تحضير القالب SMRTbell v.2.0 وتم تحديد حجمها بدقة على جهاز SAGE ELF. تم إجراء التسلسل باستخدام وقت فيديو مدته 30 ساعة مع تمديد مسبق لمدة ساعتين وتم معالجة البيانات الخام الناتجة باستخدام خوارزمية CCS4.
مكتبات RNA-seq. تم إجراء تسلسل RNA-Seq من إلومينا مع تحضير عينات RNA المعتمد على الألواح واختيار البوليمر (A) باستخدام نظام التعامل مع السوائل الروبوتي PerkinElmer Sciclone NGS، باستخدام مجموعة تحضير عينات TruSeq Stranded mRNA HT من إلومينا مع اختيار البوليمر (A) لـ mRNA وفقًا للبروتوكول الموضح من قبل إلومينا في دليل المستخدم الخاص بهم:https://support. illumina.com/sequencing/sequencing_kits/truseq-stranded-mrna.html، ومع الشروط التالية: كان إجمالي مادة RNA الابتدائية 1 ميكروغرام لكل عينة وتم استخدام ثمانية دورات من PCR لتكبير المكتبة. تم قياس المكتبات المعدة باستخدام مجموعة qPCR لمكتبات التسلسل من KAPA Biosystems وتم تشغيلها على جهاز PCR الزمني الحقيقي Roche LightCycler 480. تم إجراء تسلسل الخلية الجارية على جهاز تسلسل Illumina NovaSeq باستخدام مجموعات كواشف NovaSeq XP v. 1 وخلية جارية S4، وفقًا لـ وصفة تشغيل مؤشرة bp.
الهجين في الموقع للكروموسومات. تم إجراء تحضيرات الطور الاستوائي الانقسامي للكروموسومات والهجين في الموقع بالفلوريسنس كما هو موضح في المرجع 13. تم تصميم مجس محدد للرترو-ترانسپوزون S. spontaneum بواسطة Arbor Biosciences باستخدام برنامجها الخاص بناءً على تسلسلات الرترو-ترانسپوزون كما هو موضح في المرجع 50. كانت المجسات إما موسومة بالفلوركرومات ATTO 488 أو ATTO 550.
تحضير الكروموسومات المفصولة بتدفق فردي. تم قطع سيقان النباتات البالغة إلى قطع فردية تحتوي على برعم واحد، وتم تنظيفها ونقعها في محلول الكاربندازيم لمدة 24 ساعة، موضوعة في صينية بلاستيكية، مغطاة بالبيرلايت الرطب ومحتفظ بها في الحضانة عند في الظلام، حتى أصبحت الجذور بطول حوالي 1.5 سم. من أجل تزامن دورة الخلية وتراكم الطور الاستوائي، تم غسل الأجزاء في ثم تم نقله إلى صينية بلاستيكية مملوءة بـ محلول هوغلاند يحتوي على الهيدروكسي يوريا وتم حضنه عند 25 أو لمدة 18 ساعة في الظلام. بعد علاج استعادة لمدة ساعتين، تم غمر الجذور في محلول أميبروفوس ميثيل وتم حضنه لمدة 3 ساعات عند 25 أو تم إعداد تعليقات للكروموسومات السليمة عن طريق التماثل الميكانيكي لنهايات الجذور المثبتة بـ الفورمالديهايد و ترايتون X-100، وتم صبغه بـ 6-دياميدينو-2-فينيل إندول ثنائي الهيدروكلوريد (DAPI) . الأداة المستخدمة في فرز التدفق كانت جهاز تحليل الخلايا FACSAria II SORP (BD Biosciences) وجهاز فرز الخلايا Beckman Coulter MoFlo AstriosEQ (Beckman Coulter). البرنامج المستخدم كان FACSDiva v.6.1.3 (BD Biosciences) وSummit v.6.2.2 (Beckman Coulter). بالنسبة لفرز الكروموسومات، تم ضبط البوابة الأولية على الرسوم النقطية DAPI-A مقابل FSC-A وتم ضبط بوابة الفرز النهائية على الرسوم النقطية DAPI-A مقابل DAPI-W لاستبعاد الكروموسومات المزدوجة (الشكل التكميلي 15). تم تحديد هوية الفئات المفرزة بالتدفق من خلال المجهر الفلوري للكروموسومات المفرزة على شرائح المجهر. أظهر التحليل أنه يمكن فصل الكروموسومات إلى عدد قليل من فئات الحجم، وعلى الرغم من أن السكان المفصولين كانوا 100% من الكروموسومات النقية، لم يكن من الممكن فرز الكروموسومات الفردية من قصب السكر. للتغلب على هذه المشكلة وتحضير عينات من الحمض النووي المحدد للكروموسومات للتسلسل، تم فرز نسخ فردية من الكروموسومات وتم تضخيم الحمض النووي الخاص بها. تم وصف هذه الاستراتيجية لتحضير كروموسومات قصب السكر لقياس التدفق الخلوي لأول مرة في المرجع 51 وهي تعديل للبروتوكول الموصوف في المرجع 53.
بناء خريطة بصرية. تم عزل الحمض النووي عالي الوزن الجزيئي للغاية (uHMW) من نوى مدفونة في الأجار كما هو موصوف سابقًا في المرجع 54 مع بعض التعديلات. تم جمع حوالي 2 جرام من أوراق R570 الشابة والصحية وتجميدها بسرعة في أنبوب مخروطي سعة 50 مل، وطحنها في هاون مع النيتروجين السائل وتمت معالجتها لفترة وجيزة في محلول تجانس Bionano (HB+؛ مجموعة عزل الحمض النووي من Bionano؛ Bionano Genomics). تم تصفية حطام الخلايا عن طريق تمرير المستحلب بشكل متسلسل عبر و مصفاة الخلايا. تم ترسيب النوى في التعليق بواسطة الطرد المركزي عند في لمدة 20 دقيقة، أعيد تعليقها في 3 مل من محلول التماثل HB + وتم تعريضها لعملية الطرد المركزي بتدرج الكثافة غير المتواصل كما هو موضح في بروتوكول عزل الحمض النووي من الأنسجة النباتية (النسخة D؛ Bionano Genomics). تم استرداد طبقة الطور البيني الغنية بالنوى، وتم ترسيبها وتضمينها في أغاروز منخفض نقطة الانصهار باستخدام قالب توصيل كهربائي CHEFgel (بايو راد). تم حضانة القابس الناتج مرتين، لمدة إجمالية قدرها 12 ساعة في ، في محلول تحليل بيو نانو المضاف إليه بروتيناز K من Puregene، تم غسله أربع مرات في محلول غسيل Bionano وخمس مرات في محلول TE. تم استعادة الحمض النووي غير المتجانس عالي الوزن الجزيئي عن طريق إذابة وهضم القابس باستخدام الأجاراز. ، تليها غسيل الكلى. في المجموع، حوالي تم استرداد الحمض النووي عالي الوزن الجزيئي uHMW بتركيز واستخدمت لعمليات رسم الخرائط الجينومية اللاحقة.
تم إجراء رسم الخرائط الجينومية باستخدام كيمياء التسمية المباشرة والتلوين من Bionano Genomics في جهاز Bionano Saphyr، باستخدام الطريقة الموضحة في المرجع 55، مع بعض التعديلات. تم استخدام حوالي 800 نانوغرام من الحمض النووي عالي الوزن الجزيئي غير المتجانس لكل تفاعل وتم تحميل إجمالي ثمانية خلايا تدفق لجمع الجزيئات بطول إجمالي مشترك من مجموعة فرعية من تم اختيار جزيئات بطول أدنى يبلغ 450 كيلوبايت، وN50 يبلغ 547 كيلوبايت للتجميع. كان الطول الإجمالي النهائي للمجموعة المفلترة 1,097,878,758 قاعدة، مع تقدير التغطية الفعالة للتجميع لـ .
تم إجراء تجميع الجينوم باستخدام منصة برمجيات Bionano Genomics Access (أدوات Bionano الإصدار 1.3.8041.8044؛ Bionano Solve الإصدار 3.3_10252018)، مع تشغيل خط الأنابيب الإصدار 7981 وRefAligner.
v.7989. تم إجراء تجميعين منفصلين باستخدام معلمات optArguments_nonhaplotype_noES_BG_DLE1_saphyr.xml. تم إجراء التجميع الأول بدون قطع المناطق متعددة المسارات المعقدة (CMPR) وأنتج 570 خريطة بطول N50 يبلغ 36.444 ميجاباز. والطول الإجمالي للخريطة هو 7,654.039 ميجاباز. تم إجراء تجميع إضافي باستخدام خيار قطع CMPR، الذي يقدم قطعًا في الخرائط عند التكرارات المحتملة لتقليل التبديل المحتمل بين الهومولوج والطور. التجميع الممكّن بقطع CMPR أنتج 1,512 خريطة بطول N50 يبلغ 9.546 ميجاباز والطول الإجمالي للخريطة هو .
تم إنشاء هياكل هجينة من PacBio HiFi Bionano باستخدام برنامج Bionano Genomics Access (الأدوات الإصدار 1.3) وملف التكوين DLE-1 hybridScaffold_DLE1_config.xml باستخدام حل النزاعات التلقائي. في المجموع، تم التقاط الجينوم في 122 هيكل هجيني (N50 للهيكل = 78.823 وأقصى حجم للهيكل 131.769 ميجاباز). كان الطول الإجمالي للهيكل هو مع بقاء 4.9 ميجاباز من التسلسل غير مُنظّم.
نظرة عامة على تجميع الجينوم. كان من المستحيل الحصول على تمثيل كامل لجميع التسلسلات في جينوم R570 الذي يبلغ حجمه 10 جيجابايت دون تكرار اصطناعي للتسلسلات المنهارة، والتي توجد بكثرة. لتجميع القطع في الكروموسومات، استخدمنا خمس تقنيات مكملة (البيانات التكميلية). أولاً، استخدمنا خريطة بيو نانو البصرية لترتيب القطع في البداية إلى هياكل طويلة المدى. ثانياً، تم تجميع الهياكل في مجموعات متجانسة بناءً على 237 مجموعة ارتباط تم إنشاؤها من حوالي 1.8 مليون علامة بسيطة تم اختبارها من 96 نسل ذاتي التلقيح. ثالثاً، تم إجراء تجميع إضافي باستخدام علامات وراثية مشتقة من مكتبات كروموسوم مفصول بالتدفق تم تسلسلها من R570 (المراجع 52، 53). بعد إجراء الانضمامات الأولية، تم إعادة محاذاة كل من العلامات البسيطة وعلامات الكروموسوم الفردي إلى الكروموسومات المحتملة للتحقق من الانضمامات الخاطئة، والتي تم كسرها وتصحيحها. رابعاً، قمنا بحل الهياكل المتداخلة من خلال التحقق من مجموعات متكررة متوازية من نماذج جينات Sorghum bicolor التي تم رسمها ضد القطع باستخدام pblat. مع المعلمات الافتراضية. أخيرًا، قمنا بتقييم الروابط الكروماتينية يدويًا من 558 جيجابايت (تقريبًا ) بيانات للتحقق يدويًا من الانضمامات التي تمت بين السقالات أثناء بناء الكروموسومات (الشكل البياني الممتد 1a). التجميع الأساسي المتواصل للغاية ( contig N50؛ 67 كروموسوم) تشمل أيضًا السقالات البصرية (‘os’; ) والسقالات غير المثبتة ( ). تحتوي المجموعة الأساسية على فجوات مع مؤشر تجميع LTR (LAI؛ مقياس العناصر LTR السليمة) بقيمة 22.82، مما يشير إلى أن التجميع عالي الجودة وكامل. حيثما كان ذلك ممكنًا، التجميع البديل ( contig N50؛ يتكون من هابلوتايب متطابقة تقريبًا في التجميع الأساسي؛ تم مناقشته في البيانات التكميلية)، تم تثبيته جسديًا على الكروموسوم الأكثر تشابهًا في التجميع الأساسي بناءً على أفضل محاذاة فريدة باستخدام minimap2 (الإصدار 2.20-r1061) تم ترك القطع والهياكل التي لم يكن لديها أفضل محاذاة فريدة واحدة غير مثبتة. يجب ملاحظة أن هذه المجموعة المستندة إلى تشابه التسلسل لا تشير إلى أن القطع الموجودة على هياكل بديلة تحمل نفس الاسم (على سبيل المثال، Chr6E وChr6E_alt) تأتي بالضرورة من نفس النمط الجيني البيولوجي. وبالتالي، نقدم الهياكل البديلة لتمثيل مجموعة التسلسلات الكاملة في R570، وليس كمصدر للمقارنات العالمية ضد الجينومات المرجعية الأساسية أو الأخرى.
الأنماط الوراثية المنهارة. لتحديد أي المناطق من الجينوم كانت متطابقة تمامًا وانهارت في نمط وراثي واحد (على عكس التجميع البديل الذي يحتوي على أنماط وراثية متطابقة تقريبًا، والتي يمكن تمييزها بواسطة المجمع ولكن غالبًا لا يمكن تمييزها من خلال مواضع قراءة HiFi الفريدة)، تم إعادة محاذاة قراءات PacBio HiFi مرة أخرى إلى التجميع باستخدام minimap2 (المرجع 57) (المعلمات: -M 0 –secondary=no –hard-mask-level -t30 -x asm5). تم حساب تغطية القراءة (السكريبت: combinePAFsAndCount.R) باستخدام السكريبت: بالنسبة إلى العمق الوسيط (37) لكل نافذة 10 كيلوبايت، مع تجاهل المناطق المتكررة حيث كانت التغطية الوسيطة أكبر من خمسة (أكبر من التغطية الخام). تصنيفات العمق ( تم حسابها من الوسيط
نطاقات التغطية ، (3.5-5.0))، استنادًا إلى قمم المدرج التكراري. تم تحويل تصنيفات العمق لكل نافذة 10 كيلوبايت إلى ما يعادلها من طول التشغيل باستخدام البرنامج النصي: convertCountsToRLEs.R. لضمان تمثيل دقيق للأنماط الوراثية، NucFreq تم استخدامه لتحليل المناطق التي تم فيها دمج الأنماط الوراثية مناطق العمق؛ حوالي 1.2 جيجابايت من تسلسل الجينوم الأساسي). باختصار، تم محاذاة قراءات HiFi إلى التجميع الأساسي والبديل المشترك باستخدام pbmm2 (الإصدار 1.1.0؛ المعلمات: –log-level DEBUG –preset SUBREAD –min-length 5,000 –sort). سام تولز ثم تم استخدامه لدمج ملفات bam الفردية (من كل عملية تسلسل HiFi) واستبعاد القراءات غير الموجهة والمحاذاة التكميلية. (samtools view-F 2308). تم تحويل ملف تغطية NucFreq الناتج (obed) إلى مكافئات طول التشغيل (السكريبت: RLEruns.R)، حيث كانت استدعاءات القواعد البديلة أكبر من 20% من التغطية المجمعة. لضمان تغطية كافية للتحليل، تم استبعاد المناطق ذات عمق البيانات الخارجة عن النطاقات المتطرفة التي تتجاوز النسب المئوية العاشرة والتسعين. بالإضافة إلى ذلك، تم استبعاد المناطق التكرارية من الجينوم (95% تكرارية، مقنعة باستخدام 24 مر و10 كيلوبايت حيث كانت أكبر من تم استبعاد القواعد التي تم توضيحها كـ retrotransposons (من تحليل LAI) باستخدام أدوات BED. اطرح. من حوالي 1.2 جيجابايت المدروسة، حوالي 4.8 ميجابايت من التسلسل ( من المناطق المدروسة؛ 0.1% من القواعد داخل الكروموسومات الأولية المُنشأة) تبدو أنها تحتوي على هابلوطايبات متداخلة غير متطابقة، مدفوعة بشكل رئيسي بمناطق متداخلة ذات عمق عالٍ ( مناطق العمق من القواعد؛ مناطق العمق من القواعد).
توصيف الجينوم. تم توصيف نماذج الجينات باستخدام خط أنابيب PERTRAN الخاص بنا (الموصوف بالتفصيل في المرجع 60 باستخدام حوالي 3.7 مليار زوج من قراءات تسلسل RNA-seq مزدوجة النهاية من Illumina و31 مليون قراءة CCS من PacBio Iso-Seq. باختصار، يقوم PERTRAN بإجراء تجميع قصير للترانسكربتوم موجه بواسطة الجينوم عبر GSNAP (الإصدار 2013-09-30) ويبني رسومات محاذاة الانزلاق بعد التحقق من المحاذاة، وإعادة المحاذاة، والتصحيح. تم تصحيح حوالي 1.5 مليون من النسخ المحتملة الكاملة الطول وتبسيطها بواسطة خط أنابيب تصحيح موجه بواسطة الجينوم، الذي يقوم بمحاذاة قراءات CCS إلى الجينوم باستخدام GMAP. مع تصحيح الإنترونات للانحرافات الصغيرة في نقاط الربط إذا وجدت وتوافق الكتل عندما تكون جميع الإنترونات متطابقة أو تتداخل بنسبة 95% ل exon واحد. بعد ذلك، تم بناء 1,763,610 تجميعات للنسخ باستخدام PASA (الإصدار 2.0.2) من تجميعات النسخ RNA-seq المذكورة أعلاه. تم دعم التشابه من خلال المحاذاة مع 17 جينومًا متاحة للجمهور وبروتينات Swiss-Prot. تم توقع نماذج الجينات بواسطة متنبئين قائمين على التشابه، FGENESH+ (الإصدار 3.1.0) FGENESH EST (مشابه لـ FGENESH+، ولكن باستخدام تسلسلات التعبير المعبر عنها (ESTs) لحساب مواقع الربط ومدخلات الإنترونات بدلاً من البروتينات/إطارات القراءة المفتوحة المترجمة (ORFs) وEXONERATE (الإصدار 2.4.0) تجميع PASA ORFs (أداة داخلية للعثور على ORF مع قيود التشابه) ومن AUGUSTUS (الإصدار 3.1.0) تم تدريبها بواسطة ORFs تجميع PASA عالي الثقة ومع تلميحات الإنترونات من محاذاة القراءات القصيرة. قمنا بتحسين هذه التوصيفات الأولية من خلال مقارنة التسلسلات وجودة الجينات بين تحت الجينوم R570 عن طريق محاذاة نماذج الجينات عالية الجودة بين تحت الجينوم وتشكيل نماذج الجينات من المحاذاة داخل الجينوم. قمنا بمقارنة الدرجات بين هذه النماذج المعتمدة على التماثل داخل الجينوم وتجميعات PASA؛ تم الاحتفاظ بالنماذج المدعومة بالتماثل ذات الدرجات الأعلى التي لم تتعارض مع أدلة النسخ لاستبدال النسخ الجزئية الموجودة. كانت النماذج الجينية المختارة خاضعة لتحليل Pfam ونماذج الجينات التي تزيد عن تمت إزالة مجالات Pfam TE. كما قمنا بإزالة (1) النماذج الجينية غير المكتملة، (2) المدعومة بتماثل منخفض دون دعم كامل من النسخ الجينية، و(3) النماذج الجينية القصيرة ذات الإكسون الواحد (أقل من 300 قاعدة بيانية CDS) دون دعم من مجال البروتين أو النسخ. تم تعريف التسلسلات المتكررة باستخدام طريقة de novo بواسطة RepeatModeler (الإصدار open1.0.11). وتسلسلات التكرار المعروفة في RepBase.
علم الجينوم المقارن. الأورثولوجات المتناظرة بين التوصيف الأساسي R570، S. bicolor (الإصدار 3.1) س. سبونتانيوم (النوع الجيني AP85-441) سيتاريا فيريديس (الإصدار 2.1) وطريق R570 أحادي الصيغة تم استنتاجها
عبر GENESPACE (الإصدار 0.9.4) خط أنابيب باستخدام المعلمات الافتراضية (برنامج التحليل: genespaceCommands.R). باختصار، يقوم GENESPACE بمقارنة درجات تشابه البروتينات ضمن كتل متجانسة باستخدام MCScan X. ويستخدم أورثوفايندر (الإصدار 2.5.4) للبحث عن الأشكال المتجانسة/المتوازية ضمن الكتل المقيدة بالتناظر. تم استخدام الكتل المتناظرة للاستعلام عن الفروق بين الببتيدات الزوجية بين الأليلات الأصلية، وتحديد التباين بين الأشكال المتجانسة الأصلية باستخدام نقاط التناظر لـ S. bicolor والبحث عن مجموعات الأشكال المتجانسة المحددة للأصل (البرامج النصية، PID_calc.R؛ GENESPACE_orthogroupParsing.R؛ دفتر Jupyter: r570_orthogroupProgenitorAnalysis_forSupp.ipynb).
الطفرات الهيكلية. لتحديد التغيرات الهيكلية الكبيرة (الانعكاسات، الانتقالات والانتقالات المعكوسة) والتغيرات المحلية (الإضافات والحذف)، تم محاذاة كل مجموعة كروموسومية متجانسة (B، C، D، E، F، G) مع الكروموسوم A باستخدام minimap2 (الإصدار 2.20-r1061). مع إعداد المعاملات ‘-ax asm5 -eqx’. تم استخدام المحاذاة الناتجة لتحديد التغيرات الهيكلية باستخدام SyRI (الإصدار 1.6) تم استخدام التعليق التوضيحي gff3 للحصول على الجينات المتأثرة بالتغيرات بين الكروموسومات المتجانسة.
تنوع المجموعات المتجانسة. تم حساب متوسط الفروق الزوجية بين المتجانسات المحددة من السلف من خلال استخراج جميع التركيبات الزوجية من الأليلات المعينة للسلف داخل المجموعات المتجانسة التي تم تثبيتها بواسطة نظير S. bicolor. من بين هذه، تم اختيار 25,000 زوج من الببتيدات لكل سلف بشكل عشوائي وتم محاذاتها زوجياً باستخدام حزمة R Biostrings (الإصدار 2.70.2). تم حساب الهوية الزوجية بناءً على المطابقات/طول المحاذاة (PID2؛ البرنامج النصي PID_calc.R). تم إجراء محاذاة متعددة التسلسلات بين المجموعات المتجانسة للأورثوغروبات لمرشحي جينات نقل السكر باستخدام MAFFT (الإصدار 7.487). وتم تصورها باستخدام ggmsa (نص MSAalignmentPlots.R). تم حساب درجات الطي لكل ببتيد باستخدام ESMfold (الإصدار 2.0.1) .
نظائر جينات المقاومة. تم توضيح RGAs على السقالات التي تزيد عن 10 ميغابايت باستخدام NLR-Annotator (الإصدار 2) باستخدام المعلمات الافتراضية. تم تعيين 4,116 RGA المتوقعة (الجدول التكميلي 11) إلى السلفيات من خلال تقاطع موقع كل نمط مع كتل تعيين السلفيات (الجدول التكميلي 6).
تباين السلف. لتحديد معدل الاستبدال المحايد بين S. officinarum و S. spontaneum، تم استخراج 45,000 زوج عشوائي من الجينات المتجانسة من جميع التركيبات الثنائية للأليلات المعينة للسلف. ) ضمن مجموعات الأورثوغروب S. bicolor. تم محاذاة أزواج تسلسل الببتيد باستخدام MAFFT (الإصدار 7.487) وتم تحويله إلى تسلسل الترميز (CDS) باستخدام pal2nal (الإصدار 13) تم حساب معدلات الطفرات المتطابقة بالزوج (Ks) بين التسلسلات باستخدام seqinr (الإصدار 4.2-16) ، العثور على قمة طفرات مرادفة واحدة (ks) عند 0.012 (الشكل التوضيحي 13). بافتراض معدل طفرات نووية محايد من إلى (المرجع 78)، انقسمت S. officinarum و S. spontaneum تقريبًا مليون سنة مضت.
خرائط جينية وفيزيائية لـ Bru1. قمنا بتطوير نهج استنساخ قائم على الخرائط يتكيف مع السياق العالي التعدد الصبغي لقصب السكر لاستهداف جين مقاومة الصدأ الرئيسي المستدام Bru1. تم إجراء مسح كروموسومي محدد النمط من خلال رسم خرائط جينية دقيقة تستغل 2,383 فردًا من نسل ذاتي لـ R570 ورسم خرائط فيزيائية تستغل مكتبتين من BAC. تضمنت الخريطة الجينية عالية الدقة للمنطقة المستهدفة علامات جانبية لـ Bru1 (عند 0.14 و 0.28 سم)، و13 علامة مترافقة، وكانت الخريطة الفيزيائية الجزئية لـ BAC للنمط الوراثي المستهدف تتضمن فجوتين. ; الشكل 3ب. لإكمال الخريطة الفيزيائية لنمط Bru1 المستهدف، قمنا بإنشاء مكتبة BAC جديدة (باستخدام إنزيم BamHI) باستخدام مزيج من الحمض النووي لأربعة أفراد مقاومين للبني-صدأ من مجموعة R570 S1. احتوت مكتبة BAC على 119,040 مستنسخًا بمتوسط حجم إدخال يبلغ 130 كيلوبايت وغطت 3.2 ضعف النمط المستهدف و1.6 ضعف الجينوم الكلي.
تم عزل نهايات BAC ونسخ BAC الفرعية من الأربعة BACs (CIR009O20، 022M06، CIR012E03 و164H22) المحيطة بالفجوتين المتبقيتين (‘اليسار’ و’اليمين’) في الخريطة الفيزيائية لنمط Bru1 الوراثي، واستخدمت للمشي الكروموسومي (كما هو موضح في المرجع 44). تم تحديد وتسلسل BACين (CIRB251D13 (150 كيلوبايت) وCIRB286F09 (130 كيلوبايت)) لملء الفجوة اليمنى. خمسة BACs (CIRB009N07 (100 كيلوبايت)، CIRB114G05 (100 كيلوبايت)، CIRB127D08 (125 كيلوبايت)، CIRB210D07 (105 كيلوبايت) وCIRB236L05 (150 كيلوبايت)) قللت حجم الفجوة اليسرى بمقدار 35 كيلوبايت، لكن فجوة غير محددة بقيت. امتد تجميع جينوم R570 عبر كامل منطقة نمط Bru1 المستهدف مع كونتيغ واحد، مغلقًا الفجوة اليسرى. ) مما يتيح دراسة جميع الجينات المرشحة في المنطقة (الشكل 3ب).
جينات المرشحة Bru1. تم توضيح النمط الجيني المملوء بالفراغات المستهدف الذي يمثل 0.42 سم و 309 كيلوبايت يدويًا، متنبئًا بإجمالي 13 جينًا (الشكل 3ب والجدول التكميلي 13). كانت تسعة من هذه الجينات موجودة أيضًا في جميع أو بعض من BACs/ الأنماط الجينية المتجانسة في جينوم R570. كانت ثلاثة من الجينات المختارة موجودة فقط في الإدخال المحدد لنمط Bru1. كانت الجينات الأخرى المعلنة على مستوى الجينوم بالكامل (SoffiXsponR570.03Dg024000؛ SoffiXsponR570.03Dg024100؛ SoffiXsponR570.03Dg024600؛ SoffiXsponR570.03Dg024700) في المنطقة قصيرة، وببتيدات أحادية الإكسون، إما أنها لم تحتوي على مجالات بروتينية أو بدت كعناصر قابلة للنقل، وبالتالي لم يتم دعمها في قائمة الجينات المرشحة المختارة (الجدول التكميلي 13). من بين 13 جينًا متوقعًا، بحثنا عن جينات أظهرت تجانسًا عاليًا مع الجينات التي تم إثبات مشاركتها بالفعل في آليات المقاومة. حددنا خمسة من هذه الجينات، أربعة منها ترمز لإنزيمات كيناز السيرين/الثريونين (الجينات 1 و5 و7 و8) وجين واحد يرمز لإنزيم الإندوجلوكاناز (الجين 13). تم تحسين تصنيف هذه الجينات يدويًا من خلال تحليل النشوء والتطور الذي شمل جينات ذات تجانس عالي من نباتات أخرى موجودة في قواعد البيانات وبحث عن مجالات بروتينية وظيفية محفوظة.
الجين 13، الذي يشفر إنزيم الإندوجلوكانيز، يتكون من 3 إكسونات واثنين من الإنترونات بحجم جينومي يبلغ 1.8 كيلوبايت لنسخة متوقعة بحجم 1.5 كيلوبايت. أظهرت محاذاة التسلسل والتحليلات النشئية التي أجريت مع الإندوجلوكانيز بيتا-1-4 والإندوجلوكانيز بيتا-1-3 من أحاديات الفلقة وثنائيات الفلقة أن الجين 13 ينتمي إلى الإندوجلوكانيز بيتا-1-4. يقدم هذا الجين تشابهًا عاليًا (أكبر من ) مع بيتا-1-4 إندوغلوكاناز من نباتات أخرى ولديه أعلى تشابه ( الهوية، تغطية 100% مع الجين المتجانس لميسكانثوس (CAD6248271.1). تشارك إنزيمات بيتا-1-4 إندوغلوكاناز في تطوير الخلايا. بشكل خاص على استطالة جدار الخلية لكن لم يتم الإبلاغ عن مشاركتها في مقاومة الأمراض. وهذا يشير إلى أن هذا الجين ليس مرشحًا جيدًا ليكون Bru1.
الجين 1 يتكون من ثمانية إكسونات وسبعة إنترونات. حجمه الجينومي هو 4.3 كيلوبايت وحجم منطقة الترميز هو 882 قاعدة. البروتين المشفر بواسطة الجين لديه الهوية ( التغطية) مع كيناز مرتبط بالتحكم في انقسام الخلايا في السورغم (XP_002451427.1) وبالتالي، لم يبدو أنه مرشح جيد.
يتكون الجين 5 من ستة إكسونات وخمسة إنترونات. كان حجمه الجينومي 1.1 كيلوبايت وحجم CDS المتوقع 534 قاعدة. أظهر محاذاة تسلسل الأحماض الأمينية مع قاعدة بيانات مجالات البروتين المحفوظة Interpro أن جزءًا فقط من البروتين (الإكسونات 4 إلى 6) له تشابه مع المجالات الفرعية VIb إلى XI من كينازات السيرين/الثريونين. وبالتالي، لم يكن هذا الكيناز السيريني/الثريونيني مكتملًا، حيث كان يفتقر إلى بعض المجالات الفرعية الوظيفية وظهر كجين زائف. لذلك، لم يبدو أنه مرشح جيد.
يتكون الجين 7 من ستة إكسونات وخمسة إنترونات، بينما يحتوي الجين 8 على أربعة إكسونات وثلاثة إنترونات. كلاهما يظهر توافُقًا مع كينازات شبيهة بالمستقبلات. أظهرت التوصيفات الخاصة بالنطاقات البروتينية المحفوظة أن الجين 7 يحتوي على جميع الـ 12 نطاقًا فرعيًا من الكينازات وبالتالي يمكن أن يشفر بروتينًا وظيفيًا، بينما يحتوي الجين 8 على جزء فقط من هذه النطاقات الفرعية (من I إلى VII) وقد يت correspond إلى كيناز زائف. التصنيف باستخدام قاعدة بيانات ITAK (http://itak.feilab.net/cgi-bin/itak/index.cgi)
كشفت أنهما ينتميان إلى عائلة RLK-PELLE-DSLV ، نفس العائلة التي ينتمي إليها جين مقاومة صدأ الشعير (RPG1 (المرجع 46)) وجين مقاومة صدأ القمح الأصفر (Yr15 (المرجع 47)) الذي ثبت أنه كيناز مزدوج-كيناز زائف (TKP). بالإضافة إلى ذلك، فإن الإنترون الثالث من الجين 7 له حجم كبير جداً يبلغ حوالي 11 كيلوبايت، بما في ذلك عنصر وراثي كبير، وهي بنية خاصة مشتركة مع TKPs RPG1 وYr15. Bru1، مثل RPG1 و يعتبر من الجينات النادرة نسبيًا التي تمنح مقاومة فطرية دائمة. لذا فإن هذا الكيناز المتسلسل – الكيناز الزائف (TKP7 و TKP8) هو مرشح قوي لجين Bru1.

ملخص التقرير

معلومات إضافية حول تصميم البحث متاحة في ملخص تقارير مجموعة نيتشر المرتبط بهذه المقالة.

توفر البيانات

يمكن العثور على أعمال إضافية لدعم نتائج هذه المخطوطة في قسم البيانات التكميلية. المكتبات التسلسلية (DNA/RNA من إلومينا وقراءة طويلة مستمرة من باك بايو/هاي فاي) متاحة للجمهور ضمن أرشيف قراءة التسلسل (SRA). تم توفير مشاريع البيولوجيا وأرقام الوصول الفردية في الجدول التكميلية 14. تجميع الجينوم والتعليق على التجميع الأساسي متاح مجانًا على Phytozome.https://phytozome-next.jgi.doe.gov/“). تم إيداع مشروع تسلسل الجينوم الكامل هذا في DDBJ/ENA/GenBank تحت الرقم JAQSUU000000000. النسخة الموصوفة في هذه الورقة هي JAQSUU010000000. يمكن تنزيل الجينومات المتاحة للجمهور المستخدمة في علم الجينوم المقارن من هنا: Setaria viridis (v.2.1؛https://phytozome-next.jgi.doe.gov/info/Sviridis_v2_1), الدخن ثنائي اللون (الإصدار 3.1؛ https://phytozome-next.jgi.doe.gov/info/Sbicolor_v3_1_1), مسار تيلينغ أحادي الصبغة R570 (http://sugarcane-genome. cirad.fr) وسكران عفوي (http://www.life.illinois.edu/ming/downloads/Spontaneum_genome/). البيانات الخام المستخدمة في التحليل في هذه الورقة متاحة مجانًا على figshare (https://doi.org/10.6084/المصدر: m9.figshare.22138004). تم توفير بيانات المصدر مع هذه الورقة.

توفر الشيفرة

البرمجيات وملفات البيانات المستخدمة في التحليل في هذه الورقة متاحة مجانًا على فيغشير (https://doi.org/10.6084/m9.figshare.22138004) وعلى GitHub (https://github.com/a-healey/r570scripts).
50. هوانغ، ي. وآخرون. العناصر الراجعة الوفيرة المحددة للأنواع توضح التركيب الجيني لأسلاف قصب السكر الحديثة. كروموسوما 129، 45-55 (2020).
51. ميتكالف، سي. جي. وآخرون. التوصيف باستخدام تقنية تحليل تدفق الخلايا للجينوم المعقد متعدد الصيغ الصبغية لقصب السكر (Saccharum officinarum) وسلالات قصب السكر الحديثة. تقارير العلوم 9، 19362 (2019).
52. ميتكالف، سي. جي. وآخرون. عزل وتسلسل نسخة واحدة من كروموسوم مدخل من جينوم معقد لتحديد الجينات والـ SNP. نظرية. تطبيق. علم الوراثة 135، 1279-1292 (2022).
53. فرانا، ج. وآخرون. فرز الكروموسومات باستخدام تقنية تحليل تدفق الخلايا في النباتات: الجيل القادم. طرق 57، 331-337 (2012).
54. فولجر، م. ر. وآخرون. تسلسل طويل القراءة وتجميع التكرارات القطاعية. نات. ميثودز 16، 88-94 (2019).
55. هافورد، م. ب. وآخرون. تجميع جديد، توضيح وتحليل مقارن لـ 26 جينوم متنوع من الذرة. ساينس 373، 655-662 (2021).
56. وانغ، م. وكونغ، ل. pblat: خوارزمية blat متعددة الخيوط تسرع محاذاة التسلسلات إلى الجينومات. BMC Bioinformatics 20، 28 (2019).
57. لي، هـ. ميني ماب 2: المحاذاة الزوجية لتسلسلات النوكليوتيدات. المعلوماتية الحيوية 34، 3094-3100 (2018).
58. لي، هـ. وآخرون. تنسيق المحاذاة/الخريطة وSAMtools. المعلوماتية الحيوية 25، 2078-2079 (2009).
59. كوينلان، أ. ر. BEDTools: الأداة متعددة الاستخدامات لتحليل ميزات الجينوم. بروتوكولات حالية. المعلوماتية الحيوية 47، 11.12.1-34 (2014).
60. لوفيل، ج. ت. وآخرون. المشهد الجينومي للاستجابات الجزيئية للإجهاد الناتج عن الجفاف الطبيعي في بانكوم هالي. نات. كوم. 9، 5213 (2018).
61. وو، ت. د. وناكو، س. الكشف السريع والمتسامح مع SNP عن المتغيرات المعقدة والتقطيع في القراءات القصيرة. المعلوماتية الحيوية 26، 873-881 (2010).
62. هاس، ب. ج. وآخرون. تحسين توضيح جينوم الأرابيدوبسيس باستخدام تجميعات محاذاة النسخ القصوى. أبحاث الأحماض النووية 31، 5654-5666 (2003).
63. سلاموف، أ. أ. وسولوفيف، ف. ف. العثور على الجينات من البداية في الحمض النووي الجينومي لذباب الفاكهة. أبحاث الجينوم 10، 516-522 (2000).
64. سلاتر، ج. س. س. و بيرني، إ. التوليد الآلي للحدس لمقارنة التسلسلات البيولوجية. BMC المعلوماتية الحيوية 6، 31 (2005).
65. ستانك، م. وآخرون. AUGUSTUS: التنبؤ من البداية بالنُسخ البديلة. أبحاث الأحماض النووية. 34، W435-9 (2006).
66. سميت، أ. ف. أ. & هوبلي، ر. نموذج التكرار Open-1.0.http://www.repeatmasker.org/ (2010).
67. مكورميك، ر. ف. وآخرون. الجينوم المرجعي للذرة الرفيعة (Sorghum bicolor): تحسين التجميع، تعليقات الجينات، أطلس النسخ، وتوقيعات تنظيم الجينوم. مجلة النبات 93، 338-354 (2018).
68. ماميتي، س. وآخرون. مورد جينومي للذرة الرفيعة الخضراء Setaria viridis يمكّن من اكتشاف المواقع ذات القيمة الزراعية. نات. بيولوجيا حيوية. 38، 1203-1210 (2020).
69. وانغ، ي. وآخرون. MCScanX: مجموعة أدوات للكشف والتحليل التطوري لتوافق الجينات والتوازي. أبحاث الأحماض النووية. 40، e49 (2012).
70. إيمس، د. م. وكيللي، س. أورثوفايندر: استنتاج التماثل النشوي لعلم الجينوم المقارن. جينوم بيو. 20، 238 (2019).
71. غويل، م.، صن، هـ.، جياو، و. ب. وشنيبرغر، ك. SyRI: العثور على إعادة ترتيب الجينوم والاختلافات التسلسلية المحلية من تجميعات الجينوم الكامل. علم الجينوم 20، 1-13 (2019).
72. بيجز، إتش.، أبويون، ب.، جنتلمان، ر. وديبروي، س. بيوسترينغز: كائنات سلسلة تمثل التسلسلات البيولوجية، وخوارزميات المطابقة (2008). إصدار حزمة R 2.0 (2015).
73. كاتوه، ك. وستاندلي، د. م. برنامج محاذاة التسلسلات المتعددة MAFFT الإصدار 7: تحسينات في الأداء وسهولة الاستخدام. مول. بيول. إيفول. 30، 772-780 (2013).
74. زو، ل. وآخرون. ggmsa: أداة استكشاف بصرية لمحاذاة التسلسل المتعدد والبيانات المرتبطة. بريف. بايوإنفورم. 23، bbac222 (2022).
75. لين، ز. وآخرون. التنبؤ بمستوى الذرة لهيكل البروتين على نطاق تطوري باستخدام نموذج لغوي. ساينس 379، 1123-1130 (2023).
76. سوياما، م.، تورنتس، د. وبورك، ب. PAL2NAL: تحويل موثوق لمحاذاة تسلسلات البروتين إلى المحاذاة المقابلة للكودونات. أبحاث الأحماض النووية 34، W609-12 (2006).
77. شريف، د. ولوبري، ج. ر. في الأساليب الهيكلية لتطور التسلسل: الجزيئات، الشبكات، السكان (محررون باستولا، أ.، بورتو، م.، رومان، هـ. إ. وفيندروسكولو، م.) 207-232 (سبرينجر برلين هايدلبرغ، 2007).
78. هوانغ، سي.-سي. وآخرون. معدلات التطور للعلامات النووية والعضوية المستخدمة بشكل شائع لأقارب الأرابيدوبسيس (Brassicaceae). جين 499، 194-201 (2012).
79. أسناغي، سي. وآخرون. تطبيق التماثل عبر عائلة الحشائش لتحديد موقع خريطة جين مقاومة صدأ قصب السكر. نظرية. تطبيق. علم الوراثة. 101، 962-969 (2000).
80. مينيك، ز. الأدوار الفسيولوجية للغليكوسيد هيدرازات النباتات. بلانتا 227، 723-740 (2008).
81. ليفي، إ.، شاني، ز. وشوسييف، أ. تعديل البوليسكاريدات وجدار الخلية النباتية بواسطة إنزيم الإندو-1،4-بيتا-غلوكاناز ومجالات ربط السليلوز. هندسة الجزيئات الحيوية 19، 17-30 (2002).
الشكر والتقدير العمل (المقترح: https://doi.org/10.46936/10.25585/60001084 و https://doi.org/10.46936/10.25585/60001194) الذي أجرته وزارة الطاقة الأمريكية (DOE) معهد الجينوم المشترك (https://ror.org/O4xm1d337)، مرفق مستخدم تابع لمكتب العلوم في وزارة الطاقة الأمريكية ومعهد الطاقة الحيوية المشترك التابع لوزارة الطاقة، مدعوم من مكتب العلوم في وزارة الطاقة الأمريكية الذي يعمل بموجب العقد رقم DE-ACO2-O5CH11231 مع مختبر لورانس بيركلي الوطني. العمل الذي تم في CIRAD كان مدعومًا من قبل التحالف الدولي لبيوتكنولوجيا قصب السكر. العمل في معهد علم النبات التجريبي (IEB) كان مدعومًا من مشروع ERDF “النباتات كأداة للتنمية العالمية المستدامة” رقم CZ.02.1.01/0.0/0.0/16_019/0000827. نشكر M. Tsai من HudsonAlpha على تحميل المكتبات إلى أرشيف القراءة القصيرة في NCBI و D. Flowers على درجات ESMfold لجينات نقل السكر.
مساهمات المؤلفين: قام كل من C.M. وJ.D. وP.C. وS.R. وM.W. وC.H. وL.B.B. وJ.W. وP.P. وJ.G. بإجراء استخراج الحمض النووي، وإعداد المكتبة، والتسلسل. قام كل من A.L.H. وO.G. وJ.T.L. وS.S. وJ.J. وC.B.P. وV.L. وJ.C. بإجراء تجميع الجينوم والتعليق. تم إجراء التحليل بواسطة A.L.H. وO.G. وJ.T.L. وV.L. وN.P. وN.H. وJ.Y.H. وC.Z. وA.F. وA.D. وR.S. وJ.S. وK.A. وA.D.H. كتب A.L.H. وO.G. وJ.T.L. وA.S. وV.L. وJ.S. وK.A. وA.D.H. المخطوطة. ساهم A.L.H. وG.M. وB.S. وK.B. وR.J.H. وJ.G. وJ.S. وK.A. وA.D.H. في الفكرة، وإدارة المشروع، والمساهمة بالموارد.
المصالح المتنافسة يعلن المؤلفون عدم وجود مصالح متنافسة.

معلومات إضافية

معلومات إضافية النسخة الإلكترونية تحتوي على مواد إضافية متاحة فيhttps://doi.org/10.1038/s41586-024-07231-4.
يجب توجيه المراسلات والطلبات للحصول على المواد إلى A. L. Healey أو J. Schmutz أو A. D’Hont.
تُعرب مجلة Nature عن شكرها لإليزابيث كوبر والمراجعين الآخرين المجهولين على مساهمتهم في مراجعة هذا العمل.
معلومات إعادة الطباعة والتصاريح متاحة علىhttp://www.nature.com/reprints.
نظرة عامة على تجميع الجينوم

مقارنة تسلسل البديل الأساسي C

محاذاة الكروموسوم المبني الأساسي والبديل Chr6E
خريطة الاتصال B Hi-C
أعماق النمط الجيني D R570
عمق الهبلايوتوب الأسس المحسوبة (جيجابايت) الأسس الممثلة (جيجابايت) تمثيل الجينوم (%)
0X 1.47 0.74 ٧.٩
1X ٤.٦٣ ٤.٦٣ ٤٩.٦
2X 1.15 ٢.٣٠ ٢٤.٦
3X 0.35 1.05 11.3
4X 0.15 0.60 6.6
حجم الجينوم الممثل 9.32 جيجابايت
كثافة علامات الخريطة الجينية البسيطة
الشكل البياني الممتد 1|انظر الصفحة التالية للتعليق.

مقالة

الشكل التوضيحي للبيانات الموسعة 1 | نظرة عامة على تجميع جينوم R570 وتحليله. A) خط أنابيب مبسط لتجميع جينوم قصب السكر R570. يجمع خط الأنابيب بين تقنيات تسلسل متعددة (قطع HiFi، خريطة بصرية، خريطة وراثية، مكتبات كروموسوم فردية، سلسلة السورغم)، مستفيدين من نقاط القوة في كل منها لتحديد مراحل الكروموسومات المتجانسة، مع استخدام الفحص اليدوي والخطوات التكرارية للتغلب على نقاط الضعف في كل تقنية. انظر ‘البيانات التكميلية’ للحصول على شرح كامل وأسباب لكل خطوة. ب) خريطة حرارة قراءة Hi-C لـ R570. يتم تجميع الكروموسومات بناءً على التشابه، مع يقرأ ( التغطية) متوافقة مع النسخة النهائية من التجميع. ج) محاذاة الكروموسومات الأساسية والبديلة. خلال بناء الجينوم والانتهاء منه، تم اكتشاف نسخ متطابقة تقريبًا من الكنتيجات عند بناء الكروموسومات، والتي تم تصنيفها في تجميع بديل لتحسين فائدة الجينوم (انظر البيانات التكميلية). عند الإمكان، تم ترتيب هذه الكنتيجات وتوجيهها إلى الكروموسومات بناءً على أقرب محاذاة فريدة لها في التجميع الأساسي. على سبيل المثال، تم محاذاة الكروموسوم 6E ونسخته البديلة المثبتة باستخدام nucmer (v4.0;-1100–maxmatch-b 400). تمثل النقاط محاذاة 1-1 بين
سلسلتان طول كل منهما أكبر من 15 كيلوباس. يتم تلوين كل نقطة بناءً على نسبة تطابق المحاذاة. د) ملخص انهيار النمط الوراثي لـ R570. لتحديد مناطق انهيار النمط الوراثي داخل جينوم R570، تم محاذاة قراءات PacBio HiFi مع التجميع، باستخدام عمق القراءة لتحديد عدد نسخ النمط الوراثي. تمثل مناطق التغطية الفريدة 0 X كتل جينومية حيث لم يكن بالإمكان تحديد مواقع القراءة بشكل فريد بين التجميع الأساسي والبديل. تمثل القواعد المحسوبة تسلسلات الجينوم حيث يمكن حساب العمق بشكل موثوق. تُحسب القواعد الممثلة للقواعد المنهارة في التجميع (مثال 1 ميغابايت من تغطية 3X تمثيل التسلسل). E) كثافات علامات السيمبلكس في جينوم قصب السكر R570. تم البحث عن علامات السيمبلكس (80 نقطة أساسية) من خريطة R570 الجينية (المستمدة من اختبار نمط الانقسام 3:1 في 96 نسل S1 تم تحديده جينياً) في تجميع جينوم R570، مع الاحتفاظ فقط بمواقع المطابقة الدقيقة، ذات النسخة الواحدة. ثم تم تصور كثافات المواقع من خلال حساب النسبة المئوية لعدد القواعد المطابقة لكل نافذة منزلقة بحجم 10 كيلوبايت (خطوة طول 1 كيلوبايت). الخطوط الموجودة تحت كل كروموسوم تتوافق مع تعيينات الكتل الأصلية وكتل انهيار الهبلايوت.
محاذاة تسلسل متعددة للأورثولوجات المتجانسة SUT4
المتجانسات المتناظرة لبروتين B SIP2 – محاذاة تسلسل متعددة
المتجانسات المتناظرة لـ C PME – محاذاة تسلسل متعددة
الشكل البياني الممتد 2 | انظر الصفحة التالية للتعليق.

مقالة

الشكل البياني الممتد 2 | محاذاة جينات مرشحة لتراكم السكر. A) محاذاة للأورثولوجات المتناظرة لجين SUT4 (Sobic.008G193300). B) محاذاة للأورثولوجات المتناظرة لجين SIP2 (Sobic.002G075800). C) محاذاة للأورثولوجات المتناظرة لجين PME (Sobic.005G082100). القسم العلوي لكل لوحة يظهر الطول الكامل للمحاذاة، بينما القسم السفلي يعرض منطقة مكبرة (محددة بخط منقط وردي) لإظهار الاختلافات المحددة بين الأنواع والأليلات. تعيين السلف لجينات R570. تم تقاطع كل موضع أورثولوج مع تعيينات السلف لتحديد أصل كل ببتيد. %PID- النسبة المئوية للتطابق الثنائي (عدد المطابقات/طول المحاذاة*100)
لكل متماثل متجانس بالنسبة لـ S.bicolor (BTx623). تم تقاطع أعداد النسخ (CN) لعمق قراءة PacBio HiFi (الذي يمثل الأنماط المتماثلة المتطابقة المنهارة) مع موضع الجين لتوفير مؤشر على الأليلات المنهارة الإضافية (مثل عدد النسخ ; أليل واحد ممثل + أليل واحد متطابق مدمج). تم طي الأشكال المتجانسة (باستثناء الببتيدات المعلنة أحادية الصيغة الصبغية) باستخدام ESMfold وتم تقييمها من حيث الجودة. النقطة المقدمة هي نسبة الأحماض الأمينية عالية الجودة الموجودة في تسلسل الببتيد.

محفظة الطبيعة

المؤلف (المؤلفون) المراسلون: آدم هيلي
آخر تحديث من المؤلفين: 13 فبراير 2024

ملخص التقرير

تسعى Nature Portfolio إلى تحسين إمكانية تكرار العمل الذي ننشره. يوفر هذا النموذج هيكلًا للاتساق والشفافية في التقرير. لمزيد من المعلومات حول سياسات Nature Portfolio، يرجى الاطلاع على سياسات التحرير وقائمة مراجعة سياسة التحرير.

الإحصائيات

لجميع التحليلات الإحصائية، تأكد من أن العناصر التالية موجودة في أسطورة الشكل، أسطورة الجدول، النص الرئيسي، أو قسم الطرق.
مؤكد

حجم العينة بالضبط ( ) لكل مجموعة/شرط تجريبي، معطاة كرقم منفصل ووحدة قياس
بيان حول ما إذا كانت القياسات قد أُخذت من عينات متميزة أو ما إذا كانت نفس العينة قد تم قياسها عدة مرات
اختبار(ات) الإحصاء المستخدمة وما إذا كانت أحادية الجانب أو ثنائية الجانب
يجب أن تُوصف الاختبارات الشائعة فقط بالاسم؛ واصفًا التقنيات الأكثر تعقيدًا في قسم الطرق.
وصف لجميع المتغيرات المشتركة التي تم اختبارها
وصف لأي افتراضات أو تصحيحات، مثل اختبارات الطبيعية والتعديل للمقارنات المتعددة

وصف كامل للمعلمات الإحصائية بما في ذلك الاتجاه المركزي (مثل المتوسطات) أو تقديرات أساسية أخرى (مثل معامل الانحدار) وَالتباين (مثل الانحراف المعياري) أو تقديرات مرتبطة بعدم اليقين (مثل فترات الثقة)
لاختبار الفرضية الصفرية، إحصائية الاختبار (على سبيل المثال، ) مع فترات الثقة، أحجام التأثير، درجات الحرية و قيمة ملحوظة أعطِ القيم كقيم دقيقة كلما كان ذلك مناسبًا.
لتحليل بايزي، معلومات حول اختيار القيم الأولية وإعدادات سلسلة ماركوف مونت كارلو
للتصاميم الهرمية والمعقدة، تحديد المستوى المناسب للاختبارات والتقارير الكاملة عن النتائج
تقديرات أحجام التأثير (مثل حجم تأثير كوهين) بيرسون )، مما يشير إلى كيفية حسابها
تحتوي مجموعتنا على الإنترنت حول الإحصائيات لعلماء الأحياء على مقالات تتناول العديد من النقاط المذكورة أعلاه.

البرمجيات والشيفرة

معلومات السياسة حول توفر كود الكمبيوتر
جمع البيانات
لم يتم استخدام أي برنامج لجمع البيانات لهذه المخطوطة.
تحليل البيانات
تجميع الجينوم: RACON (الإصدار 1.4.10)، HiFiAsm (الإصدار 0.13-r308)، Juicebox (الإصدار 1.11.08)
بناء الخريطة الجينية: BWA-MEM (الإصدار 0.7.12)، JoinMap (الإصدار 4.0)، R/QTL (الإصدار 1.42-8)، DMwR (الإصدار 0.4.1)
بناء الخريطة البصرية: أدوات بيو نانو (الإصدار 1.3.8041.8044)، بيو نانو سولف (الإصدار 3.3_10252018)، برنامج بيو نانو جينومكس أكسس (الأدوات 1.3)
تجميع الجينوم: pblat (الإصدار 2.5) GENESPACE (الإصدار 0.9.4)، minimap2 (الإصدار 2.20-r1061)
توصيف الجينوم: GSNAP (الإصدار 2013-09-30)؛ PASA (الإصدار 2.0.2)؛ EXONERATE (الإصدار 2.4.0)؛ RepeatModeler (الإصدار open1.0.11)؛ FGENESH+ (الإصدار 3.1.0)؛
أغسطس (v3.1.0)
الجينوميات المقارنة: GENESPACE (الإصدار 0.9.4)، Orthofinder (الإصدار 2.5.4)، MCScanX (الإصدار 2)، SyRI (الإصدار 1.6)، Biostrings (الإصدار 2.70.2)، MAFFT (الإصدار 7.487)، seqinr (الإصدار 4.2-16)، ESMfold (الإصدار 2.0.1)، MAFFT (الإصدار 7.487)، NLR-Annotator (الإصدار 2)، pal2nal (الإصدار 13)، برنامج Olympus Cellsens (الإصدار)، FACSDiva (الإصدار 6.1.3)، Summit (الإصدار 6.2.2)، برنامج Olympus Cellsens (الإصدار 3.2)
تم توفير وتحميل نصوص البيانات المخصصة الأخرى وملفات البيانات الخام المطلوبة للتحليل على FigShare (https://doi.org/10.6084/m9.figshare.22138004) أو Github (https://github.com/a-healey/r570scripts) للاستخدام المجاني.
بالنسبة للمخطوطات التي تستخدم خوارزميات أو برامج مخصصة تكون مركزية في البحث ولكن لم يتم وصفها بعد في الأدبيات المنشورة، يجب أن تكون البرمجيات متاحة للمحررين والمراجعين. نحن نشجع بشدة على إيداع الشيفرة في مستودع مجتمعي (مثل GitHub). راجع إرشادات مجموعة Nature لتقديم الشيفرة والبرمجيات لمزيد من المعلومات.

بيانات

معلومات السياسة حول توفر البيانات
يجب أن تتضمن جميع المخطوطات بيانًا عن توفر البيانات. يجب أن يوفر هذا البيان المعلومات التالية، حيثما ينطبق:
  • رموز الانضمام، معرفات فريدة، أو روابط ويب لمجموعات البيانات المتاحة للجمهور
  • وصف لأي قيود على توفر البيانات
  • بالنسبة لمجموعات البيانات السريرية أو بيانات الطرف الثالث، يرجى التأكد من أن البيان يتماشى مع سياستنا
تتوفر مكتبات التسلسل (DNA/RNA من إلومينا وCLR/HiFi من باك بايو) بشكل علني ضمن أرشيف قراءة التسلسل (SRA). تم تقديم مشاريع البيولوجيا وأرقام الوصول الفردية في الجدول التكميلي 14. تجميع الجينوم والتعليق على الجينوم الأساسي متاحان مجانًا على Phytozome.https://phytozomenext.jgi.doe.gov/“). تم إيداع مشروع تسلسل الجينوم الكامل هذا في DDBJ/ENA/GenBank تحت الرقم التعريفي JAQSUU000000000. النسخة الموصوفة في هذه الورقة هي النسخة JAQSUU010000000. يمكن تنزيل الجينومات المتاحة للجمهور المستخدمة في علم الجينوم المقارن من هنا: Setaria viridis (v2.1؛ https://phytozome-next.jgi.doe.gov/info/Sviridis_v2_1), الذرة الرفيعة (v3.1; https://phytozome-next.jgi.doe.gov/info/Sbicolor_v3_1_1), مسار تيلينغ أحادي الصبغة R570 (http://sugarcane-genome.cirad.frسكران عفويhttp://www.life.illinois.edu/ming/downloads/Spontaneum_genome/البيانات الخام المستخدمة في التحليل في هذه الورقة متاحة مجانًا على فيغشيرhttps://doi.org/10.6084/m9.figshare.22138004).

البحث الذي يتضمن مشاركين بشريين، بياناتهم، أو مواد بيولوجية

معلومات السياسة حول الدراسات التي تشمل مشاركين بشريين أو بيانات بشرية. انظر أيضًا معلومات السياسة حول الجنس، الهوية/التقديم الجنسي، والتوجه الجنسي والعرق، والاثنية والعنصرية.
التقارير عن الجنس والنوع غير قابلة للتطبيق
التقارير عن العرق أو الإثنية، أو غير قابل للتطبيق
اجتماعي ذو صلة
تجمعات
خصائص السكان
غير قابل للتطبيق
التوظيف
غير قابل للتطبيق
الإشراف الأخلاقي
غير قابل للتطبيق
يرجى ملاحظة أنه يجب أيضًا تقديم معلومات كاملة حول الموافقة على بروتوكول الدراسة في المخطوطة.

التقارير المتخصصة في المجال

يرجى اختيار الخيار أدناه الذي يناسب بحثك بشكل أفضل. إذا لم تكن متأكدًا، اقرأ الأقسام المناسبة قبل اتخاذ قرارك.
علوم الحياة العلوم السلوكية والاجتماعية العلوم البيئية والتطورية والإيكولوجية
لنسخة مرجعية من الوثيقة بجميع الأقسام، انظرnature.com/documents/nr-reporting-summary-flat.pdf

تصميم دراسة العلوم الحياتية

يجب على جميع الدراسات الإفصاح عن هذه النقاط حتى عندما يكون الإفصاح سلبياً.
حجم العينة لم يتم تحديد حجم العينة مسبقًا قبل التحليل. تم تحديد جينات النسل الذاتي لإنشاء الخريطة الجينية. ) اخترنا بناءً على القيود الميزانية.
استثناءات البيانات لم يتم استبعاد أي بيانات من التحليلات.
التكرار تم استخراج الحمض النووي/الحمض النووي الريبي من نسخ موثوقة من نفس النمط الجيني (R570). لضمان التكرار، يمكن اختيار نفس النسخة (المحتفظ بها في البيوت الزجاجية) واختبارها.
التوزيع العشوائي تم إجراء تجميع وتحليل الجينوم على جينوتيب هجين واحد من قصب السكر ‘R570’، لذا فإن العشوائية ليست ضرورية.
مُعَمي تم إجراء تجميع وتحليل الجينوم على جينوتيب هجين واحد من قصب السكر ‘R570’، لذا فإن التعمية ليست ضرورية.

التقارير عن مواد وأنظمة وطرق محددة

نحتاج إلى معلومات من المؤلفين حول بعض أنواع المواد والأنظمة التجريبية والأساليب المستخدمة في العديد من الدراسات. هنا، يرجى الإشارة إلى ما إذا كانت كل مادة أو نظام أو طريقة مدرجة ذات صلة بدراستك. إذا لم تكن متأكدًا مما إذا كان عنصر القائمة ينطبق على بحثك، يرجى قراءة القسم المناسب قبل اختيار رد.

البحث ذو الاستخدام المزدوج الذي يثير القلق

معلومات السياسة حول البحث الثنائي الاستخدام الذي يثير القلق

المخاطر

هل يمكن أن يشكل الاستخدام العرضي أو المتعمد أو المتهور للمواد أو التقنيات الناتجة عن العمل، أو تطبيق المعلومات المقدمة في المخطوطة، تهديدًا لـ:

تجارب مثيرة للقلق

هل يتضمن العمل أيًا من هذه التجارب المثيرة للقلق:

النباتات

مخزونات البذور تم الحصول على المواد النباتية المستخدمة في التسلسل من صنف الهجين من قصب السكر R570، الموجود في البيوت الزجاجية في محطة أبحاث CIRAD في مونبلييه، فرنسا.
أنماط جينية نباتية جديدة لا توجد أنماط جينية جديدة مستخدمة في هذه الدراسة.
المصادقة لا توجد إجراءات مصادقة مطلوبة.

تدفق الخلايا

المؤامرات

أكد أن:

توضح تسميات المحاور العلامة والفلوكروم المستخدم (مثل CD4-FITC).
المقاييس على المحاور مرئية بوضوح. قم بتضمين الأرقام على المحاور فقط للرسم البياني في الأسفل الأيسر من المجموعة (المجموعة هي تحليل للعلامات المتطابقة).
جميع الرسوم البيانية هي رسوم بيانية متساوية الارتفاع مع نقاط شاذة أو رسوم بيانية بالألوان الزائفة.
تم توفير قيمة عددية لعدد الخلايا أو النسبة المئوية (مع الإحصائيات).

المنهجية

تحضير العينة تم حصاد الجذور لفرز الكروموسومات الفردية من نباتات R570، المزروعة في أصص. تم معالجة الجذور بـ هيدروكسي كوينولين لمدة 3 ساعات، مثبت لمدة 72 ساعة في ميثانول: محلول حمض الأسيتيك ومخزن في الإيثانول عند 4 درجات مئوية. تم شطف الجذور الثابتة مرتين في الماء لمدة 10 دقائق لكل منهما، وتمت معالجتها في 0.25 N HCl لمدة 10 دقائق، ثم شُطفت لمدة 10 دقائق في الماء ووُضعت في محلول الهضم. محلول سترات ) لمدة 10 دقائق. تم قطع رؤوس الجذور ووضعها في محلول إنزيمي (5% أونوزوكا R-10 سيلولاز، 1% Y-23 بيكتوليز في محلول الهضم) في أنبوب ميكرو. لمدة تقارب 3 ساعات (حيث يختلف الوقت حسب حجم الجذور)، تم شطف أطراف الجذور في الماء ونشرها على شريحة مع قطرة من 3:1 من الإيثانول:حمض الأسيتيك. – تم وصف هذه الاستراتيجية لتلوين الكروموسومات في قصب السكر لأول مرة في D’hont et al. 1996 “توصيف الهيكل الجيني المزدوج لأسلاف قصب السكر الحديثة (Saccharum spp.) بواسطة علم الوراثة الخلوية الجزيئية”
آلة تم التقاط الصور باستخدام كاميرا CCD متصلة بمجهر BX53 من أوليمبوس.
برمجيات برنامج أوليمبوس سيلسينس (الإصدار 3.2)
وفرة تجمع الخلايا لم تُستخدم الخلايا الفردية، بل الكروموسومات التي تم إيقافها في الطور الاستوائي وتم صبغها. وبالتالي، فإن القيمة العددية للخلايا ليست ذات صلة.
استراتيجية البوابة تم استخدام شدة الفلورة النسبية لفصل قمم الكاريوتيب التدريجي (I-V) وعزل الكروموسومات الفردية للتسلسل.
قم بتحديد هذا المربع لتأكيد أنه تم تقديم رقم يوضح استراتيجية البوابة في المعلومات التكميلية.

  1. مركز تسلسل الجينوم، معهد هودسون ألفا للتكنولوجيا الحيوية، هانتسفيل، ألاباما، الولايات المتحدة الأمريكية. سيراد، UMR AGAP المعهد، مونبلييه، فرنسا. معهد UMR AGAP، جامعة مونبلييه، CIRAD، INRAE، معهد أغرو، مونبلييه، فرنسا. معهد الجينوم المشترك التابع لوزارة الطاقة، مختبر لورانس بيركلي الوطني، بيركلي، كاليفورنيا، الولايات المتحدة الأمريكية. بحث السكر أستراليا، تي كواي، كوينزلاند، أستراليا. كورتيفا أجرساينس، جونستون، آيوا، الولايات المتحدة الأمريكية. CSIRO الزراعة والغذاء، منطقة علوم الحياة في كوينزلاند، سانت لوسيا، كوينزلاند، أستراليا. معهد علم النبات التجريبي بالأكاديمية التشيكية للعلوم، مركز الجينوم الهيكلي والوظيفي للنباتات، أولوموك، جمهورية التشيك. ERCANE، سانت كلوتيلد، لا ريونيون، فرنسا. معهد جينوم أريزونا، جامعة أريزونا، توكسون، أريزونا، الولايات المتحدة الأمريكية. CSIRO الزراعة والغذاء، أوربراي، جنوب أستراليا، أستراليا. تحالف كوينزلاند للابتكار في الزراعة والغذاء، جامعة كوينزلاند، بريسبان، كوينزلاند، أستراليا. المعهد المشترك للطاقة الحيوية، مختبر لورانس بيركلي الوطني، إيميريفيل، كاليفورنيا، الولايات المتحدة الأمريكية. مركز ARC للتميز في نجاح النباتات في الطبيعة والزراعة، جامعة كوينزلاند، بريسبان، كوينزلاند، أستراليا. البريد الإلكتروني:ahealey@hudsonalpha.org;jschmutz@hudsonalpha.org;dhont@cirad.fr

Journal: Nature, Volume: 628, Issue: 8009
DOI: https://doi.org/10.1038/s41586-024-07231-4
PMID: https://pubmed.ncbi.nlm.nih.gov/38538783
Publication Date: 2024-03-27

The complex polyploid genome architecture of sugarcane

https://doi.org/10.1038/s41586-024-07231-4
Received: 24 February 2023
Accepted: 23 February 2024
Published online: 27 March 2024
Open access

A. L. Healey , O. Garsmeur , J. T. Lovell , S. Shengquiang , A. Sreedasyam , J. Jenkins , C. B. Plott , N. Piperidis , N. Pompidor , V. Llaca , C. J. Metcalfe , J. Doležel , P. Cápal , J. W. Carlson , J. Y. Hoarau , C. Hervouet , C. Zini , A. Dievart , A. Lipzen , M. Williams , L. B. Boston , J. Webber , K. Keymanesh , S. Tejomurthula , S. Rajasekar , R. Suchecki , A. Furtado , G. May , P. Parakkal , B. A. Simmons , K. Barry , R. J. Henry , J. Grimwood , K. S. Aitken , J. Schmutz & A. D’Hont

Abstract

Sugarcane, the world’s most harvested crop by tonnage, has shaped global history, trade and geopolitics, and is currently responsible for of sugar production worldwide . While traditional sugarcane breeding methods have effectively generated cultivars adapted to new environments and pathogens, sugar yield improvements have recently plateaued . The cessation of yield gains may be due to limited genetic diversity within breeding populations, long breeding cycles and the complexity of its genome, the latter preventing breeders from taking advantage of the recent explosion of whole-genome sequencing that has benefited many other crops. Thus, modern sugarcane hybrids are the last remaining major crop without a reference-quality genome. Here we take a major step towards advancing sugarcane biotechnology by generating a polyploid reference genome for R570, a typical modern cultivar derived from interspecific hybridization between the domesticated species (Saccharum officinarum) and the wild species (Saccharum spontaneum). In contrast to the existing single haplotype (‘monoploid’) representation of R570, our 8.7 billion base assembly contains a complete representation of unique DNA sequences across the approximately 12 chromosome copies in this polyploid genome. Using this highly contiguous genome assembly, we filled a previously unsized gap within an R570 physical genetic map to describe the likely causal genes underlying the single-copy Bru1 brown rust resistance locus. This polyploid genome assembly with fine-grain descriptions of genome architecture and molecular targets for biotechnology will help accelerate molecular and transgenic breeding and adaptation of sugarcane to future environmental conditions.

Sugarcane domestication began approximately 10,000 years ago with the first ‘sweet’ cultivars (Saccharum officinarum) derived from Saccharum robustum . Modern day cultivars, however, are all derived from a few interspecific hybridizations performed by breeders a century ago between ‘sweet’ octoploid S. officinarum and the ‘wild’ polyploid Saccharum spontaneum. Sugarcane interspecific hybridization has provided major breakthroughs in disease resistance and adaptation to otherwise stressful environmental conditions. However, early generation hybrids also had much lower sugar yield, owing to the large wild genomic contribution. To re-establish high sugar yield, breeders backcrossed hybrids to . officinarum . This process was accelerated by the unreduced (‘ ‘) transmission of . officinarum chromosomes
in the first two generations so backcrossed (BC1) cultivars contained more domesticated sequence than would be expected by typical ( ) inheritance patterns.
While interspecific hybridization and backcrossing represent crucial steps for modern sugarcane breeding, they produced cultivars with extraordinarily complex genomes. In addition to variable progenitor subgenome dosage (due to unreduced ‘ ‘ gamete transmission), hybrid sugarcane meiotic recombination and chromosome pairing is variable within and among progenitor subgenomes. Chromosome pairing is mainly bivalent (although meiotic abnormalities can occur) but with differential pairing affinity between chromosomes, leading to a continuum of polysomic inheritance (with random association
Fig. 1| The pedigree and genome organization of hybrid sugarcane. a, An image of field-grown R570 (approximately 4 m in height). b, Estimated recorded pedigree of the R570 in a. Standardized contributions of progenitor genomes (red, S. spontaneum (Ss), ‘wild’ sugarcane; blue, ‘sweet’ S. officinarum (So)) are indicated by the proportional size of the pie diagrams, relative to expectations of inheritance. Cultivar names for each cross of the pedigree
are provided in single quotes. ‘ indicates ‘ ‘ chromosome transmission in the first two generations, and ‘ + ‘ denotes an hybrid. Although the exact pedigree of cultivars ‘R331’ and ‘Co213’ is unknown, they are estimated to be a BC2F2 and BC2:BC1F , respectively. IBD, identical by descent. c, Chromosome preparation of R570 after in situ hybridization, with S. spontaneum-specific probes shown in red.d, Karyotype diagram of R570 mirroring the colours in b.
between homologues) and disomic inheritance (with systematic association between a pair of homologues) . Recombination between progenitor subgenomes can also generate ‘interspecific recombinant’ chromosomes that contain both ‘wild’ and ‘sweet’ ancestry. As a result, chromosomes may be highly heterozygous, translocated, inherited purely from progenitor genomes, aneuploid, interspecific recombinant or entirely identical-by-descent to another chromosome. These processes result in a diverse and complex hybrid sugarcane genome.

The road to a representative genome

The complexity of hybrid sugarcane genomes and pedigrees is exemplified by the development of the ‘R570’ cultivar, which was generated by breeders on Reunion island in 1980 (ref. 11) (Fig. 1a,b). Similar to other modern cultivars, R570 has a genome size (2 C) of approximately 10 billion bases (‘gigabases’ (Gb)), a ploidy of approximately and chromosomes, several of which have recombined between progenitor species’ genomes (Fig. 1c,d); however, aneuploidy is common and the number of copies of each chromosome varies within and among cultivars. R570 was chosen as a model by the sugarcane community to study modern genome architecture and durable resistance to brown rust (Puccinia melanocephala), once a major disease in the tropics and subtropics . Despite development of numerous R570 genetic resources (for example, cytogenetics, genetic maps, BAC clone libraries, ‘monoploid’ assembly ) and other attempts to assemble other cultivars , modern sugarcane cultivars still lack a high-quality polyploid reference genome.
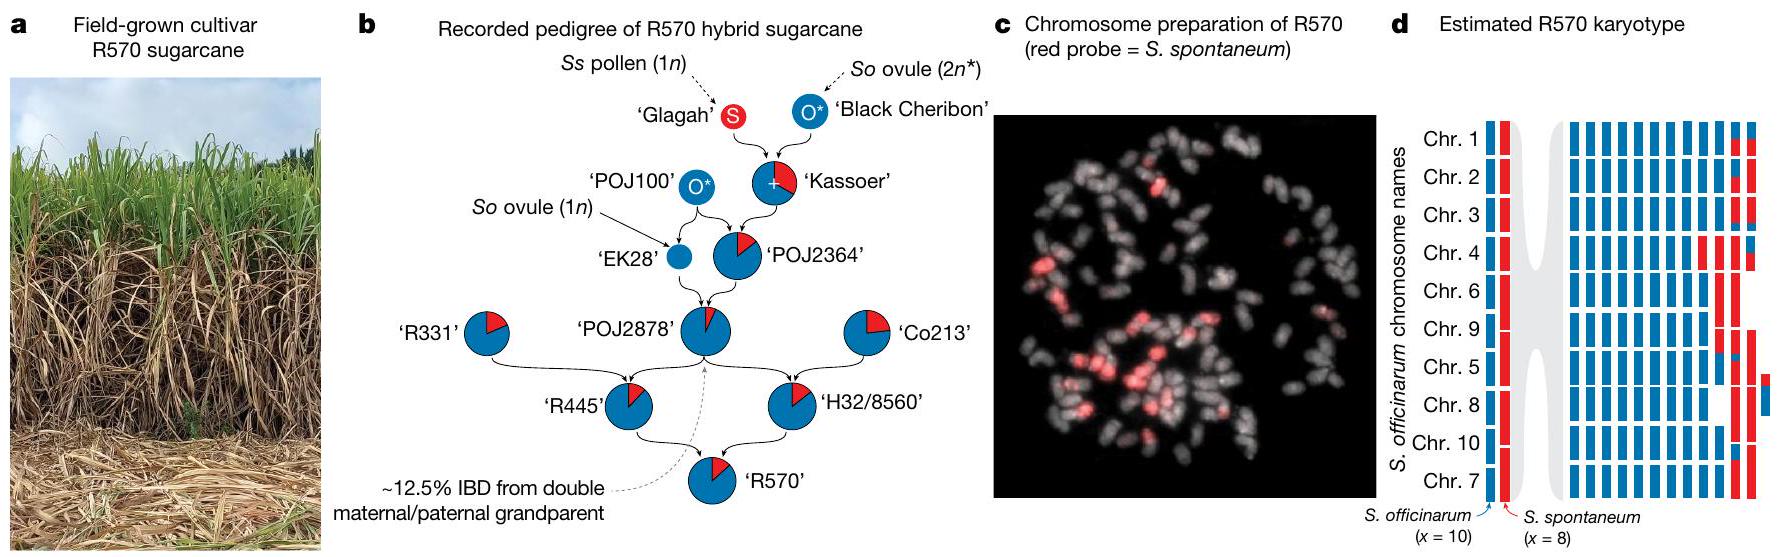
A genome such as R570 poses many technical assembly and genome representation challenges, as R570 has all the complexities of both outbred and inbred genomes. Given variable pairing affinities among R570 chromosomes, it could potentially be biologically appropriate to follow the standard outbred genome representation where an assembly is built for each meiotic homologue. However, given its backcrossed pedigree, chromosome transmission and double maternal/ paternal grandparent ‘POJ2878’ (Fig. 1b), we expect a majority of the genome to be inbred, with on average of sequences exactly duplicated. Normally, identical sequences in inbred genomes are represented as a single collapsed haplotype (for example, the CHM13 human cell line ) or computationally duplicated in each haplotype (for example, tetraploid potato genome ). In the case of R570, it is impossible to confidently place exactly duplicated sequences due to variable copy number and complex patterns of recombination between progenitor
subgenomes. Therefore, we opted for a standard partial-inbred genome assembly for R570, where the ‘primary’ assembly is a complete representation of unique haplotypes in R570 whereas the ‘alternate’ represents nearly identical, additional haplotypes. While ‘alternate’ here does not have the same meaning as compared to organisms with strict disomic pairing, we structured the R570 genome in a similar manner to improve utility for the community.
In a typical genome, a highly contiguous assembly could be organized (‘scaffolded’) into chromosomes solely by Hi-C or optical mapping; however, both of these technologies require short unique sequence anchors, which are rare in the R570 genome. Therefore scaffolding required a custom pipeline that leveraged multiple lines of evidence, including PacBio HiFi circular consensus sequencing, Bionano Direct Label and Stain optical mapping, genetic linkage mapping, synteny, single-chromosome sorted sequencing and . We combined these diverse resources through a custom pipeline (Extended Data Fig. 1a, Supplementary Data, Supplementary Figs. 1-11 and Supplementary Table 1) to construct a 5.04 Gb ( 12.6 Mb contig N50; average 12 contigs per chromosome) primary assembly (Fig. 2a,b, Extended Data Fig. 1b and Supplementary Fig. 12) that encompasses roughly half of the 10 Gb of sequence and 114 chromosomes (Methods) expected from R570 flow cytometry estimation . The 3.7 Gb of additional sequence represented in the ‘alternate’ assembly are nearly identical to, but not necessarily meiotic pairs of, the corresponding primary chromosomes. For example: Chr6E_alt ( 20.4 Mb ) is similar to Chr6E ( 50.1 Mb ; Extended Data Fig. 1c), and HiFi reads cannot be mapped uniquely to of the alternate assembly (Supplementary Table 2). In addition to this highly similar sequence, R570 has an expected approximately inbreeding coefficient due to a shared grandparent (POJ2878; Fig. 1b). Thus, we expect approximately 1.25 Gb of genome to be absent in the alternate assembly and collapsed to a single representation in the primary. Our 8.72 Gb combined primary and alternate assembly very closely aligns with this expectation.
The high-quality ( gaps; long terminal repeat (LTR) assembly index (LAI) : 22.82) primary assembly captures a full representation of the diversity present in R570 and will serve as the basis for genome-enabled biotechnology in sugarcane. As is the case with typical outbred diploid genomes, duplicate copies between haplotypes can complicate or bias analyses-usually one haplotype is used as the reference for mapping. Thus, here we focus on the primary assembly for efforts central to candidate gene discovery, such as gene expression and

Article

Expected chromosome copies Chr. 5 Chr. 2 Chr. 3 Chr 10 Chr. 7 Chr. 8 Chr. 9 Chr. 6 Chr. 4
Chr. 1 //!!,
Primary assembly identical haplotypes collapsed Chr. 2 |||||||| j I I I I I I
Sorghum bicolor v.3.1 |||||| j
ニュニューニー
1
|''''!!
Chr. 8 1
J,li li i'i
Chr. 10
c Synteny map between R570 and related genomes
Fig. 2 |The genome assembly of sugarcane cultivar R570.a,Schematic representation of the primary genome assembly.Although R570 has approximately 12 chromosome copies per homolog,backcrossing and chromosome transmission have led to near-identical haplotypes that are collapsed(represented as colour shades)in the genome assembly.b,One-to-one ortholog genes among chromosomes 1-10 of Sorghum bicolor(v.3.1.1)and primary chromosomes of R570.Each region is coloured based on progenitor
variant detection.To support these efforts,we used gene homology and RNA sequencing(RNA-seq)transcript evidence to describe the full suite of protein coding sequences and annotate genes in the primary R570 assembly.The primary annotation is highly complete(BUSCO total, duplicate completeness) with 194,593 coding sequences (and 105,138 alternative spliced transcripts).In contrast to previous monoploid assemblies,which contained a single representation of each ancestral chromosome,synteny-aware gene families(built with GENESPACE )were present in six( )copies in the primary genome( 6.78 mean syntenic block coverage with Sorghum bicolor (S.bicolor);Fig.2c,Table 1 and Supplementary Table 3),which reflects half of the expected ploidy and matches the expected copy number in the primary assembly.This within-genome variation is now available to breeders,but was obscured with current monoploid(single-copy) methods.Combined,the primary and alternate assemblies provide by far the most complete genomic sequences available for cultivated sugarcane.
contribution within R570.c,GENESPACE-generated synteny map among (bottom to top)Sorghum bicolor(v.3.1),S.spontaneum(genotype AP85-441), R570 primary and R570 monoploid genome assemblies.Horizontal segments indicate chromosomes;colours(red-purple)indicate the orthologous Sorghum bicolor chromosomes(1-10)and'braids'represent syntenic blocks between each pair of genomes. -axis positions are scaled by gene-rank order.

The architecture of the R570 genome

Knowledge of the global genome architecture of modern sugarcane cul- tivars is currently derived mainly from molecular cytogenetics , genetic mapping and haplotype sequence comparisons .Our chromosome-scale R570 assembly provides the first fine-grain descrip- tion of the genome architecture of modern sugarcane cultivars,a foun- dation to describe the patterns of genomic evolution and diversity within a neo-polyploid hybrid,a crucial resource for burgeoning sugar- cane molecular breeding efforts.Perhaps the most critical element of interspecific sugarcane breeding is the maintenance and enrichment of S.spontaneum progenitor sequence,conferring disease resistance and environmental adaptation .The progenitor species of R570 are highly diverged(approximately 1.6 million years;Supplementary Table 4 and Supplementary Fig.13),which enabled extraction of 27 bp species specific repeats used to assign progenitor blocks in the genome(Sup- plementary Data).Consistent with previous cytogenetic estimates
Table 1 | R570 genome assembly and annotation statistics
Overall S. officinarum S. spontaneum
Primary genome size (contig N50) 3.66 Gb 1.37 Gb
Alternate genome size (contig N50) 3.01 Gb 0.32 Gb
Genome size accounting for collapsed haplotypes 9.32 Gb
Collapsed haplotypes in assembly 2.31 Gb 2.18 Gb 0.116 Gb
No. of genes (no. of syntenic orthogroups) in primary annotation 194,593 132,618 61,197
Mean ploidy of primary assembly (coverage of syntenic blocks) 4.60x 2.16x
Mean pairwise peptide identity among alleles 86% 83%
Genes impacted by structural variants 5,362 5,090 260
HiFi unique mapping expected depth. GENESPACE default parameters. Calculated among peptides from the primary annotation within syntenic orthogroups. Calculated from pairwise alignments, relative to ChrA among homologous chromosomes.
we found that and of the R570 primary genome assembly ( 5.04 Gb ) is derived from S. officinarum and S. spontaneum, respectively (Supplementary Tables 5 and 6). Separate evolutionary trajectories have also produced distinct ploidy levels and basic chromosome numbers between progenitors (S. officinarum, , basic chromosome number ; S. spontaneum, typical basic chromosome number ). The basic chromosome set ( ) of S.officinarum is directly syntenic to the ten chromosomes of S.bicolor, its most well-studied annotated diploid relative. In contrast, the basic chromosome set ( , but can vary) of . spontaneum is a result of six chromosomes being rearranged into four , each of which are observed in the R570 primary assembly (Chr5_9A, Chr 6_9A, Chr 7_10A and Chr 8_10A;Fig. 2b).
Despite rearrangements in . spontaneum, most of the progenitor chromosomes within R570 are syntenic and share sequence homology, facilitating interspecific recombination. Indeed, cytogenetic experiments among multiple sugarcane hybrid cultivars indicate that homologous pairing and recombination between chromosomes from different progenitors is likely common . In the R570 primary assembly, we observed 13 interspecific recombinant chromosomes among seven of ten basic chromosomes (Fig. 2b). The assembly also confirmed a cytogenetic predicted chromosome resulting from a translocation between S. spontaneum chromosome 5 and S. officinarum chromosome 8 (Fig. 2b) which is so far found only in R570 and no other modern cultivar . Homoeologous introgressions, which can be enriched in breeding targets, have been observed in other systems, both in traditional breeding (for example, oat ) and synthetic polyploids (for example, Brassica and wheat ). R570 recombinant chromosomes contain diversity within progenitor genomes that is not easily purged through inbreeding, likely providing additive genetic variance accessible to breeders in advanced-generation intercrosses.
Breeding practices such as backcrossing, ‘2n’ chromosome transmission and small breeding population sizes, have resulted in high DNA sequence redundancy and exact duplicates, particularly those derived from S. officinarum. For example, the cultivar ‘POJ2878’ has been used in many breeding programs worldwide and is both a maternal and paternal grandparent of R570 (Fig. 1b). To catalogue the genomic structure of copy number variation and molecular sequence variation within R570, we used highly accurate PacBio HiFi reads (median length
17 kb ), to find roughly half the genome (50.4%) is identical-by-descent where haplotypes are collapsed among multiple copies (2-4x) (Supplementary Table 7, Supplementary Fig. 14 and Extended Data Fig. 1d). The remainder of the genome (49.6%) contains enough sequence variation (heterozygosity) to enable single, unique alignments of PacBio reads that distinguish separate haplotypes. Each of basic chromosomes of R570 are covered by one to four S. spontaneum haplotypes (Fig. 2b) most of which ( ) is heterozygous, single-copy sequence. In contrast, only of the S. officinarum portion is heterozygous, while the majority is collapsed among multiple haplotypes. Indeed, 87% of the duplicated sequence among the primary and alternate assemblies (39.7%; previously discussed; Supplementary Table 2) is derived from S. officinarum. Since breeding for increased sugar content and other traits rely on additive contributions of gene dosage, these perfectly duplicated regions represent potential targets for copy-number aware genotyping and molecular breeding efforts. However, exploring the genomic contribution of the domesticated progenitor is difficult as genotyping inbred haplotypes require restrictively large numbers of progeny to screen (for example, triplex marker segregation in S1 = 143:1 (ref. 36)). The most common genetic marker used for sugarcane breeding (simplex, segregation in S1 = 3:1 (ref. 37); Supplementary Data) is significantly biased toward the . spontaneum regions of the genome ( of markers; Fisher exact test: enrichment, ), and is found almost exclusively in heterozygous haplotypes (98%) (Extended Data Fig. 1e). While this bias towards heterozygous regions renders the majority of the genome invisible to traditional genetic mapping, the R570 assembly will allow easier exploration of quantitative trait loci (QTLs) through cataloguing of haplotype structure and progenitor contribution within the genome.

Exploration of targets for breeding

Many crucial traits for sugarcane improvement are polymorphic in the progenitor species and dosage dependent in hybrid breeding programs. For example, brown rust resistance (see below) appears to be derived from a single-copy locus within the genome, while high sugar content requires additive contributions of gene copies from S. officinarum. To accelerate similar breeding efforts and develop marker assisted selection strategies, we documented copy number and protein sequence variation between and within R570 progenitor subgenomes within the primary assembly and annotation (Table 1, Fig. 2c and Supplementary Table3). Using progenitor block classification, we were able to assign of gene models ( ) to S. officinarum and to . spontaneum ( ). Inspection of homeologs among progenitors found of gene copies derived from S. officinarum and 95% derived from S. spontaneum contained non-synonymous variation (Supplementary Table 8), but it is important to note that many of these genes are located in regions where haplotypes are collapsed ( S. officinarum assigned; Supplementary Table 9), and thus some gene models are likely under-represented. Peptide polymorphism largely mirrored the % identical homeolog analyses, where S. officinarum homeologs had an average pairwise identity (PID) of while . spontaneum homeologs had significantly more variation (mean PID ; Mann-Whitney , . The investigation of genes impacted by structural variants, which may prevent recombination and subsequent generation of desirable allelic combinations is also significantly biased towards S. officinarum portions of the genome ( of impacted genes; Fisher’s exact test, odds ratio: 9.03, ; Supplementary Table 10). A survey of unique material (genes with no orthology in the other progenitor; ) found more genes derived from S. officinarum than expected (Fisher’s exact test, odds ratio: 1.24, ); although investigation of the largest novel gene family contributed from the . spontaneum found a nine gene tandem duplication of leucine rich repeat genes on Chr7_10A. Furthermore,
Fig. 3 | Bru1 candidate gene locus. a, Brown rust disease resistance in R570. Top panel shows selfed R570 offspring with the Bru1 locus, while the bottom panel shows offspring lacking Bru1.b, Gap-filled haplotype assembly identifies a TKP as candidate causal genes for Bru1 durable brown rust resistance.
Blue pentagons represent curated gene models and grey pentagons are large transposable elements.Bru1 TKP7 and TKP8 candidate genes are indicated in red with their location on Chr. 3D.
annotation of resistance gene analogues (RGAs) throughout the genome (Supplementary Table 11) showed significant enrichment for S. spontaneum derived motifs (Fisher’s exact test, odd’s ratio 2.14, ), particularly on homologous regions of chromosomes 3, 6 and and enrichment, respectively, ; Supplementary Table 12).
Hybrid and backcrossing breeding programs often introduce large swaths of linked maladaptive alleles that reduce crop yield in early generations. In modern sugarcane cultivars, interspecific hybridization not only introduced disease resistance alleles from S. spontaneum, but also alleles that reduced the high-sucrose (‘brix’) content in the domesticated S. officinarum. Previous studies suggested that discrete loci disproportionately explained sugar content variation , but some of these experiments were performed in different genetic backgrounds, with only the monoploid assembly or S. bicolor available for candidate gene discovery, offering a collapsed view of allelic variation that exists in the R570 genome. Using comparative genomics between S. bicolor BTx623 (short stature, early maturing, cereal genotype) and rio (‘sweet sorghum’; tall, late maturing, high soluble sugar content), we explored sugar transport genes underlying the rio ‘sweet’ phenotype of high concentrations of soluble sugars within its stem , a phenotype also of interest by sugarcane breeders. Of the candidates described in ref. 42, 43 S. bicolor BTx623 genes were contained as single placement anchors within R570 syntenic orthogroups, with 505 syntenic orthologs among other genomes (Sorghum ‘rio’: R570 monoploid: S. spontaneum (genotype AP85-441): R570; syntenic orthologs per genome = 39:37:130:299; mean gene copies per homologue per genome = 1:1:3:7).
Percent PID among the S. bicolor homologue and syntenic orthologs found sugar transport genes are highly conserved (Sorghum ‘rio’: R570 monoploid:S. spontaneum (genotype AP85-441): R570; median PIDs per genome = 100%:91%:94%:94%) (for example, SUT4-Sobic.008G193300, Extended Data Fig. 2a), although some R570 alleles contain frameshift mutations that are likely to impair function (for example, SoffiXspo nR570.05Bg071800-L744A-Sobic.002G075800-Glycoside hydrolase ortholog,S.officinarum allele, Extended Data Fig. 2b) or possess highly variable alleles with regions where individual homeologs can be distinguished (for example, Sobic.005G082100-cell wall pectinesterase; Extended Data Fig. 2c). Annotation of the R570, paired with information of gene dosage, allelic variation and progenitor contribution will enable the sugarcane community to better comprehend germplasm resources at their disposal, for both R570 and other hybrid cultivars.
Apart from high sugar production, a defining characteristic of modern sugarcane cultivars is biotic disease resistance. One of the most
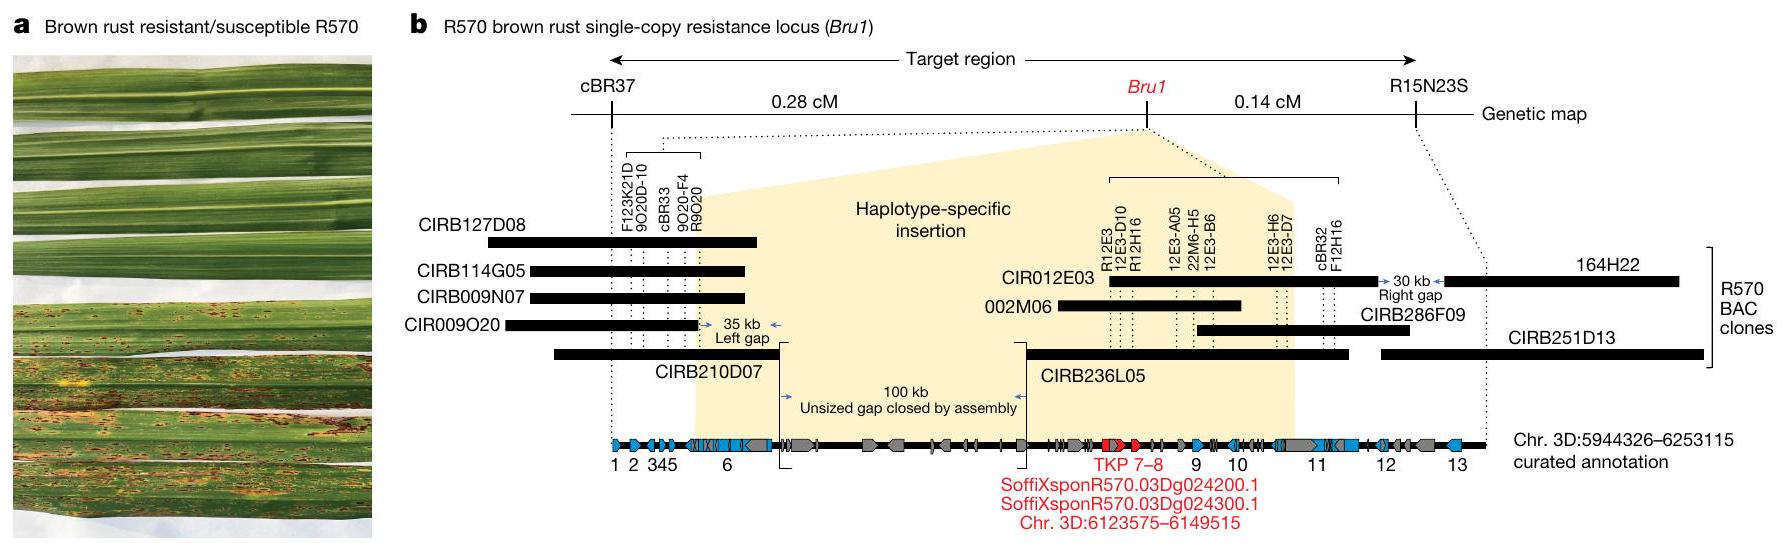
important diseases that affects all sugarcane growing regions around the world is brown rust, caused by the fungus, Puccinia melanocephala. Once a major pathogen of sugarcane that caused yield losses of up to 50%, breeders have successfully mitigated P. melancocephala-derived losses by selecting for disease resistance. A major locus (Bru1) that confers durable resistance to this disease (Fig. 3a) was identified in cultivar R570 (refs. 43,44). To uncover the causative allele underlying Bru1, previous studies used an extensive map-based cloning approach that screened approximately 2,400 self-pollinated R570 progeny, constraining Bru1 to a set of BAC sequences that spanned approximately 209 kb (refs. 27,44) (Methods). Although the region contained 13 gene models (Fig. 3b and Supplementary Table 13), it also contained an unsized gap and large haplotype insertion, both of which prevent further fine-scale mapping and exhaustive candidate gene discovery . Nonetheless, the fixed insertion haplotype enabled the design of Bru1 diagnostic PCR markers. These have been effectively used in modern cultivar breeding programs worldwide, demonstrating that the single-dose Bru1 locus has been the major source of effective (or ‘durable’) brown rust resistance for decades across multiple environments .
In contrast to previous resources, our R570 genome assembly spans the entirety of the Bru1 target region (chromosome 3D: 5944326-6253115 bp). Crucially, this includes a complete approximately 100 kb stretch of contiguous sequence across the previously unsized gap region . Filling this previously unsized gap and demonstrating that it did not include additional candidate genes was an essential step before investing in the analysis of all candidate genes in the region. Manual curation of the gap-filled region confirmed the 13 gene models, whose functions were assessed, searching for genes involved in disease resistance mechanisms, with two genes standing out as top candidates (Methods). Curated genes 7 and 8 (gene IDs, SoffiXsponR570.03Dg024200 and SoffiXsponR570.03Dg024300) share homology (both classified as RLK-PELLE-DSLV kinases ), are located within the bounds of the haplotype-specific insertion (Fig. 3b), and are each single copy in the R570 genome. While gene 7 (SoffiXsponR570.03Dg024200) contains all 12 functional kinase subdomains, gene 8 (SoffiXsponR570.03Dg024300) contains only domains I through VII and is likely a pseudokinase. These two genes represent a tandem kinase-pseudokinase (TKP), similar to barley stem rust (RPG1 (ref. 46)) and yellow rust resistance Yr15 (ref. 47). The current model of molecular action for TKP resistance suggests the pseudokinase acts as a decoy for fungal pathogen effectors , while the functional kinase generates a signal cascade, innervating the plant effector-triggered immune response. Due to their variation and novelty, TKPs (and other
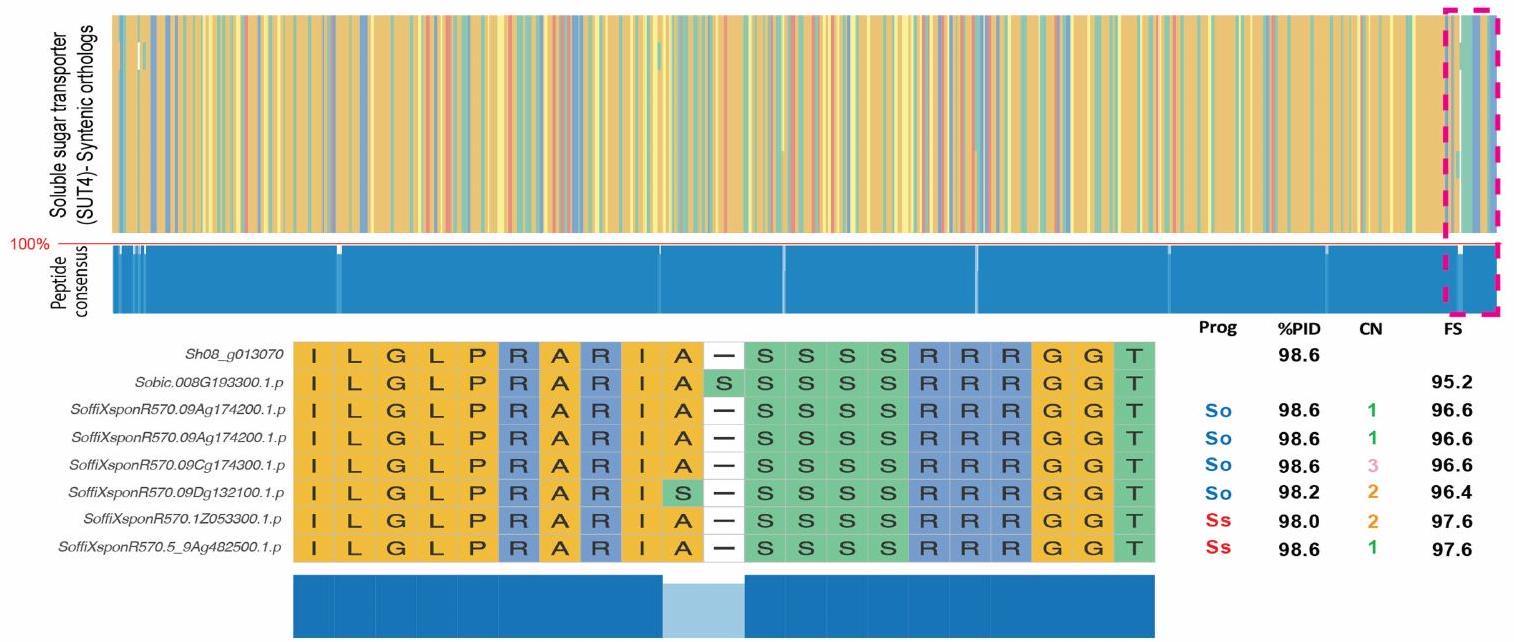
variants (for example, tandem kinase-kinases and so on)) are difficult to find using only sequence homology. Their structure has been predicted across the plant domain of life, but only five examples have been functionally validated in monocots, all of which conferred resistance to fungal pathogens . Combined, these results support this tandem kinase-pseudokinase (TKP7 and TKP8) as the causal gene for Bru1 brown rust resistance and will permit future biotechnological improvement of sugarcane for brown rust.

Conclusions

The polyploid genome assembly and annotation of sugarcane cultivar R570 is an essential stepping stone in the emerging genomic revolution for sugarcane. This work reveals the genomic effects of breeding practices that transformed sugarcane into sugar/biomass production factories, a remarkable feat by breeders considering the complexity of the genome and the revelation that much of the ‘sweet’ domesticated alleles contributed from . officinarum are identical and thus are largely inaccessible to QTL mapping efforts. Further, the persistence of the . spontaneum progenitor genomic contribution, despite multiple rounds of backcrossing to S.officinarum and chromosome transmission, is highlighted by the enrichment of both RGA motifs and unique gene family contributions from the wild progenitor species. The ability to separate, resolve and investigate individual haplotypes and chromosomes within R570 enables a much greater understanding of the fine-grain architecture of this very complex genome and will lead to substantial improvements in the genetic understanding of agronomic traits through exploration of allelic variation, copy number and gene presence/absence variation .
One of the most important, yet complex, questions underlying agronomic trait discovery in sugarcane is epistatic interaction among alleles. Desirable traits such as sucrose transport and accumulation are complex enough in diploid plants, let alone in highly polyploid sugarcane with approximately copies of each chromosome. Annotation and pan-genome synteny networks in R570, paired with new differential expression analyses enabled by this work, will help reveal the complicated regulation of transcription factors and multiple, identical target sequences within sugarcane. Furthermore, demonstrating that while half the genome is identical/collapsed among haplotypes, the remaining sequence is heterozygous and is over-represented by S. spontaneum will help improve the construction and design of genetic markers that do not rely solely on segregation for QTL mapping. While interspecific hybrid sugarcane represents one of the most complex plant genomes ever sequenced, it is likely by no-means the most complex genome that kingdom Plantae can offer. The strategies outlined here that combine multiple sequencing technologies and techniques are broadly applicable and can be applied to complex plant genomes sequenced in the future. Description of the Bru1 disease resistance locus and discovery of strong candidate genes corresponding to a tandem kinase-pseudokinase will allow targeted validation experiments. Its putative molecular function supports that tandem kinase resistance mechanisms are durable and capable of protecting globally distributed crops across many environments. This work represents the culmination of a decades-long global collaboration by sugarcane breeders and researchers to develop genomic resources for R570 to better understand one of the most valuable crops in the world, the modern sugarcane hybrid cultivar.

Online content

Any methods, additional references, Nature Portfolio reporting summaries, source data, extended data, supplementary information, acknowledgements, peer review information; details of author contributions and competing interests; and statements of data and code availability are available at https://doi.org/10.1038/s41586-024-07231-4.
  1. Dinesh Babu, K. S. et al. A short review on sugarcane: its domestication, molecular manipulations and future perspectives. Genet. Resour. Crop Evol. 69, 2623-2643 (2022).
  2. Yadav, S. et al. Accelerating genetic gain in sugarcane breeding using genomic selection. Agronomy 10, 585 (2020).
  3. Grivet, L., Glaszmann, J.-C. & D’Hont, A. in Darwin’s Harvest (eds Motley, T. J. et al.) 49-66 (Columbia Univ. Press, 2006).
  4. Bremer, G. Problems in breeding and cytology of sugar cane. Euphytica 10, 59-78 (1961).
  5. Burner, D. M. & Legendre, B. L. Chromosome transmission and meiotic stability of sugarcane (Saccharum spp.) hybrid derivatives. Crop Sci. 33, 600-606 (1993).
  6. Vieira, M. L. C. et al. Revisiting meiosis in sugarcane: chromosomal irregularities and the prevalence of bivalent configurations. Front. Genet. 9, 213 (2018).
  7. Oliveira, G. K. et al. Meiotic abnormalities in sugarcane (Saccharum spp.) and parental species: evidence for peri- and paracentric inversions. Ann. Appl. Biol. https://doi.org/ 10.1111/aab. 12855 (2023).
  8. Hoarau, J.-Y. et al. Genetic dissection of a modern sugarcane cultivar (Saccharum spp.). I. Genome mapping with AFLP markers. Theor. Appl. Genet. 103, 84-97 (2001).
  9. Aitken, K. S., Jackson, P. A. & McIntyre, C. L. A combination of AFLP and SSR markers provides extensive map coverage and identification of homo(eo)logous linkage groups in a sugarcane cultivar. Theor. Appl. Genet. 110, 789-801 (2005).
  10. Jannoo, N., Grivet, L., David, J., D’Hont, A & Glaszmann, J.-C. Differential chromosome pairing affinities at meiosis in polyploid sugarcane revealed by molecular markers. Heredity 93, 460-467 (2004).
  11. Dumont, T. et al. Sugarcane breeding in reunion: challenges, achievements and future prospects. Sugar Tech 24, 181-192 (2022).
  12. D’Hont, A. et al. Characterisation of the double genome structure of modern sugarcane cultivars (Saccharum spp.) by molecular cytogenetics. Mol. Gen. Genet. 250, 405-413 (1996).
  13. Piperidis, N. & D’Hont, A. Sugarcane genome architecture decrypted with chromosome-specific oligo probes. Plant J. 103, 2039-2051 (2020).
  14. Costet, L. et al. Haplotype structure around Bru1 reveals a narrow genetic basis for brown rust resistance in modern sugarcane cultivars. Theor. Appl. Genet. 125, 825-836 (2012).
  15. Parco, A. S. et al. Distribution and frequency of Bru1, a major brown rust resistance gene, in the sugarcane world collection. Plant Breed. 136, 637-651 (2017).
  16. Garsmeur, O. et al. A mosaic monoploid reference sequence for the highly complex genome of sugarcane. Nat. Commun. 9, 2638 (2018).
  17. Souza, G. M. et al. Assembly of the 373k gene space of the polyploid sugarcane genome reveals reservoirs of functional diversity in the world’s leading biomass crop. GigaScience 8, giz129 (2019).
  18. Shearman, J. R. et al. A draft chromosome-scale genome assembly of a commercial sugarcane. Sci. Rep. 12, 20474 (2022).
  19. Nurk, S. et al. The complete sequence of a human genome. Science 376, 44-53 (2022).
  20. Sun, H. et al. Chromosome-scale and haplotype-resolved genome assembly of a tetraploid potato cultivar. Nat. Genet. 54, 342-348 (2022).
  21. Ou, S., Chen, J. & Jiang, N. Assessing genome assembly quality using the LTR Assembly Index (LAI). Nucleic Acids Res. 46, e126 (2018).
  22. Simão, F. A., Waterhouse, R. M., Ioannidis, P., Kriventseva, E. V. & Zdobnov, E. M. BUSCO: assessing genome assembly and annotation completeness with single-copy orthologs. Bioinformatics 31, 3210-3212 (2015).
  23. Lovell, J. T. et al. GENESPACE tracks regions of interest and gene copy number variation across multiple genomes. eLife 11, e78526 (2022).
  24. Cuadrado, A., Acevedo, R., Moreno Díaz de la Espina, S., Jouve, N. & De La Torre, C. Genome remodelling in three modern S. officinarum S. spontaneum sugarcane cultivars. J. Exp. Bot. 55, 847-854 (2004).
  25. Piperidis, G., Piperidis, N. & D’Hont, A. Molecular cytogenetic investigation of chromosome composition and transmission in sugarcane. Mol. Genet. Genomics 284, 65-73 (2010).
  26. Aitken, K. S. et al. A comprehensive genetic map of sugarcane that provides enhanced map coverage and integrates high-throughput Diversity Array Technology (DArT) markers. BMC Genom. 15, 152 (2014).
  27. Garsmeur, O. et al. High homologous gene conservation despite extreme autopolyploid redundancy in sugarcane. New Phytol. 189, 629-642 (2011).
  28. Vilela, M. et al. Analysis of three sugarcane homo/homeologous regions suggests independent polyploidization events of Saccharum officinarum and Saccharum spontaneum. Genome Biol. Evol. 9, 266-278 (2017).
  29. Pompidor, N. et al. Three founding ancestral genomes involved in the origin of sugarcane. Ann. Bot. 127, 827-840 (2021).
  30. Jannoo, N. et al. Orthologous comparison in a gene-rich region among grasses reveals stability in the sugarcane polyploid genome. Plant J. 50, 574-585 (2007).
  31. Zhang, Q. et al. Genomic insights into the recent chromosome reduction of autopolyploid sugarcane Saccharum spontaneum. Nat. Genet. 54, 885-896 (2022).
  32. Zhang, J. et al. Allele-defined genome of the autopolyploid sugarcane Saccharum spontaneum L. Nat. Genet. 50, 1565-1573 (2018).
  33. Kamal, N. et al. The mosaic oat genome gives insights into a uniquely healthy cereal crop. Nature https://doi.org/10.1038/s41586-022-04732-y (2022).
  34. Song, K., Lu, P., Tang, K. & Osborn, T. C. Rapid genome change in synthetic polyploids of Brassica and its implications for polyploid evolution. Proc. Natl Acad. Sci. USA 92, 7719-7723 (1995).
  35. Liu, B. et al. Rapid genomic changes in polyploid wheat and related species: implications for genome evolution and genetic improvement. J. Genet. Genom. 36, 519-528 (2009).
  36. Lu, X. et al. Segregation analysis of microsatellite (SSR) markers in sugarcane polyploids. Genet. Mol. Res. 14, 18384-18395 (2015).
  37. Piperidis, N. et al. Comparative genetics in sugarcane enables structured map enhancement and validation of marker-trait associations. Mol. Breed. 21, 233-247 (2008).
  38. Steuernagel, B. et al. The NLR-Annotator tool enables annotation of the intracellular immune receptor repertoire. Plant Physiol. 183, 468-482 (2020).

Article

  1. Aitken, K. S., Jackson, P. A. & McIntyre, C. L. Quantitative trait loci identified for sugar related traits in a sugarcane (Saccharum spp.) cultivar Saccharum officinarum population. Theor. Appl. Genet. 112, 1306-1317 (2006).
  2. Hoarau, J.-Y. et al. Genetic dissection of a modern sugarcane cultivar (Saccharum spp.).II. Detection of QTLs for yield components. Theor. Appl. Genet. 105, 1027-1037 (2002).
  3. Ming, R. et al. Molecular dissection of complex traits in autopolyploids: mapping QTLs affecting sugar yield and related traits in sugarcane. Theor. Appl. Genet. 105, 332-345 (2002).
  4. Cooper, E. A. et al. A new reference genome for Sorghum bicolor reveals high levels of sequence similarity between sweet and grain genotypes: implications for the genetics of sugar metabolism. BMC Genom. 20, 420 (2019).
  5. Daugrois, J. H. et al. A putative major gene for rust resistance linked with a RFLP marker in sugarcane cultivar ‘R570’. Theor. Appl. Genet. 92, 1059-1064 (1996).
  6. Le Cunff, L. et al. Diploid/polyploid syntenic shuttle mapping and haplotype-specific chromosome walking toward a rust resistance gene (Bru1) in highly polyploid sugarcane ( ). Genetics 180, 649-660 (2008).
  7. Gish, L. A. & Clark, S. E. The RLK/Pelle family of kinases. Plant J. 66, 117-127 (2011).
  8. Brueggeman, R. et al. The barley stem rust-resistance gene Rpg1 is a novel diseaseresistance gene with homology to receptor kinases. Proc. Natl Acad. Sci. USA 99, 9328-9333 (2002).
  9. Klymiuk, V. et al. Cloning of the wheat Yr15 resistance gene sheds light on the plant tandem kinase-pseudokinase family. Nat. Commun. 9, 3735 (2018).
  10. Lewis, J. D., Lo, T., Bastedo, P., Guttman, D. S. & Desveaux, D. The rise of the undead: pseudokinases as mediators of effector-triggered immunity. Plant Signal. Behav. 9, e27563 (2014).
  11. Klymiuk, V., Coaker, G., Fahima, T. & Pozniak, C. J. Tandem protein kinases emerge as new regulators of plant immunity. Mol. Plant Microbe Interact. 34, 1094-1102 (2021).
Publisher’s note Springer Nature remains neutral with regard to jurisdictional claims in published maps and institutional affiliations.
Open Access This article is licensed under a Creative Commons Attribution 4.0 International License, which permits use, sharing, adaptation, distribution and reproduction in any medium or format, as long as you give appropriate credit to the original author(s) and the source, provide a link to the Creative Commons licence, and indicate if changes were made. The images or other third party material in this article are included in the article’s Creative Commons licence, unless indicated otherwise in a credit line to the material. If material is not included in the article’s Creative Commons licence and your intended use is not permitted by statutory regulation or exceeds the permitted use, you will need to obtain permission directly from the copyright holder. To view a copy of this licence, visit http://creativecommons.org/licenses/by/4.0/.
(c) The Author(s) 2024

Methods

Genome sequencing

Illumina libraries. Illumina libraries for this manuscript were sequenced on a combination of Illumina X10, HiSeq and NovaSeq platforms. HipMer assembly and selfed progeny (Extended Data Fig. 1a): sequencing libraries were constructed using an Illumina TruSeq DNA PCR-free library kit using standard protocols. Libraries were sequenced on an Illumina X10 instrument using paired ends and a read length of 150 base pairs.
Single flow-sorted chromosome libraries. Sequencing libraries were constructed using an Illumina TruSeq DNA Nano library kit using standard protocols. Libraries were sequenced on either the Illumina HiSeq2500 or NovaSeq 6000 instrument using paired ends and a read length of 150 base pairs.
Remaining Illumina libraries. Illumina Tight Insert Fragment, 400 bp-2 ug of DNA was sheared to 400 bp using the Covaris LE220 and size selected using the Pippin (Sage Science). The fragments were treated with end-repair, A-tailing and ligation of Illumina compatible adaptors (IDT) using the KAPA-Illumina library creation kit (KAPA Biosystems). The prepared libraries were quantified using KAPA Biosystems’ next-generation sequencing library qPCR kit (Roche) and run on a Roche LightCycler 480 real-time PCR instrument. The quantified libraries were then prepared for sequencing on the Illumina HiSeq sequencing platform using a TruSeq Rapid paired-end cluster kit, v.2, with the HiSeq 2500 sequencer instrument to generate a clustered flowcell for sequencing. Sequencing of the flowcell was performed on the Illumina HiSeq 2500 sequencer using HiSeq Rapid SBS sequencing kits, v.2, following a indexed run recipe.
PacBio libraries. Continuous long-read PacBio sequencing primer was then annealed to the SMRTbell template library and sequencing polymerase was bound to them using a Sequel Binding kit v.2.1. The prepared SMRTbell template libraries were then sequenced on a Pacific Biosystem Sequel sequencer using v. 3 sequencing primer, 1 M v. 2 single-molecule real-time cells and v. 2.1 sequencing chemistry with sequencing video run times. PacBio HiFi sequencing was performed using circular consensus sequencing (CCS) mode on a PacBio Sequel II instrument. High molecular weight DNA was either needle-sheared or sheared using a Diagenode Megaruptor 3 instrument. Libraries were constructed using SMRTbell Template Prep Kit v.2.0 and tightly sized on a SAGE ELF instrument ( ). Sequencing was performed using a 30 h video time with 2 h pre-extension and the resulting raw data was processed using the CCS4 algorithm.
RNA-seq libraries. Illumina RNA-Seq with poly(A) selection plate-based RNA sample preparation was performed on the PerkinElmer Sciclone NGS robotic liquid handling system using Illumina’s TruSeq Stranded mRNA HT sample prep kit using poly(A) selection of mRNA following the protocol outlined by Illumina in their user guide: https://support. illumina.com/sequencing/sequencing_kits/truseq-stranded-mrna.html, and with the following conditions: total RNA starting material was 1 ug per sample and eight cycles of PCR were used for library amplification. The prepared libraries were quantified using KAPA Biosystems’ next-generation sequencing library qPCR kit and run on a Roche LightCycler 480 real-time PCR instrument. Sequencing of the flowcell was performed on the Illumina NovaSeq sequencer using NovaSeq XP v. 1 reagent kits and an S4 flowcell, following a bp indexed run recipe.
Chromosome in situ hybridization. Chromosome mitotic metaphase preparations and fluorescence in situ hybridization were performed as described in ref. 13. The S. spontaneum retro-transposon specific oligo probe was designed by Arbor Biosciences using their proprietary software based on the retro-transposon sequences as described in ref. 50. Probes were either labelled with fluorochromes ATTO 488 or ATTO 550.
Single flow-sorted chromosome preparation. Stems of adult plants were cut into single-bud segments, cleaned and soaked in carbendazim solution for 24 h , placed in a plastic tray, covered with wet perlite and incubated at in the dark, until the roots were approximately 1.5 cm long. For cell-cycle synchronization and accumulation of metaphases, the segments were washed in , then transferred to a plastic tray filled with Hoagland solution containing hydroxyurea and incubated at 25 or for 18 h in the dark. After a 2 h recovery treatment, the roots were immersed in amiprophos-methyl solution and incubated for 3 h at 25 or . Suspensions of intact chromosomes were prepared by mechanical homogenization of root tips fixed with formaldehyde and Triton X-100, and stained with ,6-Diamidino-2-phenylindole dihydrochloride (DAPI) . The instrument used for flow sorting was a FACSAria II SORP flow cytometer (BD Biosciences) and Beckman Coulter MoFlo AstriosEQ cell sorter (Beckman Coulter). The software used was FACSDiva v.6.1.3 (BD Biosciences) and Summit v.6.2.2 (Beckman Coulter). For chromosome sorting, initial gating was set on dotplots DAPI-A versus FSC-A and the final sorting gate was set on DAPI-A versus DAPI-W dotplots to exclude chromosome doublets (Supplementary Fig. 15). The identity of flow-sorted fractions was determined by fluorescence microscopy of chromosomes sorted onto microscope slides . The analysis revealed that chromosomes could be separated into a few size fractions and while the sorted populations were 100% pure chromosomes, it was not possible to sort individual sugarcane chromosomes. To overcome this problem and prepare samples of chromosome-specific DNA for sequencing, single copies of chromosomes were sorted and their DNA amplified . This strategy for preparing sugarcane chromosomes for flow cytometry was first described in ref. 51 and is a modification of the protocol described in ref. 53.
Optical map construction. Ultra-high molecular weight (uHMW) DNA was isolated from agarose-embedded nuclei as previously described in ref. 54 with some modifications. Approximately 2 g of young, healthy R570 leaves were collected and fast-frozen in a 50 ml conical tube, ground in a mortar with liquid nitrogen and briefly incubated in Bionano homogenization buffer (HB+; Bionano Plant DNA isolation Kit; Bionano Genomics). Cell debris was filtered out by sequentially passing the homogenate through and cell strainers. Nuclei in suspension were pelleted by centrifugation at at for 20 min , resuspended in 3 ml homogenization buffer HB + and subjected to discontinuous density gradient centrifugation as described in the Plant Tissue DNA Isolation Base Protocol (Revision D;Bionano Genomics). The nuclei-enriched interphase layer was recovered, pelleted and embedded in low-melting-point agarose using a CHEFgel electrophoresis plug mould (Bio-Rad). The resulting plug was incubated twice, for a total of 12 h at , in Bionano Lysis buffer supplemented with Puregene Proteinase K, washed four times in Bionano Wash Buffer and five times in TE buffer. The uHMW nDNA was recovered by melting and digesting the plug with agarase at , followed by drop dialysis. In total, approximately uHMW DNA was recovered at a concentration of and used for subsequent genome mapping processes.
Genome mapping was performed using the Bionano Genomics Direct Label and Stain chemistry in a Bionano Saphyr instrument, using the method described in ref. 55 , with a few modifications. Approximately 800 ng of uHMW DNA was used per reaction and a total of eight flow cells were loaded to collect molecules with a total combined length of . A subset of molecules with a minimum length of 450 kb , and N50 of 547 kb were selected for assembly. The final total combined length of the filtered subset was 1,097,878,758 bp, with estimated effective coverage of assembly of .
Genome assembly was performed using the Bionano Genomics Access software platform (Bionano Tools v.1.3.8041.8044; Bionano Solve v.3.3_10252018), running the pipeline v. 7981 and RefAligner
v.7989. Two separated assemblies were performed using the optArguments_nonhaplotype_noES_BG_DLE1_saphyr.xml parameters. The initial assembly was performed without complex multi-path region (CMPR) cuts and produced 570 maps with a N50 length of 36.444 Mbp and total map length of 7,654.039 Mbp. One additional assembly was performed using the CMPR cut option, which introduces map cuts at potential duplications to reduce potential homeolog and phase switching. CMPR-cut-enabled assembly generated 1,512 maps with N50 length of 9.546 Mbp and total map length of .
PacBio HiFi Bionano hybrid scaffolds were generated using the Bionano Genomics Access software (Tools v.1.3) and the DLE-1 configuration file hybridScaffold_DLE1_config.xml using auto-conflict resolution. In total, the genome was captured in 122 hybrid scaffolds (Scaffold N50 = 78.823 and maximum scaffold size of 131.769 Mbp. The total scaffold length was , with 4.9 Mbp of sequence remaining un-scaffolded.
Genome assembly overview. Complete representation of all sequences in the 10 Gb genome of R570 was impossible without artificially duplicating collapsed sequences, of which there are many. To scaffold the contigs into chromosomes, we applied five complementary techniques (Supplementary Data). First, we used the Bionano optical map to initially order contigs into long-range scaffolds. Second, scaffolds were clustered into homeologous groups based on 237 linkage groups constructed from approximately 1.8 million simplex markers that were assayed from 96 self-pollinated progeny. Third, additional clustering was performed using genetic markers derived from single flow-sorted chromosome libraries sequenced from R570 (refs.52,53). After making initial joins, both simplex and single-chromosome genetic markers were re-aligned putative chromosomes to investigate misjoins, which were broken and corrected. Fourth, we resolved overlapping scaffolds by checking for redundant collinear sets of Sorghum bicolor gene models mapped against the contigs using pblat with default parameters. Finally, we manually evaluated chromatin linkages from 558 Gb (approximately ) data to manually verify joins made between scaffolds during chromosome construction (Extended Data Fig. 1a). The highly contiguous primary assembly ( contig N50; 67 chromosomes) also includes optical scaffolds (‘os’; ) and unanchored scaffolds ( ). The primary assembly contains gaps with an LTR assembly index (LAI; measure of intact LTR elements) of 22.82 , indicating the assembly is high quality and complete. Where possible, the alternate assembly ( contig N50; comprised of nearly identical haplotypes in the primary assembly; discussed in Supplementary Data), was physically anchored to the most similar chromosome in the primary assembly based on best unique alignments using minimap2(v.2.20-r1061) . Contigs and scaffolds that did not have a single best unique alignment were left unanchored. It should be noted that this sequence similarity-based grouping does not suggest that contigs on alternative scaffolds with the same name (for example, Chr6E and Chr6E_alt) necessarily come from the same biological haplotype. Thus, we provide the alternate scaffolds to represent the complete population of sequences in R570, and not as a source for global comparisons against the primary or other reference genomes.
Collapsed haplotypes. To determine which regions of the genome were perfectly identical and collapsed into a single haplotype (in contrast to the alternate assembly that contains nearly identical haplotypes, which could be distinguished by the assembler but most often not by unique HiFi read placements), PacBio HiFi reads were re-aligned back to the assembly using minimap2 (ref. 57) (parameters: -M 0 –secondary=no –hard-mask-level -t30 -x asm5). Read coverage (script: combinePAFsAndCount.R) was calculated using script: relative to the median depth (37) per 10 kb window, ignoring repetitive regions where the median coverage was greater than five (greater than raw coverage). Depth classifications ( ) were calculated from the median
coverage ranges , (3.5-5.0)), based on histogram peaks. Depth classifications per 10 kb window were converted to their run-length equivalent using the script: convertCountsToRLEs.R. To ensure accurate representation of haplotypes, NucFreq was used to analyse regions where haplotypes were collapsed ( depth regions; approximately 1.2 Gb of primary genome sequence). In summary, HiFi reads were aligned to the combined primary and alternate assembly using pbmm2 (v.1.1.0; parameters: –log-level DEBUG –preset SUBREAD –min-length 5,000 –sort). Samtools was then used to merge individual bam files (from each HiFi sequencing run) and exclude unmapped reads and supplementary alignments. (samtools view-F 2308). The NucFreq output coverage bed (obed) file was converted to run-length equivalents (script: RLEruns.R), where alternate base calls were greater than 20% of the combined coverage. To ensure adequate coverage for analysis, regions with outlier depth ranges beyond the 10th and 90th percentiles were excluded. Additionally, repetitive regions of the genome (95% repetitive, masked with a 24 mer and 10 kb regions where greater than of bases were annotated as retrotransposons (from LAI analysis) were also excluded using BEDtools subtract. Of the approximately 1.2 Gb considered, approximately 4.8 Mb of sequence ( of considered regions; 0.1% of bases within constructed primary chromosomes) appear to contain non-identically collapsed haplotypes, mainly driven by high depth collapsed regions ( depth regions of bases; depth regions of bases).
Genome annotation. Gene models were annotated using our PERTRAN pipeline (described in detail in ref. 60 using approximately 3.7 B pairs of stranded paired-end Illumina RNA-seq and 31 M PacBio Iso-Seq CCSs reads. In short, PERTRAN conducts genome-guided transcriptome short read assembly via GSNAP (v.2013-09-30) and builds splice alignment graphs after alignment validation, realignment and correction. The resulting approximately 1.5 M putative full-length transcripts were corrected and collapsed by genome-guided correction pipeline, which aligns CCS reads to the genome with GMAP with intron correction for small indels in splice junctions if any and clusters alignments when all introns are the same or 95% overlap for single exon. Subsequently 1,763,610 transcript assemblies were constructed using PASA (v.2.0.2) from RNA-seq transcript assemblies above. Homology support was provided by alignments to 17 publicly available genomes and Swiss-Prot proteomes. Gene models were predicted by homology-based predictors, FGENESH+ (v.3.1.0) , FGENESH EST (similar to FGENESH+, but using expressed sequence tags (ESTs) to compute splice site and intron input instead of protein/translated open reading frames (ORFs) and EXONERATE (v.2.4.0) ,PASA assembly ORFs (in-house homology constrained ORF finder) and from AUGUSTUS (v.3.1.0) trained by the high confidence PASA assembly ORFs and with intron hints from short read alignments. We improved these preliminary annotations by comparing sequences and gene quality between R570 subgenomes by aligning high-quality gene models between subgenomes and forming gene models from intragenomic alignments. We compared scores between these intragenomic homology-based models and the PASA assemblies; higher-scoring homology supported models that were not contradicted by transcriptome evidence were retained to replace existing partial copy. The selected gene models were subject to Pfam analysis and gene models with greater than Pfam TE domains were removed. We also removed (1) incomplete, (2) low-homology-supported without full transcriptome support and (3) short single exon (less than 300 BP CDS) without protein domain nor transcript support gene models. Repetitive sequences were defined using de novo by RepeatModeler (v.open1.0.11) and known repeat sequences in RepBase.
Comparative genomics. Syntenic orthologs among the R570 primary annotation, S. bicolor (v.3.1) , S. spontaneum (genotype AP85-441) , Setaria viridis (v.2.1) and the R570 monoploid path were inferred
via GENESPACE (v.0.9.4) pipeline using default parameters (analysis script: genespaceCommands.R). In brief, GENESPACE compares protein similarity scores into syntenic blocks using MCScan X and uses Orthofinder (v.2.5.4) to search for orthologs/paralogs within synteny constrained blocks. Syntenic blocks were used to query pairwise peptide differences among progenitor alleles, determine divergence among progenitor orthologs using S. bicolor syntenic anchors and search for progenitor specific orthogroups (scripts, PID_calc.R; GENESPACE_orthogroupParsing.R;Jupyter Notebook: r570_orthogroupProgenitorAnalysis_forSupp.ipynb).
Structural variants. To identify the large structural rearrangements (inversions, translocations and inverted translocations) and local variations (insertions and deletions), each homeologous chromosome group (B, C, D, E, F, G) was aligned to chromosome A using minimap2 (v.2.20-r1061) with parameter setting ‘-ax asm5 -eqx’. The resulting alignments were used to identify structural variations with SyRI (v.1.6) and annotation gff3 was used to obtain genes affected by variations between homeologous chromosomes.
Orthogroup diversity. Calculation of mean pairwise differences among progenitor specific homeologs was performed by first extracting all pairwise combinations of progenitor assigned alleles within orthogroups that were anchored by an S. bicolor ortholog. Among these, 25,000 peptide pairs per progenitor were randomly selected and pairwise aligned using R package Biostrings (v.2.70.2) . Pairwise identity calculation was based on matches/alignment length (PID2; script PID_calc.R). Multiple sequence alignments among syntenic orthogroups for sugar transport gene candidates were performed using MAFFT (v.7.487) and were visualized using ggmsa (script MSAalignmentPlots.R). Fold scores for each peptide were calculated using ESMfold (v.2.0.1) .
Resistance gene analogues. RGAs were annotated on scaffolds larger than 10 megabases with NLR-Annotator (v.2) using default parameters. The 4,116 predicted RGAs (Supplementary Table 11) were assigned to progenitors by intersecting the location of each motif with progenitor assignment blocks (Supplementary Table 6).
Progenitor divergence. To determine the neutral substitution rate between S. officinarum and S. spontaneum, 45,000 random ortholog pairs were extracted from all pairwise combinations of progenitor assigned alleles ( ) within S. bicolor anchored orthogroups. Peptide sequence pairs were aligned using MAFFT (v.7.487) and converted into coding sequence (CDS) using pal2nal (v.13) . Pairwise synonymous mutation rates (Ks) among sequences were calculated using seqinr (v.4.2-16) , finding a single synonymous (ks) mutation peak at 0.012 (Supplementary Fig. 13). Assuming a neutral nuclear mutation rate of to (ref. 78), S. officinarum and S. spontaneum diverged approximately million years ago.
Bru1 genetic and physical maps. We developed a map-based cloning approach adapted to the high polyploid context of sugarcane to target the durable major rust resistance gene Bru1. Haplotype-specific chromosome walking was performed through fine genetic mapping exploiting 2,383 individuals from self-progenies of R570 and physical mapping exploiting two BAC libraries . The high-resolution genetic map of the targeted region included flanking markers for Bru1 (at 0.14 and 0.28 cM ), 13 co-segregating markers and the partial BAC physical map of the target haplotype included two gaps ; Fig. 3b. To complete the physical map of the target Bru1 haplotype, we constructed a new BAC library (using enzyme BamHI) using a mix of DNA from four brown-rust-resistant individuals from the R570 S1 population. The BAC library contained 119,040 clones with an average insert size of 130 kb and covered 3.2 -fold the target haplotype and 1.6 -fold the total genome.
BAC-ends and BAC subclones from the four BACs (CIR009O20, 022M06, CIR012E03 and 164H22) surrounding the two remaining gaps (‘left’ and ‘right’) in the physical map of the Bru1 haplotype were isolated and used for chromosome walking (as described in ref. 44). Two BACs (CIRB251D13 ( 150 kb ) and CIRB286F09 ( 130 kb )) were identified and sequenced to fill the right gap. Five BACs (CIRB009N07 (100 kb), CIRB114G05 (100 kb), CIRB127D08 (125 kb), CIRB210D07 (105 kb) and CIRB236L05 ( 150 kb )) reduced the size of the left gap by 35 kb , but an unsized gap remained. The R570 genome assembly spanned the entirety of the Bru1 target haplotype region with one contig, closing the left gap ( ) enabling all candidate genes in the region to be investigated (Fig. 3b).
Bru1 candidate genes. The target gap-filled haplotype that represented 0.42 cM and 309 kb was manually annotated, predicting a total of 13 genes (Fig. 3b and Supplementary Table 13). Nine of these genes were also present on all or some of the hom(e)ologous BACs/ haplotypes in the R570 genome . Three of the curated genes were present only in the insertion specific to the Bru1 haplotype. Other whole-genome annotated genes (SoffiXsponR570.03Dg024000; SoffiXsponR570.03Dg024100; SoffiXsponR570.03Dg024600; SoffiXsponR570.03Dg024700) in the region were short, mono-exonic peptides that either contained no protein domains or appeared to be annotated transposable elements, and thus were not supported in the curated candidate gene list (Supplementary Table 13). Among the 13 predicted genes, we searched genes that presented high homology with genes already shown to be involved in resistance mechanisms. We identify five such genes, four genes encoding serine/threonine kinases (genes 1, 5, 7 and 8) and one gene encoding an endoglucanase (gene 13). Annotation of these genes was refined manually through phylogenetic analysis that included genes with high homology from other plants present in databases and search of conserved functional protein domains.
Gene 13, which encodes an endoglucanase, comprised 3 exons and two introns with a genomic size of 1.8 kb for a predicted transcript of 1.5 kb . Sequence alignment and phylogenetic analyses performed with beta-1-4 endoglucanase and beta-1-3 endoglucanase from monocots and dicots showed that gene 13 belongs to the beta-1-4 endoglucanase. This gene presents high homology (greater than ) with beta-1-4 endoglucanase from other plants and has the highest homology ( of identity, 100% coverage) with the orthologous Miscanthus gene (CAD6248271.1). Beta-1-4 endoglucanases are involved in cell development in particular on elongation of the cell wall but have not been reported as involved in disease resistance. This suggested that this gene is not a good candidate for being Bru1.
Gene 1 is composed of eight exons and seven introns. Its genomic size is 4.3 kb and the CDS size is 882 bp . The protein encoded by the gene has identity ( coverage) with a kinase involved in cell division control in Sorghum (XP_002451427.1) and therefore, it did not appear to be a good candidate.
Gene 5 is composed of six exons and five introns. Its genomic size was 1.1 kb and the predicted CDS size 534 bp . Alignment of its amino acid sequence with Interpro conserved protein domain database showed that only part of the protein (exons 4 to 6 ) has homology with subdomains VIb to XI of the serine/threonine kinases. This serine/threonine kinase was thus not complete, lacking some of the functional subdomains and appeared to be a pseudogene. Therefore, it did not appear to be a good candidate.
Gene 7 is composed of six exons and five introns, and gene 8 has four exons and three introns. Both present homology with receptor-like kinases. Annotation of conserved protein domains showed that gene 7 has all the 12 subdomains of kinases and thus could encode a functional protein, while gene 8 encompasses only part of these sub domains (I to VII) and could correspond to a pseudokinase. The classification with the ITAK database (http://itak.feilab.net/cgi-bin/itak/index.cgi)
revealed they both belong to the RLK-PELLE-DSLV family , the same family to which belong the barley stem rust resistance gene (RPG1 (ref. 46)) and the wheat yellow rust resistance gene (Yr15 (ref. 47)) shown to be a tandem kinase-pseudokinase (TKP). In addition, the third intron of gene 7 has a very large size of approximately 11 kb , including a large TE, a particular structure shared with RPG1 and Yr15 TKPs. Bru1, like RPG1 and , is among the relatively rare resistance genes that confer durable fungal resistance. This tandem kinase-pseudokinase (TKP7 and TKP8) is therefore a solid candidate for Bru1.

Reporting summary

Further information on research design is available in the Nature Portfolio Reporting Summary linked to this article.

Data availability

Additional work to support the findings of this manuscript can be found in the Supplementary Data section. Sequencing libraries (Illumina DNA/RNA and PacBio continuous long read/HiFi) are publicly available within the sequence read archive (SRA). BioProjects and individual accession numbers are provided in Supplementary Table 14. Genome assembly and annotation for the primary assembly is freely available at Phytozome (https://phytozome-next.jgi.doe.gov/). This Whole Genome Shotgun project has been deposited at DDBJ/ENA/GenBank under the accession JAQSUU000000000. The version described in this paper is JAQSUU010000000. Publicly available genomes used for comparative genomics can be downloaded here: Setaria viridis (v.2.1; https://phytozome-next.jgi.doe.gov/info/Sviridis_v2_1),Sorghum bicolor (v.3.1; https://phytozome-next.jgi.doe.gov/info/Sbicolor_v3_1_1), R570 monoploid tiling path (http://sugarcane-genome. cirad.fr) and Saccharum spontaneum (http://www.life.illinois.edu/ ming/downloads/Spontaneum_genome/). Raw data used for analysis in this paper are freely available on figshare (https://doi.org/10.6084/ m9.figshare.22138004). Source data are provided with this paper.

Code availability

Scripts and data files used for analysis in this paper are freely available on figshare (https://doi.org/10.6084/m9.figshare.22138004) and on GitHub (https://github.com/a-healey/r570scripts).
50. Huang, Y. et al. Species-specific abundant retrotransposons elucidate the genomic composition of modern sugarcane cultivars. Chromosoma 129, 45-55 (2020).
51. Metcalfe, C. J. et al. Flow cytometric characterisation of the complex polyploid genome of Saccharum officinarum and modern sugarcane cultivars. Sci. Rep. 9, 19362 (2019).
52. Metcalfe, C. J. et al. Isolation and sequencing of a single copy of an introgressed chromosome from a complex genome for gene and SNP identification. Theor. Appl. Genet. 135, 1279-1292 (2022).
53. Vrána, J. et al. Flow cytometric chromosome sorting in plants: the next generation. Methods 57, 331-337 (2012).
54. Vollger, M. R. et al. Long-read sequence and assembly of segmental duplications. Nat. Methods 16, 88-94 (2019).
55. Hufford, M. B. et al. De novo assembly annotation and comparative analysis of 26 diverse maize genomes. Science 373, 655-662 (2021).
56. Wang, M. & Kong, L. pblat: a multithread blat algorithm speeding up aligning sequences to genomes. BMC Bioinformatics 20, 28 (2019).
57. Li, H. Minimap2: pairwise alignment for nucleotide sequences. Bioinformatics 34, 3094-3100 (2018).
58. Li, H. et al. The Sequence Alignment/Map format and SAMtools. Bioinformatics 25, 2078-2079 (2009).
59. Quinlan, A. R. BEDTools: the Swiss-army tool for genome feature analysis. Curr. Protoc. Bioinformatics 47, 11.12.1-34 (2014).
60. Lovell, J. T. et al. The genomic landscape of molecular responses to natural drought stress in Panicum hallii. Nat. Commun. 9, 5213 (2018).
61. Wu, T. D. & Nacu, S. Fast and SNP-tolerant detection of complex variants and splicing in short reads. Bioinformatics 26, 873-881 (2010).
62. Haas, B. J. et al. Improving the Arabidopsis genome annotation using maximal transcript alignment assemblies. Nucleic Acids Res. 31, 5654-5666 (2003).
63. Salamov, A. A. & Solovyev, V. V. Ab initio gene finding in Drosophila genomic DNA. Genome Res. 10, 516-522 (2000).
64. Slater, G. S. C. & Birney, E. Automated generation of heuristics for biological sequence comparison. BMC Bioinformatics 6, 31 (2005).
65. Stanke, M. et al. AUGUSTUS: ab initio prediction of alternative transcripts. Nucleic Acids Res. 34, W435-9 (2006).
66. Smit, A. F. A. & Hubley, R. RepeatModeler Open-1.0. http://www.repeatmasker.org/ (2010).
67. McCormick, R. F. et al. The Sorghum bicolor reference genome: improved assembly, gene annotations, a transcriptome atlas, and signatures of genome organization. Plant J. 93, 338-354 (2018).
68. Mamidi, S. et al. A genome resource for green millet Setaria viridis enables discovery of agronomically valuable loci. Nat. Biotechnol. 38, 1203-1210 (2020).
69. Wang, Y. et al. MCScanX: a toolkit for detection and evolutionary analysis of gene synteny and collinearity. Nucleic Acids Res. 40, e49 (2012).
70. Emms, D. M. & Kelly, S. OrthoFinder: phylogenetic orthology inference for comparative genomics. Genome Biol. 20, 238 (2019).
71. Goel, M., Sun, H., Jiao, W. B. & Schneeberger, K. SyRI: finding genomic rearrangements and local sequence differences from whole-genome assemblies. Genome Biol. 20, 1-13 (2019).
72. Pages, H., Aboyoun, P., Gentleman, R. & DebRoy, S. Biostrings: string objects representing biological sequences, and matching algorithms (2008). R package version 2.0 (2015).
73. Katoh, K. & Standley, D. M. MAFFT multiple sequence alignment software version 7: improvements in performance and usability. Mol. Biol. Evol. 30, 772-780 (2013).
74. Zhou, L. et al. ggmsa: a visual exploration tool for multiple sequence alignment and associated data. Brief. Bioinform. 23, bbac222 (2022).
75. Lin, Z. et al. Evolutionary-scale prediction of atomic-level protein structure with a language model. Science 379, 1123-1130 (2023).
76. Suyama, M., Torrents, D. & Bork, P. PAL2NAL: robust conversion of protein sequence alignments into the corresponding codon alignments. Nucleic Acids Res. 34, W609-12 (2006).
77. Charif, D. & Lobry, J. R. in Structural Approaches to Sequence Evolution: Molecules, Networks, Populations (eds Bastolla, U., Porto, M., Roman, H. E. & Vendruscolo, M.) 207-232 (Springer Berlin Heidelberg, 2007).
78. Huang, C.-C. et al. Evolutionary rates of commonly used nuclear and organelle markers of Arabidopsis relatives (Brassicaceae). Gene 499, 194-201 (2012).
79. Asnaghi, C. et al. Application of synteny across Poaceae to determine the map location of a sugarcane rust resistance gene. Theor. Appl. Genet. 101, 962-969 (2000).
80. Minic, Z. Physiological roles of plant glycoside hydrolases. Planta 227, 723-740 (2008).
81. Levy, I., Shani, Z. & Shoseyov, O. Modification of polysaccharides and plant cell wall by endo-1,4-beta-glucanase and cellulose-binding domains. Biomol. Eng. 19, 17-30 (2002).
Acknowledgements The work (proposal: https://doi.org/10.46936/10.25585/60001084 and https://doi.org/10.46936/10.25585/60001194) conducted by the USA Department of Energy (DOE) Joint Genome Institute (https://ror.org/O4xm1d337), a DOE Office of Science User Facility and the DOE Joint BioEnergy Institute, are supported by the Office of Science of the USA Department of Energy operated under Contract No. DE-ACO2-O5CH11231 with Lawrence Berkeley National Laboratory. The work conducted at CIRAD was supported by the International Consortium for Sugarcane Biotechnology. The work at the Institute of Experimental Botany (IEB) was supported by the ERDF project “Plants as a Tool for Sustainable Global Development” No. CZ.02.1.01/0.0/0.0/16_019/0000827. We thank M. Tsai of HudsonAlpha for uploading libraries to the Short Read Archive of NCBI and D. Flowers for the ESMfold scores of sugar transport genes.
Author contributions C.M., J.D., P.C., S.R., M.W., C.H., L.B.B., J.W., P.P. and J.G. performed the DNA extraction, library preparation and sequencing. A.L.H., O.G., J.T.L., S.S., J.J., C.B.P., V.L. and J.C. performed the genome assembly and annotation. The analysis was conducted by A.L.H., O.G., J.T.L., V.L., N.P., N.H., J.Y.H., C.Z., A.F., A.D., R.S., J.S., K.A. and A.D.H. A.L.H., O.G., J.T.L., A.S., V.L., J.S., K.A. and A.D.H. wrote the manuscript. A.L.H., G.M., B.S., K.B., R.J.H., J.G., J.S., K.A. and A.D.H. contributed to the conception, project management and resource contribution.
Competing interests The authors declare no competing interests.

Additional information

Supplementary information The online version contains supplementary material available at https://doi.org/10.1038/s41586-024-07231-4.
Correspondence and requests for materials should be addressed to A. L. Healey, J. Schmutz or A. D’Hont.
Peer review information Nature thanks Elizabeth Cooper and the other, anonymous, reviewer(s) for their contribution to the peer review of this work.
Reprints and permissions information is available at http://www.nature.com/reprints.
A Genome assembly overview

C Primary-alternate sequence comparison

Chr6E Primary and Alternate Constructed Chromosome Alignment
B Hi-C contact map
D R570 Haplotype depths
Haplotype Depth Counted Bases (Gb) Represented Bases (Gb) Genome Representation (%)
0X 1.47 0.74 7.9
1X 4.63 4.63 49.6
2X 1.15 2.30 24.6
3X 0.35 1.05 11.3
4X 0.15 0.60 6.6
Represented genome size 9.32 Gb
E Genetic map simplex marker density
Extended Data Fig.1|See next page for caption.

Article

Extended Data Fig. 1 | R570 genome assembly overview and analysis. A) Simplified genome assembly pipeline for sugarcane R570. The pipeline combines multiple sequencing technologies (HiFi contigs, optical map, genetic map, single chromosome libraries, , Sorghum synteny), leveraging the strengths of each for phasing homeologous chromosomes, while using manual inspection and iterative steps to overcome each technology’s weaknesses. See ‘Supplemental Data’ for a full explanation and rationale for each step. B) Hi-C read heatmap for R570. Chromosomes are clustered based on homology, with reads ( coverage) aligned to the finalized version of the assembly.C) Alignment of primary and alternate chromosomes. During genome construction and finalization, near perfect duplicate contigs were discovered when constructing chromosomes, which were binned into an alternate assembly to improve the utility of the genome (see Supplemental Data). When possible these contigs were ordered and oriented into chromosomes based on their closest, unique alignment in the primary assembly. For example, Chromosome 6E and its anchored alternate were aligned using nucmer (v4.0;-1100–maxmatch-b 400). Dots represents a 1-1 alignment between the
two sequences that is greater than 15 kilobases in length. Each point is coloured based on alignment percent identity. D) Haplotype collapse summary for R570. To quantify regions of haplotype collapse within the R570 genome, PacBio HiFi reads were aligned to the assembly, using read depth to determine haplotype copy number. 0 X unique coverage regions represent genomic blocks where reads could not uniquely map between the primary and alternate assembly. Counted bases represent genome sequences where depth could be reliably calculated ( ). Represented bases account for collapsed bases in the assembly (example 1 Mb of 3 X coverage represented sequence). E) Simplex marker densities in the sugarcane R570 genome. Simplex markers (80 bp) from the R570 genetic map (obtained by testing 3:1 segregation pattern in 96 genotyped S1 progeny) were searched in the R570 genome assembly, retaining only exact, single copy match locations. Position densities were then visualized by calculating the percent number of matched bases per 10 kb sliding window ( 1 kb step length). Lines underneath each chromosome correspond to progenitor and haplotype collapse block assignments.
A SUT4 syntenic orthologs- multiple sequence alignment
B SIP2 syntenic orthologs- multiple sequence alignment
C PME syntenic orthologs- multiple sequence alignment
Extended Data Fig. 2 | See next page for caption.

Article

Extended Data Fig. 2 | Sugar accumulation candidate gene alignments. A) Alignment of syntenic orthologs for SUT4 (Sobic.008G193300). B) Alignment of syntenic orthologs for SIP2 (Sobic.002G075800). C) Alignment of syntenic orthologs for PME (Sobic.005G082100). Top section for each panel shows the full length of the alignment, while the bottom section displays a zoomed in region (outlined in a pink dotted outline) to show specific differences among species and alleles. Prog- progenitor assignment of R570 alleles. Each ortholog position was intersected with progenitor assignments to assign origin to each peptide. %PID- Percent pairwise identity (number of matches/alignment length*100)
for each syntenic ortholog relative to the S.bicolor(BTx623). Copy number (CN)-PacBio HiFi read depths (representing collapsed identical haplotypes) ranges were intersected with gene position to provide an indication of additional collapsed alleles (eg. copy number ; one represented allele + one identical collapsed allele). Fold score (FS)- syntenic orthologs (except for monoploid annotated peptides) were folded using ESMfold and scored for quality. Score provided is the percent of high-quality amino acids present in the peptide sequence.

natureportfolio

Corresponding author(s): Adam Healey
Last updated by author(s): Feb 13, 2024

Reporting Summary

Nature Portfolio wishes to improve the reproducibility of the work that we publish. This form provides structure for consistency and transparency in reporting. For further information on Nature Portfolio policies, see our Editorial Policies and the Editorial Policy Checklist.

Statistics

For all statistical analyses, confirm that the following items are present in the figure legend, table legend, main text, or Methods section.
Confirmed

The exact sample size ( ) for each experimental group/condition, given as a discrete number and unit of measurement
A statement on whether measurements were taken from distinct samples or whether the same sample was measured repeatedly
The statistical test(s) used AND whether they are one- or two-sided
Only common tests should be described solely by name; describe more complex techniques in the Methods section.
A description of all covariates tested
A description of any assumptions or corrections, such as tests of normality and adjustment for multiple comparisons

A full description of the statistical parameters including central tendency (e.g. means) or other basic estimates (e.g. regression coefficient) AND variation (e.g. standard deviation) or associated estimates of uncertainty (e.g. confidence intervals)
For null hypothesis testing, the test statistic (e.g. ) with confidence intervals, effect sizes, degrees of freedom and value noted Give values as exact values whenever suitable.
For Bayesian analysis, information on the choice of priors and Markov chain Monte Carlo settings
For hierarchical and complex designs, identification of the appropriate level for tests and full reporting of outcomes
Estimates of effect sizes (e.g. Cohen’s , Pearson’s ), indicating how they were calculated
Our web collection on statistics for biologists contains articles on many of the points above.

Software and code

Policy information about availability of computer code
Data collection
No software was used for data collection for this manuscript.
Data analysis
Genome Assembly: RACON(v1.4.10), HiFiAsm (v0.13-r308), Juicebox (v 1.11.08)
Genetic Map Construction: BWA-MEM (v0.7.12), JoinMap (v4.0), R/QTL (v1.42-8), DMwR (v0.4.1)
Optical Map Construction: Bionano tools (v1.3.8041.8044), Bionano Solve (v3.3_10252018), Bionano Genomics Access software (Tools 1.3)
Genome Assembly: pblat (v2.5) GENESPACE (v0.9.4), minimap2 (v 2.20-r1061)
Genome Annotation: GSNAP (v2013-09-30); PASA (v2.0.2);EXONERATE (v2.4.0) ; RepeatModeler (v.open1.0.11); FGENESH+(v3.1.0);
AUGUSTUS (v3.1.0)
Comparative Genomics: GENESPACE (v0.9.4), Orthofinder (v2.5.4), MCScanX (v2), SyRI (v1.6), Biostrings (v2.70.2), MAFFT (v7.487), seqinr (v4.2-16), ESMfold (v2.0.1), MAFFT (v7.487), NLR-Annotator (v2), pal2nal (v13), Olympus Cellsens software (v), FACSDiva (v6.1.3), Summit (v 6.2.2 ),Olympus Cellsens software (v3.2)
Other custom data scripts and raw data files required for analysis have been provided and uploaded to FigShare (https://doi.org/10.6084/ m9.figshare.22138004) or Github (https://github.com/a-healey/r570scripts) for free use.
For manuscripts utilizing custom algorithms or software that are central to the research but not yet described in published literature, software must be made available to editors and reviewers. We strongly encourage code deposition in a community repository (e.g. GitHub). See the Nature Portfolio guidelines for submitting code & software for further information.

Data

Policy information about availability of data
All manuscripts must include a data availability statement. This statement should provide the following information, where applicable:
  • Accession codes, unique identifiers, or web links for publicly available datasets
  • A description of any restrictions on data availability
  • For clinical datasets or third party data, please ensure that the statement adheres to our policy
Sequencing libraries (Illumina DNA/RNA and PacBio CLR/HiFi) are publicly available within the sequence read archive (SRA). BioProjects and individual accession numbers are provided in Supplemental Table 14. Genome assembly and annotation for the primary are freely available at Phytozome (https://phytozomenext.jgi.doe.gov/). This Whole Genome Shotgun project has been deposited at DDBJ/ENA/GenBank under the accession JAQSUU000000000. The version described in this paper is version JAQSUU010000000. Publicly available genomes used for comparative genomics can be downloaded here: Setaria viridis (v2.1; https:// phytozome-next.jgi.doe.gov/info/Sviridis_v2_1), Sorghum bicolor (v3.1; https://phytozome-next.jgi.doe.gov/info/Sbicolor_v3_1_1), R570 monoploid tiling path (http://sugarcane-genome.cirad.fr), Saccharum spontaneum (http://www.life.illinois.edu/ming/downloads/Spontaneum_genome/). Raw data used for analysis in this paper are freely available on figshare (https://doi.org/10.6084/m9.figshare.22138004).

Research involving human participants, their data, or biological material

Policy information about studies with human participants or human data. See also policy information about sex, gender (identity/presentation), and sexual orientation and race, ethnicity and racism.
Reporting on sex and gender Not applicable
Reporting on race, ethnicity, or Not applicable
other socially relevant
groupings
Population characteristics
Not applicable
Recruitment
Not applicable
Ethics oversight
Not applicable
Note that full information on the approval of the study protocol must also be provided in the manuscript.

Field-specific reporting

Please select the one below that is the best fit for your research. If you are not sure, read the appropriate sections before making your selection.
Life sciences Behavioural & social sciences Ecological, evolutionary & environmental sciences
For a reference copy of the document with all sections, see nature.com/documents/nr-reporting-summary-flat.pdf

Life sciences study design

All studies must disclose on these points even when the disclosure is negative.
Sample size Sample size was not predetermined prior to analysis. Selfed offspring genotyped for the genetic map ( ) we selected based on budgetary constraints.
Data exclusions No data was excluded from analyses.
Replication DNA/RNA was extracted from verified clones of the same genotype (R570). For repeatability, the same clone (held in greenhouses) could be selected and tested.
Randomization Genome assembly and analysis were conducted on a single sugarcane hybrid genotype ‘R570’, thus randomization is not necessary.
Blinding Genome assembly and analysis were conducted on a single sugarcane hybrid genotype ‘R570’, thus blinding is not necessary.

Reporting for specific materials, systems and methods

We require information from authors about some types of materials, experimental systems and methods used in many studies. Here, indicate whether each material, system or method listed is relevant to your study. If you are not sure if a list item applies to your research, read the appropriate section before selecting a response.

Dual use research of concern

Policy information about dual use research of concern

Hazards

Could the accidental, deliberate or reckless misuse of agents or technologies generated in the work, or the application of information presented in the manuscript, pose a threat to:

Experiments of concern

Does the work involve any of these experiments of concern:

Plants

Seed stocks Plant material used for sequenced was derived from sugarcane hybrid cultivar R570, held in greenhouses at CIRAD research station in Montpellier, France
Novel plant genotypes No novel genotypes used in this study.
Authentication No authentication procedures required.

Flow Cytometry

Plots

Confirm that:

The axis labels state the marker and fluorochrome used (e.g. CD4-FITC).
The axis scales are clearly visible. Include numbers along axes only for bottom left plot of group (a ‘group’ is an analysis of identical markers).
All plots are contour plots with outliers or pseudocolor plots.
A numerical value for number of cells or percentage (with statistics) is provided.

Methodology

Sample preparation Roots for single chromosome sorting were harvested from R570 plants, grown in pots. Roots were treated with hydroxyquinoline for 3 h , fixed for 72 h in methanol: acetic acid solution and stored in ethanol at 4 degrees C . The fixed roots were rinsed twice in water for 10 min each, treated in 0.25 N HCl for 10 min , rinsed for 10 min in water and placed in digestion buffer ( citrate buffer ) for 10 min . The root tips were cut and placed in an enzyme solution (5% Onozuka R-10 cellulase, 1% Y-23 pectolyase in digestion buffer) in a microtube at for approximately 3 h (the time varying with the size of the roots), Root tips were then rinsed in water and spread on a slide with a drop of 3:1 ethanol:acetic acid.- This strategy for staining sugarcane chromosomes was first described in D’hont et al. 1996 “Characterisation of the double genome structure of modern sugarcane cultivars (Saccharum spp.) by molecular cytogenetics”
Instrument Images were captured with a CCD camera attached to a BX53 Olympus microscope.
Software Olympus Cellsens software (v3.2)
Cell population abundance Individual cells were not used, rather chromosomes that were arrested in metaphase and stained. Thus, a numerical value for cells is not relevant.
Gating strategy Relative fluorescence intensity was used to separate flow karyotype peaks (I-V) and isolate single chromosomes for sequencing.
Tick this box to confirm that a figure exemplifying the gating strategy is provided in the Supplementary Information.

  1. Genome Sequencing Center, HudsonAlpha Institute for Biotechnology, Huntsville, AL, USA. CIRAD, UMR AGAP Institut, Montpellier, France. UMR AGAP Institut, Univ Montpellier, CIRAD, INRAE, Institut Agro, Montpellier, France. Department of Energy Joint Genome Institute, Lawrence Berkeley National Laboratory, Berkeley, CA, USA. Sugar Research Australia, Te Kowai, Queensland, Australia. Corteva Agriscience, Johnston, IA, USA. CSIRO Agriculture and Food, Queensland Bioscience Precinct, St Lucia, Queensland, Australia. Institute of Experimental Botany of the Czech Academy of Sciences, Centre of Plant Structural and Functional Genomics, Olomouc, Czech Republic. ERCANE, Sainte-Clotilde, La Réunion, France. Arizona Genomics Institute, University of Arizona, Tucson, AZ, USA. CSIRO Agriculture and Food, Urrbrae, South Australia, Australia. Queensland Alliance for Agriculture and Food Innovation, University of Queensland, Brisbane, Queensland, Australia. Joint BioEnergy Institute, Lawrence Berkeley National Laboratory, Emeryville, CA, USA. ARC Centre of Excellence for Plant Success in Nature and Agriculture, University of Queensland, Brisbane, Queensland, Australia. e-mail: ahealey@hudsonalpha.org; jschmutz@hudsonalpha.org; dhont@cirad.fr