الهندسة المكانية للخلايا النقوية وخلايا T تنظم التهرب المناعي والنتائج السريرية في سرطان الرئة Spatial Architecture of Myeloid and T Cells Orchestrates Immune Evasion and Clinical Outcome in Lung Cancer
فهم دور البيئة الدقيقة للورم (TME) في سرطان الرئة أمر حاسم لتحسين نتائج المرضى. لقد حددنا أربعة نماذج بيئية دقيقة مستقلة عن النسج في سرطان الرئة في مراحله المبكرة غير المعالج باستخدام تصوير الكتلة الخلوية في دراسة TRACERx.مرضى / 198 عينةمليون خلية). في الأورام الغدية المناعية النشطة، أماكن الفضاء لـزاد عدد الخلايا والماكروفاجات مع زيادة عبء النيوأنتيجين النسلي، في حين لوحظ مثل هذا الزيادة في مناطق خلايا البلازما وخلايا B في سرطانات الخلايا الحرشفية المعزولة من المناعة (LUSC). كانت البيئات الميكروية المناعية المنخفضة مرتبطة بحواجز الألياف الليفية أمام تسلل المناعة. كان النموذج الرابع، الذي يتميز بقلة اللمفاويات وزيادة تسلل العدلات المرتبطة بالورم (TAN)، يحتوي على خلايا ورمية مفصولة مكانيًا عن الأوعية الدموية وأظهر تباينًا مكانيًا منخفضًا داخل الورم. كانت سرطانات LUSC ذات مستوى عالٍ من TAN تحتوي على طفرات متكررة في جين PIK3CA. كانت الأورام ذات مستوى عالٍ من TAN تحمل تحتها نسخًا فرعية تم توسيعها مؤخرًا وتؤدي إلى النقائل، وكان لديها بقاء خالٍ من المرض أقصر بغض النظر عن المرحلة. توضح هذه النتائج الحواجز الجينومية والمناعية والفيزيائية أمام المراقبة المناعية وت implicate البيئات الميكروية الغنية بالعدلات في النقائل.
الأهمية: توفر هذه الدراسة رؤى جديدة حول التنظيم المكاني لبيئة الورم في سرطان الرئة في سياق المناعية الورمية، وتنوع الورم، وتطور السرطان. إن ربط التاريخ التطوري للورم مع البيئة الورمية المكانية المقاسة يقترح فرضيات آلية لتقدم الورم والانتقال مع تداعيات على نتائج المرضى والعلاج.
مقدمة
يوفر بيئة الورم الدقيقة (TME) ضغطًا انتقائيًا على التطور الكلوني لأورام الرئة. ما إذا كانت TME تعزز أو تقمع نمو الورم مرتبط بتنظيمها المكاني وأنماط خلاياها. مؤخرًا، كشفت تقنيات متعددة التداخل مثل تصوير الكتلة التصويرية (IMC) عن التعقيدات في التركيب والبنية الخاصة بـ TME عبر عدة أنواع من السرطان (1-9). أظهرت هذه الدراسات الأهمية السريرية للنهج المكاني المتعمق، حيث حددت التنظيمات متعددة الخلايا المرتبطة بنتائج المرضى، وأنماط الأورام، واستجابة العلاج في سرطان الغدد الرئوية (LUAD)، وسرطان الثدي، والورم الدبقي.
يمكن أن يتم تعديل التنظيم المكاني لـ TME بدوره من خلال التغيرات الجسدية التي تحدث خلال تطور الورم. وقد حددت دراسات IMC في سرطان الثدي أنماطًا مكانية مميزة
الهياكل المرتبطة بالطفرات المحركة الجسدية والنتائج المحددة بالنسج (2,4)، مما يظهر قيمة مثل هذه التحليلات التكاملية. لقد أظهرنا سابقًا أن زيادة التسلل المناعي، المستنتج من التوقيعات النسخية، كانت مرتبطة بآليات هروب مناعي متكررة داخل خلايا السرطان تؤثر على تقديم النيوانتجين، بما في ذلك فقدان التغايرية (LOH) لأليلات مستضد الكريات البيضاء البشرية (HLA)، في سرطان الرئة غير صغير الخلايا (NSCLC؛ المراجع 10، 11). اقترحت هذه النتائج اختيار تجمعات خلايا الورم الهاربة من المناعة في بيئة مفترسة. ومع ذلك، هناك حاجة إلى معلومات موضوعة مكانيًا لفهم الضغوط المناعية بشكل أفضل من خلال، على سبيل المثال، التفاعلات بين الخلايا والحواجز الفيزيائية لمراقبة المناعة التي تؤثر على تطور الورم. الدراسات المتعلقة بـ NSCLC التي تربط التفاصيل المكانية من التصوير عالي الأبعاد مع الجينوميات والنسخيات في مجموعات سريرية محددة جيدًا تمثل الرئيسية. ساهم كل من ك.س.س. إنفيلد، إ. كوليفر، ج. لي، و أ. ماغنيس بالتساوي في هذا المقال. ج. داونورد، إ. ساهاي، و ج. سوانتون أشرفوا بشكل مشترك على هذه المقالة.
هنا، استخدمنا تقنية IMC متعددة المناطق لوصف شامل لتكوين وترتيب TME في 198 منطقة ورمية وطبيعية من 81 مريضًا لم يتلقوا علاجًا سابقًا مصابين بسرطان الرئة غير صغير الخلايا في مجموعة TRACERx 100 (12). TRACERx [تتبع تطور السرطان من خلال العلاج (Rx)؛ ClinicalTrials.gov: NCT01888601] هو دراسة مستقبلية لتطور الورم من خلال أخذ عينات متعددة المناطق من الأورام في مرضى يعانون من مرض قابل للاستئصال في مراحله المبكرة. باستخدام بيانات IMC المزدوجة، وعلم الأمراض، وتسلسل الإكسوم الكامل (WES)، وتسلسل RNA (13-15)، درسنا العلاقة بين تنظيم TME، ومناعة الورم، والتاريخ التطوري. بحثنا كيف يمكن أن يتشكل TME من خلال عبء النيوأنتيجين العالي، وآليات الهروب المناعي الداخلية، والأنماط التطورية المرتبطة بالنتائج السيئة. يبدأ هذا العمل في فك العلاقات المعقدة بين TME وتطور ورم NSCLC. من خلال دراسة التباين المكاني لـ TME، يعزز هذا البحث المعرفة الحالية حول سؤال مفتوح حاسم – كيفية معالجة تباين TME واستخدام سياق TME للتطبيقات السريرية.
النتائج
بناء أطلس لبيئة سرطان الرئة غير صغير الخلايا في مراحله المبكرة
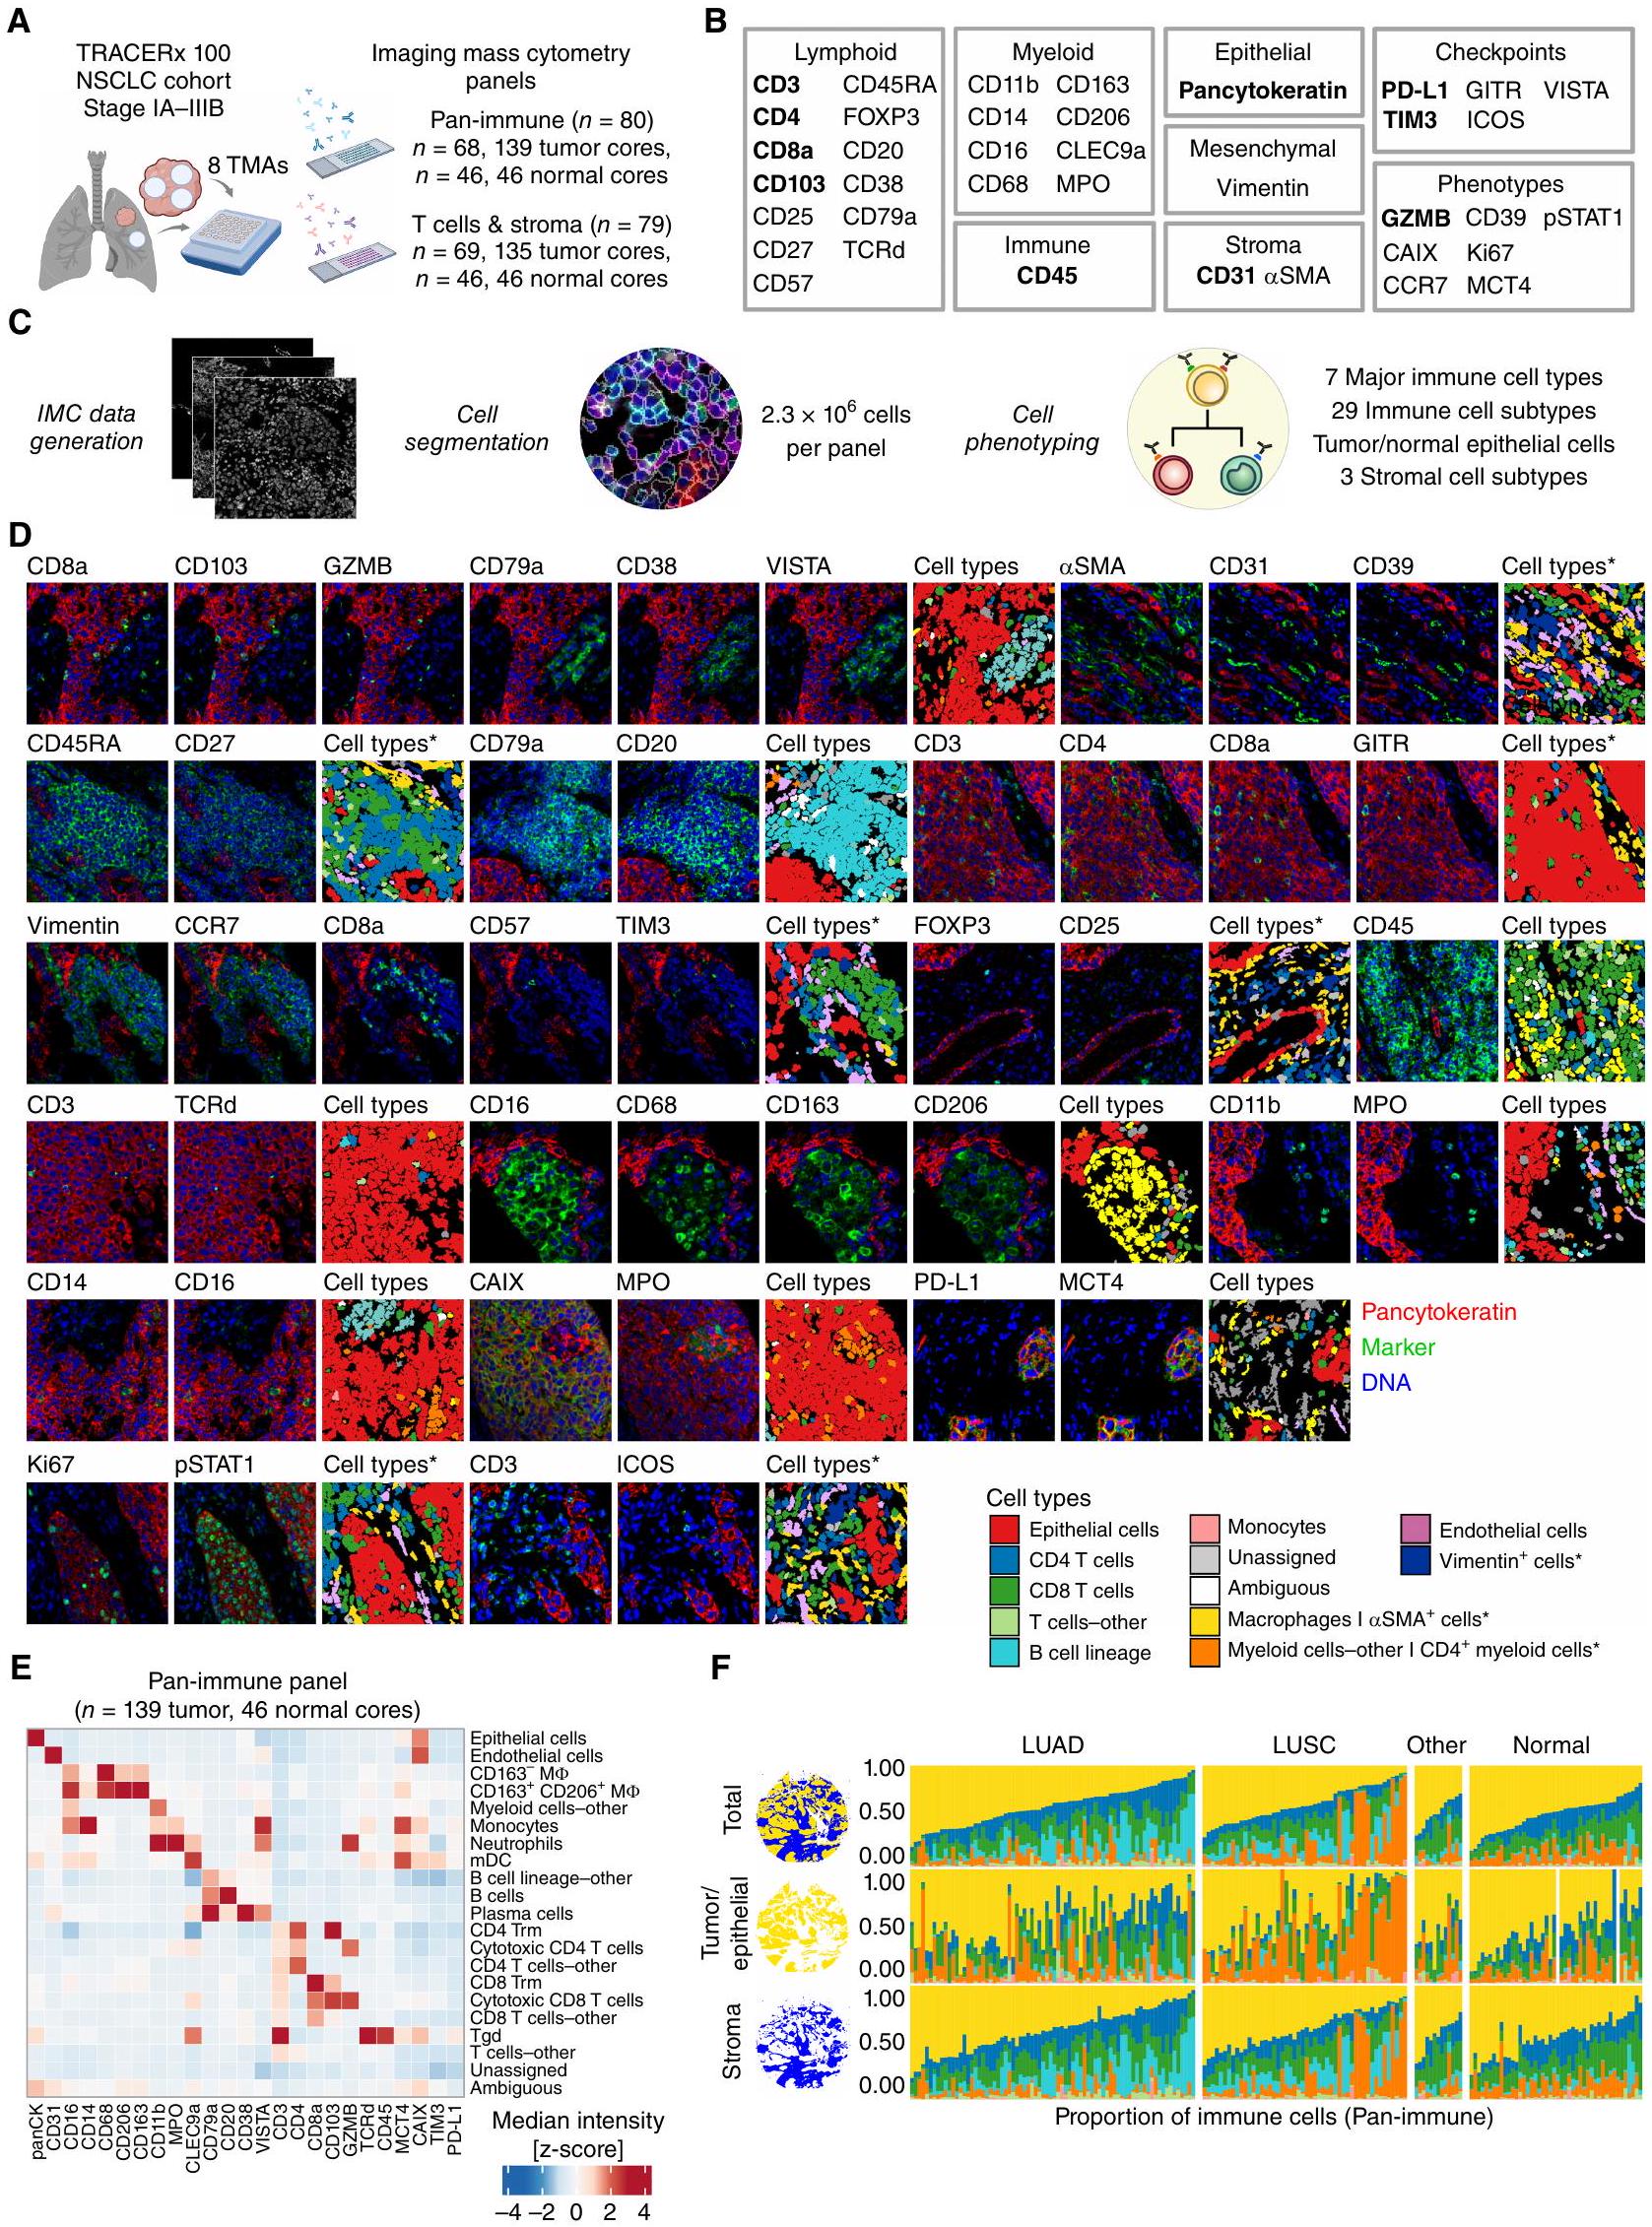
بهدف فهم دور البيئة المجهرية للورم في تطور الأورام، قمنا بإجراء تحليل عميق مكاني وسماتي للبيئة المجهرية للورم في سرطان الرئة غير صغير الخلايا في مراحله المبكرة (I-IIIA) والذي لم يتلقَ علاجًا بعد. قمنا بتوصيف التنوع في أنماط الخلايا، والمجتمعات المكانية المتكررة، وفئات البيئة المجهرية الأوسع في مجموعة TRACERx 100 متعددة المناطق. باستخدام تقنية IMC، قمنا بتوصيف التعبير في الموقع لـ 38 علامة على مصفوفات الأنسجة الدقيقة (TMA) لعينات الورم المنفصلة مكانيًا وعينات الرئة الطبيعية المجاورة التي تم الحصول عليها أثناء الاستئصال الجراحي. تم تحليل تنظيم البيئة المجهرية للورم باستخدام لوحة الأجسام المضادة المناعية الشاملة التي تستهدف أنواع خلايا المناعة الفطرية والتكيفية.185 نواة؛ الشكل 1B؛ الجدول التكميلي S1). تم استجواب حالات تمايز خلايا T الإضافية والخلايا الداعمة غير المناعية باستخدام لوحة خلايا T والستروما.أنواع الأنسجة الرئيسية لسرطان الرئة غير صغير الخلايا كانت ممثلة في المجموعة، بما في ذلك LUAD (الأورام، 76 نواة، لوحة مناعية شاملة)، سرطان الخلايا الحرشفية الرئوي (LUSC؛، 50 نواة)، وأنسجة أخرى من سرطان الرئة غير صغير الخلايا (NSCLC-أخرى؛أنسجة الرئة الطبيعية المجاورة (تمتلك بيانات IMC من عدة نوى ورمية متاحة لـ 41 من الأورام الممثلة. كان لدى اثني عشر مريضًا بيانات IMC متاحة فقط من نوى الرئة الطبيعية المجاورة. كانت الغالبية العظمى من النوى تمت دراستهم باستخدام لوحات IMC (168/198) وتوافرت بيانات تسلسل WES و RNA (RNA-seq) المزدوجة (الشكل التوضيحي التكميلي S1A-S1C؛ الجدول التكميلي S2؛ الطرق).
لتوصيف أنماط الخلايا بشكل شامل في الموقع، تم إجراء تقسيم الخلايا الموجه بواسطة التعلم العميق تلاه تصنيف الخلايا الفردية (الشكل 1C؛ الشكل التكميلي S2A-S2D). حددنا 2.3 مليون خلية لكل لوحة من الأجسام المضادة من سبعة أنواع رئيسية من خلايا المناعة و29 نوعًا فرعيًا من خلايا المناعة، بالإضافة إلى الخلايا الظهارية، والخلايا البطانية، والخلايا (الشكل 1C-E؛ الشكل التكميلي S2B؛ الشكل التكميلي S3A). تم إنشاء تسميات إضافية موجهة من قبل أطباء الأمراض باستخدام صور IMC المزدوجة وصور ملونة بالهيماتوكسيلين والإيوزين (H&E) لتمييز الميزات التي لا يمكن حلها فقط من خلال تعبير العلامات. ميزت هذه التسميات من أطباء الأمراض أيضًا بين الستروما المحيط بالأوعية والأرومات الليفية، البلعميات الهوائية، وخلايا الأورام والخلايا الظهارية غير الورمية، والتي تم استخدامها لاستجواب أنماط الخلايا الورمية المحددة وقياسات الفضاء (الشكل 1C؛ الشكل التكميلي S2C وS2D). تم قياس أنماط الخلايا بناءً على إيجابية العلامات، مع فحص، على سبيل المثال، نقص الأكسجة (CAIX)، استقلاب اللاكتات (MCT4)، التكاثر (Ki-67)، حالة الخلايا التائية المنهكة المتمايزة نهائيًا (TDT) (CD39، CD57؛ المرجع 16)، وجزيئات نقاط التفتيش المناعية (الشكل 1B وD؛ الطرق).
كانت البلعميات هي النوع الرئيسي الأكثر انتشارًا من خلايا المناعة في أنوية NSCLC (الوسيط 40% من خلايا المناعة، أنوية الأورام؛ الشكل 1F؛ الشكل التكميلي S3B)، بما يتماشى مع دراسات أخرى (1)، حيث كانت البلعميات تشكل نسبة أكبر من البلعميات CD163- (مقابل; الشكل التكميلي S3C). من الجدير بالذكر أن خلايا B في LUAD وخلايا المايلويد الأخرى، التي تتكون في الغالب من العدلات، في LUSC شكلت أكثر من 25% من خلايا المناعة في مجموعة فرعية من أنوية الأورام (14/76 LUAD، 13/50 LUSC؛ الشكل 1F؛ الشكل التكميلي S3C). من لوحة خلايا T والستروما، كانت الخلايا هي أكثر تجمعات الخلايا غير الظهارية وفرة في أنوية الأورام (الوسيط 16% من جميع الخلايا؛ الشكل التكميلي S3D). تم تصنيف الأنواع الفرعية من خلايا T CD4 وCD8 كخلايا T تنظيمية (Treg)، وخلايا غير ناضجة، وسامة، وذاكرة، وتجمعات منهكة (الشكل التكميلي S3E). شكلت الخلايا البطانية نسبة أكبر من إجمالي الخلايا في الأنوية الطبيعية المجاورة مقارنة بأنوية الأورام (مقابل)، بما يتماشى مع الوظيفة الفسيولوجية للرئة في نقل الغاز عبر تدفق الدم (الشكل التكميلي S3B وS3D).
لتحقيق فهم سياق الفضاء لأنماط الخلايا المحددة، قمنا بقياس كثافات الخلايا داخل قسمين من الأنسجة، عش الأورام/الظهارة، والستروما (الشكل 1F؛ الشكل التكميلي S2A). بالإضافة إلى ذلك، قمنا بإجراء تحليل لجوار الخلايا المحلية في NSCLC، والتي أظهرت مؤخرًا أنها تتوافق مع النتائج السريرية في LUAD (1)، وكشفت عن 10 مجتمعات جغرافية متكررة (C0-C9)
الشكل 1. يحدد سير عمل IMC المشهد المكاني للخلايا الفردية في بيئة الورم الدقيقة لـ NSCLC. أ، مجموعة TRACERx 100 IMC. قمنا بتطوير وتطبيق لوحتين من الأجسام المضادة IMC، المناعية الشاملة وخلايا T والستروما، على مصفوفات الأنسجة الدقيقة (TMA) من عينات سريرية تم جمعها أثناء الاستئصال الجراحي (تم إنشاؤها باستخدام BioRender.com). ب، أهداف الأجسام المضادة الموصوفة في هذه الدراسة. النص الغامق يشير إلى الأهداف التي تم الكشف عنها في كلا لوحتي IMC. ج، تم الحصول على بيانات IMC من TMAs الملونة ومعالجتها لتحديد الخلايا الفردية وأنماطها. محاصيل صور IMC التي تمثل العلامات من ب مع أنواع الخلايا المقابلة من اللوحة المناعية الشاملة، ما لم يتم التعليق عليها بنجمة للوحة خلايا T والستروما فقط. هـ، خريطة حرارية من كثافات الوسيط المعدلة بواسطة z-score للعلامات من اللوحة المناعية الشاملة عبر الأنواع الفرعية المحددة من الخلايا. و، نسبة أنواع خلايا المناعة الرئيسية المحددة في مجموعة بيانات IMC المناعية الشاملة لكل نواة TMA، محسوبة على إجمالي مساحة الأنسجة (موضحة كمجالات زرقاء وذهبية)، قسم الورم/الظهارة (مجال ذهبي)، أو قسم الستروما (مجال أزرق). في نواتين طبيعيتين، عكس إشارة الخلايا الظهارية خلايا رقيقة جدًا، والتي لم يتم حلها في قسم ظهاري. جميع البيانات من هذه النوى ممثلة بواسطة قسم الستروما. تنطبق أسطورة ألوان أنواع الخلايا على و، حيث تشير النجوم إلى أنواع الخلايا المحددة في لوحة خلايا T والستروما فقط. LUAD، سرطان الغدة الرئوية؛ LUSC، سرطان الخلايا الحرشفية في الرئة؛ NSCLC، سرطان الرئة غير صغير الخلايا؛ الأخرى، أنواع أخرى من أنسجة سرطان الرئة غير صغير الخلايا؛ IMC، تصوير الكتلة الخلوية. من الخلايا التي تتواجد بشكل متكرر داخل أنوية الأورام عبر الأنواع الفرعية النسيجية (الشكل التكميلي S3F وS3G؛ الطرق).
قمنا بتقييم العلاقة بين تجمعات الخلايا والمجتمعات مع المتغيرات السريرية (الشكل التكميلي S4AS4C؛ الطرق). في كل من LUAD وLUSC، كانت كثافات المجتمع C9: خلايا B وخلايا البلازما، عند اختبارها بشكل منفصل، مرتبطة بعبء طفرات الورم العالي (TMB). كان TMB العالي مرتبطًا أيضًا بزيادة كثافات البلعميات وCD 4 Tem في LUAD وCD8-TDT المنهكة في LUSC، مشابهة للملاحظات السابقة (16). من بين الارتباطات المهمة، كانت مجموعة C6: البلعميات ومجتمع الخلايا، بالإضافة إلى عدة أنواع فرعية من الخلايا التي تميز هذا المجتمع، غنية في المدخنين الحاليين مقارنة بالمدخنين السابقين والذين لم يدخنوا أبدًا في LUAD.
معًا، دمجنا المعلومات المكانية والظاهرة من التصوير المتعدد مع تعليقات علم الأمراض لتطوير إطار لدراسة تكوين وتنظيم TME في NSCLC.
تركيب المناعة في أعشاش الأورام والستروما المحيطة يكشف عن أربع فئات TME في NSCLC
تم وصف ثلاث فئات من المناعة بشكل عام سابقًا للأورام الصلبة من خلال الفحص النسيجي لعدد وموقع الخلايا اللمفاوية المتسللة إلى الورم (TIL) داخل مقاطع الورم: ملتهبة، مستبعدة من المناعة، وباردة (17). لا تزال الأنواع الفرعية من TME وتنوعها المكاني في NSCLC بحاجة إلى توصيف شامل بالارتباط مع الآليات الجينية والجزيئية والخلوية للهروب المناعي.
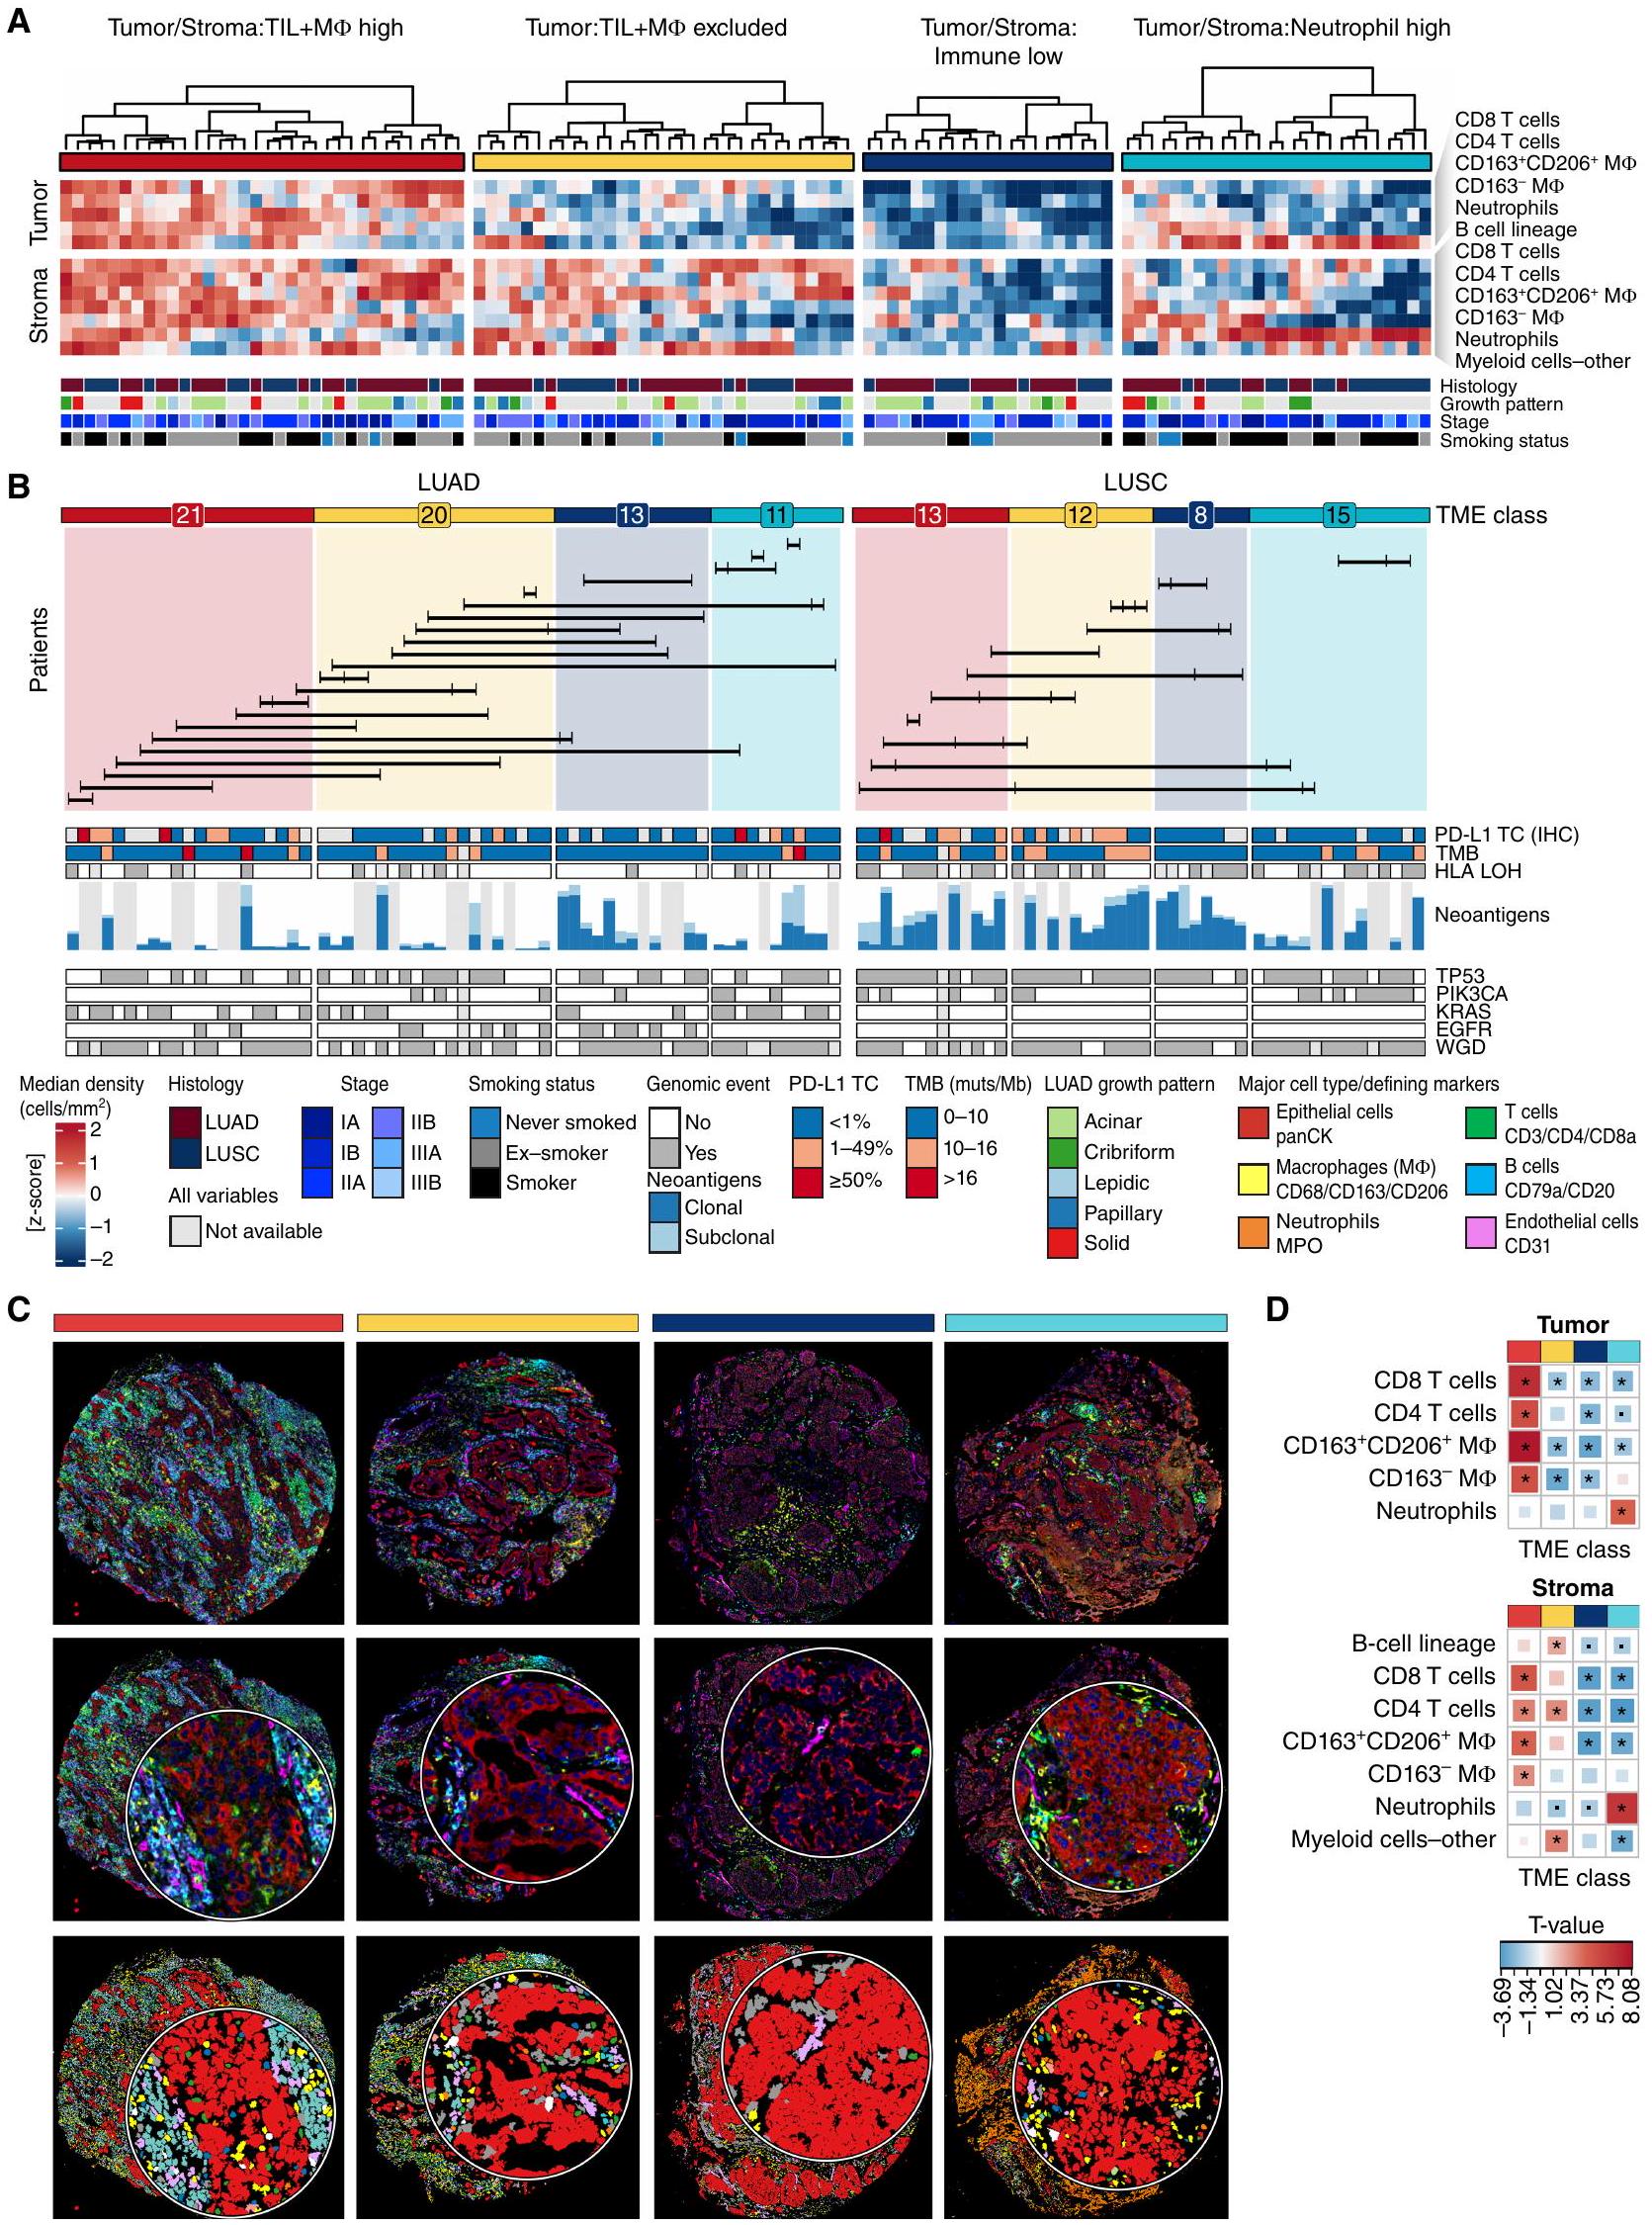
لفهم كيف يرتبط تنظيم TME بالهروب المناعي وتطور الورم، قمنا بإجراء تصنيف واسع بناءً على كثافات أنواع خلايا المناعة الرئيسية وحددنا هياكل TME الشائعة في NSCLC. قمنا بقياس كثافات الأنواع الرئيسية من المناعة التكيفية والفطرية المحددة داخل عش الورم وأقسام أنسجة الستروما. من خلال التجميع الهرمي غير المراقب، لاحظنا أربع فئات شائعة من TME محددة عبر جميع الأنواع الفرعية النسيجية في NSCLC (الشكل 2A-C؛ الشكل التكميلي S5A-S5C). تم تمييز هذه الفئات من TME من خلال كثافات خلايا ثلاث مجموعات واسعة من خلايا المناعة – TILs (الخلايا والخلايا)، البلعميات ، والعدلات – داخل عش الورم (T) أو الستروما (S) لفئة واحدة من TME مقارنة بالفئات الأخرى وتم التعليق عليها وفقًا لذلك كـ TS:TIL+MФ عالية، T:TIL+MФ مستبعدة، TS:مناعة منخفضة، وTS:عدلات عالية. بالنسبة لنسبة صغيرة من أنوية الأورام في المجموعة ()، تم تصنيف فئة TME على أنها غير محددة (الشكل التكميلي S5A؛ الطرق).
تشكل فئة TS:TIL+M$ العالية، التي تمثل من أنوية أورام NSCLC (LUAD، 13 LUSC، 5 أنوية NSCLC-أخرى)، أورامًا “ساخنة” مناعيًا تتميز باختراق عالٍ من TILs وM في كل من عش الورم ومنطقة الستروما (TS؛ الشكل 2D). كانت معظم الأنواع الفرعية من TIL والتي تم تحديدها، تتراوح من خلايا T CD 8 غير الناضجة إلى CD 8 TDT المنهكة، غنية في هذه الفئة مقارنة بالفئات الأخرى من TME (الشكل التكميلي S5D).
عبر جميع الأنواع الفرعية النسيجية، لاحظنا مجموعة فرعية من أنوية الأورام ذات اختراق منخفض من TILs وM ps في عش الورم واختراق عالٍ من خلايا B، وخلايا T CD4، ومجموعة فرعية من خلايا المايلويد باستثناء العدلات والبلعميات في الستروما (الشكل 2D). بسبب الاختراق الإحصائي الأقل من TILs وM في عش الورم (T)، تم تصنيف هذه الأنوية على أنها مستبعدة (من أنوية NSCLC، LUAD، 12 LUSC، 1 NSCLC-أنواع أخرى).
نسبة أصغر من أنوية الأورام () كانت لديها اختراق TS أقل بشكل ملحوظ من خلايا T وM مقارنة بتلك من فئات TME الأخرى، والتي أطلق عليها TS:مناعة منخفضة (LUAD، 8 LUSC، 3 NSCLC-أنواع أخرى).
أخيرًا، لاحظنا فئة TME مميزة، TS:عدلات عالية، في 19% من أنوية الأورام (LUAD، 15 LUSC، 1 NSCLC-أنواع أخرى) مع اختراق أقل من TILs وفي كل من عش الورم والستروما وزيادة ملحوظة في عدد العدلات في عش الورم أو الستروما (TS) مقارنةً بنوى الورم من فئات TME الأخرى. على الرغم من أن فئات TME تم تعريفها لجميع الأنواع النسيجية الفرعية مجتمعة، إلا أن نوى LUSC كانت غنية بالعدلات في عش الورم بشكل أكثر تكرارًا من نوى LUAD (الشكل التكميلي S5D).
لتقييم التباين داخل الورم (ITH) لهذه الفئات من البيئة المجاورة للورم، قمنا بتقدير احتمال ملاحظة نفس فئة البيئة المجاورة للورم عبر جميع أنوية الورم.الأورام، أخذ عينات عشوائية من اثنين إلى أربعة أنوية لكل ورم، الطرق). كان لدى TS:Neutrophil العالي في البيئة المجهرية للورم أعلى احتمال للاكتشاف في جميع الأنوية (0.5)، تلاه TS:Immune المنخفض (0.38)، وTS:TIL+MI العالي (0.3)، وTS:TIL+MФ المستبعد (0.21).
أظهرت المقارنة حسب المتغيرات السريرية أن الفئة المنخفضة من TS:Immune كانت مرتبطة بانخفاض TMB ودرجة الورم لعلامة PD-L1 المناعية النسيجية (IHC) في LUAD و LUSC (الشكل 2B) والأورام من المدخنين السابقين وغير المدخنين في LUAD (الشكل التوضيحي S5E). كما كانت إيجابية خلايا الورم لعلامة PD-L1 المناعية النسيجية غائبة أيضًا (<1%) في LUSCs ذات نسبة عالية من TS:Neutrophil، في حين كانت درجة الإيجابية لـتم إثراؤه بشكل كبير بـتم استبعاد LUADs العالية وT:TIL+MФ من LUSCs مقارنة بالنوى من فئات TME الأخرى. في LUSC، كانت فئة TS:TIL +M D العالية غنية في الأورام من المرحلة الثانية والثالثة مقارنة بالمرحلة الأولى (الشكل التوضيحي S5E). كانت النوى الورمية التي تحتوي على فئة TS:Neutrophil العالية في LUAD أكثر تكرارًا.
الشكل 2. أربع فئات من بيئة الورم المجهرية في سرطان الرئة غير صغير الخلايا تم تعريفها من خلال التركيب المناعي في أعشاش الورم والستروما المحيطة. أ، تم تصنيف نوى الورم إلى أربع فئات من بيئة الورم المجهرية، مستمدة من تجميع كثافات خلايا المناعة في عش الورم والستروما. فقط LUAD (أنوية، 35 ورم) وLUSC (تتميز أنوية الأورام (الأورام) ، وتظهر التعليقات السريرية المقابلة. تُظهر أنماط النمو الإقليمية لـ LUAD: اللبي (منخفض الدرجة) ، الغدي والورمي (متوسط الدرجة) ، الصلب والشبكي (عالي الدرجة). ب ، تصنيفات TME معروضة بشكل منفصل لـ LUAD و LUSC. تشير الأرقام إلى عدد الأنوية التي تحمل فئة TME معينة لكل نوع من أنواع النسج. يُظهر الرسم البياني الشريطي العدد الإجمالي للنيوانتجينات المعبر عنها لجميع الأليلات HLA المتوقعة في النطاق 0-269 لـ LUAD و 23-160 لـ LUSC ، ملونة بحالتها الكلونية والفرعية. تصل الخطوط الأفقية بين أنوية الأورام من نفس الورم متعدد المناطق.الأورام). تعرض أشرطة التوضيح ميزات الجينوم الورمي وصبغة PD-L1 لخلايا الورم (TC) (SP142 IHC) للنوى الورمية المقابلة. ج، صور مركبة وخرائط نوع الخلايا لأمثلة تمثيلية لكل فئة من فئات TME. قصاصات الصور هيبقطر. د، خريطة حرارية لقيم T المستمدة من نموذج LMEM لكثافة نوع الخلايا الرئيسية عبر فئات TME، تم تعديلها حسب نوع النسيج كأثر ثابت والمريض كأثر عشوائي. يتم الإشارة إلى العلاقات المهمة بنجمة لـ. TIL، الخلايا اللمفاوية المتسللة إلى الورم؛ MФ، البلعميات؛ LUAD، أدينوكارسينوما الرئة؛ LUSC، سرطان الخلايا الحرشفية في الرئة؛ NSCLC، سرطان الرئة غير صغير الخلايا؛ TME، الميكروبيئة الورمية؛ TMB، عبء الطفرات الورمية؛ muts/Mb، الطفرات لكل ميغاباز؛ panCK، البانسايتوكيرتين؛ LMEM، نموذج التأثيرات المختلطة الخطية. كان لديه نمط نمو عالي الجودة مقارنة بالنمطين المنخفض والمتوسط مجتمعتين ( مقابل تتوافق هذه النتائج مع التقارير السابقة حول ارتباطات TIL مع تعبير PD-L1 في خلايا الورم وTMB (18).
تترافق المجتمعات متعددة الخلايا مع عبء النيوانتجين والتجنب المناعي الذاتي
سعينا لفهم كيف كانت تنظيمات البيئة المجهرية للورم المرتبطة بعرض النيوأنتيجين وآليات التهرب المناعي الذاتية للخلايا السرطانية، وتحديد الوسطاء المحتملين الخارجيين للورم للتهرب المناعي. باستخدام عينات تحتوي على بيانات IMC وWES وRNA-seq المترابطة، بحثنا في علاقات الأنماط الخلوية المحددة مكانيًا، والمجتمعات الخلوية، وفئات البيئة المجهرية للورم مع عبء النيوأنتيجين وعيوب آلية عرض المستضدات.
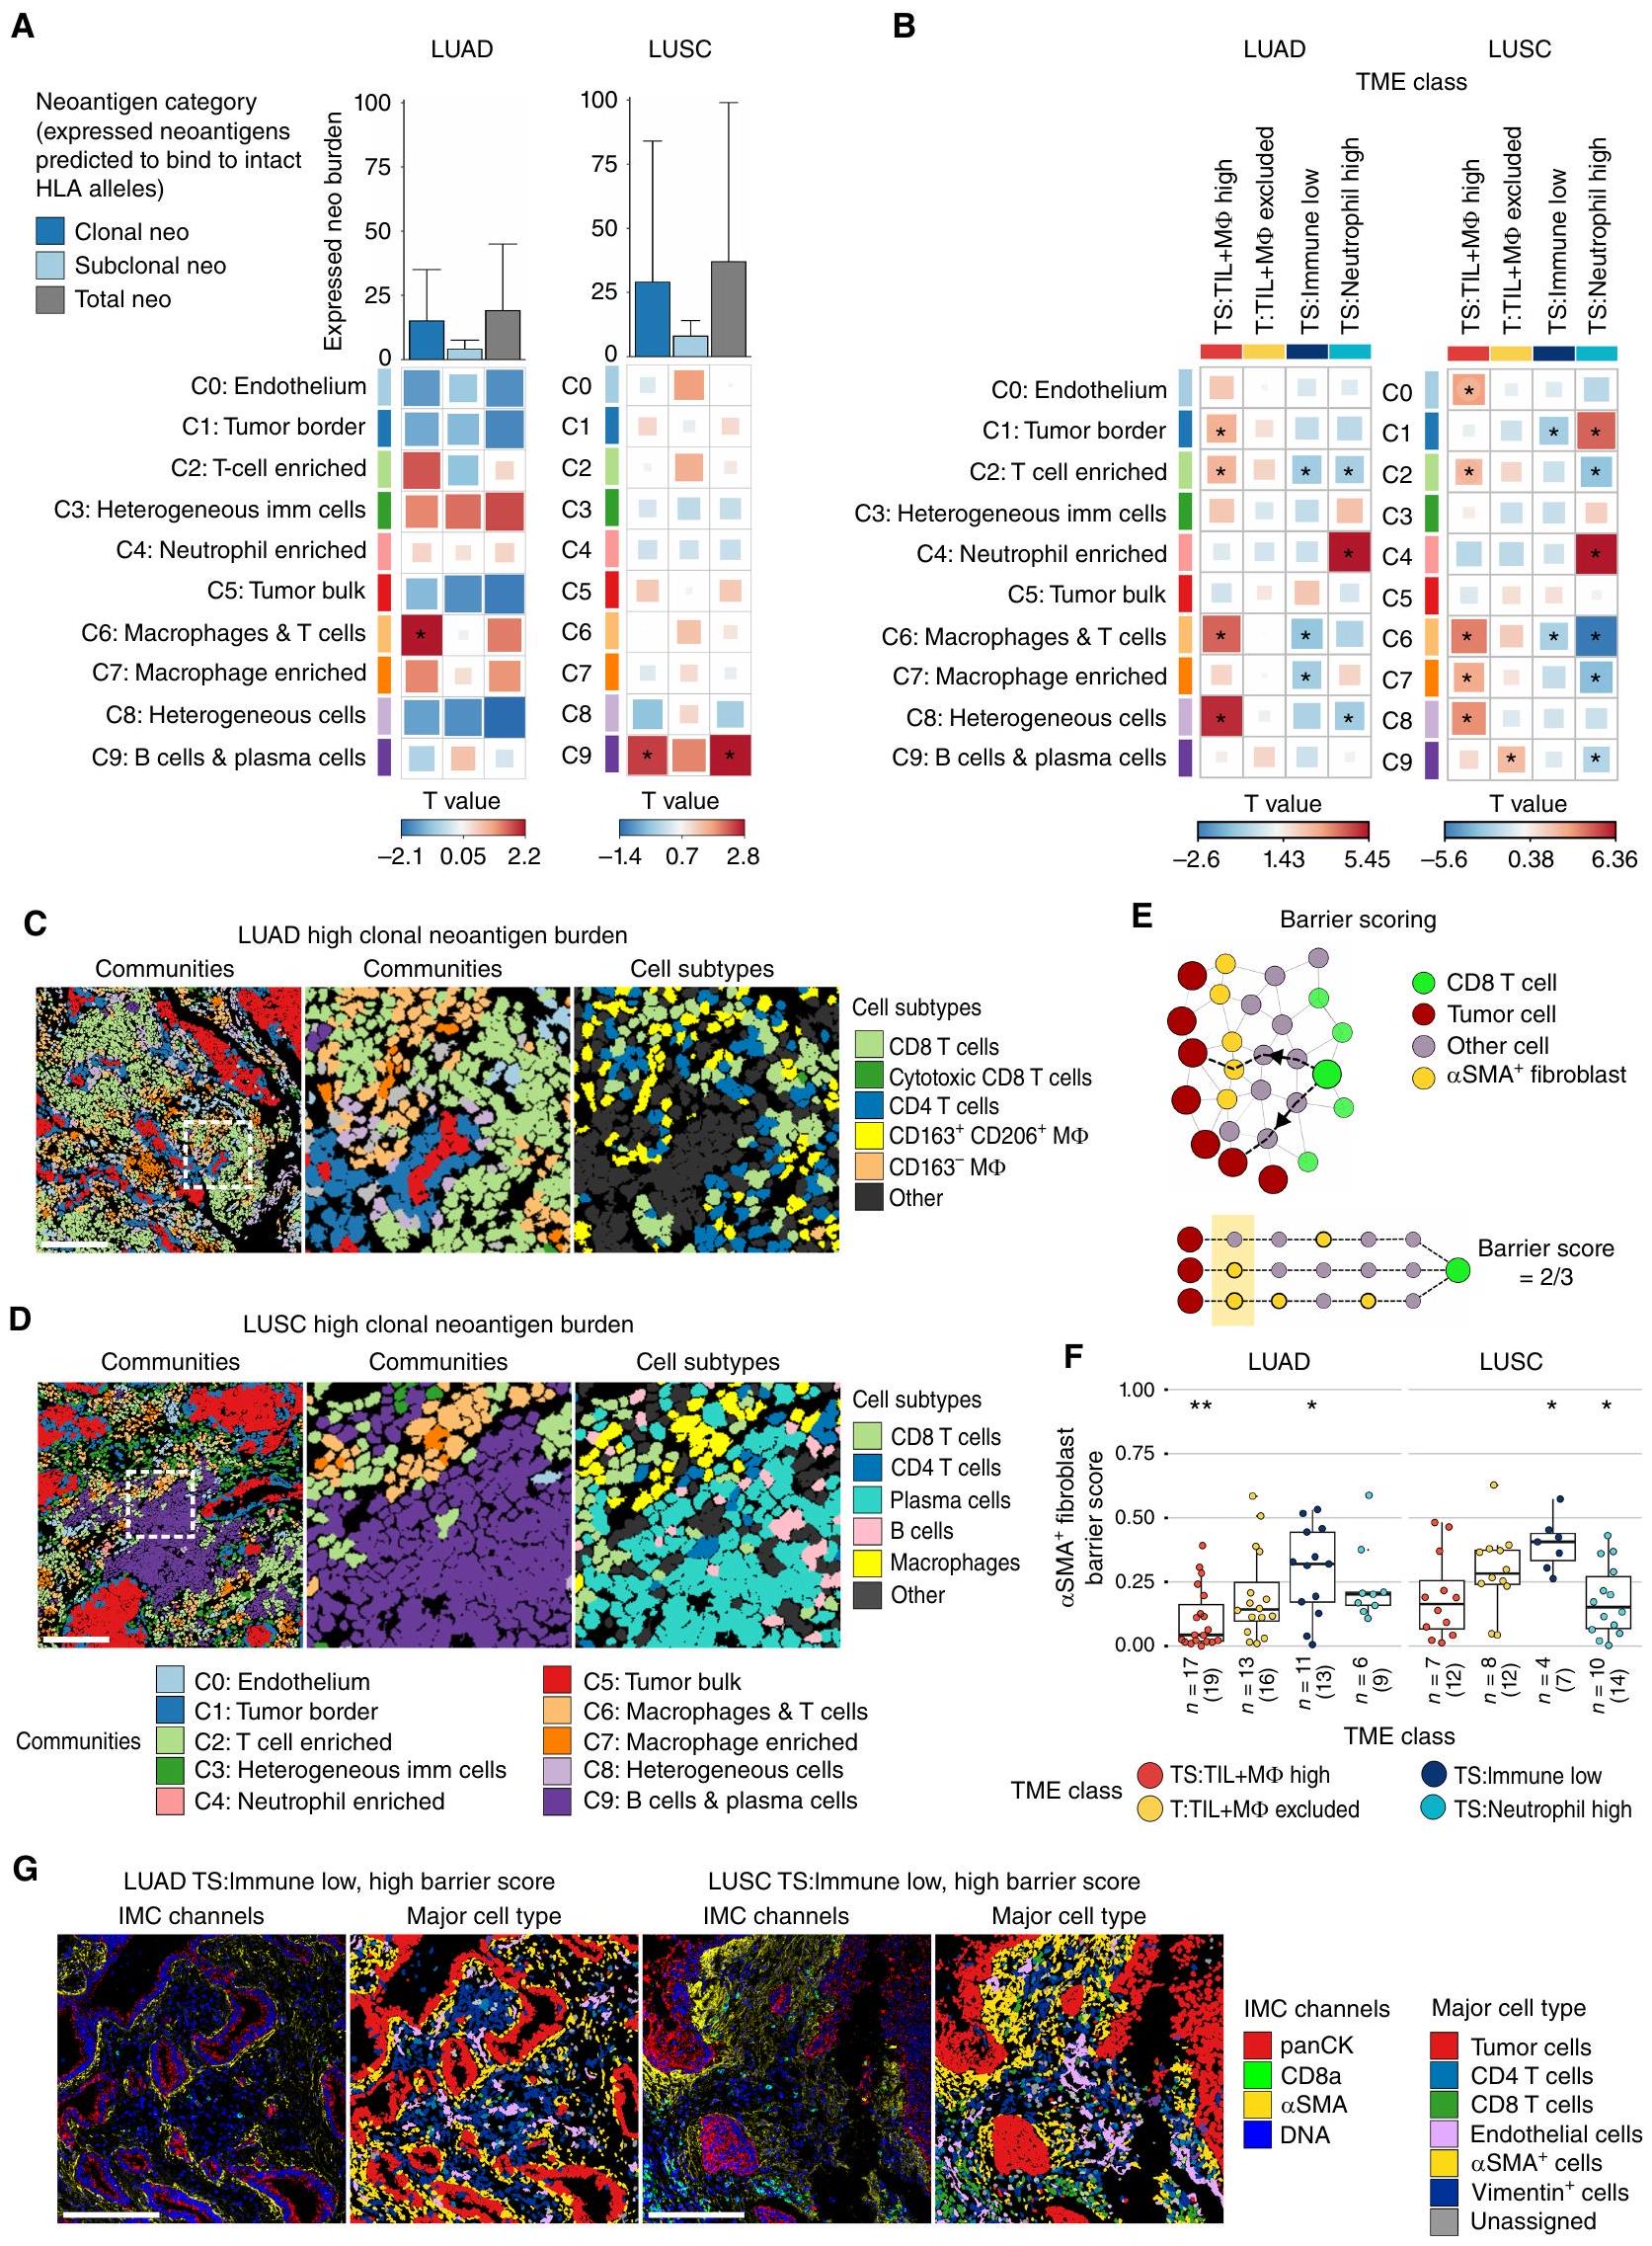
قمنا أولاً بربط كثافات المجتمعات الخلوية المستمدة من IMC مع عدد النيوأنتيجينات المعبر عنها المتوقعة للارتباط بالأليلات HLA السليمة (الطرق). حددنا ارتباطات محددة بالأنسجة بين المجتمعات المكانية وعبء النيوأنتيجين، مع تصحيح لعينات متعددة المناطق وحالة تدخين المرضى. في LUAD، كان عبء النيوأنتيجين النسلي مرتبطًا بالمجتمع C6:macrophages والخلايا (نموذج التأثيرات المختلطة الخطية، LME )، مجتمع غني في TS:TIL+M TMEs عالية وTS منخفضة: TMEs المناعية المنخفضة (الشكل 3A-C). المجتمع C6: البلعميات وتمتاز الخلايا بكثافات متزايدة لعدة مجموعات من خلايا T من نوع CD4 و CD8 مقارنةً بمجموعات أخرى، بما في ذلك خلايا T السامة من نوع CD8 وخلايا الذاكرة المقيمة من نوع CD8 (Trm)؛ ومع ذلك، كان هناك زيادة في CD163 و CD163.CD206تجمعات البلعميات تميزت بـ C6: البلعميات والخلايا من C2: غنية بخلايا T (الشكل التكميلي S3F). كانت أقلية من أنواع الخلايا الفرعية مرتبطة بشكل كبير بعبء النيوأنتيجين النسلي عندما تم اعتبارها بشكل مستقل عن توطين المجتمع (الشكل التكميلي S6A)، مما يشير إلى أن المواطن المحلية التي تقيم فيها ذات صلة بفهم الاستجابة المناعية المضادة للورم.
في LUSC، كانت عبء المستضدات النيوانية المعبر عنها والمجموع الكلي المتوقع أن ترتبط بالأليلات HLA السليمة مرتبطًا بخلايا C9:B وخلايا البلازما (LME )، مجتمع غني في T:TIL+MФ مستبعد TMEs ومفتقر في TS: كريات الدم البيضاء العالية TMEs (الشكل 3A وB وD). كانت كل من خلايا B وخلايا البلازما مُعزَّز في المجتمعالخلايا وخلايا البلازما، ولكن فقط كثافات خلايا البلازما الموجودة في السدى كانت مرتبطة بشكل كبير مع الحمل الكلوني والإجمالي للنيوانتجين في سرطان الرئة ذو الخلايا الحرشفية (الأشكال التكميلية S3F و S6A). تكشف هذه التحليل المكاني أن خلايا البلازما والمجتمع الذي تعيش فيه مرتبطة ليس فقط بارتفاع TMB ولكن أيضًا بحمل النيوانتجين الكلوني والإجمالي في مراحل مبكرة من سرطان الرئة ذو الخلايا الحرشفية.
من الجدير بالذكر أن المجتمع الغني بخلايا T، الذي احتوى على خلايا T CD4، وخلايا T CD8، وخلايا B، كان مرتبطًا فقط بعبء النيوأنتيجينات المتطابقة في LUAD والنيوأنتيجينات الفرعية في LUSC عندما لم يتم أخذ فقدان التوافق النسيجي (HLA LOH) في الاعتبار (HLA LOH غير المصحح، LME; الشكل التوضيحي الإضافي S6B). كانت المجموعة الغنية بخلايا T مرتبطة بشكل كبير أيضًا مع الخلايا التائية التنظيمية المتسللة إلى النسيج الداعم والأورام في LUSC، مما قد يشير إلى ضعف المناعة المضادة للأورام في المناطق ذات العبء العالي من النيوأنتيجينات الفرعية (HLA LOH غير المصحح، LMEبورصة لندن للمعادن“; الشكل التوضيحي الإضافي S6C). كانت المجتمعات المرتبطة بعبء النيوانتجين غير المصحح لـ HLA LOH، بما في ذلك المجتمع الغني بالخلايا التائية، غنية فيارتفاع TMEs، مما يضيف مزيدًا من الدقة في تنظيم الخلايا في البيئات الملتهبة (LME؛ الشكل 3B؛ الشكل التوضيحي S6B).
بعد ذلك، سعينا لتحديد السياق المناعي المكاني المرتبط بفقدان التغاير في HLA والاضطرابات الجسدية الأخرى في جينات APM من الفئة I، والتي ستشار إليها فيما بعد باضطراب الفئة I/APM (الطرق). في LUAD، كانت المناطق الورمية التي تعاني من اضطراب الفئة I/APM تحتوي على كثافات متزايدة من المجتمعات C6:البلاعم والخلايا و C7: غنية بالماكروفاج (LMEبورصة لندن للمعادن“; الشكل التوضيحي الإضافي S6D). في LUSC، تم ملاحظة تعطيل الفئة I/APM بشكل أكثر تكرارًا في نوى الأورام العالية TS:TIL+MФ مقارنةً بالفئات الأخرى في بيئة الورم (TME). مقابل النوى مع بيانات HLA المتاحة؛ الشكل التوضيحي التكميلي S6E).
تكشف هذه النتائج عن الفجوات المكانية لخلايا المناعة في الأورام ذات الحمل العالي من النيوأنتيجين، بما في ذلك السياق المكاني لمجموعات خلايا CD8 T الفعالة. وقد أظهرت دراسة فقدان التغاير في HLA وجود مجتمعات مكانية مختلفة تتأثر بشكل أكبر بتنوع النيوأنتيجين ونوع النسيج في سرطان الرئة غير صغير الخلايا.
حول الورمسماالأرومات الليفية تفصل بين خلايا CD8 T وخلايا الورم في بيئات الورم المناعي المنخفضة
ارتبط استبعاد خلايا T من عش الورم بالفعالية المحدودة للعلاج المناعي. السابق
الشكل 3. الميزات المكانية المرتبطة بعبء النيوانتجينات وبيئات الأورام المناعية المنخفضة. أ، ارتباط كثافات المجتمعات الخلوية المكانية وعبء النيوانتجينات الكلونية، الفرعية والإجمالية المتوقعة للارتباط بالأليلات HLA السليمة، بعد أخذ فقدان HLA في الاعتبار، في LUAD.، 51 نواة ورمية) و LUSC (نوى الأورام). يوضح الرسم البياني الشريطي متوسط عبء النيوانتجين مع خطوط تمتد إلى النسبة المئوية 75. ب، مقارنة كثافات المجتمعات الخلوية المكانية في فئة TME معينة مقارنة بجميع فئات TME الأخرى مجتمعة. LUAD: تي إس: تي آي إل + إم أنوية عاليةتي:تي إل + مالنوى المستبعدة، TS:نوى المناعة المنخفضة، TS: ارتفاع عدد العدلات. LUSC: تي إس: تي آي إل + م أنوية عاليةت:تيل+مالنوى المستبعدة، TS: المناعة منخفضة النوى، TS: ارتفاع عدد النيوترولات. أحجام الصناديق في و تتوافق مع قيم T.خرائط المجتمع ونوع الخلايا من نواة ورم LUAD مع عبء عالٍ من النيوأنتيجينات المستنسخة المعبر عنها وكثافات عالية من خلايا T من النوع C2: وغني بالماكروفاجات من النوع C6:خلايا المجتمعات. د، خرائط المجتمع ونوع الخلايا من نواة ورم LUSC مع عبء عالٍ من النيوأنتيجينات المستنسخة المعبر عنها وكثافات عالية من خلايا المجتمع C9:B وخلايا البلازما. يتم تلوين الخلايا الفردية في C وD حسب المجتمع وفقًا لأسطورة الألوان أدناه D أو نوع الخلية كما هو موضح. قضبان القياس،. الوسط، تكبير للمنطقة المميزة بمربع أبيض في الرسم البياني الأيسر مع أنواع الخلايا المتطابقة الموضحة في الرسم البياني الأيمن. E، مخطط لـ SMA حساب درجة حاجز الألياف. تقيس درجة الحاجز مدى التداخل المكاني بين خلايا الورم والخلايا المجاورة.سماالأرومة الليفية بين خلايا CD8 T وأقرب خلية ورمية لها في نواة نسيجية. في النصف السفلي من المخطط، تم تحديد ثلاث خلايا ورمية قريبة للخلايا الخضراء CD8 T، جميعها على بعد ست قفزات. الخلايا الورمية المجاورة SMA توجد الخلايا الليفية على اثنين من هذه المسارات الثلاثة من خلايا CD8 T إلى خلايا الورم، مما يؤدي إلى الحصول على درجة حاجز من. ف، مخطط الصندوق مقارنة درجات حاجز SMA + الألياف في فئة TME معينة مقارنة بجميع فئات TME الأخرى مجتمعة في LUADأنوية الورم) و LUSC (نوى الأورام). تُظهر الرسوم البيانية الصندوقية الوسيط وقيم الربع الأدنى والربع الأعلى، وتمتد الشعيرات حتى IQR أعلى وأسفل الربعيات. G، صور IMC التمثيلية وخرائط نوع الخلايا من نوى أورام LUAD وLUSC المصنفة كـمناعة منخفضة مع درجة حاجز عالية. قضبان المقياس،القيم في، و وقيم T في و تم حسابها في نموذج مختلط ذو تأثيرات خطية مع المريض كأثر عشوائي، باستخدام حالة التدخين كأثر ثابت فيمعقيمةيعتبر ذا دلالة. LUAD، أدينوكارسينوما الرئة؛ LUSC، سرطان الخلايا الحرشفية في الرئة؛ panCK، بانسايتوكيراتين؛ TS، الورم/الستروما؛ T، الورم؛ TIL، اللمفاويات المتسللة إلى الورم؛ MФ، البلعميات؛ *، P<0.05؛ **، P<0.01. أظهرت الأبحاث في سرطان الرئة غير صغير الخلايا أن النسيج الضام الكثيف المحيط بجزر الورم في شرائح أورام الرئة البشرية يمكن أن يحد من دخول خلايا T، على الأرجح من خلال وساطة مجموعات فرعية متميزة من الخلايا الليفية المرتبطة بالسرطان (CAF) التي تنتج الكولاجين.وقد أظهرت الدراسات أن التعقيد الهندسي لواجهة الورم-الستروما قد زاد مع انخفاض إجمالي مقارنة مع ارتفاع infiltrate اللمفاوي (21). تبرز كلا الدراستين دورًا محتملاً لخلايا الأنسجة الضامة في استبعاد خلايا T في سرطان الرئة غير صغير الخلايا. ومع ذلك، كانت تنوع الأنواع الفرعية للخلايا التي تم استجوابها في هذه الأعمال محدودًا.
استنادًا إلى ذلك، استغللنا الـعلامة SMA على خلايا T لدينا ولوحة الأجسام المضادة للستروما واستكشاف ما إذا كانت فئات TME المناعية مرتبطة بتمييزات معينةترتيبات الألياف، التي قد تمثل حواجز محتملة للتفاعل بين الورم والجهاز المناعي. باستخدام مقياس الحاجز المستمد من بناء رسم بياني مكاني خلوي لكل نواة ورمية (الشكل 3E، الطرق)، وجدنا أن البيئات الميكروية للورم ذات النسبة المنخفضة من الخلايا المناعية كانت تتميز بدرجة أعلى من الانسداد الفيزيائي لخلايا CD8 T عن خلايا الورم بواسطة الأنسجة المجاورة للورم.الأرومة الليفية أكثر من غيرها من البيئات المجهرية المشتركة في كل من LUAD و LUSC (LME، على التوالي، الشكل 3F وG). لم تعكس توزيعات درجات الحواجز عبر فئات TME الكثافات العامة لـالأرومة الليفية في نوى الورم (الشكل التكميلي S6F).
ومع ذلك، من الجدير بالذكر،كانت الحواجز الليفية غير كافية لشرح نقص تسلل خلايا المناعة إلى أعشاش الورم في فئة T:TIL+MФ المستبعدة من البيئة المجهرية للورم في LUAD أو LUSC، على الرغم من ملاحظة درجات حواجز عالية في حالات فردية (الشكل 3F). ومع ذلك، كانت خلايا T السامة CD8 والكرات البيض الأخرى لها علاقات تجنب ملحوظة مع خلايا الورم في البيئات المجهرية المستبعدة T:TIL+MФ مقارنةً بفئات البيئة المجهرية الأخرى في LUAD وLUSC، على التوالي (الشكل التكميلية S6G).
بشكل جماعي، تشير هذه النتائج إلى أن المحيط الورميقد تمثل الخلايا الليفية سمة من سمات بيئات الأورام في المرحلة المبكرة من سرطان الرئة غير صغير الخلايا مع مستويات منخفضة بشكل عام من التسلل المناعي وحاجز مادي محتمل لتفاعل خلايا CD8 T وخلايا الورم.
الأورام المت infiltrated بالعدلات وخلايا T النادرة تم إعادة توصيلها أيضياً وتبتعد عن الأوعية الدموية
كشفت تصنيفات المناعة عن فئة متميزة من بيئة الورم الدقيقة (TME) ذات كثافات عالية من خلايا العدلات وتسلل نادر لخلايا المناعة الورمية (TIL) في عش الورم والستروما، TS: العدلات عالية، والتي تم اكتشافها في ما لا يقل عن نواة واحدة في من NSCLCs (الأورام ذات البيئة المجهرية المحددة). أظهرت دراسات سرطان الرئة غير صغير الخلايا توقيع جيني للخلايا المتعادلة كأقوى مؤشر مناعي. معدل الوفيات (22) وارتفاع محتوى العدلات الذي يرتبط عكسياً مع تسلل خلايا T (23) دفعنا للتحقيق في دور محتمل لتعزيز الورم لهذه الفئة من بيئة الورم. ومن الجدير بالذكر أن مستويات تسلل العدلات في سرطان الرئة ذو الخلايا الحرشفية كانت أعلى من تلك في أنوية سرطان الرئة ذو الخلايا الغدية بمقدار الضعف (وسيط 752 خلية/مقارنة بـ 343 خليةوبالتالي، تم فحص فئة TME العالية من الكريات البيضاء المتعادلة بشكل منفصل ومقارنتها بين الأنماط النسيجية الرئيسية.
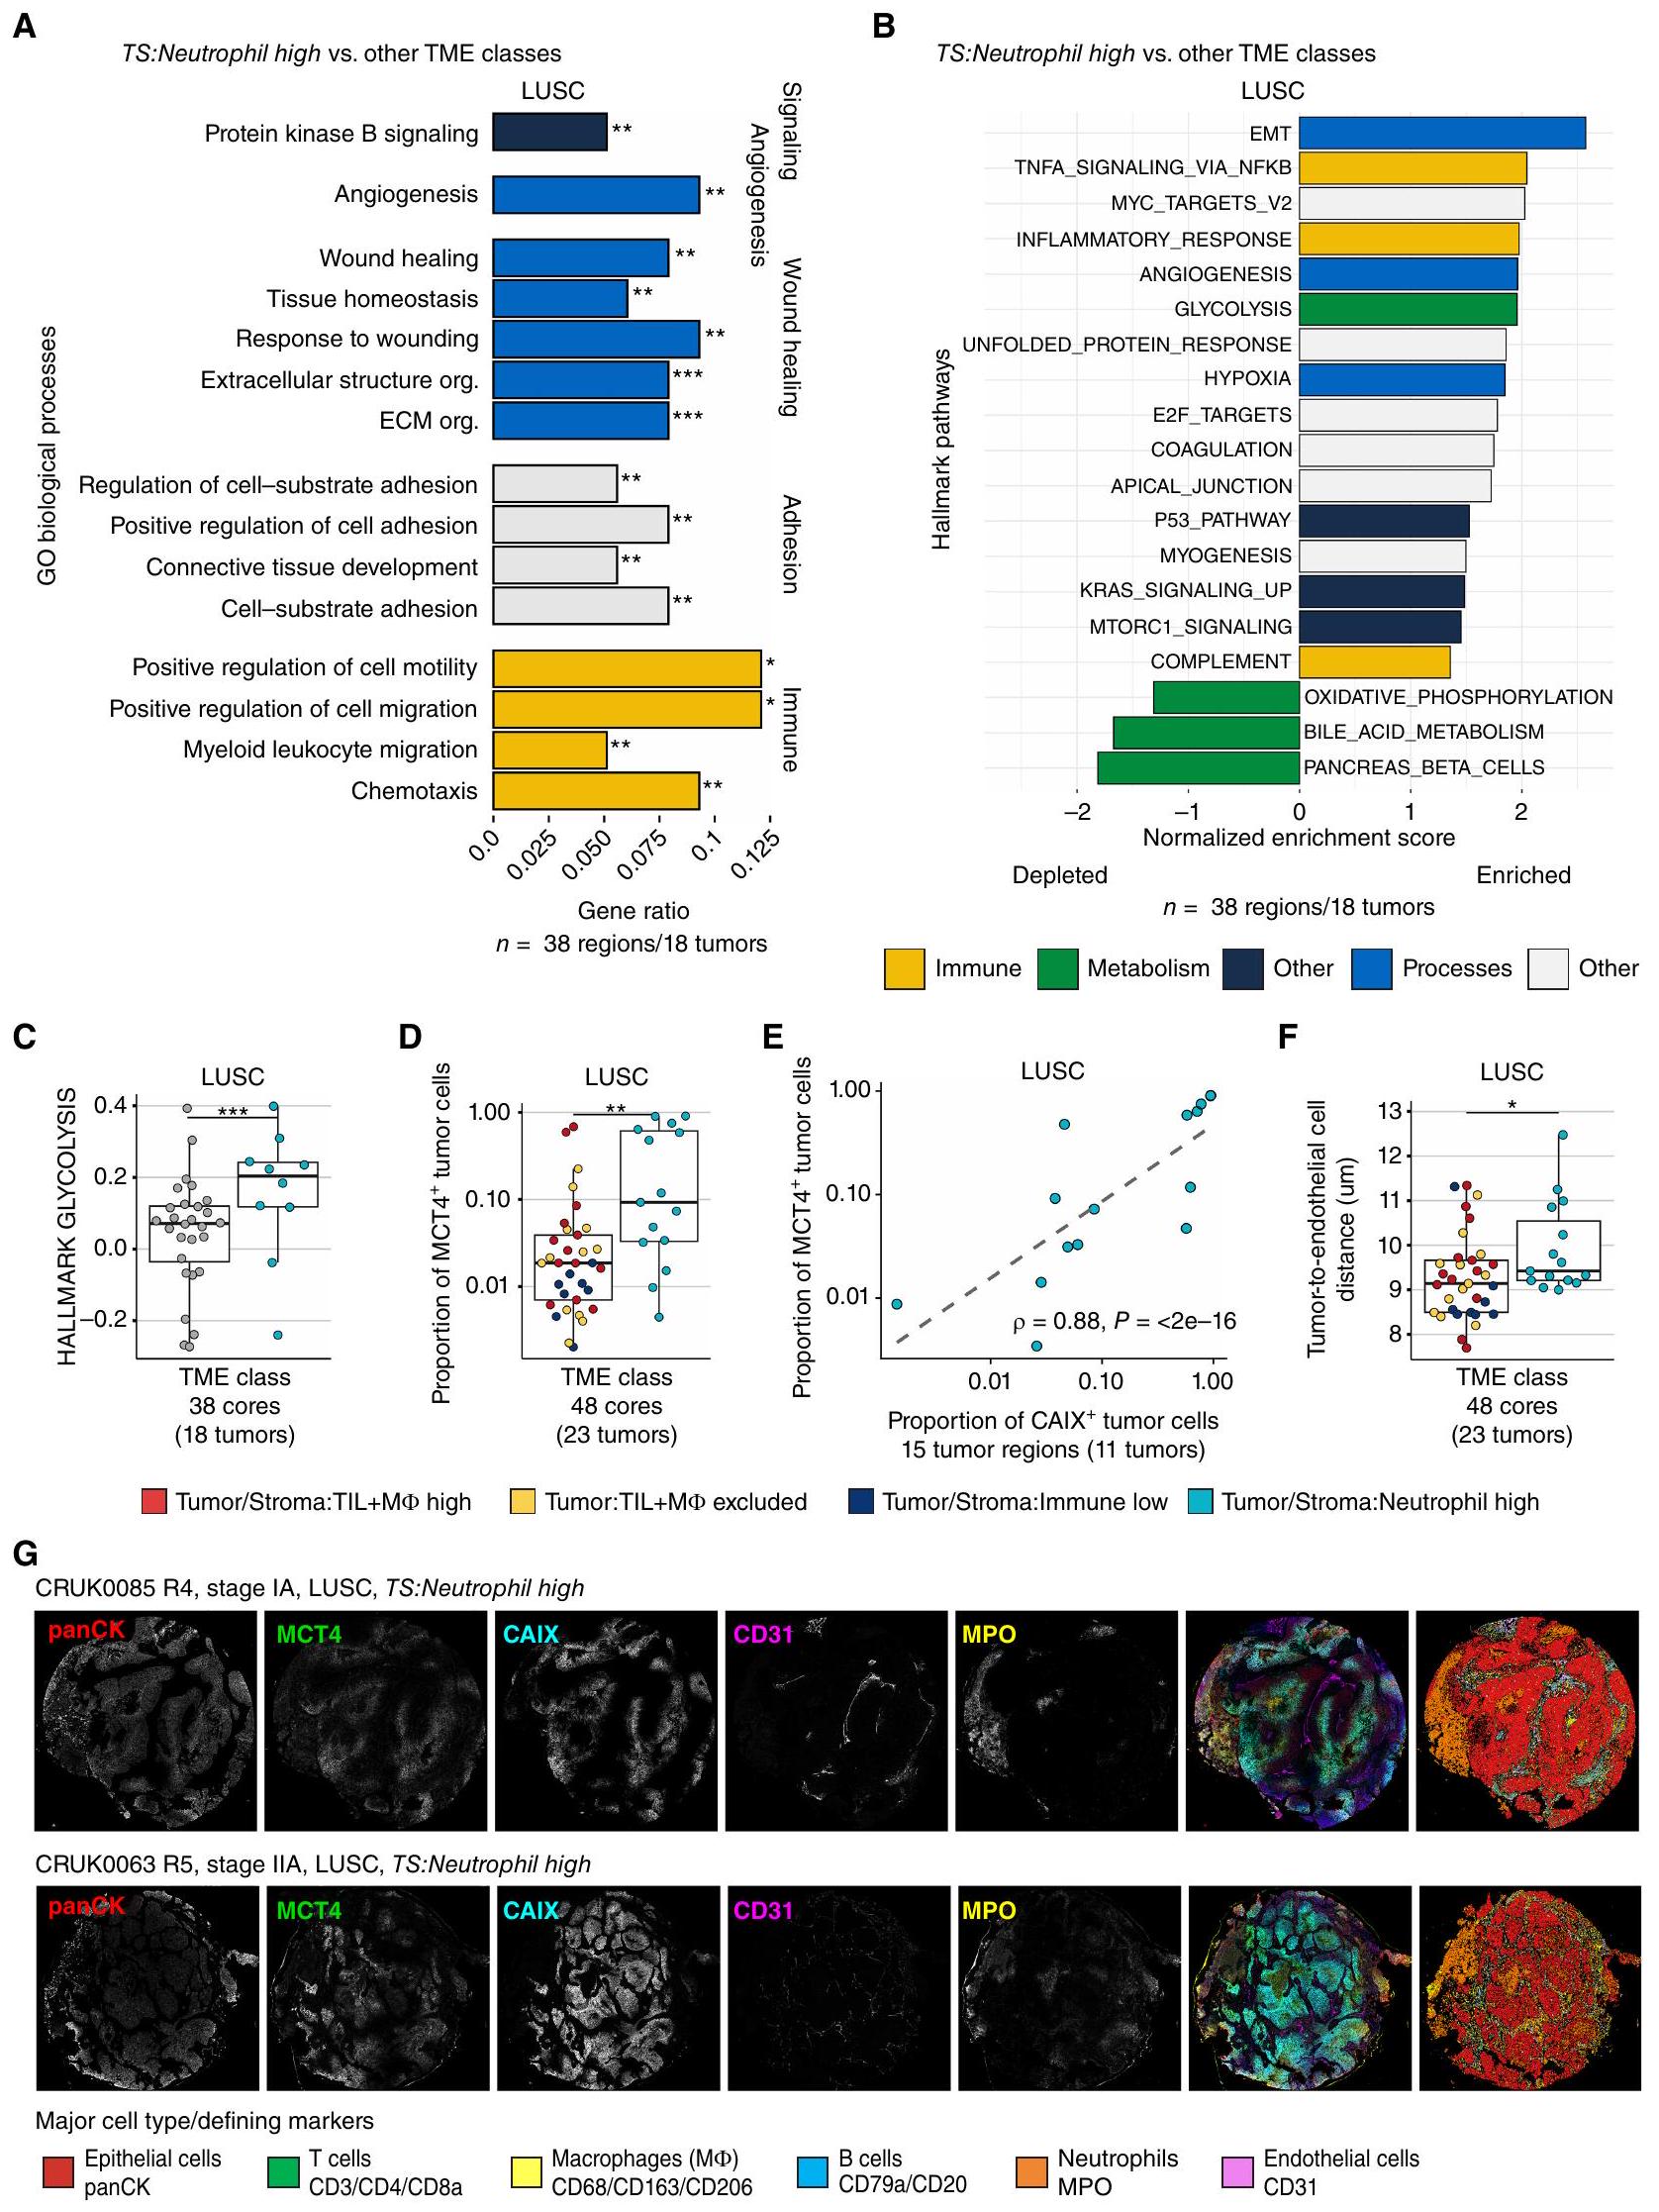
قمنا بتقييم مسارات الإشارة التي تم تنظيمها بشكل مختلف في هذه الفئة من بيئة الورم، باستخدام بيانات تسلسل RNA من TRACERx 100 المزدوجة.الأورام، 38 منطقة). في LUSC، أظهر تحليل الإفراط في التمثيل لعمليات علم الأحياء في مصفوفة الجينات (GO) زيادة في تنظيم العديد من العمليات، بما في ذلك إشارة بروتين كيناز B (PKB)، وتكوين الأوعية الدموية، وبرامج النسخ المرتبطة بالشفاء من الجروح وهجرة الكريات البيضاء النخاعية في أنوية الأورام عالية TS:Neutrophil مقارنة بالأنوية من فئات TME الأخرى (FDR < 0.01، الشكل 4A؛ الشكل التوضيحي S7A). بالإضافة إلى ذلك، حددنا مجموعات الجينات المميزة الغنية في TS:Neutrophil العالية، والتي شملت الانتقال الظهاري-الم mesenchymal (EMT) ونقص الأكسجة (الشكل 4B). على الرغم من أن العديد من العمليات الأيضية بما في ذلك الفسفرة التأكسدية (OXPHOS) كانت منخفضة بشكل كبير، إلا أن التحلل السكري كان مرتفعًا في أنوية TS:Neutrophil العالية مقارنة بتلك التي تنتمي إلى فئات TME الأخرى (FDR = 3e-06؛ الشكل 4C)، مما يشير إلى إعادة برمجة أيضية لخلايا الورم في هذه الفئة.
يمكن لخلايا الورم زيادة النشاط الجليكولي. وزيادة تنظيم ناقل اللاكتات، MCT4، لنقل فائض اللاكتات، وهو ناتج من التحلل السكري، إلى البيئة الدقيقة (26). لذلك، قمنا بمقارنة مستويات تعبير MCT4 على خلايا الورم ولاحظنا نسبة أكبر في TS: نسبة العدلات العالية مقارنة بالفئات الأخرى في TME في LUSC (LME; الشكل 4D). كان تعبير MCT4 من قبل خلايا الظهارة غير الورمية ضئيلاً (الشكل التوضيحي S7B). لذلك، فإن أورام LUSC ذات TMEs العالية من TS:Neutrophil قامت بتقليل برنامج النسخ الخاص بـ OXPHOS، بينما زادت من MCT4تعبير البروتين، مما يؤدي على الأرجح إلى زيادة النشاط الجليكولي والتراكم اللاكتاتي في البيئة المجاورة للورم.
يمكن أن تدفع الظروف المقيدة للمواد الغذائية والظروف منخفضة الأكسجين خلايا السرطان إلى التحول إلى مصادر طاقة بديلة (27). لذلك، قمنا بمقارنة وجود CAIX، وهو إنزيم يتم تحفيزه بواسطة نقص الأكسجين على خلايا الورم، ووجدنا أن نسبةكانت خلايا الورم في فئة TME العالية من العدلات (TS:Neutrophil) ليست أعلى بشكل ملحوظ من الفئات الأخرى لـ TME (الشكل التوضيحي S7C). ومع ذلك، كانت نسبة MCT4خلايا الورم مرتبطة ارتباطًا قويًا بنسبة CAIXخلايا الورم في LUSC في
الشكل 4. يرتبط تسرب العدلات في LUSC بأنماط أيضية ومناعية مثبطة مميزة. أ، العمليات البيولوجية في علم الأحياء الجيني (GO) الغنية بين الجينات المرتفعة في فئة TME العالية للعدلات: النوى) مقارنة مع فئات TME الأخرى مجتمعة (النوى) في LUSC (FDR < 0.01، نسبة الجين > 0.05). ب، تحليل GSEA لمجموعات الجينات الرئيسية مقارنة بين نوى الورم من فئة Tumor/Stroma:Neutrophil العالية في TME والفئات الأخرى من TME مجتمعة، باستخدام إحصائية t المستمدة من نموذج limma-voom على تعبير الجين المعاير بواسطة TMM. تم تلوين المسارات الغنية بشكل ملحوظ حسب نوع المسار (FDR < 0.05). ج، درجة الغنى المعايرة المستمدة من GSEA لعينة واحدة تم تصورها لفئة TS:Neutrophil العالية ونوى من فئات TME الأخرى. القيمة مشتقة من GSEA لـ LUSC كما هو موضح في وتم تعديلها لمسارات العلامات الأخرى باستخدام طريقة بنجاميني-هوشبرغ. د، نسبة خلايا الورم المعينة MCT4+ في نوى الأورام ذات نسبة عالية من TS:العدلات مقارنة بنوى الأورام من فئات TME الأخرى مجتمعة في LUSC. هـ، معامل ارتباط سبيرمان وقيمة مقارنة نسبة MCT4و CAIXخلايا الورم في TS: بيئات الورم عالية العدلات. F، المسافة المتوسطة بين خلايا ورم LUSC وأقرب خلية بطانية لكل نواة في فئة TME عالية العدلات مقارنة بجميع فئات TME الأخرى مجتمعة. G، صور أحادية القناة وصورة مركبة بجانب خريطة نوع الخلية تعرض خلايا الورم، العدلات (MPO، أصفر)، الخلايا البطانية (CD31، أرجواني)، ومناطق نقص الأكسجة (CAIX، أزرق) وتعبير MCT4 (أخضر). تظهر الرسوم البيانية الصندوقية القيم المتوسطة وقيم الربع السفلي والربع العلوي، وتمتد الشعيرات حتىالمدى بين الربيعيات فوق وتحت الربيعيات.قيم لـ و تم حسابها في نموذج تأثيرات مختلطة خطية مع المريض كمتغير عشوائي. LUSC، سرطان الخلايا الحرشفية الرئوية؛ TS، الورم/الستروما؛ FDR، معدل الاكتشاف الخاطئ؛ TMM، المتوسط المقصوص لقيم M؛ panCK، بانسيتيكراتين؛ *، P < 0.05؛ **، P < 0.01؛ ***, P < 0.001. فئة TME العالية من العدلاتقمنا بتقييم القرب من الأوعية الدموية كالمسافة المتوسطة بين كل خلية ورمية وأقرب خلية بطانية ووجدنا مسافة أكبر بشكل ملحوظ في فئة TS:Neutrophil العالية مقارنة بالفئات الأخرى في LUSC. كانت مستويات تكاثر الورم التي تم تقييمها كنسبة خلايا الورم Ki-67+ أقل في فئة TS:Neutrophil العالية مقارنة بالفئات الأخرى في TME في LUSC. تشير هذه النتائج إلى أن الزيادة في النشاط الجليكوليتي في هذه الفئة من TME مرتبطة بانخفاض في إمدادات الأكسجين في الأورام التي تكون على مسافة أكبر من الأوعية الدموية.
يمكن أن يؤدي الوصول الوعائي المقيد المتوافق مع مسافة أكبر بين الورم والخلايا البطانية إلى نخر الورم. تم اكتشاف وجود النخر، كما تم تقييمه من خلال المراجعة النسيجية لصور IMC وH&E المزدوجة (الطرق)، بشكل متكرر في TS:Immune المنخفض.من النوى) وTS: ارتفاع العدلات (60%) TMEs في LUSC (23%-28% TMEs الأخرى؛ الشكل التوضيحي S7E). ومن الجدير بالذكر أن وجود النخر وحده لم يكن مرتبطًا بزيادة المسافة بين خلايا الورم والبطانة أو نسبة MCT4.خلايا الورم (LME غير محددة).
كانت الفئة العالية من TS:العدلات في LUAD تتميز أيضًا بمسافة أكبر بين خلايا الورم والخلايا البطانية مقارنةً بالفئات الأخرى في بيئة الورم.نموذج LME؛ الشكل التوضيحي التكميلي S7F) وتكرار أعلى من النخر فيمن النوى مقارنة بـإلىفي TMEs الأخرى (اختبار كاي-تربيع); الشكل التوضيحي الإضافي S7G). كما لوحظ في LUSC، أظهرت تحليل إثراء مجموعة الجينات (GSEA) لـ LUAD أيضًا زيادة في تنظيم مجموعات الجينات الرئيسية EMT وإشارات KRAS، وتم تقليل العديد من العمليات الأيضية بما في ذلك OXPHOS ( الأورام، 49 منطقة؛ الشكل التوضيحي الإضافي S7H). ومع ذلك، تم استنفاد مجموعة جينات علامة التحلل السكري، وكانت نسبة ولم تكن خلايا الورم مختلفة بشكل ملحوظ في فئة TME العالية من TS:Neutrophil مقارنة بالفئات الأخرى من TME في LUAD (الشكل التكميلي S7I-S7J). بشكل عام، كانت نوى أورام LUAD تحتوي على نسبة أقل بشكل ملحوظ من CAIX.خلايا الورم مقارنةً بـ LUSC (الشكل التوضيحي S7K). تشير هذه النتائج إلى وجود إشارات بيئية استقلابية ونقص الأكسجين مختلفة في فئة TME العالية من TS:Neutrophil بين LUAD و LUSC.
في كل من LUAD و LUSC، كانت فئة TS:Neutrophil العالية تحتوي على تسلل نسيجي ضعيف (الشكل التوضيحي S5D). كشفت تحليلات التفاعل الخلوي المكاني عن علاقة تجنب بين العدلات وخلايا CD8 T السامة للخلايا في هذه الفئة من بيئة الورم أكثر تكرارًا من الفئات الأخرى في LUAD و LUSC. لم تكن هناك تفاعلات ملحوظة أخرى بين العدلات. وتمت ملاحظة أي من الأنماط الفرعية الخلوية المحددة (الشكل التكميلي S7L)، مما يشير إلى كبت المناعة بالقرب من العدلات في كلا النمطين النسيجيين.
باختصار، حددنا فئة متميزة من بيئة الورم الدقيقة (TME) تتميز بالتسلل السائد للخلايا المتعادلة، وزيادة المسافة بين الورم والأوعية الدموية، وزيادة تنظيم التحول الظهاري (EMT)، وإعادة توصيل الأيض لخلايا السرطان في كل من سرطان الرئة ذو الخلايا غير الصغيرة (LUAD) وسرطان الرئة ذو الخلايا الحرشفية (LUSC). على الرغم من أن الإشارات الأيضية قد تختلف بين LUAD وLUSC، إلا أن ارتفاع نسبة الخلايا المتعادلة (TS:Neutrophil high) يمثل بيئة ورم دقيقة مثبطة للمناعة مع تسلل نادر للخلايا اللمفاوية التائية (TIL) في كلا النمطين النسيجيين.
طفرات زيادة الوظيفة في إشارات كيناز الفوسفوإنوزيتيد 3 (PI3K) المرتبطة بتجنيد العدلات في أورام سرطان الرئة ذو الخلايا الحرشفية (LUSC)
يمكن أن تنظم الإشارات الذاتية لخلايا السرطان استقلاب الورم، وكبت المناعة، وتكوين الأوعية الدموية في سرطان الرئة غير صغير الخلايا (28، 29). هنا، بدأنا في تحليل الشذوذات الجينومية المتزايدة في الأورام ذات البيئة المجهرية العالية من الخلايا المتعادلة (TS:Neutrophil) التي قد تعزز اللياقة البدنية، أو تعدل الالتهاب، أو تدعم النشاط الجليكولي. لذلك، قمنا بفحص ما إذا كانت التغيرات الجسدية في مكونات المسارات التي تم تنظيمها بشكل زائد على مستوى النسخ، مثل إشارات KRAS وPKB (الشكل 4A وB؛ الشكل التوضيحي S7H)، كانت متزايدة بشكل متكرر في نوى الأورام ذات البيئة المجهرية العالية من الخلايا المتعادلة.
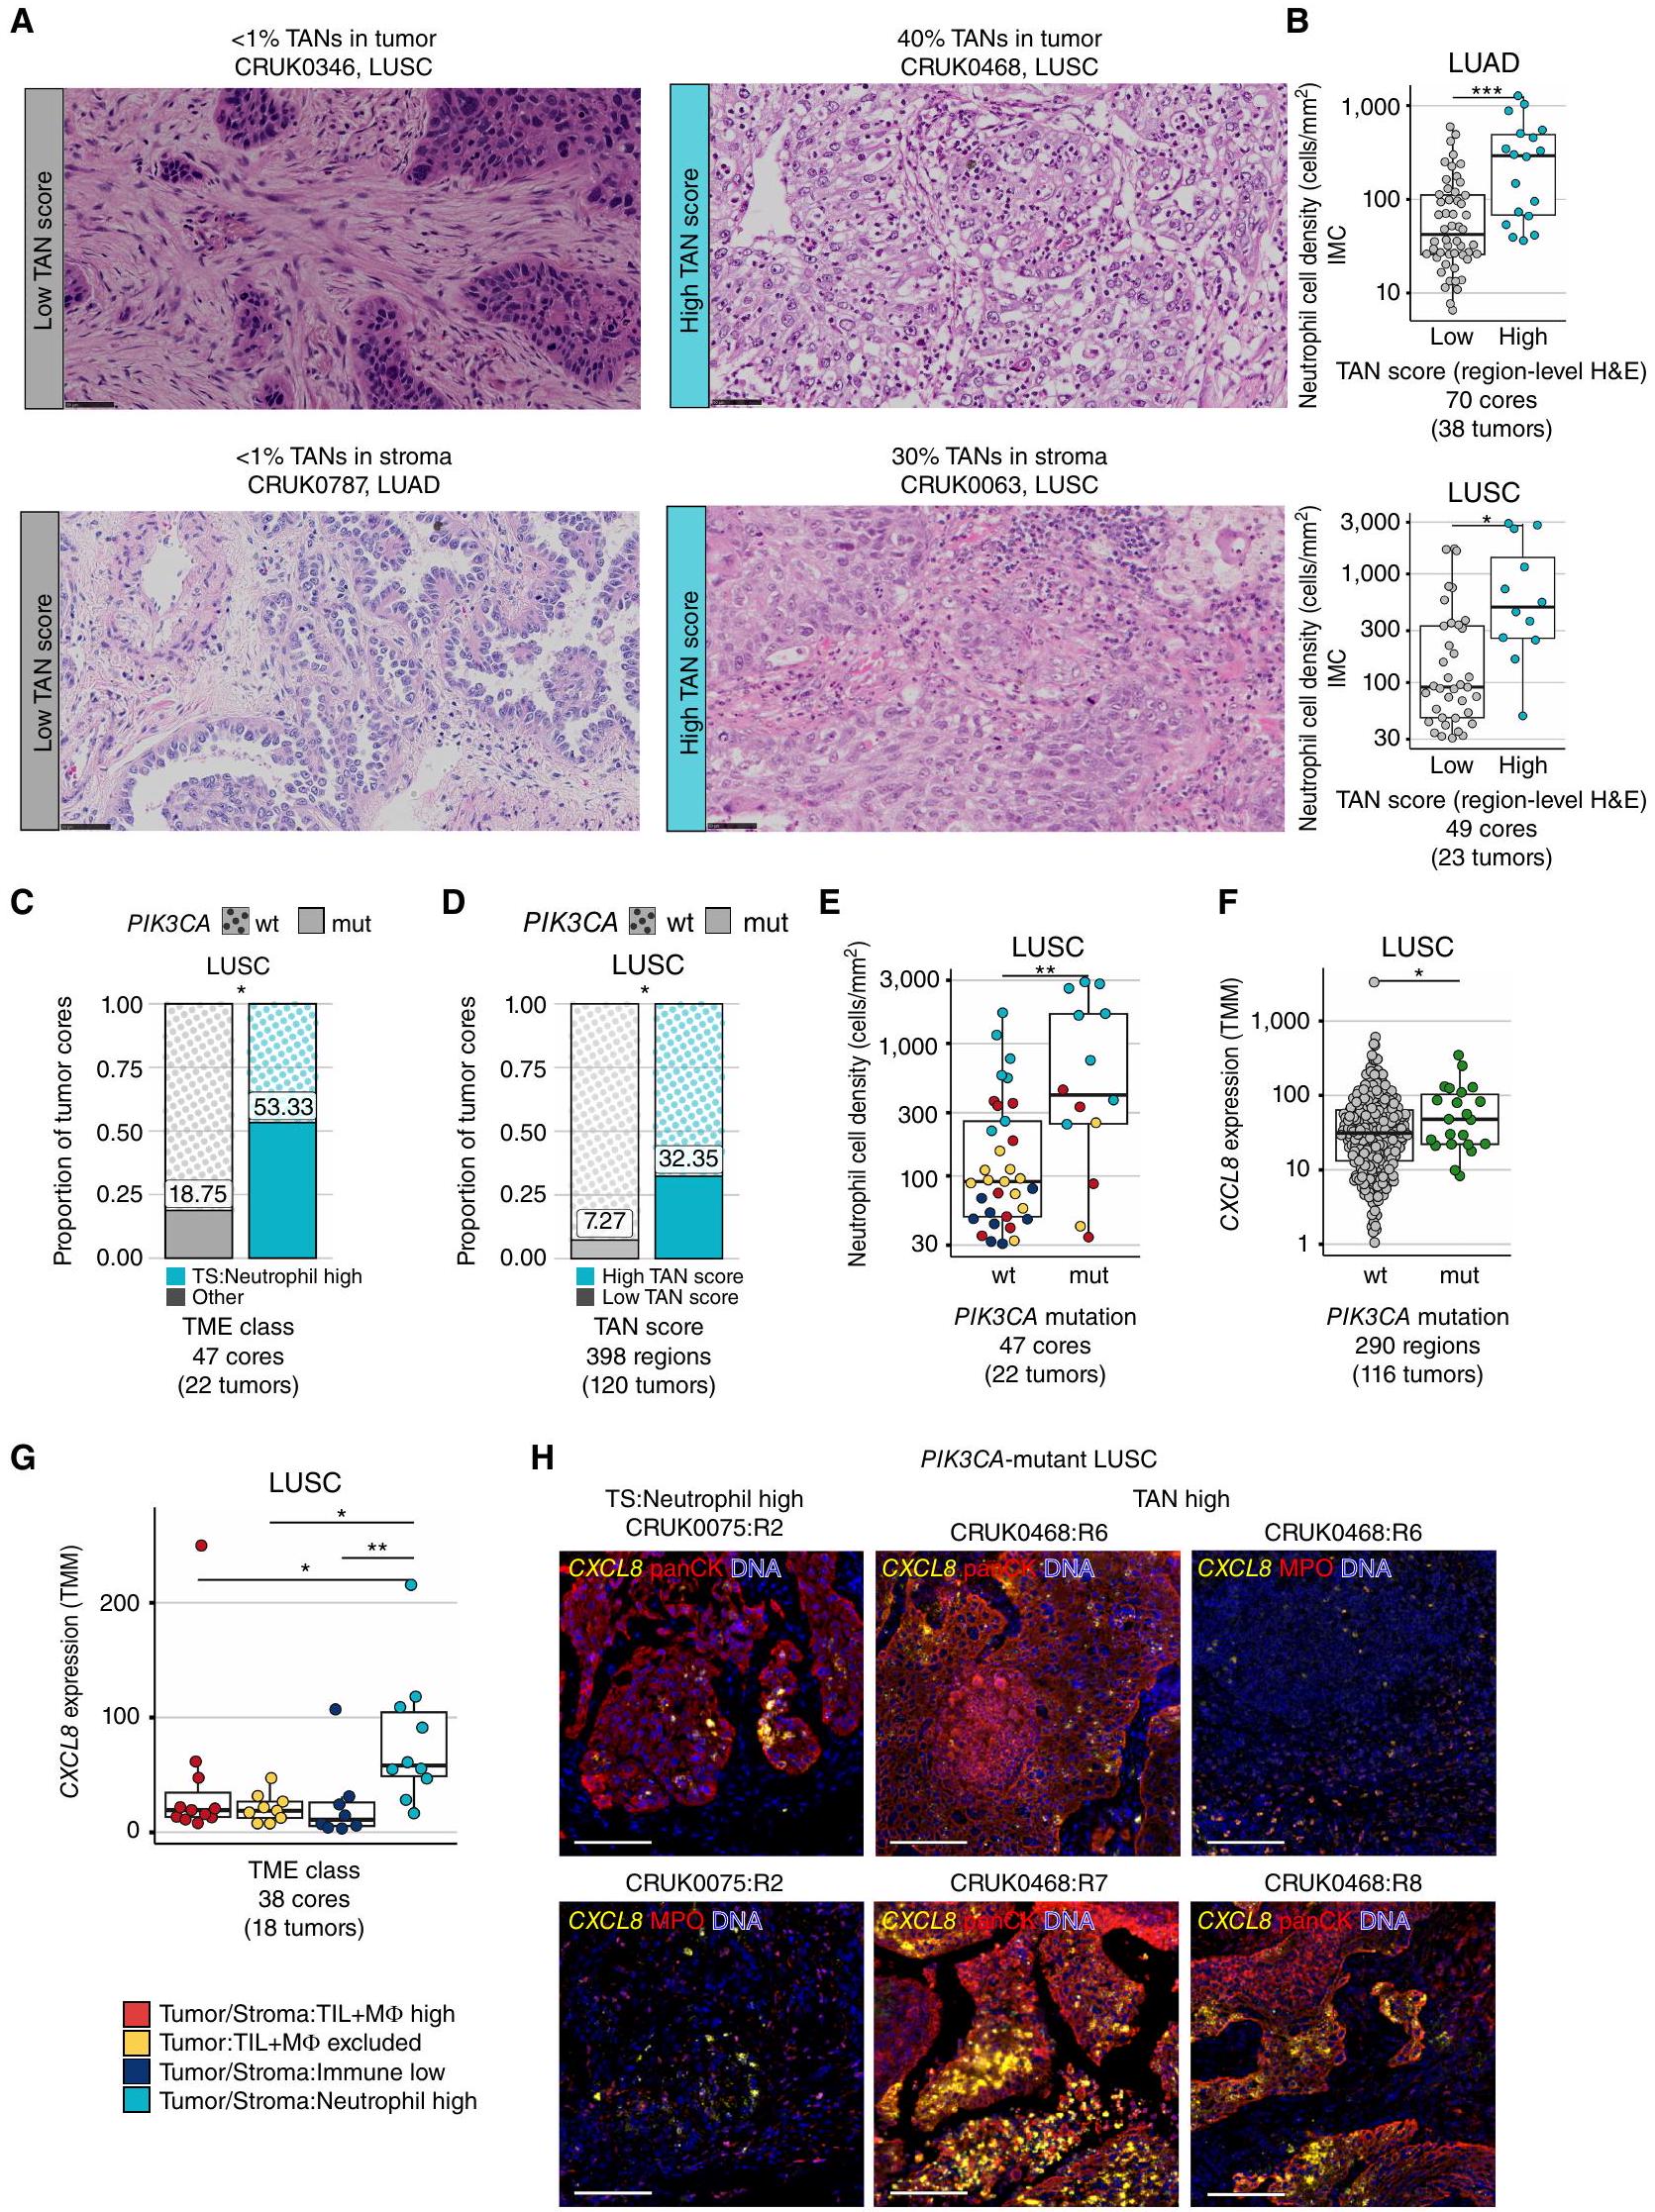
لفحص الطفرات المحركة والتغيرات في عدد النسخ بشكل منهجي، قمنا بتوسيع مجموعة TRACERx 100 إلى TRACERx 421 (14). استخدمنا تقييم العدلات المرتبطة بالورم (TAN) المستمد من أخصائيي الأمراض من صور H&E لكتل إقليمية متزاوجة من TMAs الدراسية (درجة TAN على مستوى المنطقة) وكتل تشخيصية متطابقة مع الورم (درجة TAN على مستوى الورم). قامت طريقة تقييم TAN بتقييم العدلات في عش الورم والستروما مع تعديل طريقة موحدة مستخدمة لتقدير TIL (الشكل 5A؛ الطرق؛ المرجع 30). تم تصنيف أنوية الورم إلى TAN عالي وTAN منخفض باستخدام TS:Neutrophil TME العالي كمرجع لدرجات TAN العالية (الطرق). أعادت درجات TAN المستمدة من H&E تجسيد وجود العدلات المستمدة من IMC المتزاوجة في LUAD وLUSC (الشكل 5B؛ الشكل التكميلي S8A، ارتباط سبيرمان.كانت احتمالية اكتشاف TME عالي TAN عبر جميع المناطق الم sampled 0.5 في الأورام عالية TAN (الطرق)، وهو ما يعادل الاحتمالية المقدرة لفئة TME العالية TS:Neutrophil. ومن الجدير بالذكر أن مناطق الأورام عالية TAN كانت غنية بتوقيع نسخي لـ TAN (31) وكان لديها نسبة أعلى من PD-L1 المستمد من IMC.العدلات و MCT4خلايا الورم مقارنةً بأورام LUSC ذات مستوى TAN المنخفض (الشكل التوضيحي S8B-S8D).
الشكل 5. ترتبط البيئات المجهرية الغنية بالعدلات بطفرات تنشيطية في PI3K وزيادة تعبير CXCL8 المرتبطة بالورم. أ، قصاصات تمثيلية من صور H&E على مستوى الورم مع درجات TAN منخفضة في عشة الورم والستروما (يسار) ودرجات TAN مرتفعة في عشة الورم والستروما (يمين)، مستنتجة كنسبة منطقة العدلات في الورم/الستروما من إجمالي منطقة نسيج الورم/الستروما. مقياس الرسم،التكبير. ب، كثافة خلايا العدلات كما تم تعريفها بواسطة IMC مقارنة بين نوى الأورام ذات مستوى TAN المنخفض مقابل TAN المرتفع بناءً على درجات H&E في LUAD و LUSC. ج ود، نسبة نوى الأورام مع (mut) وبدون (wt) طفرات محرك PIK3CA مقارنة بين TS: العدلات العالية مقابل الفئات الأخرى من TME مجتمعة (ج) ونوى TAN المرتفعة مقابل TAN المنخفضة على مستوى المنطقة (د) في LUSC. تم اشتقاق قيم P من اختبار كاي-تربيع. هـ، كثافة خلايا العدلات حسب حالة طفرة PIK3CA، النقاط ملونة حسب تعيين فئة TME. و وز، قيم تعبير TMM لـ CXCL8 مقارنة بحالة طفرة PIK3CA (و) وبين فئات TME (ز) في LUSC. ح، صور المناعة الفلورية لـ CXCL8 RNAscope متعددة الأبعاد مع صبغة الأجسام المضادة لـ pancytokeratin (panCK) أو MPO في منطقة ورم LUSC مع TME عالية العدلات وطفرات PIK3CA تحت خلوية، ومريض LUSC مع مناطق ورم متعددة عالية TAN وطفرات PIK3CA خلوية. توضح أمثلة panCK و MPO لـ CRUK0075:R2 نفس منطقة الاهتمام، بينما تظهر مناطق اهتمام مختلفة لـ CRUK0468:R6. شريط القياس، . قيم لـ و تم حسابها في نموذج مختلط ذو تأثيرات خطية مع المريض كمتغير عشوائي.القيم في و تم اشتقاقها من تحليل التعبير التفاضلي limma-voom مع تصحيح لعدة مناطق لكل ورم.سرطان الرئة الغدي؛ LUSC، سرطان الرئة ذو الخلايا الحرشفية؛ TMM، المتوسط المقصوص لقيم M؛ TS، الورم/الستروما؛ TIL، اللمفاويات المتسللة إلى الورم؛ Mالخلايا البلعمية؛ TAN، العدلات المرتبطة بالورم؛ H&E، الهيماتوكسيليين والإيوزين؛ mt، الطافرة؛ wt، النوع البري.
باستخدام ملفات جينومية متطابقة، قمنا بتقييم ما إذا كانت الطفرات المحفزة النشطة في مكونات مسار الإشارة PKB/PI3KAKT كانت غنية في فئة TME العالية من TS:العدلات في سرطان الرئة ذو الخلايا غير الصغيرة. وجدنا تكرارًا أعلى لطفرات PIK3CA المحفزة ذات الوظيفة المكتسبة ضمن فئة TS:العدلات العالية مقارنةً مع TMEs الأخرى. مقابل النوى؛ الشكل 5C). قمنا أيضًا بتأكيد هذه الملاحظة في مجموعة TRACERx 421 الموسعة باستخدام درجات TAN (الأنوية، 120 ورم LUSC). كانت طفرات PIK3CA المحركة غنية بشكل ملحوظ في الأورام ذات مستوى TAN العالي مقارنة بالأورام ذات مستوى TAN المنخفض ( مقابل الأورام، مستوى الورم) وتم الكشف عنها فيمن TAN-high مقارنة بـتحليل عدد النسخ باستخدام GISTIC2.0 لم يكشف عن أي دليل على تضخيم عدد النسخ أو الحذف في جينات السائق والهروب المناعي التي كانت غنية فقط في مناطق الأورام ذات مستوى TAN العالي مقارنة بمناطق الأورام ذات مستوى TAN المنخفض (الشكل التكميلي S8E).
كانت جميع طفرات PIK3CA تقريبًا من أصل كلوني في LUSCالمناطق)، مما يشير إلى أن هذه الطفرات تم اكتشافها في جميع نوى الأورام. كانت الأورام التي تحتوي على طفرة PIK3CA متجانسة لديها احتمال أعلى بمقدار الضعف لوجود بيئة ميكروية عالية TAN مقارنة بالأورام من نوع PIK3CA البري (0.47 مقابل 0.25، مع تعديل عدد المناطق المأخوذة عينة منها). نظرًا لأن نوى الأورام التي تحتوي على طفرة PIK3CA كانت لديها كثافات خلايا العدلات أعلى بشكل ملحوظ من نوى PIK3CA البري في LUSC (LMEقمنا بفحص الكيموكينات الجاذبة للعدلات كما هو محدد بمصطلح GO الخاص بالهجرة العدلية (الطرق). قمنا بمقارنة تعبيرها بين نوى الأورام ذات نسبة عالية من TS:Neutrophil وتلك ذات TMEs الأخرى، بالإضافة إلى المقارنة بين مناطق الأورام الحاملة لطفرات PIK3CA ومناطق الأورام من النوع البري PIK3CA في مجموعة TRACERx 421 الموسعة. الكيموكين الوحيد الذي تم تنظيمه في كلا المقارنتين كان IL-8، الذي يرمز له الجين CXCL8 (الشكل التوضيحي S9A). كان CXCL8 معبرًا عنه بشكل أعلى في نوى الأورام الحاملة لطفرات PIK3CA مقارنة بنوى الأورام من النوع البري PIK3CA.المناطق، الشكل 5F). تم التحقق من مستويات التعب المرتفعة لـ CXCL8 في طفرات PIK3CA مقابل النوع البري PIK3CA في مجموعة بيانات أطلس جينوم السرطان (TCGA) (“; الشكل التوضيحي الإضافي S9B). أظهر CXCL8 أعلى تعبير في بيئة الورم العالية من الخلايا المتعادلة مقارنةً ببيئات الورم الأخرى (تغير الطي؛ الشكل 5G) ومرتبط بكثافة خلايا العدلات (e-05؛ الشكل التوضيحي التكميلي S9C). قمنا بإجراء تهجين RNA في الموقع لـ CXCL8 لتحديد ما إذا كانت خلايا الورم تعبر عن الكيمياء الحيوية في أربعة أنوية طافرة PIK3CA ونواتين من نوع PIK3CA البري مع بيئات عالية من TS:العدلات أو درجات TAN العالية. بالإضافة إلى تعبير CXCL8 بواسطة العدلات، كما هو موضح بواسطة التلوين المشترك مع MPO، تم الكشف عن تعبير CXCL8 بشكل رئيسي داخل خلايا الورم، كما هو موضح بواسطة التلوين المشترك مع panCK، في أنوية LUSC ذات بيئات عالية من TS:العدلات أو TAN العالية بغض النظر عن حالة طفرة PIK3CA (الشكل 5H؛ الشكل التوضيحي التكميلي S9D). كان تعبير CXCL8 مرتبطًا إيجابيًا مع علامات التحلل السكري في مجموعات TRACERx 100 و TCGA LUSC (الشكل التوضيحي التكميلي S9E).
بعد الملاحظة لزيادة تنظيم إشارة KRAS من GSEA، قمنا أيضًا بتقييم ما إذا كانت الطفرات النشطة في KRAS متزايدة في النوى ذات بيئات TMEs عالية من TS:Neutrophil. تم العثور على طفرات KRAS، التي كانت غائبة في نوى LUSC، فينوى LUAD مع هذه الفئة من TME ومن : فئة عالية مقارنة بـإلىفي أخرى الفئات (n.s.، الشكل التوضيحي التكميلي S9F)، مما يشير إلى أن أي تأثيرات محتملة على المناعة ناتجة عن طفرات KRAS السائق التي لوحظت في نماذج الفئران في LUAD (32) ليست محدودة على البيئة المجهرية عالية TS:العدلات.
باختصار، كانت الطفرات السائقية الجسدية في PIK3CA في سرطان الرئة ذو الخلايا الحرشفية (LUSC) وتفعيل النسخ لإشارات KRAS في سرطان الرئة ذو الخلايا الغدية (LUAD) وLUSC مرتبطة بتسلل العدلات.
ت infiltrate المناطق مع توسع تحت الأورام وتنبئ بنتيجة سريرية سيئة في سرطان الرئة غير صغير الخلايا
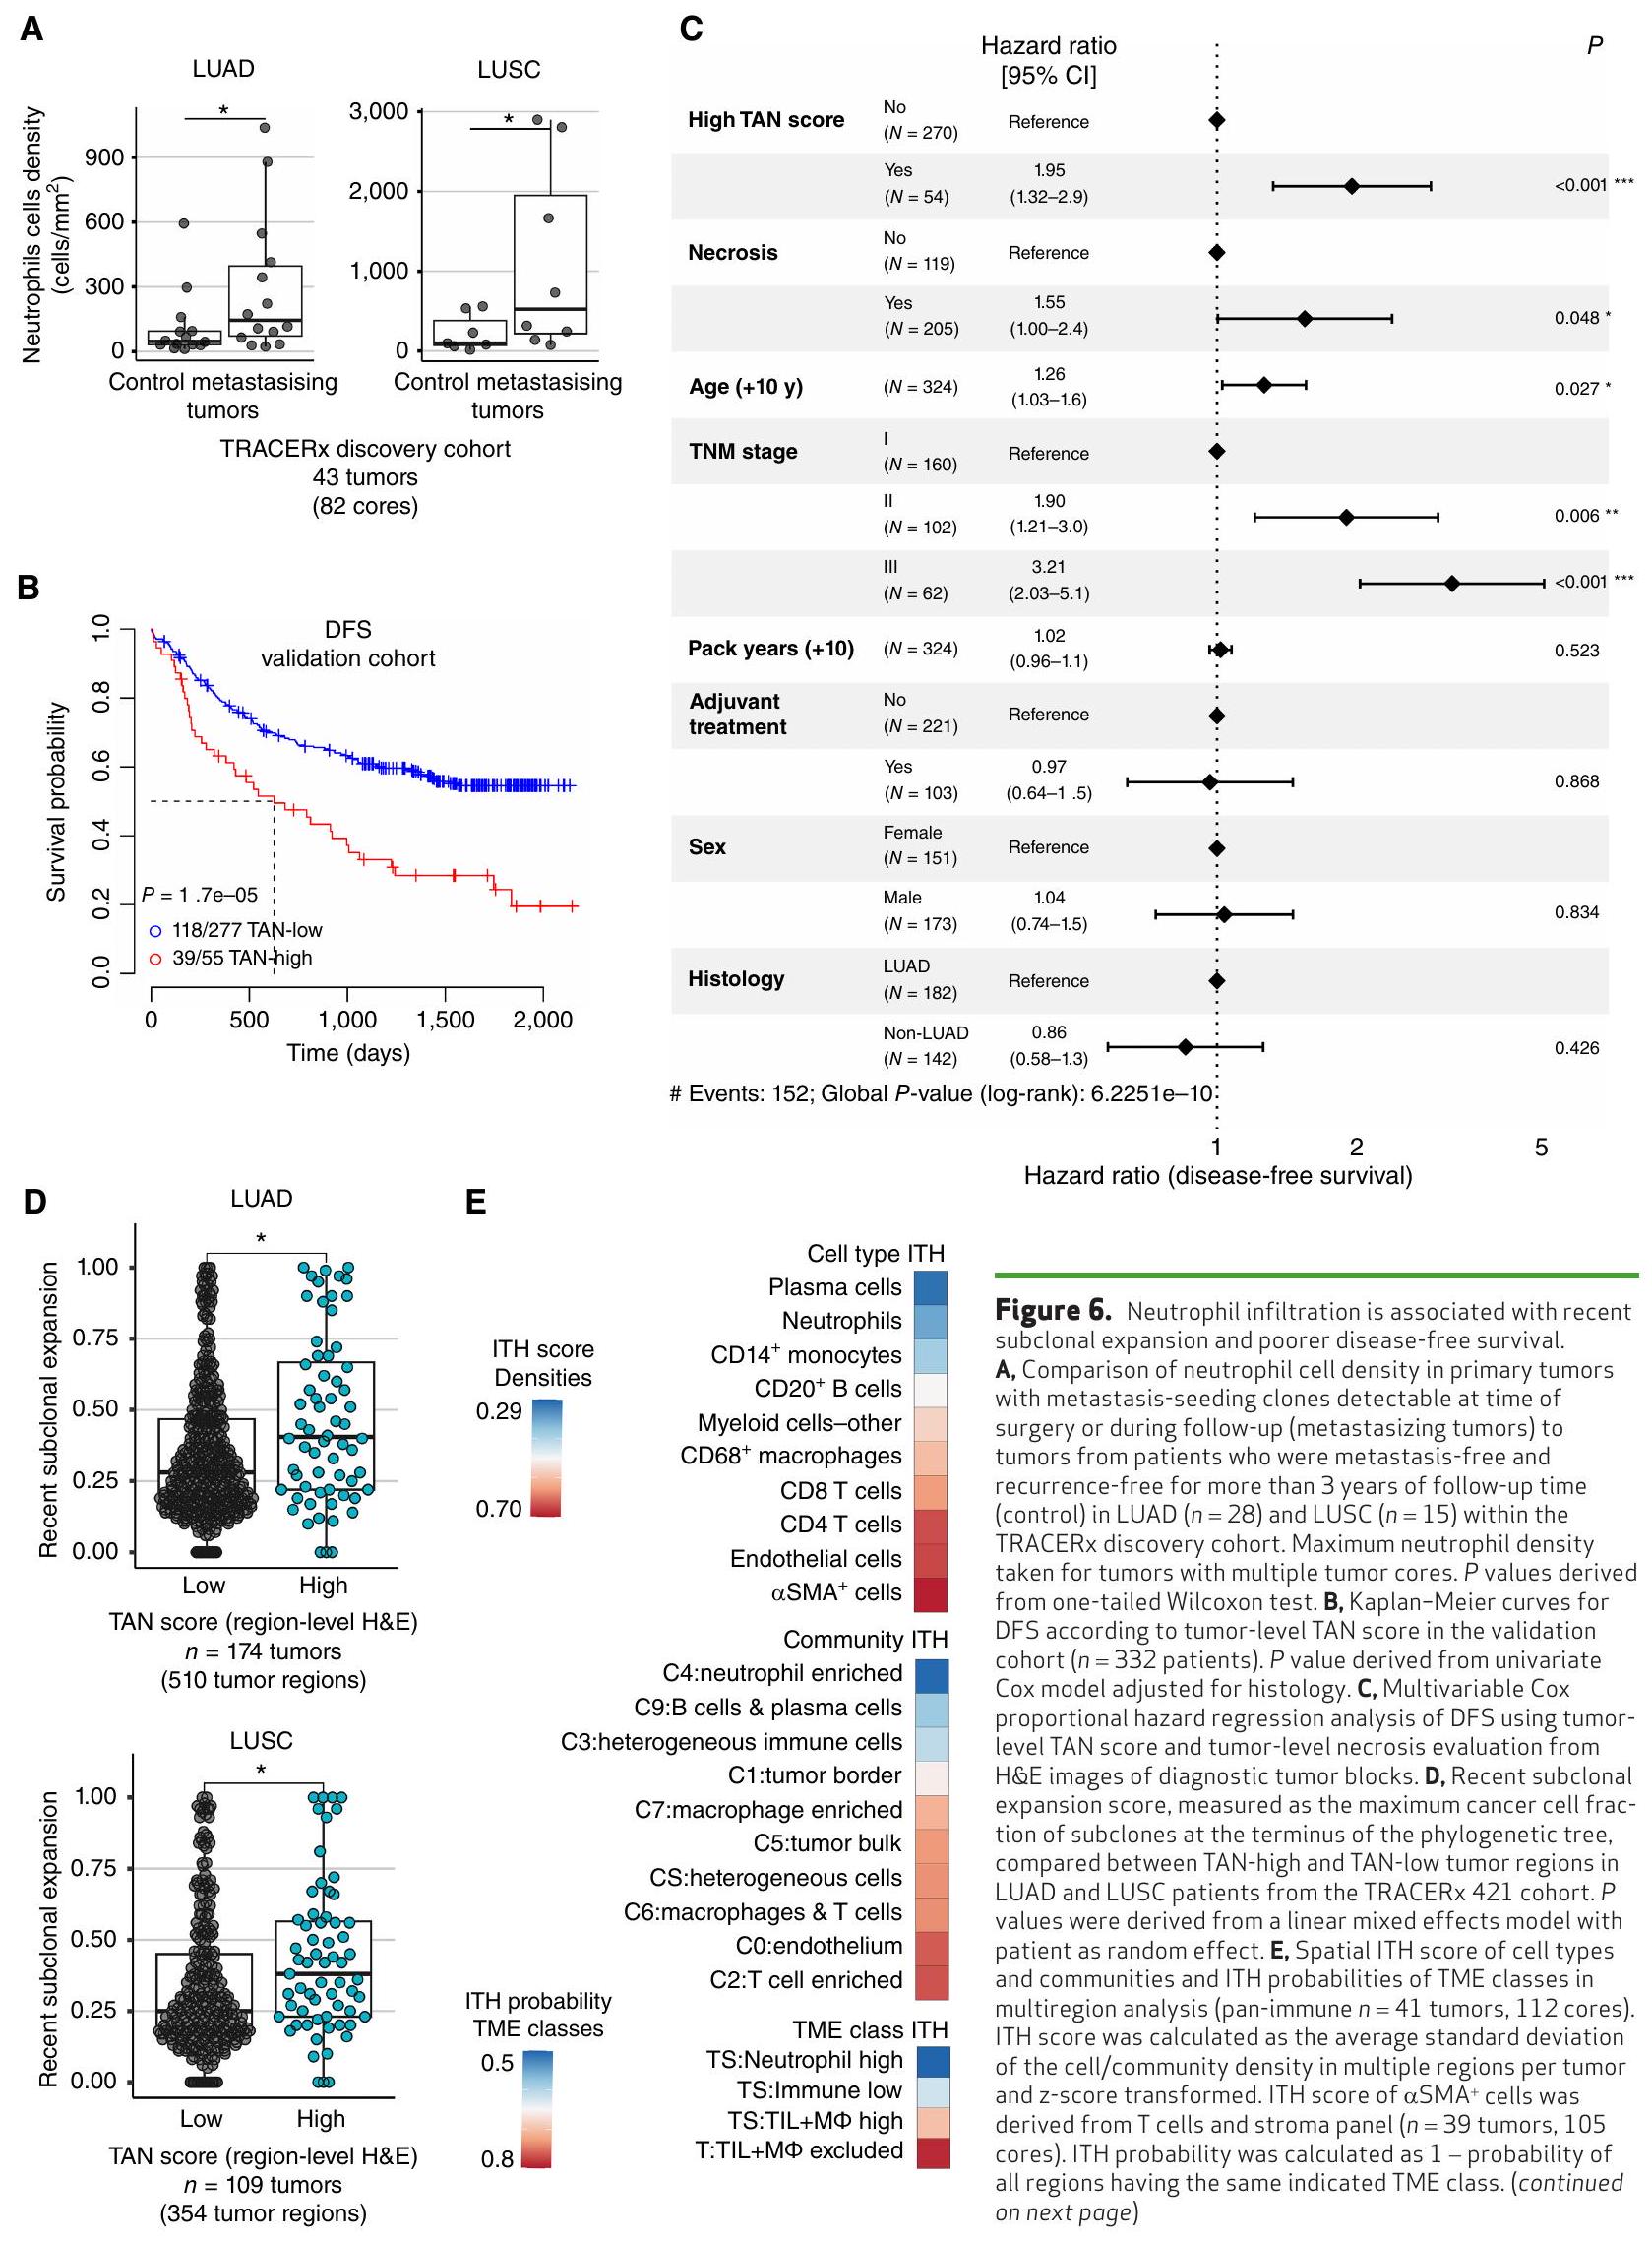
قمنا بتقييم ميل الأورام ذات البيئات المجهرية المختلفة للتطور والتوسع والانتشار. نظرًا للخصائص المؤيدة للورم المرتبطة بالبيئات المجهرية الغنية بالعدلات والتداعيات التي تم الإبلاغ عنها سابقًا للعدلات في الانتقال في نماذج الحيوانات، تحققنا مما إذا كان تسرب العدلات مرتبطًا بخطر تكرار المرض والانتقال في سرطان الرئة غير صغير الخلايا. باستخدام التحليل النسلي لمناطق الأورام الأولية في TRACERx والنقائل المقابلة، حددنا النسائل التي أطلقت النقائل. قمنا بمقارنة كثافات خلايا العدلات باستخدام بيانات IMC بين الأورام الأولية التي تحتوي على نسائل قادرة على إحداث النقائل القابلة للاكتشاف في وقت الجراحة أو خلال المتابعة (الأورام المتنقلة) والأورام من المرضى الذين ظلوا خاليين من النقائل وخاليين من التكرار لمدة لا تقل عن ثلاث سنوات من المتابعة (مجموعة الاكتشاف،مرضى LUAD و LUSC؛ الشكل التوضيحي S10A). لاحظنا زيادة ملحوظة في كثافة خلايا العدلات في الأورام المنتشرة مقارنة بالأورام من المرضى الخاليين من الانتشار والانتكاسة، في LUAD ( ) و LUSC ( اختبار أحادي الذيل؛ الشكل 6A).
لقد سعينا لتأكيد هذه الملاحظة في مجموعة تحقق منفصلة ضمن TRACERx باستخدام نظام تسجيل TAN المستمد من صبغة H&E. المرضى؛ الشكل التوضيحي التكميلي S10A؛ الجدول التكميلي S3). افترضنا أن الأورام الرئوية غير الصغيرة الأولية التي تحتوي على بيئة ميكروية غنية بالعدلات تزرع النقائل بشكل أكثر تكرارًا، وبالتالي، كانت لديها مخاطر أعلى للانتكاس بعد إزالة الورم الأساسي جراحيًا. أظهر تحليل البقاء الخالي من المرض (DFS) أحادي المتغير ارتباطًا كبيرًا بين درجات TAN العالية على مستوى الورم و DFS أسوأ في NSCLC ( )، مع متوسط فترة البقاء خالية من المرض (DFS) لمدة 21 شهرًا للدرجات العالية مقارنة بأكثر من 70 شهرًا للدرجات المنخفضة (الشكل 6B). كانت هذه العلاقة التنبؤية مستقلة عن الحد المستخدم لتعريف درجات TAN وتم الحفاظ عليها لكل من درجات TAN على مستوى الورم وعلى مستوى المنطقة (الشكل التكميلي S10B و S10C؛ الطرق). بالإضافة إلى ذلك، كانت درجة TAN العالية على مستوى الورم مرتبطة أيضًا بشكل قوي بفترة بقاء خالية من المرض أقصر في LUAD (HR ) و LUSC (HR = 2.13، )، بشكل منفصل (الشكل التكميلي S10C).
نظرًا للتكرار الأعلى للنخر في الأورام المت infiltrated بالعدلات، والذي تم ربطه سابقًا بالمرحلة المتقدمة وسوء التنبؤ في سرطان الرئة غير صغير الخلايا (NSCLC) (36)، قمنا بعد ذلك بتقييم ما إذا كانت علاقة TAN بالنتيجة مشوشة بواسطة المؤشرات المبلغ عنها سابقًا لضعف فترة البقاء بدون مرض (DFS). في نموذج متعدد المتغيرات لفترة البقاء بدون مرض باستخدام درجة TAN، النخر، العمر، الجنس، العلاج المساعد، سنوات التعبئة، نوع النسيج، ومرحلة TNM، كانت درجة TAN عامل تنبؤ مستقل. )، جنبًا إلى جنب مع حالة النخر ( )، العمر ( ) ، ومرحلة ( ) في سرطان الرئة غير صغير الخلايا (الشكل 6C؛ الشكل التكميلي S10D وS10E).
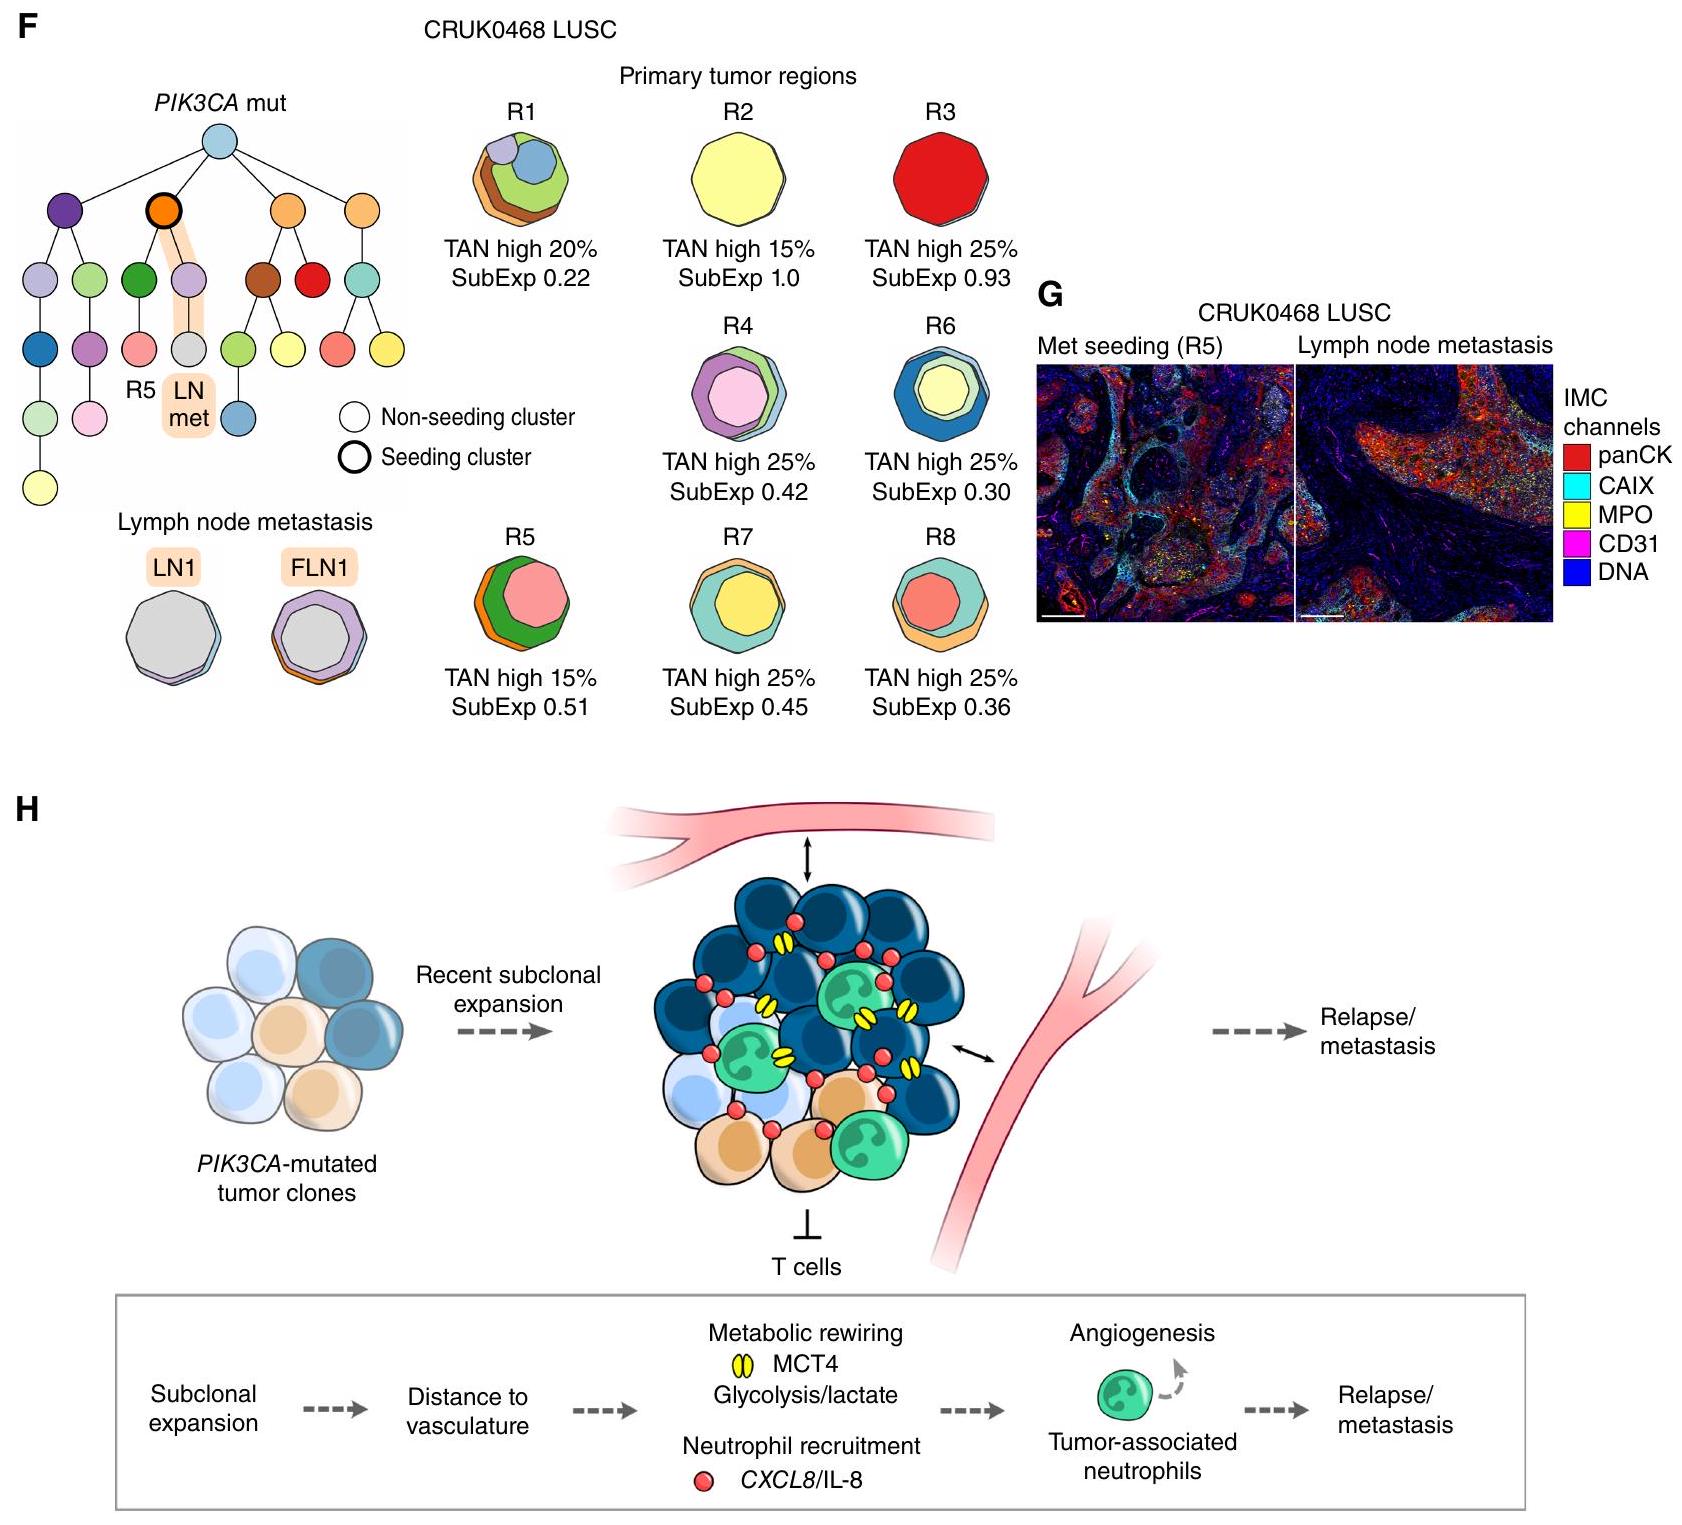
الشكل 6. (مستمر) F، مثال على شجرة النشوء والتطور توضح حالة LUSC من المرحلة IIIA مع طفرة PIK3CA متطابقة، ودرجات TAN عالية، وتوسع تحت كلوني حديث، بما في ذلك في منطقة (R5) التي أطلقت نقيلة في العقد اللمفية (LN) (FLN، FFPE LN). السلالة التي تسببت في النقيلة مميزة باللون البرتقالي. تم الإبلاغ عن درجات TAN على مستوى الورم ودرجات التوسع تحت كلوني (SubExp) للمناطق الورمية الأولية. تمثل درجة TAN المبلغ عنها الحد الأقصى لدرجات عش الورم والستروما. يتم تعيين لون لكل مجموعة في شجرة النشوء والتطور والذي يتم تمثيله أيضًا في خرائط الكلونات الإقليمية. توضح خرائط الكلونات انتشار كل كلون داخل منطقة. G، صور IMC المعروضة لـ R5 ونقيلة العقد اللمفية. مقياس الرسم، . ملخص تخطيطي للرابط بين الأورام ذات البيئة الدقيقة الغنية بالعدلات وتقدم الورم.; *, ; **, ; ***, P<0.001; LUAD، سرطان الغدة الرئوية؛ LUSC، سرطان الخلايا الحرشفية الرئوية؛ ITH، التباين داخل الورم.
لتأكيد العلاقة التنبؤية بين نهج تسجيل TAN وDFS، قمنا بالتحقق من العلاقة في مجموعة مستقلة ثانية باستخدام نهج آلي لتقدير عدد الكريات البيضاء. استخدمنا نموذج التعلم العميق PathExplore (37) لتصنيف نوع الخلايا والأنسجة على صور الشرائح الكاملة من TCGA. على غرار درجة TAN، تم تعيين درجة عالية للأورام عندما كانت نسبة الكريات البيضاء في عش الورم أو السدى أعلى من الحد الأدنى المعني لعش الورم أو السدى (الشكل التوضيحي التكميلي S11A). نظرًا لأن الحدود العليا لدرجة TAN المستمدة من مجموعة TRACERx لم تكن قابلة للتحويل إلى الدرجات الآلية في مجموعة TCGA (الطرق)، تم تقييم العلاقة مع DFS. عبر مجموعة من الحدود بناءً على نسب عُشْر الورم والستروما. تم رؤية نمط النسب العالية للمخاطر (زيادة خطر التكرار أو الوفاة) بشكل متسق مع زيادة نسب الحبيبات في عُشْر الورم أو الستروما في التحليلات متعددة المتغيرات للبقاء خالياً من المرض باستخدام العمر، الجنس، العلاج المساعد، سنوات التعبئة، نوع النسيج، ومرحلة TNM.المرضى الذين يعانون من سرطان الرئة غير صغير الخلايا (NSCLC)، حيث كانت الدرجات الآلية والمعلومات حول العوامل المستخدمة في نموذج الانحدار المتعدد المتغيرات لكوكس متاحة؛ الشكل التوضيحي التكميلي S11B)، مع الحفاظ على دلالة إحصائية عبر جميع الفترات فوقنسبة عُشْر الورمنسبة السدىقيمة الدرجة الآلية في النموذج متعدد المتغيرات ).
أخيرًا، نظرًا لارتباط درجة TAN بالنتائج السيئة، قمنا بالتحقيق فيما إذا كان تسرب العدلات مرتبطًا بأنماط تطورية أظهرت سابقًا ارتباطها بفترة بقاء خالية من المرض أقصر في TRACERx (14). على وجه التحديد، قمنا بالتحقيق في مقياس جينومي للتوسع تحت الخلوي الحديث في الأورام الأولية، والذي يُعرف بأنه حجم أكبر تحت خلية نهائية لشجرة النشوء والتطور لمنطقة الورم. كانت مناطق الأورام ذات درجة TAN العالية تحتوي على درجات توسع تحت خلوي أعلى بشكل ملحوظ من مناطق الأورام ذات درجة TAN المنخفضة في LUAD و LUSC.“; الشكل 6D)، مما يشير إلى أن البيئات المجهرية الغنية بالعدلات تحتوي على توسعات أكبر من النسخ الفرعية الحديثة مقارنة بمناطق الورم الأخرى وترتبط بديناميات تطور الورم المرتبطة بالنقائل والنتائج السيئة. كما كانت وجود طفرات PIK3CA مرتبطة أيضًا بدرجة أعلى من توسع النسخ الفرعية الحديثة مقارنة بالأورام من نوع PIK3CA البري في LUSC (؛ الشكل التوضيحي الإضافي S11C).
التنوع داخل الورم لعوامل التنبؤ، والأهداف العلاجية المحتملة، أو علامات التصنيف له أهمية قصوى لتطبيقها السريري واستجابة العلاج المثلى. باستخدام أساليب قائمة على التعلم العميق، حددت دراسة حديثة عن LUAD ميزات TME فينوى LUAD التي تتنبأ بشكل جماعي بتوقعات سيئة (1). ومع ذلك، اعتمد النموذج على ميزات كانت لديها تباين مكاني عالٍ في NSCLC (الشكل 6E)، مما يبرز أهمية أخذ انحياز العينة في الاعتبار عند تصميم الفحوصات القابلة للتطبيق سريريًا. كانت الخلايا المتعادلة، ومجتمعها المكاني، وفئة TME لديها أقل تباين مكاني، جنبًا إلى جنب مع خلايا البلازما، مقارنة بأنواع الخلايا المناعية الأخرى والمجتمعات المكانية (الشكل 6E).
المريض CRUK0468 تم تشخيصه بمرحلة IIIA من سرطان الرئة غير صغير الخلايا، على سبيل المثال، يحمل ورمًا عالي TAN مع تباين مكاني منخفض. جميع المناطق الثمانية المأخوذة من الورم الأساسي كانت تحتوي على تسلل عالي من العدلات مع درجة عالية من TAN وطفرات متكررة في جين PIK3CA. أظهرت سبع مناطق درجة توسع تحت سلالي حديث أعلى من الوسيط في المجموعة، بما في ذلك المنطقة التي أطلقت نقيلة في العقد اللمفاوية، R5 (الشكل 6F). المنطقة المصدرة، R5، والنقيلة في العقد اللمفاوية المشتركة كانت تتميز بخصائص TME: تسلل عالي من العدلات والتعبير على طول حواف عُش النسيج الورمي، الذي تم تحديده باستخدام IMC في الورم الأساسي ومنطقة النقائل (الشكل 6G).
استنادًا إلى هذه النتائج، نقترح أن الأورام الرئوية غير الصغيرة من نوع الخلايا الحرشفية والأورام الرئوية غير الصغيرة من نوع الخلايا الغدية التي تحتوي على تسلل مرتفع من الخلايا المناعية المتسللة (TAN) تحمل تحت سلالات تم توسيعها مؤخرًا ويمكن أن تكون غنية بالطفرات المحركة المحددة التي تم اكتسابها في المراحل الأولى من التطور، مثل PIK3CA في الأورام الرئوية غير الصغيرة من نوع الخلايا الحرشفية (الشكل 6H). كانت الأورام التي تحتوي على تسلل مرتفع من الخلايا المناعية المتسللة تتمتع بتنوع مكاني منخفض ومخاطر عالية من النقائل أو الانتكاس في الأورام الرئوية غير الصغيرة بغض النظر عن المرحلة، والتموت، والمتغيرات السريرية الأخرى.
نقاش
في هذه الدراسة التكاملية للبيئة المجهرية للورم في سرطان الرئة غير صغير الخلايا، استخدمنا تصوير الأنسجة عالي الأبعاد والتسلسل المتزاوج لكشف الميزات الداخلية والخارجية للسرطان التي تكمن وراء تكوين البيئة المجهرية للورم وتنظيمها المكاني. حددنا الديناميات المناعية الموجهة نحو النيوأنتيجين، وتنظيم الألياف، والطفرات المحركة، والأنماط المناعية كعوامل محتملة تحدد بنية البيئة المجهرية للورم. هذه الميزات في البيئة المجهرية للورم، شائعة عبر سرطان الرئة غير صغير الخلايا أو محددة لأنماط الأنسجة، تكشف عن نقاط الضعف العلاجية المحتملة والتحديات. نقدم تصنيفًا للتباين المكاني لهذه الميزات في بيئة الورم، مما يوفر مرجعًا للدراسات التي تسعى لتحديد الأهداف ذات التباين المكاني المنخفض. الهيكل الفريد لدراسة TRACERx وعمق المعلومات السريرية والجينية مكننا من ربط بيئة الورم بالتوسع تحت الخلوي، وزرع النقائل، والنتائج السريرية.
حددنا أربع فئات متميزة من بيئة الورم المناعية (TME) في سرطان الرئة غير صغير الخلايا (NSCLC) في مراحل مبكرة من العلاج، بناءً على تصنيفات سابقة تعتمد على التوزيع المكاني لخلايا المناعة المتسللة (TILs) فقط (17) والتجمعات التركيبية من تعبير الجينات (38-40). وصفنا 10 مجتمعات متعددة الخلايا موجودة عبر الأنواع النسيجية لسرطان الرئة غير صغير الخلايا، مؤكدين تلك التي تم تعريفها في دراسة حديثة باستخدام التصوير المناعي المتعدد (IMC) لسرطان الرئة ذو الخلايا الكبيرة (LUAD)، على الرغم من الاختلافات في الأنواع الفرعية الخلوية المحللة والتركيب النسيجي لكل مجموعة بيانات (1). التقطت فئات TME تسلل المناعة داخل الورم أو استبعادها من عش الورم، بينما كشفت المجتمعات المكانية عن تجمعات متعددة الخلايا قد تمثل موائل وظيفية.
أحد الميزات الموحدة لنوى أورام LUAD و LUSC كان الترتيب المكاني المعزز للأنسجة المحيطة بالورم.الأرومة الليفية بين خلايا CD 8 T وخلايا الورم في بيئات الأورام المناعية المنخفضة. نقترح أن الحواجز السدوية تمثل حاجزًا ماديًا محتملاً للتفاعل بين خلايا الورم وخلايا T وقد تؤثر على دخول خلايا T إلى الأورام. تدعم هذه النتائج الأدبيات السابقة التي تشير إلى دور خلايا الأنسجة الداعمة في تثبيط المناعة في أنواع مختلفة من السرطان من خلال الاستبعاد المادي للخلايا المناعية من أعشاش الورم وإفراز السيتوكينات. ومع ذلك، فإنكانت الحواجز غير كافية لشرح بيئات الأورام المستبعدة من المناعة التي تم التقاطها في هذه الدراسة. تماشيًا مع هذه النتيجة، وجد لي وزملاؤه، باستخدام النمذجة الحاسوبية، أن تعبير المواد الطاردة للكيماويات بدلاً من الحواجز الليفية هو الذي يصف بشكل أفضل استبعاد خلايا T على المدى القصير من جزر الورم في سرطان الثدي الثلاثي السلبي. يجب أن تسعى الأعمال المستقبلية إلى تحسين تقسيم ودقة أنواع الخلايا الليفية ضمن وخارجلقد أظهرت أنواع مختلفة من الخلايا الليفية المتوسطة (CAF) مؤخرًا أن لها قوة تنبؤية مختلفة في سرطان الرئة غير صغير الخلايا (NSCLC) غير المعالج (8) وأنها تتواجد بشكل مختلف في بيئة الورم (TME) لسرطان الرئة غير صغير الخلايا (20).
لقد ارتبط عبء النيوانتجينات المستنسخة بتحسين الاستجابات للعلاج المناعي (44، 45)، مما يستدعي استكشاف هياكل البيئة المجهرية للورم التي قد تتشكل استجابةً لارتفاع عبء النيوانتجينات المستنسخة. هنا، نحدد الأماكن متعددة الخلايا التي تزداد انتشارًا مع عبء النيوانتجينات المستنسخة ونظهر أن تكوينها يختلف اعتمادًا على استنساخ النيوانتجينات المعبر عنها، وفقدان التغاير في الأليل HLA المقدم ونوع النسج. في LUAD، قد تتشكل منطقة متعددة الخلايا من البلعميات وخلايا T استجابةً لارتفاع عبء النيوانتجينات المستنسخة وتؤثر على اختيار الاضطرابات الذاتية لخلايا السرطان في تقديم مستضدات MHC من الفئة I. على الرغم من أن هذه المجموعة كانت تحتوي على تجمعات خلايا T CD8 السامة والذاكرة المقيمة، إلا أن التفاعلات بين البلعميات وخلايا T CD8 يمكن أن تثبط حركة خلايا T وتعزز الإرهاق (46، 47). علاوة على ذلك، ارتبط التعرض للنيوانتجينات المستنسخة بزيادة خلل خلايا T في هذه المجموعة من البيانات (16).احتوت بيئات LUAD عالية على غنى من هذه المجموعة من البلعميات وخلايا T، مما يضيف دقة مكانية
إلى الارتباطات السابقة بين مناطق الأورام الملتهبة والهروب المناعي الذاتي (10). وهذا يبرز الحاجة إلى تصنيف مجموعات البلعميات بالقرب من خلايا T وكيف يمكن استهدافها علاجيًا لدعم استجابة فعالة موجهة ضد النيوانتجينات المستنسخة (48).
كانت خلايا البلازما ومجتمعها المقابل مرتبطين ليس فقط بالنيوانتجينات المستنسخة ولكن أيضًا بإجمالي عبء النيوانتجينات في LUSC، بالإضافة إلى ارتفاع TMB ( طفرات/ ميغاباز) في كل من LUAD وLUSC. تربط هذه النتائج عدة ميزات مرتبطة بتحسين استجابة العلاج المناعي (44، 45، 49-52). لقد حددت عدد قليل من الأوراق روابط بين هذه الميزات الذاتية وغير الذاتية لخلايا السرطان، حيث لم يتم الإبلاغ عن أي ارتباط في دراسات LUAD وحدها (53-55). قد تكون مجموعة خلايا البلازما المحددة في TRACERx قد تشكلت بشكل مستقل عن الهياكل اللمفاوية الثلاثية (TLS)، حيث لم نحدد TLS في الكتل الإقليمية التي تم اشتقاق نوى TMA منها (الطرق). وهذا يشير إلى أن خلايا البلازما المتسللة إلى الورم قد تكون قد نشأت من العقد اللمفاوية التي تصرف الورم أو أن TLS لم يتم التقاطها في الأنسجة التي تم تحليلها. تؤكد هذه الروابط على أهمية تحليل استجابات الأجسام المضادة للنيوانتجينات وكذلك المستضدات الذاتية غير المنظمة (53) وتأثيرها على استجابات العلاج المناعي.
كشفت هذه الدراسة أيضًا أن ارتفاع تسلل العدلات ارتبط بالأورام النقيليّة وفترة البقاء على قيد الحياة الأقصر في NSCLC. على الرغم من أن نسبة العدلات المحيطية إلى اللمفاويات قد ارتبطت بنتائج سلبية في NSCLC (56)، إلا أن التقارير حول التأثير التنبؤي للعدلات المحلية داخل الورم كانت متضاربة. بين الخلايا المناعية، أظهرت توقيعات التعبير الجيني للعدلات أنها أقوى مؤشر على سوء التشخيص في NSCLC (22). ومع ذلك، تم الإبلاغ عن ارتباط متغير للعدلات داخل الورم مع النتائج السريرية اعتمادًا على النوع النسجي (57)، وموقع العدلات (58)، ونمطها الظاهري (1). هنا، طورنا وصادقنا على نهج تسجيل TAN من H&Es التي تم جمعها بشكل روتيني والتي تمثل بيئات TS:Neutrophil عالية من خلال وزن نسبة العدلات في عش الورم أو السدى بشكل متساوٍ. في كل من LUAD وLUSC، تعتبر هذه النتيجة السريرية القابلة للوصول مؤشرًا قويًا للتنبؤ مستقلًا عن المرحلة والمتغيرات السريرية الأخرى في مجموعتين مستقلتين.
كما أظهرت الأورام عالية TAN أيضًا انخفاضًا في التباين المكاني، وهي ميزة أساسية للتغلب على تحيز العينة. لاحظنا تباينًا مكانيًا عاليًا لميزات TME التي تم استخدامها سابقًا للتنبؤ بالتشخيص في LUAD باستخدام نهج التعلم العميق، والذي فشل في الحفاظ على مستوى دقة التنبؤ عندما تم تقليل عدد علامات السلالة (1). قد يمثل التباين المكاني لأنواع الخلايا المستخدمة في نماذج التعلم العميق غير المراقب عقبة أمام ترجمة نهج التعلم العميق إلى اختبارات سريرية قابلة للوصول. يدعم انخفاض التباين المكاني الذي لوحظ للعدلات والهياكل المكانية التي شكلتها الإمكانية الترجمية لنهج تسجيل TAN المقترح.
لا تزال الآليات المحتملة وراء الارتباط التنبؤي لـ TANs بحاجة إلى تعريف. تشير الأدلة المتزايدة إلى أن العدلات تتمتع بمرونة عالية وقابلية للتكيف مع سياق الأنسجة (59). لذلك، فإن دراسة الإعداد المكاني للعدلات أمر أساسي لتحديد الإشارات البيئية
التي تعدل الأنماط الظاهرية المضادة للورم والمساعدة على الورم. يمكن أن تمارس العدلات ميزات مساعدة للورم من خلال تعزيز تدهور المصفوفة خارج الخلوية، EMT، تكوين الأوعية، كبت المناعة، والنقائل ()، وكلها ارتبطت بفئة TME العالية من TS:Neutrophil في واحدة على الأقل من LUAD أو LUSC. تم أيضًا ملاحظة زيادة تنظيم برامج التعبير الجيني لـ EMT في خلايا الورم المجاورة لمجموعات العدلات في دراسة حديثة للتعبير الجيني على مستوى الخلية الواحدة (62). بالإضافة إلى ذلك، كانت نوى الورم ذات بيئات TS:Neutrophil العالية في LUAD وLUSC قد شهدت حالات خلوية سرطانية أيضية متغيرة. ومع ذلك، كانت هذه الحالات الأيضية والظروف الناقصة في هذه الفئة مختلفة بين LUAD وLUSC، بما يتماشى مع التقارير السابقة حول الاختلافات الأيضية بين النوعين النسجيين (63). تشير زيادة تنظيم تعبير MCT4 وCAIX في LUSC إلى أن نقص الأكسجين أو تدفق اللاكتات قد يساهم في النمط الظاهري المثبط للمناعة في هذه الفئة، على سبيل المثال، من خلال تعزيز تعبير PD-L1 وخلل خلايا T في سياقات الالتهاب (63، 64)، بما يتماشى مع زيادة تكرار العدلات + PD-L1.
في هذه الدراسة، أظهرنا أن TANs كانت غنية في مناطق الورم التي شهدت توسعات حديثة من تحت السلالات الورمية، مما يكشف عن رابط بين TME والتاريخ التطوري للورم في LUAD وLUSC. كان هذا الارتباط مستقلًا عن وجود مناطق نخرية ونسب MCT4 وCAIXخلايا الورم في LUAD وLUSC، مما ي implicate العدلات كمؤشرات أو مروجات للانتكاس والنقائل (64). على الرغم من أن العدلات قد وُصفت بأنها وسطاء التعاون تحت السلالي غير المباشر ولكن ليس التوسع الذي يعزز النقائل في نموذج سرطان الثدي (33)، تشير نتائج هذه الدراسة إلى أن ديناميات تطور الورم مرتبطة بالنقائل في الأورام الغنية بالعدلات. نتيجةً لذلك، على سبيل المثال، يمكن أن يؤدي توسع تحت السلالة الورمية إلى تجاوز إمداداتها الوعائية، مما يؤدي إلى إجهاد أيضي يمكن أن يحفز النخر وتجنيد العدلات، مما يمكن أن يتعزز بشكل أكبر في حلقة تغذية راجعة إيجابية. ضمن هذا السياق المكاني، اكتسبت العدلات نمط TAN. لذلك، تميز العدلات بيئة دقيقة فريدة مرتبطة بتقدم المرض، والتي لا يمكن تفسيرها، على سبيل المثال، بالنخر أو نقص الأكسجين أو التحلل السكري وحده في LUAD وLUSC. بناءً على هذه النتائج، نستنتج أن LUADs وLUSCs عالية TAN من المحتمل أن تنظم TME مساعدة للورم لتعويض الوصول الوعائي المقيد والخلل الأيضي وتستقطب العدلات إلى نمط ظاهري مساعد لتكوين الأوعية مما يؤدي إلى كبت المناعة، وزيادة خطر النقائل، وتوسعات تحت السلالات.
ارتبطت زيادة تنظيم مسارات الإشارات المسرطنة أيضًا ببيئة TME الغنية بالعدلات، مثل إشارات KRAS في LUAD وLUSC. لقد أظهرنا سابقًا، في نموذج فأر LUAD، أن الأورام التي تحتوي على طفرات KRAS كانت تحتوي على تجمعات من العدلات واستبعدت TILs، بينما أدى العلاج بمثبط KRAS MRTX1257 إلى تقليل العدلات وزيادة تسلل خلايا T (65). ومع ذلك، لم تكن طفرات KRAS المحركة غنية فقط في بيئات TME العالية من TS:Neutrophil. في LUSC، لاحظنا أن TANs كانت مرتبطة بطفرات PIK3CA المحركة التي قد تساهم في أو تدعم الهروب المناعي. كانت LUSCs التي تحتوي على طفرات PIK3CA تخضع بشكل متكرر لتوسعات تحت السلالات الحديثة. بالإضافة إلى ذلك، كانت خلايا الورم التي تحتوي على PIK3CA تم تنظيم الطفرات لزيادة CXCL8/IL-8، بما يتماشى مع الأعمال السابقة التي تربط إشارة PI3K بتعبير CXCL8 في خلايا الأورام الرئوية والظهارية. لقد تم ربط طفرات PIK3CA بتنظيم استقلاب الجلوتامين واستهلاك المغذيات في الأورام المتكاثرة، بالإضافة إلى تعبير السيتوكينات المؤيدة للالتهابات. ومع ذلك، فإن نسبةأو MCT4لم تكن خلايا الورم مختلفة بشكل ملحوظ بين مناطق الطفرات في PIK3CA ونوع PIK3CA البري. بناءً على ذلك، وحالتها الكلونية بشكل أساسي، نقترح أن هذه التغيرات الجسدية قد تميل بالورم نحو بيئة ميكروية غنية بالعدلات وتكشف عن دور محتمل مباشر أو غير مباشر لطفرات PIK3CA في تعزيز التواصل بين الورم والعدلات في سرطان الرئة ذو الخلايا الحرشفية.
بشكل جماعي، فإن هذه النتائج لها آثار علاجية في سرطان الرئة غير صغير الخلايا القابل للاستئصال في مراحله المبكرة، وهي مجموعة يُعتبر فيها العلاج المناعي المساعد بالإضافة إلى العلاج الكيميائي معيارًا للرعاية الآن. تتراوح الاستجابات الكاملة المرضية، التي ترتبط بزيادة البقاء العام، بعد العلاج المساعد، بين و ، مما يبرز الحاجة إلى تحسين توصيف البيئة المجهرية للورم وتحديد استراتيجيات لتحسين نتائج المرضى. كلاهماتم استبعاد TMEs العالية و T:TIL+M$ من درجة عالية من ITH التي قد تؤثر على فعالية مثبطات نقاط التفتيش (CPI). تم العثور على جيوب مكانية غنية بالخلايا التائية بشكل رئيسي في TME العالي TS:TIL+MФ في LUAD و LUSC. ومع ذلك، كانت هذه الجيوب خاضعة لضغوط انتقائية على تقديم النيوأنتيجين من خلال HLA LOH في LUAD و LUSC. تبني هذه النتائج على الأعمال السابقة في NSCLC، التي أظهرت ارتباطًا محسنًا بين TMB واستجابات CPI بعد أخذ HLA LOH في الاعتبار (75) وتبرز أهمية النظر في كلونية النيوأنتيجين والنمط النسيجي عند تصميم استراتيجيات علاجية تعتمد على النيوأنتيجين. في LUSC، كانت TMEs المستبعدة مرتبطة بتعبير خلايا الورم عن PD-L1 ومجتمع النيوأنتيجين المتعلق بالنسيلة في البلازما والخلايا. تؤكد هذه النتائج على أهمية دراسة القيمة التنبؤية لهذه المجموعة ذات التباين المنخفض من خلايا البلازما وخلايا B في سياق العلاج المناعي في سرطان الرئة ذو الخلايا غير الصغيرة وكيف تتغير التنظيم المكاني مع مرور الوقت.
على الرغم من أن البيئات المجهرية للأورام ذات مستوى المناعة المنخفض ومستوى العدلات المرتفع كانت عرضة لانخفاض التنوع داخل الورم، إلا أنها قد تكون أقل استجابة للعلاج المناعي. قد تقيد الشبكات الكثيفة من الخلايا الليفية وصول خلايا T وبالتالي استجابة العلاج المناعي. لقد حقق استهداف الخلايا الليفية السرطانية وجزيئات نقاط التفتيش نجاحًا في النماذج ما قبل السريرية وقد يثبت فائدته في الأورام ذات البيئات المجهرية المناعية المنخفضة للعلاجات المصممة مع المعرفة المتزايدة بأنماط الخلايا الليفية ووظائفها المتنوعة. أخيرًا، في البيئات المجهرية الغنية بالعدلات، قد تكون استجابة العلاج المناعي محدودة بسبب زيادة مستويات تعبير IL-8، والتي ارتبطت بتقليل الفائدة من العلاج المناعي بناءً على مستويات IL-8 في الورم والدورة الدموية. ومع ذلك، فإن التجارب السريرية التي تستهدف العدلات باستخدام علاجات مضادة لـ CXCR1/2 والعلاج المناعي المركب ومضاد IL-8 جارية وقد توفر ميزة في علاج الأورام الغنية بالعدلات. من الجدير بالذكر أن المرضى في هذه الدراسة لم يتلقوا علاجًا مناعيًّا مسبقًا أو مساعدًا. يجب أن تسعى الدراسات المستقبلية لتقييم مجموعات أكبر من حيث العوامل التنبؤية وعوامل التنبؤ باستجابة العلاج المناعي في الإعدادات المساعدة والمراحل المتقدمة من المرض.
في الختام، توفر هذه الدراسة رؤى جديدة حول التنظيم المكاني لبيئة الورم في سرطان الرئة في مراحله المبكرة في سياق المناعية الورمية، وتنوع الورم، وتطور السرطان. وتبرز أهمية ربط التاريخ التطوري للورم مع بيئة الورم المكانية المستكشفة لرسم فرضيات آلية حول تقدم الورم وانتشاره، مع تداعيات على نتائج المرضى والعلاج.
الطرق
عينات سريرية
البيانات من هذه الدراسة هي جزء من أول 421 مريضًا تم تحليلهم بشكل استباقي من مجموعة TRACERxhttps://clinicaltrials.gov/ ct2/show/NCT01888601). تمت الموافقة على دراسة TRACERx من قبل لجنة أخلاقيات البحث المستقلة (REC)، لجنة الأخلاقيات الوطنية للبحوث (NRES) في لندن-كامدن وإيسلينغتون، مع موافقة الراعي للدراسة من جامعة كوليدج لندن (UCL) بالتفاصيل التالية: مرجع REC 13/LO/1546، رقم البروتوكول UCL/12/0279، معرف مشروع IRAS: 138871. كان الحصول على موافقة خطية مستنيرة للدخول في دراسة TRACERx إلزاميًا وتم الحصول عليها من كل مريض. تم وصف طرق الحصول على البيانات سابقًا.تم معالجة الأنسجة الورمية المأخوذة من مناطق متعددة المجمدة بسرعة والأنسجة الطبيعية المجاورة البعيدة عن الورم داخل عينة الاستئصال إلى كتل FFPE بعد أخذ كمية كافية من المواد لتحليل الحمض النووي والحمض النووي الريبي. تم أخذ نواة تمثيلية واحدة من كل كتلة FFPE إقليمية (بقطر 1.5 مم) وترتيبها في TMAs تمثل 81 مريضًا عبر ثمانية كتل (الشكل 1A؛ الشكل التكميلية S1A). تم الحصول على أنسجة FFPE التحكم لتطوير اللوحة من بنك UCL/UCLH الحيوي لدراسة الصحة وتجديد الأمراض 2020 (موافقة الأخلاقيات 20/YH/0088) ودراسة PEACE (موافقة الأخلاقيات ). بالإضافة إلى ذلك، اثنان تم أخذ عينات من أنوية بقطر من كتلة FFPE لللوزتين وتم تجميعها في TMA مصغر، والذي عمل كتحكم داخلي للتلوين في هذه الدراسة.
البيانات السريرية
تم وصف البيانات السريرية من هذه الدراسة سابقًاتمثل أنماط النمو المرتبطة بنوى الأورام الرئوية غير الصغيرة الإقليمية النمط السائد في الكتلة الإقليمية المقابلة التي تم اشتقاق النواة منها (81). تم تصنيف الأنماط الشبكية، والميكروبابيلية، والصلبة على أنها عالية الدرجة؛ والأنماط اللمعية والبابيلية كمتوسطة الدرجة؛ والأنماط الغدية كمنخفضة الدرجة.
تطوير لوحة IMC
تم تطوير لوحات المناعة الشاملة وخلايا T والستروما IMC من خلال اختبار أداء الأجسام المضادة باستخدام التألق المناعي (IF) وIMC عبر سرطان الرئة غير صغير الخلايا (NSCLC) والرئة الطبيعية واللوزتين الغنية بالمناعة والأنسجة القلبية والدماغية المنخفضة المناعة (الشكل التكميلي S12A). تم تقييم شرائح H&E من كتل الأنسجة FFPE المستخدمة في تطوير اللوحات من قبل أخصائي علم الأمراض لتحديد أنواع الخلايا والميزات ذات الصلة لدعم تقييم الصبغ وإرشاد مسح IMC. تم تقييم الأجسام المضادة غير المترافقة أولاً باستخدام IF ثم أعيد تقييمها بعد الترافق المعدني باستخدام IMC (الشكل التكميلي S12B). تم شراء الأجسام المضادة المترافقة بالمعادن من Fluidigm، الآن Standard BioTools، وتم ترافُق الأجسام المضادة الخالية من الحامل (من موردين مختلفين) مع المعادن داخليًا باستخدام مجموعة تمييز المعادن المتعددة Maxpar X8 (Standard BioTools). تم تقييم صبغ الأجسام المضادة من حيث الخصوصية المتوقعة للصبغ، بما في ذلك الصبغ المشترك (مثل CD20، CD79a)، والتفرد المتبادل (مثل CD4، CD8a)، ونسبة الإشارة إلى الضوضاء، وكان مدعومًا بتقييم أخصائي علم الأمراض (الشكل التكميلي S12C). تم اشتقاق تخفيفات جميع الأجسام المضادة من خلال تقييم سلسلة تخفيف باستخدام IMC، مع معلومات اللوحة التجريبية. تم تطبيقه على مجموعة TRACERx 100 الملخصة في الجدول التكميلي S1. تظهر أمثلة على صبغ IMC عبر NSCLC، واللوزتين، والقلب، وأنسجة الدماغ للبان-المناعة وخلايا T ولوحات السدى في الشكل التكميلي S12C. تركز نتائج هذه الدراسة على 38 هدفًا من الأجسام المضادة؛ لم يتم تضمين بعض نتائج الأجسام المضادة لأنها إما لم تكن ذات صلة بالاستنتاجات البيولوجية لهذه الدراسة أو بسبب الأداء الفني.
معالجة الأنسجة للتألق المناعي
تم قطع كتل الأنسجة FFPE إلىسمك. تم خبز الأقسام فيفي التحضير للتلوين. تم إزالة الشمع من الشرائح باستخدام الزيلين (دقائق) وتم إعادة ترطيبها في سلسلة متدرجة من الكحول (إيثانول: ماء منزوع الأيونات 100:0، 100:0، 70:30، 0:100، 0:100، دقيقة واحدة لكل منها). تم إجراء استرجاع المستضد بواسطة الحرارة في محلول تريس-EDTA عند pH 9 لمدة 30 دقيقة في ميكروويف بقوة 900 واط. تم تبريد مقاطع الأنسجة ببطء في حمام مائي بدرجة حرارة الغرفة لمنع تبلور المحلول. ثم تم غسل المقاطع فيتمت الدائرة حول منطقة الأنسجة باستخدام قلم PAP غير القابل للماء لإنشاء حاجز للمواد الكيميائية. تم غمر العينات لفترة وجيزة في PBS-Tween20 (0.2%)، قبل التثبيط بـتمت المعالجة بـ BSA/PBS لمدة 30 دقيقة في درجة حرارة الغرفة. تم التخلص من محلول الحجب الزائد عن طريق الطرد، وتم إضافة الأجسام المضادة الأولية (مخففة فيتم تطبيق BSA/PBS وتركه طوال الليل فيفي اليوم التالي، تم غسل الشرائح ثلاث مرات في PBS (دقيقة واحدة لكل منها)، وغمرها لفترة وجيزة في PBS-Tween20، وتم تطبيق الأجسام المضادة الثانوية وتركها لمدة 45 دقيقة في درجة حرارة الغرفة. تم غسل الشرائح ثلاث مرات في PBS (دقيقة واحدة لكل منها)، وغمرها لفترة وجيزة في PBS-Tween20، وتم تلوينها بعامل DAPI (1:5000 في PBS) لمدة 30 دقيقة في درجة حرارة الغرفة. تم غسل العينات ثلاث مرات في PBS (دقيقة واحدة لكل منها) وغمرها في 0.1% سودان بلاك لمدة 20 دقيقة في درجة حرارة الغرفة. تم شطف العينات جيدًا في ماء الصنبور البارد حتى تصبح واضحة وتم شطفها مرتين في ماء مقطر. تم تثبيت الشرائح بعد إضافة 2 إلى 3 قطرات من وسط تثبيت VectaMount AQ المائي على الشرائح. تم تخزين الشرائح محمية من الضوء حتى تم تصويرها باستخدام نظام Zeiss Axio Imager M1 بتكبير 20x.
معالجة الأنسجة للتصوير المناعي
تم قطع عدة مقاطع متسلسلة من كل TMA من TRACERx إلىسمك، وتم وضع قسم من اللوزتين TMA على قاع TMA002-TMA007 ليعمل كتحكم داخلي في الصبغ. تم استخدام أقسام منفصلة من اللوزتين كتحكمات صبغ لـ TMA_REC و TMA001. تم وضع جميع الأقسام على شرائح قياسية مشحونة إيجابيًا للصبغ المناعي. تم اختيار قسمين متسلسلين وتم خبزهما فيفي التحضير لتلوين الأجسام المضادة؛ تم تعريض شريحة إضافية للتلوين بصبغة H&E. تم معالجة الشرائح كما هو موضح لتقنية IF. تم تطبيق خليطين من الأجسام المضادة المربوطة بالمعادن (مخففة في 1% BSA/PBS) على الشرائح المتسلسلة وتركها طوال الليل في. في اليوم التالي، تم غسل الأقسام ثلاث مرات في PBS (دقيقة واحدة لكل منها)، وغمرها لفترة وجيزة في PBS-Tween20، وتم تلوينها بعنصر الإريديوم (1:500 في PBS، فلويديلم) لمدة 30 دقيقة في درجة حرارة الغرفة. تم غسل العينات ثلاث مرات في PBS (دقيقة واحدة لكل منها) وتم تلوينها بعنصر الروثينيوم ( ) لمدة 5 دقائق على الثلج في خزانة الغازات (82). تم غسل العينات ثلاث مرات في ماء ملي كيو (دقيقة واحدة لكل مرة) وتركها لتجف في الهواء. تم معالجة الأنسجة الضابطة بنفس الإجراء خلال تطوير اللوحة.
جمع بيانات TRACERx IMC
تم الحصول على البيانات باستخدام نظام تصوير هايبرون باستخدام برنامج Standard Biotools IMC التجاري (الإصدار 6.7). تم توجيه اختيار مناطق الاهتمام (ROI) من خلال مراجعة أخصائي الأمراض لقسم H&E التسلسلي وتم تصميمها لالتقاط كل نواة TRACERx TMA كاملة (بقطر 1.5 مم) أو منطقة اهتمام لوزة بقطر 1.0 مم (الشكل التكميلي S12A). تم حرق الأنسجة في مناطق الاهتمام باستخدام الليزر بنمط متدرج.الدقة و200 هرتز. تم ضبط الأداة بين كل تشغيل باستخدام شريحة ضبط تغطية كاملة من 3 عناصر (فلويديجم، رقم الجزء 201088).
تعويض الفائض
لأخذ في الاعتبار تسرب إشارة النظائر الناتج عن الشوائب النظيرية، والأكسدة، وخصائص الجهاز (حساسية الوفرة)، قمنا بتكييف نهج تعويض التسرب الذي اقترحه شيفرييه وزملاؤه لاثنين من لوحات الأجسام المضادة لدينا. باختصار، تم توليد البيانات باستخدام شريحة تم وضعها مع أجسام مضادة مرتبطة بالمعادن خاصة بالدفعة. تم تسخين شرائح الهيستولوجيا Superfrost Plus (ثيرمو فيشر) على كتلة حرارية وتغطيتها بـتم تحضير فيلم الأجاروز، مع ضمان توزيع متساوٍ وطبقة رقيقة (أجاروز UltraPure، Thermo Fisher). ثم تُركت الشرائح لتجف حتى تتصلب الأجاروز بالكامل. تم خلط الأجسام المضادة المربوطة بالمعادن بنسبة 1:1 مع صبغة تريبان الزرقاء وتم وضعها على الشريحة بشكل متسلسل، مع ضمان عدم تداخل البقع مع بعضها البعض. بمجرد أن جفت البقع، تم اختيار منطقة اهتمام (ROI) لكل بقعة منفصلة على جهاز Hyperion (Fluidigm)، والتي تتوافق مع جسم مضاد واحد مرتبط بالمعادن. كانت كل منطقة اهتمام بارتفاع 10 بكسلات وعرض 200 بكسل وتم إزالتها بقوة ليزر أعلى بمقدار وحدتين من قوة ضبط الليزر.
من هذه البيانات التجريبية للتسرب، قمنا بحساب مصفوفات التعويض باستخدام السكريبتات من شيفرييه وزملائه (83)، مع إجراء تعديلات طفيفة على الكود. لمعالجة عدد أيونات البيكسل الوسيطة الملحوظة التي كانت أقل من العتبة المطلوبة لتحقيق قراءة دقيقة لعيوب نظائر المعادن (العتبةالعد)، لكل منطقة اهتمام لمركب المعدن-الأجسام المضادة على حدة، قمنا بتنفيذ نهج تجميع تكيفي حيث يتم تجميع بيانات عدد البكسلات تلقائيًا وتدريجيًا عبر بكسلات متجاورة حتى يتم الوصول إلى عتبة العد، بعد أن قمنا أيضًا بتقييد التحليل أولاً إلى من وحدات البكسل ذات أعلى عدد من الأيونات داخل البقعة (توافر الشيفرة والبيانات). كانت مصفوفات التسرب التجريبية من لوحة المناعة الشاملة ولوحة خلايا T والستروما متشابهة للغاية مع المصفوفة التي أبلغ عنها شيفرييه وزملاؤه، وكان تسرب القنوات يتراوح من 0 إلى (الشكل التكميلي S13A و S13B).
تقسيم الخلايا
لتقسيم النوى، قمنا بتدريب نموذج UNet++ للتعلم العميق على مجموعة بيانات كبيرة تم وضع علامات عليها يدويًا تم تطويرها داخليًا.صور، 42,000 نواة؛ انظر توفر البيانات) للتنبؤ بثلاث ميزات دلالية للنوى من بيانات الحقيقة الأرضية: مركز كتلة النواة، جميع المواد النووية، وحدود النواة، والتي قمنا بعد ذلك بدمجها عبر إجراء تحكم العلامات في المياه إلى أقنعة علامات النواة. ثم تم إدخال هذه الأقنعة النووية في إجراء تقسيم الخلايا الكاملة المحدد بالتصوير المتعدد، والذي يستخدم العديد من قنوات علامات الخلايا المستقلة المتاحة في IMC لإنتاج أقنعة الخلايا النهائية (الشكل التكميلي S14A و S14B).
باختصار، قمنا بتقسيم الخلايا الكاملة من خلال إنشاء سلسلة من الأقنعة المستقلة للخلايا، واحدة لكل علامة من علامات سلالة الخلايا المحددة من قبل المستخدم. لتحقيق ذلك، تم ربط نوى التعلم العميق بكل علامة سلالة بالتتابع، باستخدام معيار الحد الأدنى من التداخل المطبق بين النوى وقناع علامة السلالة الذي تم إنشاؤه عن طريق عتبة أوتسو لصورة علامة السلالة المعالجة مسبقًا. كانت خطوات المعالجة المسبقة لقنوات علامات السلالة إزالة البكسلات الساخنة وتصفية الوسيط (حجم النافذةتم استخدام النوى المرتبطة بقناع السلالة المعتمد على عتبة أوتسو كالبذور لتوليد تسميات خلايا محددة بعلامة السلالة باستخدام تحديد الكائنات الثانوية المعتمد على الانتشار على صورة علامة السلالة المعالجة بشكل بسيط ذات الصلة. أسفر هذا الخطوة عن مجموعة من تسميات خلايا علامة السلالة على مستوى الحالة، والتي تم دمجها بعد ذلك في مجموعة توافقية من تسميات الخلايا الكاملة باستخدام نهج القناع التسلسلي. في هذه الخطوة، تم الاحتفاظ فقط بالبكسلات التي تتوافق بين قنوات علامات السلالة المختلفة في نفس كائن الخلية الفردية، وكان الهدف من ذلك هو تقليل عيوب التقسيم حيث توجد علامات متعارضة في نفس الخلية.
لقد لاحظنا وجود خلايا غير نواة وممدودة بشكل واسعمحتوى SMA في خلايا T لدينا ولوحة السدى، والتي يُحتمل أن تكون فيبروبلاست، ولأخذ ذلك في الاعتبار في تقسيمنا، قمنا بتنفيذ خطوة إضافية لتحديد هذهخلايا الدعامات بدون نواة في المستوى لهذه اللوحة فقط. للقيام بذلك، قمنا بإجراء تحديد كائنات أولية مباشرة على البيانات المعالجة بشكل بسيط.قناة SMA، بعد تحسين نوعي لمعايير العتبة على مجموعة تمثيلية من النوى. قمنا بتصفية الخلايا غير النواة التي تم تحديدها بهذه الطريقة لضمان أن يكون التداخل مع كائنات الخلايا النواة minimal (أقل منمن مساحة أي خلية غير نواة) وأن كل خلية غير نواة تم تحديدها كانت لها مساحة لا تقل عن 20 بكسل بعد تطبيق قناع الخلايا النواة. تم تنفيذ هذه الخطوات لتقليل احتمال العد المزدوج للخلايا أو تخصيص حطام الخلايا أو الشوائب لمساحة الخلية. الخلايا غير النواةساهمت خطوة تحديد SMA بمتوسط 560 خلية لكل نواة ورمية (متوسط 5.6% من إجمالي الخلايا/النواة).
تم تنفيذ إجراء تقسيم الخلايا الكاملة باستخدام CellProfiler v3.1.9 (84). تم إدخال قياسات الخلايا الفردية لجميع متوسطات شدة علامات IMC في وحدة تصنيف الخلايا المتعددة TYPEx.
تصنيف الخلايا
تم تحديد وتصنيف الأنواع الفرعية للخلايا في ثلاث خطوات: تصنيف الخلايا التكراري، المقارنة الإحصائية لشدة العلامات، وتعيين الأنواع الفرعية للخلايا. تم تصنيف الخلايا إلى مجموعات ذات شدة علامات مشابهة على النحو التالي: (i) تم تعيين الخلايا إلى السلالة الخلوية الرئيسية الأكثر احتمالاً باستخدام CellAssign (85) مع الأخذ في الاعتبار معرف TMA كأثر محتمل للدفعة؛ (ii) تم تحديد التعيينات ذات الثقة المنخفضة والعالية على أنها تلك التي تغيرت تسميتها من خلال تغيير المدخلات إلى نموذج CellAssign واستبعاد سلالة خلوية واحدة. تم استبعاد خلايا المايلويد الأخرى (CD11b) من اللوحة المناعية الشاملة وVim.الخلايا (Vimentin) لخلية T ولوحة السدى؛ و (iii) تم تنفيذ التجميع باستخدام FastPG (biorxiv 2020.06.19.159749v2) ضمن سلالة خلوية رئيسية ومجموعة ثقة، حيث تم تعيين المعامل k إلى 30، ولم يتم تطبيق أي تحويل على متوسط شدة البكسل الخام لكل خلية قبل التجميع. تم مقارنة المجموعات من خلال شدة البكسل لجميع العلامات ذات الاهتمام في اللوحة، وتم تحديد توزيع الاحتمالات لمجموعة لتكون لها شدة أعلى من المجموعات الأخرى. إذا كان توزيع الاحتمالات أعلى من توزيع الخلفية لجميع المجموعات، اعتُبر العلامة إيجابية. هذه الفصل ضمنت أن مجموعات خلايا T النادرة أو غير المتوقعة مثل، تم تقليلها بالنسبة إلى تجمعات خلايا T الشائعة،وتم تعيين أنواع الخلايا الفرعية تلقائيًا بناءً على مجموعة من العلامات الإيجابية، نظرًا لتعريفات ظواهر الخلايا في الشكل 1E؛ الشكل التوضيحي S2B، والشكل التوضيحي S3A.
تم استخدام العلامات الرئيسية لخطوط الخلايا لبناء نموذج CellAssign للوحة المناعية الشاملة، وكانت تشمل الخلايا البطانية (CD31)، الخلايا الظهارية (pancytokeratin/panCK)، خلايا T CD4 (CD45، CD3، CD4)، خلايا T CD8 (CD45، CD3، CD8a)، خلايا T الأخرى (CD45، CD3)، خلايا B (CD45، CD79a، CD20)، وحيدات النوى (CD45، CD11b، CD14)، البلعميات (CD45، CD11b، CD14، CD68، CD206، CD163)، خلايا المايلويد الأخرى (CD45، CD11b)، خلايا المDCs (CD45، CLEC9a)، والكرات البيضاء الأخرى (CD45). بالنسبة للوحة خلايا T والستروما، تم تعريف الخطوط الرئيسية التالية للخلايا: Vimالخلايا (فيمنتين)، الخلايا البطانية (فيمنتين، CD31)، الخلايا الظهارية (بانCK)، aSMAالخلايا (Vimentin، aSMA)، خلايا CD4 T (CD45، CD3، CD4)، خلايا CD8 T (CD45، CD3، CD8a)، خلايا T الأخرى (CD45، CD3)، الكريات البيضاء الأخرى (CD45).
لفحص التأثيرات المحتملة الناتجة عن صبغ شرائح متعددة، قمنا بمقارنة الكثافات الخام عبر نوى الأورام لجميع TMAs لكل من لوحات المناعة الشاملة وخلايا T والستروما (الشكل التكميلي S15A و S15B). لم نلاحظ أي تأثيرات دفعة في هذا التحليل ولا في تمثيلات UMAP عندما تم تجميع البيانات حسب قسم TMA المصبوغ (الشكل التكميلي S15C و S15D). بالإضافة إلى ذلك، قمنا بمقارنة كثافات العلامات المتوسطة. عبر جميع الخلايا لكل صورة بين لوحي الأجسام المضادة الاثنين (الشكل التكميلي S16A وS16B). كانت كثافات الخلايا المناعية، والبطانية، والظهارية، والإجمالية مرتبطة بشكل كبير بين لوحي الأجسام المضادة، مع معاملات ارتباط سبيرمان تبلغ 0.72 للخلايا الإجمالية، و0.9 للخلايا التائية الإجمالية، و0.85 للخلايا الظهارية، و0.82 للخلايا البطانية.
تعريفات أنواع الخلايا
تم تطبيق تعريفات أنواع الخلايا التالية لتحديد الأنواع الفرعية للخلايا. تم تعريف الأنواع الفرعية للبلاعم على النحو التالي:البلاعم و البلاعموحيد).تم تصنيف البلعميات التي كانت موجودة ضمن أقنعة محددة من قبل علماء الأمراض للبلعميات الهوائية على أنها بلعميات هوائية (الشكل التكميلي S2C).
تم تعريف العدلات على أنها CD11bالخلايا السلبية عن علامات فرعية محددة لخلايا أخرى، مثل CD14 (وحيدات النواة) وCD68/CD163/CD206 (البلاعم). تم تعريف أنواع خلايا إضافية على أنها غير ناضجة. خلايا سامة للخلايا خلايا ذاكرة مقيمة في الأنسجة خلايا مرهق نهائيًا متميزًاالخلايا (CD57قرص مضغوطقرص مضغوطالخلايا التائية التنظيمية (Treg؛الخلايا التائية الذاكرة المركزية (Tcm؛ CD27CCR7)، خلايا الذاكرة التائية الفعالة (Tem؛ CD27CCR7-CD57خلايا T (CD57خلايا البلازما (CD79a+CD38خلايا T غاما دلتاخلايا بالخط الخلوي لبائية – أخرى (CD79a+CD20-CD38-)، ونوع آخر من الخلايا النخاعية (. تم تصنيف الخلايا التي تقع مراكزها داخل مناطق قناع الأوعية الكبيرة، كما تم توضيحه خلال مراجعة علم الأمراض، على أنها محيط الأوعية الدموية.الخلايا. المتبقيةتم تعيين الخلايا في الصور كـالخلايا الليفية (الشكل التكميلي S2C).
نسبة من الخلايا غير المعينة في مجموعة بيانات المناعة الشاملة من المحتمل أن تكون ألياف أو خلايا سدى أخرى، والتي لم تتضمن هذه اللوحة من IMC علامات محددة لهذه الأنواع من الخلايا. نسبة منتُعزى الخلايا في بيانات لوحة خلايا T والستروما إلى السلالة النخاعية، والتي لم يتم التعرف عليها بسهولة في هذه اللوحة.
في جميع التحليلات التي استخدمت نسبة خلايا الورم، قمنا بتحديد نسبة خلايا الورم الإيجابية من جميع خلايا الورم، والتي تم تعريفها على أنها الخلايا الظهارية ضمن مناطق الورم المعلّمة من قبل خبراء علم الأمراض (الشكل التكميلي S2C).
تقسيم الأنسجة لعشيرة الورم والستروما
تم تدريب مصنف غابة عشوائية من ثلاث فئات لتقسيم مناطق الأنسجة الخلفية، الورم/الظهارة، والستروما على الصور المركبة من ورم سرطان الرئة غير صغير الخلايا، وأنسجة الرئة المجاورة للورم، والعقد اللمفاوية باستخدام Ilastik (86). تم إنشاء الصورة المركبة باستخدام مثبطات الحمض النووي وعلامات ذات تعبير محدد للأنسجة للظهارة (بروتينات السيتوكيرتين الشاملة) والستروما (علامات حيوية محددة للمناعة). SMA، CD31). عند توفرها، الفيمنتين (لوحة خلايا T والستروما)، الكولاجين 1 (تم أيضًا اعتبار لوحات الخلايا والستروما، ولوحة البان أكتين (لوحة المناعة الشاملة) في المناطق التي تتسم بالتفرد المتبادل مع علامات الخلايا الظهارية. ومن الجدير بالذكر أن المنطقة النسيجية التي لم تُصبغ بأي من العلامات في لوحة الأجسام المضادة، مثل الفراغ الهوائي، تم اكتشافها كخلفية. تم التحقق من أداء هذا المصنف من خلال مراجعة علم الأمراض للعينات المزدوجة.صور.
لتفسير الفروق في منطقة الأنسجة المصورة، استخدمنا كثافة الخلايا، أي عدد الخلايا المعدل حسب منطقة الأنسجة المصورة. تم حساب منطقة الأنسجة المصورة كمجموع مساحات أقسام الأنسجة، TS، المستمدة من تقسيم الأنسجة. تم تلخيص كثافات الخلايا الوسيطة في الجدول التكميلي S4.
مراجعة علم الأمراض وتوليد قناع الميزات
لكل منطقة اهتمام مصورة، تم مراجعة عينة H&E تسلسلية بواسطة أخصائي علم الأمراض لتأكيد وجود أو عدم وجود نسيج ورمي غازي ولتحديد الورم والظهارة غير الورمية، والممرات الهوائية، والنخر، والأوعية الكبيرة، والبلاعم الهوائية (الشكل التوضيحي الإضافي S17). تم إجراء التحديدات باستخدام برنامج NDP.view2. (الإصدار 2.7) على صورة شبه H&E تم إنشاؤها مباشرة من قنوات الروثينيوم والإيريديوم في صور IMC الخاصة بنا. تم إنشاء أقنعة لكل ميزة موسومة باستخدام برمجة Groovy في QuPath وتم محاذاتها مع مخرجات الدراسة.
تم تقييم صور H&E من كتلة الأنسجة FFPE الإقليمية التي تم اشتقاق نوى TMA منها للبحث عن وجود TLS. تم تعريف TLS على أنها تجمعات لمفاوية تحتوي على مناطق مفصولة من خلايا T وخلايا B، بالإضافة إلى دليل على وجود تفاعل GC مستمر، استنادًا إلى تمييز المناطق الداكنة والفاتحة في GCs. لم يكن هناك دليل على وجود TLS مرتبط بمناطق الورم التي تم تقييمها بواسطة IMC في هذه الدراسة.
تحديد المجتمعات الخلوية المكانية
تم تطبيق طريقة تحديد المجتمع (87) على 139 نواة ورمية تم تصويرها باستخدام لوحة المناعة الشاملة لتحديد مجموعات من الخلايا التي تتواجد عادة بالقرب من بعضها البعض. كانت الأنواع الفرعية للخلايا المدرجة في التحليل تحتوي على متوسط لا يقل عن 10 خلايا لكل نواة في جميع النوى الورمية. تم استبعاد الخلايا غير المعينة والغامضة من تحليل المجتمع. تم تعريف نافذة حول كل خلية في الصورة و10 خلايا مجاورة لها بما في ذلك الخلية المركزية. تم تجميع هذه النوافذ بناءً على تركيبها بالنسبة لـ 18 نوعًا من الخلايا (مع وجود ما لا يقل عن 10 خلايا في المتوسط لكل صورة) باستخدام MiniBatchKMeans ولتحديد أنواع الخلايا الغنية في مجتمع معين، قمنا بحساب ما إذا كانت كثافة نوع الخلايا أعلى بشكل ملحوظ في المجتمع المعني مقارنة بجميع المجتمعات الأخرى باستخدام نموذج LME مع اعتبار المريض كعامل عشوائي واختبار ANOVA. ثم تم تعيين أسماء تمثيلية للمجتمعات بناءً على أنواع الخلايا الغنية الموجودة فيها (الشكل التكميلي S3F). تم رسم هويات المجتمعات على الخلايا المقسمة وتم تصورها باستخدام Cytomapper (الشكل التكميلي S3G؛ المرجع 88)، والتي تم التحقق منها بعد ذلك من خلال تقييم أخصائي الأمراض لشرائح الأنسجة المتسلسلة الملونة بصبغة H&E.
للتحقق من أن المجتمعات التي اكتشفناها في TME كانت قوية، قمنا بإجراء سلسلة من الاختبارات للتحقق من نتائجنا. للعثور على الأمثلعدد المجتمعات، قمنا بتغيير عدد المجتمعات وقمنا بقياس استقرار أنواع الخلايا المكونة داخلها. لكل حجم نافذة، اختبرناإلى 20 مجتمعًا وحسبنا درجة التشويه، التي تمثل مجموع المسافات المربعة من كل نقطة إلى مركزها المعين. باستخدام محدد الكوع، وجدنا أن العدد الأمثل من النقاط الذي زاد من تقليل التشويه كان المجتمعات (الشكل التكميلي S18A). قمنا بدراسة الفروقات في المخرجات من خلال اختبار أحجام النوافذ الجيران الأقرب. لاحظنا أن تركيبة المجتمعات الناتجة لم تتغير بشكل كبير، حيث كانت غنية بأنواع خلايا مشابهة (النتائج غير معروضة). تم اختبار قوة التجميع من خلال أخذ عينة من ثلث الخلايا ثلاث مرات ومقارنة نسبة الخلايا المعينة لنفس المجتمع مع كل تكرار من تجميع البيانات، مما أسفر عن توافق وسطي قدره (الشكل التكميلي S18B). تم الكشف عن جميع المجتمعات العشر عبر الأنماط النسيجية لسرطان الرئة غير صغير الخلايا، دون وجود غنى إحصائي في LUAD أو LUSC أو NSCLC آخر (الشكل التوضيحي التكميلي S18C).
التجميع المكاني
قمنا بإجراء تجميع مكاني لخلايا الورم في المناطق المحددة من قبل أطباء الأمراض كهياكل مرجعية للتحليل المكاني (الشكل التوضيحي التكميلي S2D). تم إجراء تجميع مكاني لبيانات إحداثيات الخلايا باستخدام خوارزمية DBSCAN من مكتبة بايثون scikit-learn. تم تعيين معلمة eps في خوارزمية DBSCAN إلى 25، مما أدى إلى تجميعات خلايا معقولة من خلال التقييم البصري. استخدمنا حد أدنى لحجم التجمع يبلغ 3 خلايا للتحليل المكاني. استخدمنا حزم بايثون Alphashape وShapely لتحديد حدود جميع التجمعات المكانية وما إذا كانت أي خلية تقع داخل تجمع مكاني معين.
تعريف درجة الحاجز
تم تعديل درجات حاجز الألياف من طريقة فيلمايجر وزملائه (89) وحُسِبَت كما يلي. أولاً، تم بناء رسم بياني لأقرب الجيران لمواقع الخلايا من خلال ربط كل خلية بأقرب خمسة جيران لها. لحساب الـ “حاجز الألياف الليفية لخلايا CD8 T بالنسبة لخلايا الورم، استخدمنا خوارزمية البحث عن أقصر المسارات من مكتبة cuGraph في بايثون للعثور على أقصر المسارات من كل رأس لخلايا CD8 T في الشبكة إلى جميع رؤوس خلايا الورم.تم بعد ذلك عد الخلايا الليفية على طول كل مسار. بالنسبة لخلايا CD8 T التي كانت لديها خلايا ورمية متعددة على نفس المسافة (على سبيل المثال، خليتان ورميتان كل منهما على مسافة خمس قفزات من خلايا CD8 T)، تم تعريف الدرجة على أنها متوسط العدد منالخلايا عبر جميع المسارات. لتقييد التسجيل إلىالخلايا التي تتجمع بشكل خاص عند حافة كتلة الورم، قمنا بعدّ فقطالخلايا المجاورة لخلايا الورم (أي، العقد المجاورة في الرسم البياني المكاني للخلايا) وفقط إذا كانت خلية الورم نفسها عضوًا في مجموعة مكانية تتكون من على الأقلكما هو محدد بواسطة DBSCAN، الموضح أعلاه. اخترنا هذه المعلمات لأن مفهوم الحاجز الكلي قد يكون غير محدد بشكل جيد بالنسبة لخلايا الورم الفردية وعددها القليل. علاوة على ذلك، للتركيز على تحليلات مجموعات الخلايا غير المحيطية، بما في ذلك غير المحيطية.تم تصنيف الخلايا، الخلايا التي تقع مراكزها ضمن أقنعة الأوعية الكبيرة المعلّمة من قبل أطباء الأمراض، على أنها محيط الأوعية واستُبعدت من القياس. تم تصنيف الخلايا الظهارية غير المحيطية التي تم التقاط مراكزها ضمن منطقة قناع الورم المعلّمة من قبل أطباء الأمراض على أنها خلايا ورمية. تم حساب درجات الحاجز كمتوسط لكل صورة عبر جميع خلايا CD8 T غير المحيطية، حيث يتم تعيين درجة حاجز بقيمة 1 لخلايا CD8 T التي تفصلها خلية ورمية عن أقرب خلية ورمية.الخلايا الليفية (0 بخلاف ذلك) حيث يتم حساب درجة الحاجز لكل خلية CD8 T كمتوسط الدرجة على جميع أقصر المسارات إلى أقرب خلية ورمية.
تعريف فصول TME
تم إجراء تجميع هرمي غير خاضع للإشراف لكثافات الخلايا المعيرة بواسطة z-score باستخدام جميع النوى في الدراسة، بما في ذلك العينات الطبيعية، والعينات المجاورة للأورام الحميدة، وعينات الأورام من جميع الأنواع النسيجية. تم استخدام الأنواع الرئيسية التالية من الخلايا لتعريف تجمعات البيئة المجهرية للورم (TME): خلايا T CD8، خلايا T CD4 وسلالة خلايا B (TIL).البلاعمالبلاعمالخلايا المتعادلة والخلايا النخاعية – الأخرى (mDC، وحيدات، CD11b الأخرىالخلايا). تم حساب كثافات الخلايا لكل نوع رئيسي من الخلايا بشكل فردي للـ TS. تم العثور على خلايا من سلالة خلايا B بشكل رئيسي في حجرة نسيجية واحدة، السدى ( ). عدد صغير فقط من خلايا سلالة B وخلايا النخاع الأخرى، أقل من 3,000 خلية أو تم اكتشافها في عُش النسيج الورمي؛ لذلك، لم يتم اعتبار كثافات الخلايا في عُش النسيج الورمي لهذين النوعين من الخلايا لتصنيف البيئة المجهرية للورم. تم اكتشاف جميع أنواع الخلايا التي تم تحليلها في الأقلمن النوى التي تم تحليلها.
تم تعريف أربعة تجمعات TME على أنها أكثر التجمعات توافقًا المستمدة من التجميع الهرمي باستخداممن العينات في 1,000 تكرار فرعي، باستخدام وظائف ConsensusClusterPlus و calcICL ضمن حزمة R ConsensusClusterPlus (الإصدار 1.58؛ الشكل التوضيحي S5A). تم إجراء التجميع على كثافات الخلايا المعيارية باستخدام درجات z القوية (الوسيط مقسومًا على الانحراف المطلق الوسيط). تم إجراء التجميع باستخدام مقياس المسافة الأقصى وطريقة التجميع ward.D. دالة التوزيع التراكمي (CDF) لمصفوفة الإجماع لكل قيمة من، حيث هو عدد المجموعات، والفرق في المساحة تحت المنحنى مقارنةً بـ CDF لـ مع دالة التوزيع التراكمي لـتم تضمينها في الشكل التوضيحي التكميلي S5B. تشير قيمة الإجماع إلى نسبة الحالات التي يتم فيها تعيين نواتين إلى نفس المجموعة من بين 1,000 تكرار فرعي. لقد أظهرنا أن أكبر زيادة في قيم الإجماع لوحظت عند زيادة عدد المجموعات من ثلاثة إلى أربعة (الشكل التوضيحي التكميلي S5B). تشير هذه التحليل بقوة إلى أن هناك على الأقل أربع فئات من TME في المجموعة. تستمر قيم الإجماع لزيادة معأكبر من 4 على الرغم من وجود فرق أصغر، مما يشير إلى أن تصنيف TME المكاني قد يتم تحسينه في مجموعات أكبر بكثير. نتج عن خمسة تجمعات TME تقسيم فئة TME العالية من TS:العدلات بشكل أساسي من خلال اختلافات محددة بالنسج وCD163.كثافات البلعميات في عش الورم مما ينتج عنه تجمع LUSC بشكل أساسي مع كثافة أعلى بشكل ملحوظ من العدلات في TS مقارنةً ببقية تجمعات TME مجتمعة، وتجمع LUAD بشكل أساسي مع كثافة أعلى من العدلات والبلعميات CD163- في عش الورم مقارنةً ببقية تجمعات TME. نظرًا للتشابه العالي بين هذين التجمعين، اعتبرنا أربع فئات من TME في هذه الدراسة.
بعد ذلك، حددنا المعايير التي تميز كل مجموعة، باستخدام نموذج LME لمقارنة النوى من مجموعة مناعية معينة مع تلك من مجموعات أخرى وضبطها لعدة مناطق مع اعتبار المريض كعامل عشوائي (الشكل 2D). على وجه التحديد، تم اختيار النوى العالية من TS:TIL+MФ للنوى التي تحتوي على كثافات أعلى من TIL أو البلعميات في عش الورم مقارنةً مع فئات TME الأخرى. تم اختيار النوى المنخفضة من TS:Immune لتكون ذات كثافة أقل من خلايا المناعة في عش الورم مقارنةً بالنوى من فئات TME الأخرى. كانت المعايير الخاصة بـ T:TIL+MФ المستبعدة من TME تتطلب أن تكون كثافة TIL/البلعميات في عش الورم أقل منكانت كثافة TIL/macrophage في السدى أعلى من تلك في أنوية TS:Immune المنخفضة. أخيرًا، تم تمييز مجموعة TS:Neutrophil العالية من خلال زيادة تسلل العدلات في عش tumor أو السدى وانخفاض تسلل TIL، وكانت المعايير لهذه الفئة من TME تتطلب أن تكون نسبة العدلات من جميع الخلايا أعلى من الفئات الأخرى من TME في عش tumor أو السدى. تم تحديد الحدود لكل من هذه المعايير تلقائيًا باستخدام نموذج خطي عام ثنائي الحدين لكل مجموعة مناعية مقارنة بالفئات الأخرى، كما هو موضح في الشكل التكميلية S5C. تم استخدام دالة الأداء في حزمة R ROCR v.1.0-11 للعثور على أفضل حد كالتقاطع بين منحنيات الحساسية والنوعية. داخل كل مجموعة، تم تصنيف الأنوية التي لم تستوفِ هذه المعايير على أنها غير محددة (الشكل التكميلية S5A و S5C).
تمت إضافة تصنيفات TME بناءً على أنواع الخلايا ذات التركيب المختلف في عش الورم أو حجرة السدى، مع مقارنة كل فئة TME مقابل الفئات الأخرى، باستخدام نموذج LME مع اعتبار المريض كعامل عشوائي (الشكل 2D؛ الشكل التوضيحي S5D). بالنسبة لتحليل NSCLC، تمت إضافة علم الأنسجة كعامل ثابت (الشكل 2D). يتم تلخيص كثافات الخلايا المتوسطة المحددة حسب علم الأنسجة لكل فئة TME في الجدول التوضيحي S4.
التباين المكاني لفئات بيئة الورم و الأورام عالية TAN
لتقييم التباين المكاني داخل الورم لفئات البيئة الورمية مع الأخذ في الاعتبار العدد المختلف من المناطق المأخوذة، قمنا بإجراء أخذ عينات باستخدام طريقة البوتستراب مع 1,000 تكرار. قمنا بحساب احتمال ملاحظة فئة البيئة الورمية لعدد معين من العينات المأخوذة لكل ورم (عينتان، ثلاث عينات، وأربع عينات). تم تقدير تباين فئة البيئة الورمية المعطاة كنسبة عدد الملاحظات عندما كانت جميع العينات تحتوي على نفس البيئة الورمية إلى العدد الإجمالي للأورام التي تحتوي على تلك الفئة. يمثل هذا الاحتمال المبلغ عنه لملاحظة نفس فئة البيئة الورمية عبر جميع العينات النسبة المتوسطة عبر جميع التكرارات وعبر العدد المختلف من العينات المأخوذة (من اثنتين إلى أربع). تم استخدام هذا النهج لتقدير احتمال أن تحتوي جميع المناطق على درجة TAN عالية واحتمال أن تحتوي أي منطقة على درجة TAN عالية بالنظر إلى طفرة PIK3CA الكلونية في مجموعة TRACERx 421 (Tx421)، مع تغيير عدد العينات من اثنتين إلى ثماني (الحد الأقصى لعدد المناطق في مجموعة Tx421).
التباين المكاني لأنواع الخلايا والمجتمعات
تم حساب درجة ITH المكانية لكثافات نوع الخلايا والمجتمعات باستخدام قيم الكثافة المعنوية z-score في المرضى الذين كانت البيانات متاحة لهم من نواتج ورمية اثنين أو أكثر (لوحة المناعة الشاملة)لوحة الخلايا والستروما؛ الشكل التوضيحي الإضافي S1B).
تم حساب الانحراف المعياري عبر بيانات نواة الورم لكل مريض. مثلت درجة التباين المكاني لكل ميزة متوسط الانحراف المعياري للمجموعة، لكل لوحة IMC.
تلوين PD-L1 المناعي الخلوي لكتل الورم الإقليمية
شرائح FFPE (تم تلوينها بمضاد PD-L1 (SP142) وفقًا لتعليمات الشركة المصنعة (فينتانا). تم إجراء تقييم خلايا الورم (TC) كما هو موضح من قبل الشركة المصنعة بواسطة أطباء الأمراض ذوي الخبرة والمؤهلين. باختصار، تم تعريف درجة TC على أنها نسبة خلايا الورم الحية التي تظهر تلوين PD-L1 الغشائي بأي شدة. تم تصنيف درجات TC على أنها إلى، و لتحليل إحصائي، درجات TCكانت نادرة وبالتالي تم دمجها معإلىإلىالفئة. كانت نسبة إيجابية التلوين في العينات التي تم الإشارة إليها على أنها سلبية لـ PD-L1.
تحقق IHC من تعبير جزيء نقطة التفتيش
تم إجراء تقنية IHC المتعددة للتحقق من تعبير جزيئات نقاط التفتيش المناعية على الخلايا المناعية. تم تعريض مقاطع الأنسجة المحفوظة في الفورمالين والمجمدة من حالة سرطان الرئة البشرية التمثيلية واللوزتين المتفاعلتين للتلوين المناعي المزدوج (الشكل التوضيحي التكميلي S19). باختصار، 2 – إلىتم قطع مقاطع الأنسجة ونقلها إلى شرائح مشحونة كهربائيًا لتلوينها. لتحديد ظروف التلوين المثلى (أي، تخفيف الأجسام المضادة ومدة الحضانة، بروتوكولات استرجاع المستضد، الكروموجين المناسب)، تم اختبار كل جسم مضاد وتحسينه على مقاطع من اللوزتين التفاعلية باستخدام تقنية IHC المفردة التقليدية على منصة Bond-III Autostainer الآلية (Leica Microsystems). تم تنفيذ بروتوكول التلوين المناعي المزدوج الذي تم وصفه سابقًا. تم تلوين جميع الشرائح باستخدام الجسم المضاد MUM-1/ IRF4 clone MUM1p (1:400، Agilent Dako) وتلوينها مع أحد الأجسام المضادة PD-L1 clone SP142 (Ventana Medical Systems)، TIM3 clone D5D5R (1:100، Cell Signaling Technology Inc.)، VISTA clone CL3975 (1:150، Thermo Fisher Scientific Inc.). تم تلوين الشرائح بالهيماتوكسيليين. تم التقاط الصور على نظام تصوير الشرائح الكامل NanoZoomer 2.0HT (Hamamatsu Photonics) فيتكبير
تقييم TAN من صور H&E في TRACERx
تم تقييم كثافات TANs على صور رقمية ملونة بصبغة H&Eالأقسام وسجلت فيالتكبير. تم تقييم جميع TANs ضمن الحدود النسيجية للورم نفسه. تم تقييم TANs في حجرة السدى وحجرة جزر الورم بشكل منفصل. تم حساب TANs في حجرة السدى بناءً على الطريقة القياسية المستخدمة لتقدير TIL، كما وضعتها مجموعة العمل الدولية لمؤشرات المناعة والعلاج المناعي لسرطان الثدي (30). تم تسجيل TANs الورمية بطريقة مماثلة ولكن المناطق التي تم تقييمها شملت جزر الورم القابلة للحياة، وتم استبعاد العدلات العائمة داخل تجويف الغدة. وفقًا للإرشادات المنشورة، تم حساب النسبة كنسبة المساحة التي تشغلها العدلات على إجمالي مساحة السدى وإجمالي مساحة الورم، على التوالي. تمثل TANs السدوية (sTAN) النسبة المئوية لمساحة حجرة السدى التي تشغلها TANs؛ بينما تمثل TANs الورمية (tTAN) النسبة المئوية لمساحة حجرة الورم التي تشغلها TANs. تم حساب متوسط تسجيل العدلات عبر الشريحة بأكملها بدلاً من التركيز على مناطق النقاط الساخنة. يتم إعطاء النسبة كمعامل مستمر. تم استبعاد ثمانية عشر مريضًا من مجموعة التحقق ولم يتم تسجيلهم لـ TANs عندما لم تكن شرائح H&E متاحة أو لم يتم الكشف عن ورم في تلك الأقسام. تم اشتقاق درجات TAN على مستوى المنطقة من تسجيل صور H&E لكتل المناطق المقترنة من TMAs الدراسية، وتم تقييم درجات TAN على مستوى الورم على كتل التشخيص المطابقة للورم.
تم تعريف درجة TAN العالية بناءً على ما إذا كانت درجة الورم (tTAN) أو درجة النسيج الداعم (sTAN) عالية. لتصنيف درجات tTAN و sTAN إلى عالية ومنخفضة، حددنا مستوى مثالي. الحدود التي تفصل بشكل أفضل بين فئة TME العالية من TS:Neutrophil والفئات الأخرى من TME. استخدمنا نموذجًا خطيًا عامًّا ثنائي الحدين لدرجة tTAN أو sTAN للتنبؤ بوجود فئة TME العالية من TS:Neutrophil. استخدمنا دالة الأداء في حزمة R ROCR v.1.0-11 للعثور على أفضل حد كالتقاطع بين منحنيات الحساسية والنوعية. كانت الحدود المحددة هيلـ tTAN ولـ sTAN عبر جميع درجات الشرائح التشخيصية في LUAD/LUSC، ولـ tTAN ولـ sTAN عبر درجات TAN الإقليمية في LUAD/LUSC.
RNAscope
شرائح FFPE (تم صبغ العينات على جهاز Leica Bond Rx الآلي باستخدام اختبار RNAscope LS Multiplex Fluorescent (322800 ACD Bio-Techne) مع تطبيق استرجاع الهدف القياسي لمدة 15 دقيقة ومعالجة البروتياز لمدة 15 دقيقة باستخدام مجس الهدف Hs-IL-8 (310388 Bio-Techne) مع Opal 570 (Akoya Biosciences). تم صبغ العينات مناعياً باستخدام MPO 1:2000 (ab208670 Abcam) أو بان-سايتوكيراتين 1:250 (M3515 Agilent) وتم الكشف عنها باستخدام Opal 690 (Akoya Biosciences) وتم صبغها مضاداً مع DAPI. تم تصوير الشرائح على جهاز PhenoImager HT (Akoya Biosciences).
تحليل الحي
تم استخدام برنامج CellProfiler (الإصدار 3.1.9؛ وحدة MeasureObjectNeighbors) لحساب الخلايا المجاورة لكل نوع من الخلايا في صورة (84). تم تعريف الخلايا على أنها في “الجوار” لخلايا ذات اهتمام إذا تم اكتشافها ضمن نصف قطر بكسل يبلغ 5 بكسل من الخلية ذات الاهتمام.
تم استخدام دالة aggregate_classic في أداة الجوار (91) لتعريف العلاقة بين الخلايا على مستوى الصورة بين أي نوعين من الخلايا: علاقة تفاعلية، علاقة تجنب، أو علاقة غير ذات دلالة.
مقارنات فئات TME، PIK3CAmut/wt، ودرجة التوسع تحت الخلوي العالية/المنخفضة: لاستفسار ما إذا كانت العلاقة قد تم تعزيزها بشكل كبير في مجموعة فرعية واحدة مقارنة بأخرى، تم تطبيق نموذج الانحدار اللوجستي مع تصحيح لوجود عدة نوى لكل ورم لتقييم تكرار العلاقة المكانية في فئة TME المعنية مقارنة بجميع فئات TME الأخرى (الشكل التوضيحي التكميلي S20)، بين نوى الورم مع طفرة PIK3CA مقابل النوع البري PIK3CA (الشكل التوضيحي التكميلي S21A) وبين النوى ذات درجات التوسع تحت الخلوي العالية مقارنة بالمنخفضة (الشكل التوضيحي التكميلي S21B). تم إجراء تعديل بنجاميني-هوشبرغ لتصحيح الاختبارات المتعددة. نحن نبلغ عن نتائج ذات دلالة إحصائية (علاقات الخلايا-الخلايا إذا كانت أنواع الخلايا المكونة موجودة في الأقلأنوية الأورام. تم تصور هذه العلاقات في خريطة حرارية إذا كانت موجودة في على الأقلمن النوى.
MCT4و CAIXتحليلات حي TC: الاختلافات في ملفات التفاعل والتجنب مع أنواع الخلايا الفرعية الأخرى في TS: تم تحليل نوى أورام LUSC عالية العدلات بين المركز MCT4وخلايا الورم MCT4 (الشكل التكميلي S22A)، وبين مركز CAIXو CAIXخلايا الورم (الشكل التوضيحي S22B). نبلغ عن العلاقات بين الخلايا إذا كانت أنواع الخلايا المكونة موجودة في على الأقلأنوية الورم (النوى) لكل من الأنماط الظاهرية لخلايا الورم المركزية الإيجابية (+ve) والسلبية (-ve). لم تُلاحظ اختلافات ذات دلالة إحصائية بين خلايا المركز الإيجابية والسلبية بالنسبة لكل من MCT4 أو CAIX، عند تطبيق اختبار كاي-تربيع وتعديل القيمة (بن-جاميني-هوشبرغ). تم اختبار أنواع الخلايا الفرعية فقط التي أظهرت فيها على الأقل نواتان تجنبًا أو تفاعلًا كبيرًا لأحد نمطي الورم على الأقل.
TRACERx 100 WES
كانت بيانات WES متاحة لـأنوية الأورام في مجموعة البيانات المناعية الشاملة، ونوى الأورام في مجموعة بيانات خلايا T والستروما (الشكل التكميلي S1A؛ الجدول التكميلي S2). لم تخضع عينات الرئة الطبيعية لتحليل تسلسل الإكسوم الكامل. تم معالجة بيانات تسلسل الإكسوم الكامل كما هو موضح (14).
تسلسل RNA لـ TRACERx 100
تم معالجة بيانات تسلسل RNA كما هو موضح (13). تم إجراء تحليل مزدوج لبيانات تسلسل RNA وبيانات IMC لعينات الأورام فقط وكانت متاحة لـمن المناعة الشاملة ومنمجموعات بيانات الخلايا والستروما (الشكل التوضيحي التكميلي S1A؛ الجدول التكميلي S2).
حساب TMB
تم حساب TMB باستخدام نهج موحد كعدد الطفرات الجسدية لكل ميغاباز (muts/ Mb) في المناطق الجينومية المشفرة (92) من بيانات الطفرات TRACERx 421 من تسلسل الجينوم الكامل. تم تصنيف حالة TMB لكل منطقة ورمية على أنها عالية (الطفرات/ميغابايت) أو منخفضة (<10 طفرات/ميغابايت) لتتناسب مع الإرشادات السريرية.
تحليلات طفرات السائق
تستند استدعاءات الطفرات السائقية إلى استدعاء الطفرات السائقية من TRACERx 421 من تسلسل الجينوم الكامل (WES)، كما هو موصوف سابقًا (14)، وتشمل الطفرات الفردية للنيوكليوتيدات السائقية، وطفرات الإدراج-الحذف (indels)، وطفرات الربط في الجينات ذات الصلة. تم اشتقاق استدعاءات التماثل لطفرات PIK3CA باستخدام استدعاء التماثل من TRACERx لبيانات WES، كما هو موصوف في (14).
تم إجراء تحليلات إحصائية لتوزيعات فئات TME حسب حالة طفرات جينات السائق الإقليمية باستخدام دالة glmer من حزمة lme4 في R (توزيع “ثنائي”). تم إجراء التحليلات لمقارنة توزيعات فئة واحدة من TME مع جميع الفئات الأخرى مجتمعة (للمجموعة الفرعية الخاصة بالهيستولوجيا المعنية). تم تضمين معرف المريض كأثر عشوائي، وANOVAتم حساب القيم من خلال مقارنة نموذج فارغ بدون حالة الطفرة كأثر ثابت مع نموذج يحتوي على حالة الطفرة كأثر ثابت.
حدثت تقريبًا جميع الطفرات السائقية الملحوظة في مسار PI3K في الجين PIK3CA في TRACERx 421 (23/115 نواة). لم تكن هناك طفرات في PIK3CB في TRACERx 100. كانت الزيادات والتضخيمات في مناطق من جين PIK3CA حدثًا شائعًا في جميع أورام LUSC تقريبًا.
تم استخدام اختبار كاي تربيع لمقارنة تكرار الملاحظات بين أورام PIK3CA الطافرة وأورام PIK3CA من النوع البري. في حالة وجود مناطق متعددة لكل ورم، اعتبرنا ما إذا كانت أي منطقة ورمية من ورم معين تحتوي على طفرة.
تحليل عدد النسخ
تم اشتقاق ملفات عدد النسخ الجسدية لمناطق الورم كما هو موصوف سابقًا (14). لمقارنة ملفات تغيير عدد النسخ الجسدية (SCNA) في مناطق ذات درجات TAN عالية ومنخفضة، تم تعديل طريقة التحليل غير المتزاوجة الموصوفة سابقًا (15). ضمن كل من فئات TAN العالية والمنخفضة بشكل منفصل، لكل قطاع عدد نسخ داخل ورم فردي، تم تحديد الحد الأقصى والحد الأدنىتم اختيار قيم عدد النسخ من جميع المناطق المعينة على التوالي من ورم. ثم تم تشغيل GISTIC2.0 (93) أربع مرات لكل من LUAD و LUSC لعينات التحقق والاكتشاف المجمعة باستخدام هذه البيانات على مستوى الورم، مرة مع القيم القصوى (لفحص التضخيم) ومرة مع القيم الدنيا (لفحص الخسائر)، لكل من فئات درجات TAN العالية والمنخفضة. تم اعتبار الجينات المسؤولة أو جينات التهرب المناعي التي تم اعتبارها مضخمة/محذوفة بشكل كبير ( ) لمجموعة TAN-High ولكن غير دالة لنفس حدث SCNA في مجموعة TAN-Low، والتي كانت القيمة المطلقة لدرجة G أعلى في مجموعة TAN-high مقارنة بمجموعة TAN-low تم تقييمها. لم تُلاحظ مثل هذه القمم في LUAD أو LUSC. في هذه الحالة، تم تعريف الجينات المحركة كما في (14، 15). الجينات المختبرة للهروب المناعي كانت RFX5، RFXANK، RFXAP، TAP1، TAP2، TAPBP، PSMB8، PSMB9، NLRC5، ERAP1، CALR، CNX، PDIA3، B2M، SPPL3، MOGS، GANAB، CIITA، MARCHF1، CD74، MARCHF8، CGAS، MB21D1، TMEM173، TBK1، IRF3، IFNB1، CTNNB1، AXIN1، AXIN2، APC، GSK3، GSK3B، CSNK1A، CSNK1A1، DKK1، PTCH1، NKD1، PTEN، MYC، PTGS2، CXCL13، CXCL9، IFNGR1، IFNGR2، JAK1، JAK2، STAT1، STAT2، IRF1، IRF9، SOCS1، IFNAR1، IFNAR2، SERPINB9،
تشير اضطرابات الفئة I/APM إلى الآليات الداخلية للهروب المناعي المتعلقة بتقديم المستضدات على MHC الفئة I. تم تعريف اضطراب الفئة I/APM إذا كان يمكن تحديد فقدان التغاير في أي من HLA-A أو HLA-B أو HLA-C، و/أو إذا تم اكتشاف طفرات في أي من الجينات التالية المتعلقة بتقديم المستضدات (APM): B2M، HLA-A، HLA-B، HLA-C، CALR، ERAP1، GANAB، MOGS، NLRC5، PSMB8، PSMB9، PDIA3، RFX5، RFXANK، RFXAP، SPPL3، TAP1، TAP2، TAPBP، وCNX. تم تعريف الطفرات على أنها أي من المتغيرات أحادية النوكليوتيد غير المتجانسة (بما في ذلك فقدان التوقف وزيادة التوقف)، والإدخالات والاستبدالات (غير) الإطارية، وحذف الإطارات. ليتم تضمينه في تحليل HLA، كان يجب على الجين اجتياز الفلاتر التالية: تحديد ما لا يقل عن 10 SNPs التي اجتازت الحد الأدنى من التغطية البالغ 30؛ كان مطلوبًا أن يكون لكل من الأليلين للجين عمق متوقع (ED) من“; الفترة الثقة في عدد النسخ الأليلية كانت. تقدر ED عمق القراءات المستمدة من خلايا السرطان، والتي تم حسابها من عمق العينة الجينية المتطابقة ونقاء منطقة الورم. عند ED أقل من 10، لم نتوقع أن يكون لدينا التغطية المطلوبة لتصنيف LOH بدقة، حتى لو كانت موجودة.
تضاعف الجينوم الكامل
تم حساب مهام مضاعفة الجينوم الكامل لمناطق ورم TRACERx، المشار إليها في الشكل 2B، كما هو موضح سابقًا (14).
تحليل النيوأنتيجين
تم إجراء تحليل النيوأنتيجين ضمن أنسجة LUAD و LUSC، وكان يتطلب عينات مع توقعات النيوأنتيجين و RNAseq. تم استخدام الطفرات الكلونية (المكتشفة في جميع مناطق نفس الورم) والفرعية (غير المكتشفة في جميع مناطق نفس الورم) والطفرات غير المتناظرة الكلية للتنبؤ بالنيوأنتيجينات باستخدام NetMHCpan4.1 (94). عندما كانت بيانات النسخ الجينية الكلية متاحة، اعتُبر أن النيوأنتيجين معبر عنه إذا تم توجيه أربعة قراءات على الأقل من RNA-seq إلى موضع الطفرة. تم تصفية عدد النيوأنتيجينات بشكل إضافي بناءً على ما إذا كانت متوقعة للارتباط بالأليلات HLA الخاصة بالمريض المعني (تم تحديدها باستخدام HLA-HD؛ المرجع 95) التي لم تتعرض لفقدان HLA. تم تصفية توقعات ارتباط HLA بناءً على قوة الارتباط باستخدام عتبة درجة الترتيب.لم يكن من الممكن دائمًا تحديد حالة LOH لـ HLA-A وHLA-B وHLA-C (انظر أعلاه). تم استبعاد مناطق الورم التي لا تحتوي على بيانات لأي من HLA-A أو HLA-B أو HLA-C من تحليل النيوانتجين الذي يتطلب حالة HLA، وتمثل 3 مناطق ورم LUAD من مريضين و3 مناطق ورم LUSC من مريض واحد (الشكل التوضيحي التكميلي S1A؛ الجدول التكميلي S2). في مناطق الورم التي كانت فيها حالة LOH لأحد أو اثنين من HLA-A أو HLA-B أو HLA-C غير محددة، تم افتراض أن HLA المفقود سليم. لم يتم اعتبار مستوى التعبير عن نسخ النيوانتجين وكبت مستوى RNA لجينات HLA.
التعبير الجيني التفاضلي، إثراء مجموعة الجينات، وتحليلات GO
تم تحليل القيم المعبر عنها المعدلة باستخدام المتوسط المقصوص لقيم M (TMM) من خلال سير العمل limma-voom للتحليل التفاضلي (13). تم استخدام إحصائية t التي تم إنشاؤها بواسطة limma كمدخل لـ GSEA لمجموعات الجينات الرئيسية في MSigDB باستخدام حزمة R fgsea (v1.10.1) مع المعلمات الافتراضية. الجينات التي لديها تغيير يزيد عن 2 ضعف و”تم اختيارها لتحليل الإفراط في التمثيل باستخدام عمليات GO البيولوجية من خلال وظيفة enrichGO في حزمة clusterProfiler R (الإصدار 4.2.2).
درجة التوسع الفرعي الحديثة
درجة التوسع تحت الخلوي الأخيرة لكل ورم، تعكس حجم أكبر توسع تحت خلوي حديث داخل كل منطقة ورمية، تم حسابه كما وصفه فرانكل وزملاؤه (14). باختصار، باستخدام تسلسل الجينوم الكامل المتعدد المناطق، تم بناء أشجار النسب الوراثية للأورام، وتم تحديد العقد الطرفية على الشجرة (أي، العقد الورقية) لكل منها. ثم تم تحديد الحد الأقصى لنسبة خلايا السرطان (CCF) لأي من هذه العقد الورقية. يمثل معدل التوسع الفرعي الحديث الحد الأقصى لـ CCF لأي من العقد الورقية في منطقة ورمية معينة. تم مقارنة معدل التوسع الفرعي الحديث بين مجموعات TAN باستخدام نموذج LME مع المريض كمتغير عشوائي. لتعديل الفرق في محتوى الورم، أضفنا النقاء كمتغير ثابت في النموذج. ظلت العلاقة بين ارتفاع معدل التوسع الفرعي الحديث ونوى الأورام عالية TAN ذات دلالة إحصائية في LUAD. ) ولكن لم تصل إلى الدلالة في LUSC ( ).
شجرة النشوء والتطور ورسم خريطة النسخ
تم إعادة بناء شجرة النشوء والتطور للورم CRUK0468 في الشكل 6F باستخدام CONIPHERوتمت تصورها باستخدام دالة الرسم (حزمة igraph R الإصدار 1.3.5). تم تضمين ملفات تسلسل عينتين من نقائل العقد اللمفاوية، واحدة مجمدة طازجة (LN1) والأخرى محفوظة في الفورمالين (FLN1)، مع مناطق الورم الأولية لإعادة بناء شجرة النشوء والتطور للورم. وتمت تصور خرائط استنساخ مناطق الورم باستخدام دالة cloneMap (حزمة cloneMap R الإصدار 1.0.0.0، bioRxiv 2022.07.26.501523).
تحليل البقاء
لتقييم القيمة التنبؤية لـ TANs في سرطان الرئة، قمنا بتعريف مجموعة اكتشاف على أنها أورام TRACERx100 التي تم تحليلها باستخدام IMC لعلامات العدلات (لوحة ) ومجموعة التحقق كأورام TRACERx421 غير المتداخلة مع درجة TAN المستمدة من H&E كبديل، ( ; الشكل التوضيحي التكميلي S10A). في ثماني حالات مع تسجيل TAN، عندما كان لدى المرضى أورام رئة أولية متعددة متزامنة، استخدمنا فقط بيانات من الورم الذي يحمل أعلى مرحلة TNM مرضية. استبعدنا مريضين حيث كشفت بيانات تسلسل المناطق المتعددة عن كتلتين ورميتين كأورام تصادمية مع اثنين وثلاثة LUADs مستقلة في CRUK0881 وCRUK0704، على التوالي، تم تشخيصها نسيجياً كأورام LUAD أولية واحدة (14). تم استبعاد مريض واحد (CRUK0682) لديه أورام رئة أولية متزامنة (LUAD وLUSC)، حيث لم يتم تسلسل ورمه الذي يحمل أعلى مرحلة (LUAD)، من تحليل البقاء.
داخل مجموعة الاكتشاف، قمنا بتمييز الأورام التي تحتوي على نسخ خلوية تزرع النقائل ) كأورام نقيليّة، كما تحددها الملفات الجينومية متعددة المناطق من الأورام الأولية والنقيليّة المتطابقة (15). جميع الأورام التي تزرع في العقد اللمفاوية والنقيليات داخل الرئة القابلة للاكتشاف في وقت الجراحةبالإضافة إلى أي انتكاسة تم اكتشافها خلال المتابعة تم تضمينها (بالإضافة إلى ذلك، قمنا أيضًا بتعريف الأورام الضابطة على أنها تلك التي تخص مرضى لم يتم تشخيصهم بالانتشار أو التكرار لأكثر من 3 سنوات من فترة المتابعة.
تم تعريف فترة البقاء خالية من المرض (DFS) على أنها الفترة من تاريخ التسجيل حتى وقت التأكيد الإشعاعي لعودة الورم الأساسي المسجل في TRACERx أو وقت الوفاة لأي سبب. وتم تعريف فترة البقاء خالية من المرض الخاصة بسرطان الرئة على أنها الفترة من تاريخ التسجيل حتى وقت التأكيد الإشعاعي لعودة الورم الأساسي المسجل في TRACERx أو وقت الوفاة بسبب سرطان الرئة.
تم إنشاء مخططات كابلان-ماير استنادًا إلى النموذج الأحادي المتغير من دالة survfit (حزمة البقاء R v3.4.0) وتمت مقارنتها باختبار لوغ-رانك. نسب المخاطر وتم اشتقاق القيم باستخدام تحليلات الانحدار كوكس أحادي المتغير ومتعدد المتغيرات باستخدام دالة coxph (survival v3.4.0). تم الوفاء بفرضيات مخاطر كوكس النسبية للنماذج أحادية ومتعددة المتغيرات. كما تضمنت النماذج أحادية المتغير طبقات حسب نوع النسيج. تم تعديل النموذج متعدد المتغيرات لأخذ النخر والعمر والجنس والمرحلة المرضية في الاعتبار.سنوات تدخين علبة، تلقي العلاج المساعد، ونوع النسيج. تم استخراج متوسط مدة المتابعة للفوج من الجدول الملخص لنموذج survfit.
تم تقييم حالة النخر من صور التشخيص باستخدام صبغة H&E بواسطة أخصائي الأمراض. تم تعريف درجات التوسع الفرعي العالية والمنخفضة بناءً على الدرجة المتوسطة. تم الإبلاغ عن نسب المخاطر المرتبطة بالعمر وسنوات التدخين لكل 10 سنوات. قمنا بتقييم عدة طرق لتحديد درجات TAN العالية والمنخفضة، بما في ذلك الوسيط، والربع العلوي (مقابل البقية)، والحد الأمثل الموضح أعلاه في قسم تقييم TAN من صور HEGE في TRACERx. تم تقييم كل من درجات TAN الإقليمية والتشخيصية في التحليل الأحادي المتغير، بينما تم اشتقاق درجة TAN المستخدمة في التحليل المتعدد المتغيرات من صور التشخيص باستخدام صبغة H&E. ظلت العلاقة مع التنبؤ بالنتائج ذات دلالة إحصائية بالنسبة للأورام ذات درجات TAN العالية في التحليلات المتعددة المتغيرات مع الدرجة المتوسطة للتوسع الفرعي الأخير أو حالة طفرة PIK3CA (الجدول التكميلي S5).
تقييم الخلايا الحبيبية من صور H&E وتحليل البقاء في TCGA
تم تحليل صور الشرائح الكاملة الملونة بصبغة H&E من TCGA باستخدام PathExplore، وهو نموذج قائم على التعلم العميق لتصنيف نوع الخلايا والأنسجة تم تدريبه على تعليقات خبراء علم الأمراض على 6,918 شريحة كاملة من أنسجة NSCLC (37). يقوم نموذج تصنيف الأنسجة بتقسيم أعشاش الأورام (السرطان)، والستروما السرطانية، والخلفية، والغرغرينا، والعيوب في صور H&E. تم تقييم مخرجات PathExplore لقطاعات الأنسجة من قبل أطباء الأمراض لتقييم أداء النموذج في اكتشاف وتصنيف مناطق خلفية الأنسجة، والعيوب، وأعشاش الأورام (السرطان)، والستروما السرطانية، والغرغرينا. العينات التي تحتوي على تم إزالة الخطأ في تقسيم أعشاش الأورام (السرطان) والستروما السرطانية. العينات التي لم يتم تقييم النخر، أو العيوب، أو الخلفية لها أو كانتتم استبعاد الأخطاء. تم تدريب نموذج تصنيف نوع الخلايا للتنبؤ بالعدلات. من المتوقع أن يتضمن تصنيف العدلات الحمضات بالإضافة إلى العدلات.
تم اشتقاق الدرجة الآلية من تطبيق PathExplore على مجموعة TCGA باستخدام نسبة الحبيبات في عشيرة الورم/الستروما إلى العدد الإجمالي للخلايا في عشيرة الورم/الستروما (الشكل التوضيحي S11A). كانت الدرجة الآلية متوافقة ولكن ليست متطابقة مع درجة TAN المستمدة من أخصائي الأمراض، والتي تم تعريفها بناءً على عاملين: مساحة العدلات في أعشاش الورم/الستروما مقارنة بمساحة عشيرة الورم/الستروما. على الرغم من أن درجة TAN كانت تعتمد على نسبة مساحة الخلايا، إلا أن الدرجة الآلية كانت تقيس نسبة عدد الخلايا. نظرًا لأن مساحة العدلات عادةً ما تكون أصغر من مساحة خلايا السرطان أو الألياف في TS، فإن نسب المساحة التي سجلها أخصائي الأمراض ستكون عمومًا أقل من نسب الخلايا الآلية. لذلك، لم يكن من الممكن تطبيق حدود درجة TAN المستمدة باستخدام مجموعة TRACERx مباشرة على عينات TCGA. بدلاً من استخدام حد درجة واحد في مجموعة TCGA، استخدمنا مجموعة من حدود الدرجات، تم تعريفها من خلال نسب الحبيبات العالية في TS. اعتبرت درجة TAN وقياس PathExplore فقط جزر الورم القابلة للحياة، مستبعدة المناطق النخرية والأنسجة الطبيعية.
تم تعريف DFS استنادًا إلى تعليقات الأحداث الورمية الجديدة بعد العلاج الأولي والحالة الحيوية في البيانات السريرية التي تم تنزيلها من بوابة TCGA.بوابة.gdc.cancer.gov). لم تُعتبر الأحداث الجديدة للأورام المعلنة كأورام أولية جديدة أحداثًا تتعلق بالبقاء بدون مرض. تم استبعاد المرضى الذين تم تشخيصهم بأورام من المرحلة الرابعة أو الذين تم علاجهم من أورام سابقة. تم تقييم نسبة المخاطر لمجموعة من الفترات للمتغيرين: نسبة الكريات البيضاء المتعادلة إلى جميع الخلايا المتوقعة في عشة الورم (فترة عشة الورم) والستروما (فترة الستروما). تم تعريف الأورام ذات الدرجات العالية على أنها تلك التي كانت فيها نسبة الكريات البيضاء المتعادلة في عشة الورم أعلى من فترة عشة الورم أو كانت فيها نسبة الكريات البيضاء المتعادلة في الستروما أعلى من فترة الستروما.
تم تعديل النموذج المتعدد المتغيرات حسب العمر والجنس والمرحلة المرضيةسنوات تدخين العلب، تلقي العلاج المساعد، ونوع النسيج. تم الإبلاغ عن نسب المخاطر للعمر وسنوات العلب لكل 10 سنوات (الشكل التوضيحي التكميلي S11B).
التحليل الإحصائي
تم إجراء جميع الاختبارات الإحصائية في R. لم تُستخدم أي طرق إحصائية لتحديد حجم العينة مسبقًا. تم استبعاد NSCLC-other من التحليلات المحددة بالأنسجة بسبب حجم العينة المنخفض. تم إجراء الاختبارات التي تتضمن مقارنات التوزيعات باستخدام اختبار ويلكوكسون غير المعلمي ذو الذيلين، ما لم يُحدد أنه ذو ذيل واحد، باستخدام خيارات مرتبطة أو غير مرتبطة حيثما كان ذلك مناسبًا. تم إجراء الاختبارات التي تتضمن مقارنة المجموعات باستخدام اختبار كاي تربيع ذو الذيلين. بالنسبة لجميع الاختبارات الإحصائية، يتم رسم أو توضيح أعداد نقاط البيانات المضمنة في أسطورة الشكل المقابل. معاملات الارتباط و…تم حساب القيم باستخدام طريقة ارتباط سبيرمان.
متغير تابع مستمر: حيث تم اعتبار مناطق/أنوية الورم المتعددة لكل مريض، تم تطبيق نماذج LME باستخدام معرف المريض كأثر عشوائي. C6:البلاعم وكانت مجموعة الخلايا مرتبطة بحالة التدخين بين الميزات السريرية؛ لذلك، تم تصحيح نماذج LME مع هذه المجموعة لحالة التدخين كأثر ثابت. ANOVAتم حساب القيم من خلال مقارنة نموذج التأثيرات بالنموذج الصفري.
متغير تابع تصنيفي: في الحالة التي تم فيها اعتبار مناطق/نوى ورم متعددة لكل ورم، تم إجراء تحليلات إحصائية لتوزيعات البيانات التصنيفية (مثل فئة TME) بالنسبة لمتغير تصنيفي مستقل (مثل حالة التدخين) باستخدام دالة glmer من حزمة lme4 في R (توزيع “ثنائي”). تم تضمين معرف المريض كأثر عشوائي، وANOVAتم حساب القيم من خلال مقارنة نموذج التأثيرات مع النموذج الصفري.
توفر الشيفرة والبيانات
تم إيداع بيانات RNA-seq وWES (في كل حالة من دراسة TRACERx) المستخدمة خلال هذه الدراسة في أرشيف الجينوم والظواهر الأوروبي (EGA)، الذي يستضيفه المعهد الأوروبي للمعلوماتية الحيوية ومركز التنظيم الجينومي (CRG) تحت رموز الوصول EGAS00001006517 (RNA-seq) وEGAS00001006494 (WES)؛ يتم التحكم في الوصول من قبل لجنة الوصول إلى بيانات TRACERx. تتوفر تفاصيل حول كيفية التقدم للحصول على الوصول في الصفحة المرتبطة. بيانات IMC المستخدمة أو التي تم تحليلها خلال هذه الدراسة متاحة من خلال مركز تجارب السرطان CRUK وUCL (ctc).tracerx@ucl.ac.uk) لأغراض البحث الأكاديمي غير التجاري. سيتم منح الوصول بعد مراجعة اقتراح المشروع، الذي سيتم تقييمه من قبل لجنة الوصول إلى بيانات TRACERx، ودخول في اتفاقية وصول بيانات مناسبة، رهناً بأي موافقات أخلاقية قابلة للتطبيق.
تم تنفيذ الشيفرة المستخدمة في تحليل IMC في هذه الدراسة كخط أنابيب Nextflow وهي متاحة على GitHub مع تعليمات حول كيفية تشغيلها على مجموعة بيانات اختبار:https://github.com/FrancisCrickInstitute/تراسر إكس-فليكس.
يمكن تنزيل مجموعة بيانات تقسيم TRACERx Nuclear IMC، وأوزان نموذج الشبكة العصبية المدربة، ومجموعة بيانات الاختبار من زينودو:https://zenodo.org/record/7973724.
تقرير K.S.S. Enfield عن دعم آخر من برنامج الأبحاث والابتكار التابع للاتحاد الأوروبي Horizon 2020 بموجب اتفاقية منحة ماري سكلودوفسكا-كوري رقم 838540، ومنح من الجمعية الملكية (RF\ERE\210216)، ودعم آخر من بريستول مايرز سكويب خلال إجراء الدراسة. يذكر E. Colliver منحًا من بريستول مايرز سكويب ومؤسسة مارك لأبحاث السرطان خلال إجراء الدراسة. يذكر A. Magness منحًا من بريستول مايرز سكويب خلال إجراء الدراسة. يذكر D.A. Moore رسوم متحدث من أسترازينيكا وتاكد.
رسوم الاستشارات من أسترازينيكا، ثيرمو فيشر، تاكيدا، أميجن، جانسن، MIM Software، بريستول مايرز سكويب، وإيلي ليلي والدعم التعليمي من تاكيدا وأميجن. T. كاراساكي يذكر منحًا من الجمعية اليابانية لتعزيز العلوم خلال إجراء الدراسة. K.K. دايسترا يذكر منحًا من الاتحاد الأوروبي هورايزون 2020 وZonMW خلال إجراء الدراسة؛ رسوم شخصية من Achilles Therapeutics UK Ltd. خارج العمل المقدم. A. هاكشو يذكر منحًا من أبحاث السرطان في المملكة المتحدة خلال إجراء الدراسة. M. جمال-هانجاني يذكر منحًا من أبحاث السرطان في المملكة المتحدة خلال إجراء الدراسة؛ منح من أبحاث السرطان في المملكة المتحدة، Rosetrees Trust، المعهد الوطني للسرطان NIH، دعم آخر من مجلس استشاري علمي Achilles Therapeutics ولجنة التوجيه، فايزر، أستكس للأدوية، مجموعة أوسلو للسرطان، وبريستول مايرز سكويب خارج العمل المقدم. N. مكغرانهان يذكر براءة اختراع لـ PCT/EP2016/059401 صادرة، براءة اختراع لـ PCT/EP2016/071471 صادرة، براءة اختراع لـ PCT/GB2018/052004 صادرة، براءة اختراع لـ PCT/GB2020/050221 صادرة، وبراءة اختراع لـ PCT/EP2022/070694 صادرة. B. غلاس يذكر دعمًا آخر من PathAI خارج العمل المقدم. E. ووك يذكر أنني موظف بدوام كامل في PathAI، Inc. S.A. كويزادا يذكر دعمًا آخر من Achilles Therapeutics، منحًا من روش، وسايروبا خارج العمل المقدم. C.T. هايلي يذكر رسومًا شخصية من GenesisCare UK، منحًا من روش، وأسترازينيكا خارج العمل المقدم. J. داونورد يذكر منحًا، رسومًا شخصية، ودعمًا غير مالي من أسترازينيكا، رسومًا شخصية من باير، جوبيلانت، ثيراس، بريدج بايو، فيفيديون، نوفارتس، ومنح ودعم غير مالي من BMS، Revolution Medicines خارج العمل المقدم. E. ساهاي يذكر منحًا من مؤسسة مارك ومجلس الأبحاث الأوروبي خلال إجراء الدراسة؛ منح من نوفارتس، ميرك شارب دوهم، أسترازينيكا ورسوم شخصية من فينوميك خارج العمل المقدم. C. سوانتون يذكر منحًا ورسومًا شخصية من بريستول مايرز سكويب، أسترازينيكا، بوهيرينجر-إنجلهايم، روش-فينتانا، رسومًا شخصية من فايزر، منحًا من أونو للأدوية، بيرسوناليس، منحًا، رسومًا شخصية، ودعمًا آخر من GRAIL، دعم آخر من أسترازينيكا وGRAIL، رسومًا شخصية ودعمًا آخر من Achilles Therapeutics، Bicycle Therapeutics، رسومًا شخصية من جينينتيك، ميديكسي، مركز الابتكار الصيني لروش (CiCoR) سابقًا مركز الابتكار لروش، ميتابوميد، ريلاي ثيرابيوتيكس، ساغا داياغنوستكس، معهد سارة كانون للأبحاث، أميجن، غلاكسو سميث كلاين، إلومينا، MSD، نوفارتس، دعم آخر من Apogen Biotechnologies وEpic Bioscience خلال إجراء الدراسة؛ منح ورسوم شخصية من BMS، أسترازينيكا، بوهيرينجر-إنجلهايم، روش-فينتانا، منح من أونو للأدوية، بيرسوناليس، رسوم شخصية ودعم آخر من GRAIL، Achilles Therapeutics، Bicycle Therapeutics، ريلاي ثيرابيوتيكس، رسوم شخصية من جينينتيك، ميديكسي، مركز الابتكار الصيني لروش، ميتابوميد، ساغا داياغنوستكس، معهد سارة كانون للأبحاث، أميجن، GSK، إلومينا، MSD، دعم آخر من Apogen Biosciences، وEpic Biosciences خارج العمل المقدم؛ بالإضافة إلى ذلك، C. سوانتون لديه براءة اختراع لـ PCT/US2017/028013 مرخصة لـ Natera Inc، UCL Business، براءة اختراع لـ PCT/EP2016/059401 مرخصة لـ Cancer Research Technology، براءة اختراع لـ PCT/EP2016/071471 صادرة لـ Cancer Research Technology، براءة اختراع لـ PCT/GB2018/051912 قيد الانتظار، براءة اختراع لـ PCT/GB2018/052004 صادرة لـ Francis Crick Institute، University College London، Cancer Research Technology Ltd، براءة اختراع لـ PCT/GB2020/050221 صادرة لـ Francis Crick Institute، University College London، براءة اختراع لـ PCT/EP2022/077987 قيد الانتظار لـ Cancer Research Technology، براءة اختراع لـ PCT/GB2017/053289 مرخصة، براءة اختراع لـ PCT/EP2022/077987 قيد الانتظار لـ Francis Crick Institute، براءة اختراع لـ PCT/EP2023/059039 قيد الانتظار لـ Francis Crick Institute، وبراءة اختراع لـ PCT/GB2018/051892 قيد الانتظار لـ Francis Crick Institute؛ وC.S. هو أستاذ أبحاث في الجمعية الملكية نابير (RSRP ). يتم دعم عمله من قبل معهد فرانسيس كريك الذي يتلقى تمويله الأساسي من أبحاث السرطان في المملكة المتحدة (CC2041)، مجلس الأبحاث الطبية في المملكة المتحدة (CC2041)، و
صندوق ويلكوم (CC2041). لغرض الوصول المفتوح، قام المؤلف بتطبيق ترخيص حقوق الطبع والنشر العام CC BY على أي نسخة من المخطوطة المقبولة من المؤلف الناتجة عن هذا التقديم. C.S. يتم تمويله من قبل أبحاث السرطان في المملكة المتحدة (TRACERx (C11496/A17786)، PEACE (C416/A21999) وشبكة المحفز لعلاج السرطان CRUK)؛ مركز تميز سرطان الرئة لأبحاث السرطان في المملكة المتحدة (C11496/A30025)؛ Rosetrees Trust، Butterfield وStoneygate Trusts؛ مؤسسة نوفو نورديسك (ID16584)؛ جائزة تعزيز أستاذ الجمعية الملكية (RP/EA/180007 وRFERE231118)؛ المعهد الوطني للبحوث الصحية (NIHR) مركز أبحاث الطب الحيوي في مستشفيات جامعة كوليدج لندن؛ مركز أبحاث السرطان في المملكة المتحدة-جامعة كوليدج لندن؛ مركز أبحاث السرطان التجريبية؛ مؤسسة أبحاث سرطان الثدي (الولايات المتحدة؛ BCRF-22157)؛ جائزة أولية للكشف المبكر والتشخيص من أبحاث السرطان في المملكة المتحدة (منحة EDDPMA-Nov21/100034)؛ وجائزة Aspire من مؤسسة مارك لأبحاث السرطان (منحة 21-029-ASP) وجائزة ASPIRE II. تم دعم هذا العمل من قبل منحة Stand Up To Cancer-LUN-Gevity-American Lung Association Lung Cancer Interception Dream Team Translational Research Grant (رقم المنحة: SU2C-AACR-DT23-17 لـ S.M. Dubinett وA.E. Spira). Stand Up To Cancer هي قسم من مؤسسة صناعة الترفيه. يتم إدارة المنح البحثية من قبل الجمعية الأمريكية لأبحاث السرطان، الشريك العلمي لـ SU2C. CS يتلقى منحة متقدمة من ERC (PROTEUS) من مجلس الأبحاث الأوروبي بموجب برنامج البحث والابتكار هورايزون 2020 للاتحاد الأوروبي (رقم اتفاقية المنحة 835297). C.S هو المحقق الرئيسي المشارك في تجربة NHS Galleri الممولة من GRAIL. هو المحقق الرئيسي لتجارب أسترازينيكا السريرية MeRmaiD I وII ورئيس لجنة التوجيه. C.S هو المؤسس المشارك لـ Achilles Therapeutics ويمتلك خيارات أسهم. M. أنجيلوفا يذكر منحًا من بريستول مايرز سكويب خلال إجراء الدراسة؛ بالإضافة إلى ذلك، M. أنجيلوفا لديها براءة اختراع لـ WO2020201362A2 صادرة، براءة اختراع لـ JP2022527972A قيد الانتظار، براءة اختراع لـ EP3947737A2 قيد الانتظار، وبراءة اختراع لـ US20220177978A1 قيد الانتظار. لم يتم الإبلاغ عن أي إفصاحات من قبل المؤلفين الآخرين.
مساهمات المؤلفين
K.S.S. إنفيلد: التصور، الموارد، تنظيم البيانات، التحليل الرسمي، الإشراف، الحصول على التمويل، التحقق، التحقيق، التصور، المنهجية، كتابة المسودة الأصلية، كتابة المراجعة والتحرير. E. كوليفر: تنظيم البيانات، البرمجيات، التحليل الرسمي، التحقق، التحقيق، التصور، المنهجية، كتابة المسودة الأصلية، كتابة المراجعة والتحرير. C. لي: تنظيم البيانات، التحليل الرسمي، التحقيق، التصور، المنهجية، كتابة المسودة الأصلية. A. ماغنيس: تنظيم البيانات، البرمجيات، التحليل الرسمي، التحقق، التحقيق، التصور، المنهجية، كتابة المسودة الأصلية. D.A. مور: الموارد، تنظيم البيانات، التحقق. M. سيفاكومار: تنظيم البيانات، التصور. K. غريغوريديس: البرمجيات، التحليل الرسمي، التصور. O. بيش: تنظيم البيانات. T. كاراساكي: تنظيم البيانات، التحقق، المنهجية. P.S. هوبسون: التحقيق، المنهجية. D. ليفي: التحقيق، المنهجية. S. فيريا: الموارد، تنظيم البيانات. C. بوتيك: تنظيم البيانات. E.L. ناي: التحقيق، المنهجية. M. غرين: التحقق، التحقيق، المنهجية. K.K. ديكسترا: تنظيم البيانات. M. شيماتو: البرمجيات. A.U. أكاركا: التحقق، التحقيق. T. مارافيتي: التحقق، التصور. R. سالغادو: تنظيم البيانات. A. هاكشو: تنظيم البيانات، التحقق. اتحاد TRACERx: الموارد، تنظيم البيانات. M. جمال-هانجاني: تنظيم البيانات، الإشراف. F. فان مالديغيم: المنهجية. N. مكغرانهان: تنظيم البيانات، الإشراف. B. غلاس: التحقق، التحقيق. H. بولاسكي: التحقق. E. ووك: التحقق. J.L. ريدينغ: التصور. S.A. كويزادا: التصور. C.T. هايلي: التصور، تنظيم البيانات، الحصول على التمويل، كتابة المراجعة والتحرير. J. داونورد: التصور، الإشراف، الحصول على التمويل، كتابة المراجعة والتحرير. E. سهاي: التصور، الإشراف، الحصول على التمويل، كتابة المراجعة والتحرير. C. سوانتون: التصور، الموارد. الإشراف، الحصول على التمويل، كتابة المسودة الأصلية، مراجعة الكتابة وتحريرها. م. أنجيلوفا: التصور، تنظيم البيانات، البرمجيات، التحليل الرسمي، الإشراف، التحقق، التحقيق، التصور، المنهجية، كتابة المسودة الأصلية، مراجعة الكتابة وتحريرها.
شكر وتقدير
نحن ممتنون للمساعدة من مرافق المجهر الضوئي المتقدم، التسلسل المتقدم، علم الأمراض التجريبي، البحث البيولوجي، خدمات الخلايا، البروتيوميات، علم الخلايا الجريان، والحوسبة العلمية في معهد فرانسيس كريك. دراسة TRACERx (clinicaltrials.govرقم: NCT01888601) برعاية كلية لندن الجامعية (UCL/12/0279) وقد تمت الموافقة عليه من قبل لجنة أخلاقيات البحث المستقلة (13/LO/1546). يتم تمويل TRACERx من قبل أبحاث السرطان في المملكة المتحدة (C11496/A17786) ويتم تنسيقه من خلال مركز أبحاث السرطان في المملكة المتحدة ومركز تجارب السرطان في UCL الذي لديه منحة أساسية من CRUK (C444/A15953). نحن نقدر بشدة المرضى والأقارب الذين شاركوا في دراسات TRACERx وPEACE. نشكر جميع موظفي الموقع، والمحققين، والممولين، وشركاء الصناعة الذين دعموا جمع البيانات ضمن هذه الدراسة. تم دعم هذا العمل من قبل معهد فرانسيس كريك، الذي يتلقى تمويله الأساسي من أبحاث السرطان في المملكة المتحدة (CC2041)، ومجلس الأبحاث الطبية في المملكة المتحدة (CC2041)، ومؤسسة ويلكوم (CC2041). كما تم دعم هذا العمل من قبل مركز أبحاث السرطان في المملكة المتحدة لسرطان الرئة ومركز جائزة CRUK في مدينة لندن (C7893/A26233) بالإضافة إلى مركز UCL للأدوية التجريبية لعلاج السرطان. تم دعم هذا العمل من خلال تمويل كجزء من تعاون بحثي مع بريستول-مايرز سكويب. حصل هذا المشروع على تمويل من المجلس الأوروبي للبحث (ERC) بموجب برنامج أفق 2020 للبحث والابتكار التابع للاتحاد الأوروبي (اتفاقية منحة رقم 101018670). لغرض الوصول المفتوح، قام المؤلف بتطبيق ترخيص حقوق الطبع والنشر العام CC BY على أي نسخة من المخطوطة المقبولة من المؤلف الناتجة عن هذا التقديم. C. Swanton هو أستاذ أبحاث نابير في الجمعية الملكية (RSRP) ). يتم دعم عمله من قبل معهد فرانسيس كريك الذي يتلقى تمويله الأساسي من أبحاث السرطان في المملكة المتحدة (CC2041)، ومجلس الأبحاث الطبية في المملكة المتحدة (CC2041)، ومؤسسة ويلكوم (CC2041). يتم تمويل C. Swanton من قبل أبحاث السرطان في المملكة المتحدة (TRACERx (C11496/A17786)، PEACE (C416/A21999) وشبكة CRUK لعلاج السرطان المناعي)؛ مركز تميز سرطان الرئة التابع لأبحاث السرطان في المملكة المتحدة (C11496/A30025)؛ مؤسسة روزتريز، وصناديق باترفيلد وستونيغيت؛ مؤسسة نوفو نورديسك (ID16584)؛ جائزة تعزيز أستاذية الجمعية الملكية (RP/EA/180007 & RF\ERE\231118)؛ المعهد الوطني للبحوث الصحية (NIHR) مركز الأبحاث الطبية الحيوية في جامعة كوليدج لندن؛ مركز أبحاث السرطان في المملكة المتحدة – جامعة كوليدج لندن؛ مركز أبحاث السرطان التجريبية؛ مؤسسة أبحاث سرطان الثدي (الولايات المتحدة؛ BCRF-22-157)؛ جائزة أبحاث الكشف المبكر والتشخيص من أبحاث السرطان في المملكة المتحدة (منحة EDDPMANov21/100034)؛ وجائزة Aspire من مؤسسة مارك لأبحاث السرطان (منحة 21-029-ASP) وجائزة ASPIRE II (23-034ASP). تم دعم هذا العمل من خلال منحة بحثية ترجمة فريق أحلام سرطان الرئة من Stand Up To Cancer-LUNGev-ity-American Lung Association (رقم المنحة: SU2C-AACR-DT23-17 إلى S.M. Dubinett وA.E. Spira). يتم إدارة منحة Stand Up To Cancer المشار إليها من قبل الجمعية الأمريكية لأبحاث السرطان، الشريك العلمي لـ SU2C. يتلقى C. Swanton منحة متقدمة من ERC (PROTEUS) من المجلس الأوروبي للبحث تحت برنامج الأبحاث والابتكار Horizon 2020 التابع للاتحاد الأوروبي (رقم اتفاق المنحة 835297). تم تمويل E. Colliver وE. Sahai جزئيًا من قبل مؤسسة مارك لأبحاث السرطان (MFCR ASPIRE 2022-0384). يتم دعم E. Sahai أيضًا من قبل المجلس الأوروبي للبحث (منحة متقدمة CAN_ORGANISE، رقم اتفاق المنحة 101019366) ومعهد فرانسيس كريك، الذي يتلقى تمويله الأساسي من
أبحاث السرطان في المملكة المتحدة (CC2040)، المجلس الطبي للأبحاث في المملكة المتحدة (CC2040)، ومؤسسة ويلكوم (CC2040). ن. مكغرانهان هو زميل سير هنري ديل، ممول بشكل مشترك من قبل مؤسسة ويلكوم والجمعية الملكية (رقم المنحة 211179/Z/18/Z)، ويتلقى أيضًا تمويلًا من أبحاث السرطان في المملكة المتحدة، وروزتريز، ومركز الأبحاث الطبية الحيوية في مستشفيات جامعة كوليدج لندن ومركز أبحاث السرطان في جامعة كوليدج لندن. ف. فان مالديغيم هو متلقي زمالة أمستردام UMC ويتلقى تمويلًا من المجلس الأوروبي للبحث بموجب برنامج العمل WIDERA التابع لآفاق أوروبا للاتحاد الأوروبي (رقم اتفاقية المنحة 101079113). م. جمال-هانجاني هو حائز على جائزة تأسيس مهنة CRUK وقد حصل على تمويل من CRUK، ومؤسسة IASLC الدولية لسرطان الرئة، ومؤسسة أبحاث سرطان الرئة، وصندوق روزتريز، وUKI NETs، وNIHR، ومركز الأبحاث الطبية الحيوية في NIHR UCLH. ك.ك. ديكسترا تم دعمها من خلال تمويل من برنامج أبحاث وابتكار آفاق 2020 التابع للاتحاد الأوروبي بموجب اتفاقية منحة ماري سكلودوفسكا-كوري رقم 101024529 وزمالة زونMW روبكون (رقم 20-45200-98-20102). تم دعم ت. كاراساكي من خلال برنامج زمالات البحث الخارجي JSPS (202060447). تم دعم ك.س.س. إنفيلد من خلال برنامج أبحاث وابتكار آفاق 2020 التابع للاتحاد الأوروبي بموجب اتفاقية منحة ماري سكلودوفسكا-كوري رقم 838540 ويدعمه الجمعية الملكية (RF\ERE\210216). يقر المؤلفون باستخدامBioRender.comمرخص من معهد فرانسيس كريك لإنشاء الرسوم التوضيحية في الشكل 1A، الشكل التكميلي S1A، والشكل التكميلي S12A وS12B.
تم الاستلام في 17 نوفمبر 2023؛ تم التنقيح في 27 فبراير 2024؛ تم القبول في 22 مارس 2024؛ تم النشر لأول مرة في 12 أبريل 2024.
REFERENCES
Sorin M, Rezanejad M, Karimi E, Fiset B, Desharnais L, Perus LJM, et al. Single-cell spatial landscapes of the lung tumour immune microenvironment. Nature 2023;614:548-54.
Ali HR, Jackson HW, Zanotelli VRT, Danenberg E, Fischer JR, Bardwell H, et al. Imaging mass cytometry and multiplatform genomics define the phenogenomic landscape of breast cancer. Nat Cancer 2020;1:163-75.
Jackson HW, Fischer JR, Zanotelli VRT, Ali HR, Mechera R, Soysal SD, et al. The single-cell pathology landscape of breast cancer. Nature 2020; 578:615-20.
Danenberg E, Bardwell H, Zanotelli VRT, Provenzano E, Chin S-F, Rueda OM, et al. Breast tumor microenvironment structures are associated with genomic features and clinical outcome. Nat Genet 2022;54:660-9.
Wang XQ, Danenberg E, Huang C-S, Egle D, Callari M, Bermejo B, et al. Spatial predictors of immunotherapy response in triple-negative breast cancer. Nature 2023;621:868-76.
Li R, Lin Y, Wang Y, Wang S, Yang Y, Mu X, et al. Characterization of the tumor immune microenvironment in lung squamous cell carcinoma using imaging mass cytometry. Front Oncol 2021;11:620989.
Karimi E, Yu MW, Maritan SM, Perus LJM, Rezanejad M, Sorin M, et al. Single-cell spatial immune landscapes of primary and metastatic brain tumours. Nature 2023;614:555-63.
Cords L, Engler S, Haberecker M, Rüschoff JH, Moch H, de Souza N, et al. Cancer-associated fibroblast phenotypes are associated with patient outcome in non-small cell lung cancer. Cancer Cell 2024;42: 396-412.
Keren L, Bosse M, Marquez D, Angoshtari R, Jain S, Varma S, et al. A structured tumor-immune microenvironment in triple negative breast cancer revealed by multiplexed ion beam imaging. Cell 2018; 174:1373-87.
Rosenthal R, Cadieux EL, Salgado R, Bakir MA, Moore DA, Hiley CT, et al. Neoantigen-directed immune escape in lung cancer evolution. Nature 2019;567:479-85.
McGranahan N, Rosenthal R, Hiley CT, Rowan AJ, Watkins TBK, Wilson GA, et al. Allele-specific HLA loss and immune escape in lung cancer evolution. Cell 2017;171:1259-71.
Jamal-Hanjani M, Wilson GA, McGranahan N, Birkbak NJ, Watkins TBK, Veeriah S, et al. Tracking the evolution of non-small-cell lung cancer. N Engl J Med 2017;376:2109-21.
Martínez-Ruiz C, Black JRM, Puttick C, Hill MS, Demeulemeester J, Larose Cadieux E, et al. Genomic-transcriptomic evolution in lung cancer and metastasis. Nature 2023;616:543-52.
Frankell AM, Dietzen M, Al Bakir M, Lim EL, Karasaki T, Ward S, et al. The evolution of lung cancer and impact of subclonal selection in TRACERx. Nature 2023;616:525-33.
Al Bakir M, Huebner A, Martínez-Ruiz C, Grigoriadis K, Watkins TBK, Pich O, et al. The evolution of non-small cell lung cancer metastases in TRACERx. Nature 2023;616:534-42.
Ghorani E, Reading JL, Henry JY, de Massy MR, Rosenthal R, Turati V, et al. The T cell differentiation landscape is shaped by tumour mutations in lung cancer. Nat Cancer 2020;1:546-61.
Chen DS, Mellman I. Elements of cancer immunity and the cancerimmune set point. Nature 2017;541:321-30.
Ricciuti B, Wang X, Alessi JV, Rizvi H, Mahadevan NR, Li YY, et al. Association of high tumor mutation burden in non-small cell lung cancers with increased immune infiltration and improved clinical outcomes of PD-L1 blockade across PD-L1 expression levels. JAMA Oncol 2022;8:1160-8.
Salmon H, Franciszkiewicz K, Damotte D, Dieu-Nosjean M-C, Validire P, Trautmann A, et al. Matrix architecture defines the preferential localization and migration of T cells into the stroma of human lung tumors. J Clin Invest 2012;122:899-910.
Grout JA, Sirven P, Leader AM, Maskey S, Hector E, Puisieux I, et al. Spatial positioning and matrix programs of cancer-associated fibroblasts promote T-cell exclusion in human lung tumors. Cancer Discov 2022;12:2606-25.
AbdulJabbar K, Raza SEA, Rosenthal R, Jamal-Hanjani M, Veeriah S, Akarca A, et al. Geospatial immune variability illuminates differential evolution of lung adenocarcinoma. Nat Med 2020;26:1054-62.
Gentles AJ, Newman AM, Liu CL, Bratman SV, Feng W, Kim D, et al. The prognostic landscape of genes and infiltrating immune cells across human cancers. Nat Med 2015;21:938-45.
Kargl J, Busch SE, Yang GHY, Kim K-H, Hanke ML, Metz HE, et al. Neutrophils dominate the immune cell composition in non-small cell lung cancer. Nat Commun 2017;8:14381.
Lee DC, Sohn HA, Park Z-Y, Oh S, Kang YK, Lee K-M, et al. A lactateinduced response to hypoxia. Cell 2015;161:595-609.
DePeaux K, Delgoffe GM. Metabolic barriers to cancer immunotherapy. Nat Rev Immunol 2021;21:785-97.
Dimmer KS, Friedrich B, Lang F, Deitmer JW, Bröer S. The lowaffinity monocarboxylate transporter MCT4 is adapted to the export of lactate in highly glycolytic cells. Biochem J 2000;350(Pt 1):219-27.
DeBerardinis RJ, Chandel NS. Fundamentals of cancer metabolism. Sci Adv 2016;2:e1600200.
Spranger S, Gajewski TF. Impact of oncogenic pathways on evasion of antitumour immune responses. Nat Rev Cancer 2018;18:139-47.
Altorki NK, Markowitz GJ, Gao D, Port JL, Saxena A, Stiles B, et al. The lung microenvironment: an important regulator of tumour growth and metastasis. Nat Rev Cancer 2019;19:9-31.
Salgado R, Denkert C, Demaria S, Sirtaine N, Klauschen F, Pruneri G, et al. The evaluation of tumor-infiltrating lymphocytes (TILs) in breast cancer: recommendations by an International TILs Working Group 2014. Ann Oncol 2015;26:259-71.
Salcher S, Sturm G, Horvath L, Untergasser G, Kuempers C, Fotakis G, et al. High-resolution single-cell atlas reveals diversity and plasticity of tissue-resident neutrophils in non-small cell lung cancer. Cancer Cell 2022;40:1503-20.
Simoncello F, Piperno GM, Caronni N, Amadio R, Cappelletto A, Canarutto G, et al. CXCL5-mediated accumulation of mature neutro-
phils in lung cancer tissues impairs the differentiation program of anticancer CD8 T cells and limits the efficacy of checkpoint inhibitors. Oncoimmunology 2022;11:2059876.
Janiszewska M, Tabassum DP, Castaño Z, Cristea S, Yamamoto KN, Kingston NL, et al. Subclonal cooperation drives metastasis by modulating local and systemic immune microenvironments. Nat Cell Biol 2019;21:879-88.
Giese MA, Hind LE, Huttenlocher A. Neutrophil plasticity in the tumor microenvironment. Blood 2019;133:2159-67.
Teijeira A, Garasa S, Ochoa MC, Villalba M, Olivera I, Cirella A, et al. IL8, neutrophils, and NETs in a collusion against cancer immunity and immunotherapy. Clin Cancer Res 2021;27:2383-93.
Park SY, Lee H-S, Jang H-J, Lee GK, Chung KY, Zo JI. Tumor necrosis as a prognostic factor for stage IA non-small cell lung cancer. Ann Thorac Surg 2011;91:1668-73.
Diao JA, Wang JK, Chui WF, Mountain V, Gullapally SC, Srinivasan R, et al. Human-interpretable image features derived from densely mapped cancer pathology slides predict diverse molecular phenotypes. Nat Commun 2021;12:1613.
Thorsson V, Gibbs DL, Brown SD, Wolf D, Bortone DS, Ou Yang T-H, et al. The immune landscape of cancer. Immunity 2018;48:812-30.
Bagaev A, Kotlov N, Nomie K, Svekolkin V, Gafurov A, Isaeva O, et al. Conserved pan-cancer microenvironment subtypes predict response to immunotherapy. Cancer Cell 2021;39:845-65.
Combes AJ, Samad B, Tsui J, Chew NW, Yan P, Reeder GC, et al. Discovering dominant tumor immune archetypes in a pan-cancer census. Cell 2022;185:184-203.
Feig C, Jones JO, Kraman M, Wells RJB, Deonarine A, Chan DS, et al. Targeting CXCL12 from FAP-expressing carcinoma-associated fibroblasts synergizes with anti-PD-L1 immunotherapy in pancreatic cancer. Proc Natl Acad Sci U S A 2013;110:20212-7.
Mariathasan S, Turley SJ, Nickles D, Castiglioni A, Yuen K, Wang Y, et al. TGF attenuates tumour response to PD-L1 blockade by contributing to exclusion of T cells. Nature 2018;554:544-8.
Li X, Gruosso T, Zuo D, Omeroglu A, Meterissian S, Guiot M-C, et al. Infiltration of CD8+ T cells into tumor cell clusters in triple-negative breast cancer. Proc Natl Acad Sci U S A 2019;116:3678-87.
McGranahan N, Furness AJS, Rosenthal R, Ramskov S, Lyngaa R, Saini SK, et al. Clonal neoantigens elicit T cell immunoreactivity and sensitivity to immune checkpoint blockade. Science 2016;351: 1463-9.
RaviA,Hellmann MD,Arniella MB,Holton M,Freeman SS, Naranbhai V, et al. Genomic and transcriptomic analysis of checkpoint blockade response in advanced non-small cell lung cancer. Nat Genet 2023;55: 807-19.
PeranzoniE,LemoineJ,VimeuxL,FeuilletV,BarrinS,Kantari-MimounC, et al. Macrophages impede CD8 T cells from reaching tumor cells and limit the efficacy of anti-PD-1 treatment. Proc Natl Acad Sci U S A 2018; 115:E4041-50.
Kersten K, Hu KH, Combes AJ, Samad B, Harwin T, Ray A, et al. Spatiotemporal co-dependency between macrophages and exhausted CD8+ T cells in cancer. Cancer Cell 2022;40:624-38.
Mantovani A, Allavena P, Marchesi F, Garlanda C. Macrophages as tools and targets in cancer therapy. Nat Rev Drug Discov 2022; 21:799-820.
Litchfield K, Reading JL, Puttick C, Thakkar K, Abbosh C, Bentham R, et al. Meta-analysis of tumor- and T cell-intrinsic mechanisms of sensitization to checkpoint inhibition. Cell 2021;184:596-614.
Patil NS, Nabet BY, Müller S, Koeppen H, Zou W, Giltnane J, et al. Intratumoral plasma cells predict outcomes to PD-L1 blockade in non-small cell lung cancer. Cancer Cell 2022;40:289-300.
Vanhersecke L, Brunet M, Guégan J-P, Rey C, Bougouin A, Cousin S, et al. Mature tertiary lymphoid structures predict immune checkpoint inhibitor efficacy in solid tumors independently of PD-L1 expression. Nat Cancer 2021;2:794-802.
Rizvi NA, Hellmann MD, Snyder A, Kvistborg P, Makarov V, Havel JJ, et al. Cancer immunology. mutational landscape determines sensitivity to PD-1 blockade in non-small cell lung cancer. Science 2015;348: 124-8.
Ng KW, Boumelha J, Enfield KSS, Almagro J, Cha H, Pich O, et al. Antibodies against endogenous retroviruses promote lung cancer immunotherapy. Nature 2023;616:563-73.
Hao D, Han G, Sinjab A, Gomez-Bolanos LI, Lazcano R, Serrano A, et al. The single-cell immunogenomic landscape of B and plasma cells in early-stage lung adenocarcinoma. Cancer Discov 2022;12: 2626-45.
Leader AM, Grout JA, Maier BB, Nabet BY, Park MD, Tabachnikova A, et al. Single-cell analysis of human non-small cell lung cancer lesions refines tumor classification and patient stratification. Cancer Cell 2021;39:1594-609.
Templeton AJ, McNamara MG, Šeruga B, Vera-Badillo FE, Aneja P, Ocaña A, et al. Prognostic role of neutrophil-to-lymphocyte ratio in solid tumors: a systematic review and meta-analysis. J Natl Cancer Inst 2014;106:dju124.
Rakaee M, Busund L-T, Paulsen E-E, Richardsen E, Al-Saad S, Andersen S, et al. Prognostic effect of intratumoral neutrophils across histological subtypes of non-small cell lung cancer. Oncotarget 2016;7:72184-96.
Carus A, Ladekarl M, Hager H, Pilegaard H, Nielsen PS, Donskov F. Tumor-associated neutrophils and macrophages in non-small cell lung cancer: no immediate impact on patient outcome. Lung Cancer 2013;81:130-7.
Ballesteros I, Rubio-Ponce A, Genua M, Lusito E, Kwok I, FernándezCalvo G, et al. Co-option of neutrophil fates by tissue environments. Cell 2020;183:1282-97.
Szczerba BM, Castro-Giner F, Vetter M, Krol I, Gkountela S, Landin J, et al. Neutrophils escort circulating tumour cells to enable cell cycle progression. Nature 2019;566:553-7.
Faget J, Groeneveld S, Boivin G, Sankar M, Zangger N, Garcia M, et al. Neutrophils and snail orchestrate the establishment of a pro-tumor microenvironment in lung cancer. Cell Rep 2017;21:3190-204.
Varrone M, Tavernari D, Santamaria-Martínez A, Walsh LA, Ciriello G. CellCharter reveals spatial cell niches associated with tissue remodeling and cell plasticity. Nat Genet 2024;56:74-84.
Schuurbiers OCJ,Meijer TWH,KaandersJHAM,Looijen-SalamonMG, de Geus-Oei L-F, van der Drift MA, et al. Glucose metabolism in NSCLC is histology-specific and diverges the prognostic potential of 18FDG-PET for adenocarcinoma and squamous cell carcinoma. J Thorac Oncol 2014;9:1485-93.
Wculek SK, Malanchi I. Neutrophils support lung colonization of metastasis-initiating breast cancer cells. Nature 2015;528:413-7.
van Maldegem F, Valand K, Cole M, Patel H, Angelova M, Rana S, et al. Characterisation of tumour microenvironment remodelling following oncogene inhibition in preclinical studies with imaging mass cytometry. Nat Commun 2021;12:5906.
Sparmann A, Bar-Sagi D. Ras-induced interleukin-8 expression plays a critical role in tumor growth and angiogenesis. Cancer Cell 2004;6: 447-58.
Lin C-H, Cheng H-W, Hsu M-J, Chen M-C, Lin C-C, Chen B-C. c-Src mediates thrombin-induced NF-kappaB activation and IL-8/CXCL8 expression in lung epithelial cells. J Immunol 2006;177:3427-38.
Hao Y, Samuels Y, Li Q, Krokowski D, Guan B-J, Wang C, et al. Oncogenic PIK3CA mutations reprogram glutamine metabolism in colorectal cancer. Nat Commun 2016;7:11971.
Koundouros N, Karali E, Tripp A, Valle A, Inglese P, Perry NJS, et al. Metabolic fingerprinting links oncogenic PIK3CA with enhanced arachidonic acid-derived eicosanoids. Cell 2020;181:1596-611.
Hutti JE, Pfefferle AD, Russell SC, Sircar M, Perou CM, Baldwin AS. Oncogenic PI3K mutations lead to NF-кB-dependent cytokine expression following growth factor deprivation. Cancer Res 2012;72:3260-9.
Forde PM, Spicer J, Lu S, Provencio M, Mitsudomi T, Awad MM, et al. Neoadjuvant nivolumab plus chemotherapy in resectable lung cancer. N Engl J Med 2022;386:1973-85.
Wakelee H, Liberman M, Kato T, Tsuboi M, Lee S-H, Gao S, et al. Perioperative pembrolizumab for early-stage non-small-cell lung cancer. N Engl J Med 2023;389:491-503.
Lu S, Wu L, Zhang W, Zhang P, Wang W, Fang W, et al. Perioperative toripalimab + platinum-doublet chemotherapy vs chemotherapy in resectable stage II/III non-small cell lung cancer (NSCLC): interim
event-free survival (EFS) analysis of the phase III Neotorch study. J Clin Orthod 2023;41:425126.
Heymach JV, Harpole D, Mitsudomi T, Taube JM, Galffy G, Hochmair M, et al. Abstract CT005: AEGEAN: a phase 3 trial of neoadjuvant durvalumab + chemotherapy followed by adjuvant durvalumab in patients with resectable NSCLC. Cancer Res 2023;83:CT005.
Shim JH, Kim HS, Cha H, Kim S, Kim TM, Anagnostou V, et al. HLAcorrected tumor mutation burden and homologous recombination deficiency for the prediction of response to PD-(L)1 blockade in advanced non-small-cell lung cancer patients. Ann Oncol 2020;31:902-11.
Jenkins L, Jungwirth U, Avgustinova A, Iravani M, Mills A, Haider S, et al. Cancer-associated fibroblasts suppress CD8+ T-cell infiltration and confer resistance to immune-checkpoint blockade. Cancer Res 2022;82:2904-17.
Hu H, Piotrowska Z, Hare PJ, Chen H, Mulvey HE, Mayfield A, et al. Three subtypes of lung cancer fibroblasts define distinct therapeutic paradigms. Cancer Cell 2021;39:1531-47.
Schalper KA, Carleton M, Zhou M, Chen T, Feng Y, Huang S-P, et al. Elevated serum interleukin-8 is associated with enhanced intratumor neutrophils and reduced clinical benefit of immune-checkpoint inhibitors. Nat Med 2020;26:688-92.
Yuen KC, Liu L-F, Gupta V, Madireddi S, Keerthivasan S, Li C, et al. High systemic and tumor-associated IL-8 correlates with reduced clinical benefit of PD-L1 blockade. Nat Med 2020;26:693-8.
Teijeira Á, Garasa S, Gato M, Alfaro C, Migueliz I, Cirella A, et al. CXCR1 and CXCR2 chemokine receptor agonists produced by tumors induce neutrophil extracellular traps that interfere with immune cytotoxicity. Immunity 2020;52:856-71.
Karasaki T, Moore DA, Veeriah S, Naceur-Lombardelli C, Toncheva A, Magno N, et al. Evolutionary characterization of lung adenocarcinoma morphology in TRACERx. Nat Med 2023;29:833-45.
Catena R, Montuenga LM, Bodenmiller B. Ruthenium counterstaining for imaging mass cytometry. J Pathol 2018;244:479-84.
Chevrier S, Crowell HL, Zanotelli VRT, Engler S, Robinson MD, Bodenmiller B. Compensation of signal spillover in suspension and imaging mass cytometry. Cell Syst 2018;6:612-20.
McQuin C, Goodman A, Chernyshev V, Kamentsky L, Cimini BA, Karhohs KW, et al. CellProfiler 3.0: Next-generation image processing for biology. PLoS Biol 2018;16:e2005970.
Zhang AW, O’Flanagan C, Chavez EA, Lim JLP, Ceglia N, McPherson A, et al. Probabilistic cell-type assignment of single-cell RNA-seq for tumor microenvironment profiling. Nat Methods 2019;16:1007-15.
Schürch CM, Bhate SS, Barlow GL, Phillips DJ, Noti L, Zlobec I, et al. Coordinated cellular neighborhoods orchestrate antitumoral immunity at the colorectal cancer invasive front. Cell 2020;182:1341-59.
Eling N, Damond N, Hoch T, Bodenmiller B. Cytomapper: an R/bioconductor package for visualisation of highly multiplexed imaging data. Bioinformatics 2020;36:5706-8.
Failmezger H, Muralidhar S, Rullan A, de Andrea CE, Sahai E, Yuan Y. Topological tumor graphs: a graph-based spatial model to infer stromal recruitment for immunosuppression in melanoma histology. Cancer Res 2020;80:1199-209.
Marafioti T, Jones M, Facchetti F, Diss TC, Du M-Q, Isaacson PG, et al. Phenotype and genotype of interfollicular large B cells, a subpopulation of lymphocytes often with dendritic morphology. Blood 2003;102:2868-76.
Schapiro D, Jackson HW, Raghuraman S, Fischer JR, Zanotelli VRT, Schulz D, et al. histoCAT: analysis of cell phenotypes and interactions in multiplex image cytometry data. Nat Methods 2017;14:873-6.
Merino DM, McShane LM, Fabrizio D, Funari V, Chen S-J, White JR, et al. Establishing guidelines to harmonize tumor mutational burden (TMB): in silico assessment of variation in TMB quantification across diagnostic platforms: phase I of the Friends of Cancer Research TMB Harmonization Project. J Immunother Cancer 2020;8:e000147.
Mermel CH, Schumacher SE, Hill B, Meyerson ML, Beroukhim R, Getz G. GISTIC2.0 facilitates sensitive and confident localization
of the targets of focal somatic copy-number alteration in human cancers. Genome Biol 2011;12:R41.
Reynisson B, Alvarez B, Paul S, Peters B, Nielsen M. NetMHCpan-4.1 and NetMHCIIpan-4.0: improved predictions of MHC antigen presentation by concurrent motif deconvolution and integration of MS MHC eluted ligand data. Nucleic Acids Res 2020;48:W449-54.
Kawaguchi S, Matsuda F. High-definition genomic analysis of HLA genes via comprehensive HLA allele genotyping. Methods Mol Biol 2020;2131:31-8.
Grigoriadis K, Huebner A, Bunkum A, Colliver E, Frankell AM, Hill MS, et al. CONIPHER: a computational framework for scalable phylogenetic reconstruction with error correction. Nat Protoc 2024;19:159-83.
Cancer Evolution and Genome Instability Laboratory, The Francis Crick Institute, London, United Kingdom. Cancer Research UK Lung Cancer Centre of Excellence, University College London Cancer Institute, London, United Kingdom. Department of Cellular Pathology, University College London Hospitals, London, United Kingdom. Cancer Genome Evolution Research Group, Cancer Research UK Lung Cancer Centre of Excellence, University College London Cancer Institute, London, United Kingdom. Cancer Metastasis Laboratory, University College London Cancer Institute, London, United Kingdom. Flow Cytometry, The Francis Crick Institute, London, United Kingdom. Experimental Histopathology, The Francis Crick Institute, London, United Kingdom. Department of Pathology, ZAS Hospitals, Antwerp, Belgium. Division of Research, Peter MacCallum Cancer Centre, Melbourne, Australia. Cancer Research UK and University College London Cancer Trials Centre, London, United Kingdom. Department of Oncology, University College London Hospitals, London, United Kingdom. Oncogene Biology Laboratory, The Francis Crick Institute, London, United Kingdom. PathAI, Inc., Boston, Massachusetts. Pre-cancer Immunology Laboratory, University College London Cancer Institute, London, United Kingdom. Immune Regulation and Tumour Immunotherapy Group, Cancer Immunology Unit, Research Department of Haematology, University College London Cancer Institute, London, United Kingdom. Tumour Cell Biology Laboratory, The Francis Crick Institute, London, United Kingdom.
Spatial Architecture of Myeloid and T Cells Orchestrates Immune Evasion and Clinical
Outcome in Lung Cancer
Katey S.S. Enfield , Emma Colliver , Claudia Lee , Alastair Magness , David A. Moore , Monica Sivakumar , Kristiana Grigoriadis , Oriol Pich , Takahiro Karasaki , Philip S. Hobson , Dina Levi , Selvaraju Veeriah , Clare Puttick , Emma L. Nye7, Mary Green , Krijn K. Dijkstra , Masako Shimato , Ayse U. Akarca , Teresa Marafioti , Roberto Salgado , Allan Hackshaw , TRACERx consortium, Mariam Jamal-Hanjani , Febe van Maldegem , Nicholas McGranahan , Benjamin Glass , Hanna Pulaski , Eric Walk , James L. Reading , Sergio A. Quezada , Crispin T. Hiley , Julian Downward , Erik Sahai , Charles Swanton , and Mihaela Angelova
Abstract
Understanding the role of the tumor microenvironment (TME) in lung cancer is critical to improving patient outcomes. We identified four histology-independent archetype TMEs in treatment-naïve early-stage lung cancer using imaging mass cytometry in the TRACERx study ( patients/ 198 samples million cells). In immune-hot adenocarcinomas, spatial niches of cells and macrophages increased with clonal neoantigen burden, whereas such an increase was observed for niches of plasma and B cells in immune-excluded squamous cell carcinomas (LUSC). Immune-low TMEs were associated with fibroblast barriers to immune infiltration. The fourth archetype, characterized by sparse lymphocytes and high tumor-associated neutrophil (TAN) infiltration, had tumor cells spatially separated from vasculature and exhibited low spatial intratumor heterogeneity. TAN-high LUSC had frequent PIK3CA mutations. TAN-high tumors harbored recently expanded and metastasis-seeding subclones and had a shorter disease-free survival independent of stage. These findings delineate genomic, immune, and physical barriers to immune surveillance and implicate neutrophil-rich TMEs in metastasis.
SIGNIFICANCE: This study provides novel insights into the spatial organization of the lung cancer TME in the context of tumor immunogenicity, tumor heterogeneity, and cancer evolution. Pairing the tumor evolutionary history with the spatially resolved TME suggests mechanistic hypotheses for tumor progression and metastasis with implications for patient outcome and treatment.
INTRODUCTION
The tumor microenvironment (TME) confers a selective pressure on the clonal evolution of lung tumors. Whether the TME promotes or suppresses tumor growth is linked to its spatial organization and cell phenotypes. Recently, highly multiplexed technologies such as imaging mass cytometry (IMC) have unveiled the complexities in the composition and structure of the TME across several cancer types (1-9). These studies have demonstrated the clinical relevance of in-depth spatial approaches, identifying multicellular organizations associated with patient outcomes, tumor phenotypes, and therapy response in lung adenocarcinoma (LUAD), breast cancer, and glioma.
TME spatial organization can, in turn, be modulated by somatic alterations incurred throughout tumor evolution. IMC studies in breast cancer have identified distinct spatial
TME structures associated with somatic driver mutations and histology-specific outcomes ( 2,4 ), demonstrating the value of such integrative analyses. We previously showed that increased immune infiltration, inferred from transcriptomic signatures, was associated with frequent cancer cell-intrinsic immuneescape mechanisms that impact neoantigen presentation, including loss of heterozygosity (LOH) of human leukocyte antigen (HLA) alleles, in non-small cell lung cancer (NSCLC; refs. 10, 11). These results suggested the selection of immune evasive tumor cell populations in a predatory microenvironment. However, spatially resolved information is required to further understand immune pressures through, for example, cell-to-cell interactions and physical barriers to immune surveillance that impact tumor evolution. NSCLC studies that pair spatial detail from high-dimensional imaging with genomics and transcriptomics in clinically well-defined cohorts representing the major
K.S.S. Enfield, E. Colliver, C. Lee, and A. Magness contributed equally to this article.
J. Downward, E. Sahai, and C. Swanton jointly supervised this article.
Here, we used multiregion IMC to comprehensively characterize TME composition and spatial organization in 198 tumor and normal regions from 81 treatment-naïve patients with NSCLC in the TRACERx 100 cohort (12). TRACERx [TRAcking Cancer Evolution through therapy (Rx); ClinicalTrials. gov: NCT01888601] is a prospective study of tumor evolution through multiregion tumor sampling in patients with earlystage resectable disease. Using paired IMC, pathology, wholeexome sequencing (WES), and RNA-sequencing data (13-15), we studied the link between TME organization, tumor immunogenicity, and evolutionary history. We investigated how the TME may be shaped by high neoantigen burden, intrinsic immuneescape mechanisms, and evolutionary patterns associated with poor outcomes. This work begins to unravel the complex TME relationships with NSCLC tumor evolution. By examining TME spatial heterogeneity, this study furthers the current knowledge of a critical open question-how to address TME heterogeneity and utilize the TME context for clinical applications.
RESULTS
Building an Atlas of the Early-Stage Non-Small Cell Lung Cancer Microenvironment
With the aim of understanding the role of the TME in tumor evolution, we performed an in-depth spatial and phenotypic analysis of the TME in early-stage (I-IIIA), treat-ment-naïve NSCLC. We characterized the diversity in cell phenotypes, recurrent spatial communities, and broader TME classes in the TRACERx 100 multiregion cohort (12). Using IMC, we profiled the in situ expression of 38 markers on tissue microarrays (TMA) of spatially separated tumor and adjacent normal lung samples acquired at surgical resection (Fig. 1A). The TME organization was analyzed using the pan-immune antibody panel targeting innate and adaptive immune cell types ( , 185 cores; Fig. 1B; Supplementary Table S1). Additional T-cell differentiation states and nonimmune stromal cells were interrogated using the T cells and stroma panel ( cores). The major histologic subtypes of NSCLC were represented in the cohort, including LUAD ( tumors, 76 cores, pan-immune panel), lung squamous cell carcinoma (LUSC; , 50 cores), and other NSCLC histologies (NSCLC-Other; cores) as well as adjacent normal lung samples ( cores). IMC data from multiple tumor cores were available for 41 of the tumors represented. Twelve patients only had IMC data available from adjacent normal lung cores. The majority of cores
were profiled with both IMC panels (168/198) and had paired WES and RNA sequencing (RNA-seq) data available (Supplementary Fig. S1A-S1C; Supplementary Table S2; Methods).
To comprehensively characterize the cell phenotypes in situ, deep learning-guided cell segmentation was performed and followed by single-cell phenotyping (Fig. 1C; Supplementary Fig. S2A-S2D). We identified 2.3 million cells per antibody panel from seven major immune cell types and 29 immune cell subtypes, in addition to epithelial, endothelial, and cells (Fig. 1C-E; Supplementary Fig. S2B; Supplementary Fig. S3A). Additional pathologist-guided labels were created using paired IMC and hematoxylin and eosin (H&E)-stained images to distinguish features unresolvable by marker expression alone. These pathologist labels further distinguished perivascular stroma and fibroblasts, alveolar macrophages, and tumor and nontumor epithelial cells, which were used to interrogate tumor cell-specific phenotypes and spatial metrics (Fig. 1C; Supplementary Fig. S2C and S2D). Cell phenotypes were quantified on the basis of marker positivity, examining, for example, hypoxia (CAIX), lactate metabolism (MCT4), proliferation (Ki-67), the exhausted terminally differentiated dysfunctional (TDT) T-cell state (CD39, CD57; ref. 16), and immune-checkpoint molecules (Fig. 1B and D; Methods).
Macrophages were the most prevalent major immune cell type in NSCLC cores (median 40% of immune cells, tumor cores; Fig. 1F; Supplementary Fig. S3B), in line with other studies (1), with macrophages comprising a greater proportion than CD163- macrophages ( vs. ; Supplementary Fig. S3C). Notably, B cells in LUAD and myeloid cells-other, predominantly comprising neutrophils, in LUSC made up >25% of immune cells in a subset of tumor cores (14/76 LUAD, 13/50 LUSC; Fig. 1F; Supplementary Fig. S3C). From the T cells and stroma panel, cells were the most abundant nonepithelial cell populations in tumor cores (median 16% of all cells; Supplementary Fig. S3D). Subtypes of CD4 and CD8 T cells were categorized as regulatory T cells (Treg), naïve, cytotoxic, memory, and exhausted populations (Supplementary Fig. S3E). Endothelial cells made up a greater proportion of total cells in adjacent normal cores than tumor cores ( vs. ), in accordance with the physiologic function of the lung in gas transfer through blood flow (Supplementary Fig. S3B and S3D).
To investigate the spatial context of the identified cell phenotypes, we quantified cell densities within two tissue compartments, tumor nest/epithelium, and stroma (Fig. 1F; Supplementary Fig. S2A). Additionally, we performed analysis of local cellular neighborhoods in NSCLC, which have recently been shown to correlate with clinical outcomes in LUAD (1), and revealed 10 recurrent geographical communities (C0-C9)
Figure 1. IMC workflow defines the single-cell spatial landscape of the NSCLC tumor microenvironment. A, TRACERx 100 IMC cohort. We developed and applied two IMC antibody panels, Pan-immune and T cells and stroma, to tissue microarrays (TMA) from clinical samples collected at surgical resection (created with BioRender.com). B, Targets of antibodies described in this study. Bold text indicates targets detected in both IMC panels. C, IMC data were acquired from stained TMAs and processed to identify single cells and their phenotypes. crops of IMC images representing the markers from B with corresponding cell types from the pan-immune panel, unless annotated with an asterisk for the T cells and stroma panel only. E, A heat map of the z-score normalized median intensities of markers from the pan-immune panel across the identified cell subtypes. F, Proportion of major immune cell types identified in the pan-immune IMC data set per TMA core, calculated over the total tissue area (illustrated as blue and gold domains), tumor/epithelial compartment (gold domain), or the stromal compartment (blue domain). In two normal cores, the epithelial cell signal reflected very thin cells, which were not resolved into an epithelial compartment. All data from these cores are represented by the stroma compartment. Cell types color legend applies to and , where asterisks denote cell types identified in T cells and stroma panel only. LUAD, lung adenocarcinoma; LUSC, lung squamous cell carcinoma; NSCLC, non-small cell lung cancer; other, other non-small cell lung cancer histologies; IMC, imaging mass cytometry.
of frequently colocalizing cells within tumor cores across histologic subtypes (Supplementary Fig. S3F and S3G; Methods).
We assessed the relationship of cell populations and communities with clinical variables (Supplementary Fig. S4AS4C; Methods). In both LUAD and LUSC, densities of the community C9:B cells and plasma cells and plasma cells, when tested separately, were associated with a high tumor mutational burden (TMB). High TMB was further associated with increased densities of macrophages and CD 4 Tem in LUAD and CD8-exhausted TDTs in LUSC, similar to previous observations (16). Among the significant associations, the C6:macrophages and cells community, as well as several cell subtypes that characterize this community, were enriched in current smokers compared with ex- and never-smokers in LUAD.
Together, we integrated spatial and phenotypic information from multiplexed imaging with pathology annotations to develop a framework for studying the TME composition and organization in NSCLC.
Immune Composition in Tumor Nests and Surrounding Stroma Reveals Four TME Classes in NSCLC
Three broad immune classes have been previously described for solid tumors through histologic examination of tumorinfiltrating lymphocytes (TIL) quantity and location within tumor sections: inflamed, immune-excluded, and cold (17). The TME subtypes and their spatial heterogeneity in NSCLC remain to be comprehensively characterized in association with genetic, molecular, and cellular mechanisms of immune escape.
To understand how TME organization is associated with immune escape and tumor evolution, we performed a broad classification based on the densities of major immune cell types and identified common TME architectures in NSCLC. We quantified the densities of major cell types of adaptive and innate immunity defined within the tumor nest and stroma tissue compartments. Through unsupervised hierarchical clustering, we observed four common TME classes defined across all histologic subtypes in NSCLC (Fig. 2A-C; Supplementary Fig. S5A-S5C). These TME classes were distinguished by differential cell densities of three broad immune cell populations-TILs ( cells and cells), macrophages , and neutrophils-within the tumor nest ( T ) or stroma (S) of one TME class compared with other TME classes and annotated accordingly as TS:TIL+MФ high, T:TIL+MФ excluded, TS:Immune low, and TS:Neutrophil high. For a small proportion of tumor cores in the cohort ( ), the TME class was labeled undefined (Supplementary Fig. S5A; Methods).
The TS:TIL+M$ high class, accounting for of NSCLC tumor cores ( LUAD, 13 LUSC, 5 NSCLC-Other cores), consisted of immunologically “hot” tumors characterized by high infiltration of TILs and M s in both the tumor nest and stroma region (TS; Fig. 2D). Most of the identified TIL and subtypes, ranging from naïve CD 8 T cells to CD 8 exhausted TDTs, were enriched in this class compared with other TME classes (Supplementary Fig. S5D).
Across all histologic subtypes, we observed a subset of tumor cores with low infiltration of TILs and M ps in the tumor nest and high infiltration of B cells, CD4 T cells, and a subset of myeloid cells excluding neutrophils and macrophages in the stroma (Fig. 2D). Because of the statistically lower infiltration of TILs and M s in the tumor nest (T), these cores were labeled excluded ( of NSCLC cores, LUAD, 12 LUSC, 1 NSCLC-other cores).
A smaller proportion of tumor cores ( ) had significantly lower TS infiltration of T cells and M s compared with those from other TME classes, termed TS:Immune low ( LUAD, 8 LUSC, 3 NSCLC-other cores).
Finally, we observed a distinct TME class, TS: Neutrophil high, in 19% of tumor cores ( LUAD, 15 LUSC, 1 NSCLCOther cores) with lower infiltration of TILs and in both the tumor nest and stroma and significant enrichment of neutrophils in the tumor nest or the stroma (TS) compared with tumor cores from other TME classes. Although the TME classes were defined for all histologic subtypes combined, LUSC cores were enriched for neutrophils in the tumor nest more frequently than LUAD cores (Supplementary Fig. S5D).
To assess the intratumor heterogeneity (ITH) of these TME classes, we estimated the probability of observing the same TME class across all cores of a tumor ( tumors, bootstrap sampling of two to four cores per tumor, Methods). The TS:Neutrophil high TME had the highest probability to be detected in all cores (0.5), followed by TS:Immune low (0.38), TS:TIL+MI high (0.3), and TS:TIL+MФ excluded (0.21).
Comparison by clinical variables showed that the TS:Immune low class was associated with low TMB and PD-L1 immunohistochemistry (IHC) tumor score in LUAD and LUSC (Fig. 2B) and tumors from never and ex-smokers in LUAD (Supplementary Fig. S5E). IHC PD-L1 tumor cell positivity was also absent (<1%) in TS:Neutrophil high LUSCs, whereas a positivity score of was significantly enriched with high LUADs and T:TIL+MФ excluded LUSCs compared with cores from other TME classes. In LUSC, the TS:TIL +M D high class was enriched in stage II and III tumors compared with stage I (Supplementary Fig. S5E). The tumor cores with a TS:Neutrophil high class in LUAD more frequently
Figure 2. Four TME classes in NSCLC defined by immune composition in tumor nests and surrounding stroma. A, Tumor cores were classified into four TME classes, derived by clustering immune cell densities in the tumor nest and stroma. Only LUAD ( cores, 35 tumors) and LUSC ( tumors) tumor cores are featured, and corresponding clinical annotations are displayed. Regional growth patterns are shown for LUAD: lepidic (low grade), acinar and papillary (mid-grade), solid and cribriform (high grade). B, TME classifications displayed separately for LUAD and LUSC. Numbers indicate the number of cores with a given TME class for each histology subtype. The barplot shows the total expressed neoantigen count for all predicted HLA alleles in the range 0-269 for LUAD and 23-160 for LUSC, colored by their clonal and subclonal status. Horizontal lines connect tumor cores from the same multiregion tumor ( tumors). The annotation bars display tumor genomic features and PD-L1 tumor cell (TC) staining (SP142 IHC) for the corresponding tumor cores. C, Composite images and cell type maps of representative examples for each TME class. Crop insets are in diameter. D, A heat map of T values derived from an LMEM of the major cell type density across TME classes, adjusted for histology subtype as a fixed effect and patient as a random effect. Significant relationships are indicated with an asterisk for . TIL, tumor-infiltrating lymphocyte; MФ, macrophage; LUAD, lung adenocarcinoma; LUSC, lung squamous cell carcinoma; NSCLC, non-small cell lung cancer; TME, tumor microenvironment; TMB, tumor mutation burden; muts/Mb, mutations per megabase; panCK, pancytokeratin; LMEM, linear mixed effects model.
had a high-grade growth pattern compared with low and midgrade patterns combined ( vs. , Fig. 2A). These results align with previous reports of TIL associations with tumor cell PD-L1 expression and TMB (18).
Multicellular Communities Associate with Neoantigen Burden and Intrinsic Immune Evasion
We sought to understand how the observed TME organization was related to neoantigen presentation and cancer cell-intrinsic mechanisms of immune evasion and identify potential tumor-extrinsic mediators of immune evasion. Using samples with paired IMC, WES, and RNA-seq data, we investigated the relationships of the spatially resolved cell subtypes, cellular communities, and TME classes with neoantigen burden and antigen presentation machinery (APM) defects.
We first correlated IMC-derived densities of cellular communities with the number of expressed neoantigens predicted to bind intact HLA alleles (Methods). We identified histology-specific correlations between spatial communities and neoantigen burden, correcting for multiregion sampling and patient smoking status. In LUAD, clonal neoantigen burden was associated with community C6:macrophages and cells (linear mixed-effects model, LME ), a community enriched in TS:TIL+M high TMEs and depleted in TS:Immune low TMEs (Fig. 3A-C). Community C6:macrophages and cells was characterized by increased densities of several CD4 and CD8 T-cell populations relative to other communities, including cytotoxic CD8 T cells and CD8 T resident memory (Trm) cells; however, enrichment of CD163 and CD163 CD206 macrophage populations distinguished C6:macrophages and cells from C2:T-cell enriched (Supplementary Fig. S3F). A minority of cell subtypes were significantly associated with clonal neoantigen burden when considered independently of community localization (Supplementary Fig. S6A), suggesting the local niches in which they reside are relevant to understanding the antitumor immune response.
In LUSC, the burden of expressed clonal and total neoantigens predicted to bind intact HLA alleles was correlated with C9:B cells and plasma cells (LME ), a community enriched in T:TIL+MФ excluded TMEs and depleted in TS:Neutrophil high TMEs (Fig. 3A, B, and D). Both B cells and plasma cells were
enriched in community cells and plasma cells, but only stroma-localized plasma cell densities were significantly correlated with clonal and total neoantigen burden in LUSC (Supplementary Figs. S3F and S6A). This spatial analysis reveals that plasma cells and the community in which they reside are associated not only with high TMB but also with the burden of clonal and total neoantigens in early-stage LUSC.
Of note, the T-cell-enriched community, which harbored CD4 T cells, CD8 T cells, and B cells, was only associated with the burden of clonal neoantigens in LUAD and subclonal neoantigens in LUSC when HLA LOH was not considered (HLA LOH-uncorrected, LME ; Supplementary Fig. S6B). The T-cell-enriched community was also significantly correlated with stromal and tumor-infiltrating Tregs in LUSC, which may suggest hindered antitumor immunity in regions with a high burden of subclonal neoantigens (HLA LOH-uncorrected, LME , LME ; Supplementary Fig. S6C). Communities associated with HLA LOHuncorrected neoantigen burden, including the T-cell enriched community, were enriched in high TMEs, adding further resolution on cell organization in inflamed environments (LME ; Fig. 3B; Supplementary Fig. S6B).
We next sought to establish the spatial immune context associated with HLA LOH and other somatic disruptions to HLA class I APM genes, hereafter referred to as class I/APM disruption (Methods). In LUAD, tumor regions with class I/APM disruption had increased densities of communities C6:macrophages and cells and C7:macrophage enriched (LME , LME ; Supplementary Fig. S6D). In LUSC, class I/APM disruption was observed more frequently in TS:TIL+MФ high tumor cores compared with other TME classes ( vs. cores with available HLA data; Supplementary Fig. S6E).
These results uncover spatial niches of immune cells in high neoantigen burden tumors, including the spatial context of effector CD8 T-cell populations. Consideration of HLA LOH identified different spatial communities that are further affected by neoantigen clonality and NSCLC histology subtype.
Peritumoral SMA Fibroblasts Spatially Separate CD8 T Cells and Tumor Cells in Immune-Low TMEs
The exclusion of T cells from the tumor nest has been associated with the limited efficacy of immunotherapies. Previous
Figure 3. Spatial features associated with neoantigen burden and immune low TMEs. A, Correlation of densities of spatial cellular communities and the burden of expressed clonal, subclonal and total neoantigens predicted to bind intact HLA alleles, after accounting for HLA LOH, in LUAD ( , 51 tumor cores) and LUSC ( tumor cores). Bar plot shows the median neoantigen burden with whiskers extending to the 75th percentile. B, Comparison of the densities of spatial cellular communities in a given TME class compared with all other TME classes combined. LUAD: TS:TIL+M high cores, T:TIL+M excluded cores, TS:Immune low cores, TS:Neutrophil high cores. LUSC: TS:TIL + M high cores, T:TIL+M excluded cores, TS:Immune low cores, TS: Neutrophil high cores. Box sizes in and correspond to T values. , Community and cell subtype maps from a LUAD tumor core with a high burden of expressed clonal neoantigens and high densities of C2:T-cell enriched and C6:macrophage and cells communities. D, Community and cell subtype maps from a LUSC tumor core with a high burden of expressed clonal neoantigens and high densities of community C9:B cells and plasma cells. Single cells in C and D are colored by community according to the color legend below D or cell subtype as indicated. Scale bars, . Middle, an enlargement of the area highlighted with a white box in the left plot with matched cell subtypes shown in the right plot. E, Schematic of SMA fibroblast barrier score calculation. The barrier score measures the degree of spatial interpositioning of tumor cell-adjacent SMA fibroblasts between CD8 T cells and their nearest tumor cell(s) in a tissue core. In the lower half of the schematic, three nearest tumor cells are defined for the green CD8 T cell, all six hops away. Tumor cell-adjacent SMA fibroblasts are found on two of these three paths from CD8 T-cell to tumor cell, resulting in a barrier score of . F, Boxplot comparing the SMA + fibroblast barrier scores in a given TME class compared with all other TME classes combined in LUAD ( tumor cores) and LUSC ( tumor cores). Boxplots show median and lower and upper quartile values, and whiskers extend up to IQR above and below the quartiles. G, Representative IMC images and cell type maps from LUAD and LUSC tumor cores classified as :Immune low with a high barrier score. Scale bars, values in , and and T values in and were calculated in a linear mixed-effects model with patient as a random effect, using smoking status as a fixed effect in with a value considered significant. LUAD, lung adenocarcinoma; LUSC, lung squamous cell carcinoma; panCK, pancytokeratin; TS, tumor/stroma; T, tumor; TIL, tumor-infiltrating lymphocytes; MФ, macrophage; *, P<0.05; **, P<0.01.
work in NSCLC has found that dense fibrous stroma surrounding tumor islets in human lung tumor slices can limit T-cell ingress, likely mediated by distinct collagen-producing cancerassociated fibroblast (CAF) subsets and that the geometrical complexity of the tumor-stroma interface has been shown to be increased with overall low compared with high lymphocytic infiltrate (21). Both of these studies highlight a potential role for CAFs in T-cell exclusion in NSCLC. However, the diversity of cell subtypes interrogated in these works was limited.
Building on this, we harnessed the SMA marker on our T cells and stroma antibody panel and explored whether immune TME classes were associated with distinct fibroblast arrangements, which may represent potential barriers to tumor-immune engagement. Using a barrier metric derived from constructing a cellular spatial graph for each tumor core (Fig. 3E, Methods), we found that TS:Immune low TMEs were characterized by a higher degree of physical occlusion of CD8 T cells from tumor cells by tumor-adjacent fibroblasts than other TMEs combined in both LUAD and LUSC (LME , respectively, Fig. 3F and G). Barrier score distributions across TME classes did not reflect overall densities of fibroblasts in tumor cores (Supplementary Fig. S6F).
However, notably, fibroblast barriers were insufficient to explain the lack of immune cell infiltration into tumor nests in the T:TIL+MФ excluded TME class in LUAD or LUSC, although high barrier scores were noted in individual cases (Fig. 3F). Nevertheless, cytotoxic CD8 T cells and leukocytes-other had significant avoiding relationships with tumor cells in T:TIL+MФ excluded TMEs compared with other TME classes in LUAD and LUSC, respectively (Supplementary Fig. S6G).
Collectively, these results suggest that peritumoral fibroblasts may represent a feature of early-stage NSCLC TMEs with overall low levels of immune infiltration and a putative physical barrier to CD8 T-cell and tumor cell engagement.
Tumors Infiltrated with Neutrophils and Sparse T Cells Are Metabolically Rewired and Distant from Vasculature
Immune classification revealed a distinct TME class with high neutrophil cell densities and sparse TIL infiltration in the tumor nest and stroma, TS:Neutrophil high, which was detected in at least one core in of NSCLCs ( tumors with defined TME). Studies of NSCLC showing a neutrophil gene signature as the strongest immune predictor
of mortality (22) and high neutrophil content inversely correlating with T -cell infiltration (23) led us to investigate a potential tumor-promoting role of this TME class. Of note, neutrophil infiltration levels in LUSC were higher than in LUAD tumor cores by a factor of two (median of 752 cells/ compared with 343 cells , respectively); therefore, the TS:Neutrophil high TME class was examined separately and compared between the major histologic subtypes.
We assessed signaling pathways that were differentially regulated in this TME class, using paired TRACERx 100 RNA-seq data ( tumors, 38 regions). In LUSC, overrepresentation analysis of gene ontology (GO) biological processes showed upregulation of several processes, including protein kinase B ( PKB ) signaling, angiogenesis, and transcriptional programs associated with wound healing and myeloid leukocyte migration in TS:Neutrophil high tumor cores relative to cores from other TME classes (FDR < 0.01, Fig. 4A; Supplementary Fig. S7A). Additionally, we identified hallmark gene sets enriched in TS:Neutrophil high, which included epithelial-mesenchymal transition (EMT) and hypoxia (Fig. 4B). Although several metabolic processes including oxidative phosphorylation (OXPHOS) were significantly downregulated, glycolysis was upregulated in TS:Neutrophil high cores compared with those with other TME classes (FDR = 3e-06; Fig. 4C), suggesting metabolic reprogramming of the tumor cells in this class.
Tumor cells can increase glycolytic activity and upregulate the lactate transporter, MCT4, to shuttle excess lactate, a product of glycolysis, into the microenvironment (26). Therefore, we compared the levels of MCT4 expression on tumor cells and observed a greater proportion in TS: Neutrophil high than other TME classes in LUSC (LME ; Fig. 4D). MCT4 expression by nontumor epithelial cells was negligible (Supplementary Fig. S7B). Therefore, LUSC tumors with TS:Neutrophil high TMEs downregulated the OXPHOS transcriptional program, while increasing MCT4 protein expression, likely leading to increased glycolytic activity and lactate accumulation in the TME.
Nutrient-restrictive and hypoxic conditions can drive cancer cells to switch to substitute energy sources (27). We, therefore, compared the presence of CAIX, a hypoxia-induced enzyme on tumor cells, and found that the proportion of tumor cells in the TS:Neutrophil high TME class was not significantly higher than other TME classes (Supplementary Fig. S7C). However, the proportion of MCT4 tumor cells strongly correlated with the proportion of CAIX tumor cells in LUSC in
Figure 4. Neutrophil infiltration in LUSC is associated with distinct metabolic and immunosuppressive phenotypes. A, Gene Ontology (GO) biological processes enriched among upregulated genes in the TS:Neutrophil high TME class ( cores) compared with other TME classes combined ( cores) in LUSC (FDR < 0.01, gene ratio > 0.05). B, GSEA of hallmark gene sets compared between tumor cores from the Tumor/Stroma:Neutrophil high TME class and other TME classes combined, using the t-statistic derived from the limma-voom model on TMM-normalized gene expression. Significantly enriched pathways were colored by type of pathway (FDR < 0.05). C, Normalized enrichment score derived from single-sample GSEA visualized for TS:Neutrophil high and cores from other TME classes. The value is derived from GSEA of LUSC as shown in and adjusted for other hallmark pathways using the Benjamini-Hochberg method. D, Proportion of tumor cells assigned MCT4+ in TS:Neutrophil high tumor cores compared with tumor cores from other TME classes combined in LUSC. E, Spearman correlation coefficient and value comparing the proportion of MCT4 and CAIX tumor cells in TS:Neutrophil high LUSC TMEs. F, Median distance between LUSC tumor cells to their nearest endothelial cell per core in TS:Neutrophil high TME class compared with all other TME classes combined. G, Single-channel images and composite image alongside cell type map displaying tumor cells, neutrophils (MPO, yellow), endothelial cells (CD31, magenta), and regions of hypoxia (CAIX, cyan) and MCT4 (green) expression. Boxplots show median and lower and upper quartile values, and whiskers extend up to IQR above and below the quartiles. values for and were calculated in a linear mixedeffects model with patient as the random-effect covariate. LUSC, lung squamous cell carcinoma; TS, tumor/stroma; FDR, false discovery rate; TMM, trimmed mean of M-values; panCK, pancytokeratin; *, P < 0.05; **, P < 0.01; ***, P < 0.001.
the TS:Neutrophil high TME class ( , Fig. 4E). We evaluated the proximity to vasculature as the median distance between each tumor cell to its nearest endothelial cell and found a significantly greater distance in the TS:Neutrophil high class compared with other classes in LUSC (Fig. 4F and G). The tumor proliferation levels assessed as the proportion of Ki-67+ tumor cells were lower in TS:Neutrophil high relative to other TME classes in LUSC (Supplementary Fig. S7D). These results suggest that the increase in glycolytic activity in this TME class is associated with a decrease in oxygen supply in tumors at a larger distance to vasculature.
Restricted vascular access consistent with a larger distance between tumor and endothelial cells can result in tumor necrosis. The presence of necrosis, as evaluated by histopathologic review of paired IMC and H&E images (Methods), was frequently detected in TS:Immune low ( of cores) and TS:Neutrophil high (60%) TMEs in LUSC (23%-28% other TMEs; Supplementary Fig. S7E). Notably, the presence of necrosis alone was not associated with increased tumorendothelial cell distance nor fraction of MCT4 tumor cells (LME n.s.).
The TS:Neutrophil high class in LUAD was also characterized by a larger distance of tumor cells from endothelial cells than in other TME classes ( , LME model; Supplementary Fig. S7F) and a higher frequency of necrosis in of cores compared with to in other TMEs (chi-squared test ; Supplementary Fig. S7G). As observed for LUSC, gene set enrichment analysis (GSEA) of LUAD also showed upregulation of the hallmark gene sets EMT and KRAS signaling, and several metabolic processes including OXPHOS were downregulated ( tumors, 49 regions; Supplementary Fig. S7H). However, the glycolysis hallmark gene set was depleted, and the proportion of and tumor cells were not significantly different in the TS:Neutrophil high TME class compared with other TME classes in LUAD (Supplementary Fig. S7I-S7J). Overall, LUAD tumor cores had a significantly lower proportion of CAIX tumor cells compared with LUSC (Supplementary Fig. S7K). These results suggest different metabolic and hypoxic environmental cues in the TS:Neutrophil high TME class between LUAD and LUSC.
In both LUAD and LUSC, the TS:Neutrophil high class had sparse TIL infiltration (Supplementary Fig. S5D). Spatial cell-to-cell interaction analyses revealed an avoiding relationship between neutrophils and cytotoxic CD8 T cells in this TME class more frequently than in other TME classes in LUAD and LUSC. No other significant interactions between neutrophils
and any of the identified cell subtypes were observed (Supplementary Fig. S7L), suggesting immunosuppression in the proximity of neutrophils in both histologic subtypes.
In summary, we identified a distinct TME class defined by predominant infiltration of neutrophils, increased distance from tumor to vasculature, upregulation of EMT, and metabolic rewiring of cancer cells in both LUAD and LUSC. Although the metabolic cues may differ between LUAD and LUSC, TS:Neutrophil high represented an immunosuppressed TME with sparse TIL infiltration in both histologic subtypes.
Gain-of-Function Mutations in Phosphoinositide 3-Kinase (PI3K) Signaling Implicated in Neutrophil Recruitment in LUSC Tumors
Cancer cell-intrinsic signaling can regulate tumor metabolism, immunosuppression, and angiogenesis in NSCLC (28, 29). Here, we set out to dissect genomic aberrations enriched in tumors with a TS:Neutrophil high TME that potentially enhance fitness, modulate inflammation, or support glycolytic activity. Therefore, we examined whether somatic alterations in components of the transcriptionally upregulated pathways, such as KRAS and PKB signaling (Fig. 4A and B; Supplementary Fig. S7H), were frequently enriched in tumor cores with a TS:Neutrophil high TME.
To systematically examine driver mutations and copy-number changes, we expanded our TRACERx 100 cohort to TRACERx 421 (14). We used pathologist-derived tumor-associated neutrophil (TAN) scoring from H&E images of paired regional blocks of the study TMAs (region-level TAN score) and tumormatched diagnostic blocks (tumor-level TAN score). The TAN scoring approach evaluated the TANs in the tumor nest and stroma adapting a standardized method used for TIL quantification (Fig. 5A; Methods; ref. 30). Tumor cores were stratified into TAN-high and TAN-low using the TS:Neutrophil high TME as a reference for high TAN scores (Methods). H&E-derived TAN scores recapitulated the presence of neutrophils derived from paired IMC in LUAD and LUSC (Fig. 5B; Supplementary Fig. S8A, Spearman correlation ). The probability of detecting a TAN-high TME across all sampled regions was 0.5 in TAN-high tumors (Methods), equal to the probability estimated for the TS:Neutrophil high TME class. Notably, TAN-high tumor regions were enriched for a TAN transcriptional signature (31) and had a higher proportion of IMC-derived PD-L1 neutrophils and MCT4 tumor cells compared with TAN-low LUSC tumors (Supplementary Fig. S8B-S8D).
Figure 5. Neutrophil-rich TMEs are associated with activating mutations in PI3K and tumor-intrinsic CXCL8 upregulation. A, Representative crops of tumor-level H&E images with low TAN scores in the tumor nest and stroma (left) and high TAN scores in the tumor nest and stroma (right), inferred as the proportion of the neutrophil area in tumor/stroma from the total tumor/stroma tissue area. Scale bar, magnification. B, Neutrophil cell density as defined by IMC compared between region-level TAN-low versus TAN-high tumor cores based on H&E scores in LUAD and LUSC. C and D, Proportion of tumor cores with (mut) and without (wt) PIK3CA driver mutations compared between TS: Neutrophil high versus other TME classes combined (C) and region-level TAN-High versus TAN-Low cores (D) in LUSC. P values were derived from a Chi-square test. E, Neutrophil cell density by PIK3CA mutation status, points colored by TME class assignment. F and G, TMM expression values for CXCL8 compared by PIK3CA mutation status (F) and between TME classes (G) in LUSC. H, Immunofluorescence images of CXCL8 RNAscope multiplexed with antibody staining of pancytokeratin (panCK) or MPO in an LUSC tumor region with a TS:Neutrophil high TME and subclonal PIK3CA mutation, and an LUSC patient with multiple TAN-high tumor regions and a clonal PIK3CA mutation. panCK and MPO examples for CRUK0075:R2 illustrate the same region of interest, whereas different regions of interest are shown for CRUK0468:R6. Scale bar, . values for and were calculated in a linear mixed-effects model with patient as the random-effect covariate. values in and were derived from a limma-voom differential expression analysis correcting for multiple regions per tumor. , lung adenocarcinoma; LUSC, lung squamous cell carcinoma; TMM, trimmed mean of M-values; TS, tumor/stroma; TIL, tumor-infiltrating lymphocyte; M , macrophage; TAN, tumor-associated neutrophils; H&E, hematoxylin and eosin; mt, mutant; wt, wild-type.
Using matched genomic profiles, we assessed whether activating driver mutations in components of the PKB/PI3KAKT signaling pathway were enriched in the TS:Neutrophil high TME class of LUSC. We found a higher frequency of gain-offunction PIK3CA driver mutations within the TS:Neutrophil high TME class compared with other TMEs ( vs. cores; Fig. 5C). We further validated this observation in the extended TRACERx 421 cohort using TAN scores ( cores, 120 LUSC tumors). Driver PIK3CA mutations were significantly enriched in TAN-high tumors compared with TAN-low tumors ( vs. tumors, tumor level) and detected in of TAN-high compared with of TAN-low tumor regions (Fig. 5D). Copy-number analysis using GISTIC2.0 revealed no evidence of copy-number amplifications and deletions in driver and immune evasion genes enriched only in the TAN-high compared with TAN-low tumor regions (Supplementary Fig. S8E).
Nearly all PIK3CA mutations were of clonal origin in LUSC ( regions), indicating that these mutations were detected in all tumor cores. Tumors with a clonal PIK3CA mutation had a twice higher probability of having a TANhigh TME compared with PIK3CA wild-type tumors ( 0.47 vs. 0.25 , adjusted for the number of sampled regions). Given that tumor cores with a PIK3CA mutation had significantly higher neutrophil cell densities than PIK3CA wild-type cores in LUSC (LME , Fig. 5E), we examined neutrophilattracting chemokines as defined with the GO term neutrophil chemotaxis (Methods). We compared their expression between tumor cores with a TS:Neutrophil high TME and those with other TMEs as well as between PIK3CA mutant and PIK3CA wild-type tumor regions in the expanded TRACERx 421 cohort. The only chemokine unregulated in both comparisons was IL-8, encoded by the gene CXCL8 (Supplementary Fig. S9A). CXCL8 was more highly expressed in PIK3CA mutant vs. PIK3CA wild-type tumor cores ( regions, Fig. 5F). Higher expression levels of CXCL8 in PIK3CA mutant versus PIK3CA wild-type LUSC was validated in The Cancer Genome Atlas (TCGA) data set ( ; Supplementary Fig. S9B). CXCL8 showed the highest expression in the TS:Neutrophil high TME compared with other TMEs ( fold change; Fig. 5G) and correlated with neutrophil cell density ( e-05; Supplementary Fig. S9C). We performed CXCL8 RNA in situ hybridization to determine whether tumor cells expressed the chemokine in four PIK3CA mutant cores and two PIK3CA wild-type cores with TS:Neutrophil high TMEs or high TAN scores. In addition to CXCL8 expression by neutrophils, as indicated by MPO costaining, CXCL8 expression was detected predominantly within tumor cells, as indicated by panCK costaining, in LUSC cores with TS:Neutrophil high or TAN-high TMEs independently of the PIK3CA mutation status (Fig. 5H; Supplementary Fig. S9D). CXCL8 expression correlated positively with glycolytic markers in TRACERx 100 and TCGA LUSC cohorts (Supplementary Fig. S9E).
Following the observed upregulation of KRAS signaling from GSEA, we also assessed whether activating mutations in KRAS were enriched in cores with TS:Neutrophil high TMEs. KRAS mutations, which were absent in LUSC cores, were found in of LUAD cores with this TME class and of the : high class compared with to in other
classes (n.s., Supplementary Fig. S9F), suggesting that any potential immunomodulatory effects of KRAS driver mutations observed in mouse models in LUAD (32) are not limited to the TS:Neutrophil high TME.
In summary, somatic driver mutations in PIK3CA in LUSC and transcriptional activation of KRAS signaling in LUAD and LUSC were associated with neutrophil infiltration.
TANs Infiltrate Regions with Expanded Tumor Subclones and Predict Poor Clinical Outcome in NSCLC
We set out to assess the propensity of tumors with different TMEs to evolve, expand, and metastasize. Given the protumor features associated with neutrophil-rich TMEs and previously reported implications of neutrophils in metastasis in animal models (33-35), we investigated whether neutrophil infiltration was linked to the risk of disease relapse and metastasis in NSCLC. Using clonal analysis of TRACERx primary tumor regions and paired metastases, we identified the clones that seeded metastases (15). We compared neutrophil cell densities using IMC data between primary tumors with metastasis-seeding clones detectable at the time of surgery or during follow-up (metastasizing tumors) to tumors from patients who remained metastasis-free and recurrencefree with a minimum of three years of follow-up (discovery cohort, LUAD and LUSC patients; Supplementary Fig. S10A). We observed a significant increase in neutrophil cell densities in the metastasizing tumors compared with tumors from metastasis- and recurrence-free patients, in LUAD ( ) and LUSC ( one-tailed test; Fig. 6A).
We endeavored to confirm this observation in a separate validation cohort within TRACERx using the H&E-derived TAN scoring ( patients; Supplementary Fig. S10A; Supplementary Table S3). We hypothesized that primary NSCLCs with a neutrophil-rich TME more frequently seeded metastases and, thus, had a higher risk of relapse after surgical removal of the primary tumor. Univariate diseasefree survival (DFS) analysis showed a significant association between high tumor-level TAN scores and poorer DFS in NSCLC ( ), with a median DFS of 21 months for high compared with longer than 70 months for low TAN score (Fig. 6B). This prognostic association was independent of the cutoff used to define TAN scores and was maintained for both the tumor-level and region-level TAN scores (Supplementary Fig. S10B and S10C; Methods). In addition, high tumor-level TAN score was also strongly associated with shorter DFS in LUAD (HR ) and LUSC (HR = 2.13, ), separately (Supplementary Fig. S10C).
Given the higher frequency of necrosis in the neutrophil infiltrated tumors, which has been previously associated with advanced stage and worse prognosis in NSCLC (36), we next evaluated whether the TAN association with outcome was confounded by previously reported predictors of poor DFS. In a multivariable model of DFS using TAN score, necrosis, age, sex, adjuvant treatment, pack years, histology subtype, and TNM stage, TAN score was an independent prognostic factor ( ), alongside necrosis status ( ), age ( ), and stage ( ) in NSCLC (Fig. 6C; Supplementary Fig. S10D and S10E).
Figure 6. (Continued) F, Example phylogenetic tree depicting a stage IIIA LUSC case with a clonal PIK3CA mutation, high TAN scores, and recent subclonal expansion, including in a region (R5) that seeded a lymph node (LN) metastasis (FLN, FFPE LN). The metastasis-seeding lineage is highlighted in orange. Tumor-level TAN scores and regional subclonal expansion (SubExp) scores are reported for primary tumor regions. The reported TAN score represents the maximum of the tumor nest and stroma scores. Each cluster in the phylogenetic tree is assigned a color that is also represented in the region clone maps. The clone maps illustrate the prevalence of each clone within a region. G, IMC images shown for R5 and the LN metastasis. Scale bar, . , Summary schematic of the link between tumors with a neutrophil enriched microenvironment with tumor progression. ; *, ; **, ; ***, P<0.001; LUAD, lung adenocarcinoma; LUSC, lung squamous cell carcinoma; ITH, intratumor heterogeneity.
To confirm the prognostic association between the TAN scoring approach and DFS, we validated the relationship in a second independent cohort using an automated approach for granulocyte quantification. We applied the deep-learning model PathExplore (37) for cell type and tissue classification on wholeslide images from TCGA. Similarly to the TAN score, tumors were assigned a high score when the granulocyte proportion in the tumor nest or stroma was higher than the respective tumor nest- or stroma cutoff (Supplementary Fig. S11A). As the high TAN score cutoffs derived from the TRACERx cohort were not transferable to the automated scores on the TCGA cohort (Methods), the association with DFS was evaluated
across a range of cutoffs based on the tumor nest and stroma proportions. The pattern of high hazard ratios (increased risk of recurrence or death) was consistently seen with increasing granulocyte proportions in the tumor nest or stroma in multivariable analyses of DFS using age, sex, adjuvant treatment, pack years, histology subtype, and TNM stage ( patients with NSCLC, for which automated scores and information on factors used in the multivariable Cox regression model was available; Supplementary Fig. S11B), maintaining a statistical significance across all intervals above tumor nest proportion and stromal proportion ( value for the automated score in the multivariable model ).
Finally, given the association of TAN score with poor outcome, we investigated whether neutrophil infiltrate was associated with evolutionary patterns previously shown to associate with shorter DFS in TRACERx (14). Specifically, we investigated a genomic measure of recent subclonal expansion in primary tumors, defined as the size of the largest subclone terminal to the phylogenetic tree of a tumor region. TAN-high tumor regions had significantly higher subclonal expansion scores than TAN-low tumor regions in LUAD and LUSC ( ; Fig. 6D), suggesting that neutrophil-rich TMEs have larger expansions of recent subclones compared with other tumor regions and are associated with dynamics of tumor evolution implicated in metastasis and poor outcome. The presence of PIK3CA mutations was also associated with a higher recent subclonal expansion score compared with PIK3CA wild-type tumors in LUSC ( ; Supplementary Fig. S11C).
The intratumoral heterogeneity of prognostic factors, potential therapeutic targets, or stratification biomarkers is of paramount importance for their clinical applicability and optimal therapy response. Using deep learning-based approaches, a recent LUAD study identified TME features in LUAD cores that collectively predict poor prognosis (1). The model, however, relied on features that had high spatial heterogeneity in NSCLC (Fig. 6E), underscoring the importance of accounting for sampling bias in the design of clinically actionable assays. Neutrophils, their spatial community, and TME class had the lowest spatial heterogeneity, together with plasma cells, compared with other immune cell types and spatial communities (Fig. 6E).
Patient CRUK0468 diagnosed with stage IIIA LUSC, for example, harbors a TAN-high tumor with low spatial heterogeneity. All of the eight tumor regions sampled from the primary tumor had high neutrophil infiltrate with TAN-high score and clonal PIK3CA mutation. Seven regions showed a higher recent subclonal expansion score than the cohort median, including the region that seeded a lymph node metastasis, R5 (Fig. 6F). The seeding region, R5, and the seeded lymph node metastasis shared TME features: high infiltration of neutrophils and expression along the tumor nest edges, identified with IMC in the primary tumor and the metastasis region (Fig. 6G).
Based on these results, we propose LUADs and LUSCs with high TAN infiltration harbor recently expanded subclones and can be enriched for specific driver mutations acquired at the earliest stages of evolution, such as PIK3CA in LUSC (Fig. 6H). Tumors with high TAN infiltration had low spatial heterogeneity and a high risk of metastasis or relapse in NSCLC independent of stage, necrosis, and other clinical variables.
DISCUSSION
In this integrative study of the TME in NSCLC, we used high-dimensional tissue imaging and paired sequencing to reveal cancer-intrinsic and -extrinsic features underlying TME composition and spatial organization. We identified neoantigen-directed immune dynamics, fibroblast organization, driver mutations, and immune phenotypes as potential determinants of TME architecture. These TME features,
common across NSCLC or specific to histologic subtypes, reveal potential therapeutic vulnerabilities and challenges. We present a ranking of the spatial heterogeneity of these TME features, providing a reference for studies seeking to identify low spatial heterogeneity targets. The unique structure of the TRACERx study and its depth of clinical and genomic information enabled us to link the TME to subclonal expansion, the seeding of metastases, and clinical outcome.
We defined four distinct, pan-histology TME classes in earlystage treatment-naïve NSCLC, building on earlier classifications based on the spatial distribution of TILs alone (17) and compositional clustering from gene expression (38-40). We described 10 multicellular communities present across histologic subtypes of NSCLC, confirming those defined in a recent IMC study of LUAD, despite differences in the resolved cell subtypes and the histologic composition of each data set (1). TME classes captured intratumoral immune infiltration or exclusion from the tumor nest, whereas spatial communities revealed multicellular clusters that may represent functional niches.
One of the unifying features of LUAD and LUSC tumor cores was the enhanced spatial interpositioning of peritumoral fibroblasts between CD 8 T cells and tumor cells in TS:Immune low TMEs. We propose that stromal barriers represent a potential physical barrier to tumor-T-cell engagement and may affect T-cell entry into tumors. These results support previous literature implicating CAFs in immunosuppression in different cancer types through both physical exclusion of immune cells from tumor nests and secretion of cytokines (20, 41, 42). However, the barrier was insufficient to explain the immune-excluded TMEs captured in this study. In line with this finding, Li and colleagues found, using in silico modeling, that chemorepellent expression rather than fibrotic barriers best described short-range T-cell exclusion from tumor islets in triple-negative breast cancer (43). Future work should seek to improve segmentation and resolution of CAF subtypes within and beyond fibroblasts, as different CAF subtypes have recently been shown to have different prognostic power in treatmentnaïve primary NSCLC (8) and to be differentially localized in the NSCLC TME (20).
Clonal neoantigen burden has been associated with improved responses to CPI (44, 45), warranting exploration of TME structures that may form in response to a high burden of clonal neoantigens. Here, we delineate spatial multicellular niches that increase in prevalence with clonal neoantigen burden and demonstrate that their composition varies depending on the clonality of expressed neoantigens, the LOH of the presenting HLA allele and the histologic subtype. In LUAD, a multicellular niche of macrophages and T cells may form in response to a high clonal neoantigen burden and influence the selection of cancer cell-intrinsic disruptions to MHC class I antigen presentation. Although this community harbored cytotoxic and resident memory CD8 T-cell populations, interactions between macrophages and CD8 T cells can inhibit T-cell motility and promote exhaustion (46, 47). Furthermore, exposure to clonal neoantigens has been associated with increased T-cell dysfunction in this data set (16). high LUAD TMEs harbored enrichment of this macrophage and T-cell community, which adds spatial
resolution to previous associations between inflamed tumor regions and intrinsic immune escape (10). This underscores the need to characterize macrophage subsets in the proximity of T cells and how these can be targeted therapeutically to support a tumor-specific effector response directed against clonal neoantigens (48).
Plasma cells and their corresponding community were correlated with not only clonal but also total neoantigen burden in LUSC, as well as high TMB ( mutations/ Mb ) in both LUAD and LUSC. These findings link several features associated with improved CPI response (44, 45, 49-52). Few papers have previously identified links between these cancer cellintrinsic and -extrinsic features, reporting no association in studies of LUAD alone (53-55). The plasma cell community identified in TRACERx may have formed independently of tertiary lymphoid structures (TLS), as we did not identify TLS in the regional blocks from which TMA cores were derived (Methods). This indicates that the tumor-infiltrating plasma cells may have derived from the tumor-draining lymph node or that TLS were not captured in the tissue analyzed. These associations underscore the importance of dissecting antibody responses to neoantigens as well as deregulated selfantigens (53) and their impact on CPI responses.
This work further revealed that high infiltration of neutrophils was associated with metastasizing tumors and shorter DFS in NSCLC. Although the peripheral neutrophil-to-lymphocyte ratio has been linked to adverse outcomes in NSCLC (56), reports on the prognostic impact of local, intratumoral neutrophils have been conflicting. Among immune cells, neutrophil transcriptional signatures have been shown as the strongest predictor of poor prognosis in NSCLC (22). However, a variable association of intratumoral neutrophils with clinical outcomes has been reported depending on the histologic subtype (57), neutrophil location (58), and their phenotype (1). Here, we developed and validated a TAN scoring approach from routinely collected H&Es that represent TS:Neutrophil high TMEs by equally weighting the proportion of neutrophils in the tumor nest or stroma. In both LUAD and LUSC, this clinically accessible TAN score is a robust prognostic factor independent of stage and other clinical variables in two independent cohorts.
TAN-high tumors also displayed low spatial heterogeneity, a feature that is essential for overcoming sampling bias. We observed high spatial heterogeneity of TME features previously used to predict prognosis in LUAD with a deeplearning approach, which failed to maintain the level of prediction accuracy when the number of lineage markers was reduced (1). Spatial heterogeneity of cell types used in unsupervised deep-learning models may represent an obstacle to the translation of deep-learning approaches to clinically accessible assays. The low spatial heterogeneity observed for neutrophils and the spatial structures they formed support the translational potential of the proposed TAN scoring approach.
The potential mechanisms behind the prognostic association of TANs remain to be defined. Mounting evidence depicts neutrophils as highly plastic and adaptable to the tissue context (59). Therefore, studying the spatial setting of neutrophils is fundamental to determining the environmental
cues that modulate antitumor and protumor phenotypes. Neutrophils can exert protumorigenic features through promotion of extracellular matrix degradation, EMT, angiogenesis, immunosuppression, and metastasis ( ), all of which were associated with the TS:Neutrophil high TME class in at least one of LUAD or LUSC. Upregulation of EMT transcriptional programs in tumor cells neighboring neutrophil clusters was also observed in a recent single-cell transcriptomics study (62). In addition, tumor cores with TS:Neutrophil high TMEs in LUAD and LUSC had altered metabolic cancer cell states. However, these metabolic states and the hypoxic conditions in this class differed between LUAD and LUSC, in line with previous reports on metabolic differences between the two histologic subtypes (63). The upregulation of MCT4 and CAIX expression in LUSC suggests that hypoxia or lactate efflux may contribute to the immunosuppressed phenotype in this class, for example, through the promotion of PD-L1 expression and T-cell anergy in settings of inflammation (63, 64), consistent with the increased frequency of PD-L1 + neutrophils.
In this study, we showed that TANs were enriched in tumor regions with recent expansions of tumor subclones, revealing a link between the TME and the evolutionary history of the tumor in LUAD and LUSC. This association was independent of the presence of necrotic areas and proportions of MCT4 and CAIX tumor cells in LUAD and LUSC, implicating neutrophils as indicators or promoters of recurrence and metastasis (64). Although neutrophils have been described as the mediators of indirect subclonal cooperation but not expansion that promotes metastasis in a breast cancer model (33), the results of this study suggest tumor evolution dynamics are linked to metastasis in neutrophil enriched tumors. As a result of, for example, tumor subclonal expansion outpacing its vascular supply, metabolic stress can trigger necrosis and neutrophil recruitment, which can be further amplified in a positive feedback loop. Within this spatial context, neutrophils acquired a TAN phenotype. Therefore, neutrophils distinguish a unique microenvironment associated with disease progression, which could not be explained by, for example, necrosis, hypoxia, or glycolysis alone in LUAD and LUSC. Based on these findings, we reason that TAN-High LUADs and LUSCs likely orchestrate a protumor TME to compensate for restrictive vascular access and metabolic dysregulation and polarize neutrophils to a proangiogenic phenotype that results in immunosuppression, a higher risk of metastasis, and subclonal expansions.
Upregulation of oncogenic signaling pathways was also associated with the neutrophil enriched TME, such as KRAS signaling in LUAD and LUSC. We previously showed, in a LUAD mouse model, that tumors with a KRAS mutation had neutrophil aggregates and excluded TILs, whereas treatment with the KRAS inhibitor MRTX1257 resulted in reduced neutrophil and increased T-cell infiltrates (65). However, KRAS driver mutations were not only enriched in TS:Neutrophil high TMEs. In LUSC, we observed that TANs were associated with PIK3CA driver mutations that may contribute to or support immune escape. LUSCs with PIK3CA driver mutations more frequently underwent recent subclonal expansions. In addition, tumor cells with PIK3CA
mutations upregulated CXCL8/IL-8, in accordance with previous work linking PI3K signaling with CXCL8 expression in lung tumor and epithelial cells (66, 67). PIK3CA mutations have been linked to the regulation of glutamine metabolism (68) and nutrient consumption in proliferating tumors (69), in addition to proinflammatory cytokine expression (70). However, the proportion of or MCT4 tumor cells was not significantly different between PIK3CA mutant versus PIK3CA wild-type regions. Based on this, and their predominantly clonal status, we propose that these somatic alterations likely predispose the tumor to a neutrophil-rich TME and reveal a potential direct or indirect role for PIK3CA mutations in promoting tumor-neutrophil cross-talk in LUSC.
Collectively, these findings have therapeutic implications in early-stage resectable NSCLC, a population for which neoadjuvant immunotherapy plus chemotherapy is now a standard of care. Pathologic complete responses, which are associated with increased overall survival, following neoadjuvant treatment, range between and , highlighting the need to better characterize the TME and identify strategies to improve patient outcomes. Both high and T:TIL+M$ excluded TMEs were subject to a high degree of ITH that may affect checkpoint inhibitor (CPI) efficacy. T-cell-enriched spatial niches were predominantly found in the TS:TIL+MФ high TME in LUAD and LUSC. These were, however, subject to selective pressures on neoantigen presentation through HLA LOH in LUAD and LUSC. These findings build upon previous work in NSCLC, which demonstrated an improved association of TMB with CPI responses after accounting for HLA LOH (75) and further highlight the importance of considering neoantigen clonality and the histologic subtype when designing neoantigenmediated therapeutic strategies. In LUSC, excluded TMEs were associated with tumor cell PD-L1 expression and the clonal neoantigen-associated community of plasma and cells. These results underscore the importance of investigating the predictive value of this low heterogeneity community of plasma cells and B cells in the context of CPI in LUSC and how spatial organization changes over time.
Although TS:Immune low and TS:Neutrophil high TMEs were subject to lower ITH, they may be less responsive to CPI. Dense, fibroblast networks may inherently restrict T-cell access and consequently CPI therapy response. Combinatorial targeting of CAFs and checkpoint molecules has seen success in preclinical models (76) and may prove beneficial in tumors with immune low TMEs for therapies designed with the increasing knowledge of CAF phenotypes and their functional heterogeneity (77). Finally, in neutrophil-enriched TMEs, CPI response may be limited due to increased levels of IL-8 expression, which has been linked to reduced benefit from CPI therapy based on both tumor and circulating IL-8 levels (78, 79). Nevertheless, clinical trials targeting neutrophils with anti-CXCR1/2 therapies and combinatorial CPI and anti-IL-8 are ongoing (NCT02536469; refs. 35,80 ) and may provide an advantage in CPI treatment of neutrophil-high tumors. Of note, the patients in this study did not receive neoadjuvant or adjuvant CPI therapy. Future studies should seek to evaluate larger cohorts for both prognostic factors and predictors of CPI response in neoadjuvant and adjuvant settings and metastatic disease.
In conclusion, this study provides novel insights into the spatial organization of the early-stage lung cancer TME in the context of tumor immunogenicity, tumor heterogeneity, and cancer evolution. It highlights the importance of pairing the tumor evolutionary history with its spatially resolved TME to draw mechanistic hypotheses on tumor progression and metastasis with implications for patient outcome and treatment.
METHODS
Clinical Samples
The data from this study are part of the first 421 patients prospectively analyzed from the TRACERx cohort (https://clinicaltrials.gov/ ct2/show/NCT01888601). The TRACERx study was approved by an independent research ethics committee (REC), the National Research Ethics Service (NRES) Committee London-Camden and Islington, with the sponsor’s approval of the study by University College London (UCL) with the following details: REC reference 13/LO/1546, protocol number UCL/12/0279, IRAS project ID: 138871. Written informed consent for entry into the TRACERx study was mandatory and obtained from every patient. Methods for data obtention have been previously described . Snap-frozen multiregion sampled tumor and adjacent normal tissues distant from the tumor within the resection specimen were processed to FFPE blocks after first taking sufficient material for DNA and RNA-seq. A single representative core was taken from each regional FFPE block ( 1.5 mm diameter) and arranged into TMAs representing 81 patients across eight blocks (Fig. 1A; Supplementary Fig. S1A). Control FFPE tissues for panel development were obtained from UCL/UCLH Biobank for Studying Health and Disease Renewal 2020 (ethics approval 20/YH/0088) and the PEACE study (ethics approval ). Additionally, two diameter cores were sampled from a tonsil FFPE block and assembled into a miniature TMA, which served as an internal staining control in this study.
Clinical Data
The clinical data from this study have been previously described . Growth patterns associated with regional LUAD tumor cores represent the predominant pattern in the corresponding regional block from which the core was derived (81). Cribriform, micropapillary, and solid patterns were grouped as high grade; lepidic and papillary as mid-grade; and acinar as low grade.
IMC Panel Development
The pan-immune and T cells and stroma IMC panels were developed by testing antibody performance by immunofluorescence (IF) and IMC across NSCLC, normal lung, immune-rich tonsil, and immune-low cardiac and brain tissues (Supplementary Fig. S12A). H&E slides from FFPE tissue blocks used for panel development were assessed by a pathologist to identify cell types and features of interest to support staining evaluation and guide IMC scanning. Unconjugated antibodies were first evaluated using IF and then reevaluated following metal conjugation using IMC (Supplementary Fig. S12B). Metal-conjugated antibodies were purchased from Fluidigm, now Standard BioTools, and carrier-free antibodies (various suppliers) were conjugated to metals in-house using the Maxpar X8 Multimetal Labeling Kit (Standard BioTools). Antibody staining was evaluated for expected staining specificity, including costaining (e.g., CD20, CD79a), mutual exclusivity (e.g., CD4, CD8a), and signal-to-noise ratio, and was supported by pathologist evaluation (Supplementary Fig. S12C). The dilutions of all antibodies were derived by assessing a dilution series using IMC, with the experimental panel information
applied to the TRACERx 100 cohort summarized in Supplementary Table S1. Examples of IMC staining across NSCLC, tonsil, cardiac, and brain tissue for the pan-immune and T cells and stroma panels are shown in Supplementary Fig. S12C. The results of this study focus on 38 antibody targets; some antibody results were not included as they were either not relevant to the biological conclusions of this study or due to technical performance.
Tissue Processing for Immunofluorescence
FFPE tissue blocks were cut to thickness. Sections were baked at in preparation for staining. Sections were dewaxed in xylene ( minutes) and rehydrated in a graded series of alcohol (ethanol:deionized water 100:0, 100:0, 70:30, 0:100, 0:100, 1 minute each). Heat-mediated antigen retrieval was conducted in Tris-EDTA buffer at pH 9 for 30 minutes in a 900 W microwave. Tissue sections were slowly cooled in a room temperature water bath to prevent buffer crystallization. Sections were then washed in PBS, and the tissue area was circled with a hydrophobic PAP pen to create a reagent barrier. Samples were dipped briefly in PBS-Tween20 (0.2%), before blocking with BSA/PBS for 30 minutes at room temperature. Excess blocking solution was flicked off and the primary antibody/ antibodies (diluted in BSA/PBS) was applied and left overnight at . The next day, sections were washed three times in PBS ( 1 minute each), dipped briefly in PBS-Tween20, and the secondary antibody/ antibodies was applied and left for 45 minutes at room temperature. Sections were washed three times in PBS (1 minute each), dipped briefly in PBS-Tween20, and counterstained with DAPI (1:5,000 in PBS) for 30 minutes at room temperature. Samples were washed three times in PBS ( 1 minute each) and immersed in 0.1% Sudan Black for 20 minutes at room temperature. Samples were thoroughly rinsed in cold running tap water until clear and rinsed twice in distilled water. Coverslips were mounted after adding 2 to 3 drops of VectaMount AQ aqueous mounting medium on the slides. Slides were stored protected from light until they were imaged using the Zeiss Axio Imager M1 system at 20x magnification.
Tissue Processing for IMC
Several serial sections of each TRACERx TMA were cut to thickness, and a section from the tonsil TMA was floated onto the bottom of TMA002-TMA007 to serve as an internal staining control. Separate sections of tonsil were used as staining controls for TMA_REC and TMA001. All sections were floated onto standard positively charged slides for immunostaining. Two serial sections were selected and baked at in preparation for antibody staining; an additional serial section was subjected to H&E staining. Sections were processed as described for IF. The two metal-conjugated antibody cocktails (diluted in 1% BSA/PBS) were applied to serial sections and left overnight at . The next day, sections were washed three times in PBS (1 minute each), dipped briefly in PBS-Tween20, and counterstained with iridium (1:500 in PBS, Fluidigm) for 30 minutes at room temperature. Samples were washed three times in PBS ( 1 minute each) and counterstained with ruthenium ( ) for 5 minutes on ice in a fumehood (82). Samples were washed three times in milliQ water ( 1 minute each) and left to air dry. Control tissues were processed following the same procedure during panel development.
TRACERx IMC Data Acquisition
Data were acquired using a Hyperion Imaging System using commercial Standard Biotools IMC software (version 6.7). Regions of interest (ROI) selection was guided by pathologist review of a serial H&E section and were designed to capture each full TRACERx TMA core ( 1.5 mm diameter) or a 1.0 mm diameter tonsil ROI (Supplementary Fig. S12A). A laser ablated tissue ROIs in a rasterized pattern at resolution and 200 Hz . The instrument was tuned between
each run using a 3-Element Full Coverage Tuning Slide (Fluidigm, PN 201088).
Spillover Compensation
To account for isotope signal spillover arising due to isotopic impurities, oxidation, and instrument properties (abundance sensitivity), we adapted the Chevrier and colleagues spillover compensation approach (83) for our two antibody panels. Briefly, data were generated using a slide spotted with lot-specific metal-conjugated antibodies. Superfrost Plus histology slides (Thermo Fisher) were heated on a heat block and coated with a agarose film, ensuring an even spread and thin layer (UltraPure Agarose, Thermo Fisher). The slides were then left to dry until the agarose fully solidified. Metal-conjugated antibodies were mixed 1:1 with Trypan blue and spotted on the slide serially, ensuring no merging of spots into each other. Once the spots had dried, an ROI was chosen for each separate spot on the Hyperion (Fluidigm), corresponding to one metalconjugated antibody. Each ROI was 10 pixels high by 200 pixels wide and was ablated at a laser power 2 units higher than the tuning laser power.
From this experimental spillover data, we calculated compensation matrices using the scripts from Chevrier and colleagues (83), with minor adaptations made to the code. To address observed median pixel-level ion counts that were lower than a threshold required to achieve an accurate readout of metal isotope impurities (threshold counts), for each metal-antibody conjugate ROI in turn, we implemented an adaptive binning approach in which pixel count data are automatically and progressively aggregated over adjacent pixels until the count threshold is reached, having also first restricted analysis to the of pixels with the highest ion counts within the spot (Code and Data Availability). Experimental spillover matrices from the pan-immune panel and the T cells and stroma panel were highly similar to the matrix reported by Chevrier and colleagues and channel spillover ranged from 0 to (Supplementary Fig. S13A and S13B).
Cell Segmentation
To segment nuclei, we trained a UNet++ deep-learning model on a large manually labeled data set developed in-house ( images, 42,000 nuclei; see Data availability) to predict three semantic features of nuclei from ground truth data: nucleus center of mass, all nuclear material, and nuclear boundaries, which we then combined via a marker controlled watershed procedure into nucleus label masks. These nuclear masks were then fed into a multiplexed imaging-specific whole-cell segmentation procedure, which uses the many independent cell marker channels available in IMC to produce final cell masks (Supplementary Fig. S14A and S14B).
In brief, we segmented whole cells by first generating a series of independent cell masks, one for each of a set of user-defined cell lineage markers. To achieve this, deep-learning nuclei were associated with each lineage marker in turn, using a minimum overlap criterion applied between the nuclei and a lineage marker mask created by Otsu-thresholding a preprocessed lineage marker image. Preprocessing steps for lineage marker channels were hot pixel removal and median filtering (window size ). Nuclei associated with an Otsu-thresholded lineage mask were then used as the seeds for lineage marker-specific cell label generation using propagation-based secondary object identification onto the relevant minimally preprocessed lineage marker image. This step yielded a set of instance-level lineage marker cell labels which were then combined into a consensus set of whole-cell labels using a serial masking approach. In this step, only pixels with consensus between different lineage marker channels were retained in the same single-cell object, the aim of which was to minimize segmentation artifacts where mutually exclusive markers are found in the same cell.
We observed extensive nonnucleated and elongated SMA content in our T cells and stroma panel, putatively fibroblasts, and to account for this in our segmentation, we implemented an additional step to identify these stromal cells without an in-plane nucleus for this panel only. To do this, we performed primary object identification directly on the minimally preprocessed SMA channel, following qualitative optimization of thresholding parameters on a representative subset of cores. We filtered nonnucleated cells identified with this method to ensure overlap with nucleated cell objects was minimal (less than of the area of any nonnucleated cell) and that each identified nonnucleated cell had an area of at least 20 pixels following masking by the nucleated cell mask. These steps were implemented to reduce the likelihood of double counting cells and of assignment of cell debris or artifacts to cell area. The nonnucleated SMA identification step contributed a median of 560 cells per tumor core (median 5.6% of total cells/core).
The whole-cell segmentation procedure was implemented using CellProfiler v3.1.9 (84). Single-cell measurements of all IMC marker mean intensities were input into the TYPEx multiplexed cell phenotyping module.
Cell Phenotyping
Cell subtypes were identified and quantified in three steps: iterative cell stratification, statistical comparison of marker intensities, and cell subtype assignment. The cells were stratified into groups with similar marker intensities as follows: (i) cells were assigned to the most likely major cell lineage using CellAssign (85) accounting for TMA ID as a potential batch effect; (ii) low and high confidence assignments were identified as those that changed label by perturbing the input to the CellAssign model and excluding one cell lineage. Myeloid cells-other (CD11b) were excluded for the pan-immune panel and Vim cells (Vimentin) for the T cells and stroma panel; and (iii) clustering with FastPG (biorxiv 2020.06.19.159749v2) was performed within a major cell lineage and confidence group, where the parameter k was set to 30 , and no transformation was applied to the raw mean pixel intensities per cell prior to clustering. The clusters were compared by the pixel intensities of all markers of interest in the panel, and the probability distribution for a cluster to have a higher intensity than other clusters was determined. If the probability distribution was higher than the background distribution of all clusters, the marker was considered positive. This separation ensured that rare or unexpected T -cell populations such as , were minimized relative to the common T-cell populations, and . Cell subtypes were assigned automatically based on the combination of positive markers, given the cell phenotype definitions in Fig. 1E; Supplementary Fig. S2B, and Supplementary Fig. S3A.
The major cell lineage markers used to build the CellAssign model for the pan-immune panel were endothelial cells (CD31), epithelial cells (pancytokeratin/panCK), CD4 T cells (CD45, CD3, CD4), CD8 T cells (CD45, CD3, CD8a), T cells-other (CD45, CD3), B cells (CD45, CD79a, CD20), monocytes (CD45, CD11b, CD14), macrophages (CD45, CD11b, CD14, CD68, CD206, CD163), myeloid cells-other (CD45, CD11b), mDCs (CD45, CLEC9a), and leukocytesother (CD45). For the T cells and stroma panel, the following major cell lineages were defined: Vim cells (Vimentin), endothelial cells (Vimentin, CD31), epithelial cells (panCK), aSMA cells (Vimentin, aSMA), CD4 T cells (CD45, CD3, CD4), CD8 T cells (CD45, CD3, CD8a), T cells-other (CD45, CD3), leukocytes-other (CD45).
To examine potential batch effects arising from staining multiple slides, we compared the raw intensities across tumor cores for all TMAs for both the pan-immune and T cells and stroma panels (Supplementary Fig. S15A and s15B). We did not observe batch effects in this analysis nor in UMAP representations when data were grouped by stained TMA section (Supplementary Fig. S15C and S15D). In addition, we compared the median marker intensities
across all the cells per image between the two antibody panels (Supplementary Fig. S16A and S16B). Immune, endothelial, epithelial, and total cell densities were highly correlated between the two antibody panels, with Spearman correlation coefficients of 0.72 for total cells, 0.9 for total T cells, 0.85 for epithelial cells, and 0.82 for endothelial cells.
Cell Subtype Definitions
The following cell type definitions were applied to define cell subtypes. Macrophage subtypes were defined as follows: macrophages and macrophages alone). macrophages that were located within pathologist-annotated masks of alveolar macrophages were classified as alveolar macrophages (Supplementary Fig. S2C).
Neutrophils were defined as CD11b cells negative for other cell subtype-specific markers, such as CD14 (monocytes) and CD68/ CD163/CD206 (macrophages). Additional cell subtypes were defined as naïve cells , cytotoxic cells , tissue-resident memory cells , exhausted terminally differentiated cells (CD57 CD CD ), regulatory T cells (Treg; ), central memory T cells (Tcm; CD27 CCR7 ), effector memory T cells (Tem; CD27 CCR7- CD57 T cells (CD57 ), plasma cells (CD79a+CD38 ), gamma-delta T cells ( ), B cells ( ), B cell lineage-other (CD79a+CD20-CD38-), and a myeloid cells-other subtype ( . cells with cell centers falling within large vessel mask areas, as annotated during pathology review, were assigned as perivascular cells. Remaining cells in images were assigned as fibroblasts (Supplementary Fig. S2C).
A proportion of unassigned cells in the pan-immune data set are likely fibroblasts or other stromal cells, for which this IMC panel did not include markers specific for these cell types. A proportion of cells in the T cells and stroma panel data is attributed to the myeloid lineage, which was not readily identified in this panel.
In all analyses using the proportion of tumor cells, we have quantified the proportion of positive tumor cells out of all tumor cells, defined as the epithelial cells within pathology expert-annotated tumor areas (Supplementary Fig. S2C).
Tissue Segmentation of Tumor Nest and Stroma
A three-class random forest classifier was trained to segment background, tumor/epithelium, and stroma tissue regions on composite images from NSCLC tumor, tumor-adjacent lung tissue, and lymph nodes using Ilastik (86). The composite image was generated using DNA intercalators and markers with tissue-specific expression for the epithelium (pancytokeratin) and stroma (immune-specific biomarkers, SMA, CD31). When available, vimentin (T cells and stroma panel), collagen1 ( cells and stroma panel), and panactin (panimmune panel) were also considered in areas with mutual exclusivity with the epithelial cell markers. Of note, the tissue area that was not stained by any of the markers in the antibody panel, such as air space, was detected as background. The performance of this classifier was validated through pathology review of paired images.
To account for differences in the imaged tissue area, we used cell density, i.e., the cell count normalized by the imaged tissue area. The imaged tissue area was calculated as the sum of the areas of the tissue compartments, TS, derived from tissue segmentation. Median cell densities are summarized in Supplementary Table S4.
Pathology Review and Feature Mask Generation
For each imaged ROI, a serial H&E was reviewed by an expert pathologist to confirm the presence or absence of invasive tumor tissue and to annotate tumor and nontumor epithelium, airways, necrosis, large vessels, and alveolar macrophages (Supplementary Fig. S17). Annotations were made using NDP.view2 software
(version 2.7) on a pseudo-H&E generated directly from the ruthenium and iridium channels of our IMC images. Masks for each labeled feature were created using Groovy scripting in QuPath and aligned with study outputs.
H&E images from the regional FFPE tissue block from which TMA cores were derived were assessed for the presence of TLS. TLS were defined as lymphoid aggregates with the presence of segregated T -cell and B cell areas, as well as evidence of an ongoing GC reaction, based on the distinction of dark and light zones in GCs. There was no evidence for TLS associated with the tumor regions assessed by IMC in this study.
Identification of Spatial Cellular Communities
The community identification method (87) was applied to 139 tumor cores that were imaged with the pan-immune panel to identify groups of cells that commonly localized near one another. Cell subtypes included in the analysis had a minimum average of 10 cells per core in all tumor cores. Unassigned and ambiguous cells were excluded from community analysis. A window was defined around every cell in an image and its 10 nearest neighboring cells including the center cell. These windows were clustered by their composition with respect to the 18 cell types (with at least 10 cells on average per image) using MiniBatchKMeans and . To identify cell types enriched in a community, we calculated if the density of a cell type was significantly higher in the community of interest compared with all other communities using an LME model with patient as a random effect and ANOVA test. Communities were then assigned representative names based on the enriched cell types within them (Supplementary Fig. S3F). The community identities were mapped onto segmented cells and visualized using Cytomapper (Supplementary Fig. S3G; ref. 88), which were then validated by pathologist assessment of serial H&E-stained tissue sections.
To check that the communities we detected in the TME were robust, we performed a series of tests to validate our results. To find the optimal number of communities, we varied the number of communities and measured the stability of constituent cell types within them. For each window size, we tested to 20 communities and calculated the distortion score, representing the sum of squared distances from each point to its assigned center. Using the elbow locator, we found that the optimal number of points that maximized the decrease in distortion was communities (Supplementary Fig. S18A). We investigated the differences in output by testing window sizes of nearest neighbors. We observed that the composition of the resultant communities was largely unchanged, in that they were enriched for similar cell types (results not shown). Robustness of clustering was tested by subsampling one third of the cells three times and comparing the proportion of cells assigned to the same community with each iteration of clustering, resulting in a median concordance of (Supplementary Fig. S18B).
All 10 communities were detected across NSCLC histologic subtypes, with no statistical enrichment in LUAD, LUSC, or NSCLCOther (Supplementary Fig. S18C).
Spatial Clustering
We performed spatial clustering of tumor cells in pathologistannotated tumor areas as fiducial structures for spatial analysis (Supplementary Fig. S2D). Spatial clustering of cell coordinate data were performed using the DBSCAN algorithm from the Python library scikit-learn. The eps parameter of the DBSCAN algorithm was set to 25 , resulting in reasonable cell clusters by visual assessment. We used a minimum cluster size of 3 cells for spatial analysis. We used the Python packages Alphashape and Shapely to determine the boundaries of all spatial clusters and whether any cell was located within a given spatial cluster.
Barrier Score Definition
fibroblast barrier scores were adapted from the method of Failmezger and colleagues (89) and calculated as follows. First, a nearest neighbor graph of cell locations was constructed by connecting each cell to its five nearest neighbors. To calculate the fibroblast barrier for CD8 T cells with respect to tumor cells, we used the breadthfirst search shortest paths algorithm from the Python cuGraph library to find the shortest paths from each CD8 T-cell vertex in the network to all tumor cell vertices. fibroblasts were then enumerated along each path. For originating CD8 T cells which had multiple tumor cells at the same distance (e.g., two tumor cells each at a five-hop distance from the CD8 T cells), the score was defined as the average number of cells across all paths. To restrict the scoring to cells specifically accruing at the edge of tumor bulk, we counted only cells adjacent to tumor cells (i.e., neighboring nodes of the cell spatial graph) and only if the tumor cell itself was a member of a spatial cluster of at least as defined by DBSCAN, described above. We chose these parameters as the concept of a macroscopic barrier may be poorly defined for single and small numbers of tumor cells. Furthermore, to focus analyses on nonperivascular cell populations, including nonperivascular cells, cells with centers falling within pathol-ogist-annotated large vessel masks were annotated as perivascular and excluded from measurement. Nonperivascular epithelial cells with centers captured within the pathologist-annotated tumor mask area were assigned as tumor cells. Barrier scores were calculated as the perimage mean across all nonperivascular CD8 T cells, where a barrier score of 1 is assigned for a CD8 T-cell separated from the nearest tumor cell by a tumor cell-adjacent fibroblast ( 0 otherwise) and where the barrier score per CD8 T cell is calculated as the mean score over all shortest paths to the nearest tumor cell(s).
TME Classes Definition
Unsupervised hierarchical clustering of z-score normalized cell densities was performed using all cores in the study, including normal, benign tumor-adjacent, and tumor samples of all histologic subtypes. The following major cell types were used to define the TME clusters: CD8 T cells, CD4 T cells and B-cell lineage (TIL), macrophages and macrophages ( ), neutrophils and myeloid cells-other (mDC, monocytes, other CD11b cells). The cell densities for each major cell type were calculated individually for the TS. Cells from the B-cell lineage were predominantly found in one tissue compartment, stroma ( ). Only a small number of B-cell lineage cells and myeloid cells-other, fewer than 3,000 cells or from all immune cells, were detected in the tumor nest; therefore, the cell densities in the tumor nest for these two cell types were not considered for TME classification. All analyzed cell types were detected in at least of the analyzed cores.
Four TME clusters were defined as the most concordant clusters derived from hierarchical clustering using of the samples in 1,000 subsampling iterations, using the functions ConsensusClusterPlus and calcICL within the ConsensusClusterPlus R package (v 1.58; Supplementary Fig. S5A). The clustering was performed on normalized cell densities using robust z-scores (median divided by median absolute deviation). Clustering was performed using the distance metric maximum and the clustering method ward.D. The cumulative distribution function (CDF) of the consensus matrix for each value of , where is the number of clusters, and the difference in area under the curve comparing the CDF for with the CDF for were included in Supplementary Fig. S5B. The consensus value indicates the proportion of instances that two cores are assigned to the same cluster out of 1,000 subsampling iterations. We demonstrated that the largest increase in consensus values was observed by increasing the number of clusters from three to four (Supplementary Fig. S5B). This analysis strongly suggests that there are at least four TME classes in the cohort. The consensus values continue
to increase with larger than 4 although with a smaller difference, suggesting that the spatial TME classification may be refined in significantly larger cohorts. Five TME clusters resulted in splitting the TS:Neutrophil high TME class predominantly by histology-specific differences and CD163 macrophage densities in the tumor nest yielding a predominantly LUSC cluster with a significantly higher density of neutrophils in the TS than for other TME clusters combined and a predominantly LUAD cluster with a higher density of neutrophils and CD163- macrophages in the tumor nest compared with other TME clusters. Because of the high similarity of these two clusters, we considered four TME classes in this study.
We next identified the criteria that distinguish each cluster, using an LME model to compare cores from a given immune cluster to those from other clusters and adjust for multiple regions with patient as a random effect (Fig. 2D). Specifically, TS:TIL+MФ high cores were selected for cores with higher TIL or macrophage densities in the tumor nest compared with other TME classes. TS:Immune low cores were selected to have lower immune cell density in the tumor nest compared with cores from other TME classes. The criteria for the T:TIL+MФ excluded TME required that TIL/macrophage density in the tumor nest was lower than high and that TIL/ macrophage density in the stroma was higher than in TS:Immune low cores. Finally, as the TS:Neutrophil high cluster was characterized by higher neutrophil infiltration in tumor nest or stroma and lower TIL infiltration, the criteria for this TME class required that the neutrophil proportion from all cells was higher than other TME classes in the tumor nest or stroma. The cutoffs for each of these criteria were determined automatically using a binomial generalized linear model for each immune cluster compared with other clusters and are shown in Supplementary Fig. S5C. The performance function in the R package ROCR v.1.0-11 was used to find the best cutoff as the intersection between the sensitivity and specificity curves. Within each cluster, the cores that did not fulfill these criteria were labeled undefined (Supplementary Fig. S5A and S5C).
The TME classes were annotated based on cell types with differential composition in the tumor nest or stroma compartment compared between each TME class versus other TME classes, using an LME model with patient as a random effect (Fig. 2D; Supplementary Fig. S5D). For NSCLC analysis, histology was added as a fixed effect (Fig. 2D). Histology-specific median cell densities are summarized per TME class in Supplementary Table S4.
Spatial Heterogeneity of TME Classes and TAN-High Tumors
To evaluate the intratumor spatial heterogeneity of TME classes accounting for the different number of sampled regions, we performed bootstrap subsampling with 1,000 iterations. We calculated the probability of observing a TME class for a given number of samples taken per tumor (two, three, and four samples). The heterogeneity of a given TME class was estimated as the ratio of the number of observations when all samples had that same TME to the total number of tumors that have that TME class. This reported probability of observing the same TME class across all samples represents the average ratio across all iterations and across the different number of samples taken (two to four). This approach was used to estimate the probability of all regions to have a high TAN score and the probability for any region to have a high TAN score given a clonal PIK3CA mutation in the TRACERx 421 (Tx421) cohort, varying the number of samples from two to eight (the maximum number of regions in the Tx421 cohort).
Spatial Heterogeneity of Cell Types and Communities
A spatial ITH score for cell type and community densities was calculated using z-score normalized density values in patients for which data were available from two or more tumor cores (pan-immune panel cells and stroma panel ; Supplementary Fig. S1B).
The standard deviation was calculated across tumor core data per patient. The spatial ITH score per feature represented the cohort mean of standard deviation values, per IMC panel.
PD-L1 IHC of Regional Tumor Blocks
FFPE sections ( ) were stained with anti-PD-L1 (SP142) according to the manufacturer’s instructions (Ventana). Tumor cell (TC) scoring was performed as instructed by the manufacturer by experienced and qualified pathologists. Briefly, the TC score was defined as the proportion of viable tumor cells showing PD-L1 membranous staining of any intensity. TC scores were categorized as to , and . For statistical analysis, TC scores were rare and were therefore combined with to into a category. Samples stated as negative for PD-L1 had a staining positivity rate of .
IHC Validation of Checkpoint Molecule Expression
Multiplexed IHC was performed to validate immune-checkpoint molecule expression on immune cells. FFPE tissue sections of a representative human lung cancer case and of reactive tonsils were subjected to double immunostaining (Supplementary Fig. S19). Briefly, 2 – to tissue sections were cut and transferred on electrically charged slides to be stained. To establish optimal staining conditions (i.e., antibody dilution and incubation time, antigen retrieval protocols, suitable chromogen), each antibody was tested and optimized on sections of reactive tonsil by conventional single IHC using the automated platform Bond-III Autostainer (Leica Microsystems). For double immunostaining, a protocol previously described was carried out (90). All slides were stained with anti-MUM-1/ IRF4 clone MUM1p (1:400, Agilent Dako) and costained with one of anti-PD-L1 clone SP142 (Ventana Medical Systems), anti-TIM3 clone D5D5R (1:100, Cell Signaling Technology Inc.), anti-VISTA clone CL3975 (1:150, Thermo Fisher Scientific Inc.). Slides were counterstained with hematoxylin. Images were acquired on a NanoZoomer 2.0HT whole-slide imaging system (Hamamatsu Photonics) at magnification.
TAN Scoring from H&E Images in TRACERx
The densities of TANs were assessed on digitally scanned H&Estained sections and scored at magnification. All TANs were evaluated within the histologic limits of the tumor itself. The TANs in the stromal compartment and tumor island compartment were evaluated separately. Calculation of the TANs in the stromal compartment was based on the standardized method used for TIL quantification, as developed by the International Immuno-Oncology Biomarker Working Group on Breast Cancer (30). The tumoral TANs were scored in a similar manner but the areas assessed included viable tumor islands, and neutrophils free floating within the glandular lumen were excluded. As per the published guidelines, the percentage was calculated as the area occupied by the neutrophils over the total stromal area and total tumoral area, respectively. Stromal TANs (sTAN) represent the percentage of stroma compartment area occupied by the TANs; tumoral TANs (tTAN) is the percentage of tumor compartment area occupied by the TANs. The average neutrophils scoring was calculated across the entire slide rather than focusing on the hotspot areas. The percentage is given as a continuous parameter. Eighteen patients were excluded from the validation cohort and were not scored for TANs when H&E slides were not available or no tumor was detected in those sections. Region-level TAN scores were derived from scoring H&E images of paired regional blocks of the study TMAs, and tumor-level TAN scores were assessed on tumor-matched diagnostic blocks.
High TAN score was defined based on whether either the tumor (tTAN) or the stromal TAN (sTAN) scores were high. To classify tTAN and sTAN scores into high and low, we determined an optimal
cutoff that best separates the TS:Neutrophil high TME class from the other TME classes. We used a binomial generalized linear model of the tTAN or sTAN score to predict the presence of a TS:Neutrophil high TME class. We used the performance function in the R package ROCR v.1.0-11 to find the best cutoff as the intersection between the sensitivity and specificity curves. The determined cutoffs were for tTAN and for sTAN across all diagnostic slides scores in LUAD/LUSC, and for tTAN and for sTAN across regional TAN scores in LUAD/LUSC.
RNAscope
FFPE sections ( ) were stained on the Leica Bond Rx automated stainer using RNAscope LS Multiplex Fluorescent assay ( 322800 ACD Bio-Techne) applying a standard 15 -minute target retrieval and 15-minute protease treatment using target probe Hs-IL-8 ( 310388 Bio-Techne) with Opal 570 (Akoya Biosciences). Samples were immunostained with MPO 1:2,000 (ab208670 Abcam) or pan-cytokeratin 1:250 (M3515 Agilent) and detected with Opal 690 (Akoya Biosciences) and counterstained with DAPI. Slides were imaged on the PhenoImager HT (Akoya Biosciences).
Neighborhood Analysis
The CellProfiler software (v3.1.9; MeasureObjectNeighbors module) was used to compute the neighboring cells for each cell type in an image (84). Cells were defined as being in the “neighborhood” of a cell of interest if they were detected within a pixel radius of 5 px of the cell of interest.
The neighbouRhood tool (91) aggregate_classic function was used to define the image-level cell-cell relationship between any two cell types: interacting relationship, avoiding relationship or nonsignificant relationship.
TME class comparisons, PIK3CAmut/wt, and subclonal expansion score high/low: To query if a relationship was significantly enriched in one subgroup compared with another, a logistic regression model correcting for multiple cores per tumor was applied to assess the frequency of a spatial relationship in the TME class of interest compared with all other TME classes (Supplementary Fig. S20), between tumor cores with PIK3CA mutation versus PIK3CA wild-type (Supplementary Fig. S21A) and between cores with high compared with low subclonal expansion scores (Supplementary Fig. S21B). Benja-mini-Hochberg adjustment was performed to correct for multiple testing. We report significant ( ) cell-cell relationships if the constituent cell types were present in at least of tumor cores. These relationships were visualized in a heat map if they were present in at least of cores.
MCT4 and CAIX TC neighborhood analyses: Differences in interaction and avoidance profiles with other cell subtypes in TS:Neutrophil high LUSC tumor cores were analyzed between center MCT4 and MCT4- tumor cells (Supplementary Fig. S22A), and between center CAIX and CAIX tumor cells (Supplementary Fig. S22B). We report cell-cell relationships if the constituent cell types were present in at least of tumor cores ( cores) for both positive (+ve) and negative (-ve) center tumor cell phenotypes. No significant differences were observed between +ve and -ve center cells for either MCT4 or CAIX, when applying a Chi-square test and value adjustment (Ben-jamini-Hochberg). Only cell subtypes for which at least two cores exhibited a significant avoidance or interaction for at least one of the two tumor phenotypes were tested.
TRACERx 100 WES
WES data were available for of tumor cores in the pan-immune data set, and for of tumor cores in the T cells and stroma data set (Supplementary Fig. S1A; Supplementary Table S2). Normal lung samples were not subjected to WES. WES data were processed as described (14).
TRACERx 100 RNA-sequencing
RNA-sequencing data were processed as described (13). Paired analysis of RNA-sequencing and IMC data were performed for tumor cores only and was available for of the pan-immune and of the cells and stroma data sets (Supplementary Fig. S1A; Supplementary Table S2).
TMB Calculation
TMB was calculated using a harmonized approach as the number of somatic mutations per megabase (muts/ Mb ) in the coding genomic regions (92) on the TRACERx 421 mutation data from WES. The TMB status of each tumor region was categorized as either high ( mutations/Mb) or low (<10 mutations/Mb) to match clinical guidelines.
Driver Mutation Analyses
Driver mutation calls are derived from TRACERx 421 driver mutation calling from WES, as described previously (14), and include driver single-nucleotide variants, insertion-deletion mutations (indels), and splice mutations in relevant genes. Clonality calls for PIK3CA mutations were derived using TRACERx clonality calling for WES data, as described in (14).
Statistical analyses of TME class distributions by regional driver gene mutation status were performed using the lme4 R package glmer function (“binomial” distribution). Analyses were undertaken to compare distributions of one TME class with all other classes combined (for the respective histology subset). Patient ID was included as a random effect, and ANOVA values were calculated by comparing a null model without mutation status as a fixed effect to a model containing mutation status as a fixed effect.
Nearly all the observed driver mutations in the PI3K pathway occurred in the gene PIK3CA in TRACERx 421 (23/115 cores). There were no PIK3CB mutations in TRACERx 100. Gains and amplifications in regions of the PIK3CA gene were a frequent event in nearly all LUSC tumors.
Chi-squared test was used to compare the frequency of observations between PIK3CA mutant and PIK3CA wild-type tumors. In the case of multiple regions per tumor, we considered whether any tumor region of a given tumor had a mutation.
Copy-Number Analysis
Somatic copy-number profiles for tumor regions were derived as previously described (14). To compare somatic copy-number alteration (SCNA) profiles in high and low TAN score regions, the previously described unpaired analysis method was adapted (15). Within each of high and low TAN categories separately, for each copy-number segment within an individual tumor, the maximum and minimum copy-number values from all respectively assigned regions of a tumor were selected. GISTIC2.0 (93) was then run four times for each of LUAD and LUSC for the combined TAN validation and discovery cohorts using these tumor-level data, once with the maximum values (to examine amplifications) and once with the minimum values (to examine losses), for each of high and low TAN score categories. Driver or immune evasion genes deemed to be significantly amplified/deleted ( ) for the TAN-High group but nonsignificant for the same SCNA event in the TAN-Low group, and for which the absolute value of the G-score was higher in the TAN-high compared with the TAN-low group were assessed. No such peaks were observed in LUAD or LUSC. In this instance, driver genes were defined as in (14, 15). Immune evasion genes tested were RFX5, RFXANK, RFXAP, TAP1, TAP2, TAPBP, PSMB8, PSMB9, NLRC5, ERAP1, CALR, CNX, PDIA3, B2M, SPPL3, MOGS, GANAB, CIITA, MARCHF1, CD74, MARCHF8, CGAS, MB21D1, TMEM173, TBK1, IRF3, IFNB1, CTNNB1, AXIN1, AXIN2, APC, GSK3, GSK3B, CSNK1A, CSNK1A1, DKK1, PTCH1, NKD1, PTEN, MYC, PTGS2, CXCL13, CXCL9, IFNGR1, IFNGR2, JAK1, JAK2, STAT1, STAT2, IRF1, IRF9, SOCS1, IFNAR1, IFNAR2, SERPINB9,
Class I/APM disruption refers to intrinsic mechanisms of immune escape relating to antigen presentation on MHC class I. Class I/APM disruption was defined if HLA LOH could be determined in any of HLA-A, HLA-B, or HLA-C, and/or if mutations were detected in any of the following antigen presentation (APM) genes: B2M, HLA-A, HLA-B, HLA-C, CALR, ERAP1, GANAB, MOGS, NLRC5, PSMB8, PSMB9, PDIA3, RFX5, RFXANK, RFXAP, SPPL3, TAP1, TAP2, TAPBP, and CNX. Mutations were defined as any of nonsynonymous single-nucleotide variants (including stoploss and stopgain), and (non-)frameshift insertions and substitutions, and frameshift deletions. To be included in the HLA analysis, a gene had to pass the following filters: identified at least 10 SNPs that passed the minimum coverage of 30 ; both alleles of the gene required an expected depth (ED) of ; the confidence interval in the allelic copy number was . The ED estimates the depth of the reads sourced from the cancer cells, which was calculated from the depth of the matched germline sample and the purity of the tumor region. At an ED below 10, we did not expect to have the required coverage to accurately classify LOH , even if it were present.
Whole-Genome Doubling
Whole-genome doubling assignments for TRACERx tumor regions, referenced in Fig. 2B, were calculated as described previously (14).
Neoantigen Analysis
Neoantigen analysis was performed within LUAD and LUSC histologies and required samples with neoantigen prediction and RNAseq. Clonal (detected in all regions of the same tumor), subclonal (not detected in all regions of the same tumor), and total nonsynonymous mutations were used to predict neoantigens using NetMHCpan4.1 (94). When bulk transcriptomic data were available, a neoantigen was considered to be expressed if at least four RNA-seq reads mapped to the mutation position. Neoantigen counts were further filtered based on whether they were predicted to bind to the corresponding patient’s HLA alleles (determined using HLA-HD; ref. 95) that were not subject to HLA LOH. The HLA-binding predictions were filtered based on strong binding affinity using a threshold of rank score . LOH status of HLA-A, HLA-B, and HLA-C could not always be determined (see above). Tumor regions with no data for any of HLA-A, HLA-B, or HLA-C were excluded from neoantigen analysis requiring HLA status and represented 3 LUAD tumor regions from 2 patients and 3 LUSC tumor regions from 1 patient (Supplementary Fig. S1A; Supplementary Table S2). In tumor regions where LOH of one or two of HLA-A, HLA-B, or HLA-C was undetermined, the missing HLA was assumed to be intact. The expression level of neoantigen transcripts and RNAlevel repression of HLA genes were not considered.
Differential Gene Expression, Gene Set Enrichment, and GO Analyses
Trimmed mean of M-values (TMM) normalized expression values was analyzed with the limma-voom workflow for differential analysis (13). The t -statistic generated by limma was used as input for GSEA for MSigDB hallmark gene sets using the R package fgsea (v1.10.1) with default parameters. Genes with higher than 2 -fold change and limma-derived unadjusted were selected for overrepresentation analysis with GO Biological Processes using the enrichGO function in the clusterProfiler R package (v 4.2.2).
Recent Subclonal Expansion Score
A recent subclonal expansion score per tumor, reflecting the size of the largest recent subclonal expansion within each tumor region,
was calculated as described by Frankell and colleagues (14). In short, using multiregional WES, tumor phylogenetic trees were constructed, and for each of them, the terminal nodes on the tree (i.e., leaf nodes) were identified. The maximum cancer cell fraction (CCF) of any of these leaf nodes was then identified. The recent subclonal expansion score represents the maximum CCF of any of the leaf nodes in a given tumor region. The recent subclonal expansion score was compared between the TAN groups using the LME model with patient as a random-effect covariate. To adjust for the difference in tumor content, we added purity as a fixed-effect covariate in the model. The association of high recent subclonal expansion with TAN-high tumor cores remained significant in LUAD ( ) but did not reach significance in LUSC ( ).
Phylogenetic Tree and cloneMap Visualization
The tumor phylogenetic tree for tumor CRUK0468 in Fig. 6F was reconstructed using CONIPHER and visualized using the plot function (igraph R package v1.3.5). The sequenced profiles of two samples from a lymph node metastasis, one fresh frozen (LN1) and one FFPE (FLN1), were included with the primary tumor regions to reconstruct the tumor phylogenetic tree. Tumor region clone maps were visualized using the cloneMap function (cloneMap R package v1.0.0.0, bioRxiv 2022.07.26.501523).
Survival Analysis
To evaluate the prognostic value of TANs in lung cancer, we defined a discovery cohort as the TRACERx100 tumors profiled with IMC for neutrophil markers (panel ) and a validation cohort as the nonoverlapping TRACERx421 tumors with a surrogate, H&Ederived TAN score ( ; Supplementary Fig. S10A). In eight cases with TAN scoring, when the patients harbored synchronous multiple primary lung cancers, we used only data from the tumor of the highest pathologic TNM stage. We excluded two patients for which multiregion sequencing data revealed two tumor masses as collision tumors with two and three independent LUADs in CRUK0881 and CRUK0704, respectively, diagnosed histologically as single primary LUADs (14). One patient (CRUK0682) with synchronous primary lung cancers (LUAD and LUSC), whose tumor with the highest stage (LUAD) was not sequenced, was excluded from the survival analysis.
Within the discovery cohort, we distinguished tumors with metasta-sis-seeding clones ( ) as metastasizing tumors, as determined by multiregional genomic profiles from matched primary and metastases (15). All tumors seeding lymph node and intrapulmonary metastasis detectable at the time of surgery as well as any relapse detected during follow-up were included ( ). In addition, we also defined control tumors as those from patients who did not have metastasis or recurrence diagnosed for more than 3 years of follow-up time.
DFS was defined as the period from the date of registration to the time of radiologic confirmation of the recurrence of the primary tumor registered for the TRACERx or the time of death by any cause. Lung cancer-specific DFS was defined as the period from the date of registration to the time of radiologic confirmation of the recurrence of the primary tumor registered for the TRACERx or the time of death from lung cancer.
Kaplan-Meier plots were generated based on the univariate model from the survfit function (survival R package v3.4.0) and compared with the log-rank test. Hazard ratios and values were derived using univariate and multivariable Cox regression analyses with the coxph function (survival v3.4.0). Cox proportional hazards assumptions were fulfilled for univariate and multivariable models. Univariate models also included strata by histology subtype. The multivariable model was adjusted for necrosis, age, sex, pathologic stage ( ), smoking pack years, receipt of adjuvant therapy, and histology subtype. The median follow-up time of the cohort was extracted from the summary table of the survfit model.
The necrosis status was evaluated from diagnostic H&E images by a pathologist. High and low recent subclonal expansion scores were defined based on the median score. Hazard ratios of age and pack-years were reported per 10 years. We evaluated several cutoff approaches to define high and low TAN score, median, upper quartile (vs. rest), and optimal cutoff described above in the section TAN scoring from HEGE images in TRACERx. Both regional and diagnostic TAN scores were evaluated in univariate analysis, whereas the TAN score used for the multivariable analysis was derived from diagnostic H&E images. The association with prognosis remained significant for high TAN tumors in multivariable analyses with median recent subclonal expansion score or PIK3CA mutation status (Supplementary Table S5).
Granulocyte Scoring from H&E Images and Survival Analysis in TCGA
H&E-stained whole-slide images (WSI) from TCGA were analyzed with PathExplore, a deep learning-based model for cell type and tissue classification trained on pathologist-expert annotations on 6,918 WSIs from NSCLC tissue (37). The tissue classification model segments the tumor nests (cancer), cancer stroma, background, necrosis, and artifacts on H&E images. PathExplore outputs for tissue segments were evaluated by pathologists to assess the model’s performance in detecting and classifying regions of tissue background, artifact, tumor nests (cancer), cancer stroma, and necrosis. Samples with error for segmenting tumor nests (cancer) and cancer stroma were removed. Samples, for which necrosis, artifacts, and background were not evaluated or had error were excluded. The cell type classification model was trained to predict granulocytes. The granulocyte classification is expected to include eosinophils in addition to neutrophils.
The automated score derived from applying PathExplore on the TCGA cohort used the proportion of granulocytes in the tumor nest/ stroma over the total number of cells in the tumor nest/stroma (Supplementary Fig. S11A). The automated score was compatible but not identical to the pathologist-derived TAN score, which was defined based on two factors: the area of neutrophils in the tumor nests/ stroma over the area of the tumor nest/stroma. Although the TAN score was based on the cell area proportion, the automated score quantified the cell count proportion. As the area of neutrophils is generally smaller than the area of the cancer cells or fibroblasts in the TS, the pathologist-scored area proportions would be generally lower than the automated cell proportions. Therefore, the TAN score cutoffs derived using the TRACERx cohort could not be directly applied to the TCGA samples. Instead of using a single score cutoff in the TCGA cohort, we used a range of score cutoffs, defined by high granulocyte proportions in the TS. The TAN score and the PathExplore quantification considered only viable tumor islands, excluding necrotic areas and normal tissue.
DFS was defined based on the annotations of new tumor events after initial treatment and vital status in the clinical data downloaded from the TCGA portal (portal.gdc.cancer.gov). The new tumor events annotated as new primary tumors were not considered as DFS events. Patients diagnosed with stage IV tumors or treated for prior malignancy were excluded. The hazard ratio was evaluated for a range of intervals of the two variables: the proportion of granulocytes over all predicted cells in the tumor nest (tumor nest interval) and the stroma (stroma interval). Tumors with high scores were defined as those, for which the proportion of granulocytes in the tumor nest was higher than the tumor nest interval or the proportion of granulocytes in the stroma was higher than the stroma interval.
The multivariable model was adjusted for age, sex, pathologic stage ( ), smoking pack years, receipt of adjuvant therapy, and histology subtype. Hazard ratios of age and pack-years were reported per 10 years (Supplementary Fig. S11B).
Statistical Analysis
All statistical tests were performed in R. No statistical methods were used to predetermine sample size. NSCLC-other was excluded from histology-specific analyses due to a low sample size. Tests involving comparisons of distributions were done using a two-tailed nonparametric Wilcoxon rank-sum test, unless specified one-tailed, using paired or unpaired options where appropriate. Tests involving the comparison of groups were done using a two-tailed Chi-squared test. For all statistical tests, the numbers of data points included are plotted or annotated in the corresponding figure legend. Correlation coefficients and corresponding values were calculated with the Spearman correlation method.
Continuous dependent variable: Where multiple tumor regions/ cores per patient were considered, LME models were applied using patient ID as a random effect. The C6:macrophages and cells community was associated with smoking status among the clinical features; therefore, the LME models with this community corrected for smoking status as a fixed effect. ANOVA values were calculated by comparing the effects model to the null model.
Categorical dependent variable: In the case where multiple tumor regions/cores per tumor were considered, statistical analyses of distributions of categorical data (e.g., TME class) with relation to an independent categorical variable (e.g., smoking status) were performed using the lme4 R package glmer function (“binomial” distribution). Patient ID was included as a random effect, and ANOVA values were calculated by comparing the effects model with the null model.
Code and Data Availability
RNA-seq and WES data (in each case from the TRACERx study) used during this study have been deposited at the European Genome-phenome Archive (EGA), which is hosted by The European Bioinformatics Institute and the Centre for Genomic Regulation (CRG) under the accession codes EGAS00001006517 (RNA-seq) and EGAS00001006494 (WES); access is controlled by the TRACERx data access committee. Details on how to apply for access are available on the linked page. IMC data used or analyzed during this study are available through the CRUK and UCL Cancer Trials Centre (ctc. tracerx@ucl.ac.uk) for academic noncommercial research purposes. Access will be granted upon review of a project proposal, which will be evaluated by a TRACERx data access committee, and entering into an appropriate data access agreement, subject to any applicable ethical approvals.
The code used for IMC analysis in this study was implemented as a Nextflow pipeline and is available on github along with instructions on how to run it on a test data set: https://github.com/FrancisCrickInstitute/ TRACERx-PHLEX.
The TRACERx Nuclear IMC segmentation data set, trained neural network model weights, and the test data set can be downloaded from Zenodo: https://zenodo.org/record/7973724.
K.S.S. Enfield reports other support from European Union’s Horizon 2020 research and innovation program under the Marie Skłodowska-Curie grant agreement No. 838540, grants from The Royal Society (RFERE210216), and other support from Bristol Myers Squibb during the conduct of the study. E. Colliver reports grants from Bristol Myers Squibb and The Mark Foundation for Cancer Research during the conduct of the study. A. Magness reports grants from Bristol Myers Squibb during the conduct of the study. D.A. Moore reports Speaker fees from AstraZeneca and Takeda,
consultancy fees from AstraZeneca, Thermo Fisher, Takeda, Amgen, Janssen, MIM Software, Bristol Myers Squibb, and Eli Lilly and educational support from Takeda and Amgen. T. Karasaki reports grants from the Japan Society for the Promotion of Science during the conduct of the study. K.K. Dijkstra reports grants from European Union Horizon 2020 and ZonMW during the conduct of the study; personal fees from Achilles Therapeutics UK Ltd. outside the submitted work. A. Hackshaw reports grants from Cancer Research UK during the conduct of the study. M. Jamal-Hanjani reports grants from Cancer Research UK during the conduct of the study; grants from Cancer Research UK, Rosetrees Trust, NIH National Cancer Institute, other support from Achilles Therapeutics Scientific Advisory Board and Steering Committee, Pfizer, Astex Pharmaceuticals, Oslo Cancer Cluster, and Bristol Myers Squibb outside the submitted work. N. McGranahan reports a patent for PCT/EP2016/ 059401 issued, a patent for PCT/EP2016/071471 issued, a patent for PCT/ GB2018/052004 issued, a patent for PCT/GB2020/050221 issued, and a patent for PCT/EP2022/070694 issued. B. Glass reports other support from PathAI outside the submitted work. E. Walk reports I am a full-time employee of PathAI, Inc. S.A. Quezada reports other support from Achilles Therapeutics, grants from Roche, and Sairoopa outside the submitted work. C.T. Hiley reports personal fees from GenesisCare UK, grants from Roche, and AstraZeneca outside the submitted work. J. Downward reports grants, personal fees, and nonfinancial support from AstraZeneca, personal fees from Bayer, Jubilant, Theras, BridgeBio, Vividion, Novartis, and grants and nonfinancial support from BMS, Revolution Medicines outside the submitted work. E. Sahai reports grants from Mark Foundation and the European Research Council during the conduct of the study; grants from Novartis, Merck Sharp Dohme, AstraZeneca and personal fees from Phenomic outside the submitted work. C. Swanton reports grants and personal fees from Britsol Myers Squibb, AstraZeneca, Boehringer-Ingelhiem, Roche-Ventana, personal fees from Pfizer, grants from Ono Pharmaceutical, Personalis, grants, personal fees, and other support from GRAIL, other support from AstraZeneca and GRAIL, personal fees and other support from Achilles Therapeutics, Bicycle Therapeutics, personal fees from Genentech, Medixci, China Innovation Centre of Roche (CiCoR) formerly Roche Innovation Centre, Metabomed, Relay Therapeutics, Saga Diagnostics, Sarah Canon Research Institute, Amgen, GlaxoSmithKline, Illumina, MSD, Novartis, other support from Apogen Biotechnologies and Epic Bioscience during the conduct of the study; grants and personal fees from BMS, AstraZeneca, Boehringer-Ingelheim, Roche-Ventana, grants from Ono Pharmaceuticals, Personalis, personal fees and other support from GRAIL, Achilles Therapeutics, Bicycle Therapeutics, Relay Therapeutics, personal fees from Genentech, Medixci, China Innovation Centre of Roche, Metabomed, Saga Diagnostics, Sarah Canon Research Institute, Amgen, GSK, Illumina, MSD, other support from Apogen Biosciences, and Epic Biosciences outside the submitted work; in addition, C. Swanton has a patent for PCT/ US2017/028013 licensed to Natera Inc, UCL Business, a patent for PCT/EP2016/059401 licensed to Cancer Research Technology, a patent for PCT/EP2016/071471 issued to Cancer Research Technology, a patent for PCT/GB2018/051912 pending, a patent for PCT/ GB2018/052004 issued to Francis Crick Institute, University College London, Cancer Research Technology Ltd, a patent for PCT/ GB2020/050221 issued to Francis Crick Institute, University College London, a patent for PCT/EP2022/077987 pending to Cancer Research Technology, a patent for PCT/GB2017/053289 licensed, a patent for PCT/EP2022/077987 pending to Francis Crick Institute, a patent for PCT/EP2023/059039 pending to Francis Crick Institute, and a patent for PCT/GB2018/051892 pending to Francis Crick Institute; and C.S. is a Royal Society Napier Research Professor (RSRP ). His work is supported by the Francis Crick Institute which receives its core funding from Cancer Research UK (CC2041), the UK Medical Research Council (CC2041), and the
Wellcome Trust (CC2041). For the purpose of Open Access, the author has applied a CC BY public copyright license to any Author Accepted Manuscript version arising from this submission. C.S. is funded by Cancer Research UK (TRACERx (C11496/A17786), PEACE (C416/A21999) and CRUK Cancer Immunotherapy Catalyst Network); Cancer Research UK Lung Cancer Centre of Excellence (C11496/A30025); the Rosetrees Trust, Butterfield and Stoneygate Trusts; NovoNordisk Foundation (ID16584); Royal Society Professorship Enhancement Award (RP/EA/180007 and RFERE231118)); National Institute for Health Research (NIHR) University College London Hospitals Biomedical Research Centre; the Cancer Research UK-University College London Centre; Experimental Cancer Medicine Centre; the Breast Cancer Research Foundation (US; BCRF-22157); Cancer Research UK Early Detection and Diagnosis Primer Award (Grant EDDPMA-Nov21/100034); and The Mark Foundation for Cancer Research Aspire Award (Grant 21-029-ASP) and ASPIRE II award. This work was supported by a Stand Up To Cancer-LUN-Gevity-American Lung Association Lung Cancer Interception Dream Team Translational Research Grant (Grant Number: SU2C-AACR-DT23-17 to S.M. Dubinett and A.E. Spira). Stand Up To Cancer is a division of the Entertainment Industry Foundation. Research grants are administered by the American Association for Cancer Research, the Scientific Partner of SU2C. CS is in receipt of an ERC Advanced Grant (PROTEUS) from the European Research Council under the European Union’s Horizon 2020 research and innovation program (grant agreement no. 835297). C.S is Co-chief Investigator of NHS Galleri trial funded by GRAIL. He is Chief Investigator for the AstraZeneca MeRmaiD I and II clinical trials and Chair of the Steering Committee. C.S is cofounder of Achilles Therapeutics and holds stock options. M. Angelova reports grants from Bristol Myers Squibb during the conduct of the study; in addition, M. Angelova has a patent for WO2020201362A2 issued, a patent for JP2022527972A pending, a patent for EP3947737A2 pending, and a patent for US20220177978A1 pending. No disclosures were reported by the other authors.
Authors’ Contributions
K.S.S. Enfield: Conceptualization, resources, data curation, formal analysis, supervision, funding acquisition, validation, investigation, visualization, methodology, writing-original draft, writing-review and editing. E. Colliver: Data curation, software, formal analysis, validation, investigation, visualization, methodology, writing-original draft, writing-review and editing. C. Lee: Data curation, formal analysis, investigation, visualization, methodology, writing-original draft. A. Magness: Data curation, software, formal analysis, validation, investigation, visualization, methodology, writing-original draft. D.A. Moore: Resources, data curation, validation. M. Sivakumar: Data curation, visualization. K. Grigoriadis: Software, formal analysis, visualization. O. Pich: Data curation. T. Karasaki: Data curation, validation, methodology. P.S. Hobson: Investigation, methodology. D. Levi: Investigation, methodology. S. Veeriah: Resources, data curation. C. Puttick: Data curation. E.L. Nye: Investigation, methodology. M. Green: Validation, investigation, methodology. K.K. Dijkstra: Data curation. M. Shimato: Software. A.U. Akarca: Validation, investigation. T. Marafioti: Validation, visualization. R. Salgado: Data curation. A. Hackshaw: Data curation, validation. TRACERx Consortium: Resources, data curation. M. Jamal-Hanjani: Data curation, supervision. F. van Maldegem: Methodology. N. McGranahan: Data curation, supervision. B. Glass: Validation, investigation. H. Pulaski: Validation. E. Walk: Validation. J.L. Reading: Conceptualization. S.A. Quezada: Conceptualization. C.T. Hiley: Conceptualization, data curation, funding acquisition, writing-review and editing. J. Downward: Conceptualization, supervision, funding acquisition, writing-review and editing. E. Sahai: Conceptualization, supervision, funding acquisition, writ-ing-review and editing. C. Swanton: Conceptualization, resources,
supervision, funding acquisition, writing-original draft, writingreview and editing. M. Angelova: Conceptualization, data curation, software, formal analysis, supervision, validation, investigation, visualization, methodology, writing-original draft, writing-review and editing.
Acknowledgments
We are grateful for assistance from the Advanced Light Microscopy, Advanced Sequencing, Experimental Histopathology, Biological Research, Cell Services, Proteomics, Flow Cytometry, and Scientific Computing facilities at the Francis Crick Institute. The TRACERx study (Clinicaltrials.gov no: NCT01888601) is sponsored by University College London (UCL/12/0279) and has been approved by an independent Research Ethics Committee (13/LO/1546). TRACERx is funded by Cancer Research UK (C11496/A17786) and coordinated through the Cancer Research UK and UCL Cancer Trials Centre which has a core grant from CRUK (C444/A15953). We gratefully acknowledge the patients and relatives who participated in the TRACERx and PEACE studies. We thank all site personnel, investigators, funders, and industry partners that supported the generation of the data within this study. This work was supported by the Francis Crick Institute, which receives its core funding from Cancer Research UK (CC2041), the UK Medical Research Council (CC2041), and the Wellcome Trust (CC2041). This work was also supported by the Cancer Research UK Lung Cancer Centre of Excellence and the CRUK City of London Centre Award (C7893/A26233) as well as the UCL Experimental Cancer Medicine Centre. This work was supported by funding as part of a research collaboration with BristolMyers Squibb. This project has received funding from the European Research Council (ERC) under the European Union’s Horizon 2020 research and innovation program (grant agreement No. 101018670). For the purpose of Open Access, the author has applied a CC BY public copyright licence to any Author Accepted Manuscript version arising from this submission. C. Swanton is a Royal Society Napier Research Professor (RSRP ). His work is supported by the Francis Crick Institute that receives its core funding from Cancer Research UK (CC2041), the UK Medical Research Council (CC2041), and the Wellcome Trust (CC2041). C. Swanton is funded by Cancer Research UK (TRACERx (C11496/A17786), PEACE (C416/A21999) and CRUK Cancer Immunotherapy Catalyst Network); Cancer Research UK Lung Cancer Centre of Excellence (C11496/A30025); the Rosetrees Trust, Butterfield and Stoneygate Trusts; NovoNordisk Foundation (ID16584); Royal Society Professorship Enhancement Award (RP/EA/180007 & RFERE231118)); National Institute for Health Research (NIHR) University College London Hospitals Biomedical Research Centre; the Cancer Research UK-University College London Centre; Experimental Cancer Medicine Centre; the Breast Cancer Research Foundation (US; BCRF-22-157); Cancer Research UK Early Detection and Diagnosis Primer Award (Grant EDDPMANov21/100034); and The Mark Foundation for Cancer Research Aspire Award (Grant 21-029-ASP) and ASPIRE II award (23-034ASP). This work was supported by a Stand Up To Cancer-LUNGev-ity-American Lung Association Lung Cancer Interception Dream Team Translational Research Grant (Grant Number: SU2C-AACR-DT23-17 to S.M. Dubinett and A.E. Spira). The indicated Stand Up To Cancer grant is administered by the American Association for Cancer Research, the Scientific Partner of SU2C. C. Swanton is in receipt of an ERC Advanced Grant (PROTEUS) from the European Research Council under the European Union’s Horizon 2020 research and innovation program (grant agreement no. 835297). E. Colliver and E. Sahai were partly funded by The Mark Foundation for Cancer Research (MFCR ASPIRE 2022-0384). E. Sahai is additionally supported by the European Research Council (ERC Advanced Grant CAN_ORGANISE, Grant agreement number 101019366) and the Francis Crick Institute, which receives its core funding from
Cancer Research UK (CC2040), the UK Medical Research Council (CC2040), and the Wellcome Trust (CC2040). N. McGranahan is a Sir Henry Dale Fellow, jointly funded by the Wellcome Trust and the Royal Society (Grant Number 211179/Z/18/Z), and also receives funding from Cancer Research UK, Rosetrees and the NIHR BRC at University College London Hospitals and the CRUK University College London Experimental Cancer Medicine Centre. F. van Maldegem is a recipient of the Amsterdam UMC fellowship and receives funding from the European Research Council under the European Union’s Horizon Europe WIDERA work programme (grant agreement No. 101079113). M. Jamal-Hanjani is a CRUK Career Establishment Awardee and has received funding from CRUK, IASLC International Lung Cancer Foundation, Lung Cancer Research Foundation, Rosetrees Trust, UKI NETs, NIHR, NIHR UCLH Biomedical Research Centre. K.K. Dijkstra was supported by funding from the European Union’s Horizon 2020 research and innovation program under the Marie Skłodowska-Curie grant agreement No. 101024529 and ZonMW Rubicon fellowship (no. 20-45200-98-20102). T. Karasaki was supported by the JSPS Overseas Research Fellowships Program (202060447). K.S.S. Enfield was supported by the European Union’s Horizon 2020 research and innovation program under the Marie Skłodowska-Curie grant agreement No. 838540 and is supported by the Royal Society (RFERE210216). The authors acknowledge the use of BioRender.com licensed by The Francis Crick Institute to create illustrations in Fig. 1A, Supplementary Fig. S1A, and Supplementary Fig. S12A and S12B.
Received November 17, 2023; revised February 27, 2024; accepted March 22, 2024; published first April 12, 2024.
REFERENCES
Sorin M, Rezanejad M, Karimi E, Fiset B, Desharnais L, Perus LJM, et al. Single-cell spatial landscapes of the lung tumour immune microenvironment. Nature 2023;614:548-54.
Ali HR, Jackson HW, Zanotelli VRT, Danenberg E, Fischer JR, Bardwell H, et al. Imaging mass cytometry and multiplatform genomics define the phenogenomic landscape of breast cancer. Nat Cancer 2020;1:163-75.
Jackson HW, Fischer JR, Zanotelli VRT, Ali HR, Mechera R, Soysal SD, et al. The single-cell pathology landscape of breast cancer. Nature 2020; 578:615-20.
Danenberg E, Bardwell H, Zanotelli VRT, Provenzano E, Chin S-F, Rueda OM, et al. Breast tumor microenvironment structures are associated with genomic features and clinical outcome. Nat Genet 2022;54:660-9.
Wang XQ, Danenberg E, Huang C-S, Egle D, Callari M, Bermejo B, et al. Spatial predictors of immunotherapy response in triple-negative breast cancer. Nature 2023;621:868-76.
Li R, Lin Y, Wang Y, Wang S, Yang Y, Mu X, et al. Characterization of the tumor immune microenvironment in lung squamous cell carcinoma using imaging mass cytometry. Front Oncol 2021;11:620989.
Karimi E, Yu MW, Maritan SM, Perus LJM, Rezanejad M, Sorin M, et al. Single-cell spatial immune landscapes of primary and metastatic brain tumours. Nature 2023;614:555-63.
Cords L, Engler S, Haberecker M, Rüschoff JH, Moch H, de Souza N, et al. Cancer-associated fibroblast phenotypes are associated with patient outcome in non-small cell lung cancer. Cancer Cell 2024;42: 396-412.
Keren L, Bosse M, Marquez D, Angoshtari R, Jain S, Varma S, et al. A structured tumor-immune microenvironment in triple negative breast cancer revealed by multiplexed ion beam imaging. Cell 2018; 174:1373-87.
Rosenthal R, Cadieux EL, Salgado R, Bakir MA, Moore DA, Hiley CT, et al. Neoantigen-directed immune escape in lung cancer evolution. Nature 2019;567:479-85.
McGranahan N, Rosenthal R, Hiley CT, Rowan AJ, Watkins TBK, Wilson GA, et al. Allele-specific HLA loss and immune escape in lung cancer evolution. Cell 2017;171:1259-71.
Jamal-Hanjani M, Wilson GA, McGranahan N, Birkbak NJ, Watkins TBK, Veeriah S, et al. Tracking the evolution of non-small-cell lung cancer. N Engl J Med 2017;376:2109-21.
Martínez-Ruiz C, Black JRM, Puttick C, Hill MS, Demeulemeester J, Larose Cadieux E, et al. Genomic-transcriptomic evolution in lung cancer and metastasis. Nature 2023;616:543-52.
Frankell AM, Dietzen M, Al Bakir M, Lim EL, Karasaki T, Ward S, et al. The evolution of lung cancer and impact of subclonal selection in TRACERx. Nature 2023;616:525-33.
Al Bakir M, Huebner A, Martínez-Ruiz C, Grigoriadis K, Watkins TBK, Pich O, et al. The evolution of non-small cell lung cancer metastases in TRACERx. Nature 2023;616:534-42.
Ghorani E, Reading JL, Henry JY, de Massy MR, Rosenthal R, Turati V, et al. The T cell differentiation landscape is shaped by tumour mutations in lung cancer. Nat Cancer 2020;1:546-61.
Chen DS, Mellman I. Elements of cancer immunity and the cancerimmune set point. Nature 2017;541:321-30.
Ricciuti B, Wang X, Alessi JV, Rizvi H, Mahadevan NR, Li YY, et al. Association of high tumor mutation burden in non-small cell lung cancers with increased immune infiltration and improved clinical outcomes of PD-L1 blockade across PD-L1 expression levels. JAMA Oncol 2022;8:1160-8.
Salmon H, Franciszkiewicz K, Damotte D, Dieu-Nosjean M-C, Validire P, Trautmann A, et al. Matrix architecture defines the preferential localization and migration of T cells into the stroma of human lung tumors. J Clin Invest 2012;122:899-910.
Grout JA, Sirven P, Leader AM, Maskey S, Hector E, Puisieux I, et al. Spatial positioning and matrix programs of cancer-associated fibroblasts promote T-cell exclusion in human lung tumors. Cancer Discov 2022;12:2606-25.
AbdulJabbar K, Raza SEA, Rosenthal R, Jamal-Hanjani M, Veeriah S, Akarca A, et al. Geospatial immune variability illuminates differential evolution of lung adenocarcinoma. Nat Med 2020;26:1054-62.
Gentles AJ, Newman AM, Liu CL, Bratman SV, Feng W, Kim D, et al. The prognostic landscape of genes and infiltrating immune cells across human cancers. Nat Med 2015;21:938-45.
Kargl J, Busch SE, Yang GHY, Kim K-H, Hanke ML, Metz HE, et al. Neutrophils dominate the immune cell composition in non-small cell lung cancer. Nat Commun 2017;8:14381.
Lee DC, Sohn HA, Park Z-Y, Oh S, Kang YK, Lee K-M, et al. A lactateinduced response to hypoxia. Cell 2015;161:595-609.
DePeaux K, Delgoffe GM. Metabolic barriers to cancer immunotherapy. Nat Rev Immunol 2021;21:785-97.
Dimmer KS, Friedrich B, Lang F, Deitmer JW, Bröer S. The lowaffinity monocarboxylate transporter MCT4 is adapted to the export of lactate in highly glycolytic cells. Biochem J 2000;350(Pt 1):219-27.
DeBerardinis RJ, Chandel NS. Fundamentals of cancer metabolism. Sci Adv 2016;2:e1600200.
Spranger S, Gajewski TF. Impact of oncogenic pathways on evasion of antitumour immune responses. Nat Rev Cancer 2018;18:139-47.
Altorki NK, Markowitz GJ, Gao D, Port JL, Saxena A, Stiles B, et al. The lung microenvironment: an important regulator of tumour growth and metastasis. Nat Rev Cancer 2019;19:9-31.
Salgado R, Denkert C, Demaria S, Sirtaine N, Klauschen F, Pruneri G, et al. The evaluation of tumor-infiltrating lymphocytes (TILs) in breast cancer: recommendations by an International TILs Working Group 2014. Ann Oncol 2015;26:259-71.
Salcher S, Sturm G, Horvath L, Untergasser G, Kuempers C, Fotakis G, et al. High-resolution single-cell atlas reveals diversity and plasticity of tissue-resident neutrophils in non-small cell lung cancer. Cancer Cell 2022;40:1503-20.
Simoncello F, Piperno GM, Caronni N, Amadio R, Cappelletto A, Canarutto G, et al. CXCL5-mediated accumulation of mature neutro-
phils in lung cancer tissues impairs the differentiation program of anticancer CD8 T cells and limits the efficacy of checkpoint inhibitors. Oncoimmunology 2022;11:2059876.
Janiszewska M, Tabassum DP, Castaño Z, Cristea S, Yamamoto KN, Kingston NL, et al. Subclonal cooperation drives metastasis by modulating local and systemic immune microenvironments. Nat Cell Biol 2019;21:879-88.
Giese MA, Hind LE, Huttenlocher A. Neutrophil plasticity in the tumor microenvironment. Blood 2019;133:2159-67.
Teijeira A, Garasa S, Ochoa MC, Villalba M, Olivera I, Cirella A, et al. IL8, neutrophils, and NETs in a collusion against cancer immunity and immunotherapy. Clin Cancer Res 2021;27:2383-93.
Park SY, Lee H-S, Jang H-J, Lee GK, Chung KY, Zo JI. Tumor necrosis as a prognostic factor for stage IA non-small cell lung cancer. Ann Thorac Surg 2011;91:1668-73.
Diao JA, Wang JK, Chui WF, Mountain V, Gullapally SC, Srinivasan R, et al. Human-interpretable image features derived from densely mapped cancer pathology slides predict diverse molecular phenotypes. Nat Commun 2021;12:1613.
Thorsson V, Gibbs DL, Brown SD, Wolf D, Bortone DS, Ou Yang T-H, et al. The immune landscape of cancer. Immunity 2018;48:812-30.
Bagaev A, Kotlov N, Nomie K, Svekolkin V, Gafurov A, Isaeva O, et al. Conserved pan-cancer microenvironment subtypes predict response to immunotherapy. Cancer Cell 2021;39:845-65.
Combes AJ, Samad B, Tsui J, Chew NW, Yan P, Reeder GC, et al. Discovering dominant tumor immune archetypes in a pan-cancer census. Cell 2022;185:184-203.
Feig C, Jones JO, Kraman M, Wells RJB, Deonarine A, Chan DS, et al. Targeting CXCL12 from FAP-expressing carcinoma-associated fibroblasts synergizes with anti-PD-L1 immunotherapy in pancreatic cancer. Proc Natl Acad Sci U S A 2013;110:20212-7.
Mariathasan S, Turley SJ, Nickles D, Castiglioni A, Yuen K, Wang Y, et al. TGF attenuates tumour response to PD-L1 blockade by contributing to exclusion of T cells. Nature 2018;554:544-8.
Li X, Gruosso T, Zuo D, Omeroglu A, Meterissian S, Guiot M-C, et al. Infiltration of CD8+ T cells into tumor cell clusters in triple-negative breast cancer. Proc Natl Acad Sci U S A 2019;116:3678-87.
McGranahan N, Furness AJS, Rosenthal R, Ramskov S, Lyngaa R, Saini SK, et al. Clonal neoantigens elicit T cell immunoreactivity and sensitivity to immune checkpoint blockade. Science 2016;351: 1463-9.
RaviA,Hellmann MD,Arniella MB,Holton M,Freeman SS, Naranbhai V, et al. Genomic and transcriptomic analysis of checkpoint blockade response in advanced non-small cell lung cancer. Nat Genet 2023;55: 807-19.
PeranzoniE,LemoineJ,VimeuxL,FeuilletV,BarrinS,Kantari-MimounC, et al. Macrophages impede CD8 T cells from reaching tumor cells and limit the efficacy of anti-PD-1 treatment. Proc Natl Acad Sci U S A 2018; 115:E4041-50.
Kersten K, Hu KH, Combes AJ, Samad B, Harwin T, Ray A, et al. Spatiotemporal co-dependency between macrophages and exhausted CD8+ T cells in cancer. Cancer Cell 2022;40:624-38.
Mantovani A, Allavena P, Marchesi F, Garlanda C. Macrophages as tools and targets in cancer therapy. Nat Rev Drug Discov 2022; 21:799-820.
Litchfield K, Reading JL, Puttick C, Thakkar K, Abbosh C, Bentham R, et al. Meta-analysis of tumor- and T cell-intrinsic mechanisms of sensitization to checkpoint inhibition. Cell 2021;184:596-614.
Patil NS, Nabet BY, Müller S, Koeppen H, Zou W, Giltnane J, et al. Intratumoral plasma cells predict outcomes to PD-L1 blockade in non-small cell lung cancer. Cancer Cell 2022;40:289-300.
Vanhersecke L, Brunet M, Guégan J-P, Rey C, Bougouin A, Cousin S, et al. Mature tertiary lymphoid structures predict immune checkpoint inhibitor efficacy in solid tumors independently of PD-L1 expression. Nat Cancer 2021;2:794-802.
Rizvi NA, Hellmann MD, Snyder A, Kvistborg P, Makarov V, Havel JJ, et al. Cancer immunology. mutational landscape determines sensitivity to PD-1 blockade in non-small cell lung cancer. Science 2015;348: 124-8.
Ng KW, Boumelha J, Enfield KSS, Almagro J, Cha H, Pich O, et al. Antibodies against endogenous retroviruses promote lung cancer immunotherapy. Nature 2023;616:563-73.
Hao D, Han G, Sinjab A, Gomez-Bolanos LI, Lazcano R, Serrano A, et al. The single-cell immunogenomic landscape of B and plasma cells in early-stage lung adenocarcinoma. Cancer Discov 2022;12: 2626-45.
Leader AM, Grout JA, Maier BB, Nabet BY, Park MD, Tabachnikova A, et al. Single-cell analysis of human non-small cell lung cancer lesions refines tumor classification and patient stratification. Cancer Cell 2021;39:1594-609.
Templeton AJ, McNamara MG, Šeruga B, Vera-Badillo FE, Aneja P, Ocaña A, et al. Prognostic role of neutrophil-to-lymphocyte ratio in solid tumors: a systematic review and meta-analysis. J Natl Cancer Inst 2014;106:dju124.
Rakaee M, Busund L-T, Paulsen E-E, Richardsen E, Al-Saad S, Andersen S, et al. Prognostic effect of intratumoral neutrophils across histological subtypes of non-small cell lung cancer. Oncotarget 2016;7:72184-96.
Carus A, Ladekarl M, Hager H, Pilegaard H, Nielsen PS, Donskov F. Tumor-associated neutrophils and macrophages in non-small cell lung cancer: no immediate impact on patient outcome. Lung Cancer 2013;81:130-7.
Ballesteros I, Rubio-Ponce A, Genua M, Lusito E, Kwok I, FernándezCalvo G, et al. Co-option of neutrophil fates by tissue environments. Cell 2020;183:1282-97.
Szczerba BM, Castro-Giner F, Vetter M, Krol I, Gkountela S, Landin J, et al. Neutrophils escort circulating tumour cells to enable cell cycle progression. Nature 2019;566:553-7.
Faget J, Groeneveld S, Boivin G, Sankar M, Zangger N, Garcia M, et al. Neutrophils and snail orchestrate the establishment of a pro-tumor microenvironment in lung cancer. Cell Rep 2017;21:3190-204.
Varrone M, Tavernari D, Santamaria-Martínez A, Walsh LA, Ciriello G. CellCharter reveals spatial cell niches associated with tissue remodeling and cell plasticity. Nat Genet 2024;56:74-84.
Schuurbiers OCJ,Meijer TWH,KaandersJHAM,Looijen-SalamonMG, de Geus-Oei L-F, van der Drift MA, et al. Glucose metabolism in NSCLC is histology-specific and diverges the prognostic potential of 18FDG-PET for adenocarcinoma and squamous cell carcinoma. J Thorac Oncol 2014;9:1485-93.
Wculek SK, Malanchi I. Neutrophils support lung colonization of metastasis-initiating breast cancer cells. Nature 2015;528:413-7.
van Maldegem F, Valand K, Cole M, Patel H, Angelova M, Rana S, et al. Characterisation of tumour microenvironment remodelling following oncogene inhibition in preclinical studies with imaging mass cytometry. Nat Commun 2021;12:5906.
Sparmann A, Bar-Sagi D. Ras-induced interleukin-8 expression plays a critical role in tumor growth and angiogenesis. Cancer Cell 2004;6: 447-58.
Lin C-H, Cheng H-W, Hsu M-J, Chen M-C, Lin C-C, Chen B-C. c-Src mediates thrombin-induced NF-kappaB activation and IL-8/CXCL8 expression in lung epithelial cells. J Immunol 2006;177:3427-38.
Hao Y, Samuels Y, Li Q, Krokowski D, Guan B-J, Wang C, et al. Oncogenic PIK3CA mutations reprogram glutamine metabolism in colorectal cancer. Nat Commun 2016;7:11971.
Koundouros N, Karali E, Tripp A, Valle A, Inglese P, Perry NJS, et al. Metabolic fingerprinting links oncogenic PIK3CA with enhanced arachidonic acid-derived eicosanoids. Cell 2020;181:1596-611.
Hutti JE, Pfefferle AD, Russell SC, Sircar M, Perou CM, Baldwin AS. Oncogenic PI3K mutations lead to NF-кB-dependent cytokine expression following growth factor deprivation. Cancer Res 2012;72:3260-9.
Forde PM, Spicer J, Lu S, Provencio M, Mitsudomi T, Awad MM, et al. Neoadjuvant nivolumab plus chemotherapy in resectable lung cancer. N Engl J Med 2022;386:1973-85.
Wakelee H, Liberman M, Kato T, Tsuboi M, Lee S-H, Gao S, et al. Perioperative pembrolizumab for early-stage non-small-cell lung cancer. N Engl J Med 2023;389:491-503.
Lu S, Wu L, Zhang W, Zhang P, Wang W, Fang W, et al. Perioperative toripalimab + platinum-doublet chemotherapy vs chemotherapy in resectable stage II/III non-small cell lung cancer (NSCLC): interim
event-free survival (EFS) analysis of the phase III Neotorch study. J Clin Orthod 2023;41:425126.
Heymach JV, Harpole D, Mitsudomi T, Taube JM, Galffy G, Hochmair M, et al. Abstract CT005: AEGEAN: a phase 3 trial of neoadjuvant durvalumab + chemotherapy followed by adjuvant durvalumab in patients with resectable NSCLC. Cancer Res 2023;83:CT005.
Shim JH, Kim HS, Cha H, Kim S, Kim TM, Anagnostou V, et al. HLAcorrected tumor mutation burden and homologous recombination deficiency for the prediction of response to PD-(L)1 blockade in advanced non-small-cell lung cancer patients. Ann Oncol 2020;31:902-11.
Jenkins L, Jungwirth U, Avgustinova A, Iravani M, Mills A, Haider S, et al. Cancer-associated fibroblasts suppress CD8+ T-cell infiltration and confer resistance to immune-checkpoint blockade. Cancer Res 2022;82:2904-17.
Hu H, Piotrowska Z, Hare PJ, Chen H, Mulvey HE, Mayfield A, et al. Three subtypes of lung cancer fibroblasts define distinct therapeutic paradigms. Cancer Cell 2021;39:1531-47.
Schalper KA, Carleton M, Zhou M, Chen T, Feng Y, Huang S-P, et al. Elevated serum interleukin-8 is associated with enhanced intratumor neutrophils and reduced clinical benefit of immune-checkpoint inhibitors. Nat Med 2020;26:688-92.
Yuen KC, Liu L-F, Gupta V, Madireddi S, Keerthivasan S, Li C, et al. High systemic and tumor-associated IL-8 correlates with reduced clinical benefit of PD-L1 blockade. Nat Med 2020;26:693-8.
Teijeira Á, Garasa S, Gato M, Alfaro C, Migueliz I, Cirella A, et al. CXCR1 and CXCR2 chemokine receptor agonists produced by tumors induce neutrophil extracellular traps that interfere with immune cytotoxicity. Immunity 2020;52:856-71.
Karasaki T, Moore DA, Veeriah S, Naceur-Lombardelli C, Toncheva A, Magno N, et al. Evolutionary characterization of lung adenocarcinoma morphology in TRACERx. Nat Med 2023;29:833-45.
Catena R, Montuenga LM, Bodenmiller B. Ruthenium counterstaining for imaging mass cytometry. J Pathol 2018;244:479-84.
Chevrier S, Crowell HL, Zanotelli VRT, Engler S, Robinson MD, Bodenmiller B. Compensation of signal spillover in suspension and imaging mass cytometry. Cell Syst 2018;6:612-20.
McQuin C, Goodman A, Chernyshev V, Kamentsky L, Cimini BA, Karhohs KW, et al. CellProfiler 3.0: Next-generation image processing for biology. PLoS Biol 2018;16:e2005970.
Zhang AW, O’Flanagan C, Chavez EA, Lim JLP, Ceglia N, McPherson A, et al. Probabilistic cell-type assignment of single-cell RNA-seq for tumor microenvironment profiling. Nat Methods 2019;16:1007-15.
Schürch CM, Bhate SS, Barlow GL, Phillips DJ, Noti L, Zlobec I, et al. Coordinated cellular neighborhoods orchestrate antitumoral immunity at the colorectal cancer invasive front. Cell 2020;182:1341-59.
Eling N, Damond N, Hoch T, Bodenmiller B. Cytomapper: an R/bioconductor package for visualisation of highly multiplexed imaging data. Bioinformatics 2020;36:5706-8.
Failmezger H, Muralidhar S, Rullan A, de Andrea CE, Sahai E, Yuan Y. Topological tumor graphs: a graph-based spatial model to infer stromal recruitment for immunosuppression in melanoma histology. Cancer Res 2020;80:1199-209.
Marafioti T, Jones M, Facchetti F, Diss TC, Du M-Q, Isaacson PG, et al. Phenotype and genotype of interfollicular large B cells, a subpopulation of lymphocytes often with dendritic morphology. Blood 2003;102:2868-76.
Schapiro D, Jackson HW, Raghuraman S, Fischer JR, Zanotelli VRT, Schulz D, et al. histoCAT: analysis of cell phenotypes and interactions in multiplex image cytometry data. Nat Methods 2017;14:873-6.
Merino DM, McShane LM, Fabrizio D, Funari V, Chen S-J, White JR, et al. Establishing guidelines to harmonize tumor mutational burden (TMB): in silico assessment of variation in TMB quantification across diagnostic platforms: phase I of the Friends of Cancer Research TMB Harmonization Project. J Immunother Cancer 2020;8:e000147.
Mermel CH, Schumacher SE, Hill B, Meyerson ML, Beroukhim R, Getz G. GISTIC2.0 facilitates sensitive and confident localization
of the targets of focal somatic copy-number alteration in human cancers. Genome Biol 2011;12:R41.
Reynisson B, Alvarez B, Paul S, Peters B, Nielsen M. NetMHCpan-4.1 and NetMHCIIpan-4.0: improved predictions of MHC antigen presentation by concurrent motif deconvolution and integration of MS MHC eluted ligand data. Nucleic Acids Res 2020;48:W449-54.
Kawaguchi S, Matsuda F. High-definition genomic analysis of HLA genes via comprehensive HLA allele genotyping. Methods Mol Biol 2020;2131:31-8.
Grigoriadis K, Huebner A, Bunkum A, Colliver E, Frankell AM, Hill MS, et al. CONIPHER: a computational framework for scalable phylogenetic reconstruction with error correction. Nat Protoc 2024;19:159-83.
Cancer Evolution and Genome Instability Laboratory, The Francis Crick Institute, London, United Kingdom. Cancer Research UK Lung Cancer Centre of Excellence, University College London Cancer Institute, London, United Kingdom. Department of Cellular Pathology, University College London Hospitals, London, United Kingdom. Cancer Genome Evolution Research Group, Cancer Research UK Lung Cancer Centre of Excellence, University College London Cancer Institute, London, United Kingdom. Cancer Metastasis Laboratory, University College London Cancer Institute, London, United Kingdom. Flow Cytometry, The Francis Crick Institute, London, United Kingdom. Experimental Histopathology, The Francis Crick Institute, London, United Kingdom. Department of Pathology, ZAS Hospitals, Antwerp, Belgium. Division of Research, Peter MacCallum Cancer Centre, Melbourne, Australia. Cancer Research UK and University College London Cancer Trials Centre, London, United Kingdom. Department of Oncology, University College London Hospitals, London, United Kingdom. Oncogene Biology Laboratory, The Francis Crick Institute, London, United Kingdom. PathAI, Inc., Boston, Massachusetts. Pre-cancer Immunology Laboratory, University College London Cancer Institute, London, United Kingdom. Immune Regulation and Tumour Immunotherapy Group, Cancer Immunology Unit, Research Department of Haematology, University College London Cancer Institute, London, United Kingdom. Tumour Cell Biology Laboratory, The Francis Crick Institute, London, United Kingdom.