DOI: https://doi.org/10.1038/s41377-023-01365-2
PMID: https://pubmed.ncbi.nlm.nih.gov/38225231
تاريخ النشر: 2024-01-16
انبعاثات الأشعة تحت الحمراء القريبة من كل من القطع الكمي عالي الكفاءة (173%) والتحويل الطيفي النقي تقريبًا في NaY(WO4)2:Er3+/Yb3+ مع قدرة إدارة حرارية لخلايا الشمسية القائمة على السيليكون
الملخص
زيادة كفاءة تحويل الطاقة الضوئية وتعزيز إدارة الحرارة هما قضيتان حاسمتان للخلايا الشمسية القائمة على السيليكون. في هذا العمل، الكفاءة
مقدمة
لقد جذبت تحويل الطاقة إلى طاقة كهربائية اهتمامًا متزايدًا، وتم تطوير العديد من أنواع خلايا الشمس، مثل خلايا الشمس السيليكونية، وخلايا الشمس الحساسة للصبغة، وخلايا الشمس الرقيقة من كادميوم تيلورايد، وخلايا الشمس البيروفيسكية، وخلايا الشمس الكمية، وخلايا الشمس العضوية.
باستثناء التحسينات التقنية في عمليات الخلايا الشمسية التقليدية، هناك طريق آخر لزيادة كفاءة خلايا الشمسية القائمة على السيليكون وهو إدخال مواد تحويل الضوء. إحدى مواد تحويل الضوء قادرة على تحويل فوتون واحد ذو طاقة قريبة من أو أعلى من ضعف طاقة فجوة السيليكون إلى فوتونين أو أكثر ذو طاقة أكبر من طاقة فجوة السيليكون. تُعرف هذه العملية على نطاق واسع باسم القطع الكمي أو التحويل النزولي.
يجب أن تعمل الأجهزة الكهروضوئية عندما تتعرض لأشعة الشمس. خاصة، تعاني خلايا الشمس المركزة من إشعاع ضوء الشمس عالي الكثافة.
قياس، قياس درجة الحرارة باستخدام الثيرموكوبل، قياس درجة الحرارة باستخدام الإشعاع تحت الأحمر، قياس درجة الحرارة باستخدام الفلورسنت وما إلى ذلك
تم تقديمها إلى
القسم التجريبي
تحضير العينة
لإعداد العينات، تم وزن المواد الأولية وفقًا للنسبة الستيوكيومترية المصممة. ثم تم طحن المواد الخام في هاون من العقيق لمدة 30 دقيقة لخلطها بشكل متساوٍ. تم وضع الدفعة المختلطة جيدًا في قرص من الألومينا، ثم تم وضعها في فرن كهربائي. بعد أن تم حرقها في الهواء عند
توصيف العينة
النتائج والمناقشة
هيكل بلوري
القطع الكمي لـ
امتصاص الطول الموجي القصير
اعتماديات شدة الانبعاث المتكاملة المعيارية على
تركيزات. من المعروف جيدًا أن شدة الانبعاث لمستوى ما تتناسب مع عدد الجزيئات فيه، وبالتالي فإن تغيير شدة الانبعاث يعكس تغيير عدد الجزيئات. يوضح الشكل 2b الاعتماديات لشدة الانبعاث المتكاملة المعيارية لجميع الانتقالات الملاحظة على
آليات القطع الكمي
من الشكل 3أ، يمكن ملاحظة أن العينات ذات المتغيرات
من خلال فحص مخطط مستويات الطاقة لـ
استنادًا إلى التحليلات المذكورة أعلاه، يتم توضيح طرق تقسيم الفوتونات المحددة في الشكل 3e. في الخطوة الأولى،
يمكن أن يحدث في الوقت نفسه تأثيران من انبعاث الأشعة تحت الحمراء
كفاءة القطع الكمي
يزيد
عند درجة حرارة معينة، فإن معدل الانتقال غير الإشعاعي
المستمدة من الشكل S4 في المعادلة (3)، معدلات الاسترخاء غير الإشعاعي لـ
طيف مقطع الانبعاث
| المستوى الأولي | المستوى النهائي | عدد الموجات | معدل الانتقال (
|
نسبة الفرع (%) | معدل الإشعاع الكلي (
|
معدل غير إشعاعي
|
عمر الإشعاع (مللي ثانية) | |
| ED | مد | |||||||
|
|
|
١٧٧٢.٣٢ | 12.69 | 0.27 | ٤٦٦٣.٤٣ | ٥٧٤٨٢.٣٣ | 0.214 | |
|
|
٣٠٦٥.١٣ | 5.08 | 0.11 | |||||
|
|
٣٨٣٩.٨٧ | 12.69 | 0.27 | |||||
|
|
6931.7 | 314.79 | 6.75 | |||||
|
|
9675.17 | 538.19 | 11.54 | |||||
|
|
11891.64 | 614.34 | ١٣.١٧ | |||||
|
|
15546.65 | 2729.01 | ٥٨.٥٢ | |||||
|
|
٢٢٢٢٢.٢٢ | ٤٣٦.٦٤ | 9.36 | |||||
|
|
|
١٢٩٢.٨١ | 5.08 | 0.06 | 7928.11 | 79668.76 | 0.126 | |
|
|
٢٠٦٧.٥٥ | 0.00 | 0.00 | |||||
|
|
5159.38 | 50.77 | 0.64 | |||||
|
|
7902.85 | ٣٣٧.٦٤ | ٤.٢٦ | |||||
|
|
١٠١١٩.٣٢ | 863.13 | 10.89 | |||||
|
|
13774.33 | 2465.00 | 31.09 | |||||
|
|
20449.9 | ٤٢٠٦.٤٩ | 53.06 | |||||
|
|
|
٧٧٤٫٧٤ | 0.00 | 0.00 | 87282.66 | ٢٣٤٤٣.٦٦ | 0.011 | |
|
|
٣٨٦٦.٥٧ | ٣٤٥.٢٥ | 0.40 | |||||
|
|
6610.04 | 926.59 | 1.06 | |||||
|
|
8826.51 | ٥٥٨.٥٠ | 0.64 | |||||
|
|
١٢٤٨١.٥٢ | ٩٤٩.٤٤ | 1.09 | |||||
|
|
19157.09 | 84502.88 | ٩٦.٨٢ | |||||
|
|
|
٣٠٩١.٨٣ | 0.00 | 0.00 | ٦٣٧.٢٠ | 1.569 | ||
|
|
5835.3 | ٩٦.٤٧ | 15.14 | |||||
|
|
٨٠٥١.٧٧ | ٢٢.٨٥ | ٣.٥٩ | |||||
|
|
١١٧٠٦.٧٩ | ١٤٧.٢٤ | 23.11 | |||||
|
|
18382.35 | 370.64 | 58.17 | |||||
|
|
|
٢٧٤٣.٤٧ | ٤٥.٧٠ | 0.87 | ٥٢٤٢.٢٥ | 29701.50 | 0.191 | |
|
|
٤٩٥٩.٩٤ | 281.79 | 5.38 | |||||
|
|
8614.95 | ٣٥٢.٨٧ | 6.73 | |||||
|
|
١٥٢٩٠.٥٢ | ٤٥٦١.٨٩ | ٨٧.٠٢ | |||||
|
|
|
٢٢١٦.٤٧ | 0.00 | ٤.٠٩ | 0.57 | ٧٢٢.٥٢ | 42502.27 | 1.384 |
|
|
٥٨٧١.٤٨ | ٢٠.٣١ | 2.81 | |||||
|
|
١٢٥٤٧.٠٥ | 698.12 | ٩٦.٦٢ | |||||
|
|
|
٣٦٥٥.٠١ | ٤٥.٧٠ | ٢٠:٣٠ | 11.35 | 581.34 | ١٥٩٧٥.٢٠ | 1.720 |
|
|
١٠٣٣٠.٥٨ | 515.34 | ٨٨.٦٤ | |||||
|
|
|
6675.57 | 165.01 | 82.83 | 100 | ٢٤٧.٨٢ | ٤.٠٣٥ | |
تحولات
انبعاث تحويل صاعد عند 980 نانومتر تحت تحفيز 1550 نانومتر
تأثيرات التركيز على اللمعان الناتج عن التحويل العلوي
يظهر الطيف المكبر الذي يتراوح من 400 نانومتر إلى 900 نانومتر. الشكل 5ب يظهر اعتماد شدة الانبعاث تحت الأحمر المتكاملة على
اعتماديات قوة التحفيز على اللمعان العلوي
طيف الانبعاث المقاس عند تيارات عمل مختلفة. تعرض الإضافة في الشكل S9a طيف التحويل العلوي المكبر الذي يتراوح من 500 نانومتر إلى 600 نانومتر لـ
آلية التحويل العلوي
عدم تطابق الطاقة على الرغم من
استشعار درجة الحرارة البصرية
خصائص استشعار درجة الحرارة بناءً على نسبة شدة الفلورسنت
المربعات الصلبة في الشكل 6ب تظهر نسبة شدة الفلورسنت لـ
مسافة الطاقة بين
آلية إخماد درجة الحرارة للإشعاعات الخضراء
الاسترخاء غير الإشعاعي لـ
الاستنتاجات
تشمل عملية انقسام الفوتون عمليتين لنقل الطاقة على مرحلتين، وهما
شكر وتقدير
تضارب المصالح
نُشر على الإنترنت: 16 يناير 2024
References
- Höök, M. & Tang, X. Depletion of fossil fuels and anthropogenic climate change-a review. Energy Policy 52, 797-809 (2013).
- Tamilselvan, P., Nallusamy, N. & Rajkumar, S. A comprehensive review on performance, combustion and emission characteristics of biodiesel fuelled diesel engines. Renew. Sustain. Energy Rev. 79, 1134-1159 (2017).
- Lee, J. et al. Hybrid renewable energy systems involving thermochemical conversion process for waste-to-energy strategy. Chem. Eng. J. 452, 132918 (2023).
- Bie, P. J. et al. A review and evaluation of nonroad diesel mobile machinery emission control in China. J. Environ. Sci. 123, 30-40 (2023).
- Raheem, l. et al. Rapid growth of MXene-based membranes for sustainable environmental pollution remediation. Chemosphere 311, 137056 (2023).
- González-Torres, M. et al. A review on buildings energy information: trends, end-uses, fuels and drivers. Energy Rep. 8, 626-637 (2022).
- Abdelfattah, A. et al. Microalgae-based wastewater treatment: mechanisms, challenges, recent advances, and future prospects. Environ. Sci. Ecotechnol. 13, 100205 (2023).
- Lin, Y. H. et al. Alleviating the self-discharge and enhancing the polysulphides conversion kinetics with
nanocrystals decorated hierarchical porous carbon. Chem. Eng. J. 452, 139091 (2023). - Kumar, A. et al. A review on S-scheme and dual S-scheme heterojunctions for photocatalytic hydrogen evolution, water detoxification and
reduction. Fuel 333, 126267 (2023). - Salamah, T. et al. Effect of dust and methods of cleaning on the performance of solar PV module for different climate regions: comprehensive review. Sci. Total Environ. 827, 154050 (2022).
- Wu, N. et al. Efficient furan-bridged dibenzofulvene-triphenylamine hole transporting materials for perovskite solar cells. Mater. Adv. 4, 515-522 (2023).
- Zhao, J. L. et al. Photochromic crystalline hybrid materials with switchable properties: recent advances and potential applications. Coord. Chem. Rev. 475, 214918 (2023).
- Ma, Z. X. et al. Efficient decontamination of organic pollutants from wastewater by covalent organic framework-based materials. Sci. Total Environ. 901, 166453 (2023).
- Liao, G. F. et al. Z-scheme systems: from fundamental principles to characterization, synthesis, and photocatalytic fuel-conversion applications. Phys. Rep. 983, 1-41 (2022).
- Mehta, N. et al. Down-conversion of a single photon as a probe of many-body localization. Nature 613, 650-655 (2023).
- Arduini, F. et al. Carbon black as an outstanding and affordable nanomaterial for electrochemical (bio)sensor design. Biosens. Bioelectron. 156, 112033 (2020).
- Tian, N. et al. Layered bismuth-based photocatalysts. Coord. Chem. Rev. 463, 214515 (2022).
- Petrov, V. Frequency down-conversion of solid-state laser sources to the midinfrared spectral range using non-oxide nonlinear crystals. Prog. Quant. Electron. 42, 1-106 (2015).
- Hola, K. et al. Carbon dots-Emerging light emitters for bioimaging, cancer therapy and optoelectronics. Nano Today 9, 590-603 (2014).
- Pulli, E., Rozzi, E. & Bella, F. Transparent photovoltaic technologies: current trends towards upscaling. Energy Convers. Manag. 219, 112982 (2020).
- Jia, Y. T., Alva, G. & Fang, G. Y. Development and applications of photovoltaic-thermal systems: a review. Renew. Sustain. Energy Rev. 102, 249-265 (2019).
- Alami, A. H. et al. Management of potential challenges of PV technology proliferation. Sustain. Energy Technol. Assess. 51, 101942 (2022).
- Mojiri, A. et al. Spectral beam splitting for efficient conversion of solar energy-a review. Renew. Sustain. Energy Rev. 28, 654-663 (2013).
- Raijmakers, L. H. J. et al. A review on various temperature-indication methods for Li-ion batteries. Appl. Energy 240, 918-945 (2019).
- Abram, C., Fond, B. & Beyrau, F. Temperature measurement techniques for gas and liquid flows using thermographic phosphor tracer particles. Prog. Energy Combust. Sci. 64, 93-156 (2018).
- Taylor, N. A. S., Tipton, M. J. & Kenny, G. P. Considerations for the measurement of core, skin and mean body temperatures. J. Therm. Biol. 46, 72-101 (2014).
- Roy, A. et al. The impact of pure and mixed self-activated
phosphor materials ( and Ta) on downshifting and quantum cutting emission behaviours of doped ( and ) ions. Ceram. Int. 49, 17383-17395 (2023). - Mishra, N. K. et al. Probing multimodal light emission from
-doped garnet nanophosphors for lighting applications. Phys. Chem. Chem. Phys. 25, 11756-11770 (2023). - Li, D. C. et al. Quantum cutting in
green phosphor. Nanomaterials 13, 351 (2023). - Balaji, S. et al. Insights into
energy transfer dynamics upon infrared excitation in a low phonon fluoro-tellurite glass system. J. Lumin. 187, 441-448 (2017). - Weigh, R. T. et al. Visible quantum cutting in
: Eu through downconversion. Science 283, 663-666 (1999). - Ye, S. et al. Enhanced cooperative quantum cutting in
codoped glass ceramics containing nanocrystals. Opt. Express 16, 8989-8994 (2008). - Chen, D. Q. et al. Quantum cutting downconversion by cooperative energy transfer from
to in borate glasses. J. Appl. Phys. 104, 116105 (2008). - Roh, J. Y. D. et al. Negative thermal quenching in quantum-cutting
doped Perovskite nanocrystals. ACS Nano 17, 17190-17198 (2023). - Zi, L. et al. X-ray quantum cutting scintillator based on
single crystals. Laser Photon. Rev. 17, 2200852 (2023). - Zhao, Y. Optical temperature sensing of up-conversion luminescent materials: fundamentals and progress. J. Alloys Compd 817, 152691 (2020).
- Zhu, L. & Zeng, W. Room-temperature gas sensing of ZnO-based gas sensor: a review. Sens. Actuat. A: Phys. 267, 242-261 (2017).
- Chen, Z. L., Galli, M. & Gallavotti, A. Mechanisms of temperature-regulated growth and thermotolerance in crop species. Curr. Opin. Plant Biol. 65, 102134 (2022).
- de Mendívil, J. M. et al. Judd-Ofelt analysis and transition probabilities of
doped crystals. J. Lumin. 165, 153-158 (2015). - Zhang, L. Z. et al. Crystal growth, spectroscopy and first laser operation of a novel disordered tetragonal Tm:
tungstate crystal. J. Lumin. 203, 676-682 (2018). - Zhang, L. Z. et al. Crystal growth, optical spectroscopy and laser action of
-doped monoclinic magnesium tungstate. Opt. Express 25, 3682-3693 (2017). - Auzel, F. A fundamental self-generated quenching center for lanthanidedoped high-purity solids. J. Lumin. 100, 125-130 (2002).
- Liang, Y. J. et al. New function of the
ion as an efficient emitter of persistent luminescence in the short-wave infrared. Light Sci. Appl. 5, e16124 (2016). - Zhang, Y. et al. Blue LED-pumped intense short-wave infrared luminescence based on
-co-doped phosphors. Light Sci. Appl. 11, 136 (2022). - Green, M. A. Solar Cells: Operating Principles, Technology, and System Applications (Kensington: University of New South Wales, 1998).
- Zhang, Y. Q. et al. A universal approach for calculating the Judd-Ofelt parameters of
in powdered phosphors and its application for the : phosphor derived from auto-combustion-assisted fluoridation. Phys. Chem. Chem. Phys. 20, 15876-15883 (2018). - Luo, M. Y. et al. Optical transition properties, internal quantum efficiencies, and temperature sensing of
doped phosphor with low maximum phonon energy. J. Am. Ceram. Soc. 105, 3353-3363 (2022). - Sha, X. Z. et al. Pre-assessments of optical transition, gain performance and temperature sensing of
in and Lu single crystals by using their powder-formed samples derived from traditional solid state reaction. Opt. Laser Technol. 140, 107012 (2021). - de Sousa, D. F. et al. Energy transfer and the
emission of -and – doped low silica content calcium aluminate glasses. Phys. Rev. B 62, 3176-3180 (2000). - Pecoraro, E. et al. Evaluation of the energy transfer rate for the
system in lead fluoroindogallate glasses. J. Appl. Phys. 86, 3144-3148 (1999). - Kim, M. et al. Methylammonium chloride induces intermediate phase stabilization for efficient perovskite solar cells. Joule 3, 2179-2192 (2019).
- Zhou, T. M. et al. Concentration effect and temperature quenching of upconversion luminescence in
: phosphor. J. Rare Earths 33, 686-692 (2015). - Liu, L. T. et al. Dependence of optical temperature sensing and photo-thermal conversion on particle size and excitation wavelength in
nanoparticles. J. Alloys Compd 741, 927-936 (2018). - Li, Y. C. et al. A temperature self-monitoring NaYF4: Dy
core-shell photothermal converter for photothermal therapy application. Results Phys. 15, 102704 (2019). - Collins, S. F. et al. Comparison of fluorescence-based temperature sensor schemes: theoretical analysis and experimental validation. J. Appl. Phys. 84, 4649-4654 (1998).
- Correspondence: Baojiu Chen (bjchen@dlmu.edu.cn)
School of Science, Dalian Maritime University, Dalian 116026 Liaoning, China
DOI: https://doi.org/10.1038/s41377-023-01365-2
PMID: https://pubmed.ncbi.nlm.nih.gov/38225231
Publication Date: 2024-01-16
Near infrared emissions from both high efficient quantum cutting (173%) and nearly-pure-color upconversion in
Abstract
Raising photoelectric conversion efficiency and enhancing heat management are two critical concerns for siliconbased solar cells. In this work, efficient
Introduction
energy into electrical energy have attracted growing interest, and many kinds of solar cells, such as silicon solar cells, dye-sensitized solar cells, cadmium telluride thin film solar cells, perovskite solar cells, quantum dots solar cells, and organic solar cells, have been developed
Except for the technical improvement of the traditional solar cell processes, another route to raising the siliconbased solar cell efficiency is to introduce light conversion materials. One of the light conversion materials is capable of converting one photon with energy close to or higher than the two times silicon bandgap energy into two or more photons with energy larger than the silicon bandgap energy. This conversion is widely known as quantum cutting or down-conversion
The photovoltaic devices must operate when they are exposed to sunlight. Especially, the concentrator solar cells suffer from high-intensity sunlight irradiation
measurement, thermocouple temperature measurement, infrared radiation temperature measurement, fluorescence temperature measurement and so on
were introduced into the
Experimental section
Sample preparation
To prepare the samples, the starting materials were weighed according to the designed stoichiometric ratio. Then, the raw materials were ground in an agate mortar for 30 min to mix them evenly. The well-mixed batch was put into an alumina crucible, and then was placed into an electric furnace. After calcined in air at
Sample characterization
Results and discussion
Crystal structure
Quantum cutting of
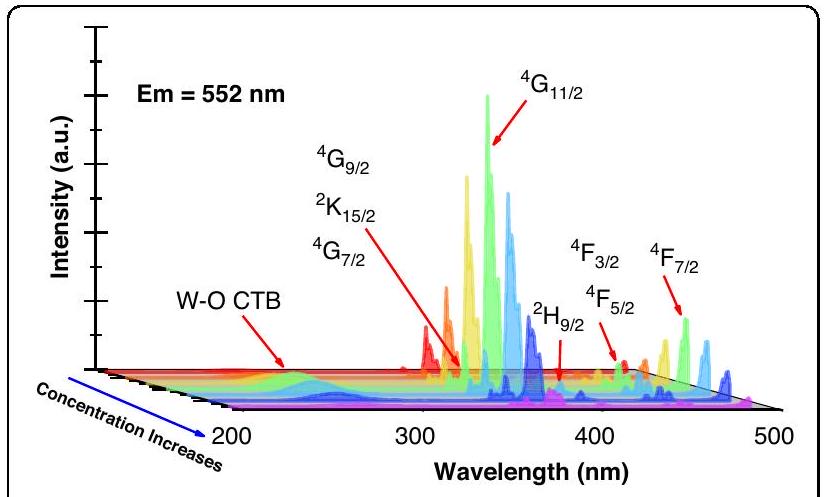
Short wavelength absorption of
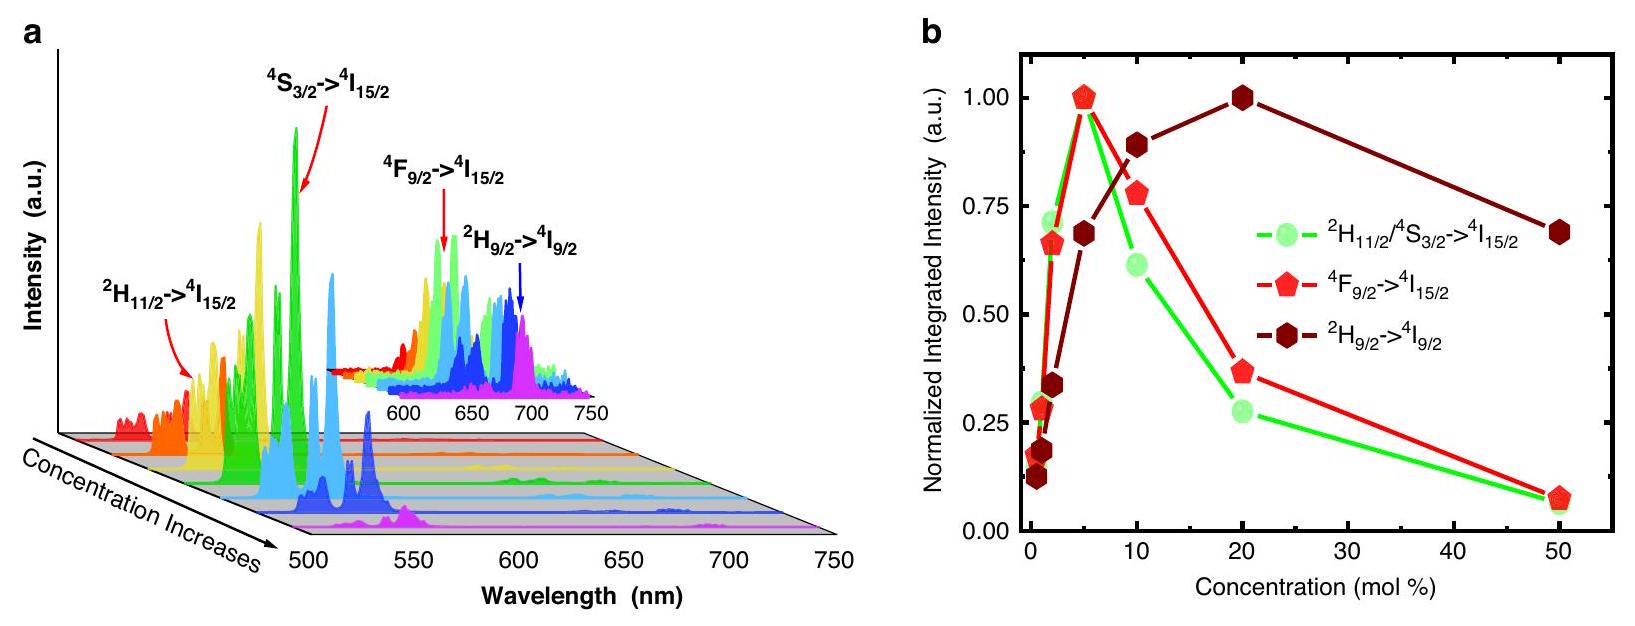
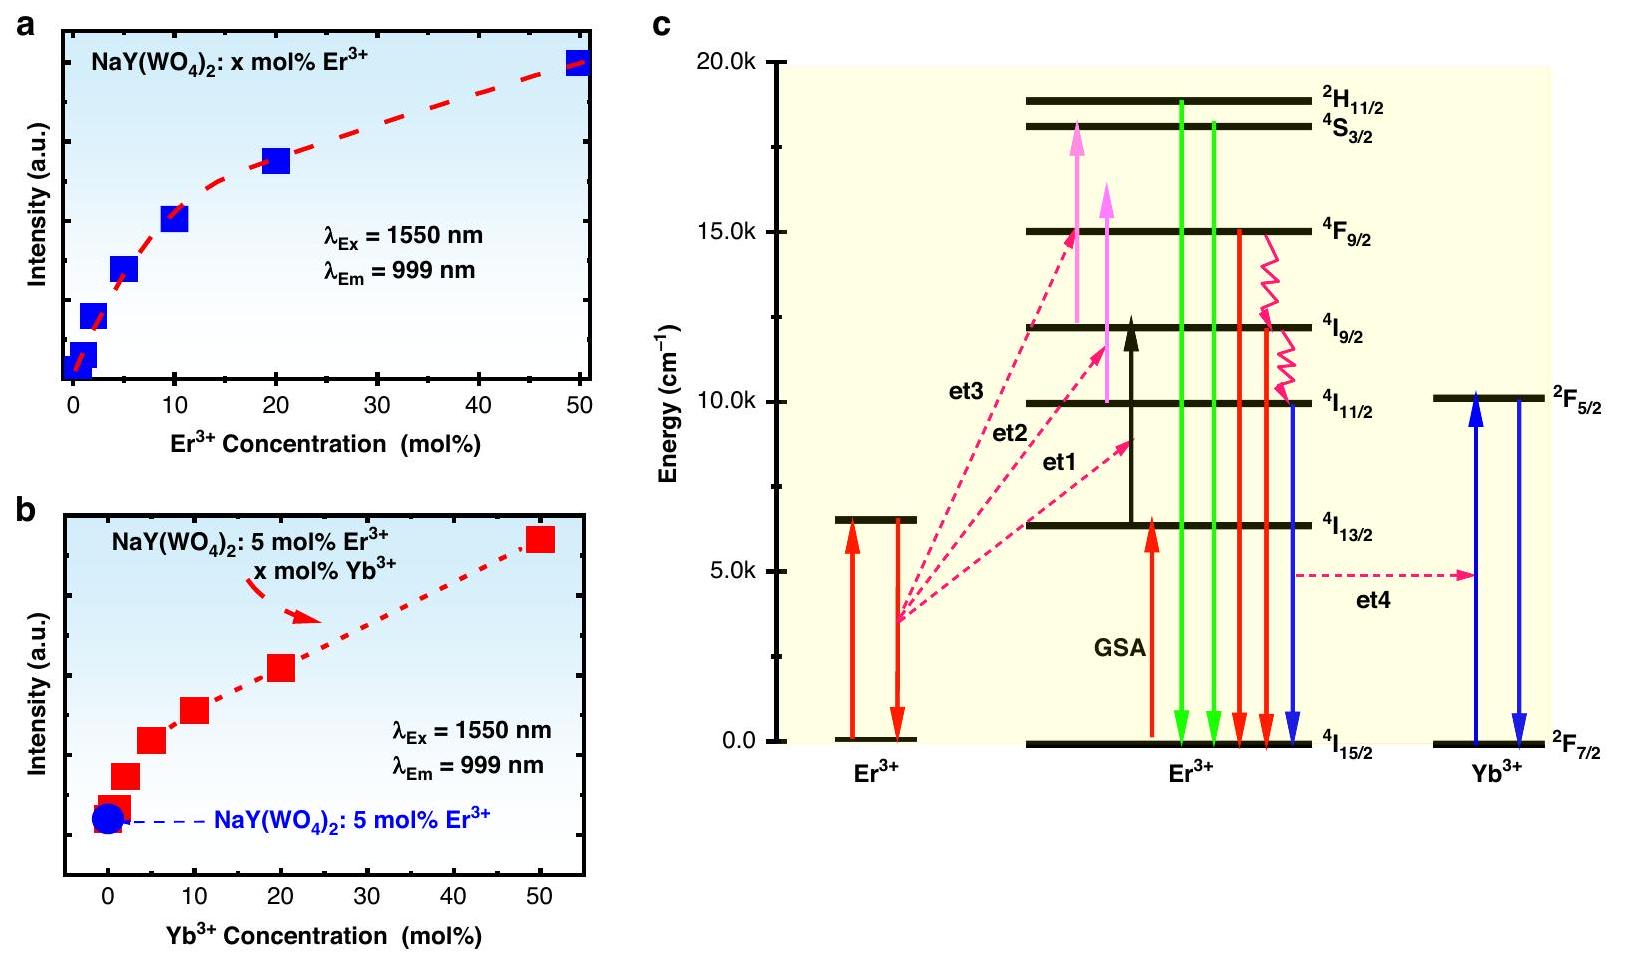
b Dependences of normalized integrated emission intensities on
concentrations. It is well known that the emission intensity of a level is proportional to its population, therefore, the change of emission intensity reflects the population change. Figure 2b shows the dependences of normalized integrated emission intensities for all observed transitions on the
Quantum cutting mechanisms
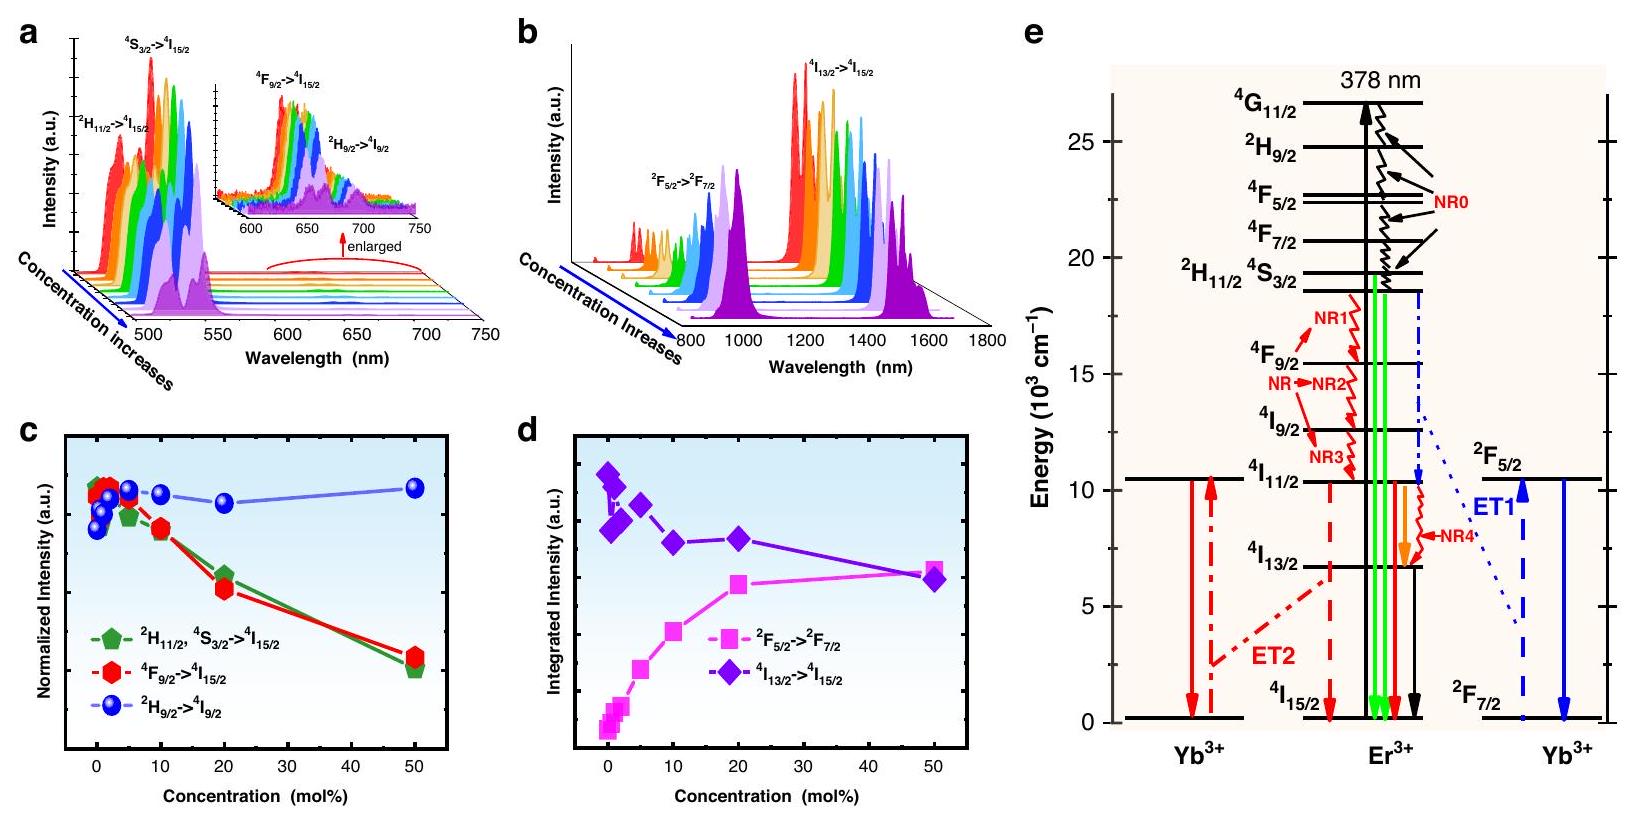
From Fig. 3a it can be seen that the samples with varied
By inspecting the energy level scheme of
Based on the above analyses, the specific photon-splitting routes are illustrated in Fig. 3e. In the first step, the
can eventuate simultaneously two effects that infrared emission of
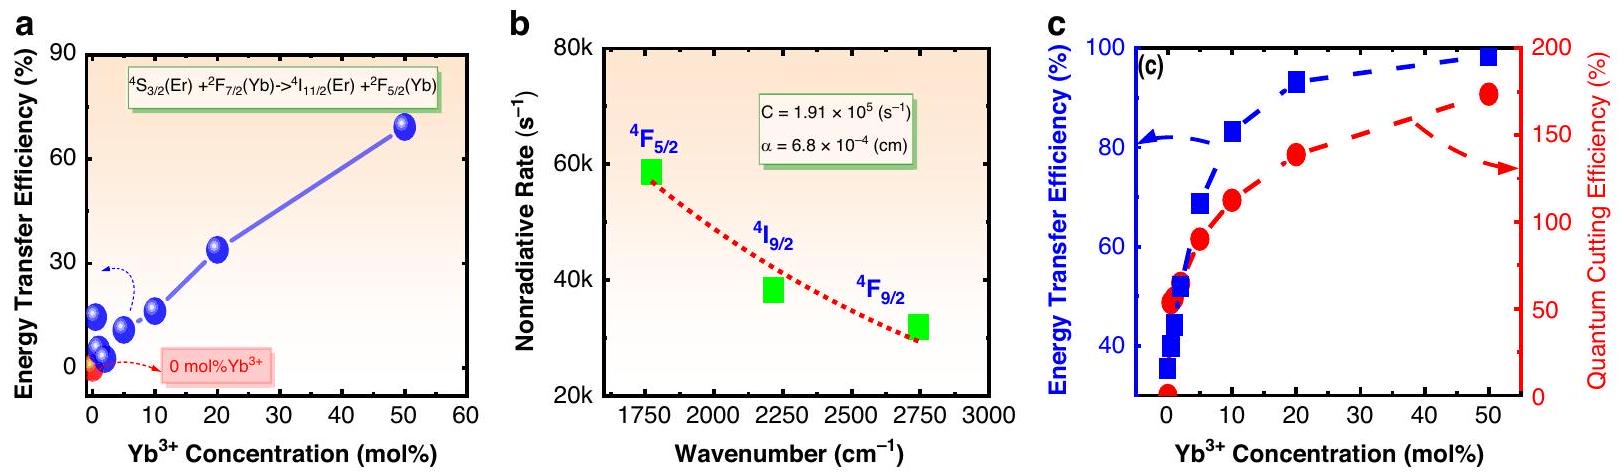
Quantum cutting efficiency
increasing
At a certain temperature, the nonradiative transition rate
obtained from Fig. S4 into Eq. (3), the nonradiative relaxation rates for
The emission cross-section spectrum
| Initial level | Final level | Wave-number | Transition rate (
|
Branch Ratio (%) | Total radiative rate (
|
Non-radiative rate (
|
Radiative liifetime (ms) | |
| ED | MD | |||||||
|
|
|
1772.32 | 12.69 | 0.27 | 4663.43 | 57482.33 | 0.214 | |
|
|
3065.13 | 5.08 | 0.11 | |||||
|
|
3839.87 | 12.69 | 0.27 | |||||
|
|
6931.7 | 314.79 | 6.75 | |||||
|
|
9675.17 | 538.19 | 11.54 | |||||
|
|
11891.64 | 614.34 | 13.17 | |||||
|
|
15546.65 | 2729.01 | 58.52 | |||||
|
|
22222.22 | 436.64 | 9.36 | |||||
|
|
|
1292.81 | 5.08 | 0.06 | 7928.11 | 79668.76 | 0.126 | |
|
|
2067.55 | 0.00 | 0.00 | |||||
|
|
5159.38 | 50.77 | 0.64 | |||||
|
|
7902.85 | 337.64 | 4.26 | |||||
|
|
10119.32 | 863.13 | 10.89 | |||||
|
|
13774.33 | 2465.00 | 31.09 | |||||
|
|
20449.9 | 4206.49 | 53.06 | |||||
|
|
|
774.74 | 0.00 | 0.00 | 87282.66 | 23443.66 | 0.011 | |
|
|
3866.57 | 345.25 | 0.40 | |||||
|
|
6610.04 | 926.59 | 1.06 | |||||
|
|
8826.51 | 558.50 | 0.64 | |||||
|
|
12481.52 | 949.44 | 1.09 | |||||
|
|
19157.09 | 84502.88 | 96.82 | |||||
|
|
|
3091.83 | 0.00 | 0.00 | 637.20 | 1.569 | ||
|
|
5835.3 | 96.47 | 15.14 | |||||
|
|
8051.77 | 22.85 | 3.59 | |||||
|
|
11706.79 | 147.24 | 23.11 | |||||
|
|
18382.35 | 370.64 | 58.17 | |||||
|
|
|
2743.47 | 45.70 | 0.87 | 5242.25 | 29701.50 | 0.191 | |
|
|
4959.94 | 281.79 | 5.38 | |||||
|
|
8614.95 | 352.87 | 6.73 | |||||
|
|
15290.52 | 4561.89 | 87.02 | |||||
|
|
|
2216.47 | 0.00 | 4.09 | 0.57 | 722.52 | 42502.27 | 1.384 |
|
|
5871.48 | 20.31 | 2.81 | |||||
|
|
12547.05 | 698.12 | 96.62 | |||||
|
|
|
3655.01 | 45.70 | 20.30 | 11.35 | 581.34 | 15975.20 | 1.720 |
|
|
10330.58 | 515.34 | 88.64 | |||||
|
|
|
6675.57 | 165.01 | 82.83 | 100 | 247.82 | 4.035 | |
transitions of
980 nm up-conversion emission under 1550 nm excitation
Concentration effects of upconversion luminescence
shows the enlarged spectra ranging from 400 nm to 900 nm . Figure 5b shows the dependence of the infrared emission integrated intensity on the
Excitation power dependences of upconversion luminescence
emission spectra measured at different working currents. The insert of Fig. S9a displays the enlarged upconversion spectra ranging from 500 nm to 600 nm for
Upconversion mechanism
energy mismatch though the
Optical temperature sensing
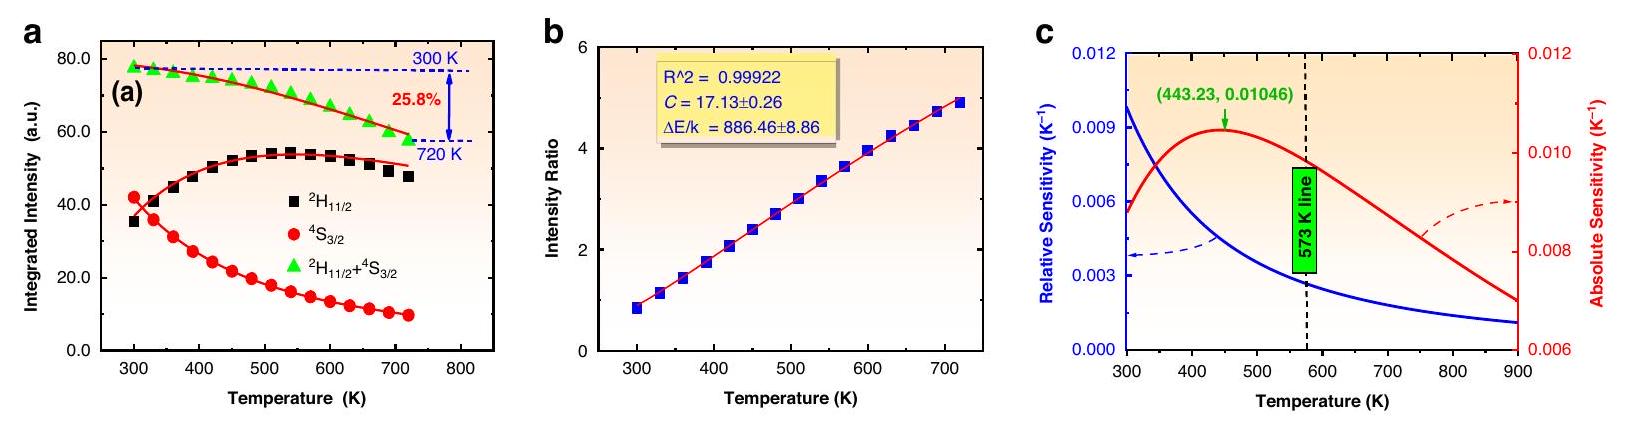
Temperature sensing properties based on fluorescence intensity ratio
The solid squares in Fig. 6b show the fluorescence intensity ratio of
energy distance between
Temperature quenching mechanism of green emissions of
nonradiative relaxation of
Conclusions
photon splitting process includes two-step energy transfer processes, namely,
Acknowledgements
Conflict of interest
Published online: 16 January 2024
References
- Höök, M. & Tang, X. Depletion of fossil fuels and anthropogenic climate change-a review. Energy Policy 52, 797-809 (2013).
- Tamilselvan, P., Nallusamy, N. & Rajkumar, S. A comprehensive review on performance, combustion and emission characteristics of biodiesel fuelled diesel engines. Renew. Sustain. Energy Rev. 79, 1134-1159 (2017).
- Lee, J. et al. Hybrid renewable energy systems involving thermochemical conversion process for waste-to-energy strategy. Chem. Eng. J. 452, 132918 (2023).
- Bie, P. J. et al. A review and evaluation of nonroad diesel mobile machinery emission control in China. J. Environ. Sci. 123, 30-40 (2023).
- Raheem, l. et al. Rapid growth of MXene-based membranes for sustainable environmental pollution remediation. Chemosphere 311, 137056 (2023).
- González-Torres, M. et al. A review on buildings energy information: trends, end-uses, fuels and drivers. Energy Rep. 8, 626-637 (2022).
- Abdelfattah, A. et al. Microalgae-based wastewater treatment: mechanisms, challenges, recent advances, and future prospects. Environ. Sci. Ecotechnol. 13, 100205 (2023).
- Lin, Y. H. et al. Alleviating the self-discharge and enhancing the polysulphides conversion kinetics with
nanocrystals decorated hierarchical porous carbon. Chem. Eng. J. 452, 139091 (2023). - Kumar, A. et al. A review on S-scheme and dual S-scheme heterojunctions for photocatalytic hydrogen evolution, water detoxification and
reduction. Fuel 333, 126267 (2023). - Salamah, T. et al. Effect of dust and methods of cleaning on the performance of solar PV module for different climate regions: comprehensive review. Sci. Total Environ. 827, 154050 (2022).
- Wu, N. et al. Efficient furan-bridged dibenzofulvene-triphenylamine hole transporting materials for perovskite solar cells. Mater. Adv. 4, 515-522 (2023).
- Zhao, J. L. et al. Photochromic crystalline hybrid materials with switchable properties: recent advances and potential applications. Coord. Chem. Rev. 475, 214918 (2023).
- Ma, Z. X. et al. Efficient decontamination of organic pollutants from wastewater by covalent organic framework-based materials. Sci. Total Environ. 901, 166453 (2023).
- Liao, G. F. et al. Z-scheme systems: from fundamental principles to characterization, synthesis, and photocatalytic fuel-conversion applications. Phys. Rep. 983, 1-41 (2022).
- Mehta, N. et al. Down-conversion of a single photon as a probe of many-body localization. Nature 613, 650-655 (2023).
- Arduini, F. et al. Carbon black as an outstanding and affordable nanomaterial for electrochemical (bio)sensor design. Biosens. Bioelectron. 156, 112033 (2020).
- Tian, N. et al. Layered bismuth-based photocatalysts. Coord. Chem. Rev. 463, 214515 (2022).
- Petrov, V. Frequency down-conversion of solid-state laser sources to the midinfrared spectral range using non-oxide nonlinear crystals. Prog. Quant. Electron. 42, 1-106 (2015).
- Hola, K. et al. Carbon dots-Emerging light emitters for bioimaging, cancer therapy and optoelectronics. Nano Today 9, 590-603 (2014).
- Pulli, E., Rozzi, E. & Bella, F. Transparent photovoltaic technologies: current trends towards upscaling. Energy Convers. Manag. 219, 112982 (2020).
- Jia, Y. T., Alva, G. & Fang, G. Y. Development and applications of photovoltaic-thermal systems: a review. Renew. Sustain. Energy Rev. 102, 249-265 (2019).
- Alami, A. H. et al. Management of potential challenges of PV technology proliferation. Sustain. Energy Technol. Assess. 51, 101942 (2022).
- Mojiri, A. et al. Spectral beam splitting for efficient conversion of solar energy-a review. Renew. Sustain. Energy Rev. 28, 654-663 (2013).
- Raijmakers, L. H. J. et al. A review on various temperature-indication methods for Li-ion batteries. Appl. Energy 240, 918-945 (2019).
- Abram, C., Fond, B. & Beyrau, F. Temperature measurement techniques for gas and liquid flows using thermographic phosphor tracer particles. Prog. Energy Combust. Sci. 64, 93-156 (2018).
- Taylor, N. A. S., Tipton, M. J. & Kenny, G. P. Considerations for the measurement of core, skin and mean body temperatures. J. Therm. Biol. 46, 72-101 (2014).
- Roy, A. et al. The impact of pure and mixed self-activated
phosphor materials ( and Ta) on downshifting and quantum cutting emission behaviours of doped ( and ) ions. Ceram. Int. 49, 17383-17395 (2023). - Mishra, N. K. et al. Probing multimodal light emission from
-doped garnet nanophosphors for lighting applications. Phys. Chem. Chem. Phys. 25, 11756-11770 (2023). - Li, D. C. et al. Quantum cutting in
green phosphor. Nanomaterials 13, 351 (2023). - Balaji, S. et al. Insights into
energy transfer dynamics upon infrared excitation in a low phonon fluoro-tellurite glass system. J. Lumin. 187, 441-448 (2017). - Weigh, R. T. et al. Visible quantum cutting in
: Eu through downconversion. Science 283, 663-666 (1999). - Ye, S. et al. Enhanced cooperative quantum cutting in
codoped glass ceramics containing nanocrystals. Opt. Express 16, 8989-8994 (2008). - Chen, D. Q. et al. Quantum cutting downconversion by cooperative energy transfer from
to in borate glasses. J. Appl. Phys. 104, 116105 (2008). - Roh, J. Y. D. et al. Negative thermal quenching in quantum-cutting
doped Perovskite nanocrystals. ACS Nano 17, 17190-17198 (2023). - Zi, L. et al. X-ray quantum cutting scintillator based on
single crystals. Laser Photon. Rev. 17, 2200852 (2023). - Zhao, Y. Optical temperature sensing of up-conversion luminescent materials: fundamentals and progress. J. Alloys Compd 817, 152691 (2020).
- Zhu, L. & Zeng, W. Room-temperature gas sensing of ZnO-based gas sensor: a review. Sens. Actuat. A: Phys. 267, 242-261 (2017).
- Chen, Z. L., Galli, M. & Gallavotti, A. Mechanisms of temperature-regulated growth and thermotolerance in crop species. Curr. Opin. Plant Biol. 65, 102134 (2022).
- de Mendívil, J. M. et al. Judd-Ofelt analysis and transition probabilities of
doped crystals. J. Lumin. 165, 153-158 (2015). - Zhang, L. Z. et al. Crystal growth, spectroscopy and first laser operation of a novel disordered tetragonal Tm:
tungstate crystal. J. Lumin. 203, 676-682 (2018). - Zhang, L. Z. et al. Crystal growth, optical spectroscopy and laser action of
-doped monoclinic magnesium tungstate. Opt. Express 25, 3682-3693 (2017). - Auzel, F. A fundamental self-generated quenching center for lanthanidedoped high-purity solids. J. Lumin. 100, 125-130 (2002).
- Liang, Y. J. et al. New function of the
ion as an efficient emitter of persistent luminescence in the short-wave infrared. Light Sci. Appl. 5, e16124 (2016). - Zhang, Y. et al. Blue LED-pumped intense short-wave infrared luminescence based on
-co-doped phosphors. Light Sci. Appl. 11, 136 (2022). - Green, M. A. Solar Cells: Operating Principles, Technology, and System Applications (Kensington: University of New South Wales, 1998).
- Zhang, Y. Q. et al. A universal approach for calculating the Judd-Ofelt parameters of
in powdered phosphors and its application for the : phosphor derived from auto-combustion-assisted fluoridation. Phys. Chem. Chem. Phys. 20, 15876-15883 (2018). - Luo, M. Y. et al. Optical transition properties, internal quantum efficiencies, and temperature sensing of
doped phosphor with low maximum phonon energy. J. Am. Ceram. Soc. 105, 3353-3363 (2022). - Sha, X. Z. et al. Pre-assessments of optical transition, gain performance and temperature sensing of
in and Lu single crystals by using their powder-formed samples derived from traditional solid state reaction. Opt. Laser Technol. 140, 107012 (2021). - de Sousa, D. F. et al. Energy transfer and the
emission of -and – doped low silica content calcium aluminate glasses. Phys. Rev. B 62, 3176-3180 (2000). - Pecoraro, E. et al. Evaluation of the energy transfer rate for the
system in lead fluoroindogallate glasses. J. Appl. Phys. 86, 3144-3148 (1999). - Kim, M. et al. Methylammonium chloride induces intermediate phase stabilization for efficient perovskite solar cells. Joule 3, 2179-2192 (2019).
- Zhou, T. M. et al. Concentration effect and temperature quenching of upconversion luminescence in
: phosphor. J. Rare Earths 33, 686-692 (2015). - Liu, L. T. et al. Dependence of optical temperature sensing and photo-thermal conversion on particle size and excitation wavelength in
nanoparticles. J. Alloys Compd 741, 927-936 (2018). - Li, Y. C. et al. A temperature self-monitoring NaYF4: Dy
core-shell photothermal converter for photothermal therapy application. Results Phys. 15, 102704 (2019). - Collins, S. F. et al. Comparison of fluorescence-based temperature sensor schemes: theoretical analysis and experimental validation. J. Appl. Phys. 84, 4649-4654 (1998).
- Correspondence: Baojiu Chen (bjchen@dlmu.edu.cn)
School of Science, Dalian Maritime University, Dalian 116026 Liaoning, China