الأورام الدبقية هي أورام خبيثة غير قابلة للعلاج، وتتميز بوجود بيئة ميكروية مثبطة للمناعة تحتوي على خلايا نقي وفيرة، والتي لا تزال أنماطها المناعية غير محددة بشكل جيد.. هنا نحقق بشكل منهجي في هذه الأنماط الظاهرية من خلال دمج تسلسل RNA على مستوى الخلية الواحدة، وإمكانية الوصول إلى الكروماتين، وعلم النسخ الجزيئي المكاني، وأنظمة زراعة الأورام الدبقية. اكتشفنا أربعة برامج تعبير مناعية: برامج الالتهاب الميكروغليالي وبرامج المناعة المثبطة للالتقاط، والتي هي فريدة من نوعها للأورام الدماغية الأولية، وبرامج الالتهاب النظامي وبرامج المناعة المثبطة للمكمل، والتي يتم التعبير عنها أيضًا من قبل الأورام غير الدماغية. هذه البرامج ليست مرتبطة بنوع الخلايا النخاعية، أو الأصل التطوري، أو حالة الطفرة في الورم، بل بدلاً من ذلك يتم تحفيزها بواسطة إشارات البيئة المحيطة، بما في ذلك نقص الأكسجين في الورم، والإنترلوكين-1.تي جي إفوعلاج الديكساميثازون القياسي. يمكن أن تتنبأ تعبيراتها النسبية باستجابة العلاج المناعي والبقاء العام. من خلال ربط البرامج المعنية بالعناصر الجينومية الوسيطة، وعوامل النسخ، ومسارات الإشارة، نكشف عن استراتيجيات لتعديل أنماط خلايا النخاع. توفر دراستنا إطارًا لفهم تعديل المناعة بواسطة خلايا النخاع في الورم الدبقي وأساسًا لتطوير علاجات مناعية أكثر فعالية.
الأورام الدبقية المنتشرة هي أكثر أنواع الأورام الخبيثة الأولية شيوعًا في الدماغ وهي في النهاية مميتة.على الرغم من أن العلاج المناعي قد أحدث ثورة في علاج العديد من أنواع السرطان، إلا أن الأورام الدبقية تمثل تحديًا للعلاج المناعي بسبب البيئة المناعية الفريدة في الدماغ، والوصول المحدود للعلاجات النظامية، والحاجة إلى تحقيق توازن بين الاستجابات المناعية العلاجية والالتهاب الناتج عن الوذمة التي قد تكون مميتة..
في العديد من الأورام الصلبة، بما في ذلك الورم الدبقي، يمكن للخلايا النخاعية أن تخلق بيئة ميكروية مثبطة للمناعة وترتبط بتوقعات سيئة.في الأورام الدبقية، تعتبر الخلايا النخاعية النوع الأكثر انتشارًا من الخلايا غير الخبيثة، حيث تشكل ما يصل إلىخلايا في ورميمكن أن تؤثر الخلايا النخاعية المرتبطة بالورم على الحالة الجزيئية للخلايا الخبيثة.بالإضافة إلى خلايا T المتسللة إلى الورموهي الخلايا الفعالة الرئيسية في حجب نقاط التفتيش، واللقاحات، والعلاج بالخلايا المتبناة. يمكنها أيضًا استقطاب وكبح خلايا النخاع الأخرى..
ومع ذلك، لا يزال يتعين تحديد أنواع خلايا المايلويد المحددة وبرامج التعبير التي تنظم هذه الوظائف. لقد وثقت دراسات تسلسل RNA أحادي الخلية (scRNA-seq) طيفًا من حالات الخلايا الخبيثة في الأورام الدبقية.لقد درست الدراسات السابقة أيضًا الخلايا النخاعية في الأورام الدبقية البشرية والفأرية.ومع ذلك، لا تزال العديد من الأسئلة قائمة. أولاً، نفتقر إلى توافق في الآراء حول تعريف حالات خلايا النخاع وبرامج التعبير، أو كيف تؤثر على الميزات السريرية والبيولوجية للأورام الدبقية. لقد تم تصنيف خلايا النخاع تقليديًا ودراستها وفقًا لنوع الخلية: الخلايا الدبقية الصغيرة، البلعميات، وحيدات النواة، الخلايا الشجرية التقليدية (cDC) أو العدلات.. ومع ذلك، كان من الصعب تقييم أنشطتها الوظيفية بشكل مستقل عن نوع الخلية، وهذا الأمر لم يتم تناوله بشكل جيد من قبل أدوات الحوسبة الفردية القياسية. ثانياً، يُستنتج عادةً أن الأصول التطورية للخلايا المكونة للدم هي إما مشتقة من الخلايا الدبقية الصغيرة أو مشتقة من نخاع العظام بناءً على الجينات المحددة.
من تجارب تتبع السلالة في الفئرانومع ذلك، فإن أصول الخلايا النخاعية في الأورام الدبقية البشرية لا تزال غير مؤكدة.ثالثًا، نفتقر إلى فهم كيفية تفاعلات الخلايا النخاعية مع الخلايا الخبيثة وغير الخبيثة الأخرى التي تخلق بيئات موطنية وميكروبيئية مناعية. العقبة الأخيرة تتعلق بالنمذجة التجريبية. تتغير حالة البلعميات المرتبطة بالورم بسرعة في زراعة الطبقة الواحدة، ونماذج الفئران تفشل في إعادة إنتاج بيولوجيا الخلايا الدبقية وبرامج البلعميات في الأورام البشرية بشكل كامل..
هنا سعينا لتجاوز هذه القيود من خلال دراسة شاملة للخلايا النخاعية في الأورام الدبقية البشرية. استغللنا بيانات تسلسل RNA أحادي الخلية لـ 85 ورم دبقي متنوع وطرق حسابية ناشئة لتحديد 4 برامج مناعية مهيمنة مشتركة عبر أنواع الخلايا النخاعية. ثم دمجنا تتبع السلالة، والتعبير الجيني المكاني، والوصول إلى الكروماتين، ونماذج خارج الجسم لاكتشاف أصول هذه البرامج، وبيئاتها، ومحركاتها. تصف تحليلاتنا حجرة نخاعية ديناميكية ومترابطة تصبح شديدة التثبيط المناعي استجابةً للإشارات البيئية والعلاجات. إنها توفر أساسًا لتطوير استراتيجيات تشخيصية وعلاجية مناعية للأورام الدبقية.
برامج التعبير النخاعي المتفق عليها
استخدمنا تسلسل RNA أحادي الخلية (scRNA-seq) لوصف أنواع الخلايا المناعية وغير المناعية في الأورام الدبقية المنتشرة التي تم استئصالها حديثًا من البالغين. شملنا مجموعة واسعة من الأورام، تتراوح بين الأورام المتحورة في إنزيم إيزوسيترات ديهيدروجيناز (IDH) والأورام من النوع البري (WT)، والأورام الأولية والمتكررة، والأورام المعرضة لعلاجات مختلفة. جمعنا 44 ملفًا للأورام تم جمعها بشكل استباقي مع 41 ملفًا تم تجميعها من منشورات سابقة.قمنا بتقسيم هذه الـ 85 ملفًا (الجدول التكميلي 1) إلى مجموعة اكتشاف ومجموعة تحقق، وقمنا بتعليق الخلايا بناءً على تعبير الجينات المحددة، وحددنا التغيرات في عدد النسخ لتمييز الخلايا الخبيثة (الشكل 1أ، الشكل البياني الممتد 1أ-ج والطرق).
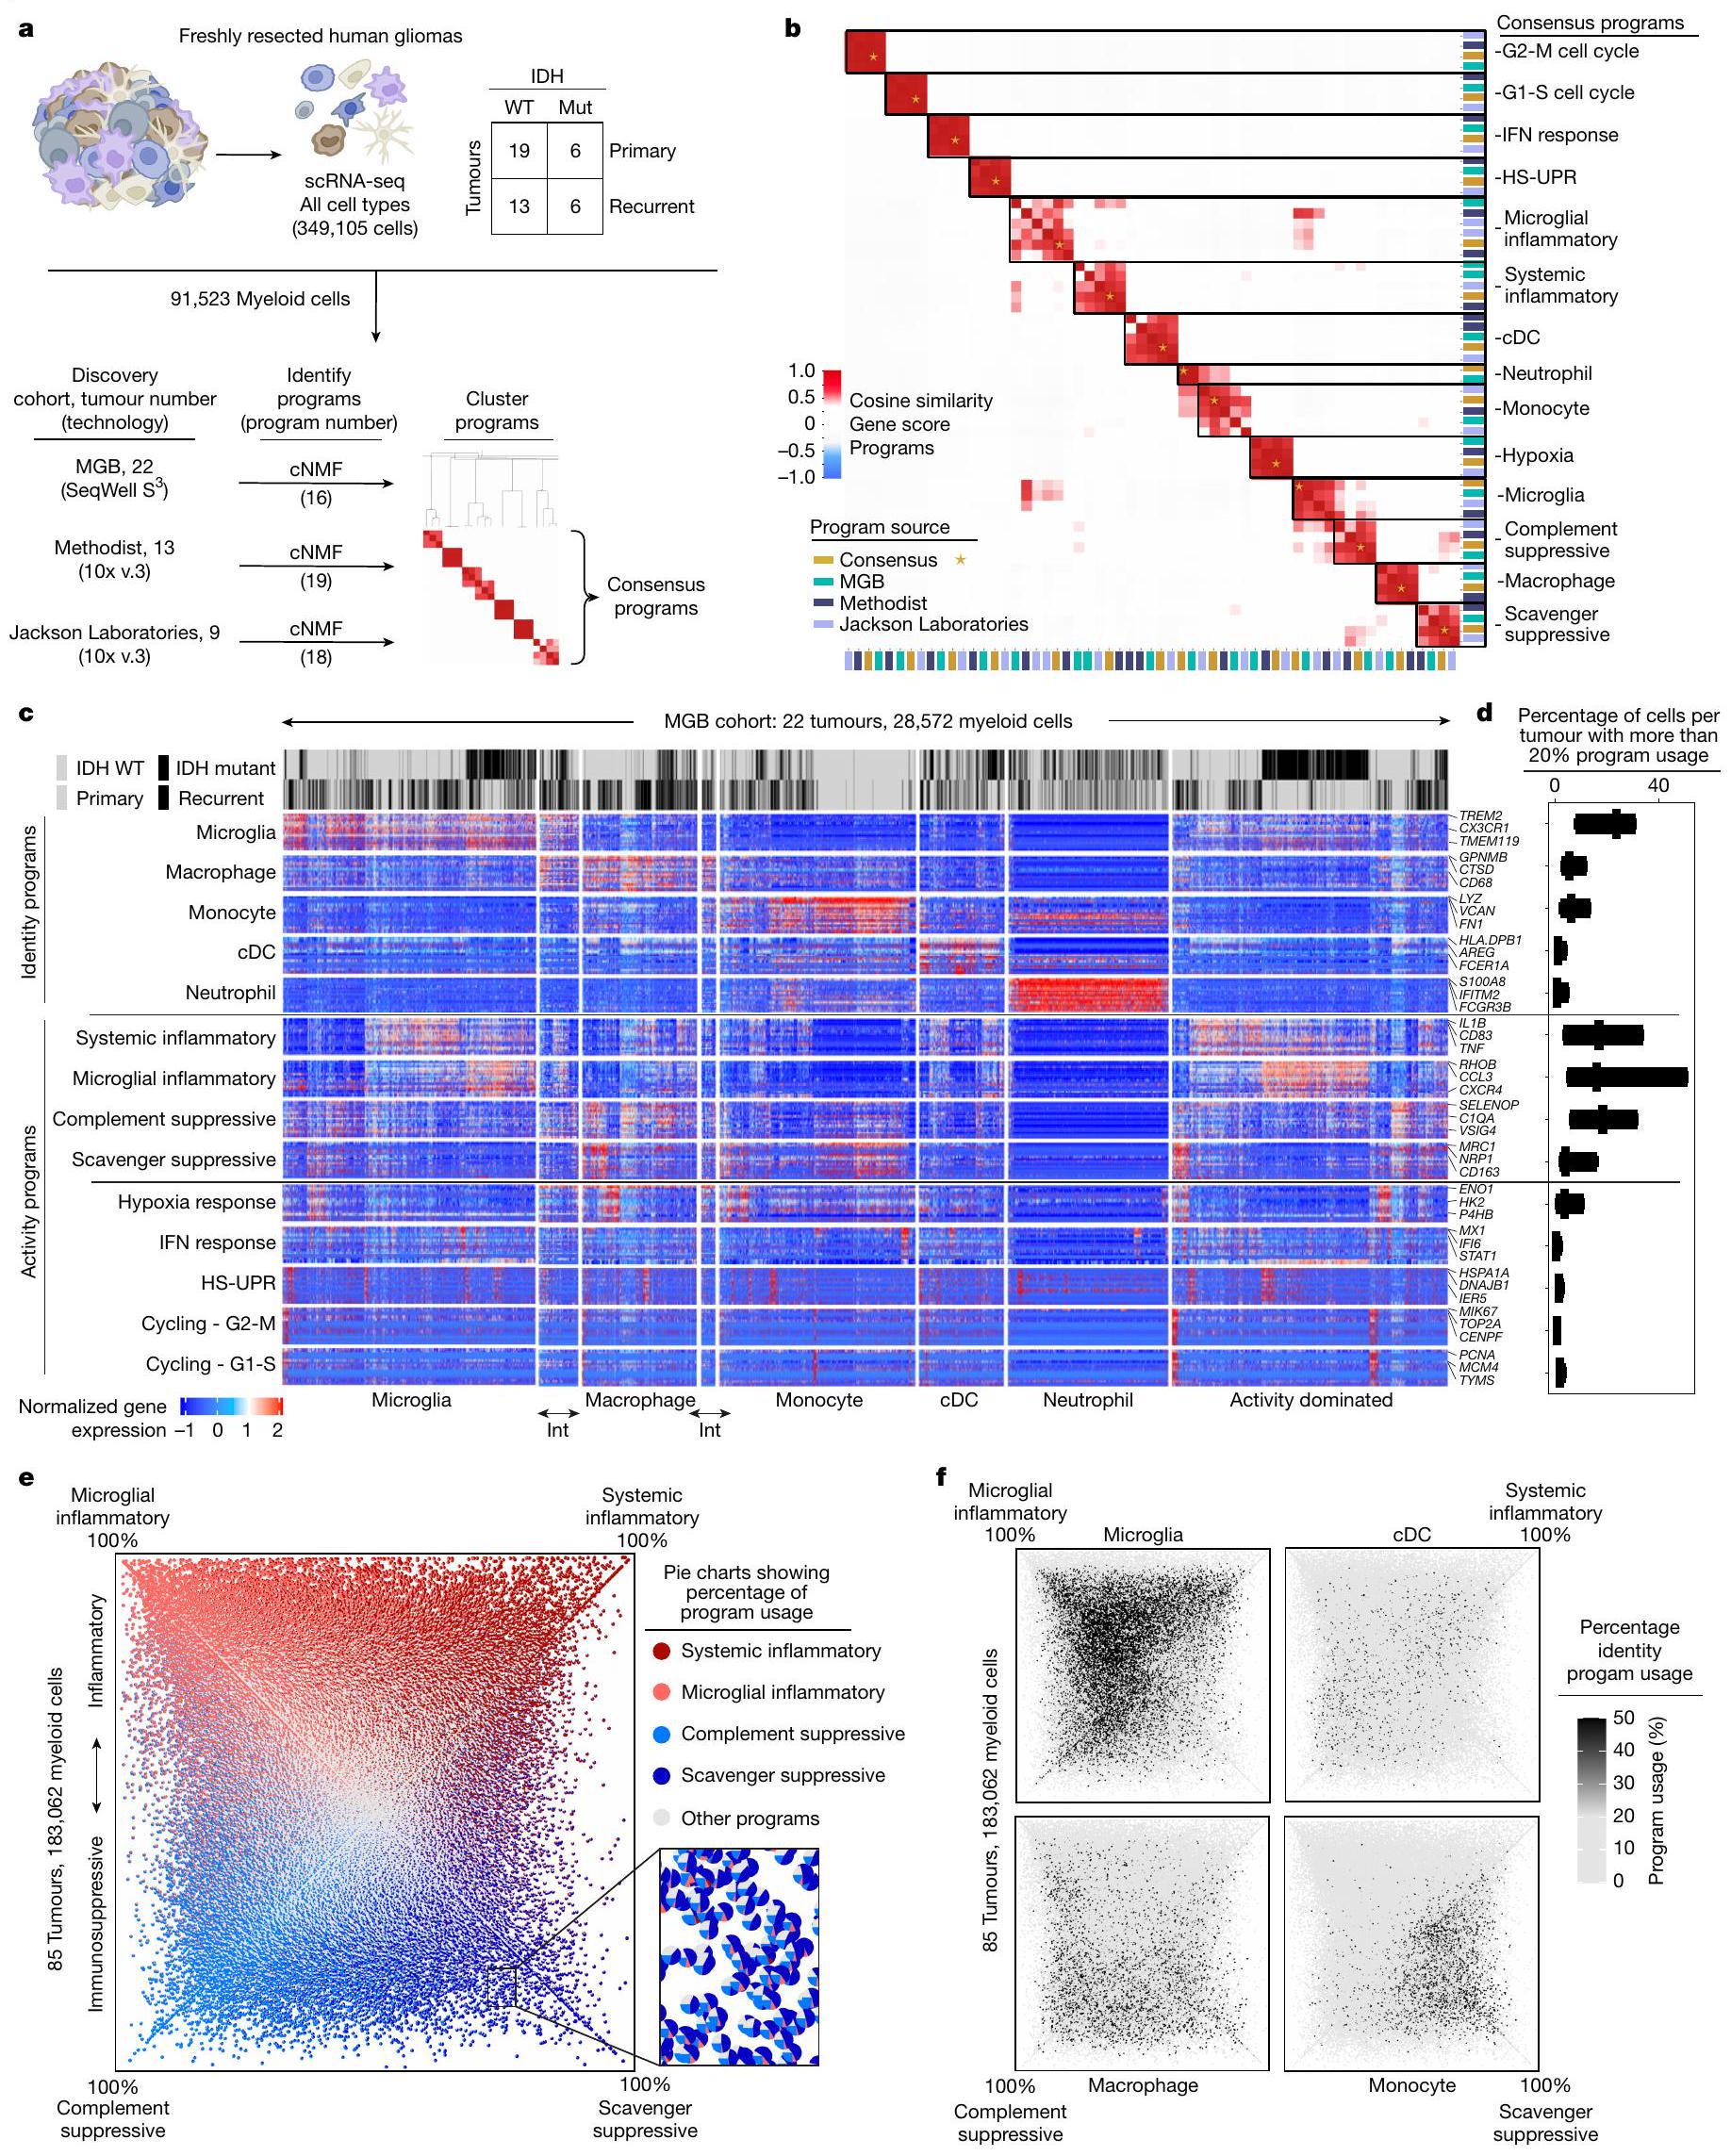
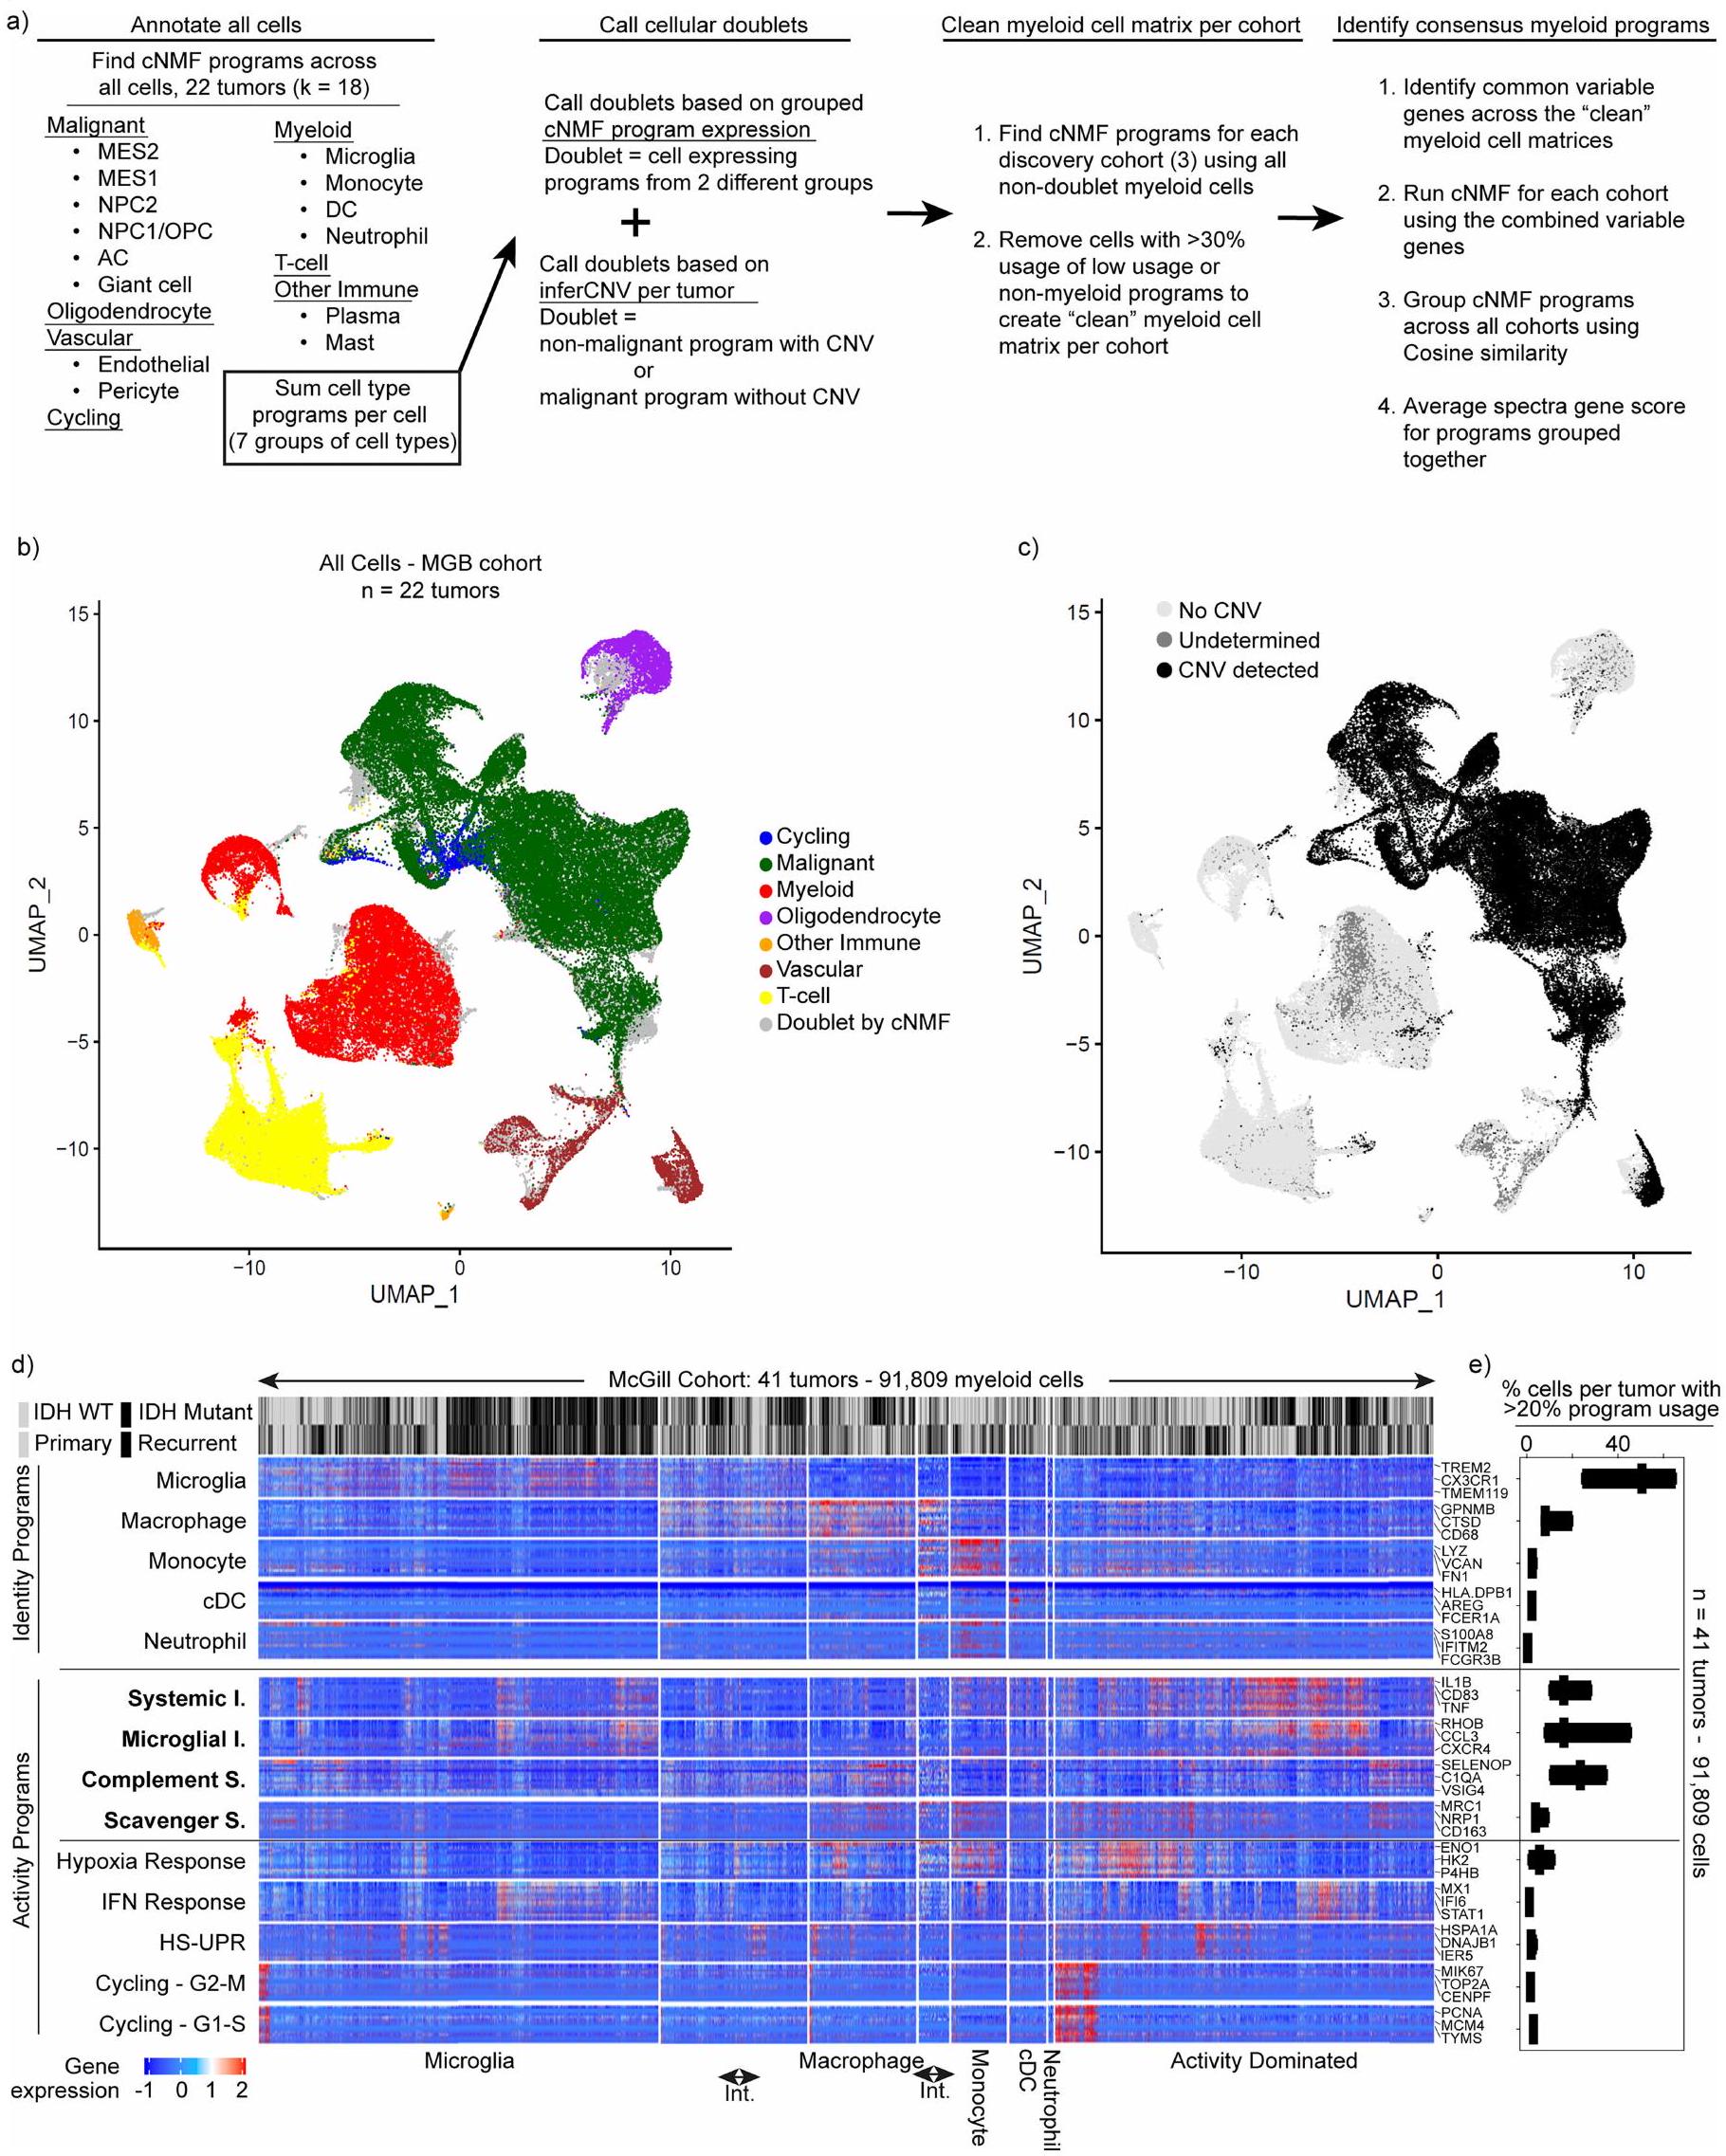
لاكتشاف برامج التعبير الجيني المتوافقة في الخلايا النخاعية، استخدمنا طريقة غير متحيزة، وهي تحليل المصفوفة غير السلبية التوافقية. (cNMF) ، لتحديد مجموعات من الجينات، التي نسميها برامج، والتي تم تنظيمها بشكل متناسق عبر خلايا النخاع في كل مجموعة من مجموعة بيانات الاكتشاف الخاصة بنا. حدد التجميع الهرمي لهذه البرامج برامج تعبير متكررة وجدت في جميع المجموعات الثلاث، والتي استخلصنا منها 14 برنامج جيني متوافق. تم العثور على هذه البرامج المتوافقة عبر مجموعة تمثيلية من 85 ورمًا دبقيًا وتم تكرارها في مجموعة التحقق الخاصة بنا (الشكل 1 أ، ب، الشكل البياني الممتد 1 والجدول التكميلي 2).
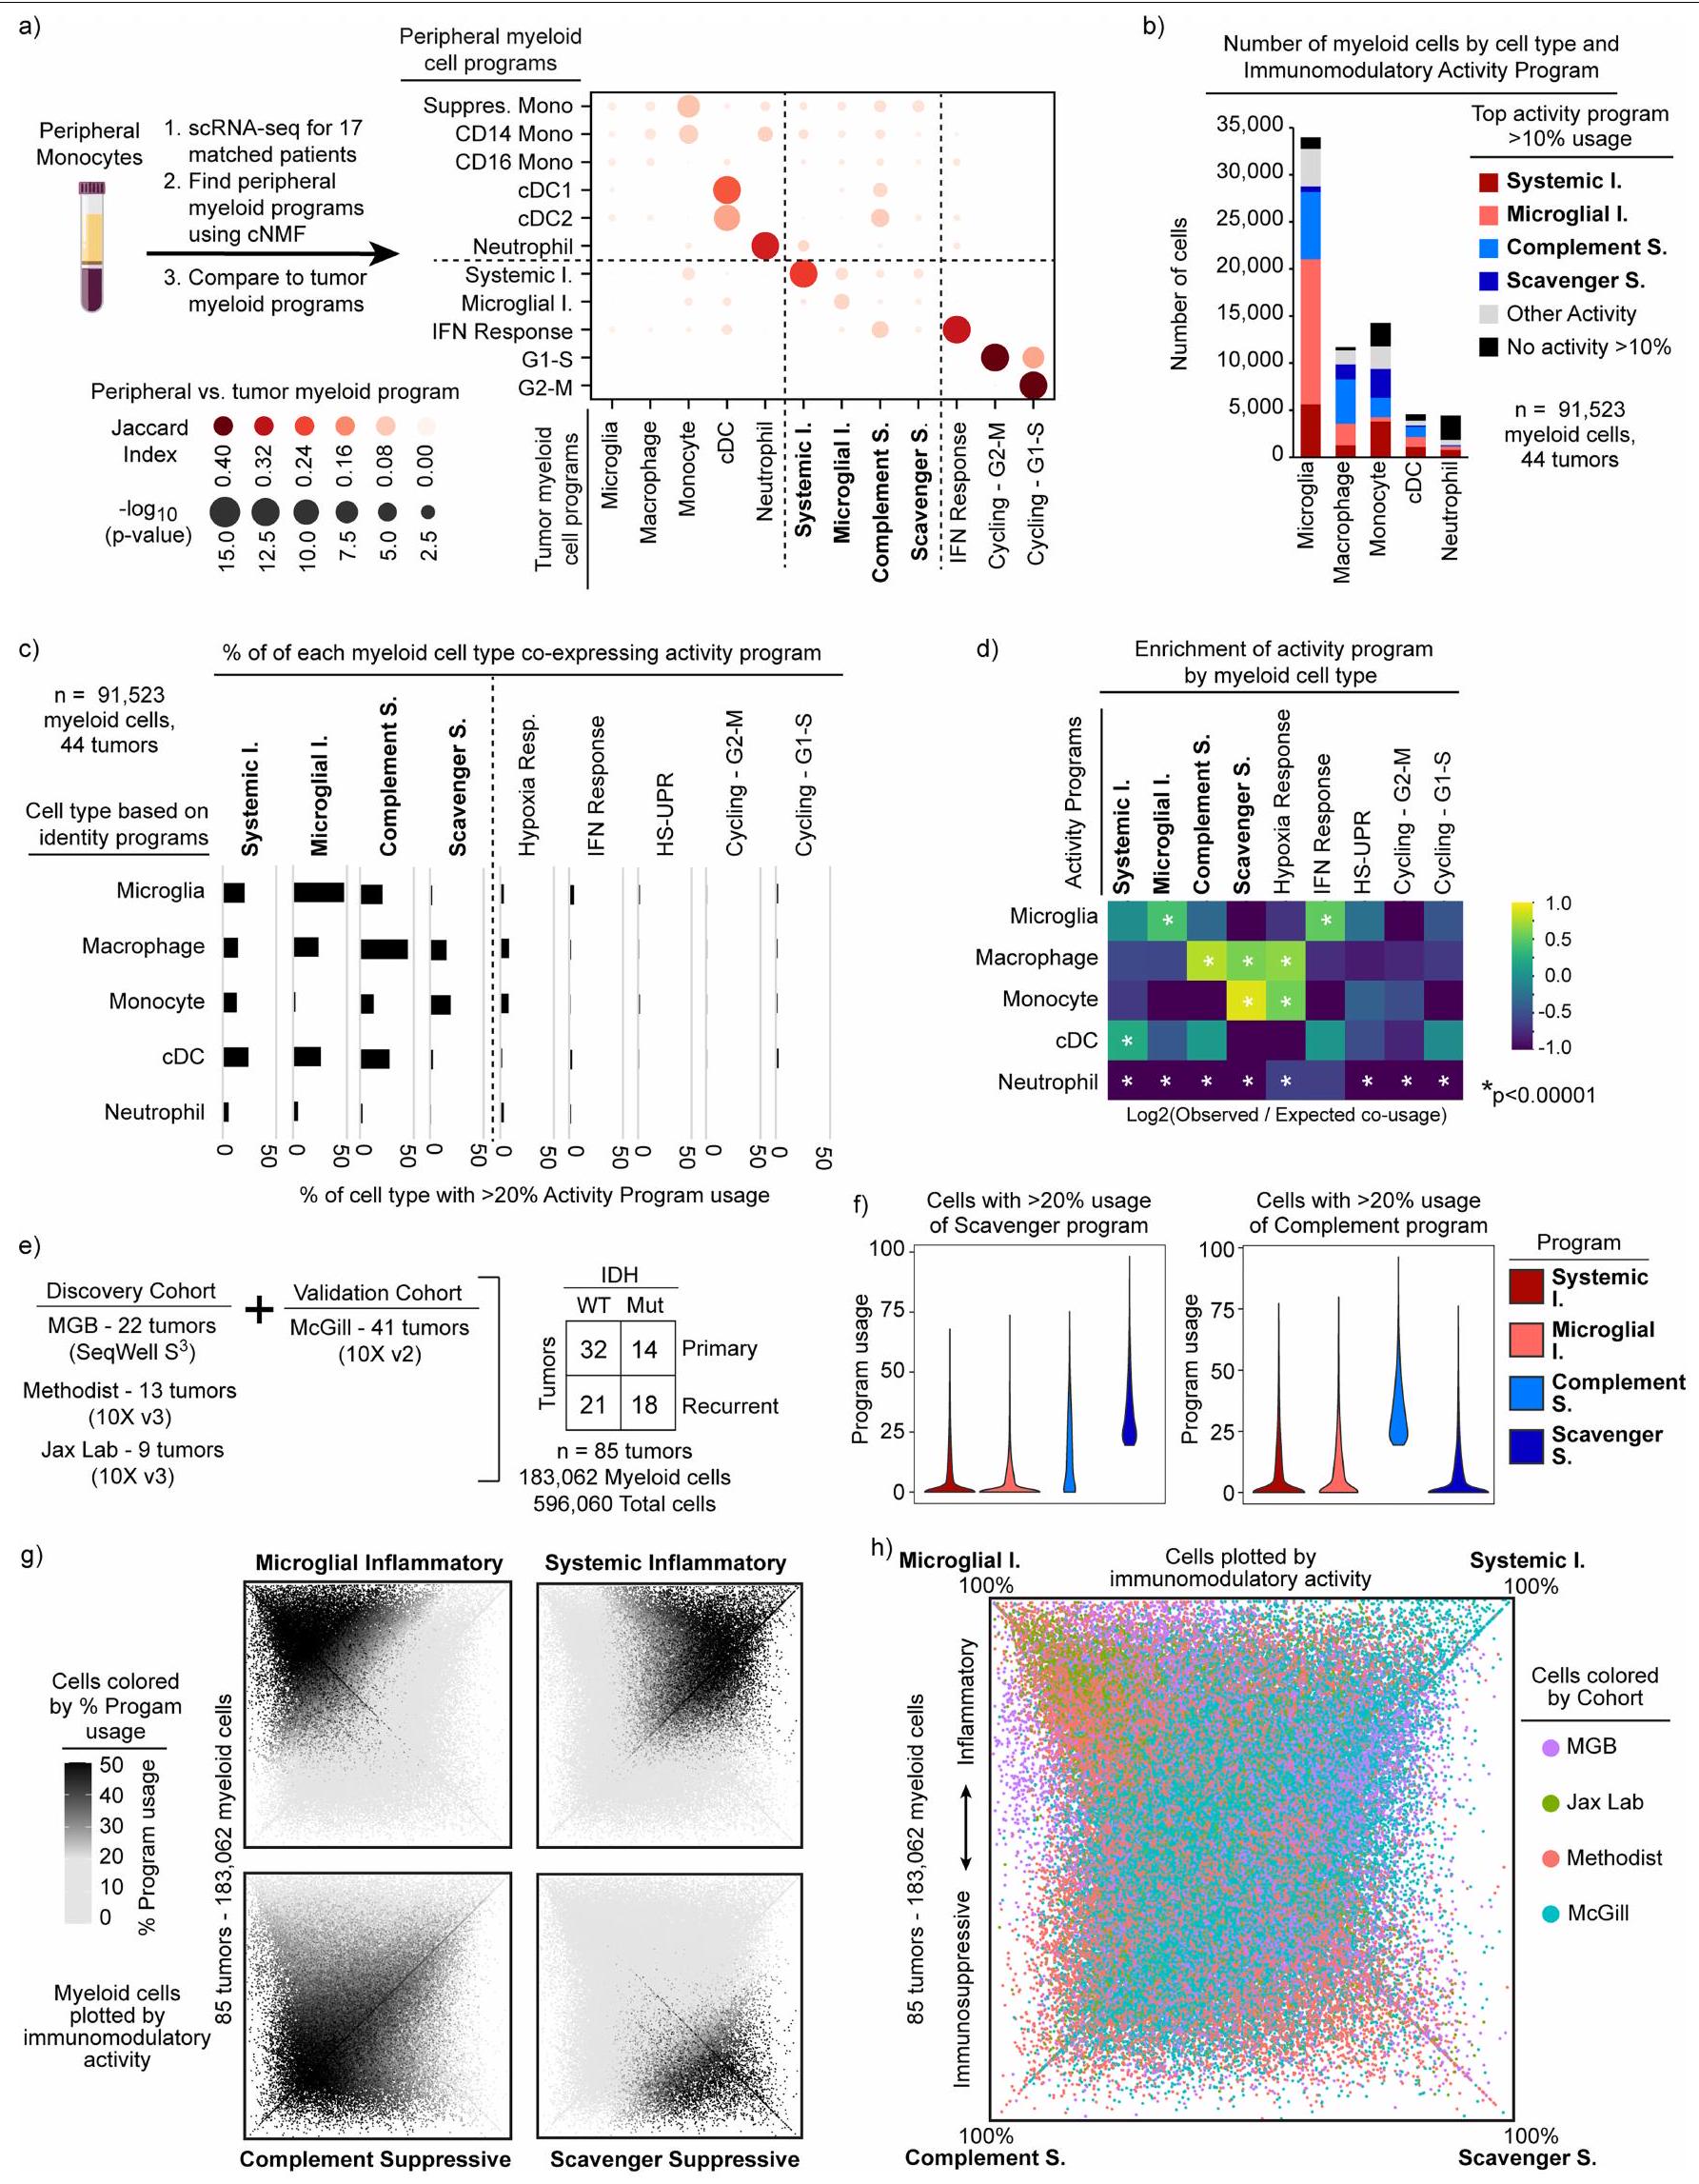
شملت برامج التوافق برامج هوية الخلايا وبرامج نشاط الخلايا (الشكل 1c). تحتوي برامج الهوية على جينات علامات كلاسيكية لأنواع الخلايا النخاعية، بما في ذلك الخلايا الدبقية الصغيرة، البلعميات، وحيدات النواة، الخلايا الشجرية والعدلات. لمقارنة برنامج وحيدات النواة المرتبطة بالورم مع وحيدات النواة المحيطية، قمنا بإجراء تسلسل RNA أحادي الخلية على خلايا نخاعية من 17 عينة دم متطابقة، وحددنا 3 برامج لوحيدات النواة المحيطية (CD14و CD163). برنامج وحيدات النوى المرتبطة بالورم شارك ميزات مع وبرامج في المونوسيتات المحيطية ولكن ليس معالبرنامج (الشكل 2أ من البيانات الموسعة). كما شمل الجينات المشاركة في التصاق الخلايا، والهجرة، والتمايز، والاستجابة الالتهابية الأولية (على سبيل المثال، VCAN، FCN1، LYZ، CD44 وCCR2)، مما يشير إلى أن الأحادية الخلوية تمر بعملية التمايز في نسيج الورم.
أربعة برامج رئيسية لتعديل المناعة
تم تكملة برامج نوع الخلايا cNMF بتسعة برامج نشاط. خمسة من هذه البرامج تتوافق مع برامج خلوية معروفة تتكون من جينات علامات كلاسيكية للاستجابة لنقص الأكسجين، والإنترفيرون، والبروتينات غير المطوية، أو دورة الخلية. تحتوي البرامج الأربعة الأخرى على جينات ذات وظائف مناعية ويمكن تقسيمها إلى برنامجين التهابيين وبرنامجين مثبطين للمناعة. أحد البرامج الالتهابية،
الذي أطلقنا عليه اسم برنامج ‘الالتهاب الجهازي’، يتضمن جينات تشفر السيتوكينات والكيموكينات التي لها أدوار مثبتة في تجنيد الخلايا النخاعية والاستجابات الالتهابية الجهازية (IL1B، IL1A، CCL2، TNF، OSM وCXCL8). يتضمن برنامج ‘الالتهاب الميكروغليالي’ جينات تشارك في تجنيد اللمفاويات والوحيدات (CXCR4، CXCL12، CCL3، CCL4 وCX3CR1)، استجابات الإجهاد (RHOB، JUN، KLF2 وEGR1) وجينات التفاعل العصبي (PDK4 وP2RY13). على الجانب المناعي المثبط، يتضمن برنامج ‘المكمل المناعي المثبط’ جينات تشفر عوامل المكمل المتورطة في حل الجروح واستجابات السيتوكين المضادة للالتهابات ومرتبطة بالمثبطات المناعية في أورام أخرى (C1QA، C1QB، و )، بالإضافة إلى علامات مثبطة مناعية مثبتة أخرى (VSIG4 وCD163) . أخيرًا، يتضمن برنامج ‘المثبط المناعي القاذف’ جينات تشفر مستقبلات القاذف (MRC1 (المعروف أيضًا باسم CD206)، MSR1 (المعروف أيضًا باسم CD204)، CD163، LYVE1، COLEC12 وSTAB1) وجينات أخرى قد تكون مثبطة مناعيًا (NRP1، RNASE1 وCTSB). لقد أظهرت العديد من هذه الجينات أنها تثبط وظيفة خلايا T، بما في ذلك CD163 (مرجع 28) وVSIG4 (مرجع 27)، التي تثبط تكاثر خلايا T، وMSR1، التي تثبط إشارات STAT1 .
تشارك البرامج المناعية المعدلة
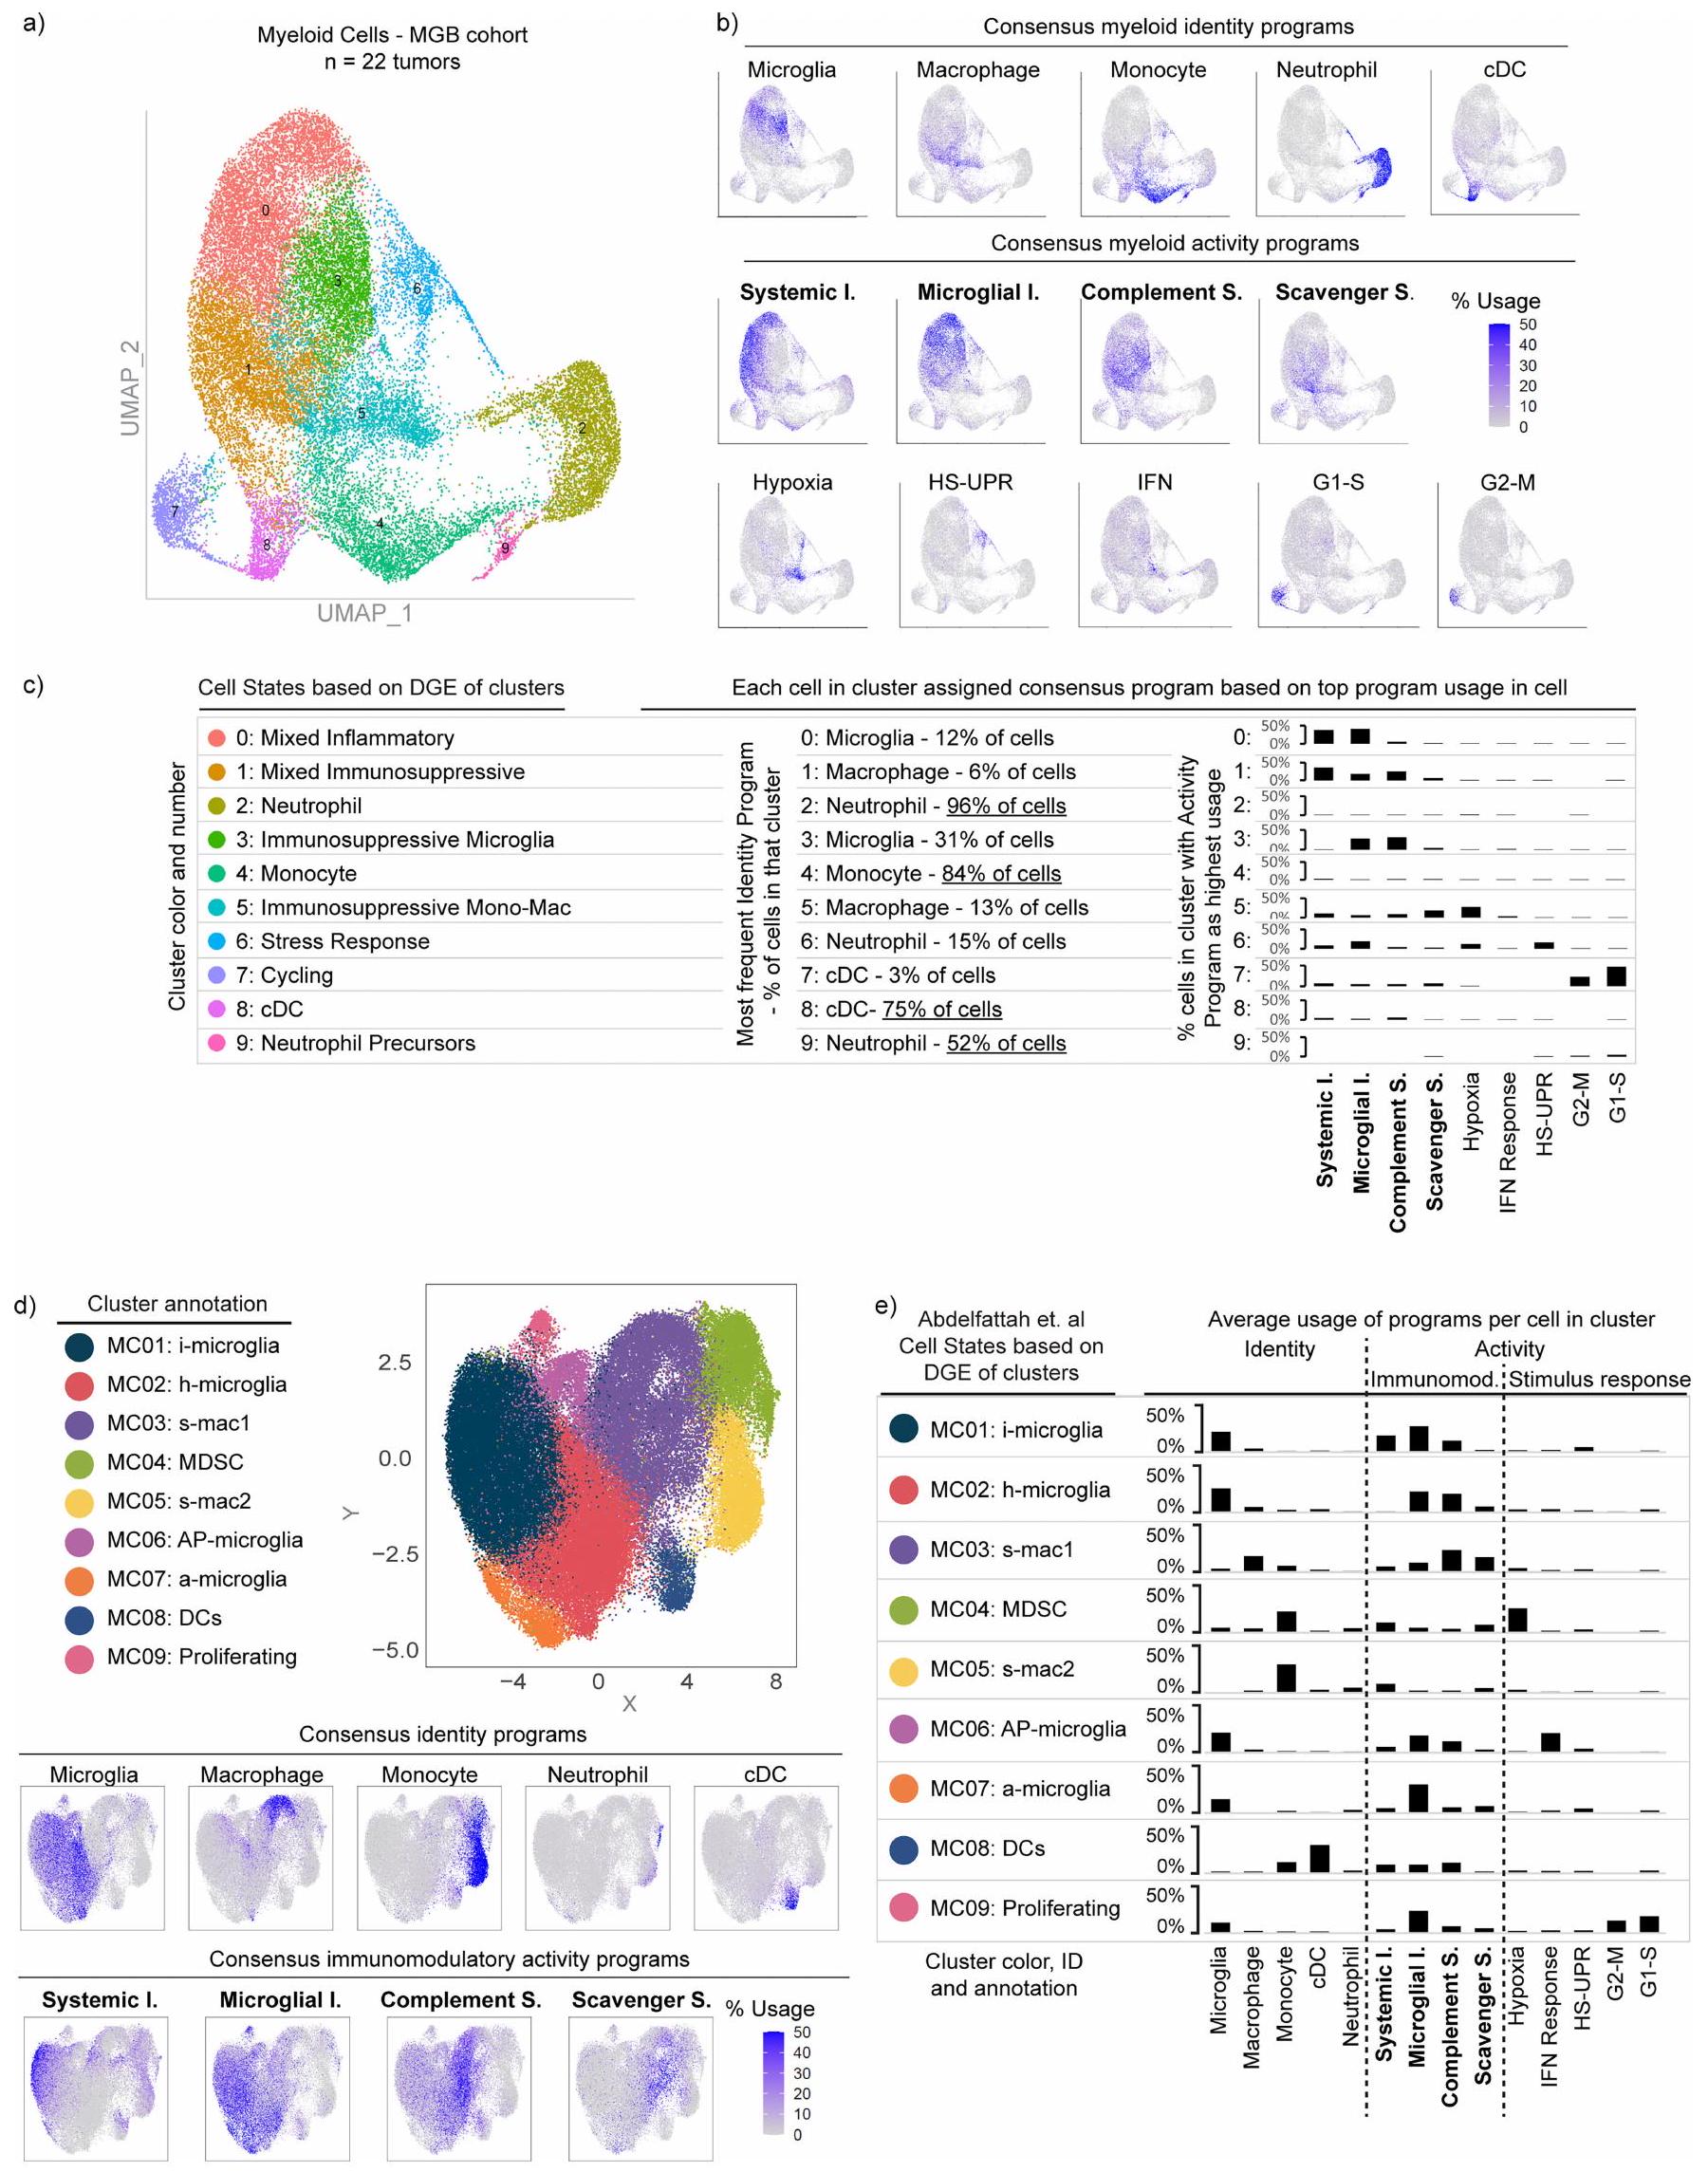
كانت البرامج المناعية المعدلة هي الأكثر استخدامًا من بين برامج cNMF، حيث أن من خلايا النخاع المرتبطة بالورم تعبر عن أحد البرامج الأربعة (الشكل 1d). تم التعبير عن جميع البرامج الأربعة عبر أنواع خلايا متعددة (البيانات الموسعة الشكل 2b-d والملاحظة التكميلية 1)، ووجد أن البرنامج الالتهابي الجهازي موجود في مجموعات فرعية من جميع أنواع خلايا النخاع. يمكن لكل نوع من خلايا النخاع استخدام أكثر من برنامج واحد. على سبيل المثال، يمكن أن تعبر البلعميات عن أي من البرامج الأربعة المناعية المعدلة ولكنها غنية بالبرامج المناعية المثبطة. يمكن أن تعبر الميكروغليا عن كلا البرنامجين الالتهابيين وبرنامج المكمل المناعي المثبط، لكنها نادرًا ما تعبر عن برنامج المثبط المناعي القاذف.
كان استخدام البرامج المناعية المعدلة الواسع ولكن المختلف عبر أنواع خلايا النخاع سمة بارزة في تحليل cNMF المنهجي لدينا لـ 183,062 خلية نخاع من 85 ورمًا (الشكل 1c-f، البيانات الموسعة الشكل 2e-h والملاحظة التكميلية 2). ومع ذلك، عندما أعدنا تحليل هذه البيانات أحادية الخلية باستخدام تجميع لوفيان القياسي وتقريب وتهيئة الفضاء الموحد (UMAP)، لم يتم إعادة تجسيد البرامج المناعية المعدلة. كانت هذه الأساليب التقليدية، التي تعالج الخلايا كوحدات فردية وتجمعها حسب التشابه مع خلايا أخرى، تنظم البيانات بشكل أساسي حسب نوع الخلية وفشلت في التقاط برامج النشاط (البيانات الموسعة الشكل 3).
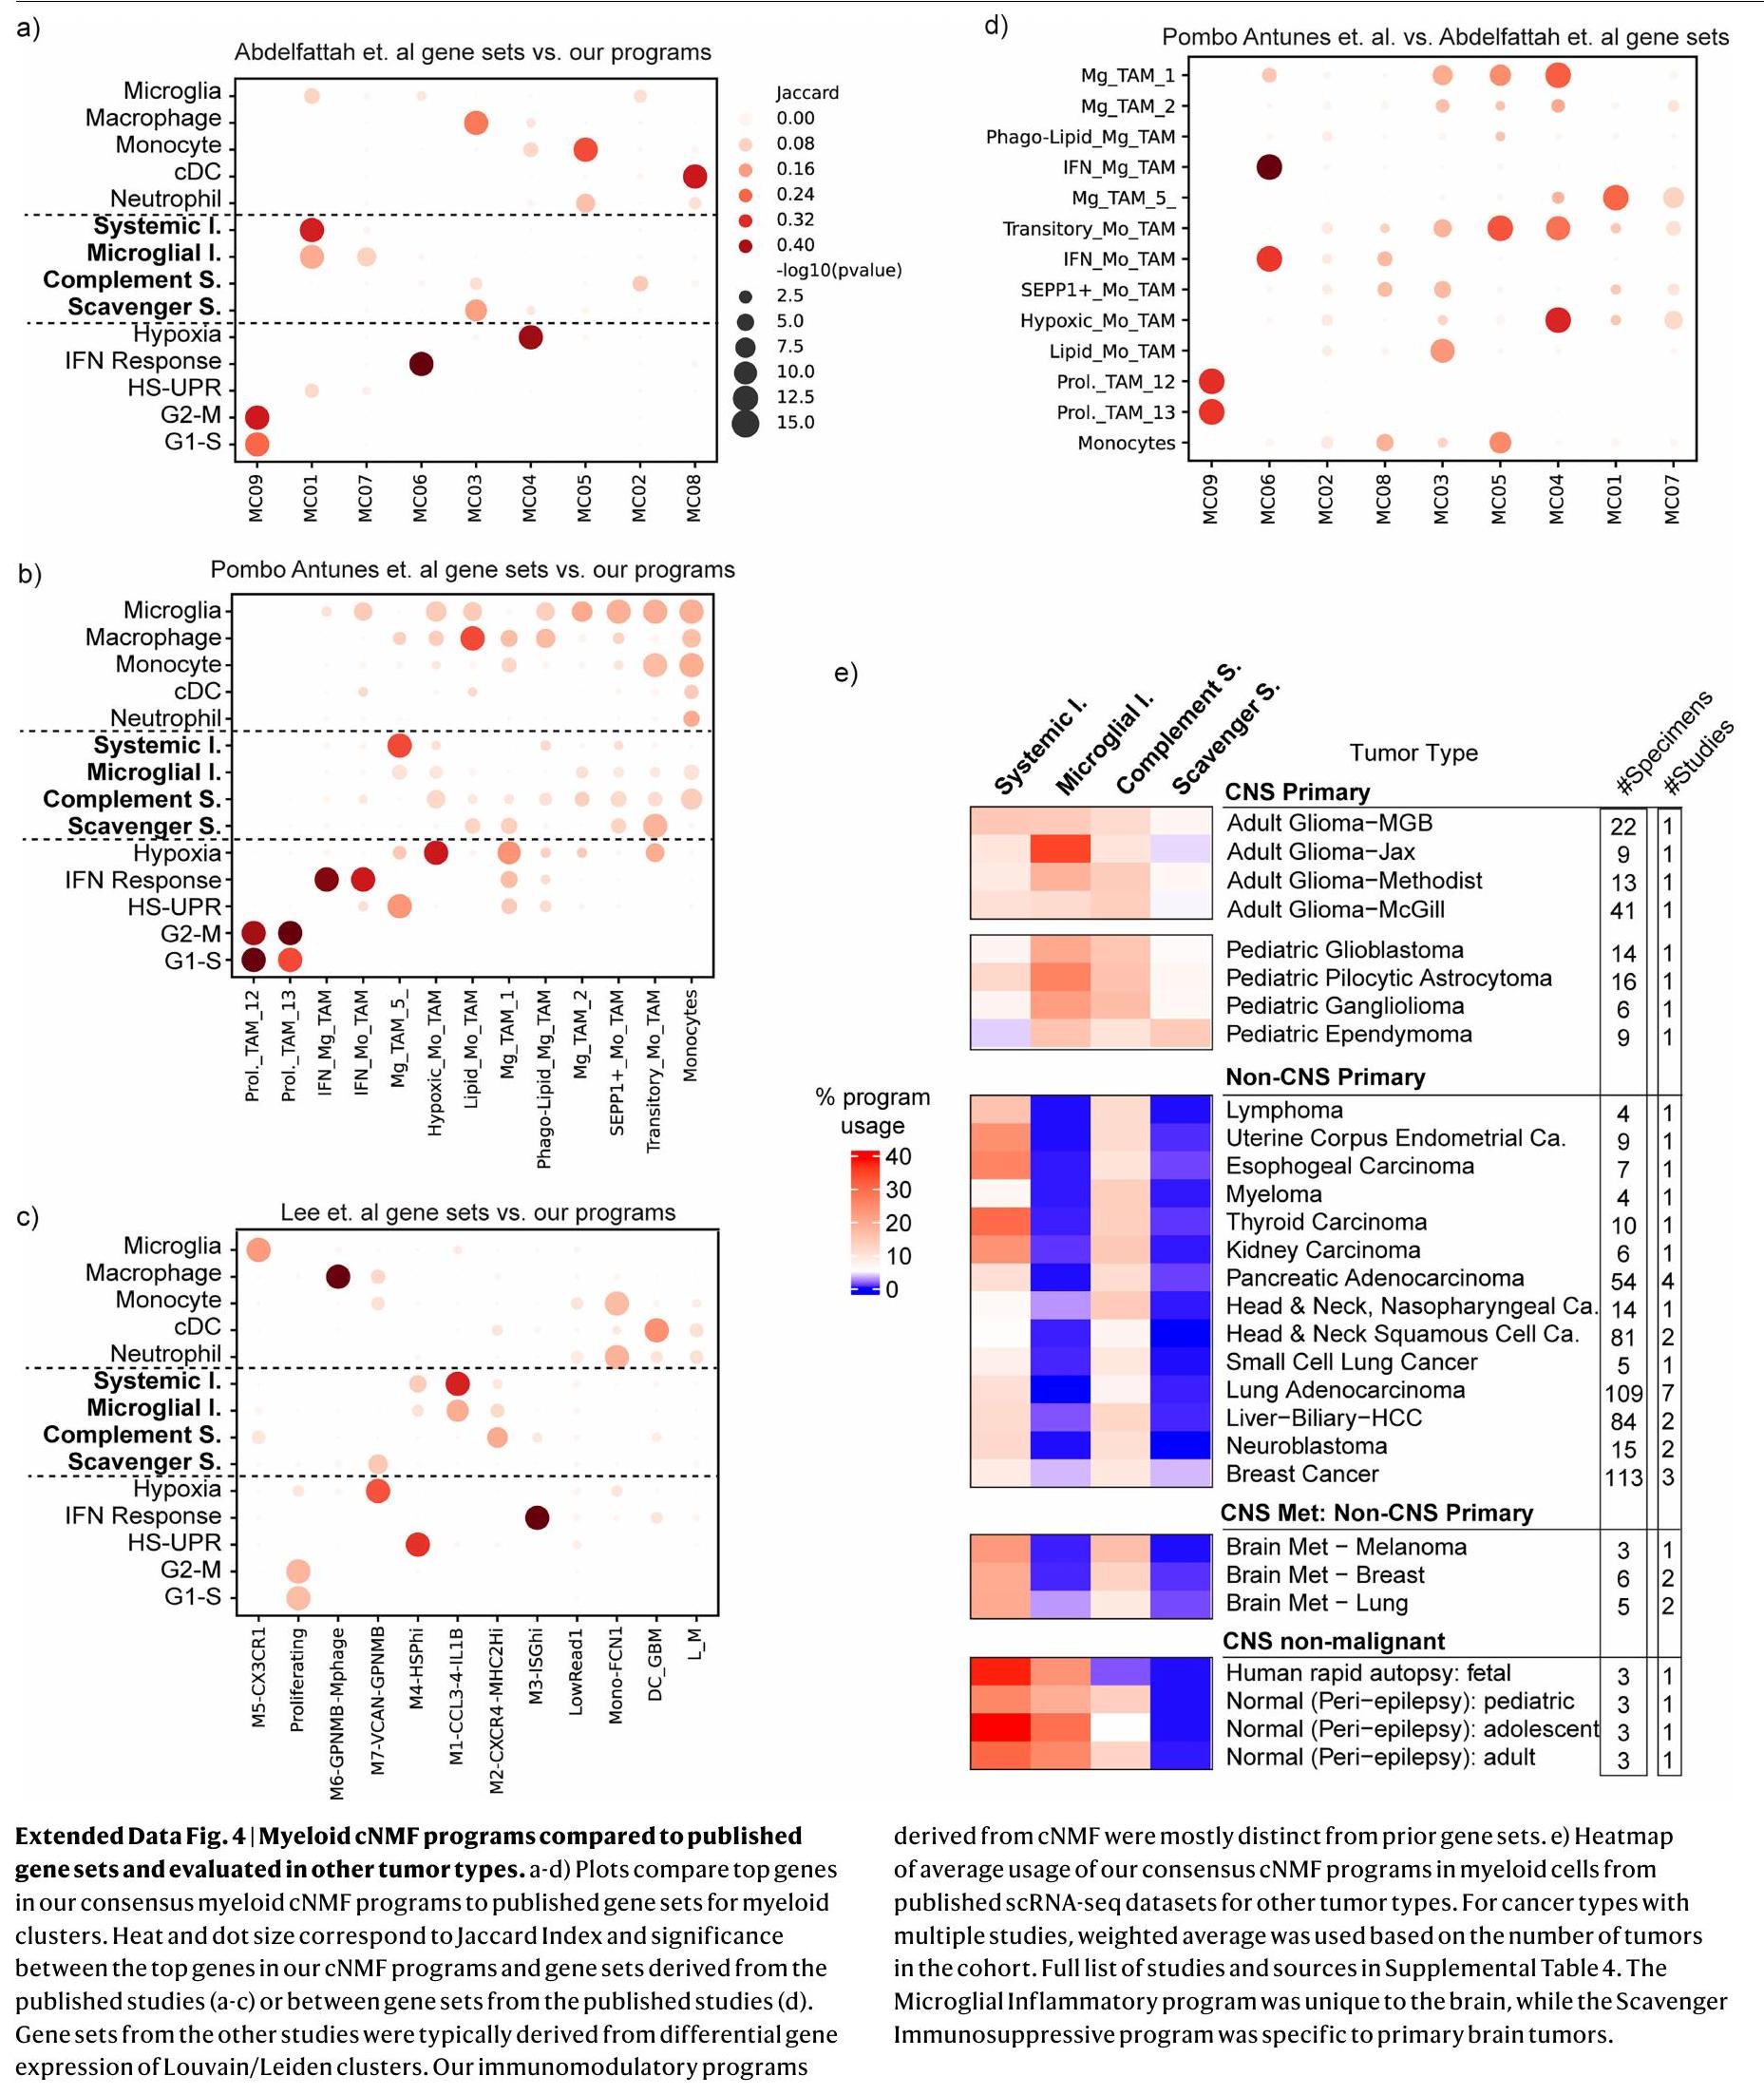
بشكل متسق، أكدت المقارنات الشاملة مع الأدبيات المنشورة سابقًا أن برامج cNMF المناعية المعدلة متميزة عن حالات خلايا النخاع المبلغ عنها ومجموعات الجينات، التي تم اشتقاقها من خلال طرق تجميع الخلايا الكاملة. على سبيل المثال، تعكس حالة تم الإبلاغ عنها للبلعميات المثبطة-1 (مرجع 7) مزيجًا من برنامج البلعميات cNMF مع برنامجينا المناعيين المثبطين، وتجمع حالة تم الإبلاغ عنها للميكروغليا الالتهابية تجمع بين الميكروغليا cNMF مع برنامجينا الالتهابيين (البيانات الموسعة الشكل 3d، e). يظهر تداخل بسيط لمجموعات الجينات من الدراسات السابقة نمطًا مشابهًا لاستخدام البرامج المركبة، حيث اشتقت الدراسات السابقة كل منها مجموعات جينية مختلفة بناءً على كيفية تقسيمها للخلايا ذات الصلة الوثيقة (البيانات الموسعة الشكل 4a-d).
تشير هذه التحليلات إلى أن برامج cNMF لدينا تمثل مكونات أساسية من خلايا النخاع التي لا يمكن تمييزها من خلال التجميع التقليدي. لقد مكنتنا قوة cNMF في عزل برامج النشاط من نوع الخلية من اتخاذ نهج مركزي للنشاط في تحقيقاتنا حول خلايا النخاع المرتبطة بالورم، وركزنا تحقيقاتنا الإضافية على العواقب الوظيفية والفسيولوجية للبرامج المناعية المعدلة الأربعة السائدة.
الشكل 1|انظر الصفحة التالية للتسمية.
الشكل 1|تحديد هوية خلايا النخاع القابلة للتراكب والبرامج النشطة. أ، خط أنابيب التحليل لتحديد البرامج النخاعية المتكررة عبر ثلاث مجموعات اكتشاف ورم الدبقيات. Mut، طفرات. ب، خريطة حرارية توضح تشابه درجات طيف الجينات لكل برنامج في ثلاث مجموعات اكتشاف. تم تضمين البرامج التوافقية المكونة من متوسط درجاتها أيضًا. HS-UPR، استجابة بروتين غير مطوي بسبب الصدمة الحرارية؛ IFN، إنترفيرون. ج، خريطة حرارية توضح تعبير الجينات في البرامج النخاعية المتكررة (الصفوف) في خلايا فردية (الأعمدة) مجمعة حسب نوع الخلية، كما هو محدد من خلال استخدام برنامج هوية النخاع. تعبر الخلايا المتوسطة (Int) عن كلا البرنامجين المتجاورين. اليمين، جينات العلامة المختارة لكل برنامج. د، مخططات صندوقية توضح نسبة الخلايا لكل ورم التي تعبر عن البرنامج النخاعي المقابل (أقصى اليسار في ج) عبر ثلاث مجموعات اكتشاف. تمثل الخط الوسيط والصناديق تمثل الربع الأول والثالث؛ الأورام، 91,523 خلية نخاع. هـ، مخطط رباعي يحدد خلايا النخاع من مجموعات الاكتشاف والتحقق وفقًا لتعبيرها النسبي عن أربعة برامج مناعية معدلة بارزة. تتوافق المحاور القطرية مع الفرق بين استخدام البرنامج الالتهابي الميكروغليالي والمثبط المناعي القاذف أو بين استخدام البرنامج الالتهابي الجهازي والمثبط المناعي المكمل. البرامج في نهايات المحاور القطرية متعارضة إلى حد كبير في الخلايا الفردية. كل نقطة هي مخطط دائري صغير يوضح انتشار كل برنامج مناعي معدل (الألوان) ومزيج من جميع البرامج الأخرى (الرمادي) في تلك الخلية. و، مخططات رباعية توضح استخدام هوية خلايا النخاع للخلايا المحددة كما في هـ. يتم استخدام أربعة برامج نشاط مناعية معدلة بارزة عبر أنواع متعددة من خلايا النخاع.
تمتد الحالات المناعية المعدلة عبر أورام الجهاز العصبي المركزي
تم الكشف عن جميع البرامج الأربعة المناعية المعدلة في مجموعات فرعية من خلايا النخاع في جميع 85 ورمًا دبقيًا، والتي شملت أورامًا كانت تحمل طفرات IDH، IDH-WT، أولية، متكررة، منخفضة الدرجة، عالية الدرجة، تمثل طفرات متنوعة وعولجت بعلاجات مختلفة (الشكل 1c، d والبيانات الموسعة الأشكال 1d و2g، h). لفحص البرامج في أورام أخرى في الجهاز العصبي المركزي (CNS) وغير CNS، قمنا بتجميع مجموعات بيانات scRNA-seq المنشورة وحساب استخدام البرامج في خلايا النخاع (البيانات الموسعة الشكل 4e). في أورام CNS الأولية الأخرى، بما في ذلك الأورام الدبقية الطفولية والإيبنديمومات، تم تمثيل مجموعة كاملة من البرامج المناعية المعدلة. ومع ذلك، أسفر فحص خلايا النخاع من الأورام غير CNS عن نتيجة مختلفة. كانت البرامج الالتهابية الجهازية والمثبط المناعي المكمل موجودة في جميع أنواع الأورام تقريبًا، لكن البرامج الالتهابية الميكروغليالية والمثبط المناعي القاذف كانت خاصة إلى حد كبير بأورام CNS. من الجدير بالذكر أن أقسام النخاع في النقائل الدماغية للأورام غير CNS أعادت تجسيد الأورام الأصلية وكانت خالية إلى حد كبير من البرامج الالتهابية الميكروغليالية والمثبط المناعي القاذف. أخيرًا، عبرت خلايا النخاع من أدمغة غير ورمية عن ثلاثة من البرامج المناعية المعدلة، مع غياب البرنامج المثبط المناعي القاذف، مما يدعم بشكل أكبر خصوصيته لأورام CNS الأولية. تشير هذه النتائج إلى أن الأورام الدبقية لديها بيئة نخاعية فريدة مع نمط مثبط مناعي بارز ومحدد يغيب إلى حد كبير عن الأورام غير CNS ونقائلها الدماغية.
الأصول والمرونة لحالات النخاع
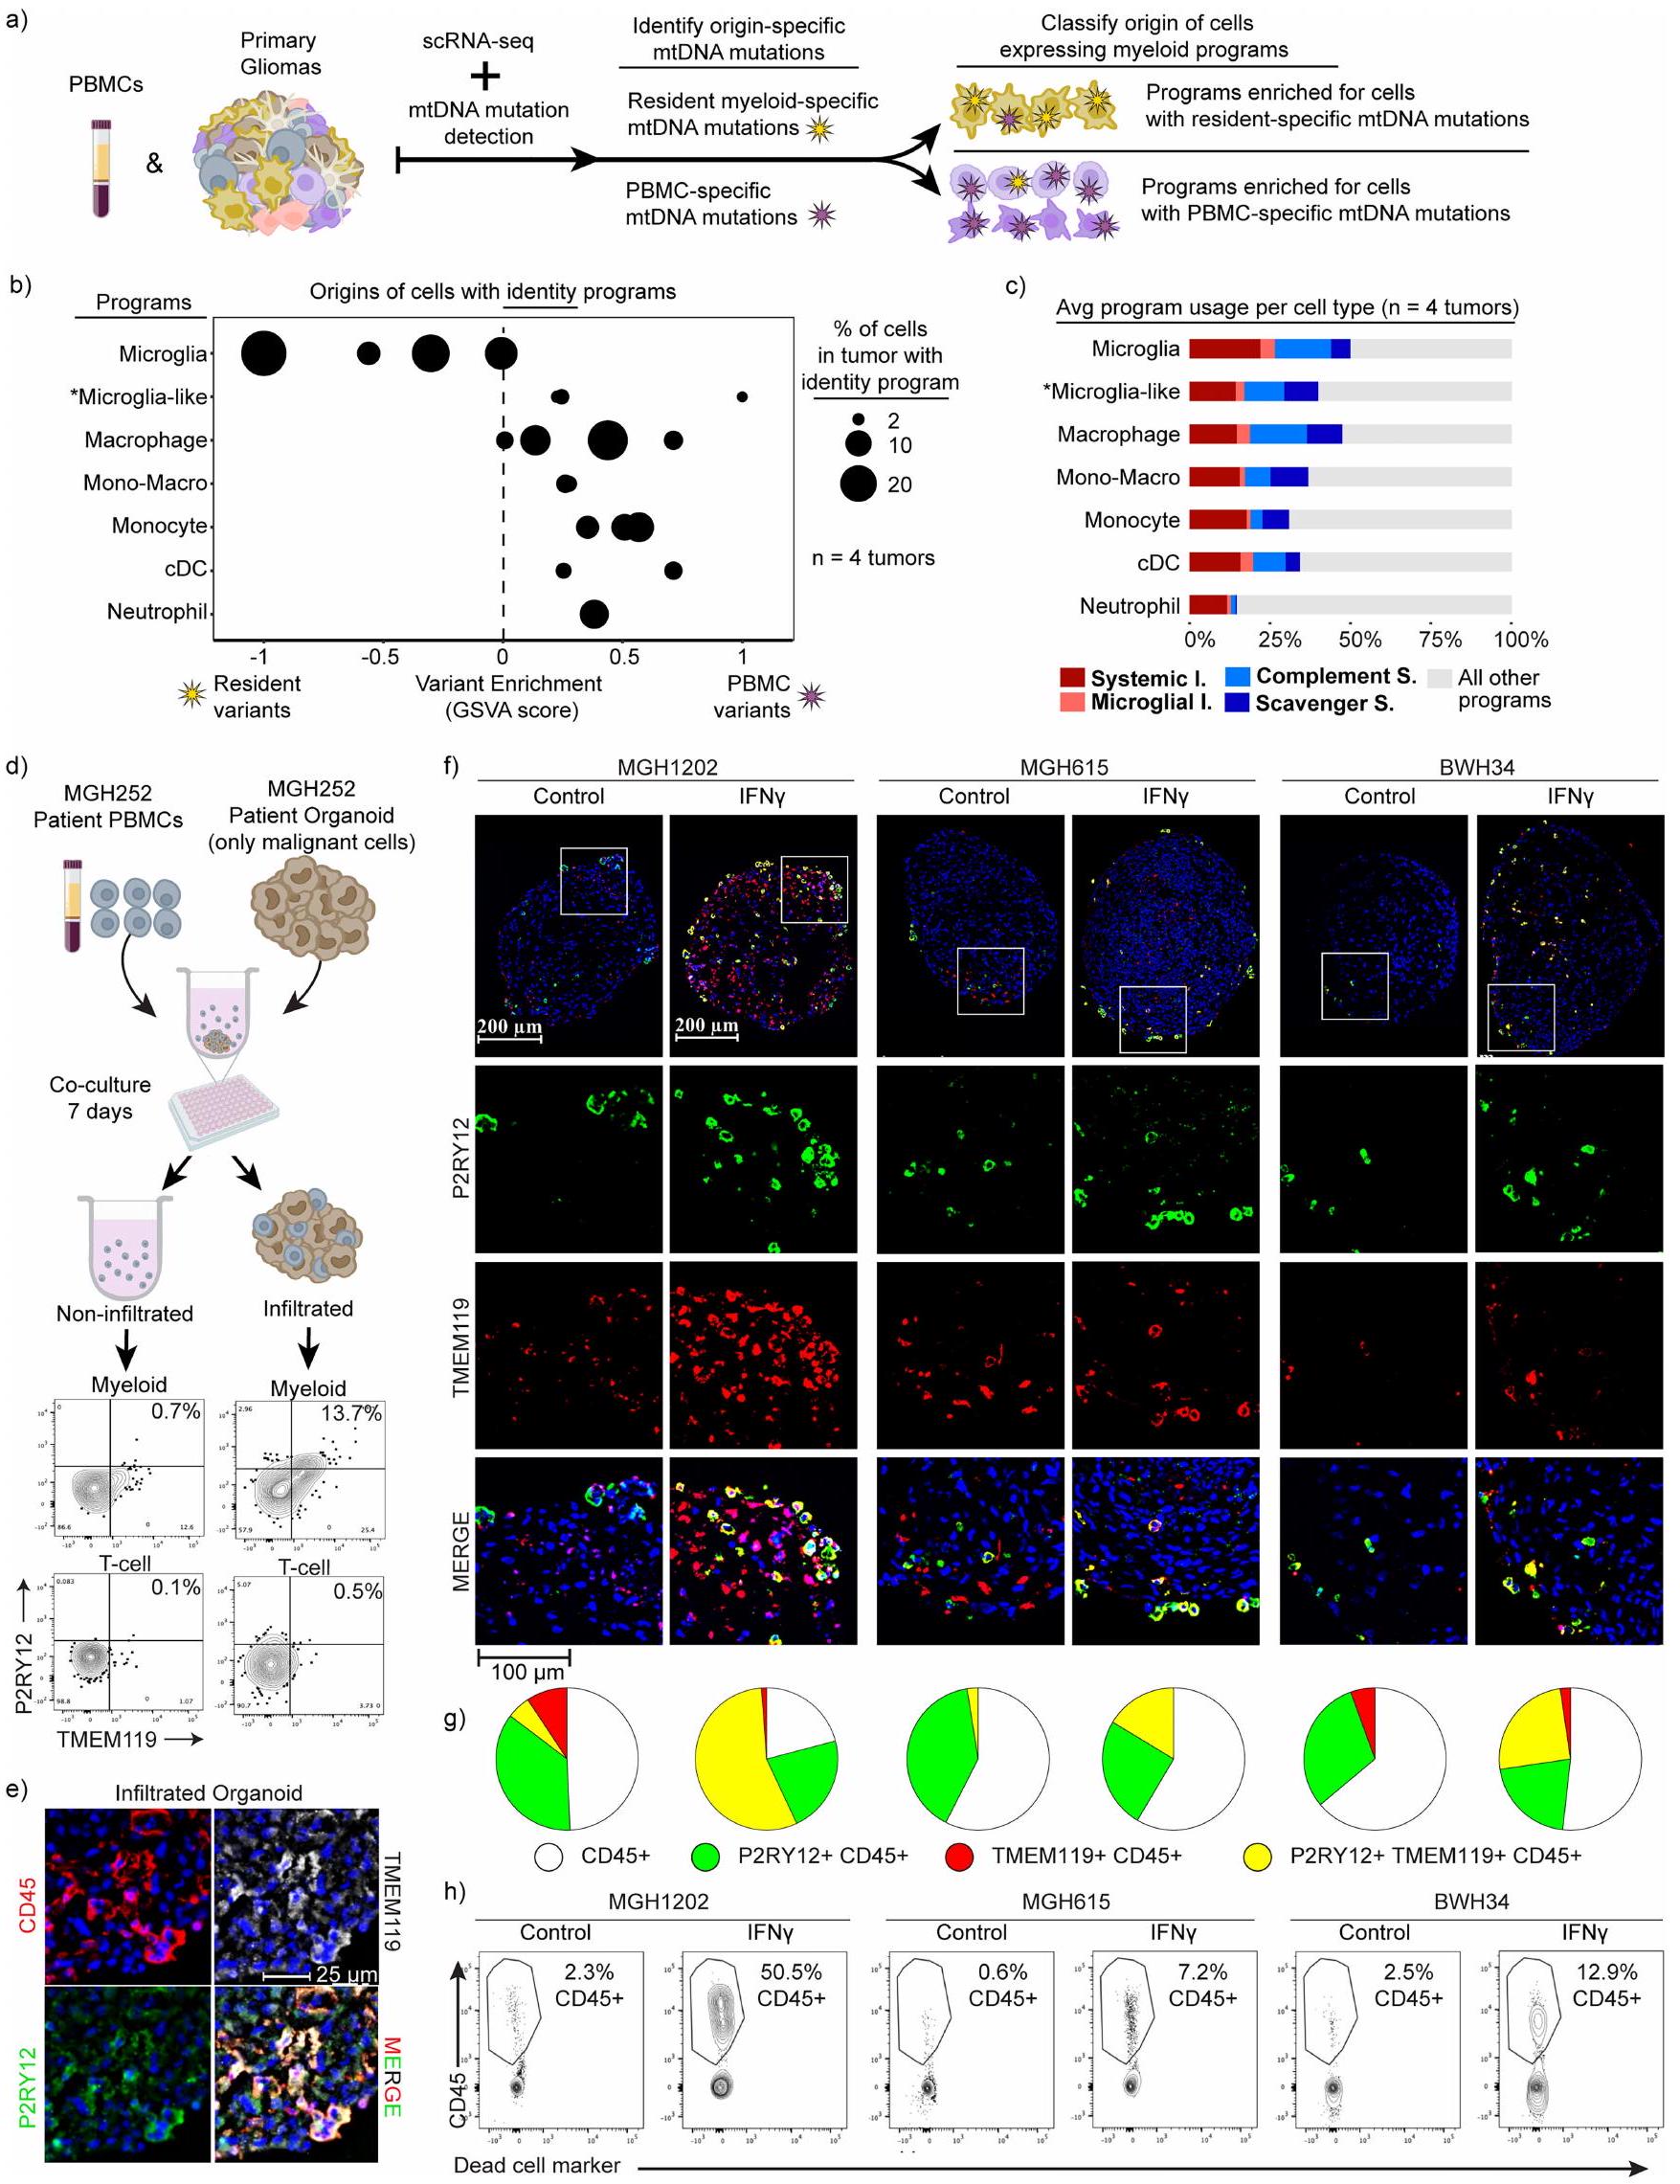
بعد ذلك نظرنا في العلاقات المتبادلة بين الأصل التطوري، نوع خلية النخاع والظواهر المناعية المعدلة. بدأنا باستنتاج علاقات النسب وأصول خلايا النخاع الفردية من طفرات الحمض النووي الميتوكوندري الخاص بها. استخدمنا MAESTER للاتصال بطفرات الحمض النووي الميتوكوندري في خلايا النخاع المرتبطة بالأورام والعدلات المتطابقة من الدم المحيطي لأربعة مرضى. افترضنا أن خلايا النخاع في الورم التي كانت تحتوي على متغيرات من الدم المحيطي كانت مشتقة من الدم. بالمقابل، من المحتمل أن تمثل تلك التي تحتوي على متغيرات مميزة خلايا نخاعية مشتقة من الميكروغليا المقيمة في الدماغ (الشكل التمديدي 5 أ-ج). بما يتماشى مع توقعاتنا، وجدنا أن الخلايا التي تعبر عن برنامج الميكروغليا كانت الأكثر احتمالاً لحمل متغيرات محددة للخلايا المقيمة، في حين كانت أنواع خلايا النخاع الأخرى أكثر احتمالاً لامتلاك متغيرات من الدم المحيطي. كما كانت الخلايا المتوسطة التي تعبر عن برامج الميكروغليا والماكروفاجات غنية أيضاً بالمتغيرات المحيطية. تشير هذه النتائج إلى أن خلايا النخاع المشتقة من العظام يمكن أن تنشط نمط ظاهري مشابه للميكروغليا في الأورام. كما تجلت البرامج المناعية عبر الهويات الخلوية المختلفة والأصول المفترضة، مما يدل على أن خلايا النخاع تحافظ على مرونة جينية كبيرة.
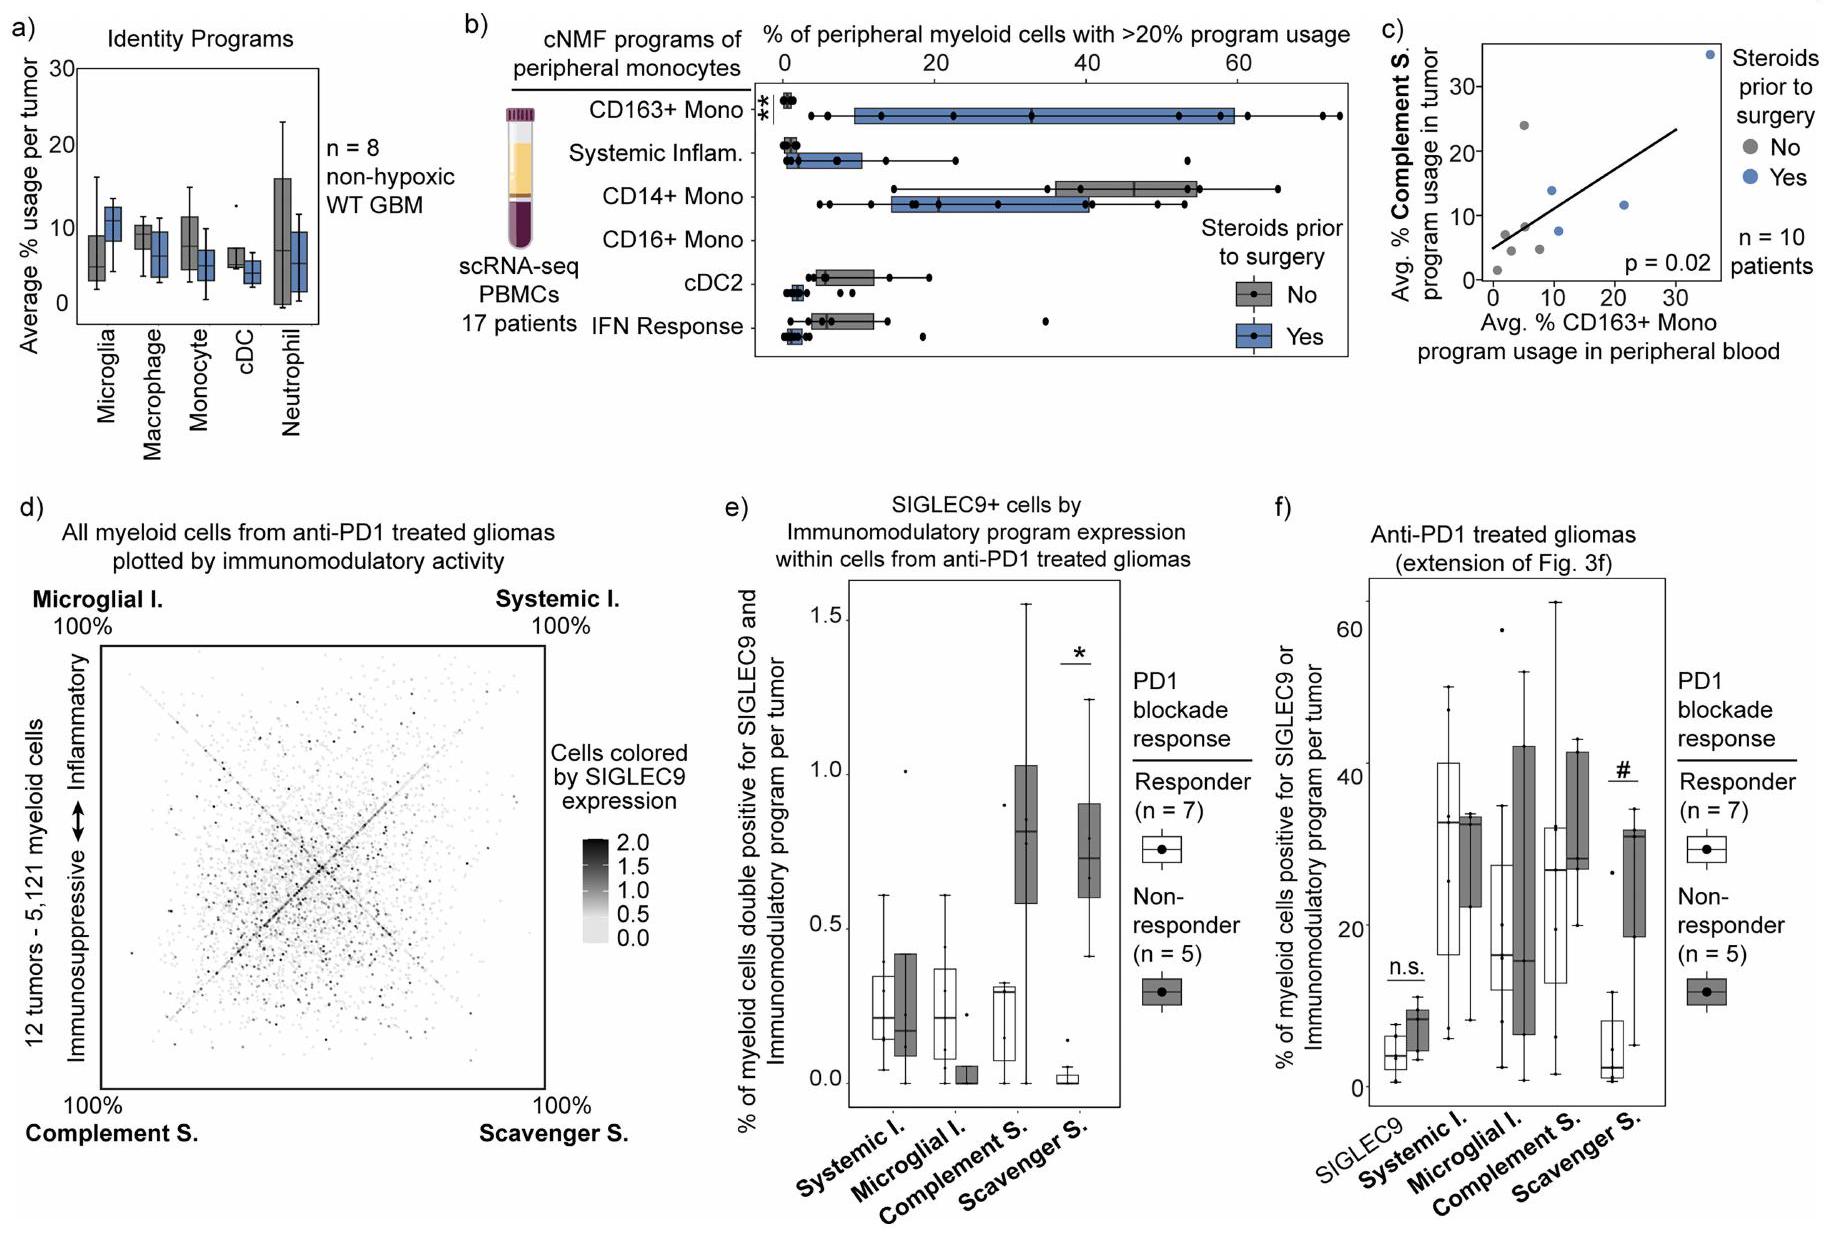
دفعتنا هذه النتائج لاختبار خلايا المايلويد في الدم المحيطي من مرضى الورم الدبقي للتعبير عن برامج النشاط. من بين البرامج الأربعة المناعية، كان فقط النظامي تم اكتشاف برنامج التهابي، مما يشير بقوة إلى أن حالات النشاط النخاعي يجب أن تتغير عند تسلل الورم (الشكل البياني الممتد 2أ). لتقييم قدرة الخلايا المحيطية المشتقة من نخاع العظم على اكتساب أنماط المايلود المرتبطة بالورم الدبقي، استخدمنا نظام الأورغانويد الورمي الدبقي (GBO)تم إنشاء GBOs من الأورام المستأصلة وتم تمريرها لاستنفاد جميع خلايا المناعة. ثم تم تطبيق خلايا الدم المحيطية الوحيدة النواة (PBMCs) المتطابقة على GBOs. بعد أسبوع من الزراعة المشتركة، كانت GBOs مملوءة بشكل كبير بخلايا النخاع (الشكل الممتد 5d-h والطرق). على الرغم من أن العديد من خلايا النخاع تمايزت نحو نمط ماكروفاج، إلا أن مجموعات من خلايا النخاع المتسللة زادت من تعبيرها عن علامات الميكروغليا الكلاسيكية (TMEM119 و P2RY12)، مما يؤكد أن أحادية النواة المحيطية يمكن أن تكتسب ميزات الميكروغليا المقيمة في الأنسجة. بالمقابل، كانت خلايا النخاع التي بقيت خارج الأورغانويد أقل احتمالاً بكثير للتعبير عن هذه العلامات. أكدت الكيمياء المناعية النسيجية أن هناك تسللًا قويًا لخلايا المناعة، بما في ذلك خلايا النخاع التي تعبر عن علامات الميكروغليا.
تشير هذه البيانات معًا إلى أن المونوسيتات المشتقة من الدم يمكن أن تنشط جميع البرامج النخاعية المرتبطة بالورم الدبقي، بما في ذلك برنامج الميكروغليا. يمكنها أيضًا الانخراط في أربعة برامج مناعية متميزة، على الرغم من ملاحظتنا أن خلايا النخاع المحيطية من المرضى الذين يعانون من الورم الدبقي يمكن أن تنشط برنامجًا واحدًا فقط. تُظهر أن تعبير البرامج المناعية ليس مشروطًا بالأصل التطوري أو نوع الخلية، وتبرز مرونة خلايا النخاع في بيئة الورم الدبقي.
حالات النخاع المرتبطة بمواقع الأورام
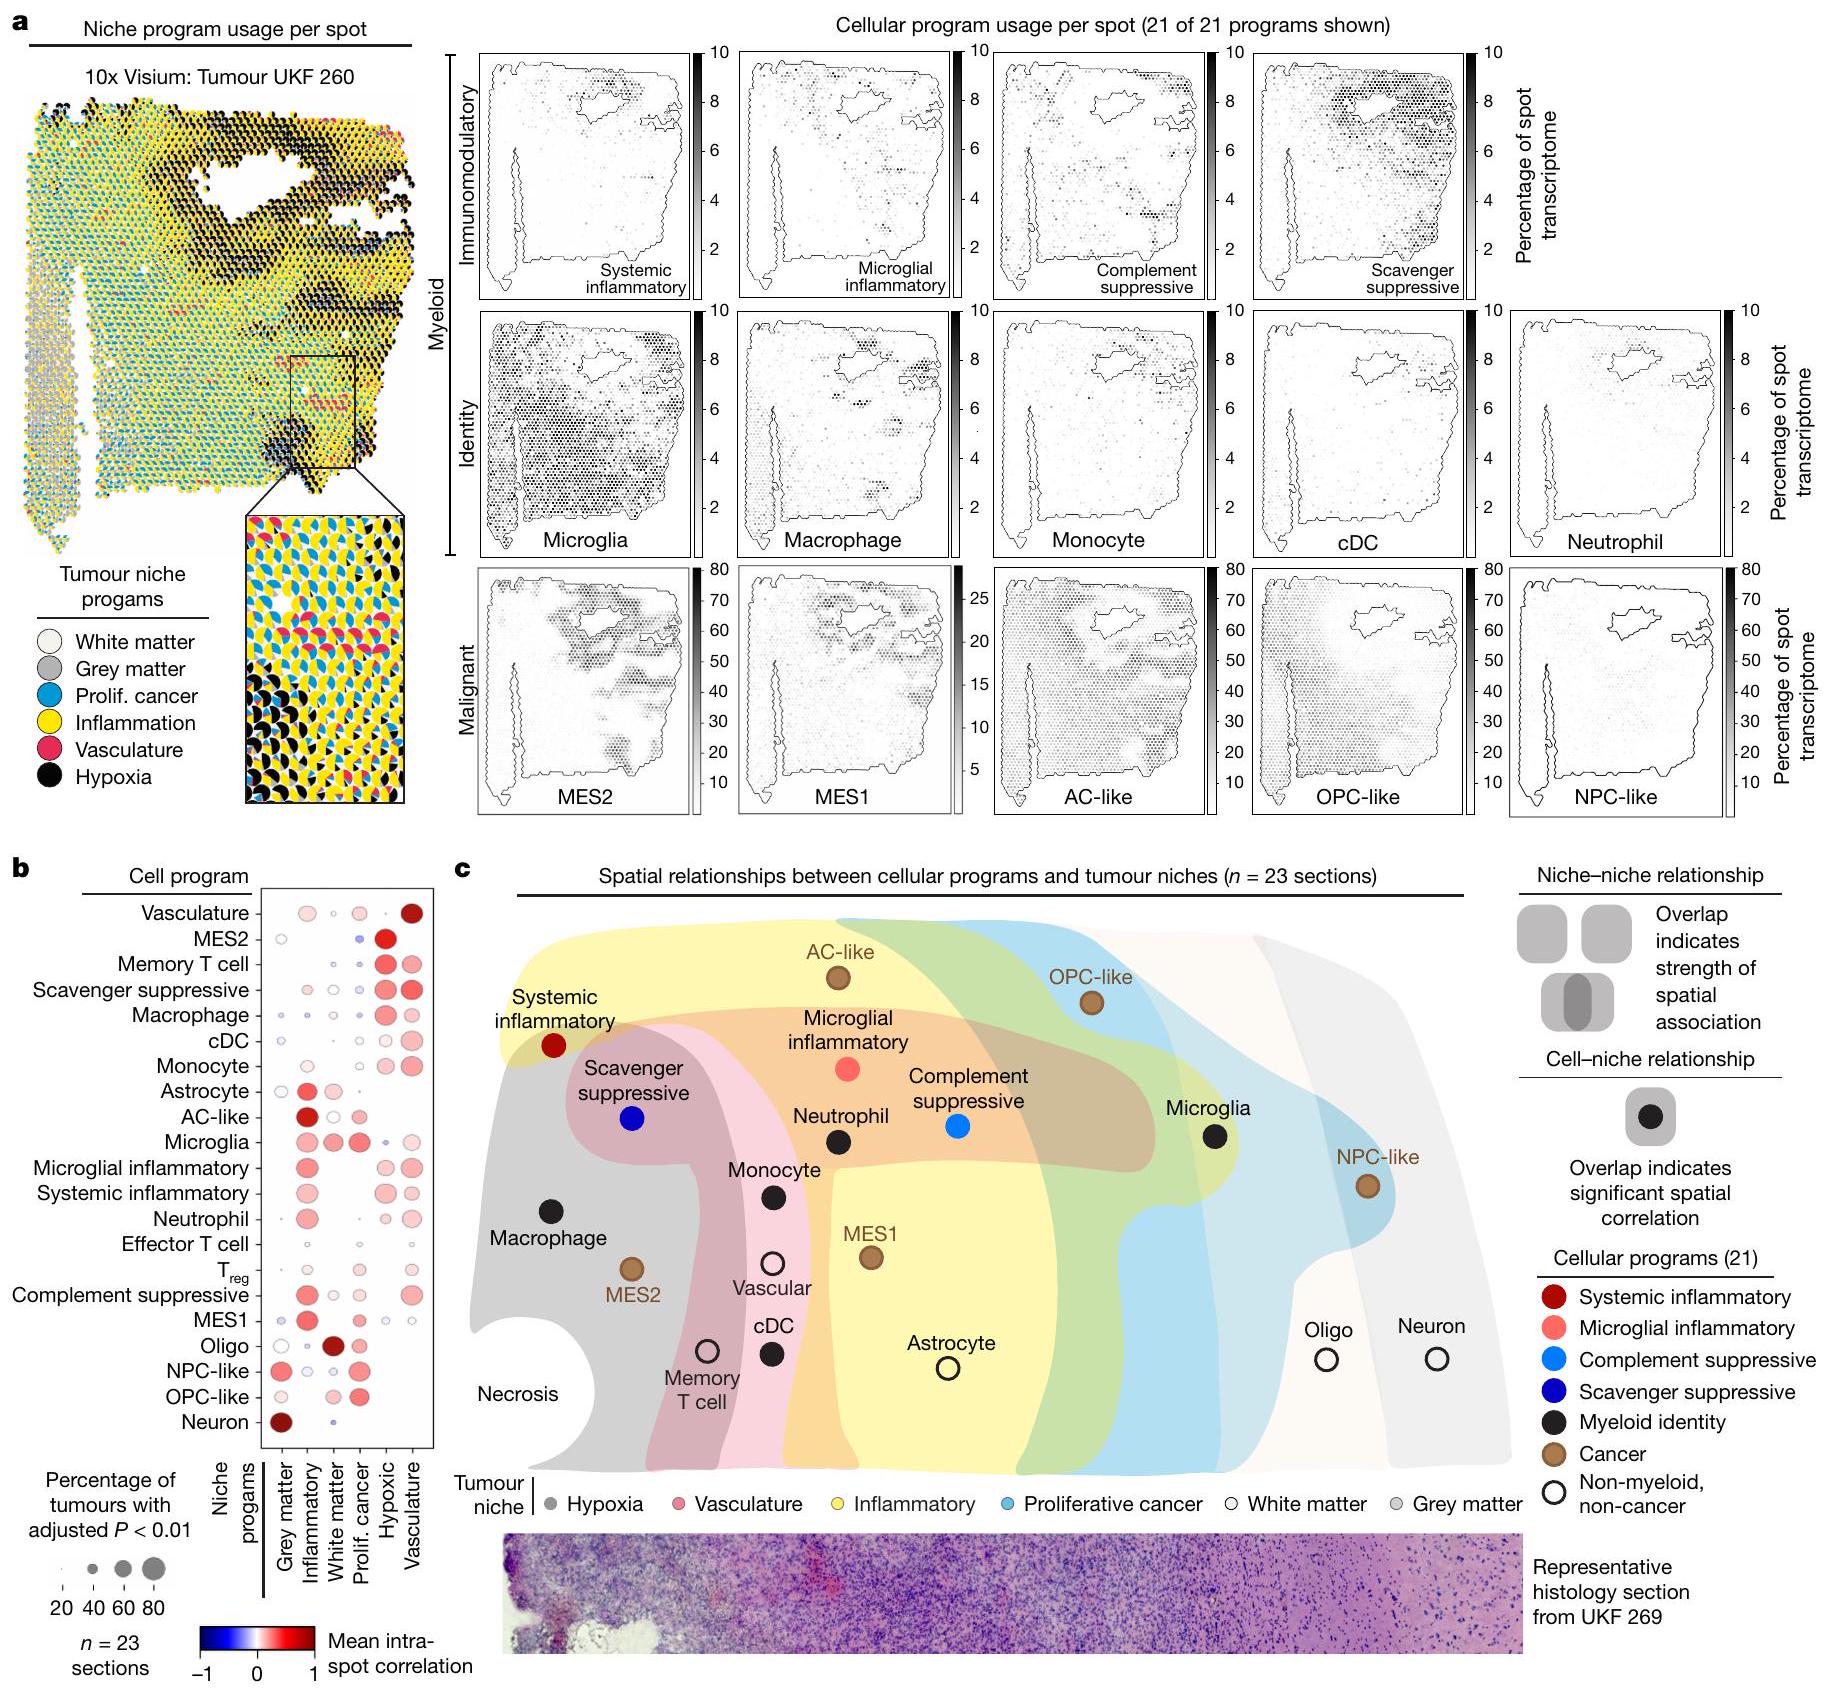
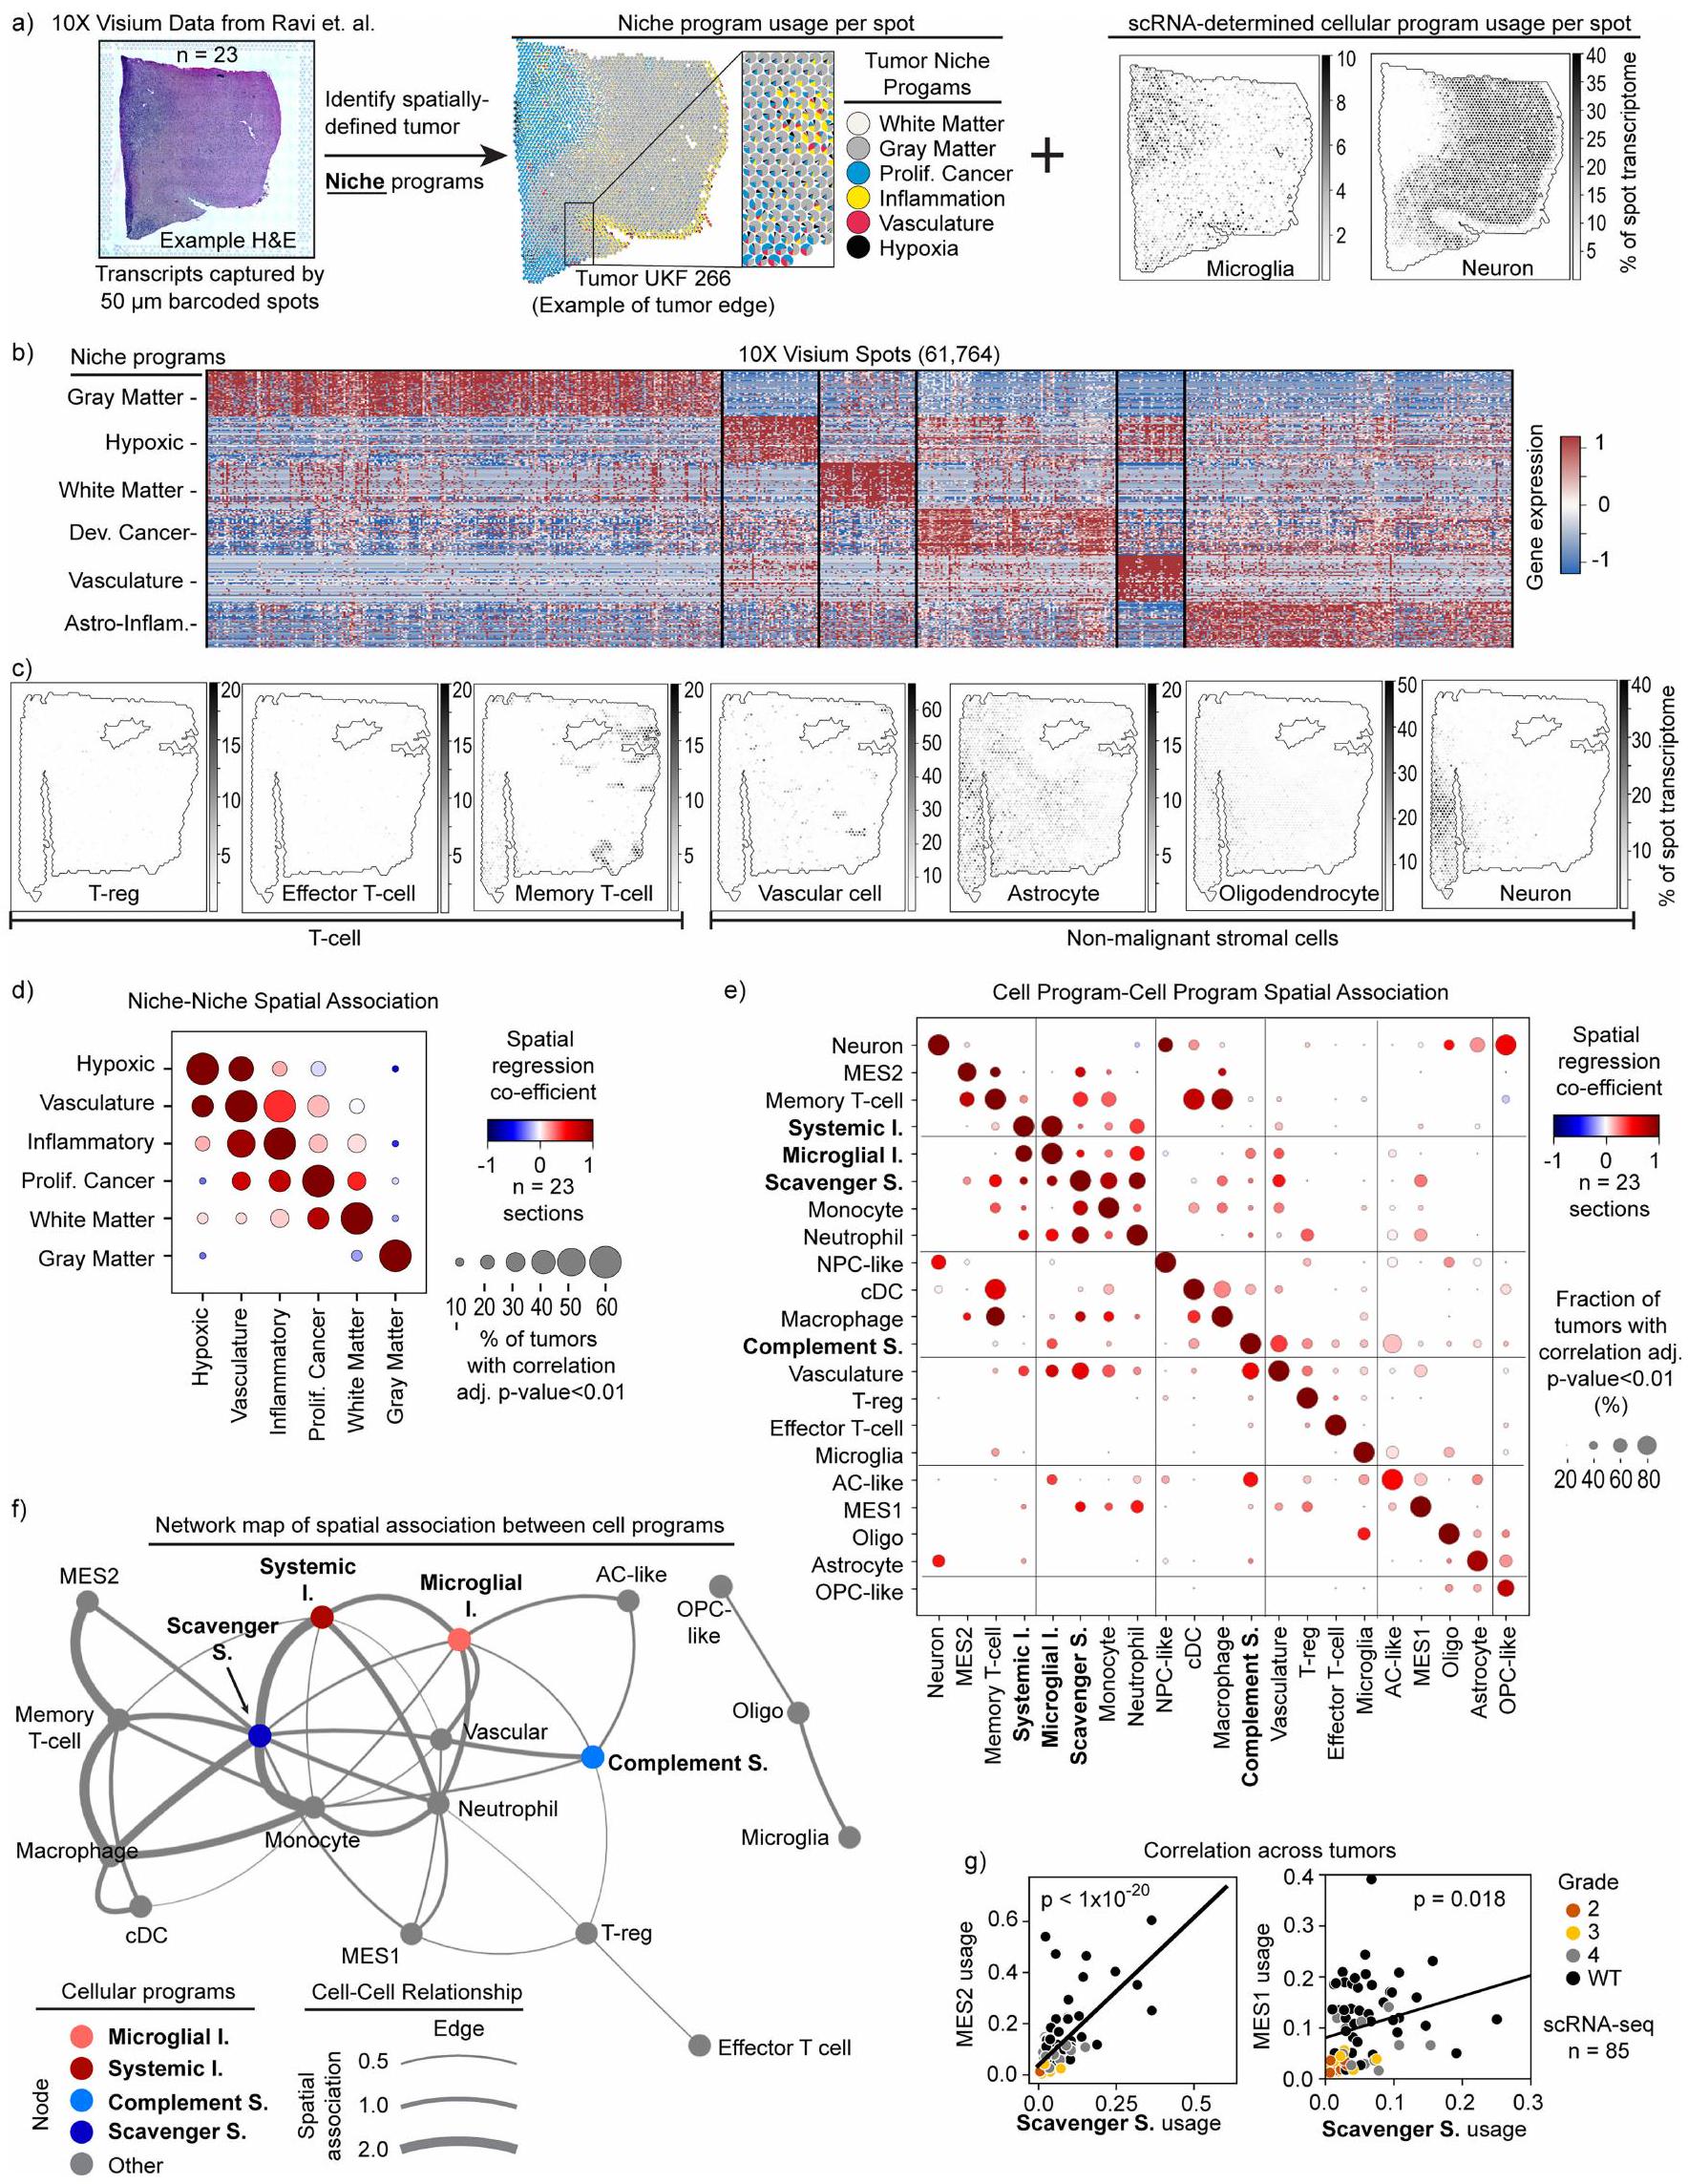
لتحقيق في المحركات الدقيقة المحتملة لبرامج النخاع، قمنا بدمج بيانات تسلسل RNA أحادي الخلية لدينا مع بيانات النسخ الجزيئي المكاني من الأورام الدبقية.“. لقد حددنا أولاً مجموعة من برامج الجينات المكانية التي التقطت التباين النسخي عبر 68,830 بقع في 23 قسمًا (الشكل التوضيحي الممتد 6 أ، ب والأساليب). وقد ميز ذلك ستة ‘برامج نيش’ بارزة تضمنت نيش هيكلية من المادة الرمادية والبيضاء، ونيش أيضي نقص الأكسجين والأوعية الدموية، ونيش مكون من خلايا سرطانية متكاثرة، ونيش التهابي مكون من خلايا مناعية وجينات أستروسيتية تفاعلية. بالتوازي، قمنا بتقدير المحتوى الخلوي لكل تحديد من خلال قياس تعبير برامج cNMF الخاصة بناكشفت هذه التحليلات المكانية عن أنماط واضحة محددة بالموائل لبرامج الخلايا النخاعية، وبرامج خلايا السرطان وأنواع خلايا أخرى في الأورام (الشكل 2أ والشكل التمديدي 6أ، ج). لجمع العلاقات المكانية المتكررة، قمنا بحساب الارتباطات المكانية بين البرامج الخلوية والبيئية عبر جميع مقاطع الأورام في فيزيوم. وقد كشف ذلك عن ارتباطات قوية بين البيئات، والبيئات والخلايا، والخلايا والخلايا (الشكل 2ب، ج والشكل التمديدي 6د-و). كشفت العلاقات بين البيئات عن بنية متكررة حيث يحيط ببيئة نقص الأكسجين بيئة التهابية، والتي بدورها تكون مجاورة لبيئة سرطان تكاثرية تمتد بعد ذلك إلى المادة البيضاء، وهو ما يتماشى مع الملاحظة السريرية بأن معظم الأورام الدبقية موجودة في المادة البيضاء.كانت المناطق الناقصة الأكسجين والالتهابية محاطة أيضًا بمناطق وعائية، مما يدل على تكاثر الأوعية استجابةً لذلك.
الشكل 2 | البرامج المايلويدية المناعية المرتبطة بالفضاء
مواضع الأورام. أ، مخطط فطيرة متفرق (يسار) لتمثيلقسم فيزيوم لعينة من ورم الدبقيات من المرجع 32. كل مخطط دائري يصور تعبير برامج النسيج الورمي المحددة (الألوان) في نقطة. تظهر المخططات النقطية (على اليمين) نفس القسم مع نقاط مظللة حسب تعبير خلايا النخاع العظمي cNMF أو الخلايا الخبيثة المحددة.برنامج.ACالخلية النجمية؛ MES، الخلايا الجذعية الميزانشيمية؛ NPC، خلية سلف عصبية؛ OPC، خلية سلف أوليجوديندروسايت؛ التكاثر، التكاثر. ب، رسم نقطي يوضح الارتباط داخل البقعة بين البيئة و نتائج برنامج الخلايا، محسوبة بشكل مستقل لكل عينة. حجم النقطة يظهر نسبة العينات التي لديها ارتباط كبير (معدلثنائي الجانب، من دالة كثافة الاحتمال لارتباط بيرسون) ويشير اللون إلى ارتباط إيجابي (أحمر) أو سلبي (أزرق). ج، خريطة الخلايا والموائل توضح العلاقات المكانية المحفوظة لأنواع الخلايا النخاعية، الخبيثة والعصبية (دوائر) والموائل النسخية (المناطق المظللة) عبر العينات المكانية. تظهر هذه التحليلات المكانية أن البرامج المناعية النخاعية غنية في موائل متميزة ضمن بنية ورمية محفوظة. إلى نقص الأكسجين وقد تمثل نقطة دخول محتملة لاختراق المناعة. هذه الأنماط تتماشى إلى حد كبير مع التقارير الأخيرة.
كانت نقص الأكسجين أيضًا تنظم البرامج النخاعية. كان برنامج المناعة المثبطة للسموم غنيًا في البيئات الوعائية ونقص الأكسجين، بينما تم استبعاد برنامج المناعة المثبطة للمكملات من البيئات منخفضة الأكسجين وارتبط بالبيئات الالتهابية والوعائية المحيطة. كان البرنامج الالتهابي الجهازي مرتبطًا بالبيئات منخفضة الأكسجين والالتهابية، وكان برنامج الالتهاب الدبقي غنيًا في البيئات الالتهابية والوعائية. تم استبعاد الخلايا الدبقية من المناطق منخفضة الأكسجين ولكن تم العثور عليها في بقية مجال الورم. تشير هذه التحليلات المكانية إلى دور قوي بشكل خاص لبرنامج المناعة المثبط للمتغذيات في بيئة الورم الدبقي. حدد نموذج الانحدار المكاني لعلاقات الخلايا-الخلايا تفاعلات متعددة بين برنامج المناعة المثبط للمتغذيات وكل برنامج خلية تقريبًا في البيئات منخفضة الأكسجين والأوعية الدموية، بما في ذلك برامج MES2 وMES1 وبرامج وحيدات النواة. قمنا بالتحقق من هذه الروابط بطريقة عمودية باستخدام مجموعة بيانات scRNA-seq، التي كشفت أن الاستخدام المتوسط لهذه البرامج كان مرتبطًا بشكل كبير مع برنامج المناعة المثبطة للمتغذيات عبر عينات جراحية (الشكل التوضيحي الممتد 6g). بشكل عام، تبرز التحليلات المكانية ارتباطات محددة بين برامج المايلود المناعية وتجاويف الورم، وتشير إلى أن برنامج المناعة المثبطة للمتغذيات قد يكون عاملاً رئيسياً في بيئة الورم الدقيقة.
الارتباطات السريرية لبرامج النخاع
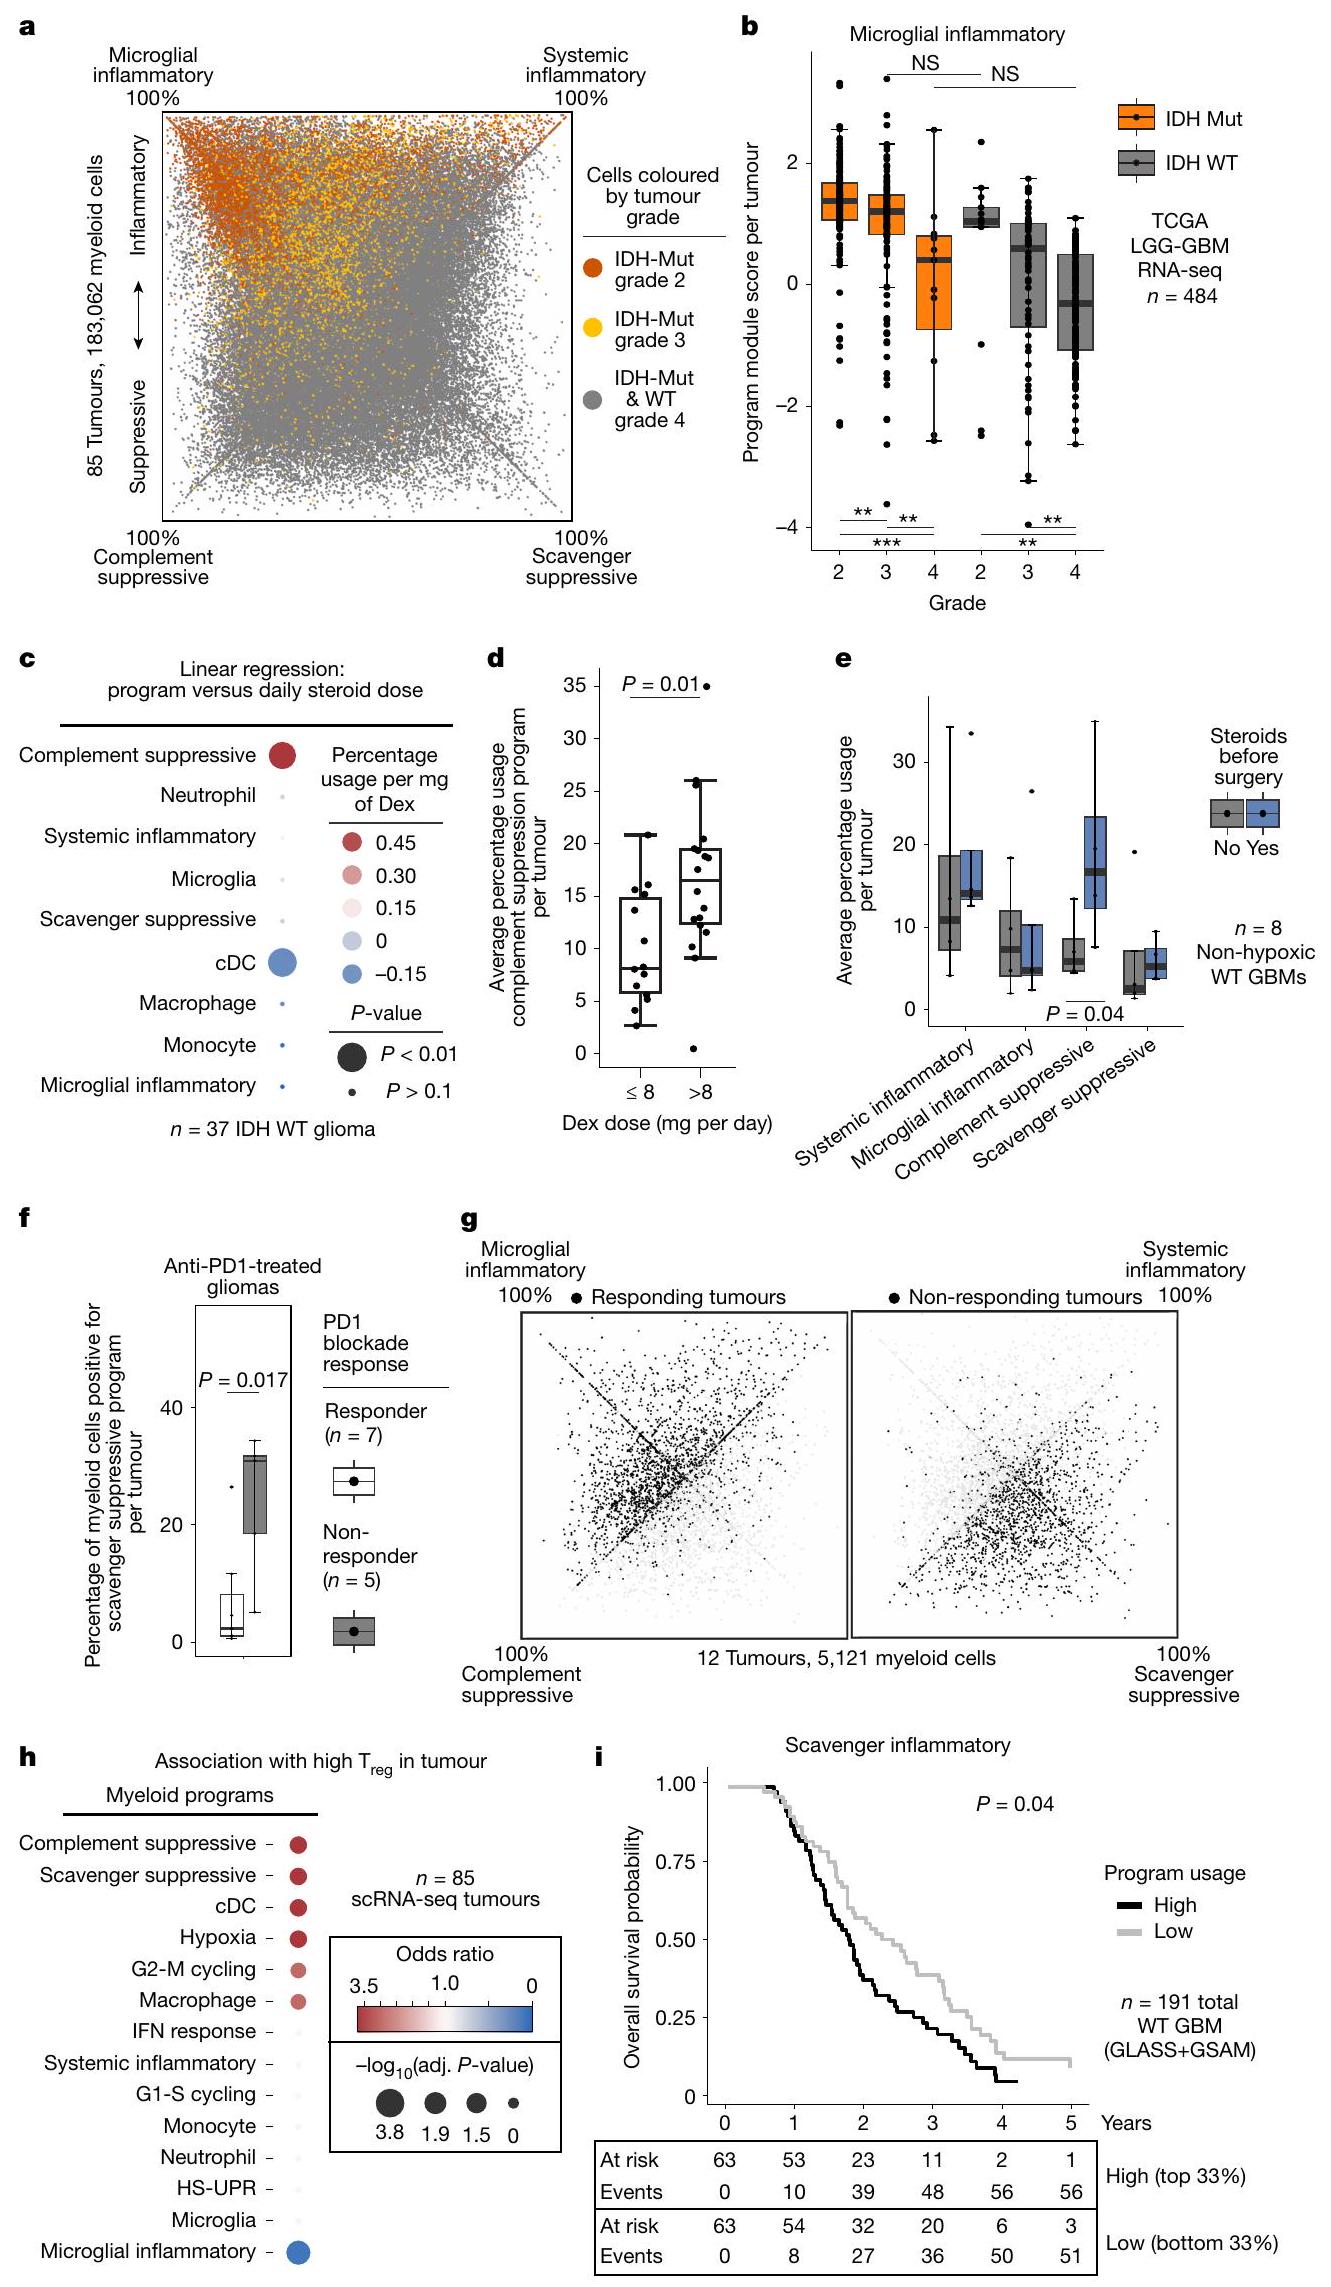
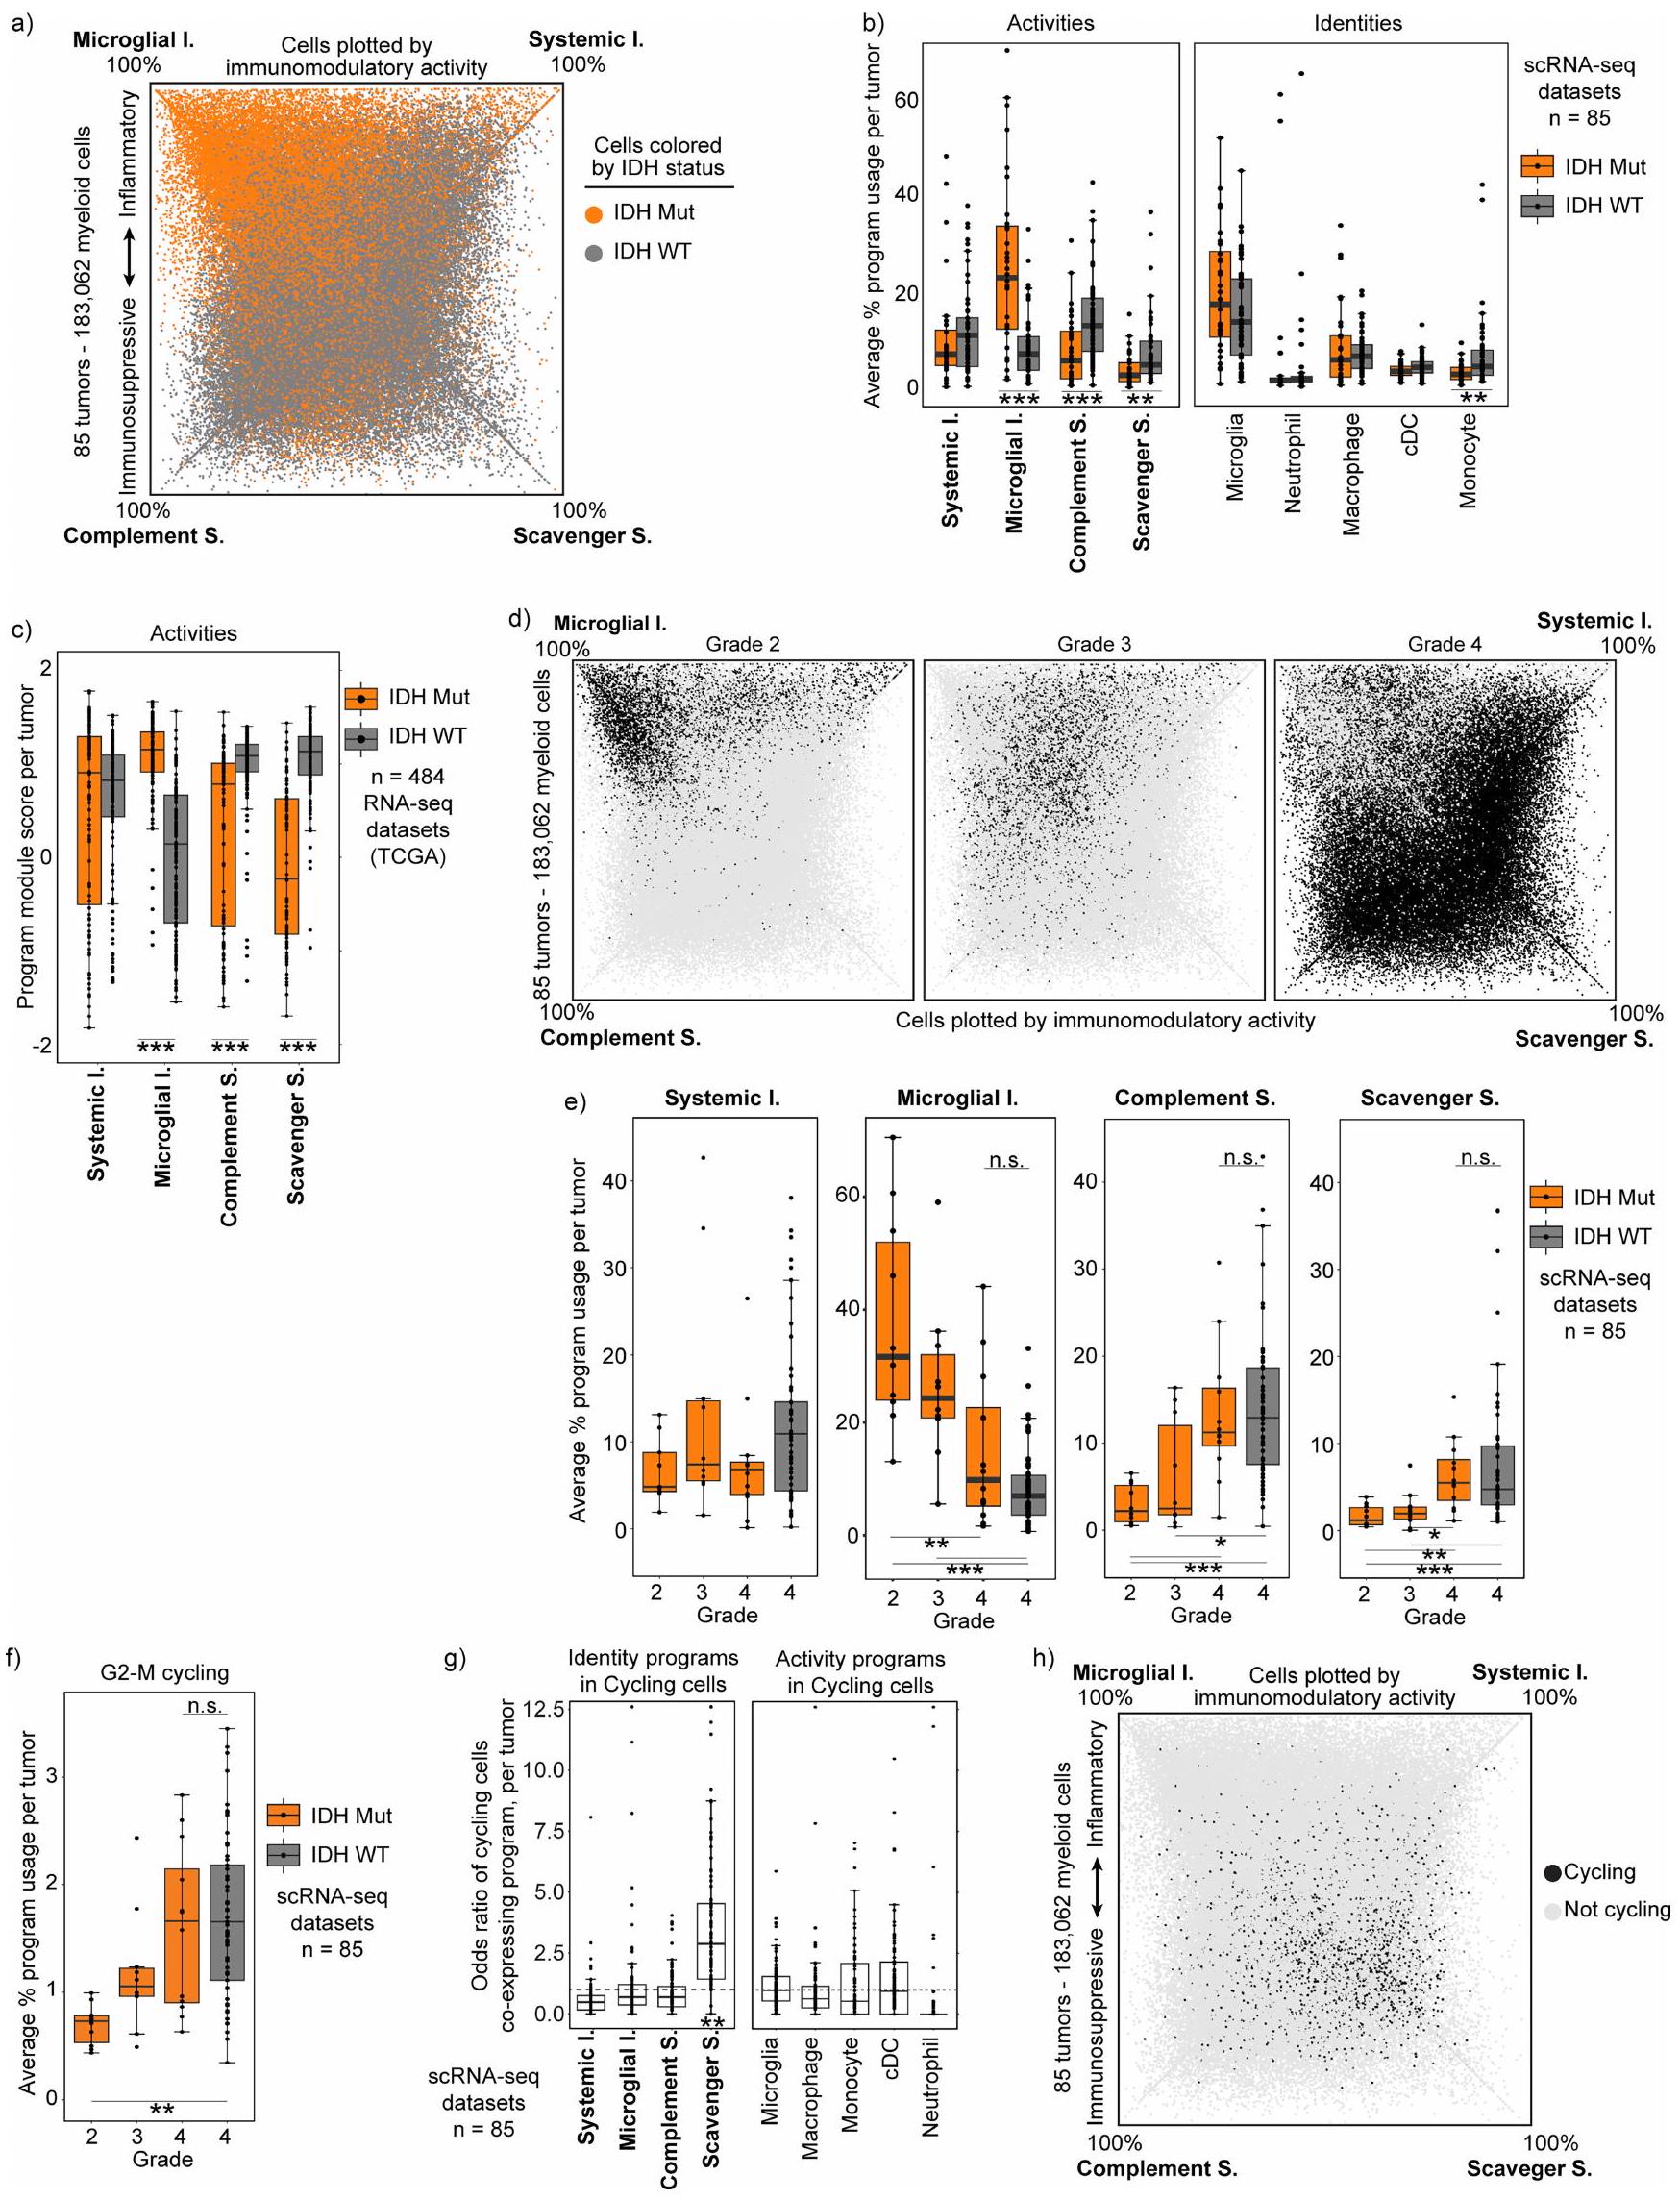
قمنا بعد ذلك بالتحقيق فيما إذا كانت هويات الخلايا النخاعية وبرامج تعديل المناعة تتوافق مع العوامل السريرية مثل حالة الطفرات والعلاجات. وقد أفادت دراسات سابقة بزيادة الأنماط الالتهابية في الأورام الحاملة لطفرات IDH، وهو اكتشاف يُعزى إلى الأونكوميتابوليت 2-هيدروكسيجلوتارات.لقد وجدنا باستمرار أن الأورام الحاملة لطفرات IDH تتمتع بتكوين مميز لبرامجنا المناعية، يتميز بزيادة قوية في برنامج الالتهاب الميكروغليالي ونقص في كلا البرنامجين المثبطين للمناعة (الشكل التوضيحي الممتد 7 أ-ج). ومع ذلك، كانت هذه التمييزات مرتبطة بشكل أقوى بدرجة الورم، بدلاً من طفرة IDH، حيث كان التكوين النخاعي للأورام الحاملة لطفرات IDH من الدرجة 4 قريبًا جدًا من ذلك للأورام الحاملة لـ IDH-WT من الدرجة 4 (الشكل 3 أ والشكل التوضيحي الممتد 7 د، هـ). علاوة على ذلك، أظهر فحص مجموعة أكبر أن تكوين البرنامج النخاعي للأورام الحاملة لـ IDH-WT من الدرجة المنخفضة (وفقًا لتصنيف منظمة الصحة العالمية لعام 2016) يعكس ذلك للأورام الحاملة لطفرات IDH من الدرجة المنخفضة (الشكل 3 ب والملاحظة التكميلية 3). ونتيجة لذلك، فإن الاختلافات المزعومة في حجرة النخاع للأورام الحاملة لطفرات IDH والأورام الحاملة لـ IDH-WT من المرجح أن تعكس درجة الورم.
لقد بحثنا أيضًا فيما إذا كانت العلاجات السريرية تؤثر على حالات النخاع. قمنا أولاً بمقارنة تكوين البرنامج في الأورام الأولية مقابل الأورام المتكررة، والتي كانت جميعها قد تلقت علاجًا مستهدفًا للأورام سابقًا، لكننا لم نجد تغييرات كبيرة عند التحكم في الدرجة. ومع ذلك، وجدنا أن برنامج المكمل المناعي المثبط مرتبط بشكل خاص وملحوظ بالديكساميثازون (Dex). الديكساميثازون هو كورتيكوستيرويد قوي يُعطى بانتظام للمرضى الذين يعانون من الورم الدبقي لتقليل الوذمة الوعائية في الدماغ قبل وبعد الجراحة. يزيد برنامج المكمل المناعي المثبط مع زيادة جرعة الديكساميثازون ويقل بشكل ملحوظ في الأورام غير المعالجة عند التحكم في نقص الأكسجة، مما يمنع التأثيرات المضادة للالتهابات للغلوكوكورتيكويدات في خلايا النخاع. (الشكل 3ج-هـ والشكل التوضيحي الممتد 8أ).
تشير الملاحظة بأن الخلايا المايلويدية المرتبطة بالغليوما والبرامج المرتبطة بها مشتقة من المونوسيتات المتسللة إلى أن أنماط دكس قد تنشأ في البداية من المونوسيتات المحيطية. في الواقع، عندما قمنا بفحص بيانات تسلسل RNA أحادي الخلية للمونوسيتات المحيطية، حددنا برنامجًا محتملًا مثبطًا للمناعة تم زيادته بشكل خاص في المرضى الذين تم علاجهم بدكس. يتضمن هذا البرنامج CD163 وبعض العلامات الأخرى الموجودة في البرنامج المثبط للمناعة المكمل، مما يثير احتمال أن يكون هذا برنامجًا سابقًا يتطور بشكل أكبر في الورم. دعمًا لذلك، لاحظنا وجود ارتباط إيجابي بين البرنامج المرتبط بدكس في المونوسيتات الدائرة وبرنامج المثبط للمناعة المكمل في المونوسيتات المرتبطة بالورم من نفس المريض (الشكل 8b، c من البيانات الموسعة).
الخلايا النخاعية واستجابة العلاج المناعي
كما ربطنا برامجنا النخاعية باستجابة العلاج المناعي، وحالة المناعة في الورم، والبقاء العام. دراسة حديثة باستخدام تسلسل RNA أحادي الخلية لـ 12 مريضًا مصابًا بالورم الدبقي تم علاجهم بحجب PD1 قبل الجراحة، حددت مجموعة من البلعميات التي تعبر عن SIGLEC9 والتي كانت مرتبطة بالأورام غير المستجيبة.إعادة تحليل هذه البيانات باستخدام إطار عمل cNMF الخاص بنا كشفت أن الخلايا الإيجابية لـ SIGLEC9 كانت غير متجانسة في تعبيرها عن برامجنا المناعية. ومن الجدير بالذكر أن الخلايا الإيجابية لـ SIGLEC9 التي تعبر عن برنامج المناعة المثبطة للسموم كانت أكثر تركيزًا في غير المستجيبين. علاوة على ذلك، كان برنامج المناعة المثبطة للسموم مرتبطًا بشكل أوثق بالأورام الدبقية غير المستجيبة مقارنةً بـ SIGLEC9 وحده (الشكل 3f، g وExtended
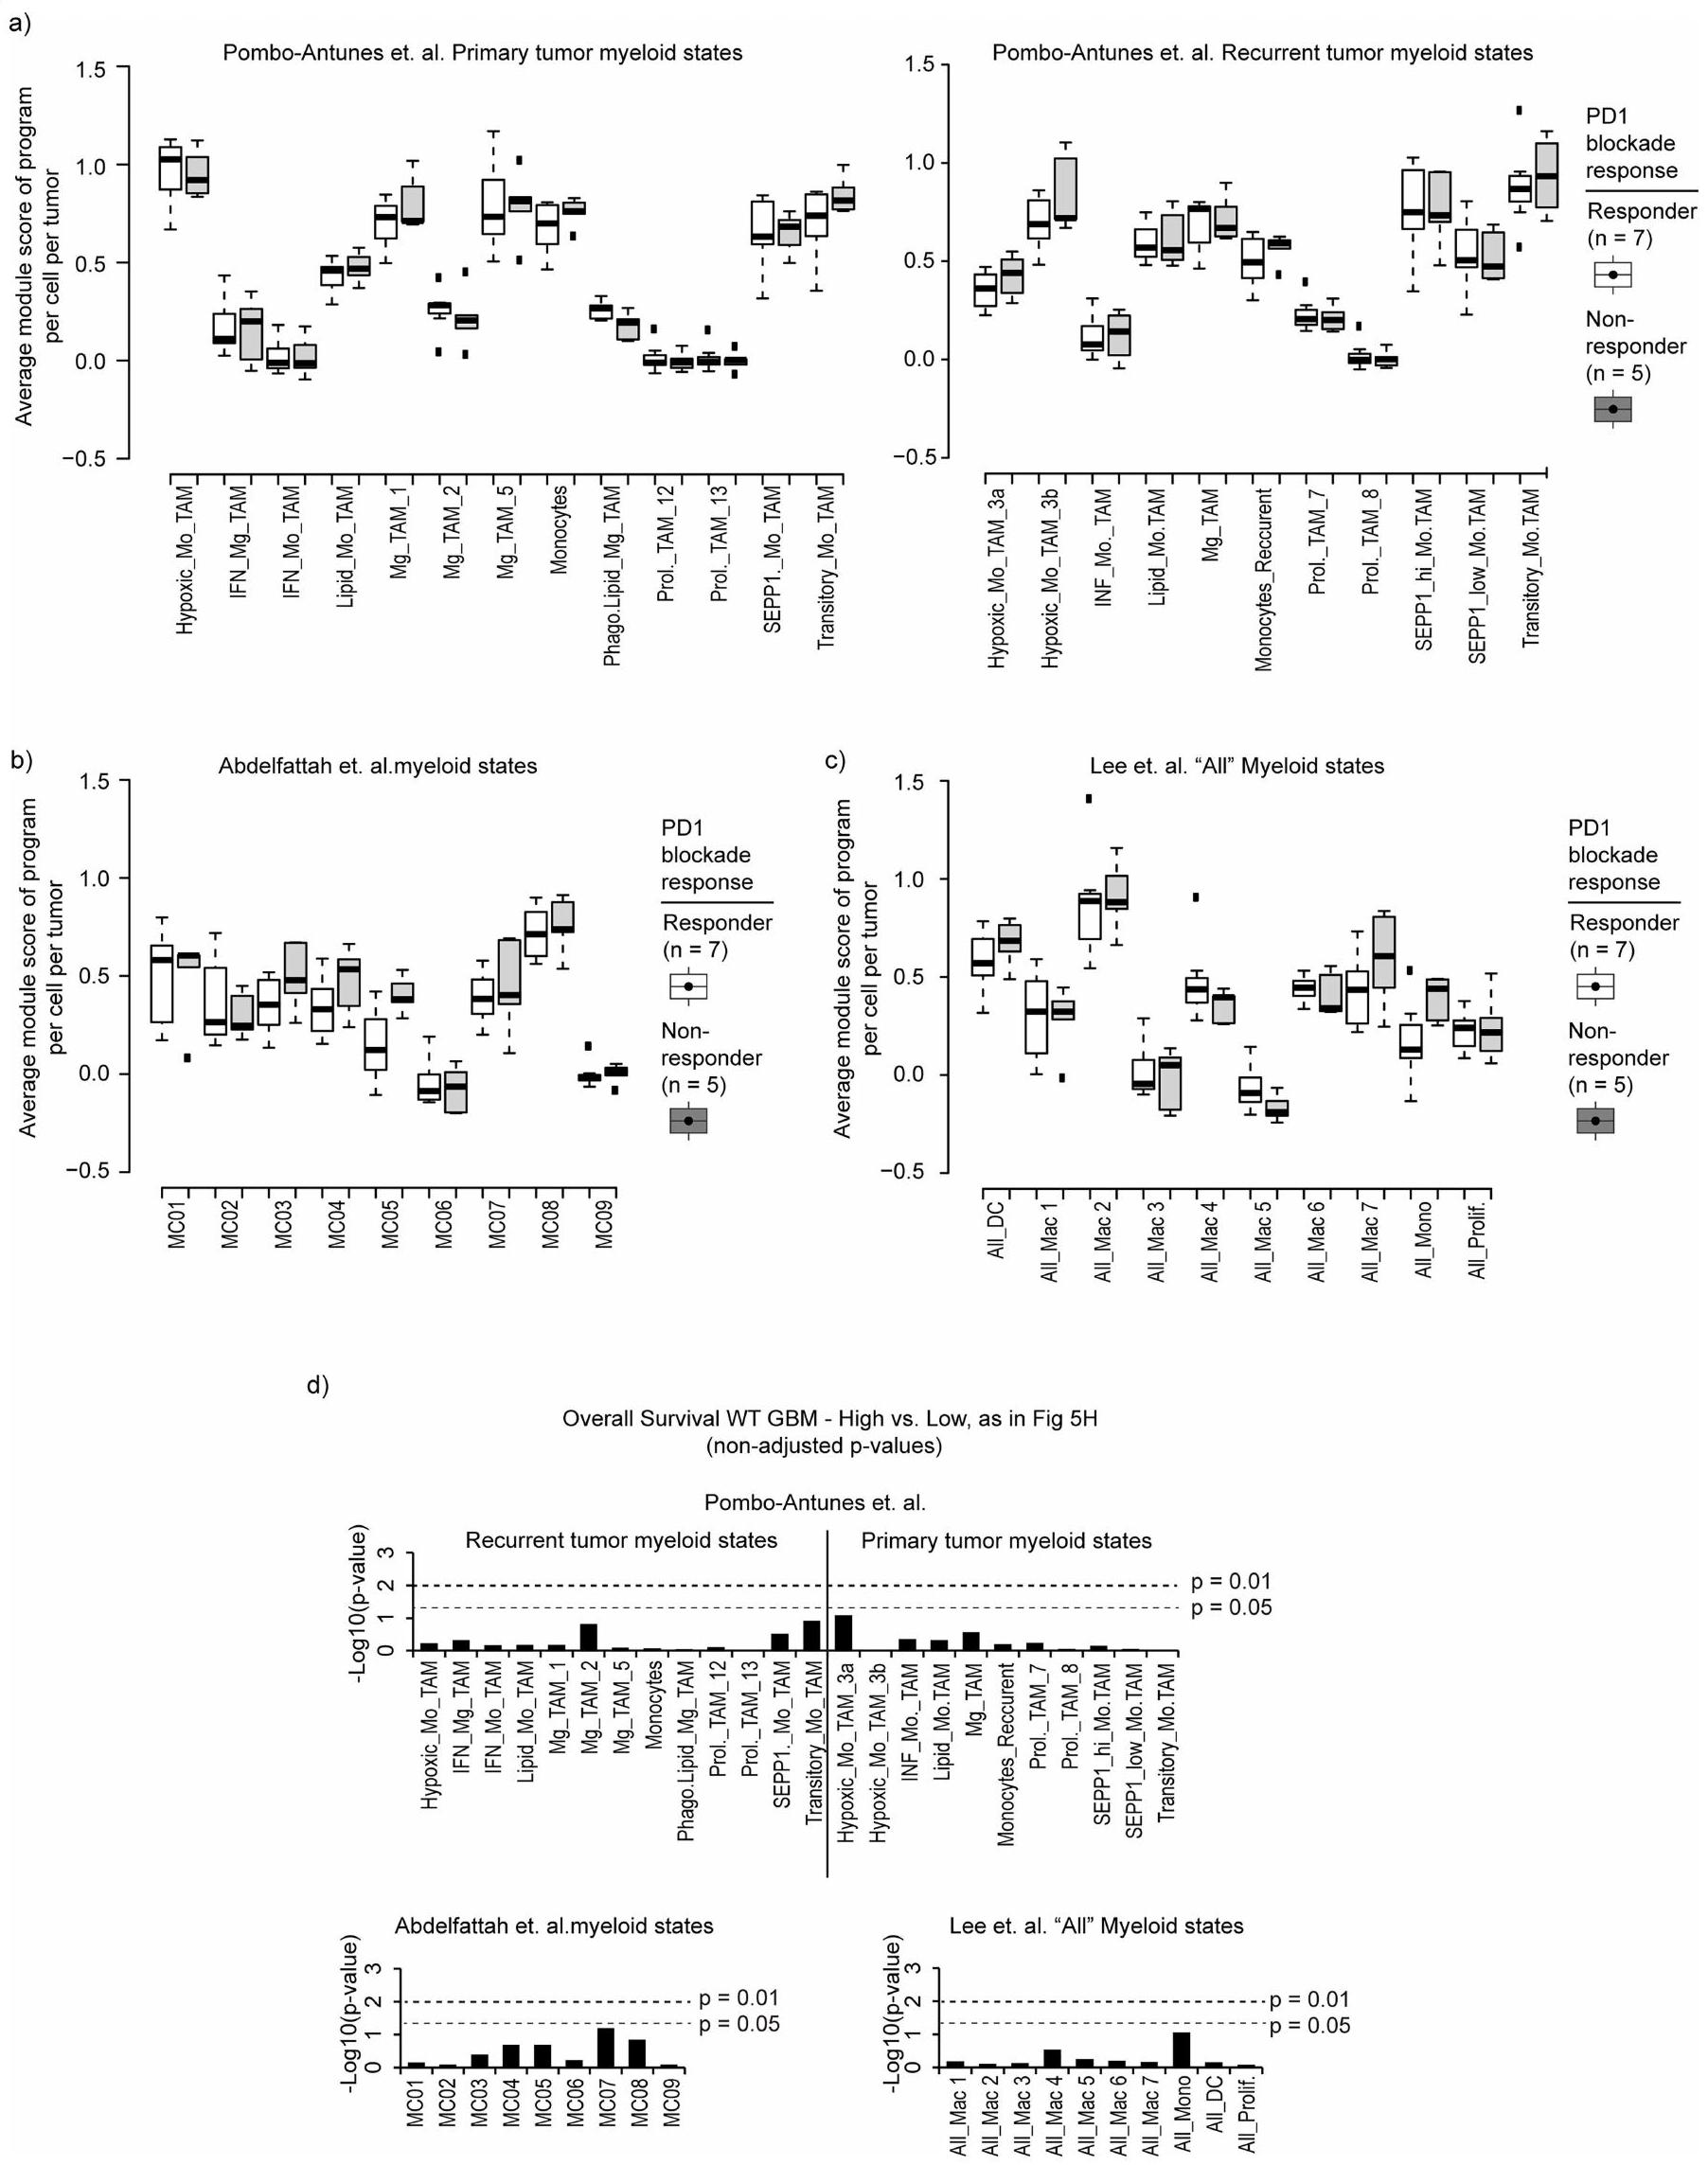
البيانات الشكل 8d-f)، مما يشير إلى أن هذا البرنامج المثبط للمناعة قد يفسر بشكل أكثر دقة النمط المقاوم. لم نكتشف ارتباطًا كبيرًا بين استجابة العلاج المناعي في هذه المجموعة وأي من برامجنا الأخرى أو مجموعات الجينات المنشورة سابقًا لحالة الخلايا النخاعية (البيانات الموسعة الشكل 9a-c). لتوسيع هذه العلاقة لتشمل مجموعة أوسع من الأورام، قمنا بفحص التنظيمالخلايا كبديل لبيئة مثبطة للمناعة واستجابات مناعية ضعيفةعينات ذات مستوى عالٍتم إثراء تردد الخلايا لخلايا النخاع الشوكي التي تعبر عن برامج المناعية المثبطة للسموم والمكملات، ولكن تم استنفادها من خلايا الميكروغليا التي تعبر عن الالتهابات (الشكل 3h). كما اكتشفنا ارتباطًا مكانيًا بينالخلايا وبرنامج المناعة المثبطة المكمل. بالمقابل، كانت خلايا T التي تحمل توقيعات تعبيرية غير ناضجة/ذاكرة مرتبطة مكانيًا مع مناطق نقص الأكسجين وبرنامج المناعة المثبطة الملتقطة (الشكل 2b والشكل الإضافي 6e، f). وبالتالي، فإن البرامج المايلويدية المعنية مرتبطة بتعزيزات خلايا T مميزة وبيئات ميكروية مناعية. أخيرًا، تحققنا مما إذا كانت برامجنا المناعية المرتبطة كانت مرتبطة بالبقاء العام. استخدمنا أفضل الجينات في كل برنامج لتقييم الأورام الدبقية IDH-WT في مجموعات التحالف وضبطنا النتائج بناءً على المحتوى النخاعي المقدر (الطرق). وجدنا أن برنامج المناعة المثبط للسموم كان مرتبطًا بشكل كبير بأسوأ بقاء عام. لم يُلاحظ مثل هذا الارتباط الكبير مع أي من برامج نشاطنا النخاعي الأخرى، ولا مع مجموعات الجينات النخاعية المنشورة سابقًا (الشكل 3i والشكل الإضافي 9d). تشير هذه التحليلات الجماعية إلى أن البرنامج المناعي المثبط الخاص بالورم الدبقي يعد عاملاً حاسماً في بيئة المناعة للخلايا التائية، والاستجابة للعلاج المناعي، والبقاء العام.
منظمو البرامج المناعية
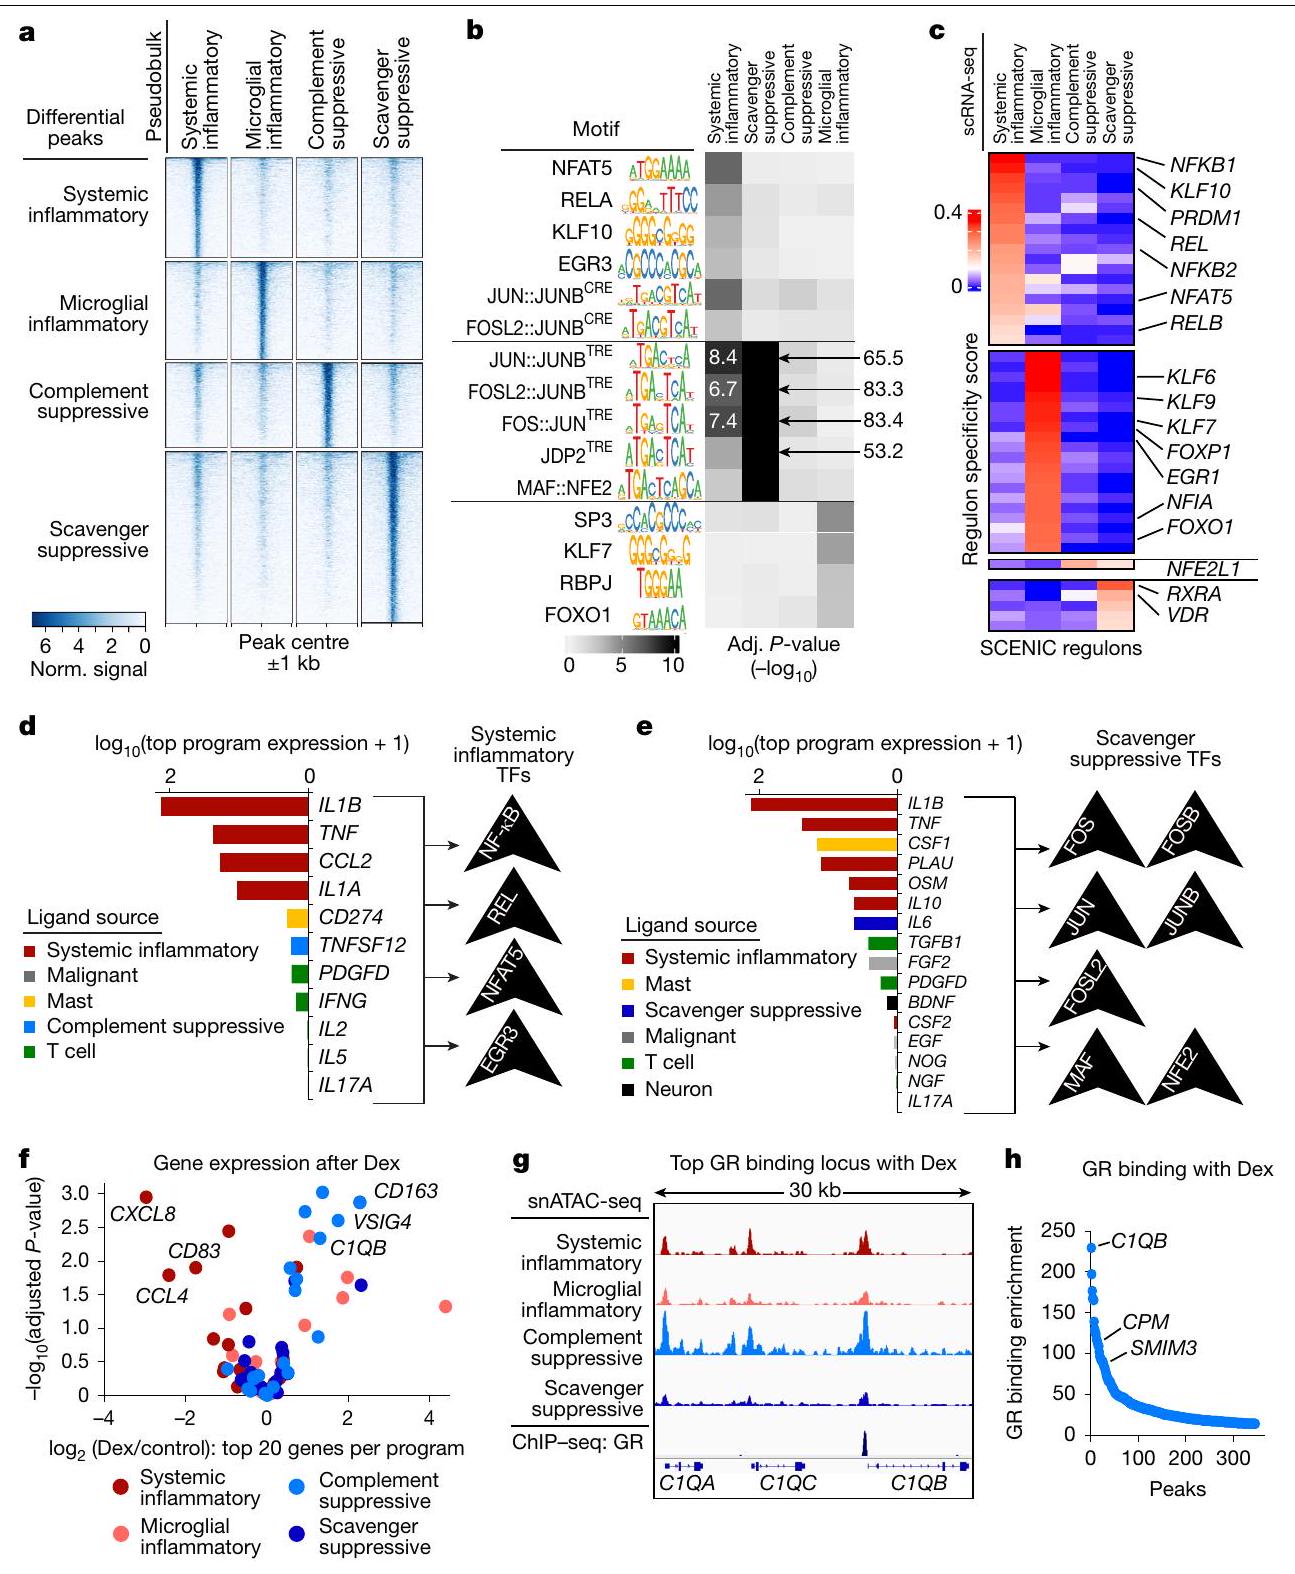
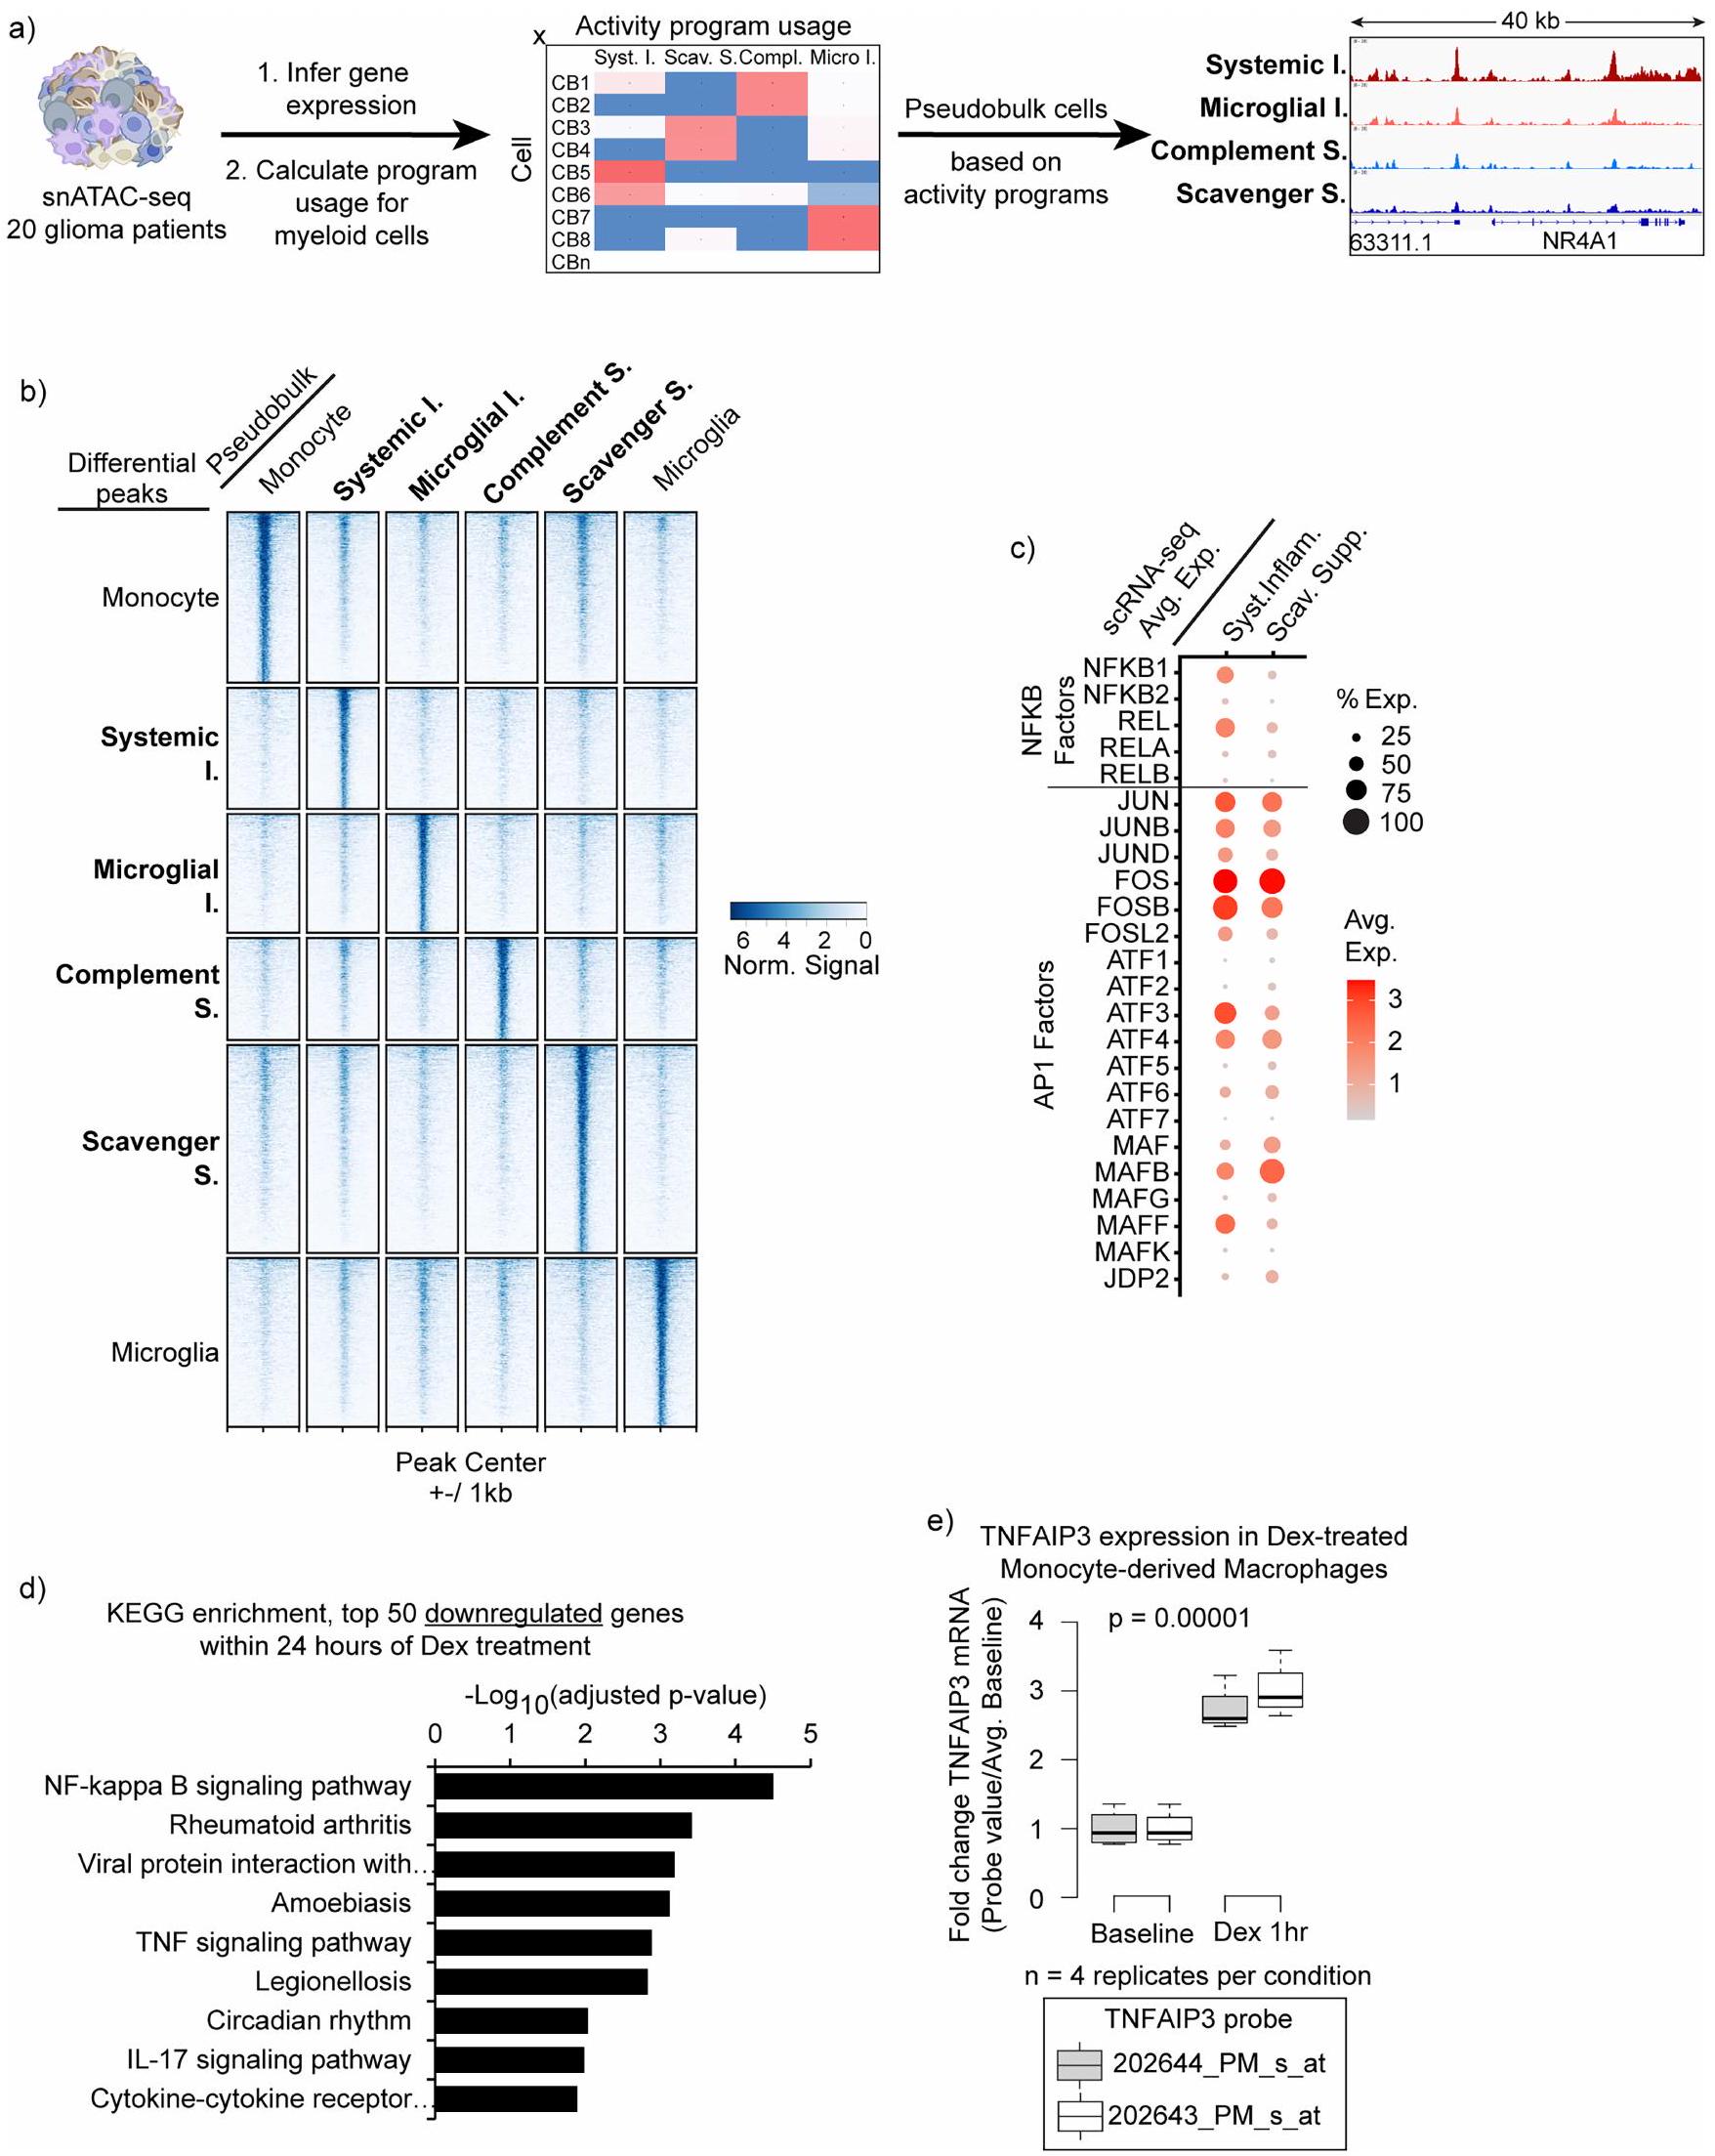
بعد ذلك، سعينا لربط برامج التعبير المناعي مع عناصر تنظيم الجينات وعوامل النسخ العلوية (الشكل 4 والشكل الإضافي 10). قمنا باستخراج ملفات وصول الكروماتين لـ 36,675 خلية نقيعية فردية من 20 ورم دبقي بشري من مجموعة عامة من بيانات اختبار النواة الفردية لكروماتين قابل للوصول بواسطة الترانسبوزاز مع التسلسل (snATAC-seq).قمنا بحساب استخدام البرنامج لكل خلية نقي العظام بناءً على درجات نشاط الجينات المستنتجة (الطرق). ثم أنشأنا ملفات تعريف الوصول الزائف لكل برنامج مناعوي من خلال تجميع الخلايا ذات أعلى استخدام للبرنامج. أظهر التجميع على المواقع القابلة للوصول بشكل مختلف المحفزات والمُعزِّزات المحتملة الخاصة بالبرنامج (الشكل 4 أ، ب والشكل البياني الممتد 10 أ، ب). كشف فحص هذه العناصر القابلة للوصول عن أنماط ربط TF المرتبطة ببرامج المناعية محددة. قمنا بتكملة هذه الفحوصات بأنماط الربط مع استنتاج الشبكة التنظيمية على مستوى الخلية الواحدة والتجميع (SCENIC).استراتيجية متعامدة لربط برامج التعبير بشبكات عوامل النسخ. كشفت هذه التحليلات عن ارتباطات قوية بين البرنامج الالتهابي الجهازي وعوامل النسخ المرتبطة بـ NF-кB. علاوة على ذلك، كانت عناصر برنامج المناعة المثبطة للسموم غنية بشكل كبير بموتيفات AP-1، مع درجات دلالة أعلى بمقدار عدة مرات من البرنامج الالتهابي الجهازي (الشكل 4ب، ج). قدمت هذه الارتباطات مع العناصر التنظيمية المحتملة وعائلات عوامل النسخ البارزة رؤى حول الشبكات والمنظمين الذين يقودون برامج المايلويد المثبطة للمناعة في الورم الدبقي.
تفاعل التغذية الراجعة بين حالات النخاع الشوكي
قمنا أيضًا بدراسة مسارات الإشارة والليغاندات البيئية التي لديها القدرة على دفع البرامج المناعية المعدلة وعوامل النسخ المرتبطة بها. تم دمج بيانات تسلسل RNA أحادي الخلية لدينا مع قاعدة بيانات NicheNet.الأليغاندات المكشوفة المعبر عنها في أورامنا التي يمكن أن تنشط هذه العوامل النسخية. تضمنت الأليغاندات الأعلى تصنيفًا المرتبطة بإشارات NF-кB الإنترلوكين- (IL-1 ) ،
الشكل 3|انظر الصفحة التالية للتعليق.
الشكل 3 | العلاقات السريرية لبرامج المايلويد المناعية. رسم بياني رباعي مع خلايا نقي العظام موضوعة كما في الشكل 1e وملونة حسب درجة الورم الأصلي.رسم بياني للصندوق يوضح توزيع درجات برنامج الالتهاب الميكروغليالي المحسوبة لـ 484 مجموعة بيانات ورم. بالنسبة لجميع الرسوم البيانية في هذه الشكل، يمثل كل نقطة ورم، وتمثل الخطوط الوسيط والرباعيات. تمثل الشعيرات 1.5 مرة من نطاق الرباعيات. معدل الاكتشاف الخاطئ (FDR) مصححتم حساب القيم باستخدام اختبارات ويلكوكسون للرتب المجمعة ذات الجانبين:I’m sorry, but there is no text provided for translation. Please provide the text you would like to have translated.; NS، غير مهم. لا تظهر جميع المقارنات. GBM، ورم دبقي متعدد الأشكال؛ LGG، ورم دبقي منخفض الدرجة. ج، رسم نقطي يوضح معامل الانحدار الخطي بين متوسط استخدام كل برنامج نقي للدم لكل عينة ورم دبقي وجرعة ديكس اليومية المقابلة للمريض قبل الجراحة.-القيم مأخوذة من نموذج الانحدار العادي لأقل المربعات. د، رسم بياني يوضح متوسط استخدام برنامج المناعة المكمل في عينات الورم الدبقي مقسمة حسب جرعة ديكس؛ ورم دبقي IDH-WT؛-القيم تم حسابها باستخدام
اختبار مجموع الرتب ويلكوكسون ذو الجانبين. هـ، رسم بياني يوضح متوسط استخدام البرامج في عينات الورم الدبقي مقسمة حسب استخدام ديكس (تم استبعاد العينات المهيجة).-تم حساب القيم باستخدام اختبارات مجموع الرتب ويلكوكسون ذات الجانبين. و، رسم بياني يوضح نسبة الخلايا التي تعبر عن برنامج المناعة المكمل عبر عينات الورم الدبقي من تجربة العلاج المناعي المضاد لـ PD1، مقسمة حسب الاستجابة (، FDR عند النظر في جميع القياسات في البيانات الموسعة الشكل. ).، رسومات رباعية تحدد مواقع خلايا النخاع الفردية في من الاستجابة الإشعاعية (يسار) وعدم الاستجابة (يمين) وفقًا لتعبيرها عن البرامج المناعية المعدلة. ز، رسم نقطي يوضح العلاقة بين البرامج المحددة و وفرة الخلايا عبر 85 ورم دبقي. Adj.-القيمة، القيمة المعدلة-القيمة. ط، منحنى كابلان-ماير للبقاء العام لورم دبقي IDH-WT مقسم حسب تعبير برنامج المناعة المكمل في GLASS و GSAM المجموعات. تم حساب-القيمة باستخدام اختبار لوغاريتمي ذو الجانبين.
TNF، CCL2، IL-1 و IFN. كانت وحدة AP-1 مرتبطة بـ IL-1، TNF، PLAU، OSM، IL-10، IL-6 و TGF (الشكل 4د، هـ والشكل الموسع 10ج). من الجدير بالذكر أن خلايا النخاع من البرنامج الالتهابي الجهازي عبرت عن العديد من الروابط التي تم التنبؤ بها لتنشيط إشارة AP-1 وبالتالي قد تعزز برنامج المناعة المكمل.
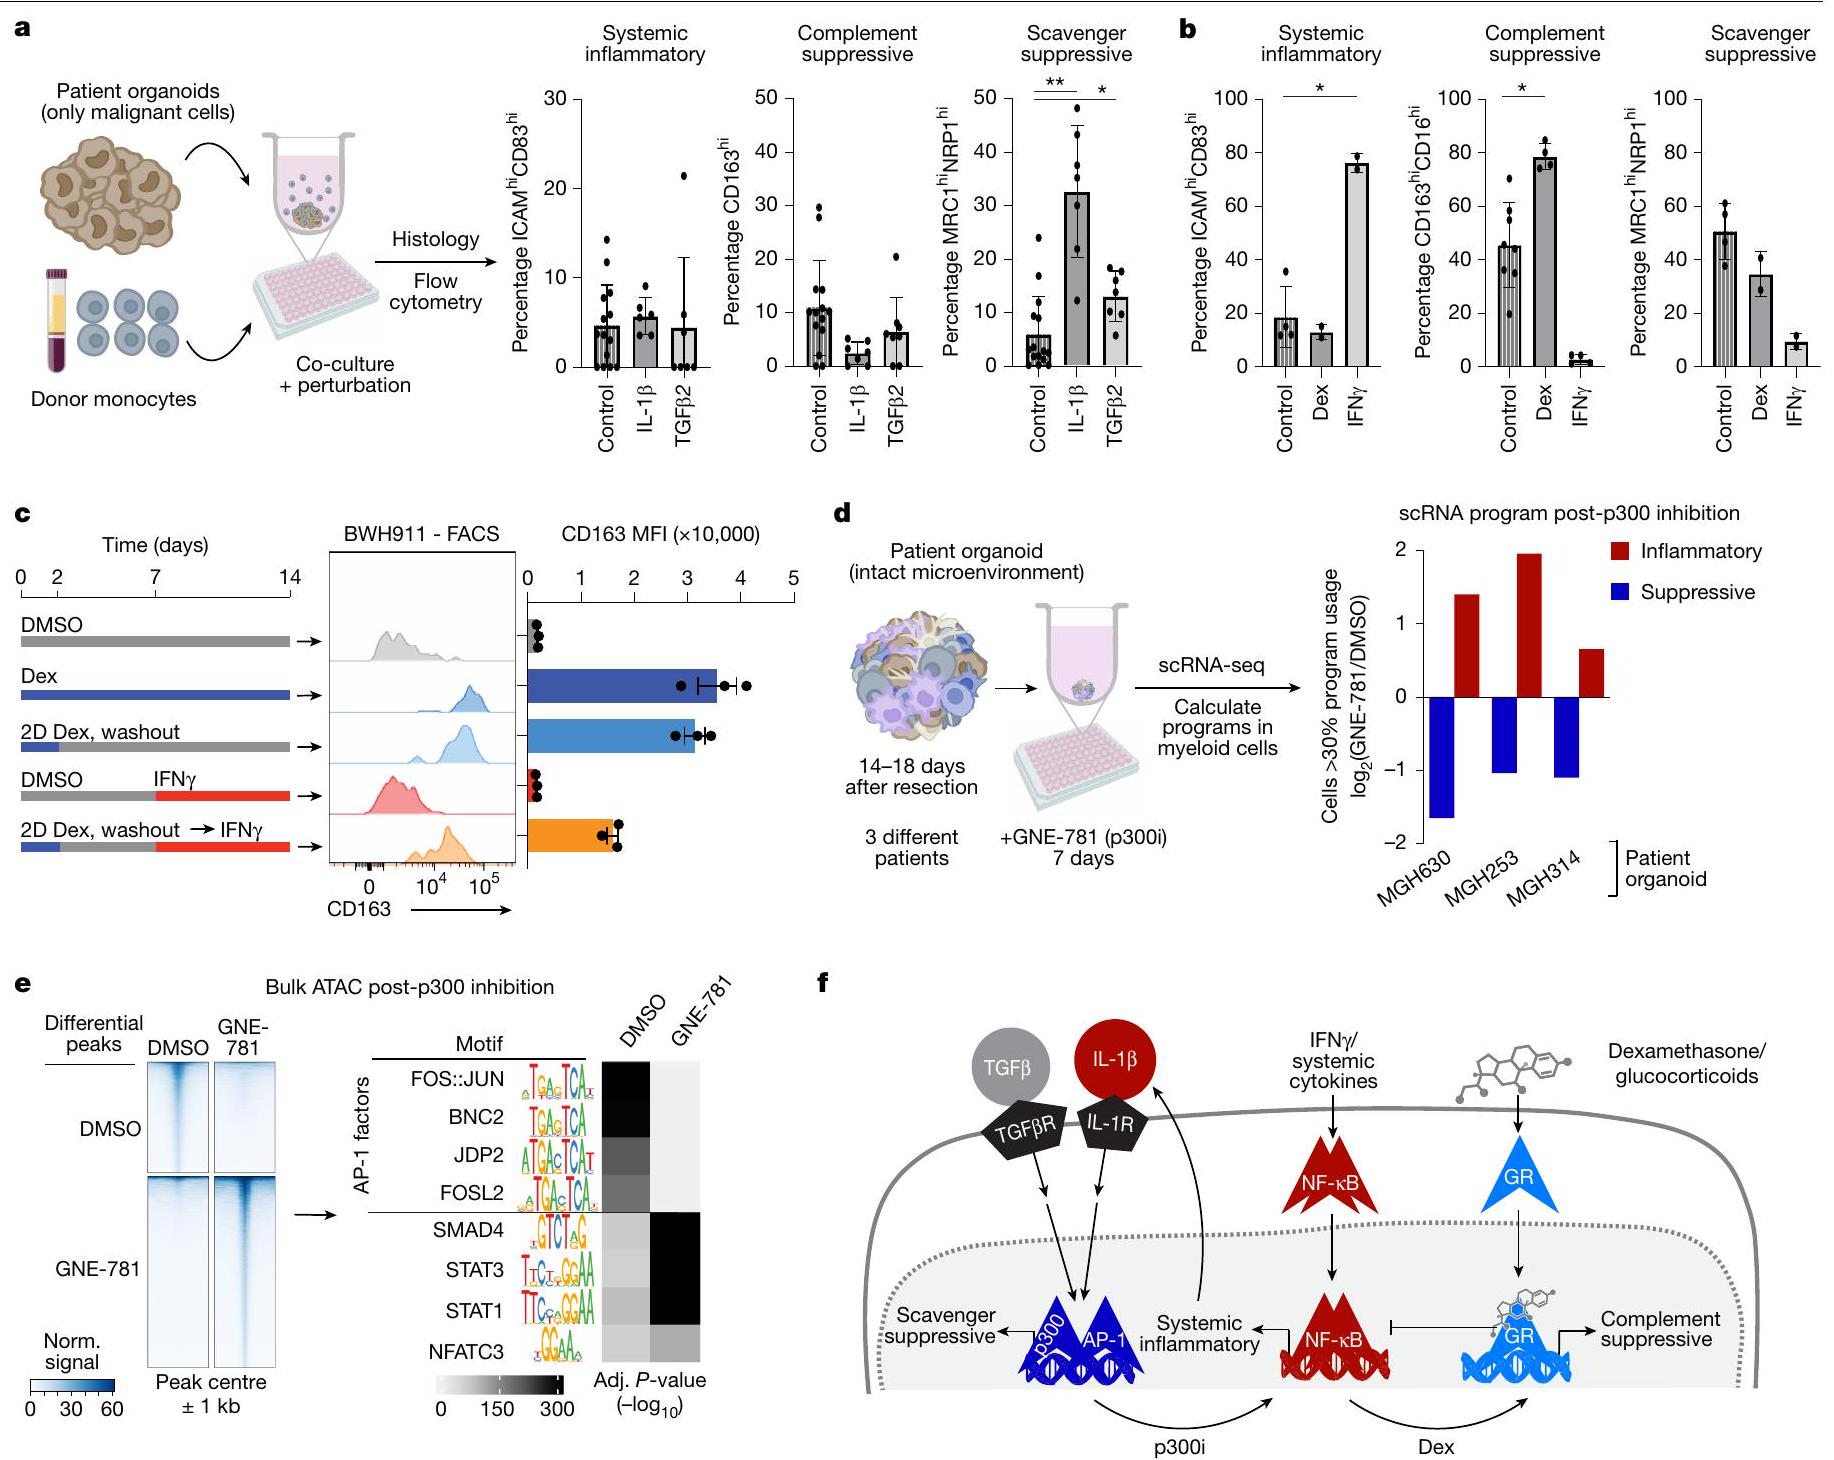
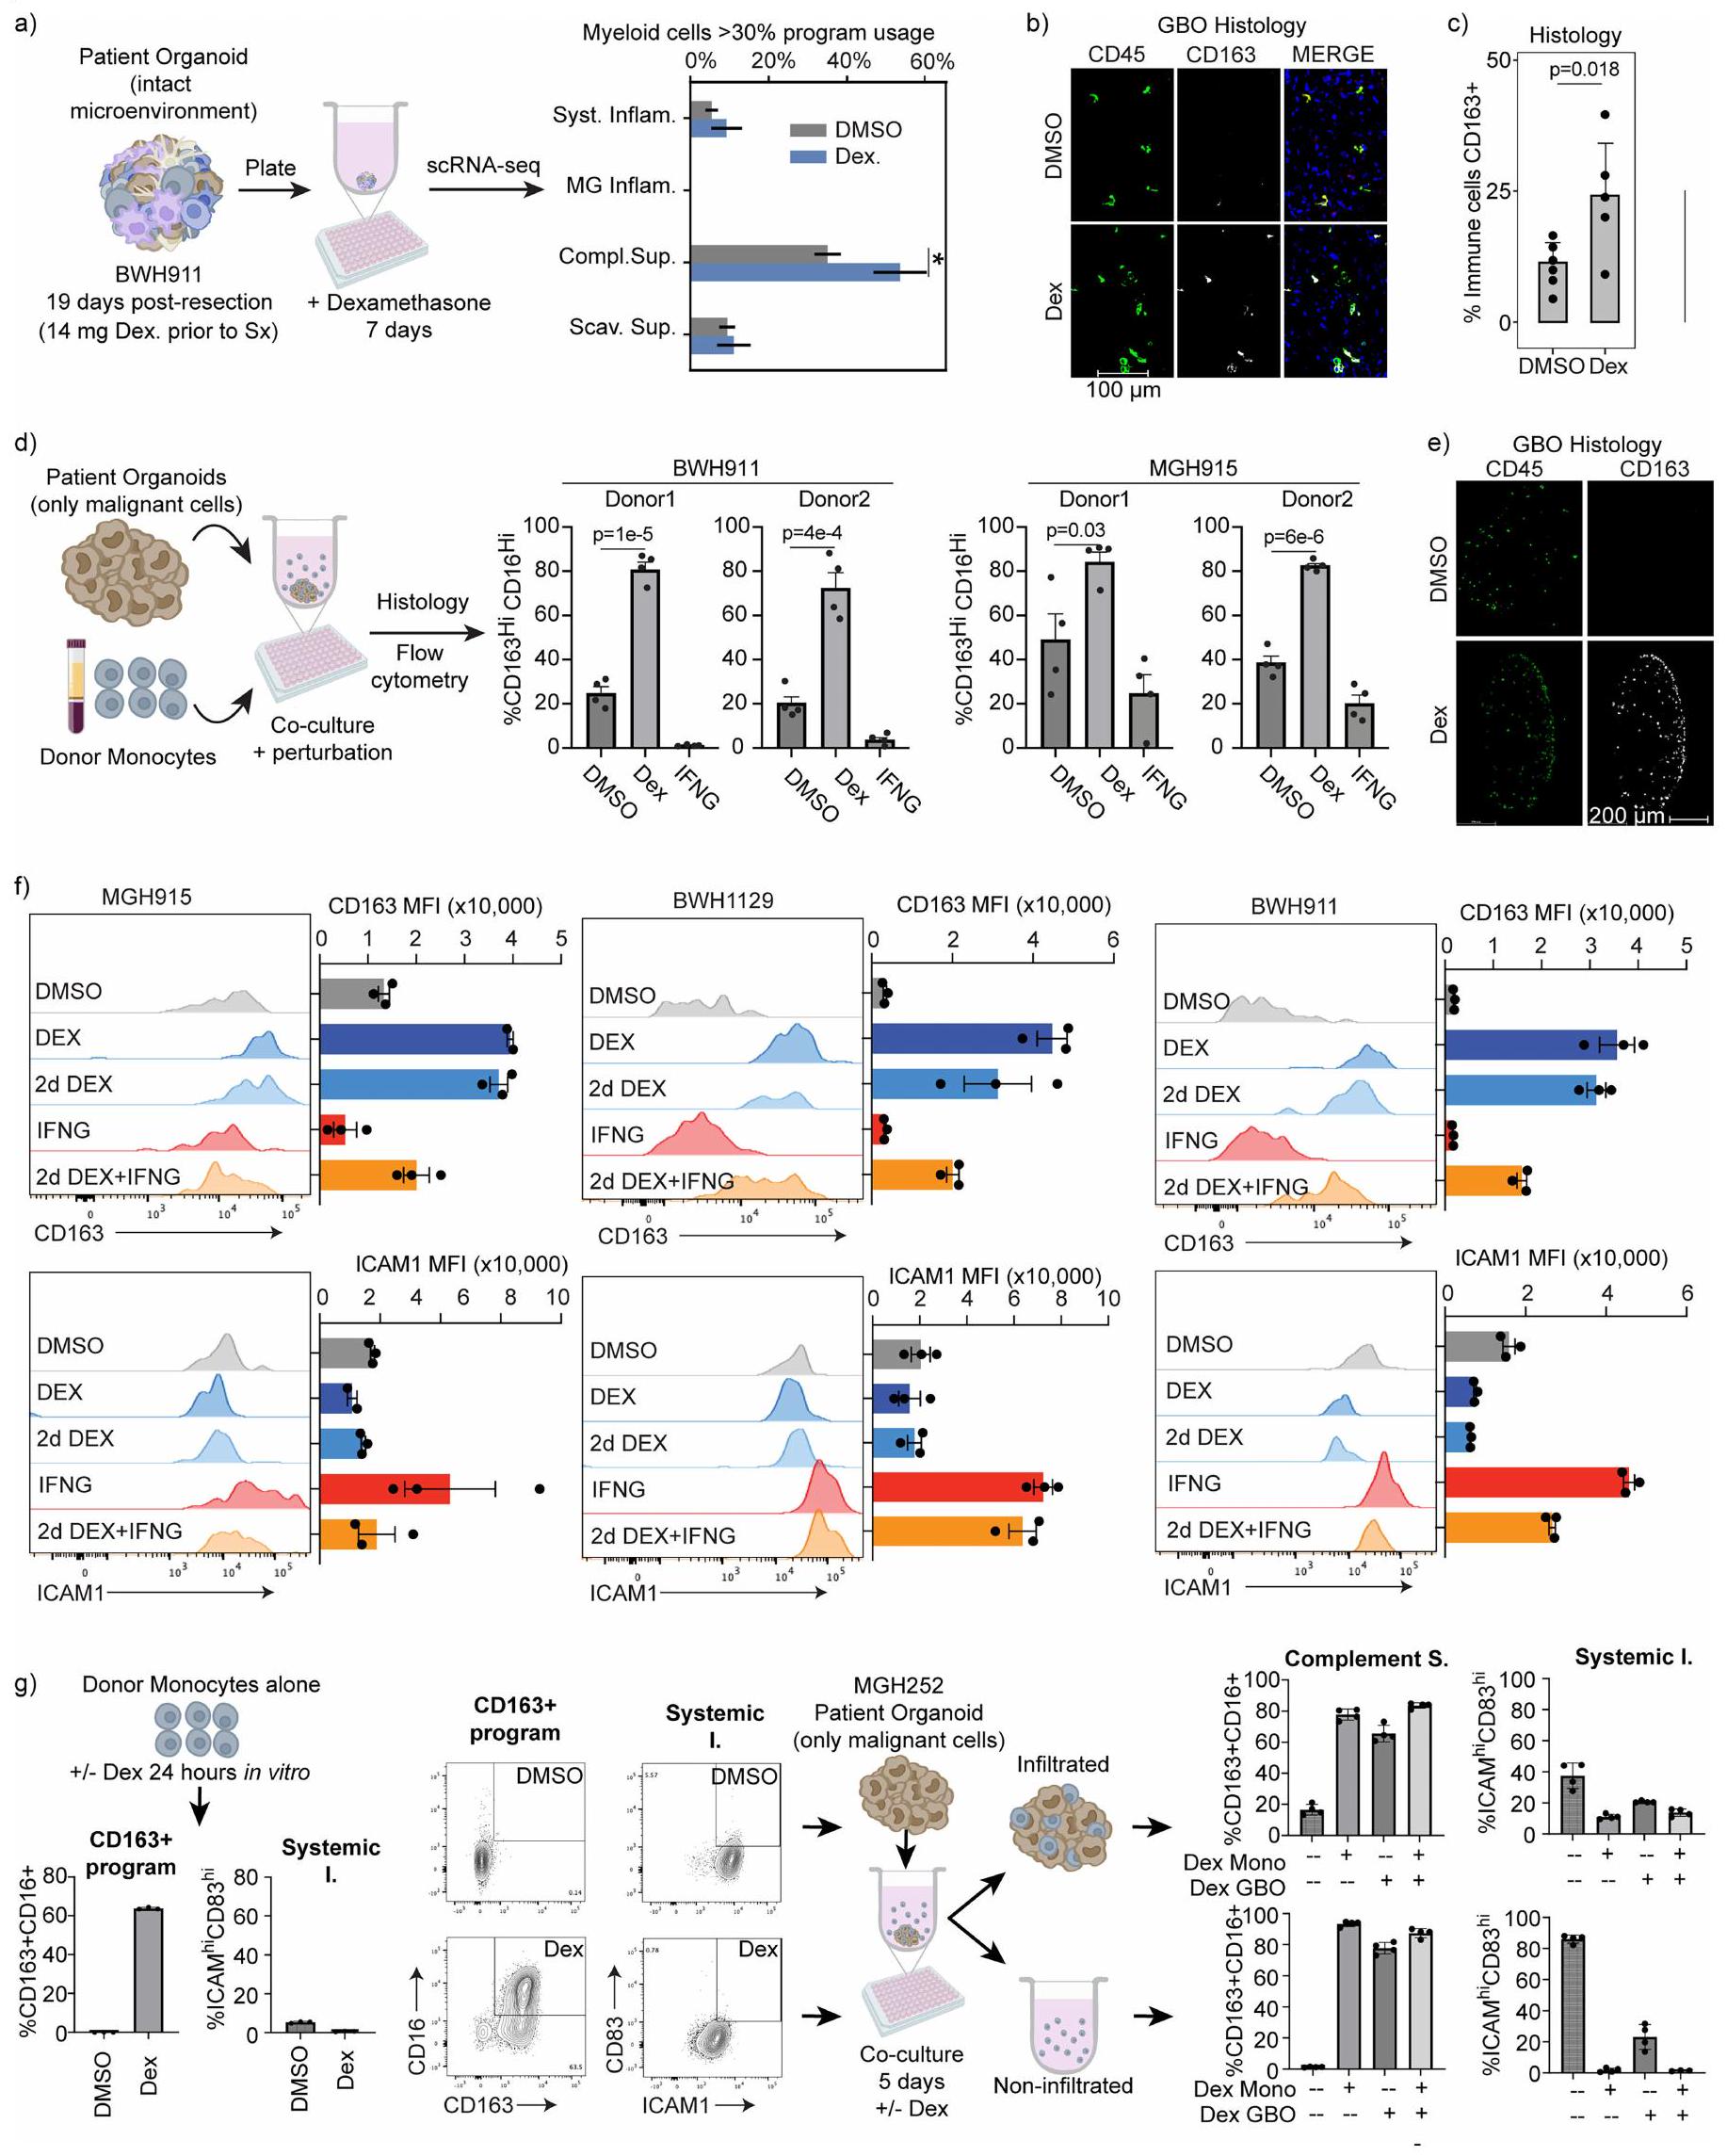
استخدمنا GBOs لاختبار مباشرة ما إذا كانت الروابط التي تعبر عنها البرنامج الالتهابي الجهازي تؤثر على برنامج المناعة المكمل. قمنا بتطبيق أحادية المحيط على GBOs الموزعة عبر لوحة 96 بئر وزرعناها لمدة 5 أيام في وجود روابط مختلفة. ثم جمعنا الأعضاء وقيمنا البرامج النخاعية باستخدام قياس التدفق المناعي والكيمياء النسيجية للبروتينات الرئيسية (الشكل 5أ). IL-1 و TGF كلاهما حفز علامات المناعة المكملة، مع IL-1 الذي حفز زيادة تزيد عن أربعة أضعاف مقارنة بالتحكم. على العكس، زاد IFN من نسب الخلايا التي تعبر عن علامات الالتهاب الجهازي وقلل من علامات المناعة المكملة (الشكل 5ب).
هذه التنبؤات والتحقق التجريبي حددت روابط محددة في بيئة الورم الدبقي التي كان لها تأثيرات متعارضة على البرامج الالتهابية الجهازية والمناعة المكملة. كما تشير إلى أن الروابط الالتهابية الجهازية قد تعزز برنامج المناعة المكمل، مما قد يدل على تفاعل تغذية راجعة يحد من الالتهاب في أورام الجهاز العصبي المركزي.
ديكس يحفز المناعة المستدامة
على عكس البرامج الجهازية والمكملة، لم تحدد تحليلاتنا TFs أو روابط محددة كانت مرتبطة بقوة مع برنامج المناعة المكمل. ومع ذلك، فإن الارتباط السريري الوثيق للبرنامج مع علاج ديكس دفعنا للتحقيق في هذه العلاقة باستخدام GBOs. وجدنا أن ديكس حفز بشكل خاص وملحوظ برنامج المناعة المكمل، دون التأثير على برنامج المناعة المكمل. كان هذا التأثير واضحًا في GBOs الطازجة مع خلايا النخاع الذاتية وفي GBOs الممررة التي تسللت إليها خلايا النخاع من الدم المحيطي ex vivo (الشكل 5ب، ج والشكل الموسع 11أ-هـ).
ديكس يؤثر على النشاط النسخي من خلال دفع الانتقال النووي وارتباط الحمض النووي بمستقبل الجلوكوكورتيكويد (GR). قمنا بتقييم أهداف GR المباشرة باستخدام تسلسل المناعة الكروماتينية العامة (ChIP-seq) وبيانات RNA-seq لبلعميات بشرية مزروعة تم علاجها بـ ديكس لمدة. أكدت بيانات RNA-seq الزيادة السريعة في تنظيم الجينات الرئيسية لبرنامج المناعة المكمل، العديد منها كانت أهداف ارتباط GR المباشرة باستخدام ChIP-seq (الشكل 4ف-ح). بالمقابل، الجينات التي تم تقليلها بواسطة ديكس لم يكن لديها دليل على ارتباط GR. بدلاً من ذلك، كانت مرتبطة بمسار NF-кB و، من ثم، مع برنامجنا الالتهابي الجهازي (الشكل 4ف والشكل الموسع 10د، هـ). هذا يتماشى مع الدراسات الفأرية التي تظهر قمع نشاط NF-кB بواسطة GR من خلال زيادة تنظيم مثبطات NF-кB. في الواقع، حددت تحليلاتنا مثبط NF-кB TNFAIP3 كهدف مباشر لـ GR يتم تحفيزه بسرعة بواسطة علاج ديكس.
أخيرًا، تحققنا مما إذا كان هذا النمط المناعي المكمل الناتج عن ديكس قابلًا للعكس. هذا سؤال سريري مهم نظرًا لأن الغالبية العظمى من المرضى الذين يعانون من ورم دبقي يتلقون الكورتيكوستيرويدات قبل العملية وأن تجارب العلاج المناعي عادة ما تبدأ بعد فترة قصيرة من توقف ديكس. قمنا بتطبيق ديكس على GBOs المملوءة بخلايا النخاع لمدة يومين ثم غسلنا ديكس. ومع ذلك، لم يتراجع تعبير برنامج المناعة المكمل حتى بعد أسبوعين من سحب الدواء (الشكل 5ج والشكل الموسع 11ف). على الرغم من أن إضافة IFN إلى GBOs عكست جزئيًا التغيير الناتج عن ديكس، إلا أن استخدام برنامج المناعة المكمل ظل مرتفعًا. كما اختبرنا ما إذا كان تأثير ديكس على أحادية المحيط مستدامًا بعد دخولها الورم. وجدنا أن ديكس حفز بسرعة علامات المناعة المكملة في أحادية المحيط، وأن هذه التغييرات استمرت مع تمايز الأحادية في GBOs، حتى بعد سحب ديكس (الشكل الموسع 11ز).
بشكل عام، تشير هذه البيانات إلى أن ديكس يحفز برنامج المناعة المكمل من خلال التحفيز المشترك لأهداف GR المستجيبة للهرمونات وقمع البرنامج الالتهابي الجهازي المرتبط بـ NF-кB. تسلط النتائج الضوء على مرونة حالات خلايا النخاع أثناء تسلل الورم الدبقي، والتمايز والعلاج، لكنها أيضًا تظهر الديمومة الملحوظة للحالة المناعية المكملة الناتجة عن ديكس والتي لا يمكن عكسها ولها آثار سريرية كبيرة.
استهداف AP-1 وبرنامج المناعة المكمل بواسطة p300i
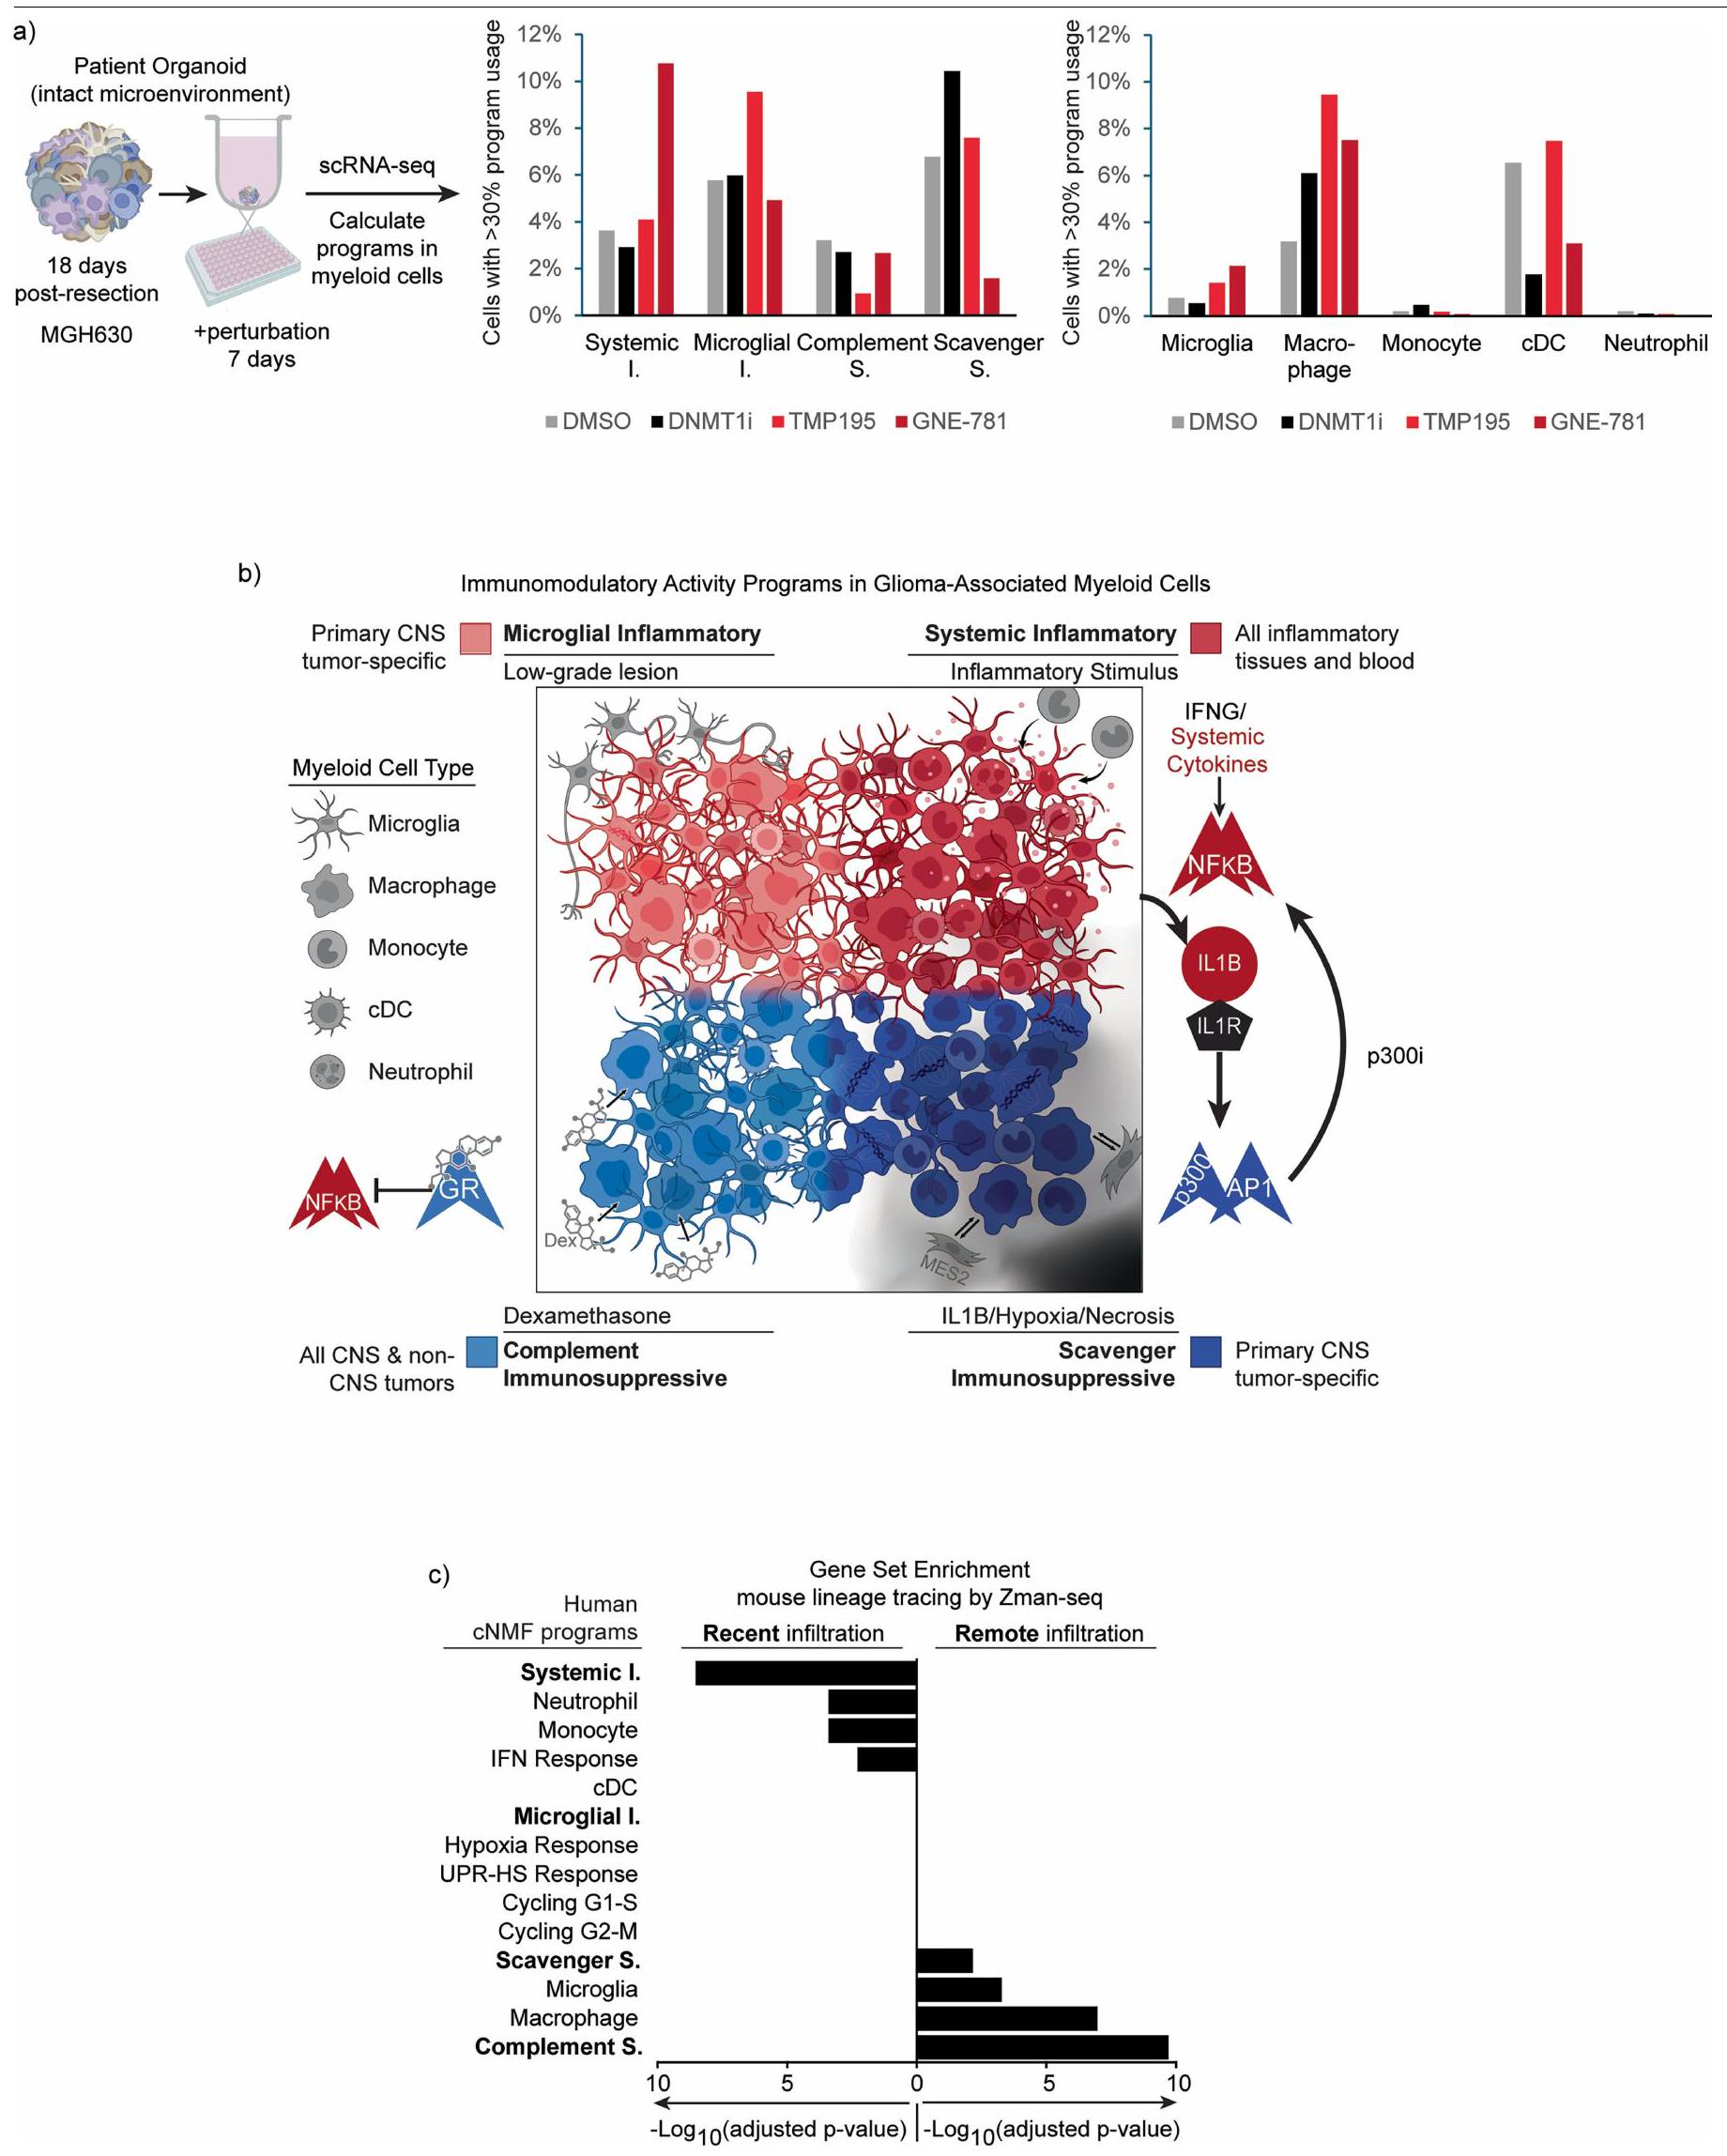
نظرًا للأدوار البارزة لبرنامج المناعة المكمل كمثبط للالتهاب والاستجابات المناعية في الورم الدبقي، استكشفنا ما إذا كان يمكن إعادة برمجته لإنشاء بيئة ميكروية أكثر التهابية. باستخدام GBOs من الأورام التي تمت إزالتها حديثًا، اختبرنا مثبطات كيميائية للمنظمين الجينيين لتأثيراتها على استخدام البرنامج (الشكل الموسع 12أ). وجدنا أن GNE-781، مثبط انتقائي لمجال برومودومين p300/CBP (p300i)، كان له التأثير الأكثر لفتًا على الأنماط المناعية المعدلة. أدى العلاج بـ GNE-781 لمدة سبعة أيام إلى تقليل استخدام برنامج المناعة المكمل بشكل كبير، مع زيادة تعويضية في البرنامج الالتهابي الجهازي (الشكل 5د).
للتحقيق في الآليات التي من خلالها ي moderates GNE-781 البرنامج المناعي المكمل، قمنا بإجراء ATAC-seq على خلايا النخاع المعزولة من الأعضاء المعالجة. كانت المواقع ذات الوصول المنخفض في العينات المعالجة بـ GNE-781 غنية بشدة بموتيفات AP-1 (الشكل 5هـ). هذا يتماشى مع الدراسات السابقة التي أشارت إلى p300/CBP في تنشيط أهداف AP-1 ومن المحتمل أن يفسر الانخفاض الملحوظ في برنامج المناعة المكمل. على العكس، كانت مجموعة المواقع التي زاد وصولها بعد علاج GNE-781 غنية بموتيفات مرتبطة بـ NF-кB، بما يتماشى مع دراسة سابقة ربطت CBP/p300 بخلايا مثبطة مشتقة من النخاع ومع تحولنا الملحوظ في الأنماط التعبيرية النخاعية من المناعية المكملة.
الشكل 4 | الدوائر التنظيمية المرتبطة بالبرامج المايلويد المناعية. أ، خريطة حرارية توضح إمكانية الوصول إلى المواقع التنظيمية المرشحة (الصفوف) المرتبطة بكل برنامج مناعي في ملفات pseudobulk المجمعة من بيانات snATAC-seq لخلايا المايلويد المرتبطة بالورم الدبقي مع تعبير تفضيلي عن برنامج واحد (الأعمدة). نورم، مُعَدل. ب، خريطة حرارية توضح إثراء أنماط TF المشار إليها (الصفوف) في العناصر القابلة للوصول المرتبطة بكل برنامج (الأعمدة).-تم حساب القيم باستخدام اختبار فيشر الدقيق أحادي الجانب. ج، خريطة حرارية تعرض درجات الخصوصية لبرامج تنظيم TF (الصفوف) في الخلايا التي تستخدم برامج مناعية محددة (الأعمدة). تم حساب الدرجات من scRNA-seq بواسطة SCENIC. د، هـ، مخططات شريطية تظهر تعبير اللجندات المتوقعة لاستهداف TFs للنظام.
إلى الالتهاب الجهازي. تدعم هذه البيانات فرضيتنا بأن الإشارة العالية لـ AP-1 هي محرك لبرنامج المناعة المثبطة للسموم، كما تشير إلى استراتيجية علاجية لديها القدرة على إعادة برمجة البيئة المناعية الفريدة في الأورام الدبقية (الشكل 5f).
نقاش
تسلط دراستنا الضوء على مرونة الخلايا النخاعية المرتبطة بالورم الدبقي والأثر الحاسم للبيئة الدقيقة المحلية والموطن على أنماطها الظاهرية. من خلال تحليل النسخ الجينية للخلايا الفردية إلى برامج تعبيرية منفصلة باستخدام cNMF، قمنا بفك ارتباط هوية الخلية من برنامج الالتهاب (د) أو برنامج المناعة المثبطة للسموم (هـ). تشير القيم إلى التعبير في البرنامج الذي يحتوي على أعلى تعبير للرباط (المشار إليه بلون الشريط). و، رسم بركاني يوضح الجينات المعبر عنها بشكل مختلف في البلعميات المعالجة بـ Dex لمدة 24 ساعة (المرجع 43). تم رسم أعلى 20 جينًا في كل برنامج وتلوينها وفقًا للبرنامج. ز، عرض جينومي يظهر ملفات snATAC المجمعة لكل برنامج فوق المواقع المستهدفة الرئيسية لـ GR. تظهر بيانات ChIP-seq لـ GR في الصف السفلي المواقع المرتبطة بـ GR. ح، رسم نقطي يظهر إشارة ارتباط GR فوق المواقع المستهدفة مرتبة حسب الرتبة. تم وضع علامات على جينات برنامج المناعة المثبطة للسموم المختارة بالقرب من مواقع هدف GR. معًا، تلقي البيانات الجينية الضوء على الآليات التنظيمية لـ TF التي تكمن وراء تعبير البرنامج المناعي المعدل في خلايا المايلود المرتبطة بالورم الدبقي. نشاط الخلايا، المكونات الأساسية لظواهر الخلايا النخاعية. وقد كشفت هذه النتائج عن رؤى بيولوجية كانت مخفية في توقيعات الجينات المستمدة من تجمعات لوفيان/لايدن، التي تخلط بين البرامج المعبر عنها بشكل مشترك. على الرغم من أن الخلايا النخاعية عادة ما تم تصنيفها حسب نوع الخلية أو النشوء، إلا أننا وجدنا أن أيًا منهما ليس محددًا رئيسيًا لنشاطها في الأورام الدبقية. بدلاً من ذلك، يمكن أن تقوم أنواع مختلفة من الخلايا النخاعية بتنشيط نفس البرامج الأربعة المناعية، والتي من المحتمل أن تحدد الحالة المناعية العامة. في الواقع، تشير الارتباطات السريرية إلى أن هذه البرامج المناعية تعدل بشكل قوي الاستجابات المناعية ونتائج المرضى. تكشف التحقيقات الوظيفية عن دوائر TF، ومسارات الإشارة، والليغاندات التي تتوسط التفاعل و
الشكل 5 | التحريض الوظيفي وعكس البرامج المثبطة للمناعة. أ، ب، تصميم التجربة ومخططات الأعمدة لنتائج التدفق من تجارب اضطراب اللقائيات لـ IL- و TGF ، التي تحفز بشكل خاص برنامج المناعة المثبطة للماكروفاجات (أ) وديكس وIFNالتي تحفز بشكل خاص برنامج المناعة المثبطة المكمل وبرامج الالتهاب النظامي، على التوالي (ب). تمثل نقاط البيانات GBOs الفردية. تظهر الرسوم البيانية المتوسط ± الانحراف المعياري.تم حساب قيم – للقوة الدافعة على التحكم باستخدام اختبار فيشر الدقيق؛*. ج، تصميم التجربة ونتائج تحليل تدفق الخلايا من تقييمات متانة نمط Dex. تظهر الرسوم البيانية الشريطية متوسط الإشارة ± الانحراف المعياري. تمثل كل نقطة بيانات مجموعتين من GBOs. FACS، فرز الخلايا المعتمد على الفلورية؛ MFI، متوسط شدة الفلورية. تصميم التجارب والنتائج لعلاجات p300i لـ GBOs. تمثل الأعمدة مجموعة من البرامج الالتهابية (باللون الأحمر) أو البرامج المثبطة للمناعة (باللون الأزرق) تم حسابها من تسلسل RNA أحادي الخلية.، محسوب بواسطة اختبار الطالب ذو الذيلين-اختبار التغيير في البرنامج المثبط مقابل التغيير في البرنامج الالتهابي عبر ثلاث عينات. e، تُظهر خرائط الحرارة العناصر التنظيمية المرشحة ذات الوصول المختلف بين خلايا النخاع الشوكي المعالجة بـ p300i أو التحكم DMSO. تُظهر أنماط TF الغنية في العناصر المختلفة على اليمين.-تم حساب القيم باستخدام اختبار فيشر الدقيق أحادي الجانب. f، مخطط يوضح الحلقات المرتبطة من برامج تعديل المناعة والسيتوكينات وعوامل النسخ والجزيئات الصغيرة التي يمكن أن تؤثر عليها. لوحة 96 بئر (و d) وأنبوب PBMC (أ) تم إنشاؤه في BioRender. شاليك، أ. (2005)https://BioRender.com/b15i535. توازن البرامج المعنية للحفاظ على بيئة ميكروية مثبطة للمناعة.
تتمتع البرامج الأربعة بارتباطات فريدة ومواضع وسائقين، لكنها مترابطة بشكل كبير (الشكل 12b من البيانات الموسعة). يُعتبر برنامج الالتهاب الميكروغليالي نموذجًا لمرونة الخلايا المكونة للدم في بيئة الدماغ. على الرغم من احتوائه على علامات ميكروغليا كلاسيكية، إلا أنه يتم تفعيله أيضًا في مجموعات فرعية من البلعميات والخلايا التغصنية المستمدة من وحيدات الدم المتسللة. بالمقابل، يظهر البرنامج الالتهابي الجهازي في وحيدات الدم المحيطية من المرضى الذين يعانون من الورم الدبقي. في بيئة الورم الدبقي، تنتج الخلايا الالتهابية الجهازية المتسللة مستويات عالية من IL-1.الذي يمكن أن يحفز برنامج المناعة المثبطة الخاص بالورم الدبقي، مما قد يخلق حلقة تغذية راجعة تعمل على تعديل التهاب الدماغ. ومن الجدير بالذكر، أن p300/CBP يعمل المثبط على تقليل هذا البرنامج المناعي المثبط والتوقيعات المرتبطة بـ AP-1، مما يعيد البرنامج الالتهابي الافتراضي. برنامج أخير، وهو البرنامج المناعي المثبط المكمل، ينشط جينات ودارات مختلفة، ويشغل مناطق متميزة من الورم الدبقي. يتم تحفيزه بواسطة إشارات GR، التي يمكن تنشيطها بواسطة الجلوكوكورتيكويدات الذاتية وتزداد بشكل ملحوظ بواسطة الجلوكوكورتيكويد الاصطناعي Dex. تبرز متانة هذا النمط المناعي المثبط الحاجة إلى بدائل لـ Dex، الذي يُستخدم على نطاق واسع لإدارة الأعراض في الورم الدبقي.
تترك دراستنا بعض الأسئلة الحرجة دون إجابة. تلتقط بياناتنا تنوع الخلايا النخاعية في وقت استئصال الورم ولكنها لا تتناول ديناميكياتها الزمنية أو معدل دورانها. نحن نتكهن أن الخلايا الدبقية الصغيرة والوحيدات الغازية تكون في البداية متحيزة نحو الأنماط الالتهابية ولكنها تتبنى بعد ذلك أنماطًا مثبطة للمناعة. برامج استجابة للإشارات البيئية الدقيقة، كما يتماشى مع الدراسات الحديثة على الفئران (الملاحظة التكميلية 4). الموضوع مهم سريرياً وفي وقته نظرًا للإشارات التي تشير إلى أن عمر خلايا النخاع قد يمتد في مناطق أورام الدماغ.تحتاج الدراسات الإضافية أيضًا إلى تحسين استنتاجاتنا بشأن جزيئات الإشارة التي تحفز الغزو، والتمايز، وبرامج تعديل المناعة. توضح بياناتنا كيف تؤثر بيئات الورم الدبقي على البرامج المايلويدية، لكنها لا تتناول مدى تأثير التغذية الراجعة من الأنماط المايلويدية على هذه البيئات. كما أننا لا نحدد السببية في العلاقة بين درجة الورم والبرامج المايلويدية، والتي قد تتضمن أيضًا تفاعلًا بين وراثة الخلايا الخبيثة والأنماط المايلويدية.ومع ذلك، يوفر عملنا إطارًا قويًا لفهم بيولوجيا الخلايا المكونة للدم، والذي ينبغي أن يحفز المزيد من الاكتشافات وفي النهاية يوجه استراتيجيات جديدة لإعادة برمجة الخلايا المكونة للدم والبيئة المناعية لتحقيق فوائد علاجية.
المحتوى عبر الإنترنت
أي طرق، مراجع إضافية، ملخصات تقارير Nature Portfolio، بيانات المصدر، بيانات موسعة، معلومات تكميلية، شكر وتقدير، معلومات مراجعة الأقران؛ تفاصيل مساهمات المؤلفين والمصالح المتنافسة؛ وبيانات توفر البيانات والرموز متاحة علىhttps://doi.org/10.1038/s41586-025-08633-8.
غوتمان، د. هـ. وكيتينمان، هـ. الميكروغليا/البلاعم الدماغية كمحركات مركزية لعلم أمراض أورام الدماغ. نيورون 104، 442-449 (2019).
سورنسن، م. د.، دالروت، ر. هـ.، بولدت، هـ. ب.، هانسن، س. وكريستنسن، ب. و. الخلايا الدبقية/البلاعم المرتبطة بالورم تتنبأ بتوقعات سيئة في الأورام الدبقية عالية الدرجة وترتبط بنمط ورم عدواني. علم الأمراض العصبية. التطبيق العصبي. 44، 185-206 (2018).
وانغ، إي. جي. وآخرون. مقاومة العلاج المناعي في الورم الدبقي. فرونت. جينيت. 12، 750675 (2021).
رافيل، ب. وكوسينز، ل. م. البلعميات ومقاومة العلاج في السرطان. خلية السرطان 27، 462-472 (2015).
كليم، ف. وآخرون. استجواب المشهد الميكروبيئي في أورام الدماغ يكشف عن تغييرات محددة للمرض في خلايا المناعة. خلية 181، 1643-1660 (2020).
هارا، ت. وآخرون. التفاعلات بين خلايا السرطان وخلايا المناعة تدفع الانتقالات إلى حالات شبيهة بالميزانشيم في الورم الدبقي. خلية السرطان 39، 779-792 (2021).
عبد الفتاح، ن. وآخرون. تحليل الخلايا الفردية للورم الدبقي البشري وخلايا المناعة يحدد S100A4 كهدف للعلاج المناعي. نات. كوميونيك. 13، 767 (2022).
ماثيوسون، ن. د. وآخرون. تم تحديد مستقبل CD161 المثبط في خلايا T المتسللة إلى الورم الدبقي من خلال تحليل الخلايا الفردية. خلية 184، 1281-1298 (2021).
نيفتل، سي. وآخرون. نموذج تكاملي لحالات الخلايا والمرونة والوراثة للورم الدبقي. خلية 178، 835-849 (2019).
كوتورييه، سي. بي. وآخرون. تسلسل RNA على مستوى الخلية الواحدة يكشف أن الورم الدبقي يعيد تمثيل تسلسل التطور العصبي الطبيعي. نات. كوميونيك. 11، 3406 (2020).
فينتيشر، أ. س. وآخرون. فصل الجينات، السلالات، والبيئة الدقيقة في الأورام الدبقية المتحورة IDH بواسطة تسلسل RNA أحادي الخلية. ساينس 355، eaai8478 (2017).
غاروفانو، ل. وآخرون. تصنيف الورم الدبقي القائم على المسارات يكشف عن نوع ميتوكوندريالي مع نقاط ضعف علاجية. نات. كانسر 2، 141-156 (2021).
جونستون، ك. س. وآخرون. تحليلات الجليوما متعددة الأبعاد على مستوى الخلية الواحدة تحدد المنظمات الجينية للمرونة الخلوية واستجابة الإجهاد البيئي. نات. جينيت. 53، 1456-1468 (2021).
الغامري، م. س. وآخرون. G-CSF الذي تفرزه خلايا جذعية من الأورام الدبقية ذات الطفرة في IDH1 يلغي تثبيط المناعة للخلايا النخاعية ويعزز فعالية العلاج المناعي. Sci. Adv. 7، eabh3243 (2021).
بومبو أنتونيس، أ. ر. وآخرون. تحليل الخلايا المفردة للخلايا النخاعية في الورم الدبقي عبر الأنواع ومرحلة المرض يكشف عن تنافس وتخصص البلعميات. نات. نيوروساينس. 24، 595-610 (2021).
ميلر، س. وآخرون. تحليل الخلايا الفردية للأورام الدبقية البشرية يكشف عن أصل البلعميات كأساس للاختلافات الإقليمية في تنشيط البلعميات في بيئة الورم الدقيقة. جينوم بيو. 18، 234 (2017).
فريبل، إ. وآخرون. رسم خرائط الخلايا الفردية لسرطان الدماغ البشري يكشف التعليم المحدد للورم لكريات الدم البيضاء الغازية للأنسجة. خلية 181، 1626-1642 (2020).
فريدريش، م. وآخرون. استقلاب التربتوفان يقود حالات المايلويد المناعية المثبطة الديناميكية في الأورام الدبقية المتحورة في IDH. نات. كانسر 2، 723-740 (2021).
لي، أ. هـ. وآخرون. حجب PD-1 المساعد قبل الجراحة يحفز تنشيط خلايا T و cDC1 ولكنه يفشل في التغلب على البلعميات المرتبطة بالورم المثبطة للمناعة في الورم الدبقي المتكرر. نات. كوم. 12، 6938 (2021).
جينهو، ف. وآخرون. تحليل تتبع المصير يكشف أن الميكروغليا البالغة تنشأ من البلعميات البدائية. ساينس 330، 841-845 (2010).
هامباردزوميان، د.، غوتمان، د. هـ. وكيتينمان، هـ. دور الميكروغليا والماكروفاجات في الحفاظ على الورم الدبقي وتطوره. نات. نيوروساينس. 19، 20-27 (2016).
زيلونيس، ر. وآخرون. تحليل النسخ الجيني على مستوى الخلية الواحدة لسرطانات الرئة لدى البشر والفئران يكشف عن تجمعات ميويد محفوظة عبر الأفراد والأنواع. المناعة 50، 1317-1334 (2019).
كوتورييه، سي. بي. وآخرون. تظهر تسلسلات RNA أحادية الخلية لورم الدبقيات زيادة معتمدة على المناعة في خلايا السرطان الميزنشيمية والأنماط الهيكلية المتغيرة في خلايا الجذع العصبي البعيدة نتيجة للعلاج. علم الأورام العصبية. 24، 1494-1508 (2022).
كوتليار، د. وآخرون. تحديد برامج التعبير الجيني لهوية نوع الخلية والنشاط الخلوي باستخدام تسلسل RNA أحادي الخلية. eLife 8، e43803 (2019).
تشانغ، س. وآخرون.تساهم البلعميات المرتبطة بالأورام في تثبيط المناعة من خلال إعادة برمجة الأيض الدهني في الانصباب الجنبي الخبيث. J. Immunother. Cancer 11، e007441 (2023).
فوجت، ل. وآخرون. VSIG4، بروتين مرتبط بعائلة B7، هو منظم سلبي لتنشيط خلايا T. ج. استثمار سريري. 116، 2817-2826 (2006).
تيمرمان، م.، باك، ف.، سورغ، ج. و هوغر، ب. تفاعل CD163 القابل للذوبان مع اللمفاويات التائية المنشطة يتضمن ارتباطه بسلسلة الميوسين الثقيلة من النوع A غير العضلي. علم المناعة. علم الخلايا 82، 479-487 (2004).
جادجون، ج.، مارين-روبيو، ج. ل. وتروست، م. دور مستقبل مستقبلات الماكروفاج 1 (MSR1) في الاضطرابات الالتهابية والسرطان. فرونت. إيمونول. 13، 1012002 (2022).
ميلر، ت. إ. وآخرون. إثراء المتغيرات الميتوكوندرية من تسلسل RNA أحادي الخلية عالي الإنتاجية يحل السكان النسليين. نات. بيوتكنولوجي. 40، 1030-1034 (2022).
جاكوب، ف. وآخرون. نموذج عضوي مشتق من المريض للورم الدبقي البيولوجي ومصرف حيوي يعيد تمثيل التباين بين الأورام وداخلها. خلية 180، 188-204 (2020).
رافي، ف. م. وآخرون. التحليل المتعدد الأبعاد المكاني يفكك الاعتماد المتبادل الثنائي الاتجاه بين الورم والمضيف في الورم الدبقي. خلية السرطان 40، 639-655 (2022).
كابل، د. م. وآخرون. التحليل القوي لمزيج أنواع الخلايا في النسخ الجيني المكاني. نات. بيولوجيا التكنولوجيا. 40، 517-526 (2022).
شيرر، هـ. ج. التطور الهيكلي في الأورام الدبقية. مجلة السرطان الأمريكية 34، 333-351 (1938).
جرينوالد، أ. سي. وآخرون. التحليل المكاني التكاملي يكشف عن تنظيم متعدد الطبقات للورم الدبقي. خلية 187، 2485-2501 (2024).
أمانكولور، ن. م. وآخرون. الطفرة في IDH1 تنظم نظام المناعة المرتبط بالورم في الأورام الدبقية. جينات ديف. 31، 774-786 (2017).
مي، ي. وآخرون. سيجلك-9 يعمل كجزيء نقطة تفتيش مناعية على البلعميات في الورم الدبقي، مما يقيّد تنشيط خلايا T واستجابة العلاج المناعي. نات. كانسر 4، 1273-1291 (2023).
نيشيكاوا، هـ. وكوياما، س. آليات تسلل خلايا T التنظيمية في الأورام: الآثار المترتبة على العلاجات المناعية الدقيقة المبتكرة. ج. علاج المناعة. السرطان 9، e002591 (2021).
تيرخانوفا، ن. ف. وآخرون. التنظيم الجيني غير الوراثي خلال انتقالات السرطان عبر 11 نوعًا من الأورام. ناتشر 623، 432-441 (2023).
أيبار، س. وآخرون. SCENIC: استنتاج الشبكة التنظيمية على مستوى الخلية الواحدة والتجميع. نات. ميثودز 14، 1083-1086 (2017).
براويز، ر.، سيلينس، و. وسايس، ي. نيتش نت: نمذجة التواصل بين الخلايا من خلال ربط الروابط بالجينات المستهدفة. نات. ميثودز 17، 159-162 (2020).
جب، أ. و.، يونغ، ر. س.، هوم، د. أ. & بيكومور، و. أ. دوران المعزز مرتبط باستجابة نسخية متباينة للجلوكوكورتيكويد في البلعميات الفأرية والبشرية. ج. المناعة. 196، 813-822 (2016).
دي ألميدا ناغاتا، د. إ. وآخرون. تنظيم نشاط الخلايا النخاعية المرتبطة بالورم بواسطة تعديل برومودومين CBP/EP300 لأسيتيل H3K27. تقارير الخلايا 27، 269-281 (2019).
غويريرو، ج. ل. وآخرون. تثبيط HDAC من الفئة IIa يقلل من أورام الثدي والنقائل من خلال البلعميات المضادة للورم. ناتشر 543، 428-432 (2017).
بابالاردي، م. ب. وآخرون. اكتشاف مثبط انتقائي لـ DNMT1 من الفئة الأولى قابل للعكس مع تحمل وفعالية محسّنة في سرطان الدم النخاعي الحاد. نات. كانسر 2، 1002-1017 (2021).
كيرشنباوم، د. وآخرون. علم النسخ الجزيئي للخلايا الفردية مع الزمن يحدد المسارات المناعية في الورم الدبقي. خلية 187، 149-165 (2024).
تشين، ز. وآخرون. دائرة باراكرين من IL-1ß/IL-1R1 بين خلايا النخاع والعقدة الورمية تدفع تقدم الورم الدبقي المعتمد على النمط الجيني. ج. استثمار سريري. 133، e163802 (2023).
فارن، ف. س. وآخرون. تقدم الورم الدبقي يتشكل من خلال التطور الجيني وتفاعلات البيئة الدقيقة. خلية 185، 2184-2199 (2022).
هوغسترات، ي. وآخرون. تحليل النسخ الجيني يكشف عن تغييرات في بيئة الورم في الورم الدبقي. خلية السرطان 41، 678-692 (2023).
ملاحظة الناشر: تظل شركة سبرينغر ناتشر محايدة فيما يتعلق بالمطالبات القضائية في الخرائط المنشورة والانتماءات المؤسسية.
الوصول المفتوح هذه المقالة مرخصة بموجب رخصة المشاع الإبداعي النسبية-غير التجارية-بدون اشتقاقات 4.0 الدولية، التي تسمح بأي استخدام غير تجاري، ومشاركة، وتوزيع، واستنساخ في أي وسيلة أو صيغة، طالما أنك تعطي الائتمان المناسب للمؤلفين الأصليين والمصدر، وتوفر رابطًا لرخصة المشاع الإبداعي، وتوضح إذا قمت بتعديل المادة المرخصة. ليس لديك إذن بموجب هذه الرخصة لمشاركة المواد المعدلة المشتقة من هذه المقالة أو أجزاء منها. الصور أو المواد الأخرى من طرف ثالث في هذه المقالة مشمولة في رخصة المشاع الإبداعي الخاصة بالمقالة، ما لم يُشار إلى خلاف ذلك في سطر الائتمان للمادة. إذا لم تكن المادة مشمولة في رخصة المشاع الإبداعي الخاصة بالمقالة وكان استخدامك المقصود غير مسموح به بموجب اللوائح القانونية أو يتجاوز الاستخدام المسموح به، فستحتاج إلى الحصول على إذن مباشرة من صاحب حقوق الطبع والنشر. لعرض نسخة من هذه الرخصة، قم بزيارة http:// creativecommons.org/licenses/by-nc-nd/4.0/. (ج) المؤلف(ون) 2025
طرق
المواضيع البشرية
قدم المرضى البالغون من الذكور والإناث في مستشفى ماساتشوستس العام ومستشفى بريغهام والنساء (MGB) موافقة مستنيرة قبل العملية للمشاركة في الدراسة في جميع الحالات بموجب بروتوكول مجلس المراجعة المؤسسية المعتمد DF/HCC 10-417. يتم تلخيص الخصائص السريرية للمرضى في الجدول التكميلي 1. قدم المرضى في مجموعات أخرى الموافقة وفقًا للطرق المنشورة.تم جمع بيانات المرضى غير المنشورة سابقًا من معهد مونتريال للأعصاب كما تم الإبلاغ عنها مع أورام أخرى من جامعة مكغيل..
معالجة الورم الأساسي لـ Seq-Well و GBOs
تم جمع عينات الأورام الطازجة مباشرة من غرفة العمليات في وقت الجراحة وتم تأكيد وجود الورم الدبقي من خلال القسم المجمد. تم تشريح العينات إلى قطع صغيرة ومزجها. بالنسبة للعينات التي تحتوي على مادة كافية، قمنا بتقسيم قطع الورم المختلطة، حيث تم استخدام جزء منها لتفكيك الخلايا المفردة وجزء آخر لتوليد GBO.
فصل الخلايا الفردية وSeq-Well. بالنسبة لمجموعة MGB، تم فصل قطع الأنسجة المفرومة ميكانيكياً وإنزيمياً باستخدام مجموعة فصل الأورام، وفقًا لتعليمات الشركة المصنعة، وجهاز GentleMACS Octo Dissociator مع سخانات (Miltenyi Biotec) باستخدام إعدادات مخصصة. ثم تم إزالة الخلايا الميتة والحطام من تعليق الخلايا الفردية باستخدام فرز الخلايا المعتمد على المغناطيس (مجموعة إزالة الخلايا الميتة، Miltenyi Biotec). ثم تمت معالجة الخلايا لـ Seq-Well كما تم وصفه سابقًا.باختصار، تم إعادة تعليق الخلايا في الوسط وتم توزيع 10,000-15,000 خلية بالتنقيط على مصفوفة ميكروويل Seq-Well المحملة مسبقًا بخلايا التقاط mRNA. ثم تم ختم المصفوفات بغشاء شبه نفاذ وغمرها في محلول التحلل لتفكيك أغشية الخلايا والنوى. بعد ذلك، تمت إزالة محلول التحلل وغمرت المصفوفة في محلول التهجين للسماح بارتباط mRNA بخلايا الالتقاط. بعد التقاط mRNA، تمت إزالة الختم من المصفوفة وتم غسل خلايا الالتقاط يدويًا من المصفوفة باستخدام محلول الغسيل. بعد إزالتها من المصفوفة، تم غسل الخلايا لإزالة أي مواد زائدة من محلول التحلل والأحماض النووية غير المرتبطة. تم إجراء تفاعل النسخ العكسي على الخلايا وتم إنتاج cDNA من خلال إطالة أوليغو خلايا الالتقاط باستخدام RNA الملتقط كقالب. ثم تم إجراء تفاعل إنزيم الإكسونوكلياز على الخلايا لتنظيفها. بعد ذلك، تم إجراء تفاعل تخليق الشريط الثاني لإنتاج شريط DNA مكمل لشريط cDNA من خلال تفاعل سلسلة البوليميراز. بعد توليد الشريط الثاني، تم تضخيم cDNA المزدوج الشريطة الآن من خلال تفاعل سلسلة البوليميراز في تضخيم كامل النسخ. تم إنتاج مكتبات قابلة للتسلسل من تضخيم كامل النسخ باستخدام مجموعة تحضير مكتبة Nextera، وفقًا لتعليمات الشركة المصنعة.
مواد MAESTER والتحضير. من cDNA Seq-Well، تم سحب أجزاء RNA الميتوكوندري بشكل انتقائي، وتم تضخيمها وتسلسلها بشكل منفصل كما هو موصوف سابقًا..
إنشاء وصيانة GBOs. تم تشريح قطع الأنسجة المفرومة باستخدام مشرطين حتى أصبحت القطع بقطر. تم غسلها، ومعالجتها بشكل إضافي وصيانتها وفقًا لبروتوكول سابق.
معالجة خلايا الدم المحيطية للمرضى والوحيدات
تم جمع خلايا PBMCs الخاصة بالمريض في وقت الجراحة وعزلها باستخدام أنابيب SepMate-15 (تقنيات ستيمسيل) وLympholyte-H (Cedarlane) وفقًا لتعليمات الشركات المصنعة. تم معالجة الخلايا إما مباشرة لـ Seq-Well كما هو مذكور أعلاه أو تم إثراؤها لخلايا المايلويد الشاملة باستخدام كريات CD11b (Miltenyi Biotec، 130-097-142) على Miltenyi. المغناطيس وفقًا لبروتوكولات التصنيع، ثم تمت معالجته لـ Seq-Well.CD11bD45تم فحص النقاء بواسطة تحليل تدفق الخلايا (النقاء ).
اضطراب GBO وطرق قراءة الخلايا الفردية
اضطرابات GBO. بالنسبة لتجارب الاضطراب، تم نقل GBOs إلى أطباق 96 بئر ذات قاع دائري منخفض الالتصاق (كورنينج، 7007) مع GBO واحد لكل بئر. تم وضع GBOs فيوسائط. ثم أضيفت جزيئات صغيرة في إضافيوسائل الإعلام فيتركيز. تم تغيير الوسط كلأيام عن طريق إزالة واستبداله بـ وسائط جديدة مع اضطراب. اعتمادًا على التجربة، كان لكل حالة 6-12 GBOs لكل حالة لتأخذ في الاعتبار التباين بين GBOs. بالنسبة للتجارب التي استخدمت قياس التدفق الخلوي أو تسلسل RNA أحادي الخلية كقراءة، تم تجميع عدة GBOs معًا في تكرارات لكل حالة ثم تم فصلها إلى خلايا مفردة معًا.
التعايش المشترك بين الخلايا المكونة للدم – GBO. إنسانتم تقسيم الخلايا المعزولة من ورم أو خلايا الدم المحيطية لمتبرع، كما هو موضح أعلاه، وتجميدها فيخلايا لكل مل لكل قنينة. قبل الزراعة المشتركة مع GBOs، تم إذابة الخلايا النخاعية بلطف وغسلها في وسط خلايا نخاعية دافئ (وسط تمايز البلعميات ImmunoCult-SF، باستخدام وسط أساسي مع M-CSF فقط (; تقنيات الخلايا الجذعية، 10961)، وتم زرعها في طبق منخفض الالتصاق مكون من 24 بئرًا (كورنينغ) لاستعادة الخلايا لمدة 30 دقيقة في الحاضنة. تم وضع الأطباق على دوار مداري بسرعة 120 دورة في الدقيقة مع الحد الأقصى للخلايا لكل بئر لتجنب التصاق الخلايا والحفاظ على شكل وحيدة النواة. ثم أضيفت وحيدات النواة (10,000-50,000، حسب التجربة) إلى كل بئر GBO في وسائط الخلايا النخاعية مع اضطراب الجزيئات الصغيرة عند الاقتضاء. تم تغيير الوسط كلأيام عن طريق إزالة واستبداله بـ وسط جديد (خليط 1:1 من وسط GBO ووسط الخلايا النخاعية) مع اضطراب عند الاقتضاء.
فصل GBOs. باختصار، تم تجميع جميع GBOs في كل تكرار تجريبي معًا في أنبوب إيبندورف سعة 1.7 مل، وتم سحب الوسط وتم غسل GBOs مرتين باستخدام 1 مل من الوسط لإزالة الجزيئات الصغيرة و/أو الخلايا. ثم تم فصل GBOs إلى خلايا مفردة باستخدام وسط الفصل من مجموعة فصل الأورام من ميلتينيي مختلطة بنسبة 2:1 مع أكيوتاس في أنابيب 1.7 مل. تم وضعها فيوفصلت ميكانيكياً كلعن طريق نقل السائل لأعلى ولأسفل حتى تم الحصول على خليط متجانس من الخلايا المفردة. تم تمرير الخلايا عبرتم تصفية الخلايا ثم استخدامها في التجارب اللاحقة. تم معالجة الخلايا باستخدام Seq-Well كما هو موضح أعلاه أو تم تحليلها بواسطة تحليل تدفق الخلايا كما هو موضح أدناه.
تدفق الخلايا. كان تدفق الخلايا يعتمد على بروتوكول سابقباختصار، تم إعداد كوكتيل من الأجسام المضادة بواسطةنسبة محلول صبغة البقع اللامعة (BD Horizon، 566349) وPBS، وتم إضافة الأجسام المضادة أو الأصباغ (الأجسام المضادة مدرجة في الجدول التكميلي 5). تم غسل التعليق الخلوي بواسطة PBSBSA فيأنابيب إيبندورف أو لوحات 96 بئر على شكل U. تم ترسيب الخلايا بواسطة الطرد المركزي عند 300 جرام لمدة 5 دقائق في درجة حرارة الغرفة. بعد إزالة محلول الغسيل، تم إعادة تعليق الخلايا فيكوكتيل الصبغ عن طريق نقل السائل لأعلى ولأسفل حوالي عشر مرات. تم تغطية الألواح أو الأنابيب لتجنب الضوء وتم صبغها في الظلام في درجة حرارة الغرفة لمدة. تم غسل الخلايا بواسطة PBSBSA وتم الطرد المركزي عندفي درجة حرارة الغرفة لمدة 5 دقائق. تم إعادة تعليق كريات الخلايا فيBSA. تم معالجة قياس التدفق على جهاز BD LSRFortess X-20 وفقًا لإجراءات الشركة المصنعة. تم استخدام UltraComp eBeads (Invitrogen، 01-3333-42) لتحديد التعويض مسبقًا. تم استخدام FlowJo v. 10 لتحليل البيانات.
التقييم النسيجي لتجارب GBO. تم تثبيت GBOs في 4% من الفورمالديهايد لمدة 30 دقيقة ثم تم غسلها بـ DPBS وتركها فيمحلول السكروز طوال الليل لتجفيف الأنسجة. تم تضمين الأعضاء
ثم تم تضمينها في OCT (Sakura Tissue Tek) وتجميدها باستخدام حمام إيزوبروبانول. تم بعد ذلك قطع الأنسجة بسماكةباستخدام جهاز التجميد. للتلوين، تم تجفيف الشرائح في درجة حرارة الغرفة لمدة 10 دقائق ثم تم غسلها مسبقًا بـTBST لإزالة OCT. تم حجب الأنسجة بمحلول BSA جلايسين لمدة ساعة في درجة حرارة الغرفة. تم بعد ذلك حاضنة مقاطع الأنسجة مع الأجسام المضادة الأولية إما فيطوال الليل أو في درجة حرارة الغرفة لمدة ساعتين (الأجسام المضادة مدرجة في الجدول التكميلي 5). تم بعد ذلك غسل مقاطع الأنسجة بدقة باستخدامTBST وتم حاضنتها مع الأجسام المضادة الثانوية المرتبطة بالفلوروفور وDAPI لمدة ساعة في درجة حرارة الغرفة. تم غسل الأنسجة بـTBS وتم حاضنتها معمادة كواتشينر True Black Autofluorescence لمدة دقيقة واحدة. تم غسل مقاطع الأنسجة بـTBS وتم تثبيتها بوسائط تثبيت Prolonged Gold (Invitrogen) وتم تغطيتها بشرائح زجاجية. للتصوير، تم استخدام نظام ميكروسكوب Leica Thunder مع منصة آلية ميكانيكية. تم التقاط الصور باستخدام ميزات المسح مع عدسة موضوعية × 40 مغمورة في الزيت. تم تجميع الصور معًا وتعزيزها باستخدام برامج التنظيف الحسابية السريعة لبرنامج Leica LAS X v.3.8.2.27713.
التحليل النسيجي. تم تحليل جميع الصور النسيجية باستخدام برنامج تحليل الصور مفتوح المصدر Qupath v.0.4.3. تم عد الخلايا باستخدام ميزة اكتشاف الخلايا باستخدام قناة DAPI. تم بعد ذلك استدعاء الخلايا المكتشفة لإيجابية تصل إلى ثلاثة علامات فلورية باستخدام ميزة قياس الكائن الفردي مع ضبط عتبات الإيجابية وفقًا للتجربة. تم تعيين العتبات من خلال مقارنة الظروف التجريبية بالتحكم ثم تم تطبيقها على جميع صور التجربة من خلال نصوص آلية.
تحليلات RNA-seq أحادية الخلية، مكانية وجماعية
المجموعات. استخدمت هذه الدراسة أربع مجموعات، مقسمة إلى مجموعتين من البيانات. احتوى مجموعة البيانات المكتشفة على MGB، هيوستن ميثوديستومختبرات جاكسونالمجموعات. تم اختبار الخلايا في هذه المجموعات باستخدام تقنيات scRNA-seq الأكثر تقدمًا: Seq-Well S(MGB) أو 10x Genomicsv. 3 (Methodist وJackson Laboratories). كانت مجموعة البيانات للتحقق تتكون من عينات من مجموعة McGill، بما في ذلك مجموعة تم نشرها سابقًاومجموعة لم يتم نشرها سابقًا. تم اختبار أورام McGill باستخدام مجموعات 10x Genomics 3′ v. 2. تم تنزيل بيانات Methodist (سلسلة GEO، GSE182109)، وتم تنزيل بيانات مختبرات جاكسون منhttps://ega-archive.org/datasets/EGAD00001007772 وتم تنزيل بيانات McGill المنشورة منhttps://ega-archive.org/datasets/EGAD00001006206.
بالنسبة للأورام الأخرى، حصلنا على مصفوفات التعبير الخام من المصادر المشار إليها في الجدول التكميلي 4.
المحاذاة. استخدمنا منصة Cumulusلإجراء تجارب RNA-seq أحادية الخلية على نطاق واسع. تم محاذاة المكتبات إلى جينوم GRCh38 باستخدام STARsolo v.2.7.10 (مرجع 60). تحتوي صفحة GitHub الخاصة بنا على الإعدادات المحددة (https://github.com/BernsteinLab/Myeloid-Glioma).
معالجة البيانات والتصور. تم ضغط مخرجات المصفوفات الخام من STARsolo (بدون تصفية الخلايا) لكل ورم ومكتبة GBO باستخدام gzip واستخدمت كمدخل لـ Seuratباستخدام وظيفة Read10X() مع المعلمات الافتراضية. تم تنفيذ خط الأنابيب لكل مجموعة بشكل مستقل. تم دمج الأورام في كل مجموعة باستخدام وظيفة Seurat merge() لإنشاء كائن Seurat لكل مجموعة. تم تحديد نسبة تعبير الجين الميتوكوندري باستخدام PercentageFeatureSet() مع تعيين النمط إلى ^MT. تم تصفية الخلايا التي تحتوي على أكثر من 25% من ترانسكريبتومها يتكون من تعبير الجين الميتوكوندري. كما قمنا بتصفية الخلايا التي تعبر عن أقل من 500 جين أو أكثر من 6,000 جين. كما قمنا بتصفية الخلايا التي تحتوي على أقل من 1,000 UMI والجينات المعبر عنها في أقل من ثلاث خلايا في المصفوفة. تم تنفيذ عملية التصفية باستخدام وظيفة Seurat subset().
لرسم المخططات، تم إجراء التطبيع، والتوسيع واكتشاف الجينات المتغيرة باستخدام وظيفة SCTransform()، حيث استخدمنا نسبة تعبير الجين الميتوكوندري كعامل انحدار.
قمنا بإجراء تحليل المكونات الرئيسية (PCA) باستخدام RunPCA() مع المعلمات الافتراضية وتم إنشاء مخطط الكوع باستخدام وظيفة ElbowPlot() لتحديد الأبعاد اللازمة لإنشاء UMAPs ولتجميع Louvain (MGB، 24؛ هيوستن ميثوديست، 19؛ مختبرات جاكسون، 16).
تم إنشاء UMAPs باستخدام RunUMAP() مع تعيين التخفيض إلى pca. تم استخدام FindNeighbors() وFindClusters() للتجميع، مع تعيين الدقة إلى 0.3.
تصنيف أنواع الخلايا. لتصنيف خلايا الورم في جميع المجموعات، حددنا البرامج الخلوية الرئيسية في مجموعة MGB وحددنا البرنامج الأعلى لكل خلية في جميع المجموعات. تم استخدام هذا البرنامج الأعلى بعد ذلك كتصنيف للخلية.
قمنا بدمج جميع الخلايا من 22 ورمًا في مجموعة MGB واستخدمنا هذه المصفوفة التعبيرية كمدخل لـ cNMF. حددنا 4,000 من أكثر الجينات المتغيرة باستخدام SCTransform، مع إرجاع محتوى الميتوكوندريا. قمنا بتقسيم المصفوفة لهذه الجينات وتم إخضاع المصفوفة الناتجة لبرنامج cNMF التوافقي v.1.0.4 (مرجع 24).
بالنسبة لوظيفة ‘تحضير’ CNMF، قمنا بإجراء التحليل على K يتراوح من 2-35. تأكدنا من أن جميع الجينات المتغيرة تم اعتبارها للتحليل باستخدام المعامل –numgenes 4000. كما قمنا بإجراء 500 تكرار من خلال إدخال –n-iter 500 في نص تحضير cNMF.كانت القيمة الأعلى مع درجة سيلويت أكبر من 0.8 وبالتالي تم اختيارها لبرنامج cNMF التوافقي. تم تشغيل cNMF بقيمة –local-density-threshold تبلغ 0.015
قمنا بتعليق كل برنامج على المخرجات النهائية gene_spectra لـ cNMF من خلال مقارنة أعلى 100 جين مع مجموعات الجينات المنشورة سابقًا والجينات المعروفة. استخدمنا gProfilerلتحديد درجات الثراء لمصفوفة مجموعة الجينات التي تم تنسيقها يدويًا مع أكثر من 600 مجموعة جينات (الجدول التكميلي 3). مكنتنا التكامل اليدوي لدرجات الثراء والجينات المعروفة من تحديد أسماء البرامج (الشكل البياني الممتد 1a). من الجدير بالذكر أن MGH720، وهو ورم تم تشخيصه نسيجيًا على أنه ورم دبقي عملاق، كان لديه برنامج خبيث فريد من نوعه cNMF.
ثم استخدمنا مخرجات طيف الجينات لبرامج cNMF لحساب استخدام هذه البرامج من قبل الخلايا في المجموعات المنشورة الأخرى وفي مكتبات GBO scRNA-seq. استخرجنا مصفوفة العد الخام بما في ذلك التقاطع بين الجينات المكتشفة في المجموعة وأعلى 4,000 جين متغير في مجموعة MGB. تم بعد ذلك إخضاع هذه المصفوفة لنص تحضير cNMF للتطبيع. تم تعيين معامل –numgenes إلى عدد الجينات في المصفوفة. استخدمنا sklearn decomposition.non_negative_factorization حيث X هي مصفوفة التعبير المصفاة والمطابقة وH هي مصفوفة طيف الجينات المصفاة. تم استخدام المعلمات التالية: n_components= 18، init = ‘عشوائي’، update_H=False، solver=’cd’، beta_loss=’frobenius’، tol, max_iter, alpha, alpha_W, alpha_H, ‘نفس الشيء’، l1_ratio, regularizationلا شيء، random_state=None، verbose, shuffle=False. الكود متاح على https://github.com/BernsteinLab/ الخلايا النخاعية-الورم الدبقي.
أخيرًا، تم تصنيف كل خلية كنوع خلية باستخدام ‘مصفوفة الاستخدام النهائية الناتجة عن cNMF أو مصفوفات الاستخدام المحسوبة، كما تم مناقشته أعلاه. تم تطبيع درجات الاستخدام إلى لكل خلية. لكل خلية، تم جمع درجات الاستخدام لجميع البرامج في كل فئة لإنشاء درجة استخدام لفئة نوع الخلية. على سبيل المثال، تم جمع درجات الاستخدام لأربعة برامج نخاعية لإنشاء استخدام نخاعي لكل خلية. ثم تم تصنيف الخلايا كواحدة من أنواع الخلايا باستخدام أعلى درجة استخدام لفئة نوع الخلية.
من الجدير بالذكر أن الخلايا الدائرية تم اعتبارها بشكل منفصل. استخدمنا inferCNV لتصنيف الخلايا الدائرية كخلايا خبيثة أو غير خبيثة. ثم تم تصنيف الخلايا غير الخبيثة بشكل إضافي بواسطة نوع الخلية التالي الأعلى. تم استخدام هذه التصنيفات الثانوية عند فصل أنواع الخلايا لمزيد من التحليل المحدد لنوع الخلية.
استنتاج CNA من بيانات الخلايا المفردة. اخترنا مجموعة من الخلايا المرجعية التي لم يتم تصنيفها كأي برنامج خبيث من أورام مختلفة
(مجموعة من الخلايا النخاعية، خلايا T، خلايا أوليجو وخلايا الأوعية الدموية). قمنا باستخراج ودمج العد الخام لهذه الخلايا المرجعية في مصفوفة واحدة. الخلايا المرجعية المستخدمة مذكورة في https://github.com/ BernsteinLab/Myeloid-Glioma. ثم استخدمنا حزمة inferCNV (inferCNV v.1.3.3 من مشروع Trinity CTAT؛ https://github.com/ broadinstitute/inferCNV). قمنا بإجراء التحليل لكل ورم بشكل منفصل. في ملف التسمية، قمنا بتضمين الخلايا المرجعية وصنفنا خلايا كل ورم، كما تم مناقشته أعلاه. قمنا بدمج المصفوفة الخام لكل ورم مع مصفوفة الخلايا المرجعية الخام. قمنا بإنشاء ملف ترتيب الجينات المطلوب لـ inferCNV باستخدام سكربت gtf_to_position_file.py من حزمة inferCNV. قمنا بتضمين المعلمات الإضافية التالية: –denoise –HMM –cluster_by_groups –cutoff 0.1. كما تأكدنا من أن –ref_group_names تتطابق مع الأسماء المعطاة للخلايا المرجعية في ملفات التسمية. تم إجراء اختيار الخلايا المرجعية بشكل منفصل لكل مجموعة.
كشف الزوجات. تم تحديد الزوجات باستخدام دمج بيانات cNMF وinferCNV. تم اعتبار الخلايا زوجات بواسطة cNMF إذا كانت تعبر عن برنامج ثانٍ فوق عتبة معينة (الجدول التكميلي 6). تم اختيار عتبات محددة لنوع الخلية من خلال تقسيمها حسب نوع الخلية، ثم رسم استخدام كل برنامج ثانٍ محتمل. من هذا الرسم، وجدنا القيمة التي تفصل استخدام البرنامج الثاني عن الزوجات. تم اعتبار الخلايا أيضًا زوجات إذا كانت تسمية cNMF الخاصة بها غير متوافقة مع ملف تعريف inferCNV. من الجدير بالذكر أن البرامج الدائرية لم تؤخذ بعين الاعتبار في تحليل الزوجات. يمكن العثور على وصف أكثر تفصيلًا لطرق التسمية وكشف الزوجات في https://github. com/BernsteinLab/Myeloid-Glioma/blob/main/Processing%20of%20 scRNA-Seq%20Files%20(Related%20to%20Figure%201)/15-%20Annotation%20and% 20Doublet%20Detection.pdf.
تعريف متكامل للخلايا الخبيثة. إذا كان الورم يحتوي على CNVs يمكن اكتشافها باستخدام inferCNV، كان يجب أن تلبي خلايا ذلك الورم المعايير التالية: غير زوجية، إيجابية لـ CNV وغير مصنفة كنوع خلية غير خبيث بواسطة برنامج cNMF. بالنسبة لتلك الأورام التي لم يكن من الممكن اكتشاف CNVs فيها بسهولة بواسطة inferCNV، اعتمدنا على التصنيفات المستندة إلى cNMF.
تحديدات برنامج الجينات. من أجل تحليل أكثر تفصيلًا لبرامج الخلايا لنوع خلية محدد (خلايا نخاعية، خلايا T أو خلايا خبيثة)، أخذنا الخلايا في كل فئة محددة وأزلنا الزوجات بناءً على الطريقة الموضحة في قسم ‘كشف الزوجات’ أعلاه. ثم أدخلنا تلك الخلايا التي تم تحديدها كخلايا مفردة في تحليل cNMF آخر لكل فئة.
الخلايا النخاعية. استخدمنا مجموعات MGB، مختبرات جاكسون ومجموعة ميثوديست لتحديد برامج cNMF في الخلايا النخاعية في الأورام الدبقية. تم إجراء cNMF في جولتين لكل مجموعة. تم استخدام الجولة الأولى لتحديد الخلايا باستخدام برامج ليست نخاعية (أي، لها هوية نوع خلية مختلفة) أو برامج استخدمها أقل من 100 خلية نخاعية. قمنا بإزالة مثل هذه الخلايا للتحليلات اللاحقة. تم استخدام الجولة الثانية لتحديد البرامج النخاعية.
في الجولة الأولى، تم استخدام العد الخام لجميع الخلايا المصنفة كخلايا نخاعية ومفردة (غير زوجية) من كل مجموعة لإنشاء كائن Seurat بشكل مستقل. ثم قمنا بتطبيع كائن Seurat باستخدام NormalizeData() وحددنا أعلى 2000 جين متغير بمتوسط تعبير أكبر من 0.001 في الخلايا المعبرة في كل مجموعة باستخدام FindVariableFeatures(). بعد ذلك، قمنا بإخراج المصفوفات الثلاث. تم إخضاع هذه المصفوفات بشكل منفصل لـ cNMF مع المعلمات التالية في سكربت التحضير: –n-iter 500 –total-workers 1 –seed 14 –numgenes 2000 . ثم قمنا بإجراء التحليل وعملنا الرسوم البيانية K باستخدام سكربتات factorize وcombine وk_selection_plot من cNMF. ثم اخترنا Ks التالية: MGB-22، Houston Methodist-23، مختبرات جاكسون – 14 . ثم قمنا بتنفيذ سكربت الإجماع مع Ks المذكورة أعلاه وعتبة كثافة محلية قدرها 0.02
في الجولة الثانية، قمنا بإزالة الخلايا من كل مجموعة كما تم مناقشته أعلاه وأنشأنا كائن Seurat مدمج من المصفوفات الثلاثة المنظفة باستخدام دالة Seurat merge(). ثم قمنا بتطبيع كائن Seurat المدمج واكتشفنا الجينات المتغيرة باستخدام NormalizeData() وFindVariableFeatures(). ثم قمنا بتصفية الجينات ذات قيمة تعبير متوسطة أقل من 0.01 في الخلايا المعبرة وموحدات التباين أقل من 1 . ثم قمنا بتصفية مصفوفة النخاع المنظفة لكل مجموعة لتشمل الجينات المتغيرة التي تلبي المعايير المذكورة أعلاه. مشابهة للجولة الأولى، تم إخضاع هذه المصفوفات لـ cNMF بشكل فردي مع المعلمات التالية في سكربت التحضير: –n-iter 500 –total-workers 1 -seed 14 –numgenes 2276 . ثم قمنا أيضًا بتشغيل التحليل وعملنا الرسوم البيانية K باستخدام سكربتات factorize وcombine وk_selection_plot من cNMF. ثم اخترنا Ks التالية في الجولة الثانية: MGB – 18 (قمنا بتصفية البرامج التي ليست نخاعية)، Houston Methodist-19، مختبرات جاكسون – 18. أخيرًا، قمنا بتنفيذ سكربت الإجماع مع Ks المذكورة أعلاه وعتبة كثافة محلية قدرها 0.02 .
لإيجاد البرامج المتوافقة، قمنا بإجراء تشابه جيب التمام لمخرجات ‘dt’ من كل مجموعة اكتشاف من الجولة 2 من cNMF. طبقنا خوارزمية التجميع الهرمي المسماة طريقة وارد على مصفوفة التشابه لتصور العلاقات بين البرامج في خريطة حرارية. لاشتقاق درجات الطيف للبرامج المتوافقة، قمنا بمتوسط درجات الطيف dt للبرامج التي لديها درجة تشابه جيب التمام 0.5 أو أعلى. أسفر ذلك عن 14 برنامجًا متوافقًا نخاعي عبر 3 مجموعات، والتي قمنا بتصنيفها كما تم مناقشته أعلاه.
الخلايا الخبيثة وخلايا T. تم الحصول على الخلايا الخبيثة وخلايا T من بيانات MGB في عمليات cNMF منفصلة، مشابهة لعملية cNMF ذات الخطوتين المستخدمة للخلايا النخاعية. اخترنا قيمة K قدرها 7 للخلايا الخبيثة بناءً على استقرار مخطط السيلويت، بما يتماشى مع التوقيعات المنشورة سابقًا للورم الدبقي التي تم تمثيلها في برامجنا الخمسة المختارة . بالنسبة لخلايا T، وجدنا أن العدد الأمثل للبرامج هو 4 . قمنا بحساب استخدام هذه البرامج في المجموعات الأخرى بطريقة مشابهة لنموذج NMF لجميع أنواع الخلايا المذكور أعلاه.
معالجة وNMF لمكتبات scRNA-seq لـ PBMC. تم معالجة مكتبات PBMC لـ cNMF بطريقة مشابهة لمكتبات الأورام الأولية. قمنا بدمج مصفوفة التعبير لجميع مكتبات PBMC باستخدام دالة Seurat merge. ثم تم تطبيع كائن Seurat باستخدام NormalizeData() وScaleData(). ثم استخدمنا FindVariableFeatures() لحساب درجة التباين لكل جين. اخترنا أعلى 3000 جين متغير بعد إزالة الجينات ذات تعبير أقل من 0.001 (في الخلايا المعبرة) ثم قمنا بتقسيم مصفوفة تعبير الجين لتشمل فقط الجينات المتغيرة. كما هو موضح أعلاه، تم إجراء cNMF مع –numgenes 3000 وقيمة بالنسبة لسيناريو التوافق لـ cNMF، تم إجراء التوصيف باستخدام gProfiler، وتم تحديد الخلايا غير المزدوجة. قمنا بعزل الخلايا النخاعية، وحددنا أعلى 2000 جين الأكثر تباينًا، وأجرينا جولتين من cNMF..
حساب استخدام برامج النخاع. قمنا باستخراج مصفوفة العد الخام التي تتضمن التقاطع بين الجينات المكتشفة في مصفوفة GBO أو أنواع الأورام الأخرى من المصفوفات والجينات الموجودة في ملف طيف جينات برامج خلايا النخاع. ثم خضعت هذه المصفوفة لبرنامج التحضير cNMF للتطبيع. تم تعيين معلمة –numgenes إلى عدد الجينات في المصفوفة. استخدمنا تحليل العوامل غير السلبية من sklearn حيث X هي مصفوفة التعبير المنقاة والمطابقة وH هي مصفوفة طيف الجينات المنقاة. تم استخدام المعلمات التالية: n_components= 14، init=’random’، update_H=False، solver=’cd’، beta_loss=’frobenius’، tol، max_iter، ألفا=0.0، ألفا_W=0.0، ألفا_H=’نفس الشيء’، نسبة_l1التنظيملا شيء، حالة عشوائيةلا شيء، مطول، shuffle=False. الكود متاح علىhttps://github.com/Bernstein-Lab/Myeloid-Glioma.
تم تطبيع درجات الاستخدام إلىلكل خلية.
مقارنة برامج الجينات. لتقييم التشابه بين برنامجين جينيين معينين، أخذنا أفضل 100 جين في تلك البرامج وقارنّا تكوينها باستخدام مؤشر جاكارد.تم قياس القيم من خلال تقييم احتمال الحصول على تطابقات الجينات الملحوظة عن طريق الصدفة باستخدام اختبار ثنائي الحدين حيث هو عدد المباريات، هو حجم مجموعة الجينات، و هي احتمالية سحب مباريات عشوائيًا من جميع الجينات المسجلة في البرنامج.
تحليل مقارن لـ UMAP وتجمع خلايا النخاع. قمنا باستخراج العد الخام لجميع خلايا MGB الموصوفة على أنها نخاعية وفردية (غير مزدوجة) من كل ورم. ثم تم إجراء التطبيع لكل ورم على حدة باستخدام NormalizeData() مع الإعدادات الافتراضية، تلاها FindVariableGenes() مع الإعدادات التالية (selection.method = vst، nfeatures = 2,000). ثم قمنا بتشغيل FindIntegrationAnchors() مع تعيين k.filter على 30 (لضمان تضمين الأورام التي تحتوي على عدد قليل من خلايا النخاع). ثم استخدمنا المراسي المحددة كمدخل لتصحيح الدفعات باستخدام IntegrateData()، مع تعيين features.to.integrate كالتقاطع بين الجينات المكتشفة في جميع الأورام وdims إلى 1:30.
تم بعد ذلك إخضاع كائن Seurat المصحح دفعةً لـ ScaleData() و RunPCA() و ElbowPlot() مع المعلمات الافتراضية لتحديد عدد الأبعاد التي سيتم استخدامها لتجميع لوفيان وتوليد UMAP. قمنا بتوليد UMAP باستخدام RunUMAP() مع تعيين الأبعاد إلىوتم تعيين التخفيضات إلى PCA. قمنا بتنفيذ التجميع باستخدام FindNeighbors() مع تعيين الأبعاد إلى 1:8، تلاها FindClusters() بدقة 0.3. تم إنشاء UMAPs باستخدام دالة DimPlot().
توليد خريطة حرارية لبرامج التعبير الجيني. لتوليد خريطة التعبير الجيني لبرامج NMF، قمنا بتصنيف خلايا النخاع إلى واحدة من الفئات التالية: الميكروغليا. كان هناك استخدام أدنى بنسبة 10% لبرنامج الميكروغليا وكانت جميع برامج الهوية الأخرى أقل من قيمة استخدام برنامج الميكروغليا (يجب أن تكون البلعميات أقل من ). شبيهة بالميكروغليا. كان هناك استخدام أدنى بنسبة 10% للميكروغليا و10% لبرنامج المونوسيتات أو الماكروفاجات. يجب أن تكون البرامج الهوية الأخرى أقل من قيمة الاستخدام لهذين البرنامجين (وإلا سيتم تصنيفها كميكروغليا). البلاعم. كان هناك استخدام أدنى بنسبة 10% لبرنامج البلاعم وكانت البرامج الأخرى المتعلقة بالهوية جميعها أقل من قيمة استخدام برنامج البلاعم (وحيدات النواة أقل من 10%). مونو_ماكرو. كان هناك استخدام أدنى بنسبة 10% من البلعميات واستخدام برنامج المونوسيتات. كانت برامج الهوية الأخرى أقل من قيمة الاستخدام لهذين البرنامجين. الخلايا الوحيدة. كان هناك استخدام أدنى بنسبة 10% لبرنامج البلعميات وكانت البرامج الأخرى أقل من قيمة استخدام برنامج الخلايا الوحيدة. cDC. كان هناك استخدام أدنى بنسبة 10% لبرنامج cDC وكانت البرامج الأخرى المتعلقة بالهوية جميعها أقل من قيمة استخدام برنامج cDC. العدلات. كان هناك استخدام أدنى بنسبة 10% لبرنامج العدلات وكانت البرامج الأخرى المتعلقة بالهوية جميعها أقل من قيمة استخدام برنامج العدلات. النشاط هيمن. كانت جميع برامج الهوية أدنى منالاستخدام. لاختيار الجينات المدرجة في خرائط الحرارة، حددنا أفضل 100 جين في مخرجات طيف الجينات المتوسطة لبرامج cNMF النخاعية لكل برنامج. قمنا بعدّ عدد خلايا النخاع التي تعبر عن أفضل 100 جين في كل برنامج. قمنا بتضمين أفضل 20 جينًا بأعلى عدد من خلايا النخاع التي تعبر عنها في كل برنامج.
استخدمنا مكتبة ComplexHeatmap فيلإنشاء خرائط الحرارة. نحن-تم قياس القيم المعبر عنها للجينات المنطقية المنضبطة عبر جميع خلايا النخاع (بغض النظر عن التصنيف). ثم قمنا بتحديد حد أعلى قدره 2 وحد أدنى قدره -1. قمنا بإنشاء خريطة حرارية لكل فئة على حدة. قمنا بإيقاف تجميع الصفوف (الجينات) عن طريق تعيين cluster_rows = FALSE في دالة الخريطة الحرارية، وسمحنا بتجميع الأعمدة الافتراضي في كل فئة (الخلايا).
توليد مخططات الربع. قمنا برسم 183,062 خلية نقي من 85 ورمًا بناءً على تعبيرها عن البرامج الأربعة المناعية، مع توجيه البرامج الالتهابية والمثبطة للمناعة بشكل كبير في الاتجاهات المعاكسة على نفس المحاور.تم حساب محور مخططات الربع (من الأسفل اليسار إلى الأعلى اليمين) عن طريق طرح استخدام برنامج المناعة المثبطة المكمل من البرنامج النظامي المؤيد للالتهابات.تم حساب المحور (من أعلى اليسار إلى أسفل اليمين) عن طريق طرح استخدام برنامج المناعة المثبطة للمتغذيات من برنامج الالتهاب الميكروغليالي لكل خلية نقيّة. تم تحويل الإحداثيات الناتجة باستخداممصفوفة الدوران. بالنسبة لرسم الربع مع الفطائر المتناثرة كنقاط، استخدمنا مكتبة scatterpie (https://github.com/GuangchuangYu/scatterpieتم حساب فئة ‘الآخرين’ في مخططات الدائرة عن طريق جمع استخدامات جميع البرامج باستثناء البرامج الأربعة المناعية.
تحديد قيم الاستخدام الحدية للخلايا النخاعية. لتحديد عتبة القطع لبرامج الهوية النخاعية في الأورام الأولية، أنشأنا مخطط الكوع لتحليل قيم الاستخدام لكل برنامج هوية نخاعية cNMF. استنادًا إلى نتائجنا، حددنا نقطة الانعطاف الدنيا لبرنامج الهوية عند حواليوحدد مستوى القطع عندالاستخدام. وبالمثل، لاحظنا أن نقطة الانعطاف الدنيا تقريبًالبرامج النشاط، مما يقودنا لاختياراستخدامه كحد قطع. يمكن تصنيف خلية واحدة من الخلايا النخاعية باستخدام برامج متعددة. على سبيل المثال، يمكن اعتبار خلية نخاعية على أنها ميكروغليا باستخدام برنامج المناعة المثبطة للسموم إذا كانت تحتوي على على الأقلاستخدام برنامج الميكروغليا واستخدام برنامج المناعة المثبطة للمت scavenger. تم استخدام هذه الحدود في الشكل 1d والأشكال الإضافية 1e و8b. بالنسبة للشكل الإضافي 2d، قمنا بحساب النسب الملاحظة/المتوقعة لتزامن برنامج الهوية النخاعي وبرنامج النشاط النخاعي واستخدمنا اختبار هايبرجومتريك لتقييم الأهمية.
بالنسبة لـ GBOs، كجزء من تحسين النموذج، حددنا نقاط الانعطاف لبرامج النشاط في خلايا النخاع. لاحظنا أن نقاط الانعطاف كانت تقريبًالبرامج النشاط، مما يقودنا لاختيارالاستخدام كحد قطع في تجارب GBO. تم استخدام هذه الحدود لجميع تحليلات scRNA-seq في GBO، كما هو موضح في الشكل 5d والشكل الإضافي 12a.
تحديد دقيق لخلايا النخاع الشوكي وخلايا T. التحليلات المحددة (MAESTER، الشكل 5 من البيانات الموسعة؛ وتوليد خريطة حرارية، الشكل 1c) تتطلب تحديدًا دقيقًا لخلايا النخاع الشوكي بدلاً من الاكتفاء بالنظر فيما إذا كانت خلايا النخاع الشوكي تستخدم برنامجًا معينًا أم لا. تم ذكر الحدود الدنيا لهذه التحليلات في أقسامها المعنية.
كانت استخدامات برنامج خلايا T أكثر تميزًا. لذلك قمنا ببساطة بتعريفها من خلال البرنامج الأكثر استخدامًا لها.
إنشاء مصفوفة متقطعة وتحديد جينات العلامة. لتمكين اكتشاف علامات محددة وفك تشفير الخلايا المكانية كما هو موضح أدناه، قمنا بإنشاء مصفوفة متقطعة لخلايا MGB مع أقوى تعبير لكل برنامج خلية ورمية، بما في ذلك البرامج المايلويدية، وبرامج خلايا T والسرطان، مما استبعد الخلايا المتوسطة. بالنسبة لمخرجات cNMFs الخاصة بالمايلويد، والسرطانية، وخلايا T، تم تصنيف الخلايا التي لديها استخدام أعلى بمقدار 2.5 مرة على الأقل لبرنامج معين مقارنة بالبرنامج الثاني الأكثر استخدامًا كخلايا منفصلة. بالنسبة للخلايا الدبقية والأوعية الدموية، تم استخدام الاستخدامات من جميع أنواع خلايا مخرجات cNMF لتصنيف خلايا الدبقية أو الأوعية الدموية المنفصلة. تم استبعاد الخلايا المزدوجة، والبرامج الدورية، والخلايا الدورية من التحليل.
علاوة على ذلك، قمنا بتنزيل بيانات تسلسل RNA أحادي الخلية (scRNA-seq) من أنسجة الدماغ الطبيعية من أفراد تتراوح أعمارهم بين 25 و40 عامًا.تم معالجة هذه المكتبات باستخدام معالجة Seurat المذكورة أعلاه؛ قمنا بتطبيع الخلايا واستخدمنا 1:14 كأبعاد لتوليد UMAPs وتحديد المجموعات. قمنا بتنفيذ FindMarkers واستخرجنا الخلايا العصبية والخلايا النجمية من المصفوفة المنشورة بناءً على الجينات المعبر عنها بشكل مختلف. ثم قمنا بدمج هذه الخلايا مع مصفوفة الخلايا المنفصلة. قمنا بتوليد UMAP كما هو موضح أعلاه.
لتحديد العلامات لبرامج المناعية المعدلة، قمنا باستخراج خلايا منفصلة تم توضيحها على أنها مثبطة للمناعة من نوع الكاسح، مثبطة للمناعة من نوع المكمل، التهابية نظامية أو التهابية ميكروغليالية باستخدام دالة Seurat subset() (كائن المناعة المعدلة المايلويد المنفصل). تم تنفيذ خط معالجة مماثل مع تعيين الخيار dims إلى 1:16 في FindNeighbors() و FindClusters(). تم الحصول على إحداثيات UMAP لهذه الخلايا باستخدام Embeddings() مع تعيين الخيار reduction إلى umap. ثم تم استخراج المصفوفة المنضبطة لهذه الخلايا باستخدام دالة GetAssayData() مع تعيين الخيار slot إلى data. تم استخدام هذه الملفات كمدخلات لـ COMET.لتحديد العلامات المهمة التي تميز كل برنامج مناعي. كما استخدمنا دالة Seurat DotPlot() لإنشاء الرسوم البيانية لنقاط التعبير الموضحة في الشكل الإضافي 10c.
تحليل الريغولون. استخدمنا مصفوفة التعبير المناعي المعياري المنفصل للخلية النخاعية كمدخل لـ SCENIC. لقد قمنا أيضًا بتنزيل ملفات الريشة hg38_10kbp_up_10kbp_down_full_tx_v10_clust.genes_vs_motifs.rankings.feather و hg38_500bp_up_100bp_down_full_tx_v10_clust.genes_vs_motifs.rankings.feather من https:// resources.aertslab.org/cistarget/databases/homo_sapiens/hg38/ refseq_r80/mc_v10_clust/gene_based واستخدمناها كمدخلات لـ SCENIC. تم تصفية الجينات في المصفوفة بناءً على الإعدادات الافتراضية، وقمنا بتشغيل الخطوات الأربع runSCENIC_1_coexNetwork2modules، runSCENIC_2_createRegulons، runSCENIC_3_scoreCells(scenicOptions, exprMat_filtered) و runSCENIC_4_aucell_binarize. لحساب درجة خصوصية التنظيم لكل تنظيم في كل توصيف مناعي، استخدمنا الدالة calculate_rrs() من scFunction (https:// github.com/FloWuenne/scFunctions/). يمكن العثور على الرموز الكاملة في https://github.com/BernsteinLab/Myeloid-Glioma.
تحليل MAESTER لتحديد أصل الخلايا النخاعية. لتحديد أصول الهويات المختلفة للخلايا النخاعية، قمنا بمعالجة مكتبات MAESTER على ثلاث مراحل: المعالجة المسبقة، تحديد المتغيرات ذات الاهتمام، وقياس الثراء للمتغيرات المحددة في الهويات النخاعية المختلفة.
المرحلة 1: المعالجة المسبقة. تم إجراء المعالجة المسبقة كما تم وصفه سابقًا.باختصار، قمنا بتقليص القراءات عالية الجودة، وقمنا بمحاذاتها باستخدام STAR (hg38) ومعالجتها باستخدام MAEGATK مع الإعدادات الافتراضية باستثناء – -min-reads، التي تم تعيينها على 3 لضمان وجود حد أدنى من ثلاث قراءات لتغطية القاعدة في الخلية..
المرحلة 2: تجميع زائف منخفض الدقة لتحديد المتغيرات ذات الاهتمام. لتحديد أصل هويات الخلايا النخاعية، حددنا المتغيرات الخاصة بالخلايا النخاعية في بيئة الورم ولكنها غير موجودة في خلايا الدم المحيطية. كما حددنا المتغيرات الموجودة في الخلايا النخاعية في خلايا الدم المحيطية ولكنها غائبة في بيئة الورم. قمنا بتجميع المكتبات الورمية الأولية إلى الفئات التالية وفقًا لتصنيف تسلسل RNA الخاص بها. بالنسبة لمكتبات الورم الأولية، تم تصنيفها إلى خبيث، وخلايا نخاعية مرتبطة بالورم (TAMs)، ونسج، وأوليغو، وخلايا T، وبالنسبة لمكتبات خلايا الدم المحيطية، اعتبرنا فقط العدلات والوحيدات (Myeloid_PBMCs). تضمنت هذه المرحلة خطوات متعددة.
الخطوة 1: قمنا باستخراج عدد UMIs التي تدعم كل متغير ممكن في كل موقع ممكن من مخرجات MAEGATK باستخدام البرنامج النصي التالي في R:
أنشأ computeAFMutMatrix مصفوفة تكون فيها الصفوف كل متغير ممكن في الجينوم الميتوكوندري، والأعمدة هي الرموز الشريطية (الخلايا). تمثل القيم وحدات التمييز الفريدة (UMIs) التي تدعم كل متغير في الرمز الشريطي المعطى.
الخطوة 2: قمنا باستخراج تغطية مكتبات الميستر في كل قاعدة من جينوم MT في كل خلية من مخرجات MAEGATK، التي تم تخزينها في assays(maegatk.rse)[[coverage]]، حيث أن maegatk.rse هو كائن R الناتج عن MAEGATK.
الخطوة 3: قمنا بتعليق الخلايا في كل مصفوفة (المستمدة من الخطوة 1 والخطوة 2) بناءً على مكتبة scRNA-seq (كما هو مذكور في قسم ‘تصنيف أنواع الخلايا’). أنشأنا إطار بيانات يحتوي على عمود واحد يحتوي على الرموز الشريطية والعمود الآخر يحتوي على التعليق.
الخطوة 4: قمنا بتجميع مصفوفة عدد UMI (المستخرجة من الخطوة 1) باستخداممع الخطوات التالية: قمنا بتقسيم المصفوفة إلى كل تعليق باستخدام تيبل؛ استخدمنا دالة sum() لجمع جميع الصفوف في كل مصفوفة، مما أنشأ رقمًا مزيفًا لكل تعليق؛ وقمنا بدمج جميع القيم المجمعة في كل مصفوفة لكل احتمال متغير في مصفوفة مزيفة حيث تمثل كل عمود تعليقًا.
الخطوة 5: قمنا بتجميع مصفوفة التغطية (المستخرجة من الخطوة 2) بطريقة مشابهة للخطوة 4.
الخطوة 6: قمنا بحساب ترددات الأليلات المتغيرة المجمعة (VAFs) باستخدام R. أضفنا عددًا زائفًا 0.000001 إلى كل قيمة في مصفوفة التغطية المجمعة. قسمنا كل قيمة في مصفوفة العد المجمعة على تغطيتها في مصفوفة التغطية المجمعة للحصول على VAFs المجمعة لكل فئة.
الخطوة 7: لضمان خصوصية اكتشاف كل متغير بنسبة 99%، استخدمنا نموذج ثنائي لتحديد حد أدنى لنسبة تردد المتغيرات (VAF) يعتمد على التغطية.
الخطوة 8: للنظر في المتغير على أنه محدد لخلايا النخاع العظمي في بيئة الورم الدقيقة، كان يجب أن يستوفي المتغير المعايير التالية: الحد الأدنى من متطلبات VAF لخلايا TAMs لتغطيات فئات TAMs و Myeloid_PBMC؛ VAF = 0 في فئة PBMC النخاع العظمي؛ و VAF > الحد الأدنى المطلوب في فئة TAM.
الخطوة 9: لتحديد المتغيرات الخاصة بالخلايا النخاعية في PBMCs، كان يجب أن يلبي المتغير المعايير التالية: أولاً، كان يجب أن يحقق الحد الأدنى من متطلبات VAF لـ Myeloid_PBMC للتغطيات في فئات الأورام الخبيثة، TAMs و Myeloid_PBMC؛ ثانياً، VAF = 0 في فئة الأورام الخبيثة (إذا كانت مكتبة الورم غنية بالخلايا الخبيثة، يمكن استبدال هذا المعيار بـ VAF في Myeloid_PBMC، والذي يكون أكبر بـ 20 مرة من الأورام الخبيثة)؛ ثالثاً، VAF > 0 في فئة TAM؛ ورابعاً، VAF > الحد الأدنى المطلوب في فئة Myeloid_PBMC. يمكن العثور على الطفرات المستخدمة في التحليلات اللاحقة في الجدول التكميلية 7.
المرحلة 3: تحديد تركيز المتغيرات المثيرة للاهتمام في هويات مختلفة من خلايا النخاع.
افترضنا أن الخلايا النخاعية الغنية بالمتغيرات المحددة لبيئة الورم كانت مقيمة في الأنسجة، في حين أن تلك الغنية بالمتغيرات المحددة لخلايا الدم المحيطية كانت مشتقة من وحيدات الدم. كان إجراء تحليل الإثراء يتضمن عدة مراحل. بدأنا بتعليق TAMs باستخدام برامج الهوية النخاعية cNMF. احتفظنا بالخلايا التي استوفت المعايير التالية لضمان موثوقية الهوية والنتائج: لتعليق الخلايا الدبقية الصغيرة: أولاً، يجب أن تحتوي الخلية على حد أدنى مناستخدام برنامج الميكروغليا؛ ثانياً، يجب أن يكون برنامج الميكروغليا مرتفعاً على الأقل بمقدار الضعف مقارنة بأي برنامج هوية آخر؛ وثالثاً، يجب أن يكون برنامج البلعميات منخفضاً على الأقل بمقدار الضعف مقارنة بأي برنامج هوية آخر.
لتعليق Microglia_Like: أولاً، يجب أن تحتوي الخلية على حد أدنى من استخدام برنامج الميكروغليا؛ ثانياً، يجب أن تحتوي الخلية على حد أدنى من استخدام برنامج البلعميات؛ ثالثاً، يجب أن يكون برنامج الميكروغليا مرتفعاً على الأقل بمقدار الضعف مقارنة بأي برنامج هوية آخر (باستثناء البلعميات والوحيدات)؛ ورابعاً، يجب أن يكون برنامج البلعميات مرتفعاً على الأقل بمقدار الضعف مقارنة بأي برنامج هوية آخر (باستثناء الميكروغليا والوحيدات).
لتعليق Mono_Macro: أولاً، يجب أن تحتوي الخلية على حد أدنى من استخدام برنامج الوحيدات؛ ثانياً، يجب أن تحتوي الخلية على حد أدنى من 10% استخدام لبرنامج البلعميات؛ ثالثاً، يجب أن يكون برنامج الوحيدات مرتفعاً على الأقل بمقدار الضعف مقارنة بأي برنامج هوية آخر (باستثناء البلعميات)؛ ورابعاً، يجب أن يكون برنامج البلعميات مرتفعاً على الأقل بمقدار الضعف مقارنة بأي برنامج هوية آخر (باستثناء الوحيدات).
لتعليق البلعميات: أولاً، يجب أن تحتوي الخلية على حد أدنى من استخدام برنامج البلعميات؛ ثانياً، يجب أن يكون برنامج البلعميات مرتفعاً على الأقل بمقدار الضعف مقارنة بأي برنامج هوية آخر؛ ثالثاً، يجب أن يكون برنامج الوحيدات مرتفعاً على الأقل بمقدار الضعف مقارنة بأي برنامج هوية آخر؛ ورابعاً، يجب أن يكون برنامج الميكروغليا مرتفعاً على الأقل بمقدار الضعف مقارنة بأي برنامج هوية آخر.
لتعليق الوحيدات: أولاً، يجب أن تحتوي الخلية على حد أدنى من استخدام برنامج الوحيدات؛ ثانياً، يجب أن يكون برنامج الوحيدات مرتفعاً على الأقل بمقدار الضعف مقارنة بأي برنامج هوية آخر؛ وثالثاً، يجب أن يكون برنامج البلعميات مرتفعاً على الأقل بمقدار الضعف مقارنة بأي برنامج هوية آخر.
لتعليق العدلات: أولاً، يجب أن تحتوي الخلية على حد أدنى من 15% استخدام لبرنامج العدلات؛ وثانياً، يجب أن يكون برنامج العدلات مرتفعاً على الأقل بمقدار الضعف مقارنة بأي برنامج هوية آخر.
لتعليق cDC: أولاً، يجب أن تحتوي الخلية على حد أدنى من استخدام برنامج cDC؛ وثانياً، يجب أن يكون برنامج cDC مرتفعاً على الأقل بمقدار الضعف مقارنة بأي برنامج هوية آخر.
قمنا بتقسيم مصفوفة MAESTER UMI للخلايا المفردة التي تم الحصول عليها في المرحلة 2، الخطوة 1 إلى مصفوفات أصغر، حيث تتكون كل مصفوفة من خلايا تم التعليق عليها بأحد الهويات المذكورة أعلاه (المرحلة 3، الخطوة 1).
قمنا بإنشاء مصفوفة تكون فيها الصفوف هي المتغيرات ذات الاهتمام التي تم تحديدها في المرحلة 3، وتمثل كل عمود هوية. القيم في هذه المصفوفة تشير إلى عدد الخلايا في كل هوية تم اكتشاف المتغير فيها. استخدمنا annotation_matrix[,apply(annotation_matrix,2,function(x) sum(x > 0))] في R لكل مصفوفة مقسمة. يحتفظ هذا السكربت بالأعمدة التي تحتوي على UMI . ثم حددنا عدد الخلايا التي كانت UMI > O لكل تعليق باستخدام ncol(as.matrix(annotation_matrix))، حيث تمثل annotation_matrix كل مصفوفة مقسمة.
ثم قمنا بإزالة أي متغير له قيمة صفر في كل فئة مدمجة.
قمنا بإزالة أي هوية (عمود) كان لديها أقل من عشرة قيم إجمالية لضمان نتائج إثراء صحيحة.
استخدمنا GSVA عن طريق تصنيف صفوف المصفوفة كخاصة بـ PBMC أو خاصة ببيئة الورم. لأن القيم هي أعداد صحيحة (عدد الخلايا التي تحتوي على UMIs تدعم المتغيرات)، قمنا بتعيين الخيار kcdf إلى Poisson في سكربت gsva.
ثم قمنا بطرح إثراء GSVA للمتغيرات الخاصة ببيئة الورم من إثراء GSVA للمتغيرات الخاصة بـ PBMC لكل هوية. تشير القيم الإيجابية إلى أصل PBMC، بينما تشير القيم السلبية إلى أصل مقيم في الأنسجة.
قمنا بحساب انتشار كل هوية في كل ورم. قمنا برسم مخططات النقاط مع موضع النقاط يمثل قيم إثراء GSVA المخصومة، وحجم النقطة يمثل الانتشار باستخدام ggplot2.
قمنا بحساب متوسط نسبة استخدام البرامج المناعية الأربعة في كل هوية، وسمينا النسبة المتبقية كـ ‘أخرى’ في كل ورم، ورسمناها كمخططات شريطية مكدسة باستخدام ggplot2.
تحليل الارتباط على مستوى العينة. لقياس الارتباط بين الحالات، حددنا متوسط استخدام برامج النخاع، وخلايا T، والسرطان في خلاياهم المعنية في كل عينة. استخدمنا ارتباط سبيرمان لفهم كيف أن ارتفاع حالة نخاع واحدة يتوافق مع تغييرات في حالات السرطان أو خلايا T، مما يمكننا من فحص كيف يمكن أن تؤثر التغيرات في حالة واحدة على سلوك الآخرين في نفس العينة.
في تحليل ارتباطات الحالة السريرية/الجزيئية لدينا، طبقنا متوسطات حالة العينة المستمدة أعلاه. تم مقارنتها عبر
فئات سريرية وجزيئية مختلفة، مثل درجة الورم، حالة طفرة IDH واستخدام الستيرويد، باستخدام اختبار ويلكوكسون للرتب.
لأخذ تأثير نقص الأكسجين في العينة في الاعتبار على تأثير الديكساميثازون على برنامج المناعة المثبطة للنخاع، قمنا بتقييد هذا التحليل إلى العينات التي كان فيها متوسط استخدام برنامج MES2 في خلايا السرطان أقل من .
استخدمنا تحليل الانحدار الخطي الأقل تربيعاً للتحقيق في التغيرات في متوسط استخدام برنامج النخاع عبر العينات بالنسبة للجرعة اليومية من Dex.
لتقييم ارتباطات برنامج النخاع والسرطان مع الخلايا، قمنا بتصنيف كل عينة في أعلى وأدنى معبري الخلايا واستخدامات برنامج السرطان/النخاع واستخدمنا اختبار فيشر الدقيق لقياس هذا الارتباط. -تم تعديل القيم باستخدام FDR.
تحليل دورة الخلية. قمنا بتقييم العلاقة بين دورة الخلية وحالات خلايا النخاع المختلفة في كل عينة بشكل مستقل. تم تعريف الخلايا على أنها في دورة إذا تجاوز الاستخدام المشترك لبرامج G1S وG2M ، واعتبرت تنتمي إلى حالة معينة إذا تجاوز استخدامها . استخدمنا اختبار فيشر الدقيق لقياس هذا الارتباط وحصلنا على نسبة الأرجحية. لكل برنامج، قمنا بتقييم احتمال أن يكون توزيع عينته أعلى من 1 باستخدام اختبار عينة واحدة -على القيم المحولة لوغاريتمياً، بحيث كانت موزعة تقريباً بشكل طبيعي .
فك تشفير TCGA وGLASS وG-SAM. تتكون أنبوب التحليل من ثلاث خطوات لفك تشفير مجموعات التعبير الكثيفة للورم التي تم نشرها سابقاً. تم تنفيذ الخطوتين 2 و3 من الأنبوب لكل مجموعة بيانات بشكل منفصل.
الخطوة 1: إنشاء مجموعات الجينات لكل برنامج. تم الحصول على أفضل 50 جين لكل برنامج نخاع من خلال ترتيبها في مخرجات طيف الجينات المدمجة. بالنسبة لخلايا T والخلايا الخبيثة، قمنا بترتيب طيف الجينات من مخرجات cNMF الخاصة بهم للحصول على أفضل 50 جين لكل برنامج. بالنسبة لأنواع الخلايا الأخرى، استخدمنا مخرجات طيف الجينات من cNMF لجميع الخلايا في بيئة الورم. قمنا بترتيب وحصلنا على أفضل 50 جين لبرامج الخلايا المحيطية، والأوعية الدموية، والأوليغو. ثم اخترنا الجينات التي ظهرت فقط في قائمة برنامج واحد.
الخطوة 2: حساب درجات الوحدة باستخدام Seurat. تم الحصول على عدد الجينات الخام لمجموعات بيانات الورم الدبقي. ثم تم تطبيع المصفوفات باستخدام دالة DGEList() وcalcNormFactors() وcpm() من EdgeR . ثم تم تحويل المصفوفة المطبعة باستخدام دالة في R. بعد ذلك، تم إنشاء كائنات Seurat باستخدام دالة CreateSeuratObject(). تم توسيع كائنات Seurat باستخدام ScaleData(). أخيراً، تم حساب درجات الوحدة باستخدام دالة AddModuleScore() من Seurat. تم استخدام مجموعات الجينات المذكورة أعلاه كمدخلات في خيار الميزات لـ AddModuleScore().
الخطوة 3: تطبيع درجة الوحدة. لتصحيح الفروق في النقاء في مجموعات بيانات التعبير الكثيف للورم الدبقي المنشورة، قمنا بتقدير النسب المئوية للخلايا الخبيثة، والأوليغو، والأوعية الدموية، والنخاع، وخلايا T وغيرها من الخلايا المناعية في مصفوفات التعبير الكثيف باستخدام CIBERSORTx . كمدخل، استخدمنا المصفوفة المقطعة الموضحة أعلاه، مستثنين الخلايا العصبية والأستروcytes. تم استخدام المصفوفة كمرجع للخلايا المفردة في وحدة الكسور من CIBERSORTx. تم أيضاً تطبيع مصفوفات التعبير الجيني الكثيف المنشورة كمدخل ‘مزيج’ دون تحويل لوغاريتمي. ثم تم تقسيم درجات الوحدة التي تم الحصول عليها أعلاه على القيمة المقدرة لنوع الخلية المعني في نتائج CIBERSORTx.
تم استخدام هذه الدرجات الموحدة للوحدات بعد ذلك للربط مع بيانات سريرية عينة، بما في ذلك حالة طفرات IDH والدرجة الجزيئية. للربط مع البيانات السريرية، كانت درجات الوحدات الموحدةتم تحويلها. قمنا بإزالة المكتبات التي كانت قيمتها في CIBERSORTx أقل من 0.1 للخلايا النخاعية. لربط درجات الوحدة بمستويات التعبير عن اللجندات المحددة في مجموعات TCGA للورم الدبقي منخفض الدرجة والورم الدبقي متعدد الأشكال، قمنا بإجراء ارتباط بيرسون. بين درجة الوحدة المنسوخة المنطقية المحولة لوغاريتميًا والتعبير المنسوخ المنطقية المحولة لوغاريتميًا. استخدمنا اختبار ويلكوكسون لمجموع الرتب لتقييم الأهمية الإحصائية، مع تعديل-القيم باستخدام FDR.
تحليل النسخ الجيني المكاني. استخدمنا النسخ الجيني المكاني في فيزيوم لتحليل 23 عينة.شملت منهجيتنا نهجين متميزين: اكتشاف الفئات غير المتحيزة باستخدام cNMF؛ وفك تشفير حالة الخلية باستخدام RCTD.وبرامج تسلسل RNA أحادي الخلية.
في اكتشاف الفئات غير المتحيزة، استخدمنا جميع العينات، سواء كانت صحية أو سرطانية، لتحليل cNMF. اخترنا 1500 من أفضل الجينات المتغيرة مكانيًا بناءً على مقياس موران.وقام بتشغيل خوارزمية cNMF منإلىالمثالي قيمة ( تم تحديده كالأعلى مع درجة ظل أكبر من 0.9. قمنا بتعريف هوية البرامج المتخصصة من خلال تحليل أنماط التعبير الجيني واستبعدنا البرنامج الذي كانت جيناته الرئيسية ميتوكوندرية وريبوسومية. لضمان التوحيد، تم تطبيع درجات الاستخدام إلى 1 في كل نقطة.
لإعادة توزيع حالات الخلايا، استخدمنا المصفوفة المميزة الموضحة أعلاه. باستخدام هذا المرجع للخلايا الفردية، تم تشغيل RCTD بشكل فردي لكل عينة مكانية. مرة أخرى، تم تطبيع الدرجات لتكون مجموعها 1 في كل نقطة.
لتقييم العلاقة بين النيتش وحالة الخلية، استخدمنا ارتباط سبيرمان لتقييم العلاقة بين درجات RCTD المعدلة واستخدام cNMF لعينات المرضى الفردية. بالنسبة للشكل 2، تم تصنيف نوع الخلية كجزء من النيتش إذا كانت العلاقة ذات دلالة إحصائية (FDR < 0.01) في أكثر من نصف العينات.
في تحليلنا لحالة الخلية والعلاقات المكانية بين النيتشات، صممنا نموذج انحدار مكاني لقياس قرب حالة الخلية، مع تحليل عينة واحدة في كل مرة. بالنسبة لأي زوج من حالات الخلية أو النيتش عبر جميع النقاط في العينة، قمنا بعمل انحدار لوجود حالة واحدة في نقطة مركزية مقابل التعبير المتوسط للحالة الأخرى في النقاط المحيطة. في هذا النموذج، قمنا بتحويل وجود حالة النقطة المركزية إلى ثنائية باستخدام عتبة محددة لحالة معينة تم تحديدها بواسطة مخطط الركبة (KneeLocator). ) من تعبير حالة الخلية عبر النقاط في جميع العينات. يشير معامل الانحدار الناتج إلى قوة الارتباط بين الحالات، مع -القيمة التي تظهر الأهمية الإحصائية لهذه العلاقة. الثابت يمثل الإشارة الخلفية للحالة غير المركزية. تم رسم الرسم البياني للشبكة في الشكل الإضافي 6f باستخدام حزمة بايثون NetworkX (الإصدار 2.0). يمثل حجم كل حافة نسبة معامل الانحدار إلى الثابت، مما يوفر مقياسًا لقوة ارتباط الحالة بالنسبة للإشارة الخلفية. كانت الحواف ذات دلالة إحصائية (FDR < 0.01) في أكثر منمن العينات التي لديها قوة ارتباط أكبر من 0.1.
ترابط البرامج المناعية مع المستجيبين وغير المستجيبين للعلاج المناعي. قمنا بتحميل كائن Seurat المنشور لمكتبات scRNA-seq للمرضى الذين يعانون من الورم الدبقي والذين يستجيبون أو لا يستجيبون للعلاج المناعي.استنادًا إلى التعليقات المنشورة، قمنا باستخراج الخلايا النخاعية من كائن Seurat. قمنا بحساب استخدام برامج cNMF النخاعية في كل خلية نخاعية، كما هو موضح أعلاه. قمنا بحساب متوسط استخدام كل برنامج في الخلايا النخاعية لكل مريض وحسبنا الفرق بين متوسط الاستخدام في المرضى المستجيبين وغير المستجيبين، باستخدام اختبارات ويلكوكسون المرتبة المصححة بواسطة FDR لتقييم الأهمية.
قمنا بحساب درجات الوحدات باستخدام مجموعات الجينات من المراجع 7 و15 و19 في جميع خلايا النخاع الشوكي من المرجع 38. وبالمثل، قمنا بحساب متوسط درجات الوحدة لكل مجموعة جينية لكل مريض وحساب الفرق بين المرضى المستجيبين وغير المستجيبين، باستخدام اختبارات ويلكوكسون المعدلة لتصحيح معدل الخطأ الكاذب لتقييم الأهمية.
تحليل البقاء. قمنا بدمج معلومات البقاء (مدة البقاء) والأحداث من مجموعات G-SAM وGLASS. شملنا فقط الأورام الدبقية IDH-WT. استخدمنا قيم درجات الوحدة المعيارية. (بدون تحويل اللوغاريتم) لبرامج cNMF. قمنا بإزالة إدخالات المرضى المكررة المتعلقة بالانتكاسات من خلال الاحتفاظ بالقيم من الورم الأساسي فقط. قمنا بإزالة أي مكتبة بقيمة CIBERSORTx تساوي 0 لسلالة النخاع. ثم أخذنا العينات في الأعلىواعتبرت هذه المجموعة من العينات هي الأعلى في كل برنامج. بالنسبة للمجموعة المنخفضة في كل برنامج، اخترنا عينات من الأسفل.المكتبات.
قمنا بإجراء تحليل البقاء بطريقة مشابهة باستخدام مجموعات الجينات من المراجع 7 و 15 و 19.
تحليل ATAC-seq على مستوى الخلية الواحدة. قمنا بتنزيل 20 مكتبة snATAC-seq من المرجع 40 وملف الشظايا لكل مكتبة. ثم تم معالجة كل مكتبة باستخدام Signac.v.1.12.0 لإزالة الخلايا ذات الجودة المنخفضة. باختصار، تم إنشاء كائن شظية لكل ملف شظية باستخدام دالة CreateFragmentObject() من Signac. ثم تم استدعاء القمم باستخدام دالة CallPeaks(). قمنا بإزالة القمم التي تتطابق مع الكتل باستخدام keepStandardChromosomes() وأزلنا المناطق المحظورة باستخدام دالة subsetByOverlaps() مع الخيارات ranges = blacklist_hg38 و invert = TRUE.
قمنا بإنشاء مصفوفة العد لكل مكتبة باستخدام FeatureMatrix()، ثم أنشأنا اختبار الكروماتين من خلال إدخال مصفوفة العد التي تم إنشاؤها وملف الشظايا للمكتبة المعنية باستخدام دالة CreateChromatinAssay() من Signac. قمنا بتصفية الخلايا التي لم تتضمن قراءات في أكثر من 200 ميزة وأزلنا القمم التي لم تتضمن قراءات من أكثر من 10 خلايا. أخيرًا، تم إنشاء كائن Seurat لكل مكتبة snATAC-seq باستخدام دالة CreateSeuratObject().
تم إخضاع خلايا كل مكتبة لتحليلات مراقبة الجودة باستخدام دوال NucleosomeSignal() و TSSEnrichment() و FractionCountsInRegion() و FRiP() لاستبعاد الخلايا ذات الضوضاء النووية العالية، وتلك التي تحتوي على عدد كبير من القراءات الموجهة إلى المناطق المحظورة، وانخفاض التخصيب بالقرب من TSS و/أو انخفاض في عدد القراءات المساهمة في القمم. يمكن العثور على العتبات المختارة لكل مكتبة فيhttps://github.com/BernsteinLab/الورم الدبقي النخاعي. تم حفظ كائن سورات والقمم لكل مكتبة بعد تصفية الخلايا ذات الجودة المنخفضة.
بعد ذلك، قمنا بدمج جميع كائنات Seurat في كائن واحد على النحو التالي. أولاً، قمنا بدمج جميع القمم باستخدام دالة Reduce() وقمنا بتصفية القمم التي تقل عن 20 قاعدة (bp) أو تزيد عن 10,000 قاعدة في الطول. ثم أنشأنا كائن شظايا جديد لكل مكتبة من خلال إدخال ملف الشظايا الأصلي في CreateFragmentObject() ولكن استخدمنا فقط الخلايا عالية الجودة. بعد ذلك، أنشأنا مصفوفة العد لكل مكتبة من خلال إدخال كائنات الشظايا التي تم إنشاؤها حديثًا ودمج القمم باستخدام دالة FeatureMatrix(). ثم أنشأنا اختبارات الكروماتين جديدة لكل مكتبة من خلال إدخال مصفوفات العد وكائنات الشظايا التي تم إنشاؤها حديثًا باستخدام دالة CreateChromatinAssay(). بعد ذلك، أنشأنا كائن Seurat جديد لكل مكتبة باستخدام اختبارات الكروماتين التي تم إنشاؤها حديثًا. أخيرًا، قمنا بدمج كائنات Seurat الجديدة باستخدام دالة الدمج.
تم إخضاع كائن Seurat المدمج لتحليل التجميع وتوليد UMAP باستخدام الدوال RunTFIDF() و FindTopFeatures() و RunSVD() و RunUMAP() و FindNeighbors() و FindClusters(). استخدمنا تقليل lsi وأزلنا PC1 و PC3 لأنهما كانا مرتبطين بعمق المكتبة، وليس بالبيولوجيا. تم استخدام الدالة DepthCor() لتحديد ارتباط كل PC بالعمق.
تم حساب أنشطة الجينات باستخدام دالة GeneActivity() من Signac. ثم أنشأنا مصفوفة نشاط الجينات باستخدام CreateAssayObject(). تم تطبيع قيم أنشطة الجينات باستخدام دالة NormalizeData() مع تعيين خيارات normalization.method إلى RC و scale.factor إلى median(Object$nCount_RNA).
ثم خضعت مصفوفة نشاط الجينات لحساب برامج cNMF لأنواع الخلايا، كما هو موضح أعلاه لمصفوفات scRNA-seq، لتوضيح الخلايا في المصفوفة. باستخدام هذه الحسابات،
تم تحديد خلايا المايلويد غير المزدوجة في كائن Seurat المدمج كما هو مذكور أعلاه.
تم تصفية كائن Seurat ليشمل فقط خلايا المايلويد باستخدام دالة subset(). بعد ذلك، تم استدعاء مجموعة جديدة من القمم، مما أدى إلى إنشاء مصفوفة ميزات جديدة واختبار كروماتين جديد. أخيرًا، تم إنشاء مصفوفة نشاط الجينات لكائن خلايا المايلويد المدمج، كما تم مناقشته سابقًا. تم تحديد استخدام برامج المايلويد في خلايا المايلويد لاستخراج خلايا المايلويد المنفصلة، كما هو مذكور أعلاه، لمكتبات scRNA-seq. قمنا باستخراج خلايا المايلويد المنفصلة لهويات وحيدات النواة والميكروغليا وللأنشطة المناعية النظامية، وجامعة، ومكمل، والتهاب الميكروغليا. بالنسبة لخلايا المايلويد الالتهابية النظامية، اخترنا أفضل 400 خلية مايلويد منفصلة.
لتحديد القمم القابلة للوصول بشكل مختلف في برامج المناعية، قمنا بتجميع تجمعات المايلويد المنفصلة باستخدام دالة AggregateExpression() مع الخيارات التالية: return.seurat = TRUE،group.by = Myeloid_Discrete_Status4، normalization.method LogNormalize، scale.factor . ثم قمنا باستخراج مصفوفة العدات المطبوعة باستخدام دالة LayerData() على كائن Seurat المجمع مع تعيين خيار الطبقة إلى البيانات. ثم قمنا بتحويل قيم log1p إلى قيم أسية واعتبرنا القمة محددة لتوضيح منفصل معين إذا كان لديها عدد لا يقل عن 2.5 مرة أكبر من متوسط العدات للتوضيحات الأخرى. قمنا بإنشاء bigwigs المطبوعة لكل توضيح باستخدام كود داخلي، والذي يمكن العثور عليه في https://github.com/BernsteinLab/ Myeloid-Glioma. لإنشاء مصفوفة مرجعية للتغطية للمناطق التي تمتد 1,000 نقطة أساسية للأعلى والأسفل من مراكز القمم المحددة، استخدمنا دالة computeMatrix من deeptools. قمنا بإدخال bigwigs المطبوعة وملفات القمم المحددة مع تمكين خيارات reference-point و-skipZeros، وتعيين -referencePoint إلى المركز و -b و -a إلى 1,000. أخيرًا، قمنا برسم خريطة الحرارة باستخدام دالة plotHeatmap من deeptools .
قمنا بإجراء تحليل النمط على كل مجموعة قمم محددة باستخدام monaLISA v.1.11.4 لتحديد الأنماط الغنية بشكل كبير. أولاً، قمنا بدمج القمم المحددة وإعادة تحجيمها إلى عرض الوسيط للقمم المدمجة مع تثبيت المركز. بعد ذلك، قمنا بتقسيم ملفات القمم المدمجة إلى صناديق بناءً على توضيح القمة. استخدمنا دالة getSeq() للحصول على تسلسلات القمم. استخدمنا النمط الأساسي PWM JASPAR2024 (المرجع 74) كميزات وحددنا الأنماط باستخدام دالة calcBinnedMotifEnrR() من monaLISA. لإنشاء خلفية كبيرة لحساب الغنى، قمنا بتعيين الخلفية إلى جينوم hg38 و genome.oversample = 500. أخيرًا، تم إنشاء خريطة حرارة الأنماط باستخدام دالة plotMotifHeatmaps().
تحليل Ligand-TF. لفهم أي الروابط تشارك في دفع برامج معينة ودائرة تنظيمية، استخدمنا قاعدة بيانات NicheNet (https://zenodo.org/record/7074291/files/gr_network_ human_21122021.rds) من أسماء الملفات gr_Network_Nichenet_Database.txt أو Signaling_Network_Nichenet_Database) التي تربط الروابط بـ TFs التي يمكنها تنشيطها من خلال تفاعلات الروابط المعروفة.
حددنا أولاً قائمة من TFs المحتملة النشطة لكل برنامج مناعي من خلال تحليل غنى الأنماط لمواقع ATAC-seq المحددة (الشكل 4a،b) وتحليل SCENIC (الشكل 4c). ثم استخدمنا قاعدة بيانات NicheNet لتحديد جميع الروابط التي كانت مرتبطة بكل TF. احتفظنا فقط بالروابط التي كانت معبرة في خلايا الأورام (أي نوع خلية في بيئة الورم) بأكثر من 0.3.
تحليل ATAC-seq الشامل. تمت إزالة محولات Nextera transposase من ملفات fastq عن طريق قصها باستخدام خيارات –phred33 –paired –fastqc باستخدام trim_galore (https://github.com/ FelixKrueger/TrimGalore). ثم تم استخدام محاذي STAR لرسم fastqs بالإعدادات التالية: -outSAMtype BAM SortedByCoordinate –outFilterMultimapNmax 1000 –outFilterScoreMinOverLread 0.25 –alignIntronMax 1–alignEndsType EndToEnd. ثم استخدمنا
وحدة PICARD MarkDuplicates (https://broadinstitute.github.io/ picard/) مع الخيار REMOVE_DUPLICATES المعين إلى TRUE. بعد ذلك، تم استخدام samtools لإزالة القراءات المرسومة إلى chrM أو contigs. ثم تم استخدام ملفات bam المعالجة لإنشاء bigwigs باستخدام دالة bamCoverage من deeptools مع طريقة تطبيع RPGC وحجم الجينوم الفعال . لتحديد المناطق القابلة للوصول، قمنا بتحويل ملفات bam المعالجة إلى تنسيق bed باستخدام bedtools واستخدمنا awk لإضافة أربعة قواعد إلى موقع البداية إذا كانت القراءة على الشريط الإيجابي وإزالة خمسة قواعد من موقع النهاية إذا كانت القراءة على الشريط السلبي لتصحيح انحياز tn5. تم استخدام MACS2 v.2.2.9.1 لاستدعاء القمم باستخدام الإعدادات التالية: -g hs -fBED -q 0.01 -nomodel –shift -75 –extsize 150 –keep-dup all. لتحديد المواقع القابلة للوصول بشكل مختلف، أنشأنا أدلة العلامات باستخدام الملفات المعالجة المرسومة كمدخلات لدالة makeTagDirectory من HOMER . تم دمج المواقع القابلة للوصول لمكتبات DMSO و p300i باستخدام دالة mergePeaks من HOMER، وتم تحديد المواقع القابلة للوصول بشكل مختلف باستخدام دالة getDifferentialPeaks من HOMER وتعيين -F إلى 2 للاحتفاظ بالمناطق التي تحتوي على عدد علامات مطبوعة أعلى بمقدار الضعف في واحدة من المكتبات. تم إنشاء خرائط حرارة deeptools كما هو مذكور أعلاه، وتم تحديد الأنماط المهمة الغنية في المواقع القابلة للوصول بشكل مختلف باستخدام monaLISA v.1.11.4، بطريقة مشابهة للطريقة المذكورة أعلاه، باستثناء تعيين genome.oversample إلى 50، نظرًا لعدد المواقع القابلة للوصول بشكل مختلف.
تحليل GR ChIP-seq. تم الحصول على مواقع الربط لـ GR من المرجع 43. تم توضيح مواقع الربط باستخدام وحدة findPeaks من HOMER. كانت المسافة القصوى المسموح بها إلى جين 100,000 نقطة أساسية.
تحليل الارتباط الزمني. حصلنا على مجموعات جينية للجينات المرتبطة بالتسلل الأخير والتسلل البعيد إلى الورم في نموذج فأر من الورم الدبقي . استخدمنا gprofiler (https://biit. cs.ut.ee/gprofiler/gost) لتحديد غنى برامج cNMF المايلويد في هذه المجموعات الجينية من خلال تقديم أفضل 100 جين لكل برنامج cNMF كاستعلام ضد كل مجموعة جينية كخلفية.
ملخص التقرير
معلومات إضافية حول تصميم البحث متاحة في ملخص تقرير Nature Portfolio المرتبط بهذه المقالة.
توفر البيانات
تتوفر العدات الخام ومجموعة البيانات المعالجة لفوج الاكتشاف والتحقق في بوابة الخلايا المفردة مع معرف الدراسة SCP2389 في https://singlecell.broadinstitute.org/single_cell/study/SCP2389/ برامج-أصول-وأنماط-الخلايا-المايلويد-المناعية-في-الأورام-الدماغية-البشرية. بالنسبة لجميع بيانات scRNA-seq التي تم إنشاؤها لهذه المخطوطة (MGB وفوج IDH-mutant من جامعة مكغيل)، تم إيداع بيانات المستوى الفردي الخام في dbGaP مع رمز وصول الدراسة phs003756.v1.p1 ويمكن عرضها في صفحة تقرير دراسة dbGaP في https://www.ncbi.nlm.nih.gov/projects/gap/cgi-bin/study. cgi?study_id=phs003756.v1.p1. بالنسبة للبيانات الأخرى التي أعيد تحليلها في هذه الدراسة، تم تنزيل بيانات Methodist من سلسلة GEO GSE182109؛ تم تنزيل بيانات مختبرات جاكسون من https://ega-archive. org/datasets/EGAD00001007772؛ وتم تنزيل بيانات جامعة مكغيل المنشورة (عينات IDH-WT) من https://ega-archive. org/datasets/EGAD00001006206. جميع البيانات الأخرى متاحة من المؤلف المقابل عند الطلب المعقول.
يمكن العثور على أداة عبر الإنترنت لحساب استخدامات برامج النخاع المتفق عليها المقدمة لخلايا النخاع المرتبطة بالورم الدبقي من تجارب أخرى فيhttps://consensus-myeloid-program-calculator. shinyapps.io/shinyapp/. هذه الأداة تمكن المستخدمين من رفع مصفوفة التعبير الجيني الخاصة بهم من بيانات تسلسل RNA أحادي الخلية وإخراج استخدامات البرنامج التوافقي لكل خلية. 56. هيوز، ت. ك. وآخرون. تكشف تقنية تسلسل RNA أحادي الخيط المعتمدة على تخليق الشريط الثاني عن حالات خلوية وميزات جزيئية لاعتلالات الجلد الالتهابية البشرية. المناعة 53، 878-894 (2020). 57. جاكوب، ف.، مينغ، ج.-ل. وسونغ، هـ. توليد وتخزين الأنسجة العضوية المستمدة من مرضى الأورام الدبقية واستخدامها في اختبار خلايا CAR T. نات. بروتوك. 15، 4000-4033 (2020). 58. تشين، ز. وآخرون. تحليل تكاملي لعناصر تنظيم الجينات بدقة القاعدة. جينوم الخلية. 3، 100318 (2023). 59. لي، ب. وآخرون. كوميولوس يوفر تحليل بيانات قائم على السحابة لتحليل RNA-seq على مستوى الخلية الواحدة والنواة الواحدة على نطاق واسع. نات. ميثودز 17، 793-798 (2020). 60. دوبين، أ. وآخرون. ستار: محاذي تسلسل RNA عالمي فائق السرعة. المعلوماتية الحيوية 29، 15-21 (2013). 61. هاو، ي. وآخرون. تحليل متكامل لبيانات الخلايا الفردية متعددة الأنماط. خلية 184، 3573-3587 (2021). 62. راودفير، يو. وآخرون. g:Profiler: خادم ويب لتحليل الإثراء الوظيفي وتحويل قوائم الجينات (تحديث 2019). أبحاث الأحماض النووية. 47، W191-W198 (2019). 63. Gu، ز.، إيلس، ر. وشليسنر، م. الخرائط الحرارية المعقدة تكشف عن أنماط وارتباطات في البيانات الجينومية متعددة الأبعاد. المعلوماتية الحيوية 32، 2847-2849 (2016). 64. هيرينغ، سي. أ. وآخرون. ديناميات تنظيم الجينات في القشرة الجبهية البشرية من الحمل إلى البلوغ بدقة خلوية واحدة. خلية 185، 4428-4447 (2022). 65. ديلاني، سي. وآخرون. التنبؤ التوافقي لمجموعات العلامات من بيانات النسخ الجيني على مستوى الخلية الواحدة. أنظمة البيولوجيا الجزيئية 15، e9005 (2019). 66. Hänzelmann, S., Castelo, R. & Guinney, J. GSVA: تحليل تباين مجموعة الجينات لبيانات الميكروأري وRNA-seq. BMC Bioinformatics 14, 7 (2013). 67. بلاند، ج. م. وألتمن، د. ج. ملاحظات إحصائية. نسبة الأرجحية. BMJ 320، 1468 (2000). 68. روبنسون، م. د.، مكارثي، د. ج. وسميث، ج. ك. edgeR: حزمة Bioconductor لتحليل التعبير التفاضلي لبيانات التعبير الجيني الرقمي. المعلوماتية الحيوية 26، 139-140 (2010). 69. نيومان، أ. م. وآخرون. تحديد وفرة نوع الخلية والتعبير من الأنسجة الكلية باستخدام السيتومترية الرقمية. نات. بيوتكنولوجي. 37، 773-782 (2019). 70. أرفاي، ك. وآخرون. أرڤكيفي/كند: التوثيق! زينودوhttps://doi.org/10.5281/zenodo. 6496267 (2020). 71. ستيوارت، ت.، سريفاستافا، أ.، ماداد، س.، لاريه، ك. أ. وساتيجا، ر. تحليل حالة الكروماتين على مستوى الخلية الواحدة باستخدام Signac. نات. ميثودز 18، 1333-1341 (2021). 72. راميريز، ف. وآخرون. deepTools2: خادم ويب من الجيل التالي لتحليل بيانات التسلسل العميق. أبحاث الأحماض النووية. 44، W160-W165 (2016). 73. Machlab، د. وآخرون. monaLisa: حزمة R/Bioconductor لتحديد الأنماط التنظيمية. المعلوماتية الحيوية 38، 2624-2625 (2022). 74. Rauluseviciute، I. وآخرون. JASPAR 2024: الذكرى العشرون لقاعدة البيانات المفتوحة الوصول لملفات ارتباط عوامل النسخ. أبحاث الأحماض النووية. 52، D174-D182 (2024). 75. مارتن، م. كوتادابت يزيل تسلسلات الموصلات من قراءات التسلسل عالي الإنتاجية. مجلة EMBnet 17، 10-12 (2011). 76. دانيتشيك، ب. وآخرون. اثنا عشر عامًا من SAMtools و BCFtools. جيغا ساينس 10، giab008 (2021). 77. كوينلان، أ. ر. وهال، I. M. BEDTools: مجموعة مرنة من الأدوات لمقارنة الميزات الجينومية. المعلوماتية الحيوية 26، 841-842 (2010). 78. هاينز، س. وآخرون. تركيبات بسيطة من عوامل النسخ المحددة للسلالة تهيئ العناصر التنظيمية المترابطة المطلوبة لهويات البلعميات وخلايا B. مول. خلية 38، 576-589 (2010). 79. كولبرغ، ل. وآخرون. خدمة ويب متوافقة مع g:Profiler لتحليل الإثراء الوظيفي ورسم خرائط معرفات الجينات (تحديث 2023). أبحاث الأحماض النووية. 51، W207-W212 (2023).
الشكر والتقدير نشكر المرضى وعائلاتهم على تبرعهم بأنسجة الأورام لهذه الدراسة؛ ب. لي على المساعدة الفنية في خط أنابيب كوميولوس؛ إ. إسترادا على المساعدة في تحديد خصوصية برامجنا عبر أنواع الأورام المختلفة؛ إ. تيروش وجميع أعضاء مختبر بيرنشتاين على الملاحظات؛ وج. م. لارسون، م. أ. دي سافاج، إ. سامرز، موظفي بنك أنسجة علم الأمراض في مستشفى ماساتشوستس العام وجراحة الأعصاب في مستشفى ماساتشوستس العام، م. س. برابهو، ج. ج. بوسي، ك. ل. ليغون وموظفي بنك أنسجة وبيانات الأورام العصبية على المساعدة في الحصول على استئصال الأنسجة الطازجة. تم دعم ت. إ. م. وهذه الدراسة من قبل جوائز قادة المستقبل من جمعية أورام الدماغ في المملكة المتحدة (GN-000701 وGN-000722) بالشراكة مع مؤسسة جيك مكارثي وصندوق ريا ميلفين، وزمالة البحث الأساسية من جمعية أورام الدماغ الأمريكية تكريماً لجويل أ. جينغراس الابن، وزمالة ما بعد الدكتوراه في علاج السرطان المناعي من SITC-بريستول مايرز سكويب، ومنحة NCI KO8 رقم KO8CA276819 ومنحة التدريب NIH T32 رقم CA9216. تم دعم ج. ب. س. من قبل زمالات ما بعد الدكتوراه من مركز لودفيغ في معهد ماساتشوستس للتكنولوجيا، والمعاهد الكندية للأبحاث الصحية (181907)، وصندوق أبحاث كيبيك – الصحة ومنحة من صندوق ج. هـ. وإ. ف. ويد في معهد ماساتشوستس للتكنولوجيا. تم دعم ل. ن. ج. س. من قبل مؤسسة روبرت وود جونسون. تم دعم أ. ك. س. من قبل منح NIH NCI P3O CA14051، NCI 1U2C CA23319501 وNCI U54 CA217377، وصندوق ج. هـ. وإ. ف. ويد في معهد ماساتشوستس للتكنولوجيا وبرنامج بايو-ستيوارت للباحثين في مجال السرطان. تم دعم ز. س. من قبل NCI-CA-234842. تم دعم د. س. ف. من قبل مركز إريك وويلي شميت في معهد برود بمعهد ماساتشوستس للتكنولوجيا وهارفارد. تم دعم ج. ل. ج. من قبل R37CA269499. تم دعم هذا المشروع من قبل أموال من مؤسسة الليلة الرائعة (إلى ك. ب.)، وصندوق مدير NCI/NIH (DP1CA216873 إلى ب. إ. ب.)، ومركز لودفيغ في هارفارد وجمعية إيمرسون.
مساهمات المؤلفين: قام كل من ت.إم، ك.أ.إف، ك.ب.س، م.ل.س، أ.ك.س و ب.إي.ب بتصميم الدراسة. جمع كل من ت.إم، ك.ب.س، ز.س، ج.ب.د، ج.ف، ل.ن.ج.س و أ.ن.س الأورام الأولية، وأنشأوا GBOs، وأجروا تسلسل RNA أحادي الخلية، وأجروا تجارب على GBOs. قدمت ت.أ.س و ك.ب. بيانات سريرية من مجموعة أورام مكغيل ودعمت تفسير النتائج. قدمت د.هـ.هـ مجموعة 10 X Visium ودعمت تحليل وتفسير النتائج. ساهم كل من ت.إم، ك.أ.إف، ك.ب.س، ز.س، م.أ.ف، ي.إ.ت، أ.ن.س، ي.ز، د.س.ف و ب.إي.ب في الأساليب التحليلية وأجروا تحليلات إحصائية. أشرف كل من ج.ل.ج، م.ل.س، أ.ك.س و ب.إي.ب على المشروع وساهموا في تفسير البيانات. قام كل من ت.إم، ك.أ.إف، ك.ب.س و ب.إي.ب بتفسير البيانات وكتابة المخطوطة. راجع جميع المؤلفين وحرروا المخطوطة.
المصالح المتنافسة: لدى T.E.M. مصالح مالية في Reify Health وCare Access Research وTelomere Diagnostics. لدى C.P.C. مصلحة مالية في Axoft. يتلقى L.N.G.C. رسوم استشارية من Elsevier وOakstone Publishing وPrime Education وBMJ Best Practice وServier، وتمويل بحثي من Merck & Co (لمعهد دانا فاربر للسرطان). J.L.G. هو مستشار ويعمل في المجلس الاستشاري العلمي لشركات Array BioPharma وAstraZeneca وBD Biosciences وCarisma وCodagenix وDuke Street Bio وGlaxoSmithKline وKowa وKymera وOncoOne وVerseau Therapeutics، ويتلقى دعمًا بحثيًا من Array BioPharma/Pfizer وEli Lilly وGlaxoSmithKline وMerck. M.L.S. هو مالك أسهم ومؤسس علمي مشارك وعضو في المجلس الاستشاري لشركة Immunitas Therapeutics. يتلقى A.K.S. تعويضًا عن الاستشارات و/أو عضوية المجلس الاستشاري العلمي من Honeycomb Biotechnologies وCellarity وOchre Bio وRelation Therapeutics وFL86/Quotient Therapeutics وParabalis Medicines وPasskey Therapeutics وIntrECate Biotherapeutics وDanaher وSenda Biosciences وDahlia Biosciences، وهو غير مرتبط بهذا العمل. لدى B.E.B. مصالح مالية في Fulcrum Therapeutics وHiFiBio وArsenal Biosciences وChroma Medicine وCell Signaling Technologies. المؤلفون الآخرون يعلنون عدم وجود مصالح متنافسة.
معلومات إضافية
معلومات إضافية النسخة الإلكترونية تحتوي على مواد إضافية متاحة فيhttps://doi.org/10.1038/s41586-025-08633-8. يجب توجيه المراسلات والطلبات للحصول على المواد إلى برادلي إي. برنشتاين. تشكر مجلة Nature ليلى عكاري والمراجعين الآخرين المجهولين على مساهمتهم في مراجعة الأقران لهذا العمل. معلومات إعادة الطبع والتصاريح متاحة علىhttp://www.nature.com/reprints.
مقالة
الشكل 1 من البيانات الموسعة | انظر الصفحة التالية للتعليق.
الشكل البياني الممتد 1| تحديد برامج النخاع المتسقة في مجموعات الاكتشاف والتحقق. أ) خط أنابيب حسابي تم استخدامه لتحديد برامج النخاع المتكررة في بيانات scRNA-seq من ثلاث مجموعات اكتشاف، وتم تطبيقه بشكل منفصل على مجموعة التحقق (McGill). ب) UMAP لجميع الخلايا في مجموعة اكتشاف MGB ملونة حسب نوع الخلية الاسمي. ج) نفس UMAP مع خلايا موصوفة بوجود (أسود) أو غياب (رمادي) التغيرات في عدد النسخ. د) خريطة حرارية توضح تعبير الجينات في برامج النخاع المتكررة. (الصفوف) عبر الخلايا (العمود) مجمعة حسب نوع الخلية، مماثلة للشكل 1c، ولكن لمجموعة التحقق (McGill). تم تحديد نوع الخلية من خلال استخدام برامج هوية الخلايا المكونة من cNMF. e) توضح الرسوم البيانية الصندوقية نسبة الخلايا لكل ورم التي تعبر عن البرنامج المكون من الخلايا المكونة (أقصى اليسار) عبر مجموعة التحقق. الخط يمثل الوسيط والصناديق تمثل الربع الأول والربع الثالث. كانت برامج الخلايا المكونة المتوافقة متسقة للغاية بين مجموعات الاكتشاف والتحقق.
الشكل البياني الموسع 2 | انظر الصفحة التالية للتعليق.
الشكل الممتد 2 | تحديد ومقارنة برامج cNMF في الخلايا المايلويدية المحيطية مع برامج الأورام. أ) برامج cNMF التي تم تحديدها من ملفات scRNA-seq للدم المحيطي من مرضى الغليوما. الرسم البياني يقارن بين برامج cNMF في الخلايا المايلويدية المحيطية وخلايا المايلويد المرتبطة بالغليوما. حجم الحرارة والنقاط يت correspond إلى مؤشر جاكارد بين طيف الجينات. ب) لكل نوع من أنواع الخلايا المايلويدية، يظهر العمود المكدس العدد المطلق للخلايا ذات الاستخدام الأعلى للبرامج النشطة المحددة. ج) لكل نوع من أنواع الخلايا المايلويدية (الصفوف)، تشير الأشرطة الأفقية إلى نسبة الخلايا التي لديهااستخدام برنامج النشاط المحدد. د) تُظهر خريطة الحرارة الثراء النسبي لبرامج النشاط المحددة (الأعمدة) عبر هويات الخلايا المختلفة (الصفوف). تم حساب قيمة P باستخدام التوزيع الفائق الهندسة. هـ) توضح المخططات توسيع المجموعة لتشمل
عينات مكغيل في جميع التحليلات اللاحقة. f) تُظهر الرسوم البيانية على شكل كمان استخدام كل برنامج من برامج تعديل المناعة في الخلايا معاستخدام برنامج المناعة المثبطة للمت scavenger (يسار) أو برنامج المناعة المثبطة للملحق (يمين). ج) تمثل مخططات الربع موضع الخلايا (النقاط) حسب تعبيرها عن البرامج المناعية المعدلة كما في الشكل 1e. يظهر تدرج الرمادي استخدام البرنامج المناعي المعدل المحدد. يمثل موضع كل نقطة الفرق في استخدام البرامج المناعية المثبطة والالتهابية بواسطة تلك الخلية (الجزء العلوي من المخطط أكثر التهابا، بينما الجزء السفلي أكثر تثبيطا للمناعة). ح) مخطط ربع كما في ج ولكن مع تلوين الخلايا حسب المجموعة. بشكل عام، يتم مشاركة البرامج الأربعة المعدلة للمناعة عبر أنواع الخلايا النخاعية، ولكن نادرا ما يتم استخدامها من قبل نفس الخلايا. أنبوب PBMC، شاليك، أ. (2005)https://BioRender.com/b15i535.
الشكل البياني الممتد 3 | انظر الصفحة التالية للتعليق.
البيانات الموسعة الشكل 3 | مقارنة مباشرة بين تجميع لوفين وبرامج cNMF. أ) تعرض UMAP تجمعات لوفين لخلايا المايلويد المفردة المصححة حسب الدفعة من مجموعة MGB. ب) UMAPs لنفس مجموعة MGB مع خلايا موصوفة حسب استخدامهم لهوية الخلية (أعلى) وبرامج نشاط الخلية (أسفل). ج) تم وصف تجمعات لوفين في اللوحة أ بناءً على تحليل التعبير الجيني التفاضلي (يسار)، أو حسب اسم وتكرار أكثر نوع خلية شائع لكل استخدام برنامج هوية cNMF (وسط). لكل تجمع لوفين (صفوف)، تشير الرسم البياني العمودي (يمين) إلى نسبة الخلايا ذات التعبير العالي للبرنامج النشاط المحدد (أعمدة). د) (أعلى) UMAP تعرض تجمعات لوفين لخلايا المايلويد المفردة المصححة حسب الدفعة من عبد الفتاح. مجموعة عبد الفتاح وآخرون. (أسفل) خرائط UMAP لخلايا المايلويد من مجموعة عبد الفتاح وآخرون توضح استخدام البرامج المحددة في أعلى كل خريطة UMAP. e) (يسار) توضيحات لمجموعات لوفيان في (د) بناءً على تحليل التعبير الجيني التفاضلي القياسي للمجموعات بواسطة عبد الفتاح وآخرون. (يمين) رسم بياني عمودي لمتوسط استخدام برامج cNMF للهوية والنشاط في خلايا مجموعات لوفيان في (د). تتكون المجموعات من خلايا تمثل تركيبات غير متجانسة من برامج cNMF، حيث تفصل المجموعات بشكل كبير حسب استخدام برنامج الهوية، بينما يتم مشاركة برامج النشاط عبر المجموعات وأنواع الخلايا.
الشكل 5 من البيانات الموسعة | انظر الصفحة التالية للتعليق.
الشكل 5 من البيانات الموسعة | الظواهر المتقاربة للخلايا الميكروغليالية والخلايا المولودة من نخاع العظام. أ) خط أنابيب تحليل MAESTER لاستنتاج أصول الخلايا المولودة في الورم الدبقي بناءً على اكتشاف طفرات mtDNA في بيانات scRNA-seq. ب) الرسم البياني يوضح الفرق في الثراء بين المتغيرات الخاصة بـ PBMC والمتغيرات الخاصة بالسكان المقيمين. كل نقطة تمثل مستوى الثراء للخلايا ذات الهوية المحددة في مريض واحد. المحور السيني يدل على الفرق المقيس بين ثراء GSVA للمتغيرات الخاصة بـ PBMC والمتغيرات الخاصة بالسكان المقيمين. ج) الرسوم البيانية المكدسة تشير إلى متوسط استخدام البرامج المناعية في الخلايا المولودة ذات الهويات الخلوية المحددة للأورام الأربعة الموضحة في اللوحة ب. فئة “برامج أخرى” تشمل البرامج الأخرى المتعلقة بالهوية والنشاط. د) تصميم التجربة (الأعلى) ومخططات تحليل التدفق (الأسفل) لخلايا PBMC المأخوذة من المرضى والمطابقة المطبقة على GBOs المستنفدة من خلايا المناعة. النتائج هي من مجموعة من 8 GBOs لكل حالة. تم استخدام خلايا T كتحكم في التصفية لـ P2RY12 و TMEM119. e) صور تمثيلية للتألق المناعي تظهر خلايا PBMC المتسللة إلى GBO. f) صور تمثيلية للتألق المناعي لشرائح الأعضاء من مرضى مختلفين باستخدام نفس الإعداد التجريبي كما في (d) باستثناء استخدام وحيدات النواة من المتبرعين العاديين. g) تمثل المخططات الدائرية كمية الصور في (f). النتائج هي من 4 GBOs مجمعة لكل حالة. h) تقيم مخططات تحليل التدفق نسبة تسلل خلايا CD45+ إلى GBOs. الائتمان: لوحة 96 بئر وأنبوب PBMC، شاليك، أ. (2005)https://BioRender.com/ب15ي535.
الشكل البياني الممتد 6 | انظر الصفحة التالية للتعليق.
الشكل التوضيحي الممتد 6|الارتباطات المكانية للخلايا النخاعية وبيئات الورم الدبقي. أ) يوضح المخطط نهج التحليل لعينات النسخ الجزيئي المكاني: تم تطبيق cNMF على بيانات النسخ الجزيئي المكاني من Ravi وآخرين لتعريف برامج بيئة الورم النسخية الواسعة؛ بالتوازي، تم استنتاج محتوى الخلايا لكل نقطة بناءً على توقيعات scRNA-seq (فك التعدد RCTD؛ انظر الطرق). يوضح الرسم البياني الدائري المكاني (في المنتصف) لقسم 10X Visium تمثيل برامج بيئة الورم. تمثل كل دائرة نقطة وتلون بناءً على تعبير برامج بيئة الورم المحددة. يوضح الرسم البياني المكاني (على اليمين) لنفس القسم التعبير النسبي لبرامج نوع الخلايا المحددة (تشير درجات الرمادي إلى النسب المتوقعة للنقاط بواسطة RCTD). ب) تُظهر خريطة الحرارة تعبير الجينات (الصفوف) المجمعة حسب برنامج البيئة عبر جميع النقاط (الأعمدة) في مجموعة عينات النسخ الجزيئي المكاني. يتم عرض أعلى 40 جينًا من كل برنامج بيئة. يتم تطبيع بيانات تعبير الجينات عمودياً، ثم يتم تطبيعها لوغاريتمياً وتعديلها حسب التباين. ج) تُظهر الرسوم البيانية المكانية التعبير النسبي للبرامج الخلوية في قسم 10X Visium الموضح في الشكل 2أ (تشير درجات الرمادي إلى النسب المتوقعة للنقاط بواسطة RCTD). د) تعرض خريطة النقاط القرب المكاني. درجة الإثراء بين البرامج المتخصصة، محسوبة بشكل مستقل لكل عينة (قيمة p باستخدام المربعات الصغرى العادية، انظر الطرق). حجم النقاط يدل على نسبة العينات التي تظهر ارتباطًا كبيرًا (p-adj<0.01)، بينما اللون يشير إلى ارتباط إيجابي (أحمر) أو سلبي (أزرق). e) يعرض مخطط النقاط درجة الإثراء القريب المكاني بين برامج الخلايا، محسوبة بشكل مستقل لكل عينة (قيمة p باستخدام المربعات الصغرى العادية، انظر الطرق). f) توضح شبكة الرسم البياني العلاقات المكانية المتكررة لأنواع الخلايا في بيئة الورم الدقيقة عبر عينات النسخ الجينية المكانية. تمثل العقد أنواع الخلايا، مع تحديد الحواف القربات الغنية بشكل كبير بين أنواع الخلايا، التي لوحظت في ما لا يقل عنمن العينات التي لديها متوسط درجة إثراء > 0.1. عرض الحافة يعكس هذه الدرجة المتوسطة. ج) يعرض مخطط التشتت متوسط درجة برنامج المناعة المثبطة للسموم (محور س) مقابل درجة برنامج السرطان MES2 أو MES1 (محور ص) عبر عينات الجليوما في مجموعة بيانات scRNA-seq. تظهر نتائج المربعات الصغرى العادية (خط، وقيمة p).
الشكل 7 من البيانات الموسعة | انظر الصفحة التالية للتعليق.
الشكل البياني الموسع 7 | يتنوع تكوين البرنامج النخاعي مع درجة الورم النسيجي. أ) رسم رباعي مع خلايا نخاعية موضوعة كما في الشكل 1e مع تلوين كل خلية حسب حالة طفرة IDH للورم المقابل. ب) تظهر الرسوم البيانية الصندوقية متوسط استخدام نشاط الخلايا (يسار) وبرامج الهوية (يمين) في الخلايا النخاعية من مجموعات تسلسل RNA أحادي الخلية، مصنفة حسب حالة طفرة IDH للورم المقابل. في جميع الرسوم البيانية الصندوقية في الشكل، تمثل كل نقطة ورمًا، وتمثل الخطوط الوسيط والرباعيات. تمثل الشعيرات 1.5 مرة من النطاق الرباعي. تم حساب قيمة p المصححة باستخدام FDR باستخدام اختبار ويلكوكسون للرتب المجمعة ذو الجانبين: *<0.05،ج) مخطط الصندوق يعرض متوسط درجات الوحدات في الأورام من مجموعة TCGA مصنفة حسب حالة طفرة IDH. د) ربع الرسوم البيانية كما في اللوحة (أ) حيث يشير اللون الأسود إلى ما إذا كانت الخلية النخاعية من ورم دبقي من الدرجة 2 (يسار)، الدرجة 3 (وسط)، أو الدرجة 4 (يمين). e) توضح الرسوم البيانية الصندوقية متوسط استخدام كل برنامج من برامج تعديل المناعة في الخلايا النخاعية من الأورام الدبقية المصنفة حسب الدرجة. f) تظهر الرسوم البيانية الصندوقية متوسط استخدام برنامج دورة G2M في الخلايا النخاعية في بيانات تسلسل RNA أحادي الخلية لعينات الأورام الدبقية، مصنفة حسب الدرجة وحالة طفرة IDH. g) تظهر الرسوم البيانية الصندوقية نسبة الاحتمالات للدورة للخلايا النخاعية التي تعبر عن البرامج المحددة، محسوبة بشكل مستقل لكل ورم. ‘الدورة’ والبرنامج محددان بواسطة استخدام الخلية.لكل من الدراجات والبرنامج المحدد. ح) رسم رباعي كما في الشكل 3أ مع الإشارة إلى خلايا الدراجات.
الشكل البياني الموسع 9 | انظر الصفحة التالية للتعليق.
الشكل 9 من البيانات الموسعة | مقارنات النتائج السريرية مع مجموعات الجينات المنشورة سابقًا. أ-ج) يظهر الرسم البياني الصندوقي درجة الوحدة النسبية لمجموعات الجينات النخاعية المنشورة من بومبو-أنتونيس وآخرون (أ)، عبد الفتاح وآخرون (ب) ولي وآخرون (ج) في الأورام الدبقية من مي وآخرون، مقسمة حسب الاستجابة للعلاج المناعي. تمثل الرسوم البيانية الصندوقية الوسيط والرباعيات، مع تمثيل الخطوط الخارجية 1.5 مرة نطاق الربيع بين الربيعين. تم حساب الأهمية بواسطة اختبار ويلكوكسون للرتب المجمعة ذو الجانبين المصحح بواسطة FDR. جميعها كانت > 0.25. د) تظهر الرسوم البيانية الشريطية قيم P المحسوبة باستخدام اختبار الرتبة ذو الجانبين.-المحور) لتحديد ما إذا كانت مجموعات الجينات المشار إليها (المحور السيني) من بومبو-أنتونيس وآخرين، عبد الفتاح وآخرين، ولي وآخرين مرتبطة بفروق البقاء. لم يحقق أي منها دلالة إحصائية..
الشكل البياني الموسع | انظر الصفحة التالية للتعليق.
الشكل 10 من البيانات الموسعة | دوائر TF المرتبطة بالتعديل المناعي برامج. أ) مخطط لتحليل snATAC-seq لاشتقاق ملفات الوصول الزائفة الكثيفة للبرامج المناعية المختلفة. ب) تُظهر خريطة الحرارة الوصول النسبي على المواقع التنظيمية المرشحة لكل برنامج مناعي، كما في الشكل 4أ ولكن تشمل تجمعات الخلايا الوحيدة والخلايا الدبقية الصغيرة. ج) تُظهر خريطة الحرارة متوسط تعبير TF ونسبة الخلايا التي تعبر عن TF في الخلايا النخاعية مع تعبير مميز لبرامج نظامية أو برامج مخلصة. د) يُظهر الرسم البياني العمودي الثراء لأكثر 50 من الجينات المنخفضة التنظيم خلال 24 ساعة من علاج الديكساميثازون في البلعميات البشرية (مجموعات جينات KEGG). الجينات المنظمة مستمدة من الجدول S1B من Jubb وآخرون. قيمة P تم توليدها بواسطة gProfilerباستخدام الإعدادات الافتراضية. هـ) مخطط الصندوق للتعبير عن TNFAIP3 في البلعميات بعد ساعة واحدة من علاج ديكس (جوب وآخرون). تمثل مخططات الصندوق الوسيط والرباعيات، مع تمثيل الشعيرات 1.5 مرة من النطاق الرباعي. الأهمية هي قيمة p المعدلة (FDR) مأخوذة من الجدول S1A لجوب وآخرون.
الشكل البياني الممتد 11|انظر الصفحة التالية للتعليق.
الشكل 11 من البيانات الموسعة | الديكساميثازون يحفز بسرعة وبشكل دائم برنامج المناعة المثبطة للمكمل. أ) تصميم التجربة ورسم بياني عمودي يظهر نسبة الخلايا النخاعية التي تعبر عن البرامج المناعية المعدلة في بيانات تسلسل RNA أحادي الخلية لـ GBOs المعالجة بالديكساميثازون لمدة 7 أيام أو التحكم. تم تجميع 16 GBO من BWH11 لكل حالة وتم تسلسلها؛ تم حساب أشرطة الخطأ من الخطأ القياسي الثنائي. قيمة pباستخدام اختبار فيشر الدقيق، جميع المقارنات الأخرى غير ذات دلالة. ب) صور المناعة الفلورية لجسم عضوي مع بيئة ميكروية داخلية سليمة مزروعة لمدة 7 أيام مع 100 نانومتر من ديكس أو التحكم باستخدام DMSO. ج) يظهر الرسم البياني متوسط تقدير الخلايا الإيجابية للعلامة في الأعضاء المقطعة. كل نقطة تمثل عضواً عضوياً. تم حساب قيمة P باستخدام اختبار T لطلاب ذو طرفين. تمثل أشرطة الخطأ الانحراف المعياري. د) تصميم التجربة ونتائج تحليل التدفق الخلوي للوحيدات المحيطية المطبقة على الأجسام العضوية التي تم استنفاد الخلايا المناعية فيها بحضور ديكس أو إنترفيرون غاما. تمثل نقاط البيانات 3 أجسام عضوية مجمعة. تمثل أشرطة الخطأ الانحراف المعياري. هـ) مقطع تمثيلي من علم الأنسجة لجسم عضوي في التجربة الموضحة في (د). و) نتائج تحليل التدفق الخلوي للأجسام العضوية من عدة مرضى تظهر أنماط متسقة. تصميم التجربة كما في الشكل 5ج. الصف العلوي يظهر CD163، وهو علامة لبرنامج تثبيط المناعة المكمل. الصف السفلي يظهر ICAM1، وهو علامة للالتهاب الجهازي. برنامج. الرسم البياني BWH911CD163 هو نفسه كما هو موضح في الشكل 5c. تظهر الرسوم البيانية الشريطية متوسط الإشارة +/- الانحراف المعياري. تمثل نقاط البيانات (4) كل منها 2 من GBOs المجمعة. ج) تصميم التجربة والنتائج من علاج Dex لنموذج GBO المتسلل. نتائج تحليل التدفق الخلوي بعد 24 ساعة من العلاج، قبل إضافة الخلايا إلى GBOs (أسفل اليسار). تظهر الرسوم البيانية الشريطية متوسط 3 آبار من وحيدات النواة المعالجة من نفس المريض. تظهر أشرطة الخطأ +/- الانحراف المعياري. يتم عرض رسم تدفق تمثيلي. يوضح المخطط الأوسط تصميم التجربة بعد تطبيق الخلايا المعالجة على GBOs. يظهر الرسم البياني على اليمين متوسط نتائج تحليل التدفق الخلوي للخلايا النخاعية المتسللة وغير المتسللة، مصنفة حسب العلاج. تمثل نقاط البيانات (4) كل منها 3 آبار مجمعة (لغير المتسللة) أو GBOs (للمتسللة). تظهر أشرطة الخطأ +/- الانحراف المعياري. تحولت وحيدات النواة المحيطية المعرضة لـ Dex قبل أن تُزرع مع GBOs إلى علامات مكمل وحافظت على تعبير علامات البرنامج بعد تسلل GBO وعبر التمايز. كان تعبير علامة المناعة المثبطة للمكمل في GBO متساويًا بغض النظر عن توقيت أو مدة التعرض، مما يشير إلى أن وحيدات النواة لديها ذاكرة من التعرض لـ Dex حتى عند وضعها في بيئات ميكروية مختلفة. الائتمان: لوحة 96 بئر وأنبوب PBMC، شاليك، أ. (2005)https://BioRender.com/b15i535.
الشكل 12 من البيانات الموسعة | انظر الصفحة التالية للتعليق.
الشكل 12 من البيانات الموسعة | تأثير البيئة الدقيقة والاضطرابات على البرامج المناعية. أ) تصميم التجربة ورسم بياني لتقييم تأثير مثبطات الإبيجينيتك على نشاط وهويات الخلايا النخاعية المرتبطة بالورم الدبقي. تم تجميع 25 GBO من MGH630 لكل حالة وتم تسلسلها. ب) مخطط للبرامج الأربعة للنشاط المناعي في الخلايا النخاعية المرتبطة بالورم الدبقي، مع الروابط البيئية الدقيقة، وتركيزات عوامل النسخ، والاضطرابات التي تم إثبات أنها تحفز أو تعكس تعبير البرنامج. أنواع الخلايا النخاعية الموضحة في كل ربع من البرنامج هي تقريب لتوزيع أنواع الخلايا التي تعبر عن المعنيين. برنامج. تم ملاحظة توزيع البرنامج عبر الأورام الخبيثة في الجهاز العصبي المركزي وغير المركزي. ج) مخططات الأعمدة لثراء مجموعة الجينات من بيانات تتبع سلالة الفئران (كيرشينباوم وآخرون). تم اشتقاق مجموعات الجينات من أفضل 100 جين في الخلايا النخاعية الأكثر ارتباطًا بالتسلل الحديث (الأقرب إلى 12 ساعة) أو أفضل 100 جين الأكثر ارتباطًا بالتسلل البعيد (التواجد في الورم لمدة تصل إلى 48 ساعة). تم أخذ قائمة الجينات من كيرشينباوم وآخرون. الجدول التكميلي 2، ورقة “Table_S3_Isotype_Control_Time”. تم توليد قيمة P بواسطة gProfiler.باستخدام الإعدادات الافتراضية مع مصفوفة مجموعة الجينات المخصصة المكونة من برامج cNMF الخاصة بنا. الائتمان: لوحة 96 بئر وأنبوب PBMC، شاليك، أ. (2005)https://BioRender.com/b15i535.
محفظة الطبيعة
المؤلف (المؤلفون) المراسلون: برادلي إي. برنشتاين
آخر تحديث من المؤلف(ين): 31/12/2024
ملخص التقرير
تسعى Nature Portfolio إلى تحسين إمكانية تكرار العمل الذي ننشره. يوفر هذا النموذج هيكلًا للاتساق والشفافية في التقرير. لمزيد من المعلومات حول سياسات Nature Portfolio، يرجى الاطلاع على سياسات التحرير وقائمة مراجعة سياسة التحرير.
الإحصائيات
لجميع التحليلات الإحصائية، تأكد من أن العناصر التالية موجودة في أسطورة الشكل، أسطورة الجدول، النص الرئيسي، أو قسم الطرق. غير متوفر □ □ □ تم التأكيد
حجم العينة بالضبطلكل مجموعة/شرط تجريبي، معطاة كرقم منفصل ووحدة قياس
بيان حول ما إذا كانت القياسات قد أُخذت من عينات متميزة أو ما إذا كانت نفس العينة قد تم قياسها عدة مرات اختبار(ات) الإحصاء المستخدمة وما إذا كانت أحادية الجانب أو ثنائية الجانب يجب أن تُوصف الاختبارات الشائعة فقط بالاسم؛ واصفًا التقنيات الأكثر تعقيدًا في قسم الطرق. □ وصف لجميع المتغيرات المرافقة التي تم اختبارها □ □ وصف لأي افتراضات أو تصحيحات، مثل اختبارات الطبيعية والتعديل للمقارنات المتعددة وصف كامل للمعلمات الإحصائية بما في ذلك الاتجاه المركزي (مثل المتوسطات) أو تقديرات أساسية أخرى (مثل معامل الانحدار) والتباين (مثل الانحراف المعياري) أو تقديرات عدم اليقين المرتبطة (مثل فترات الثقة) □
لاختبار الفرضية الصفرية، فإن إحصائية الاختبار (على سبيل المثال، ) مع فترات الثقة، أحجام التأثير، درجات الحرية وقيمة ملحوظة أعطِالقيم كقيم دقيقة كلما كان ذلك مناسبًا. □
لتحليل بايزي، معلومات حول اختيار القيم الأولية وإعدادات سلسلة ماركوف مونت كارلو □ لتصميمات هرمية ومعقدة، تحديد المستوى المناسب للاختبارات والتقارير الكاملة عن النتائج □ تقديرات أحجام التأثير (مثل حجم تأثير كوهين)بيرسون )، مما يشير إلى كيفية حسابها تحتوي مجموعتنا على الإنترنت حول الإحصائيات لعلماء الأحياء على مقالات تتناول العديد من النقاط المذكورة أعلاه.
البرمجيات والشيفرة
معلومات السياسة حول توفر كود الكمبيوتر
جمع البيانات
تحليل البيانات
تم جمع بيانات تحليل تدفق الخلايا باستخدام: BD LSRFortessa X-20 (BD Bioscience) باستخدام برنامج DIVA (BD Bioscience). تم الحصول على صور المناعة الفلورية باستخدام ميكروسكوب لايكا ثاندر مع برنامج LAS X الإصدار 3.8.2.27713 تم تسلسل مكتبات RNA-Sequencing الجماعية والفردية على أجهزة NextSeq500 (Illumina).
يمكن العثور على أداة لامعة لحساب استخدام برامج المايلويد المتفق عليها المقدمة لخلايا المايلويد المرتبطة بالورم الدبقي من تجارب أخرى في: https://github.com/BernsteinLab/Calculate_Myeloid_cNMF_Usage/ أدوات تحليل الجينوم المستخدمة: STARsolo V2.7.10b لمحاذاة scRNA-seq Seurat v4 لتحليل تسلسل RNA أحادي الخلية inferCNV V1.3.3 لتحديد CNVs في الخلايا الفردية تم استخدام cNMF V1.0.4 لتحديد البرنامج Signac V1.12.0 لتحليل scATAC-seq تم استخدام MACS2 V2.2.9.1 لاستدعاء قمم ATAC-Seq الجماعية monaLISA V1.11.4 لتحديد أنماط TF الغنية بشكل ملحوظ
برامج أخرى مستخدمة لتحليل البيانات: تم تحليل بيانات تدفق الخلايا باستخدام برنامج FlowJo (Treestar) الإصدار v10 تم تحليل جميع الصور النسيجية باستخدام برنامج تحليل الصور مفتوح المصدر Qupath الإصدار 0.4.3. يوفر قسم الطرق وصفًا مفصلًا لأساليب الحساب.
بالنسبة للمخطوطات التي تستخدم خوارزميات أو برامج مخصصة تكون مركزية في البحث ولكن لم يتم وصفها بعد في الأدبيات المنشورة، يجب أن تكون البرمجيات متاحة للمحررين والمراجعين. نحن نشجع بشدة على إيداع الشيفرة في مستودع مجتمعي (مثل GitHub). راجع إرشادات مجموعة Nature لتقديم الشيفرة والبرمجيات لمزيد من المعلومات.
بيانات
معلومات السياسة حول توفر البيانات
يجب أن تتضمن جميع المخطوطات بيانًا حول توفر البيانات. يجب أن يتضمن هذا البيان المعلومات التالية، حيثما ينطبق:
رموز الانضمام، معرفات فريدة، أو روابط ويب لمجموعات البيانات المتاحة للجمهور
وصف لأي قيود على توفر البيانات
بالنسبة لمجموعات البيانات السريرية أو بيانات الطرف الثالث، يرجى التأكد من أن البيان يتماشى مع سياستنا.
لكل بيانات تسلسل RNA أحادي الخلية (scRNA-seq) التي تم إنشاؤها لهذا المخطوط (مجموعة MGB ومجموعة الطفرات IDH من جامعة مكغيل)، تم إيداع البيانات الخام على مستوى الأفراد في dbGaP مع رقم الوصول للدراسة: phs003756.v1.p1 ويمكن تصفحها في صفحة تقرير دراسة dbGaP على:https://www.ncbi.nlm.nih.gov/projects/gap/cgi-bin/study.cgi? study_id=phs003756.v1.p1
البحث الذي يتضمن مشاركين بشريين، بياناتهم، أو مواد بيولوجية
معلومات السياسة حول الدراسات التي تشمل مشاركين بشريين أو بيانات بشرية. انظر أيضًا معلومات السياسة حول الجنس، الهوية/التقديم الجنسي، والتوجه الجنسي والعرق، والعرقية والعنصرية.
التقارير عن الجنس والنوع الاجتماعي
التقارير عن العرق أو الإثنية أو غيرها من المجموعات الاجتماعية ذات الصلة
خصائص السكان
تم جمع معلومات عن الجنس البيولوجي وتقريرها، ولكن لم يتم الإبلاغ عن أي تحليل في هذه المخطوطة. ومع ذلك، نحن نبلغ عن البيانات حيث ستكون هذه المجموعة من البيانات مصدرًا للمجال وقد يرغب الآخرون في إجراء تحليلات محددة حسب الجنس.
نحن لا نجمع ولا نبلغ عن العرق أو الإثنية أو أي تصنيفات اجتماعية ذات صلة.
نقدم الخصائص السكانية التالية، عند توفرها، للمرضى المدرجين في مجموعات بيانات الأورام البشرية التي تم تحليلها في هذه الدراسة: التشخيص، الدرجة، حالة الانتكاس، العمر، الجنس، الورم، الموقع، حالة IDH، طفرة IDH، ميثيلation MGMT، استخدام الستيرويد، الجرعة اليومية من الستيرويد. تم علاج جميع المرضى الذين يعانون من أورام متكررة بالعلاج الكيميائي والإشعاعي القياسي. يتم الإبلاغ عن هذه المعلومات السريرية في الجدول التكميلي 1.
التوظيف
الإشراف الأخلاقي
تم عرض موافقة المرضى البالغين من الذكور والإناث الذين يخضعون لجراحة الأعصاب لإزالة ورم دماغي في مستشفى ماساتشوستس العام أو مستشفى بريغهام والنساء على تخزين الأنسجة الجراحية الزائدة بموجب بروتوكول تخزين معتمد من لجنة الأخلاقيات. لم يتم استخدام أي معايير استبعاد بخلاف استعداد المريض أو وكيل المريض للموافقة على المشاركة. لا نتوقع أي تحيزات يتم إدخالها من خلال هذه الاستراتيجية في التوظيف والتي قد تؤثر على النتائج في هذه المخطوطة.
قدم المرضى البالغون من الذكور والإناث في مستشفى ماساتشوستس العام أو مستشفى بريغهام والنساء (MGB) موافقة مستنيرة قبل العملية للمشاركة في الدراسة في جميع الحالات بموجب بروتوكول مجلس المراجعة المؤسسية المعتمد DF/HCC 10-417. تم الحصول على موافقة المرضى في مجموعات أخرى وفقًا لطرقهم المنشورة. تم جمع بيانات المرضى غير المنشورة سابقًا من معهد مونتريال للأعصاب كما هو موضح مع أورام أخرى من جامعة مكغيل (انظر الطرق).
يرجى ملاحظة أنه يجب أيضًا تقديم معلومات كاملة حول الموافقة على بروتوكول الدراسة في المخطوطة.
التقارير المتخصصة في المجال
يرجى اختيار الخيار أدناه الذي يناسب بحثك بشكل أفضل. إذا لم تكن متأكدًا، اقرأ الأقسام المناسبة قبل اتخاذ قرارك. علوم الحياة العلوم السلوكية والاجتماعية □ العلوم السلوكية والاجتماعية □ العلوم البيئية والتطورية والبيئية □ □ العلوم البيئية والتطورية والبيئية
تصميم دراسة العلوم الحياتية
يجب على جميع الدراسات الإفصاح عن هذه النقاط حتى عندما يكون الإفصاح سلبياً.
حجم العينة
لم يتم إجراء أي تجارب سريرية أو دراسات على الحيوانات كجزء من هذه المخطوطة. تم اختيار حجم العينة من مجموعة الأورام الرئيسية التي تم تحليلها بواسطة scRNA-seq دون حسابات القوة، ولكن تم اختياره بناءً على الخبرة والتحليلات الأولية مع حجم عينة أصغر. مع وجود أقل من 20 ورمًا، تأثرت نتائج برنامجنا بإضافة أو طرح أورام فردية. للوصول إلى توافق لبرامج التعبير الجيني cNMF الخاصة بنا، أضفنا أيضًا مجموعات إضافية ثم وجدنا برامج متكررة عبر المجموعات لضمان عدم كونها محددة بالأورام. بالنسبة للتجارب الأخرى، سعينا لتحقيق ما لا يقل عن 3 تكرارات بيولوجية.
استثناءات البيانات
بشكل عام، تم تضمين جميع البيانات. في التحليلات التي تم استبعاد بيانات معينة منها، يتم ذكر ذلك بشكل صريح في النص و/أو الطرق.
التكرار
عدد النسخ لكل تجربة موضح في الأشكال أو أساطير الأشكال. تم تكرار جميع التجارب عدة مرات مع مرضى مختلفين أو مجموعات مختلفة كما هو مذكور في أساطير الأشكال والطرق. تم تأكيد العديد من النتائج الرئيسية باستخدام orth
التوزيع العشوائي
لم يتم إجراء أي تجارب سريرية أو دراسات على الحيوانات كجزء من هذه المخطوطة. بالنسبة للتجارب التي أجريت باستخدام الأورام العضوية للغليوبلاستوما (GBOs)، تم عشوائية GBOs الفردية إلى ظروف مختلفة من خلال الخلط في طبق واحد ثم توزيعها في طبق 96 بئر. بالنسبة لتجارب الجينوم، تم استخدام جميع العينات وبالتالي لم تكن هناك حاجة للعشوائية ولم يتم استخدامها.
مُعَمي
لم نقم بإجراء تجربة سريرية أو تجارب على الحيوانات كانت ستتطلب استراتيجيات إخفاء محددة. بالنسبة للتجارب الأخرى، مثل تحليل تدفق الخلايا، وتصوير المناعية الفلورية، وتجارب التسلسل التي تعتمد على قياسات موضوعية، لم يكن الإخفاء مطلوبًا حيث لم تكن النتائج مُقيّمة بشكل ذاتي.
التقارير عن مواد وأنظمة وطرق محددة
نحتاج إلى معلومات من المؤلفين حول بعض أنواع المواد والأنظمة التجريبية والأساليب المستخدمة في العديد من الدراسات. هنا، يرجى الإشارة إلى ما إذا كانت كل مادة أو نظام أو طريقة مدرجة ذات صلة بدراستك. إذا لم تكن متأكدًا مما إذا كان عنصر القائمة ينطبق على بحثك، يرجى قراءة القسم المناسب قبل اختيار رد.
المواد والأنظمة التجريبية
طرق
غير متوفر
مشارك في الدراسة
غير متوفر
□
أجسام مضادة X
إكس
إكس
□
□
إكس
□
إكس
إكس
□
إكس
□
إكس
□
إكس
□
الأجسام المضادة
الأجسام المضادة المستخدمة مضاد SOX2 [20G5] Abcam؛ رقم الكاتالوج Ab171380، RRID:AB_2732072 مضاد Iba1، أرنب (للتلوين المناعي الخلوي) فوجي فيلم واكو؛ رقم الكاتالوج# 019-19741، RRID:AB_839504 أجسام مضادة لـ CD3 إبسيلون [CD3-12] جينيتكس؛ رقم الكاتالوج GTX11089، RRID:AB_369097 مضاد كاسبيز-3 المنفصل (Asp175) #9661 من Cell Signaling؛ رقم الكاتالوج 9661، RRID:AB_2341188 مضاد الجسم متعدد النسائل P2Y12 (خارجي) من ثيرمو فيشر ساينتيفيك؛ رقم الكاتالوج PA5-111827، RRID:AB_2857236 أجسام مضادة وحيدة النسيلة CD45 (YAML501.4) من ثيرمو فيشر العلمية؛ رقم الكاتالوج MA5-17687، RRID:AB_2539077 الأجسام المضادة متعددة النسائل TMEM119 بروتين تك؛ الرقم المرجعي# 27585-1-AP، RRID:AB_2880915 أجسام مضادة أحادية النسيلة (Ab-1) مضادة لـ EGFR (528) من ميلبورو سيغما أجسام مضادة مضادة لـ VSIG4 المؤتلف [EPR22576-70] من أبكام؛ رقم الكاتالوج Ab252933 أجسام مضادة أحادية النسيلة من نوع CD163 للفئران، النسخة 2G12 من أوريجين؛ رقم الكاتالوج 50-167-6602، RRID:AB_2623740 مضاد Ki67 المضاد Abcam؛ رقم الكاتالوج Ab15580، RRID:AB_443209 أجسام مضادة أحادية النسيلة CD68 (KP1) ثيرمو؛ رقم الكاتالوج 14-0688-82، RRID:AB_11151139 مضاد MRC1(CD206) من Biolegend؛ رقم الكاتالوج # 321102، RRID:AB_571923 أجسام مضادة NRP1 (CD304) من ثيرمو؛ رقم الكاتالوج MA5-32179، RRID:AB_2809467 أجسام مضادة Nurr1 من ثيرمو؛ رقم الكاتالوج PA5-78097، RRID:AB_2736269 أجسام مضادة CD83 Biolegend؛ رقم الكاتالوج 305302، RRID:AB_314510 أجسام مضادة RHOB ثيرمو؛ رقم الكاتالوج # 711274، RRID:AB_2633147 أجسام مضادة CXCR4(CD184) من بيو ليجند؛ رقم الكاتالوج 306502، RRID:AB_314608 مضاد P2RY12-BV421 من Biolegend؛ رقم الكاتالوج 392106 أجسام مضادة NRP1(CD304) – PerCp-Cy5.5 Biolegend؛ رقم الكاتالوج # 304509 أجسام مضادة CD8-BV711 بيو ليجند؛ رقم الكاتالوج # 344374 أجسام مضادة TMEM119-AF488 Abcam؛ رقم الكاتالوج AB225497 أجسام مضادة CD163-PE Biolegend؛ الرقم المرجعي# 333606 أجسام مضادة CD11b-PE-Cy5 Biolegend؛ رقم الكاتالوج 301308
أجسام مضادة CD68-PE-Cy7 بيو ليجند؛ رقم الكاتالوج# 333816 مضاد TREM2-APC R&D؛ رقم الكاتالوج FAB17291A أجسام مضادة CD45-AF700 بيو ليجند؛ رقم الكاتالوج 304012 أجسام مضادة ICAM1(CD54) – باك بلو بيو ليجند؛ رقم الكاتالوج 332716 أجسام مضادة CD69-BV510 بيو ليجند؛ رقم الكاتالوج 310936 أجسام مضادة CXCR4-BV605 من بيو ليجند؛ رقم الكاتالوج 306522 أجسام مضادة CD16-BV711 بيو ليجند؛ رقم الكاتالوج 302044 أجسام مضادة CD68-BV785 بيو ليجند؛ رقم الكاتالوج # 333826 أجسام مضادة CD206-PE-Cy7 من بايو ليجند؛ رقم الكاتالوج 321124 أجسام مضادة CD83-APC بيو ليجند؛ رقم الكاتالوج 305312
التحقق تم شراء جميع الأجسام المضادة المستخدمة في تحليل التدفق الخلوي في هذه الدراسة من مصادر تجارية، وتم استخدام الأجسام المضادة المعتمدة بالكامل، بما في ذلك الأجسام المضادة المعتمدة من KO، عند توفرها. كما تم اختيار الأجسام المضادة المعتمدة بشكل جيد من قبل مختبرات أخرى عندما لم تكن الأجسام المضادة المعتمدة من قبل الشركة المصنعة متاحة. تم شراء جميع الأجسام المضادة المستخدمة في تحليل التدفق الخلوي من Biolegend، باستثناء TREM2 من R&D (المعتمدة مع مجموعات خلايا إيجابية وسلبية معروفة) وTMEM119 من Abcam (المعتمدة من KO بواسطة Abcam). وهي مناسبة لتحليلات التدفق الخلوي وتم توصيفها واعتمادها من قبل Biolegend. هذه المعلومات متاحة على مواقع الشركات المصنعة.https://www.biolegend.com/ar/quality/quality-controlلأغراض صبغ IF وIHC، تم إجراء ضوابط سلبية (صبغ الأجسام المضادة من نفس النوع والأجسام المضادة الثانوية).
النباتات
مخزونات البذور غير متوفر
أنماط جينية نباتية جديدة غير متوفر
المصادقة غير متوفر
تدفق الخلايا
المؤامرات
أكد أن:
توضح تسميات المحاور العلامة والفلوركروم المستخدم (مثل CD4-FITC). المقاييس على المحاور مرئية بوضوح. قم بتضمين الأرقام على المحاور فقط للرسم البياني في أسفل اليسار من المجموعة (المجموعة هي تحليل للعلامات المتطابقة). جميع الرسوم البيانية هي رسوم بيانية متساوية الارتفاع مع نقاط شاذة أو رسوم بيانية بالألوان الزائفة. تم توفير قيمة عددية لعدد الخلايا أو النسبة المئوية (مع الإحصائيات).
المنهجية
تحضير العينة تم إجراء تحليل تدفق الخلايا بناءً على بروتوكول سابق. باختصار، تم إعداد خليط من الأجسام المضادة بواسطةنسبة محلول الصبغة اللامعة (BD Horizon, 566349) وPBS، ثم تمت إضافة الأجسام المضادة/الأصباغ. تم غسل تعليقات الخلايا المفردة بواسطة PBS.تم استخدام BSA في أنابيب إيبندورف سعة 1.5 مل أو ألواح قاع U سعة 96 بئر. تم جمع الخلايا عن طريق الطرد المركزي في درجة حرارة الغرفة، بسرعة 300 × ج لمدة 5 دقائق. بعد إزالة محلول الغسيل، تم إعادة تعليق الخلايا في 100 ميكرولتر من خلطات الصبغة عن طريق السحب والضغط حوالي 10 مرات. تم تغطية الألواح أو الأنابيب لتجنب الضوء وتم صبغها في الظلام في درجة حرارة الغرفة لمدةتم غسل الخلايا بواسطة PBS + 0.5% BSA، وتم الطرد المركزي في درجة حرارة الغرفة، 300 × جرام لمدة 5 دقائق. تم إعادة تعليق راسب الخلايا في 200 ميكرولتر من PBS + 0.5% BSA.
آلة تمت معالجة تحليل تدفق الخلايا باستخدام جهاز BD LSRFortessa X-20 وفقًا لإجراءات التصنيع. تم استخدام كرات UltraComp eBeads (Invitrogen، 01-3333-42) للتهيئة المسبقة للتعويض.
برمجيات يتم استخدام FlowJo V 10 لمعالجة تحليل البيانات
وفرة تجمع الخلايا تم تحليل نقاء العينات المفروزة بواسطة قياس التدفق الخلوي على نفس الأجهزة المستخدمة في الفرز.
استراتيجية البوابة
تم تحديد جميع خلايا المناعة بناءً على FSC/SSC، باستخدام ضوابط PBMC لكل تجربة. تم تحديد الخلايا المفردة بناءً على FSC-a/FSC-h. تم استخدام صبغة Zombie NIR Live/Dead لتحديد الخلايا الحية.
في جميع تجارب الاضطراب GBO مع الخلايا النخاعية، تم تعريف الخلايا النخاعية على أنها CD45+/CD11b+. تم استخدام المونوسيتات غير المعالجة أو PBMCs كضوابط تصنيف لاختيار الخلايا النخاعية والسكان الثنائيين لتعريف السكان الإيجابيين للعلامة. كانت ضوابط التصنيف لـ TMEM119 و P2RY12.
قم بتحديد هذا المربع لتأكيد أنه تم تقديم رقم يوضح استراتيجية البوابة في المعلومات التكميلية.
قسم بيولوجيا السرطان، معهد دانا فاربر للسرطان، بوسطن، ماساتشوستس، الولايات المتحدة الأمريكية.معهد برود التابع لمعهد ماساتشوستس للتكنولوجيا وهارفارد، كامبريدج، ماساتشوستس، الولايات المتحدة الأمريكية.قسم علم الأمراض ومركز عائلة كرانتز لأبحاث السرطان، مستشفى ماساتشوستس العام وكلية هارفارد الطبية، بوسطن، ماساتشوستس، الولايات المتحدة الأمريكية.أقسام علم الخلايا وعلم الأمراض، كلية الطب بجامعة هارفارد، بوسطن، ماساتشوستس، الولايات المتحدة الأمريكية. مركز لودفيغ في كلية الطب بجامعة هارفارد، بوسطن، ماساتشوستس، الولايات المتحدة الأمريكية.معهد الهندسة الطبية والعلوم وقسم الكيمياء، معهد ماساتشوستس للتكنولوجيا، كامبريدج، ماساتشوستس، الولايات المتحدة الأمريكية.معهد كوتش لأبحاث السرطان التكاملية، معهد ماساتشوستس للتكنولوجيا، كامبريدج، ماساتشوستس، الولايات المتحدة الأمريكية.قسم جراحة الأعصاب، مستشفى بريغهام والنساء، بوسطن، ماساتشوستس، الولايات المتحدة الأمريكية.معهد راغون في مستشفى ماساتشوستس العام، معهد ماساتشوستس للتكنولوجيا وجامعة هارفارد، كامبريدج، ماساتشوستس، الولايات المتحدة الأمريكية.مركز الأورام العصبية، معهد دانا فاربر للسرطان وقسم الأعصاب، مستشفى بريغهام والنساء، بوسطن، ماساتشوستس، الولايات المتحدة الأمريكية. 11 قسم الأعصاب وجراحة الأعصاب، معهد مونتريال العصبي-المستشفى، جامعة مكغيل، مونتريال، كيبك، كندا.مختبر أبحاث الميكروبيئة وعلم المناعة، المركز الطبي – جامعة فرايبورغ، فرايبورغ، ألمانيا.قسم جراحة الأعصاب، كلية فاينبرغ للطب بجامعة نورث وسترن، شيكاغو، إلينوي، الولايات المتحدة الأمريكية.قسم جراحة الثدي، قسم الجراحة، مستشفى بريغهام والنساء، بوسطن، ماساتشوستس، الولايات المتحدة الأمريكية.العنوان الحالي: قسم علم الأمراض، جامعة كيس ويسترن ريزيرف، كلية الطب ومركز كيس الشامل للسرطان، كليفلاند، أوهايو، الولايات المتحدة الأمريكية.العنوان الحالي: مركز أبحاث أورام الدماغ، معهد مونتريال العصبي، جامعة مكغيل، مونتريال، كيبك، كندا.ساهم هؤلاء المؤلفون بالتساوي: تايلر إي. ميلر، شادي أ. الفران، تشارلز بي. كوتورييه.البريد الإلكتروني: bradley_bernstein@dfci.harvard.edu
Tyler E. Miller , Chadi A. El Farran , Charles P. Couturier , Zeyu Chen , Joshua P. D’Antonio , Julia Verga , Martin A. Villanueva , L. Nicolas Gonzalez Castro , Yuzhou Evelyn Tong , Tariq Al Saadi , Andrew N. Chiocca , Yuanyuan Zhang , David S. Fischer , Dieter Henrik Heiland , Jennifer L. Guerriero , Kevin Petrecca , Mario L. Suva , Alex K. Shalek & Bradley E. Bernstein
Gliomas are incurable malignancies notable for having an immunosuppressive microenvironment with abundant myeloid cells, the immunomodulatory phenotypes of which remain poorly defined . Here we systematically investigate these phenotypes by integrating single-cell RNA sequencing, chromatin accessibility, spatial transcriptomics and glioma organoid explant systems. We discovered four immunomodulatory expression programs: microglial inflammatory and scavenger immunosuppressive programs, which are both unique to primary brain tumours, and systemic inflammatory and complement immunosuppressive programs, which are also expressed by non-brain tumours. The programs are not contingent on myeloid cell type, developmental origin or tumour mutational state, but instead are driven by microenvironmental cues, including tumour hypoxia, interleukin-1 , TGF and standard-of-care dexamethasone treatment. Their relative expression can predict immunotherapy response and overall survival. By associating the respective programs with mediating genomic elements, transcription factors and signalling pathways, we uncover strategies for manipulating myeloid-cell phenotypes. Our study provides a framework to understand immunomodulation by myeloid cells in glioma and a foundation for the development of more-effective immunotherapies.
Diffuse gliomas are the most common primary malignant brain tumours and are ultimately fatal . Although immunotherapy has revolutionized the treatment of many cancers, gliomas represent a challenge for immunotherapy owing to the unique immune microenvironment of the brain, restricted access of systemic therapies, and the need to balance therapeutic immune responses with potentially fatal inflammation-induced oedema .
In many solid tumours, including glioma, myeloid cells can create an immunosuppressive microenvironment and are associated with poor prognosis . In gliomas, myeloid cells are the most prevalent non-malignant cell type, comprising up to of cells in a tumour . Tumour-associated myeloid cells can influence the molecular state of malignant cells as well as tumour-infiltrating T cells , which are the main effector cells of checkpoint blockade, vaccine and adoptive cell therapies. They can also recruit and suppress other myeloid cells .
However, the specific myeloid cell types and expression programs that orchestrate these functions remain to be determined.
Single-cell RNA sequencing (scRNA-seq) studies have documented a spectrum of malignant cell states in gliomas . Previous studies have also investigated myeloid cells in human and mouse gliomas . Even so, many questions remain. First, we lack consensus on the definition of myeloid-cell states and expression programs, or how they inform the clinical and biological features of gliomas. Myeloid cells have conventionally been classified and studied according to cell type: microglia, macrophage, monocyte, conventional dendritic cell (cDC) or neutrophil . However, evaluating their functional activities independent of cell type has been difficult and is poorly addressed by standard single-cell computational tools. Second, the developmental origins of myeloid cells are typically inferred to be microglia derived or bone-marrow derived on the basis of marker genes identified
from lineage-tracing experiments in mice . However, the origins of myeloid cells in human gliomas remain uncertain . Third, we lack an understanding of how interactions between myeloid cells and other malignant and non-malignant cells create niches and immune microenvironments. A final impediment pertains to experimental modelling. Tumour-associated macrophages change state quickly in monolayer culture, and mouse models fail to completely recapitulate microglia biology and macrophage programs in human tumours .
Here we sought to overcome these limitations through a comprehensive study of myeloid cells in human gliomas. We leveraged scRNA-seq data for 85 diverse gliomas and emerging computational methods to identify 4 dominant immunomodulatory programs shared across myeloid cell types. We then integrated lineage tracing, spatial transcriptomics, chromatin accessibility and ex vivo models to discover the origins, niches and drivers of these programs. Our analyses portray a dynamic and interconnected myeloid compartment that becomes highly immunosuppressive in response to microenvironmental cues and therapies. They provide a foundation for advancing diagnostic and immunotherapeutic strategies for gliomas.
Consensus myeloid expression programs
We used scRNA-seq to characterize immune and non-immune cell types in freshly resected human adult diffuse gliomas. We included a wide array of tumours, spanning isocitrate dehydrogenase (IDH)-mutant and wild-type (WT) tumours, primary and recurrent, and tumours exposed to different therapies. We combined 44 prospectively collected tumour profiles with 41 consolidated from previous publications . We divided these 85 profiles (Supplementary Table 1) into a discovery and a validation dataset, annotated cells based on marker-gene expression, and called copy number alterations to distinguish malignant cells (Fig. 1a, Extended Data Fig. 1a-c and Methods).
To discover the consensus gene-expression programs in myeloid cells, we used an unbiased method, consensus non-negative matrix factorization (cNMF), to identify sets of genes, which we call programs, that were coordinately regulated across myeloid cells in each cohort of our discovery dataset. Hierarchical clustering of these programs identified recurrent expression programs found in all 3 cohorts, from which we derived 14 consensus gene programs. These consensus programs were found across our representative set of 85 gliomas and were recapitulated in our validation cohort (Fig. 1a,b, Extended Data Fig. 1 and Supplementary Table 2).
The consensus programs included cell-identity programs and cellactivity programs (Fig. 1c). The identity programs contain classical marker genes for myeloid cell types, including microglia, macrophages, monocytes, dendritic cells and neutrophils. To compare the tumourassociated monocyte program with peripheral monocytes, we performed scRNA-seq on myeloid cells from 17 matched blood samples, and identified 3 peripheral monocyte programs (CD14 and CD163 ). The tumour-associated monocyte program shared features with the and programs in peripheral monocytes but not with the program (Extended Data Fig. 2a). It also included genes involved in cell adhesion, migration, differentiation and initial inflammatory response (for example, VCAN, FCN1, LYZ, CD44 and CCR2), which indicates that the monocytes are undergoing differentiation in the tumour tissue.
Four principal immunomodulatory programs
The cNMF cell-type programs were complemented by nine activity programs. Five of these correspond to known cellular programs composed of classical marker genes for responses to hypoxia, interferon, unfolded proteins or the cell cycle. The other four programs contain genes with immunomodulatory functions and could be split into two inflammatory and two immunosuppressive programs. One inflammatory program,
which we named the ‘systemic inflammatory’ program, includes genes encoding cytokines and chemokines that have established roles in myeloid-cell recruitment and systemic inflammatory responses (IL1B, IL1A, CCL2, TNF, OSM and CXCL8). A ‘microglial inflammatory’ program includes genes involved in lymphocyte and monocyte recruitment (CXCR4, CXCL12, CCL3, CCL4 and CX3CR1), stress responses (RHOB, JUN, KLF2 and EGR1) and neural-interaction genes (PDK4 and P2RY13). On the immunosuppressive side, the ‘complement immunosuppressive’ program includes genes that encode complement factors implicated in wound resolution and anti-inflammatory cytokine responses and associated with immunosuppression in other tumours (C1QA, C1QB, and ), as well as other established immunosuppressive markers (VSIG4 and CD163) . Finally, the ‘scavenger immunosuppressive’ program includes genes encoding scavenger receptors (MRC1 (also known as CD206), MSR1 (also known as CD204), CD163,LYVE1, COLEC12 and STAB1) and other potentially immunosuppressive genes (NRP1, RNASE1 and CTSB). Many of these genes have been shown to suppress T cell function, including CD163 (ref. 28) and VSIG4 (ref. 27), which inhibit T cell proliferation, and MSR1, which suppresses STAT1 signalling .
Immunomodulatory programs are shared
The immunomodulatory programs were the most widely utilized cNMF programs, with of glioma-associated myeloid cells expressing one of the four programs (Fig. 1d). All four programs were expressed across multiple cell types (Extended Data Fig. 2b-d and Supplementary Note 1), and the systemic inflammatory program was found in subsets of all myeloid-cell types. Each myeloid cell type can use more than one program. For example, macrophages can express any of the four immunomodulatory programs but are enriched for the two immunosuppressive programs. Microglia can express both inflammatory programs and the complement immunosuppressive program, but they rarely express the scavenger immunosuppressive program.
This widespread but differential immunomodulatory-program usage across the myeloid cell types was a prominent feature in our systematic cNMF analysis of the 183,062 myeloid cells from 85 tumours (Fig.1c-f, Extended Data Fig. 2e-h and Supplementary Note 2). However, when we reanalysed these single-cell data using standard Louvain clustering and uniform manifold approximation and projection (UMAP) visualization, the immunomodulatory programs were not recapitulated. These conventional approaches, which treat cells as singular units and cluster them by similarity to other cells, organized the data primarily by cell type and failed to capture the activity programs (Extended Data Fig. 3).
Consistently, exhaustive comparisons with previously published literature confirmed that the cNMF immunomodulatory programs are distinct from reported myeloid cell states and gene sets, which were derived through whole-cell clustering methods. For example, a reported state for suppressive macrophage-1 (ref.7) reflects a composite of the cNMF macrophage program with our two immunosuppressive programs, and a reported state for inflammatory microglia aggregates the cNMF microglia with our two inflammatory programs (Extended Data Fig. 3d,e). A simple overlap of gene sets from previous studies shows a similar pattern of composite program usage, with prior studies each deriving different gene sets based on how they partitioned closely related cells (Extended Data Fig. 4a-d).
These analyses indicate that our cNMF programs represent fundamental components of myeloid cells that cannot be distinguished by conventional clustering. The power of cNMF to isolate activity programs from cell type enabled us to take an activity-centric approach to our investigations of tumour-associated myeloid cells, and we focused our further investigations on the functional and physiological consequences of the four dominant immunomodulatory programs.
Fig.1|See next page for caption.
Fig. 1|Identification of consensus superimposable myeloid-cell identity and activity programs. a, Analysis pipeline for identifying recurrent myeloid programs across three discovery glioma cohorts. Mut, mutant. b, Heatmap depicting similarity of the gene spectra scores of each program in the three discovery cohorts. Consensus programs created from their average scores are also included. HS-UPR, heat shock-unfolded protein response; IFN, interferon. c, Heatmap depicting expression of genes in recurrent myeloid programs (rows) in single cells (columns) grouped by cell type, as defined by myeloid-identity program usage. Intermediate (Int) cells express both adjacent identity programs. Right, selected marker genes for each program. d, Box plots depicting the percentage of cells per tumour that express the corresponding myeloid program (far left in c) across the three discovery cohorts. The line represents the median
and boxes represent the first and third quartiles; tumours, 91,523 myeloid cells. e, Quadrant plot positioning myeloid cells from the discovery and validation cohorts according to their relative expression of four prominent immunomodulatory programs. Diagonal axes correspond to the differential between microglial inflammatory and scavenger immunosuppressive program usage or between systemic inflammatory and complement immunosuppressive program usage. Programs at opposite ends of the diagonal axes are largely exclusive in individual cells. Each dot is a small pie chart depicting the prevalence of each immunomodulatory program (colours) and the combination of all other programs (grey) in that cell.f, Quadrant plots depicting myeloid cell identity usage for cells positioned as in e. Four prominent immunomodulatory activity programs are each used across multiple myeloid cell types.
Immunomodulatory states span CNS tumours
All 4 immunomodulatory programs were detectable in subsets of myeloid cells in all 85 gliomas, which included tumours that were IDH-mutant, IDH-WT, primary, recurrent, low-grade, high-grade, representative of varied mutations and treated with different therapies (Fig. 1c,d and Extended Data Figs. 1d and 2g,h). To examine the programs in other central nervous system (CNS) and non-CNS tumours, we collated published scRNA-seq datasets and calculated program usages in the myeloid cells (Extended Data Fig. 4e). In other primary CNS tumours, including paediatric gliomas and ependymomas, the full set of immunomodulatory programs were represented. However, examination of myeloid cells from non-CNS tumours yielded a different result. The systemic inflammatory and complement immunosuppressive programs were present in essentially all tumour types, but the microglial inflammatory and scavenger immunosuppressive programs were largely specific to CNS tumours. Notably, the myeloid compartments of brain metastases of non-CNS tumours recapitulated the originating tumours and were largely devoid of the microglial inflammatory and scavenger immunosuppressive programs. Finally, myeloid cells from non-neoplastic brains expressed three of the immunomodulatory programs, with only the scavenger immunosuppressive program being absent, further supporting its specificity to primary CNS tumours. These results indicate that gliomas have a unique myeloid environment with a prominent and specific immunosuppressive phenotype that is largely absent from non-CNS tumours and their brain metastases.
Origins and plasticity of myeloid states
We next considered the inter-relationships between developmental origin, myeloid cell type and immunomodulatory phenotypes. Webegan by inferring the lineage relationships and origins of individual myeloid cells from their mitochondrial DNA mutations. We used MAESTER to call mitochondrial DNA mutations in tumour-associated myeloid cells and matched peripheral blood monocytes from four patients. We presumed that myeloid cells in the tumour that had peripheral blood variants were blood derived. By contrast, those with distinct variants were likely to represent resident microglia-derived myeloid cells in the brain (Extended Data Fig. 5a-c). Consistent with our expectations, we found that cells expressing a microglia program were most likely to harbour resident cell-specific variants, whereas other myeloid cell types were more likely to have peripheral blood variants. Intermediate cells that co-express microglia and macrophage programs were also enriched for peripheral variants. These findings indicate that bone-marrow-derived myeloid cells can activate a microglia-like phenotype in tumours. The immunomodulatory programs also manifested across the different cell identities and presumed origins, a further indication that myeloid cells maintain substantial epigenetic plasticity.
These results prompted us to test the peripheral blood myeloid cells from patients with glioma for expression of the activity programs. Of the four immunomodulatory programs, only the systemic
inflammatory program was detected, strongly suggesting that myeloid activity states must shift on tumour infiltration (Extended Data Fig. 2a).
To evaluate the capacity of bone-marrow-derived peripheral cells to acquire glioma-associated myeloid phenotypes, we leveraged a glioma organoid (GBO) system . GBOs were established from resected tumours and passaged to deplete all the immune cells. Matched peripheral blood mononuclear cells (PBMCs) were then applied to GBOs. After one week of co-culture, the GBOs were extensively infiltrated by myeloid cells (Extended Data Fig. 5d-h and Methods). Although many of the myeloid cells differentiated towards a macrophage phenotype, subsets of infiltrating myeloid cells upregulated canonical microglia markers (TMEM119 and P2RY12), confirming that peripheral monocytes can acquire features of tissue-resident microglia. By contrast, myeloid cells that remained outside the organoids were much less likely to express these markers. Immunohistochemistry confirmed that there was robust infiltration of immune cells, including myeloid cells expressing both microglia markers.
Together, these data indicate that blood-derived monocytes can activate all the glioma-associated myeloid programs, including the microglia program. They can also engage four distinct immunomodulatory programs, despite our observation that peripheral blood myeloid cells from patients with glioma can activate only one. They demonstrate that expression of immunomodulatory programs is not contingent on developmental origin or cell type, and highlight the plasticity of myeloid cells in the glioma microenvironment.
Myeloid states linked to tumour niches
To investigate potential microenvironmental drivers of the myeloid programs, we integrated our scRNA-seq data with Visium spatial transcriptomic data fromglioblastomas . We first identified a set of spatial gene programs that captured the transcriptomic heterogeneity across 68,830 spots in 23 sections (Extended Data Fig. 6a,b and Methods). This distinguished six prominent ‘niche programs’ that included grey- and white-matter structural niches, hypoxic and vascular metabolic niches, a niche composed of proliferative cancer cells, and an inflammatory niche composed of immune cells and reactive astrocytic genes. In parallel, we estimated the cellular content of each spot by quantifying the expression of our cNMF programs . These spatial analyses revealed clear niche-specific patterns of myeloid programs, cancer cell programs and other cell types in the tumours (Fig. 2a and Extended Data Fig. 6a,c).
To collate recurrent spatial relationships, we computed spatial correlations between cellular and niche programs across all Visium tumour sections. This revealed robust niche-niche, niche-cell and cell-cell associations (Fig. 2b,c and Extended Data Fig. 6d-f). The niche-niche relationships revealed a recurrent architecture in which a hypoxic niche is flanked by an inflammatory niche, which in turn is adjacent to a proliferative cancer niche that then runs into white matter, which is consistent with the clinical observation that most gliomas are present in white matter .The hypoxic and inflammatory niches were also flanked by vascular niches, indicative of vascular proliferation in response
Fig. 2 | Immunomodulatory myeloid programs associated with spatial
tumour niches. a, Scatter pie plot (left) of a representative Visium section of a glioma specimen from ref.32. Each pie chart depicts expression of the indicated tumour niche programs (colours) in a spot. The scatter plots (right) show the same section with spots shaded by expression of the indicated cNMF myeloid cell or malignant cell program.AC, astrocyte; MES, mesenchymal; NPC, neural progenitor cell; OPC, oligodendrocyte progenitor cell; prolif., proliferative.b, Dot plot depicting intraspot correlation between niche and
cell program scores, calculated independently for each sample. The dot size shows the proportion of samples with a significant correlation (adjusted , two-sided, from Pearson correlation probability density function) and the colour indicates a positive (red) or negative (blue) correlation. c, Cell-niche map illustrating the conserved spatial relationships of myeloid, malignant and neural cell types (circles) and transcriptomic niches (shaded areas) across spatial samples. These spatial analyses show that the immunomodulatory myeloid programs are enriched in distinct niches in a conserved tumour architecture.
to hypoxia and potentially representing an entry point for immune infiltration. These patterns are largely consistent with recent reports .
Hypoxia was also organizing for the myeloid programs. The scavenger immunosuppressive program was enriched in vascular and hypoxic niches, whereas the complement immunosuppressive program was excluded from hypoxic niches and associated with surrounding inflammatory and vascular niches. The systemic inflammatory program was associated with hypoxic and inflammatory niches, and the microglial inflammatory program was enriched in inflammatory and vascular niches. Microglia were excluded from
hypoxic niches but were found throughout the rest of the tumour field.
These spatial analyses indicated a particularly robust role for the scavenger immunosuppressive program in the glioma microenvironment. A spatial regression model of cell-cell relationships identified multiple interactions between the scavenger immunosuppressive program and nearly every cell program in the hypoxic and vascular niches, including the MES2, MES1 and monocyte programs. We validated these connections orthogonally using the scRNA-seq dataset, which revealed that average usage of these programs was highly correlated with the
scavenger immunosuppressive program across surgical samples (Extended Data Fig. 6g). Overall, spatial analyses highlight specific associations between immunomodulatory myeloid programs and tumour niches, and indicate that the scavenger immunosuppressive program may be a key determinant of the tumour microenvironment.
Clinical correlates of myeloid programs
We next investigated whether the myeloid cell identities and immunomodulatory programs correlate with clinical factors such as mutational status and therapies. Previous studies have reported increased inflammatory phenotypes in IDH-mutant tumours, a finding attributed to the oncometabolite 2-hydroxyglutarate . We consistently found that IDH-mutant tumours have a distinct composition of our immunomodulatory programs, characterized by strong enrichment of the microglial inflammatory program and depletion of both immunosuppressive programs (Extended Data Fig. 7a-c). However, this distinction was most strongly associated with tumour grade, rather than IDH mutation, as the myeloid composition of grade 4 IDH-mutant tumours closely approximated that of grade 4 IDH-WT tumours (Fig. 3a and Extended Data Fig. 7d,e). Moreover, examination of a larger cohort revealed that the myeloid program composition of low-grade IDH-WT tumours (as per the 2016 WHO classification) mirrored that of low-grade IDH-mutant tumours (Fig. 3b and Supplementary Note 3). As a result, purported differences in the myeloid compartment of IDH-mutant and IDH-WT tumours are more likely to reflect the tumour grade.
We also investigated whether clinical therapies affect myeloid states. We first compared program composition in primary tumours versus recurrent tumours, all of which had previous tumour-targeting therapy, but we found no significant changes when controlling for grade. However, we did find that the complement immunosuppressive program is specifically and significantly associated with dexamethasone (Dex). Dex is a potent corticosteroid that is routinely administered to patients with glioma to reduce vasogenic oedema in the brain preand post-operatively. The complement immunosuppressive program increases with escalating dexamethasone dose and is significantly reduced in untreated tumours when controlling for hypoxia, which prevents the anti-inflammatory effects of glucocorticoids in myeloid cells (Fig. 3c-e and Extended Data Fig. 8a).
The observation that glioma-associated myeloid cells and programs are derived from infiltrating monocytes indicates that Dex phenotypes may initially arise in peripheral monocytes. Indeed, when we examined scRNA-seq data for peripheral monocytes, we identified a potentially immunosuppressive program that was specifically increased in patients treated with Dex. This program includes CD163 and some other markers found in the complement immunosuppressive program, raising the possibility that this is a precursor program that further develops in the tumour. In support of this, we observed a positive correlation between the Dex-related program in circulating monocytes and the complement immunosuppressive program in tumour-associated monocytes from the same patient (Extended Data Fig. 8b,c).
Myeloid cells and immunotherapy response
We also related our myeloid programs to immunotherapy response, tumour immune state and overall survival. A recent scRNA-seq study of 12 patients with glioma treated with neoadjuvant PD1 blockade identified a population of SIGLEC9-expressing macrophages that were associated with non-responsive tumours . Reanalysis of these data using our cNMF framework revealed that SIGLEC9-positive cells were heterogeneous in their expression of our immunomodulatory programs. Notably, only the SIGLEC9-positive cells expressing the scavenger immunosuppressive program were enriched in non-responders. Moreover, the scavenger immunosuppressive program was more closely associated with non-responding gliomas than SIGLEC9 alone (Fig. 3f,g and Extended
Data Fig. 8d-f), indicating that this immunosuppressive program may more accurately explain the refractory phenotype. We did not detect a significant association between immunotherapy response in this cohort and any of our other programs or previously published gene sets of myeloid cell state (Extended Data Fig. 9a-c).
To expand this association to a broader range of tumours, we examined regulatory cells as a proxy for an immunosuppressive environment and poor immune responses . Samples with high cell frequency were enriched for myeloid cells expressing the scavenger and complement immunosuppressive programs but depleted of microglial inflammatory-expressing cells (Fig. 3h). We also detected a spatial association between cells and the complement immunosuppressive program. By contrast, T cells with naive/memory expression signatures were spatially associated with hypoxic niches and the scavenger immunosuppressive program (Fig. 2b and Extended Data Fig. 6e,f). Hence, the respective myeloid programs are associated with distinct T cell enrichments and immune microenvironments.
Finally, we investigated whether our immunomodulatory programs were associated with overall survival. We used the top genes in each program to score IDH-WT glioblastomas in consortium cohorts and adjusted the results on the basis of estimated myeloid content (Methods). We found that the scavenger immunosuppressive program was significantly associated with worse overall survival. Such a significant association was not seen with any of our other myeloid activity programs, nor with previously published myeloid gene sets (Fig. 3i and Extended Data Fig. 9d).
These collective analyses implicate the glioma-specific scavenger immunosuppressive program as a critical determinant of the T cell immune microenvironment, response to checkpoint therapy and overall survival.
Regulators of immunomodulatory programs
We next sought to associate the immunomodulatory expression programs with gene regulatory elements and upstream transcription factors (TFs) (Fig. 4 and Extended Data Fig. 10). We extracted chromatin accessibility profiles for 36,675 individual myeloid cells across 20 human gliomas from a public compendium of single-nucleus assay for transposase-accessible chromatin with sequencing (snATAC-seq) data . We calculated program usage for each myeloid cell on the basis of inferred gene activity scores (Methods). We then created pseudobulk accessibility profiles for each immunomodulatory program by aggregating cells with the highest program usage. Clustering on differentially accessible sites revealed putative program-specific promoters and enhancers (Fig. 4a,b and Extended Data Fig. 10a,b).
A scan of these accessible elements identified TF-binding motifs associated with specific immunomodulatory programs. We complemented these motif scans with single-cell regulatory network inference and clustering (SCENIC) , an orthogonal strategy for connecting expression programs to TF networks. These analyses revealed robust associations between the systemic inflammatory program and NF-кB-related TFs. Moreover, the scavenger immunosuppressive program elements were strongly enriched for AP-1 motifs, with order-of-magnitude higher significance scores than systemic inflammatory (Fig. 4b,c). These associations with putative regulatory elements and prominent TF families provided insight into the networks and regulators that drive immunosuppressive myeloid programs in glioma.
Feedback interplay among myeloid states
We also examined signalling pathways and environmental ligands with the potential to drive the immunomodulatory programs and associated TFs. Integrating our scRNA-seq data with the NicheNet database revealed ligands expressed in our tumours that can activate these TFs. Top-ranked ligands associated with NF-кB signalling included interleukin- (IL-1 ),
Fig.3|See next page for caption.
Fig. 3 | Clinical correlates of immunomodulatory myeloid programs.
a, Quadrant plot with myeloid cells positioned as in Fig. 1e and coloured by the grade of the originating tumour. , Box plot depicting the distribution of microglial inflammatory program module scores computed for 484 glioma datasets. For all the box plots in this figure, each dot represents a tumour, and lines represent median and quartiles. The whiskers represent 1.5 times the interquartile range. False discovery rate (FDR)-corrected -values were calculated using two-sided Wilcoxon rank sum tests: , *** ; NS, not significant. Not all comparisons are shown. GBM, glioblastoma; LGG, low-grade glioma. c, Dot plot depicting the linear regression coefficient between the average usage of each myeloid program per glioma sample and the corresponding patient’s pre-surgery daily Dex dose. -values are from ordinary least-squares regression model. d, Box plot showing average complement immunosuppressive program usage in glioma samples stratified by Dex dose; IDH-WT glioma; -values calculated using a
two-sided Wilcoxon rank sum test.e, Box plot showing average usage of programs in glioma samples stratified by Dex use (hypoxic samples excluded). -values were calculated using two-sided Wilcoxon rank sum tests. f, Box plot depicting the percentage of cells expressing the scavenger immunosuppressive program across glioma specimens from an anti-PD1 immunotherapy trial , stratified by response ( , FDR when considering all measurements in Extended Data Fig. ). , Quadrant plots positioning the individual myeloid cells in from radiographic response (left) and non-response (right) samples according to their expression of the immunomodulatory programs. h, Dot plot depicting the association between the indicated programs and cell abundance across 85 gliomas. Adj. -value, adjusted -value. i, KaplanMeyer curve of overall survival for IDH-WT glioblastomas stratified by scavenger immunosuppressive program expression in GLASS and GSAM cohorts. The -value was calculated using a two-sided log-rank test.
TNF, CCL2, IL-1 and IFN . The AP-1 module was associated with IL-1 , TNF, PLAU, OSM, IL-10, IL-6 and TGF (Fig. 4d,e and Extended Data Fig.10c). Notably, systemic inflammatory program myeloid cells expressed many ligands that were predicted to activate AP-1 signalling and may therefore potentiate the scavenger immunosuppressive program.
We used the GBOs to test directly whether ligands expressed by the systemic inflammatory program impact the scavenger immunosuppressive program. We applied peripheral monocytes to GBOs distributed across a 96-well plate and cultured them for 5 days in the presence of various ligands. We then collected the organoids and assessed the myeloid programs by flow cytometry and immunohistochemistry of key protein markers (Fig. 5a). IL-1 and TGF both induced scavenger immunosuppressive markers, with IL-1 inducing a more than four-fold increase over control. Conversely, IFN increased the proportions of cells expressing systemic inflammatory markers and reduced immunosuppressive markers (Fig. 5b).
These predictions and experimental validations identified specific ligands in the glioma microenvironment that had opposite effects on the systemic inflammatory and scavenger immunosuppressive programs. They also indicate that systemic inflammatory ligands may promote the scavenger immunosuppressive program, which is potentially indicative of feedback interplay that restrains inflammation in CNS tumours.
Dex induces durable immunosuppression
In contrast to the systemic and scavenger programs, our analyses did not identify specific TFs or ligands that were strongly associated with the complement immunosuppressive program. However, the close clinical association of the program with Dex treatment prompted us to investigate this connection using GBOs. We found that Dex specifically and significantly induced the complement immunosuppressive program, without affecting the scavenger immunosuppressive program. This effect was evident in fresh GBOs with endogenous myeloid cells and in passaged GBOs infiltrated with peripheral blood myeloid cells ex vivo (Fig. 5b,c and Extended Data Fig. 11a-e).
Dex affects transcriptional activity by driving nuclear translocation and DNA binding of the glucocorticoid receptor (GR). We evaluated direct GR targets using public chromatin immunoprecipitation with sequencing (ChIP-seq) and RNA-seq data for cultured human macrophages treated with Dex for . The RNA-seq data confirmed rapid upregulation of top complement program genes, many of which were direct GR binding targets using ChIP-seq (Fig. 4f-h). By contrast, genes that were downregulated by Dex lacked evidence of GR binding. Instead, they were associated with the NF-кB pathway and, by extension, with our systemic inflammatory program (Fig. 4f and Extended Data Fig.10d,e). This is consistent with murine studies demonstrating GR-mediated suppression of NF-кB activity through the upregulation of NF-кB inhibitors . Indeed, our analyses identified the NF-кB inhibitor TNFAIP3 as a direct GR target that is rapidly induced by Dex treatment.
Finally, we investigated whether this Dex-induced immunosuppressive phenotype is reversible. This is an important clinical question given that the vast majority of patients with glioma receive corticosteroids perioperatively and that immunotherapy trials are typically initiated after a short Dex cessation period. We applied Dex to myeloid-cell-infiltrated GBOs for two days and then washed out Dex. However, complement immunosuppressive program expression did not reverse even two weeks after drug withdrawal (Fig. 5c and Extended Data Fig. 11f). Although adding IFN to the GBOs partly reversed the Dex-induced state change, overall complement immunosuppressive program usage remained high. We also tested whether the effect of Dex on peripheral monocytes was sustained after they entered the tumour. We found that Dex rapidly induced complement markers in peripheral monocytes, and that these changes were sustained as the monocytes differentiated in the GBOs, even after Dex withdrawal (Extended Data Fig. 11g).
Altogether, these data indicate that Dex drives the complement immunosuppressive program through combined induction of hormone-responsive GR targets and suppression of the default NF-кB-associated systemic inflammatory program. The results highlight the plasticity of myeloid cell states during glioma infiltration, differentiation and therapy, but they also demonstrate the remarkable durability of the Dex-induced immunosuppressive state whose irreversibility has major clinical implications.
Targeting of AP-1 and the scavenger program by p300i
Given the prominent roles of the scavenger immunosuppressive program as a suppressor of inflammation and immune responses in glioma, we explored whether it could be reprogrammed to create a more inflammatory microenvironment. Using GBOs from freshly resected tumours, we tested chemical inhibitors of epigenetic regulators for their effects on program usage (Extended Data Fig.12a). We found that GNE-781, a selective p300/CBP bromodomain inhibitor (p300i) , had the most striking effect on the immunomodulatory phenotypes. Treatment with GNE-781 for seven days strongly reduced scavenger immunosuppressive program usage, with a compensatory increase in the systemic inflammatory program (Fig. 5d).
To investigate the mechanisms by which GNE-781 moderates the immunosuppressive program, we performed ATAC-seq on myeloid cells isolated from the treated organoids. Loci with reduced accessibility in GNE-781-treated samples were strongly enriched for AP-1 motifs (Fig.5e). This is consistent with previous studies that implicated p300/CBP in the activation of AP-1 targets and probably explains the striking reduction in the scavenger immunosuppressive program. Conversely, the set of sites whose accessibility increased following GNE-781 treatment were enriched for NF-кB-related motifs, consistent with a previous study that associated CBP/p300 with myeloid-derived suppressor cells and with our observed shift in the myeloid expression phenotypes from immunosuppressive
Fig. 4 | Regulatory circuits associated with immunomodulatory myeloid programs.a, Heatmap depicting the accessibility of candidate regulatory loci (rows) associated with each immunomodulatory program in pseudobulk profiles aggregated from snATAC-seq data for glioma-associated myeloid cells with preferential expression of a single program (columns). Norm., normalized. b, Heatmap depicting enrichment of the indicated TF motifs (rows) in accessible elements associated with each program (columns). -values were calculated using one-sided Fisher’s exact test.c, Heatmap displaying the specificity scores for TF regulons (rows) in cells with discrete immunomodulatory program usage (columns). Scores were calculated from scRNA-seq by SCENIC.d,e, Bar charts showing the expression of ligands predicted to target TFs of the system
to systemic inflammatory. These data support our hypothesis that high AP-1 signalling is a driver of the scavenger immunosuppressive program, and also nominate a therapeutic strategy with the potential to reprogram the unique immune microenvironment in gliomas (Fig. 5f).
Discussion
Our study highlights the plasticity of glioma-associated myeloid cells and the critical impact of the local microenvironment and niche on their phenotypes. By decomposing single-cell transcriptomes into discrete expression programs using cNMF, we disentangled cell identity from
inflammatory program(d) or the scavenger immunosuppressive program(e). Values indicate expression in the program with the highest expression of the ligand (indicated by bar colour). f, Volcano plot depicting differentially expressed genes in macrophages treated with Dex for 24 h (ref. 43 ). The top 20 genes in each program are plotted and coloured according to the program.g, Genomic view showing snATAC profiles aggregated for each program over the top GR target loci. The GR ChIP-seq data in the bottom row show top GR-bound loci.h, Dot plot showing GR binding signal over rank-ordered target sites. Selected complement immunosuppressive program genes near GR target sites are labelled. Together, epigenetic data shed light on the TF regulatory mechanisms underlying immunomodulatory program expression in glioma-associated myeloid cells.
cell activity, the fundamental components of myeloid-cell phenotypes. This revealed biological insights that are obscured in gene signatures derived from Louvain/Leiden clusters, which conflate co-expressed programs. Although myeloid cells have typically been classified by cell type or ontogeny, we found neither to be major determinants of their activity in gliomas. Instead, different myeloid cell types can each actuate the same four immunomodulatory programs, which probably determine the overall immune state. Indeed, clinical correlates indicate that these immunomodulatory programs potently modulate immune responses and patient outcomes. Functional investigations reveal TF circuits, signalling pathways and ligands that mediate interplay and
Fig. 5 | Functional induction and reversal of immunosuppressive programs. a,b, Experimental design and bar plots of flow results from ligand perturbation experiments of IL- and TGF , which specifically induce the scavenger immunosuppressive program (a) and Dex and IFN , which specifically induce the complement immunosuppressive program and systemic inflammatory programs, respectively (b). Data points represent individual GBOs. Plots show mean ± s.d. -values for induction over control were calculated using Fisher’s exact test;* . c, Experimental design and flow-cytometry results from evaluations of the durability of the Dex phenotype. Bar plots show mean signal ± s.d. Data points each represent two pooled GBOs. FACS, fluorescence-activated cell sorting; MFI, mean fluorescence intensity.
d, Experimental design and results for p300i treatments of GBOs. Bars represent
a combination of inflammatory programs (red) or immunosuppressive programs (blue) computed from scRNA-seq. , calculated by twotailed Student’s -test of change in suppressive program versus change in inflammatory program across three samples. e, Heatmaps depict differentially accessible candidate regulatory elements between myeloid cells treated with p300i or DMSO control. TF motifs enriched in the differential elements are shown on the right. -values were calculated using one-sided Fisher’s exact test.f, Schematic depicting the interconnected feedback loops of the immunomodulatory programs and the cytokines, TFs and small molecules that can affect them. 96-well plate ( and d) and PBMC tube (a) created in BioRender.Shalek, A. (2005) https://BioRender.com/b15i535.
balance the respective programs to maintain an immunosuppressive microenvironment.
The four programs have unique associations, niches and drivers but are highly interconnected (Extended Data Fig. 12b). The microglial inflammatory program is emblematic of myeloid plasticity in the brain microenvironment. Despite including classical microglia markers, it is also actuated in subsets of macrophages and dendritic cells derived from infiltrating monocytes. By contrast, the systemic inflammatory program is evident in peripheral monocytes from patients with glioma. In the glioma microenvironment, infiltrating systemic inflammatory cells produce high levels of IL-1 that can induce the glioma-specific scavenger immunosuppressive program, potentially creating a feedback loop that moderates brain inflammation. Notably, a p300/CBP
inhibitor downregulates this immunosuppressive program and associated AP-1 signatures, restoring the default inflammatory program. A final program, complement immunosuppressive, actuates different genes and circuits, and occupies distinct glioma niches. It is driven by GR signalling, which can be activated by endogenous glucocorticoids and markedly increased by the synthetic glucocorticoid Dex. The durability of this immunosuppressive phenotype highlights the need for alternatives to Dex, which is widely used for symptom management in glioma.
Our study leaves some critical questions unaddressed. Our data capture the diversity of myeloid cells at the time of tumour resection but do not address their temporal dynamics or rate of turnover. We speculate that microglia and invading monocytes are initially biased towards inflammatory phenotypes but subsequently adopt immunosuppressive
programs in response to microenvironmental cues, as would be consistent with recent mouse studies (Supplementary Note 4). The topic is clinically important and timely in light of indications that myeloid-cell lifespan may be extended in brain tumour niches . Further study is also needed to refine our inferences regarding signalling molecules that drive invasion, differentiation and immunomodulatory programs. Our data delineate how glioma niches affect myeloid programs, but they do not address the extent to which feedback from myeloid phenotypes shapes these niches. Nor do we define the causality of the association between tumour grade and myeloid programs, which may further involve interplay between malignant-cell genetics and myeloid phenotypes . Nevertheless, our work provides a robust framework for understanding myeloid biology that should catalyse further discovery and ultimately guide new strategies for reprogramming myeloid cells and the immune microenvironment for therapeutic benefit.
Online content
Any methods, additional references, Nature Portfolio reporting summaries, source data, extended data, supplementary information, acknowledgements, peer review information; details of author contributions and competing interests; and statements of data and code availability are available at https://doi.org/10.1038/s41586-025-08633-8.
Gutmann, D. H. & Kettenmann, H. Microglia/brain macrophages as central drivers of brain tumor pathobiology. Neuron 104, 442-449 (2019).
Sørensen, M. D., Dahlrot, R. H., Boldt, H. B., Hansen, S. & Kristensen, B. W. Tumour-associated microglia/macrophages predict poor prognosis in high-grade gliomas and correlate with an aggressive tumour subtype. Neuropathol. Appl. Neurobiol. 44, 185-206 (2018).
Wang, E. J. et al. Immunotherapy resistance in glioblastoma. Front. Genet. 12, 750675 (2021).
Ruffell, B. & Coussens, L. M. Macrophages and therapeutic resistance in cancer. Cancer Cell 27, 462-472 (2015).
Klemm, F. et al. Interrogation of the microenvironmental landscape in brain tumors reveals disease-specific alterations of immune cells. Cell 181, 1643-1660 (2020).
Hara, T. et al. Interactions between cancer cells and immune cells drive transitions to mesenchymal-like states in glioblastoma. Cancer Cell 39, 779-792 (2021).
Abdelfattah, N. et al. Single-cell analysis of human glioma and immune cells identifies S100A4 as an immunotherapy target. Nat. Commun. 13, 767 (2022).
Mathewson, N. D. et al. Inhibitory CD161 receptor identified in glioma-infiltrating T cells by single-cell analysis. Cell 184, 1281-1298 (2021).
Neftel, C. et al. An integrative model of cellular states, plasticity, and genetics for glioblastoma. Cell 178, 835-849 (2019).
Couturier, C. P. et al. Single-cell RNA-seq reveals that glioblastoma recapitulates a normal neurodevelopmental hierarchy. Nat. Commun. 11, 3406 (2020).
Venteicher, A. S. et al. Decoupling genetics, lineages, and microenvironment in IDH-mutant gliomas by single-cell RNA-seq. Science 355, eaai8478 (2017).
Garofano, L. et al. Pathway-based classification of glioblastoma uncovers a mitochondrial subtype with therapeutic vulnerabilities. Nat. Cancer 2, 141-156 (2021).
Johnson, K. C. et al. Single-cell multimodal glioma analyses identify epigenetic regulators of cellular plasticity and environmental stress response. Nat. Genet. 53, 1456-1468 (2021).
Alghamri, M. S. et al. G-CSF secreted by mutant IDH1 glioma stem cells abolishes myeloid cell immunosuppression and enhances the efficacy of immunotherapy. Sci. Adv. 7, eabh3243 (2021).
Pombo Antunes, A. R. et al. Single-cell profiling of myeloid cells in glioblastoma across species and disease stage reveals macrophage competition and specialization. Nat. Neurosci. 24, 595-610 (2021).
Müller, S. et al. Single-cell profiling of human gliomas reveals macrophage ontogeny as a basis for regional differences in macrophage activation in the tumor microenvironment. Genome Biol. 18, 234 (2017).
Friebel, E. et al. Single-cell mapping of human brain cancer reveals tumor-specific instruction of tissue-invading leukocytes. Cell 181, 1626-1642 (2020).
Friedrich, M. et al. Tryptophan metabolism drives dynamic immunosuppressive myeloid states in IDH-mutant gliomas. Nat. Cancer 2, 723-740 (2021).
Lee, A. H. et al. Neoadjuvant PD-1 blockade induces T cell and cDC1 activation but fails to overcome the immunosuppressive tumor associated macrophages in recurrent glioblastoma. Nat. Commun. 12, 6938 (2021).
Ginhoux, F. et al. Fate mapping analysis reveals that adult microglia derive from primitive macrophages. Science 330, 841-845 (2010).
Hambardzumyan, D., Gutmann, D. H. & Kettenmann, H. The role of microglia and macrophages in glioma maintenance and progression. Nat. Neurosci. 19, 20-27 (2016).
Zilionis, R. et al. Single-cell transcriptomics of human and mouse lung cancers reveals conserved myeloid populations across individuals and species. Immunity 50, 1317-1334 (2019).
Couturier, C. P. et al. Glioblastoma scRNA-seq shows treatment-induced, immunedependent increase in mesenchymal cancer cells and structural variants in distal neural stem cells. Neuro Oncol. 24, 1494-1508 (2022).
Kotliar, D. et al. Identifying gene expression programs of cell-type identity and cellular activity with single-cell RNA-Seq. eLife 8, e43803 (2019).
Bohlson, S. S., O’Conner, S. D., Hulsebus, H. J., Ho, M.-M. & Fraser, D. A. Complement, c1q, and c1q-related molecules regulate macrophage polarization. Front. Immunol. 5, 402 (2014).
Zhang, S. et al. tumor-associated macrophages contribute to immunosuppression through fatty acid metabolic reprogramming in malignant pleural effusion. J. Immunother. Cancer 11, e007441 (2023).
Vogt, L. et al. VSIG4, a B7 family-related protein, is a negative regulator of T cell activation. J. Clin. Invest. 116, 2817-2826 (2006).
Timmermann, M., Buck, F., Sorg, C. & Högger, P. Interaction of soluble CD163 with activated T lymphocytes involves its association with non-muscle myosin heavy chain type A. Immunol. Cell Biol. 82, 479-487 (2004).
Gudgeon, J., Marín-Rubio, J. L. & Trost, M. The role of macrophage scavenger receptor 1 (MSR1) in inflammatory disorders and cancer. Front. Immunol. 13, 1012002 (2022).
Miller, T. E. et al. Mitochondrial variant enrichment from high-throughput single-cell RNA sequencing resolves clonal populations. Nat. Biotechnol. 40, 1030-1034 (2022).
Jacob, F. et al. A patient-derived glioblastoma organoid model and biobank recapitulates inter- and intra-tumoral heterogeneity. Cell 180, 188-204 (2020).
Ravi, V. M. et al. Spatially resolved multi-omics deciphers bidirectional tumor-host interdependence in glioblastoma. Cancer Cell 40, 639-655 (2022).
Cable, D. M. et al. Robust decomposition of cell type mixtures in spatial transcriptomics. Nat. Biotechnol. 40, 517-526 (2022).
Scherer, H. J. Structural development in gliomas. Am. J. Cancer 34, 333-351 (1938).
Greenwald, A. C. et al. Integrative spatial analysis reveals a multi-layered organization of glioblastoma. Cell 187, 2485-2501 (2024).
Amankulor, N. M. et al. Mutant IDH1 regulates the tumor-associated immune system in gliomas. Genes Dev. 31, 774-786 (2017).
Auger, J.-P. et al. Metabolic rewiring promotes anti-inflammatory effects of glucocorticoids. Nature 629, 184-192 (2024).
Mei, Y. et al. Siglec-9 acts as an immune-checkpoint molecule on macrophages in glioblastoma, restricting T-cell priming and immunotherapy response. Nat. Cancer 4, 1273-1291 (2023).
Nishikawa, H. & Koyama, S. Mechanisms of regulatory T cell infiltration in tumors: implications for innovative immune precision therapies. J. Immunother. Cancer 9, e002591 (2021).
Terekhanova, N. V. et al. Epigenetic regulation during cancer transitions across 11 tumour types. Nature 623, 432-441(2023).
Aibar, S. et al. SCENIC: single-cell regulatory network inference and clustering. Nat. Methods 14, 1083-1086 (2017).
Browaeys, R., Saelens, W. & Saeys, Y. NicheNet: modeling intercellular communication by linking ligands to target genes. Nat. Methods 17, 159-162 (2020).
Jubb, A. W., Young, R. S., Hume, D. A. & Bickmore, W. A. Enhancer turnover Is associated with a divergent transcriptional response to glucocorticoid in mouse and human macrophages. J. Immunol. 196, 813-822 (2016).
Oh, K.-S. et al. Anti-inflammatory chromatinscape suggests alternative mechanisms of glucocorticoid receptor action. Immunity 47, 298-309 (2017).
de Almeida Nagata, D. E. et al. Regulation of tumor-associated myeloid cell activity by CBP/EP300 bromodomain modulation of H3K27 acetylation. Cell Rep. 27, 269-281 (2019).
Guerriero, J. L. et al. Class IIa HDAC inhibition reduces breast tumours and metastases through anti-tumour macrophages. Nature 543, 428-432 (2017).
Pappalardi, M. B. et al. Discovery of a first-in-class reversible DNMT1-selective inhibitor with improved tolerability and efficacy in acute myeloid leukemia. Nat. Cancer 2, 1002-1017 (2021).
Romero, F. A. et al. GNE-781, a highly advanced potent and selective bromodomain inhibitor of cyclic adenosine monophosphate response element binding protein, binding protein (CBP). J. Med. Chem. 60, 9162-9183 (2017).
Kamei, Y. et al. A CBP integrator complex mediates transcriptional activation and AP-1 inhibition by nuclear receptors. Cell 85, 403-414 (1996).
Kirschenbaum, D. et al. Time-resolved single-cell transcriptomics defines immune trajectories in glioblastoma. Cell 187, 149-165 (2024).
Chen, Z. et al. A paracrine circuit of IL-1ß/IL-1R1 between myeloid and tumor cells drives genotype-dependent glioblastoma progression. J. Clin. Invest. 133, e163802 (2023).
Ballesteros, I. et al. Co-option of neutrophil fates by tissue environments. Cell 183, 1282-1297 (2020).
Sattiraju, A. et al. Hypoxic niches attract and sequester tumor-associated macrophages and cytotoxic T cells and reprogram them for immunosuppression. Immunity 56, 1825-1843.e6 (2023).
Varn, F. S. et al. Glioma progression is shaped by genetic evolution and microenvironment interactions. Cell 185, 2184-2199 (2022).
Hoogstrate, Y. et al. Transcriptome analysis reveals tumor microenvironment changes in glioblastoma. Cancer Cell 41, 678-692 (2023).
Publisher’s note Springer Nature remains neutral with regard to jurisdictional claims in published maps and institutional affiliations.
Open Access This article is licensed under a Creative Commons Attribution-NonCommercial-NoDerivatives 4.0 International License, which permits any non-commercial use, sharing, distribution and reproduction in any medium or format, as long as you give appropriate credit to the original author(s) and the source, provide a link to the Creative Commons licence, and indicate if you modified the licensed material. You do not have permission under this licence to share adapted material derived from this article or parts of it. The images or other third party material in this article are included in the article’s Creative Commons licence, unless indicated otherwise in a credit line to the material. If material is not included in the article’s Creative Commons licence and your intended use is not permitted by statutory regulation or exceeds the permitted use, you will need to obtain permission directly from the copyright holder. To view a copy of this licence, visit http:// creativecommons.org/licenses/by-nc-nd/4.0/.
(c) The Author(s) 2025
Methods
Human subjects
Adult male and female patients at Massachusetts General Hospital and Brigham and Women’s Hospital (MGB) provided preoperative informed consent to take part in the study in all cases under the approved Institutional Review Board Protocol DF/HCC 10-417. Patients’ clinical characteristics are summarized in Supplementary Table 1. Patients in other cohorts gave consent according to published methods . Previously unpublished patient data from the Montreal Neurological Institute was collected as reported with other tumours from McGill University .
Primary tumour processing for Seq-Well and GBOs
Fresh tumour samples were collected directly from the operating room at the time of surgery and the presence of glioma was confirmed by frozen section. Samples were dissected into small pieces and mixed. For samples with enough material, we divided up the mixed tumour pieces, with part being used for single-cell dissociation and part for GBO generation.
Single-cell dissociation and Seq-Well. For the MGB cohort, minced tissue pieces were mechanically and enzymatically dissociated using a tumour dissociation kit, according to the manufacturer’s instructions, and a GentleMACS Octo Dissociator with Heaters (Miltenyi Biotec) using custom settings. The single-cell suspension was then depleted of dead cells and debris using magnetic-activated cell sorting (Dead Cell Depletion Kit, Miltenyi Biotec). Cells were then processed for Seq-Well as previously described . In brief, cells were resuspended in media and 10,000-15,000 cells were then distributed dropwise onto a Seq-Well microwell array preloaded with mRNA capture beads. The arrays were then sealed with a semipermeable membrane and submerged in lysis buffer to lyse their cellular and nuclear membranes. Lysis buffer was then removed and the array was submerged in a hybridization buffer to allow for attachment of mRNA to the capture beads. After mRNA capture, the seal was removed from the array and the capture beads were manually washed out of the array with a washing buffer. Following removal from the array, the beads were washed to remove any excess lysis reagents and unattached nucleic acids. A reverse-transcription reaction was run on the beads and cDNA was generated by elongation of the capture bead oligos using the captured RNA as a template. An exonuclease reaction was then run on the beads to clean them up. After this, a second strand-synthesis reaction was run to generate a DNA strand complementary to the cDNA strand by polymerase chain reaction. Subsequent to second-strand generation, the now double-stranded cDNA was amplified by polymerase chain reaction in a whole-transcriptome amplification. Sequenceable libraries were generated from the whole-transcriptome amplification using the Nextera Library Prep kit, following the manufacturer’s instructions.
MAESTER materials and preparation. From the Seq-Well cDNA, mitochondrial RNA fragments were selectively pulled down, separately amplified and sequenced as previously described .
Creation and maintenance of GBOs. Minced tissue pieces were further dissected using two scalpels until pieces were in diameter. These were washed, further processed and maintained according to a previous protocol .
Patient PBMC and monocyte processing
Patient PBMCs were collected at the time of surgery and isolated using SepMate-15 tubes (StemCell Technologies) and Lympholyte-H (Cedarlane) according to the manufacturers’ instructions. Cells were either directly processed for Seq-Well as above or enriched for pan-myeloid cells using CD11b beads (Miltenyi Biotec, 130-097-142) on Miltenyi
magnet according to the manufacturing protocols, and then processed for Seq-Well.CD11b D45 purity was checked by flow cytometry (purity ).
GBO perturbation and single-cell read-out methods
GBO perturbations. For perturbation experiments, GBOs were pipetted into ultralow-adherence round-bottomed 96-well plates (Corning, 7007) with one GBO per well. GBOs were plated in media. Small molecules were then added in an extra of media at concentration. Medium was changed every days by removing and replacing it with fresh media with perturbation. Depending on the experiment, each condition had 6-12 GBOs per condition to account for heterogeneity among GBOs. For experiments with flow cytometry or scRNA-seq as a read-out, multiple GBOs were grouped together in replicates per condition and then dissociated to single cells together.
Myeloid-GBO co-culture. Human cells isolated from tumour or donor patient PBMCs, as described above, were aliquoted and frozen at cells per ml per vial. Before co-culturing with GBOs, myeloid cells were gently thawed and washed in warm myeloid cell media (ImmunoCult-SF Macrophage Differentiation Medium, using base medium with only M-CSF ( ; STEMCELL Technologies, 10961), and plated in a 24 -well low-attachment plate (Corning) to recover for 30 min in a incubator. Plates were placed on an orbital rotator at 120 rpm with maximum cells per well to avoid cell attachment and to maintain monocyte morphology. Monocytes (10,000-50,000, depending on the experiment) were then added to each GBO well in myeloid cell media with small-molecule perturbation when applicable. Medium was changed every days by removing and replacing it with fresh medium (a 1:1 mix of GBO medium and myeloid cell medium) with perturbation when applicable.
Dissociation of GBOs. In brief, all GBOs in each experimental replicate were grouped together in a 1.7 ml Eppendorf tube, the medium was aspirated and GBOs were washed twice with 1 ml media to remove small molecules and/or cells. GBOs were then dissociated to single cells using dissociation media from a Miltenyi tumour dissociation kit mixed 2:1 with accutase in the 1.7 ml tubes. These were placed at and mechanically dissociated every by pipetting up and down until there was a homogeneous single-cell mixture. Cells were passed through a filter and then used for downstream assays. Cells were processed for Seq-Well as described above or analysed by flow cytometry as described below.
Flow cytometry. Flow cytometry was based on a previous protocol . In brief, an antibody cocktail was made by a ratio of Brilliant Stain Buffer (BD Horizon, 566349) and PBS, and antibodies or dyes were added (antibodies are listed in Supplementary Table 5). Single-cell suspensions were washed by PBS BSA in Eppendorf tubes or 96-well U-bottomed plates. Cells were pelleted by centrifugation at 300 g for 5 min at room temperature. After removing the washing buffer, cells were resuspended in staining cocktail by pipetting up and down about ten times. Plates or tubes were covered to avoid light and stained in the dark at room temperature for . Cells were washed by PBS BSA and centrifuged at at room temperature for 5 min . Cell pellets were resuspended in BSA. Flow cytometry was processed on a BD LSRFortess X-20 according to the manufacturer’s procedure. UltraComp eBeads (Invitrogen, 01-3333-42) were used to pre-annotate the compensation. FlowJo v. 10 was used for data analysis.
Histological assessment of GBO experiments. GBOs were fixed in 4% formaldehyde for 30 min and then washed with DPBS and left in a sucrose solution overnight to dehydrate the tissue. The organoids
were then embedded in OCT (Sakura Tissue Tek) and frozen using an isopropanol bath. The tissue was then sectioned at a thickness of using a cryostat. For staining, slides were dried at room temperature for 10 min and then prewashed with TBST to remove the OCT. The tissue was blocked with a glycine BSA solution for 1 h at room temperature. Tissue sections were then incubated with primary antibodies either at overnight or at room temperature for 2 h (antibodies are listed in Supplementary Table 5). Tissue section were then washed thoroughly with TBST and incubated with fluorophore-conjugated secondary antibodies and DAPI for 1 h at room temperature. The tissue was washed with TBS and incubated with True Black Autofluorescence quencher for 1 min. Tissue sections were washed with TBS and mounted with Prolonged Gold mounting media (Invitrogen) and covered with glass slips. For imaging, a Leica Thunder microscopy system was used with an automated mechanized stage. Images were taken using the scanning features with a × 40 oil-immersion objective lens. Images were stitched together and enhanced with the fast computational clearing programs of Leica LAS X software v.3.8.2.27713.
Histological analysis. All histological images were analysed using Qupath open-source image-analysis software v.0.4.3. Cells were counted with the cell-detection feature using the DAPI channel. The detected cells were then called for positivity of up to three fluorescent markers using the single-object measurement feature with positivity thresholds adjusted according to the experiment. Thresholds were set by comparison of experimental conditions to control and then applied to all images of the experiment through automated scripts.
Single-cell, spatial and bulk RNA-seq analyses
Cohorts. This study used four cohorts, split into two datasets. The discovery dataset contained the MGB, Houston Methodist and Jackson Laboratories cohorts. Cells in these cohorts were assayed with more-advanced scRNA-seq technologies: Seq-Well S (MGB) or 10x Genomics v. 3 (Methodist and Jackson Laboratories). The validation dataset was composed of samples from the McGill cohort, including a set that had been previously published and a set that was not previously published. McGill tumours were assayed using 10x Genomics 3′ v. 2 kits. The Methodist data were downloaded (GEO series, GSE182109), the Jackson Labs data were downloaded from https://ega-archive.org/ datasets/EGAD00001007772 and published McGill data were downloaded from https://ega-archive.org/datasets/EGAD00001006206.
For other tumours, we obtained raw expression matrices from sources indicated in Supplementary Table 4.
Alignment. We used the Cumulus platform to process the large-scale single-cell RNA-seq experiments. Libraries were aligned to the GRCh38 genome using STARsolo v.2.7.10 (ref. 60). Our GitHub page contains the specific settings (https://github.com/BernsteinLab/Myeloid-Glioma).
Data processing and visualization. The raw matrices outputs of STARsolo (no filtration of cells) for each tumour and GBO library were gzipped and used as input for Seurat using the Read10X() function with the default parameters. The pipeline was done for each cohort independently. Tumours in each cohort were merged using the Seurat merge() function to generate a Seurat object for each cohort. The percentage of mitochondrial gene expression was determined using PercentageFeatureSet() with the pattern set to ^MT. Cells with more than 25% of their transcriptome composed of mitochondrial gene expression were filtered out. We also filtered out cells expressing fewer than 500 genes or more than 6,000 genes. We also filtered out cells with less than 1,000 UMIs and genes expressed in less than three cells in the matrix. The filtering process was done using the Seurat subset() function.
For plotting, normalization, scaling and variable gene detection were done using the SCTransform() function, for which we used the percentage of mitochondrial gene expression as a regression factor.
We performed principal components analysis (PCA) using RunPCA() with default parameters and generated an elbow plot using the ElbowPlot() function to determine the dimensions for generating UMAPs and for Louvain clustering (MGB, 24; Houston Methodist, 19;Jackson Laboratories, 16).
UMAPs were generated using RunUMAP() with the reduction set to pca. FindNeighbors() and FindClusters() were used for clustering, with the resolution set to 0.3 .
Classification of cell types. To classify tumour cells in all cohorts, we identified the main cell programs in the MGB cohort and identified the top program for each cell in all cohorts. This top program was then used as the cell’s classification.
We merged all cells from the 22 tumours in the MGB cohort and used this expression matrix as the input for cNMF. We identified the 4,000 most variable genes using SCTransform, regressing out mitochondrial content. We subsetted the matrix for these genes and the resulting matrix was then subjected to consensus cNMF v.1.0.4 (ref. 24).
For the CNMF ‘prepare’ function, we performed factorization over K ranges from 2-35. We ensured that all the variable genes were considered for the factorization using the parameter –numgenes 4000 . We also performed 500 iterations by inputting –n-iter 500 in the cNMF prepare script. was the highest value with a silhouette score greater than 0.8 and was thus chosen for the consensus script of cNMF. cNMF was run with a –local-density-threshold value of 0.015
We annotated each program on the final gene_spectra output of cNMF by comparing the top 100 genes with previously published gene sets and known marker genes. We used gProfiler to determine enrichment scores for a manually curated gene-set matrix with more than 600 gene sets (Supplementary Table 3). Manual integration of enrichment scores and known marker genes enabled us to determine the names of the programs (Extended Data Fig. 1a). Of note, MGH720, a tumour with a histological diagnosis of giant cell glioblastoma, had a cNMF unique malignant program.
We then used the gene spectra output of the cNMF programs to calculate the usage of these programs by cells in the other published cohorts and in the GBO scRNA-seq libraries. We extracted a raw-counts matrix including the intersection between genes detected in the cohort and the top 4,000 variable genes in the MGB cohort. This matrix was then subjected to the cNMF prepare script for normalization. The –numgenes parameter was set to the number of genes in the matrix. We used sklearn decomposition.non_negative_factorization in which X is the filtered normalized expression matrix and H is the filtered gene-spectra consensus matrix. The following parameters were used: n_components= 18, init = ‘random’, update_H=False, solver=’cd’, beta_loss=’frobenius’, tol , max_iter , alpha , alpha_W , alpha_H ‘same’, l1_ratio , regularization None, random_state=None, verbose , shuffle=False. The code is available at https://github.com/BernsteinLab/ Myeloid-Glioma.
Finally, each cell was annotated as a cell type using the final ‘usage matrix output of cNMF or the calculated usage matrices, as discussed above. The usage scores were normalized to for each cell. For each cell, the usage scores for all programs in each category were summed to create a usage score for the cell-type category. For example, the usage scores for four myeloid programs were summed to create the myeloid usage per cell. Cells were then annotated as one of the cell types using the top-scoring usage for cell-type category.
Of note, cycling cells were considered separately. We used inferCNV to annotate cycling cells as malignant or non-,alignant. Non-malignant cells were then further annotated by the next-highest cell type. These secondary annotations were used when separating cell types for further cell-type-specific analysis.
CNA inference from single-cell data. We selected a group of reference cells not annotated as any malignant program from various tumours
(a mix of myeloid cells, T cells, oligos and vasculature cells). We extracted and merged the raw counts of these reference cells into a single matrix. The reference cells used are given in https://github.com/ BernsteinLab/Myeloid-Glioma. We then used the inferCNV package (inferCNV v.1.3.3 of the Trinity CTAT Project; https://github.com/ broadinstitute/inferCNV). We performed the analysis for each tumour separately. In the annotation file, we included the reference cells and annotated the cells of each tumour, as discussed above. We concatenated the raw matrix of each tumour with the reference cells’ raw matrix. We constructed the gene-order file required for inferCNV using the gtf_to_position_file.py script of the inferCNV package. We included the following extra arguments: –denoise –HMM –cluster_by_groups –cutoff 0.1. We also ensured that the –ref_group_names match the names given to the reference cells in the annotation files. The selection of the reference cells was performed separately for each cohort.
Doublet detection. Doublets were determined using integration of cNMF and inferCNV data. Cells were considered doublets by cNMF if they expressed a second program above a specific threshold (Supplementary Table 6). Cell-type-specific thresholds were selected by subsetting by cell type, then plotting the usage of each potential second program. From this plot, we found the value that separated the background usage of a second program from doublets. Cells were also considered doublets if their cNMF annotation was not compatible with the inferCNV profile. Of note, the cycling programs were not considered in doublet analysis. A more detailed description of annotation and doublet-detection methods can be found at https://github. com/BernsteinLab/Myeloid-Glioma/blob/main/Processing%20of%20 scRNA-Seq%20Files%20(Related%20to%20Figure%201)/15-%20Annotation%20and% 20Doublet%20Detection.pdf.
Integrated definition of malignant cells. If a tumour had CNVs that were detectable using inferCNV, cells from that tumour had to meet the following criteria: non-doublet, positive for CNV and not annotated as a non-malignant cell type by the cNMF program. For those tumours in which CNVs could not be readily detected by inferCNV, we relied on annotations based on cNMF.
Gene-program identifications. For more granular analysis of cell programs for a specific cell type (myeloid cells, T cells or malignant cells), we took cells in each specific category and removed doublets on the basis of the method described in the ‘Doublet detection’ section above. We then input those cells identified as singlets into another cNMF analysis for each category.
Myeloid cells. We used the MGB, Jackson Laboratories and Methodist cohorts for identifying the cNMF programs in myeloid cells in gliomas. The cNMF was carried out in two rounds for each cohort. The first round was used to identify cells using programs that are not myeloid (that is, have a different cell-type identity) or programs used by fewer than 100 myeloid cells. We removed such cells for subsequent analyses. The second round was used to determine the myeloid programs.
In the first round, raw counts of all cells annotated as myeloid and singlets (non-doublets) from each cohort were used to create a Seurat object independently. We then normalized the Seurat object using NormalizeData() and identified the top 2,000 variable genes with mean expression greater than 0.001 in expressing cells in each cohort using the FindVariableFeatures(). Subsequently, we output the three matrices. These matrices were subjected separately to cNMF with the following parameters in the prepare script: –n-iter 500 –total-workers 1 –seed 14 –numgenes 2000 . Then we performed factorization and generated the K-plots using the factorize, combine and k_selection_plot scripts of cNMF. We then chose the following Ks: MGB-22, Houston Methodist-23, Jackson’s laboratories – 14 . We then performed the consensus script with the above Ks and a local-density threshold of 0.02
In the second round, we removed cells from each cohort as discussed above and created a merged Seurat object from the three cleaned matrices using the Seurat merge() function. Then we normalized the merged Seurat object and detected variable genes using NormalizeData() and FindVariableFeatures(). We then filtered out the genes with a mean expression value of less than 0.01 in expressing cells and standardized variance of less than 1 . We then filtered the cleaned myeloid matrix of each cohort to include the variable genes that met the criteria mentioned above. Similar to round1, these matrices were subjected to cNMF individually with the following parameters in the prepare script:–n-iter 500 –total-workers 1 -seed 14 –numgenes 2276 . Then we also ran the factorization and generated the K-plots using the factorize, combine and k_selection_plot scripts of cNMF. We then chose the following Ks in the second round: MGB – 18 (we filtered out programs that are not myeloid), Houston Methodist-19, Jackson Laboratories – 18. Finally, we performed the consensus script with the above-mentioned Ks and a local-density threshold of 0.02 .
To find the consensus programs, we performed a cosine similarity of the gene-spectra ‘dt’ output of each discovery cohort from round 2 of cNMF. We applied a hierarchical clustering algorithm called Ward’s method to the similarity matrix to visualize the relationships between programs in a heatmap. To derive the spectra scores for the consensus programs, we averaged the spectra dt scores of the programs with a cosine similarity score of 0.5 or higher. This resulted in 14 consensus myeloid programs across the 3 cohorts, which we annotated as discussed above.
Malignant and T cells. Malignant cells and T cells were obtained from the MGB data in separate cNMF runs, similar to the two-step cNMF used for myeloid cells. We selected a K-value of 7 for the malignant cells based on the silhouette plot’s stability, consistent with previously published glioblastoma signatures represented in our five chosen programs . For the T cells, we found the optimal program count to be 4 . We calculated the usage of these programs in the other cohorts in a way similar to the all-cell-type NMF mentioned above.
Processing and NMF for PBMC scRNA-seq libraries. The PBMC libraries were processed for cNMF in a similar way to the primary tumour libraries. We merged the expression matrix of all the PBMC libraries using the Seurat merge function. The Seurat object was then normalized using NormalizeData() and ScaleData(). We then used FindVariableFeatures() to calculate the variance score for every gene. We selected the top 3,000 variable genes after removing genes of less than 0.001 mean expression (in expressing cells) and then subsetted the gene-expression matrix to include only the variable genes. As described above, cNMF was performed with –numgenes 3000 and a value for the consensus script of cNMF, annotation was done using gProfiler, and non-doublet cells were identified. We isolated myeloid cells, identified the top 2,000 most-variable genes, and performed two rounds of cNMF .
Calculation of the usage of myeloid programs. We extracted a raw counts matrix including the intersection between genes detected in the GBO matrix or other tumour types of matrices and the genes found in the myeloid-cell programs gene-spectra file. This matrix was then subjected to the cNMF prepare script for normalization. The –numgenes parameter was set to the number of genes in the matrix. We used sklearn decomposition.non_negative_factorization in which X is the filtered normalized expression matrix and H is the filtered gene-spectra consensus matrix. The following parameters were used: n_components= 14, init=’random’, update_H=False, solver=’cd’, beta_loss=’frobenius’, tol , max_iter , alpha=0.0, alpha_W=0.0, alpha_H=’same’, l1_ratio , regularization None, random_state None, verbose , shuffle=False. The code is available at https://github.com/Bernstein-Lab/Myeloid-Glioma.
The usage scores were normalized to for each cell.
Comparison of gene programs. To assess the similarity of 2 given gene programs, we took the top 100 genes in those programs and compared their make-up using a Jaccard index. -values were measured by assessing the probability of observed gene matches being obtained by random chance using a binomial test in which is the number of matches, is the size of the gene set, and is probability of randomly drawing matches from all genes scored in the program.
Comparative UMAP and clustering of myeloid cells. We extracted the raw counts of all MGB cells annotated as myeloid and singlets (non-doublets) from each tumour. Then normalization was performed for each tumour separately using NormalizeData() with default settings, followed by FindVariableGenes() with the following settings (selection.method = vst, nfeatures = 2,000). We then ran FindIntegrationAnchors() k.filter set at 30 (to ensure that tumours with few myeloid cells were included. We then used the anchors identified as input to batch correct the objects using IntegrateData(), setting features.to.integrate as the intersection of genes detected in all tumours in and dims to 1:30.
The batch-corrected Seurat object was then subjected to ScaleData(), RunPCA() and ElbowPlot() with default parameters to identify the number of dimensions to use for Louvain clustering and UMAP generation. We generated the UMAP using RunUMAP() with dims set to and reductions set to pca. We performed the clustering using FindNeighbors() with dims set to 1:8, followed by FindClusters() with a 0.3 resolution. UMAPs were generated using the DimPlot() function.
Generation of heatmap for gene-expression programs. To generate the gene-expression heatmap of the NMF programs, we assigned the myeloid cells to one of the following categories:
Microglia. This had a minimum 10% usage of the microglia program and other identity programs were all less than the usage value of the microglia program (macrophages must be below ).
Microglia-like. This had a minimum 10% usage of microglia and 10% usage of the monocytes or macrophages program. Other identity programs should be below the usage value of these two programs (otherwise it was assigned as a microglia).
Macrophages. This had a minimum 10% usage of the macrophage program and other identity programs were all below the usage value of the macrophage program (monocytes below 10%).
Mono_macro. This had a minimum 10% usage of macrophages and usage of the monocytes program. Other identity programs were below the usage value of these two programs.
Monocytes. This had a minimum 10% usage of the macrophage program and other identity programs were below the usage value of the monocytes program.
cDC. This had a minimum 10% usage of the cDC program and other identity programs were all below the usage value of the cDCs program.
Neutrophils. This had a minimum 10% usage of the neutrophils program and other identity programs were all below the usage value of the neutrophils program.
Activity dominated. All identity programs were below usage.
For selecting the genes included in the heatmaps, we identified the top 100 genes in the averaged gene-spectra output of the myeloid cNMF programs for each program. We counted the number of myeloid cells expressing the top 100 genes in each program. We included the top 20 genes with the highest number of myeloid cells expressing them in each program.
We used the ComplexHeatmap library in to generate the heatmaps. We -score scaled the loglp normalized gene-expression values across all the myeloid cells (regardless of the categorization). We then set an upper limit of 2 and a lower limit of -1 . We generated a heatmap for each category separately. We turned off row clustering (genes) by setting cluster_rows = FALSE in the heatmap function, and we allowed default column clustering in each category (cells).
Generation of quadrant plots. We plotted 183,062 myeloid cells from 85 tumours on the basis of their expression of the four immunomodulatory programs, orienting largely exclusive inflammatory and immunosuppressive programs oppositely on the same axes. The axis of the quadrant plots (bottom left to top right) was calculated by subtracting the usage of the complement immunosuppressive program from the systemic pro-inflammatory program. The axis (top left to bottom right) was calculated by subtracting the scavenger immunosuppressive program usage from the microglial inflammatory program for each myeloid cell. The resulting coordinates were transformed using a rotation matrix. For the quadrant plot with scatterpies as dots, we used the scatterpie library (https://github.com/GuangchuangYu/scatterpie). The ‘others’ category for the pie charts was calculated by summing the usages of all programs excluding the four immunomodulatory programs.
Determining cut-off usage values for myeloid cells. To determine the cut-off threshold for myeloid identity programs in primary tumours, we created an elbow plot to analyse the usage values for each myeloid-identity cNMF program. Based on our findings, we identified the minimum inflection point for an identity program at around and set the cut-off level at usage. Similarly, we observed that the minimum inflection point is approximately for activity programs, leading us to select usage as the cut-off level. A single myeloid cell could be classified using multiple programs. For example, a myeloid cell could be considered to be microglia using the scavenger immunosuppressive program if it had at least usage of the microglia program and usage of the scavenger immunosuppressive program. These cut-offs were used for Fig. 1d and Extended Data Figs. 1e and 8b. For Extended Data Fig. 2d, we calculated the observed/expected ratios of the co-occurrence of a myeloid identity program and a myeloid activity program and used a hypergeometric test to assess significance.
For GBOs, as part of optimizing the model, we determined the inflection points of the activity programs in the myeloid cells. We observed that the inflection points were approximately for activity programs, leading us to select usage as the cut-off level in GBO experiments. These cut-offs were used for all GBO scRNA-seq analyses, as shown in Fig. 5d and Extended Data Fig. 12a.
Definite annotation for myeloid cells and T cells. Specific analyses (MAESTER, Extended Data Fig. 5; and heatmap generation, Fig. 1c) required definite annotation of a myeloid cell instead of only considering whether the myeloid cell uses a particular program or not. The cut-offs for such analyses are mentioned in their respective sections.
T cell program usages were more distinct. We therefore simply defined them by the program of their top usage.
Creating discretized matrix and identifying marker genes. To enable the discovery of specific markers and the spatial cellular demultiplexing described below, we created a discretized matrix of MGB cells with the strongest expression of each tumour-cell program, including myeloid, T cell and cancer programs, thereby excluding intermediate cells. For the outputs of myeloid, malignant and T cell cNMFs, cells with a minimum 2.5 -fold higher usage of a particular program over the second-most-used program were annotated with that program as a discrete cell. For oligodendrocytes and vasculature, the usages from all cell types cNMF outputs were used to annotate oligo or vasculature discrete cells. Doublets, cycling programs and cycling cells were excluded from the analysis.
Furthermore, we downloaded scRNA-seq for normal brain tissue from individuals 25 and 40 years old . These libraries were processed using the above-mentioned Seurat processing; we normalized the cells and used 1:14 as dims for generating UMAPs and identifying clusters. We performed FindMarkers and extracted neurons and astrocytes from the published matrix on the basis of differentially expressed genes. We then merged these cells with the discrete cells matrix. We generated a UMAP as described above.
To identify markers for the immunomodulatory programs, we extracted discrete cells annotated as scavenger immunosuppressive, complement immunosuppressive, systemic inflammatory or microglial inflammatory using the Seurat subset() function (discrete myeloid immunomodulatory object). A similar processing pipeline was performed with the option dims set to 1:16 in FindNeighbors() and FindClusters(). The UMAP coordinates for these cells were obtained using Embeddings() with the option reduction set to umap. Then the normalized matrix of these cells was extracted using the function GetAssayData() with the option slot set to data. These files were used as input for COMET to identify the significant markers that distinguish each immunomodulatory program. We also used the Seurat function DotPlot() to generate the expression dot plots shown in Extended Data Fig. 10c.
Regulon analysis. We used the normalized discrete myeloid immunomodulatory expression matrix as an input for SCENIC . We also downloaded the feather files hg38_10kbp_up_10kbp_down_full_tx_v10_ clust.genes_vs_motifs.rankings.feather and hg38_500bp_up_100bp_ down_full_tx_v10_clust.genes_vs_motifs.rankings.feather from https:// resources.aertslab.org/cistarget/databases/homo_sapiens/hg38/ refseq_r80/mc_v10_clust/gene_based and used these as input for SCENIC. Genes in the matrix were filtered on the basis of the default settings, and we ran the four steps runSCENIC_1_coexNetwork2modules, runSCENIC_2_createRegulons,runSCENIC_3_scoreCells(scenicOptions, exprMat_filtered) and runSCENIC_4_aucell_binarize. To calculate the regulon specificity score for each regulon in each immunomodulatory annotation, we used the function calculate_rrs() of scFunction (https:// github.com/FloWuenne/scFunctions/). The full codes can be found at https://github.com/BernsteinLab/Myeloid-Glioma.
MAESTER analysis for determining myeloid-cell origin. To determine the origins of the various myeloid-cell identities, we processed the MAESTER libraries in three stages: preprocessing, identifying variants of interest, and measuring the enrichment of the identified variants in the various myeloid identities.
Stage 1: preprocessing. The preprocessing was done as previously described . In brief, we trimmed high-quality reads, aligned them using STAR (hg38) and processed them using MAEGATK with the default settings except for – -min-reads, which was set to 3 to ensure a minimum of three reads to cover the base in the cell .
Stage 2: low-resolution pseudobulking to identify variants of interests. To determine the origin of the myeloid-cell identities, we identified variants specific to myeloid cells in the tumour microenvironment but not present in the PBMC. We also identified variants present in the myeloid cells in the PBMC but absent in the tumour microenvironment. We pseudobulked the primary tumour libraries to the following categories according to their RNA-seq annotation. For the primary tumour libraries Malignant, Tumor-Associated Myeloid (TAMs), Stromal, Oligo and Tcells, and for PBMC libraries, we considered only Neutrophils and Monocytes (Myeloid_PBMCs). This stage involved multiple steps.
Step 1: we extracted the number of UMIs supporting each possible variant at every possible location from the MAEGATK output using the following script in R:
The computeAFMutMatrix generated a matrix in which the rows are every possible variant in the mitochondrial genome, and the columns are barcodes (cells). The values represent the UMIs supporting each variant in the given barcode.
Step 2: we extracted the coverage of the Maester libraries at each base of the MT genome in every cell from the output of MAEGATK, which was stored in assays(maegatk.rse)[[coverage]], whereby maegatk.rse is the R object output of MAEGATK.
Step 3: we annotated the cells in each matrix (obtained from step 1 and step 2) based on the scRNA-seq library (as mentioned in the ‘Classification of cell types’ section). We created a data frame in which one column has the barcodes and the other has the annotation.
Step 4:we pseudobulked the UMI count matrix (obtained from step1) using with the following steps: we subsetted the matrix into each annotation using tibble; we used the sum() function to sum all the rows in each matrix, creating a pseudobulked number for each annotation; and we merged all the summed values in each matrix for each variant possibility into a pseudobulked matrix in which each column represents an annotation.
Step 5: we pseudobulked the coverage matrix (obtained from step 2) similarly to step 4.
Step 6: we calculated the pseudobulked variant allele frequencies (VAFs) using R. We added a pseudo-count 0.000001 to each value in the pseudobulked coverage matrix. We divided each value in the pseudobulked counts matrix by its coverage in the pseudobulked coverage matrix to obtain pseudobulked VAFs for each category.
Step 7: to ensure the specificity of each variant’s detection with 99% certainty, we used a binomial model to establish a minimum VAF threshold dependent on coverage.
Step 8: to consider the variant to be specific to the myeloid cells in the tumour microenvironment, the variant had to meet the following criteria: the minimum VAF requirement for TAMs for the coverages in TAMs and Myeloid_PBMC categories; VAF = 0 in the myeloid PBMC category; and VAF > the minimum required in the TAM category.
Step 9: to identify variants specific to the myeloid cells in PBMCs, the variant had to meet the following criteria: first, it had to achieve the minimum VAF requirement for Myeloid_PBMC for the coverages in the Malignant, TAMs and Myeloid_PBMC categories; second, VAF = 0 in the Malignant category (if the tumour library was enriched for malignant cells, this criteria could be replaced with VAF in Myeloid_PBMC, which is 20 times bigger than Malignant); third, VAF > 0 in the TAM category; and fourth, VAF > the minimum required in the Myeloid_PBMC category. The mutations used for subsequent analyses can be found in Supplementary Table 7.
Stage 3: determining the enrichment of variants of interest in various identities of myeloid cells.
We hypothesized that myeloid cells enriched for tumour microenvironment-specific variants were tissue residents, whereas those enriched for PBMC-specific variants were derived from monocytes. Performing the enrichment analysis had several stages. We began by annotating the TAMs with the myeloid identity cNMF programs. We kept cells that met the following criteria to ensure the reliability of the identity and the results:
for Microglia annotation: first, the cell has a minimum of usage of microglia program; second, the microglia program must be at least twice as high as any other identity program; and third, the macrophage program is at least twice as low as any other identity program.
for Microglia_Like annotation: first, the cell has a minimum of usage of the microglia program; second, the cell has a minimum of usage of the macrophage program; third, the microglia program must be at least twice as high as any other identity program (excluding macrophages and monocytes); and fourth, the macrophage program must be at least twice as high as any other identity program (excluding microglia and monocytes).
for Mono_Macro annotation: first, the cell has a minimum of usage of the monocytes program; second, the cell has a minimum of 10% usage of the macrophage program; third, the monocyte program must be at least twice as high as any other identity program (excluding macrophages); and fourth, the macrophage program must be at least twice as high as any other identity program (excluding monocytes).
for Macrophages annotation: first, the cell has a minimum of usage of the macrophages program; second, the macrophage program must be at least twice as high as any other identity program; third, the monocytes program must be at least twice as high as any other identity program; and fourth, the microglia program must be at least twice as high as any other identity program.
For Monocytes annotation: first, the cell has a minimum of usage of the monocytes program; second, the monocyte program must be at least twice as high as any other identity program; and third, the macrophage program must be at least twice as high as any other identity program.
For Neutrophils annotation: first, the cell has a minimum of 15% usage of the neutrophils program; and second, the neutrophils program must be at least twice as high as any other identity program.
For cDC annotation: first, the cell has a minimum of usage of the cDC program; and second, the cDC program must be at least twice as high as any other identity program.
We subsetted the single cells MAESTER UMI matrix obtained in stage 2, step1 to smaller matrices, with each matrix composed of cells annotated with one of the above identities (stage 3, step1).
We created a matrix in which the rows are the variants of interest identified in stage 3, and each column represents an identity. The values in this matrix denote the number of cells in each identity in which the variant was detected. We used annotation_matrix[,apply(annotation_ matrix,2,function(x) sum(x > 0))] in R for each subsetted matrix. This script keeps columns that have UMI . Then we identified the number of cells for which UMI > O for each annotation by using ncol(as. matrix(annotation_matrix), whereby annotation_matrix represents each subsetted matrix.
We then removed any variant with a zero value in every pseudobulked category.
We removed any identity (column) that had less than ten total values to ensure proper enrichment results.
We used GSVA by categorizing the rows of the matrix as PBMC specific or tumour microenvironment specific. Because the values are integers (the number of cells having UMIs supporting the variants), we set the option kcdf to Poisson in the gsva script.
We then subtracted the GSVA enrichment for tumour micro-environment-specific variants from GSVA enrichment for PBMCspecific variants for each identity. Positive values indicate a PBMC origin, whereas negative values indicate a tissue-resident origin.
We calculated the prevalence of each identity in each tumour. We plotted the dot plots with the position of the dots representing the subtracted GSVA enrichment values, and the size of the dot representing the prevalence using ggplot2.
We calculated the average percentage usages of the four immunomodulatory programs in each identity, labelled the remaining percentage as others in each tumour, and plotted them as stacked bar plots using ggplot2.
Sample level association analysis. To measure inter-state association, we determined the average usage of the myeloid, T cell and cancer programs in their respective cells in each sample. We used the Spearman correlation to understand how a rise in one myeloid state corresponded to changes in cancer or T cell states, enabling us to examine how variations in one state could influence the behaviour of others in the same sample.
In our state-clinical/molecular associations analysis, we applied the sample state averages derived above. These were compared across
various clinical and molecular categories, such as tumour grade, IDH-mutation status and steroid usage, using the Wilcoxon rank-sum test.
To account for the confounding effect of sample hypoxia on the influence of dexamethasone on the complement immunosuppressive myeloid program, we limited this analysis to samples for which the average MES2 program usage in cancer cells was below .
We used a linear least-square regression to investigate changes in average myeloid program usage across samples relative to the daily dose of Dex.
To assess the myeloid and cancer program associations with cells, we classified each sample in the top and bottom expressors of cells and cancer/myeloid program usages and used Fisher’s exact test to measure this association. -values were adjusted using the FDR.
Cell-cycle analysis. We evaluated the relationship between the cell cycle and different myeloid cell states in each sample independently. Cells were defined as cycling if the combined usage of the G1S and G2M programs exceeded , and as belonging to a specific state if its usage surpassed . We used Fisher’s exact test to measure this association and obtained an odds ratio. For each program, we assessed the probability that its sample distribution was higher than 1 using a one-sample -test on the log-transformed values, so they were approximately normally distributed .
Deconvolution of TCGA, GLASS and G-SAM. The analysis pipeline consisted of three steps to deconvolve previously published glioma bulk expression datasets. Steps 2 and 3 of the pipeline were performed for each dataset separately.
Step 1: creating gene sets for each program. The top 50 genes were obtained for each myeloid program by ranking them in the merged gene-spectra output. For T cells and malignant cells, we ranked the gene spectra from their respective cNMF outputs to obtain the top 50 genes for each program. For the other cell types, we used the gene-spectra output of the cNMF of all cells in the tumour microenvironment. We ranked and obtained the top 50 genes for the pericytes, endothelial and oligo programs. Then we selected genes that appeared only in the list of a single program.
Step 2: calculating module scores using Seurat. Raw gene counts for the glioma datasets were obtained. The matrices were then CPM-normalized using EdgeR’s DGEList(), calcNormFactors() and cpm() functions . The CPM-normalized matrix was then log-transformed using the function of R. Afterwards, Seurat objects were created using the CreateSeuratObject() function. The Seurat objects were scaled using ScaleData(). Finally, module scores were calculated using Seurat’s AddModuleScore() function. The above-mentioned gene sets were used as input in the features option of AddModuleScore().
Step 3: normalizing the module score. To correct for the purity differences in the published bulk glioma mRNA-expression datasets, we imputed the percentages of malignant, oligo, vasculature, myeloid, T cells and other immune cells in the bulk expression matrices using CIBERSORTx . As input, we used the discretized matrix described above, excluding neurons and astrocytes. The matrix was used as the single_cell_reference in the Fractions module of CIBERSORTx. The published bulk gene expression matrices used as ‘mixture’ input were also CPM-normalized without log transformation. The module scores obtained above were then divided by the imputed value of their respective cell type in the CIBERSORTx results outputs.
These normalized module scores were then used to correlate with sample clinical data, including IDH-mutation status and molecular grade. For correlation with clinical data, the normalized module scores were transformed. We removed libraries with a CIBERSORTx value of less than 0.1 for myeloid cells. To correlate the module scores with the expression levels of the identified ligands in the lower-grade glioma and glioblastoma TCGA cohorts, we performed a Pearson correlation
between the log-transformed normalized module score and the log-transformed normalized expression. We used the Wilcoxon rank sum test to assess the statistical significance, adjusting the -values using FDR.
Spatial transcriptomic analysis. We used Visium spatial transcriptomics to analyse 23 samples . Our methodology encompassed two distinct approaches: unbiased niche discovery using cNMF; and cell-state demultiplexing using RCTD and the single-cell RNA-seq programs.
In the unbiased niche discovery, we used all samples, both healthy and cancer, for cNMF analysis. We selected the 1,500 top spatially variable genes based on Moran’s and ran the cNMF algorithm from to . The optimal value ( ) was determined as the highest one with a silhouette score greater than 0.9 . We defined the identity of niche programs through the analysis of gene expression patterns and excluded the program whose top genes were mitochondrial and ribosomal. To ensure uniformity, the usage scores were normalized to 1 in each spot.
For cell-state demultiplexing, we used the discretized matrix described above. Using this single-cell reference, RCTD was run individually for each spatial sample. Again, the scores were normalized to sum to 1 in each spot.
To assess the link between niche and cell state, we used the Spearman correlation to evaluate the relationship between normalized RCTD scores and cNMF usage for individual patient samples. For Fig. 2, a cell type was classified as part of a niche if the correlation had statistical significance (FDR < 0.01) in more than half of the samples.
In our analysis of cell state and niche-niche spatial relationships, we designed a spatial regression model to quantify cell-state proximity, analysing one sample at a time. For any pair of cell or niche states across all spots in a sample, we regressed the presence of one state in a central spot against the average expression of the other state in surrounding spots. In this model, we binarized the central spot’s state presence using a state-specific threshold determined by a knee plot (KneeLocator ) of cell-state expression across spots in all samples. The resulting regression coefficient indicates the association strength between the states, with the -value demonstrating the statistical significance of this association. The constant represents the background signal of the non-central state. The network graph in Extended Data Fig. 6f was plotted using the Python package NetworkX (v.2.0). The size of each edge represents the ratio of the regression coefficient to the constant, providing a measure of the state-association strength relative to the background signal. Edges were statistically significant (FDR < 0.01) in more than of the samples with an association strength greater than 0.1.
Correlation of immunomodulatory programs with responders and non-responders to immunotherapy. We downloaded the published Seurat object of scRNA-seq libraries of patients with glioma responding or not responding to immunotherapy . Based on the published annotations, we extracted the myeloid cells from the Seurat object. We calculated the usage of the myeloid cNMF programs in each myeloid cell, as shown above. We averaged the usage of each program in the myeloid cells per patient and calculated the difference between the average usage in responding versus non-responding patients, using FDR-corrected Wilcoxon rank-sum tests to assess the significance.
We calculated the module scores using gene sets from refs. 7,15,19 in all myeloid cells from ref.38. Similarly, we averaged the module scores of each gene set for each patient and calculated the difference between responding versus non-responding patients, using FDR-corrected Wilcoxon rank sum tests to assess the significance.
Survival analysis. We merged the survival information (survival time) and events from the cohorts of G-SAM and GLASS. We included only IDH-WT glioblastomas. We used the normalized module score values
(without log transformation) for the cNMF programs. We removed duplicate patient entries corresponding to recurrences by keeping the values from the primary tumour only. We removed any library with a CIBERSORTx value of 0 for the myeloid lineage. We then took the samples in the top and considered this group of samples as the high in each program. For the low group in each program, we selected samples in the bottom of libraries.
We performed the survival analysis in a similar way using gene sets from refs. 7,15,19.
Single-cell ATAC-seq analysis. We downloaded 20 snATAC-seq libraries from ref. 40 and the fragments file for each library. Each library was then processed using Signac v.1.12.0 to remove low-quality cells. In brief, a fragment object for each fragment file was created using the CreateFragmentObject() function of Signac. Then, peaks were called using the CallPeaks() function. We removed peaks mapping to contigs by using keepStandardChromosomes() and removed blacklisted regions by using the subsetByOverlaps() function with the options ranges = blacklist_hg38 and invert = TRUE.
We created a counts matrix for each library using FeatureMatrix(), then created a chromatin assay by inputting the created counts matrix and fragments file of the respective library using the CreateChromatinAssay() function of Signac. We filtered cells that did not include reads in more than 200 features and removed peaks that did not include reads from more than 10 cells. Finally, the Seurat object for each snATAC-seq library was created using the CreateSeuratObject() function.
The cells of each library were subject to QC analyses using the NucleosomeSignal(), TSSEnrichment(), FractionCountsInRegion() and FRiP() functions to filter out cells with high nucleosomal noise, those high in reads mapped to blacklisted regions, low enrichment near TSS and/or low in the number of reads contributing to peaks. Thresholds selected for each library can be found at https://github.com/BernsteinLab/ Myeloid-Glioma. The Seurat object and peaks for each library were saved after filtering out low-quality cells.
Next, we combined all the Seurat objects into one as follows. First, we merged all the peaks using the Reduce() function and filtered out peaks less than 20 base pairs (bp) or more than 10,000 bp in length. Then we created a new fragment object for each library by inputting the original fragments file into CreateFragmentObject() but used only high-quality cells. We then created a counts matrix for each library by inputting the newly created fragment objects and combined peaks using the FeatureMatrix() function. Then we created new chromatin assays for each library by inputting the newly created counts matrices and fragment objects using the CreateChromatinAssay() function. Next, we created a new Seurat object for each library using the newly created chromatin assays. Finally, we combined the new Seurat objects using the merge function.
The combined Seurat object was then subjected to clustering analysis and UMAP generation using the RunTFIDF(), FindTopFeatures(), RunSVD(), RunUMAP(), FindNeighbors() and FindClusters() functions. We used the lsi reduction and removed PC1 and PC3 because they were associated with library depth, not biology. The function DepthCor() was used to determine the association of each PC with depth.
The gene activities were calculated using the GeneActivity() function of Signac. Then we created a gene activity matrix using CreateAssayObject(). The values of gene activities were normalized using the NormalizeData() function with the options normalization.method set to RC and scale.factor set to median(Object$nCount_RNA).
The gene activity matrix was then subject to calculation of the cell-types cNMF programs, as described above for the scRNA-seq matrices, to annotate the cells in the matrix. Using these calculations,
the non-doublet myeloid cells were identified in the combined Seurat object as mentioned above.
The Seurat object was filtered to include only myeloid cells by using the subset() function. After that, a new set of peaks was called, resulting in the creation of a new feature matrix and a new chromatin assay. Finally, a gene activity matrix was generated for the combined myeloid-cells object, as discussed previously. The usage of the myeloid programs was determined in the myeloid cells to extract the discrete myeloid cells, as mentioned above, for the scRNA-seq libraries. We extracted discrete myeloid cells for monocyte and microglia identities and for systemic, scavenger, complement and microglial inflammatory for immunomodulatory activities. For systemic inflammatory myeloid cells, we selected the top 400 discrete myeloid cells.
To determine differentially accessible peaks in the immunomodulatory programs, we pseudobulked the discrete myeloid populations using the AggregateExpression() function with the following options: return.seurat = TRUE, group.by = Myeloid_Discrete_Status4, normalization.method LogNormalize, scale.factor . Then we extracted the normalized counts matrix using the LayerData() function on the pseudobulked Seurat object with the layer option set to data. We then converted the log1p values to exponential values and considered a peak to be specific to a particular discrete annotation if it had a count at least 2.5 times greater than the average counts of the other annotations. We generated normalized bigwigs for each annotation using an in-house code, which can be found at https://github.com/BernsteinLab/ Myeloid-Glioma. To generate a reference matrix of coverage for the regions spanning 1,000 bps upstream and downstream of the centres of the specific peaks, we utilized the deeptools computeMatrix function. We inputted the normalized bigwigs and the specific peak files while enabling the reference-point and-skipZeros options, and setting -referencePoint to centre and -b and -a to 1,000. Finally, we plotted the heatmap using the deeptools plotHeatmap function .
We performed motif analysis on each specific peak set using monaLISA v.1.11.4 to identify significantly enriched motifs. First, we combined the specific peaks and resized them to the median width of the combined peaks with a centre fixation. Subsequently, we divided the combined peak files into bins based on the annotation of the peak. We used the getSeq() function to obtain the sequences of the peaks. We used the PWM core JASPAR2024 (ref. 74) as features and determined the motifs using the calcBinnedMotifEnrR() function of monaLISA. To create a large background for calculating enrichments, we set the background to hg38 genome and the genome.oversample = 500. Finally, the motifs heatmap was generated using the plotMotifHeatmaps() function.
Ligand-TF analysis. To understand which ligands are involved in driving specific programs and regulatory circuitry, we used the NicheNet database (https://zenodo.org/record/7074291/files/gr_network_ human_21122021.rds) of file names gr_Network_Nichenet_Database. txt or Signaling_Network_Nichenet_Database) that connects ligands to the TFs they can activate through known ligand-receptor interactions.
We first identified a list of potentially active TFs for each immunomodulatory program through motif enrichment analysis of specific ATAC-seq loci (Fig. 4a,b) and SCENIC analysis (Fig. 4c). Then we used the NicheNet database to identify all ligands that were connected to each TF. We kept only ligands that were expressed in cells in the tumours (any cell type in the tumour microenvironment) at more than 0.3.
Bulk ATAC-seq analysis. The Nextera transposase adaptors were removed from the fastq files by trimming them with the –phred33 –paired –fastqc options using trim_galore (https://github.com/ FelixKrueger/TrimGalore). The STAR aligner was then used to map the fastqs with the following settings: -outSAMtype BAM SortedByCoordinate –outFilterMultimapNmax 1000 –outFilterScoreMinOverLread 0.25 –alignIntronMax 1–alignEndsType EndToEnd. We then used the
PICARD MarkDuplicates module (https://broadinstitute.github.io/ picard/) with the option REMOVE_DUPLICATES set to TRUE. Afterwards, samtools was used to remove reads mapped to chrM or contigs. The processed bam files were then used to generate bigwigs using the bamCoverage function of deeptools with the RPGC normalization method and an effective genome size of . To identify accessible regions, we converted the processed bam files to bed format using bedtools and used awk to add four bases to the start site if the read was on the positive strand and remove five bases from the end site if the read was on the negative strand to correct for tn5 biases. MACS2 v.2.2.9.1 was used to call peaks using the following settings: -g hs -fBED -q 0.01 -nomodel –shift -75 –extsize 150 –keep-dup all. To identify differential accessible sites, we created tag directories using the processed mapped files as input for the makeTagDirectory function of HOMER . The accessible sites for DMSO and p300i libraries were merged using the mergePeaks function of HOMER, and differential accessible sites were determined using the getDifferentialPeaks function of HOMER and setting -F to 2 to keep regions with two-fold higher normalized tag counts in one of the libraries. Deeptools heatmaps were generated as mentioned above, and significant motifs enriched in the differential accessible sites were identified using monaLISA v.1.11.4, similar to the way mentioned above, except for setting genome.oversample to 50, given the number of differentially accessible sites.
GR ChIP-seq analysis. The binding sites of GR were obtained from ref. 43 . The binding sites were annotated using the findPeaks module of HOMER. The maximum allowable distance to a gene was 100,000 bp.
Temporal correlation analysis. We obtained gene sets for genes correlated with recent infiltration and remote infiltration into the tumour in a mouse model of glioblastoma . We used gprofiler (https://biit. cs.ut.ee/gprofiler/gost) to determine the enrichment of the myeloid cNMF programs in these gene sets by submitting the top 100 genes for each cNMF program as a query against each gene set as a background.
Reporting summary
Further information on research design is available in the Nature Portfolio Reporting Summary linked to this article.
Data availability
The raw counts and processed dataset for the discovery and validation cohort are available at the single-cell portal with study ID SCP2389 at https://singlecell.broadinstitute.org/single_cell/study/SCP2389/ programs-origins-and-niches-of-immunomodulatory-myeloid-cells-in-human-gliomas. For all scRNA-seq data generated for this manuscript (MGB and the IDH-mutant cohort from McGill University), individual-level raw data were deposited at dbGaP with study accession code phs003756.v1.p1 and can be viewed at the dbGaP study report page at https://www.ncbi.nlm.nih.gov/projects/gap/cgi-bin/study. cgi?study_id=phs003756.v1.p1. For other data reanalysed in this study, the Methodist data were downloaded from GEO series GSE182109; the Jackson Laboratories data were downloaded from https://ega-archive. org/datasets/EGAD00001007772; and the published McGill University data (IDH-WT samples) were downloaded from https://ega-archive. org/datasets/EGAD00001006206. All other data are available from the corresponding author on reasonable request.
An online tool to calculate usages of the presented consensus myeloid programs for glioma-associated myeloid cells from other experiments can be found at https://consensus-myeloid-program-calculator. shinyapps.io/shinyapp/. This tool enables users to upload their own gene-expression matrix from scRNA-seq data and output consensus program usages for each cell.
56. Hughes, T. K. et al. Second-strand synthesis-based massively parallel scRNA-Seq reveals cellular states and molecular features of human inflammatory skin pathologies. Immunity 53, 878-894 (2020).
57. Jacob, F., Ming, G.-L. & Song, H. Generation and biobanking of patient-derived glioblastoma organoids and their application in CAR T cell testing. Nat. Protoc. 15, 4000-4033 (2020).
58. Chen, Z. et al. Integrative dissection of gene regulatory elements at base resolution. Cell Genom. 3, 100318 (2023).
59. Li, B. et al. Cumulus provides cloud-based data analysis for large-scale single-cell and single-nucleus RNA-seq. Nat. Methods 17, 793-798 (2020).
60. Dobin, A. et al. STAR: ultrafast universal RNA-seq aligner. Bioinformatics 29, 15-21 (2013).
61. Hao, Y. et al. Integrated analysis of multimodal single-cell data. Cell 184, 3573-3587 (2021).
62. Raudvere, U. et al. g:Profiler: a web server for functional enrichment analysis and conversions of gene lists (2019 update). Nucleic Acids Res. 47, W191-W198 (2019).
63. Gu, Z., Eils, R. & Schlesner, M. Complex heatmaps reveal patterns and correlations in multidimensional genomic data. Bioinformatics 32, 2847-2849 (2016).
64. Herring, C. A. et al. Human prefrontal cortex gene regulatory dynamics from gestation to adulthood at single-cell resolution. Cell 185, 4428-4447 (2022).
65. Delaney, C. et al. Combinatorial prediction of marker panels from single-cell transcriptomic data. Mol. Syst. Biol. 15, e9005 (2019).
66. Hänzelmann, S., Castelo, R. & Guinney, J. GSVA: gene set variation analysis for microarray and RNA-seq data. BMC Bioinformatics 14, 7 (2013).
67. Bland, J. M. & Altman, D. G. Statistics notes. The odds ratio. BMJ 320, 1468 (2000).
68. Robinson, M. D., McCarthy, D. J. & Smyth, G. K. edgeR: a Bioconductor package for differential expression analysis of digital gene expression data. Bioinformatics 26, 139-140 (2010).
69. Newman, A. M. et al. Determining cell type abundance and expression from bulk tissues with digital cytometry. Nat. Biotechnol. 37, 773-782 (2019).
70. Arvai, K. et al. Arvkevi/kneed: Documentation! Zenodo https://doi.org/10.5281/zenodo. 6496267 (2020).
71. Stuart, T., Srivastava, A., Madad, S., Lareau, C. A. & Satija, R. Single-cell chromatin state analysis with Signac. Nat. Methods 18, 1333-1341(2021).
72. Ramírez, F. et al. deepTools2: a next generation web server for deep-sequencing data analysis. Nucleic Acids Res. 44, W160-W165 (2016).
73. Machlab, D. et al. monaLisa: an R/Bioconductor package for identifying regulatory motifs. Bioinformatics 38, 2624-2625 (2022).
74. Rauluseviciute, I. et al. JASPAR 2024: 20th anniversary of the open-access database of transcription factor binding profiles. Nucleic Acids Res. 52, D174-D182 (2024).
75. Martin, M. Cutadapt removes adapter sequences from high-throughput sequencing reads. EMBnet J. 17, 10-12 (2011).
76. Danecek, P. et al. Twelve years of SAMtools and BCFtools. Gigascience 10, giab008 (2021).
77. Quinlan, A. R. & Hall, I. M. BEDTools: a flexible suite of utilities for comparing genomic features. Bioinformatics 26, 841-842 (2010).
78. Heinz, S. et al. Simple combinations of lineage-determining transcription factors prime cis-regulatory elements required for macrophage and B cell identities. Mol. Cell 38, 576-589 (2010).
79. Kolberg, L. et al. g:Profiler-interoperable web service for functional enrichment analysis and gene identifier mapping (2023 update). Nucleic Acids Res. 51, W207-W212 (2023).
Acknowledgements We thank the patients and their families for donating tumour tissue for this study; B. Li for technical help with the Cumulus pipeline; E. Estrada for help determining the specificity of our programs across different tumour types; I. Tirosh and all members of the Bernstein lab for feedback; and J. M. Larson, M. A. De Sauvage, E. Summers, staff at the MGH Pathology Tissue Bank and MGH Neurosurgery, M. C. Prabhu, C. C. Bossi, K. L. Ligon and staff at the Neuro-oncology Tissue and Data Bank for help acquiring fresh tissue resections. T.E.M. and this study were supported by the UK Brain Tumour Charity’s Future Leaders Awards (GN-000701 and GN-000722) in partnership with the Jake McCarthy Foundation and the Ria Melvin Fund, the American Brain Tumor Association basic research fellowship in honour of Joel A. Gingras Jr, the SITC-Bristol Myers Squibb Postdoctoral Cancer Immunotherapy Translational Fellowship, the NCI KO8 award KO8CA276819 and the NIH T32 training grant CA9216. C.P.C. was supported by postdoctoral fellowships from the Ludwig Center at MIT’s Koch Institute, the Canadian Institutes of Health Research (181907), the Fond de Recherche du Québec – Santé and a grant from the J. H. and E. V Wade Fund at MIT. L.N.G.C. was supported by the Robert Wood Johnson Foundation. A.K.S. was supported by NIH grants NCI P3O CA14051, NCI 1U2C CA23319501 and NCI U54 CA217377, the J. H. and E. V Wade Fund at MIT and the Pew-Stewart Scholars Program for Cancer Research. Z.C. was supported by NCI-CA-234842. D.S.F. was supported by the Eric and Wendy Schmidt Center at the Broad Institute of MIT and Harvard. J.L.G. was supported by R37CA269499. This project was supported by funds from the Brilliant Night Foundation (to K.P.), the NCI/NIH Director’s Fund (DP1CA216873 to B.E.B.), the Ludwig Center at Harvard and the Emerson Collective. B.E.B. is the Richard and Nancy Lubin Family chair at the Dana Farber Cancer Institute, an American Cancer Society research professor and an investigator in the Ludwig Center at Harvard.
Author contributions T.E.M, C.A.E.F., C.P.C., M.L.S., A.K.S. and B.E.B. conceived and designed the study. T.E.M., C.P.C., Z.C., J.P.D., J.V., L.N.G.C. and A.N.C. collected primary tumours, created GBOs, did scRNA-seq and performed experiments on GBOs. T.A.S. and K.P. provided the McGill tumour cohort with clinical data and supported the interpretation of results. D.H.H. provided the 10 X Visium cohort and supported the analysis and interpretation of results. T.E.M., C.A.E.F., C.P.C., Z.C., M.A.V., Y.E.T., A.N.C., Y.Z., D.S.F. and B.E.B. contributed to analytical approaches and performed statistical analyses. J.L.G., M.L.S., A.K.S. and B.E.B. supervised the project and contributed to the interpretation of the data. T.E.M., C.A.E.F., C.P.C. and B.E.B. interpreted data and wrote the manuscript. All authors reviewed and edited the manuscript.
Competing interests T.E.M. has financial interests in Reify Health, Care Access Research and Telomere Diagnostics. C.P.C. has financial interest in Axoft. L.N.G.C. receives consulting fees from Elsevier, Oakstone Publishing, Prime Education, BMJ Best Practice and Servier, and research funding from Merck & Co (to the Dana-Farber Cancer Institute). J.L.G. is consultant and serves on the scientific advisory board of Array BioPharma, AstraZeneca, BD Biosciences, Carisma, Codagenix, Duke Street Bio, GlaxoSmithKline, Kowa, Kymera, OncoOne and Verseau Therapeutics, and receives research support from Array BioPharma/Pfizer, Eli Lilly, GlaxoSmithKline and Merck. M.L.S. is an equity holder, scientific co-founder and advisory board member of Immunitas Therapeutics. A.K.S. receives compensation for consulting and/or scientific advisory board membership from Honeycomb Biotechnologies, Cellarity, Ochre Bio, Relation Therapeutics, FL86/Quotient Therapeutics, Parabalis Medicines, Passkey Therapeutics, IntrECate Biotherapeutics, Danaher, Senda Biosciences and Dahlia Biosciences that is unrelated to this work. B.E.B. has financial interests in Fulcrum Therapeutics, HiFiBio, Arsenal Biosciences, Chroma Medicine and Cell Signaling Technologies. The other authors declare no competing interests.
Additional information
Supplementary information The online version contains supplementary material available at https://doi.org/10.1038/s41586-025-08633-8.
Correspondence and requests for materials should be addressed to Bradley E. Bernstein. Peer review information Nature thanks Leila Akkari and the other, anonymous, reviewer(s) for their contribution to the peer review of this work.
Reprints and permissions information is available at http://www.nature.com/reprints.
Article
Extended Data Fig.1|See next page for caption.
Extended Data Fig. 1|Identification of consensus myeloid programs in discovery and validation cohorts. a) Computational pipeline used to identify recurrent myeloid programs in scRNA-seq data from three discovery cohorts, and applied separately to validation cohort (McGill).b) UMAP for all cells in the MGB discovery cohort colored by nominal cell type. c) Same UMAP with cells annotated by the presence (black) or absence (gray) of copy number variations. d) Heatmap depicts the expression of genes in recurrent myeloid programs
(rows) across cells (column) grouped by cell type, analogous to Fig.1c, but for the validation cohort (McGill). Cell type determined from the usage of cNMF myeloid identity programs. e) Boxplots depict the percentage of cells per tumor expressing the corresponding myeloid program (far left) across the validation cohort. Line represents median and boxes represent 1st and 3rd quartiles. Consensus myeloid programs were highly consistent between discovery and validation cohorts.
Extended Data Fig. 2 | See next page for caption.
Extended Data Fig. 2 |Identification and comparison of cNMF programs in peripheral myeloid cells to tumor programs. a) cNMF programs identified from scRNA-seq profiles of peripheral blood from glioma patients. Plot compares cNMF programs between peripheral myeloid cells and gliomaassociated myeloid cells. Heat and dot size correspond to Jaccard Index between gene spectra.b) For each myeloid cell type, stacked bar shows the absolute number of cells with top usage of indicated activity programs. c) For each myeloid cell type (rows), horizontal bars indicate the percent of cells with usage of the indicated activity program. d) Heatmap shows relative enrichment of the indicated activity programs (columns) across the different cell identities (rows). P value calculated using hypergeometric distribution. e) Schematics depicts expansion of the cohort to include the
McGill samples in all subsequent analyses. f) Violin plots shows the usage of each immunomodulatory program in cells with usage of the Scavenger Immunosuppressive program (left) or the Complement Immunosuppressive program (right). g) Quadrant plots position cells (dots) by their expression of the immunomodulatory programs as in Fig.1e. Grayscale depicts usage of the indicated immunomodulatory program. The position of each dot represents the difference in the usage of immunosuppressive and inflammatory programs by that cell (the upper part of the plot is more inflammatory, while the lower part is more immunosuppressive). h) Quadrant plot as in g but with cells colored by cohort. Overall, the four immunomodulatory programs are shared across myeloid cell types, but are rarely utilized by the same cells. PBMC tube, Shalek, A. (2005) https://BioRender.com/b15i535.
Extended Data Fig. 3 | See next page for caption.
Extended Data Fig. 3 | Direct comparison of Louvain clustering and cNMF programs. a) UMAP displays the Louvain clusters of batch-corrected singlet myeloid cells of the MGB cohort.b) UMAPs of the same MGB cohort with cells annotated by their usage of the cell identity (top) and cell activity programs (bottom). c) Louvain clusters in panel a were annotated based on differential gene expression analysis (left), or by the name and frequency of most frequent cell type per cNMF identity program usage (middle). For each Louvain cluster (rows), bar chart (right) indicates the percent of cells with high expression of the indicated activity program (columns). d) (Top) UMAP exhibiting the Louvain clusters of batch-corrected singlet myeloid cells of the Abdelfattah
et al. cohort. (Bottom) UMAPs of the myeloid cells of the Abdelfattah et al. cohort demonstrating the usage of indicated programs at the top of each UMAP. e) (left) Annotations of Louvain clusters in (d) based on standard differential gene expression analysis of clusters by Abdelfattah et al. (Right) bar chart of the average usage of identity and activity cNMF programs in the cells of the Louvain clusters in (d). The clusters are composed of cells that are heterogeneous combinations of the cNMF programs, with the clusters largely segregating by identity program usage, while the activity programs are shared across clusters and cell types.
Extended Data Fig.5 | See next page for caption.
Extended Data Fig. 5 | Convergent phenotypes of microglia- and bone marrow-derived myeloid cells. a) MAESTER analysis pipeline for inferring the origins of myeloid cells in glioma based on detection of mtDNA mutations in scRNA-seq data. b) Plot depicts the enrichment difference between PBMCspecific and Resident-specific variants. Each dot represents the enrichment level for cells with the indicated identity in one patient. X-axis denotes the scaled difference between GSVA enrichment of PBMC-specific variants and Resident variants. c) Stacked bar charts indicate the average usage of the immunomodulatory programs in myeloid cells with the indicated cell identities for the four tumors shown in panelb. The “other programs” category encompasses the other identity and activity programs. d) Experimental design
(top) and flow cytometry plots (bottom) for matched patient derived PBMCs applied to immune cell-depleted GBOs. Results are from a combination of 8 GBOs per condition. T cells were used as gating control for P2RY12 and TMEM119. e) Representative immunofluorescence images show PBMCs infiltrated into a GBO.f) Representative immunofluorescence images of organoid sections from different patients using the same experimental setup as in (d) except using normal donor monocytes.g) Pie charts depict quantification of images in (f). Results are from 4 GBOs combined for each condition. h) Flow cytometry plots evaluate the percent of CD45+ cell infiltration into the GBOs. Credit: 96-well plate and PBMC tube,Shalek, A. (2005) https://BioRender.com/ b15i535.
Extended Data Fig. 6 | See next page for caption.
Extended Data Fig. 6|Spatial associations of myeloid cells and glioma niches. a) Schematic illustrates the analysis approach for spatial transcriptomics samples: cNMF was applied to spatial transcriptomic data from Ravi et al. to define broad transcriptomic tumor niche programs; in parallel, the cell content of each spot was inferred based on scRNA-seq signatures (RCTD demultiplexing; see Methods). Spatial Pie plot (middle) of a representative 10X Visium section depicts tumor niche programs. Each pie represents a spot and is colored by expression of the indicated tumor niche programs. Spatial plot (right) of the same section depicts relative expression of the indicated cell type programs (gray scale indicates RCTD-predicted spot proportions).b) Heatmap shows expression of genes (rows) grouped by niche program across all spots (columns) in the cohort of spatial transcriptomic samples. Top 40 genes of each niche program are shown. Gene expression data is column normalized, then log normalized and scaled by variance.c) Spatial plots show relative expression of cellular programs in the 10 X Visium section shown in Fig. 2a (gray scale indicates RCTD-predicted spot proportions). d) Dotplot displays the spatial proximity
enrichment score between niche programs, calculated independently per sample (p-value ordinary least squares, see Methods). Dot size denotes the proportion of samples showing a significant correlation (p-adj<0.01), while color signifies a positive (red) or negative (blue) correlation. e) Dotplot displays the spatial proximity enrichment score between cell programs, calculated independently per sample ( p -value ordinary least squares, see Methods). f) Network graph illustrates recurrent spatial relationships of cell types in tumor microenvironment across spatial transcriptomic samples. Nodes denote cell types, with edges marking significantly enriched proximities between cell types, observed in at least of samples with an average enrichment score>0.1. Edge width reflects this average score.g) Scatter plot exhibits the mean Scavenger Immunosuppressive program score ( x -axis) versus the MES2 or MES1 cancer program score ( y -axis) across glioma samples in the scRNA-seq dataset. Ordinary least square results are shown (line, and p -value).
Extended Data Fig.7 | See next page for caption.
Extended Data Fig. 7 | Myeloid program composition varies with histopathological tumor grade. a) Quadrant plot with myeloid cells positioned as in Fig. 1e with each cell colored by the IDH mutation status of the corresponding tumor.b) Box plots show the average usage of cell activity (left) and identity (right) programs in myeloid cells from the single-cell RNA-Seq cohorts, stratified by IDH mutation status of the corresponding tumor. For all box plots in figure, each dot represents a tumor, and lines represent median and quartiles. The whiskers represent 1.5 times the interquartile range. FDR corrected p-value calculated using two-sided Wilcoxon Rank Sum Test:*<0.05, . c) Box plot exhibiting the program average module scores in tumors of the TCGA cohort stratified by IDH mutation status. d) Quadrant
plots as in panel (a) in which the black color indicates whether a myeloid cell is from a grade 2 (left), grade 3 (center), or grade 4 (right) glioma. e) Box plots depict the average usage of each immunomodulatory program in myeloid cells from gliomas stratified by grade.f) Box plot shows the average usage of the G2M cycling program in myeloid cells in single-cell RNA-Seq data for the glioma cohorts, stratified by grade and IDH mutation status. g) Boxplot shows the odds ratio of cycling for myeloid cells expressing the indicated programs, calculated independently for each tumor. ‘Cycling’ and program defined by a cell usage of both cycling and indicated program. h) Quadrant plot as in Fig. 3a with indication of cycling cells.
Extended Data Fig. 9 | See next page for caption.
Extended Data Fig. 9 | Comparisons of clinical outcomes to previously published gene sets. a-c) Boxplot shows the relative module score of published myeloid gene sets from Pombo-Antunes et al. (a), Abdelfattah et al. (b) and Lee et al. (c) ingliomas from Mei et al. stratified by response to immunotherapy.
Boxplots represent median and quartiles, with whiskers representing 1.5 times
the interquartile range. Significance calculated by FDR-corrected two-sided Wilcoxon Rank Sum Test. All were > 0.25. d) Barplots show P-values calculated using a two-sided log-rank test ( -axis) to determine whether the indicated gene sets ( x -axis) from Pombo-Antunes et al., Abdelfattah et al., and Lee et al. are associated with survival differences. None met significance of .
Extended Data Fig. | See next page for caption.
Extended Data Fig. 10|TF circuits associated with the immunomodulatory
programs. a) Schematic of the snATAC-seq analysis pipeline for deriving pseudo-bulk accessibility profiles for the respective immunomodulatory programs.b) Heatmap depicts relative accessibility over candidate regulatory sites for each immunomodulatory program, as in Fig. 4a but including Monocyte and Microglial populations.c) Heatmap shows the average TF expression and percent of cells expressing the TF in myeloid cells with discrete Systemic or Scavenger program expression. d) Barchart shows enrichments of 50 most
downregulated genes within 24 h of Dex treatment in human macrophages (KEGG gene sets). Regulated genes derived from Table S1B from Jubb et al. P-value generated by gProfiler using default settings. e) Boxplot of TNFAIP3 expression in macrophages after 1 h of Dex treatment (Jubb et al.). Boxplots represent median and quartiles, with whiskers representing 1.5 times the interquartile range. Significance is adjusted p value (FDR) taken from Table S1A of Jubb et al.
Extended Data Fig. 11|See next page for caption.
Extended Data Fig. 11 |Dexamethasone rapidly and durably induces the Complement Immunosuppressive program. a) Experimental design and bar graph shows the percentage of myeloid cells expressing the immunomodulatory programs in scRNA-seq data for GBOs treated with Dex for 7 days or control. 16 GBOs from BWH11 were pooled per condition and sequenced; error bars were calculated from the binomial standard error. p -value by Fisher’s Exact test, all other comparisons not significant.b) Immunofluorescence images of a GBO with intact endogenous TME cultured for 7 days with 100 nM Dex or DMSO control. c) Barplot shows mean quantification of marker positive cells in sectioned organoids. Each dot represents an organoid. P-value calculated with 2-tailed student’s T-test. Error bars represent S.D. d) Experimental design and flow cytometry results for peripheral monocytes applied to immune celldepleted GBOs in the presence of Dex or IFN-gamma. Data points represent 3 pooled GBOs. Error bars represent S.D.e) Representative histology section of a GBO in the experiment shown in (d). f) Flow cytometry results of GBOs from multiple patients show consistent phenotypes. Experimental design as in Fig. 5c. Top row shows CD163, a marker of the Complement Immunosuppressive program. Bottom row shows ICAM1, a marker of the Systemic Inflammatory
program. BWH911CD163 plot is the same as shown in Fig. 5c. Barplots show mean signal +/-S.D.Data points (4) each represent 2 pooled GBOs.g) Experimental design and results from Dex treatment of infiltrating GBO model. Flow cytometry results after 24 h of treatment, prior to adding cells to GBOs (bottom left). Barcharts show the mean of 3 wells of monocytes treated from the same patient. Error bars +/- S.D. Representative flow plot is shown. Middle schematic shows experimental design after pretreated cells were applied to GBOs. Barchart on the right shows mean flow cytometry results for infiltrated and noninfiltrated myeloid cells, stratified by treatment. Data points (4) each represent 3 pooled wells (for non-infiltrated) or GBOs (for infiltrated). Error bars +/-S.D. Peripheral monocytes exposed to Dex prior to being cultured with GBOs turned on Complement markers and maintained program marker expression after GBO infiltration and through differentiation. The Complement Immunosuppressive marker expression in the GBO was equivalent regardless of exposure timing or duration, indicating monocytes have a memory of Dex exposure even when put in different microenvironments. Credit: 96-well plate and PBMC tube, Shalek, A. (2005) https://BioRender.com/b15i535.
Extended Data Fig. 12 | See next page for caption.
Extended Data Fig. 12 | Impact of microenvironment and perturbations on immunomodulatory programs. a) Experimental design and barplot for evaluations of the impact of epigenetic inhibitors on glioma-associated myeloid cell activity and identity programs. 25 GBOs from MGH630 were pooled per condition and sequenced b) Schematic of the four immunomodulatory activity programs in glioma-associated myeloid cells, along with the microenvironmental associations, TF enrichments, and perturbations shown to induce or reverse program expression. Myeloid cell types depicted in each program quadrant are an approximation of the distribution of cell types expressing the respective
program. Program distribution across CNS and non-CNS malignancies also noted. c) Bar plots of gene set enrichments from mouse lineage tracing data (Kirschenbaum et al.). Gene sets derived from Top 100 genes in myeloid cells most correlated with recent infiltration (closer to 12 h ) or Top 100 genes most correlated with remote infiltration (being in the tumor for up to 48 h ). Gene list taken from Kirschenbaum et al. Supplemental Table 2, sheet “Table_S3_Isotype_ Control_Time”. P-value generated by gProfiler using default settings with a custom gene set matrix consisting of our cNMF programs. Credit: 96-well plate and PBMC tube, Shalek, A. (2005) https://BioRender.com/b15i535.
natureportfolio
Corresponding author(s): Bradley E. Bernstein
Last updated by author(s): 12/31/2024
Reporting Summary
Nature Portfolio wishes to improve the reproducibility of the work that we publish. This form provides structure for consistency and transparency in reporting. For further information on Nature Portfolio policies, see our Editorial Policies and the Editorial Policy Checklist.
Statistics
For all statistical analyses, confirm that the following items are present in the figure legend, table legend, main text, or Methods section.
n/a
□
□
□
Confirmed
The exact sample size for each experimental group/condition, given as a discrete number and unit of measurement
A statement on whether measurements were taken from distinct samples or whether the same sample was measured repeatedly
The statistical test(s) used AND whether they are one- or two-sided
Only common tests should be described solely by name; describe more complex techniques in the Methods section.
□ A description of all covariates tested
□
□
A description of any assumptions or corrections, such as tests of normality and adjustment for multiple comparisons
A full description of the statistical parameters including central tendency (e.g. means) or other basic estimates (e.g. regression coefficient) AND variation (e.g. standard deviation) or associated estimates of uncertainty (e.g. confidence intervals)
□
For null hypothesis testing, the test statistic (e.g. ) with confidence intervals, effect sizes, degrees of freedom and value noted Give values as exact values whenever suitable.
□
For Bayesian analysis, information on the choice of priors and Markov chain Monte Carlo settings
□ For hierarchical and complex designs, identification of the appropriate level for tests and full reporting of outcomes
□ Estimates of effect sizes (e.g. Cohen’s , Pearson’s ), indicating how they were calculated
Our web collection on statistics for biologists contains articles on many of the points above.
Software and code
Policy information about availability of computer code
Data collection
Data analysis
Flow cytometry data were collected at: BD LSRFortessa X-20 (BD Bioscience) using DIVA software (BD Bioscience).
Immunofluorescence images were acquired on a Leica Thunder microscope using LAS X software Version 3.8.2.27713
Bulk and single-cell RNA-Sequencing libraries were sequenced on NextSeq500 instruments (Illumina).
A shiny tool to calculate usage of the presented consensus myeloid programs for glioma-associated myeloid cells from other experiments can be found at: https://github.com/BernsteinLab/Calculate_Myeloid_cNMF_Usage/
Genomic analysis tools utilized:
STARsolo V2.7.10b for scRNA-seq alignment
Seurat v4 for scRNA-seq analysis
inferCNV V1.3.3 to identify CNVs in single cells
cNMF V1.0.4 was used for program identification
Signac V1.12.0 for scATAC-seq analysis
MACS2 V2.2.9.1 was used for bulk ATAC-Seq peak calling
monaLISA V1.11.4 to identify significantly enriched TF motifs
Other software used for data analysis:
Flow cytometry data were analyzed with FlowJo (Treestar) version v10
All histological images were analyzed using the Qupath open source image analysis software v0.4.3.
Detailed description of computation methods is provided in Methods section.
For manuscripts utilizing custom algorithms or software that are central to the research but not yet described in published literature, software must be made available to editors and reviewers. We strongly encourage code deposition in a community repository (e.g. GitHub). See the Nature Portfolio guidelines for submitting code & software for further information.
Data
Policy information about availability of data
All manuscripts must include a data availability statement. This statement should provide the following information, where applicable:
Accession codes, unique identifiers, or web links for publicly available datasets
A description of any restrictions on data availability
For clinical datasets or third party data, please ensure that the statement adheres to our policy
For all scRNA-seq data generated for this manuscript (MGB and IDH-mutant cohort from McGill), individual-level raw data are deposited at dbGaP with Study Accession: phs003756.v1.p1 and can be browsed at the dbGaP study report page at: https://www.ncbi.nlm.nih.gov/projects/gap/cgi-bin/study.cgi? study_id=phs003756.v1.p1
Research involving human participants, their data, or biological material
Policy information about studies with human participants or human data. See also policy information about sex, gender (identity/presentation), and sexual orientation and race, ethnicity and racism.
Reporting on sex and gender
Reporting on race, ethnicity, or other socially relevant groupings
Population characteristics
Biological sex information is collected and reported, but no analysis was reported in this manuscript. However, we report the data as this dataset will be a resource for the field and others may want to run sex-specific analyses.
We do not collect nor report race, ethnicity, or other socially relevant groupings
We report the following population characteristics, when available, for the patients included in the human tumor datasets analyzed in this study: Diagnosis, Grade, Recurrence_Status, Age, Sex, Tumor, Location, IDH Status, IDH_mutation, MGMT Methylation, Steroid Use, Steroid Daily Dose. All patients with recurrent tumors were treated with standard of care chemotherapy and radiation. This clinical information is reported in Supplemental Table 1.
Recruitment
Ethics oversight
Adult male and female patients undergoing neurosurgery for a brain tumor at Massachusetts General Hospital or Brigham and Women’s Hospital were offered to consent to biobanking of excess surgical tissue under an IRB-approved biobanking protocol. There were no exclusionary criteria used other than patient’s or patient’s proxy’s willingness to consent to participate. We do not anticipate any biases introduced through this recruitment strategy that would impact the results in this manuscript.
Adult male and female patients at Massachusetts General Hospital or Brigham and Women’s Hospital (MGB) provided preoperative informed consent to take part in the study in all cases under the approved Institutional Review Board Protocol DF/HCC 10-417. Patients in other cohorts were consented according to their published methods. Previously unpublished patient data from the Montreal Neurological Institute was collected as reported with other tumors from McGill University (see methods).
Note that full information on the approval of the study protocol must also be provided in the manuscript.
Field-specific reporting
Please select the one below that is the best fit for your research. If you are not sure, read the appropriate sections before making your selection.
Life sciences
Behavioural & social sciences
□ Behavioural & social sciences □ Ecological, evolutionary & environmental sciences
□
□
Ecological, evolutionary & environmental sciences
Life sciences study design
All studies must disclose on these points even when the disclosure is negative.
Sample size
No clinical trial or animal studies were conducted as part of this manuscript. Sample size of the main tumor cohort analyzed by scRNA-seq was chosen without power calculations, but was chosen based on experience and preliminary analyses with a smaller sample size. With less than 20 tumors, our program results became impacted by adding or subtracting individual tumors. To reach consensus for our cNMF gene expression programs, we also added additional cohorts and then found recurrent programs across cohorts to ensure these were not tumor specific. For other experiments, we sought to achieve at least 3 biological replicates.
Data exclusions
In general, all data were included. In analyses where certain data was excluded, this is explicitly stated in the text and/or methods.
Replication
The number of replicates for each experiment is indicated in the figures or figure legends. All experiments were repeated multiple times with different patients or different cohorts as stated in the figure legends and methods. Many key findings were confirmed using orth
Randomization
No clinical trial or animal studies were conducted as part of this manuscript. For experiments conducted using glioblastoma organoids (GBOs), individual GBOs were randomized into different conditions through mixing in a single plate and then distributing into a 96 -well plate. For genomics experiments, all samples were used and therefore no randomization was needed nor used.
Blinding
We did not run a clinical trial or animal experiments that would have required specific blinding strategies. For the other experiments, for instance flow cytometry, immunofluorescence imaging, and sequencing experiments that are based on objective measurements, blinding was not required as results were not subjectively scored.
Reporting for specific materials, systems and methods
We require information from authors about some types of materials, experimental systems and methods used in many studies. Here, indicate whether each material, system or method listed is relevant to your study. If you are not sure if a list item applies to your research, read the appropriate section before selecting a response.
Validation
All antibodies for flow cytometry used in this study were purchased from commercial sources and fully validated antibodies, including KO validated antibodies, were used when available. Well-referenced antibodies validated by other labs were also chosen when manufacturer-validated antibodies were not available. All antibodies used for flow cytometry were purchased from Biolegend, with the exception of TREM2 from R&D (validated with known positive and negative cell populations) and TMEM119 from Abcam (KO validated by Abcam). They are suitable for flow-cytometric analyses and were characterized and validated by Biolegend. These indications are available on the manufacturer’s websites (https://www.biolegend.com/en-us/quality/quality-control); For IF and IHC staining, negative controls (isotype and secondary antibody staining) were performed.
Plants
Seed stocks
N/A
Novel plant genotypes
N/A
Authentication
N/A
Flow Cytometry
Plots
Confirm that:
The axis labels state the marker and fluorochrome used (e.g. CD4-FITC).
The axis scales are clearly visible. Include numbers along axes only for bottom left plot of group (a ‘group’ is an analysis of identical markers).
All plots are contour plots with outliers or pseudocolor plots.
A numerical value for number of cells or percentage (with statistics) is provided.
Methodology
Sample preparation
Flow cytometry was done based on a prior protocol7. In brief, an antibody cocktail was made by ratio of Brilliant Stain Buffer(BD Horizon,566349) and PBS, and then antibodies/dyes were added. Single cell suspensions were washed by PBS BSA in 1.5 ml Eppendorf tubes or 96 -well U bottom plates. Cells were pelleted by centrifugation at room temperature, 300 xg for 5 mins. After removing the washing buffer, cells were resuspended in 100 ul staining cocktails via pipetting up and down ~10 times. Plates or tubes were covered to avoid light and stained in a dark at room temperature for mins. Cells were washed by PBS+0.5%BSA, centrifuged at room temperature, 300 xg for 5 mins . Cell pellets were resuspended in 200 ul of PBS+0.5%BSA.
Instrument
Flow cytometry was processed on BD LSRFortessa X-20 according to the manufacturing procedure. UltraComp eBeads (Invitrogen, 01-3333-42) are used to pre-annotate the compensation.
Software
FlowJo V 10 is used to process data analysis
Cell population abundance
The purity of sorted samples was analyzed by flow cytometry on the same instruments used for sorting.
Gating strategy
All immune cells were gated on FSC/SSC, using PBMC controls for each experiment. Single cells were gated on FSC-a/FSC-h. Zombie NIR Live/Dead dye was used to gate on live cells.
For all GBO perturbation experiments with myeloid cells, myeloid cells were defined CD45+/CD11b+. Untreated monocytes or PBMCs were used as gating controls for myeloid selection and binary populations to define the marker-positive populations. the gating control for TMEM119 and P2RY12.
Tick this box to confirm that a figure exemplifying the gating strategy is provided in the Supplementary Information.
Department of Cancer Biology, Dana Farber Cancer Institute, Boston, MA, USA. Broad Institute of MIT and Harvard, Cambridge, MA, USA. Department of Pathology and Krantz Family Center for Cancer Research, Massachusetts General Hospital and Harvard Medical School, Boston, MA, USA. Departments of Cell Biology and Pathology, Harvard Medical School, Boston, MA, USA. Ludwig Center at Harvard Medical School, Boston, MA, USA. Institute for Medical Engineering and Sciences and Department of Chemistry, Massachusetts Institute of Technology, Cambridge, MA, USA. Koch Institute for Integrative Cancer Research, Massachusetts Institute of Technology, Cambridge, MA, USA. Department of Neurosurgery, Brigham and Women’s Hospital, Boston, MA, USA. Ragon Institute of MGH, Massachusetts Institute of Technology and Harvard University, Cambridge, MA, USA. Center for Neuro-Oncology, Dana-Farber Cancer Institute and Department of Neurology, Brigham and Women’s Hospital, Boston, MA, USA. 11Department of Neurology and Neurosurgery, Montreal Neurological Institute-Hospital, McGill University, Montreal, Quebec, Canada. Microenvironment and Immunology Research Laboratory, Medical Center – University of Freiburg, Freiburg, Germany. Department of Neurological Surgery, Northwestern University Feinberg School of Medicine, Chicago, IL, USA. Division of Breast Surgery, Department of Surgery, Brigham and Women’s Hospital, Boston, MA, USA. Present address: Department of Pathology, Case Western Reserve University School of Medicine and Case Comprehensive Cancer Center, Cleveland, OH, USA. Present address: Brain Tumour Research Center, Montreal Neurological Institute, McGill University, Montreal, Quebec, Canada. These authors contributed equally: Tyler E. Miller, Chadi A. El Farran, Charles P. Couturier. e-mail: bradley_bernstein@ dfci.harvard.edu