تباين مخزون الكربون في الأعشاب البحرية على مستوى العالم والانبعاثات الناتجة عن فقدان الأعشاب البحرية Global seagrass carbon stock variability and emissions from seagrass loss
تباين مخزون الكربون في الأعشاب البحرية على مستوى العالم والانبعاثات الناتجة عن فقدان الأعشاب البحرية
تاريخ الاستلام: 27 أكتوبر 2024 تم القبول: 14 أبريل 2025 نُشر على الإنترنت: 06 مايو 2025
النظم البيئية الساحلية المزروعة (VCEs)، بما في ذلك الأعشاب البحرية، هي خزانات مهمة لغازات الدفيئة.تخزن بقدر ماالكربون العضوي ) في الكتلة الحيوية والتربة الأساسية (المعروفة باسم “الكربون الأزرق”) تلعب هذه النظم البيئية دورًا كبيرًا في دفن الكربون في المحيطات لأنها تمثل ما يقرب من نصف السنويالدفن في الرواسب المحيطية على الرغم من تغطيته فقطمن المحيطوبالتالي، يُعتبر استعادة أو حماية أو تعزيز عناصر القيمة البيئية بالنسبة للوضع الراهن من الحلول المناخية الطبيعية.. ومع ذلك، فإن
تُعرف نظم الأعشاب البحرية بقدرتها على احتجاز وتخزين الكربون العضوي، ولكن هناك تباين كبير في مخزونات الكربون العضوي في التربة المرتبطة بخصائص النباتات والظروف البيئية، مما يجعل تقدير وتوسيع نطاق تخزين الكربون وتدفقاته اللازمة للمساهمة في التخفيف من تغير المناخ أمرًا صعبًا للغاية. هنا، نقدم تقديرات لمخزونات الكربون المرتبطة بأنظمة الأعشاب البحرية (الكتلة الحيوية والتربة) من خلال تحليل قاعدة بيانات عالمية شاملة تشمل أكثر من 2700 عينة تربة من الأعشاب البحرية. الوسيط العالمي للتربةتقدير المخزون هوفي أعلى 30 سم من التربة،أقل من التقديرات من التوليفات العالمية السابقة، مما يحسن من مستوى 1 للتربة في الهيئة الحكومية الدولية المعنية بتغير المناخالمخزون الحالي المستخدم في حساب الكربون في الأماكن التي لا توجد بها بيانات محلية. نحن نقدر أن مخزونات الكربون في الأعشاب البحرية المعرضة لخطر التدهور قد تطلقبتكلفة اجتماعية قدرهامليار (دولار أمريكي 2020)، إذا لم يتم اتخاذ أي إجراء للحفاظ على هذه المواطن. المساهمة المهمة في التخفيف من تغير المناخ في خطر لأن النظم البيئية الساحلية تتناقص على مستوى العالم، وفقدانها قد يؤدي إلى تفاقم تغير المناخ من خلال تقليل قدرة تخزين الكربون، مما يضيق من عازل طبيعي محدود بالفعل ضد ارتفاع انبعاثات الغازات الدفيئة. بالإضافة إلى ذلك، فإن فقدان وتدهور الأعشاب البحرية وغيرها من النظم البيئية الساحلية يعرض للخطرالمخزنة في التربة الأساسية، بعضها قد يتآكل، ويعاد تعليقها وإعادة معدنتها، مما يحولالمخزونات المتراكمة على مدى قرون إلى مصدر جديد لانبعاثات غازات الدفيئة.
على الرغم من أن الحفاظ على VCEs له فوائد عديدة تتجاوز الكربون الأزرقإن القدرة الأساسية لهم على احتجاز الكربون وتخزينه هي التي يتم دمجها في الأطر السياسية الوطنية والدولية وآليات التمويل، بما في ذلك اعتمادات الكربون.. على سبيل المثال، تعتبر حماية واستعادة VCE استراتيجيات معترف بها لتحقيق الأهداف المحددة في اتفاق باريس، والتي تشمل الحد من انبعاثات غازات الدفيئة والحفاظ على زيادة درجات الحرارة العالمية على المدى الطويل إلى ما دون بالنسبة لذلك قبل الثورة الصناعيةتقوم عدة دول بالفعل بإدراج VCEs في التزاماتها (المعروفة بالمساهمات المحددة وطنياً، NDCs) لتحقيق أهداف هذه الاتفاقية.بالإضافة إلى ذلك، توجد منهجيات لتوليد ائتمانات الكربون من استعادة وحماية المناطق البيئية القيمة التي يمكن شراؤها من قبل أولئك الذين يرغبون في تعويض انبعاثات غازات الدفيئة.“، وعدد المشاريع المرتبطة التي تولد “ائتمانات الكربون الزرقاء” لدعم الأنشطة المتعلقة بالحفاظ على البيئة يتسارع بسرعة.. ومع ذلك، فإن الأعشاب البحرية لديها عدم يقين كبير في التربةكثافة ومعدل الاحتجاز وقد تلقت أيضًا اهتمامًا أقل من السياسات والتمويل المرتبط مقارنةً بغيرها من VCEs، مما أدى إلى تقليل الأنشطة المتعلقة بالحفاظ على واستعادة نظم إيكولوجية الأعشاب البحرية. زيادة المعرفة بالتنوع في، والعوامل المؤثرة على، الأعشاب البحريةتعتبر الأسهم ضرورية لتوجيه تطوير ونزاهة وموثوقية سياسة وتمويل تغير المناخ لدعم الحفاظ على الأعشاب البحرية واستعادتها.
لقد تم الاعتراف بأن نظم عشب البحر لها أهمية عالمية منذ فترة طويلةالأسهم التي تحمل مخاطر كبيرة من الانبعاثات بعد تدهورها. ومع ذلك، كانت التقديرات السابقة للمرجان البحريكانت الأسهم عرضة لقدر كبير من عدم اليقين بسبب القيودبيانات المخزون التي لم تلتقط التنوع الكامل لأنواع موائل الأعشاب البحرية عبر توزيعها الجغرافيلقد مرت أكثر من عقد من الزمن منذ التركيب الأساسي لعشب البحربيانات المخزون بواسطة فوركوريان وآخرون، وزيادة الاهتمام بالكربون الأزرق في الأعشاب البحرية قد أثار نشاطًا بحثيًا في جميع القارات. ونتيجة لذلك، لدينا الآن بيانات شاملة لتشكيل فهم أكثر اكتمالاً ودقة للكربون الأزرق في الأعشاب البحرية. على سبيل المثال، أظهرت الأعمال الأخيرة أن الأعشاب البحرية تعتمد عملية الاحتجاز والتخزين على مجموعة متنوعة من العوامل المتعلقة بخصائص النباتات والمناخ والجيومورفولوجيا والهيدرولوجيا.شكل ونبات الأعشاب البحريةخصائص التربةونظام الهيدروديناميكايمكن أن تؤثر جميعها أيضًا على الأعشاب البحريةالأسهم. ومع ذلك، فإن هذه التقدمات الأخيرة في فهمنا لعشب البحرالتخزين غالبًا ما يكون إقليميًا أو محددًا بنوع معينويحتاج الأمر إلى تجميع عالمي لهذه البيانات المتاحة حديثًا لتمكين دراسة شاملة للأعشاب البحريةتقييم المخزون عبر جميع الأنواع والبيئات والمناطق البيئية.
هنا، نقيمبيانات المخزون عبر التوزيع الجغرافي الكامل والتنوع التصنيفي لبيئات الأعشاب البحرية، وذلك من خلال تجميع قاعدة بيانات عالمية للأعشاب البحرية.الأسهم من خلال مراجعة منهجية للبيانات المنشورة، مدعومة ببيانات غير منشورة سابقًا. نقدم تقديرات محدثة للمتوسطات العالمية والإقليمية والخاصة بالنوع.الأسهم (انظر الجدول S1) وتحديد المتغيرات العالمية لـتغير المخزون المتعلق بالبيوجغرافيا، وعلم وظائف الأعضاء للنباتات، والجيومورفولوجيا الساحلية. كما يتم تحديد قاعدة البيانات حسب السجلات لكل دولة لتمكين القراء من تقييم مخزونات الكربون بالإشارة إلى التطبيقات العملية مثل السجلات الوطنية لانبعاثات الغازات الدفيئة المطلوبة بموجب اتفاقية باريس. نحن نجمع بين عشب البحرتقديرات المخزون مع التقييمات الحديثة لمخاطر فقدان الأعشاب البحرية، وعوامل إعادة التمعدن الكربوني، والمساحة العالمية للأعشاب البحرية لاستنتاج تقديرات من الدرجة الأولى للانبعاثات المحتملة الناتجة عن الفشل في حماية النظم البيئية الحالية للأعشاب البحرية.
النتائج والمناقشة
المخزونات العالمية من الكربون في الأعشاب البحرية
قمنا بتجميع بيانات من 2771 عينة تربة (الشكل 1)، منها 1022 عينة تربة كانت بعمق لا يقل عن 30 سم بمتوسطمخزون منهافي أعلى 30 سم من التربة (الجدول 1). هذهتم تحريف بيانات المخزون بشكل مرتفع بسبب تقديرات المخزون الكبيرة جدًا (معظمها من مروج Posidonia oceanica في البحر الأبيض المتوسط)، مما جعل تقديرات الوسيط لـها (نطاق الربيع) أكثر تمثيلاً للاتجاه المركزي. استخدمنا مزيدًا من
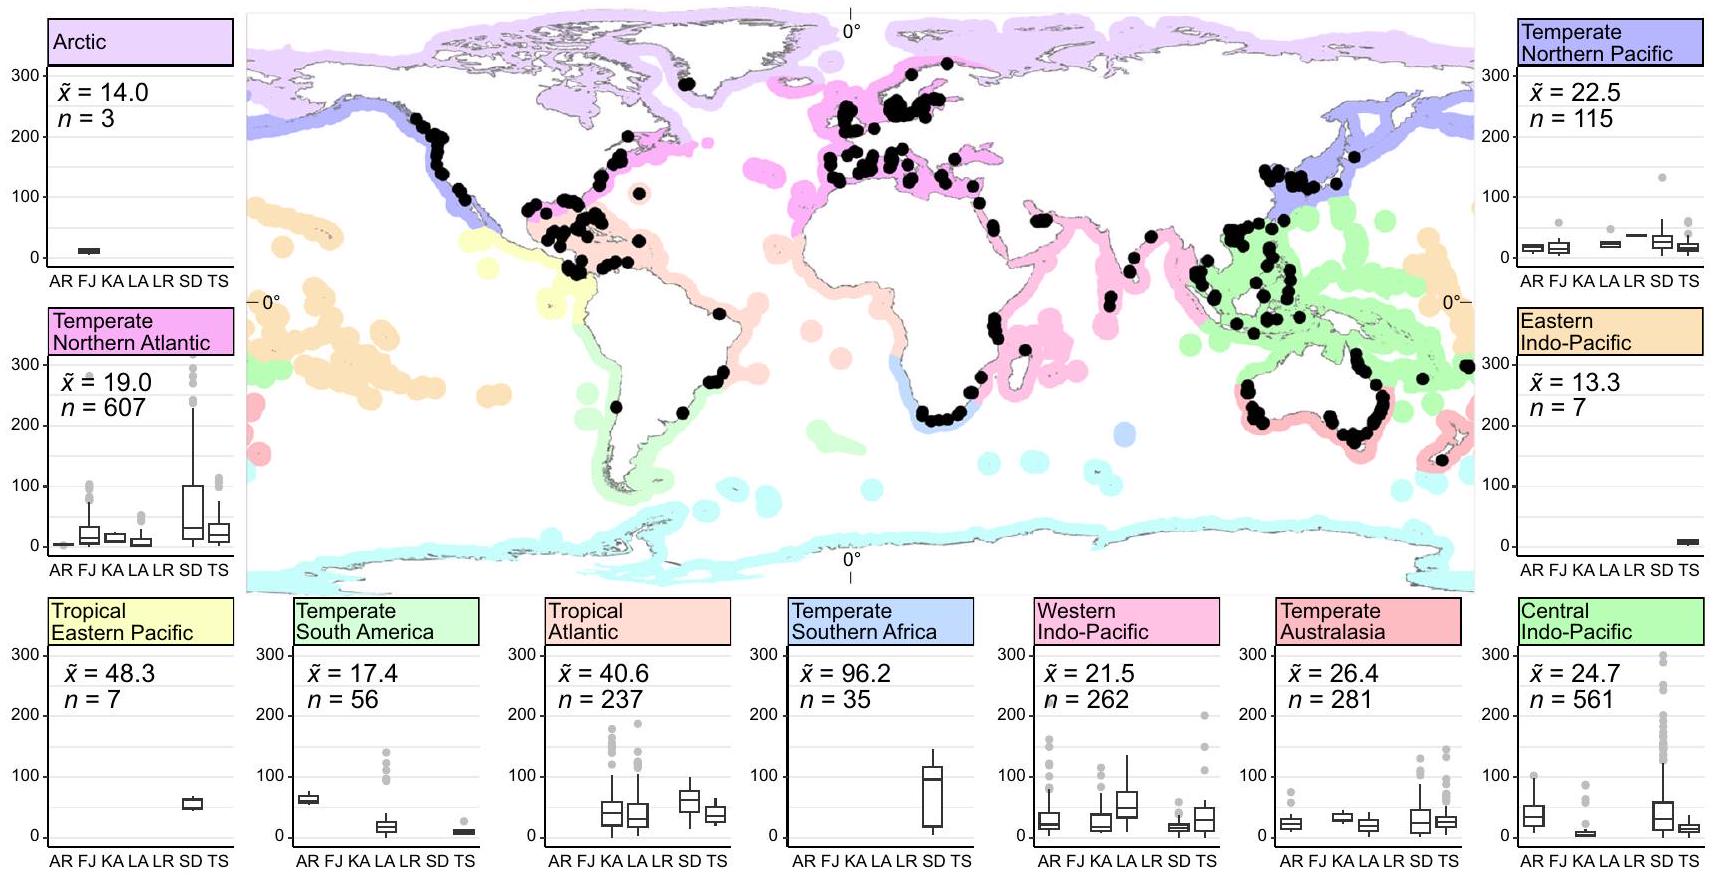
الشكل 1 | الكربون العضوي في تربة الأعشاب البحرية الأسهم (إلى ) حسب النوع الساحلي والإقليم البحري. تُظهر الخريطة مواقع أخذ العينات (دوائر سوداء) مع الأقاليم البحريةتظهر الألواح مخططات الصندوق لنجيل البحر بارتفاع 30 سمالأسهم حسب النوع الساحلي، حيث أريهيكالفيورداتكارسالخلجانأنهار كبيرة دلتا صغيرة، TS=أنظمة المد والجزر. الوسيط الأسهم ( ) وحجم العينة ( ) تظهر في اللوحات لكل منطقة إيكولوجية بحرية، حيث تُظهر الخطوط الوسطى الوسيط، وحدود الصندوق تُظهر الربعين العلوي والسفلي، والشعيرات هي نطاق الربيع الرباعي والنقاط هي نقاط شاذة. خريطة أساسية من ESRI.
الجدول 1 | ملخص قاعدة البيانات ومقارنتها بالتقديرات السابقة
دراسة
المتوسط ± الخطأ القياسي
الوسيط (نطاق الربيع)
خصائص التربة
الكثافة الجافة للكتل )
هذه الدراسة
1.1 (0.8-1.4)
18,436
فوركريان وآخرون
0.9
2484
هذه الدراسة
0.7 (0.3-1.6)
18,658
فوركوريان وآخرون
1.4
٣٥٦١
التربةسهمها )
30 سم؛ بما في ذلك المتوقع
هذه الدراسة
٢٤.٢ (١٢.٤-٤٤.٩)
٢١٧١
30 سم؛ مقاس فقط
هذه الدراسة
27.54 (15.8-47.2)
١٠٢٢
كينيدي وآخرون
٢٣.١
576
فوركريان وآخرون
٣٣.٢ (٢٣.١-٤٥.٦)
183
1 م ؛ بما في ذلك المتوقع
هذه الدراسة
77.6 (41.9-139.7)
1625
فوركوريان وآخرون
165.6
١٣٩.٧
٢١٩
الهيئة الحكومية الدولية المعنية بتغير المناخ
١٠٨ (٨٤-١٣٩)
89
1 م؛ مقاس فقط
هذه الدراسة
145 (62.2-263.7)
227
فوركريان وآخرون
173.3
41
تم تلخيص خصائص التربة لجميع البيانات المتاحة في قاعدة البيانات، حيث تحتوي معظم عينات التربة على نقاط بيانات متعددة تمثل زيادات فردية في العينة.تم حساب المخزونات لكل عينة تربة. الهيئة الحكومية الدولية المعنية بتغير المناخأبلغ عن المتوسط الهندسي معفترة الثقة، بناءً على كل من القياسات والتقديراتالأسهم.
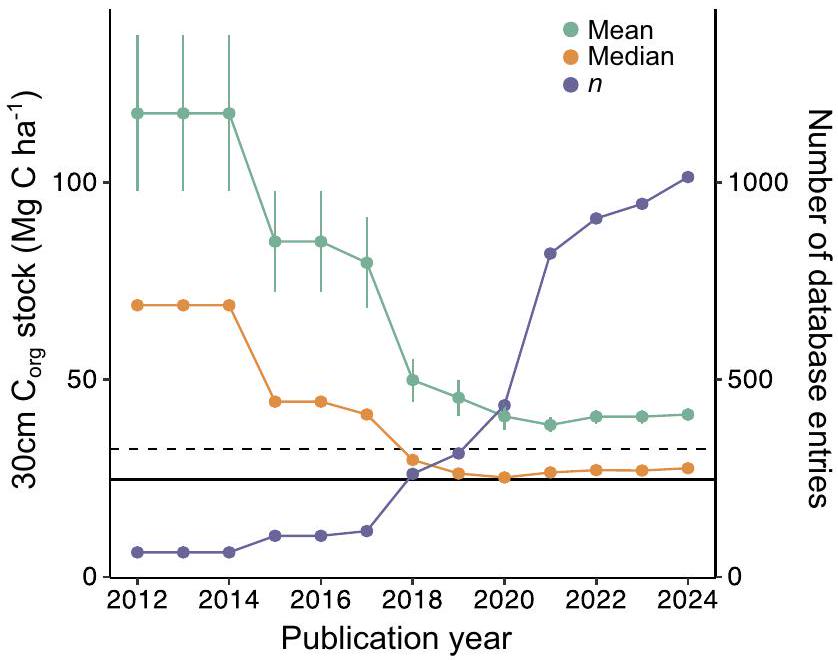
الشكل 2 | الكربون العضوي في تربة الأعشاب البحريةملخص إحصائيات قاعدة بيانات المخزون حسب سنة نشر البيانات. تربة الأعشاب البحريةمتوسط المخزون (الأخضر)، الوسيط (البرتقالي)، وعدد النوى (الأرجواني) محسوبة بشكل تراكمي لكل سنة نشر بدءًا من 2012. تشمل مخزونات الكربون العضوي القيم المقاسة فقط (الحد الأدنى لطول النواة 30 سم). يتم عرض الخطأ القياسي للمتوسط. تشير الخطوط الأفقية إلى تقدير IPCC من المستوى 1 (متقطع؛ IPCC ) ووسيط قاعدة البيانات الجديدة لدينا (الخط الصلب، يشمل الأسهم المتوقعة).
1,149 عينة تربة بطول يتراوح بين 5 إلى 29 سم لنمذجة تربة بعمق 30 سمالمخزونات ونقدم أفضل تقدير لدينا للمتوسط العالمي لنجيل البحرالمخزونات في أعلى 30 سم من التربة لتكون“، استنادًا إلى 2171 نواة. لم تصل 600 عينة إضافية من سطح التربة إلى عمق 5 سم ولم تكن جزءًا منتقديرات المخزون.
هذا التنبؤ بمتوسط 30 سم من التربةالسهم هوأعلى من التقديرات الأخيرة التي قدمها كينيدي وآخرون.استنادًا إلى 576 نواة، ولكنأقل من التقدير العالمي الأول الذي قدمه فوركوريان وآخرون.بينما التنبؤ الوسيط لعمق 1 متر من التربةالسهم هوأقل من تقدير المستوى الأول للهيئة الحكومية الدولية المعنية بتغير المناخ (IPCC) و أقل من فوركيان وآخرون (الجدول 1). مقارنةً بهذه الدراسات السابقة، فإن قاعدة بياناتنا توسع بشكل كبير التوزيع الجغرافي والضريبي للأعشاب البحرية.تقديرات وتشمل بيانات من مروج الأعشاب البحرية في البيئات المعدنية مع تربة ذات كثافة جافة أعلى وكثافة تربة أقلالمحتوى، الذي كان تمثيله ناقصًا في التوليفات السابقة (الجدول 1). في الواقع، كل عام منذ نشر Fourqurean وآخرون.إضافة جديدة عشب البحرأدت قياسات المخزون إلى تقليل التقديرات العالمية للمتوسط والوسيط (الشكل 2)، مما يشير إلى أن البيانات المتاحة في وقت مبكر كانت متحيزة نحو موائل الأعشاب البحرية ذات التربة العالية.الأسهم. ومن الجدير بالذكر أنه منذ عام 2019، استقرت التقديرات المتوسطة والوسيطية، مما يشير إلى أن العدد الحالي من القياسات المتاحة كافٍ لاشتقاق تقدير أكثر قوة وموثوقية لتربة الأعشاب البحرية.تقدير المخزون لإبلاغ الدراسات المستقبلية للكربون الأزرق المعتمدة على متوسط عالمي.
تقدم تركيبتنا أيضًا بيانات عن الكتلة الحيوية فوق الأرض لنباتات الأعشاب البحرية ( )، الكتلة الحيوية تحت الأرض ( ) ، والكتلة الحيوية الإجمالية ( )، بمتوسط (وسيط) قدره للكتلة الحيوية فوق الأرض،للكتلة الحيوية تحت الأرض، ولإجمالي الكتلة الحيوية (الجدول التكميلي S1). على الرغم من أن هذه التقديرات تستند إلى حجم عينة يزيد عن الضعف، إلا أنها مشابهة جدًا للقيم المنشورة سابقًا (الجدول التكميلي S2).باستثناء الكتلة الحيوية تحت الأرض، التي نقدرهاأعلى من دوارتي وتشيسكانومجموعة أحدث وأكبر بكثير من بيانات كتلة العشب البحري بواسطة ستريدوم وآخرون.كما يشير إلى أن الكتلة الحيوية تحت الأرض أعلى من الكتلة الحيوية فوق الأرض في الأعشاب البحرية، على الرغم من أن الكتلة الحيوية الإجمالية أقل. الأسهم (الجدول التكميلي S2). ومع ذلك، لم يقم ستريدوم وآخرون.ولا دوراتي ولا تشيسكانوالكتلة الحيوية المبلغ عنهاالمحتوى، وقد حسبنا المخزونات تحت الافتراض المبسط أنالكتلة الحيوية هي.
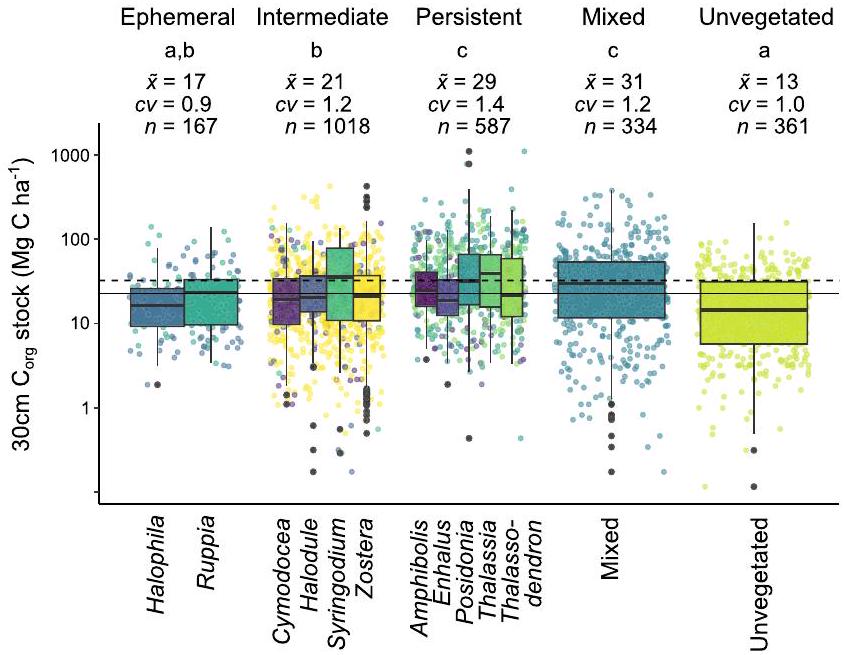
هناك اختلافات ملحوظة في تربة الأعشاب البحريةالمخزونات اعتمادًا على الهوية التصنيفية والمجموعة الوظيفية. أعلى تربةكانت المخزونات مرتبطة بأجناس الأعشاب البحرية مثل بوسيدونيا، وثالاسيا، وسيرينغوديوم، بالإضافة إلى المروج المختلطة الأنواع، على الرغم من أن هذه المجموعات كانت أيضًا تتمتع بأكبر تباين في التربة.الأسهم (الشكل 3؛ الجدول التكميلي S1). من المثير للاهتمام أن هذه الأنواع أظهرت أيضًا أعلى كتلة حيوية تحت الأرض، بينما كان جنس الأعشاب البحرية الذي يمتلك أدنى تربةكانت الأنواع (Halophila) تمتلك أدنى متوسط للكتلة الحيوية تحت الأرض، مما يشير إلى وجود علاقة محددة بين الأجناس والتربة.المخزونات وكتلة الأعشاب البحرية (الشكل التكميلي S1).
العوامل العالمية المرتبطة بمخزونات الكربون في الأعشاب البحرية
تُرتبط أنواع الأعشاب البحرية الكبيرة والمستمرة بتربة أكبرالأسهم أكثر من الأنواع العابرة (الشكل 3). من المحتمل أن تكون هذه النتيجة مرتبطة بزيادة إنتاج الكتلة الحيوية، وخاصة الجذور تحت الأرض والريزومات التي تساهم مباشرة في إضافة المادة العضوية المحلية إلى حوض الكربون في التربة.بالإضافة إلى الكتلة الحيوية فوق الأرض التي قد تسهل احتجاز الجسيمات بمعدلات أعلى، بما في ذلك المواد العضوية الغريبة.تستمر هذه الأنواع الكبيرة من الأعشاب البحرية عادةً في نفس الموقع على مدى عدة سنوات، مما يشير إلى غياب أو مقاومة للاضطراب. قد يكون هذا البيئة الرسوبية المستقرة
الشكل 3 | مخططات الصندوق توضح التربةالأسهم حسب جنس الأعشاب البحرية (الألوان)، متداخلة ضمن المجموعة الوظيفية. عناصر الرسم البياني الصندوقي محددة كما في الشكل 1. لاحظ اللوغاريتمي-المحور. كما تظهر الحروف التي تشير إلى الاختلافاتبين المجموعات الوظيفية (اختبار كروسكال-واليس، اختبار دان بعد التحليل)المخزونات الكربونية المتوسطةمعاملات التباين ( ) وحجم العينة ( ) لمجموعات الوظائف. الخطوط الأفقية تشير إلى تقدير المستوى الأول من IPCC (المتقطع) ومتوسط قاعدة بياناتنا الجديد (المتصل). لاحظ أن عائلة الزوستراسي تم مراجعتها مؤخرًا لتشمل عدة أجناس، وهو ما لا ينعكس في هذه الدراسة.تم استبعاد مجموعتين من الأسهم ذات الكربون المنخفض جداً من مجموعة “غير المزروعة” لأغراض العرض.
تساهم في أن تكون تربتها الأساسية أعلىالمخزونات، حيث قد تكون معدلات إعادة تعليق الرواسب وإعادة التمعدن أقل.
على النقيض، قد تحبس أنواع الأعشاب البحرية الصغيرة والقصيرة الأجل عددًا أقل من جزيئات المادة العضوية الغريبة، وتساهم بمقدار أقل من المادة العضوية المحلية الناتجة عن الكتلة الحيوية، وقد تكون أكثر عرضة للفقد.المخزونات لإعادة التمعدن عندما يكون الغطاء النباتي منخفضًا أو غائبًافي الواقع، تعتبر العديد من أنواع الأعشاب البحرية الصغيرة والزائلة مستعمرات مبكرة، وبالتالي ترتبط بموائل غير مستقرة أو مضطربة حديثًا.، والتي قد تحتوي على تربة منخفضةالمخزونات عند الاستعمار. ومع ذلك، تظهر بياناتنا أن كلا من الأنواع العابرة من هالوفيلا وروبيا يمكن، في بعض الحالات، أن تكون مرتبطة بمخزونات الكربون التي تزيد عن 100 ميغاغرام كربون لكل هكتار.في أعلى 30 سم. قد يعكس هذا قدرتهم على الاستقرار في التربة التي كانت مشغولة سابقًا بأنواع دائمة.إمكانيتها لمعدلات عالية من الإنتاج المحليأو استقرارهم في بيئات ترسيب ذات مصادر كربونية خارجية مثل المانغروفتتطلب الدراسات الإضافية لفهم مساهمة الأعشاب البحرية الصغيرة والقصيرة العمر في التربة.الأسهم.
تظهر هذه النتائج أن تقديرات مخزون الكربون في الأعشاب البحرية تحتاج إلى أخذ أنواع الأعشاب البحرية أو هوية المجموعة الوظيفية في الاعتبار لتحسين التقديرات الحالية. توسيع نطاق التربةالتقديرات المخزنية المستمدة من الأنواع المستمرة إلى المروج المكونة من الأعشاب البحرية المؤقتة من المحتمل أن تؤدي إلى تقديرات مفرطة لمخزونات الكربون الأزرق، والعكس صحيح. وهذا يبرز الحاجة إلى تمييز أنواع مروج الأعشاب البحرية (المجموعات الوظيفية أو تركيب الأنواع) في كل من رسم خرائط امتداد الأعشاب البحرية وجمع البيانات الميدانية.بيانات الأسهم. الأعشاب البحريةتقديرات المخزون التي تعتمد فقط على خرائط الوجود والغياب وتستخدممن المحتمل أن تؤدي بيانات المخزون المستمدة حصريًا من المروج الكثيفة والمستمرة إلى تقدير مبالغ فيه للمخزونات الحقيقية. ومع ذلك، فإن التباين الكبير فيتؤكد المخزونات حتى داخل الأجناس على الحاجة إلى النظر في خصائص الموقع الإضافية لمشاريع الكربون الأزرق (الشكل 4). على سبيل المثال، حيث تنمو الأعشاب البحرية المؤقتة على تربة ذات مستوى عالٍ منالأسهم التي قد تكون قد تم إيداعها سابقًا بواسطة أنواع أخرى (مثل الأعشاب البحرية المستدامة أو أشجار المانغروف)، قد تمنع حمايتها انبعاثات الإرث.الأسهم حتى لو كانت حديثةالدفن منخفض.
تربة الأعشاب البحريةتختلف المخزونات أيضًا جغرافيًا، حيث توجد مخزونات أعلى في المناطق البحرية الاستوائية الأطلسية، والمحيط الهادئ الشرقي الاستوائي، وجنوب أفريقيا المعتدلة، على الرغم من أن المنطقتين الأخيرتين لا تزالان تحت العينة نسبيًا (الشكل 1؛ الجدول التكميلي S1). كانت جهود العينة المطلقة الأعلى في أستراليا، والولايات المتحدة، والدنمارك، والمملكة المتحدة، وسنغافورة (الشكل التكميلي S2)، ولكن عند تطبيعها حسب مساحة الأعشاب البحرية داخل المياه الإقليمية، كانت الأردن، ومالطا، وسنغافورة، وجزر العذراء الأمريكية، وماليزيا، وكينيا، وكولومبيا لديها أعلى كثافة بيانات (الشكل التكميلي S3). كما اختبرنا الفروق بين الأنماط الساحلية.لأن الإعداد الجيومورفولوجي قد تم تحديده كمؤشر جيد لـالأسهم في VCEsوجدنا تربة أعلىالمخزونات في دلتا صغيرة، وكارست، وإعدادات أرهيك (الجدول التكميلي S1؛ الشكل التكميلي S4)، لا سيما في دلتا صغيرة من شمال الأطلسي المعتدل ووسط المحيط الهادئ الهندي (الشكل 1). قد توفر هذه الأنماط الساحلية ظروفًا مثالية لعشب البحر.التخزين، لأن الدلتا الصغيرة يمكن أن تكون بيئات ترسيب محمية مع إمكانية إمداد إضافي من المواد الغريبة.من المصادر الأرضية والمواد غير العضوية التي تدفن بسرعة وتحافظ على الرواسب (الشكل 4). الأعلى تحتوي الأسهم المرتبطة بهذه البيئات على مروج بوسيدونيا في البحر الأبيض المتوسط، بالإضافة إلى مروج إنهالوس وثالاسيا في وسط المحيط الهندي الهادئ، وجميعها أنواع دائمة ذات كتلة حيوية عالية.
بشكل عام، التباين العالمي في تربة الأعشاب البحريةتم تفسير الأسهم جزئيًا فقط من خلال المتنبئات الجغرافية والضرائبية الواسعة في قاعدة بياناتنا (الغابة العشوائية: جذر متوسط مربع الخطأ؛ الشكل التوضيحي الإضافي S5)، مما يشير إلى أن عوامل أخرى على المستوى الإقليمي والمحلي قد تمارس السيطرة على تربة الأعشاب البحريةالمخزونات (مثل الهيدرولوجيا، علم الرواسب، تاريخ الاضطرابات، إلخ). أفضل نماذج تربة الأعشاب البحريةلذا ستكون الأسهم محلية أو إقليمية، مع الأخذ في الاعتبار المؤشرات الخاصة بهذه المقاييس.أو تضمين متغيرات تنبؤية أكثر تفصيلاًبالإضافة إلى ذلك، كانت المؤشرات البيوجغرافية (تصنيف السواحل، المنطقة البحرية) وكذلك المؤشرات التصنيفية (أنواع الأعشاب البحرية، الجنس، والمجموعة الوظيفية) ذات دلالة، مما يبرز أنه على مستوى العالم، تتفاعل كل من خصائص النباتات والإعداد البيئي لتحديد مخزونات الكربون الأزرق للأعشاب البحرية. (الشكل 4). لكن حتى أفضل نماذجنا لا تزال تترك نسبة كبيرة من التباين في الأسهم غير المفسرة؛ كان معرف الدراسة (“معرف المقال”) هو أهم متنبئ لـالأسهم (الشكل التوضيحي الإضافي S5)، مما يشير إلى أن تصميم الدراسة أو الخصائص الفريدة الأخرى للموقع (انظر الشكل 4) قد تفسر جزءًا كبيرًا من التباين. هناك حاجة إلى مزيد من العمل لتحديد العوامل المسؤولة عن تحديد تربة الأعشاب البحرية بشكل أفضل.الأسهم على الصعيدين العالمي والمحلي.
الانبعاثات الكربونية المحتملة من فقدان الأعشاب البحرية
قمنا بإنتاج تقدير من الدرجة الأولى للإمكاناتالانبعاثات الناتجة عن الفشل في حماية مخزونات الكربون في الأعشاب البحرية المعرضة للخطر على مستوى العالم. للقيام بذلك، قمنا بدمج بيانات التربة للأعشاب البحرية بشكل مكاني محددالمخزونات حتى عمق 30 سم مع خريطة عالمية حديثة النشر لمخاطر الانخفاض السريع في الأعشاب البحريةإذا لم تُتخذ أي إجراءات للحفاظ على البيئة لوقف هذا الانخفاض السريع، فإننا نقدر أنهاقد يتم فقدانه بحلول عام 2050، على افتراضالتربةيتم إعادة المعادن إلى المخزونات بعد تحويل موطن الأعشاب البحرية إلى حالة غير مزروعة. إضافة فقدان الكتلة الحيوية للأعشاب البحرية (ها، الجدول التكميلي S1) ويفترض أن تقديرات المخاطر واحتياطيات الكربون المتاحة تمثل إجمالي مساحة الأعشاب البحرية العالميةمقتبس من مكينزي وآخرون.و UNEP-WCMCفقدانيمكن أن تؤدي المخزونات المعرضة لتحويل الأعشاب البحرية إلى حالة غير مزروعة إلى انبعاثات قدرها 1154 (665-1699) Tg.بحلول عام 2050 (الجدول 2). مع تكلفة اجتماعية للكربون قدرها (دولار أمريكي 2020) لكل ميغاغرام من الانبعاثات من خلال تأثيرات تغير المناخقد يؤدي الفشل في حماية موائل الأعشاب البحرية إلى تكلفة اجتماعية قدرها (123-314) مليار ($2020 أمريكي) حتى عام 2050، استنادًا إلى فقدان تخزين وحده. من المحتمل أن تكون هذه التقديرات متحفظة لأنها تشمل فقط فقدان الأعشاب البحرية الموجودة.المخزونات إلى عمق 30 سم ولا تأخذ في الاعتبار أي احتجاز مفقود، والذي يرتبط بقدر أكبر من عدم اليقين بسبب ارتفاع
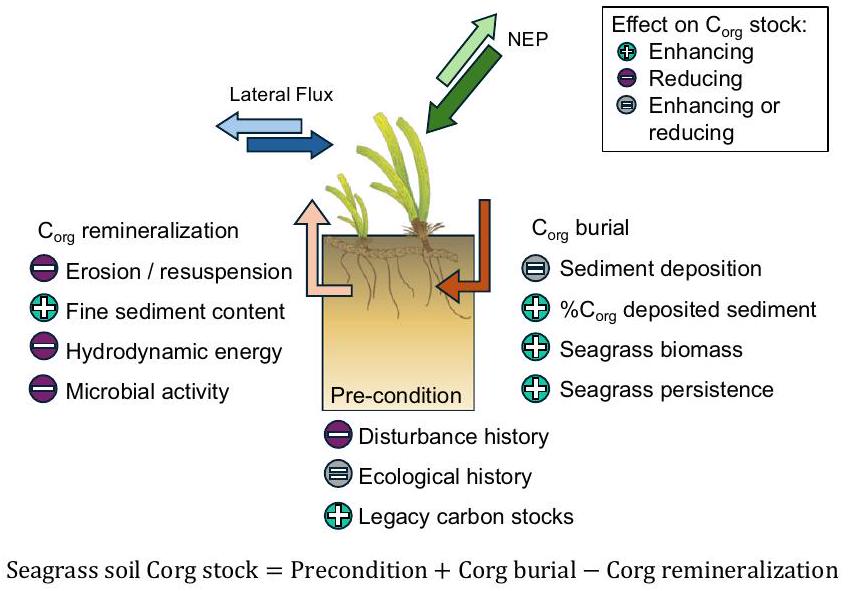
الشكل 4 | مخطط تصوري للعوامل التي تؤثر على التربةالأسهم في أنظمة الأعشاب البحرية. تنتج الأعشاب البحرية (إنتاجية النظام البيئي الصافي، NEP) وقد تتبادل مع الأنظمة المجاورة (التدفق الجانبي). التربةتعتبر الأسهم وظيفة من مخزونات الكربون القديمة، والتاريخ البيئي والتاريخ الاضطرابي (الشرط المسبق)، وتزداد بـدفن (تأثر بترسب الرواسب،محتوى الرواسب المودعة، وكتلة الأعشاب البحرية، والاستمرارية)، وتم تقليله بواسطةإعادة التمعدن (تتأثر بالتآكل، محتوى الرواسب الدقيقة، الطاقة الهيدروديناميكية، والنشاط الميكروبي). العوامل ذات الرموز الخضراء (+) تزيد عمومًا من التربةتقلل الأسهم، بينما الرموز البنفسجية (-) عادةً من جودة التربةالأسهم، والعوامل ذات الرموز الرمادية (=) ليس لها اتجاه قابل للتعميم. رمز الأعشاب البحرية تم تعديله من كاثرين كولير، جامعة جيمس كوك (ترخيص: creativecommons.org/licenses/by-sa/4.0/).
تغير فيمعدلات الدفن وتعقيد تحديدها بدقةعلى الرغم من هذا النهج المحافظ، نستنتج معدل سنوي قدره، على افتراض أن الانبعاثات تحدث بمعدل ثابت حتى عام 2050. كانت التقديرات السابقة تشمل فقدان العمق (1 م)الأسهم واعتُبرتحويلأسهم إلىولكن بدون تحديد مكاني واضحبيانات مخاطر المخزون والانخفاض، معدلات الخسارة السنوية المستمدة منبتكلفةمليار دولار أمريكي.
عمق المرجع لحساب مخزون الكربون
في هذا العمل، نبلغ عن التربة المرتبطة بالأعشاب البحريةالمخزونات إلى عمق 30 سم، على الرغم من أن التقييمات السابقة استخدمت أفق عمق 1 ماستخدام عمق مرجعي يبلغ 30 سم لتربة الأعشاب البحريةمحاسبة المخزون أكثر تحفظًا وتعكس أن معظم البيانات المتاحة تأتي من أنوية التربة التي يقل طولها عن 1 متر (فقط 227 من أصل 2171 نواة في قاعدة بياناتنا تصل إلى عمق 1 متر، الجدول 1)، ومن المحتمل أن يكون السبب في ذلك هو أن الحصول على أنوية تربة تحت المد أكثر طولًا هو أمر معقد لوجستيًا، أو مستحيل حيث تنمو الأعشاب البحرية على تربة يقل عمقها عن 1 متر، كما يمكن أن يكون الحال في البيئات القريبة من الشاطئ والمرجان الخلفي. نؤكد على أنه بالنسبة لمحاسبة مخزون الكربون، من المهم قياس عمق التربة ونحذر من الافتراض بأن عمق التربة 1 متر موجود في جميع المروج. وبالتالي، فإن الممارسة الشائعة للاستخراج الخطي للقياسات من الأنوية الأقصر إلى عمق 1 متر قد تكون غير مناسبة، خاصةً أن تحليل الأنوية بطول 1 متر في قاعدة بياناتنا يشير إلى أن هذه الممارسة تفرط في التقدير. الأسهم، خاصة في المرتفعات – التربة (طرق إضافية).
من الواضح أن تقدير الأعشاب البحريةتؤدي الأسهم إلى عمق مرجعي أكبر إلى أسهم أكبر، ولكن لغرض حساب الكربون، من المناسب استخدام العمق المرجعي الذي يتعرض لخطر الفقد. لا توجد حاليًا بيانات كافية لتحديد العمق الذي تصل إليه الأعشاب البحرية.تتأثر الأسهم عندما تتدهور أو تفقد مروج الأعشاب البحرية، ومن المحتمل أن تختلف هذه العمق مع الظروف البيئية ونوع الاضطراب. تتعرض أنظمة الأعشاب البحرية عالميًا بشكل رئيسي للتهديد من التنمية الساحلية، وصيد القاع، والتثبيت، وتدهور جودة المياه.يمثل الصيد القاعي أحد أكبر المخاطروكلاهما نمذجةودراسات ميدانيةتشير إلى تأثيره علىيمتد المخزون إلى عمق التربة. وبالمثل، القليل معروف عن توازن في التربة المرتبطة بالأعشاب البحرية التي تكون قابلة للتغير وعرضة لإعادة التمعدن، على عكس المواد المقاومةالذي لن يتم إعادة معدنة عند تآكل التربة وإعادة تعليقها بعد فقدان الأعشاب البحرية. عادةً، تحتوي الطبقة السطحية من التربة البحرية على المزيد من المواد القابلة للتغير.من الطبقات الأعمق، بحيث تكون معدل إعادة التمعدن لـقد يقل عند الاضطراب مع العمق. لذلك اخترنا أن نحد من افتراضاتنا عنالخسائر للأكثر ضعفًا والأعلى-أعلى 30 سم من تربة الأعشاب البحرية.
أخيرًا، من المهم أن نلاحظ أن مروج الأعشاب البحرية وغيرها من البيئات الساحلية القابلة للتكيف يمكن أن تدور غازات الدفيئة ليس فقط من خلال إنتاج المادة العضوية ودفنها، ولكن أيضًا من خلال إنتاج الكربونات وحلها، بالإضافة إلى تدفقات القلوية الكلية، والميثان، وأكسيد النيتروز. بينما قد تفوق فوائد الكربون الأزرق هذه العمليات في مروج الأعشاب البحرية الفردية.تشير الأبحاث إلى أنه على مستوى العالم، فإن إنتاج القلوية وذوبان الكربونات يزيدان من قدرة إزالة ثاني أكسيد الكربون.بينما إنتاج الميثان وأكسيد النيتروز منخفض وليس كافياً لتعويض وضعها كخزانات لغازات الدفيئة.
آوتلوك
منذ التربة البحرية الأولية العالميةتم نشر ملخص الأسهموتم دمجها في تقديرات المستوى الأول للهيئة الحكومية الدولية المعنية بتغير المناخ لتخزين الكربون والانبعاثات المحتملةلقد بذلت المجتمع العلمي العالمي جهودًا كبيرة لتوليد بيانات للمناطق التي لم تُدرس بشكل كافٍ، وأنواع الأعشاب البحرية، والبيئات. إن فهمنا الجديد للكتلة الحيوية العالمية والتربةتشير الأسهم إلى أن الاتجاه المركزي للتربة البحرية العالميةالمخزونات أقل مما كان يُعتقد سابقًا. تشير تحليلاتنا إلى أن هذا التقدير الجديد قوي عند إضافة بيانات جديدة ويمثل بشكل أكثر دقة وموثوقية تربة الأعشاب البحرية العالمية.الأسهم. تقديرنا يحدد تربة المستوى الأولالمخزون للأماكن التي لا تحتوي على بيانات محلية، ونماذجنا لعوامل ارتباط التربةتسمح الأسهم بحساب تقديرات المستوى الثاني من خلال النظر في خصائص الأنواع، والمنطقة البيولوجية، والإعداد الجيومورفي. كما نبرز أن هناك ما زال هناك فجوات معرفية حاسمة فيما يتعلق بمحركات تربة الأعشاب البحرية.الأسهم، مدىإعادة التمعدن بعد فقدان الأعشاب البحرية، مصير المواد المعاد تمعدنهاالمخزونات، ومدى الأعشاب البحرية العالمية.
على الرغم من هذه المجهولات، فإن فائدة الحفاظ على الموجودإن وفرة المخزونات في موائل الأعشاب البحرية واضحة تمامًا. حتى مع اتباع نهج أكثر تحفظًا من الدراسات السابقةعشب البحر الأسهم المعرضة لخسارة لا تزال كبيرة على نطاق عالمي، مع انبعاثات محتملة من بحلول عام 2050. حماية VCEs الحالية واحتياطيات الكربون المرتبطة بها، بما في ذلك تجنب فقدان المواطن وإعادة إغلاق التربة القديمة.تعتبر الأسهم مع الأعشاب البحرية من بين أكثر الاستراتيجيات فعالية من حيث التكلفة للتخفيف من آثار تغير المناخ من خلال الحلول المناخية الطبيعية.بالإضافة إلى حماية أنظمة الأعشاب البحرية كمصادر لغازات الدفيئة، فإن الحفاظ على هذه المواطن يوفر فوائد كبيرة، بدءًا من دعم التنوع البيولوجي وسبل العيش، إلى تغذية الأنواع المهددة بالانقراض، وحماية السواحل، وتحسين جودة المياه.زيادة موثوقية لديناتقديرات المخزون وفهم أفضل لعوامل التباين توفر لقطاعات سياسة المناخ والتمويل وصولاً متزايداً إلى موارد عالية النزاهة يمكن أن تعزز جهود الحفظ والاستعادة.
طرق
بحث الأدب
تم إجراء بحث في 24 أكتوبر 2021 في قواعد البيانات الببليوغرافية Web of Science (WoS) و Scopus. تم إنشاء سلسلة البحث المستخدمة في المراجعة المنهجية باستخدام قائمة من الكلمات الرئيسية الناتجة عن أهداف المشروع. تم تنظيم الكلمات الرئيسية تحت عناوين السكان، والمقارنة، والنتيجة، وهو نهج شائع للمراجعات المنهجية. تم تشكيل الكلمات الرئيسية في سلاسل بحث باستخدام العوامل البوليانية OR بين المصطلحات المتشابهة، والعامل البولياني AND بين كل عنوان رئيسي (أي، السكان،
الجدول 2 | الانبعاثات الكربونية العالمية المحتملة من الأعشاب البحرية المعرضة لفقدانها والتكاليف الاجتماعية المرتبطة بها
التربةأسهمفي خطرها )
كتلة العشب البحري (مغ)ها )
مدى الأعشاب البحرية العالمية (هكتار)
الانبعاثات العالمية المحتملة )
التكلفة الاجتماعية (مليار دولار أمريكي 2020)
أخفض
٤.٨٩
2.00
٢٦,٦٥٦,٢٠٠
665
123
مركزي
5.25
2.01
٤٣,٣٢٨,١٠٠
١١٥٤
213
علوي
5.61
2.02
“60,000,000” in Arabic is “٦٠٠٠٠٠٠٠”.
١٦٩٩
314
التقدير المركزي يعتمد على متوسط مخزونات الكربون في التربة والكتلة الحيوية المعرضة للخطر (التقديرات العليا والدنيا هي المتوسط ± الخطأ المعياري). بالنسبة لمدى الأعشاب البحرية العالمية، فإن التقدير الأعلى هو من برنامج الأمم المتحدة للبيئة – مركز التنسيق العالمي.التقدير الأدنى هو من مكينزي وآخرون. (تقدير ثقتهم الأدنى)، والتقدير المركزي هو متوسطهم. يتم التعبير عن الانبعاثات المحتملة بوحدات Tg (كتلة الكربون مضروبة في 3.67). التكلفة الاجتماعية لطن واحد من هو . المقارن، والنتيجة). تم تجربة هذه المصطلحات وسلاسل البحث في WoS و Scopus وتم اختيارها بناءً على عملية تكرارية لفحص نتائج البحث. بعد تجربة سلاسل البحث، تم مقارنة نتائج البحث مع مكتبة اختبار لتقييم شمولية البحث. احتوت مكتبة الاختبار على 20 دراسة ذات صلة تم اختيارها من قبل فريق المراجعة لقياس دقة نتائج البحث. من بين 20 دراسة من مكتبة الاختبار، تم العثور على 18 دراسة في كل من Scopus و WoS. لذلك، استنتجنا أن سلسلة البحث الخاصة بنا كانت حساسة وقابلة للإدارة في إرجاع عدد مناسب من النتائج.
سلسلة البحث النهائية، المحددة حسب السكان، المقارنات، والنتائج كانت: الأعشاب البحرية أو مرج الأعشاب البحرية أو Cymodocea أو الأعشاب البحرية أو Halodule أو Halophila أو Hydrocharitaceae أو Posidonia أو الأعشاب البحرية أو النباتات المائية الغاطسة أو Thalassia أو النظم البيئية الساحلية المزروعة أو Zosteraceae AND مصيدة أو الكتلة الحيوية أو الكثافة أو التربة العضوية أو التربة أو المخزون أو المخزونات أو التخزين أو التراكم أو التوازن أو الميزانية أو صافي توازن الكربون في النظام البيئي أو صافي تبادل النظام البيئي أو صافي إنتاج النظام البيئي أو الإنتاجية الأولية الصافية أو الرواسب أو الرواسب أو التراكم أو دفن الرواسب أو الاحتجاز أو دفن التربة أو الطحالب أو القلوية أو التبادل الجوي أوأو التكلس أو الطحالب المتكلسة أو كربونات الكالسيوم أو دورة الكربونات أو DIC أو الذوبان أو الكربون غير العضوي المذاب أو الكربون العضوي المذاب أو DOC أو الانبعاث أو الانبعاثات أو الطحالب السطحية أو التبادل أو التدفق أو التبادل الجانبي أو الكربون العضوي الجسيمي أو POC أو التنفس أو المصدر أو التبادل العمودي AND الكربون الأزرق أو غازات الدفيئة أو GHG أو الكربون أو CH4 أو CO2 أو الميثان أوأو أكسيد النيتروز.
تم تشغيل سلسلة البحث النهائية آخر مرة في 1 ديسمبر 2024، وأسفرت عن 2071 مقالة من Scopus و3764 مقالة من قاعدة بيانات WoS. كما شملت المراجعة قاعدة البيانات الكاملة التي طورها فوركوريان وآخرون.لضمان تضمين الدراسات السابقة عن مخزونات الكربون، بالإضافة إلى قواعد البيانات الأخرى التي يحتفظ بها مجموعة المؤلفين. تم استخدام المكتبة الناتجة من المقالات لاستخراج البيانات حول موقع الدراسة والبيانات البيئية وخصائص التربة لفترات نواة التربة، وعلم الأحياء للسيجاراس، ومخزونات الكربون في الكتلة الحيوية والتربة (انظر قاعدة البيانات للحصول على قائمة كاملة بجميع المتغيرات الملتقطة). تحتوي النسخة النهائية من قاعدة البيانات على معلومات من 415 مقالة منشورة و24 مجموعة بيانات غير منشورة، بإجمالي 19,650 فترة نواة و3245 تقدير لمخزون الكربون (الكتلة الحيوية والتربة).
حساب مخزونات الكربون
قمنا بحساب مخزونات الكربون من بيانات ملف نواة التربة (على الأقلالكثافة الجافة للكتلة، عمق الفاصل، والسماكة)، حيثما كان ذلك متاحًا، واستخدمت القيم المنشورة في غياب بيانات العمق. تم حساب مخزونات الكربون إلى “أعماق قياسية” من، و100 سم، ولكن فقط حتى أقصى عمق أخذ العينات دون التقدير. إذا لم تكن هناك بيانات تحت السطح متاحة وكان المخزون الكربوني المبلغ عنه يشير إلى عمق أخذ عينات غير ، أو 100 سم، قمنا بتعديل القيمة المبلغ عنها بشكل خطي إلى أعماق مرجعية لا تتجاوز عمق العينة. إذا تم حسابها من بيانات الأعماق، تم حساب كثافة الكربون لكل فترة نواة متاحة، وجميع الفترات تم جمعها إلى أعماق المرجع. إذا لم تمثل فترات العينات العمق الكامل للنواة (على سبيل المثال،، تم ملء البيانات للفترات المفقودة عبر الاستيفاء الخطي بين الفترات المتاحة التالية أعلاه وأسفل الفترة المفقودة. في الحالات التي كانت فيها عمق المرجع لحساب المخزون ضمن فترة عميقة، تم تعديل تلك الفترة بشكل خطي إلى عمق المرجع التالي. إذا لم يتم تقديم معلومات عن انضغاط العينة من قبل الدراسة الأصلية، فقد تم الافتراض بأنه لم يحدث انضغاط للعينة.
تتضمن قاعدة بياناتنا 1022 تقديرًا لمخزون الكربون حتى عمق لا يقل عن 30 سم. للتحليل المقدم في هذه الورقة، أضفنا 1149 نقطة بيانات إضافية من خلال التنبؤالأسهم من النوى الأقصر (5 إلى 29 سم) (الشكل التوضيحي S6). استخدمنا مجموعة فرعية من البيانات، تشمل فقطتم قياس المخزونات إلى 30 سم، وقارنا أداء نموذجين تنبؤيين (خطّي وذو حدّين). وجدنا أن كلا النموذجين كانا دقيقين بنفس القدر واستخدمنا النموذج متعدد الحدود التالي للتنبؤ بتربة 30 سم.أسهممنأسهم.
بالإضافة إلى ذلك، توقعناالمخزونات من النوى الأقصر بطريقة مشابهة ووجدنا أن دالة متعددة الحدود من الدرجة الثانية توقعت بدقة أكبر النوى بطول 100 سم من النوى بطول 30 سم و50 سم مقارنة بالتقديرات الخطية. قمنا بإجراء تحليل مشابه للتنبؤالأسهم من أعماق مرجعية أقصرانظر قسم الطرق التكميلية “توقع“الأسهم من النوى القصيرة” و الشكل التوضيحي الإضافي S7، الجدول الإضافي S3.
كان هناك 553 تقديرًا لمخزون الكربون من فوركيان وآخرون.قاعدة بيانات لم تكن فيها بيانات الكثافة الجافة المتاحة وتم تعيينها بدلاً من ذلك إلى قيمة ثابتة منتوقعنا كثافات الكتلة الجافة لهذه العينات منالمحتوى من خلال ملاءمة دوال الانخفاض الأسّي لجميع إدخالات قاعدة البيانات المتاحةبيانات المحتوى وكثافة الكتلة الجافة. تم تحقيق أدق التنبؤات عندما تم ملاءمة وظائف منفصلة لكل نوع ساحلي (مثل الكارست، الأريكي، البحيرات، إلخ).. انظر قسم الطرق التكميلية “توقع قيم كثافة الكتلة الجافة المفقودة منالمحتوى”، الشكل التوضيحي التكميلي S8، والجدول التكميلي S4 لمزيد من التفاصيل حول نمذجة الكثافة السائبة الجافة.
نموذج الغابة العشوائية لعوامل مخزون الكربون
استخدمنا نمذجة الغابات العشوائية للتنبؤ بالعشب البحريأسهم، من فئات البيانات الوصفية تصنيف السواحل، المنطقة البحرية، جنس الأعشاب البحرية، نوع الأعشاب البحرية، مجموعة الأعشاب البحرية الوظيفية، ورقم المقال. ثم قمنا بتقييم أهمية المتغيرات لتقدير أي فئة من البيانات الوصفية كانت الأكثر تنبؤًا بالأعشاب البحرية.الأسهم (الشكل التوضيحي التكميلي S5). تم تنفيذ نماذج الغابة العشوائية وأهمية المتغيرات في النسخة 4.3.1 من Rاستخدام حزمة randomForestSRCمعلمات النموذج المثالي mtry ( ) وحجم العقدة ( تم تحديدها باستخدام دالة التعديل، واستخدمت المعلمات ntree في تشغيل النموذج النهائي.، أخذ العينات مع الاستبدال، حجم الكتلة، والأهمية (= permute). تم استخراج أهمية المتغير المقدرة باستخدام دالة subsample و extract.subsample وتم رسمها باستخدام دالة plot.subsample.
الانبعاثات الناتجة عن فقدان الأعشاب البحرية
لتقدير الخسارة منالأسهم من تحويل مروج الأعشاب البحرية إلى حالة غير مزروعة (أي، الفقدان)، استخدمنا المخاطر المتوقعة لانخفاض الأعشاب البحرية السريع من Turschwell وآخرون.طبقة جغرافية تتكون منخلايا الشبكة المملوءة بالاحتمالية النموذجية التي تشير إلى أن الأعشاب البحرية في خلية معينة تشهد تراجعًا سريعًا (فقدانأكثر من 10 سنوات) من مجموعة من الضغوط (الصيد القاعي، جودة المياه، إلخ). قمنا باستخراج قيمة الاحتمال هذه في مواقع 1323 إدخال في قاعدة بيانات مخزون الأعشاب البحرية وضربنا احتمال فقدان الأعشاب البحرية مع 30 سم محدد بالموقع.أسهم لاستنتاج تقدير لـ الأسهم في خطر. لم تقع جميع إدخالات قاعدة البيانات ضمن خلايا شبكة المخاطر، لأن طبقة المخاطر من تورشويل وآخرون.تم حسابه على البصمة المكانية لقاعدة بيانات توزيع الأعشاب البحرية الأصغر. لقد اعتبرنا المواقع التي كانت تتوفر فيها بيانات الكربون فقط مساوية للمواقع التي لا توجد بها بيانات، مع افتراض ضمني أن بيانات المخزون غير المشمولة في طبقة المخاطر لم تكن مختلفة عن بيانات المخزون المدرجة في هذا الحساب. ثم قمنا بضرب تربة الأعشاب البحرية الأسهم المعرضة للخسارة بواسطة أفضل تقدير حالي لـخفض المخزون بعد 25 عامًا (بحلول عام 2050) نتيجة لتحويل موائل الأعشاب البحرية إلى حالة غير مزروعة، محسوبة باستخدام الصيغة المستمدة تجريبيًا، حيث هو الوقت بالسنوات و هو في المئة خسارةثم قمنا بتقدير فقدان الكربون المرتبط بالكتلة الحيوية عند فقدان الأعشاب البحرية استنادًا إلى الوسيط الإجمالي للكتلة الحيوية المقدرة من قاعدة بياناتنا.، الجدول التكميلي S1)، على افتراض فقدان كل الكتلة الحيوية. لتقدير الإجماليالمخزون في خطر على مستوى العالم، قمنا بضرب ناتج التربةالمخزون المعرض لخطر الفقدان وكتلة الأعشاب البحرية وفقًا لأفضل تقديراتنا لمساحة الأعشاب البحرية العالمية الإجمالية. لا يزال هناك عدم يقين كبير مرتبط بتقديرات مساحة الأعشاب البحرية، وقد استخدمنا المتوسط لحد أدنى من (مرجع 42) وأقصى مساحة لـ (المرجع 43). ثم قمنا بتحويل كتلة الكربون المفقودة إلى ، من خلال الضرب في 3.67، النسبة الجزيئية لـإلى ج. بالإضافة إلى ذلك، قمنا بتقدير كمية الكربون التي لن يتم احتجازها بواسطة الأعشاب البحرية التي فقدت، ولكننا لم ندرج هذا المصطلح في تقديرنا النهائي لـ الانبعاث، بسبب عدم اليقين الكبير المرتبط بمعدلات احتجاز الكربون في الرواسب العارية حيث فقدت الأعشاب البحرية. بدلاً من ذلك، استخدمنا تقدير فقدان مخزون الكربون من الأعشاب البحرية دون احتساب الاحتجاز المفقود لتحديد التكلفة الاجتماعية المرتبطة بذلك.الانبعاثات، مع افتراض تكلفة اجتماعية لـ (دولار أمريكي 2020) لكل طن من .
القيود المنهجية واحتياجات البحث المستقبلية
نحن نعترف بأن تقديراتنا لتدفق الكربون الناتج عن تآكل التربةمن غير المحتمل أن تتساوى مخزونات الأعشاب البحرية مع الغلاف الجوي والمحيط.تدفق، لأن ليس كلدخول عمود الماء سيتم تحويله إلىوتحرير الغازات إلى الغلاف الجوي. لا توجد حاليًا بيانات كافية عن النسب وتوزيع العمق للمواد غير التفاعلية.في تربة الأعشاب البحرية، بالإضافة إلى إعادة توزيع محتملة وإعادة دفن لاحقة للتآكلبالإضافة إلى ذلك، تنشأ درجة كبيرة من عدم اليقين في تقديراتنا من النطاق الواسع الممكن لمدى الأعشاب البحرية العالمية.مما يبرز الحاجة إلى تحسين رسم الخرائط العالمية للمدى. على الرغم من أننا وجدنا اختلافات في مخزونات مجموعات ووحدات الأعشاب البحرية، لم نتمكن من دمج محددالأسهم في حساب انبعاثاتنا، لأنها غير محسوبة حاليًا في تقديرات مدى الأعشاب البحرية العالمية. بالإضافة إلى ذلك، فإن قيدًا منهجيًا في أبحاث الكربون الأزرق للأعشاب البحرية هو الممارسة الشائعة لتقييمفي تربة الأعشاب البحرية دون إزالة المواد الموجودة تحت الأرض للأعشاب البحرية، مما قد يؤدي إلى احتساب مزدوج إذا تم تضمين هذه المواد في كل من الكتلة الحيوية تحت الأرض والتربة.تقديرات.
تم توفير جميع كودات R اللازمة لإعادة إنتاج التحليل كبرمجيات تكميلية 1 لهذه المقالة.
References
Rosentreter, J. A. et al. Coastal vegetation and estuaries are collectively a greenhouse gas sink. Nat. Clim. Change 13, 579-587 (2023).
Poulter, B. et al. In Geophysical Monograph Series. (eds. Krauss, K. W., Zhu, Z. & Stagg, C. L.) 1-20 (Wiley, 2021).
Duarte, C. M., Middelburg, J. J. & Caraco, N. Major role of marine vegetation on the oceanic carbon cycle. Biogeosci. Discuss. 1, 659-679 (2004).
Leavitt, S. M. et al. Natural Climate Solutions Handbook: A Technical Guide for Assessing NatureBased Mitigation Opportunities in Countries. 135 (The Nature Conservancy, Arlington, VA, USA, 2021).
Fourqurean, J. W. et al. Seagrass ecosystems as a globally significant carbon stock. Nat. Geosci. 5, 505-509 (2012).
Pendleton, L. et al. Estimating global “Blue Carbon” emissions from conversion and degradation of vegetated coastal ecosystems. PLoS ONE 7, e43542 (2012).
Lovelock, C. E., Fourqurean, J. W. & Morris, J. T. Modeled CO2 emissions from coastal wetland transitions to other land uses: tidal marshes, mangrove forests, and seagrass beds. Front. Mar. Sci. 4, 143 (2017).
Duarte, C. M., Losada, I. J., Hendriks, I. E., Mazarrasa, I. & Marbà, N. The role of coastal plant communities for climate change mitigation and adaptation. Nat. Clim. Change 3, 961-968 (2013).
Friess, D. A., Howard, J., Huxham, M., Macreadie, P. I. & Ross, F. Capitalizing on the global financial interest in blue carbon. PLoS Clim. 1, e0000061 (2022).
Hoegh-Guldberg, O., Northrop, E. & Lubchenco, J. The ocean is key to achieving climate and societal goals. Science 365, 1372-1374 (2019).
Friess, D. A. The potential for mangrove and seagrass blue carbon in Small Island States. Curr. Opin. Environ. Sustain. 64, 101324 (2023).
Needelman, B. A. et al. The science and policy of the verified carbon standard methodology for tidal wetland and seagrass restoration. Estuar. Coasts 41, 2159-2171 (2018).
Lovelock, C. E. et al. Modeled approaches to estimating blue carbon accumulation with mangrove restoration to support a blue carbon accounting method for Australia. Limnol. Oceanogr. 67, S50-S60 (2022).
Belshe, E. F., Mateo, M. A., Gillis, L., Zimmer, M. & Teichberg, M. Muddy Waters: Unintentional Consequences of Blue Carbon Research Obscure Our Understanding of Organic Carbon Dynamics in Seagrass Ecosystems. Front. Marine Sci. 4, 00125 (2017).
Mazarrasa, I. et al. Habitat characteristics provide insights of carbon storage in seagrass meadows. Mar. Pollut. Bull. 134, 106-117 (2018).
Kennedy, H. et al. Species traits and geomorphic setting as drivers of global soil carbon stocks in seagrass meadows. Glob. Biogeochem. Cycles. 36, e2022GB007481 (2022).
Fourqurean, J. W. et al. Seagrass abundance predicts surficial soil organic carbon stocks across the range of thalassia testudinum in the Western North Atlantic. Estuar. Coasts. https://doi.org/10.1007/ s12237-023-01210-0 (2023).
Serrano, O. et al. Can mud (silt and clay) concentration be used to predict soil organic carbon content within seagrass ecosystems? Biogeosciences 13, 4915-4926 (2016).
Röhr, M. E. et al. Blue Carbon Storage Capacity of Temperate Eelgrass (Zostera marina) Meadows. Glob. Biogeochem. Cycles 32, 1457-1475 (2018).
Dahl, M. et al. The influence of hydrodynamic exposure on carbon storage and nutrient retention in eelgrass (Zostera marina L.) meadows on the Swedish Skagerrak coast. Sci. Rep. 10, 13666 (2020).
Oreska, M. P. J., McGlathery, K. J., Porter, J. H., Bost, M. & McKee, B. A. Seagrass blue carbon accumulation at the meadow-scale. PLoS ONE 12, 1-18 (2017).
Oreska, M. P. J. et al. The greenhouse gas offset potential from seagrass restoration. Sci. Rep. 10, 1-15 (2020).
Stankovic, M. et al. Quantification of blue carbon in seagrass ecosystems of Southeast Asia and their potential for climate change mitigation. Sci. Total Environ. 783, 146858 (2021).
Macreadie, P. I. et al. The future of Blue Carbon science. Nat. Commun. 10, 3998 (2019).
IPCC. Methodological Guidance on Lands with Wet and Drained Soilds, and Constructed Wetlands for Wastewater Treatment. 2013 Supplement to the 2006 IPCC Guidelines for National Greenhouse Gas Inventories: Wetlands. 1-55. http://www.ipcc-nggip.iges.or.jp (2014).
Duarte, C. M. & Chiscano, C. L. Seagrass biomass and production: a reassessment. Aquat. Bot. 65, 159-174 (1999).
Strydom, S. et al. Global dataset on seagrass meadow structure, biomass and production. Earth Syst. Sci. Data. 15, 511-519 (2023).
Kilminster, K. et al. Unravelling complexity in seagrass systems for management: Australia as a microcosm. Sci. Total Environ. 534, 97-109 (2015).
Tanaya, T. et al. Contributions of the direct supply of belowground seagrass detritus and trapping of suspended organic matter to the sedimentary organic carbon stock in seagrass meadows. Biogeosciences 15, 4033-4045 (2018).
Hendriks, I. E., Sintes, T., Bouma, T. J. & Duarte, C. M. Experimental assessment and modeling evaluation of the effects of the seagrass Posidonia oceanica on flow and particle trapping. Mar. Ecol. Prog. Ser. 356, 163-173 (2008).
Reidenbach, M. A. & Thomas, E. L. Influence of the seagrass, Zostera marina, on wave attenuation and bed shear stress within a shallow coastal bay. Front. Mar. Sci. 5, 397 (2018).
Terrados, J. & Duarte, C. M. Experimental evidence of reduced particle resuspension within a seagrass (Posidonia oceanica L.) meadow. J. Exp. Mar. Biol. Ecol. 243, 45-53 (2000).
Hendriks, I. E., Bouma, T. J., Morris, E. P. & Duarte, C. M. Effects of seagrasses and algae of the Caulerpa family on hydrodynamics and particle-trapping rates. Mar. Biol. 157, 473-481(2010).
Wesselmann, M. et al. Seagrass (Halophila stipulacea) invasion enhances carbon sequestration in the Mediterranean Sea. Glob. Change Biol. 27, 2592-2607 (2021).
Chen, G. et al. Mangroves as a major source of soil carbon storage in adjacent seagrass meadows. Sci. Rep. 7, 42406 (2017).
Dürr, H. H. et al. Worldwide typology of nearshore coastal systems: defining the estuarine filter of river inputs to the oceans. Estuar. Coasts 14, 441-458 (2011).
Twilley, R. R., Rovai, A. S. & Riul, P. Coastal morphology explains global blue carbon distributions. Front. Ecol. Environ. 16, 503-508 (2018).
Macreadie, P. I. et al. Carbon sequestration by Australian tidal marshes. Sci. Rep. 7, 44071 (2017).
Turschwell, M. P. et al. Anthropogenic pressures and life history predict trajectories of seagrass meadow extent at a global scale. Proc. Natl Acad. Sci. USA 118, e2110802118 (2021).
Dahl, M. et al. Ranking the risk of CO 2 emissions from seagrass soil carbon stocks under global change threats. Glob. Environ. Change 78, 102632 (2023).
McKenzie, L. J. et al. The global distribution of seagrass meadows. Environ. Res. Lett. 15, 074041 (2020).
UNEP-WCMC & Short, F. Global Distribution of Seagrasses (Version 7.1). Seventh Update to the Data Layer Used in Green and Short (2003). https://doi.org/10.34892/x6r3-d211 (2021).
Rennert, K. et al. Comprehensive evidence implies a higher social cost of CO2. Nature 610, 687-692 (2022).
Johannessen, S. C. & Macdonald, R. W. Geoengineering with seagrasses: is credit due where credit is given? Environ. Res. Lett. 11, 113001 (2016).
Williamson, P. & Gattuso, J.-P. Carbon removal using coastal blue carbon ecosystems is uncertain and unreliable, with questionable climatic cost-effectiveness. Front. Clim. 4, 853666 (2022).
Howard, J. et al. Clarifying the role of coastal and marine systems in climate mitigation. Front Ecol. Environ. 15, 42-50 (2017).
Dunic, J. C., Brown, C. J., Connolly, R. M., Turschwell, M. P. & Côté, I. M. Long-term declines and recovery of meadow area across the world’s seagrass bioregions. Glob. Change Biol. 27, 4096-4109 (2021).
De Borger, E., Tiano, J., Braeckman, U., Rijnsdorp, A. D. & Soetaert, K. Impact of bottom trawling on sediment biogeochemistry: a modelling approach. Biogeosciences 18, 2539-2557 (2021).
Morys, C., Brüchert, V. & Bradshaw, C. Impacts of bottom trawling on benthic biogeochemistry in muddy sediments: removal of surface sediment using an experimental field study. Mar. Environ. Res. 169, 105384 (2021).
Van Dam, B. R. et al. Calcification-driven CO2 emissions exceed “Blue Carbon” sequestration in a carbonate seagrass meadow. Sci. Adv. 7, 51 (2021).
Fakhraee, M., Planavsky, N. J. & Reinhard, C. T. Ocean alkalinity enhancement through restoration of blue carbon ecosystems. Nat. Sustain. https://doi.org/10.1038/s41893-023-01128-2 (2023).
R Core Team. R: A Language and Environment for Statistical Computing. 2, 1-12 (R Core Team, 2024).
Ishwaran, H. & Kogalur, U. B. Fast Unified Random Forests for Survival, Regression, and Classification (RF-SRC). https://cran.r-project. org/package=randomForestSRC (2023).
Spalding, M. D. et al. Marine ecoregions of the world: a bioregionalization of coastal and shelf areas. BioScience 57, 573-583 (2007).
Dunn, O. J. Multiple comparisons using rank sums. Technometrics 6, 241-252 (1964).
Sullivan, B. K. & Short, F. T. Taxonomic revisions in Zosteraceae (Zostera, Nanozostera, Heterozostera and Phyllospadix). Aquat. Bot. 187, 103636 (2023).
شكر وتقدير
هذا العمل هو نتاج مبادرة الكربون الأزرق الدولية، المنسقة من قبل منظمة الحفظ الدولية، واللجنة الدولية الحكومية لعلوم المحيطات – اليونسكو، والاتحاد الدولي لحفظ الطبيعة. وقد مولت مؤسسة MAC3 Impact Philanthropies هذه البحث بسخاء من خلال منظمة الحفظ الدولية. بالإضافة إلى ذلك، قام J.R.K. و J.W.F. بتطوير هذه الورقة بالتعاون مع برنامج الأبحاث البيئية طويلة الأمد في إيفرجليدز الساحلية في فلوريدا، منحة مؤسسة العلوم الوطنية رقم DEB-2025954. A.A.-O. يعترف بالدعم من MCIN/AEI RYC2021-034455-I. K.J.M. يعترف بالدعم من منحة مؤسسة العلوم الوطنية DEB-1832221 لمشروع الأبحاث البيئية طويلة الأمد في محمية ساحل فرجينيا. O.S. يعترف بالدعم من مشروع MEDCHANGE الممول من AEI. N.M. يعترف بالدعم من مشروع OBAMA-NEXT (الاتحاد الأوروبي بموجب برنامج هورايزون أوروبا، اتفاقية المنحة رقم 101081642) ومن الحكومة الإسبانية من خلال اعتماد “مركز ماريا دي مايتزو للتميز” لـ IMEDEA (CSIC-UIB) (CEX2021-001198). هذا هو رقم النشر 1855 من قسم السواحل والمحيطات في معهد البيئة بجامعة فلوريدا الدولية.
مساهمات المؤلفين
جميع المؤلفين تصوروا الورقة وساهموا بشكل كبير في العمل. كتب ج.ر.ك. المسودة الأولية وأجرى التحليل الرسمي. قام ج.س. بأداء البحث الأدبي الأولي وتصميم قاعدة البيانات الأولية. قام ج.ر.ك.، ج.س.، م.د.، ك.إل.، م.ب.ج.أ.، ل.و.و.، وج.و.ف. بإجراء استخراج البيانات. قام ج.س.، أ.أ.أ.، م.ج.أ.، س.س.، م.د.، د.ف.، هـ.ك.، ج.إل.، ن.م.، ك.ج.م.، م.ب.ج.أ.، إ.ب.، أ.س.، م.أ.ف.، س.م.ي.، وج.و.ف. بمراجعة نقدية والمساهمة في عدة مسودات من المخطوطة.
ملاحظة الناشر: تظل شركة سبرينجر ناتشر محايدة فيما يتعلق بالمطالبات القضائية في الخرائط المنشورة والانتماءات المؤسسية.
الوصول المفتوح. هذه المقالة مرخصة بموجب رخصة المشاع الإبداعي النسب-غير التجارية-عدم الاشتقاق 4.0 الدولية، التي تسمح بأي استخدام غير تجاري، ومشاركة، وتوزيع، وإعادة إنتاج في أي وسيلة أو صيغة، طالما أنك تعطي الائتمان المناسب للمؤلفين الأصليين والمصدر، وتوفر رابطًا لرخصة المشاع الإبداعي، وتوضح إذا قمت بتعديل المادة المرخصة. ليس لديك إذن بموجب هذه الرخصة لمشاركة المواد المعدلة المشتقة من هذه المقالة أو أجزاء منها. الصور أو المواد الأخرى من طرف ثالث في هذه المقالة مشمولة في رخصة المشاع الإبداعي الخاصة بالمقالة، ما لم يُشار إلى خلاف ذلك في سطر الائتمان للمادة. إذا لم تكن المادة مشمولة في رخصة المشاع الإبداعي الخاصة بالمقالة وكان استخدامك المقصود غير مسموح به بموجب اللوائح القانونية أو يتجاوز الاستخدام المسموح به، ستحتاج إلى الحصول على إذن مباشرة من صاحب حقوق الطبع والنشر. لعرض نسخة من هذه الرخصة، قم بزيارة http:// creativecommons.org/licenses/by-nc-nd/4.0/.
(ج) المؤلفون 2025
¹معهد البيئة، قسم السواحل والمحيطات، جامعة فلوريدا الدولية، ميامي، فلوريدا، الولايات المتحدة الأمريكية. ²مدرسة البيئة، جامعة كوينزلاند، سانت لوسيا، كوينزلاند، أستراليا.قسم الفيزياء، جامعة برشلونة المستقلة، برشلونة، إسبانيا.مركز سميثسونيان للبحوث البيئية، إدج ووتر، ماريلاند، الولايات المتحدة الأمريكية.المركز الزراعي الاستوائي للبحث والتعليم، تورريالبا، كوستاريكا.جمعية سيلفستروم للمناخ، سوساليتو، كاليفورنيا، الولايات المتحدة الأمريكية.مدرسة العلوم الطبيعية، التكنولوجيا والدراسات البيئية، جامعة سودرتورن، هودينغ، السويد.قسم علوم الأرض والبيئة، جامعة تولين، نيو أورلينز، لويزيانا، الولايات المتحدة الأمريكية.مدرسة علوم المحيطات، جامعة بانغور، بانغور، ويلز الشمالية، المملكة المتحدة.الجامعة الوطنية في سنغافورة، سنغافورة، سنغافورة.مجموعة أبحاث التغير العالمي، المعهد المتوسطي للدراسات المتقدمة (CSIC-UIB)، إسبورلاس، إسبانيا.قسم العلوم البيئية، جامعة فيرجينيا، شارلوتسفيل، فيرجينيا، الولايات المتحدة الأمريكية.الحفاظ الدولي، أرلنجتون، فيرجينيا، الولايات المتحدة الأمريكية.مركز الدراسات المتقدمة في بلانيس، المجلس الأعلى للبحوث العلمية (CEAB-CSIC)، بلانيس، إسبانيا.CSIRO البيئة، مركز أبحاث المحيط الهندي، كراولي، أستراليا الغربية، أستراليا.المعهد الدولي للكربون الأزرق، الحفاظ الدولي، سنغافورة، سنغافورة.قسم العلوم البيولوجية، جامعة فلوريدا الدولية، ميامي، فلوريدا، الولايات المتحدة الأمريكية. البريد الإلكتروني: jkrause@fiu.edu
Global seagrass carbon stock variability and emissions from seagrass loss
Received: 27 October 2024
Accepted: 14 April 2025
Published online: 06 May 2025
Vegetated coastal ecosystems (VCEs), including seagrasses, are significant greenhouse-gas sinks that store as much as organic carbon ( ) in biomass and underlying soil (known as “blue carbon”) . These ecosystems play an outsized role in oceanic carbon burial because they account for nearly half of the annual burial in oceanic sediments despite covering only of the ocean . As such, restoration, protection, or enhancement of VCEs relative to the status quo are considered natural climate solutions . However, their
Seagrass ecosystems are recognized for their capacity to sequester and store organic carbon, but there is large variability in soil organic carbon stocks associated with plant traits and environmental conditions, making the quantification and scaling of carbon storage and fluxes needed to contribute to climate change mitigation highly challenging. Here, we provide estimates of carbon stocks associated with seagrass systems (biomass and soil) through analyses of a comprehensive global database including 2700+ seagrass soil cores. The median global soil stock estimate is in the top 30 cm of soil, lower than estimates from previous global syntheses, refining the IPCC Tier 1 soil stock currently used for carbon accounting in places without local data. We estimate that seagrass carbon stocks at risk of degradation could emit with a social cost of billion (2020 US dollars), if no action is taken to conserve these habitats.
important contribution to climate change mitigation is at risk because VCEs are declining globally, and their loss could further exacerbate climate change by reducing carbon sequestration capacity, shrinking an already limited natural buffer against rising greenhouse gas emissions. In addition, seagrass and other VCE loss and degradation also puts at risk the stored in underlying soils, some of which may be eroded, resuspended and remineralized, turning stocks accumulated over centuries into a new source of greenhouse gas emissions .
Although the conservation of VCEs has many benefits beyond blue carbon , it is primarily their carbon sequestration and storage capacity that is being integrated into national and international policy frameworks and financing mechanisms, including carbon credits . For example, VCE protection and restoration are recognized strategies to achieve the goals set by the Paris Agreement, which include limiting greenhouse gas emissions and keeping long-term global temperature increases to well below relative to that before the industrial revolution . Multiple countries are already including VCEs in their commitments (known as Nationally Determined Contributions, NDCs) to achieving the targets of this agreement . Additionally, methodologies exist for generating carbon credits from the restoration and conservation of VCEs that can be purchased by those wishing to offset greenhouse gas emissions , and the number of associated projects generating “blue carbon credits” to support conservation-related activities is rapidly accelerating . However, seagrasses have large uncertainties in soil density and sequestration rate and have also received less policy and related financial attention than other VCEs , resulting in fewer conservation and restoration activities targeting seagrass ecosystems. Greater knowledge of the variation in, and drivers of, seagrass stocks is essential to guide the development, integrity, and reliability of climate change policy and financing to support seagrass conservation and restoration.
Seagrass ecosystems have long been recognized as globally significant stocks with considerable risk of emissions following their degradation . However, earlier estimates of seagrass stocks were subject to large uncertainty due to limited stock data that did not capture the full variety of seagrass habitat types across their geographic distribution . More than a decade has passed since the seminal synthesis of seagrass stock data by Fourqurean et al. , and increased interest in seagrass blue carbon has sparked research activity on all continents. As a result, we now have comprehensive data to form a more complete and nuanced understanding of seagrass blue carbon. For example, recent work has shown that seagrass
sequestration and storage depend on a variety of influences relating to plant traits, climate, geomorphology, and hydrology . Seagrass morphology and biomass , soil properties , and hydrodynamic regime can all also influence seagrass stocks. However, these recent advances in our understanding of seagrass storage are mostly regional or species-specific and a global synthesis of these newly available data is needed to enable a comprehensive seagrass stock assessment across all species, environments and bioregions .
Here, we assess stock data across the full geographic distribution and taxonomic variety of seagrass habitats and do this by assembling a global database of seagrass stocks via a systematic review of published data, supplemented with previously unpublished data. We provide updated estimates of global, regional, and genusspecific mean stocks (see Table S1) and determine global correlates of stock variability relating to biogeography, plant physiology, and coastal geomorphology. The database is also delineated by records per country to enable readers to assess carbon stocks with reference to practical applications such as National Greenhouse Gas Inventories required under the Paris Agreement. We combine our seagrass stock estimates with recent assessments of seagrass loss risks, carbon remineralization factors, and global seagrass area to derive first-order estimates of potential emissions resulting from a failure to protect current seagrass ecosystems.
Results and discussion
Global seagrass carbon stocks
We compiled data from 2771 soil cores (Fig. 1), out of which 1022 soil cores had a depth of at least 30 cm with a mean stock of ha in the top 30 cm of soil (Table 1). These stock data were skewed high by very large stock estimates (mostly from Mediterranean Posidonia oceanica meadows), thus making estimates of the median of ha (interquartile range) more representative of the central tendency. We used a further
Fig. 1 | Seagrass soil organic carbon ( ) stocks (to ) by coastal typology and marine ecoregion. Map shows sampling locations (black circles) with marine ecoregions . Panels show boxplots of 30 cm seagrass stocks by coastal typology , where Arheic, Fjords, Karst, Lagoons, Large Rivers, Small deltas, TS=Tidal systems. Median
stocks ( ) and sample size ( ) are shown in panels for each marine ecoregion, where the center line shows the median, box limits show upper and lower quartiles, whiskers are the interquartile range and points are outliers. Basemap from ESRI.
Table 1 | Database summary and comparison to previous estimates
Study
Mean ± SE
Median (interquartile range)
Soil properties
Dry bulk density ( )
This study
1.1 (0.8-1.4)
18,436
Fourqurean et al.
0.9
2484
This study
0.7 (0.3-1.6)
18,658
Fourqurean et al.
1.4
3561
Soil stock ( ha )
30 cm ; Including predicted
This study
24.2 (12.4-44.9)
2171
30 cm ; Measured only
This study
27.54 (15.8-47.2)
1022
Kennedy et al.
23.1
576
Fourqurean et al.
33.2 (23.1-45.6)
183
1 m ; Including predicted
This study
77.6 (41.9-139.7)
1625
Fourqurean et al.
165.6
139.7
219
IPCC
108 (84-139)
89
1 m; Measured only
This study
145 (62.2-263.7)
227
Fourqurean et al.
173.3
41
Soil properties were summarized for all available data in the database, where most soil cores contain multiple data points representing individual core increments. Soil stocks were calculated per soil core. IPCC reported the geometric mean with a confidence interval, based on both measured and interpolated stocks.
Fig. 2 | Seagrass soil organic carbon ( ) stock database summary statistics by data publication year. Seagrass soil stock mean (green), median (orange), and number of cores (purple) cumulatively calculated for each publication year from 2012. Organic carbon stocks include only measured values (minimum core length of 30 cm ). Standard error shown for the mean. Horizontal lines indicate the IPCC Tier 1 estimate (dashed; IPCC ) and our new database median (solid line, includes predicted stocks).
1,149 soil cores that had a length of 5 to 29 cm to model 30 cm soil stocks and report our best estimate of median global seagrass stocks in the top 30 cm of soil to be , based on 2171 cores. An additional 600 soil surface samples did not reach to 5 cm depth and were not part of stock estimates.
This predicted median 30 cm soil stock is higher than recent estimates by Kennedy et al. based on 576 cores, but lower than the first global estimate by Fourqurean et al. , while the median predicted 1 m soil stock is lower than the IPCC Tier 1 estimate and lower than Fourquean et al. (Table 1). Compared to these earlier studies, our database greatly expands the geographic and taxonomic distribution of seagrass estimates and includes data from seagrass meadows in minerogenic settings with soils of higher dry bulk density and lower soil content, which were underrepresented in earlier syntheses (Table 1). Indeed, each year since the publication of Fourqurean et al. , the addition of new
seagrass stock measurements reduced the global mean and median estimates (Fig. 2), indicating that early available data were biased toward seagrass habitats with high soil stocks. Notably, since 2019, the mean and median estimates have stabilized, suggesting that the current number of available measurements is sufficient to derive a more robust and reliable seagrass soil stock estimate to inform future blue carbon studies reliant on a global average.
Our synthesis also provides data on seagrass above-ground biomass ( ), below-ground biomass ( ), and total biomass ( ), with a mean (median) of for aboveground biomass, for below-ground biomass, and for total biomass (Supplementary Table S1). Although these estimates are based on at least twice the sample size, they are very similar to previously published values (Supplementary Table S2) , except for below-ground biomass, which we estimate higher than Duarte and Chiscano . A more recent, much larger compilation of seagrass biomass data by Strydom et al. also suggests higher below-ground than above-ground biomass in seagrasses, albeit with lower overall biomass stocks (Supplementary Table S2). However, neither Strydom et al. nor Duarte and Chiscano reported biomass content, and we calculated stocks under the simplifying assumption that of biomass is .
There are pronounced differences in seagrass soil stocks depending on taxonomic identity and functional group. The highest soil stocks were associated with the seagrass genera Posidonia, Thalassia, Syringodium, as well as mixed species meadows, although these groups also had the largest variability in soil stocks (Fig. 3; Supplementary Table S1). Interestingly, these taxa also showed the highest below-ground biomass, while the seagrass genus with the lowest soil stocks (Halophila) had the lowest average belowground biomass, suggesting a relationship of genera-specific soil stocks and seagrass biomass (Supplementary Fig. S1).
Global correlates of seagrass carbon stocks
Large, persistent seagrass species are associated with larger soil stocks than ephemeral species (Fig. 3). This finding is likely related to the increased production of biomass, particularly below-ground roots and rhizomes that directly contribute autochthonous organic matter to the soil carbon pool , as well as above-ground biomass that may facilitate trapping of particles at higher rates, including allochthonous organic matter . These large seagrass species also typically persist in the same location over multiple years, indicating an absence of-or resistance to-disturbance. This stable sedimentary environment may
Fig. 3 | Box plots showing soil stocks by seagrass genus (colors), nested within functional group. Box plot elements are defined as in Fig. 1. Note the logarithmic -axis. Also shown are letters indicating differences between functional groups (Kruskal-Wallis, Dunn’s post hoc ), median carbon stocks , coefficients of variation ( ), and sample size ( ) for functional groups. Horizontal lines indicate the IPCC Tier 1 estimate (dashed) and our new database median (solid). Note that Zosteraceae were recently revised to encompass multiple genera, which is not reflected in this study . Two very low carbon stocks of the “unvegetated” group were excluded for display purposes.
contribute to their underlying soils having higher stocks, as sediment resuspension and remineralization rates may be lower .
In contrast, small and ephemeral seagrass species may trap fewer allochthonous organic matter particles, contribute less autochthonous organic matter from biomass, and may be more prone to lose stocks to remineralization when vegetation cover is low or absent . In fact, many small and ephemeral seagrass species are considered early colonizers and, as such, are associated with unstable or recently disturbed habitats , which may have low soil stocks upon colonization. However, our data show that both ephemeral species of Halophila and Ruppia can, in some cases, be associated with carbon stocks of more than 100 Mg C ha in the top 30 cm . This may reflect their ability to settle on soil previously occupied by persistent species , their potential for high rates of autochthonous production , or their settling in depositional environments with allochthonous sources of carbon such as mangroves . Further studies are required to understand the contribution of small and ephemeral seagrasses to soil stocks.
These findings show that seagrass carbon stock estimates need to consider seagrass species, or functional group identity, to improve current estimates. Extrapolating soil stock estimates derived from persistent species to meadows comprised of ephemeral seagrasses will likely lead to overestimations of blue carbon stocks, and vice versa. This highlights the need to distinguish seagrass meadow types (functional groups or species composition) in both seagrass extent mapping and field collection of stock data. Seagrass stock estimates that rely solely on presence-absence maps and utilize stock data exclusively derived from dense, persistent meadows are likely to overestimate true stocks. However, the considerable variability in stocks even within genera emphasizes the need to consider further site characteristics for blue carbon projects (Fig. 4). For example, where ephemeral seagrasses grow on soil with high stocks that may have been previously deposited by other species (e.g., persistent seagrasses or mangroves), their conservation might prevent emissions of legacy stocks even if recent burial is low.
Seagrass soil stocks also differ geographically, with higher stocks in the Tropical Atlantic, Tropical Eastern Pacific, and Temperate Southern Africa marine ecoregions, although the latter two regions are still relatively under-sampled (Fig. 1; Supplementary Table S1). Absolute sampling effort was highest in Australia, USA, Denmark, UK, and Singapore (Supplementary Fig. S2), but normalized for seagrass area within territorial waters, Jordan, Malta, Singapore, US Virgin Islands, Malaysia, Kenya, and Colombia had the highest data density (Supplementary Fig. S3). We also tested for differences among coastal typologies because the geomorphic setting has been identified as a good predictor of stocks in VCEs . We found higher soil stocks in small deltas, Karst, and arheic settings (Supplementary Table S1; Supplementary Fig. S4), particularly in small deltas of the Temperate North Atlantic and Central Indo-Pacific (Fig. 1). This coastal typology may provide ideal conditions for seagrass storage, because small deltas can be sheltered, depositional environments with a potential additional supply of allochthonous from terrestrial sources and inorganic material that rapidly buries and preserves deposited (Fig. 4). The highest stocks associated with these settings harbor Posidonia meadows in the Mediterranean, as well as Enhalus and Thalassia meadows in the Central Indo-Pacific, all persistent species with high biomass.
Overall, global variability in seagrass soil stocks was only partially explained by the broad geographical and taxonomic predictors in our database (Random Forest: , RMSE ; Supplementary Fig. S5), suggesting that other regional and local-scale drivers may exert control over seagrass soil stocks (e.g., hydrology, sedimentology, disturbance history, etc.). The best models of seagrass soil stocks will therefore be local or regional, considering predictors specific to these scales or including more detailed predictor variables . In addition, biogeographical (coastal typology, marine ecoregion) as well as taxonomic (seagrass species, genus, and functional group) predictors were significant, highlighting that globally, both plant traits and the environmental setting interact to determine seagrass blue carbon stocks (Fig. 4). But even our best models still leave a large proportion of the variance in stocks unexplained; the study identifier (“Article ID”) was the most important predictor of stocks (Supplementary Fig. S5), suggesting that study design or other site idiosyncrasies (see Fig. 4) may explain a large portion of the variability. Further work is needed to better constrain the factors responsible for determining seagrass soil stocks at a global and local scale.
Potential carbon emissions from seagrass loss
We produced a first-order estimate of potential emissions resulting from a failure to protect at-risk seagrass carbon stocks globally. To do this, we combined spatially explicit seagrass soil stocks to 30 cm depth with a recently published global map of risk of rapid seagrass decline . If no conservation actions are taken to halt this rapid decline, we estimate that ha might be lost by 2050 , assuming of soil stocks are being remineralized after conversion of seagrass habitat to an unvegetated state . Adding the loss of seagrass biomass ( ha , Supplementary Table S1) and assuming that the available risk and carbon stock estimates are representative of the total global seagrass area , adapted from McKenzie et al. and UNEP-WCMC ), loss of stocks from atrisk seagrass conversion to an unvegetated state could result in emissions of 1154 (665-1699) Tg by 2050 (Table 2). With a social carbon cost of (2020 US dollars) per Mg of emissions through climate change impacts , a failure to protect seagrass habitats could have a social cost of (123-314) billion ($2020 US) until 2050, based on the loss of stores alone. This estimate is likely conservative because it only includes the loss of existing seagrass stocks to a 30 cm depth and does not consider any foregone sequestration, which is associated with much greater uncertainty due to high
Fig. 4 | Conceptual diagram of factors driving soil stocks in seagrass systems. Seagrasses produce (net ecosystem productivity, NEP) and may exchange with adjacent systems (lateral flux). Soil stocks are a function of legacy carbon stocks, ecological and disturbance history (Pre-condition), increased by burial (affected by sediment deposition, content of deposited sediment, seagrass biomass, and persistence), and reduced by remineralization (affected by erosion, fine sediment content, hydrodynamic energy, and microbial activity). Factors with green symbols (+) generally increase soil stocks, while purple symbols (-) generally decrease soil stocks, and factors with gray symbols (=) have no generalizable direction. Seagrass symbol adapted from Catherine Collier, JCU (license: creativecommons.org/licenses/by-sa/4.0/).
variability in burial rates and the complexity of their accurate determination . Despite this conservative approach, we derive an annualized rate of , assuming that emissions are occurring at a constant rate until 2050. Previous estimates included the loss of deeper ( 1 m ) stocks and assumed conversion of stocks to , but without spatially explicit stock and degradation risk data, derived annualized loss rates of at a cost of billion US .
Reference depth for carbon stock accounting
In this work, we report seagrass-associated soil stocks to a depth of 30 cm , although previous assessments used a 1 m depth horizon . Using 30 cm reference depth for seagrass soil stock accounting is more conservative and reflects that most available data are from soil cores less than 1 m long (only 227 out of 2171 cores in our database reach 1 m depth, Table 1), likely because obtaining longer subtidal soil cores is logistically more complicated, or impossible where seagrass grows on soils less than 1 m deep, as can be the case in nearshore and backreef environments. We emphasize that for carbon stock accounting, it is important to measure soil depth and caution against assuming a soil depth of 1 m exists at all meadows. Thus, the common practice of linear extrapolation of measurements from shorter cores to 1 m depth can be inappropriate, particularly as analysis of 1 m cores in our database suggests that this practice overestimates stocks, especially in high- soils (Supplementary Methods).
Evidently, estimating seagrass stocks to a greater reference depth yields larger stocks, but for the purpose of carbon accounting it is appropriate to use the reference depth that is at risk of loss. There is currently insufficient data to ascertain the depth to which seagrass stocks are affected when seagrass meadows are degraded or lost, and this depth will likely vary with environmental conditions and disturbance type. Seagrass systems globally are mainly threatened by coastal development, bottom trawling and anchoring, and deterioration of water quality . Bottom trawling represents one of the
greatest risks , and both modeling and field studies suggest that its effect on stocks extends to a soil depth of . Similarly, little is known about the balance of in seagrass-associated soils that is labile and at risk of remineralization, as opposed to recalcitrant that would not be remineralized upon soil erosion and resuspension following seagrass loss. Typically, the surface layer of marine soils contains more labile than deeper layers , so that the remineralization rate of upon disturbance may decrease with depth. We therefore chose to limit our assumptions of losses to the more vulnerable and higher- top 30 cm of seagrass soils.
Lastly, it is important to note that seagrass meadows and other VCEs can cycle greenhouse gases not only by organic matter production and burial, but also via carbonate production and dissolution, as well as fluxes of total alkalinity, methane, and nitrous oxide. While the benefit of blue carbon may be outweighed by these processes in individual seagrass meadows , research suggests that globally, alkalinity production and carbonate dissolution increase carbon dioxide removal capacity while methane and nitrous oxide production are low and not sufficient to offset their status as greenhouse gas sinks .
Outlook
Since the initial global seagrass soil stocks summary was published and incorporated into IPCC Tier 1 estimates for carbon storage and potential emissions , the global scientific community has made considerable effort to generate data for previously understudied regions, seagrass taxa, and environments. Our new understanding of global biomass and soil stocks suggests that the central tendency of global seagrass soil stocks is lower than previously thought. Our analyses suggest that this new estimate is robust to the addition of new data and more accurately and reliably represents global seagrass soil stocks. Our estimate refines the Tier 1 soil stock for places without local data, and our models of the correlates of soil stocks allow for the calculation of Tier 2 estimates by considering species traits, bioregion, and geomorphic setting. We also highlight that there are still critical knowledge gaps with regard to drivers of seagrass soil stocks, the extent of remineralization following seagrass loss, the fate of remineralized stocks, and the global seagrass extent.
Despite these unknowns, the benefit of conserving existing stocks in seagrass habitats is abundantly clear. Even with a more conservative approach than previous studies , seagrass stocks at risk of loss are still significant at a global scale, with potential emissions of by 2050. The protection of existing VCEs and their associated carbon stocks, including avoided habitat loss and resealing ancient soil stocks with seagrasses, is among the most costeffective strategies for climate change mitigation via natural climate solutions . In addition to protecting seagrass systems as greenhouse gas sinks, the conservation of these habitats yields substantial cobenefits, from supporting biodiversity and livelihoods, to nourishing endangered species, protecting coastlines, and improving water quality . The increased reliability of our stock estimates and better understanding of the drivers of variability provide climate change policy and financing sectors with increased access to highintegrity resources that can further drive conservation and restoration.
Methods
Literature search
A search was conducted on the 24th of October 2021 of the bibliographic databases Web of Science (WoS) and Scopus. The search string used in the systematic review was generated using a list of keywords arising from the project aims. Keywords were organized under the headings of population, comparator, and outcome, a common approach for systematic reviews. Keywords were formed into search strings using the Boolean operators OR between similar terms, and the Boolean operator AND between each major heading (i.e., population,
Table 2 | Potential global carbon emissions from seagrass at risk of loss and associated social cost
Soil stocks at risk ( ha )
Seagrass biomass (Mg ha )
Global seagrass extent (ha)
Global potential emissions ( )
Social cost (Billion 2020 US Dollar)
Lower
4.89
2.00
26,656,200
665
123
Central
5.25
2.01
43,328,100
1,154
213
Upper
5.61
2.02
60,000,000
1,699
314
Central estimate is based on mean of soil and biomass carbon stocks at risk (upper and lower estimates are mean ± SE). For global seagrass extent, the upper estimate is from UNEP-WCMC , the lower estimate is from McKenzie et al. (their lower confidence estimate), and the central estimate is their average. Potential emissions are expressed as Tg (mass of carbon multiplied by 3.67). The social cost of one ton of is .
comparator, and outcome). These terms and search strings were then trialed in WoS and Scopus and selected based on an iterative process of screening search results. After search strings were trialed, search results were compared with a test library to assess search comprehensiveness. The test library contained 20 relevant studies selected by the review team for gauging the accuracy of the search results. Out of the 20 studies from the test library, 18 studies were found in both Scopus and WoS. We therefore concluded that our search string was both sensitive and manageable in returning a relevant number of results.
The final search string, delineated by populations, comparators, and outcomes was Seagrass OR seagrass meadow OR Cymodocea OR eelgrass OR Halodule OR Halophila OR Hydrocharitaceae OR Posidonia OR seagrasses OR submerged aquatic vegetation OR Thalassia OR vegetated coastal ecosystems OR Zosteraceae AND sink OR biomass OR density OR organic soil OR soil OR stock OR stocks OR storage OR accumulation OR balance OR budget OR net ecosystem carbon balance OR net ecosystem exchange OR net ecosystem production OR net primary productivity OR sediment OR sediment OR accretion OR sediment burial OR sequestration OR soil burial OR algae OR alkalinity OR atmospheric exchange OR OR calcification OR calcifying algae OR calcium carbonate OR carbonate cycling OR DIC OR dissolution OR dissolved inorganic carbon OR dissolved organic carbon OR DOC OR emission OR emissions OR epiphytes OR exchange OR flux OR lateral exchange OR particulate organic carbon OR POC OR respiration OR source OR vertical exchange AND Blue carbon OR Greenhouse gas OR GHG OR carbon OR CH4 OR CO2 OR methane OR OR nitrous oxide.
The final search string was last run on December 1st 2024, and resulted in 2071 articles from Scopus and 3764 articles from the WoS database. The review also included the full database developed by Fourqurean et al. to ensure previous carbon stocks studies are included, as well as other databases held by the author group. The resulting library of articles was used to extract data on study site and environmental data, soil properties of soil core intervals, seagrass biology, and carbon stocks in biomass and soils (see database for a complete list of all variables captured). The final version of the database contains information from 415 published articles and 24 unpublished datasets for a total of 19,650 core intervals and 3245 carbon stock estimates (biomass and soil).
Calculating carbon stocks
We calculated carbon stocks from soil core profile data (at minimum , dry bulk density, interval depth, and thickness), where available, and used published values in the absence of downcore data. Carbon stocks were calculated to “standard depths” of , and 100 cm , but only up to the maximum sampling depth without extrapolating. If no downcore data were available and the reported carbon stock referred to a sampling depth other than , or 100 cm , we scaled the reported value linearly to reference depths not exceeding the sampling depth. If calculated from downcore data, the carbon density for each available core interval was calculated,
and all intervals were summed to the reference depths. If core intervals did not represent the entire core depth (e.g., , ), data for the missing intervals were filled via linear interpolation between the next available intervals above and below the missing interval. In cases where the reference depth for stock calculation was within a downcore interval, that interval was scaled linearly to the next reference depth. If no information on core compaction was provided by the original study, it was assumed that no core compaction occurred.
Our database includes 1022 carbon stock estimates to a depth of at least 30 cm . For the analysis presented in this paper, we added a further 1149 data points by predicting stocks from shorter cores (5 to 29 cm ) (Supplementary Fig. S6). We used a subset of data, including only stocks measured to 30 cm , and compared the performance of two predictive models (linear and 2nd order polynomial). We found that both models were equally as accurate and used the following polynomial model to predict 30 cm soil stocks from stocks .
In addition, we predicted stocks from shorter cores in a similar fashion and found that a 2nd order polynomial function more accurately predicted 100 cm cores from 30 cm and 50 cm cores than linear extrapolations. We performed a similar analysis to predict stocks from shorter reference depths , see Supplementary Methods section “Prediction of stocks from short cores” and Supplementary Fig. S7, Supplementary Table S3.
There were 553 carbon stock estimates from the Fourquean et al. database for which dry bulk density data were not available and instead were set to a constant value of . We predicted dry bulk densities for these samples from content by fitting exponential decay functions to all database entries with available content and dry bulk density data. The most accurate predictions were achieved when separate functions were fit for each coastal typology (e.g., Karst, arheic, lagoons, etc.) . See Supplementary Methods section “Prediction of missing dry bulk density values from content”, Supplementary Fig. S8, and Supplementary Table S4 for further details of dry bulk density modeling.
Random forest model of carbon stock drivers
We used random forest modeling to predict seagrass stocks , from metadata categories coastal typology, marine ecoregion, seagrass genus, seagrass species, seagrass functional group, and Article ID. We then assessed variable importance to estimate which metadata category was most predictive of seagrass stocks (Supplementary Fig. S5). Random Forest models and variable importance were implemented in R version 4.3.1 using the package randomForestSRC . Ideal model parameters mtry ( ) and nodesize ( ) were determined using the tune function and the final model run used the parameters ntree , sampling with replacement, block.size , and importance (=permute). Estimated variable importance was extracted using the subsample and extract.subsample functions and plotted using the plot.subsample function.
emissions resulting from seagrass loss
To estimate loss of stocks from seagrass meadow conversion of seagrass habitat to an unvegetated state (i.e., loss), we used the predicted risk of rapid seagrass decline from Turschwell et al. , a geospatial layer consisting of grid cells populated with the modeled probability that seagrasses in a given cell experience rapid decline (loss of over 10 years) from a set of stressors (demersal fishing, water quality, etc.). We extracted this probability value at the locations of 1323 seagrass stock database entries and multiplied the seagrass loss probability with location-specific 30 cm stocks to derive an estimate of stocks at risk. Not all database entries fell within risk grid cells, because the risk layer from Turschwell et al. was calculated on the spatial footprint of a smaller seagrass distribution database . We treated locations where only carbon stocks were available as equal to locations with no data, implicitly assuming that stock data not covered by the risk layer were not different from stock data included in this calculation. We then multiplied seagrass soil stocks at risk of loss by , the current best estimate of stock reduction after 25 years (by 2050) following conversion of seagrass habitat to an unvegetated state, calculated using the empirically derived formula , where is time in years and is percent loss . We then estimated the loss of carbon bound in biomass upon seagrass loss based on the median total biomass estimated from our database , Supplementary Table S1), assuming all biomass is lost. To estimate the total stock at risk globally, we multiplied the product of soil stock at risk of loss and seagrass biomass by our best estimates of total global seagrass area . There is still large uncertainty associated with seagrass area estimates, and we used the average of a minimum of (ref. 42) and a maximum area of (ref. 43). We then converted the mass of carbon lost to , by multiplication with 3.67 , the molecular ratio of to C . In addition, we estimated how much carbon would not be sequestered by the seagrasses that were lost, but did not include this term in our final estimate of emission, because of the considerable uncertainty associated with carbon sequestration rates of bare sediment where seagrass was lost. Instead, we used the estimate of seagrass carbon stock loss without foregone sequestration to determine the social cost of the associated emissions, assuming a social cost of (2020 US dollars) per ton of .
Methodological limitations and future research needs
We acknowledge that our estimates of carbon efflux due to erosion of soil stocks and seagrass biomass are unlikely to equal air-sea flux, because not all entering the water column will be converted to and outgas to the atmosphere. There is currently insufficient data on fractions and depth-distribution of non-reactive in seagrass soils, as well as potential redistribution and subsequent re-burial of eroded . Additionally, considerable uncertainty in our estimations arises from the large range of possible global seagrass extent , highlighting the need for improved global extent mapping . Although we found differences in stocks of seagrass functional groups and genera, we could not incorporate specific stocks into our emissions calculation, because they are currently not resolved in global seagrass extent estimates. In addition, a methodological limitation in seagrass blue carbon research is the common practice to assess in seagrass soils without removing seagrass below-ground material, which could potentially lead to double-counting if such material is included in both below-ground biomass and soil estimates.
All R code necessary to reproduce the analysis is made available as Supplementary Software 1 to this article.
References
Rosentreter, J. A. et al. Coastal vegetation and estuaries are collectively a greenhouse gas sink. Nat. Clim. Change 13, 579-587 (2023).
Poulter, B. et al. In Geophysical Monograph Series. (eds. Krauss, K. W., Zhu, Z. & Stagg, C. L.) 1-20 (Wiley, 2021).
Duarte, C. M., Middelburg, J. J. & Caraco, N. Major role of marine vegetation on the oceanic carbon cycle. Biogeosci. Discuss. 1, 659-679 (2004).
Leavitt, S. M. et al. Natural Climate Solutions Handbook: A Technical Guide for Assessing NatureBased Mitigation Opportunities in Countries. 135 (The Nature Conservancy, Arlington, VA, USA, 2021).
Fourqurean, J. W. et al. Seagrass ecosystems as a globally significant carbon stock. Nat. Geosci. 5, 505-509 (2012).
Pendleton, L. et al. Estimating global “Blue Carbon” emissions from conversion and degradation of vegetated coastal ecosystems. PLoS ONE 7, e43542 (2012).
Lovelock, C. E., Fourqurean, J. W. & Morris, J. T. Modeled CO2 emissions from coastal wetland transitions to other land uses: tidal marshes, mangrove forests, and seagrass beds. Front. Mar. Sci. 4, 143 (2017).
Duarte, C. M., Losada, I. J., Hendriks, I. E., Mazarrasa, I. & Marbà, N. The role of coastal plant communities for climate change mitigation and adaptation. Nat. Clim. Change 3, 961-968 (2013).
Friess, D. A., Howard, J., Huxham, M., Macreadie, P. I. & Ross, F. Capitalizing on the global financial interest in blue carbon. PLoS Clim. 1, e0000061 (2022).
Hoegh-Guldberg, O., Northrop, E. & Lubchenco, J. The ocean is key to achieving climate and societal goals. Science 365, 1372-1374 (2019).
Friess, D. A. The potential for mangrove and seagrass blue carbon in Small Island States. Curr. Opin. Environ. Sustain. 64, 101324 (2023).
Needelman, B. A. et al. The science and policy of the verified carbon standard methodology for tidal wetland and seagrass restoration. Estuar. Coasts 41, 2159-2171 (2018).
Lovelock, C. E. et al. Modeled approaches to estimating blue carbon accumulation with mangrove restoration to support a blue carbon accounting method for Australia. Limnol. Oceanogr. 67, S50-S60 (2022).
Belshe, E. F., Mateo, M. A., Gillis, L., Zimmer, M. & Teichberg, M. Muddy Waters: Unintentional Consequences of Blue Carbon Research Obscure Our Understanding of Organic Carbon Dynamics in Seagrass Ecosystems. Front. Marine Sci. 4, 00125 (2017).
Mazarrasa, I. et al. Habitat characteristics provide insights of carbon storage in seagrass meadows. Mar. Pollut. Bull. 134, 106-117 (2018).
Kennedy, H. et al. Species traits and geomorphic setting as drivers of global soil carbon stocks in seagrass meadows. Glob. Biogeochem. Cycles. 36, e2022GB007481 (2022).
Fourqurean, J. W. et al. Seagrass abundance predicts surficial soil organic carbon stocks across the range of thalassia testudinum in the Western North Atlantic. Estuar. Coasts. https://doi.org/10.1007/ s12237-023-01210-0 (2023).
Serrano, O. et al. Can mud (silt and clay) concentration be used to predict soil organic carbon content within seagrass ecosystems? Biogeosciences 13, 4915-4926 (2016).
Röhr, M. E. et al. Blue Carbon Storage Capacity of Temperate Eelgrass (Zostera marina) Meadows. Glob. Biogeochem. Cycles 32, 1457-1475 (2018).
Dahl, M. et al. The influence of hydrodynamic exposure on carbon storage and nutrient retention in eelgrass (Zostera marina L.) meadows on the Swedish Skagerrak coast. Sci. Rep. 10, 13666 (2020).
Oreska, M. P. J., McGlathery, K. J., Porter, J. H., Bost, M. & McKee, B. A. Seagrass blue carbon accumulation at the meadow-scale. PLoS ONE 12, 1-18 (2017).
Oreska, M. P. J. et al. The greenhouse gas offset potential from seagrass restoration. Sci. Rep. 10, 1-15 (2020).
Stankovic, M. et al. Quantification of blue carbon in seagrass ecosystems of Southeast Asia and their potential for climate change mitigation. Sci. Total Environ. 783, 146858 (2021).
Macreadie, P. I. et al. The future of Blue Carbon science. Nat. Commun. 10, 3998 (2019).
IPCC. Methodological Guidance on Lands with Wet and Drained Soilds, and Constructed Wetlands for Wastewater Treatment. 2013 Supplement to the 2006 IPCC Guidelines for National Greenhouse Gas Inventories: Wetlands. 1-55. http://www.ipcc-nggip.iges.or.jp (2014).
Duarte, C. M. & Chiscano, C. L. Seagrass biomass and production: a reassessment. Aquat. Bot. 65, 159-174 (1999).
Strydom, S. et al. Global dataset on seagrass meadow structure, biomass and production. Earth Syst. Sci. Data. 15, 511-519 (2023).
Kilminster, K. et al. Unravelling complexity in seagrass systems for management: Australia as a microcosm. Sci. Total Environ. 534, 97-109 (2015).
Tanaya, T. et al. Contributions of the direct supply of belowground seagrass detritus and trapping of suspended organic matter to the sedimentary organic carbon stock in seagrass meadows. Biogeosciences 15, 4033-4045 (2018).
Hendriks, I. E., Sintes, T., Bouma, T. J. & Duarte, C. M. Experimental assessment and modeling evaluation of the effects of the seagrass Posidonia oceanica on flow and particle trapping. Mar. Ecol. Prog. Ser. 356, 163-173 (2008).
Reidenbach, M. A. & Thomas, E. L. Influence of the seagrass, Zostera marina, on wave attenuation and bed shear stress within a shallow coastal bay. Front. Mar. Sci. 5, 397 (2018).
Terrados, J. & Duarte, C. M. Experimental evidence of reduced particle resuspension within a seagrass (Posidonia oceanica L.) meadow. J. Exp. Mar. Biol. Ecol. 243, 45-53 (2000).
Hendriks, I. E., Bouma, T. J., Morris, E. P. & Duarte, C. M. Effects of seagrasses and algae of the Caulerpa family on hydrodynamics and particle-trapping rates. Mar. Biol. 157, 473-481(2010).
Wesselmann, M. et al. Seagrass (Halophila stipulacea) invasion enhances carbon sequestration in the Mediterranean Sea. Glob. Change Biol. 27, 2592-2607 (2021).
Chen, G. et al. Mangroves as a major source of soil carbon storage in adjacent seagrass meadows. Sci. Rep. 7, 42406 (2017).
Dürr, H. H. et al. Worldwide typology of nearshore coastal systems: defining the estuarine filter of river inputs to the oceans. Estuar. Coasts 14, 441-458 (2011).
Twilley, R. R., Rovai, A. S. & Riul, P. Coastal morphology explains global blue carbon distributions. Front. Ecol. Environ. 16, 503-508 (2018).
Macreadie, P. I. et al. Carbon sequestration by Australian tidal marshes. Sci. Rep. 7, 44071 (2017).
Turschwell, M. P. et al. Anthropogenic pressures and life history predict trajectories of seagrass meadow extent at a global scale. Proc. Natl Acad. Sci. USA 118, e2110802118 (2021).
Dahl, M. et al. Ranking the risk of CO 2 emissions from seagrass soil carbon stocks under global change threats. Glob. Environ. Change 78, 102632 (2023).
McKenzie, L. J. et al. The global distribution of seagrass meadows. Environ. Res. Lett. 15, 074041 (2020).
UNEP-WCMC & Short, F. Global Distribution of Seagrasses (Version 7.1). Seventh Update to the Data Layer Used in Green and Short (2003). https://doi.org/10.34892/x6r3-d211 (2021).
Rennert, K. et al. Comprehensive evidence implies a higher social cost of CO2. Nature 610, 687-692 (2022).
Johannessen, S. C. & Macdonald, R. W. Geoengineering with seagrasses: is credit due where credit is given? Environ. Res. Lett. 11, 113001 (2016).
Williamson, P. & Gattuso, J.-P. Carbon removal using coastal blue carbon ecosystems is uncertain and unreliable, with questionable climatic cost-effectiveness. Front. Clim. 4, 853666 (2022).
Howard, J. et al. Clarifying the role of coastal and marine systems in climate mitigation. Front Ecol. Environ. 15, 42-50 (2017).
Dunic, J. C., Brown, C. J., Connolly, R. M., Turschwell, M. P. & Côté, I. M. Long-term declines and recovery of meadow area across the world’s seagrass bioregions. Glob. Change Biol. 27, 4096-4109 (2021).
De Borger, E., Tiano, J., Braeckman, U., Rijnsdorp, A. D. & Soetaert, K. Impact of bottom trawling on sediment biogeochemistry: a modelling approach. Biogeosciences 18, 2539-2557 (2021).
Morys, C., Brüchert, V. & Bradshaw, C. Impacts of bottom trawling on benthic biogeochemistry in muddy sediments: removal of surface sediment using an experimental field study. Mar. Environ. Res. 169, 105384 (2021).
Van Dam, B. R. et al. Calcification-driven CO2 emissions exceed “Blue Carbon” sequestration in a carbonate seagrass meadow. Sci. Adv. 7, 51 (2021).
Fakhraee, M., Planavsky, N. J. & Reinhard, C. T. Ocean alkalinity enhancement through restoration of blue carbon ecosystems. Nat. Sustain. https://doi.org/10.1038/s41893-023-01128-2 (2023).
R Core Team. R: A Language and Environment for Statistical Computing. 2, 1-12 (R Core Team, 2024).
Ishwaran, H. & Kogalur, U. B. Fast Unified Random Forests for Survival, Regression, and Classification (RF-SRC). https://cran.r-project. org/package=randomForestSRC (2023).
Spalding, M. D. et al. Marine ecoregions of the world: a bioregionalization of coastal and shelf areas. BioScience 57, 573-583 (2007).
Dunn, O. J. Multiple comparisons using rank sums. Technometrics 6, 241-252 (1964).
Sullivan, B. K. & Short, F. T. Taxonomic revisions in Zosteraceae (Zostera, Nanozostera, Heterozostera and Phyllospadix). Aquat. Bot. 187, 103636 (2023).
Acknowledgements
This work is a product of the International Blue Carbon Initiative, coordinated by Conservation International, IOC-UNESCO, and IUCN. MAC3 Impact Philanthropies generously funded this research through Conservation International. In addition, J.R.K. and J.W.F. developed this paper in collaboration with the Florida Coastal Everglades Long-Term Ecological Research Program, National Science Foundation Grant No. DEB-2025954. A.A.-O. acknowledges support from MCIN/AEI RYC2021-034455-I. K.J.M. acknowledges support from the National Science Foundation grant DEB-1832221 to the Virginia Coast Reserve Long Term Ecological Research Project. O.S. acknowledges support from the MEDCHANGE project funded by AEI. N.M. acknowledges support from the project OBAMA-NEXT (EU under the Horizon Europe program, grant agreement no. 101081642) and the Spanish Government through the “Maria de Maeztu Centre of Excellence” accreditation to IMEDEA (CSIC-UIB) (CEX2021-001198). This is publication number 1855 from the Coastlines and Oceans Division of the Institute of Environment at Florida International University.
Author contributions
All authors conceived of the paper and contributed extensively to the work. J.R.K. wrote the initial draft and performed formal analysis. C.C. performed the initial literature search and designed the initial database. J.R.K., C.C., M.D., K.E.L., M.P.J.O., L.W.W., and J.W.F. performed data extraction. C.C., A.A.O., M.C.J., S.C., M.D., D.F., H.K., C.E.L., N.M., K.J.M., M.P.J.O., E.P., O.S., M.A.V., S.M.Y., and J.W.F. critically reviewed and contributed to several drafts of the manuscript.
Competing interests
The authors declare no competing interests.
Additional information
Supplementary information The online version contains
Correspondence and requests for materials should be addressed to Johannes R. Krause.
Peer review information Nature Communications thanks the anonymous reviewers for their contribution to the peer review of this work. A peer review file is available.
Publisher’s note Springer Nature remains neutral with regard to jurisdictional claims in published maps and institutional affiliations.
Open Access This article is licensed under a Creative Commons Attribution-NonCommercial-NoDerivatives 4.0 International License, which permits any non-commercial use, sharing, distribution and reproduction in any medium or format, as long as you give appropriate credit to the original author(s) and the source, provide a link to the Creative Commons licence, and indicate if you modified the licensed material. You do not have permission under this licence to share adapted material derived from this article or parts of it. The images or other third party material in this article are included in the article’s Creative Commons licence, unless indicated otherwise in a credit line to the material. If material is not included in the article’s Creative Commons licence and your intended use is not permitted by statutory regulation or exceeds the permitted use, you will need to obtain permission directly from the copyright holder. To view a copy of this licence, visit http:// creativecommons.org/licenses/by-nc-nd/4.0/.
(c) The Author(s) 2025
¹Institute of Environment, Coastlines and Oceans Division, Florida International University, Miami, FL, USA. ²School of Environment, University of Queensland, St Lucia, QLD, Australia. Departament de Física, Universitat Autònoma de Barcelona, Barcelona, Spain. Smithsonian Environmental Research Center, Edgewater, MD, USA. Centro Agronómico Tropical de Investigación y Enseñanza, Turrialba, Costa Rica. Silvestrum Climate Associates, Sausalito, CA, USA. School of Natural Sciences, Technology and Environmental Studies, Södertörn University, Huddinge, Sweden. Department of Earth and Environmental Sciences, Tulane University, New Orleans, LA, USA. School of Ocean Sciences, Bangor University, Bangor, North Wales, UK. National University of Singapore, Singapore, Singapore. Global Change Research Group, Institut Mediterrani d’Estudis Avançats (CSIC-UIB), Esporles, Spain. Department of Environmental Sciences, University of Virginia, Charlottesville, VA, USA. Conservation International, Arlington, VA, USA. Centro de Estudios Avanzados de Blanes Consejo Superior de Investigaciones Científicas (CEAB-CSIC), Blanes, Spain. CSIRO Environment, Indian Ocean Marine Research Centre, Crawley, WA, Australia. International Blue Carbon Institute, Conservation International, Singapore, Singapore. Department of Biological Sciences, Florida International University, Miami, FL, USA. e-mail: jkrause@fiu.edu