تشمل الخلايا التغصنية التقليدية (cDCs) مجموعات متنوعة من حيث الوظيفة والظاهرة، مثل cDC 1 و cDC 2. وقد تم تقسيم المجموعة الأخيرة بشكل مختلف إلى cDC2 المعتمدة على Notch و cDC2 المعتمدة على KLF4 و T-bet.cDC2As و T-betcDC2Bs، لكن من غير الواضح كيف ترتبط جميع هذه الأنماط الفرعية وما هي الدرجة التي تمثل بها حالات الخلايا أو مجموعات الخلايا. جميع cDCs مشتقة من سلالات نخاع العظام المعروفة باسم pre-cDCs، التي تتجول عبر الدم لتستعمر الأنسجة المحيطية. هنا، حددنا أنماط فرعية متميزة من الفئران pre-cDC2 تميل إلى إنتاج cDC2As أو cDC2Bs. أظهرنا أن Siglec-سكان ما قبل cDC2A في نخاع العظام أعطوا بشكل تفضيلي نشأة Siglec-pre-cDC2As في الأنسجة، التي تمايزت إلى T-betcDC2As. على النقيض، سيجلك-نسبة الخلايا الجذعية المبدئية في نخاع العظام والمحيط التي تولد في الغالب خلايا T-bet cDC2Bs، وهو سلالة تتميز بتعبير LysM. أظهرت نتائجنا أن تحديد مصير cDC2A مقابل cDC2B يبدأ في نخاع العظام وتقترح أن مجموعات cDC2 هي سلالات محددة تطورياً، بدلاً من أن تكون حالات خلوية مفروضة بواسطة بيئة الأنسجة المحيطية.
تتكون الخلايا الشجرية التقليدية (cDCs) من مجموعتين رئيسيتين، تعرفان باسم CDC1s و cDC2s.. إكس سي آر 1cDC1s تعتمد على BATF3ومطلوب لتحفيز استجابات الخلايا التائية السامة ضد العديد من المستضدات الورمية والفيروسية. غالبًا ما تعبر cDC2s عن CD11b و CD172 (SIRP )، وتعتمد قدرتها على التمايز أو الهجرة على IRF4 (المراجع 1،2). تشير الأدلة المتزايدة إلى أن CDC2s مطلوبة للتفعيل الفعال للذراع المساعدة لاستجابات خلايا T . ومع ذلك، فإن cDC 2 أكثر تنوعًا منمجموعتان فرعيتان من الفئرانتم تعريفها في البداية بناءً على المتطلبات التفاضلية لـ Notch2 أو KLF4 لتمايزهاتُوسم cDC2s المعتمدة على Notch2 في فئران Gpr4 المبلغ عنها، يتم التعبير عن CD4 وCLEC4A4 وجزيء الالتصاق الانتقائي للخلايا البطانية (Esam) في الطحال وCD103 في الأمعاء.تعبّر خلايا cDC2 المستقلة عن Notch2 عن CLEC12A وتُوسم في فئران التقارير Cx3cr1 وCcr2 وفي فئران تتبع مصير Lyz2.الخلايا المناعية المستقلة عن KLF4 هي CD172ويعبرون بشكل متغير عن CD24 أو PD-L2 أو MGL-2، اعتمادًا على النسيج.
مؤخراً، T-betو T-betتم العثور على cDC2s في طحال فئران تقرير T-bet وأطلق عليهما اسم cDC2As و cDC2Bs، على التوالي.تي-بيتتشمل cDC2As Esam المعتمد على Notch2cDC2s. كانت مجموعة cDC2B الأصلية تتضمن نسبة صغيرة من الخلايا المميزة بـ
تخطيط مصير RORүt، والذي تم إظهاره لاحقًا على أنه يشكل نوعًا متميزًا من الخلايا اللمفاوية بدلاً من كونه في دراسة أخرى، تم اقتراح أن cDC2s المعتمدة على KLF4 تت correspond إلى cDC2Bs.أخيرًا، يمكن أن تؤدي العدوى أو السرطان إلى ظهور خلايا تُسمى ‘cDC2s الالتهابية’ و’خلايا دندريتية ناضجة غنية بالجزيئات التنظيمية’، على التوالي.. وبالتالي، في الوقت الحاضر، تشمل خلايا cDC2 في الفئران بشكل متغير خلايا cDC2A، وcDC2B، وخلايا cDC2 المعتمدة على Notch، وخلايا cDC2 المعتمدة على KLF4، وخلايا cDC2 الالتهابية، وخلايا دندريتية ناضجة غنية بالجزيئات التنظيمية. قد تتداخل بعض هذه الفئات الفرعية أو تتوافق مع حالات تطوير أو تنشيط مختلفة من نفس سلالة DC، بينما قد تمثل أخرى مجموعات فرعية متميزة من CDC2. بالإضافة إلى ذلك، تم تحديد مجموعة أخرى، تُسمى بشكل متغير خلايا DC الانتقالية (tDCs)، وخلايا DC AXL+، وخلايا DC AS أو خلايا DC الشبيهة بالبلازما في البشر والفئران.. يُقترح أن تكون خلايا tDCs ذات أصل لمفاوي، وتشير الأعمال الحديثة إلى أنها جزء من سلالة خلايا DC البلازمية، على الرغم من أنها يمكن أن تتمايز إلى خلايا تشبه cDC2As..
أحد الأساليب لفك تعقيد هذه المسألة هو دراسة نشوء خلايا الدندريتية التقليدية. عمر خلايا الدندريتية التقليدية في الأنسجة قصير.أيام بحيث يحتاج شبكة أنسجة الخلايا التغذوية القليلة (cDC) إلى التجديد المستمر من سلفها في نخاع العظام. يعتبر السلف التقليدي أو الشائع للخلايا التغذوية (CDP) هو أول خلية في نخاع العظام ذات إمكانيات محددة للخلايا التغذوية.. هذه CDPs تؤدي إلى ظهور pre-cDCs، التي تغادر نخاع العظام عبر الدم لتوزيعها على جميع الأنسجة وتوليد cDC1s و cDC2s المتمايزة نهائيًا.تبدأ التخصص نحو سلالة cDC1 أو cDC2 بالفعل في مرحلة CDP وتنتج خلايا ما قبل cDC1s وpre-cDC2s.. الرأي السائد هو أن الأخيرة تتنوع بعد ذلك من خلال اكتساب سمات ظاهرة أو وظيفية مميزة في بيئات الأنسجة المختلفة أو تحت ظروف التهابية مختلفة.تماشيًا مع هذه الفكرة، يدعم حمض الريتينويك تمايز خلايا CDC2 المعتمدة على Notch2 في الأمعاء والطحال.; نوع 3 من خلايا اللمفويات الفطرية (ILC3s) في الطحال تعزز تمايز cDC2As من خلال إنتاج اللمفوتوكسين. ومع ذلك، من الممكن أن يحدث تحديد تنوع cDC2 على مستوى ما قبل cDC في نخاع العظام وأن الإشارات في الأنسجة تكون مسموحة بدلاً من أن تكون تعليمية.
في هذه الدراسة، استخدمنا تعريفًا ثنائيًا لـ cDC2s، حيث قمنا بتقسيمها، كما هو مقترح، إلى T-betcDC2As و T-betcDC2Bs. أظهرنا أن cDC2As و cDC2Bs في الفئران في حالة الاستقرار تشمل ظاهريًا الفئات الفرعية المعتمدة على Notch و KLF4 التي تم وصفها سابقًا. ومن الجدير بالذكر أننا وجدنا أن pre-cDC2s في نخاع العظام يمكن تقسيمها بالفعل إلى نوعين فرعيين يفضلان إنتاج cDC2As أو cDC2Bs. إن تحديد تجمعات pre-cDC2A و pre-cDC2B المنحازة في نخاع العظام لدى الفئران والبشر يدعم الفكرة القائلة بأن cDC2As و cDC2Bs تمثل سلالات أنطوجينية متميزة.
النتائج
تتوافق خلايا cDC2 المعتمدة على Notch2 والمعتمدة على KLF4 مع cDC2A و cDC2B
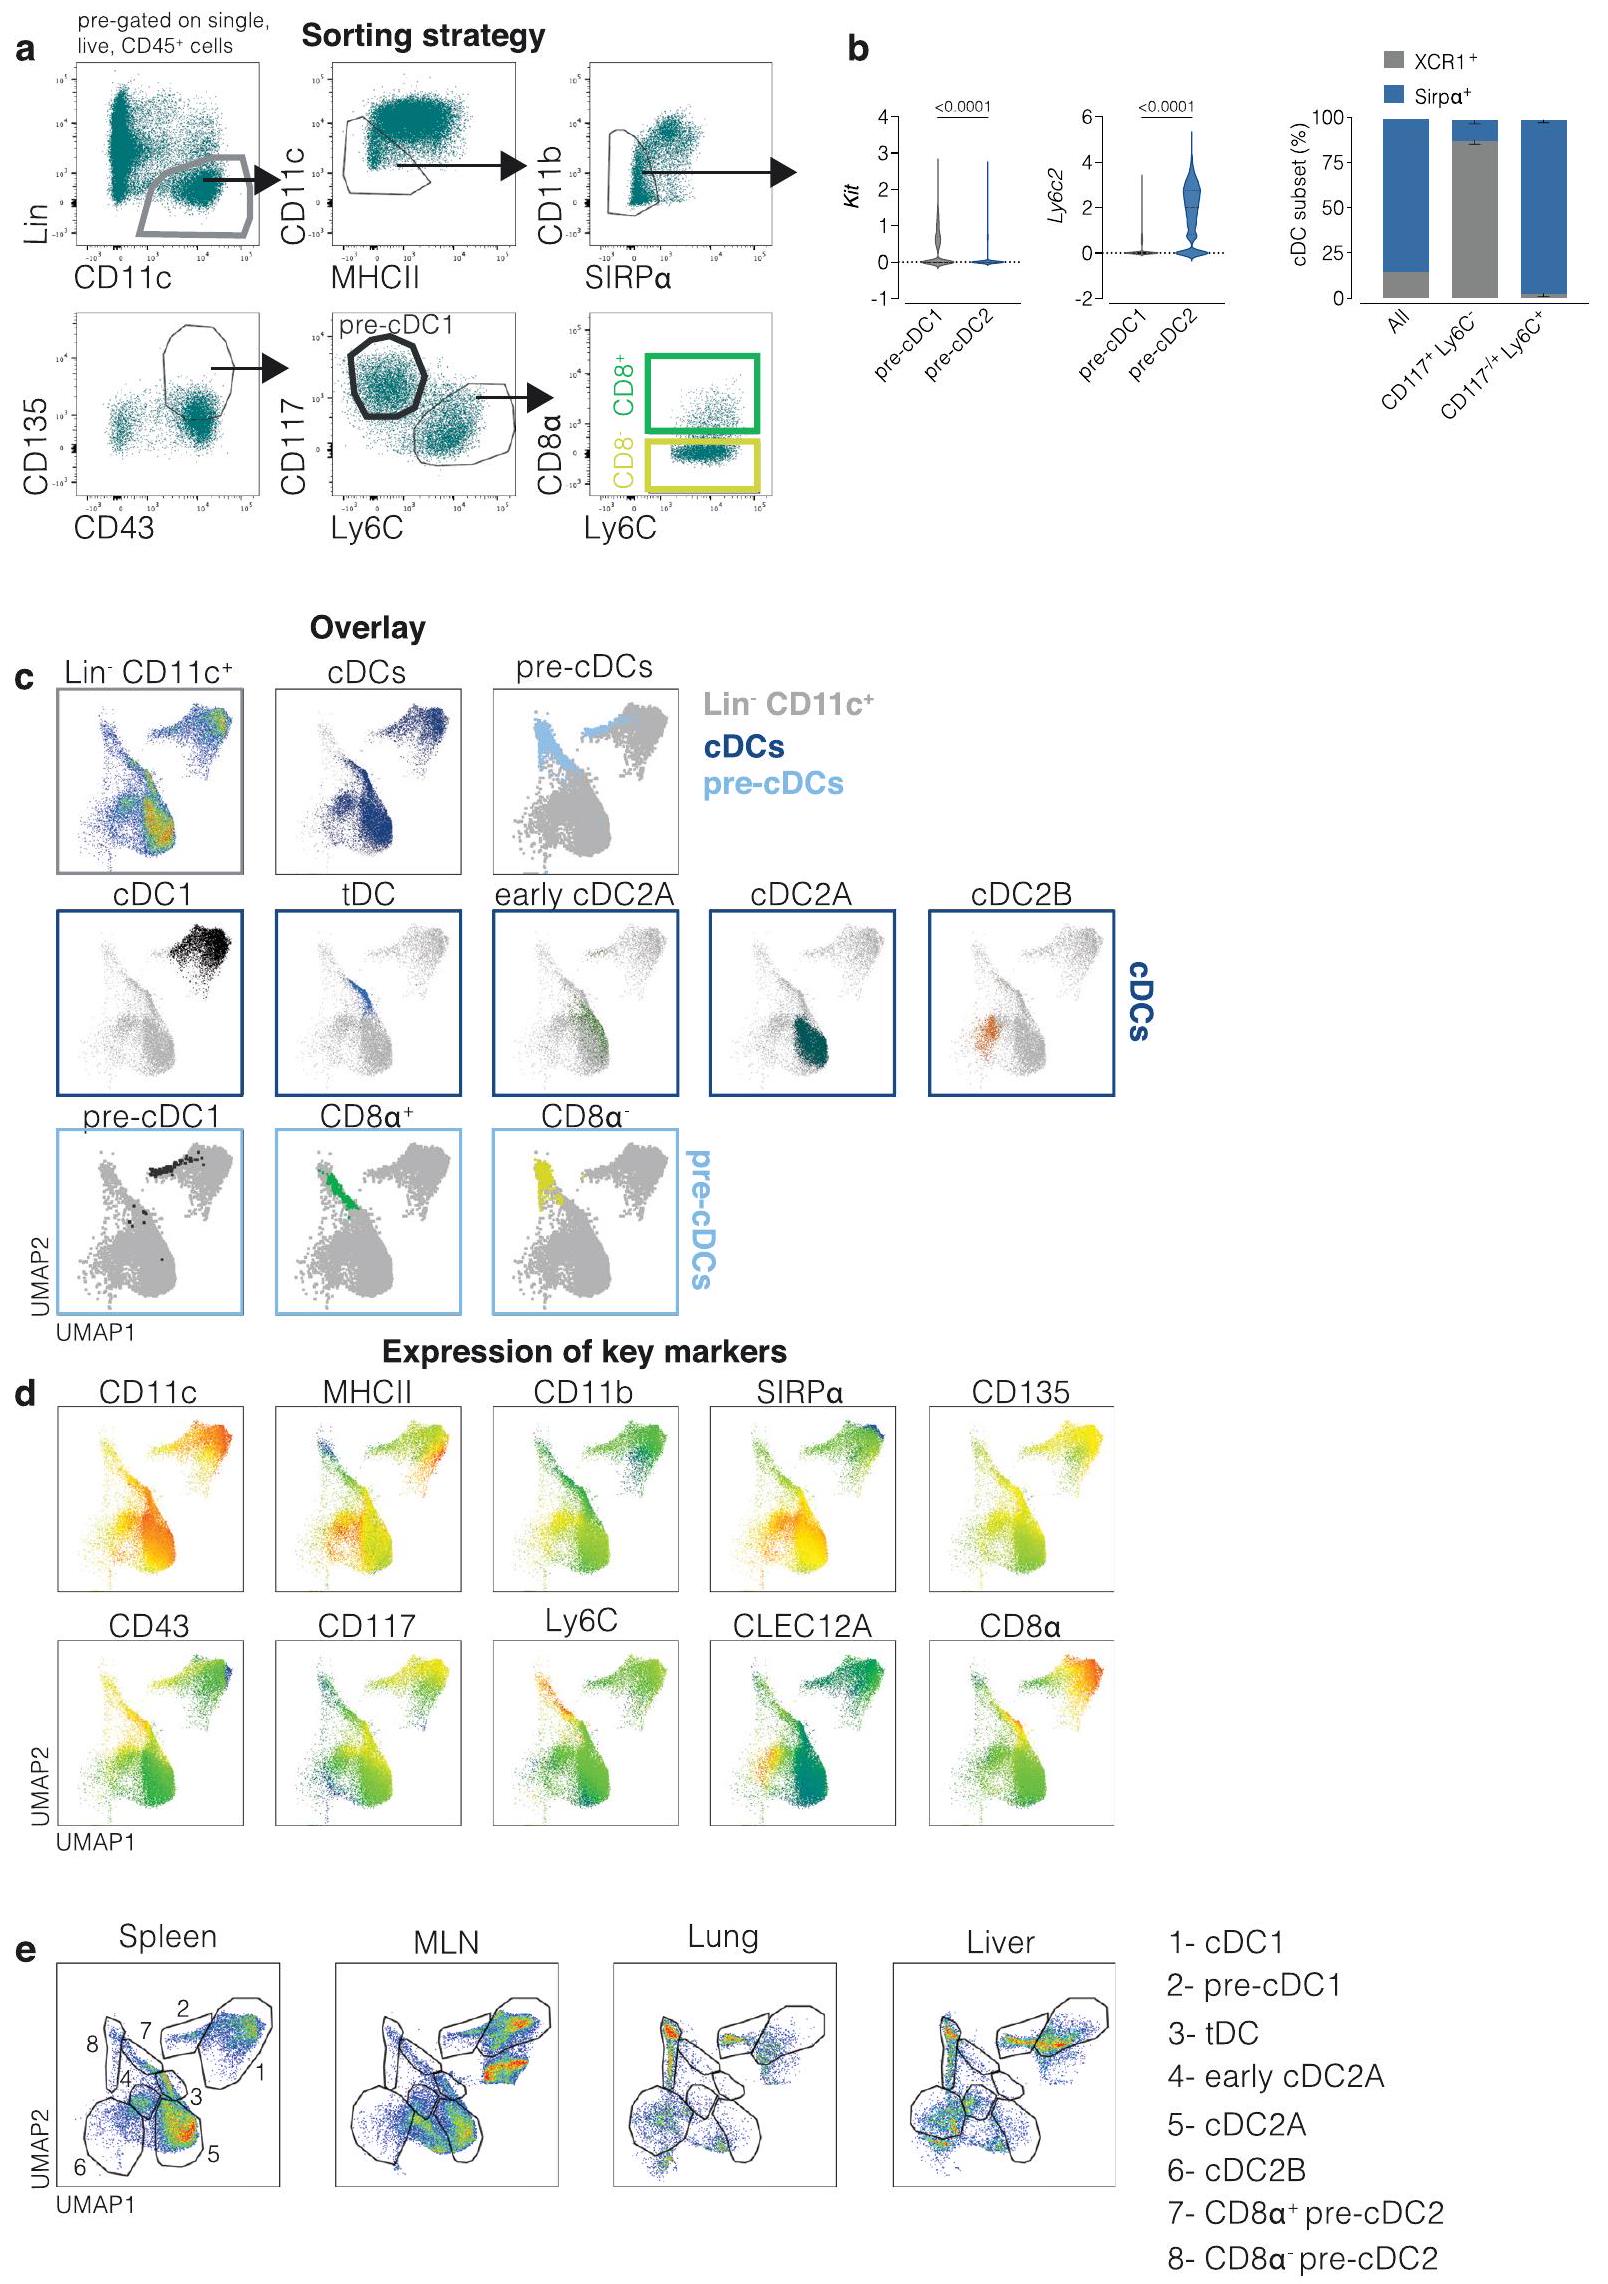
قمنا بتحديد النمط الظاهري للخلايا التغصنية القليلة (cDCs) من الفئران التي يتم فيها الإبلاغ عن تعبير T-bet بواسطة ZsGreen (والتي سنشير إليها لاحقًا بفئران T-bet-ZsGreen).قمنا بتعريف cDCs على أنها Lin (CD3، Ly6G، Siglec-F، B220، CD19، Ly6D، NK1.1 و Ter119) CD64CD11cمعقد التوافق النسيجي الكبير (MHC) الفئة الثانية، و cDC 1 و CDC 2 كـوعلى التوالي.تم تحديد خلايا tDCs داخل بوابة cDC2 على أنها CD8خلايا (الشكل البياني الموسع 1a,b). لتحديد تجمعات cDC2 التي تم التعرف عليها سابقًا، استخدمنا Esam لتحديد cDC2s المعتمدة على Notch.CD24 و MGL-2، ligand2 لموت الخلايا المبرمج 1 (PD-L2) لـ cDC2s المعتمدة على KLF4ت-بيت-زدزجرين لـ cDC2Asو CLEC12A لـ cDC2Bs.
بدأنا بتقسيم cDC2s إلى ZsGreenو ZsGreen (الشكل البياني للبيانات الموسعة 1a). وقد كشف ذلك عن تداخل ملحوظ بين تعبير Esam و T-bet-ZsGreen في جميع الأنسجة التي تم تحليلها (الطحال، العقد اللمفية المساريقية (MLN)، الرئة والكبد؛ الشكل 1a). في المقابل، T-bet-ZsGreenأظهرت خلايا cDC2Bs تعبيرًا تفضيليًا عن CLEC12A وتعبيرًا متغيرًا عن CD24 وMGL-2 وPD-L2 (الشكل 1a).
وبالتالي، باستخدام تحليل العلامات، T-bet-ZsGreenتضمنت cDC2As خلايا cDC2 المعتمدة على Notch2 بينما كانت T-bet-ZsGreencDC2Bs تتوافق مع cDC2s المعتمدة على KLF4تحليل تقليل الأبعاد باستخدام تقنيات تقريب وتوقع المانيفولد الموحد (UMAP) باستخدام جميع العلامات باستثناء T-bet-ZsGreen لدفع فصل المجموعات، جنبًا إلى جنب مع تسلسل RNA الشامل (RNA-seq)، أشار إلى أن Esam وCLEC12A يحددان بدقة cDC2As وcDC2Bs، على التوالي، بشكل مستقل عن وسم T-bet-ZsGreen (الشكل 1ب، البيانات الموسعة الأشكال 1ب-د و2أ، والجدول التكميلي 1). وجدنا مجموعة صغيرة نسبيًا من tDCs (المجموعة 4) التي كانت CD8.CD11b(الشكل 1ب والشكل البياني الموسع 2ب) و CD8العنقود الذي انفصل عن خلايا tDCs (العنقود 3) (الشكل 1ب والشكل البياني الممتد 2ب).
لتنقيح تحديد cDC2A و cDC2B، استخدمنا Clec9a روزا26 ريبج فئران (C9a ) التي تفتقر إلى إشارات نوتش في سلالة cDC وقارنتها بـ Clec9a روزا26 التحكمات (C9aتم تقليل عدد cDC2As، ولكن ليس cDC2Bs (كما هو محدد بواسطة مجموعات UMAP)، في C9aالفئران في جميع الأعضاء التي تم تحليلها (الشكل 1ج). C9أظهرت الفئران أيضًا زيادة في المجموعة 3 (CD8CD117عصام عبر جميع الأنسجة (الشكل 1c والشكل الإضافي 2b)، مما يشير إلى أن هذه الخلايا كانت سلفًا مباشرًا لـ cDC2As التي تم إيقاف تمايزها النهائي في غياب إشارات Notch (من هنا فصاعدًا cDC2As المبكرة) . CD8 تم العثور على tDCs فقط في الطحال والعقد اللمفية المساريقية ولكن لم تنخفض فيالفئران (الشكل 1 ج والشكل الإضافي 2 ج). جنبًا إلى جنب مع التقارير التي تظهر أن cDC2Bs، ولكن ليس cDC2As، تعتمد على KLF4تشير بياناتنا إلى أن التباين العام في cDC2s يمكن تقليصه إلى نوعين رئيسيين يعتمد كل منهما على Notch وT-bet.فروع cDC2A و cDC2B المستقلة عن Notch وحالات التمايز على طولها.
تحديد تنوع cDC2 على مستوى ما قبل cDC2 باستخدام تسلسل RNA أحادي الخلية
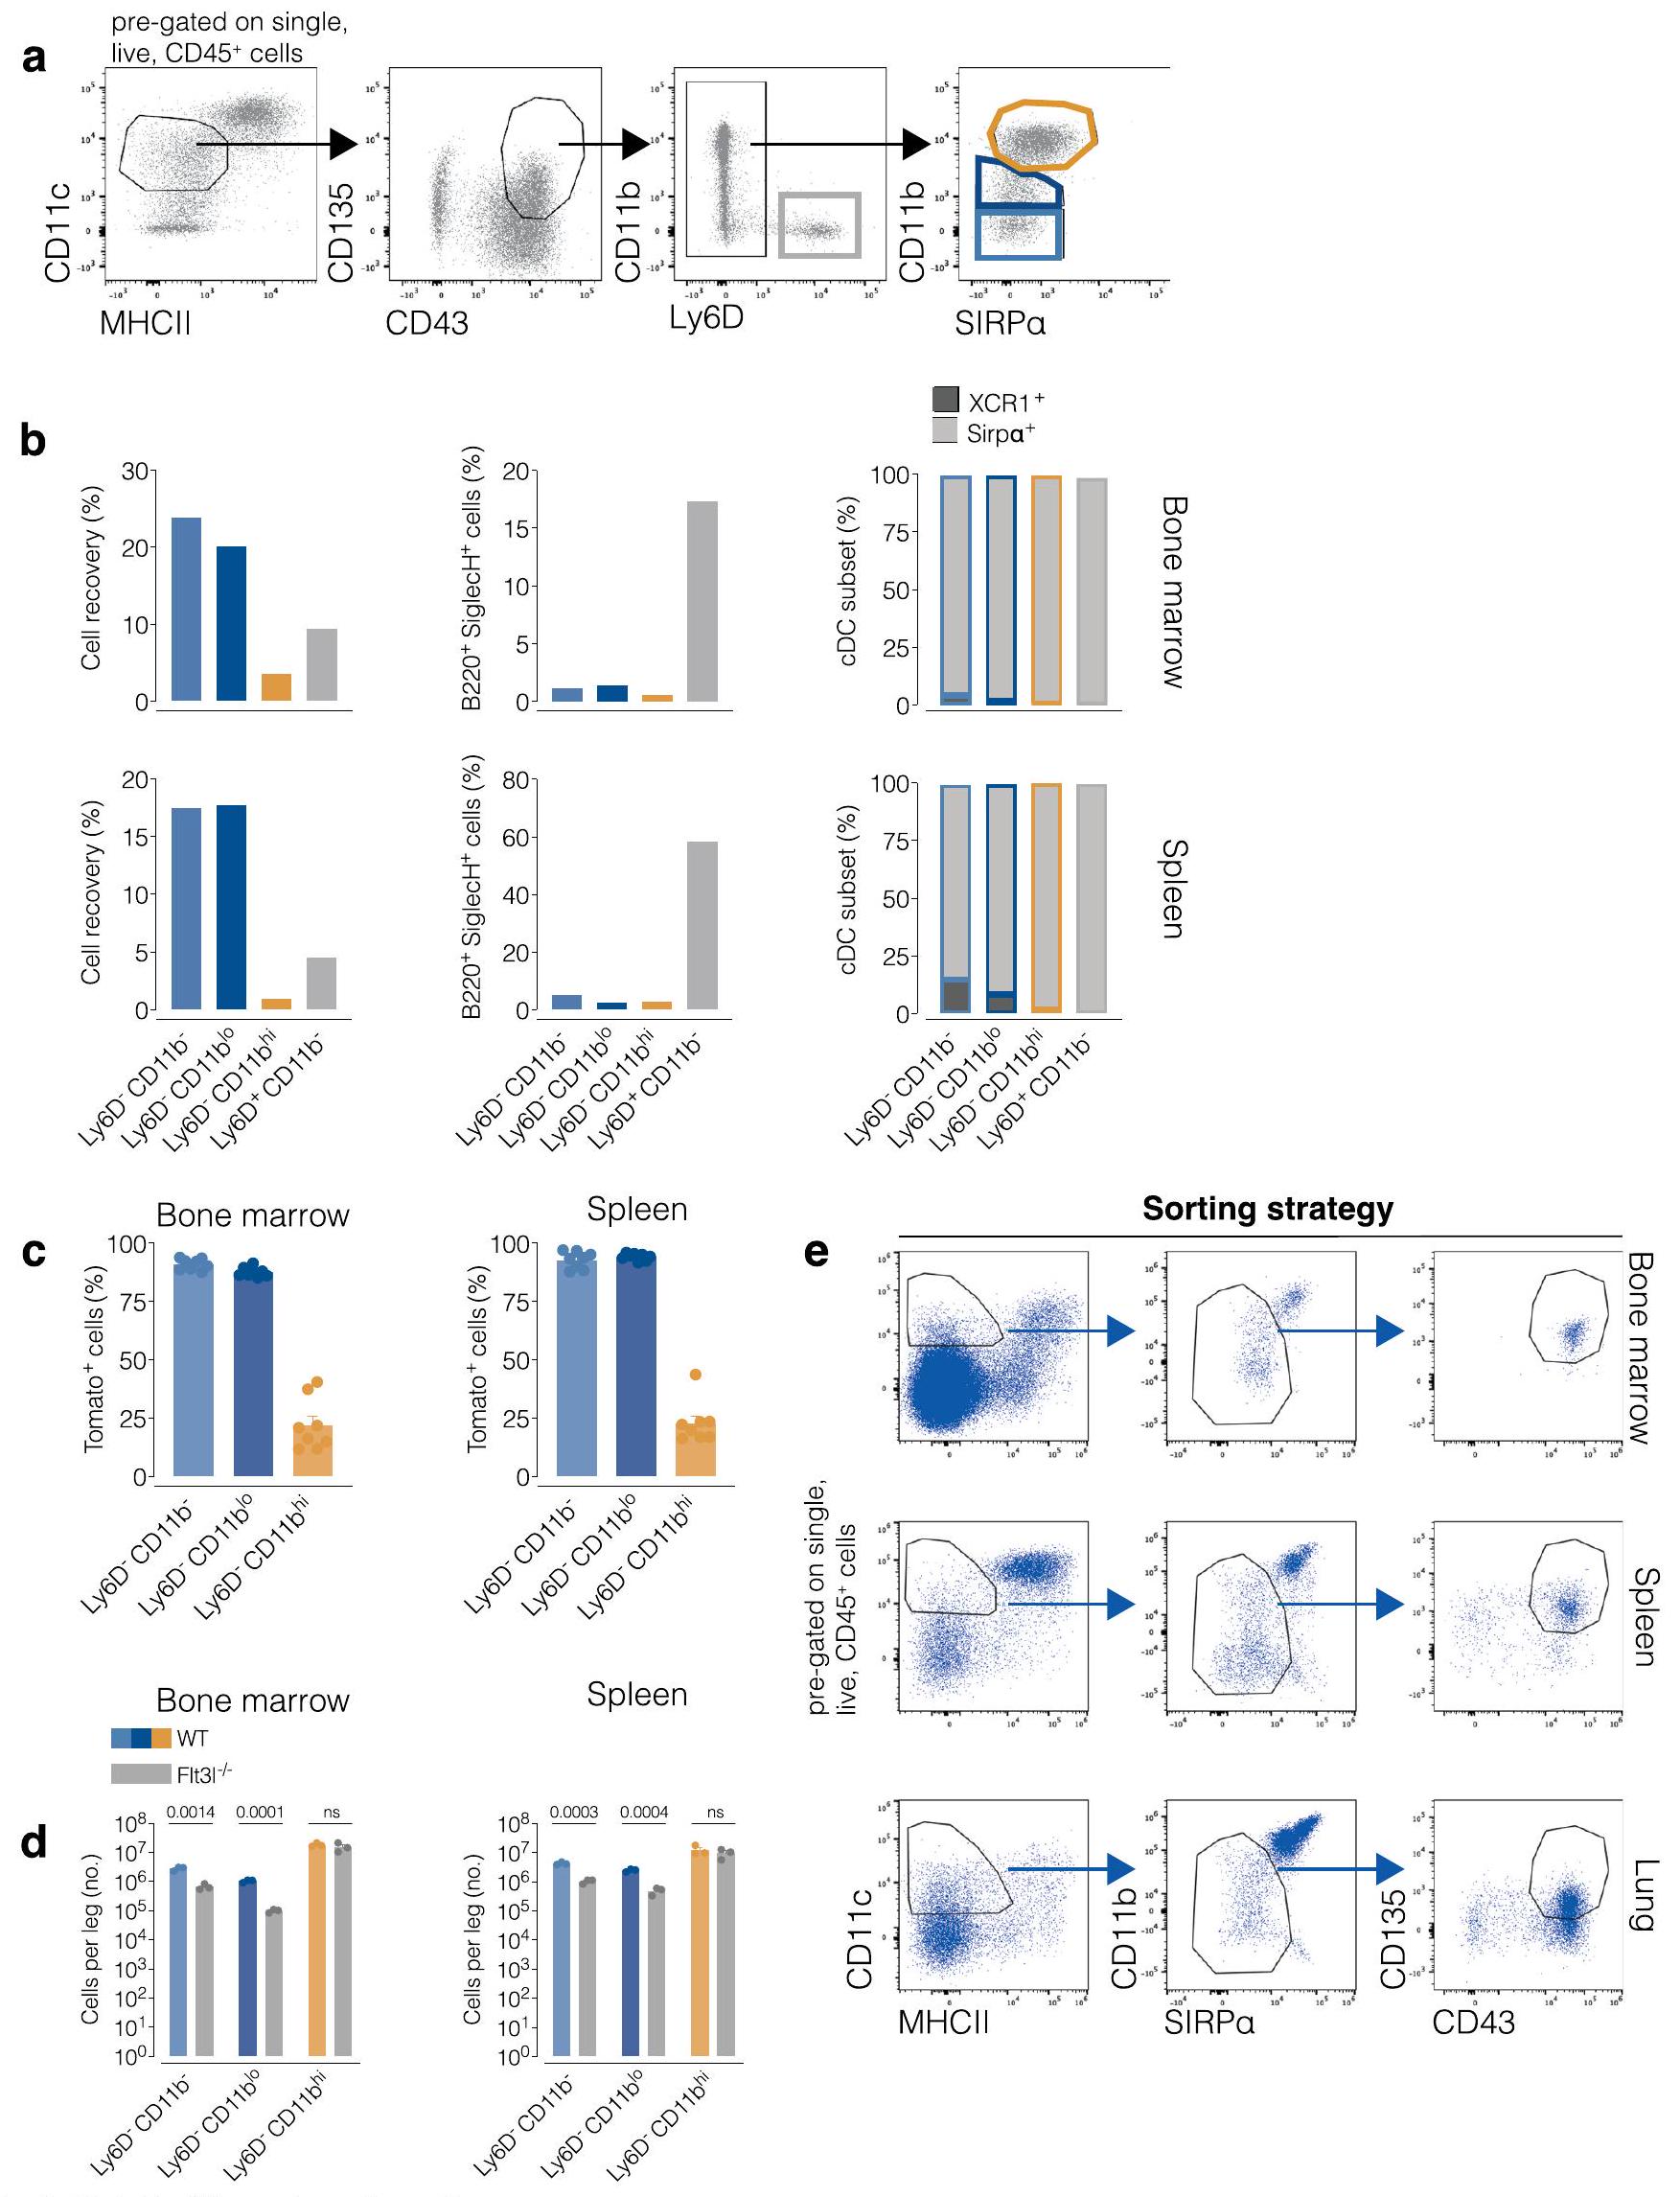
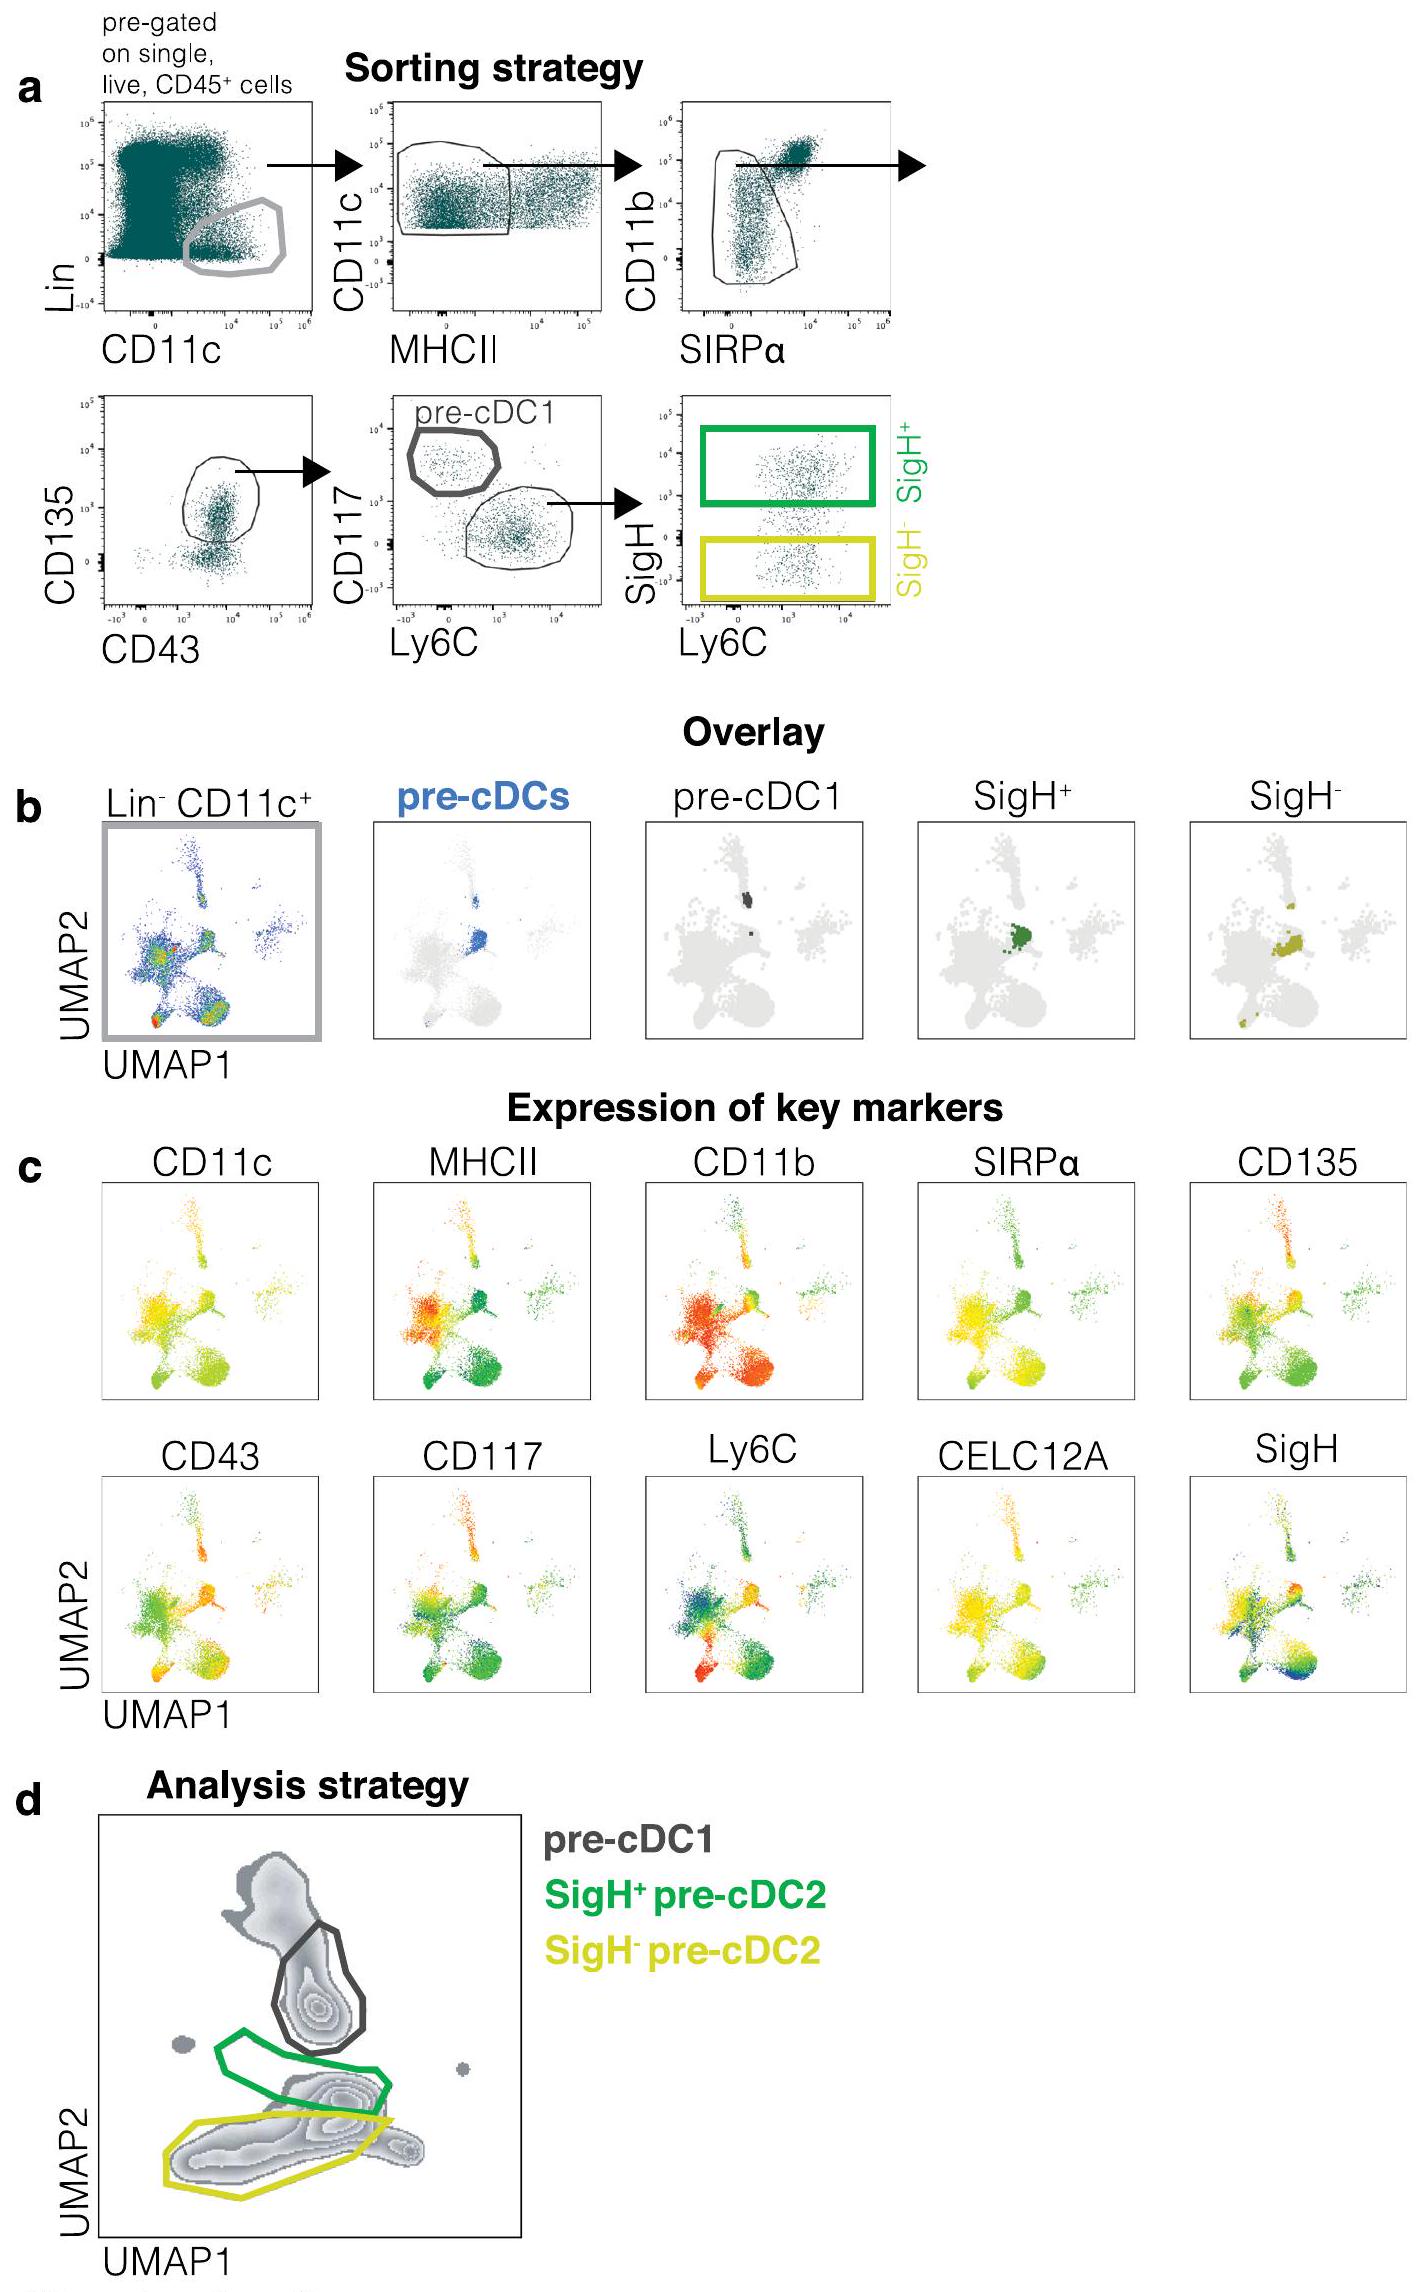
بعد ذلك، حددنا خلايا ما قبل الخلايا dentritic (pre-cDCs) في الأنسجة باستخدام بروتوكول تم تطويره لعزل خلايا ما قبل الخلايا dentritic في الرئة.. نحن محاطون بـسيربCD135قرص مضغوطالخلايا مع استبعاد Ly6Dالخلايا (سابقة لكل من الخلايا البلازمية) و tDCs ) و CD11b سيربCD16الخلايا (خلايا شبيهة بالوحيدات وخلايا DC3 السلفية) ) (الشكل 3a من البيانات الموسعة). باستخدام اختبارات التمايز في المختبر (الشكل 3b من البيانات الموسعة)، ورسم مصير الخلايا (الشكل 3c من البيانات الموسعة) واعتماد الليغاند الخاص بكيناز التيروزين الشبيه بـ Fms (Flt3L) في الجسم الحي (الشكل 3d من البيانات الموسعة)، أكدنا أن استراتيجية التصفية حددت خلايا ما قبل cDCs الحقيقية في نخاع العظام والطحال، كما تم إظهاره سابقًا للرئة.استخدمنا استراتيجية البوابة (الشكل 3e من البيانات الموسعة) لفرز خلايا ما قبل الخلايا الجذعية الدموية (pre-cDCs) من نخاع العظام والطحال والرئة لفئران C57BL/6J من النوع البري (WT). قمنا بإجراء تحليل تسلسل RNA على مستوى الخلية الواحدة (scRNA-seq) على 2,649 خلية ما قبل الخلايا الجذعية الدموية من نخاع العظام، و4,371 خلية من الطحال، و358 خلية من الرئة بعد استبعاد عدد قليل من الخلايا الميتة والملوثات (التي تم تحديدها باستخدام ملفات النسخ الجيني لخلايا المناعة؛https://www. immgen.org/) (الشكل 2أ). قمنا بدمج الأنسجة الثلاثة (نخاع العظم، الطحال والرئة) وأنشأنا خريطة UMAP التي حددت تسعة تجمعات، على الرغم من اختلافها في النسبة، إلا أنها تداخلت عبر جميع الأنسجة (الشكل 2أ). لذلك، قمنا بدمج الخلايا من جميع الأنسجة واستخدمنا توقيعات الجينات المنشورة.لتعليق على تجمعات UMAP. أظهرت هذه الطريقة أن التجمعات 4 و5 و6 تت correspond إلى الخلايا الجذعية القشرية المبكرة المتكاثرة (الشكل 2ب). كانت غنية في نخاع العظام (الشكل 2أ، ب)، وهو ما يتماشى مع حقيقة أنها تنشأ في هذا النسيج. من المحتمل أن تمثل التجمعات 0 و1 خلايا ما قبل القشرية المتمايزة أكثر والتي على وشك مغادرة نخاع العظام.أو ما يُعرف بـ pre-cDCs التي استعمرت مؤخرًا الأنسجة المحيطية (الشكل 2ب). كانت المجموعات 3 و2 و7 و8 (late pre-cDCs) مفرطة التمثيل في الأنسجة المحيطية (الشكل 2أ، ب)، حيث تكمل pre-cDCs تمايزها إلى cDCs.. بشكل عام، تم تقسيم الخلايا السابقة لـ cDCs إلى مجموعتين: واحدة تتكون من الكتل 3 و 6 مع توقيع تعبير جيني للخلايا السابقة لـ cDC1s/cDC1s؛ والأخرى تتكون من الكتلو 8 ومشابهة في التعبير الجيني لـ pre-cDC2s/cDC2s (الشكل 2c)لم نحدد أي
أ
MLN
رئة
كبد
زسجرينتي-بيتcDC2
ب
0.0286
0.0286
0.0286
زسجرينتي-بيتcDC2
1 cDC2B
2 cDC2A
3 cDC2A المبكرة
4 ت.د.س
CLEC12A MFI ( )
0
يوماپ 1
تي-بيت
عصام
0
CD24
MGL-2
PD-L2
– cDC2B
– تDC
– cDC2A المبكر
– cDC2A
الطحال
كبد
ج
رئة
(1) C9a
C9a
cDC2A المبكر
MLN
كبد
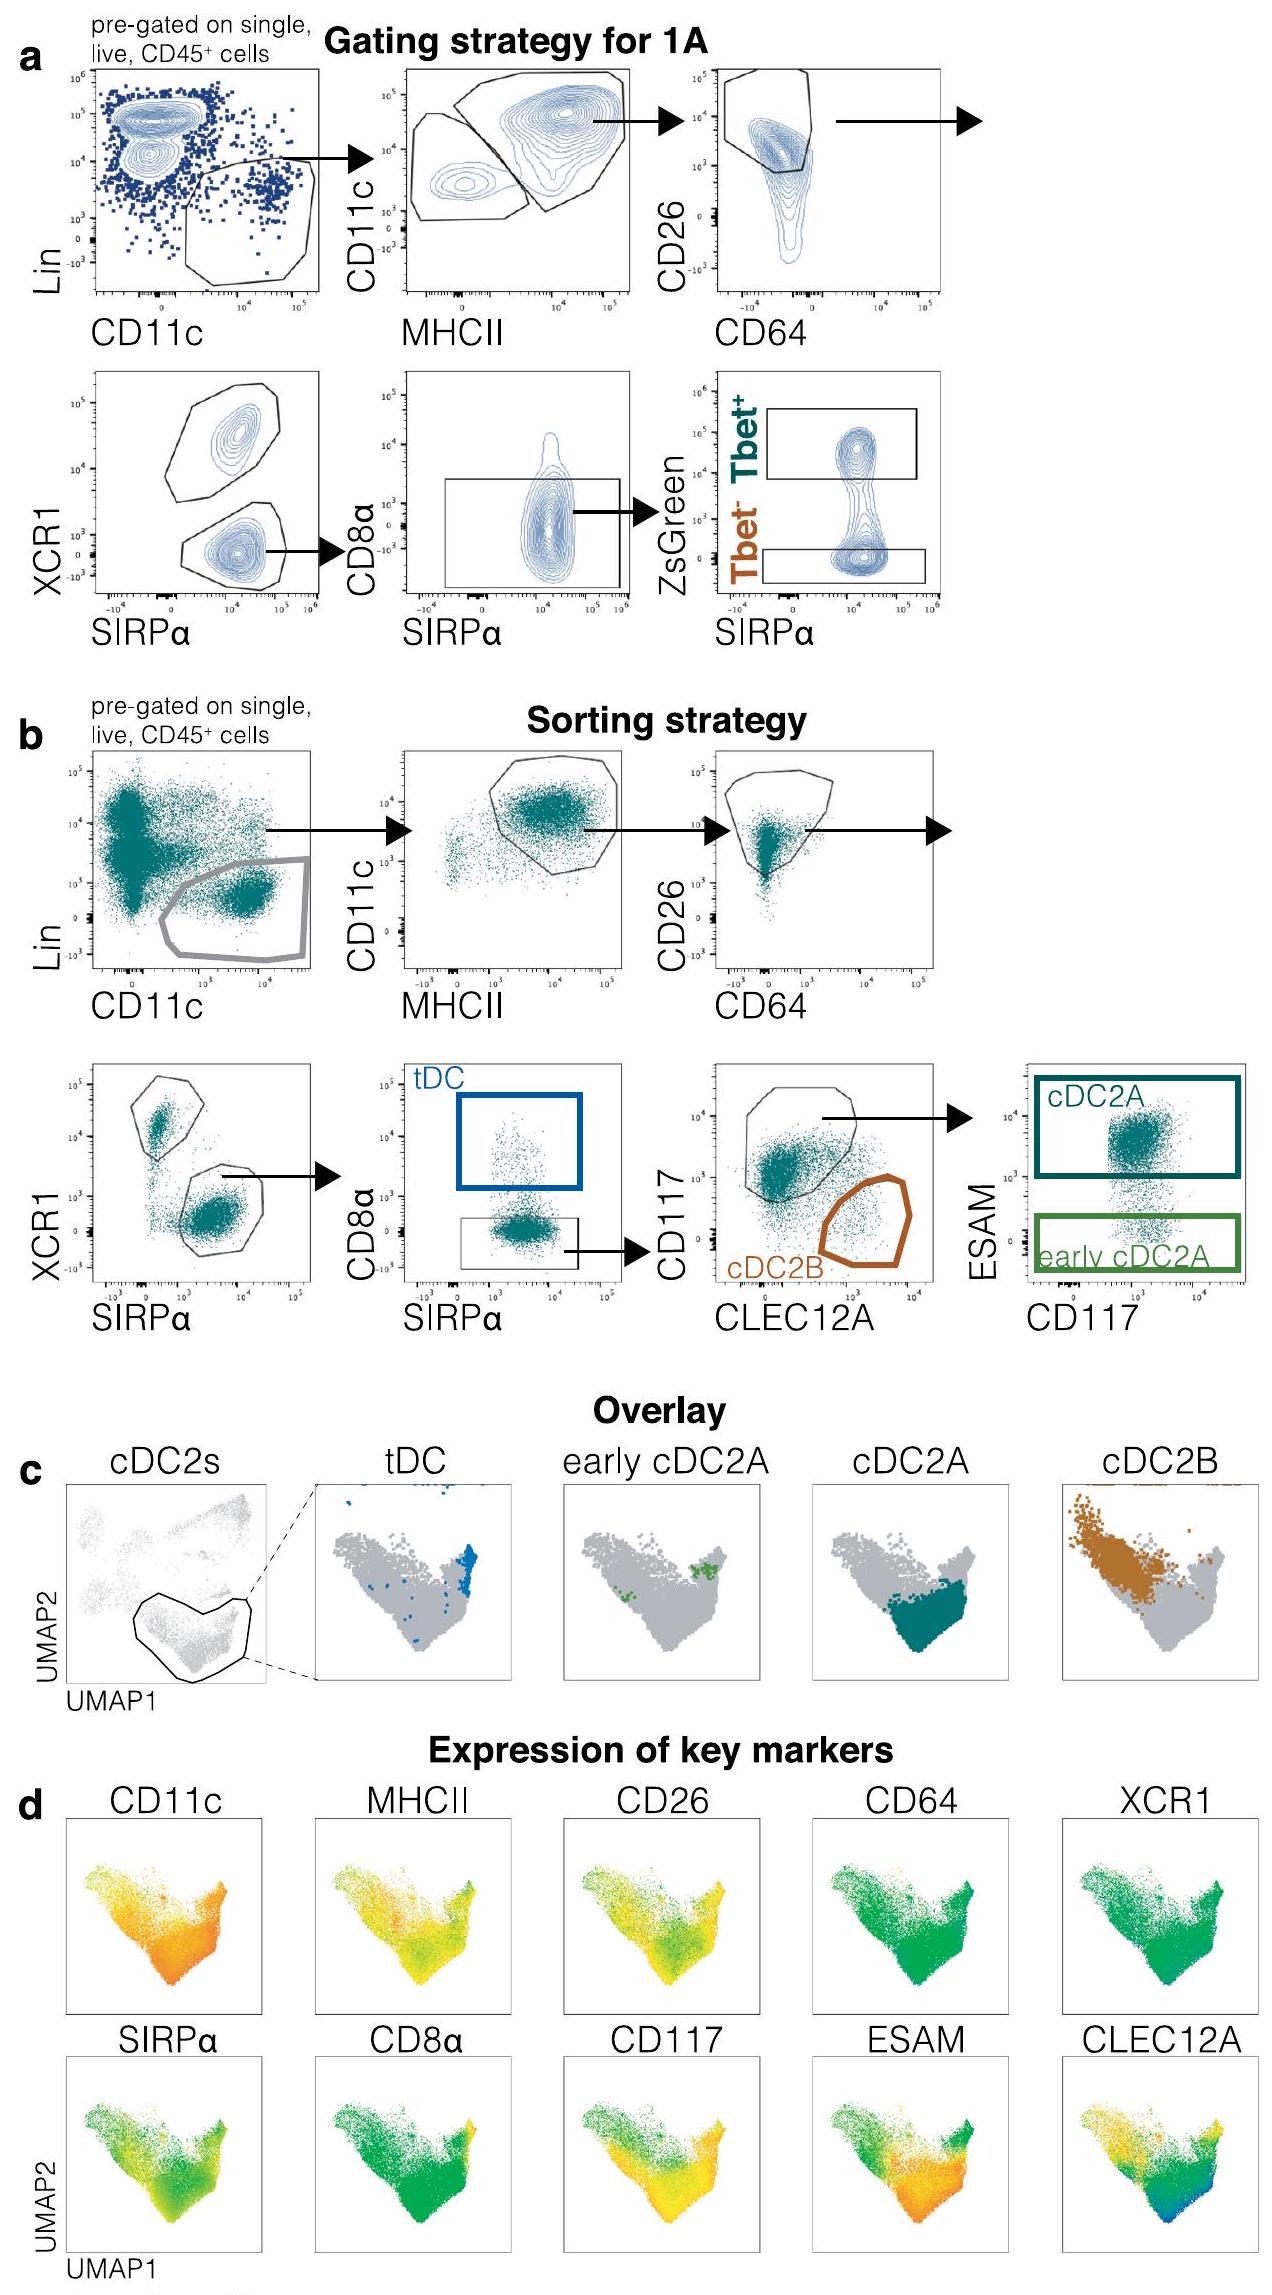
الشكل 1| تشمل cDC2As خلايا cDC2 المعتمدة على Notch2 بينما تت correspond خلايا cDC2 المعتمدة على KLF4 إلى cDC2Bs. أ، تحليل تدفق الخلايا يظهر تعبير Esam و CLEC12A و CD24 و MGL-2 و PD-L2 على T-bet-ZsGreen(cDC2A) و T-bet-ZsGreen- (cDC2B) cDC2s من الطحال، MLN، الرئة والكبد في فئران T-betZsGreen. ب، UMAP تمثيلي لبيانات تدفق الخلايا من خلايا الطحال من فئران Tbx21-ZsGreen التي تقع ضمن بوابة cDC2 التي تم إنشاؤها منالخلايا باستخدام تعبير CD11c، MHC-II، CD26، CD64، CD88، XCR1، SIRPإسام، CLEC12A، CD11b، CD43، CD135، CD117، Ly6C و CD8تشير إلى cDC2Bs و cDC2As و cDC2As المبكرة و tDCs (الأعلى) تراكب T-bet-ZsGreenعصام،
سي إل إي سي 12 إيهCD24مجل-2أو PD-L2cDC2s على UMAP (في المنتصف) وشدة الفلورية المتوسطة لـ ZsGreen (MFI – بعد طرح خلفية الفلورية الذاتية) في cDC2Bs و cDC2As و early cDC2As و tDCs المحددة في UMAP (في الأسفل). ج، تحليل تدفق الخلايا يظهر قياس cDC2Bs و cDC2As و early cDC2As و tDCs من الطحال و MLN والرئة والكبد من C9a. و فئران. كل نقطة تمثل فأراً واحداً (في و في ). البيانات من واحدة من اثنتين ( ) أو مجموعة من اثنين ( تجارب (تعنيم.م.). اختبار مان-ويتني ذو الذيلين-تم استخدام اختبار لمقارنة المجموعات (في، المقارنة نسبية بالنسبة لـ cDC2B).القيم موضحة أعلاه الرسوم البيانية.
الشكل 2 | يمكن إعادة تجسيد تباين cDC على مستوى ما قبل cDC. أ، خرائط UMAP تعرض تحليل scRNA-seq لـ pre-cDCs المصنفة كما هو موضح في الشكل الإضافي 3 e من نخاع العظام (2,649 خلية)، الطحال (4,371 خلية) والرئة (358 خلية) مع تجميع غير خاضع للإشراف (كل عينة هي مجموعة من ستة فئران). يتم عرض نسبة المجموعات التسع المحددة في خرائط UMAP لكل عضو على اليمين. ب، مخططات تمثيلية توضح الدرجة لتوقيعات الجينات (المراجع 15، 30 والجدول التكميلي 9) للتكاثر (الوسط) وpre-cDC المبكر (اليسار) أو المتأخر (اليمين) المعروضة على مساحة UMAP المجمعة. يتم عرض مستويات التعبير كتدرج من منخفض (رمادي فاتح) إلى مرتفع (أخضر مزرق). ج، مخططات الميزات
تصوير الدرجات لتوقيعات الجينات (المراجع 15، 30 والجدول التكميلي 9) لـ pre-cDC1s و pre-cDC2s على UMAP المدمج، ومخططات الكمان للدرجات ضمن 3 و 6، وو 8، مجموعات العنقود. د، رسومات الميزات التي توضح الدرجات لتوقيعات الجينات (المراجع 15، 30 والجدول التكميلي 9) لـ cDC2As و cDC2Bs على UMAP المدمج، ورسومات الكمان للدرجات ضمن مجموعات العنقود 0، 2 و 8، و 1 و 7. يتم عرض مستويات التعبير كتدرج من منخفض (رمادي فاتح) إلى مرتفع (أخضر مزرق). في ج، د، تم استخدام اختبار مان ويتني ذو الذيلين.-تم استخدام اختبار للمقارنة (الوسيطنطاق الربيع الربعي (IQR).القيم موضحة أعلاه الرسوم البيانية. العنقود الذي ظهر غير ملتزم على مستوى توقيع التعبير الجيني (الشكل 2c)، كما هو متوقعكانت خلايا ما قبل cDC2 أكثر تنوعًا نسبيًا من خلايا ما قبل cDC1 (سبعة مقارنة باثنين من المجموعات) (الشكل 2c). داخل مجموعات خلايا ما قبل cDC2 المتأخرة، كانت هناك مجموعتان عريضتان: أظهرت المجموعات 0 و2 و8 زيادة في التشابه في ملف التعبير الجيني مع cDC2A؛ بينما عبرت المجموعات 1 و7 عن المزيد من الجينات المشتركة مع cDC2B (الشكل 2d). تشير هذه البيانات إلى أن تقسيم cDC2s إلى cDC2As وcDC2Bs يمكن أن يُعاد تمثيله على مستوى سلفها من خلايا ما قبل cDC باستخدام تحليل التعبير الجيني.
الخلايا الجذعية القشرية من النوع 2 (Pre-cDC2s) تميل نحو مصير cDC2A أو cDC2B
استخدمنا Comet، أداة للتنبؤ بعلامات سطح الخلايا السكانية من بيانات scRNA-seq.لتصميم استراتيجية لتحديد مجموعات ما قبل الخلايا الجذعية المشتقة من الخلايا الدندريتية باستخدام تقنية تحليل التدفق الخلوي. حددت كوميت العلامات التي تم استخدامها سابقًا لتمييز ما قبل الخلايا الجذعية المشتقة من الخلايا الدندريتية 1 (CD117 وCD24) عن ما قبل الخلايا الجذعية المشتقة من الخلايا الدندريتية 2 (Ly6C وCD115، من بين آخرين). (الجدول التكميلي 2)، وقد أكدنا دقته باستخدام اختبارات التمايز في المختبر (الشكل 4a,b من البيانات الموسعة). كما حددت Comet CD8كعلامة لـ cDC2As المفترضة، بالإضافة إلى تمييز cDC1s و tDCs
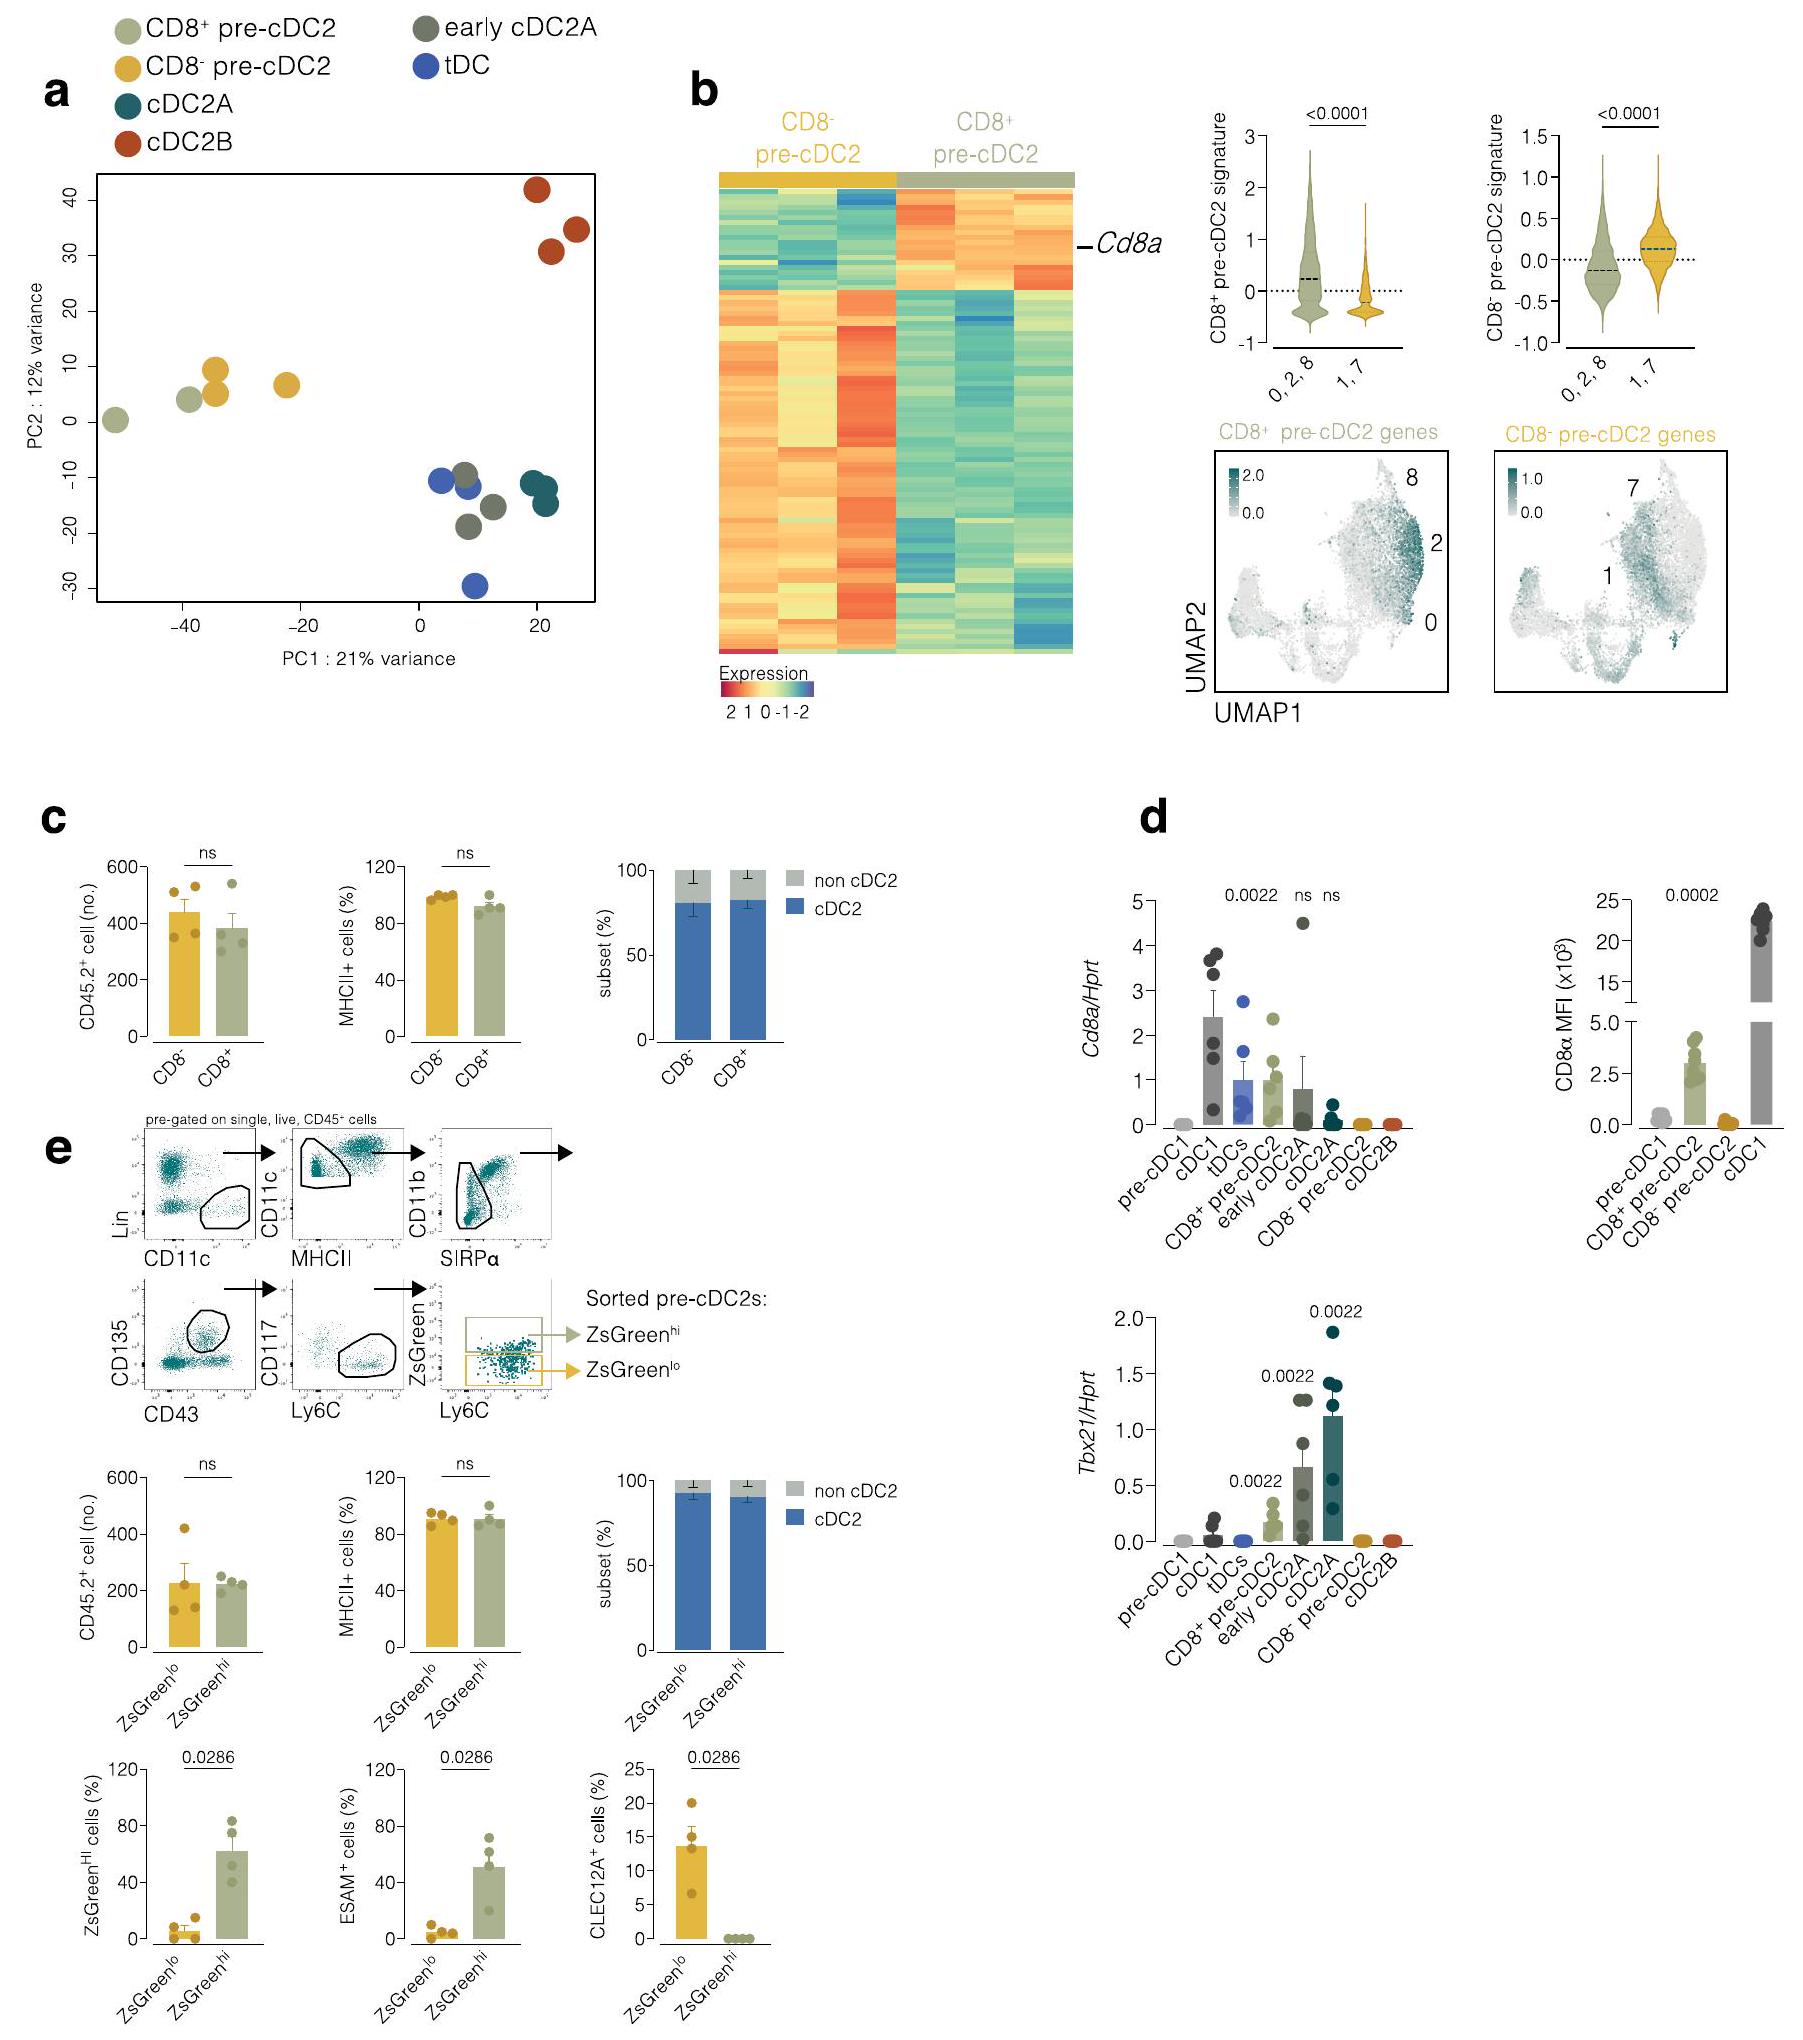
الشكل 3 | الخلايا الجذعية المحيطية pre-cDC2s مائلة نحو مصير cDC2A أو cDC2B. أ، رسم بياني للميزات (يسار) ورسم بياني على شكل كمان (يمين) يظهر تعبير Cd8a على UMAP المدمج أو في مجموعات الكتل 0 و 2 و 8، أو 1 و 7، كما في الشكل 2b-d. ب، UMAP تمثيلي لتحليل تدفق السيتومتر للخلايا الجذعية pre-cDC والسكان cDC التي تم إنشاؤها على CD11c.لينالخلايا باستخدام CD11c، MHC-II، CD26، CD64، CD88، XCR1، SIRPإسام، CLEC12A، CD11b، CD43، CD135، CD117، Ly6C و CD8 (يسار)، و CD8 الخلايا المرسومة فوق UMAP (يمين). ج، CD45.2cDC2s (المستمدة من CD8أو CD8تم استرداد (pre-cDC2s) من الطحال لفئران المتلقين CD45.1 وتم وضعها على UMAP تمثل سلالة cDC للمضيف (يسار) وتحليل تدفق الخلايا يظهر العدد والنسبة المئوية لـ WT CD45.2 EsamcDC2As و CLEC12Aتم استرداد cDC2Bs من الطحال لمتلقّي الفئران WT CD45.1 بعد 3 أيام من نقل CD8و CD8تجمعات CD45.2 pre-cDC2s (يمين). يتم توضيح التجمعات في ب. د، متوسط شدة الفلورة ZsGreen (بعد الطرح من) خلفية الفلورة الذاتية) في cDC2As و cDC2Bs أو CD8أو CD8خلايا ما قبل cDC2 من فئران T-bet-ZsGreen ومخططات تدفق تمثيلية مع م overlaypre-cDC2s وpre-cDC2s في الطحال، MLN، الرئة والكبد توضح تعبير T-bet-ZsGreen (شدة الفلورية) في كل مجموعة من pre-cDC2. e، نسبة cDC2As و cDC2Bs أو CD8أو CD8 pre-cDC2s في الطحال، العقد اللمفية المتوسطة، الرئة والكبد، وUMAP التمثيلي للطحال، العقد اللمفية المتوسطة، الرئة والكبد يظهر المجموعات التي تحتوي على cDC2As وcDC2Bs أو CD8أو CD8pre-cDC2s. في ج، د، كل نقطة تمثل فأراً واحداً (في و في د، هـ)؛ تم تجميع البيانات من تجربتين (المتوسط س.م.; الوسيط IQR لرسم الكمان). في (ج-هـ)، تأتي الكميات من UMAPs (كما هو موضح في وشكل البيانات الموسعة الشكل 4c-e). اختبار مان-ويتني ذو الذيلينتم استخدام -test للمقارنة.القيم موضحة أعلاه الرسوم البيانية. في بعض الأنسجة (الشكل 3أ، الشكل التمديدي 4ج-هـ والجدول التكميلي 2). باستخدام تحليل تدفق الخلايا، أكدنا أنتضمنت خلايا ما قبل cDC2s خلايا CD8و CD8الخلايا (الشكل 3ب والشكل الإضافي 4أ، ج-هـ). تحليل UMAP لـخلايا الطحال ملونة لعدة علامات cDC و pre-cDC موضوعة CD8pre-cDC2s على فرع يؤدي إلى cDC 2 B، وpre-cDC2s على مسار متميز يؤدي إلى cDC2A (الشكل 3b والشكل الإضافي 4c,d). قمنا بفرز CD8 من الطحالما قبل cDC2s و CD8pre-cDC2s (الشكل 4a من البيانات الموسعة) وتم إجراء تحليل تسلسل RNA الكمي الشامل (الشكل 5a من البيانات الموسعة). تم استخدام الجينات المعبر عنها بشكل مختلف (DEGs) من أي من السكان (الجدول التكميلي 3) كعلامة جينية، والتي عند تراكبها على تحليل UMAP السابق لتسلسل RNA أحادي الخلية (الشكل 5b من البيانات الموسعة)، أشارت إلى أن CD8كان قادرًا بالفعل على فصل المكونات المحتملة لـ cDC2As (CD8pre-cDC2s) و cDC2Bs (CD8pre-cDC2s) في طحال الفأر (الشكل 5b من البيانات الموسعة). كما أشار هذا التحليل إلى أنه على الرغم من أن tDCs تعبر عن CD8كان ملف تعبير الجينات لديهم مميزًا عن ذلك الخاص بـ CD8pre-cDC2s (الشكل 5a من البيانات الموسعة).
لاختبار العلاقات بين السلف والمنتج بشكل مباشر، قمنا بعزل CD8 من الطحالو CD8قمنا بعزل خلايا pre-cDC2s من فئران CD45.2 ونقلناها إلى متلقين CD45.1 الذين تعرضوا للإشعاع بشكل غير مميت. استبعدنا Ly6Dالخلايا لاستبعاد سلفيات الخلايا البلازمية أو خلايا tDCs، و CD11bسيربالخلايا لاستبعاد الخلايا الشبيهة بالوحيدات وخلايا DC3 السلفية. أظهر تحليل خلايا cDCs الطحالية بعد 3 أيام من النقل أن كلا منpre-cDC2s و CD45.2تغيرت خلايا pre-cDC2s إلى SIRPcDC2s إلى حد مشابه (الشكل 5c من البيانات الموسعة). ومع ذلك، فإن CD8تم إنتاج خلايا pre-cDC2s بشكل مفضل CLEC12AcDC2Bs بينما CD8أصبحت خلايا ما قبل cDC2 بشكل أساسي EsamcDC2As (الشكل 3ج). وبالتالي، CD8، وهو علامة مرتبطة بـ cDC1s و tDCs، تم التعبير عنه أيضًا بواسطة pre-cDC2As الطحالية ويمكن استخدامه لتمييزها عن pre-cDC2Bs الطحالية (الشكل البياني الموسع 5d).
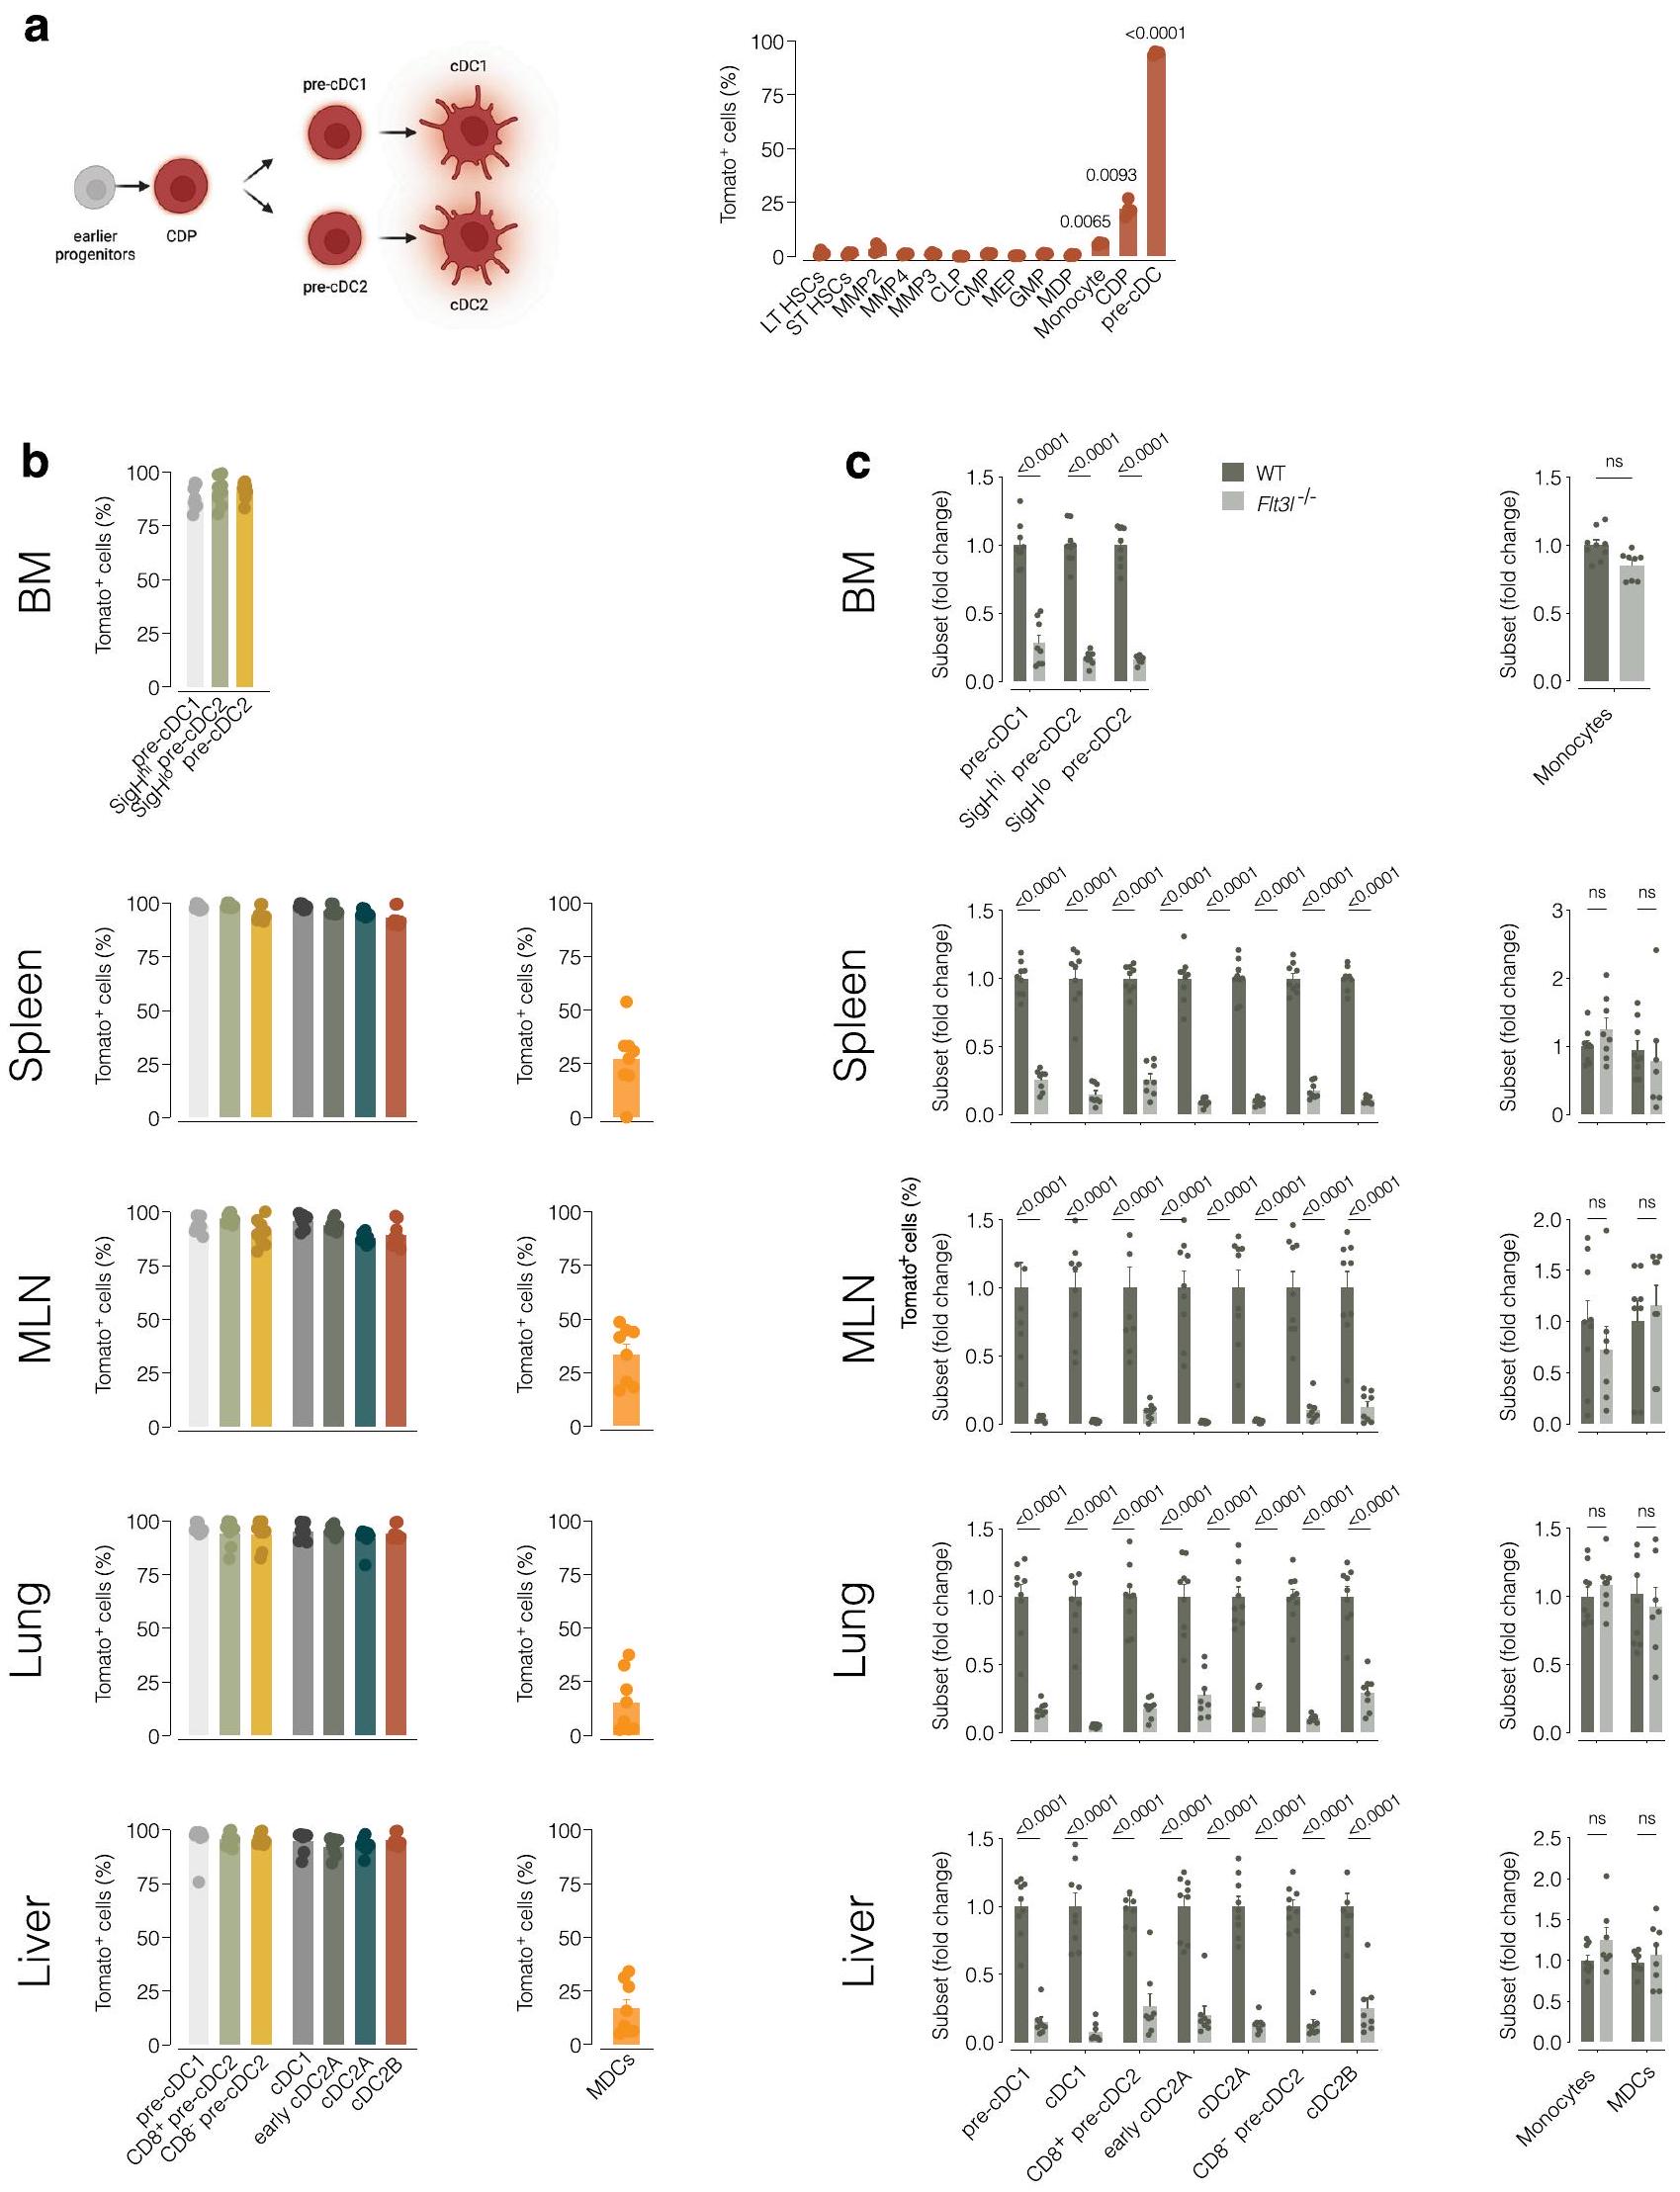
تكون خلايا Pre-cDC2 نادرة جدًا في الأنسجة المحيطية الأخرى بحيث لا تسمح بالفرز والنقل التبني. في الطحال، والعقد اللمفية المتوسطة، والرئة، والكبد لفئران T-bet-ZsGreen، اكتشفنا Esam.cDC2As التي تعبر عن Tbx21 المحاضر (الشكل البياني الممتد 5d) ومستويات أعلى من T-bet-ZsGreen مقارنة بـ CLEC12AcDC2Bs (الشكل 3d). إشارة T-bet-ZsGreen في Ly6Cكان مستوى pre-cDC2s أقل بكثير من مستوى cDC2As (الشكل 3d)؛ ومع ذلك، كان قابلاً للاكتشاف وكان أعلى بشكل ملحوظ فيpre-cDC2As أكثر من CD8pre-cDC2Bs عبر جميع الأنسجة (الشكل 3d). نقل خلايا الطحال المفروزة T-bet-ZsGreenpre-cDC2s و T-bet-ZsGreenأظهرت التجارب على الفئران المتجانسة أن تعبير T-bet-ZsGreen تم الاحتفاظ به (وزيادته) طوال عمر cDC2As ولكن ليس cDC2Bs ونسلها. (الشكل البياني الممتد 5e). في حالة التوازن، نسبة T-bet-ZsGreencDC2As إلى T-bet-ZsGreenكانت cDC2Bs أكبر في الأنسجة اللمفاوية (الشكل 3e). وبالمثل، احتوت الأنسجة اللمفاوية على نسبة أكبر من pre-cDC2As، في حين كانت pre-cDC2Bs تهيمن في الأنسجة غير اللمفاوية (الشكل 3e). أخيرًا، كانت جميع هذه المجموعات، على عكس CD11bلي6Cوحيدات النواة أو CD64سي دي 88الخلايا المشتقة من وحيدات النوى (MDCs) أظهرت وسمًا شبه كامل في Clec9فئران تتبع النسب ) وتم تقليلها بشكل ملحوظ في التكرار ( ) في Flt3l الفئران (الشكل 6a-c من البيانات الموسعة). وهذا يشير إلى وجود سلالتين من cDC2 عبر الأنسجة، وكلاهما أعضاء حقيقيون في عائلة cDC.
مجموعتان فرعيتان من خلايا ما قبل السلف النخاعي العظمي cDC2 مرتبطتان بـ cDC2As و cDC2Bs
بعد ذلك، بحثنا فيما إذا كان التحيز النسلي لـ pre-cDC2As و pre-cDC2Bs يحدث عند دخولهم الأنسجة أو، كما هو الحال مع pre-cDC1s و pre-cDC2s، قبل مغادرة نخاع العظام. أظهرت تحليل الزمن الزائف لبيانات scRNA-seq من pre-cDCs في نخاع العظام وجود مسارين تفريقيين متعارضين لـ cDC2A و cDC2B (الشكل 4a). قمنا بمقارنة ملفات التعبير الجيني لمجموعات الخلايا التي عرّفت المسارين الاثنين (الشكل 4b). من بين النسخ الجينية التي فصلت المجموعات 0 و 1 في نخاع العظام، وجدنا 87 نسخة تتداخل مع بعض النسخ التي فصلت late pre-cDC2As (المجموعات 2 و 8) و late pre-cDC2Bs (المجموعة 7) في المحيط، بالإضافة إلى تلك التي فصلت cDC2As و cDC2Bs (الشكل 4b والجدول التكميلي 4). كانت هذه التداخلات ذات دلالة إحصائية.
الشكل 4| يحتوي نخاع العظم على مجموعتين من الخلايا الجذعية قبل cDC2 يمكن فصلها وفقًا لتعبير Siglec-H وترتبط بـ cDC2As و cDC2Bs. أ، تحليل الزمن الزائف لبيانات scRNA-seq (الشكل 2ب-د) من الكتلة 4 إلى الكتل 7 و 8 المجمعة من نخاع العظم والطحال والرئة. ب، خريطة حرارية لـ 87 جينًا معبرًا عنه بشكل مختلف بين الخلايا الجذعية المبكرة قبل cDC2 (الكتل 0 و 1) في نخاع العظم (يسار)، والكتل المتأخرة من الخلايا الجذعية قبل cDC2 (الكتل 2 و 8، والكتلة 7) من نخاع العظم والطحال والرئة (الوسط) ومقارنة بيانات scRNAseq الخاصة بنا مع تلك الخاصة بـ cDC2As و cDC2Bs الطحالية من براون وآخرون. (يمين). تراوحت مستويات التعبير من منخفضة (زرقاء) إلى مرتفعة (برتقالية). ج، تعبير CD8على pre-cDC2s من نخاع العظام، الطحال، MLN، الرئة والكبد، تم تحديدها كما في الشكل التمديدي 4c-e. د، تم عرض تعبير Siglech على UMAP scRNA-seq لـ pre-cDCs من نخاع العظام كما في الشكل 2a (يسار) وتعبير Siglech في الكتلة 0 أو 1 من pre-cDCs في نخاع العظام (يمين). هـ، RT-qPCR لـ Siglech تم تطبيعه على Hprt في cDCs من الطحال المفروزة كما في الشكل التمديدي 1b وpre-cDCs من نخاع العظام المفروزة كما في الشكل التمديدي 7a. ف، رسم بياني تمثيلي لتدفق السيتومتر يظهر Siglec-H وCD26 على pre-cDC2s من نخاع العظام المحددة كأحادية. مباشرسيربالخلايا كما في الشكل 4b-d.g من البيانات الموسعة، دمج 5-إيثينيل-2′-ديوكسي يوريدين (EdU) وصبغة Ki-67 علىأو(أو سيجلك- أو سيجلك-في نخاع العظام) تم تحديد precDC2s من بوابات UMAP كما هو موضح في الأشكال التكميلية 4e و 7d (الأعلى) و cDC2As و cDC2Bs المحددة من بوابات UMAP كما هو موضح في الشكل التكميلية 4e من نخاع العظام والطحال و MLN والرئة والكبد. h، MFI لـ OX40L و mRNA لـ II12b تم تطبيعهما على Hprt (RT-qPCR) في cDC2As و cDC2Bs الطحالية التي تم فرزها كما هو موضح في الشكل التكميلية 1b ونخاع العظام Siglec-أو سيجلك-تم فرز خلايا pre-cDC2s كما هو موضح في الشكل 8a من البيانات الموسعة بعد زراعة ليلية مع الفلاجيلين، R848، CpG أو الزيموسان. في c، e، g، يمثل كل نقطة فأراً واحداً (فيفيفي. البيانات من تجربة واحدة (h) أو مجموعة من اثنتين (c,e,g) (المتوسط س.م.؛ الوسيط IQR لرسم البياني للكمان). اختبار مان-ويتني ذو الطرفين-اختبار (d,g) أو تحليل التباين ثنائي الاتجاه (ANOVA) (مع تصحيح توكي، e,h) تم استخدامه لمقارنة المجموعات (في e، المقارنة تتعلق بـ Siglec-قبلالقيم موضحة أعلاه الرسوم البيانية.
الشكل 5 | سيجلك في نخاع العظامو سيجلك-تستجيب تجمعات ما قبل cDC2 بشكل مختلف للسموم اللمفاوية وعوامل Notch لتصبح cDC2s. أ، عدد الخلايا، تعبير MHC-II، تعبير SIRPوتعبير T-betZsGreen على نخاع العظم Siglec-ما قبل cDC2s و Siglec-ما قبل cDC2s بعد زراعة Siglec-و سيجلك-تم فرز خلايا pre-cDC2s من نخاع العظام لفئران T-bet-ZsGreen (كما في الشكل 7a من البيانات الموسعة) مع خلايا الستروما OP9 أو OP9-DL4 لمدة 3 أيام في وجود Flt3L مع أو بدون اللمفوتوكسين الفأري المعاد التركيب. ب، مخططات تدفق تمثيلية تظهر تعبير MHC-II و SIRP.و T-bet-ZsGreen على Siglec-pre-cDC2s و Siglec-pre-cDC2s في اليوم الثالث من التعايش مع خلايا الستروما OP9-DL4، Flt3L
والليمفوتوكسين. ج، تحليل GSEA لبيانات RNA-seq الكثيفة في Siglec-ما قبل cDC2s و Siglec-تم فرز pre-cDC2s كما هو موضح في الشكل 7a من البيانات الموسعة من C9a و الفئران. كل نقطة تمثل تكرارًا بيولوجيًا واحدًا ( ); البيانات هي مجموعة من تجربتين (المتوسط معدل الاكتشاف الخاطئ (FDR)؛ عامل تحفيز المستعمرات من نوع الخلايا الحبيبية والماكروفاج (GM-CSF)؛ إنترفيرون (IFN)؛ درجة الإثراء المعايرة (NES). في (أ)، تم تحليل الخلايا باستخدام التصفية اليدوية (كما في (ب)) وتم تعريفها على أنها: مفردة؛ حية؛ CD45.2; CD11c ; و MHC-II تم تعريف CDC1s على أنها XCR1بينما تعبر cDC2s عن SIRPتم استخدام تحليل التباين الثنائي (مع تصحيح توكي) للمقارنة.القيم موضحة أعلاه الرسوم البيانية. (؛ الشكل 4ب)، مما يشير إلى أن التخصص نحو cDC2As و cDC2Bs كان واضحًا بالفعل على مستوى خلايا ما قبل cDC2 في نخاع العظام.
على عكس الأنسجة الطرفية، لم نكتشف تعبير CD8في أي من الخلايا السابقة لـ cDC2 في نخاع العظام (الشكل 4c). ومع ذلك، حدد تحليل تسلسل RNA أحادي الخلية (scRNA-seq) وPCR الكمي مع النسخ العكسي (RT-qPCR) Siglec-H كعلامة محتملة للخلايا السابقة لـ cDC2 في المجموعة 0 (الشكل 4d,e). أكد تحليل تدفق الخلايا أن الخلايا السابقة لـ cDC2 في نخاع العظام يمكن فصلها إلى Siglec-و سيجلك-السكان (الشكل 4f والشكل الإضافي 7a-d). كان تعبير Siglec-H منخفضًا جدًا في pre-cDC2s أو cDC2s من الأنسجة المحيطية، مثل الطحال (الشكل الإضافي 8a)، مما يشير إلى أن تعبير Siglec-H فقد في وقت مبكر عندما تمايزت pre-cDCs إلى late pre-cDCs التي تغادر نخاع العظام، وهو ما يتماشى مع التقارير السابقة.. وبناءً عليه، أظهرت تحليل بيانات تسلسل RNA أحادي الخلية أن تعبير Siglech كان أعلى في الخلايا في الكتلة 0 وأقل في الخلايا المتميزة أكثر pre-cDC2As في الكتل 2 و 8 (الشكل 8b من البيانات الموسعة). قمنا بفرز Siglec- و سيجلك-تم الحصول على خلايا pre-cDC2s من نخاع العظم وأُجري تحليل تسلسل RNA الجماعي للحصول على توقيع DEG لكلتا المجموعتين (الشكل 8c-d من البيانات الموسعة والجدول التكميلي 5). عند رسمها على UMAP لتسلسل RNA أحادي الخلية، كان توقيع Siglec-تم تسليط الضوء على خلايا pre-cDC2s في المجموعات 0 و2 و8، في حين أن توقيع Siglec-تم تسليط الضوء على خلايا pre-cDC2s في المجموعات 1 و 7 (الشكل 8d من البيانات الموسعة). استخدمنا أيضًا تحليل المكونات الرئيسية (PCA) لاستكشاف العلاقة بين Siglec- نخاع العظام.pre-cDC2s و
سيجلك-pre-cDC2s وpre-cDC2As وتم العثور على pre-cDC2Bs في الطحال. فصل المكون الرئيسي 1 الخلايا وفقًا للأنسجة، بينما فصل المكون الرئيسي 2 الخلايا وفقًا للمجموعة الفرعية (الشكل البياني الممتد 8c)، مما يشير إلى التشابه بين Siglec-وpre-cDC2s و Siglec-و CD8pre-cDC2s.
سيجلك-أظهرت خلايا pre-cDC2s مؤشر تكاثر أكبر من Siglec-pre-cDC2s، والتي كانت مشابهة للاختلاف بين cDC2As و cDC2Bs (الشكل 4 ج). cDC2As و Siglec-استجابت خلايا cDC2s السابقة بشكل أقوى لتحفيز الفلاجيلين، في حين أن cDC2Bs وSiglec-كانت خلايا pre-cDC2s أكثر استجابة لـ R848 و CpG و الزيموزان (الشكل 4 ح). سيغليك في نخاع العظام –pre-cDC2As و Siglec-أظهرت خلايا ما قبل cDC2Bs تمييزًا مشابهًا لخلايا ما قبل cDC1s في نخاع العظام في Clec9aفئران تتبع النسب (الشكل 6 أ-ب) وكانت تعتمد على FIt3L (الشكل 6 ج)، مما يشير إلى أنها جميعًا ناتجة عن CDPs وليس عن وحيدات النواة. أظهرت هذه البيانات أن Siglec-pre-cDC2s و Siglec-تشبه خلايا cDC2s السابقة في نخاع العظم خلايا cDC2As وcDC2Bs المحيطية، على التوالي، من حيث تعبير الجينات، وقدرة التكاثر ونمط الاستجابة لمحفزات المناعة الفطرية..
السموم اللمفاوية وعوامل ربط نوتش تدعم تحديد الخلايا الجذعية القشرية من النوع 2A
قمنا بعد ذلك بفرز Siglec-و سيجلك-خلايا ما قبل cDC2 من نخاع العظام لفئران T-bet-ZsGreen لاختبارات التمايز في المختبر. كل من Siglec- في نخاع العظام. أ، عدد الخلايا وتعبير MHC-II و CD43 على CD45.2الخلايا المستعادة من الطحال من فئران المتلقين CD45.1 WT بعد 3 أيام من نقل Siglec-أو سيجلك-تم عزل خلايا pre-cDC2s من فئران T-bet-ZsGreen (تم فرزها كما في الشكل التوضيحي الممتد 7a). ب، تعبير CD8 (%) و T-bet-ZsGreen (MFI) على CD45.2 الخلايا المعزولة من فئران T-bet-ZsGreen والمستعادة من فئران CD45.1 WT كما في أ. ج، تصنيف يدوي لتأكيد تحليل UMAP المستخدم في التكميم في أ، ب. د، عدد الخلايا وتعبير MHC-II وCD43 على CDالخلايا المستعادة من الطحال من فئران المتلقين CD45.1 WT بعد 6 أيام من نقل Siglec-أو سيجلك-تم عزل خلايا cDC2 الأولية من فئران T-bet-ZsGreen (تم فرزها كما هو موضح في الشكل 7a من البيانات الموسعة). هـ، تحديد cDC2 (كما تم قياسه باستخدام SIRPزيادة التعبير) لـ CD45.2الخلايا المعزولة من فئران T-bet-ZsGreen والمستعادة من فئران CD45.1 WT كما في الد.ف، تعبير CD117 وEsam و
CLEC12A (%) على CD45.2الخلايا المعزولة من فئران T-bet-ZsGreen والمستعادة من فئران CD45.1 WT كما في (د). ج، تصنيف يدوي لتأكيد تحليل UMAP المستخدم في التكميم في (د-ف). ح، MFI لـ T-bet-ZsGreen على Siglec-و سيجلك- pre-cDC2s من نخاع العظام لفئران T-bet-ZsGreen قبل النقل. تم طرح الفلورة الذاتية الخلفية عن طريق تحديد خلايا مكافئة من فئران WT. i، T-bet-ZsGreenفي سيجلك-أو سيجلك-الخلايا السابقة لـ cDC2s (أو نسلها بعد النقل) المعزولة من نخاع العظام لفئران CD45.2 T-bet-ZsGreen قبل النقل أو بعد 6 أيام من النقل إلى فئران CD45.1 WT (كما في d). كل نقطة تمثل فأراً واحداً.بما في ذلك ); البيانات هي مجموعة من تجربتين (المتوسط م.م.). اختبار مان-ويتني ذو الذيلين-اختبارأو تحليل التباين ثنائي الاتجاه (مع تصحيح توكي، i) تم استخدامه لمقارنة مصير سيجلك-و سيجلك-ما قبل cDC2s.القيم موضحة أعلاه الرسوم البيانية. NS، غير دالة.
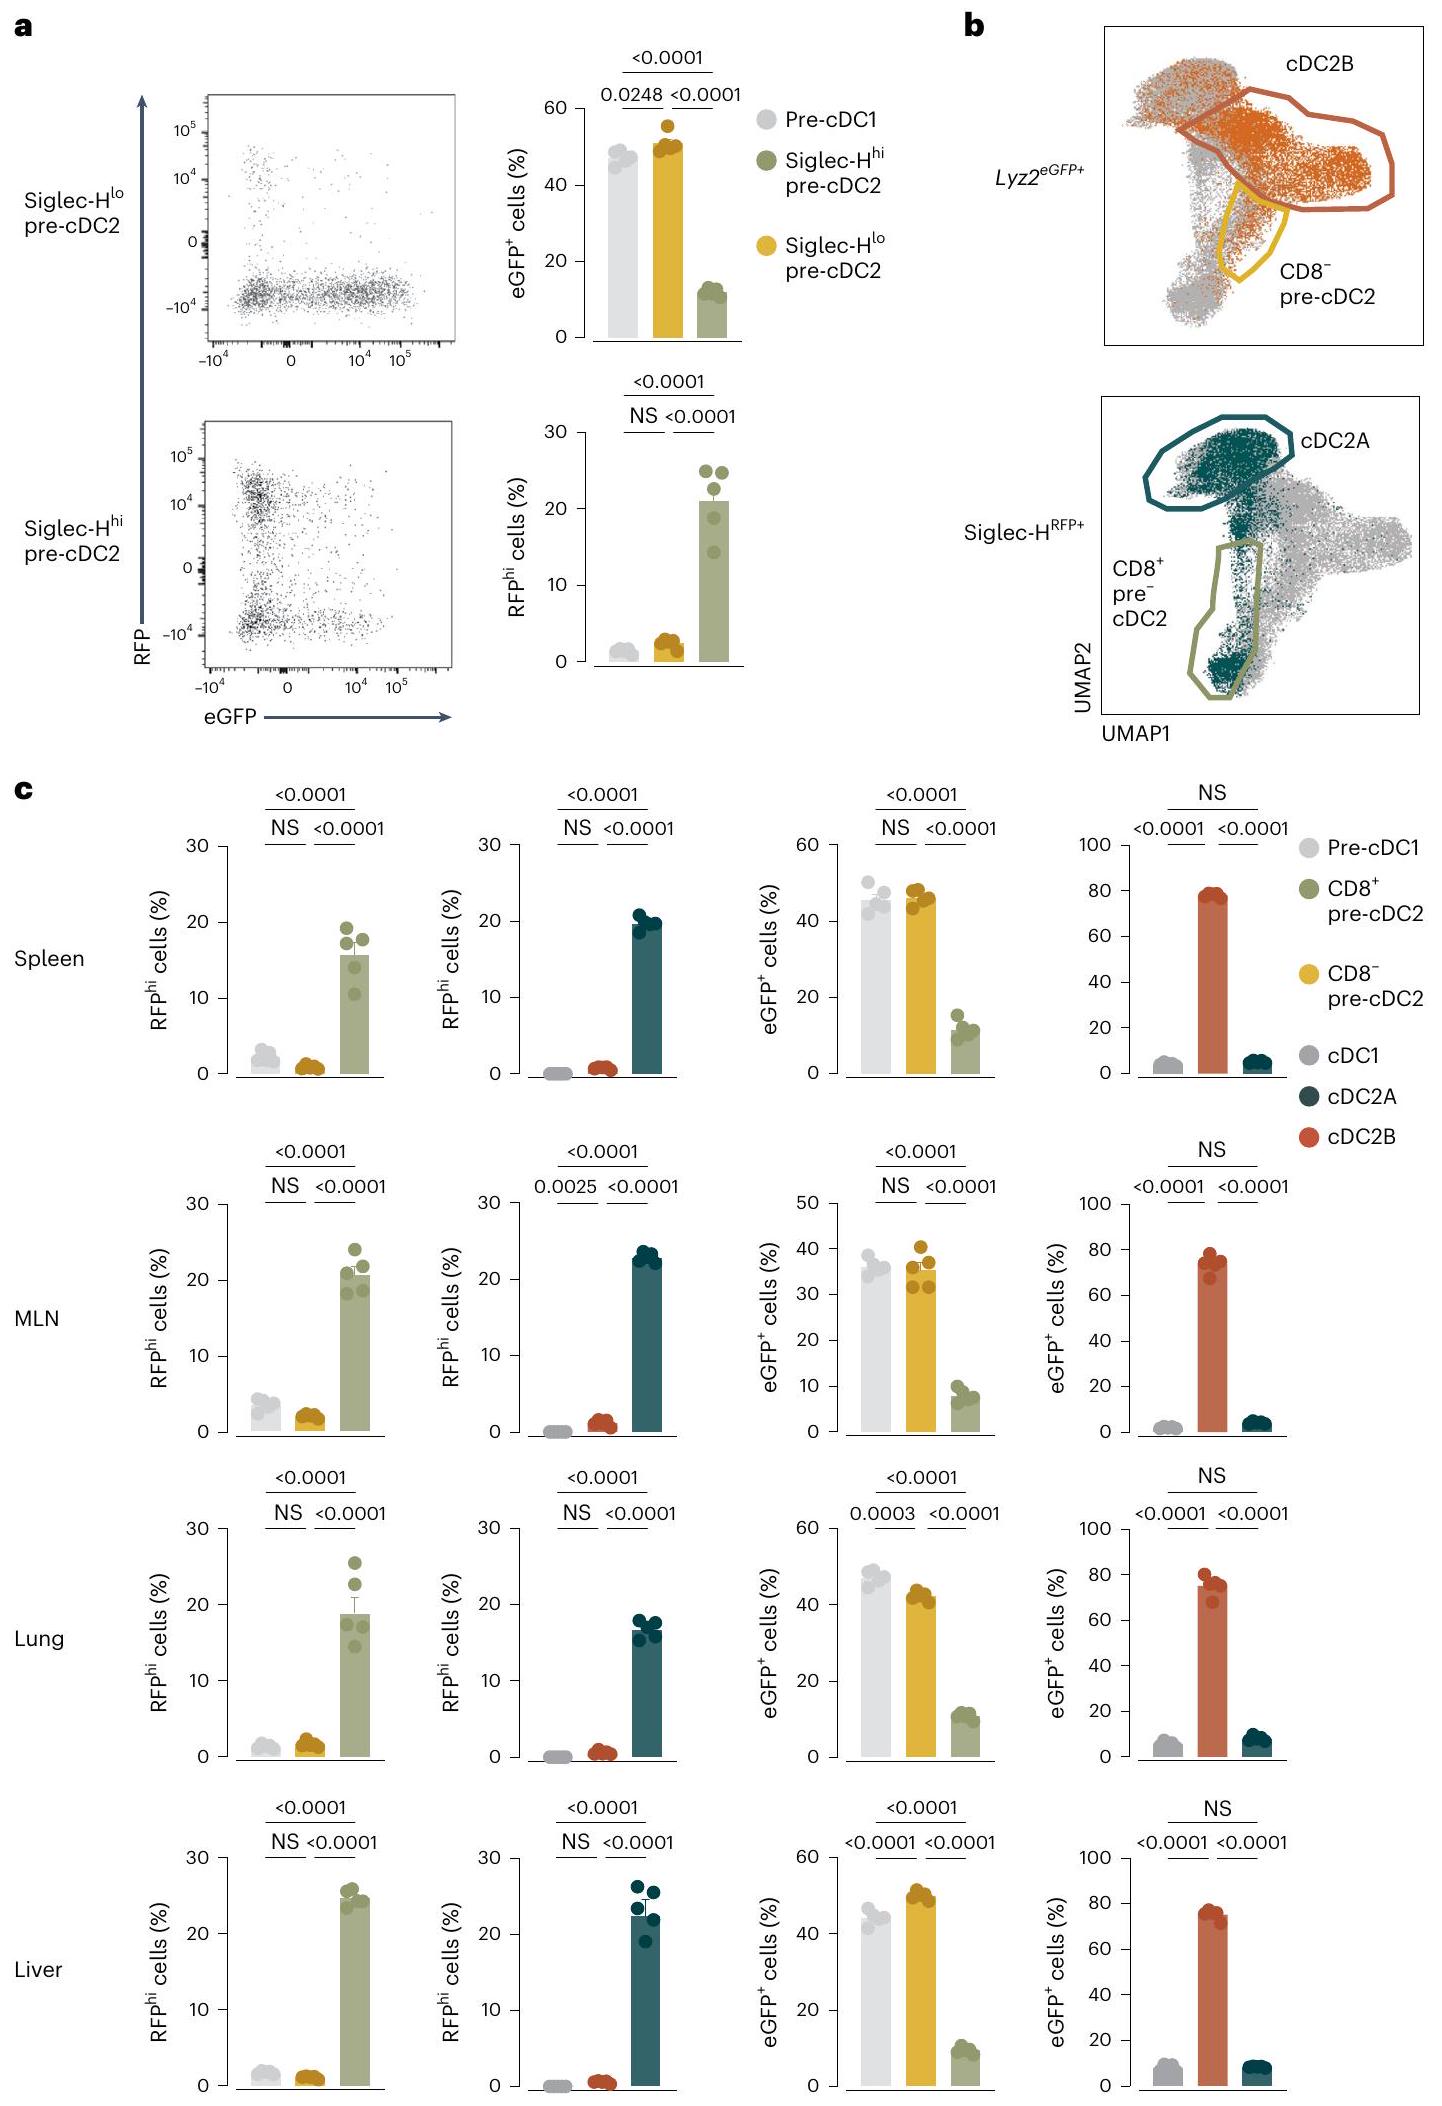
الشكل 7 | تتبع السلالة يؤكد وجود تطور متميز لـ CDC2A و CDC2B سلالات. أ، مخططات تدفق تمثيلية لتعبير RFP و eGFP على Siglec-و سيجلك-pre-cDC2s ونسبة Siglec-و LysM-eGFPالخلايا بين pre-cDC1s و Siglec-أو سيجلك-pre-cDC2s من نخاع العظم لـ SigHليزالفئران. تم تحديد الخلايا الجذعية المبدئية باستخدام UMAPs كما في الشكل التوضيحي الممتد 7b-d.b، UMAPs تمثيلية (مجمعة من الطحال، العقد اللمفاوية المتوسطة، الرئة والكبد) تم إنشاؤها على CD11cلينالخلايا باستخدام CD11c، MHC-II، CD26، CD64، CD88، XCR1، SIRPإيسام، CLEC12A، CD11b، CD43، CD135، CD117، Ly6C و
CD8كما في الشكل 4c-e من البيانات الموسعة، تراكب RFP و eGFP الخلايا في cDC2As و CDC 2 Bs وأوما قبل cDC2s. ج، نسبةأو eGFPcDC2As و cDC2Bs و pre-cDC1s و CD8pre-cDC2s أو CD8تم تحديد الخلايا السابقة لـ cDC2 باستخدام UMAPs كما هو موضح في الشكل 4c-e من البيانات الموسعة من الطحال، العقد اللمفاوية المتوسطة، الرئة والكبد من SigHليزفئران. بوابات لطلب تقديم العروضو GFPتم إعداد الخلايا باستخدام نظائرها من خلايا الفئران البرية. كل نقطة تمثل فأراً واحداً ( ); البيانات من إحدى التجربتين (المتوسط تم استخدام تحليل التباين الأحادي (ANOVA) مع تصحيح توكي للمقارنة.القيم موضحة أعلاه الرسوم البيانية. و سيجلك-تمت زراعة خلايا pre-cDC2s مع Flt3L فقط، وتمايزت إلى cDC2s، كما تم قياسه من خلال زيادة تعبير MHC-II و SIRP. (الشكل 5أ). ومع ذلك، لم تؤد إلى ظهور T-bet-ZsGreenالخلايا ما لم يتم زراعتها مع خلايا التغذية OP9-DL4، التي توفر جزيئات Notch (الشكل التمديدي 8e)، في وجود اللمفوتوكسين الفأري المعاد التركيب (الشكل 5a، b). في هذا السياق، Siglec-pre-cDC2s، ولكن ليس Siglec-pre-cDC2s، تم إنتاج T-bet-ZsGreencDC2As (الشكل 5أ، ب). هذا أكد على الأهمية إشارات Notch في مسار تمايز cDC2A وقد دفعنا ذلك لتقييم تأثيره على pre-cDC2s. على الرغم من أن C9a و C9a كان لدى الفئران أعداد مكافئة من Siglec-و سيجلك-pre-cDC2s في نخاع العظام ووpre-cDC2s في المحيط (الشكل 8f من البيانات الموسعة)، أظهر تحليل تسلسل RNA الكمي الشامل أن pre-cDC2s من نخاع العظامأظهرت الفئران المعدلة جينياً ملف تعبير جيني متغير (الشكل 8g من البيانات الموسعة والجدول 6 التكميلي).
كان هذا ملحوظًا بشكل خاص بالنسبة لـ Siglec-pre-cDC2s (الجدول التكميلي 6). حدد تحليل إثراء مجموعة الجينات (GSEA) ‘الإشارات بواسطة Notch’، بالإضافة إلى دورة الخلية وإشارات مستقبلات السيتوكين كمسارات متغيرة فيسيجلكpre-cDC2s (الشكل 5c). وبالتالي، كانت إشارات Notch حاسمة بشكل خاص لاستمرار تطوير Siglec- في نخاع العظامpre-cDC2s.
تبدأ تحديد مجموعة ما قبل cDC2 في نخاع العظام
بعد ذلك، قمنا بنقل Siglec- بشكل تكييفيأو سيجلك-نخاع العظام pre-cDC2s من فئران CD45.2T-bet-ZsGreen إلى متلقين CD45.1 الذين تعرضوا للإشعاع تحت القاتل. في اليوم الثالث بعد النقل، استعدنا أعدادًا متساوية من CD45.2خلايا من الطحال لكلتا مجموعتي المتلقين وكان معظمهاpre-cDCs (الشكل 6أ). Siglec-تمتلك خلايا pre-cDC2s تفضيلاً لاكتساب CD8وتعبير T-bet-ZsGreen، في حين أن Siglec-ظلّت خلايا pre-cDC2s سلبية لكلا العلامتين (الشكل 6ب، ج). في اليوم السادس بعد النقل، وهو نقطة زمنية سمحت بالتحويل الكامل للخلايا المنقولة إلى cDC2s، تقريباًمن CD45.2كانت الخلايا SIRPMHC-IIسي دي(الشكل 6د، هـ). سيجلك-تفضل خلايا ما قبل cDC2s أن تعطيأوcDC2s، بينما Siglec-الخلايا الجذعية قبل cDC2 تفضل أن تعطي نشأة لـ CLEC12AcDC2s (الشكل 6f)، مما يؤكد الملاحظات السابقة. على الرغم من أن لا سيغليك في نخاع العظاملا cDC2s ولا Siglec-أظهرت خلايا pre-cDC2s تعبيرًا قابلًا للاكتشاف عن T-bet-ZsGreen في وقت النقل، Siglec-أظهرت خلايا pre-cDC2s ميلاً متزايداً لإنتاج T-bet-ZsGreencDC2s (الشكل 6g-i). أشارت هذه التجارب إلى أن انحياز سلالة CDC 2 A و CDC 2 B كان قد تم طباعته بالفعل على مستوى pre-cDC2s التي تخرج من نخاع العظام.
تشير تتبعات السلالة إلى نشوء متميز لـ CDC2A و CDC2B
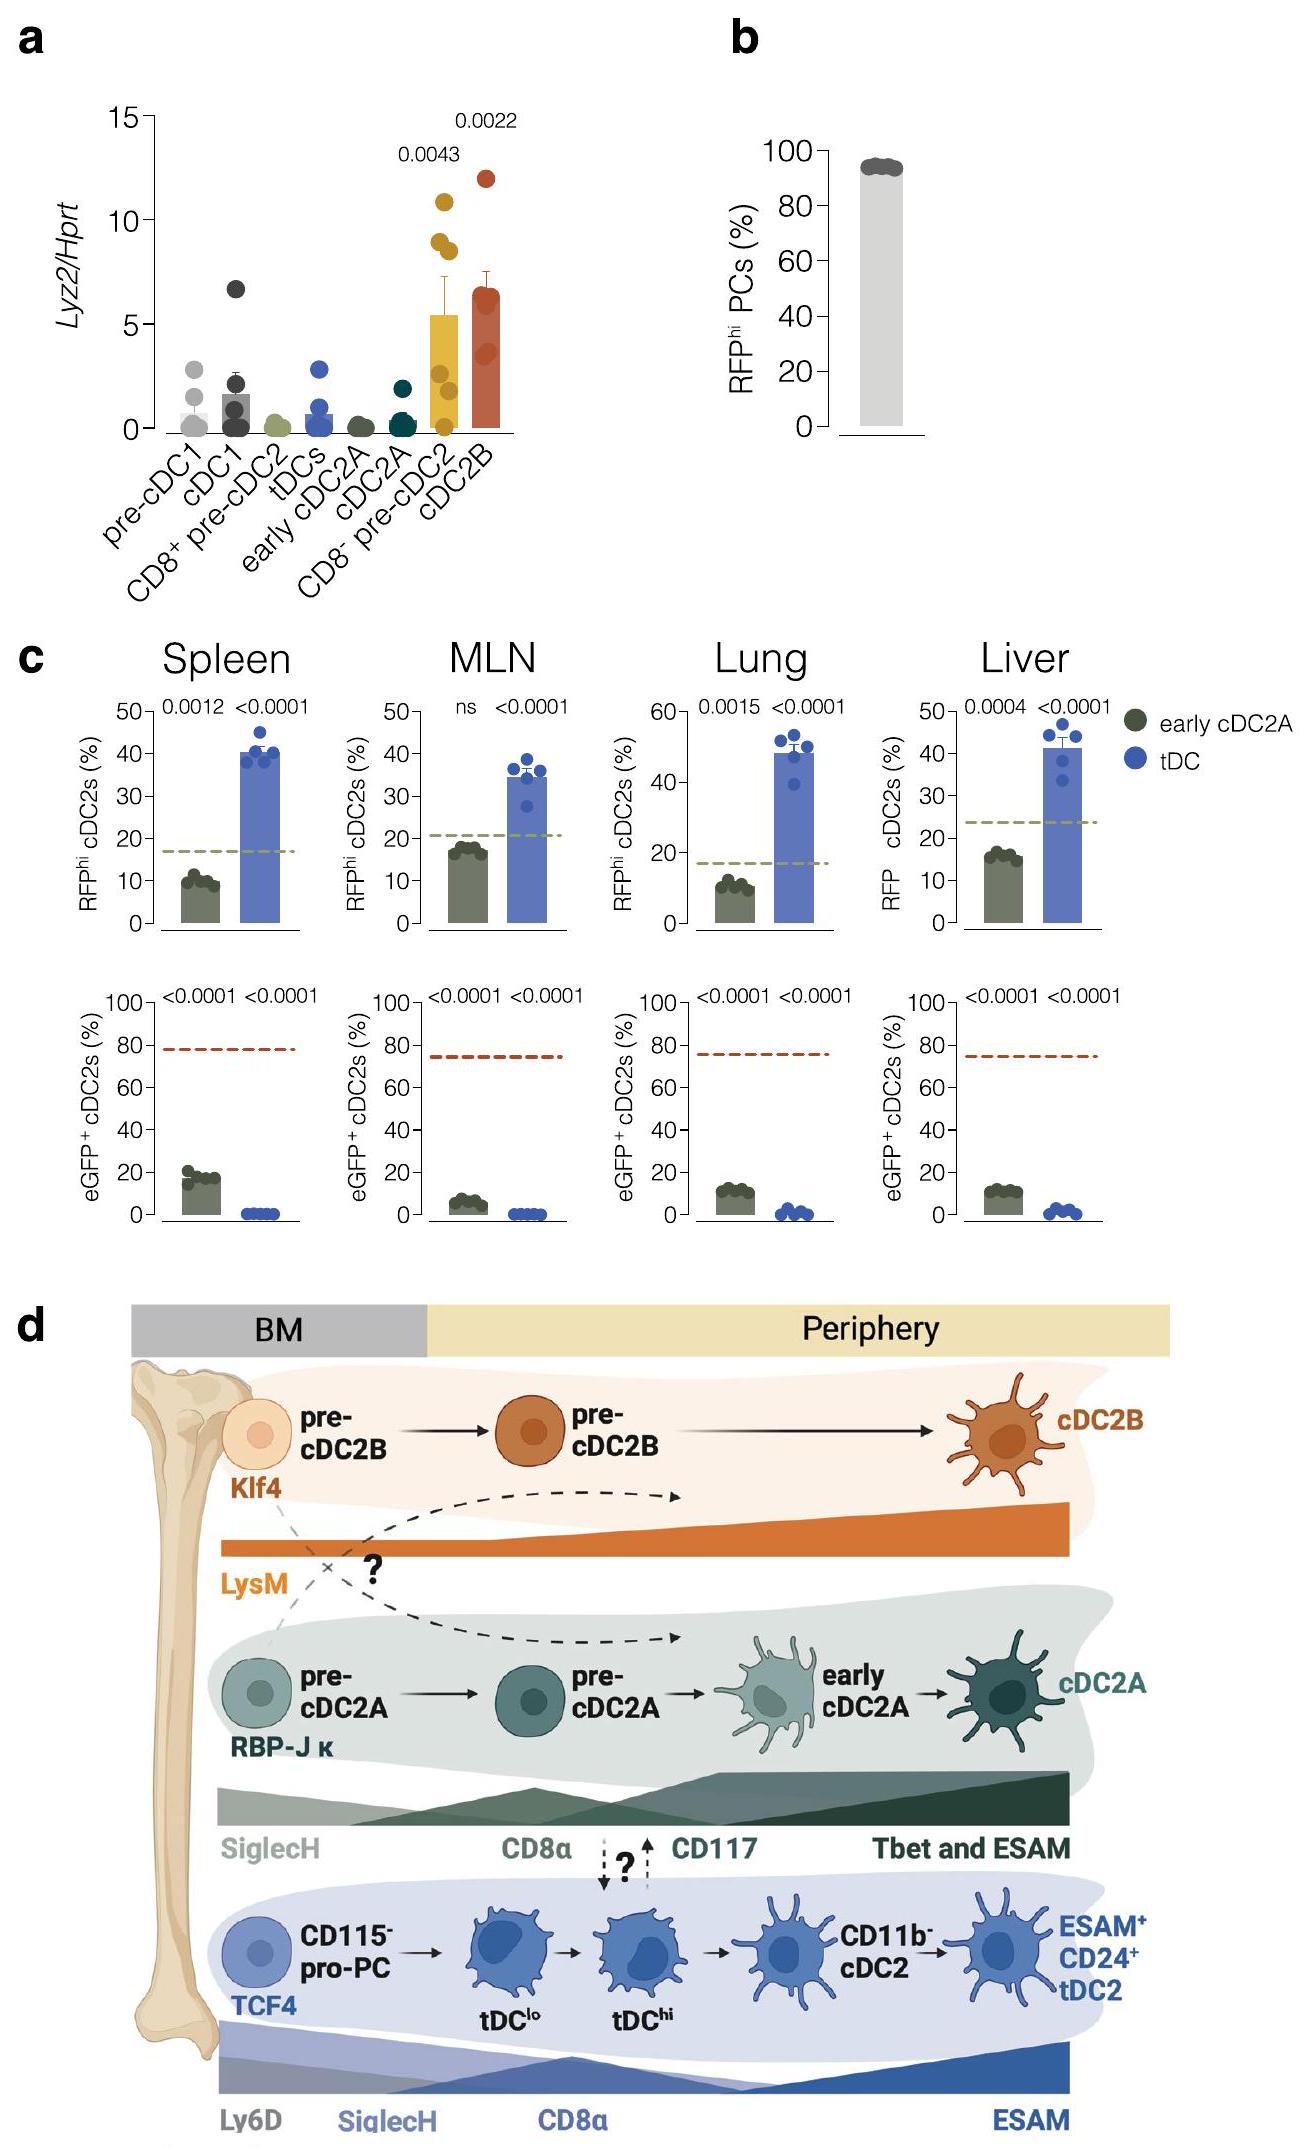
لتأكيد هذه النتائج دون نقل الخلايا أو الإشعاع، استخدمنا Siglech روزا26 فئران (يشار إليها فيما بعد بـ SigH )، التي تتبع نسل سلفيات تعبر عن Siglec-H . في الوقت نفسه، سعينا لتعريف pre-cDC2Bs و cDC2Bs بشكل مستقل عن عدم تعبير Siglec-H و CD8أو T-bet. أظهرت تحليل التعبير الجيني لخطوط cDC2A مقابل cDC2B (الشكل 4 ب والشكل التمديدي 9أ) أن LysM (Lyz2) قد يعمل كعلامة للأخيرة. بناءً على ذلك، قمنا بعبور SigHفئران إلىضغط المراسللإنشاءليزالفئران. الخلايا البلازماوية، التي تعبر عن سيجلك-كان بروتين الفلورسنت الأحمر (RFP) من نوع Siglec-Hفي هذه الفئران (الشكل التوضيحي الممتد 9ب). نسبة عالية من ( ) من tDCs كانت أيضًا Siglec-H-RFP (الشكل 9c من البيانات الموسعة)، وهو ما يتماشى مع الفكرة التي تفيد بأنهم يمكنهم التعبير عن Siglec-H وينحدرون من Siglec-سلف الخلايا البلازماوية. في سلالة cDC، وُجد وسم Siglec-H-RFP في نخاع العظام Siglec-pre-cDC2s ) ولكن ليس سيجلك – pre-cDC2sأو ما قبل cDC1s (الشكل 7أ)، بينما تم العثور على تعبير بروتين الفلورسنت الأخضر المعزز بـ LysM (eGFP) في Siglec-pre-cDC2sسيجلك-pre-cDC2sو pre-cDC1s ( ) (الشكل 7أ). على الرغم من أن تعبير Siglec-H قد انقطع عندما غادرت خلايا pre-cDC2A نخاع العظام، إلا أن الثنائية ظلت محفوظة عبر الأعضاء اللمفاوية وغير اللمفاوية المحيطية: تكرار Siglec-كانت الخلايا أعلى بين الأنسجةما قبل cDC2s أكثر من CD8pre-cDC2Bs أو pre-cDC1s (CD8pre-cDC2s:; CD8 pre-cDC2s:; ما قبل cDC1s: )، بينما كان العكس صحيحًا لخلايا LysM-eGFP (CD8pre-cDC2s:; CD8 ما قبل cDC2s:; ما قبل cDC1s: ) (الشكل 7ب، ج). في حجرة cDC2 المتمايزة، كان وسم Siglec-H-RFP مقصورًا إلى حد كبير على EsamcDC2As و cDC2As المبكرة، تعكس تسمية CD8تمت ملاحظة تعبير LysM-eGFP بشكل تفضيلي في CLEC12AcDC2Bs وكانت غائبة في cDC1s (الشكل 7ب، ج). كانت هذه البيانات متسقة مع الفكرة القائلة بأن cDC2As و cDC2Bs مشتقة من Siglec- متميزة. و LysM السابقة (الشكل 9d من البيانات الموسعة).
تحديد نخاع العظام لـ cDC2s محفوظ عبر الأنواع
قمنا بإعادة تحليل مجموعة بيانات منشورة أبلغت عن cDC2As و cDC2Bs بين نظائر HLA-DR (HLA-DR)خلايا من الطحال البشري.
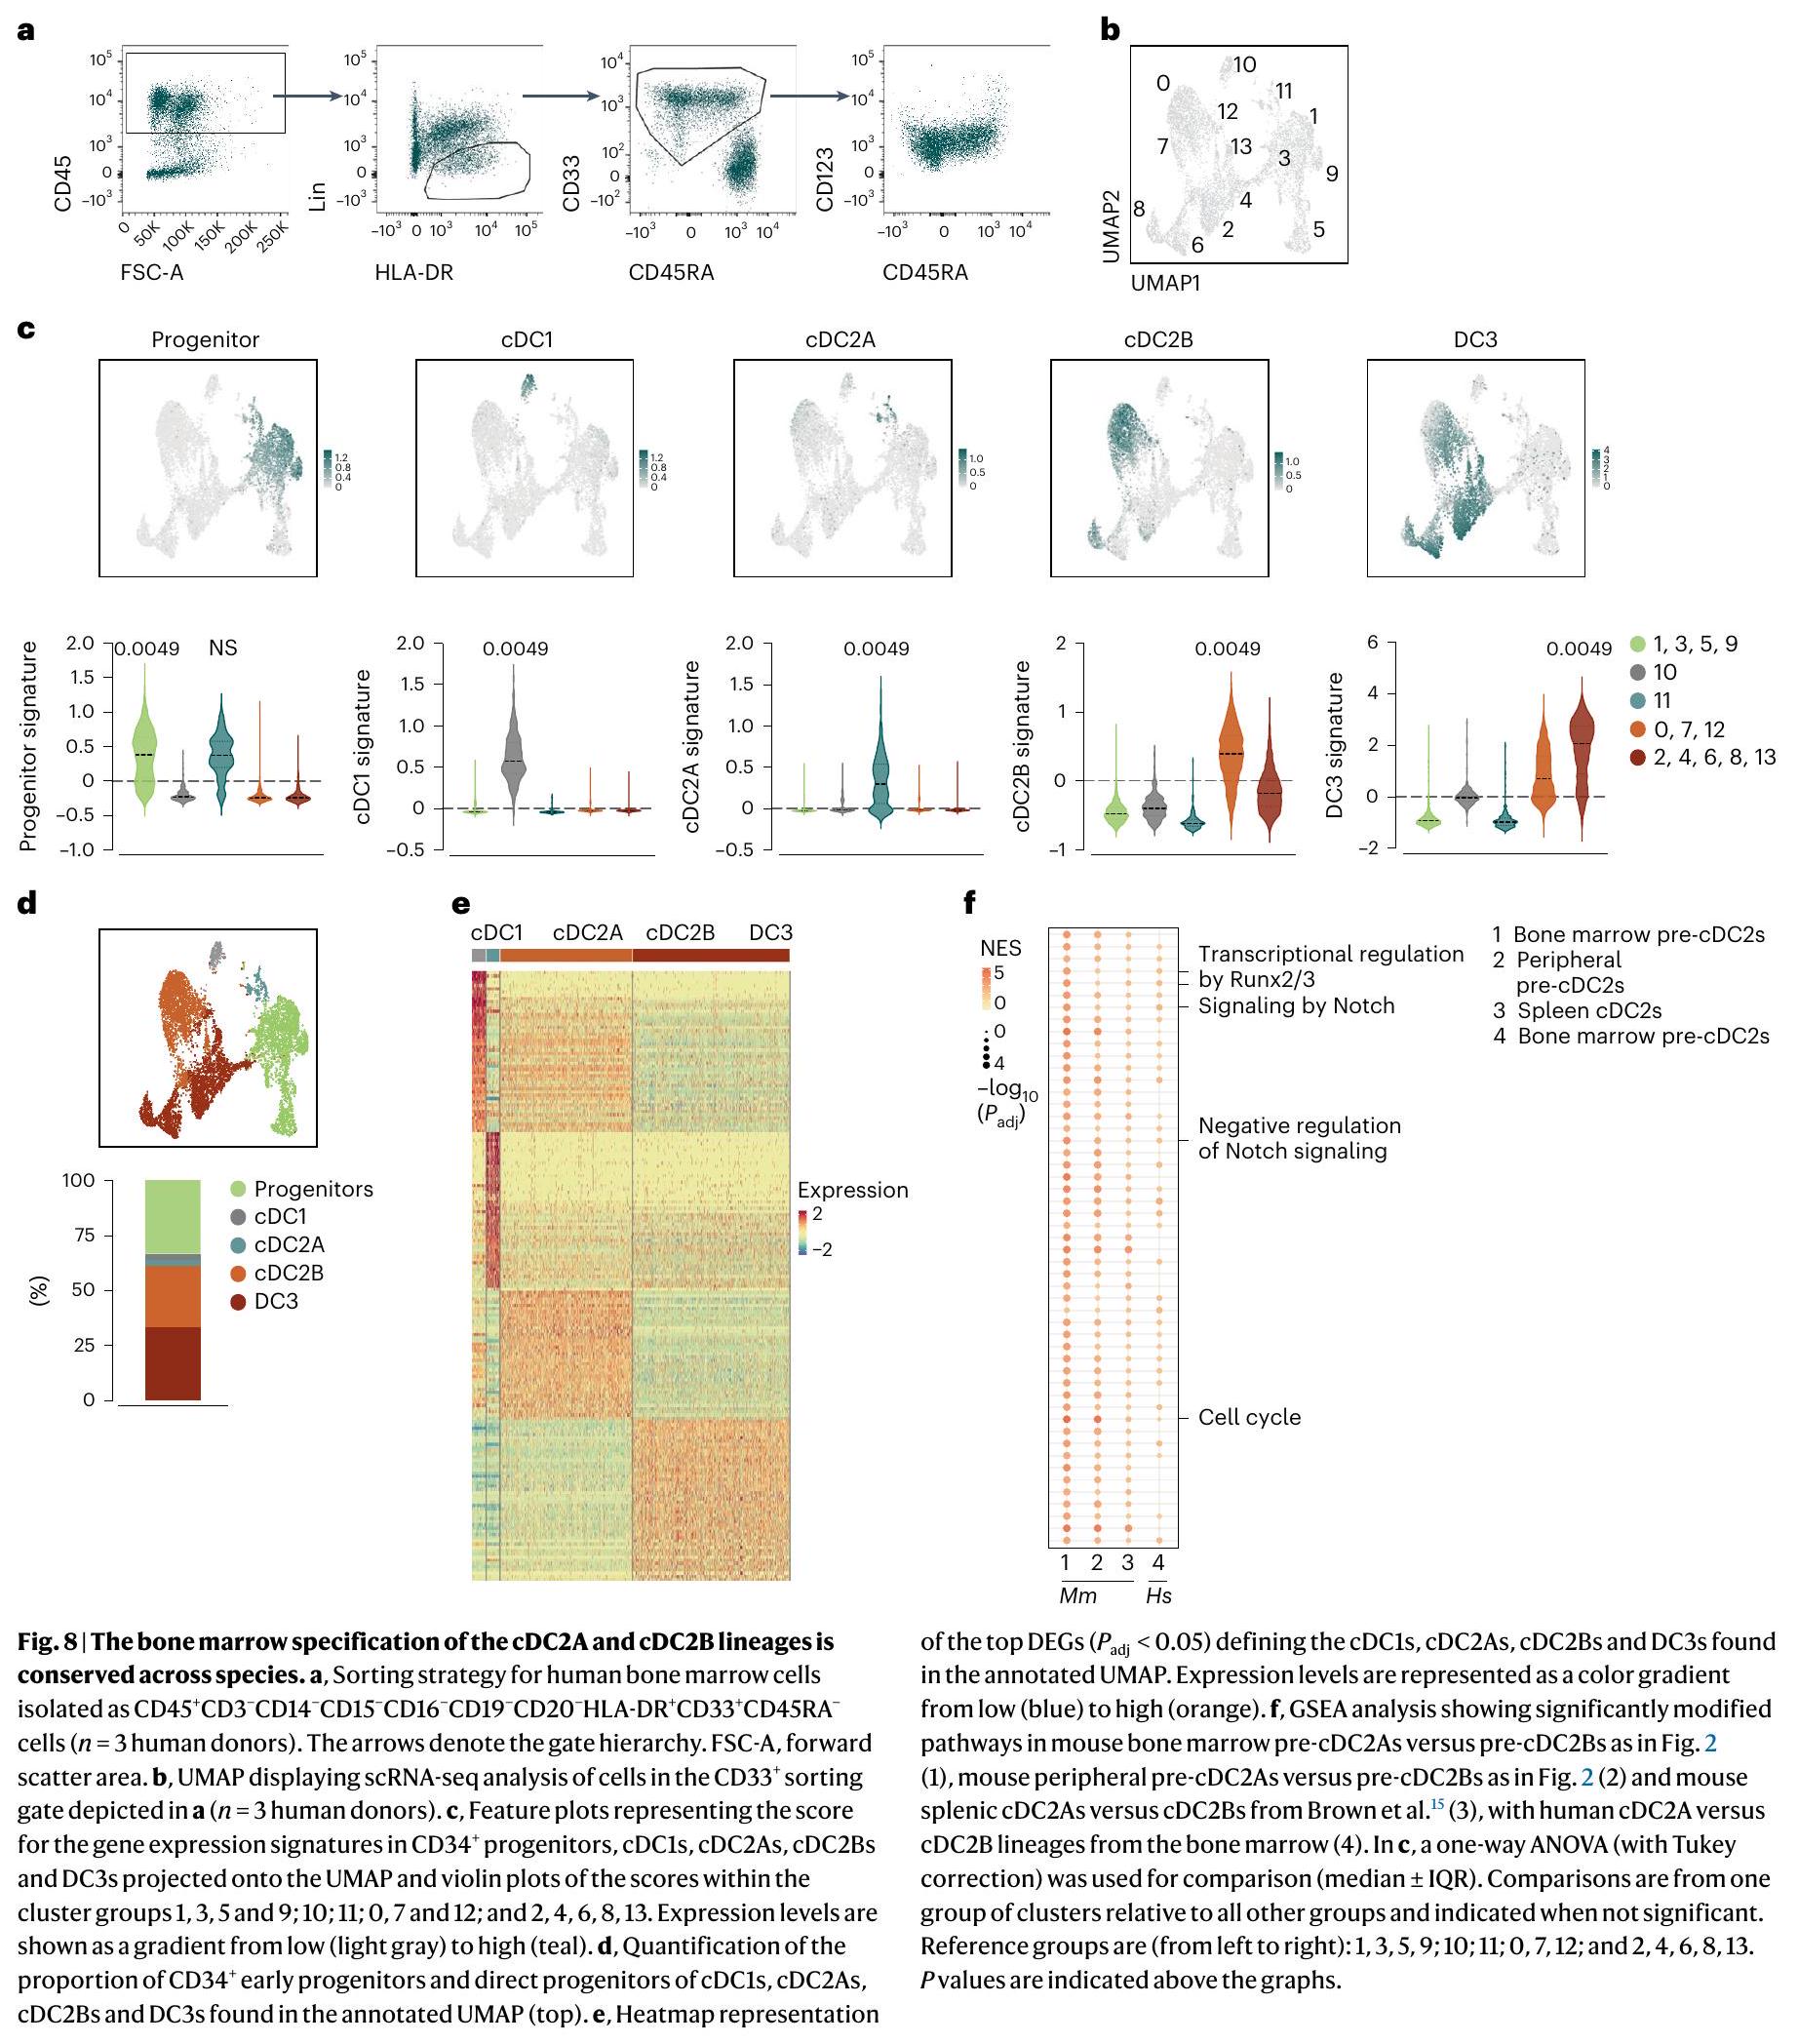
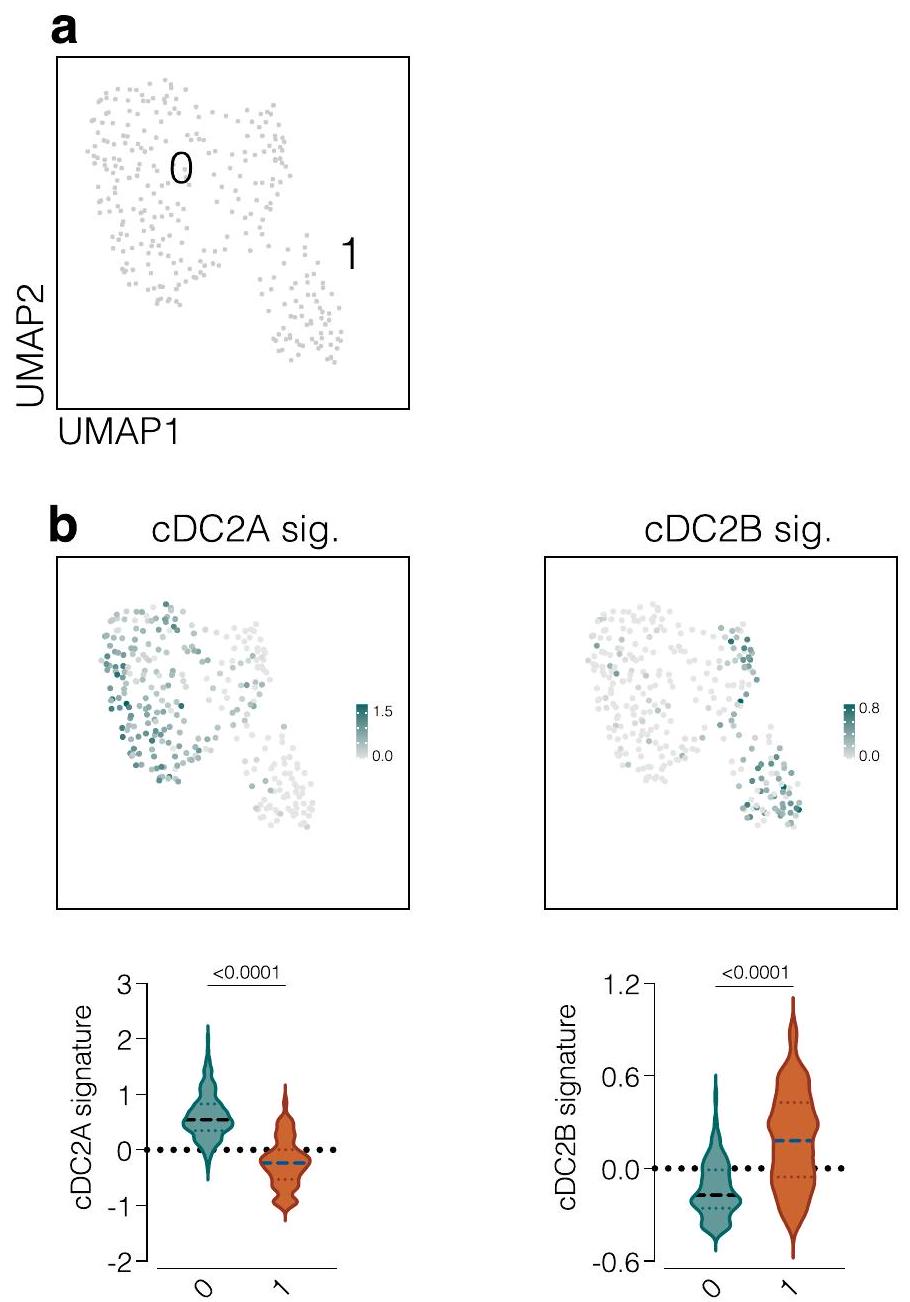
حددنا مجموعة صغيرة منيمكن تقسيم الخلايا السابقة لـ cDCs إلى مجموعتين تشبهان cDC2As أو cDC2Bs (الشكل التمديدي 10a، b)، مما يشير إلى أن الطحال البشري يحتوي على pre-cDC2As و pre-cDC2Bs. لتقييم ما إذا كانت هذه الخلايا السابقة لـ cDC2s يمكن العثور عليها أيضًا في نخاع العظام، قمنا بتنقيتها باستخدام استراتيجية تصنيف تم تطويرها سابقًا لخلايا cDCs في الدم البشري وسابقاتها.. CD3- CD14-CD15- CD1 تم فرز الخلايا من نخاع العظام للمتبرعين البشر (الشكل 8أ) وخضعت لتحليل تسلسل RNA أحادي الخلية. بعد استبعاد عدد قليل من الملوثات، قمنا بإنشاء خريطة UMAP تضمنت 8,240 خلية و14 مجموعة (الشكل 8ب). استخدمنا توقيعات جميع مجموعات خلايا DC التي تم تحديدها سابقًا في البشر، بما في ذلك cDC1 وcDC2A وcDC2B وDC3 (المراجع 15، 21، 23) (الجدول التكميلي 7) لتوضيح المجموعات وشملنا توقيعًا للخلايا السلفية. (الجدول التكميلي 7) لتصور اتجاه التمايز. وُجدت السلف السابقة في المجموعات 1 و3 و5 و9 بينما احتوت المجموعة 10 على سلالة pre-cDC1/cDC1 (الشكل 8c). أظهرت المجموعة 11 أعلى درجة لتوقيع cDC2A بينما وُجدت pre-cDC2Bs/cDC2Bs في المجموعات 0 و7 و12 وDC3s في المجموعاتو 13 (الشكل 8c). بشكل عام، وجدنا ثلاث مجموعات متميزة من الخلايا الجذعية المبدئية/ الخلايا الجذعية الناضجة (cDC1 و cDC2A و cDC2B)، و DC3s (الشكل 8d، e والجدول التكميلي 8). من الجدير بالذكر أن تحليل المسار الجيني (GSEA) الذي يقارن بين سلالات cDC2 في الفئران إلى جانب cDC2A/cDC2A البشرية (العنقود 11) وcDC2B/pre-cDC2B (العناقيد 0 و7 و12) أظهر تداخلًا كبيرًا في المسارات التي كانت غنية في سلالة cDC2A عبر الأنواع (الشكل 8f). وبالتالي، يبدو أن تحديد مجموعة cDC2A/cDC2B محفوظ عبر الفئران والبشر.
نقاش
يمكن أن تساهم أنواع الخلايا المتميزة أو حالات الخلايا المختلفة في تباين cDC2s. في هذه الدراسة، حددنا pre-cDC2s في نخاع العظام والف tissues المحيطية في الفئران التي أظهرت ميلًا مختلفًا لتوليد cDC2As مقابل cDC2Bs وقد تفسر الأنواع cDC2 التي تم وصفها سابقًا. تمامًا كما هو الحال في الفصل بين cDC1s و cDC2s، بدأت تحديد cDC2As و cDC2Bs في نخاع العظام. هذه البيانات تدعم نموذجًا حيث يتم تحديد مجموعات cDC (cDC1 و cDC2A و cDC2B) والسلالات ذات الصلة (DC3s، الخلايا البلازمية، tDCs) مسبقًا في نخاع العظام وتشكل مجموعات DC حقيقية بدلاً من حالات الخلايا المحددة بواسطة الأنسجة.
لم نتمكن من التأكد مما إذا كانت pre-cDC2As و pre-cDC2Bs ذات قدرة أحادية، حيث لاحظنا وجود قدرة متبقية في نخاع العظام.أو الطحالمن cDC2 السابقة لتوليد cDC2Bs. قد يعكس هذا المرونة ولكنه قد يمثل أيضًا قيودًا تقنية في فرز الخلايا أو في اختراق إعادة التركيب التي يتم الوساطة بها بواسطة Cre في تتبع السلالة. بالإضافة إلى ذلك، لم تعبر بعض الخلايا الناتجة في تجارب تتبع السلالة لدينا، وفي نقل الأحياء واختبارات التمايز في المختبر، عن علامات سمحت لنا بتصنيفها إما إلى سلالات cDC2A أو cDC2B. سيكون التحليل النسلي، بالإضافة إلى تصنيف أكثر شمولاً، مهمًا في المستقبل لتمييز انحياز السلف عن الالتزام المطلق. Siglec-و سيجلك-يُقترح أن تمثل خلايا ما قبل cDC2 مراحل تطويرية متميزة لـ. وجدنا أيضًا مجموعة من خلايا ما قبل cDC2 في نخاع العظام التي لم تعبر أبدًا عن Siglec-H وتنتج cDC2Bs. كما أظهرنا أن Siglec-فقدت خلايا pre-cDC2As تعبير Siglec-H عند مغادرتها نخاع العظم، بالتزامن مع اكتساب CD8.التعبير وقبل التمايز النهائي إلى cDC2As في الأنسجة. هذا يتماشى مع تقرير سابق يفيد بأن Siglec-يمكن أن تعطي الخلايا السابقة لـ cDC2لكنه يجادل بأن هذه الحالة تنطبق فقط على cDC2As وليس على cDC2Bs.
يمكن أن تدفع الأماكن العضوية المحددة الكريات البيضاء الأحادية البالغة لتصبح ماكروفاجات مقيمة مشابهة لتلك التي استعمرت الأعضاء خلال الحياة الجنينية.. في هذا السياق، تتجاوز إشارات الأنسجة التطور الجنيني لتحديد مصير خلايا المايلويد. ومع ذلك، على عكس البلعميات النسيجية التي يمكن أن تعيش حتى 18 شهرًا في الفئران و11 عامًا في البشرتُقدّر مدة حياة خلايا cDCs في أنسجة الفئران بـأيام في معظم الأعضاءقد يفسر هذا لماذا يتم تحديد مجموعات cDC2 مسبقًا في نخاع العظام، حيث قد لا يكون لديهم الوقت الكافي ليتم ‘توجيههم’ بواسطة بيئتهم.
ومع ذلك، فإن هذا لا ينفي أهمية البيئة الدقيقة للأنسجةكما أظهرنا أن الخلايا السابقة لـ cDC2 تحتاج إلى بيئة ملائمة لإكمال تمايزها. يمكن أن تؤثر الإشارات البيئية المختلفة في الأعضاء اللمفاوية مقابل الأعضاء غير اللمفاوية على تكاثر ونمط حياة أنواع ما قبل cDC2 أو نسلها، مما يفسر النسبة المتباينة بين cDC2A و cDC2B في هذه الأعضاء. بما يتماشى مع هذه الفكرة،تتكاثر cDC2As أكثر من EsamcDC2s استجابةً للسموم اللمفاوية المعبر عنها بواسطة ILC3s الطحاليةيمكن أن يؤثر التعبير التفاضلي لمستقبلات الكيموكين في الخلايا الجذعية قبل cDC2A مقابل الخلايا الجذعية قبل cDC2B (على سبيل المثال، Ccr1 وCcr2 وCcr9، كما هو ملاحظ في تحليل scRNA-seq الخاص بنا) أيضًا على تفضيل مجموعات الخلايا الجذعية قبل cDC نحو أعضاء مختلفة.
ركزنا على التطور الجنيني وتعبير الجينات كأداة رئيسية لتعريف الخلايا التغصنية التقليدية، كما فعل الآخرون.لقد تم اقتراح أن السلف الذي يعبر عن Siglec-وتشارك علامات أخرى مع الخلايا البلازمية (التي من المرجح أن تت correspond إلى pre-cDC2 كما هو موصوف في هذه الدراسة) تعمل كسلائف cDC2.. يمكن لـ tDCs توليد Esamالخلايا التي تظهر تداخلًا في النمط الظاهري مع، لكنها متميزة عن، cDC2Asتشير بياناتنا إلى أن cDC2As السابقة تظهر تشابهات في النمط الظاهري مع tDCs، لكنها تنشأ من سلفيات Ly6D-، وتظهر توقيعات تعبير جيني مميزة عن tDCs، ويمكن تمييزها من خلال التعبير الأعلى عن SIRP.، MHC-II، CLEC12A و CD43 وتعبير أقل عن CD24، وتظهر وسمًا أقل من tDCs فيالفئران. وبالتالي، فإن بياناتنا تتماشى مع الفكرة القائلة بأن tDCs و pre-cDC2As تمثل مجموعات متميزة، على الرغم من أننا نلاحظ أن كلاهما يمكن أن يؤدي إلى Esam.DCs (هذا العمل وسولتشوفسكي وآخروناستنادًا إلى تعبير CD11b و CD24، فإن Esam المشتق من tDCقد لا تكون خلايا DCs هي خلايا cDC2A الكنسية، على الرغم من أنه لا يزال يتعين تقييم تعبير T-bet. سيتطلب التحديد الدقيق لخطوط cDC2A و tDC نهجًا وراثيًا، مثل استخدام فئران تتبع السلالة hCD2 أو CD300c.
لقد أظهرت الدراسات مؤخرًا أن DC3s تختلف عن cDCs والوحيدات وتنشأ من Ly6 C.سلالات الخلايا الجذعية أحادية النواة-DC التي لا تمر بمرحلة ما قبل cDC. بالمثل، تنشأ tDCs من Ly6Dسلالات نخاع العظم المشتركة مع البلازما الخلويةيدعم اكتشاف DC3s و tDCs المتميزة من الناحية الأونتوجينية، مع ملاحظاتنا، نموذجًا يكون فيه نخاع العظام هو الموقع الأصلي لانحياز سلف DC نحو مصير cDC1 و cDC2A و cDC2B و DC3 و tDC. ستكون الدراسات الإضافية ضرورية لتحديد درجة المرونة في الالتزام قبل cDC خلال الالتهاب وتقييم الخصائص الوظيفية لسلالات cDC2As و cDC2Bs و DC3s و tDCs.
المحتوى عبر الإنترنت
أي طرق، مراجع إضافية، ملخصات تقارير Nature Portfolio، بيانات المصدر، بيانات موسعة، معلومات إضافية، شكر وتقدير، معلومات مراجعة الأقران؛ تفاصيل مساهمات المؤلفين والمصالح المتنافسة؛ وبيانات توفر البيانات والرموز متاحة فيhttps://doi.org/10.1038/s41590-024-01745-9.
References
Cabeza-Cabrerizo, M., Cardoso, A., Minutti, C. M., Pereira da Costa, M. & Reis e Sousa, C. Dendritic cells revisited. Annu. Rev. Immunol. 39, 131-166 (2021).
Guilliams, M. et al. Dendritic cells, monocytes and macrophages: a unified nomenclature based on ontogeny. Nat. Rev. Immunol. 14, 571-578 (2014).
Tussiwand, R. et al. Klf4 expression in conventional dendritic cells is required for T helper 2 cell responses. Immunity 42, 916-928 (2015).
Lewis, K. L. et al. Notch2 receptor signaling controls functional differentiation of dendritic cells in the spleen and intestine. Immunity 35, 780-791 (2011).
Satpathy, A. T. et al. Notch2-dependent classical dendritic cells orchestrate intestinal immunity to attaching-andeffacing bacterial pathogens. Nat. Immunol. 14, 937-948 (2013).
Persson, E. K. et al. IRF4 transcription-factor-dependent CD11b dendritic cells drive mucosal T helper 17 cell differentiation. Immunity 38, 958-969 (2013).
Schlitzer, A. et al. IRF4 transcription factor-dependent CD11b dendritic cells in human and mouse control mucosal IL-17 cytokine responses. Immunity 38, 970-983 (2013).
Gao, Y. et al. Control of T helper 2 responses by transcription factor IRF4-dependent dendritic cells. Immunity 39, 722-732 (2013).
Kumamoto, Y. et al. CD301b dermal dendritic cells drive T helper 2 cell-mediated immunity. Immunity 39, 733-743 (2013).
Mayer, J. U. et al. Homeostatic IL-13 in healthy skin directs dendritic cell differentiation to promote and inhibit cell polarization. Nat. Immunol. 22, 1538-1550 (2021).
Liu, T. T. et al. Ablation of cDC2 development by triple mutations within the Zeb2 enhancer. Nature 607, 142-148 (2022).
Bosteels, C. et al. Inflammatory type 2 cDCs acquire features of cDC1s and macrophages to orchestrate immunity to respiratory virus infection. Immunity 52, 1039-1056 (2020).
Murphy, T. L. et al. Transcriptional control of dendritic cell development. Annu. Rev. Immunol. 34, 93-119 (2016).
Kasahara, S. & Clark, E. A. Dendritic cell-associated lectin 2 (DCAL2) defines a distinct CD8 dendritic cell subset. J. Leukoc. Biol. 91, 437-448 (2012).
Brown, C. C. et al. Transcriptional basis of mouse and human dendritic cell heterogeneity. Cell 179, 846-863 (2019).
Akagbosu, B. et al. Novel antigen-presenting cell imparts -dependent tolerance to gut microbiota. Nature 610, 752-760 (2022).
Rodrigues, P. F. et al. pDC-like cells are pre-DC2 and require KLF4 to control homeostatic CD4 T cells. Sci. Immunol. 8, eadd4132 (2023).
Cabeza-Cabrerizo, M. et al. Recruitment of dendritic cell progenitors to foci of influenza A virus infection sustains immunity. Sci. Immunol. 6, eabi9331 (2021).
Ginhoux, F., Guilliams, M. & Merad, M. Expanding dendritic cell nomenclature in the single-cell era. Nat. Rev. Immunol. 22, 67-68 (2022).
Leylek, R. et al. Integrated cross-species analysis identifies a conserved transitional dendritic cell population. Cell Rep. 29, 3736-3750 (2019).
See, P. et al. Mapping the human DC lineage through the integration of high-dimensional techniques. Science 356, eaag3009 (2017).
Valente, M. et al. Novel mouse models based on intersectional genetics to identify and characterize plasmacytoid dendritic cells. Nat. Immunol. 24, 714-728 (2023).
Villani, A.-C. et al. Single-cell RNA-seq reveals new types of human blood dendritic cells, monocytes, and progenitors. Science 356, eaah4573 (2017).
Alcántara-Hernández, M. et al. High-dimensional phenotypic mapping of human dendritic cells reveals interindividual variation and tissue specialization. Immunity 47, 1037-1050 (2017).
Sulczewski, F. B. et al. Transitional dendritic cells are distinct from conventional DC2 precursors and mediate proinflammatory antiviral responses. Nat. Immunol. 24, 1265-1280 (2023).
Bar-On, L. et al. dendritic cells are a steady-state population related to plasmacytoid dendritic cells. Proc. Natl Acad. Sci. USA 107, 14745-14750 (2010).
Ginhoux, F. et al. The origin and development of nonlymphoid tissue CD103 DCs. J. Exp. Med. 206, 3115-3130 (2009).
Schraml, B. U. et al. Genetic tracing via DNGR-1 expression history defines dendritic cells as a hematopoietic lineage. Cell 154, 843-858 (2013).
Grajales-Reyes, G. E. et al. Batf3 maintains autoactivation of Irf8 for commitment of a CD8 conventional DC clonogenic progenitor. Nat. Immunol. 16, 708-717 (2015).
Schlitzer, A. et al. Identification of and cDC 2 -committed DC progenitors reveals early lineage priming at the common DC progenitor stage in the bone marrow. Nat. Immunol. 16, 718-728 (2015).
Sichien, D., Lambrecht, B. N., Guilliams, M. & Scott, C. L. Development of conventional dendritic cells: from common bone marrow progenitors to multiple subsets in peripheral tissues. Mucosal Immunol. 10, 831-844 (2017).
Klebanoff, C. A. et al. Retinoic acid controls the homeostasis of pre-cDC-derived splenic and intestinal dendritic cells. J. Exp. Med. 210, 1961-1976 (2013).
Zeng, R., Bscheider, M., Lahl, K., Lee, M. & Butcher, E. C. Generation and transcriptional programming of intestinal dendritic cells: essential role of retinoic acid. Mucosal Immunol. 9, 183-193 (2016).
Vanderkerken, M. et al. ILC3s control splenic cDC homeostasis via lymphotoxin signaling. J. Exp. Med. 218, e20190835 (2021).
Zhu, J. et al. The transcription factor T-bet is induced by multiple pathways and prevents an endogenous Th2 cell program during Th1 cell responses. Immunity 37, 660-673 (2012).
Guilliams, M. et al. Unsupervised high-dimensional analysis aligns dendritic cells across tissues and species. Immunity 45, 669-684 (2016).
Dress, R. J. et al. Plasmacytoid dendritic cells develop from Ly6D lymphoid progenitors distinct from the myeloid lineage. Nat. Immunol. 20, 852-864 (2019).
Rodrigues, P. F. et al. Distinct progenitor lineages contribute to the heterogeneity of plasmacytoid dendritic cells. Nat. Immunol. 19, 711-722 (2018).
Liu, Z. et al. Dendritic cell type 3 arises from Ly6C monocytedendritic cell progenitors. Immunity 56, 1761-1777 (2023).
Pereira da Costa, M. et al. Interplay between CXCR4 and CCR2 regulates bone marrow exit of dendritic cell progenitors. Cell Rep. 42, 112881 (2023).
Delaney, C. et al. Combinatorial prediction of marker panels from single-cell transcriptomic data. Mol. Syst. Biol. 15, e9005 (2019).
Faust, N., Varas, F., Kelly, L. M., Heck, S. & Graf, T. Insertion of enhanced green fluorescent protein into the lysozyme gene creates mice with green fluorescent granulocytes and macrophages. Blood 96, 719-726 (2000).
Calvanese, V. et al. Mapping human haematopoietic stem cells from haemogenic endothelium to birth. Nature 604, 534-540 (2022).
Guilliams, M., Thierry, G. R., Bonnardel, J. & Bajenoff, M. Establishment and maintenance of the macrophage niche. Immunity 52, 434-451 (2020).
Patel, A. A., Ginhoux, F. & Yona, S. Monocytes, macrophages, dendritic cells and neutrophils: an update on lifespan kinetics in health and disease. Immunology 163, 250-261 (2021).
Liu, K. et al. Origin of dendritic cells in peripheral lymphoid organs of mice. Nat. Immunol. 8, 578-583 (2007).
Papaioannou, N. E. et al. Environmental signals rather than layered ontogeny imprint the function of type 2 conventional dendritic cells in young and adult mice. Nat. Commun. 12, 464 (2021).
Kabashima, K. et al. Intrinsic lymphotoxin- receptor requirement for homeostasis of lymphoid tissue dendritic cells. Immunity 22, 439-450 (2005).
Waskow, C. et al. The receptor tyrosine kinase Flt3 is required for dendritic cell development in peripheral lymphoid tissues. Nat. Immunol. 9, 676-683 (2008).
Publisher’s note Springer Nature remains neutral with regard to jurisdictional claims in published maps and institutional affiliations.
البحث في هذه المخطوطة يتوافق مع جميع اللوائح الأخلاقية ذات الصلة. تم التخطيط لتجارب الفئران وفقًا لمبادئ الثلاث Rs (الاستبدال، التخفيف، التحسين). تم إجراء جميع التجارب وفقًا لقانون الحيوانات في المملكة المتحدة (إجراءات علمية) لعام 1986. تم اعتماد جميع الباحثين من قبل وزارة الداخلية البريطانية للتعامل مع الحيوانات وإجراء التجارب. تم منح الإذن لإجراء أبحاث على الحيوانات في معهد فرانسيس كريك من قبل الهيئة الأخلاقية المؤسسية ومنحتها وزارة الداخلية البريطانية بموجب PPL PF40C0C67.
فئران
C57BL/6J (CD45.1“), C57BL/6J (CD45.2“), T-bet-ZsGreen (تاكونيك بيوساينسز)، Rbpj (مختصر إلى RBPJ)، Clec9a (مختصر إلى C9a)، Flt3l (تاكونيك بيوساينس)، روزا26تم تربية فئران (مختبر جاكسون) في معهد فرانسيس كريك في ظروف خالية من مسببات الأمراض المحددة.فئران (B6-سيغليش ) تم إنتاجها بواسطة مركز المناعة الظاهرية (مارسيليا، فرنسا) وتم عبورها مع روزا و السلالات. تم إعادة تهجين جميع سلالات الفئران المعدلة وراثيًا مع C57BL/6J؛ تم مطابقة الفئران الذكور والإناث الذين تتراوح أعمارهم بين 6-12 أسبوعًا من حيث العمر والجنس في جميع التجارب.
نخاع العظام البشري
تم شراء نخاع العظام البشري من شركة STEM CELL Technologies وتم معالجته كما هو موضح سابقًاباختصار، تم إذابة خلايا من ثلاثة متبرعين مستقلين (امرأة تبلغ من العمر 31 عامًا، ورجلين يبلغان من العمر 29 و24 عامًا) في مصل فتي يحتوي على DNase I.تم غسلها وتلوينها لفرز الخلايا المعتمد على الفلورية (FACS) كما هو موضح أدناه (الأجسام المضادة المستخدمة للتلوين مدرجة في الجدول التكميلي 10). بعد الفرز، تم تجميع خلايا ما قبل الدندريتية (pre-DCs) والدندريتية (DCs) من الأفراد الثلاثة لتقليل التباين الفردي قبل تقديمها لتسلسل RNA أحادي الخلية (scRNA-seq).
تحضير تعليقات الخلايا المفردة
تم ضخ الفئران داخل القلب من خلال البطين الأيسر باستخدام محلول PBS البارد قبل جمع الأنسجة. وتم ضخ الكبد بشكل إضافي في الموقع عبر الوريد البابي. كانت هذه العملية فعالة في إزالة الخلايا الدائرة كما تم تقييمه عن طريق حقن جسم مضاد CD45 (عن طريق الوريد) قبل دقيقتين من جمع الأنسجة ومعالجتها.تم قطع الطحال، والعقد اللمفاوية المتوسطة، والرئتين، والكبد إلى قطع صغيرة وتم هضمها باستخدام الكولاجيناز الثامن.“سيغما-ألدريتش” و DNase Iروشي) في معهد روسويل بارك التذكاري (RPMI) وسط 1640 لمدة 15 دقيقة (الطحال والعقد اللمفية المتوسطة) أو 25 دقيقة (الرئة والكبد) فيتم تمرير الأنسجة المهضومة عبرمنخل الخلايا (BD Biosciences) وغسل بمحلول FACSتم إثراء كريات الدم البيضاء في الرئة والكبد باستخدام الطرد المركزي بتدرج بيركول (GE Healthcare) كما هو موصوف سابقًا.. بالنسبة لنخاع العظم، تم قطع عظم الفخذ، الساق والعظام الحوضية وتم تدويرها لمدة 30 ثانية عند تم إعادة تعليق الخلايا في محلول FACS بعد الطرد المركزي. بالنسبة لاختبارات النقل، تم جمع العمود الفقري وعظم العضد أيضًا وسحقهما باستخدام هاون قبل جمع تعليق الخلايا باستخدام مايكروبيبت وفلترته باستخداممنخل الخلايا.
إثراء وعزل cDC المسبق
تم إثراء التعليق الخلوي المفرد من نخاع العظم والطحال والرئة لزيادة عدد الخلايا الجذعية القشرية المبدئية (pre-cDCs) عن طريق صبغها بعلامات مقيدة للنسب باستخدام أجسام مضادة مرتبطة بالبيوتين أو الأجسام المضادة المرتبطة بالفلوريسئين إيزوثيوسيانات (FITC) (CD3، Ly6G، Siglec-F، B220، CD19، Ly6D، NK1.1 وTer119) وإزالة خلايا T وB والخلايا البلازمية، بالإضافة إلى خلايا الدم الحمراء والعدلات والحمضات وسلالاتها، باستخدام مجموعة اختيار الإيجابية للبيوتين من EasySep Mouse (STEMCELL Technologies). تم صبغ الخلايا كما هو موضح أدناه. تم فرز مجموعات pre-cDC وcDC باستخدام تقنية فرز الخلايا بالتدفق (FACS) على جهاز Aria Fusion (BD Biosciences) مع “فوهة باستخدام استراتيجية البوابة الموضحة في الأشكال البيانية الموسعة 1ب، 3أ، 4أ و7أ كما هو موضح.
تحليل تدفق الخلايا
تم تحضين الخلايا مسبقًا مع مضاد CD16/32 المثبط في محلول FACS لمدة 10 دقائق فيثم تم صبغها لمدة 40 دقيقة فيمع مجموعة من الأجسام المضادة ومجموعة صبغة الخلايا الميتة القابلة للتثبيت LIVE/DEAD (Thermo Fisher Scientific) في محلول FACS. تشمل علامات السلالة (Lin) CD3 وLy6G وSiglec-F وB220 وCD19 وLy6D وNK1.1 وTer119، ما لم يُذكر خلاف ذلك. الأجسام المضادة المستخدمة في تحليل التدفق الخلوي مدرجة في الجدول التكميلي 10. تم الحصول على العينات باستخدام جهاز BD FACSymphony A5 (BD Biosciences) أو في جهاز ID7000 (Sony Biotechnology) أو أجهزة التحليل الطيفي SpectroFlo Aurora (Cytek). تم تحليل البيانات باستخدام FlowJo (الإصدار 10.8.2) كما هو موضح في الأشكال البيانية الموسعة 1 و4 و8. تحليل UMAPتم إجراء تحليل بيانات تدفق الخلايا بناءً على CD11b و CD11c و CD26 و CD43 و CD64 و CD88 و CD135 و SIRPمركب MHC-II، CD117، Ly6C، Siglec-H، CD8تمت الإشارة إلى تعبير XCR1 و CLEC12A و Esam. تم إجراء توضيح المجموعات على مخططات UMAP باستخدام علامات تعريفية لكل مجموعة مناعية. تم تأكيد دقة تحليل UMAP مقابل التصفية اليدوية من خلال تراكب مجموعات المناعة المختلفة التي تم تحديدها بواسطة أي من الاستراتيجيتين. تم تحديد العدلات و MDCs كما هو موضح في Cabeza-Cabrerizo وآخرون.تم تحديد سلالات الخلايا الجذعية في نخاع العظام سابقًا كما في دراسة كاردوسو وآخرون..
تسلسل RNA أحادي الخلية
تم معالجة خلايا ماوس والبشر pre-cDCs (نسبة البقاء>95%) وفقًا لتعليمات الشركة المصنعة على منصة 10X Genomics Chromium. تم إجراء توليد المكتبة باستخدام مجموعات كواشف الخلايا الفردية 3′ من 10X Genomics وتم تسلسلها على جهاز HiSeq 4000 (Illumina) لتحقيق متوسط حوالي 63,000 قراءة لكل خلية وحوالي 4,000 خلية لكل عينة. تم معالجة القراءات الأولية باستخدام خط أنابيب Cell Ranger v.3.0.2.، التي قامت بفك تشفير القراءات إلى خلاياها الأصلية باستخدام علامات المعرفات الجزيئية الفريدة، وقامت بمحاذاتها إلى النسخة الجينية mm10 (التي أضفنا إليها تسلسل eGFP (https://www.addgene.org/browse/sequence/305137/“) لاكتشاف الخلايا التي تعبر عن GFP) باستخدام STAR (الإصدار 2.5.1b)وتم الإبلاغ عن تقديرات عدد التعبير الجيني المحدد للخلايا. تم إجراء جميع التحليلات اللاحقة في R v.3.6.1 باستخدام حزمة Seurat (v.3)تم اعتبار الجينات ‘معبرة’ إذا كانت التقديراتكان عدد الخلايا على الأقل 0.1. تم إجراء تصفية أولية عن طريق إزالة الخلايا التي تعبر عن أقل من 50 جينًا والخلايا التي تشكل فيها الجينات الميتوكوندرية أكثر من ثلاث انحرافات معيارية عن متوسط الجينات الميتوكوندرية المعبر عنها. تم إجراء تحليل المكونات الرئيسية (PCA) وبعد النظر في مخططات ‘الكوع’ للقيم الذاتية، تم استخدام أول 30 مكونًا لبناء مخططات UMAP لكل عينة. تم دمج عينات متعددة باستخدام 2000 جين متغير وتحليل الارتباط الكنسي لـ Seurat. تم تحديد علامات الجينات الخاصة بالتجمعات باستخدام اختبار ويلكوكسون للرتب؛ تم استخدام أفضل 10 أو 20 جينًا مرتبة وفقًا لتغير اللوغاريتم لكل تجمع لإنشاء خريطة حرارية. تم توضيح التجمعات باستخدام جينات العلامة المعروفة وتوقيعات الجينات (المراجع 15، 30 والجدول التكميلي 9). تم استبعاد التلوث بالخلايا البلازمية وMDCs من خلال دمج بياناتنا مع تحليل scRNA-seq السابق الذي شمل هذه الخلايا. والتحقق من تباين التجمعات. تم استخدام GSEA لتحديد المسارات الغنية في تجمع أو مجموعة منها مقارنة بالآخرين. CytoTRACE تم استخدامه لتحديد حالات تمايز الخلايا. تم تحديد المسارات باستخدام حزمة Slingshot (الإصدار 1.4.0)، باستخدام الكتلة غير المتمايزة كنقطة انطلاق وإحداثيات تقليل الأبعاد UMAP. تم تحديد السلالات التي تظهر مسارات مختلفة تنتهي في خلايا متمايزة محددة (الجدول التكميلي 11). تحليل المذنبتم استخدامه لتحديد علامات تدفق السيتومتر المحتملة للسكان المحددين باستخدام تسلسل RNA أحادي الخلية. تم إجراء التحليل عن طريق تحميل بيانات تسلسل RNA أحادي الخلية، وUMAP، والتجميع من Seurat على بوابة Comet. ).
تسلسل RNA بالجملة
تم فرز الخلايا الجذعية المبدئية (Pre-cDCs) والخلايا الجذعية الناضجة (cDCs) باستخدام تقنية فرز الخلايا بالتدفق (FACS) من نخاع العظام والطحال إما من
WT أو C9a و C9a فئران. خلاياإلىتم فرزها مباشرة في محلول التحلل لتجنب فقدان المادة. تم استخراج RNA باستخدام مجموعة RNeasy Mini (QIAGEN). تم استخدام نظام NuGEN Ovation RNA-Seq (V2) لتخليق الحمض النووي المكمل (cDNA) تلاه نظام NuGEN Ultralow Library (V2) لتحضير المكتبة. تم تطبيع العينات إلى 1 نانوغرام من RNA للإدخال؛ تم إجراء التحضير وفقًا لإرشادات الشركة المصنعة. تم التسلسل على جهاز Illumina HiSeq 4000، مع قراءات أحادية النهاية بطول 100 قاعدة. بعد التسلسل، تم تطبيع العينات وتحليلها. تم استخدام GSEA لتحديد المسارات الغنية في الخلايا من أنماط وراثية مختلفة.
استخراج RNA و RT-qPCR
تم جمع الخلايا في محلول RLT وتم إجراء استخراج RNA باستخدام مجموعة RNeasy Micro (QIAGEN). تم إجراء تخليق cDNA باستخدام إنزيم SuperScript II العكسي (Invitrogen). تم إجراء RT-qPCR باستخدام خليط TaqMan Universal PCR Master Mix (Thermo Fisher Scientific) والبرايمرات (الجدول التكميلي 12). تم إجراء التحليل على نظام PCR QuantStudio (Thermo Fisher Scientific) باستخدامتكميم
اختبارات تمايز الخلايا الجذعية السابقة cDC ونسخ OP9
تم الحصول على خلايا OP9 من ATCC (CRL-2749). OP9 DL1/GFPتم الحصول على الخط من معهد فرانسيس كريك لخدمات الخلايا. لإنشاء خط خلايا مغذية يعبر عن DL4 بشكل مفرط، استخدمنا نظام فيروس لنتي تجاري (نسخة Lenti ORF من Dll4 (موسومة بـ Myc-DDK)، أوريجين). تم إنتاج فيروس لنتي مزيف من فيروس التهاب الفم الحويصلي G (VSVG) عن طريق نقل خلايا HEK 293T بـمن pCMV دلتا R8.2 (Addgene)، من VSVG (Addgene) و تم جمع السائل العلوي بعد 72 ساعة من التحويل، وتم الطرد لإزالة الحطام واستخدامه لنقل خلايا OP9 (CRL-2749، ATCC). بعد 24 ساعة، تم اختيار الخلايا باستخدام البيروميسين ثم تم فرزها بواسطة FACS لزيادة تركيز الخلايا التي تعبر عن DL4 (الشكل التمديدي 8e).
تمت عملية تمايز الخلايا الجذعية المبدئية المستندة إلى Flt3L كما هو موضح في مكان آخرباختصار، تم زراعة الخلايا الجذعية القشرية المبدئية مع خلايا OP9إلى صفائح 96 بئر في وسط RPMI 1640 المدعوم بـ l-glutamine (جيبكو)، البنسلين-ستربتوميسين (جيبكو)، الأحماض الأمينية غير الأساسية (جيبكو)، HEPES (جيبكو)، الصوديوم البيروفاتي (جيبكو)، 10% FCS (سيغما-ألدريتش) و-ميركابتوإيثانول (جيبكو) (R10). ثم، OP9، OP9-DL1/GFP أو تم زرع خلايا OP9-DL4؛ في اليوم التالي،إلىتم إضافة خلايا ما قبل الخلايا الدموية المتمايزة (pre-cDCs) المفروزة من فئران T-bet-ZsGreen إلى طبقة OP9 بعد إزالة الوسط واستبداله بوسط جديد يحتوي على Flt3L من الفئران. ) أو ليمفوتوكسين ( ) (أنظمة البحث والتطوير). تم تقييم خلايا النسل بعد 3 أيام باستخدام تحليل تدفق الخلايا. تم تقييم تمايز خلايا DC وفقًا لزيادة تعبير MHC-II، بينما تم قياس تمايز الخلايا البلازمية وفقًا لتعبير B220 وSiglec-H. تم تعريف cDC1s على أنها ، وتم تعريف CDC 2 s على أنها . تم تقييم مصير CDC 2 باستخدام زيادة تعبير T-bet (تعبير ZsGreen).
تحفيزات Pre-cDC2 و cDC2
تم فرز مجموعات Pre-cDC2 (عالية ومنخفضة Siglec-H) و cDC2 من نخاع العظام والطحال، على التوالي (استراتيجية التصفية موضحة في البيانات الموسعة الأشكال 1b و 7a). بعد ذلك،تم زراعة الخلايا في R10 في وجود وغياب محفزات مختلفة (InvivoGen) بتركيزات مت varying: الفلاجيلين ( ), R848 ( )، ODN CpG وزيموزان (بعد 12 ساعة من الثقافة، تم استرداد الخلايا للتحليل اللاحق باستخدام FACS (OX40L) أو معالجتها لـ RT-qPCR (كما هو موضح أعلاه). كانت قابلية الخلايا المستردة مشابهة عبر أنواع الخلايا والعلاجات، كما تم تقييمها باستخدام قياس التدفق الخلوي.
نقل الخلايا
تم إجراء تجارب نقل الخلايا كما هو موصوف سابقًاباختصار، الطحال ونخاع العظام (الساقين، عظمة الورك، العمود الفقري وعظمة العضد) تم جمعها من فئران CD45.2 C57BL/6J (WT أو Tbx21-ZsGreen). تم فرز مجموعات pre-cDC2s كما هو موضح في الأشكال التكميلية 4a و 7a. الخلاياتم حقنها عن طريق الوريد في فئران CD45.1 C57BL/6J التي تعرضت للإشعاع بشكل شبه مميت (6.6 غيغا) بعد يوم واحد من الإشعاع. تم تحليل خلايا الطحال بعد 3 أو 6 أيام من النقل.
تقييم الانتشار
تم حقن الفئران داخل الصفاق بـ 1 ملغ من EdU (لوميبروبي) قبل ساعتين من جمع الأنسجة لتقييم تكاثر الخلايا. تم إجراء كشف EdU باستخدام مجموعة Click-iT Plus EdU Alexa Fluor 647 لقياس التدفق الخلوي (ثيرمو فيشر ساينتيفيك) بعد صبغ السطح والتثبيت والنفاذية. صبغ داخل النواة لـتم تنفيذ ذلك بالتوازي مع اكتشاف EdU. تم تحليل الخلايا باستخدام قياس التدفق الخلوي كما هو موضح أعلاه.
التحليل الإحصائي وإمكانية التكرار
لم تُستخدم أي طرق إحصائية لتحديد أحجام العينات مسبقًا، لكن أحجام عيناتنا كانت مشابهة لتلك المبلغ عنها في المنشورات السابقة.لم يتم توزيع الفئران عشوائيًا في الأقفاص، ولكن تم تخصيص كل قفص عشوائيًا لمجموعة علاجية. لم يكن الباحثون معزولين عن هوية الفئران أثناء التشريح وتحليل العينات. تم استخدام الفئران الذكور والإناث لإجراء التجارب. ومع ذلك، لم نلاحظ اختلافات بين الجنسين. في جميع الحالات، تم أخذ القياسات من عينات متميزة ولم يتم استبعاد أي نقاط بيانات فردية تحت أي ظرف من الظروف. تم إجراء التحليلات الإحصائية باستخدام برنامج Prism 9 (GraphPad Software). يتم تصوير النتائج كمتوسط.الانحراف المعياري المتوسط والوسيط IQR في مخططات الكمان. الاختبار الإحصائي المستخدم محدد في كل أسطورة شكل. بالنسبة للمقارنات الزوجية، يتم استخدام اختبار مان-ويتني غير المعلمي ذو الطرفين.تم استخدام اختبار -test. عند استخدام ANOVA، تم إجراء تصحيح Tukey. تم افتراض توزيع البيانات على أنه طبيعي، لكن لم يتم اختباره رسميًا. بالنسبة للجدول 1 و 3 و 5، تم استخدام اختبار Wald ثنائي الجانب مع تصحيح Benjamini-Hochberg. بالنسبة للجدول التكميلي 2 و 4 و 6 (DEGs) و 8، تم استخدام اختبار Wilcoxon ذو الجانب الواحد مع تصحيح Benjamini-Hochberg. بالنسبة للجدول التكميلي 6 (الإثراء)، تم استخدام اختبار هايبرجومتري ذو الجانب الواحد مع تصحيح Benjamini-Hochberg. بالنسبة للجدول التكميلي 11، تم استخدام اختبار Wald ذو الجانب الواحد دون تصحيح للاختبارات المتعددة. تم إجراء هذه المقارنات باستخدام DESeq2. الجينات التيتم أخذها إلى الأمام واستخدامها لرسم خريطة حرارية باستخدام حزمة R ComplexHeatmap أو لتوليد توقيع جيني.
ملخص التقرير
معلومات إضافية حول تصميم البحث متاحة في ملخص تقارير مجموعة نيتشر المرتبط بهذه المقالة.
توفر البيانات
تم إيداع بيانات تسلسل RNA أحادي الخلية وبيانات تسلسل RNA الكلي في أرشيف التعبير الجيني تحت أرقام الوصول GSE217328 وGSM6711828 وGSM6711829 وGSM6711830 وGSE244346. جميع البيانات الأخرى اللازمة لتقييم الاستنتاجات في المخطوطة موجودة في المخطوطة أو المعلومات التكميلية.
References
Tanigaki, K. et al. Notch-RBP-J signaling is involved in cell fate determination of marginal zone B cells. Nat. Immunol. 3, 443-450 (2002).
Luche, H., Weber, O., Nageswara Rao, T., Blum, C. & Fehling, H. J. Faithful activation of an extra-bright red fluorescent protein in ‘knock-in’ Cre-reporter mice ideally suited for lineage tracing studies. Eur. J. Immunol. 37, 43-53 (2007).
Huerga Encabo, H., Ulferts, R., Sharma, A., Beale, R. & Bonnet, D. Infecting human hematopoietic stem and progenitor cells with SARS-CoV-2. STAR Protoc. 2, 100903 (2021).
Becht, E. et al. Dimensionality reduction for visualizing single-cell data using UMAP. Nat. Biotechnol. https://doi.org/10.1038/ nbt. 4314 (2018).
Cardoso, A. et al. Interleukin-10 induces interferon- -dependent emergency myelopoiesis. Cell Rep. 37, 109887 (2021).
Zheng, G. X. Y. et al. Massively parallel digital transcriptional profiling of single cells. Nat. Commun. 8, 14049 (2017).
Dobin, A. et al. STAR: ultrafast universal RNA-seq aligner. Bioinformatics 29, 15-21 (2013).
Stuart, T. et al. Comprehensive Integration of single-cell data. Cell 177, 1888-1902 (2019).
Mildner, A. et al. Genomic characterization of murine monocytes reveals C/EBP transcription factor dependence of Ly6C cells. Immunity 46, 849-862 (2017).
Gulati, G. S. et al. Single-cell transcriptional diversity is a hallmark of developmental potential. Science 367, 405-411 (2020).
Street, K. et al. Slingshot: cell lineage and pseudotime inference for single-cell transcriptomics. BMC Genomics 19, 477 (2018).
Schmitt, T. M. & Zúñiga-Pflücker, J. C. Induction of T cell development from hematopoietic progenitor cells by delta-like-1 in vitro. Immunity 17, 749-756 (2002).
Kirkling, M. E. et al. Notch signaling facilitates in vitro generation of cross-presenting classical dendritic cells. Cell Rep. 23, 3658-3672 (2018).
شكر وتقدير
نشكر أعضاء مختبر المناعة الحيوية على المناقشات والمقترحات المفيدة. نشكر منصات التكنولوجيا العلمية للتسلسل المتقدم في كريك، والبحث البيولوجي، وقياس التدفق على دعمهم طوال هذا المشروع. كما نشكر م. غايا على تسهيل التعاون بين مختبرات C.R.S. وM.D. تم دعم هذا العمل من قبل معهد فرانسيس كريك، الذي يتلقى تمويلاً أساسياً من أبحاث السرطان في المملكة المتحدة (CC2090، CC2079 وCC2027)، ومجلس البحوث الطبية في المملكة المتحدة (CC2090، CC2079 وCC2027) ومؤسسة ويلكوم (CC2090، CC2079 وCC2027)؛ منح المحققين المتقدمين من المجلس الأوروبي للبحث AdG 268670 و786674 (إلى C.R.S.)؛ جوائز المحققين من ويلكوم WT106973 وWT223136 (إلى C.R.S.)؛ وجائزة من مؤسسة لويس-جانتيه (إلى C.R.S.). تم تمويل هذا البحث جزئياً من قبل مؤسسة ويلكوم (أرقام المنح: CC2090، CC2079، CC2027، WT106973 وWT223136). تم دعم العمل الذي تم في مختبر M.D. من قبل منحة من مؤسسة الأبحاث الطبية (فريق معتمد، رقم المرجع DEQ20180339172) ومن خلال تمويل مؤسسي من المركز الوطني للبحث العلمي، والمعهد الوطني للصحة والبحث الطبي وجامعة إكس-مارسيليا. لأغراض الوصول المفتوح، قام المؤلفون بتطبيق ترخيص حقوق الطبع والنشر العام CC BY على أي نسخة من المخطوطة المقبولة من المؤلفين الناتجة عن هذا التقديم.
مساهمات المؤلفين
صمم C.M.M. و C.R.S. التجارب، وحللا البيانات وكتبا المخطوطة. قدم D.B. و H.H.E. نخاع العظام البشري. قدم J. Langhorne الفئران الطافرة. قدم M.D. و E.T. الفئران الطافرة وساهموا في تصميم تجارب تتبع المصير. أجرى C.M.M. التجارب بمساعدة من C.P. و M.P.d.C. و N.R. و H.H.E. و A.C. و J. Loong و G.B. و C.M. و E.T. ساعد C.P. و M.P.d.C. و P.C. و C.M. و E.T. في تحليل البيانات. قام C.M.M. و P.C. بإجراء التحليل الإحصائي. أشرف C.R.S. على المشروع. راجع جميع المؤلفين وحرروا المخطوطة.
تمويل
تم توفير تمويل الوصول المفتوح من قبل معهد فرانسيس كريك.
المصالح المتنافسة
يمتلك C.R.S. تعيينًا إضافيًا كأستاذ زائر في كلية الطب في إمبريال كوليدج لندن ويشغل مناصب شرفية في كلية لندن الجامعية وكلية كينغز لندن. C.R.S. هو مؤسس شركة Adendra Therapeutics ويمتلك خيارات أسهم أو يعمل كمستشار مدفوع الأجر لشركات Adendra Therapeutics وBicara Therapeutics وMontis Biosciences وBicycle Therapeutics، وجميعها غير مرتبطة بهذا العمل. يعلن المؤلفون الآخرون عدم وجود مصالح متنافسة.
معلومات مراجعة الأقران تشكر مجلة Nature Immunology المراجعين المجهولين على مساهمتهم في مراجعة هذا العمل. المحرر الرئيسي: كانت إيوانا ستايتكو المحرر الرئيسي في هذه المقالة وأدارت عملية التحرير ومراجعة الأقران بالتعاون مع بقية فريق تحرير Nature Immunology.
الشكل البياني الممتد 1| انظر الصفحة التالية للتعليق.
الشكل البياني الممتد 1 | استراتيجية تصنيف cDC2 في الطحال. أ، استراتيجية التصنيف المستخدمة في 1أ. اللوحة الأكثر يسارًا تظهر الخلايا التي تم تصنيفها مسبقًا على أنها مفردة، حية،يتضمن كوكتيل السلالة أجسامًا مضادة ضد CD3 وLy6G وSiglecF وB220 وCD19 وNK1.1 وLy6D وTer119.و MHC -IIتُحدد الخلايا في البداية، بعد ذلكو CD64تنقسم cDCs إلى cDC1s () و cDC2s (SIRP ). بعد استبعاد CD8 تم تقسيم tDCs و cDC2s إلى ZsGreenو ZsGreen لمزيد من التحليل. الأسهم تشير إلى تسلسل البوابات.استراتيجية الفرز لخلايا cDC2s في الطحال. اللوحة الأكثر يسارًا تُظهر الخلايا التي تم تصنيفها مسبقًا على أنها مفردة، حية،يتضمن كوكتيل السلالة أجسامًا مضادة ضد CD3 وLy6G وSiglecF وB220 وCD19 وNK1.1 وLy6D وTer119.وتُحدد الخلايا في البداية، بعد ذلكو CD64تنقسم مراكز السيطرة على الأمراض إلىو.
بعد استبعاد CD8تم تحديد tDCs (أزرق داكن)، وcDC2As (أخضر مائل إلى الأزرق) وcDC2Bs (برتقالي) باستخدام ESAM وCLEC12A، على التوالي. الأسهم تشير إلى تسلسل البوابات. ج، تم وضع البوابات اليدوية من B على UMAP (نفسه كما في 1b) لـ Lin CD11c.الخلايا (من البوابة الأولى للاستراتيجية اليدوية في أ). تم إنشاء UMAP بناءً على CD11c و MHC-II و CD26 و CD64 و CD88 و XCR1 و SIRPESAM، CLEC12A، CD11b، CD43، CD135، CD117، Ly6C، وCD8تم تحديد خلايا cDC2s في UMAP الأيسر وتم تكبيرها في اللوحات التالية، حيث تم تراكب مجموعات cDC2 المحددة يدويًا. انظر أيضًا الشكل 1b. د، يتم عرض تعبير العلامات الرئيسية المستخدمة لتعريف مجموعات فرعية مختلفة من CDC و tDC في UMAPs في شكل خرائط حرارية. يتم تمثيل مستويات التعبير كتدرج لوني من منخفض (أزرق) إلى مرتفع (برتقالي).
الشكل 2 من البيانات الموسعة | انظر الصفحة التالية للتعليق.
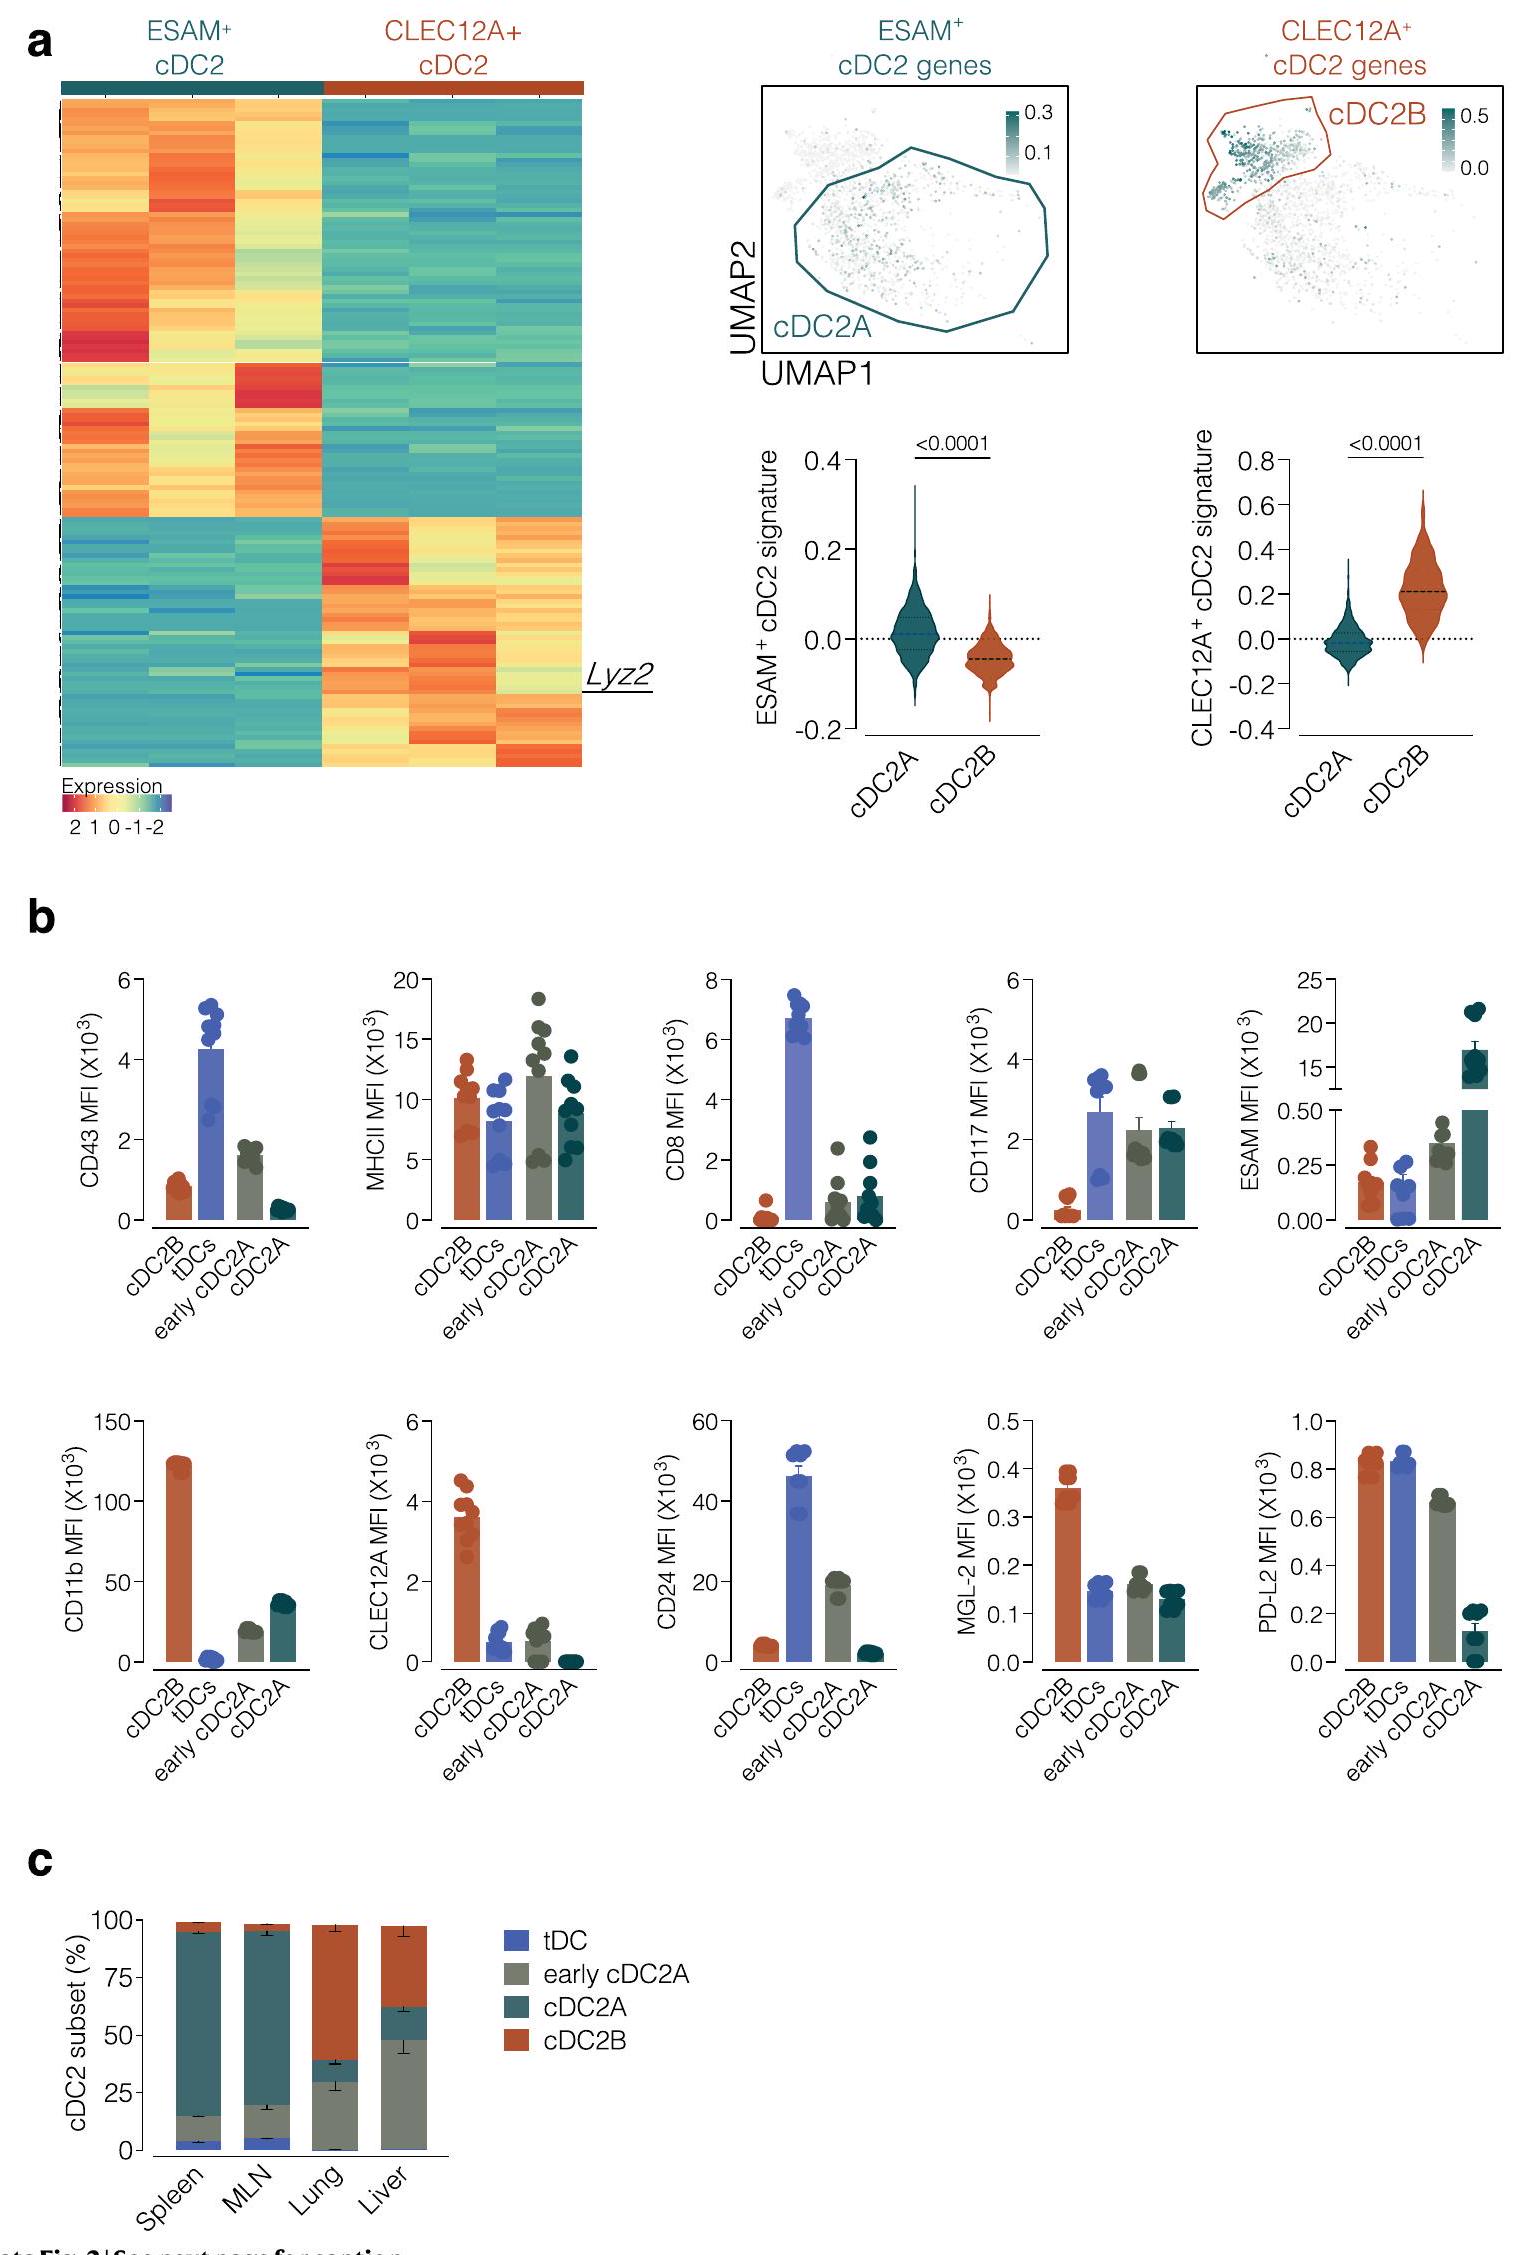
الشكل البياني الممتد 2 | التحقق من استراتيجية تصنيف cDC2 في الطحال. أ، (يسار) تمثيل خريطة حرارية لأعلى الجينات المعبر عنها بشكل مختلف (قيمة p المعدلة لـ ) من تحليل RNAseq الضخم الجديد لاثنين من مجموعات cDC2 (ESAMcDC2s و CLEC12Aتم فرز cDC2s) باستخدام استراتيجية التصفية الموضحة في الشكل الإضافي 1b (يتم عرض PCA لاحقًا في الشكل الإضافي 5a). يتم تمثيل مستويات التعبير كتدرج لوني من المنخفض (الأزرق) إلى العالي (البرتقالي). يمثل كل عمود عينة تأتي من مجموعة من 5 فئران. لاحظ أن تعبير Esam و Clec12a و Tbx21 لم يتم اكتشافه أو لم يكن ذا دلالة في التحليل الإحصائي. (يمين) تمثيلات الميزات التي تمثل درجة DEGs من (استخدمت كعلامات) ESAM.cDC2s و CLEC12Aتم وضع cDC2s على خريطة UMAP لـ cDC2As و cDC2Bs التي تم إنشاؤها من مجموعة بيانات scRNAseq الخاصة بـ Brown et al.
تظهر مستويات التعبير كتدرج من منخفض (رمادي فاتح) إلى مرتفع (أخضر مزرق). يتم عرض تقدير الدرجات في الأسفل على شكل مخططات كمان. ب، (من اليسار إلى اليمين ومن الأعلى إلى الأسفل) تحليل FACS يظهر CD43، MHC-II، CD8.“، CD117، ESAM، CD11b، CLEC12A، CD24، MGL-2 و PD-L2 التعبير عنهم في مجموعات cDC2 و tDC في الطحال (المحددة من بوابات UMAP كما هو موضح في الشكل 1b والشكل البياني الممتد 1c، d). ج، تحليل FACS يظهر نسبة المجموعات المختلفة (المحددة كما هو موضح في الشكل 1b والشكل البياني الممتد 1c، d) في الأنسجة المحددة. البيانات في ( ) هي مجموعة من تجربتين ( ) (يعني SEM، الوسيط IQR لرسم الكمان). كل نقطة في ب تمثل فأراً واحداً (تم استخدام اختبار مان-ويتني (ذو الاتجاهين) لمقارنة cDC2As و cDC2Bs في A. يتم الإشارة إلى قيم P في أعلى الرسوم البيانية.
الشكل البياني الموسعانظر الصفحة التالية للتعليق.
الشكل البياني الممتد 3| التحقق من استراتيجية الفرز لتصنيف مجموعات الخلايا السلفية الكلية precDC من الأنسجة. أ، استراتيجية الفرز للخلايا السلفية precDC (وغيرها من الخلايا السلفية لتحديد أي منها هو الخلايا السلفية precDC الحقيقية). تم تحليل الخلايا الفردية الحية من تعليقات الطحال أو نخاع العظام السلبية لمؤشرات السلالة (CD3، Ly6G، SiglecF، B220، CD19، NK1.1، وTer119) والإيجابية لـ CD45.2 كما يلي:تم اختيارهم، من هذا البوابة،الخلايا احتوت على الخلايا الجذعية السابقة لـ cDCs وملوثات أخرى.الخلايا تحتوي على مجموعتين: Ly6Dو Ly6Dالخلايا. Ly6Dتم فرز الخلايا مباشرة ككتلة واحدة (البوابة الرمادية). تم تقسيم خلايا Ly6D إلى ثلاث تحت مجموعات تم فرزها كما هو موضح في اللوحة الرابعة: CD11b (البوابة الزرقاء الفاتحة)، CD11b (بوابة زرقاء داكنة) و CD11b (البوابة البرتقالية). الأسهم تشير إلى تسلسل البوابات.تم فرز السكان المميزين في اللوحات 3 و 4 من نخاع العظام (الأعلى) أو الطحال (الأسفل) وزراعتهم لمدة 3 أيام مع خلايا الستروما OP9-DL1 في وجود Flt3L. البيانات هي تحليل FACS يظهر نسبة الاسترداد بعد التمايز وتكرار مجموعات cDC والخلايا البلازمية بين النسل. تم تحليل هذه السكان باستخدام التصفية اليدوية. وكانت تعرف على أنها: عازب، حي،الخلايا. يتم تعريف CDC 1 على أنهابينما تعبر cDC 2 عن SIRPتظهر اللوحة اليمنىتوزيع مجموعة فرعية من النسل من الخلايا المفروزة بعد التمايز. ج، تحليل FACS يظهر وسم TdTomato للسكان الخلويين المشار إليهم من نخاع العظام أو الطSplen من C9a.تم تصنيف الفئران كما هو موضح في (أ). تحليل FACS يظهر وفرة مجموعات الخلايا المحددة (المصنفة كما هو موضح في (أ)) في نخاع العظام والطحال للفئران WT والفئران التي تفتقر إلى Flt3L. (هـ) استراتيجية تصنيف مصقولة تم استخدامها لفرز إجمالي pre-cDCs من الأنسجة مع الأخذ في الاعتبار النتائج من (أ-د). في هذه الاستراتيجية، يتم تحديد pre-cDCs على أنها كريات دم بيضاء سلبية للعديد من العلامات المحددة للنسب (CD3، Ly6G، SiglecF، B220، CD19، Ly6D، NK1.1، وTer119)، بالإضافة إلى كونها سلبية/منخفضة للتعبير السطحي عن MHC-II، CD11b وSIRP.، ولكن إيجابي لـ CD11c و CD135 و CD43. كل نقطة تمثل فأراً واحداً (في ب و د و 8 في ج). البيانات من تجربة واحدة من تجربتين (ب، د) أو مجموعة من اثنتين (ج) (المتوسطاتتم استخدام اختبار مان-ويتني (ذو الاتجاهين) لمقارنة الفئران WT و Flt3l- / في (د). يتم الإشارة إلى قيم P في أعلى الرسوم البيانية.
الشكل البياني الممتد 4 | تحديد مجموعة ما قبل الخلايا الجذعية الدندريتية في الطحال، العقد اللمفاوية المتوسطة، الرئة والكبد. أ، استراتيجية الفرز لمجموعات ما قبل الخلايا الجذعية الدندريتية في الطحال. تم تحديد اللوحة اليسرى الأكثر على أنها مفردة، حية،وسلالةخلايا الطحال. يتضمن مزيج السلالة أجسامًا مضادة ضد CD3 وLy6G وSiglecF وB220 وCD19 وNK1.1 وLy6D وTer119. يتم استخدام CD117 وLy6C لتحديد pre-cDC1s (رمادي داكن) وprecDC2s، على التوالي. CD8يُصنف ما يُفترض أنه pre-cDC2As (أخضر فاتح) بينما يُعتبر ما يُفترض أنه pre-cDC2Bs CD8(أصفر). الأسهم تشير إلى تسلسل البوابات. ب، (يسار) مخططات الكمان تظهر تعبير و في الخلايا السابقة لـ cDC1s (العناقيد 3 و 6) أو الخلايا السابقة لـ cDC2s (العناقيد ) من تحليل scRNAseq (UMAP للبيانات المجمعة من جميع الأنسجة). (يمين) تم فرز إجمالي pre-cDCs أو المجموعات الفرعية المحددة من الطحال (استراتيجية الفرز كما في الشكل 4a من البيانات الموسعة) وزرعها لمدة 3 أيام مع خلايا الستروما OP9-DL1 في وجود Flt3L. تم تحليل النسل بعد التمايز بواسطة FACS لتوزيع مجموعة CDC. تم تحليل الخلايا باستخدام التصفية اليدوية وتعريفها على أنها: مفردة، حية، CD45.2CD11cMHC-IIتُعرَّف CDC1s بأنهابينما تعبر cDC2s عن SIRP. تم وضع بوابات يدوية كما في الشكل 4a من البيانات الموسعة للخلايا الجذعية القشرية الأولية (pre-cDCs) وكما في الشكل 1b من البيانات الموسعة للخلايا الجذعية القشرية (cDC) على تحليل UMAP للطحال (نفسه كما في 3b). الألوان للخلايا الجذعية القشرية الأولية تتوافق مع البوابات في a. تم إنشاء UMAP باستخدامالخلايا من البوابة الأولى للاستراتيجية اليدوية في أ، واستخدام العلامات التالية: CD11c، MHC-II، CD26، CD64، CD88، XCR1، SIRPESAM، CLEC12A، CD11b، CD43، CD135، CD117، Ly6C، وCD8. د، يتم عرض تعبير العلامات الرئيسية المستخدمة لتعريف مجموعات فرعية مختلفة من cDC قبل النضوج في UMAPs (من الطحال في 3ب) في شكل خرائط حرارية. يتم تمثيل مستويات التعبير كتدرج لوني من منخفض (أزرق) إلى مرتفع (برتقالي). هـ، تحليل UMAP تمثيلي من الطحال، MLN، الرئة والكبد. تم إنشاء UMAP كما في ب. الخلايا غير المصنفة هي cDC1s وcDC2s المتنقلة، وربما DC3s ولم يتم تحليلها في هذه الدراسة. في ب (اليمين) البيانات هي مجموعة من تجربتين ( ) (يعني SEM والوسيطتم استخدام اختبار مان-ويتني (ذو الاتجاهين) للمقارنات. يتم الإشارة إلى قيم P في أعلى الرسوم البيانية.
الشكل البياني الممتد 5 | التحقق من الاستراتيجية لتحديد مجموعات ما قبل cDC2 الطحالية. أ، تحليل المكونات الرئيسية لجميع الجينات المعبر عنها من تسلسل RNA الكمي (نفس الشكل البياني الممتد 2أ) للسكان المحددين الذين تم فرزهم من الطحال كما هو موضح في الأشكال البيانية الممتدة 1ب و4أ. ب، (يسار) تمثيل خريطة حرارية لأعلى الجينات المعبر عنها بشكل مختلف (قيمة p المعدلة لـتعريفما قبل cDC2تم تحليل pre-cDC2 بواسطة تسلسل RNA الكمي (نفس التحليل كما في a). يتم تمثيل مستويات التعبير كتدرج لوني من المنخفض (الأزرق) إلى العالي (البرتقالي). كل عمود يمثل عينة تأتي من مجموعة من 5 فئران. (يمين) مخططات الميزات تمثل درجة CD8و CD8توقيعات ما قبل cDC2 (التوقيعات هي قائمة من DEGs من خريطة الحرارة على اليسار) تم إسقاطها على UMAP المدمج. يتم عرض مستويات التعبير كتدرج من منخفض (رمادي فاتح) إلى مرتفع (أخضر مزرق). يتم عرض تقدير الدرجات في أعلى الرسوم البيانية. ج، تحليل FACS يظهر (يسار) الاسترداد (عدد الخلايا)، (وسط) التمايز (زيادة التعبير عن MHC-II) و (يمين) تحديد cDC2 (زيادة التعبير عن SIRP ) من خلايا WT CD45.2 المستعادة من طحال فئران WT CD45.1 المتلقية بعد 3 أيام من نقل مجموعات CD45.2 pre-cDC2s المحددة ( الخلايا مرتبة كما هو موضح في الشكل 4a من البيانات الموسعة. تحليل qRT-PCR يظهر تعبير (أعلى اليسار) و (أسفل) في مجموعات خلايا الطSplen التي تم فرزها باستخدام FACS كما هو موضح في البيانات الموسعة الأشكال 1ب و 4أ). (أعلى اليمين) الكمية الكمية باستخدام قياس التدفق لـ CD8 التعبير في السكان المشار إليهم (محدد كما في الشكل 4c-e من البيانات الموسعة). e، تحليل FACS لخلايا CD45.2 المستعادة من طحال الفئران CD45.1 بعد 3 أيام من تلقيها مجموعات CD45.2 pre-cDC2s المشار إليها من فئران T-bet- ZsGreen (تم فرز الخلايا كما هو موضح في الأعلى – تم ضبط البوابة السلبية باستخدام نظير WT). البيانات هي: (الزاوية العليا اليسرى) الاسترداد (عدد الخلايا)، (الزاوية العليا الوسطى) التمايز (زيادة تنظيم MHC-II)، (الزاوية العليا اليمنى) تحديد cDC2 (زيادة تنظيم SIRP )، (أسفل اليسار) % ZsGreen ، (الأسفل الوسط) % ESAMو (الزاوية السفلية اليمنى) % CLEC12Aالخلايا. كل نقطة تمثل فأراً واحداً، والبيانات هي مجموعة من تجربتين (في ج و هـ و 6 في د) (يعنيSEM، الوسيط IQR لرسم البياني على شكل كمان). تم استخدام اختبار مان-ويتني (ذو الاتجاهين) للمقارنات. يتم الإشارة إلى قيم P في أعلى الرسوم البيانية. في تمت مقارنة الخلايا السابقة لـ cDC2 ضدpre-cDC2 و cDC2A (و cDC2A المبكرة) ضد cDC2B.
الشكل البياني الممتد 6 | انظر الصفحة التالية للتعليق.
الشكل البياني الممتد 6 | cDC2As و cDC2Bs هي مجموعات فرعية حقيقية من cDC. أ، (يسار) مخطط يوضح استراتيجية وسم سلالات cDC في فئران تتبع سلالة DNGR-1 (C9ate ). تم إنشاء الشكل باستخدام BioRender. (يمين) تحليل FACS يظهر نسبة الطماطم سلالات خلايا نخاع العظم المحددة كما في المرجع. ب، تحليل FACS يظهرطماطمالخلايا في الأنواع الفرعية المحددة من cDC و pre-cDC و MDCs كمرجع لسلالة غير موصوفة بشكل جيد. ج، تحليل FACS يظهر العدد النسبي للأنواع الفرعية المحددة من cDC و pre-cDC في الفئران WT مقابل الفئران التي تفتقر إلى Flt3L. كما يتم عرض عدد المونوسيتات و MDCs من أنسجة مختلفة كمرجع لسلالة مستقلة عن Flt3L. الأنسجة التي تم تحليلها موضحة في يسار الرسوم البيانية. كل نقطة تمثل فأراً واحداً ( )، وتم تجميع البيانات من تجربتين، في البيانات c يتم التعبير عنها كفرق مضاعف من WT (يعني SEM). تأتي عملية التصفية والتquantifications من UMAPs كما هو موضح في الشكل الإضافي 7b-d (انظر لاحقًا) لنخاع العظام والشكل الإضافي 4c-e للطحال، والعقد اللمفاوية المتوسطة، والرئة، والكبد. تم تحديد العدلات والـ MDCs كما في المرجع 18. كل نقطة تمثل تكرارًا بيولوجيًا واحدًا. )، والبيانات هي مجموعة من تجربتين (تعني SEM). للوحيات ( تم استخدام تحليل التباين الأحادي (ANOVA) مع تصحيح توكي لمقارنة المجموعات مقابل تصنيف MDPs أو مقابل التحكم WT.تُشير القيم إلى أعلى الرسوم البيانية.
الشكل البياني الممتد 7| انظر الصفحة التالية للتعليق.
الشكل 7 من البيانات الموسعة | تحديد مجموعة ما قبل الخلايا الجذعية في نخاع العظام.
أ، استراتيجية فرز لمجموعات ما قبل خلايا الدم الجذعية في نخاع العظام. اللوحة الأكثر يسارًا تم تصنيفها مسبقًا على الخلايا الفردية، الحية،وسلالةخلايا الطحال. يتضمن مزيج السلالة أجسامًا مضادة ضد CD3 وLy6G وSiglecF وB220 وCD19 وNK1.1 وLy6D وTer119. يتم استخدام CD117 وLy6C لتحديد pre-cDC1s (رمادي داكن) وpre-cDC2s، على التوالي. يميز SiglecH ما يُحتمل أن يكون pre-cDC2As (أخضر فاتح) بينما يُعتبر ما يُحتمل أن يكون pre-cDC2Bs هو Siglech.(أصفر). الأسهم تشير إلى تسلسل البوابات. ب، البوابات اليدوية المستخدمة في أ تم تراكبها على تحليل UMAP. تم إنشاء UMAP باستخدامCD11cالخلايا من البوابة الأولى للاستراتيجية اليدوية في و استخدم العلامات التالية: CD11c، MHC-II، CD26، CD64، CD88، XCR1، SIRP“، ESAM، CLEC12A، CD11b، CD43، CD135، CD117، Ly6C، وSiglecH. ج، يتم عرض تعبير العلامات الرئيسية المستخدمة لتعريف مجموعات فرعية مختلفة من pre-cDC في UMAPs في شكل خرائط حرارية. يتم تمثيل مستويات التعبير كتدرج لوني من منخفض (أزرق) إلى مرتفع (برتقالي). د، استراتيجية التحليل لمجموعات pre-cDC في نخاع العظام. تم تكبير الرسم البياني في مجموعة pre-cDCs الموضحة في اللوحة الثانية من ب (المميزة باللون الأزرق). البوابة الرمادية الداكنة هي pre-cDC1s، والبوابة الخضراء هي SiglecH.الخلايا السابقة لـ cDC2 والبوابة الصفراء هي SiglecHما قبل cDC2s.
الشكل 8 من البيانات الموسعة | انظر الصفحة التالية للتعليق.
الشكل البياني الموسع 8 | مسار تمايز cDC2A بعد خروجها من نخاع العظام. أ، تحليل FACS للتعبير عن SiglecH بواسطة مجموعات pre-cDC2 أو cDC2 المحددة المعزولة من الأنسجة المشار إليها في أعلى الرسوم البيانية. يتم عرض التصفية في الشكل البياني الموسع 7b-d لنخاع العظام وفي الشكل البياني الموسع 4c-e للأعضاء الطرفية. ب، رسم بياني على شكل كمان يوضح التعبير عن Siglech في المجموعات من UMAP المجمعة لتحليل scRNAseq (انظر الشكل 2a). ج، تحليل المكونات الرئيسية لجميع الجينات المعبر عنها من RNAseq الكلي لمجموعات pre-DC2 المحددة من الطحال (مرتبة كما هو موضح في الشكل البياني الموسع 4a) ونخاع العظام (مرتبة كما هو موضح في الشكل البياني الموسع 7a). د، (يسار) تمثيل خريطة حرارية لأعلى DEGs (تم تعديلهاقيمة لـتعريف SiglecHما قبل cDC2 و SiglecHتم تحليل pre-cDC2 بواسطة تسلسل RNA الكمي (نفس التحليل كما في c). يتم تمثيل مستويات التعبير كتدرج لوني من المنخفض (الأزرق) إلى العالي (البرتقالي). يمثل كل عمود عينة تأتي من مجموعة من 8 فئران. (يمين) مخططات الميزات تمثل درجة الجينات المعبر عنها بشكل مختلف (DEGs) (الموضحة في خريطة الحرارة، المستخدمة كعلامات) لـ Siglech.وسيجليكHpre-cDC2 على UMAP المدمج.
تظهر مستويات التعبير كتدرج من منخفض (رمادي فاتح) إلى مرتفع (أخضر مزرق). على اليمين يوجد رسم بياني على شكل كمان يوضح تعبير التوقيعات المستمدة من DEG بواسطة المجموعات المحددة. e، تحليل FACS لخلايا OP9 المعالجة يظهر فرط التعبير عن DL4. تم فرز DL4تم استخدام الخلايا (اللوحة السفلية اليمنى) كخلايا مغذية للشكل 5a و 5b. f، تحليل FACS يظهر عدد الخلايا في مجموعات pre-cDC2 المحددة من C9a. (رمادي داكن) أو C9a فئران (رمادي فاتح). يتم عرض التصفية في الشكل الإضافي 7b-d لنخاع العظام وفي الشكل الإضافي 4c-e للأعضاء الطرفية. g، تحليل المكونات الرئيسية لجميع الجينات المعبر عنها من تسلسل RNA الضخم الجديد لعينات ما قبل DC2 (نفس ما هو موضح في 5c) التي تم فرزها (كما هو موضح في الشكل الإضافي 7a) من نخاع العظام لـ C9a.ضد C9aالفئران. كل نقطة تمثل عينة تأتي من مجموعة من 3 فئران. في اللوحة أ و ف، كل نقطة تمثل فأراً واحداً (في 9 في (ف)، وكانت البيانات مجموعة من تجربتين (المتوسطاتSEM، الوسيطتم استخدام IQR لرسم البيانو). تم استخدام تحليل التباين ثنائي الاتجاه (مع تصحيح توكي، أ، ب وف) أو اختبار مان-ويتني (ذو طرفين، د) لمقارنة المجموعات المختلفة. يتم الإشارة إلى قيم P في أعلى الرسوم البيانية.
الشكل البياني الموسع 9 | انظر الصفحة التالية للتعليق.
الشكل البياني الموسع 9 | نموذج لنشوء cDC2A و cDC2B. أ، تحليل qRT-PCR يظهر تعبيرفي مجموعات cDC و tDC و pre-cDC من الطحال (تم فرزها كما هو موضح في الأشكال التكميلية 1b و 4a). البيانات مُعَيارَة لجين المنزل Hprt.b، تحليل FACS يُظهر النسبة المئوية لـفي خلايا البلازما الخلوية الطحالية (المعرفة كـ CD45.2سيغليك إتشCD26CD64الخلايا) من تتبع سلالة SiglecH (عبرت الفئران إلىفئران المراسل. ج، تحليل FACS يظهر نسبة RFP(الأعلى) أو (الأدنى) بين cDC2As المبكرة أو tDCs عبر الأعضاء المحددة. يتم عرض التصفية في الشكل 1 ب والشكل الإضافي 1 ج-د. الخط المنقط هو القيمة المرجعية لـpre-cDC2A (الأعلى) أو eGFPنسبة cDC2B (أسفل) في كل نسيج. كل نقطة تمثل فأراً واحداًفي ب وج و 6 في أ)، وبيانات من تجربة واحدة من تجربتين (ب-ج) أو مجمعة من تجربتين (أ) (المتوسطاتANOVA أحادي الاتجاه (مع تصحيح توكي) تم استخدامه للمقارنة: في أ،تمت مقارنة الخلايا السابقة لـ cDC2 ضدpre-cDC2 و CDC 2 B ضد cDC2A وفي c، tDCs و early cDC2As (بشكل منفصل) مع pre-cDC2As (في الأعلى) أو cDC2Bs (في الأسفل). يتم الإشارة إلى قيم P في أعلى الرسوم البيانية. تمثيل تخطيطي لنموذج لتطور CDC2A وCDC2B: في تمايز cDC2A، تقوم الخلايا الجذعية الإيجابية لـ SiglecH بتقليل تعبير SiglecH عند مغادرتها لنخاع العظام وتكتسب تعبير CD8.بينما يستعمرون الأنسجة. يتضمن التمايز اللاحق لهذه الخلايا pre-cDC2As إلى خلايا cDC2As النسيجية تقليل تعبير CD8. وزيادة تنظيم CD117 و MHC-II. يتم تنظيم تعبير T-bet بشكل تدريجي طوال مسار تمايز cDC2A بالكامل. يعتمد تطور cDC2A على RBP-Jk. في تمايز cDC2B، ينتج نخاع العظام خلايا pre-cDC2B التي تعبر عن LYSM ولكن تفتقر إلى SiglecH و CD8.. هذه المجموعة السكانية تتمايز إلى cDC2Bs المميزة بزيادة تتبع LYSM وزيادة تعبير MHC-II وCLEC12A. تطوير CDC2B يعتمد على KLF4. علامات الاستفهام تشير إلى الفجوات التي لا تزال بحاجة إلى معالجة في نموذجنا: سيكون من الضروري إجراء تحليل كلوني، بالإضافة إلى استخدام علامات أفضل أو إضافية لتقييم مستوى المرونة داخل سلالات cDC2 في نخاع العظام (علامة الاستفهام العليا). وبالمثل، لا يزال الانقسام بين cDC2A وسلالة tDC بحاجة إلى تأكيد من خلال نهج وراثي (علامة الاستفهام السفلية). تم إنشاء الشكل باستخدام BioRender.
تظهر كمتدرج من منخفض (رمادي فاتح) إلى مرتفع (أخضر مزرق). أدناه توجد مخططات كمان توضح تعبير توقيع الجينين من قبل المجموعات المحددة فيمحاور. تم استخدام اختبار مان-ويتني (ذو الاتجاهين) للمقارنات (الوسيطتُشير القيم إلى أعلى الرسوم البيانية.
الشكل البياني الموسع | تحديد الخلايا السابقة cDC2A و cDC2B في الطحال البشري. أ، UMAP للبيانات المأخوذة من المرجع 15 تعرض تحليل خلية واحدة لخلايا cDCs السابقة في الطحال البشري مع التجميع غير المراقب. ب، مخططات الميزات تمثل درجة تعبير الجينات لعلامات cDC2A و cDC2B (الشكل البياني الموسع 9، من ) تم إسقاطها على مساحة UMAP. مستويات التعبير
محفظة الطبيعة
المؤلف(المؤلفون) المراسلون: كايتانو ريس إي سوزا وكارلوس م. مينوتي آخر تحديث من المؤلف(ين): 01/04/2024
ملخص التقرير
تسعى Nature Portfolio إلى تحسين إمكانية تكرار العمل الذي ننشره. يوفر هذا النموذج هيكلًا للاتساق والشفافية في التقرير. لمزيد من المعلومات حول سياسات Nature Portfolio، يرجى الاطلاع على سياسات التحرير وقائمة مراجعة سياسة التحرير.
الإحصائيات
لجميع التحليلات الإحصائية، تأكد من أن العناصر التالية موجودة في أسطورة الشكل، أسطورة الجدول، النص الرئيسي، أو قسم الطرق.
مؤكد
حجم العينة بالضبط ( ) لكل مجموعة/شرط تجريبي، معطاة كرقم منفصل ووحدة قياس
بيان حول ما إذا كانت القياسات قد أُخذت من عينات متميزة أو ما إذا كانت نفس العينة قد تم قياسها عدة مرات
اختبار(ات) الإحصاء المستخدمة وما إذا كانت أحادية الجانب أو ثنائية الجانب يجب أن تُوصف الاختبارات الشائعة فقط بالاسم؛ واصفًا التقنيات الأكثر تعقيدًا في قسم الطرق.
وصف لجميع المتغيرات المشتركة التي تم اختبارها وصف لأي افتراضات أو تصحيحات، مثل اختبارات الطبيعية والتعديل للمقارنات المتعددة X وصف كامل للمعلمات الإحصائية بما في ذلك الاتجاه المركزي (مثل المتوسطات) أو تقديرات أساسية أخرى (مثل معامل الانحدار) وَ التباين (مثل الانحراف المعياري) أو تقديرات مرتبطة بعدم اليقين (مثل فترات الثقة) X لاختبار الفرضية الصفرية، إحصائية الاختبار (على سبيل المثال، ) مع فترات الثقة، أحجام التأثير، درجات الحرية وقيمة ملحوظة أعطِالقيم كقيم دقيقة كلما كان ذلك مناسبًا.
لتحليل بايزي، معلومات حول اختيار الأولويات وإعدادات سلسلة ماركوف مونت كارلو
للتصاميم الهرمية والمعقدة، تحديد المستوى المناسب للاختبارات والتقارير الكاملة عن النتائج
تقديرات أحجام التأثير (مثل كوهين’s , بيرسون’s )، تشير إلى كيفية حسابها
تحتوي مجموعتنا على الإنترنت حول الإحصائيات لعلماء الأحياء على مقالات حول العديد من النقاط المذكورة أعلاه.
البرمجيات والرموز
معلومات السياسة حول توفر رمز الكمبيوتر
جمع البيانات
تحليل البيانات
غير متاح
تم إجراء تحليلات تسلسل RNA أحادي الخلية في R v.3.6.1 (https://www.R-project.org/) باستخدام حزمة Seurat (v3). تم تحديد مسارات التمايز باستخدام الحزمة ‘Slingshot’ (الإصدار 1.4.0). تم استخدام تحليل Comet لتحديد علامات تدفق السيتومتر المحتملة من السكان المحددين بواسطة scRNAseq. تم إجراء التحليلات الإحصائية باستخدام برنامج GraphPad Prism 9 (GraphPad). تم تحليل بيانات تدفق السيتومتر باستخدام FlowJo (10.8.2). تم الحصول على العينات باستخدام BD FACSDiva في Symphony A5 (BD)، أو SA3800 في ID7000 5L (SONY) أو SpectroFlo في 5L Aurora (Cytek) محللات الطيف.
بالنسبة للمخطوطات التي تستخدم خوارزميات أو برمجيات مخصصة والتي تعتبر مركزية للبحث ولكن لم يتم وصفها بعد في الأدبيات المنشورة، يجب أن تكون البرمجيات متاحة للمحررين والمراجعين. نشجع بشدة على إيداع الرموز في مستودع مجتمعي (مثل GitHub). راجع إرشادات Nature Portfolio لتقديم الرموز والبرمجيات لمزيد من المعلومات.
البيانات
معلومات السياسة حول توفر البيانات
يجب أن تتضمن جميع المخطوطات بيان توفر البيانات. يجب أن يوفر هذا البيان المعلومات التالية، حيثما ينطبق:
رموز الوصول، معرفات فريدة، أو روابط ويب لمجموعات البيانات المتاحة للجمهور
وصف لأي قيود على توفر البيانات
بالنسبة لمجموعات البيانات السريرية أو بيانات الطرف الثالث، يرجى التأكد من أن البيان يتماشى مع سياستنا
تم إيداع بيانات RNA أحادي الخلية والبيانات الكلية في GEO تحت أرقام الوصول GSE217328، GSM6711828، GSM6711829، GSM6711830. جميع البيانات الأخرى اللازمة لتقييم الاستنتاجات في الورقة موجودة في الورقة أو المواد التكميلية.
المشاركون في البحث البشري
معلومات السياسة حول الدراسات التي تشمل المشاركين في البحث البشري والجنس والنوع في البحث.
التقارير حول الجنس والنوع
تم شراء نخاع العظام البشري من Stem Cell Technologies من متبرعين ذكور (2) وإناث (1).
خصائص السكان
تم اختيار نخاع العظام البشري من البالغين الذين لديهم أعمار متشابهة لتقليل التباين المحتمل بسبب الشيخوخة. كان عمر المتبرعين 24 (ذكر)، 29 (ذكر) و31 (أنثى) عامًا.
التجنيد
غير متاح
الإشراف الأخلاقي
تم شراء نخاع العظام البشري من Stem Cell Technologies. تمت الموافقة على الدراسة من قبل هيئة المراجعة الأخلاقية لمعهد فرانسيس كريك.
لاحظ أنه يجب أيضًا تقديم معلومات كاملة حول الموافقة على بروتوكول الدراسة في المخطوطة.
التقارير الخاصة بالمجال
يرجى اختيار الخيار أدناه الذي يناسب بحثك بشكل أفضل. إذا لم تكن متأكدًا، اقرأ الأقسام المناسبة قبل اتخاذ قرارك.
علوم الحياة العلوم السلوكية والاجتماعية العلوم البيئية والتطورية والبيئية
لنسخة مرجعية من الوثيقة مع جميع الأقسام، انظر nature.com/documents/nr-reporting-summary-flat.pdf
تصميم دراسة علوم الحياة
يجب على جميع الدراسات الإفصاح عن هذه النقاط حتى عندما يكون الإفصاح سلبيًا.
حجم العينة
لم يتم استخدام أي طرق إحصائية لتحديد أحجام العينات مسبقًا ولكن أحجام عيناتنا مشابهة لتلك المبلغ عنها في المنشورات السابقة (Cabeza-Cabrerizo، وآخرون 2021، Science Immunology.
استبعاد البيانات
لم يتم استبعاد أي نقاط بيانات فردية تحت أي ظرف من الظروف.
التكرار
تم إجراء جميع التجارب على الأقل مرتين وتم تضمين البيانات التي تم تكرارها عبر جميع التجارب فقط في هذه المخطوطة.
العشوائية
لم يتم عشوائية الفئران في الأقفاص، ولكن تم تعيين كل قفص عشوائيًا إلى مجموعة علاج.
التعمية
لم يكن الباحثون معميين عن هوية الفئران أثناء التشريح وتحليل العينات.
التقارير عن المواد والأنظمة والأساليب المحددة
نحتاج إلى معلومات من المؤلفين حول بعض أنواع المواد والأنظمة التجريبية والأساليب المستخدمة في العديد من الدراسات. هنا، حدد ما إذا كانت كل مادة أو نظام أو طريقة مدرجة ذات صلة بدراستك. إذا لم تكن متأكدًا مما إذا كان عنصر القائمة ينطبق على بحثك، اقرأ القسم المناسب قبل اختيار رد.
المواد والأنظمة التجريبية
الطرق
غير متاح
المشاركة في الدراسة
غير متاح
المشاركة في الدراسة
الأجسام المضادة
خطوط الخلايا حقيقية النواة
علم الحفريات وعلم الآثار
البحث ذو الاستخدام المزدوج المثير للقلق
الأجسام المضادة
الأجسام المضادة المستخدمة
جميع الأجسام المضادة، ومعلوماتها (التركيب، النسخة، المنزل التجاري وتركيز العمل) مدرجة في الشكل التكميلية 9
التحقق
جميع الأجسام المضادة المستخدمة في هذه الدراسة تجارية ومصادق عليها من قبل الشركات البائعة. تم تحديد تركيزات العمل عن طريق التخفيف باستخدام التركيزات المقترحة من قبل المنزل التجاري.
خطوط الخلايا حقيقية النواة
معلومات السياسة حول خطوط الخلايا والجنس والنوع في البحث
مصدر خط الخلايا
تم الحصول على خلايا OP9 و OP9-DL1 و OP9-DL4 من مرفق خدمات الخلايا لمعهد فرانسيس كريك.
التحقق من الهوية
تم اختبار جميع خطوط الخلايا المستخدمة في هذه الدراسة فقط لتحديد الأنواع – وقد حددت هذه الخطوط كخلايا فئران
تلوث الميكوبلازما
جميع خطوط الخلايا اختبرت سلبية لتلوث الميكوبلازما
الخطوط التي تم التعرف عليها بشكل خاطئ بشكل شائع (انظر سجل ICLAC)
غير متاح
الحيوانات وغيرها من الكائنات البحثية
معلومات السياسة حول الدراسات التي تشمل الحيوانات؛ توجيهات ARRIVE موصى بها لتقارير أبحاث الحيوانات، والجنس والنوع في البحث
الحيوانات المخبرية
تم تربية فئران C57BL/6J (CD45.1+)، C57BL/6J (CD45.2+)، Tbx21-ZsGreen (Taconic Biosciences)، Rbpj-fl (مختصر )، Clec9aCre (مختصر C9a)، Flt3I-/- (Taconic Biosciences)، Rosa26-LSL-tdTomato (مختصر tdTOM؛ مختبر جاكسون) في معهد فرانسيس كريك في ظروف خالية من مسببات الأمراض المحددة. تم إنتاج فئران SiglechiCre (B6-Siglechtm1(iCre)Ciphe) بواسطة Centre d’Immunophénomique، مرسيليا، فرنسا وتم عبورها مع سلالات Rosa26-LSL-RFP و Lyz2-eGFP. تم إعادة عبور جميع خطوط الفئران المعدلة وراثيًا إلى C57BL/6J. تم مطابقة الفئران الذكور والإناث من 6 إلى 12 أسبوعًا في جميع التجارب. ظروف السكن هي كما يلي: تتقلب دورات الضوء من 7 صباحًا إلى 7 مساءً. تتراوح درجة الحرارة من 20 إلى 24 درجة مئوية والرطوبة هي .
الحيوانات البرية
لم يتم استخدام أي حيوانات برية في الدراسة.
التقارير حول الجنس
تم استخدام ذكور وإناث الفئران لإجراء التجارب. ومع ذلك، لم نلاحظ اختلافات بين الجنسين.
عينات تم جمعها من الميدان
لم يتم استخدام أي عينات تم جمعها من الميدان في الدراسة.
الإشراف الأخلاقي
تم إجراء جميع التجارب وفقًا لقانون الحيوانات (إجراءات علمية) في المملكة المتحدة لعام 1986. تم اعتماد جميع الباحثين من قبل وزارة الداخلية البريطانية للتعامل مع الحيوانات وإجراء التجارب. تمت الموافقة على إجراء أبحاث الحيوانات في معهد فرانسيس كريك من قبل هيئة المراجعة الأخلاقية المؤسسية ومنحتها وزارة الداخلية البريطانية؛ وبالتالي، تم إجراء جميع الأبحاث بموجب ترخيص المشروع PF40C0C67.
لاحظ أنه يجب أيضًا تقديم معلومات كاملة حول الموافقة على بروتوكول الدراسة في المخطوطة.
تدفق السيتومتر
الرسوم البيانية
أكد أن:
توضح تسميات المحاور العلامة والفلوركروم المستخدم (مثل CD4-FITC).
تكون مقاييس المحاور مرئية بوضوح. قم بتضمين الأرقام على المحاور فقط للرسم البياني السفلي الأيسر للمجموعة (المجموعة هي تحليل للعلامات المتطابقة).
جميع الرسوم البيانية هي رسوم بيانية كونتورية مع نقاط شاذة أو رسوم بيانية زائفة.
تم توفير قيمة عددية لعدد الخلايا أو النسبة المئوية (مع إحصائيات).
المنهجية
تحضير العينة
تم تحضير الخلايا مسبقًا مع مانع anti-CD16/32 في محلول FACS لمدة 10 دقائق عند ثم تم صبغها لمدة 40 دقيقة عند مع خليط الأجسام المضادة ومجموعة صبغة الخلايا الميتة FIXABLE LIVE/DEAD في محلول FACS. تضمنت علامات السلالة (Lin) CD3 و Ly6G و SiglecF و B220 و CD19 و Ly6D و NK1.1 و Ter119. تم إدراج الأجسام المضادة المستخدمة لتدفق السيتومتر في الجدول S6.
الأداة
تم الحصول على العينات باستخدام Symphony A5 (BD)، أو ID7000 5L (SONY) أو 5L Aurora (Cytek) محللات الطيف.
البرمجيات
تم تحليل البيانات باستخدام FlowJo 10.
وفرة مجموعة الخلايا
على الأقل تم صبغ الخلايا وتحليلها لتحقيق عدد قوي من الخلايا في بوابة cDC السابقة.
استراتيجية البوابة
تم إنشاء تحليل UMAP لبيانات تدفق السيتومتر بناءً على CD11b و CD11c و CD16/32 و CD26 و CD43 و CD64 و CD88 و CD135 و SIRP و, MHC-II و CD117 و Ly6C و SiglecH و CD8 و, XCR1 و CLEC12A و ESAM. تم وضع علامات على المجموعات في مخططات UMAP باستخدام علامات تعريفية لكل مجموعة مناعية. تم تأكيد دقة بوابتنا اليدوية على UMAPs من خلال تراكب مجموعات مناعية مختلفة تم تحديدها بواسطة البوابة اليدوية.
حدد هذا المربع لتأكيد أن الشكل الذي يوضح استراتيجية البوابة متوفر في المعلومات التكميلية.
مختبر علم المناعة الحيوية، معهد فرانسيس كريك، لندن، المملكة المتحدة.المعلوماتية الحيوية والإحصاء الحيوي، معهد فرانسيس كريك، لندن، المملكة المتحدة.مختبر خلايا الدم الجذعية، معهد فرانسيس كريك، لندن، المملكة المتحدة.مختبر علم المناعة الفيروسية، معهد فرانسيس كريك، لندن، المملكة المتحدة.جامعة إكس-مارسيليا، المركز الوطني للبحث العلمي، المعهد الوطني للصحة والبحث الطبي، مركز علم المناعة في مارسيليا-لوميني، مركز تورينغ للأنظمة الحية، مارسيليا، فرنسا.مختبر علم المناعة للملاريا، معهد فرانسيس كريك، لندن، المملكة المتحدة.العنوان الحالي: مختبر تنظيم المناعة، أبحاث شامباليمود، مركز شامباليمود للمعرفة المجهولة، لشبونة، البرتغال. – البريد الإلكتروني:carlos.minutti@research.fchampalimaud.org; caetano@crick.ac.uk
البيانات الموسعة الشكل 4 | انظر الصفحة التالية للتعليق.
Conventional dendritic cells (cDCs) include functionally and phenotypically diverse populations, such as CDC 1 s and cDC 2 s . The latter population has been variously subdivided into Notch-dependent cDC2s, KLF4-dependent cDC2s, T-bet cDC2As and T-bet cDC2Bs, but it is unclear how all these subtypes are interrelated and to what degree they represent cell states or cell subsets. All cDCs are derived from bone marrow progenitors called pre-cDCs, which circulate through the blood to colonize peripheral tissues. Here, we identified distinct mouse pre-cDC2 subsets biased to give rise to cDC2As or cDC2Bs. We showed that a Siglec- pre-cDC2A population in the bone marrow preferentially gave rise to Siglec- pre-cDC2As in tissues, which differentiated into T-bet cDC2As. In contrast, a Siglec- fraction of pre-cDCs in the bone marrow and periphery mostly generated T-bet cDC2Bs, a lineage marked by the expression of LysM. Our results showed that cDC2A versus cDC2B fate specification starts in the bone marrow and suggest that cDC2 subsets are ontogenetically determined lineages, rather than cell states imposed by the peripheral tissue environment.
Conventional dendritic cells (cDCs) consist of two major subsets, known as CDC1s and cDC2s . XCR1 cDC1s are BATF3-dependent and required for inducing cytotoxic T cell responses against many tumor and viral antigens . cDC2s often express CD11b and CD172 (SIRP ), and their differentiation or migratory capacity depends on IRF4 (refs. 1,2). Accumulating evidence suggests that CDC2s are required for effective activation of the helper arm of T cell responses . However, cDC 2 s are more heterogenous than . Two subgroups of mouse were initially defined based on differential requirement for Notch2 or KLF4 for their differentiation .Notch2-dependent cDC2s are labeled
in Gpr4 reporter mice and express CD4, CLEC4A4 and endothelial cell-selective adhesion molecule (Esam) in the spleen and CD103 in the intestine . Notch2-independent cDC2s express CLEC12A and are labeled in Cx3cr1 and Ccr2 reporter mice and in Lyz2 fate mapping mice . KLF4-dependent cDC2s are CD172 and variably express CD24, PD-L2 or MGL-2, depending on the tissue .
More recently, T-bet and T-bet cDC2s were found in the spleens of T-bet reporter mice and termed cDC2As and cDC2Bs, respectively . T-bet cDC2As include Notch2-dependent Esam cDC2s. The original cDC2B population included a small proportion of cells marked by
RORүt fate mapping , later shown to constitute a distinct lymphoid cell type rather than bona fide . In a further study, KLF4-dependent cDC2s were suggested to correspond to cDC2Bs . Finally, infection or cancer can drive the appearance of cells termed ‘inflammatory cDC2s’ and ‘mature dendritic cells enriched in regulatory molecules’, respectively . Thus, at present, mouse cDC2s variably include cDC2As, cDC2Bs, Notch-dependent cDC2s, KLF4-dependent cDC2s, inflammatory cDC2s and mature dendritic cells enriched in regulatory molecules. Some of these subpopulations might overlap or correspond to different developmental or activation states of the same DC lineage, while others might represent distinct CDC2 subsets. Adding to the complexity, another population, variably termed transitional DCs (tDCs), AXL+ DCs, AS DCs or plasmacytoid-like DCs has been identified in humans and mice . tDCs are proposed to have a lymphoid origin and recent work suggests that they are part of the plasmacytoid DC lineage, although they can differentiate into cells resembling cDC2As .
One approach to disentangle this complexity is to study cDC ontogeny. The lifespan of cDCs in tissues is short ( days ) such that the cDC tissue network needs to be constantly replenished from bone marrow precursors. The conventional or common DC progenitor (CDP) is the earliest bone marrow cell with DC-restricted potential . These CDPs give rise to pre-cDCs, which leave the bone marrow through the blood to seed all tissues and generate terminally differentiated cDC1s and cDC2s .Specification toward the cDC1 or cDC2 lineage starts already at the CDP stage and generates pre-cDC1s and pre-cDC2s . The prevailing view is that the latter then diversify by acquiring distinct phenotypic or functional traits in different tissue niches or under different inflammatory conditions . In line with this notion, retinoic acid supports the differentiation of Notch2-dependent CDC2s in the intestine and spleen ; type 3 innate lymphoid cells (ILC3s) in the spleen promote the differentiation of cDC2As through the production of lymphotoxin . However, it is possible that cDC2 diversity specification might occur at the pre-cDC level in the bone marrow and that signals in tissue are permissive rather than instructive.
In this study, we used a binary definition of cDC2s, splitting them, as proposed , into T-bet cDC2As and T-bet cDC2Bs. We showed that cDC2As and cDC2Bs in mice at steady state phenotypically encompass the previously described Notch-dependent and KLF4-dependent cDC subsets. Notably, we found that pre-cDC2s in the bone marrow could already be divided into two subtypes that preferentially gave rise to cDC2As or cDC2Bs. The identification of biased pre-cDC2A and pre-cDC2B populations in mouse and human bone marrow supports the notion that cDC2As and cDC2Bs represent distinct ontogenetic lineages.
Results
Notch2-dependent and KLF4-dependent cDC2s correspond to cDC2As and cDC2Bs
We phenotyped cDCs from mice in which T-bet expression is reported by ZsGreen (hereafter T-bet-ZsGreen mice) . We defined cDCs as Lin (CD3, Ly6G, Siglec-F, B220, CD19, Ly6D, NK1.1 and Ter119) CD64 CD11c major histocompatibility complex (MHC) class II , and cDC 1 and CDC 2 as and , respectively .tDCs within the cDC2 gate were identified as CD8 cells (Extended Data Fig. 1a,b). To mark previously identified cDC2 populations, we used Esam for Notch-dependent cDC2s , CD24 and MGL-2, programmed cell death1 ligand2 (PD-L2) for KLF4-dependent cDC2s , T-bet-ZsGreen for cDC2As and CLEC12A for cDC2Bs .
We started by splitting cDC2s into ZsGreen and ZsGreen (Extended Data Fig. 1a). This revealed a marked overlap between the expression of Esam and T-bet-ZsGreen in all the tissues analyzed (spleen, mesenteric lymph node (MLN), lung and liver; Fig. 1a). In contrast, T-bet-ZsGreen cDC2Bs showed preferential expression of CLEC12A and variable expression of CD24, MGL-2 and PD-L2 (Fig. 1a).
Thus, using marker analysis, T-bet-ZsGreen cDC2As included Notch2-dependent cDC2s whereas T-bet-ZsGreen cDC2Bs corresponded to KLF4-dependent cDC2s . Uniform manifold approximation and projection (UMAP) dimension reduction analysis using all markers except T-bet-ZsGreen to drive cluster segregation, together with bulk RNA sequencing (RNA-seq), indicated that Esam and CLEC12A accurately defined cDC2As and cDC2Bs, respectively, independently of T-bet-ZsGreenlabeling (Fig. 1b, Extended Data Figs. 1b-d and 2a, and Supplementary Table 1). We found a relatively small cluster of tDCs (cluster 4) that was CD8 CD11b (Fig. 1b and Extended Data Fig. 2b) and a CD8 cluster that segregated from tDCs (cluster 3) (Fig. 1b and Extended Data Fig. 2b).
To refine cDC2A and cDC2B identification, we used Clec9a Rosa26 Rbpj mice (C9a ) that lack Notch signaling in the cDC lineage and compared them to Clec9a Rosa26 controls (C9a ). The number of cDC2As, but not cDC2Bs (as defined by the UMAP clusters), was reduced in C9a mice in all organs analyzed (Fig. 1c). C9 mice also displayed an increase in cluster 3 (CD8 CD117 Esam ) across all tissues (Fig. 1c and Extended Data Fig. 2b), suggesting that these cells were immediate precursors of cDC2As whose terminal differentiation was arrested in the absence of Notch signals (hereafter early cDC2As) . CD8 tDCs were only found in spleen and MLN but were not decreased in mice (Fig. 1c and Extended Data Fig. 2c). Together with reports showing that cDC2Bs, but not cDC2As, are KLF4-dependent , our data suggested that the overall heterogeneity of cDC2s can be distilled down to two main Notch-dependent T-bet cDC2A and Notch-independent T-bet cDC2B branches and states of differentiation along them.
Single-cell RNA-seq defines cDC2 heterogeneity at the pre-cDC2 level
We next identified pre-cDCs in tissues using a protocol developed for isolating lung pre-cDCs . We gated on SIRP CD135 CD cells while excluding Ly6D cells (precursors of both plasmacytoid cells and tDCs ) and CD11b SIRP CD16 cells (monocyte-like cells and DC3 progenitors ) (Extended Data Fig. 3a). Using in vitro differentiation assays (Extended Data Fig. 3b), fate mapping (Extended Data Fig. 3c) and in vivo Fms-like tyrosine kinase 3 ligand (Flt3L) dependence (Extended Data Fig.3d), we confirmed that the gating strategy identified bona fide pre-cDCs in the bone marrow and spleen, as previously shown for the lung . We used the gating strategy (Extended Data Fig. 3e) to sort pre-cDCs from the bone marrow, spleen and lung of C57BL/6J wild-type (WT) mice. We performed single-cell RNA-seq (scRNA-seq) analysis on 2,649 bone marrow, 4,371 spleen and 358 lung-sorted pre-cDCs after excluding a small number of dying cells and contaminants (identified using immune cell transcriptome profiles; https://www. immgen.org/) (Fig. 2a). We integrated the three tissues (bone marrow, spleen and lung) and generated a UMAP that identified nine clusters that, although varying in proportion, overlapped across all tissues (Fig. 2a). Therefore, we concatenated the cells from all tissues and used published gene signatures to annotate the UMAP clusters. This approach indicated that clusters 4,5 and 6 corresponded to proliferative early pre-cDCs (Fig. 2b). They were enriched in bone marrow (Fig. 2a,b), which is consistent with the fact that they originate in that tissue. Clusters 0 and 1 probably represented more differentiated pre-cDCs about to leave the bone marrow or pre-cDCs that recently colonized peripheral tissues (Fig. 2b). Clusters 3, 2, 7 and 8 (late pre-cDCs) were overrepresented in peripheral tissues (Fig. 2a,b), where pre-cDCs complete differentiation into cDCs . Overall, pre-cDCs segregated into two groups: one consisting of clusters 3 and 6 with a gene expression signature of pre-cDC1s/cDC1s; and one consisting of clusters and 8 and similar in gene expression to pre-cDC2s/cDC2s (Fig. 2c) . We did not identify any
a
MLN
Lung
Liver
ZsGreen T-bet cDC2
b
0.0286
0.0286
0.0286
ZsGreen T-bet cDC2
1 cDC2B
2 cDC2A
3 Early cDC2A
4 tDC
CLEC12A MFI ( )
0
UMAP1
T-bet
Esam
0
CD24
MGL-2
PD-L2
– cDC2B
– tDC
– Early cDC2A
– cDC2A
Spleen
Liver
C
Lung
(1) C9a
C9a
Early cDC2A
MLN
Liver
Fig. 1|cDC2As include Notch2-dependent cDC2s whereas KLF4-dependent cDC2s correspond to cDC2Bs. a, Flow cytometry analysis showing expression of Esam, CLEC12A, CD24, MGL-2 and PD-L2 on T-bet-ZsGreen (cDC2A) and T-bet-ZsGreen- (cDC2B) cDC2s from the spleen, MLN, lung and liver in T-betZsGreen mice. b, Representative UMAP of flow cytometry data of spleen cells from Tbx21-ZsGreen mice that fall into the cDC2 gate generated from cells using the expression of CD11c, MHC-II, CD26, CD64, CD88, XCR1, SIRP , Esam, CLEC12A, CD11b, CD43, CD135, CD117, Ly6C and CD8 indicating the cDC2Bs, cDC2As, early cDC2As and tDCs (top) overlays of T-bet-ZsGreen , Esam ,
CLEC12A , CD24 , MGL-2 or PD-L2 cDC2s onto the UMAP (middle) and ZsGreen mean fluorescence intensity (MFI-after subtracting the autofluorescence background) in cDC2Bs, cDC2As, early cDC2As and tDCs identified in the UMAP (bottom).c, Flow cytometry analysis showing the quantification of spleen, MLN, lung and liver cDC2Bs, cDC2As, early cDC2As and tDCs from C9a and mice. Each dot represents one mouse ( in and in ). Data are from one of two ( ) or a pool of two ( ) experiments (mean s.e.m.). A two-tailed Mann-Whitney -test was used to compare groups (in , the comparison is relative to cDC2B). values are indicated above the graphs.
Fig. 2 | cDC heterogeneity can be recapitulated at the pre-cDC level. a, UMAPs displaying scRNA-seq analysis of pre-cDCs sorted as shown in Extended Data Fig. 3 e from the bone marrow ( 2,649 cells), spleen ( 4,371 cells) and lung ( 358 cells) with unsupervised clustering (each sample is a pool of six mice). The proportion of the nine clusters identified in the UMAPs for each organ is shown on the right.b, Representative plots depicting the score for the gene signatures (refs. 15,30 and Supplementary Table 9) of proliferation (middle) and early (left) or late (right) pre-cDC projected onto the concatenated UMAP space. Expression levels are shown as a gradient from low (light gray) to high (teal). c, Feature plots
depicting the score for the gene signatures (refs. 15,30 and Supplementary Table 9) of pre-cDC1s and pre-cDC2s on the concatenated UMAP, and violin plots for the scores within the 3 and 6 , and and 8 , cluster groups. d, Feature plots depicting the score for the gene signatures (refs. 15,30 and Supplementary Table 9) of cDC2As and cDC2Bs on the concatenated UMAP, and violin plots for the scores within the 0,2 and 8 , and 1 and 7 , cluster groups. Expression levels are shown as a gradient from low (light gray) to high (teal). In c,d, a two-tailed MannWhitney -test was used for comparison (median the interquartile range (IQR)). values are indicated above the graphs.
cluster that appeared uncommitted at the level of the gene expression signature (Fig. 2c), as expected . Pre-cDC2s were relatively more heterogenous than pre-cDC1s (seven compared to two clusters) (Fig. 2c). Within the late pre-cDC2s clusters, there were two broad groups: clusters 0,2 and 8 showed increased similarity in gene expression profile to cDC2A; clusters 1 and 7 expressed more genes in common with cDC2B (Fig. 2d). These data suggested that subdivision of cDC2s into cDC2As and cDC2Bs could be recapitulated at the level of their pre-cDC precursors using gene expression profiling.
Pre-cDC2s are biased toward the cDC2A or cDC2B fate
We used Comet, a tool for predicting cell population surface markers from scRNA-seq data , to design a strategy to identify putative pre-cDC subsets using flow cytometry. Comet identified markers previously used to distinguish pre-cDC1s (CD117 and CD24) from pre-cDC2s (Ly6C and CD115, among others) (Supplementary Table 2), the accuracy of which we confirmed using in vitro differentiation assays (Extended Data Fig. 4a,b). Comet further identified CD8 as a marker for the putative pre-cDC2As, in addition to marking cDC1s and tDCs
Fig. 3 | Peripheral pre-cDC2s are biased toward the cDC2A or cDC2B fate. a, Feature plot (left) and violin plot (right) showing Cd8a expression on the concatenated UMAP or in cluster groups 0, 2 and 8, or 1 and 7, as in Fig. 2b-d. b, Representative UMAP of flow cytometry analysis of splenic pre-cDC and cDC populations generated on CD11c Lin cells using CD11c, MHC-II, CD26, CD64, CD88, XCR1, SIRP , Esam, CLEC12A, CD11b, CD43, CD135, CD117, Ly6C and CD8 (left), and CD8 cells overlaid onto the UMAP (right). c, CD45.2 cDC2s (derived from CD8 or CD8 pre-cDC2s) recovered from the spleen of CD45.1 recipient mice overlaid onto a UMAP representing the cDC lineage of the host (left) and flow cytometry analysis showing the number and percentage of WT CD45.2 Esam cDC2As and CLEC12A cDC2Bs recovered from the spleen of WT CD45.1 recipient mice 3 days after transfer of the CD8 and CD8 CD45.2 pre-cDC2s populations (right). Populations are annotated in b. d, ZsGreen MFI (after subtracting the
autofluorescence background) in cDC2As and cDC2Bs or CD8 or CD8 pre-cDC2s from T-bet-ZsGreen mice and representative flow cytometry plots with overlaid pre-cDC2s and pre-cDC2s in the spleen, MLN, lung and liver depicting T-bet-ZsGreen expression (fluorescence intensity) in each pre-cDC2 population. e, Percentage of cDC2As and cDC2Bs or CD8 or CD8 pre-cDC2s in the spleen, MLN, lung and liver and representative UMAP for the spleen, MLN, lung and liver showing the clusters containing cDC2As and cDC2Bs or CD8 or CD8 pre-cDC2s. In c,d, each dot represents one mouse ( in and in d,e); data were pooled from two experiments (mean s.e.m.; median IQR for the violin plot). In c-e, quantifications come from the UMAPs (as shown in and Extended Data Fig. 4c-e). A two-tailed Mann-Whitney -test was used for comparison. values are indicated above the graphs.
in some tissues (Fig. 3a, Extended Data Fig. 4c-e and Supplementary Table 2). Using flow cytometry, we confirmed that pre-cDC2s encompassed CD8 and CD8 cells (Fig. 3b and Extended Data Fig. 4a,c-e). UMAP analysis of spleen cells stained for multiple cDC and pre-cDC markers positioned CD8 pre-cDC2s on a branch leading to cDC 2 B , and pre-cDC2s on a distinct one leading to cDC2A (Fig. 3b and Extended Data Fig. 4c,d). We sorted spleen CD8 pre-cDC2s and CD8 pre-cDC2s (Extended Data Fig. 4a) and performed bulk RNA-seq analysis (Extended Data Fig. 5a). Differentially expressed genes (DEGs) from either population (Supplementary Table 3) were used as a gene signature, which when overlaid on the earlier scRNA-seq UMAP analysis (Extended Data Fig. 5b), indicated that CD8 was indeed able to segregate putative precursors of cDC2As (CD8 pre-cDC2s) and cDC2Bs (CD8 pre-cDC2s) in mouse spleen (Extended Data Fig. 5b). This analysis also indicated that although tDCs express CD8 , their gene expression profile was distinct from that of CD8 pre-cDC2s (Extended Data Fig. 5a).
To directly test precursor-product relationships, we isolated splenic CD8 and CD8 pre-cDC2s from CD45.2 mice and transferred them into sublethally irradiated CD45.1 recipients. We excluded Ly6D cells to exclude precursors of plasmacytoid cells or tDCs, and CD11b SIRP cells to exclude monocyte-like cells and DC3 progenitors. Analysis of splenic cDCs 3 days after transfer showed that both pre-cDC2s and CD45.2 pre-cDC2s had differentiated into SIRP cDC2s to a comparable extent (Extended Data Fig. 5c). However, the CD8 pre-cDC2s preferentially generated CLEC12A cDC2Bs whereas the CD8 pre-cDC2s predominantly became Esam cDC2As (Fig. 3c). Thus, CD8 , a marker associated with cDC1s and tDCs, was also expressed by splenic pre-cDC2As and could be used to differentiate them from splenic pre-cDC2Bs (Extended Data Fig. 5d).
Pre-cDC2s are too rare in other peripheral tissues to allow for sorting and adoptive transfer. In the spleen, MLN, lung and liver of T-bet-ZsGreen mice, we detected Esam cDC2As that expressed Tbx21
transcripts (Extended Data Fig. 5d) and higher levels of T-bet-ZsGreen than CLEC12A cDC2Bs (Fig. 3d). The T-bet-ZsGreen signal in Ly6C pre-cDC2s was much lower than in cDC2As (Fig. 3d); however, it was detectable and significantly higher in pre-cDC2As than in CD8 pre-cDC2Bs across all tissues (Fig. 3d). Transfer of sorted spleen T-bet-ZsGreen pre-cDC2s and T-bet-ZsGreen pre-cDC2s into congenic mice indicated that T-bet-ZsGreen expression was retained (and increased) throughout the lifespan of cDC2As but not cDC2Bs and their progenitors (Extended Data Fig. 5e). At steady state, the ratio of T-bet-ZsGreen cDC2As to T-bet-ZsGreen cDC2Bs was greater in lymphoid tissues (Fig. 3e). Similarly, lymphoid tissues contained a larger proportion of pre-cDC2As, whereas pre-cDC2Bs predominated in nonlymphoid tissues (Fig.3e). Finally, all these populations, in contrast to CD11b Ly6C monocytes or CD64 CD88 monocyte-derived cells (MDCs), displayed near-complete labeling in Clec9 lineage-tracing mice ( ) and were markedly reduced in frequency ( ) in Flt3l mice (Extended Data Fig. 6a-c). This suggested the existence of two cDC2 lineages across tissues, both bona fide members of the cDC family.
Two bone marrow pre-cDC2 subsets are related to cDC2As and cDC2Bs
Next, we investigated whether the lineage bias of pre-cDC2As and pre-cDC2Bs occurred as they entered the tissue or, as for pre-cDC1s and pre-cDC2s, before leaving the bone marrow. Pseudotime analysis of scRNA-seq data from bone marrow pre-cDCs suggested two mutually exclusive cDC2A and cDC2B differentiation trajectories (Fig.4a). We compared the gene expression profiles of the cell clusters that defined the two trajectories (Fig. 4b). Among the transcripts that segregated clusters 0 and 1 in the bone marrow, we found 87 that overlapped with some of the transcripts that segregated late pre-cDC2As (clusters 2 and 8) and late pre-cDC2Bs (cluster 7) in the periphery, as well as those that segregated cDC2As and cDC2Bs (Fig. 4b and Supplementary Table 4). This overlap was statistically significant
Fig. 4| The bone marrow contains two populations of pre-cDC2s that can be segregated according to Siglec-H expression and are related to cDC2As and cDC2Bs. a, Pseudotime analysis of scRNA-seq data (Fig. 2b-d) from cluster 4 to clusters 7 and 8 concatenated from the bone marrow, spleen and lung. b, Heatmap of 87 DEGs between early pre-cDC2s (clusters 0 and 1) in the bone marrow (left), late pre-cDC2 clusters (clusters 2 and 8, and cluster 7) from the bone marrow, spleen and lung (middle) and comparison of our pre-cDC scRNAseq data to those of splenic cDC2As and cDC2Bs from Brown et al. (right). Expression levels ranged from low (blue) to high (orange). c, Expression of CD8 on pre-cDC2s from the bone marrow, spleen, MLN, lung and liver, gated as in Extended Data Fig. 4c-e.d, Siglech expression projected on the scRNA-seq UMAP of bone marrow pre-cDCs as in Fig. 2a (left) and expression of Siglech in cluster 0 or 1 from bone marrow pre-cDCs (right). e, RT-qPCR for Siglech normalized to Hprt in spleen cDCs sorted as in Extended Data Fig. 1b and bone marrow precDCs sorted as in Extended Data Fig. 7a.f, Representative flow cytometry plot showing Siglec-H and CD26 on pre-cDC2s from the bone marrow gated as single
live SIRP cells as in Extended Data Fig. 4b-d.g, 5-Ethynyl-2′-deoxyuridine (EdU) incorporation and Ki-67 staining on or (or Siglec- or Siglec- in the bone marrow) precDC2s identified from the UMAP gates as in Extended Data Figs. 4e and 7d (top) and cDC2As and cDC2Bs identified from the UMAP gates as in Extended Data Fig. 4e from bone marrow, spleen, MLN, lung and liver. h, OX40L MFI and II12b mRNA normalized to Hprt (RT-qPCR) in splenic cDC2As and cDC2Bs sorted as in Extended Data Fig. 1b and bone marrow Siglec- or Siglec- pre-cDC2s sorted as in Extended Data Fig. 8a after overnight culture with flagellin, R848, CpG or zymosan. In c,e,g, each dot represents one mouse ( in in in . Data are from one of two experiments (h) or a pool of two (c,e,g) (mean s.e.m.; median IQR for the violin plot). A two-tailed Mann-Whitney -test (d,g) or two-way analysis of variance (ANOVA) (with Tukey correction, e,h) was used to compare groups (in e, the comparison is relative to Siglec- pre values are indicated above the graphs.
Fig. 5 | Bone marrow Siglec- and Siglec- pre-cDC2 populations respond differentially to lymphotoxin and Notch ligands to become cDC2s. a, Cell number, expression of MHC-II, expression of SIRP and expression of T-betZsGreen on bone marrow Siglec- pre-cDC2s and Siglec- pre-cDC2s after the culture of Siglec- and Siglec- pre-cDC2s sorted from the bone marrow of T-bet-ZsGreen mice (as in Extended Data Fig. 7a) with OP9 or OP9-DL4 stromal cells for 3 days in the presence of Flt3L with or without recombinant mouse lymphotoxin.b, Representative flow cytometry plots showing the expression of MHC-II, SIRP and T-bet-ZsGreen on Siglec- pre-cDC2s and Siglec- pre-cDC2s on day 3 of coculture with OP9-DL4 stromal cells, Flt3L
and lymphotoxin. c, GSEA analysis of bulk RNA-seq data in Siglec- pre-cDC2s and Siglec- pre-cDC2s sorted as in Extended Data Fig. 7a from C9a and mice. Each dot represents one biological replicate ( ); data are a pool of two experiments (mean s.e.m.). FDR, false discovery rate; GM-CSF, granulocyte-macrophage colony-stimulating factor; IFN, interferon; NES, normalized enrichment score. In a, cells were analyzed using manual gating (as in b) and defined as: single; live; CD45.2 ; CD11c ; and MHC-II . CDC1s were defined as XCR1 , whereas cDC2s expressed SIRP . A two-way ANOVA (with Tukey correction) was used for comparison. values are indicated above the graphs.
( ; Fig. 4b), suggesting that specification toward cDC2As and cDC 2 Bs was already patent at the level of bone marrow pre-cDC2s.
In contrast to peripheral tissues, we did not detect expression of CD8 in any pre-cDC2s in the bone marrow (Fig. 4c). However, scRNA-seq and quantitative PCR with reverse transcription (RT-qPCR) analysis identified Siglec-H as a potential marker for the putative bone marrow pre-cDC2As in cluster 0 (Fig. 4d,e). Flow cytometry analysis confirmed that bone marrow pre-cDC2s could be segregated into Siglec- and Siglec- populations (Fig. 4f and Extended Data Fig. 7a-d). Siglec-H expression was very low in pre-cDC2s or cDC2s from peripheral tissues, such as the spleen (Extended Data Fig. 8a), suggesting that Siglec-H expression was lost as early pre-cDCs differentiated into late pre-cDCs that leave the bone marrow, which is consistent with previous reports . Accordingly, scRNA-seq data analysis showed that Siglech expression was higher in cells in cluster 0 and lower in more differentiated pre-cDC2As in clusters 2 and 8 (Extended Data Fig. 8b). We sorted Siglec- and Siglec- pre-cDC2s from the bone marrow and performed bulk RNA-seq analysis to obtain a DEG signature for both populations (Extended Data Fig. 8c-d and Supplementary Table 5). When mapped onto the scRNA-seq UMAP, the signature of the Siglec- pre-cDC2s highlighted cells in clusters 0,2 and 8 , whereas the signature of the Siglec- pre-cDC2s highlighted cells in clusters1 and 7(Extended Data Fig. 8d). We further used principal component analysis (PCA) to probe the relationship between bone marrow Siglec- pre-cDC2s and
Siglec- pre-cDC2s and the pre-cDC2As and pre-cDC2Bs found in the spleen. Principal component 1 segregated cells according to tissue, while principal component 2 split the cells according to subset (Extended Data Fig. 8c), indicating similarity between Siglec- and pre-cDC2s and Siglec- and CD8 pre-cDC2s.
Siglec- pre-cDC2s displayed a greater proliferation index than Siglec- pre-cDC2s, which was similar to the difference between cDC2As and cDC2Bs (Fig. 4 g ). cDC2As and Siglec- pre-cDC2s responded more strongly to flagellin stimulation, whereas cDC2Bs and Siglec- pre-cDC2s were more responsive to R848, CpG and zymosan (Fig. 4 h ). Bone marrow Siglec- pre-cDC2As and Siglec- pre-cDC2Bs displayed comparable labeling to bone marrow pre-cDC1s in Clec9a lineage-tracing mice (Extended Data Fig. 6a-b) and were FIt3L-dependent (Extended Data Fig. 6c), suggesting that they all descended from CDPs and not monocytes. These data showed that Siglec- pre-cDC2s and Siglec- pre-cDC2s in the bone marrow resemble peripheral cDC2As and cDC2Bs, respectively in terms of gene expression, proliferation capacity and pattern of responsiveness to innate immune stimuli .
Lymphotoxin and Notch ligands sustain pre-cDC2A specification
We next sorted Siglec- and Siglec- pre-cDC2s from the bone marrow of T-bet-ZsGreen mice for in vitro differentiation assays. Both Siglec- in the bone marrow. a, Number of cells and expression of MHC-II and CD43 on CD45.2 cells recovered from the spleen of CD45.1 WT recipient mice 3 days after transfer of Siglec- or Siglec- pre-cDC2s isolated from T-bet-ZsGreen mice (sorted as in Extended Data Fig. 7a). b, Expression of CD8 (%) and T-bet-ZsGreen (MFI) on CD45.2 cells isolated from T-bet-ZsGreen mice and recovered from CD45.1 WT mice as in a. c, Manual gating to confirm the UMAP analysis used for quantification in a,b. d, Number of cells and expression of MHC-II and CD43 on CD cells recovered from the spleen of CD45.1 WT recipient mice 6 days after transfer of Siglec- or Siglec- pre-cDC2s isolated from T-bet-ZsGreen mice (sorted as in Extended Data Fig. 7a). e, cDC2 specification (as measured using SIRP upregulation) of CD45.2 cells isolated from T-bet-ZsGreen mice and recovered from CD45.1 WT mice as in d.f, Expression of CD117, Esam and
CLEC12A (%) on CD45.2 cells isolated from T-bet-ZsGreen mice and recovered from CD45.1 WT mice as in d. g, Manual gating to confirm the UMAP analysis used for quantification in d-f. h, T-bet-ZsGreen MFI on Siglec- and Siglec- pre-cDC2s from the bone marrow of T-bet-ZsGreen mice before transfer. Background autofluorescence was subtracted by gating on equivalent cells from WT mice. i, T-bet-ZsGreen in Siglec- or Siglec- pre-cDC2s (or their progeny after transfer) isolated from the bone marrow of CD45.2 T-bet-ZsGreen mice before transfer or 6 days after transfer into CD45.1 WT mice (as in d). Each dot represents one mouse ( , including ); data are a pool of two experiments (mean s.e.m.). A two-tailed Mann-Whitney -test or two-way ANOVA (with Tukey correction, i) was used to compare the fate of Siglec- and Siglec- pre-cDC2s. values are indicated above the graphs. NS, not significant.
Fig. 7 | Lineage tracing confirms distinct CDC2A and CDC2B ontogenetic
lineages. a, Representative flow cytometry plots of the expression of RFP and eGFP on Siglec- and Siglec- pre-cDC2s and percentage of Siglec- and LysM-eGFP cells among pre-cDC1s and Siglec- or Siglec- pre-cDC2s from the bone marrow of SigH Lyz mice. Pre-cDCs were identified using the UMAPs as in Extended Data Fig. 7b-d.b, Representative UMAPs (concatenated spleen, MLN, lung and liver) generated on CD11c Lin cells using CD11c, MHC-II, CD26, CD64, CD88, XCR1, SIRP , Esam, CLEC12A, CD11b, CD43, CD135, CD117, Ly6C and
CD8 as in Extended Data Fig. 4c-e, overlaying RFP and eGFP cells in cDC2As and CDC 2 Bs and or pre-cDC2s. c, Percentage of or eGFP , cDC2As, cDC2Bs and pre-cDC1s, and CD8 pre-cDC2s or CD8 pre-cDC2s identified using the UMAPs as shown in Extended Data Fig. 4c-e from the spleen, MLN, lung and liver of SigH Lyz mice. Gates for RFP and GFP cells were set using WT mouse cell counterparts. Each dot represents one mouse ( ); data are from one of two experiments (mean s.e.m.). A one-way ANOVA (with Tukey correction) was used for comparison. values are indicated above the graphs.
and Siglec- pre-cDC2s cultured with Flt3L alone differentiated into cDC2s, as measured by the upregulation of MHC-II and SIRP (Fig. 5a). However, they did not give rise to T-bet-ZsGreen cells unless cocultured with OP9-DL4 feeder cells, which provide Notch ligands (Extended Data Fig.8e), in the presence of recombinant mouse lymphotoxin (Fig.5a,b). In this setting, Siglec- pre-cDC2s, but not Siglec- pre-cDC2s, generated T-bet-ZsGreen cDC2As (Fig. 5a,b). This reiterated the importance
of Notch signaling in the cDC2A differentiation pathway and led us to assess its effect on pre-cDC2s. Although C9a and C9a mice had equivalent numbers of Siglec- and Siglec- pre-cDC2s in the bone marrow and and pre-cDC2s in the periphery (Extended Data Fig. 8f), bulk RNA-seq analysis showed that bone marrow pre-cDC2s from j mice displayed an altered gene expression profile (Extended Data Fig.8g and Supplementary Table6).
This was particularly noticeable for Siglec- pre-cDC2s (Supplementary Table 6). Gene set enrichment analysis (GSEA) identified ‘signaling by Notch’, as well as cell cycle and cytokine receptor signaling as pathways altered in Siglec pre-cDC2s (Fig. 5c). Thus, Notch signals were especially critical for the continued development of bone marrow Siglec- pre-cDC2s.
Pre-cDC2 subset specification starts in the bone marrow
Next, we adoptively transferred Siglec- or Siglec- bone marrow pre-cDC2s from CD45.2T-bet-ZsGreen mice into sublethally irradiated CD45.1 recipients. On day 3 after transfer, we recovered equivalent numbers of CD45.2 cells from the spleens of both recipient groups and most were pre-cDCs (Fig. 6a). Siglec- pre-cDC2s preferentially acquired CD8 and T-bet-ZsGreen expression, whereas Siglec- pre-cDC2s remained negative for both markers (Fig. 6b,c). On day 6 after transfer, a time point that allowed for complete conversion of the transferred cells into cDC2s, virtually of CD45.2 cells were SIRP MHC-II CD (Fig. 6d,e). Siglec- pre-cDC2s preferentially gave rise to or cDC2s, whereas Siglec- pre-cDC2s preferentially gave rise to CLEC12A cDC2s (Fig. 6f), confirming previous observations . Even though neither bone marrow Siglec- pre-cDC2s nor Siglec- pre-cDC2s expressed detectable T-bet-ZsGreen at the time of the transfer, Siglec- pre-cDC2s showed an increased tendency to give rise to T-bet-ZsGreen cDC2s (Fig. 6g-i). These experiments indicated that CDC 2 A and CDC 2 B lineage bias was already imprinted at the level of the pre-cDC2s that leave the bone marrow.
Lineage tracing suggests distinct CDC2A and CDC2B ontogeny
To confirm these findings without cell transfer or irradiation, we used Siglech Rosa26 mice (hereafter SigH ), which trace the progeny of Siglec-H-expressing precursors . In parallel, we sought to define pre-cDC2Bs and cDC2Bs independently of lack of expression of Siglec-H, CD8 or T-bet. Gene expression analysis of cDC2A versus cDC2B lineages (Fig. 4 b and Extended Data Fig. 9a) suggested that LysM (Lyz2) might act as a marker for the latter. As such, we crossed the SigH mice to a reporter strain to generate Lyz mice. Plasmacytoid cells, which express Siglec- , were Siglec-H-red fluorescent protein (RFP) in these mice (Extended Data Fig. 9b). A high percentage ( ) of tDCs were also Siglec-H-RFP (Extended Data Fig. 9c), which is consistent with the notion that they can express Siglec-H and descend from Siglec- plasmacytoid cell precursors . In the cDC lineage, Siglec-H-RFP labeling was found in bone marrow Siglec- pre-cDC2s ( ) but not Siglec- pre-cDC2s or pre-cDC1s (Fig. 7a), while LysM-enhanced green fluorescent protein (eGFP) expression was found in Siglec- pre-cDC2s , Siglec- pre-cDC2s and pre-cDC1s ( ) (Fig. 7a). Even though Siglec-H expression was extinguished as pre-cDC2As left the bone marrow, the dichotomy was preserved across peripheral lymphoid and nonlymphoid organs: the frequency of Siglec- cells was higher among tissue pre-cDC2s than in CD8 pre-cDC2Bs or pre-cDC1s (CD8 pre-cDC2s: ; CD8 pre-cDC2s: ; pre-cDC1s: ), while the opposite was true for LysM-eGFP cells (CD8 pre-cDC2s: ; CD8 pre-cDC2s: ; pre-cDC1s: ) (Fig. 7b,c). In the differentiated cDC2 compartment, Siglec-H-RFP labeling was largely restricted to Esam cDC2As and early cDC2As, mirroring the labeling of CD8 pre-cDC2As (Fig. 7b,c and Extended Data Fig. 9c). In contrast, LysM-eGFP expression was preferentially seen in CLEC12A cDC2Bs and was absent in cDC1s (Fig. 7b,c). These data were consistent with the notion that cDC2As and cDC2Bs were derived from distinct Siglec- and LysM precursors (Extended Data Fig. 9d).
Bone marrow specification of cDC2s is conserved across species
We reanalyzed a published dataset that reported cDC2As and cDC2Bs among HLA-DR isotype (HLA-DR) cells from human spleen .
We identified a small cluster of pre-cDCs that could be further segregated into two clusters resembling cDC2As or cDC2Bs (Extended Data Fig.10a,b), suggesting that human spleen contained pre-cDC2As and pre-cDC2Bs. To assess if these pre-cDC2s can also be found in bone marrow, we purified them using a gating strategy previously developed for human blood cDCs and their precursors . CD3- CD14-CD15- CD1 cells sorted from the bone marrow of human donors (Fig. 8a) were subjected to scRNA-seq analysis. After excluding a small number of contaminants, we generated a UMAP that included 8,240 cells and 14 clusters (Fig. 8b). We used the signatures of all previously identified DC populations in humans, including cDC1, cDC2A, cDC2B and DC3 (refs. 15,21,23) (Supplementary Table 7) to annotate the clusters and included a progenitor signature (Supplementary Table 7) to visualize the differentiation directionality. Earlier progenitors were found in clusters 1, 3, 5 and 9 while cluster 10 contained the pre-cDC1/cDC1 lineage (Fig. 8c). Cluster 11 showed the highest score for the cDC2A signature whereas pre-cDC2Bs/cDC2Bs were found in clusters 0,7 and 12 and DC3s in clusters and 13 (Fig. 8c). Overall, we found three distinct populations of pre-cDCs/ cDCs (cDC1, cDC2A and cDC2B), and DC3s (Fig. 8d,e and Supplementary Table 8). Notably, GSEA comparing mouse cDC2 lineages alongside human pre-cDC2A/cDC2A (cluster 11) and pre-cDC2B/cDC2B (clusters 0, 7 and 12) showed a considerable overlap in pathways that were enriched in the cDC2A lineage across species (Fig. 8f). Thus, the cDC2A/cDC2B subset specification appears conserved across mice and humans.
Discussion
Distinct cell types or different cell states can contribute to the heterogeneity of cDC2s. In this study, we identified pre-cDC2s in mouse bone marrow and peripheral tissues that displayed differential propensity to generate cDC2As versus cDC2Bs and could account for previously described cDC2 types. Much like the separation between cDC1s and cDC2s, the specification of cDC2As and cDC2Bs started in the bone marrow. These data argue for a model in which cDC subsets (cDC1, cDC2A and cDC2B) and related lineages (DC3s, plasmacytoid cells, tDCs) are prespecified in the bone marrow and constitute bona fide DC subsets rather than tissue-determined cell states.
We could not ascertain whether pre-cDC2As and pre-cDC2Bs are unipotential as we noted residual capacity of bone marrow or spleen pre-cDC2 to generate cDC2Bs. This might reflect plasticity but could equally represent technical limitations in cell sorting or in the penetrance of Cre-mediated recombination in lineage tracing. In addition, some of the output cells in our lineage-tracing experiments, and in vivo transfer and in vitro differentiation assays, did not express markers that allowed us to assign them to either the cDC2A or cDC2B lineages. Clonal analysis, as well as more extensive phenotyping, will be important in the future to distinguish precursor bias from absolute commitment. Siglec- and Siglec- pre-cDC2s are proposed to represent distinct developmental stages of . We further found a population of bone marrow pre-cDC2s that never expressed Siglec-H and generates cDC2Bs. We also showed that Siglec- pre-cDC2As lost the expression of Siglec-H as they left the bone marrow, concomitant with the acquisition of CD8 expression and before final differentiation into cDC2As in tissues. This is consistent with a previous report that Siglec- pre-cDC2s can give rise to but argues that it is the case only for cDC2As and not cDC2Bs.
Specific organ niches can drive adult monocytes to become resident macrophages akin to those that colonized the organs during embryonic life . In this setting, tissue signals override ontogeny to specify myeloid cell fate. However, unlike tissue macrophages that can live up to 18 months in mice and 11 years in humans , the lifespan of cDCs in mouse tissues is estimated to be days in most organs . This might explain why cDC2 subsets are prespecified in the bone marrow, as they may not have enough time to be ‘instructed’ by their niche.
However, this does not negate the importance of the tissue microenvironment as we showed that pre-cDC2s required a permissive setting to complete their differentiation. Different environmental cues in lymphoid versus nonlymphoid organs could modulate the proliferation and lifespan of pre-cDC2 types or their progeny, explaining the contrasting proportion of cDC2As and cDC2Bs in these organs. In line with this notion, cDC2As proliferate more than Esam cDC2s in response to lymphotoxin expressed by splenic ILC3s . Differential expression of chemokine receptors in pre-cDC2As versus pre-cDC2Bs (for example, Ccr1, Ccr2 and Ccr9, as noted in our scRNA-seq analysis) could additionally affect the tropism of pre-cDC subsets toward different organs.
We focused on ontogeny and gene expression as the primary tool for cDC definition, as done by others . It has been suggested that progenitors that express Siglec- and share other markers with plasmacytoid cells (most likely corresponding to the pre-cDC2As described in this study) act as cDC2 precursors . tDCs can generate Esam cells that show phenotypic overlap with, yet are distinct from, cDC2As . Our data suggest that pre-cDC2As display phenotypic similarities to tDCs, but arise from Ly6D- precursors, display distinct gene expression signatures from tDCs, can be distinguished by higher expression of SIRP , MHC-II, CLEC12A and CD43 and lower expression of CD24, and display lower labeling than tDCs in mice. As such, our data are consistent with the notion that tDCs and pre-cDC2As represent distinct populations, although we note that both can give rise to Esam DCs (this work and Sulczewski et al. ). Based on the expression of CD11b and CD24, tDC-derived Esam DCs may not be canonical cDC2As, although expression of T-bet remains to be assessed. Finer delineation of the cDC2A and the tDC lineages will require a genetic approach, such as hCD2 or CD300c lineage-tracing mice.
DC3s have recently been shown to be distinct from cDCs and monocytes and arise from Ly6 C monocyte-DC progenitors that do not go through a pre-cDC stage . Similarly, tDCs originate from Ly6D bone marrow progenitors shared with plasmacytoid . The discovery of ontogenetically distinct DC3s, tDCs, together with our observations, supports a model in which the bone marrow is the original site of DC precursor bias toward the cDC1, cDC2A, cDC2B, DC3 and tDC fate. Additional studies will be necessary to establish the degree of plasticity in pre-cDC commitment during inflammation and assess the functional properties of progeny cDC2As, cDC2Bs, DC3s and tDCs.
Online content
Any methods, additional references, Nature Portfolio reporting summaries, source data, extended data, supplementary information, acknowledgements, peer review information; details of author contributions and competing interests; and statements of data and code availability are available at https://doi.org/10.1038/s41590-024-01745-9.
References
Cabeza-Cabrerizo, M., Cardoso, A., Minutti, C. M., Pereira da Costa, M. & Reis e Sousa, C. Dendritic cells revisited. Annu. Rev. Immunol. 39, 131-166 (2021).
Guilliams, M. et al. Dendritic cells, monocytes and macrophages: a unified nomenclature based on ontogeny. Nat. Rev. Immunol. 14, 571-578 (2014).
Tussiwand, R. et al. Klf4 expression in conventional dendritic cells is required for T helper 2 cell responses. Immunity 42, 916-928 (2015).
Lewis, K. L. et al. Notch2 receptor signaling controls functional differentiation of dendritic cells in the spleen and intestine. Immunity 35, 780-791 (2011).
Satpathy, A. T. et al. Notch2-dependent classical dendritic cells orchestrate intestinal immunity to attaching-andeffacing bacterial pathogens. Nat. Immunol. 14, 937-948 (2013).
Persson, E. K. et al. IRF4 transcription-factor-dependent CD11b dendritic cells drive mucosal T helper 17 cell differentiation. Immunity 38, 958-969 (2013).
Schlitzer, A. et al. IRF4 transcription factor-dependent CD11b dendritic cells in human and mouse control mucosal IL-17 cytokine responses. Immunity 38, 970-983 (2013).
Gao, Y. et al. Control of T helper 2 responses by transcription factor IRF4-dependent dendritic cells. Immunity 39, 722-732 (2013).
Kumamoto, Y. et al. CD301b dermal dendritic cells drive T helper 2 cell-mediated immunity. Immunity 39, 733-743 (2013).
Mayer, J. U. et al. Homeostatic IL-13 in healthy skin directs dendritic cell differentiation to promote and inhibit cell polarization. Nat. Immunol. 22, 1538-1550 (2021).
Liu, T. T. et al. Ablation of cDC2 development by triple mutations within the Zeb2 enhancer. Nature 607, 142-148 (2022).
Bosteels, C. et al. Inflammatory type 2 cDCs acquire features of cDC1s and macrophages to orchestrate immunity to respiratory virus infection. Immunity 52, 1039-1056 (2020).
Murphy, T. L. et al. Transcriptional control of dendritic cell development. Annu. Rev. Immunol. 34, 93-119 (2016).
Kasahara, S. & Clark, E. A. Dendritic cell-associated lectin 2 (DCAL2) defines a distinct CD8 dendritic cell subset. J. Leukoc. Biol. 91, 437-448 (2012).
Brown, C. C. et al. Transcriptional basis of mouse and human dendritic cell heterogeneity. Cell 179, 846-863 (2019).
Akagbosu, B. et al. Novel antigen-presenting cell imparts -dependent tolerance to gut microbiota. Nature 610, 752-760 (2022).
Rodrigues, P. F. et al. pDC-like cells are pre-DC2 and require KLF4 to control homeostatic CD4 T cells. Sci. Immunol. 8, eadd4132 (2023).
Cabeza-Cabrerizo, M. et al. Recruitment of dendritic cell progenitors to foci of influenza A virus infection sustains immunity. Sci. Immunol. 6, eabi9331 (2021).
Ginhoux, F., Guilliams, M. & Merad, M. Expanding dendritic cell nomenclature in the single-cell era. Nat. Rev. Immunol. 22, 67-68 (2022).
Leylek, R. et al. Integrated cross-species analysis identifies a conserved transitional dendritic cell population. Cell Rep. 29, 3736-3750 (2019).
See, P. et al. Mapping the human DC lineage through the integration of high-dimensional techniques. Science 356, eaag3009 (2017).
Valente, M. et al. Novel mouse models based on intersectional genetics to identify and characterize plasmacytoid dendritic cells. Nat. Immunol. 24, 714-728 (2023).
Villani, A.-C. et al. Single-cell RNA-seq reveals new types of human blood dendritic cells, monocytes, and progenitors. Science 356, eaah4573 (2017).
Alcántara-Hernández, M. et al. High-dimensional phenotypic mapping of human dendritic cells reveals interindividual variation and tissue specialization. Immunity 47, 1037-1050 (2017).
Sulczewski, F. B. et al. Transitional dendritic cells are distinct from conventional DC2 precursors and mediate proinflammatory antiviral responses. Nat. Immunol. 24, 1265-1280 (2023).
Bar-On, L. et al. dendritic cells are a steady-state population related to plasmacytoid dendritic cells. Proc. Natl Acad. Sci. USA 107, 14745-14750 (2010).
Ginhoux, F. et al. The origin and development of nonlymphoid tissue CD103 DCs. J. Exp. Med. 206, 3115-3130 (2009).
Schraml, B. U. et al. Genetic tracing via DNGR-1 expression history defines dendritic cells as a hematopoietic lineage. Cell 154, 843-858 (2013).
Grajales-Reyes, G. E. et al. Batf3 maintains autoactivation of Irf8 for commitment of a CD8 conventional DC clonogenic progenitor. Nat. Immunol. 16, 708-717 (2015).
Schlitzer, A. et al. Identification of and cDC 2 -committed DC progenitors reveals early lineage priming at the common DC progenitor stage in the bone marrow. Nat. Immunol. 16, 718-728 (2015).
Sichien, D., Lambrecht, B. N., Guilliams, M. & Scott, C. L. Development of conventional dendritic cells: from common bone marrow progenitors to multiple subsets in peripheral tissues. Mucosal Immunol. 10, 831-844 (2017).
Klebanoff, C. A. et al. Retinoic acid controls the homeostasis of pre-cDC-derived splenic and intestinal dendritic cells. J. Exp. Med. 210, 1961-1976 (2013).
Zeng, R., Bscheider, M., Lahl, K., Lee, M. & Butcher, E. C. Generation and transcriptional programming of intestinal dendritic cells: essential role of retinoic acid. Mucosal Immunol. 9, 183-193 (2016).
Vanderkerken, M. et al. ILC3s control splenic cDC homeostasis via lymphotoxin signaling. J. Exp. Med. 218, e20190835 (2021).
Zhu, J. et al. The transcription factor T-bet is induced by multiple pathways and prevents an endogenous Th2 cell program during Th1 cell responses. Immunity 37, 660-673 (2012).
Guilliams, M. et al. Unsupervised high-dimensional analysis aligns dendritic cells across tissues and species. Immunity 45, 669-684 (2016).
Dress, R. J. et al. Plasmacytoid dendritic cells develop from Ly6D lymphoid progenitors distinct from the myeloid lineage. Nat. Immunol. 20, 852-864 (2019).
Rodrigues, P. F. et al. Distinct progenitor lineages contribute to the heterogeneity of plasmacytoid dendritic cells. Nat. Immunol. 19, 711-722 (2018).
Liu, Z. et al. Dendritic cell type 3 arises from Ly6C monocytedendritic cell progenitors. Immunity 56, 1761-1777 (2023).
Pereira da Costa, M. et al. Interplay between CXCR4 and CCR2 regulates bone marrow exit of dendritic cell progenitors. Cell Rep. 42, 112881 (2023).
Delaney, C. et al. Combinatorial prediction of marker panels from single-cell transcriptomic data. Mol. Syst. Biol. 15, e9005 (2019).
Faust, N., Varas, F., Kelly, L. M., Heck, S. & Graf, T. Insertion of enhanced green fluorescent protein into the lysozyme gene creates mice with green fluorescent granulocytes and macrophages. Blood 96, 719-726 (2000).
Calvanese, V. et al. Mapping human haematopoietic stem cells from haemogenic endothelium to birth. Nature 604, 534-540 (2022).
Guilliams, M., Thierry, G. R., Bonnardel, J. & Bajenoff, M. Establishment and maintenance of the macrophage niche. Immunity 52, 434-451 (2020).
Patel, A. A., Ginhoux, F. & Yona, S. Monocytes, macrophages, dendritic cells and neutrophils: an update on lifespan kinetics in health and disease. Immunology 163, 250-261 (2021).
Liu, K. et al. Origin of dendritic cells in peripheral lymphoid organs of mice. Nat. Immunol. 8, 578-583 (2007).
Papaioannou, N. E. et al. Environmental signals rather than layered ontogeny imprint the function of type 2 conventional dendritic cells in young and adult mice. Nat. Commun. 12, 464 (2021).
Kabashima, K. et al. Intrinsic lymphotoxin- receptor requirement for homeostasis of lymphoid tissue dendritic cells. Immunity 22, 439-450 (2005).
Waskow, C. et al. The receptor tyrosine kinase Flt3 is required for dendritic cell development in peripheral lymphoid tissues. Nat. Immunol. 9, 676-683 (2008).
Publisher’s note Springer Nature remains neutral with regard to jurisdictional claims in published maps and institutional affiliations.
The research in this manuscript complies with all relevant ethical regulations. Mouse experiments were planned in accordance with the principles of the three Rs (replacement, reduction, refinement). All experiments were performed in accordance with the United Kingdom Animals (Scientific Procedures) Act of 1986. The UK Home Office accredited all researchers for animal handling and experimentation. Dispensation to carry out animal research at the Francis Crick Institute was approved by the institutional ethical review body and granted by the UK Home Office under PPL PF40C0C67.
Mice
C57BL/6J (CD45.1 ), C57BL/6J (CD45.2 ), T-bet-ZsGreen (Taconic Biosciences), Rbpj (abbreviated to RBPJ), Clec9a (abbreviated to C9a), Flt3l (Taconic Biosciences), Rosa26 (The Jackson Laboratory) mice were bred at the Francis Crick Institute in specific pathogen-free conditions.Siglech mice (B6-Siglech ) were generated by the Centre d’Immunophénomique (Marseille, France) and crossed to the Rosa and strains. All genetically modified mouse lines were backcrossed to C57BL/6J;6-12-week-old male and female mice were age-matched and sex-matched in all experiments.
Human bone marrow
Human bone marrow was purchased from STEM CELL Technologies and processed as described previously . Briefly, cells from three independent donors (female aged 31 years, and males aged 29 and 24 years) were thawed in prewarmed FCS containing DNase I ( ), washed and stained for fluorescence-activated cell sorting (FACS) as described below (the antibodies used for staining are listed in Supplementary Table 10). After sorting, human pre-DCs and DCs from the three individuals were pooled to minimize individual variability before submission for scRNA-seq.
Preparation of single-cell suspensions
Mice were perfused intracardially through the left ventricle using cold PBS before tissue collection. Livers were further perfused in situ via the portal vein. This procedure efficiently removed circulating cells as assessed by injection of CD45 antibody (intravenously) 2 min before tissue collection and processing . Spleens, MLNs, lungs and livers were cut into small pieces and digested with collagenase VIII ( , Sigma-Aldrich) and DNase I ( , Roche) in Roswell Park Memorial Institute (RPMI) 1640 medium for 15 min (spleen and MLN) or 25 min (lung and liver) at . Digested tissues were passed through a cell strainer (BD Biosciences) and washed with FACS buffer ( FCS and 5 mM EDTA in PBS). For lung and liver, leukocytes were enriched using Percoll gradient centrifugation (GE Healthcare) as described previously . For bone marrow, the femur, tibia and hip extremities were cut and spun for 30 s at . Cells were resuspended in FACS buffer after centrifugation. For the transfer assays, the spine and humerus were also collected and crushed with a mortar before collecting a cell suspension with a micropipette and filtering using a cell strainer.
Pre-cDC enrichment and isolation
Single-cell suspensions from the bone marrow, spleen and lung were enriched for pre-cDCs by staining for lineage-restricted markers with biotin-conjugated or fluorescein isothiocyanate (FITC)-conjugated antibodies (CD3, Ly6G, Siglec-F, B220, CD19, Ly6D, NK1.1 and Ter119) and depleting T, B and plasmacytoid cells, as well as red blood cells, neutrophils, eosinophils and their precursors, using the EasySep Mouse Biotin Positive Selection Kit II (STEMCELL Technologies). Cells were stained as described below. Pre-cDC and cDC subsets were FACS-sorted on an Aria Fusion (BD Biosciences) with a nozzle using the gating strategy shown in Extended Data Figs. 1b, 3a, 4a and 7a as indicated.
Flow cytometry analysis
Cells were preincubated with blocking anti-CD16/32 in FACS buffer for 10 min at and then stained for 40 min at with an antibody cocktail and LIVE/DEAD Fixable Dead Cell Stain Kit (Thermo Fisher Scientific) in FACS buffer. Lineage (Lin) markers included CD3, Ly6G, Siglec-F, B220, CD19, Ly6D, NK1.1 and Ter119, unless otherwise specified. The antibodies used for flow cytometry are listed in Supplementary Table 10. Samples were acquired using a BD FACSymphony A5 (BD Biosciences) or in an ID7000 (Sony Biotechnology) or SpectroFlo Aurora (Cytek) spectral analyzers. Data were analyzed using FlowJo (v.10.8.2) as shown in Extended Data Figs.1,4 and 8. UMAP analysis of the flow cytometry data was carried out on the basis of CD11b, CD11c, CD26, CD43, CD64, CD88, CD135, SIRP , MHC-II, CD117, Ly6C, Siglec-H, CD8 , XCR1, CLEC12A and Esam expression. Annotation of clusters on the UMAP plots was done by using defining markers for each immune population. Validation of the accuracy of the UMAP analysis versus manual gating was confirmed by overlaying different immune populations identified by either strategy. Monocytes and MDCs were identified as in Cabeza-Cabrerizo et al. . Earlier bone marrow progenitors were identified as in Cardoso et al. .
scRNA-seq
Mouse and human pre-cDCs (viability>95%) were processed according to the manufacturer’s instructions on a 10X Genomics Chromium platform. Library generation was performed using the Chromium Single Cell 3′ Reagents Kits (10X Genomics) and sequenced on an HiSeq 4000 (Illumina) to achieve an average of approximately 63,000 reads per cell and approximately 4,000 cells per sample. Raw reads were initially processed using the Cell Ranger v.3.0.2 pipeline , which deconvolved reads to their cell of origin using the unique molecular identifier tags, aligned these to the mm10 transcriptome (to which we added the eGFP sequence (https://www.addgene.org/browse/sequence/305137/) to detect GFP-expressing cells) using STAR (v.2.5.1b) and reported cell-specific gene expression count estimates. All subsequent analyses were performed in R v.3.6.1 using the Seurat (v.3) package . Genes were considered to be ‘expressed’ if the estimated ( ) count was at least 0.1. Primary filtering was then performed by removing from consideration cells expressing fewer than 50 genes and cells for which mitochondrial genes made up greater than three standard deviations from the mean of mitochondria-expressed genes. PCA decomposition was performed and, after consideration of the eigenvalue ‘elbow-plots’, the first 30 components were used to construct the UMAP plots per sample. Multiple samples were integrated using 2,000 variable genes and Seurat’s canonical correlation analysis. Cluster-specific gene markers were identified using a Wilcoxon rank-sum test; the top 10 or 20 genes ranked according to log fold change per cluster were used to generate a heatmap. Clusters were annotated using known marker genes and gene signatures (refs. 15,30 and Supplementary Table 9). Contamination with plasmacytoid cells and MDCs was ruled out by integrating our data with previous scRNA-seq analysis that included these cells and checking for cluster segregation. GSEA was used to identify pathways enriched in a cluster or a group of them against others. CytoTRACE was used to determine the differentiation states of cells. Trajectories were identified using the package Slingshot (v.1.4.0) , using the undifferentiated cluster as a starting point and the dimensionality reduction UMAP coordinates. Lineages were identified showing different trajectories ending in specific differentiated cells (Supplementary Table 11). Comet analysis was used to identify putative flow cytometry markers for populations defined using scRNA-seq. The analysis was performed by loading the scRNA-seq data, the UMAP and the clustering from Seurat on the Comet portal ).
Bulk RNA-seq
Pre-cDCs and cDCs (gating strategy shown in Extended Data Figs.1b, 4a and 7a) were FACS-sorted from the bone marrow and spleen either from
WT or C9a and C9a mice. Cells to were sorted directly into lysis buffer to avoid loss of material. RNA was extracted using the RNeasy Mini Kit (QIAGEN). The NuGEN Ovation RNA-Seq System (V2) was used for complementary DNA (cDNA) synthesis followed by the NuGEN Ultralow Library System (V2) for library preparation. Samples were normalized to 1 ng of RNA for input; the preparation was performed according to the manufacturer’s guidelines. Sequencing was performed on an Illumina HiSeq 4000, with 100-base pair single-end reads. After sequencing, samples were normalized and analyzed. GSEA was used to identify pathways enriched in cells from different genotypes.
RNA extraction and RT-qPCR
Cells were collected in RLT buffer and RNA extraction was performed using the RNeasy Micro Kit (QIAGEN). cDNA synthesis was carried out using SuperScript II Reverse Transcriptase (Invitrogen). RT-qPCR was performed using the TaqMan Universal PCR Master Mix (Thermo Fisher Scientific) and primers (Supplementary Table 12). Analysis was performed on a QuantStudio PCR system (Thermo Fisher Scientific) using quantification.
Pre-cDC differentiation assays and OP9 transduction
OP9 cells were obtained from ATCC (CRL-2749). The OP9 DL1/GFP line was obtained from the Francis Crick Institute Cell Services. To generate a feeder cell line overexpressing DL4, we made use of a commercial lentiviral system (Lenti ORF clone of Dll4 (Myc-DDK-tagged), OriGene).Vesicular stomatitis virus G(VSVG)-pseudotyped lentivirus was generated by transfecting HEK 293T cells with of pCMV delta R8.2 (Addgene), of VSVG (Addgene) and of transfer plasmid (OriGene). Supernatant was collected 72 h after transfection, spun down to remove debris and used to transduce OP9 cells (CRL-2749, ATCC). After 24 h , cells were selected with puromycin and subsequently FACS-sorted to enrich for DL4-expressing cells (Extended Data Fig. 8e).
Flt3L-driven differentiation of pre-cDCs was carried out as outlined elsewhere . Briefly, pre-cDCs were cocultured with OP9 cells into 96-well plates in RPMI 1640 medium supplemented with l-glutamine (Gibco), penicillin-streptomycin (Gibco), nonessential amino acids (Gibco), HEPES (Gibco), sodium pyruvate (Gibco), 10% FCS (Sigma-Aldrich) and -mercaptoethanol (Gibco) (R10). Then, OP9, OP9-DL1/GFP or OP9-DL4 cells were plated; the following day, to sorted pre-cDCs from T-bet-ZsGreen mice were added to the OP9 monolayer after removing the medium and replacing it with fresh medium containing mouse Flt3L ( ) or lymphotoxin ( ) (R&D Systems). Progeny cells were assessed 3 days later using flow cytometry. DC differentiation was assessed according to MHC-II upregulation, whereas plasmacytoid cell differentiation was quantified according to the expression of B220 and Siglec-H. cDC1s were defined as , and CDC 2 s were defined as . CDC 2 A fate was assessed using T-bet upregulation (ZsGreen expression).
Pre-cDC2 and cDC2 stimulations
Pre-cDC2 (Siglec-H high and low) and cDC2 populations were sorted from the bone marrow and spleen, respectively (gating strategy shown in Extended Data Figs. 1b and 7a). Subsequently, cells were cultured in R10 in the presence and absence of different stimuli (InvivoGen) at varying concentrations: flagellin ( ), R848 ( ), CpG ODN and zymosan ( ). After 12 h of culture, cells were recovered for subsequent FACS analysis (OX40L) or processed for RT-qPCR (as outlined above). The viability of recovered cells was similar across cell types and treatments, as assessed using flow cytometry.
Cell transfers
The cell transfer experiments were performed as described before . Briefly, spleen and bone marrow (legs, hip bone, spine and humerus)
were collected from CD45.2 C57BL/6J (WT or Tbx21-ZsGreen) mice. Pre-cDC2s subsets were sorted as indicated in Extended Data Figs. 4a and 7 a. Cells were injected intravenously into sublethally irradiated (6.6 Gy) CD45.1 C57BL/6J mice 1 day after irradiation. Spleen cells were analyzed 3 or 6 days after transfer.
Proliferation assessment
Mice were injected intraperitoneally with 1 mg EdU (Lumiprobe) 2 h before tissue collection for assessment of cell proliferation. EdU detection was carried out using the Click-iT Plus EdU Alexa Fluor 647 Flow Cytometry Kit (Thermo Fisher Scientific) after surface staining and fixation and permeabilization. Intranuclear staining of was performed in parallel to EdU detection. Cells were analyzed using flow cytometry as described above.
Statistical analysis and reproducibility
No statistical methods were used to predetermine sample sizes but our sample sizes were similar to those reported in previous publications . Mice were not randomized in cages, but each cage was randomly assigned to a treatment group. Investigators were not blinded to mouse identity during necropsy and sample analysis. Male and female mice were used to perform the experiments. However, we did not observe differences between sexes. In all cases measurements were taken from distinct samples and no individual data points were excluded under any circumstances. Statistical analyses were performed using Prism 9 (GraphPad Software). Results are depicted as the mean s.e.m. and median IQR in violin plots. The statistical test used is specified in each figure legend. For pair comparisons, a nonparametric two-tailed Mann-Whitney -test was used. When ANOVA was used, Tukey correction was performed. Data distribution was assumed to be normal, but this was not formally tested. For Tables 1, 3 and 5, a two-sided Wald test with Benjamini-Hochberg correction was used. For Supplementary Tables 2, 4, 6 (DEGs) and 8, a one-sided Wilcoxon signed-rank test with Benjamini-Hochberg correction was used. For Supplementary Table 6 (enrichment), a one-sided hypergeometric test with Benjamini-Hochberg correction was used. For Supplementary Table 11, a one-sided Wald test not corrected for multiple testing was used. These comparisons were made using the DESeq2. Genes with were taken forward and used to draw a heatmap using the ComplexHeatmap R package or to generate a gene signature.
Reporting summary
Further information on research design is available in the Nature Portfolio Reporting Summary linked to this article.
Data availability
The scRNA-seq and bulk RNA-seq data have been deposited in the Gene Expression Omnibus under accession nos. GSE217328, GSM6711828, GSM6711829, GSM6711830 and GSE244346. All other data needed to evaluate the conclusions in the manuscript are presented in the manuscript or the Supplementary Information.
References
Tanigaki, K. et al. Notch-RBP-J signaling is involved in cell fate determination of marginal zone B cells. Nat. Immunol. 3, 443-450 (2002).
Luche, H., Weber, O., Nageswara Rao, T., Blum, C. & Fehling, H. J. Faithful activation of an extra-bright red fluorescent protein in ‘knock-in’ Cre-reporter mice ideally suited for lineage tracing studies. Eur. J. Immunol. 37, 43-53 (2007).
Huerga Encabo, H., Ulferts, R., Sharma, A., Beale, R. & Bonnet, D. Infecting human hematopoietic stem and progenitor cells with SARS-CoV-2. STAR Protoc. 2, 100903 (2021).
Becht, E. et al. Dimensionality reduction for visualizing single-cell data using UMAP. Nat. Biotechnol. https://doi.org/10.1038/ nbt. 4314 (2018).
Cardoso, A. et al. Interleukin-10 induces interferon- -dependent emergency myelopoiesis. Cell Rep. 37, 109887 (2021).
Zheng, G. X. Y. et al. Massively parallel digital transcriptional profiling of single cells. Nat. Commun. 8, 14049 (2017).
Dobin, A. et al. STAR: ultrafast universal RNA-seq aligner. Bioinformatics 29, 15-21 (2013).
Stuart, T. et al. Comprehensive Integration of single-cell data. Cell 177, 1888-1902 (2019).
Mildner, A. et al. Genomic characterization of murine monocytes reveals C/EBP transcription factor dependence of Ly6C cells. Immunity 46, 849-862 (2017).
Gulati, G. S. et al. Single-cell transcriptional diversity is a hallmark of developmental potential. Science 367, 405-411 (2020).
Street, K. et al. Slingshot: cell lineage and pseudotime inference for single-cell transcriptomics. BMC Genomics 19, 477 (2018).
Schmitt, T. M. & Zúñiga-Pflücker, J. C. Induction of T cell development from hematopoietic progenitor cells by delta-like-1 in vitro. Immunity 17, 749-756 (2002).
Kirkling, M. E. et al. Notch signaling facilitates in vitro generation of cross-presenting classical dendritic cells. Cell Rep. 23, 3658-3672 (2018).
Acknowledgements
We thank members of the Immunobiology Laboratory for helpful discussions and suggestions. We thank the Crick Advanced Sequencing, Biological Research and Flow Cytometry science technology platforms for their support throughout this project. We also thank M. Gaya for facilitating the collaboration between the laboratories of C.R.S. and M.D. This work was supported by The Francis Crick Institute, which receives core funding from Cancer Research UK (CC2090, CC2079 and CC2027), the UK Medical Research Council (CC2090, CC2079 and CC2027) and the Wellcome Trust (CC2090, CC2079 and CC2027); the European Research Council Advanced Investigator grants AdG 268670 and 786674 (to C.R.S.); Wellcome Investigator Awards WT106973 and WT223136 (to C.R.S.); and a prize from the Louis-Jeantet Foundation (to C.R.S.). This research was funded in part by the Wellcome Trust (grant nos. CC2090, CC2079, CC2027, WT106973 and WT223136). The work performed in the laboratory of M.D. was supported by a grant from Fondation pour la Recherche Médicale (Equipe Labellisée, ref. no. DEQ20180339172) and by institutional funding from the Centre National de la Recherche Scientifique, Institut National de la Santé et de la Recherche Médicale and Aix-Marseille Université. For the purpose of open access, the authors have applied a CC BY public copyright license to any author accepted manuscript version arising from this submission.
Author contributions
C.M.M. and C.R.S. designed the experiments, analyzed the data and wrote the manuscript. D.B. and H.H.E. provided the human bone marrow. J. Langhorne provided the mutant mice. M.D. and E.T. provided the mutant mice and contributed to the design of the fate mapping experiments. C.M.M. conducted the experiments with assistance from C.P., M.P.d.C., N.R., H.H.E., A.C., J. Loong, G.B., C.M. and E.T. C.P., M.P.d.C., P.C., C.M. and E.T. assisted with the data analysis. C.M.M. and P.C. carried out the statistical analysis. C.R.S. supervised the project. All authors reviewed and edited the manuscript.
Funding
Open Access funding provided by The Francis Crick Institute.
Competing interests
C.R.S. has an additional appointment as visiting professor in the Faculty of Medicine at Imperial College London and holds honorary professorships at University College London and King’s College London. C.R.S. is a founder of Adendra Therapeutics and owns stock options in or is a paid consultant for Adendra Therapeutics, Bicara Therapeutics, Montis Biosciences and Bicycle Therapeutics, all unrelated to this work. The other authors declare no competing interests.
Peer review information Nature Immunology thanks the anonymous reviewers for their contribution to the peer review of this work. Primary Handling Editor: Ioana Staicu was the primary editor on this article and managed its editorial process and peer review in collaboration with the rest of the Nature Immunology editorial team.
Extended Data Fig. 1 | Spleen cDC2 gating strategy. a, Gating strategy used in 1a. Leftmost panel shows cells pre-gated on single, live, . The lineage cocktail includes antibodies against CD3, Ly6G, SiglecF, B220, CD19, NK1.1, Ly6D, and Ter119. and MHC -II cells are initially selected, after which and CD64 cDCs are divided into cDC1s ( ) and cDC2s (SIRP ). After excluding CD8 tDCs, cDC2s are split into ZsGreen and ZsGreen for further analysis. Arrows denote gate hierarchy. , Sorting strategy for spleen cDC2s. Leftmost panel shows cells pre-gated on single, live, . The lineage cocktail includes antibodies against CD3, Ly6G, SiglecF, B220, CD19, NK1.1, Ly6D, and Ter119. and cells are initially selected, after which and CD64 CDCs are divided into and .
After excluding CD8 tDCs (dark blue), cDC2As (teal) and cDC2Bs (orange) are identified using ESAM and CLEC12A, respectively. Arrows denote gate hierarchy. c, Manual gates from B are overlaid onto a UMAP (same as 1b) of the Lin CD11c cells (from the first gate of the manual strategy in a). The UMAP was generated on the basis of CD11c, MHC-II, CD26, CD64, CD88, XCR1, SIRP , ESAM, CLEC12A, CD11b, CD43, CD135, CD117, Ly6C, and CD8 . cDC2s in the leftmost UMAP are gated and zoomed in the following panels, where cDC2 subsets gated manually are overlaid. See also Fig. 1b. d, The expression of key markers used to define different CDC and tDC subpopulations in the UMAPs is shown in the form of heatmaps. Expression levels are represented as a colour gradient from low (blue) to high (orange).
Extended Data Fig. 2 | See next page for caption.
Extended Data Fig. 2 | Validation of spleen cDC2 gating strategy. a, (Left) Heatmap representation of the top differentially expressed genes (an adjusted p value of ) from a new bulk RNAseq analysis of the two cDC2 populations (ESAM cDC2s and CLEC12A cDC2s) sorted using the gating strategy shown in Extended Data Fig. 1b (PCA is shown later in Extended Data Fig. 5a). Expression levels are represented as a colour gradient from low (blue) to high (orange). Each column represents a sample coming from a pool of 5 mice. Note that the expression of Esam, Clec12a and Tbx21 was either not detected or not significant in the statistical analysis. (Right) Feature plots representing the score of DEGs from a (used as signatures) of ESAM cDC2s and CLEC12A cDC2s overlaid onto a UMAP of cDC2As and cDC2Bs generated from the Brown et al scRNAseq dataset .
Expression levels are shown as a gradient from low (light grey) to high (teal). The quantification of the scores is shown on the bottom in the form of violin plots. b, (from left to right and top to bottom) FACS analysis showing CD43, MHC-II, CD8 , CD117, ESAM, CD11b, CLEC12A, CD24, MGL-2 and PD-L2 expression on spleen cDC2 and tDC populations (identified from UMAP gates as shown in 1b and Extended Data Fig. 1c, d). c, FACS analysis showing the percentage of different populations (identified as shown in 1b and Extended Data Fig. 1c, d) in the indicated tissues. Data in ( ) are a pool of two experiments ( ) (means SEM, median IQR for violin plot). Each dot in b represents one mouse ( ). Mann-Whitney test (two-tailed) was used to compare cDC2As and cDC2Bs in A. P values are indicated on top of the graphs.
Extended Data Fig. See next page for caption.
Extended Data Fig. 3| Validation of gating strategy for sorting total precDC populations from tissues. a, Sorting strategy for pre-cDCs (and other precursor cells to ascertain which ones are bona fide pre-cDCs). Live single cells from spleen or bone marrow cell suspensions negative for lineage markers (CD3, Ly6G, SiglecF, B220, CD19, NK1.1, and Ter119) and positive for CD45.2 were analysed as follows: were selected, from this gate, the cells contained the pre-cDCs and other contaminants. cells contained two populations: Ly6D and Ly6D cells. The Ly6D cells were directly sorted as one population (grey gate). The Ly6D cells were further split into three subpopulations that were sorted as shown on the fourth panel: CD11b (light blue gate), CD11b (dark blue gate) and CD11b (orange gate). Arrows denote gate hierarchy. , The populations highlighted in panels 3 and 4 were sorted from the bone marrow (top) or spleen (bottom) and cultured for 3 days with OP9-DL1 stromal cells in the presence of Flt3L. Data are FACS analysis showing the % recovery after differentiation and frequency of cDC subsets and plasmacytoid cells among the progeny. These populations were analysed using manual gating
and were defined as: single, live, cells. CDC 1 s are defined as while cDC 2 s express SIRP . The right panel shows the subset distribution of progeny from the sorted cells after differentiation. c, FACS analysis showing TdTomato labelling of the indicated cell populations from the bone marrow or spleen of C9a mice gated as shown in a. d, FACS analysis showing the abundance of the indicated cell populations (gated as shown in a) in the bone marrow and spleens of WT and Flt3L-deficient mice. e, Refined gating strategy used to sort total pre-cDCs from tissues taking into account the results from a-d. In this sorting strategy, pre-cDCs are identified as leukocytes that are negative for many lineage-restricted markers (CD3, Ly6G, SiglecF, B220, CD19, Ly6D, NK1.1, and Ter119), as well as negative/low for surface expression of MHC-II, CD11b and SIRP , but positive for CD11c, CD135, and CD43. Each dot represents one mouse ( in b and d and 8 in c ). Data are from one out of two experiments (b, d) or a pool of two (c) (means SEM). Mann-Whitney test (two-tailed) was used to compare WT and Flt3l-/ mice in (d). P values are indicated on top of the graphs.
Extended Data Fig. 4 | Pre-cDC subset identification in the spleen, MLN, lung and liver. a, Sorting strategy for spleen pre-cDC subsets. Leftmost panel has been pre-gated on single, live, , and lineage spleen cells. The lineage cocktail includes antibodies against CD3, Ly6G, SiglecF, B220, CD19, NK1.1, Ly6D, and Ter119. CD117 and Ly6C are used to identify pre-cDC1s (dark grey) and precDC2s, respectively. CD8 labels the putative pre-cDC2As (light green) whereas the putative pre-cDC2Bs are CD8 (yellow). Arrows denote gate hierarchy. b, (left) Violin plots showing the expression of and in pre-cDC1s (clusters 3 and 6) or pre-cDC2s (clusters ) from scRNAseq analysis (UMAP of data concatenated from all tissues). (right) Total pre-cDCs or the indicated subsets were sorted from spleen (sorting strategy as in Extended Data Fig. 4a) and cultured for 3 days with OP9-DL1 stromal cells in the presence of Flt3L. The progeny after differentiation was analysed by FACS for CDC subset distribution. Cells were analysed using manual gating and defined as: single, live, CD45.2 , CD11c MHC-II . CDC1s are defined as , whereas cDC2s express SIRP .
c, Manual gates as in Extended Data Fig. 4a for pre-cDCs and as in Extended Data Fig. 1b for cDC were overlaid onto a UMAP analysis of the spleen (same as 3b). Colours for pre-cDCs correspond to the gates in a. The UMAP was generated using the cells from the first gate of the manual strategy in a, and using the following markers: CD11c, MHC-II, CD26, CD64, CD88, XCR1, SIRP , ESAM, CLEC12A, CD11b, CD43, CD135, CD117, Ly6C, and CD8 . d, The expression of key markers used to define different pre-cDC subpopulations in the UMAPs (from spleen in 3b) is shown in the form of heatmaps. Expression levels are represented as a colour gradient from low (blue) to high (orange). e, Representative UMAP analysis from the spleen, MLN, lung and liver. UMAP was generated as in b. Ungated cells are migratory cDC1s and cDC2s, and probably DC3s and were not analysed in this study. In b (right) data are a pool of two experiments ( ) (means SEM and median IQR for violin plot). Mann-Whitney test (two-tailed) was used for comparisons. P values are indicated on top of the graphs.
Extended Data Fig. 5 | Validation of the strategy to identify splenic pre-cDC2 subsets. a, PCA of all expressed genes from a bulk RNAseq (same as Extended Data Fig. 2a) of the indicated populations sorted from spleen as shown in Extended Data Figs. 1b and 4a.b, (left) Heatmap representation of the top DEGs (an adjusted p value of ) defining pre-cDC2 and pre-cDC2 analysed by bulk RNAseq (same analysis as a). Expression levels are represented as a colour gradient from low (blue) to high (orange). Each column represents a sample coming from a pool of 5 mice. (right) Feature plots representing the score of the CD8 and CD8 pre-cDC2 signatures (signatures are the list of DEGs from the heatmap on the left) projected on the concatenated UMAP. Expression levels are shown as a gradient from low (light grey) to high (teal). The quantification of the scores is shown on top of the plots. c, FACS analysis showing (left) recovery (number of cells), (middle) differentiation (upregulation of MHC-II) and (right) cDC2 specification (upregulation of SIRP ) of WT CD45.2 cells recovered from spleens of WT CD45.1 recipient mice 3 days after transfer of the indicated CD45.2 pre-cDC2s populations ( cells sorted as shown in Extended Data Fig. 4a).
d, qRT-PCR analysis showing expression of (top left) and (bottom) in the indicated spleen cell populations (FACS-sorted as shown in Extended Data Figs. 1b and 4a). (top right) Flow cytometric quantification of CD8 expression in the indicated populations (gated as in Extended Data Fig. 4c-e). e, FACS analysis of CD45.2 cells recovered from spleens of CD45.1 mice 3 days after receiving the indicated CD45.2 pre-cDC2s populations from T-bet- ZsGreen mice ( cells sorted as shown on top – negative gate was set using a WT counterpart). Data are: (top left) recovery (number of cells), (top middle) differentiation (upregulation of MHC-II), (top right) cDC2 specification (upregulation of SIRP ), (bottom left) % ZsGreen , (bottom middle) % ESAM and (bottom right) % CLEC12A cells. Each dot represents one mouse, and data are a pool of two experiments ( in c and e and 6 in d ) (means SEM, median IQR for violin plot). Mann-Whitney test (two-tailed) was used for comparisons. P values are indicated on top of the graphs. In pre-cDC2 were compared against pre-cDC2, and cDC2A (and early cDC2A) against cDC2B.
Extended Data Fig. 6 | See next page for caption.
Extended Data Fig. 6 | cDC2As and cDC2Bs are bona fide cDC subsets. a, (left) schematic depicting strategy for labelling of cDC lineages in DNGR-1 lineage tracer mice (C9ate ). Figure was generated with BioRender. (right) FACS analysis showing % Tomato bone marrow progenitors identified as in reference . b, FACS analysis showing Tomato cells in the indicated cDC and pre-cDC subtypes and MDCs as reference for a poorly-labelled lineage. c, FACS analysis showing relative number of the indicated cDC and pre-cDC subtypes in WT versus Flt3L-deficient mice. Number of monocytes and MDCs from different tissues is also shown as reference for a Flt3L-independent lineage. Tissues analysed are indicated at the
left of the graphs. Each dot represents one mouse ( ), and data were pooled from two experiments, in c data are expressed as fold-difference from WT (means SEM). Gating and quantifications come from UMAPs as shown in Extended Data Fig. 7b-d (see later) for the bone marrow and Extended Data Fig. 4c-e for the spleen, MLN, lung and liver. Monocytes and MDCs were identified as in ref. 18. Each dot represents one biological replicate ( ), and data are a pool of two experiments (means SEM). For panels ( ) one-way ANOVA (with Tukey correction) was used for comparison of the groups against the labelling of MDPs or against the WT control. values are indicated on top of the graphs.
Extended Data Fig. 7| See next page for caption.
Extended Data Fig. 7| Pre-cDC subset identification in the bone marrow.
a, Sorting strategy for bone marrow pre-cDC subsets. Leftmost panel has been pre-gated on single, live, , and lineage spleen cells. The lineage cocktail includes antibodies against CD3, Ly6G, SiglecF, B220, CD19, NK1.1, Ly6D, and Ter119. CD117 and Ly6C are used to identify pre-cDC1s (dark grey) and pre-cDC2s, respectively. SiglecH labels the putative pre-cDC2As (light green) whereas the putative pre-cDC2Bs are Siglech (yellow). Arrows denote gate hierarchy. b, Manual gates used in a overlaid onto a UMAP analysis. The UMAP was generated using the CD11c cells from the first gate of the manual strategy
in a and used the following markers: CD11c, MHC-II, CD26, CD64, CD88, XCR1, SIRP , ESAM, CLEC12A, CD11b, CD43, CD135, CD117, Ly6C, and SiglecH. c, The expression of key markers used to define different pre-cDC subpopulations in the UMAPs is shown in the form of heatmaps. Expression levels are represented as a colour gradient from low (blue) to high (orange). d, Analysis strategy for pre-cDC subsets in the bone marrow. The plot has been zoomed in the population of pre-cDCs shown in the second panel of b (highlighted in blue). Dark grey gate are pre-cDC1s, green gate are SiglecH pre-cDC2s and yellow gate are SiglecH pre-cDC2s.
Extended Data Fig. 8|See next page for caption.
Extended Data Fig. 8 | cDC2A differentiation trajectory post bone marrow egress. a, FACS analysis of SiglecH expression by the indicated pre-cDC2 or cDC2 populations isolated from the tissues indicated on top of the graphs. Gating is shown in Extended Data Fig. 7b-d for the bone marrow and Extended Data Fig. 4c-e for peripheral organs.b, Violin plot depicting the expression of Siglech in the clusters from the concatenated UMAP of the scRNAseq analysis (see Fig. 2a). c, PCA of all expressed genes from a bulk RNAseq of the indicated pre-DC2 populations from spleen (Sorted as shown in Extended Data Fig. 4a) and bone marrow (sorted as shown in Extended Data Fig. 7a). d, (left) Heatmap representation of the top DEGs (an adjusted value of ) defining SiglecH pre-cDC2 and SiglecH pre-cDC2 analysed by bulk RNAseq (same analysis as c). Expression levels are represented as a colour gradient from low (blue) to high (orange). Each column represents a sample coming from a pool of 8 mice. (right) Feature plots representing the score of the DEGs (shown in the heatmap, used as signatures) of Siglech and SiglecH pre-cDC2 on the concatenated UMAP.
Expression levels are shown as a gradient from low (light grey) to high (teal). On the right is a violin plot depicting the expression of the DEG-derived signatures by the indicated clusters. e, FACS analysis of transduced OP9 cells showing overexpression of DL4. Sorted DL4 cells (bottom right panel) were used as feeder cells for Fig. 5a, b. f, FACS analysis showing the number of cells in the indicated pre-cDC2 populations from C9a (dark grey) or C9a (light grey) mice. Gating is shown in Extended Data Fig. 7b-d for the bone marrow and Extended Data Fig. 4c-e for peripheral organs. g, PCA of all expressed genes from a new bulk RNAseq of pre-DC2 populations (same as 5c) sorted (as shown in Extended Data Fig. 7a) from the bone marrow of C9a versus C9a mice. Each dot represents a sample coming from a pool of 3 mice. In panel a and f , each dot represents one mouse ( in a 9 in f ), and data were a pool from two experiments (means SEM, median IQR for violin plot). Two-way ANOVA (with Tukey correction, a, b and f) or Mann-Whitney test (two-tailed, d) was used to compare the different groups. P values are indicated on top of the graphs.
Extended Data Fig. 9 | See next page for caption.
Extended Data Fig. 9 | Model for cDC2A and cDC2B ontogeny. a, qRT-PCR analysis showing the expression of in cDC, tDC and pre-cDC populations from the spleen (sorted as shown in Extended Data Figs. 1b and 4a). Data are normalised to housekeeping gene Hprt.b, FACS analysis showing the percentage of in splenic plasmacytoid cells (defined as CD45.2 , SiglecH , CD26 CD64 cells) from SiglecH lineage tracing ( ) mice crossed to reporter mice. c, FACS analysis showing the percentage of RFP (top) or (bottom) among early cDC2As or tDCs across the indicated organs. Gating is shown in 1 b and Extended Data Fig. 1c-d. Dotted line is the reference value for pre-cDC2A (top) or eGFP cDC2B (bottom) percentage in each tissue. Each dot represents one mouse ( in b and c and 6 in a), and data from one of two experiments (b-c) or pooled from two experiments (a) (means SEM). One-way ANOVA (with Tukey correction) was used to compare: in a, pre-cDC2 were compared against pre-cDC2 and CDC 2 B against cDC2A and in c, the tDCs and the early cDC2As (separately) with the pre-cDC2As (top) or the cDC2Bs (bottom). P values are indicated on top of the graphs.
d, Schematic representation of a model for CDC2A and CDC2B ontogeny: In cDC2A differentiation, SiglecH-positive pre-cDC2As downregulate SiglecH as they leave the bone marrow and acquire the expression of CD8 as they colonise the tissues. Subsequent differentiation of these pre-cDC2As into tissue cDC2As involves downregulation of CD8 and upregulation of CD117 and MHC-II. T-bet expression is progressively upregulated throughout the entire cDC2A differentiation trajectory. cDC2A development is RBP-Jk-dependent. In cDC2B differentiation, the bone marrow generates pre-cDC2Bs that express LYSM but lack SiglecH and CD8 . This population differentiates into cDC2Bs marked by increased LYSM tracing and upregulation of MHC-II and CLEC12A. CDC2B development is KLF4-dependent. The question marks denote the gaps that remail to be addresses in our model: Clonal analysis, as well as the use of better or additional markers will be necessary to assess the level of plasticity within bone marrow cDC2 progenitors (top question mark). Similarly, the split between the cDC2A and the tDC lineage remains to be confirmed by a genetic approach (bottom question mark). Figure was generated with BioRender.
are shown as a gradient from low (light grey) to high (teal). Below are violin plots depicting the expression of the two gene signatures by the indicated clusters in the axes. Mann-Whitney test (two-tailed) was used for comparisons (median values are indicated on top of the graphs.
Extended Data Fig. | Identification of pre-cDC2A and pre-cDC2B in human spleen. a, UMAP of data taken from Ref. 15 displaying a single cell analysis of human splenic pre-cDCs with unsupervised clustering. b, Feature plots representing the score for gene expression signatures of cDC2A and cDC2B (Extended Data Fig. 9, from ) projected onto the UMAP space. Expression levels
natureportfolio
Corresponding author(s): Caetano Reis e Sousa and Carlos M. Minutti
Last updated by author(s): 04/01/2024
Reporting Summary
Nature Portfolio wishes to improve the reproducibility of the work that we publish. This form provides structure for consistency and transparency in reporting. For further information on Nature Portfolio policies, see our Editorial Policies and the Editorial Policy Checklist.
Statistics
For all statistical analyses, confirm that the following items are present in the figure legend, table legend, main text, or Methods section.
Confirmed
The exact sample size ( ) for each experimental group/condition, given as a discrete number and unit of measurement
A statement on whether measurements were taken from distinct samples or whether the same sample was measured repeatedly
The statistical test(s) used AND whether they are one- or two-sided
Only common tests should be described solely by name; describe more complex techniques in the Methods section.
A description of all covariates tested
X A description of any assumptions or corrections, such as tests of normality and adjustment for multiple comparisons
X
A full description of the statistical parameters including central tendency (e.g. means) or other basic estimates (e.g. regression coefficient) AND variation (e.g. standard deviation) or associated estimates of uncertainty (e.g. confidence intervals)
X
For null hypothesis testing, the test statistic (e.g. ) with confidence intervals, effect sizes, degrees of freedom and value noted Give values as exact values whenever suitable.
For Bayesian analysis, information on the choice of priors and Markov chain Monte Carlo settings
For hierarchical and complex designs, identification of the appropriate level for tests and full reporting of outcomes
X Estimates of effect sizes (e.g. Cohen’s , Pearson’s ), indicating how they were calculated
Our web collection on statistics for biologists contains articles on many of the points above.
Software and code
Policy information about availability of computer code
Data collection
Data analysis
N/A
Single cell RNA sequencing analyses were performed in R v.3.6.1 (https://www.R-project.org/) using the Seurat (v3) package. Differentiation trajectories were identified using the package ‘Slingshot’ (version 1.4.0). Comet analysis was used to identify putative flow cytometry markers from populations defined by scRNAseq. Statistical analyses were performed using GraphPad Prism 9 software (GraphPad). Flow cytometry data was analysed using FlowJo (10.8.2). Samples were acquired using BD FACSDiva in a Symphony A5 (BD), or SA3800 in a ID7000 5L (SONY) or SpectroFlo in a 5L Aurora (Cytek) spectral analysers.
For manuscripts utilizing custom algorithms or software that are central to the research but not yet described in published literature, software must be made available to editors and reviewers. We strongly encourage code deposition in a community repository (e.g. GitHub). See the Nature Portfolio guidelines for submitting code & software for further information.
Data
Policy information about availability of data
All manuscripts must include a data availability statement. This statement should provide the following information, where applicable:
Accession codes, unique identifiers, or web links for publicly available datasets
A description of any restrictions on data availability
For clinical datasets or third party data, please ensure that the statement adheres to our policy
Single cell and bulk RNA-seq data have been deposited in GEO under accession numbers GSE217328, GSM6711828, GSM6711829, GSM6711830. All other data needed to evaluate the conclusions in the paper are present in the paper or the Supplementary Materials.
Human research participants
Policy information about studies involving human research participants and Sex and Gender in Research.
Reporting on sex and gender
Human bone marrow was purchased from Stem Cell Technologies from male (2) and female (1) donors.
Population characteristics
Human marrows were selected from adults with similar age to minimise potential variability due to aging. The donors were 24 (male), 29 (male) and 31 (female) years old.
Recruitment
N/A
Ethics oversight
Human bone marrow was purchased from Stem Cell Technologies. The study was approved by the Francis Crick Institute Ethical Review Body.
Note that full information on the approval of the study protocol must also be provided in the manuscript.
Field-specific reporting
Please select the one below that is the best fit for your research. If you are not sure, read the appropriate sections before making your selection.
Life sciences Behavioural & social sciences Ecological, evolutionary & environmental sciences
For a reference copy of the document with all sections, see nature.com/documents/nr-reporting-summary-flat.pdf
Life sciences study design
All studies must disclose on these points even when the disclosure is negative.
Sample size
No statistical methods were used to pre-determine sample sizes but our sample sizes are similar to those reported in previous publications (Cabeza-Cabrerizo, et al. 2021, Science Immunology.
Data exclusions
No individual data points were excluded under any circumstances.
Replication
All experiments were performed at least twice and only data that reproduced across all experiments was included in this manuscript.
Randomization
Mice were not randomized in cages, but each cage was randomly assigned to a treatment group.
Blinding
Investigators were not blinded to mouse identity during necropsy and sample analysis.
Reporting for specific materials, systems and methods
We require information from authors about some types of materials, experimental systems and methods used in many studies. Here, indicate whether each material, system or method listed is relevant to your study. If you are not sure if a list item applies to your research, read the appropriate section before selecting a response.
Materials & experimental systems
Methods
n/a
Involved in the study
n/a
Involved in the study
Antibodies
Eukaryotic cell lines
Palaeontology and archaeology
Dual use research of concern
Antibodies
Antibodies used
All antibodies, and their information (conjugate, clone, commercial house and working concentration) are listed in Supplementary figure 9
Validation
All antibodies used in this study are commercial and validated by selling companies. Working concentrations were determined by titration using the starting with the concentrations suggested by the commercial house.
Eukaryotic cell lines
Policy information about cell lines and Sex and Gender in Research
Cell line source(s)
OP9, OP9-DL1 and OP9-DL4 cells were acquired from the Cell Services facility of The Francis Crick Institute.
Authentication
All cell lines used in this study have been tested for Species ID only – this identified the lines as mouse cells
Mycoplasma contamination
All cell lines tested negative for mycoplasma contamination
Commonly misidentified lines (See ICLAC register)
N/A
Animals and other research organisms
Policy information about studies involving animals; ARRIVE guidelines recommended for reporting animal research, and Sex and Gender in Research
Laboratory animals
C57BL/6J (CD45.1+), C57BL/6J (CD45.2+), Tbx21-ZsGreen (Taconic Biosciences), Rbpj-fl (abbreviated ), Clec9aCre (abbreviated C9a), Flt3I-/- (Taconic Biosciences), Rosa26-LSL-tdTomato (abbreviated tdTOM; the Jackson Laboratory) mice were bred at the Francis Crick Institute in specific pathogen-free conditions. SiglechiCre mice (B6-Siglechtm1(iCre)Ciphe) were generated by Centre d’Immunophénomique, Marseille, France and crossed to the Rosa26-LSL-RFP and the Lyz2-eGFP strains. All genetically modified mouse lines were backcrossed to C57BL/6J. Six- to 12-week-old male and female mice were age- and sex-matched in all experiments. The housing conditions are the following: Light cycles fluctuate from 7am-7pm. Temperature range from 20-24 degrees C and humidity is .
Wild animals
No wild animals were used in the study.
Reporting on sex
Male and female mice were used to perform the experiments. However, we did not observe differences between sexes.
Field-collected samples
No field collected samples were used in the study.
Ethics oversight
All experiments were performed in accordance with the United Kingdom Animals (Scientific Procedures) Act of 1986. The UK Home Office accredited all researchers for animal handling and experimentation. Dispensation to carry out animal research at the Francis Crick Institute was approved by the Institutional Ethical Review Body and granted by the UK government Home Office; as such all research was carried under the project license PF40C0C67.
Note that full information on the approval of the study protocol must also be provided in the manuscript.
Flow Cytometry
Plots
Confirm that:
The axis labels state the marker and fluorochrome used (e.g. CD4-FITC).
The axis scales are clearly visible. Include numbers along axes only for bottom left plot of group (a ‘group’ is an analysis of identical markers).
All plots are contour plots with outliers or pseudocolor plots.
A numerical value for number of cells or percentage (with statistics) is provided.
Methodology
Sample preparation
Cells were preincubated with blocking anti-CD16/32 in FACS buffer for 10 min at and then stained for 40 min at with antibody cocktail and LIVE/DEAD Fixable Dead Cell Stain Kit in FACS buffer. Lineage (Lin) markers included CD3, Ly6G, SiglecF, B220, CD19, Ly6D, NK1.1, and Ter119. Antibodies used for flow cytometry are listed in Table S6.
Instrument
Samples were acquired using a Symphony A5 (BD), or a 5L ID7000 (SONY) or 5L Aurora (Cytek) spectral analysers.
Software
Data were analysed using FlowJo 10.
Cell population abundance
At least cells were stained and analysed so as to achieve a robust number of cells in the pre-cDC gate.
Gating strategy
UMAP analysis of flow cytometry data was generated on the basis of CD11b, CD11c, CD16/32, CD26, CD43, CD64, CD88, CD135, SIRP , MHC-II, CD117, Ly6C, SiglecH, CD8 , XCR1, CLEC12A, and ESAM expression. Annotation of clusters on the UMAP plots was done by using defining markers for each immune population. The accuracy of our manual gating was confirmed on the UMAPs by overlaying different immune populations identified with manual gating.
Tick this box to confirm that a figure exemplifying the gating strategy is provided in the Supplementary Information.
Immunobiology Laboratory, The Francis Crick Institute, London, UK. Bioinformatics and Biostatistics, The Francis Crick Institute, London, UK. Haematopoietic Stem Cell Laboratory, The Francis Crick Institute, London, UK. Retroviral Immunology Laboratory, The Francis Crick Institute, London, UK. Aix-Marseille University, Centre National de la Recherche Scientifique, Institut National de la Santé et de la Recherche Médicale, Centre d’Immunologie de Marseille-Luminy, Turing Center for Living Systems, Marseille, France. Malaria Immunology Laboratory, The Francis Crick Institute, London, UK. Present address: Immunoregulation Laboratory, Champalimaud Research, Champalimaud Centre for the Unknown, Lisbon, Portugal. – e-mail: carlos.minutti@research.fchampalimaud.org; caetano@crick.ac.uk

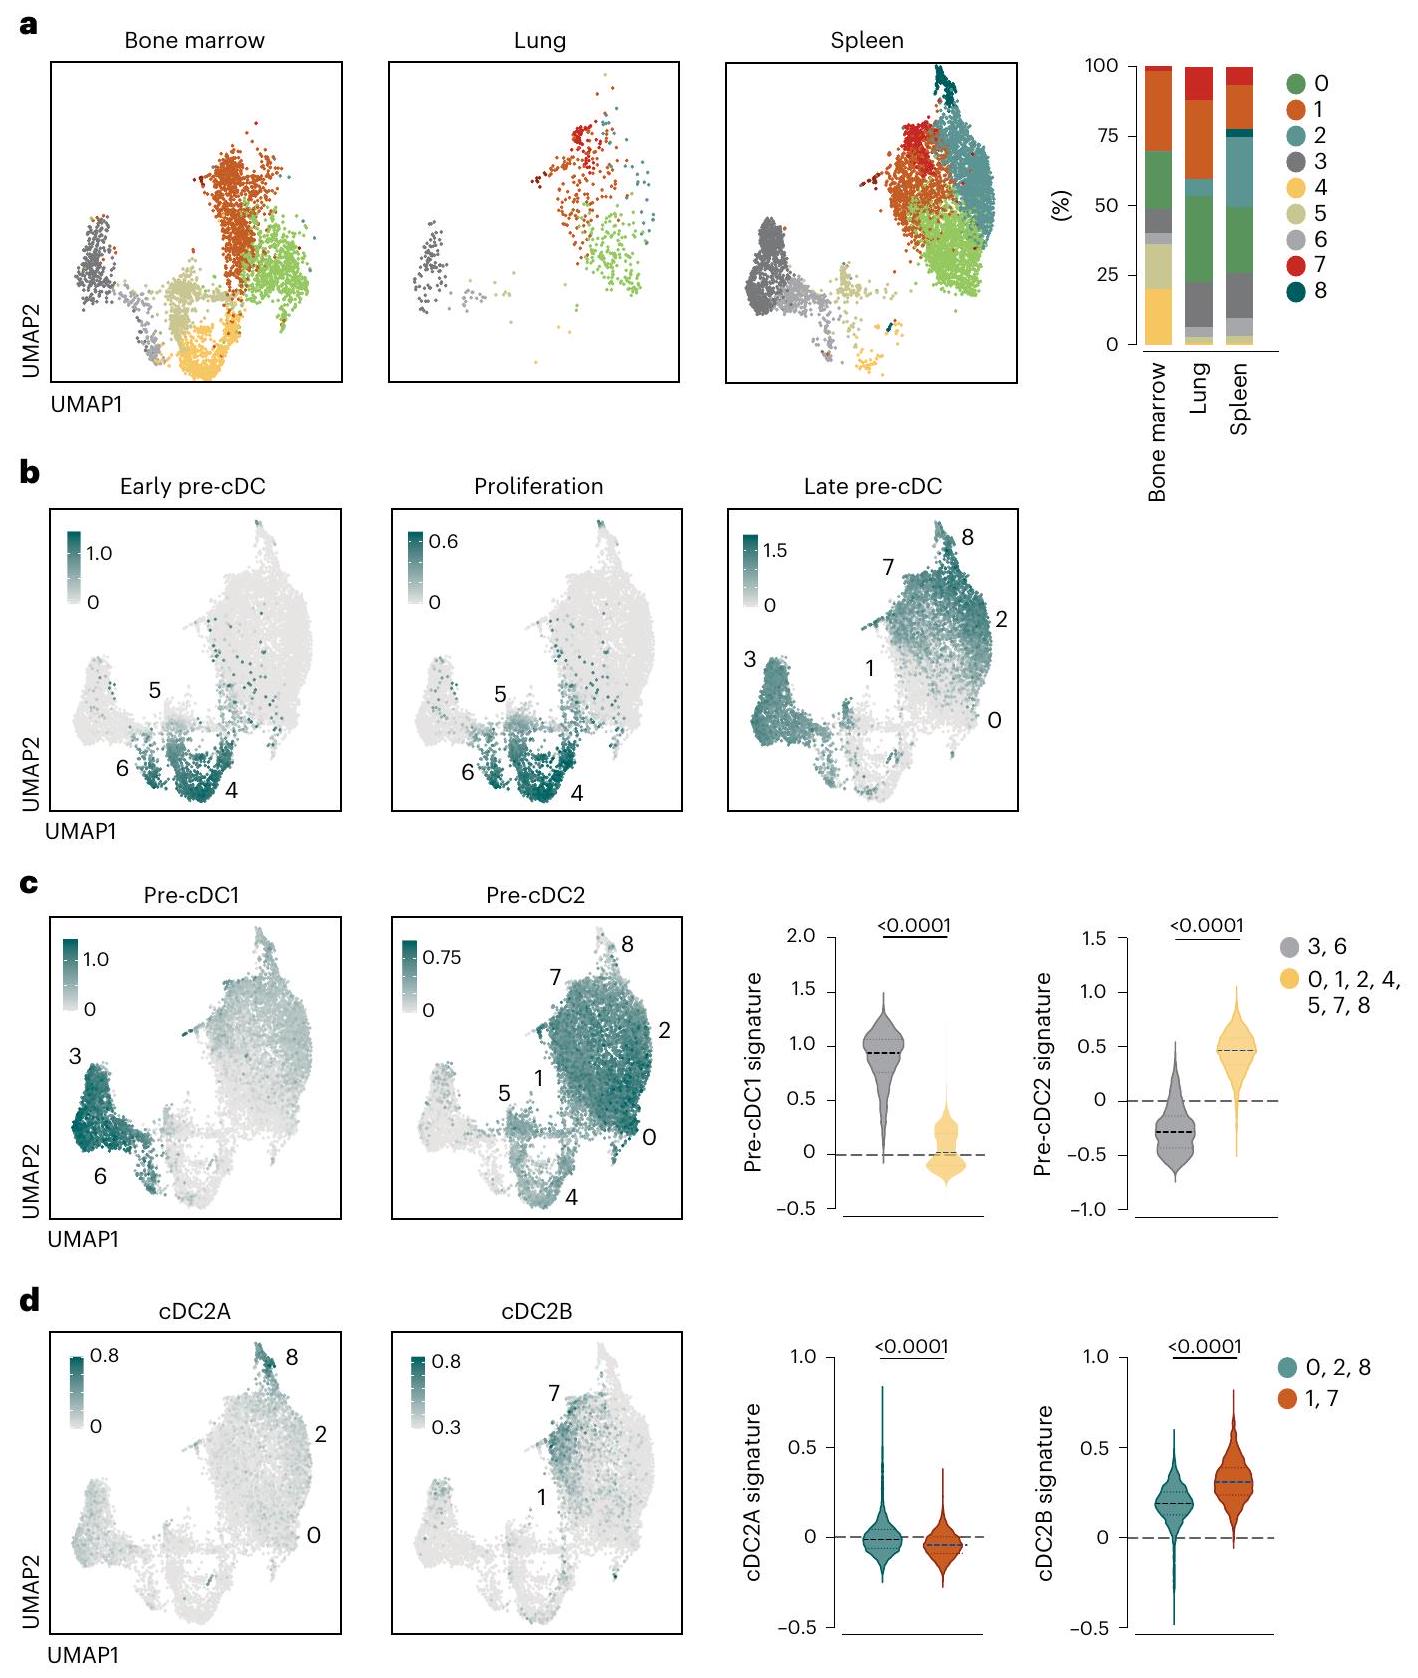
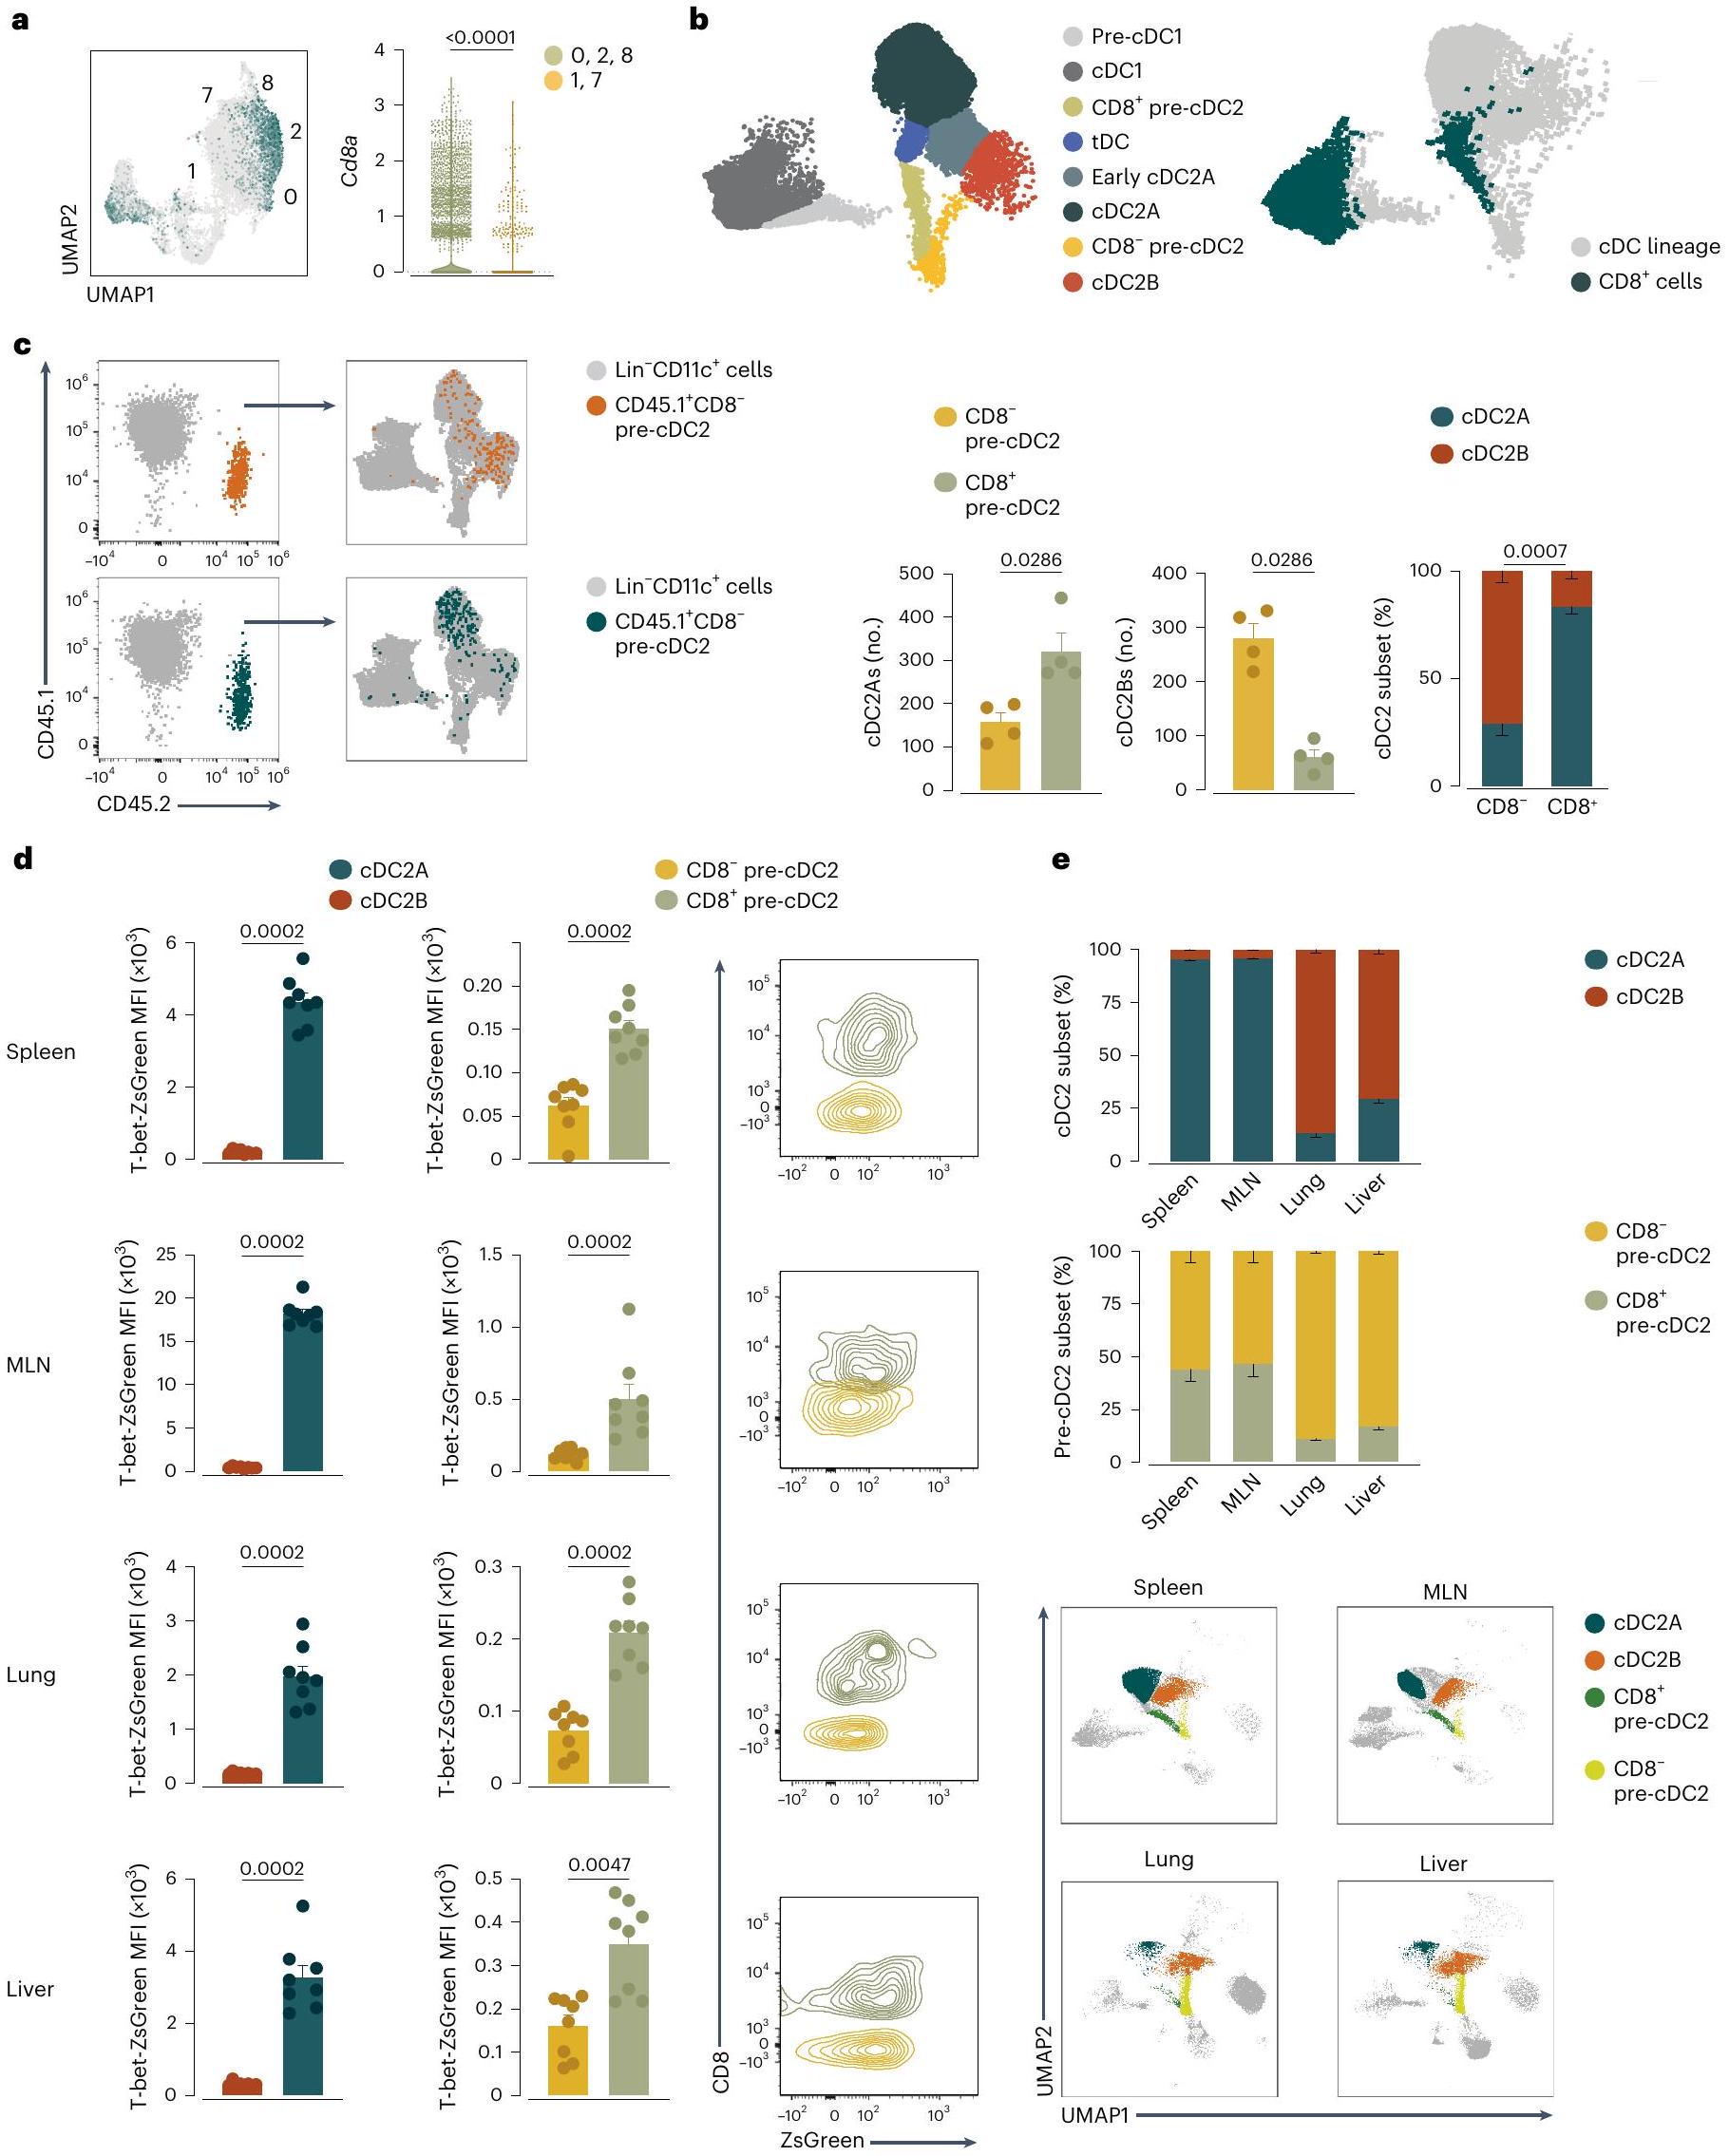
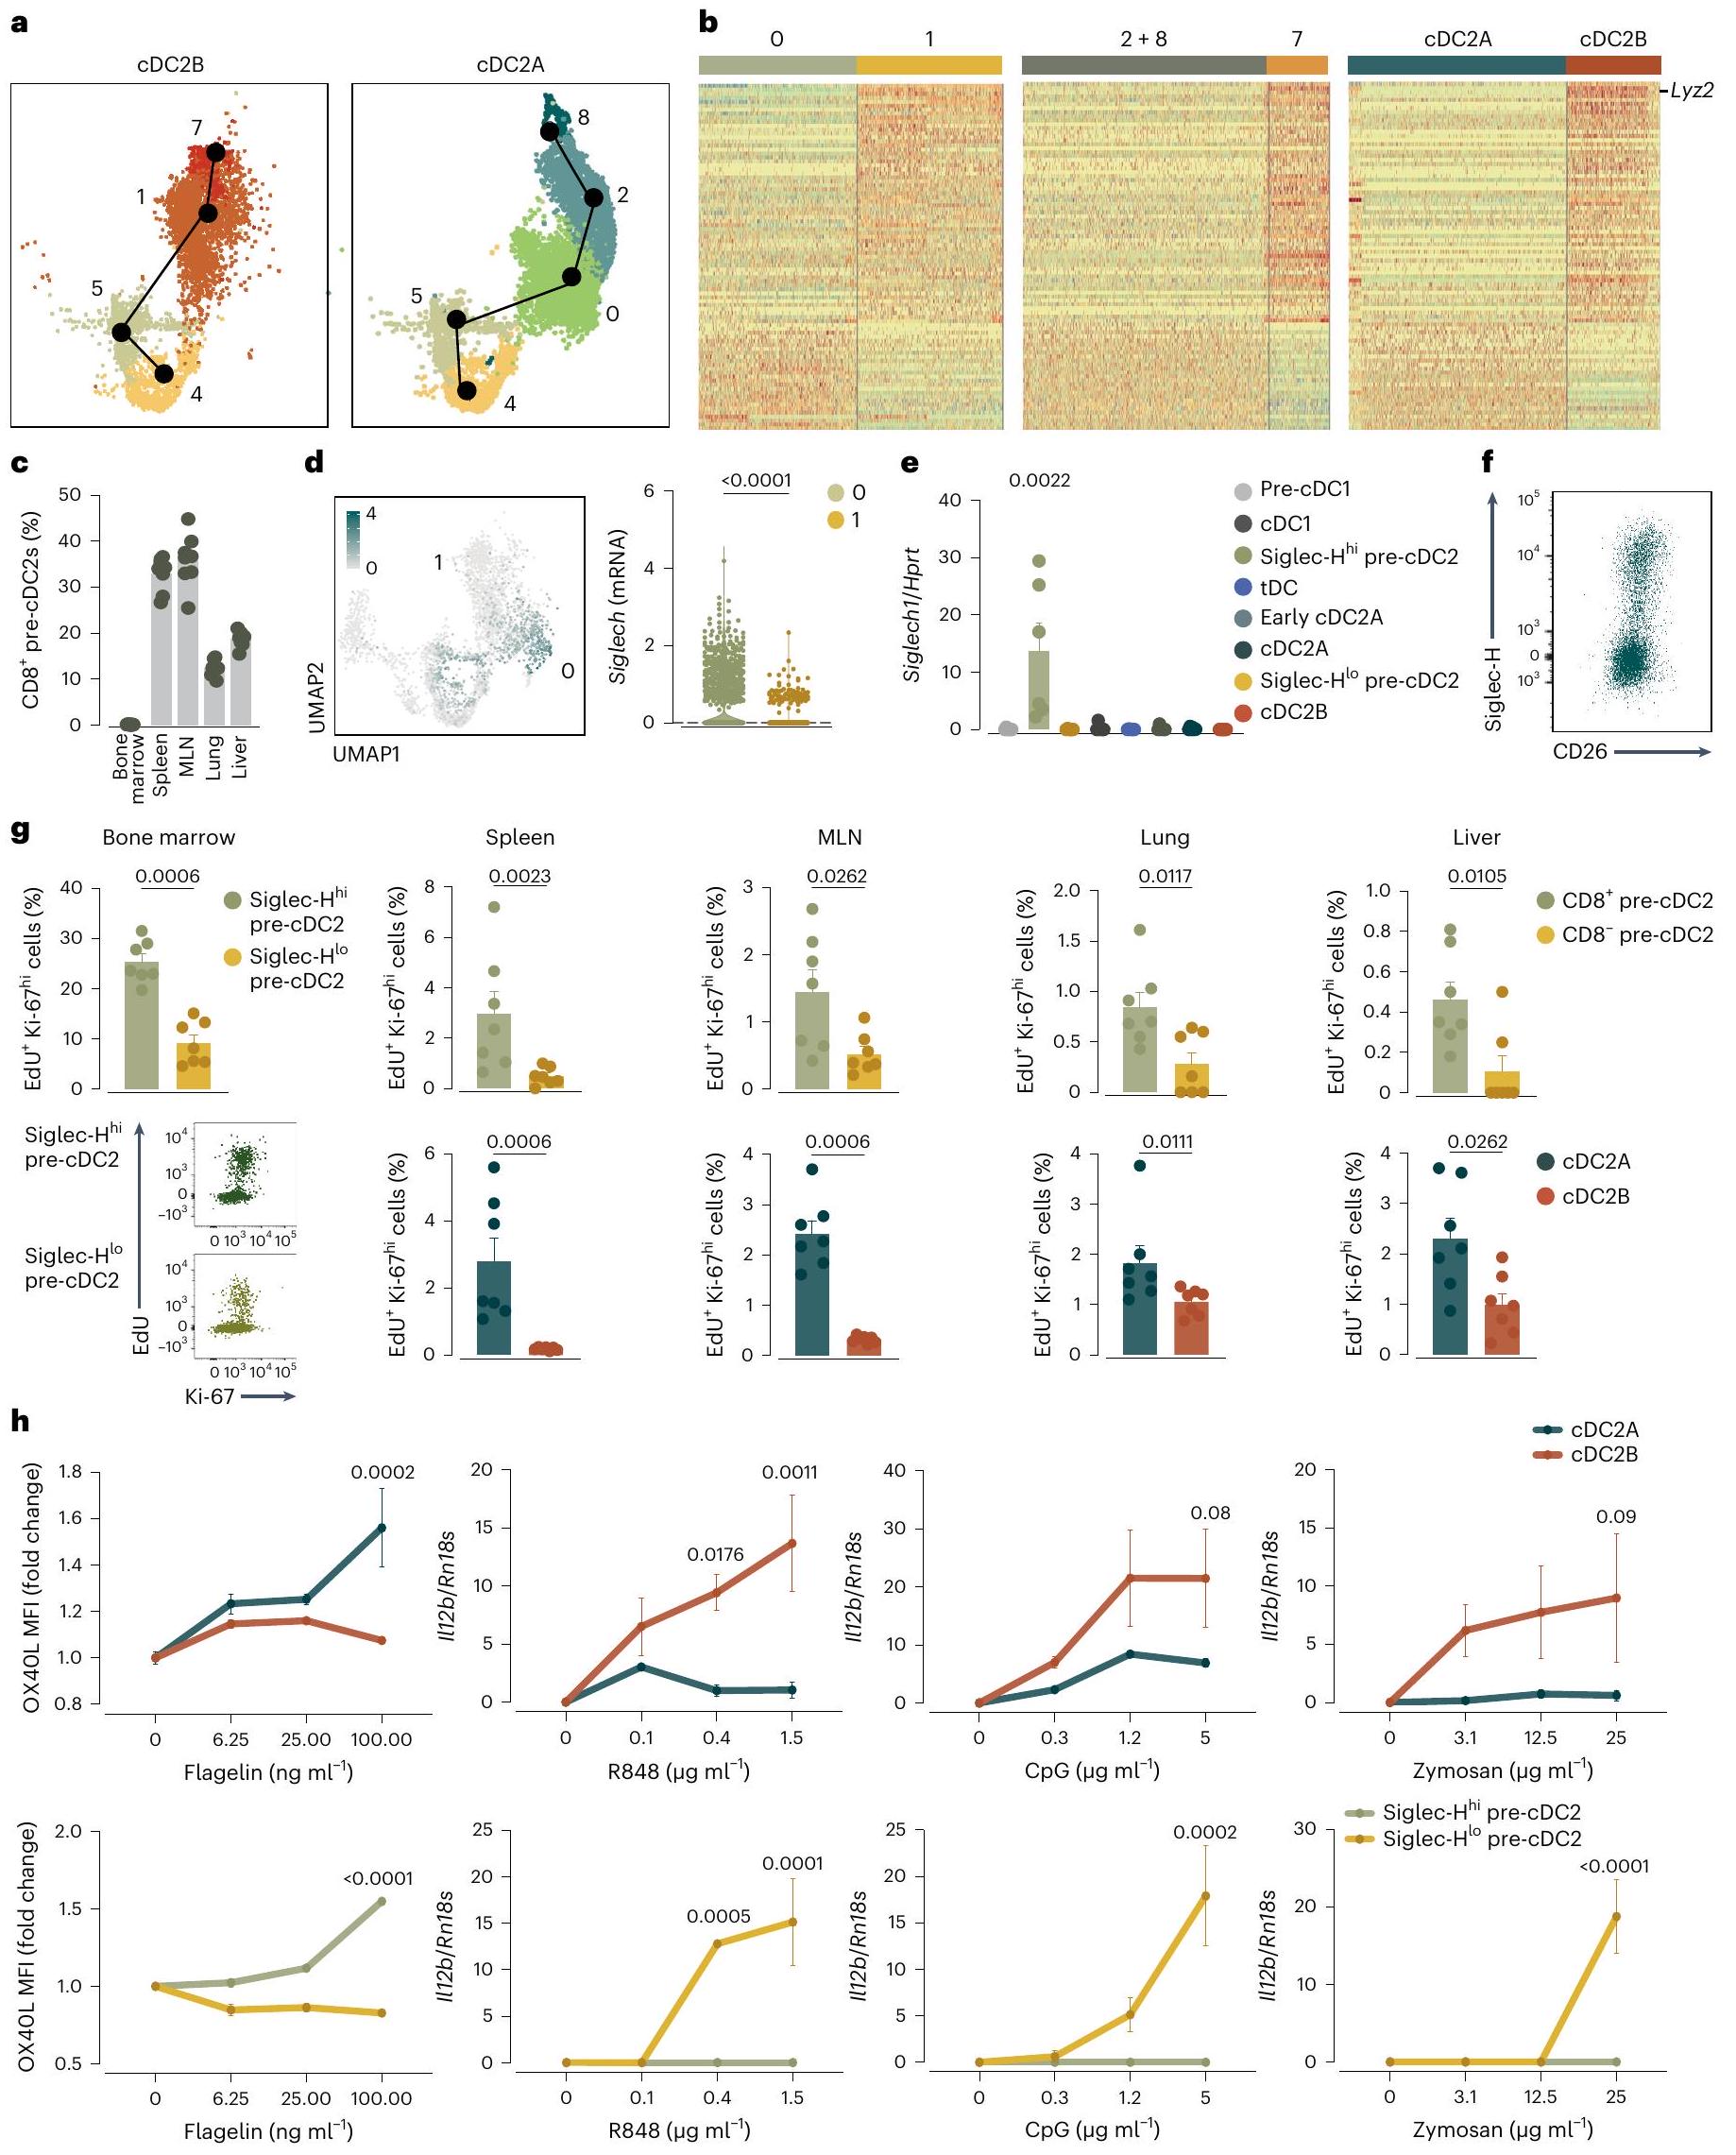
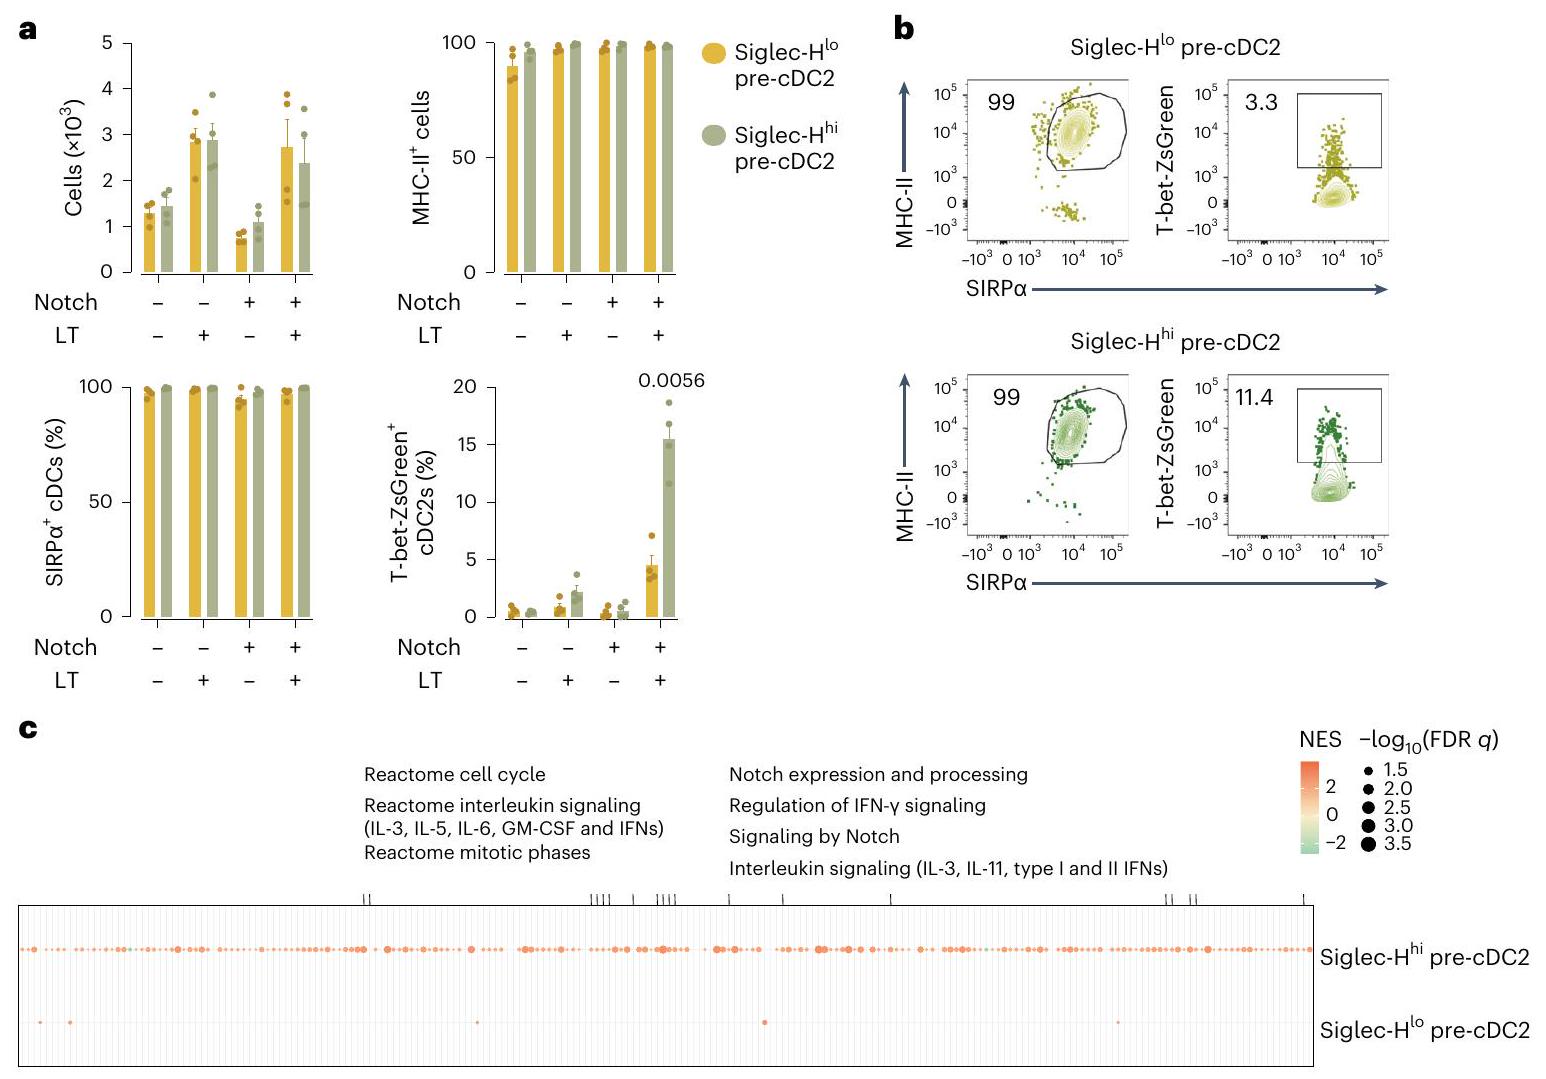
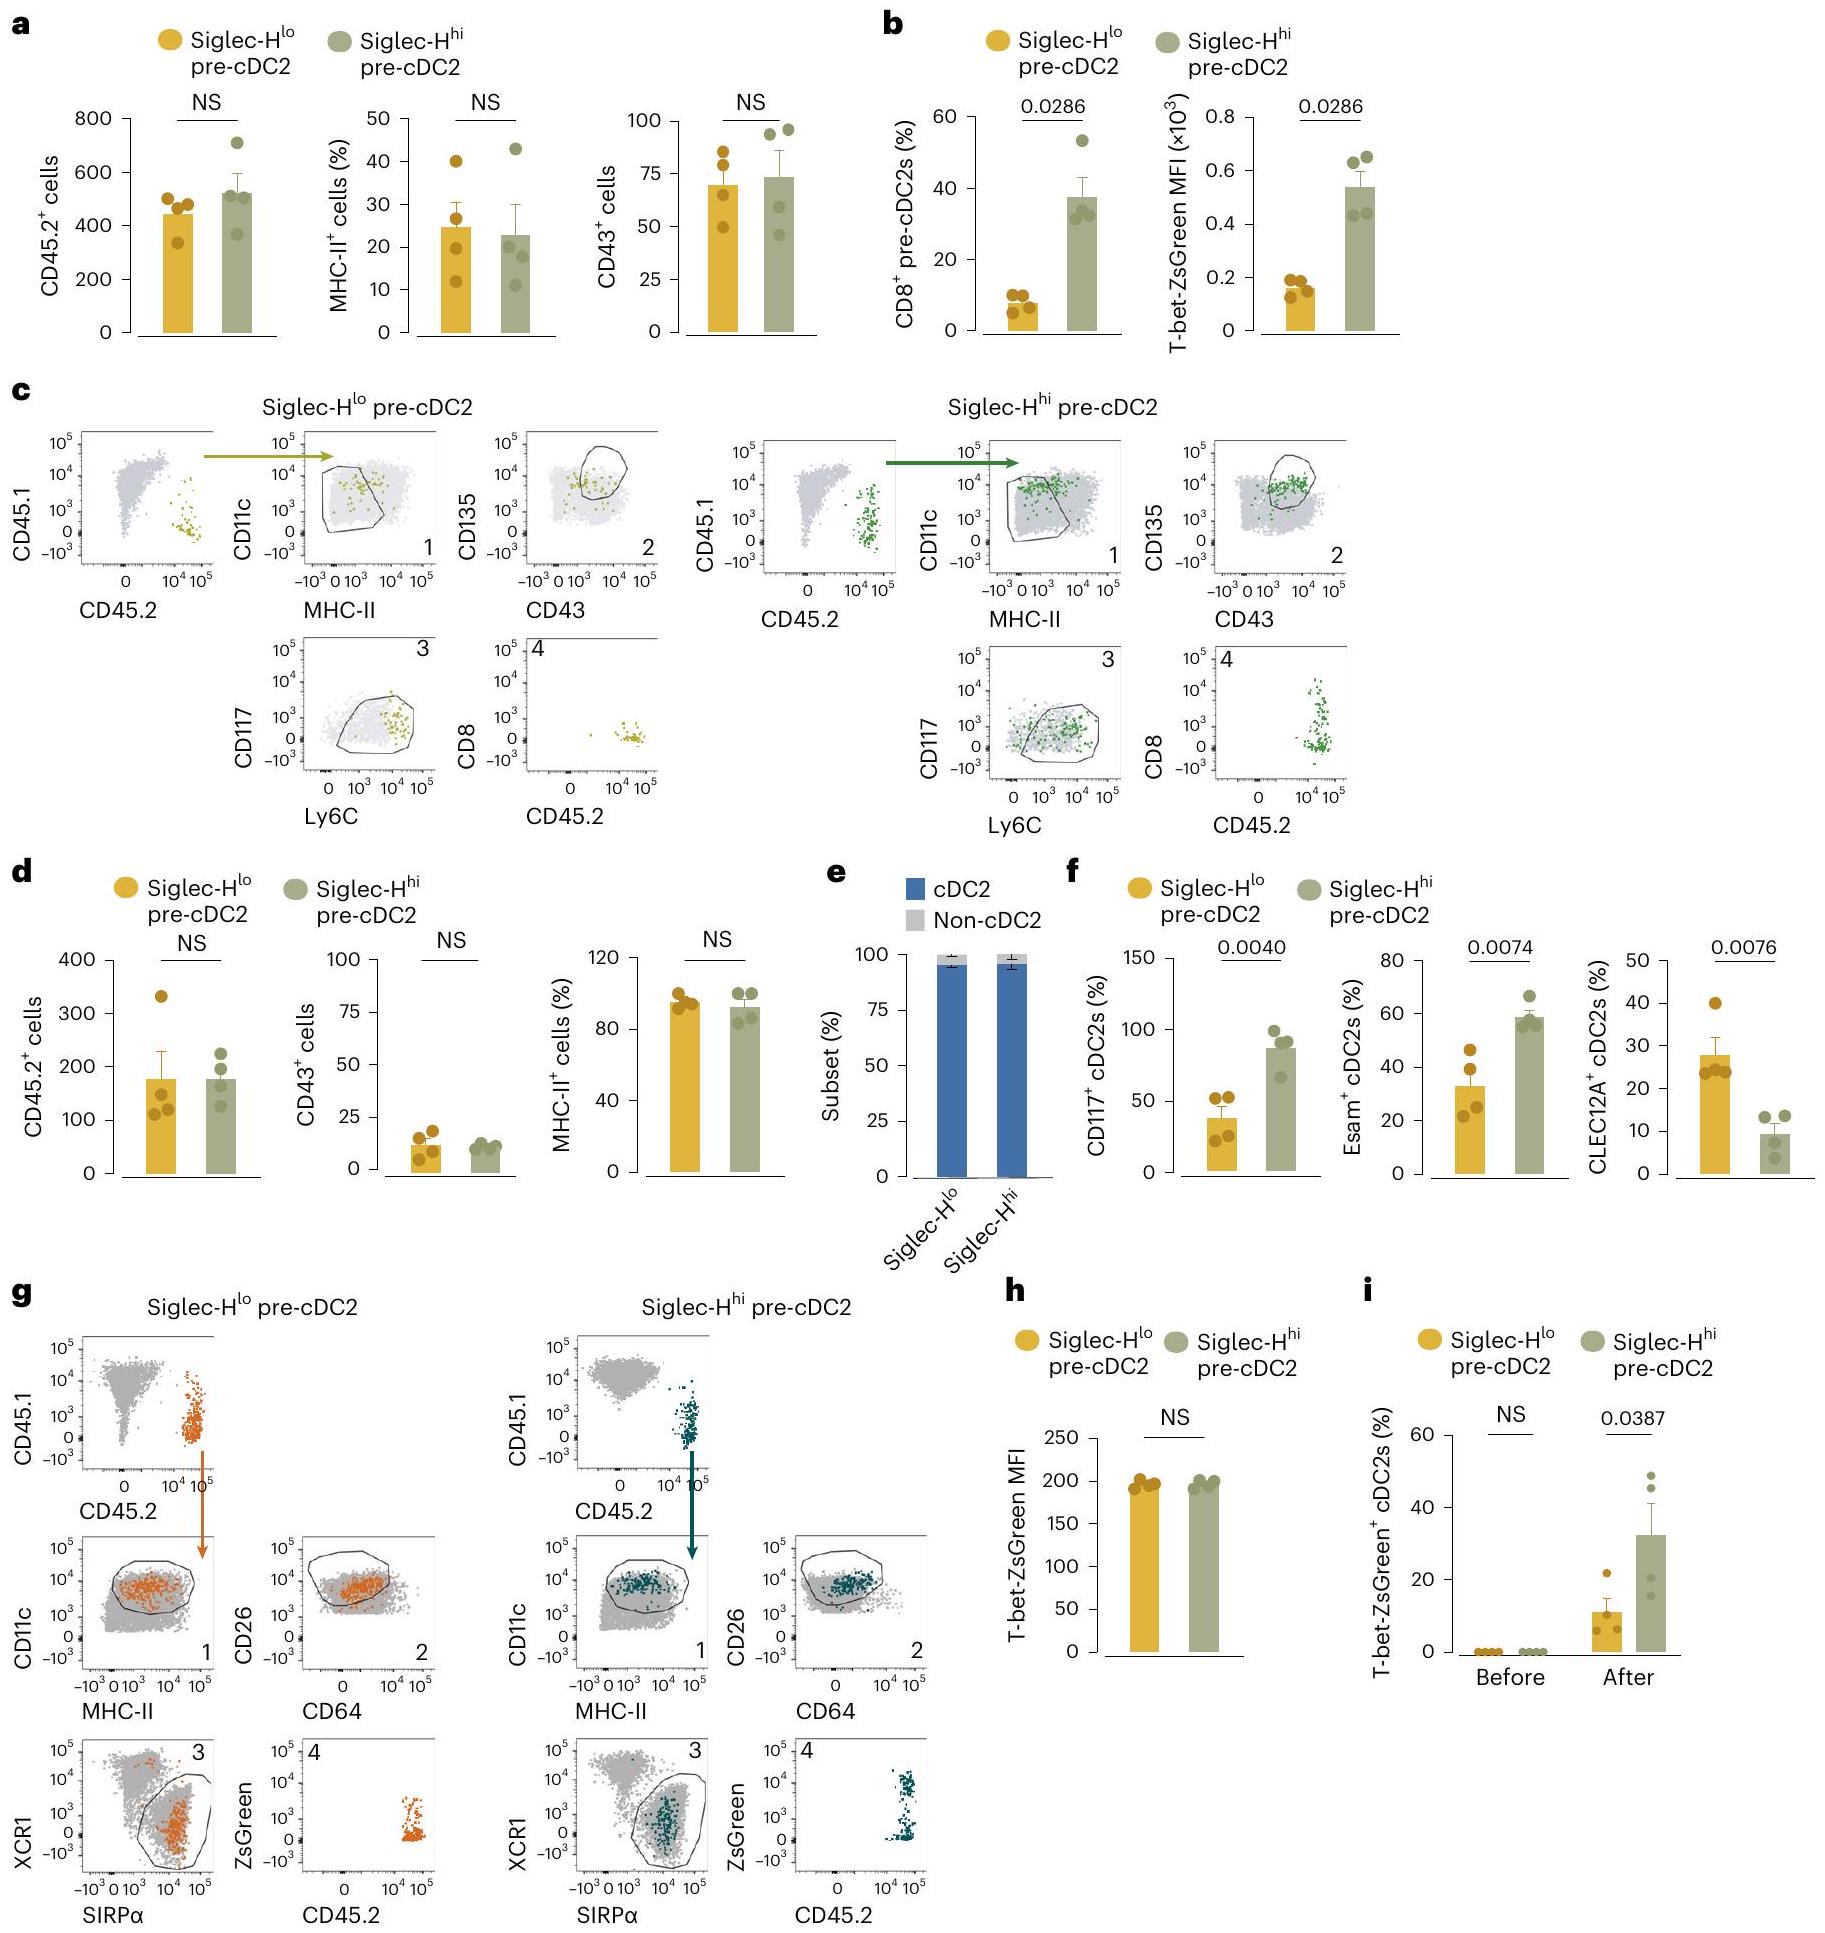 في نخاع العظام. أ، عدد الخلايا وتعبير MHC-II و CD43 على CD45.2