تحدد عتبات الكربون العضوي في التربة تأثيرات الأسمدة على تراكم الكربون في الأراضي الزراعية حول العالم Soil organic carbon thresholds control fertilizer effects on carbon accrual in croplands worldwide
تعتمد المبادرات لاستعادة خصوبة التربة والتخفيف من ظاهرة الاحتباس الحراري على إعادة بناء الكربون العضوي في التربة (SOC). يعتبر تخصيب النيتروجين (N) أمرًا حيويًا لعائدات المحاصيل ولكنه يؤثر على SOC بشكل غير متوقع بسبب الاستجابات المتفاوتة لمخزونات الكربون العضوي الجزيئي (POC) والكربون العضوي المرتبط بالمعادن (MAOC) لمستويات SOC الأولية. لتوضيح هذه التأثيرات، هنا، من خلال دمج تحليل ميتا عالمي مع تجارب ميدانية على نطاق قاري، نحدد أن عتبة SOC الأولية تبلغ تتحكم في تأثير تخصيب النيتروجين على POC وMAOC. في التربة الفقيرة في SOC ()، يزيد سماد النيتروجين من المدخلات المشتقة من النباتات ويعزز تجميع التربة، مما يفضل تراكم POC. على العكس، في التربة الغنية بـ SOC، يحفز سماد النيتروجين كفاءة التمثيل الغذائي الميكروبي، مما يؤدي إلى إنتاج أكبر من النيكروماس واستقراره بواسطة الحماية المعدنية، مما يُلاحظ كزيادة ملحوظة في تراكم MAOC. تكشف نتائجنا كيف تشكل عتبات SOC استجابة مخزونات الكربون النشطة والثابتة لتخصيب النيتروجين، مع عواقب على تراكم SOC في تربة الأراضي الزراعية على مستوى العالم.
فقدت الأراضي الزراعية ما يصل إلى نصف مخزونات الكربون العضوي (C) منذ الثورة الصناعية، مع استنفاد تراكمي يقترب من 62 بيغاغرام من الكربون، مما يحد من خصوبة التربة ويهدد الأمن الغذائي.. تعتبر التربة المستنفدة من الكربون العضوي بسبب الزراعة المكثفة غالبًا بمثابة مصب محتمل للكربون العالمي. بناء SOC في الأراضي الزراعية هو مهمة صعبة، ومع ذلك، فهي ضرورية لاستعادة وظائف التربة وضمان إنتاج الغذاء.. يعتبر تخصيب النيتروجين (N) ضروريًا للإنتاجية الزراعية لتلبية الطلب البشري على الغذاء, ولكنه يمكن أن يؤثر بشدة على ديناميات SOC. بشكل عام، يسهل تخصيب النيتروجين
إنتاج الكتلة الحيوية النباتية، مما يزيد من المدخلات الكربونية إلى التربة التي ينبغي أن تزيد من SOC. ومع ذلك، تم الإبلاغ عن استجابات متغيرة لتراكم SOC عند إضافة النيتروجين، تتراوح من الانخفاضات إلى عدم التغيير إلى الزيادات. إن التباين الواسع في استجابة SOC لتخصيب النيتروجين له تداعيات مهمة لحماية التربة لتلبية كل من هدف التنمية المستدامة (SDG) 2 (القضاء على الجوع) وSDG 13 (العمل المناخي) في ظل الظروف الحالية التي تتطلب زيادة إنتاج الغذاء، وتحسين استخدام الأسمدة وزيادة التقاط الكربون/ التخزين. يساعد فهم التأثيرات البشرية على SOC
من خلال اعتبار إجمالي مخزون SOC كمزيج من الكربون العضوي الجزيئي (POC) والكربون العضوي المرتبط بالمعادن (MAOC) الذي يختلف بشكل كبير في تركيبته الكيميائية، ودورانه، ووظيفته البيئية. حيثما كانت توفر النيتروجين للنباتات محدودًا، فإن الزيادات الناتجة عن النيتروجين في مدخلات الكربون النباتي إلى التربة هي خطوة أولى ضرورية لتجديد SOC. ومع ذلك، فإن زيادة المواد الأولية فقط ليست كافية لتحقيق احتجاز الكربون في التربة على المدى الطويل: حماية SOC الجديد من التحلل أمر حاسم لضمان استمراريته على المدى الطويل. لذلك، فإن فهم الآليات الكامنة وراء التباين في استجابة مخزونات SOC ووظيفتها لتخصيب النيتروجين أصبح الآن أمرًا حيويًا.
لقد برز محتوى SOC الأولي مؤخرًا كعامل مهم يعدل استجابات مخزونات POC وMAOC لتخصيب النيتروجين من خلال التأثيرات المباشرة على التمثيل الغذائي الميكروبي والتأثيرات غير المباشرة على الخصائص الفيزيائية والكيميائية والمعادن للتربة. تتنبأ نظرية التوازن البيئي (EST) بأن نمو وتكاثر المجتمعات الميكروبية مدفوعان بالطلب الميكروبي وإمدادات الموارد. قد تؤدي مدخلات سماد النيتروجين إلى التربة الفقيرة في SOC إلى حدوث عدم توازن ستيوكيومتري (منخفض C: مرتفع N) بين الطلبات الميكروبية وتوفر الموارد في التربة، مما يؤدي إلى إعادة تخصيص نسبة أكبر من الركيزة إلى التمثيل الغذائي للصيانة, مما يُلاحظ كزيادة في التنفس الميكروبي. على العكس، تلبي مدخلات سماد النيتروجين إلى التربة الغنية بـ SOC الطلب على المغذيات الميكروبية, وتحفز النشاط الميكروبي من خلال توفير المغذيات والطاقة لتسريع تحلل بقايا النباتات والاستثمار في تخليق الكتلة الحيوية الميكروبية، ومن ثم إنتاج النيكروماس. يعتمد تراكم كربون النيكروماس الميكروبي واستقراره كـ MAOC أيضًا على خصائص التربة الجيوكيميائية الأوسع التي قد تخضع لتغيرات كبيرة قد تتغير بشكل كبير بسبب تطبيق سماد النيتروجين. تعمل التربة الغنية بـ SOC على تخفيف حموضة النيتروجين الناتجة عن سعة تبادل الكاتيونات (CEC) لمادة التربة العضوية، على حساب زيادة تسرب الكاتيونات الأساسية (مثل، و) وزيادة ذوبانية الكاتيونات المائية (مثل، و). مقارنة بالتربة ذات القوام الناعم (الطينية)، تميل التربة ذات القوام الخشن (الرملية) إلى أن تكون فقيرة في الكربون مع CEC أصغر وبالتالي قدرة تخزين أقل ضد تسرب الكاتيونات الناتج عن استخدام سماد النيتروجين. تؤثر التغيرات في كيمياء الكاتيونات المعدنية على الامتصاص وتفاعلات الترسيب المشترك مع المركبات العضوية في التربة، بما في ذلك تلك المشتقة من النيكروماس الميكروبي، مما يسبب تباينًا في تأثير سماد النيتروجين على تشكيل MAOC. بالإضافة إلى ذلك، قد يعزز سماد النيتروجين تشكيل الماكروaggregates من خلال تحفيز نمو الجذور والفطريات، والتي، جنبًا إلى جنب مع الكربون المشتق من النباتات، تساهم في تجمع POC واستقراره كجزء من التجمع. لذلك، فإن العلاقة بين SOC الأولي واستجابة المخزونات الوظيفية لتخصيب النيتروجين تتضمن العديد من التباينات من التفاعلات المعقدة بين عدة محركات آلية، بما في ذلك العوامل الميكروبية والجيولوجية التي تؤثر على التوازن بين مخزونات POC وMAOC. يعد تقييم العلاقة بين SOC الأولي واحتجاز الكربون استجابةً للتخصيب أمرًا حيويًا للتنبؤ بشكل أفضل بالتغيرات في مخزونات POC وMAOC في عالم متغير.
هنا، قمنا بدمج تحليل ميتا عالمي مع بيانات جديدة من تجارب ميدانية طويلة الأمد لتخصيب النيتروجين على نطاق قاري في أربعة مواقع عبر الصين (الشكل 1 أ والشكل التكميلي 1) للتحقيق في كيفية تفاعل محتوى SOC الأولي مع تخصيب النيتروجين للتأثير على تراكم SOC في تربة الأراضي الزراعية العالمية. افترضنا: 1) يعزز تخصيب النيتروجين إنتاجية النباتات وتشكيل الماكروaggregates، وبالتالي يزيد من تراكم واستقرار POC؛ 2) عدم التوازن بين ستيوكيومترية الموارد وطلب المغذيات الميكروبية في التربة الفقيرة في SOC يعيق تشكيل كربون النيكروماس الميكروبي وتحلل POC، مما يضعف تراكم MAOC؛ 3) زيادة كفاءة التمثيل الغذائي الميكروبي وإنتاج النيكروماس مع الحماية المعدنية، وكلها تزيد من MAOC في التربة الغنية بـ SOC تحت توفر النيتروجين المتزايد. هنا، نتناول هذه الفرضيات باستخدام نهجين شاملين: تحليل ميتا عالمي لمحتويات POC وMAOC من 118 تجربة تخصيب، و
تحليل لأربع تجارب ميدانية طويلة الأمد المنسقة مع تخصيب النيتروجين لتقييم الآليات الأساسية، بما في ذلك مدخلات النباتات، والتحول الميكروبي، والحماية بواسطة التجمعات والمعادن. لقد حددنا عتبة كربون التربة الحرجة (أي،) التي تتحكم في تأثير تخصيب النيتروجين على احتجاز الكربون. تحت هذه العتبة الكربونية، يميل الاحتجاز استجابةً للتخصيب نحو تشكيل POC المشتق مباشرة من كربون النباتات، بينما يتجاوز هذا النقطة يغير التوازن نحو تراكم MAOC المشتق من الكائنات الحية الدقيقة في التربة. من خلال تحديد كيفية استجابة مكونات SOC المحددة لتخصيب النيتروجين وكيف تؤثر عتبات الكربون على هذه الاستجابات من خلال تفاعلات النباتات والميكروبات والتربة، يمهد هذه الدراسة الطريق لاستراتيجيات إدارة التربة الأكثر استهدافًا وفعالية التي يمكن أن تعزز الأمن الغذائي العالمي بينما تكافح تغير المناخ.
النتائج
تعتمد تأثيرات الأسمدة على POC وMAOC على SOC الأولي في الأراضي الزراعية العالمية
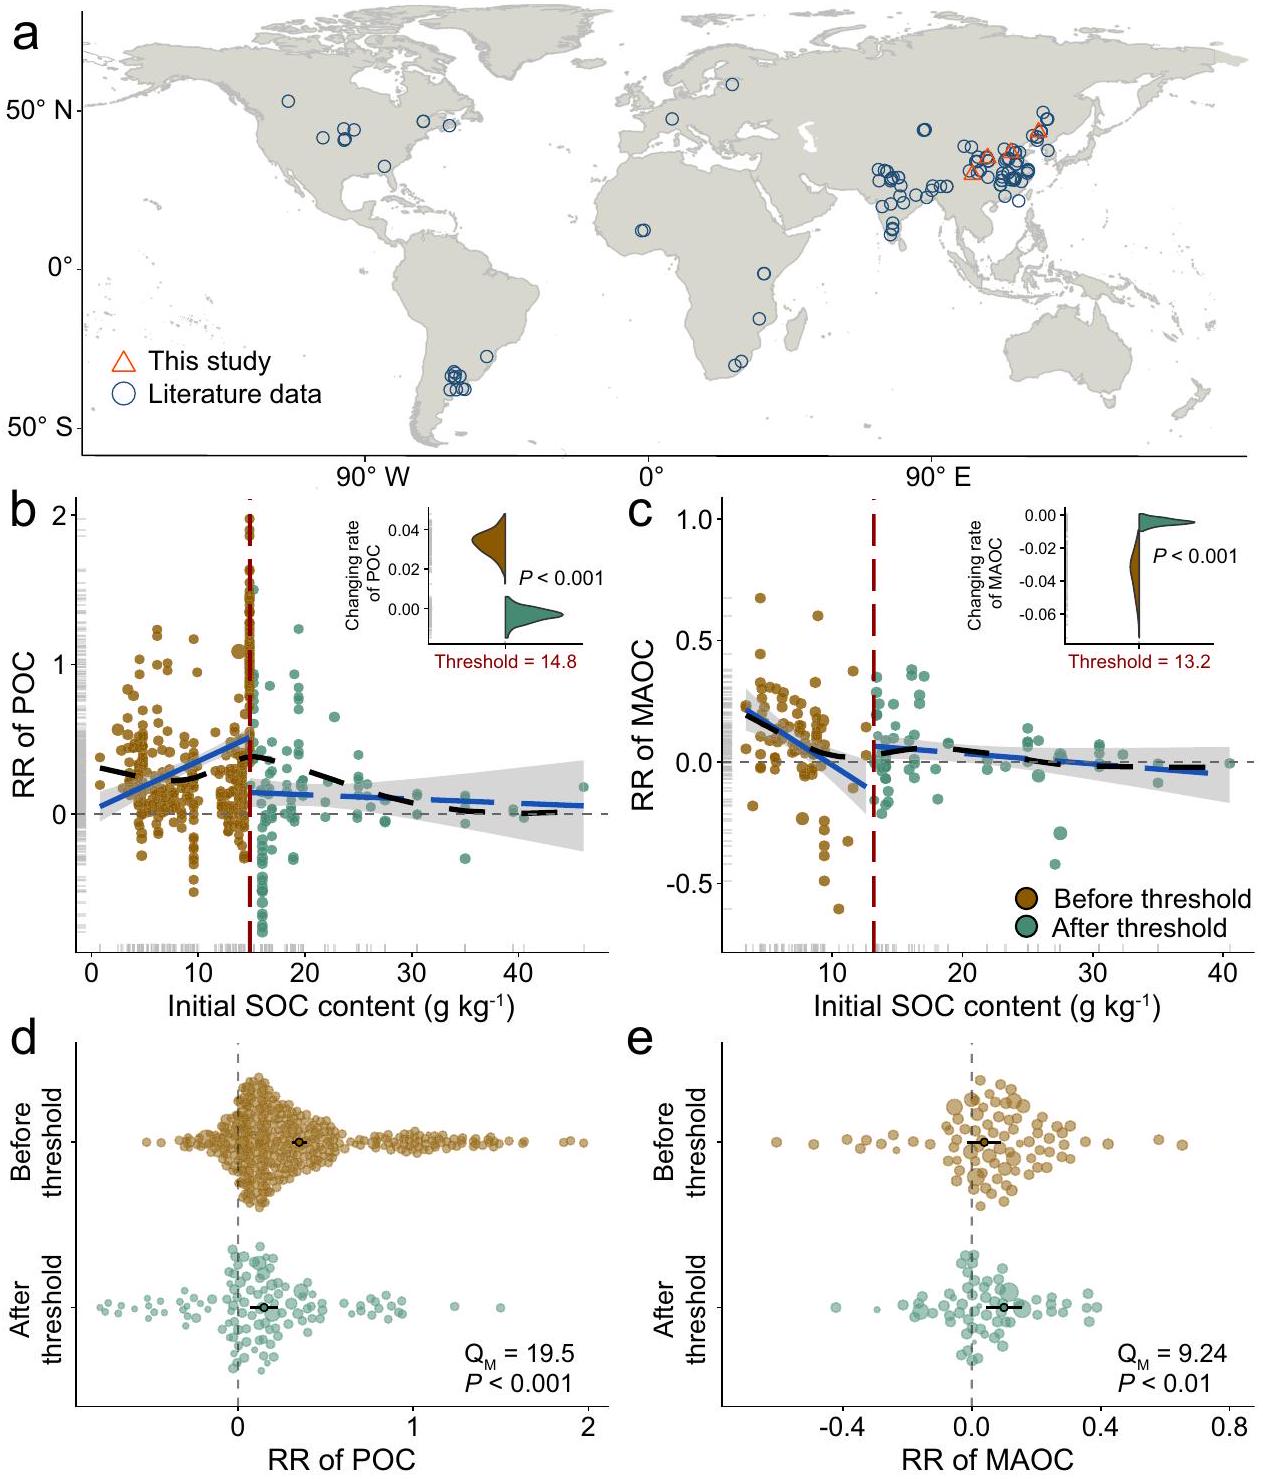
لتحديد ما إذا كان محتوى SOC الأولي يؤثر على التغيرات العالمية في POC و MAOC استجابةً لتسميد النيتروجين، قمنا بتجميع قاعدة بيانات تشمل 609 ملاحظة مزدوجة لتغيرات POC و MAOC من 118 موقعًا ميدانيًا حول العالم (الشكل 1a)، تغطي نطاقًا واسعًا جدًا من محتوى SOC الأولي.; 0.79 إلى 46.1 ). بشكل عام، كان لدى POC سلبيمحايداستجابات إيجابية لإضافة النيتروجين (حجم التأثير المتوسط) ); بينما كان لدى MAOC سلبيمحايداستجابات إيجابية لإضافة النيتروجين (حجم التأثير المتوسط); الشكل التوضيحي 2). لمساعدتنا في تفسير التغيرات في استجابات POC و MAOC تجاه سماد النيتروجين والعوامل الأساسية، اعتبرنا 8 متغيرات مناخية وإدارية وتربوية كعوامل معتدلة. أظهرت تحليل تقسيم التباين أن الأهمية النسبية للخصائص التربوية والممارسات الإدارية كانت أعلى من تلك الخاصة بالظروف المناخية (الشكل التوضيحي 3). من بينها، كانت المتغيرات المهمة في نموذجنا تشمل التأثيرات الفردية للـ SOC الأولي، وسماد النيتروجين وتفاعلاتها (؛ الشكل التوضيحي الإضافي 4)، مما يشير إلى أن تخصيب النيتروجين أثر على الكربون العضوي المذاب (POC) والكربون العضوي المعدني (MAOC) تم تعديله بواسطة مستويات الكربون العضوي الأولية عبر مناطق مختلفة. أظهرت النتيجة أن النموذج غير الخطي كان أكثر ملاءمة للكربون العضوي المذاب (POC) والكربون العضوي المعدني (MAOC) بالنسبة لمحتوى الكربون الأولي (الشكل التوضيحي الإضافي 5 والجدول الإضافي 1)، مما يدل على وجود عتبات للكربون العضوي حيث حدثت تغييرات مفاجئة.
تم تقييم تحليل العتبة الإضافي استجابة POC و MAOC لمحتويات SOC الأولية المختلفة، مما حدد مستويات SOC معينة حيث أظهرت استجاباتهما تغييرات مفاجئة. من خلال مقارنة ستة نماذج غير خطية، وجدنا أن التغيرات الناتجة عن النيتروجين في POC و MAOC استجابت بطريقة مجزأة لزيادة محتوى SOC الأولي (الجدول التكميلي 1). على وجه التحديد، حدثت تغييرات مفاجئة في POC و MAOC على مدى صغير من محتوى الكربون الأولي. (الشكل 1ب، ج). تم الكشف عن زيادة حادة في POC قبل محتوى الكربون الأولي لـثم انخفضت قليلاً (الشكل 1ب). ومع ذلك، عند مستويات منخفضة من C الأولي، انخفض MAOC بشكل حاد. بمجرد أنتم تجاوز العتبة، حيث انخفض MAOC قليلاً مع زيادة SOC (الشكل 1c). تدعم هذه الفكرة بشكل أكبر تحليل التباين، الذي يظهر اختلافات واضحة في استجابات POC وMAOC قبل وبعد الوصول إلى عتبة SOC تحت إضافة النيتروجين.لذوي البشرة الملونة؛بالنسبة لـ MAOC؛ الشكل 1d، e). لاحظ أن زيادة POC تحت تخصيب النيتروجين كانت أكثر أهمية قبل العتبة منها بعدها، في حين أن استجابة MAOC اتبعت الاتجاه المعاكس.
استجابات متباينة لـ POC و MAOC لعقد من إضافة النيتروجين في المواقع التجريبية
لفك تشابك الآليات المحتملة وراء كيفية تأثير محتوى الكربون العضوي الأولي على التغيرات الناتجة عن النيتروجين في الكربون العضوي الجزيئي والكربون العضوي المعدني، قمنا بجمع عينات من التربة من أربعة تجارب ميدانية طويلة الأمد ومنسقة لتجارب الأسمدة النيتروجينية (الشكل التوضيحي التكميلي 1). هذه
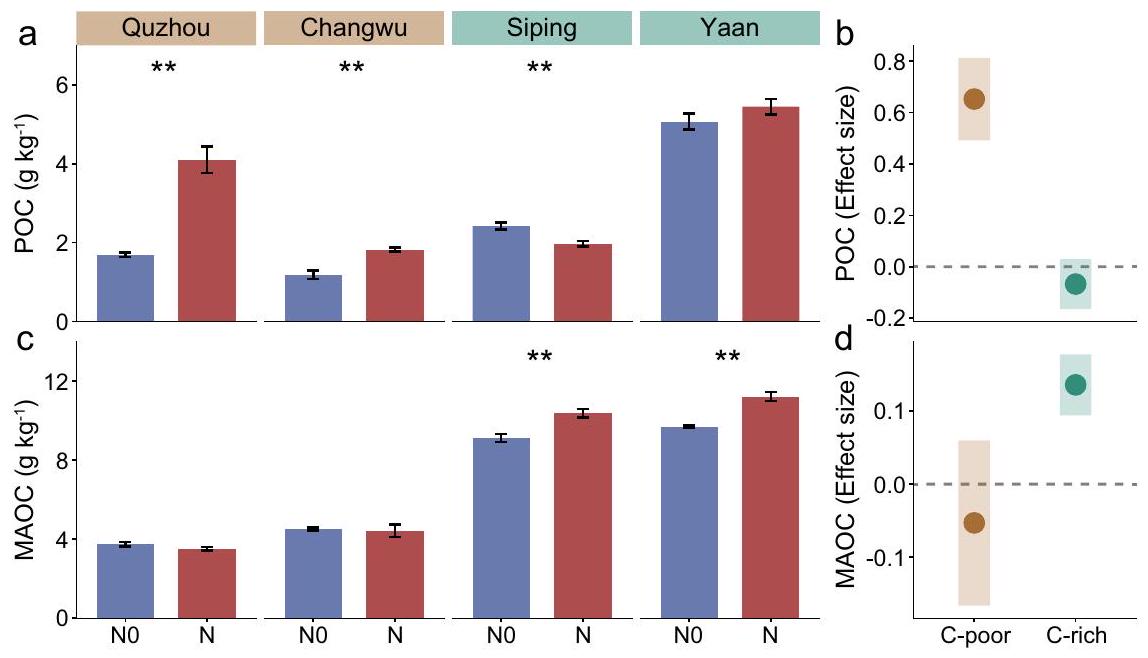
الشكل 1 | التوزيع العالمي لمواقع الدراسة والتفاعلات بين تخصيب النيتروجين ومحتوى الكربون العضوي في التربة (SOC) على الكربون العضوي الجزيئي والكربون العضوي المرتبط بالمعادن (POC و MAOC) في التربة الزراعية المرتفعة العالمية. أ التوزيع العالمي لمواقع الدراسة. ب-هـ الاستجابات غير الخطية لخصائص POC و MAOC لمحتوى الكربون العضوي في التربة الأولي.تمثل الخطوط السوداء المتقطعة الطويلة الاتجاه الملسّ الذي تم ملاءمته بواسطة نموذج إضافي عام، وتمثل الخطوط الزرقاء الصلبة الملاءمات الخطية على كلا جانبي كل عتبة. الأرقام الحمراء المدخلة والخطوط العمودية المتقطعة تصف SOC الأولي المحدد. كمان تظهر المخططات المنحدرات المعززة أو قيم الاتجاه المتوقع الملائم عند عتبة الانحدارين الموجودين على كل جانب من العتبة (الأخضر: قبل العتبة؛ البني، بعد العتبة). مهم (تباين المجموعات) يشير إلى أن نسب الاستجابة تختلف بين ما قبل وما بعد عتبة SOC ( ). خريطة أساسية في (أ) من الأرض الطبيعية (https://www. naturalearthdata.com/). تم اشتقاق حدود الساحل في الخريطة من قاعدة بيانات GSHHG (https://www.ngdc.noaa.gov/mgg/shorelines/data/gshhg/أحدث/). يتم توفير بيانات المصدر كملف بيانات المصدر. تمت التجارب في أربعة مواقع زراعية بمحتويات مختلفة من الكربون العضوي في التربة: كوتشوتشانغووسبيينغ (SP، ) ويان (YA، ). أثر عقد من استخدام الأسمدة النيتروجينية على فئات الكربون العضوي في أربعة مواقع ( ; الجدول التكميلي 2). زادت المعالجات المحسّنة والعالية من محتوى POC في QZ و CW ( )، بينما زاد محتوى MAOC في SP و YA ( ; الشكل التوضيحي الإضافي 6). نظرًا للنتائج المتسقة من كل من OPT و HN، قمنا بدمج هذه النتائج تحت عنوان “تأثيرات سماد النيتروجين” في تحليلنا، مما يعزز قابلية الفهم للقراء. ومن المثير للاهتمام أن استجابات محتويات POC و MAOC لسماد النيتروجين قسمت المواقع الأربعة إلى فئتين: استجابة تراكم POC واستجابة تراكم MAOC (الشكل 2). بالإضافة إلى التأثيرات الفردية لسماد النيتروجين ومحتوى SOC الأولي، كانت هناك تأثيرات تفاعلية لـمحتوى الكربون الأولي في برك الوظائف الخاصة بنظام SOC; إضافي
الجدول 2)، مما يشير إلى أن التغيرات في محتويات POC و MAOC نتيجة لإضافة النيتروجين تعتمد بشكل كبير على محتوى SOC الابتدائي. استنادًا إلى نتائج التحليل الشامل، تم تحديد العتبة الابتدائية لـ SOC لتحول POC و MAOC لتكون بينتم العثور على محتوى SOC الأولي لـ QZ و CW أقل منبينما كانت تلك الخاصة بـ SP و YA أكبر من. نتيجة لذلك، تم تصنيف التربة في النقاط الأربع إلى فئتين: تربة فقيرة بالكربون وتربة غنية بالكربون. ومن الجدير بالذكر أن هناك تباينًا قويًا في التغيرات في محتويات POC و MAOC بين التربة الفقيرة والغنية بالكربون (الشكل 2ب، د). أظهر التحليل الإضافي أن سماد النيتروجين كان له تأثير إيجابي على محتوى POC في التربة الفقيرة بالكربون، مما يدل على زيادة متوسطة قدرها مقارنة بالتربة بدون تسميد بالنيتروجين (NO) (؛ الشكل 2 أ، ب). ومع ذلك، زادت إضافة النيتروجين من محتوى MAOC بـفي التربة الغنية بالكربون بالنسبة لـ NO; الشكل 2ج، د).
الشكل 2 | تأثيرات التسميد بالنيتروجين على المدى الطويل على خزانات الكربون عبر أربعة تجارب ميدانية، مع تصنيف النتائج إلى-فقير و-تربة غنية من أربعة مواقع. أ، ج تأثيرات تخصيب النيتروجين على الكربون العضوي الجزئي (POC) والكربون العضوي المعدني (MAOC) عبر أربعة تجارب ميدانية. تشير النجمة إلى دلالة إحصائية للتأثير بناءً على اختبار ويلكوكسون غير المعلمي.باستخدام بنجاميني وهوشبرغطريقة (لـ لا،لـ N). ب، د تأثيرات تخصيب النيتروجين على POC و MAOC في كل من التربة الفقيرة والغنية بالكربون. أحجام التأثير المقدرة هي معاملات الانحدار بناءً على متغيرات الاستجابة المعاد قياسها (بمتوسط صفر وانحراف معياري واحد) في نموذج التأثيرات المختلطة الخطية. تمثل النقاط والظلال المتوسط ± الانحراف المعياري للآثار في B و D. تعتمد الأهمية الإحصائية على نوع والد II.اختبارات، وعدم تداخل CI مع الصفر يدل على الأهمية. POC: الكربون العضوي الجزيئي؛ MAOC: الكربون العضوي المرتبط بالمعادن. NO: التحكم (بدون إضافة نيتروجين)؛ N: إضافة نيتروجين (نتائج دمج إضافة نيتروجين محسّنة وإضافة نيتروجين عالية). C -poor: دمج نتائج QZ و CW؛ C-rich: دمج نتائج SP و YA. يتم توفير بيانات المصدر كملف بيانات مصدر.
تفاعلات مصفوفة النبات والميكروبات والتربة تدعم الاستجابات المتباينة لـ POC و MAOC لتسميد النيتروجين في التربة الفقيرة بالكربون والغنية بالكربون
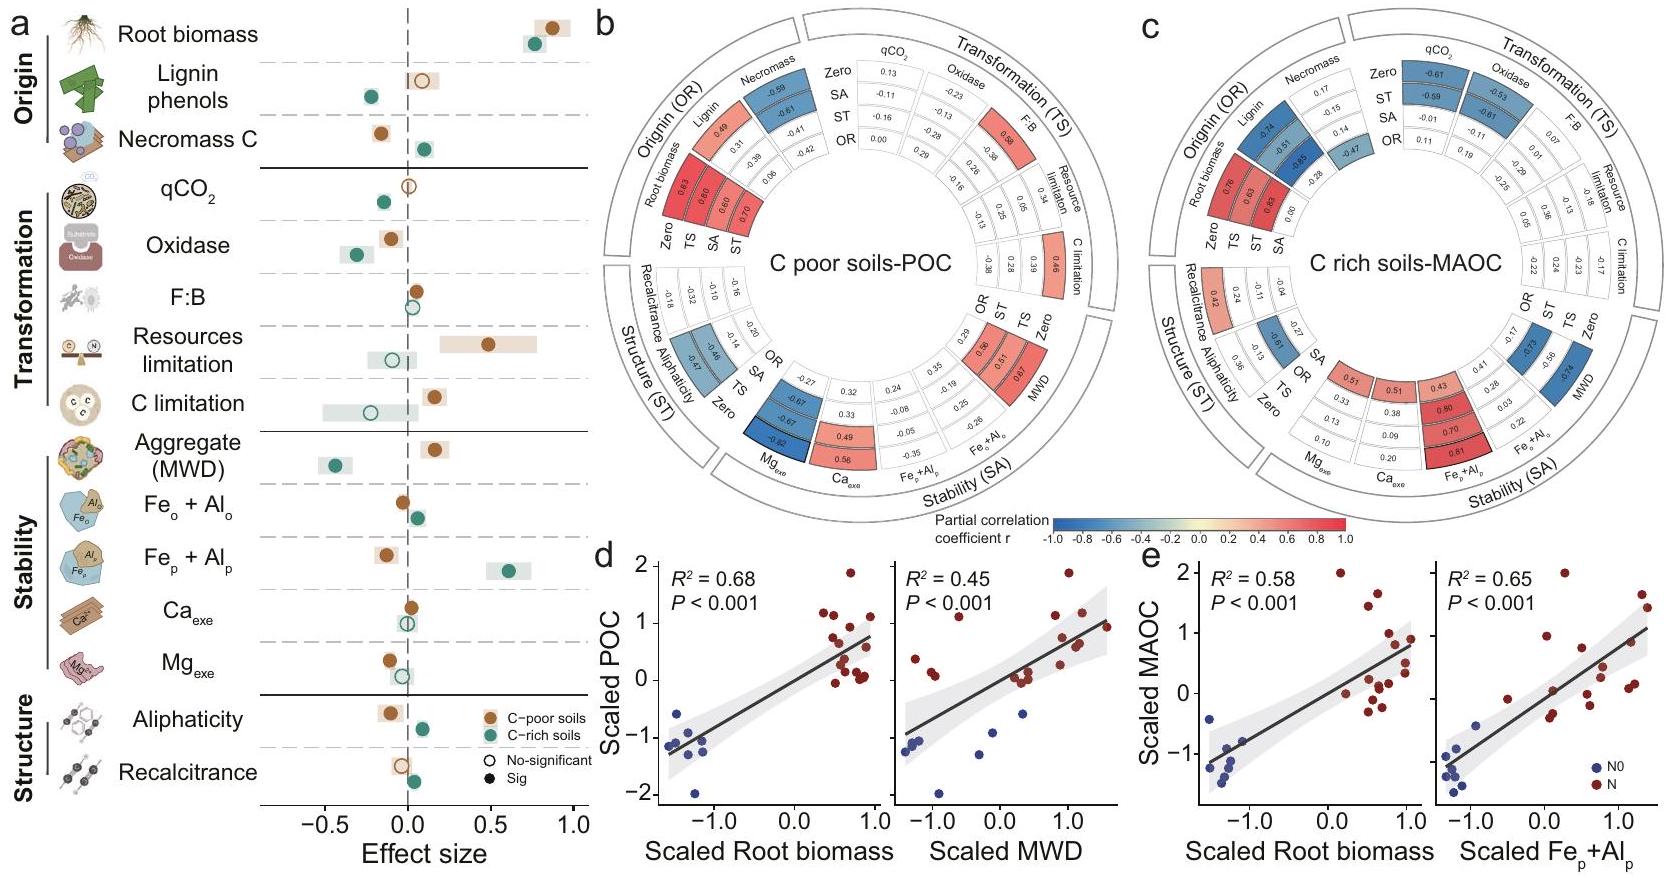
لتحقيق في الآليات الأساسية التي تحكم ديناميات محتويات POC و MAOC استجابةً لسماد النيتروجين، قمنا بتحليل مجموعة من المتغيرات المرتبطة بأحواض الكربون، بما في ذلك المؤشرات الحيوية للنباتات والميكروبات، وخصائص الميكروبات في التربة، وحماية الكتل والمعادن، بالإضافة إلى التركيب الكيميائي للكربون العضوي في التربة. بالمقارنة مع NO، زاد سماد النيتروجين من كتلة الجذور في التربة الفقيرة بالكربون. ) وغني بـ C ( التربة، على التوالي (; الشكل 3أ والشكل التوضيحي 7). غيرت الأسمدة النيتروجينية كل من الفينولات اللجنينية وC النخرية، اعتمادًا على محتوى C الأولي; الجدول التكميلي 2). بالمقارنة مع NO، زاد سماد النيتروجين من الفينولات اللجنينية بـلكنها قللت من الكتلة الحيوية الميتة للميكروبات C في التربة الفقيرة بالكربون“; الشكل 3أ والشكل التوضيحي 8). أظهرت الفينولات اللجنينية والكتلة الحيوية الميتة الميكروبية استجابات متباينة لسماد النيتروجين في التربة الغنية بالكربون: حيث أظهرت الفينولات اللجنينية استجابة سلبية، بينما أظهرت الكتلة الحيوية الميتة الميكروبية استجابة إيجابية.؛ الشكل 3 أ والشكل التوضيحي 8). وبالتالي، زاد سماد النيتروجين من الكتلة الميكروبية الميتة الكربونية بـمقارنة بواسطة NO، مما يؤكد تراكم MAOC في التربة الغنية بالكربون (; الشكل 3أ).
أظهرت الخصائص الميكروبية المرتبطة بتحويل الكربون تأثيرات متباينة ملحوظة استجابةً لسماد النيتروجين بين التربة الفقيرة بالكربون والغنية بالكربون.; الشكل 3أ والجدول التكميلي 2). على وجه التحديد، أدى سماد النيتروجين إلى تجميع قيود الكربون الميكروبي، بالنسبة لثاني أكسيد النيتروجين في التربة الفقيرة بالكربون (؛ الشكل 3أ والشكل التكميلي 9). بالمقابل، خفف سماد النيتروجين من قيود الكربون والموارد الميكروبية، مما أدى إلىانخفاض في معامل الأيض الميكروبي ) في التربة الغنية بالفيتامين C ( “; الشكل 3أ والشكل التكميلي 10)، مما يشير إلى نمو ميكروبي أكثر كفاءة. بالإضافة إلى ذلك، أدى إضافة النيتروجين إلى تقليل الأكسيدات (أكسيد الفينول وأكسيد البيروكسيد). بالنسبة لـ NO ( “; الشكل 3أ والجدول التكميلي 3). ثم قمنا بقياس متوسط قطر الوزن (MWD) للكتل ومحتوى الكاتيونات القابلة للتبادل لتحديد حماية الكربون العضوي في التربة (SOC) بواسطة الكتل والمعادن، على التوالي. وغالبًا ما كانت تأثيرات التسميد على استقرار الكتل وحماية المعادن تعتمد على الكربون العضوي في التربة الأولي (; الجدول التكميلية 2). كان لسماد النيتروجين تأثير إيجابي على MWD في التربة الفقيرة بالكربون (زيادة)، ولكن انخفضت في التربة الغنية بالكربون (؛
الشكل 3أ والشكل التكميلي 11). بالمقابل، زاد سماد النيتروجين من محتوى أكاسيد الحديد والألمنيوم في التربة الغنية بالكربون، مما عزز قدرة الحماية المعدنية للتربة.; الشكل 3أ والشكل التوضيحي 11).أظهر تحليل طيف الرنين المغناطيسي النووي (NMR) بشكل إضافي أن سماد النيتروجين زاد من الأليفاتية والمقاومة منإلىفي التربة الغنية بالكربون، مما يشير إلى أن النيتروجين قد يساهم في استقرار الكربون العضوي في مثل هذه التربة.؛ الشكل 3أ والجدول التكميلي 4).
أظهر تحليل الارتباط الجزئي أنه في التربة الفقيرة بالكربون العضوي، على الرغم من الارتباطات الكبيرة بين الكربون العضوي الجزئي وأربعة أنواع من العوامل (أي، مصدر الكربون العضوي، التحول الميكروبي، الاستقرار والبنية؛ من الدرجة صفر في الشكل 3ب)، فإن معاملات الارتباط بين الكربون العضوي الجزئي وانخفض بمقداربعد التحكم في أصل SOC (الشكل 3ب). على العكس من ذلك، كانت الكتلة الحيوية للجذور وMWD مرتبطة دائمًا ارتباطًا وثيقًا بـ POC في التربة الفقيرة بالكربون.; الشكل 3د)، حتى بعد التحكم في الأنواع الثلاثة أو الاثنين الآخرين من العوامل. على وجه التحديد، كان زيادة الكتلة الحيوية للجذور وMWD مرتبطة بزيادة POC (; ) في التربة الفقيرة بالكربون (الشكل 3d). في التربة الغنية بالكربون، بعد التحكم في استقرار الكربون العضوي التربة، أصبحت معاملات الارتباط بين MAOC وأصل الكربون (المميز بإدخال الكربون من النباتات والبيوماركرات) غير ذات دلالة (الشكل 3c). علاوة على ذلك، فإن الكتلة الحيوية للجذور وزاد باستمرار مع MAOC (الشكل 3e؛; وبناءً عليه، كانت مدخلات النبات C هي السيطرة الوحيدة في جميع التربة، حيث أثرت بشكل إيجابي قوي على POC وMAOC. كانت الحماية الفيزيائية والحماية المعدنية مرتبطة ارتباطًا وثيقًا بتراكم POC في التربة الفقيرة بالكربون وتراكم MAOC في التربة الغنية بالكربون، على التوالي (الشكل 3).
التغيرات في محتوى الكربون العضوي في التربة الزراعية العالمية ومحتوى الكربون العضوي في المواد العضوية تحت سيناريوهات التسميد بالنيتروجين الحالية
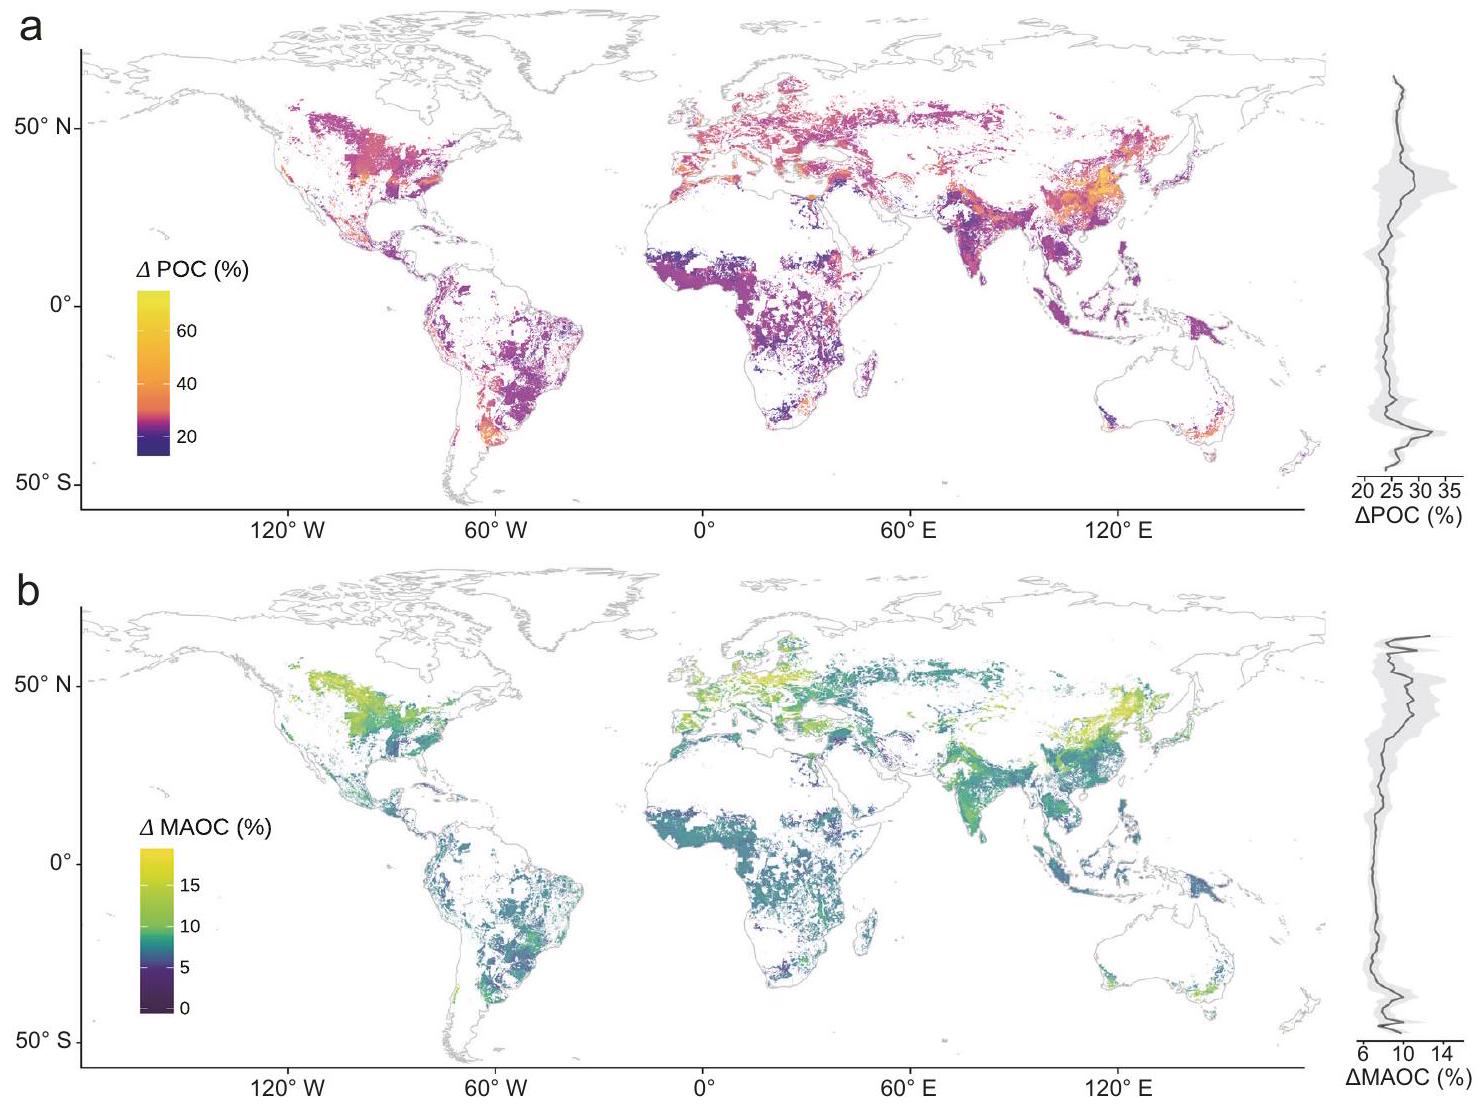
باختصار، بعد عملية تقييم مقاييس النموذج القياسية (الجدول التكميلي 5)، تم اختيار نموذج أشجار القرار المعزز بالتدرج المحسن كنموذج مثالي لنقاط الرعاية (POC) ونقاط الرعاية المتقدمة (MAOC). ثم قمنا بتطبيق نموذجنا التنبؤي لتوسيع الملاحظات على مستوى الموقع عبر العالم فيقرار لقياس التغيرات في POC و MAOC تحت معدل تطبيق الأسمدة النيتروجينية الحالي مقارنةً بسيناريو عدم التسميد. على مدار العقد الماضي، تشير تقديراتنا العالمية إلى أن تطبيق الأسمدة النيتروجينية قد أدى إلى زيادة متوسطة في POC و MAOC بنسبة و على التوالي
الشكل 3 | آثار التسميد بالنيتروجين على أصل وتحول واستقرار خزانات الكربون، بالإضافة إلى المؤشرات الرئيسية لديناميات خزانات الكربون. أ آثار التسميد بالنيتروجين على أصل الكربون العضوي في التربة (كتلة الجذور، الفينولات اللجنينية وC من النخر الميكروبي)، والتحول الميكروبي (أكسيدازالقيود على الموارد وقيود الكربون)، الاستقرار الفيزيائي والبيوكيميائي لمحتوى الكربون (استقرار التجمع، و ) والبنية (الأليفاتية والمقاومة) بين التربة الفقيرة بالكربون والتربة الغنية بالكربون واختلافها. أحجام التأثير المقدرة هي معاملات الانحدار بناءً على متغيرات الاستجابة المعاد قياسها (بمتوسط صفر وفترات الثقة) في نموذج التأثيرات المختلطة الخطية. تمثل النقاط والظلال المتوسط ± الانحراف المعياري للآثار. تعتمد الأهمية الإحصائية على نوع والد IIاختبارات، وعدم تداخل الصفر يدل على الأهمية. الدوائر المملوءة تمثل التأثيرات الهامة الناتجة عن سماد النيتروجين. ). ب، ج الارتباطات الجزئية بين POC للتربة الفقيرة بالكربون و MAOC للتربة الغنية بالكربون مع أربعة أنواع من العوامل (أصل SOC (OR)، التحول الميكروبي (TS)، الاستقرار الفيزيائي والمعادن لـ SOC (SA) والبنية (ST)). الدائرة الخارجية تمثل العوامل (أي، OR، TS، SA و ST) التي يتم فحصها من حيث ارتباطها بـ POC أو MAOC. لون أشكال المروحة يدل على قوة واتجاه الارتباط، مع إطار أسود يشير إلى الأهمية الإحصائية عند مستوى 0.05. الفروق في اللون بين الصفر (Zero) والمتحكم تشير العوامل إلى مدى اعتماد العلاقة بين POC أو MAOC والعامل المدروس على المتغير المسيطر (عدم تغيير لون الدائرة بين العامل المسيطر والترتيب الصفري = عدم الاعتماد؛ انخفاض/زيادة في شدة لون الدائرة = فقدان/كسب العلاقة). د، هـ علاقات بين POC في التربة الفقيرة بالكربون وMAOC في التربة الغنية بالكربون مع المتنبئات الرئيسية. الخط الصلب في كل لوحة يظهر ملاءمة نموذجية مهمة باستخدام الانحدار الخطي. )، والتظليل حول الخط الملائم يمثل فترات الثقة. qCO2 (نسبة الأيض؛نسبة الكتلة الحيوية الفطرية-البكتيرية؛ MWD: متوسط قطر وزن الكتل؛ : بلورية حقيقيةأكاسيد؛معقد عضويًاأكاسيد؛ و نسب المولات القابلة للتبادل و . الأليفاتية: نسبة منطقة الألكيل مقسومة على منطقة O-alkyl؛ المقاومة: نسبة (الكربون الألكيلي + الكربون العطري) / (O-alkyl + الكربون الكربوكسيلي). POC: الكربون العضوي الجزيئي؛ MAOC: الكربون العضوي المرتبط بالمعادن. NO: التحكم (بدون إضافة نيتروجين)؛ N: إضافة نيتروجين (نتائج دمج إضافة نيتروجين المحسنة وإضافة نيتروجين عالية). التربة الفقيرة بالكربون: دمج نتائج كوتشو وتشونغ وو؛ التربة الغنية بالكربون: دمج نتائج سيبينغ ويان. تم إنشاء بعض العناصر في (أ) باستخدام BioRender. ب، أ. (2025)https://BioRender.com/b56q841تُقدم بيانات المصدر كملف بيانات مصدر. (الشكل 4 أ و ب). علاوة على ذلك، قمنا بتقسيم الأراضي الزراعية العالمية إلى فئتين بناءً على عتبات الكربون العضوي في التربة (عتبة الكربون العضوي لبيانات التحليل التلوي لدينا): الأراضي الزراعية الفقيرة في الكربون والأراضي الزراعية الغنية في الكربون. زادت إضافة الأسمدة النيتروجينية من الكربون العضوي القابل للاحتراق.في التربة الفقيرة بالعنصر C وفي التربة الغنية بالكربون، مقارنة بالتربة غير المخصبة (الشكل التكميلي 12). ومع ذلك، كانت الزيادة في MAOC الناتجة عن التسميد 7% في التربة الفقيرة بالكربون و8% في التربة الغنية بالكربون (الشكل التكميلي 12). عبر المناطق البيئية، وجدنا أن التأثيرات المفيدة لسماد النيتروجين على POC كانت أكبر في المناطق شبه الاستوائية ( )، تليها معتدلة ( ) و boreal ( ) ، وأقل في المناطق الاستوائية ( “; الشكل التوضيحي الإضافي 13). بشكل خاص، فإن تراكم المواد العضوية القابلة للذوبان في الماء بسبب التسميد يكون أكثر وضوحًا في شرق آسيا وأمريكا الشمالية. بالمقابل، كانت استجابة المواد العضوية القابلة للذوبان في الماء للتسميد في أفريقيا ضئيلة أو محايدة. كشفت دراستنا عن تعزيز نسبي موحد في المواد العضوية القابلة للذوبان في الماء، الناتج عن سماد النيتروجين، عبر مناطق بيئية متنوعة، مع زيادات تتراوح بين و شهدت المنطقة المعتدلة أكبر زيادة ملحوظة، في حين أظهرت المنطقة الاستوائية أقل زيادة (الشكل التكميلي 13).
نقاش
استعادة محتوى الكربون في التربة الزراعية أمر حيوي لتعزيز الإنتاج الزراعي المستدام وتقديم استراتيجية قابلة للتطبيق للتخفيف من الاحتباس الحراريالكربون في التربة ليس كيانًا موحدًا، حيث يمكن أن يساعد تمييزه إلى الكربون العضوي القابل للتأكسد (POC) والكربون العضوي الثابت (MAOC) في فهم تكوين وتراكم الكربون في التربة (SOC)، وبالتالي توفير إرشادات أكثر دقة للمديرين وصانعي السياسات. ومع ذلك، فإن التقييمات الحالية لتأثير الأسمدة النيتروجينية على POC وMAOC اعتمادًا على مستويات خصوبة التربة غير كافية، مما يعيق تقدم الزراعة المستدامة وتحسين فوائد احتجاز الكربون. من خلال دمج تحليل شامل للأدبيات المنشورة والأدلة التجريبية من أربعة تجارب، حددنا عتبة حرجة لكربون التربة (أي، التحكم في تأثير تخصيب النيتروجين على تراكم الكربون. تحت هذا العتبة الحرجة لمحتوى الكربون في التربة، يكون تراكم الكربون استجابةً للتخصيب مائلًا نحو تكوين الكربون العضوي الجزيئي، بينما يتجاوز هذا النقطة يغير التوازن نحو مزيد من تراكم الكربون العضوي المعدني (الشكل 1د، هـ). يؤثر محتوى الكربون العضوي الأولي على التغيرات الناتجة عن النيتروجين في الكربون العضوي الجزيئي والكربون العضوي المعدني من خلال التأثيرات المباشرة على مدخلات الكربون من النباتات والتأثيرات غير المباشرة على التحول الميكروبي، والحماية الفيزيائية والمعادن (الشكل 5).
من خلال استخدام البحث المنهجي ووجهات النظر المتنوعة، تتناول هذه الدراسة الآليات وراء تشكيل مكونات الوظائف الاجتماعية التي تتوسطها الأسمدة النيتروجينية والكربون الأولي، حيث يتم تحليل المصادر وعمليات التحول واستقرار هذه المكونات بشكل منهجي. في الأنظمة الزراعية، غالبًا ما يتم زيادة غلات المحاصيل.
الشكل 4 | خرائط التوزيع المكاني المتوقع لتأثيرات معدلات التسميد بالنيتروجين الحالية على تغييرات الكربون العضوي الجزيئي (POC) والكربون العضوي المعدني (MAOC) (%) عبر الأراضي الزراعية العالمية المرتفعة ونمطها العرضي، على التوالي. أ خريطة عالمية لتغييرات الكربون العضوي الجزيئي (POC) وتوزيعه العرضي.خريطة عالمية لتغيرات الكربون العضوي المرتبط بالمعادن (MAOC) وتوزيعه العرضي. الرسم التوضيحي في الجانب الأيمن يظهر المتوسطات العرضية (باللون الأسود) خط) والانحرافات المعيارية (تظليل رمادي) لـ POC أو MAOC.” يمثل التغير النسبي في POC أو MAOC تحت مستوى التسميد الحالي مقارنةً بالحالة غير المخصبة. خريطة الأساس في (أ) من Natural Earth.https://www. naturalearthdata.com/). تم اشتقاق حدود الساحل في الخريطة من قاعدة بيانات GSHHG (https://www.ngdc.noaa.gov/mgg/shorelines/data/gshhg/latest/). يتم توفير بيانات المصدر كملف بيانات المصدر. من خلال تخصيب النيتروجين، وعادة ما تكون الكتلة الحيوية فوق وتحت الأرض ومدخلات الكربون المستمدة من الجذور أكبر بشكل عامفي التربة الفقيرة بالكربون، تم إثبات زيادة الكتلة الحيوية للجذور والفينولات اللجنينية بعد تخصيب النيتروجين (الشكل 3 أ و د)، بما يتماشى مع الفرضية (1). عادةً، يؤدي زيادة مدخلات الكربون من النباتات إلى تحفيز زيادة مماثلة في أنشطة الإنزيمات، وذلك بسبب توافر الركائز الغنية التي “تغذي” العمليات الميكروبية.في الدراسة الحالية، انخفضت أنشطة أكسيداز التربة قليلاً مع إضافة النيتروجين في التربة الفقيرة بالكربون (الجدول التكميلي 3)، وهو ما يتماشى مع تحليل شامل حديث أظهر أن إضافة النيتروجين قيدت نشاط إنزيمات تحلل اللجنين.، مما أدى إلى تراكم بقايا النباتات كجزيئات ماكروموليكول اللجنين . بخلاف الإنزيمات خارج الخلوية، تلعب التركيبة الميكروبية والتصنيف أيضًا دورًا في التوسط في تحلل اللجنين وتكوين المواد العضوية القابلة للذوبان لاحقًا. الكتلة الحيوية الفطرية وتم زيادتها تحت تخصيب النيتروجين (الشكل 3أ؛ الشكل التكميلي 14)، مما يشير إلى أن المجتمعات الميكروبية تمر بانتقال نحو نظام بيئي يهيمن عليه الفطريات لزيادة الكفاءة في تحلل اللجنين.، كما لوحظ من قبل مان وآخرون.. علاوة على ذلك، وفقًا لنظرية EST، عندما يكون N وفيرًا في التربة الفقيرة بالمواد العضوية، يمكن أن يؤدي عدم التوازن بين توفر الموارد واحتياجات المغذيات الميكروبية إلى عدم توازن ستوكيويمي. هذا الاختلال يعيق تحويل المواد العضوية القابلة للاحتراق (POC) إلى المواد العضوية القابلة للاحتجاز (MAOC) لأن الميكروبات، وهي الوسيط الرئيسي في تحويل الكربون غير المستقر إلى MAOC، تؤدي إلى زيادة احتفاظ POC.بالإضافة إلى العوامل البيولوجية المذكورة أعلاه، تلعب الكتل التربة دورًا حيويًا في الحماية الفيزيائية للمواد العضوية المحتوية على الكربون (الشكل 3ب، د)وجدنا أن تخصيب النيتروجين زاد من استقرار كتل التربة (الشكل 3أ)، وهو ما قد يكون نتيجة لزيادة بقايا النباتات، والترسيب الجذري، والفطريات. الكتلة الحيوية. تمتلك بقايا الأوراق والترسبات الجذرية القدرة على الارتباط مع خيوط الفطريات وجزيئات التربة، مما يؤدي إلى تشكيل الكتل الكبيرة.تركيب التربة، إلى جانب تكوين الكتل، هو عامل رئيسي يؤثر على تراكم الكربون.أشارت تحليلنا الشامل إلى أن محتوى الطين والطفل يؤثر بشكل كبير على تراكم المواد العضوية المعلقة (POC) والمواد العضوية المعلقة المتعددة (MAOC) (الشكل التوضيحي 4). كشفت تحليل التباين أن حجم التأثير للمواد العضوية المعلقة (POC) أكبر في التربة الطينية مقارنة بالتربة الطينية الرملية (الشكل التوضيحي 15)، حيث يحتوي الطين على المزيد من المواقع التفاعلية لامتصاص الكربون.بشكل عام، فإن التأثير الصافي المفيد لإضافة النيتروجين على الكربون العضوي القابل للتحلل في التربة الفقيرة بالكربون يعتمد على التفاعلات بين زيادة الكتلة الحيوية للجذور واللجنين، والتغيرات في أنشطة الإنزيمات خارج الخلوية، وحماية قوية لكتل التربة (الشكل 5).
بينما أصبح التوافق العالمي على زيادة احتجاز الكربون، خاصة في خزانات التحلل البطيء (مثل MAOC)، أكثر أهمية على مدار العقد الماضي، لا تزال اتجاهات وحجم التغيرات في MAOC استجابةً للنيتروجين غير مدروسة بشكل كاف.هنا، لاحظنا أن تخصيب النيتروجين كان له تأثير إيجابي بشكل خاص على MAOC في التربة الغنية بالكربون (الشكل 2c، d؛ الشكل التوضيحي 6). كما لاحظنا أن تخصيب النيتروجين زاد من الكتلة الميكروبية الجديدة، مما سهل بشكل خاص مساهمة الكتلة الميكروبية الفطرية في حوض الكربون المستقر (الشكل 3a والشكل التوضيحي 8). وهذا يشير إلى تحول في التوازن بين أحواض SOC القابلة للتغيير والمستقرة تحت تخصيب النيتروجين، والذي يمكن أن يكون ناتجًا عن آليات متعددة متداخلة. أولاً، الزيادة في كتلة الجذور والترسيب الجذري الناتج عن سماد النيتروجين زادت من توفر الكربوهيدرات البسيطة، التي يتم استخدامها بشكل أكثر كفاءة لتشكيل الكتلة الميكروبية ثم تتحول لاحقًا إلى MAOC.ثانيًا، يتماشى مع فرضيتنا الثانية، زيادة توفر النيتروجين
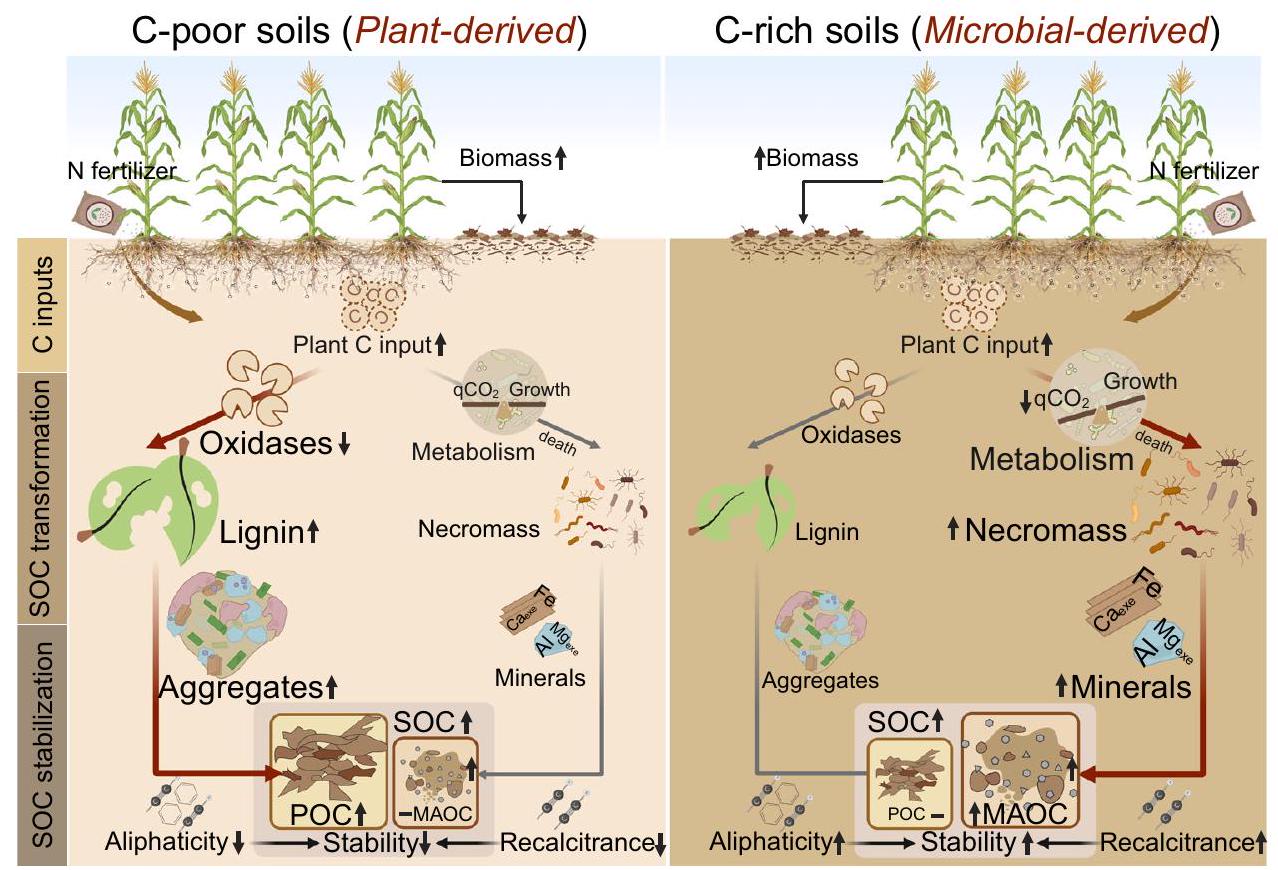
الشكل 5 | رسم تخطيطي مفهومي يوضح الـتأثيرات التسميد على الكربون العضوي في التربة (SOC) والمجموعات الوظيفية (POC وMAOC) بالإضافة إلى آليات تنظيمها من خلالأصول المدخلات، التحول الميكروبي، والاستقرار الفيزيائي والكيميائي في التربة الفقيرة بالكربون والغنية بالكربون. من الواضح أنه في التربة الفقيرة بالكربون ذات المحتوى المنخفض من الكربون العضوي، يسهل التسميد بالنيتروجين احتفاظ المواد العضوية القابلة للتأكسد وزيادة محتوى الكربون العضوي، بشكل أساسي من خلال تأثيره على الكربون المشتق من النباتات والحماية داخل الكتل. على العكس، في التربة الغنية بالكربون ذات المحتوى العالي من الكربون العضوي، حفز سماد النيتروجين احتجاز MAOC وزيادة SOC من خلال دورة الكربون الميكروبية الأكثر كفاءة (كفاءة أيض عالية وكفاءة ضخ) وآليات حماية معدنية قوية. يمثل المسار الأحمر الآلية الرئيسية التي يؤثر بها سماد النيتروجين على مكونات الكربون في الظروف الحالية. تشير اتجاه السهم إلى التغير في المتغير (للأعلى/زيادة؛ للأسفل/نقصان)، بينما تمثل الخطوط الأفقية عدم التغيير. تم إنشاء بعض عناصر هذه الشكل في BioRender. ب، أ. (2025)https://BioRender.com/i51j856. يمكن أن يخفف من عدم التوازن بين المجتمع الميكروبي والموارد المتاحة في التربة الغنية بالكربون SOC)، مما يخفف من قيود المغذيات الميكروبية وبالتالي يزيد من إنتاج الكتلة الميتة من الكربون دراستنا قابلة للمقارنة مع التقارير السابقة التي تشير إلى أن الكائنات الدقيقة تعاني من نقص في الكربون وتظهر كفاءة أيضية منخفضة في التربة ذات محتوى منخفض من الكربون العضوي في التربة. )، كما يتضح من الارتفاع في قيم. لقد حددنا أيضًا أدنىالقيم تحت إضافة النيتروجين في التربة الغنية بالكربون (الشكل 3أ). بالطبع، يتأثر التوازن الاستوكيومتري الميكروبي بتغيرات كل من محتوى الكربون وتوافر العناصر الغذائية في التربة.بينما يمكن أن تكون معدل تطبيق سماد النيتروجين عاملاً رئيسياً يؤثر على الاستجابات الأيضية الميكروبية للتسميدالاستجابات لا تعتمد على كمية النيتروجين المطبقة, الذي يتماشى مع نتائجنا (الشكل التكميلي 9). ثالثًا، يوفر تحليل الإنزيمات خارج الخلوية دليلًا على أن زيادة أنشطة أكسيد الفينول والأكسيداز قد تزيد من قدرة الميكروبات على الحصول على الكربون من خزانات SOC ذات معدلات دوران أبطأ . قد يكون الانخفاض الملحوظ في أنشطة الأكسيداز التي لوحظت في هذه الدراسة قد غيرت استراتيجيات اكتساب الكربون الميكروبي، مما ساهم في زيادة MAOC تحت إضافة النيتروجين (الشكل 3c، e). أخيرًا، يعد امتصاص المركبات العضوية على الأسطح المعدنية علامة مميزة للتربة الغنية بالكربون، مما يجعل هذه التربة عرضة بشكل خاص للتأثيرات الحمضية الناتجة عن إضافة النيتروجين . كان لإضافة النيتروجين تأثير إيجابي كبير على الحماية المعدنية في التربة الغنية بالكربون في هذه الدراسة، ناتج أساسًا عن زيادة محتوى المركبات العضوية-الألمنيوم/الحديد ( و ; الشكل 3a). على وجه التحديد، زادت التأثيرات الحمضية الناتجة عن النيتروجين من MAOC بشكل عام نتيجة لزيادة قابلية ذوبان الكاتيونات المعدنية والتكوين اللاحق لمركبات العضوية-المعدنية (الشكل التكميلي 11) . توضح دراستنا أن التربة الغنية بالكربون التي تحتوي على كميات أكبر من الطين والغرينية (مثل تلك من SP و YA) مع قدرة محسنة على الاحتفاظ بالمياه تدعم إنتاج الكتلة الحيوية الميكروبية وبالتالي تشكيل الكتلة الحيوية الميتة الميكروبية . توفر المساحة السطحية الكبيرة لجزيئات التربة الدقيقة المزيد من الأسطح المعدنية والمواقع التفاعلية لتثبيت الكربون المشتق من الميكروبات و
تعزيز تراكم MAOC . بالإضافة إلى ذلك، تم إثبات المساهمة المعززة للكربون المستقر في خزانات SOC من خلال زيادة في الأليفاتية بعد إضافة النيتروجين (الجدول التكميلي 4)، حيث تمثل الأليفاتية مؤشرًا شاملًا لتقييم المركبات الكيميائية ‘المقاومة’ . بشكل عام، كان تراكم MAOC الناتج عن النيتروجين في التربة الغنية بالكربون ناتجًا بشكل رئيسي عن تراكم الكتلة الحيوية الميتة وزيادة التثبيت على المعادن (الأشكال 2d و 3a). تؤكد نتائجنا معًا على الدور الحاسم لكتلة الجذور، وخصائص الميكروبات والمعادن كمتنبئين رئيسيين يؤثرون على التراكم الملحوظ في مستويات MAOC بعد إضافة النيتروجين في التربة الغنية بالكربون.
يمكن أن تساعد القدرة على التنبؤ بخزانات الكربون وتغيرات وظيفتها تحت إضافة النيتروجين الحالية في توجيه تطبيق الأسمدة المثلى لحلول المناخ المعتمدة على الأراضي الزراعية. وقد توقعت الدراسات الحديثة مجموعة واسعة من استجابات SOC للأسمدة غير العضوية، والتي تختلف في الحجم و. يعود عدم اليقين جزئيًا إلى تخصيص الكربون في خزانات النماذج التي تفتقر إلى تعريفات فيزيائية حيوية متميزة وتظهر حساسيات متفاوتة لإضافة النيتروجين.
استنادًا إلى نتائجنا، فإن تطبيق سماد النيتروجين عزز تراكم MAOC في التربة الزراعية الغنية بالكربون (الشكل التكميلي 12)، ويمكن أن يساعد في مكافحة الخسائر المتوقعة في الكربون من الأراضي الزراعية لتحقيق أهداف احتجاز الكربون في التربة. أظهرت العديد من الدراسات الحالية للتحليل الشامل أيضًا أن التسميد عزز قليلاً تراكم MAOC . ومع ذلك، يجب تنفيذ هذه الاستراتيجية بحذر لتخفيف المخاطر العالمية المحتملة على الاقتصاد والبيئة والصحة العامة . على سبيل المثال، قد يتم تعويض فوائد زيادة مصب MAOC جزئيًا من خلال زيادة الانبعاثات، والطاقة الأحفورية والانبعاثات المرتبطة بغازات الدفيئة أثناء تصنيع الأسمدة . بالنظر إلى انبعاثات غازات الدفيئة طوال دورة حياة سماد النيتروجين، فإن إمكانات الاحتباس الحراري للتربة المخصبة تظل أكبر من تلك الخاصة بالتربة غير المخصبة . غالبًا ما يكون هذا التبادل ضروريًا لضمان الأمن الغذائي. إن تطوير فهم شامل
لتغيرات الكربون الناتجة عن سماد النيتروجين أمر ضروري للتنبؤ بدقة بمصير SOC في عالم أكثر دفئًا، من أجل زيادة القدرة الزراعية على التخفيف من تغير المناخ وتوفير خدمات النظام البيئي الإضافية. أشارت توقعاتنا العالمية إلى أن التسميد يؤدي إلى زيادة أكبر بكثير في POC في التربة الفقيرة بالكربون مقارنة بالتربة الغنية بالكربون (الشكل 4a). ومع ذلك، بسبب دوران POC السريع وعدم وجود حماية من الميكروaggregates والمعادن، فإن هذا الاحتفاظ لا يترجم إلى مكاسب طويلة الأجل في SOC , خاصة في ظل ظروف الاحتباس الحراري . علاوة على ذلك، فإن الاحترار الذي يزيد من النشاط الميكروبي من المحتمل أن يسرع من تحلل POC، حيث تعالج الميكروبات مصادر الكربون المتاحة، مما قد يؤدي إلى فقدان كبير للكربون بطريقة مضاعفة . يؤدي هذا التفاقم إلى زيادة انبعاثات غازات الدفيئة، مما يخلق حلقة تغذية راجعة إيجابية تعزز من ارتفاع درجة حرارة مناخ كوكبنا. على الرغم من أنه لوحظ أن التسميد يزيد من خزانات الكربون (الشكل 4)، إلا أن الحذر ضروري عند تقييم إمكاناته المستقبلية، خاصة في المناطق التي تعاني من الإفراط في التسميد وخصوبة عالية، حيث تكون النتائج غالبًا دون المستوى الأمثل . بينما يوفر تحليلنا تقديرًا عالميًا للتغيرات الناتجة عن التسميد بالنيتروجين في خزانات الكربون على مدار العقد الماضي، يجب الاعتراف بعدة قيود. أولاً، تقييمنا العالمي، المستند إلى تحليلات شاملة مع بروتوكولات تجريبية وعينات غير موحدة عبر الدراسات، يقيّد مخرجات النموذج إلى تفسيرات ارتباطية بدلاً من إثبات السببية. لمعالجة هذه القيود، يجب أن تعطي الجهود المستقبلية الأولوية لتجارب سماد النيتروجين متعددة المناطق الموحدة التي تدمج بيانات على مستوى القطعة مع طرق الاستدلال السببي. ستوضح هذه الأطر العلاقات السببية التي تكمن وراء كيفية تأثير سماد النيتروجين على التغذية الراجعة بين النبات والميكروبات والبيئة التي تحكم ديناميات خزانات الكربون. ثانيًا، يقيّد نقص تغطية البيانات في أوروبا وكندا وروسيا قابلية التنبؤ ودقة النموذج في هذه المناطق، خاصة بالنظر إلى مواقعها في خطوط العرض العالية وزيادة تعرضها لتأثيرات تغير المناخ. سيتطلب معالجة هذه القيود جهودًا منسقة من المجتمع العلمي لإجراء تجارب واسعة النطاق ومترابطة عبر القارات. ثالثًا، تعتمد تقديراتنا على مجموعات بيانات عالمية متداخلة بدقة زمانية ومكانية منخفضة (الجدول التكميلي 5)، حيث إن العديد من بيانات الميتاداتا على مستوى القطعة غير متاحة. لتقليل عدم اليقين في مثل هذه المجموعات، هناك حاجة إلى مزيد من الجهود لتحسين جودة البيانات ودقتها. على الرغم من هذه القيود، فإن الطبيعة الشاملة لدراستنا، التي تتضمن مجموعة متنوعة من مصادر البيانات وطرق التحليل المتقدمة، توفر تقديرًا قويًا لتغيرات خزانات الكربون الناتجة عن سماد النيتروجين.
باختصار، يوفر عملنا رؤى جديدة حول فوائد تطبيق سماد النيتروجين لتراكم SOC في أنظمة الزراعة العالمية. نميز بين آليتين متميزتين لتراكم الكربون في التربة العالمية بعد سماد النيتروجين عبر عتبة كربون أولية من : في التربة الفقيرة بالكربون ()، يتم دفع التراكم بشكل أساسي من خلال زيادة المدخلات النباتية وحماية التجمعات التي تعزز POC؛ على العكس من ذلك، في التربة الغنية بالكربون (SOC )، يحدث التراكم بشكل رئيسي من خلال تعزيز مضخة الكربون الميكروبية وزيادة الحماية المعدنية، مما يؤدي إلى تحول نحو MAOC. كما هو موضح في الشكل 5، من خلال إجراء أربع تجارب طويلة الأجل لشبكات سماد النيتروجين، لاحظنا أن التسميد بالنيتروجين غير من خزانات الكربون الوظيفية في التربة اعتمادًا على محتوى SOC الأولي، مما ينظم تحكمًا متكاملًا يشمل العوامل النباتية والجيوكيميائية والميكروبية. تسهم نتائجنا في الفهم الدقيق لدور سماد النيتروجين في تعزيز احتجاز SOC، مما يمهد الطريق لمراجعة النماذج الحالية لديناميات الكربون في التربة. إن الثنائية في آليات تراكم SOC التي اكتشفناها – تراكم POC الأكثر وضوحًا في التربة الفقيرة بالكربون مقابل تراكم MAOC في الظروف الغنية بالكربون – تتحدى وتوسع المفاهيم التقليدية لتأثيرات التسميد بالنيتروجين. تؤكد هذه الفجوة على تعقيد تفاعلات مصفوفة النبات والميكروبات والتربة في الوساطة لهذه التأثيرات. يجب أن تتضمن الأطر النظرية المستقبلية تنوع استجابات التربة لإضافة النيتروجين، مع التأكيد على التفاعل بين العوامل البيولوجية والجيوكيميائية.
طرق
وصف موقع الحقل
تم إنشاء شبكة من أربعة تجارب ميدانية طويلة الأمد لتسميد النيتروجين بين عامي 2008 و2011 في المناطق الأربعة الرئيسية لإنتاج الذرة في الصين وتمثل أربعة أنواع رئيسية من التربة (الشكل التوضيحي التكميلي 1). كانت المواقع الأربعة تقع في محطة سبيينغ (SP) التجريبية، مقاطعة جيلين في شمال شرق الصين.، محطة تشوzhou التجريبية (QZ)، مقاطعة خبي في سهل شمال الصينمحطة تشانغوو التجريبية (CW)، مقاطعة شنشي في شمال غرب الصين; ومحطة يان التجريبية (YA)، مقاطعة سيتشوان في جنوب غرب الصينفي سيبينغ، قوام التربة هو طين سلت. SOC، ودرجة حموضة 6.16. كانت المنطقة تتمتع بمتوسط درجة حرارة الهواء ومتوسط هطول الأمطار السنوي 551 مم. في محطة كوتشو التجريبية، نسيج التربة هو طين طيني مع SOC، ودرجة حموضة 8.5. كانت المنطقة تتمتع بمتوسط درجة حرارة الهواء ومتوسط هطول الأمطار السنوي 516 مم. في محطة تشانغوو التجريبية، قوام التربة هو طين سيلتي.، و كان متوسط درجة حرارة الهواء في المنطقة ومتوسط هطول الأمطار السنوي 595 مم. في محطة يان التجريبية، نسيج التربة هو طين طيني مع و كان متوسط درجة حرارة الهواء في المنطقةومتوسط هطول الأمطار السنوي 1635 مم. تم تلخيص المعلومات التفصيلية لمواقع المناطق الأربع المأخوذة منها العينات في الجدول التكميلية 7.
تم إجراء نفس تجارب الأسمدة في تصميم كتلة كاملة عشوائية مع أربع مكررات في كل موقع. تم إضافة سماد النيتروجين على شكل يوريا.على ثلاثة مستويات من النيتروجين: (1) بدون سماد نيتروجيني (يشار إليه فيما بعد بـ ‘التحكم’)؛ (2) معدل نيتروجين محسّن (يشار إليه فيما بعد بـ ‘OPT’)؛ (3) معدل نيتروجين مرتفع (يشار إليه فيما بعد بـ ‘HN’). باختصار، تم تحديد معدل تطبيق النيتروجين الأمثل بناءً على إدارة نيتروجين منطقة الجذور خلال الموسم لمزامنة إمدادات النيتروجين من التربة والبيئة مع الطلب على النيتروجين من المحصول، بينما يُعتبر معدل النيتروجين المرتفع مماثلاً لممارسات المزارعين المحليين.تم تطبيق السماد مرتين خلال فترة النمو: في البداية كإضافة أساسية ثم كإضافة علوية في جميع المواقع الأربعة. تم تقطيع قش الذرة ودمجه في التربة من خلال الحراثة إلى عمق.
أخذ عينات من التربة والنباتات وتحليلها
التربة السطحيةتم أخذ عينات في سبتمبر 2020، وتم جمع خمسة أنوية من التربة السطحية عشوائيًا من كل قطعة أرض لتكون عينة واحدة لكل قطعة. تم غربلة عينات التربة من خلالتمت إزالة جميع الجذور والصخور المرئية من المنخل باستثناء تجزئة الركام وتم تقسيمها إلى جزئين: تم تخزين أحدهما فيلتحليل أنشطة الإنزيمات وتركيب الميكروبات خلال أسبوع واحد، وتم تخزين التربة المتبقية في درجة حرارة الغرفة لتحديد التحليلات الفيزيائية والكيميائية للتربة وتجربة الحضانة الإضافية.
تم تحديد محتويات الكربون العضوي في التربة (SOC) والنيتروجين الكلي (TN) عن طريق الاحتراق الجاف باستخدام محلل عنصري (Elementar, Vario Max CN, ألمانيا). قبل قياس SOC وTN، تم تعقيم التربة القلوية بحمض الهيدروكلوريك المركز لمدة 48 ساعة لإزالة الكربونات. تم قياس درجة حموضة التربة باستخدام جهاز ULTRAMETERII.6PFCE (ميلون، كاليفورنيا، الولايات المتحدة الأمريكية) بعد هز التربة في الماء منزوع الأيوناتتعليق لمدة 30 دقيقة. تم استخراج الكتلة الحيوية الميكروبية الكربونية (MBC) والنيتروجينية (MBN) فيمحلول من التربة المعالجة بالبخار الكلوروفورم وغير المعالجة وتم تحديده من خلال الفرق في تركيز الكربون والنيتروجين باستخدام محلل TOC-L من شيمادزوتم تقييم نسبة الفطريات إلى البكتيريا (F:B) من خلال تطبيق طريقة الأحماض الدهنية الفوسفوليبيدية..
عند النضج في عام 2018، تم جمع أربعة أنظمة جذرية كاملة من التربة السطحية.في كل قطعة. تم فصل الجذور عن التربة عن طريق الشطف على شاشة شبكية ناعمة تحت ماء خفيف. رش حتى تمت إزالة معظم التربة. ثم تم تجفيف الجذور النظيفة فيتمت غربلتها للاحتفاظ بالجذور مع إزالة أي تربة متبقية، ثم تم وزنها.
الإنزيمات التحليلية المائية،-غلوكوسيداز (BG)، سيلوبيوهيدراز (CBH)،-أسيتيل-تم قياس “-D-glucosaminidase (NAG)، leucine amino peptidase (LAP)، acid و alkaline phosphatase (ACP و ALP) في عينات التربة الطازجة بطريقة الفلورية باستخدام ركائز موسومة بـ methylumbelliferone.”باختصار، تم إضافة 125 مل من محلول العازلة إلى 1.0 جرام من الكتلة الجافة للتربة الطازجة وتم ضبط الرقم الهيدروجيني على 8.2 باستخدام حمض الهيدروكلوريك. بالنسبة لتحليل ALP و ALP، تم ضبط العازلة على الرقم الهيدروجيني 6.5 و 8.2، على التوالي. المجموع الكلي منعينة التعليق وتم توزيع حلول الركيزة في آبار لوحة ميكروية سوداء مكونة من 96 بئرًا. تم تغطية الألواح الميكروية وحضانتها في الظلام عندلمدة 4 ساعات وتم قياس الفلورية باستخدام مقياس الفلورية في الألواح الدقيقة معإثارةمرشحات الانبعاث. تم قياس إنزيم بوليفينول أوكسيداز (PPO) وإنزيم بيروكسيداز (POD) طيفياً في لوحة ميكروية واضحة مكونة من 96 بئرًا باستخدام ركيزة L-3،4-ديهيدروكسي فينيل ألانين (L-DOPA؛ جيرمان وآخرون.تم خلط 1 مل من معلق التربة مع 1 مل من 10 مليمول L-DOPA في محلول أسيتات 50 مليمول لاختبار PPO أو 1 مل من L-DOPA و0.2 مل من بيروكسيد الهيدروجين لاختبار POD ثم تم حضنه في الظلام عندلمدة ساعتين. تم طرد المعلقات مركزياً، وتم قياس النشاط عن طريق قياس الامتصاص عند 450 نانومتر.
تم استخدام النسبة المولية الإنزيمية لتقييم القيود المحتملة على الكربون في التربة. تم حساب طول المتجهات وفقًا لـ Moorhead وآخرون.تشير طول المتجه إلى نشاط الإنزيم تجاه اكتساب الكربون بالنسبة للنيتروجين والفوسفور. يمثل طول المتجه الأعلى قيودًا أكبر على الكربون الميكروبي..
أين و تمثل النسبي و نسب الإنزيمات المكتسبة، على التوالي. إنزيم اكتساب الكربون: BG وCBH؛ إنزيم اكتساب النيتروجين: NAG وLAP؛ إنزيم اكتساب الفوسفور: ACP لـ SP وYA، وALP لـ QZ وCW.
قمنا أيضًا بتقييم قيود الموارد الميكروبية من خلال حساب نسب نسب الموارد C:N )، تم تطبيعها إلى نسبة MBC إلى MBN نظرًا لأن النسبة المولية للكتلة الحيوية تحدد متطلبات المغذيات للمحللات الميكروبية، فإن زيادة قيود الموارد تشير إلى زيادة قيود النيتروجين على الميكروبات.
أينيمثل نسبة SOC إلى TN،يمثل نسبة MBC إلى MBN.
تم تقييم كفاءة الأيض الميكروبي باستخدام qCO2، حيث تشير قيم qCO2 الأعلى إلى تخصيص أقل للكربون (C) للكتلة الحيوية وزيادة في خسائر التنفس.تم تعديل عينات التربة (ما يعادل 30 جرام من الوزن الجاف) إلىسعة احتباس الماء، ووُضعت في برطمانات سعة 250 مل، وتم تحضينها في لمدة 28 يومًا. هيدسبيس تم قياس الإفراج باستخدام تربةنظام التدفق مزود بغرفة محمولة (EGM-5، الولايات المتحدة الأمريكية، نظام PP) في الأيامبعد حضانة التربة. التربةتم التعبير عنه كـ.
تجزئة SOC
تم تحديد المادة العضوية الجزيئية (POC) والكربون العضوي المرتبط بالمعادن (MAOC) مع تعديلات على الطريقة الموصوفة من قبل بوبلاو وآخرين.باختصار، 20 جرام منتم هز التربة السائبة المنخلة لمدة 18 ساعة مع كرات زجاجية في سداسي ميتافوسفات الصوديوم لتعطيل جميع التجمعات. تم شطف المزيج الناتج من التربة بالماء المقطر.منخل مع الكسر الذي يمر من خلالهتمثيل MAOC والجزء المتبقي على المنخلتمثيل الأشخاص الملونين. بعد التكسير الفيزيائي، تم قياس إجمالي الكربون في كسور MAOC و POC باستخدام التحليل العنصري.
تم استخدام الفينولات اللجنينية كدليل جيوكيميائي لدخول الكربون من النباتات الأرضية وفقًا لأوتو وسيمبسون.تم طحن عينات التربة لتجاوز منخل شبكي بحجم 0.15 مم وتم نقل عينة فرعية إلى وعاء تيفلون للهضم باستخدام CuO القلوي تحت ضغط ودرجة حرارة مرتفعة لإطلاق الفينولات الأحادية المكونة من بوليفينولات اللجنين. باختصار، تم استخدام 1 جرام من التربة المجففة بالهواء (تم استخراجها بالمذيب وتحليلها بالقاعدة لإزالة الدهون القابلة للاستخراج والتحلل. تم خلط الرواسب المجففة مع 1 جرام من CuO و100 ملغ من كبريتات الحديد (II) الأمونيوم سداسية الماء، و-تم تطهير 2 م NaOH في قنابل مبطنة بالتفلون. تم شطف القنابل بـلمدة 10 دقائق وتم تسخينه عندلمدة 2.5 ساعة. بعد التبريد، تم إضافة منتجات أكسدة اللجنين (LOPs) إلى الفانيليا الإيثيلية، وتم تحميضها إلى pH 1 باستخدام 6 M HCl، وتم الاحتفاظ بها في الظلام لمدة ساعة. تم استخراج LOPs من السائل العلوي باستخدام الإيثيل أسيتات، وتم تركيزها تحت، وتم إذابته في محلول يحتوي على حمض السيناميك المتحول. تم تجفيف الخليط تحتمشتق بـ N,O-ثنائي (تريميثيل سيليل) ثلاثي فلور أسيتاميد و بيريدينتم قياسها باستخدام جهاز GC-MS QP 2010 PLUS (شيمادزو) مع عمود سيليكا مدمج HP-5 وكاشف تأين اللهب. أطلق هذه الطريقة ثمانية مكونات مميزة من الفينولات الأحادية اللجنين، بما في ذلك الفانيل (V؛ الفانيلين، الأسيتوفانيلون وحمض الفانيل) والسيرينجيل (S؛ السيرينغالدهايد، الأسيتوسيرينجون وحمض السيرينجيك) والسيناميل (C؛ حمض p-كوماريك وحمض الفيروليك). تم جمع الفينولات الفانيلية (V) والسيرينجيل (S) والسيناميل (C) لتمثيل الفينولات اللجنينية في التربة.
تم استخدام تحليل السكريات الأمينية لت quantifying الكتلة الميكروبية المساهمة من قبل البكتيريا أو الفطريات وفقًا لـ زانغ وأميلونغ.باختصار، تم تحلل عينات التربة الموزونة باستخدام 6 م HCl لمدة 8 ساعات فيتم إضافة الميو-إنوزيتول كمعيار داخلي بعد أن تبرد الهيدروليزات إلى درجة حرارة الغرفة. ثم تم تصفية الهيدروليز، وتبخيره، وضبط الرقم الهيدروجيني (6.6-6.8)، وطرده مركزيًا وتجفيفه بالتجميد. تم إعادة إذابة السكريات الأمينية في الميثانول وفصلها عن الأملاح بالطرد المركزي. بعد إضافة معيار كمي (ميثيل-غلوكامين)، تم تحويل السكريات الأمينية إلى مشتقات الألدونونيتريل. ثم تم التفاعل مع كاشف المشتقات، أنهدريد الأسيتيك، إيثيل أسيتات، وهكسان للتشتت. تم استخدام جهاز الكروماتوغرافيا الغازية (Agilent 6890 A، Agilent Technologies) لفصل وقياس السكريات الأمينية الثلاثة. تم حساب الكتلة الحيوية البكتيرية والفطرية C باستخدام المعادلات التالية، وتشير الكتلة الحيوية الميكروبية C إلى مجموع الكتلة الحيوية البكتيرية والفطرية C. :
الكتلة النخرية الفطريةغلوكوزامينحمض الموراميك حيث تمثل 45 نسبة تحويل حمض الموراميك إلى الكتلة الميتة البكتيرية C؛ و179.17 هو الوزن الجزيئي للجلوكوزامين؛ و9 تشير إلى نسبة التحويل من جلوكوزامين الفطريات إلى الكتلة الميتة الفطرية..
تجزئة حجم حبيبات التربة
تم تحديد أحجام جزيئات التربة باستخدام إجراء الغربلة الرطبةحيث تم فصل 100 جرام من التربة إلى أربع فئات حجمية من الكتل: الكتل الكبيرة الماكرو.كتل صغيرة ماكروالميكروaggregates و الكسور. باختصار، تم سحق عينات التربة المجففة بالهواء غير المضطربة برفق لتجاوز شبكة المنخل. ثم، عينات بوزن 100 جرام منتم وضع المجاميع بحجم – في المنخل العلوي لمجموعة تحتوي على المناخل مع، وأحجام شبكة 0.053 مم التي تم غمرها وتذبذبها (السعة ) في الماء المنزوع الأيونات. كانت مادة التربة تم شطفها من كل منخل ثم تجفيفها في الفرن ووزنها. يشير متوسط قطر الوزن (MWD، مم) إلى استقرار المجاميع، والذي يتم حسابه على النحو التالي:
أين هو القطر المتوسط للركام في أي حجم من الأحجام؛ هو نسبة المجاميع التي تتوافق مع.
الحالة الصلبةتحليل الرنين المغناطيسي النووي (NMR)
تمت دراسة التركيب الكيميائي لـ SOC من خلال تحديد الوفرة النسبية للمجموعات الوظيفية باستخدام الحالة الصلبةالرنين المغناطيسي النووي بتقنية الاستقطاب المتقاطع والدوران بزاوية سحرية (CPMAS)تم معالجة عينات التربة بـمحلول HF-HCL لتركيز المادة العضوية وإزالة المعادن البارامغناطيسية.-تم الحصول على طيف NMR باستخدام جهاز AVANCE III 400 WB (Bruker، بيليريكا، ماساتشوستس، الولايات المتحدة الأمريكية). الحالة الصلبةتم تقسيم طيف الرنين المغناطيسي النووي C-CPMAS إلى أربعة مناطق شائعة من الانزياح الكيميائي: الكيل-C (أو-ألكيل-سيعطرية-ج ) وكربونيل-ج (160-220 جزء في المليون). تم حساب مؤشرات مختلفة لاستقرار الكربون العضوي كما يلي: الشفافية = ألكيل C / ألكيل C
حماية معدنية
توفر الكاتيونات متعددة التكافؤ آلية للاحتفاظ بالكربون من خلال دورها في ربط الكاتيونات. قمنا بقياس محتوى الكاتيونات القابلة للتبادل بما في ذلك-(هيدرو) أكسيداتلقياسأكاسيد، قابلة للاستخراج بواسطة البيروفوسفاتأكاسيدتم استخراجها باستخدام 0.2 م من فوسفات الصوديوم، وأكاسيد الحديد/الألمنيوم القابلة للاستخراج بالأوكسالات ) تم استخراجه باستخدام حمض الأكساليك 0.2 م – أوكسالات الأمونيوم ( )، تم استخدامها لتمثيل المركبات المعقدة عضوياً الأكاسيد والأكسيد الهيدروكسيدات ذات البلورات الضعيفة، على التوالي.
الكالسيوم القابل للتبادل ) والمغنيسيوم ( تم استخراج أيونات C التي تحمي التربة باستخدام محلول كلوريد الأمونيوم-70% إيثانول بعد إزالة الكلوريد القابل للذوبان والكبريتات بواسطةمحلول الإيثانول. محتويات و تم تحديد المراحل المعدنية باستخدام مطياف الانبعاث الضوئي البلازمي المقترن بالحث (ICP-OES؛ iCAP 6300، ثيرمو ساينتيفيك، وولثام، الولايات المتحدة الأمريكية).
تجميع قاعدة البيانات العالمية
للتحقيق في تغييرات خزانات الكربون في التربة (SOC، POC وMAOC) استجابةً لتطبيق الأسمدة النيتروجينية تحت تأثيرات مستويات SOC الأولية المختلفة في الأراضي الزراعية العالمية، قمنا بتجميع مقالات بحثية تجريبية نُشرت قبل يونيو 2024 من قاعدة بيانات Web of Science وقاعدة بيانات البنية التحتية الوطنية للمعرفة في الصين باستخدام الكلمات الرئيسية التالية: (“النيتروجين”) AND (“جزء الكربون في التربة” OR “الكربون العضوي المرتبط بالمعادن في التربة” OR “المادة العضوية المرتبطة بالمعادن في التربة” OR “MAOC” OR “MOC” OR “MAOM” OR “MOM” OR “المادة العضوية الجزيئية” OR “الكربون العضوي الجزيئي” OR “POC” أو POM) AND (“الأراضي الزراعية” OR “الأراضي المزروعة” OR “الزراعة”). لكي يتم تضمينها في قاعدة البيانات، يجب أن تكون الأبحاث المنشورة قد استوفت المعايير التالية: (1) تم إجراء تجربة تخصيب نيتروجيني في الحقل وشملت إضافات النيتروجين وعلاجات التحكم ضمن النظم الزراعية تحت نفس الظروف البيئية؛ (2) تم تضمين الدراسات التي أجريت فقط في الحقول المرتفعة؛ (3) لم يتم تطبيق أي سماد عضوي آخر في جميع العلاجات خلال التجارب؛ (4) تم قياس خزانات الكربون وواحدة على الأقل من المتغيرات ذات الصلة، وتم الإبلاغ عن المتوسط والانحراف المعياري أو الخطأ المعياري وحجم العينة لجميع العلاجات؛ لضمان قابلية المقارنة مع مواقعنا الأربعة. في هذه التجربة، اخترنا فقط البيانات من التجارب التي أجريت على الأراضي الجافة. من خلال تطبيق هذه المعايير، تم اختيار 118 مقالة منشورة (المراجع التكميلية). قمنا بتجميع مجموعة بيانات نهائية تحتوي على 494 و149، قياسات POC وMAOC، على التوالي. كما تم جمع بيانات عن إحداثيات الموقع، المناخ، الكربون العضوي في التربة الأولية، الرقم الهيدروجيني للتربة الأولية، النيتروجين الكلي الأولي، محتوى الطين والسلت الأولي (تشير جميع خصائص التربة الأولية إلى تلك التي كانت قبل بدء التجربة)، معدل إدخال النيتروجين، والمدة. كما تم استخراج قيم إنتاج المحاصيل إذا كانت متاحة. عندما تم تقديم البيانات بشكل رسومي فقط، تم رقمنة الأشكال لاستخراج القيم العددية باستخدام GETDATA GRAPH. إذا لم يتم الإبلاغ عن متغيرات التربة والمناخ، قمنا بتعويض البيانات المفقودة باستخدام قواعد البيانات العالمية (مثل soilgrids وقاعدة بيانات WorldClim). قمنا بتصنيف البيانات إلى مناطق استوائية، شبه استوائية، معتدلة وبورالية بناءً على إحداثيات الموقع المحددة ومناطق منظمة الأغذية والزراعة.
النمذجة التنبؤية للـ POC والـ MAOC العالمية
لإنشاء نموذج تنبؤ مكاني لتأثير الأسمدة النيتروجينية الحالية على الكربون العضوي المذاب (POC) والكربون العضوي المعدني (MAOC)، قمنا أولاً بأخذ عينات من مجموعة المتغيرات البيئية المعدة لدينا في كل نقطة بيانات مستقلة ضمن قاعدة البيانات المجمعة. شملت هذه الطبقات المناخ والتربة واستخدام الأسمدة (الجدول التكميلي 6). على وجه التحديد، تم استخراج قيم جميع شبكات الطبقات البيئية بناءً على إحداثيات الموقع المحددة أو مباشرة من الدراسات الأصلية عند توفرها. تم إعادة أخذ عينات جميع المتغيرات وإعادة إسقاطها على شبكة بكسل موحدة في EPSG:4326 (WGS84) بدقة مكانية تبلغ خمس دقائق قوسية. اخترنا أربعة نماذج تعلم آلي شائعة وموثوقة (نموذج الغابة العشوائية، نموذج تعزيز التدرج المتطرف، نموذج آلة تعزيز التدرج الخفيف، ونموذج أشجار القرار المعززة) للتنبؤ بتغيرات POC وMAOC. البيانات المستخدمة للتدريب والتحقق هي و “، على التوالي. استخدمنا إجراء بحث شبكي، مع التحقق المتقاطع بخمسة أضعاف، لاختيار أفضل نموذج. تم قياس القدرة التنبؤية للنماذج باستخدام ثلاثة مقاييس رئيسية: جذر متوسط مربع الخطأ (RMSE)، ومتوسط الخطأ المطلق (MAE)، وجودة الملاءمة، كما هو ممثل بمعامل التحديد ( ). أظهرت النتائج أن نموذج أشجار القرار المعزز بالتدرج كان الأفضل بين جميع النماذج (المميز بأقصى وأقل قيمة للخطأ المطلق المتوسط (MAE) والخطأ التربيعي المتوسط (MSE؛ الجدول التكميلي 5) وبالتالي تم اختيارها للتنبؤ بالتغيرات العالمية في POC/MAOC. تم تشغيل جميع النماذج في بايثون.
التحليل الإحصائي
لتحليل البيانات، قمنا بحساب متوسط حجم التأثير وفترة الثقة 95% للتأثيرات العامة لإدارة الأسمدة النيتروجينية على الكربون العضوي في التربة (SOC) والكربون العضوي القابل للذوبان (POC) والكربون المعدني العضوي (MAOC). تم تقدير تأثيرات التسميد بالنيتروجين بناءً على الطبيعة.نسبة الاستجابة المحولةتم توليد فترات الثقة (CIs) على حجم التأثير الموزون باستخدام تقنية إعادة التقدير (999 تكرار، دالة confint، حزمة metafor):
أين هو متوسط العلاج، و هو متوسط التحكم. التباين المرتبطة بكل قيمة من تم حسابه على النحو التالي:
أين و هي أحجام العينات لمجموعتي العلاج والضبط، على التوالي؛ و و هي الانحرافات المعيارية لمجموعتي العلاج والضبط، على التوالي.
قمنا أولاً بتطبيق الانحدارات الخطية وغير الخطية (النماذج التربيعية والنماذج التراكمية العامة [GAM]) على العلاقات بين أحجام التأثير لـ POC/MAOC ومحتوى SOC الأولي، واستخدمنا معيار معلومات أكايك (AIC) لتحديد أي نموذج كان الأنسب في كل حالة.يمكن تعريف العتبات فقط عندما تكون غير خطية تتناسب الانحدارات بشكل أفضل مع البيانات. ثم قمنا بتقييم ستة نماذج غير خطية مختلفة لاختيار النموذج الذي يتماشى بشكل أفضل مع بياناتنا (الجدول التكميلي 1)، والتي اختلفت عن بعضها البعض من خلال الدوال الملائمة على كل جانب من نقطة الانكسار المقدرة.تم تقييم النماذج غير الخطية التالية: النماذج التراكمية العامة (GAM)، النماذج المتقطعة (نموذجان مع تقاطعين، حيث تم اختبار الفروق في التقاطع عند نقطة الانكسار)، النماذج المجزأة (نموذجان خطيان يتم فيهما تغيير الميل عند نقطة الانكسار)، النماذج المقطعية (نموذجان خطيان يتم فيهما تغيير كل من الميل والتقاطع عند نقطة الانكسار)، نموذج المفصل 12 (يتم ملاءمة نموذج خطي واحد للجزء الأيسر من نقطة الانكسار ونموذج متعدد الحدود من الدرجة الثانية للجزء الأيمن)، ونموذج المفصل 22 (يتم ملاءمة نموذجين مختلفين من الدرجة الثانية على كلا جانبي نقطة الانكسار). تم اعتبار النموذج الذي يظهر أقل قيمة لمعيار AIC ومعيار المعلومات بايزي (BIC) هو أفضل نموذج. تم توفير قيم AIC وBIC التفصيلية لكل نموذج انحدار في الجدول التكميلي 1. لقد عرفنا نقطة الانكسار على أنها عتبة SOC الأولية.
لاختبار ما إذا كانت العتبات المحددة تؤثر بشكل كبير على ميل الانحدارات الملائمة، قمنا بإعادة أخذ عينات من الانحدارات الخطية على جانبي كل عتبة لكل متغير. ثم استخرجنا الميل والقيمة المتوقعة للمتغير المقيم قبل وبعد العتبة وقارنّا بينهما باستخدام اختبار مان ويتني U وفقًا للطرق في المراجع 75،76. كما استخدمنا إحصائية Q لاختبار تباين أحجام تأثير N على POC و MAOC بين قبل وبعد عتبة SOC. بشكل ملحوظتشير قيم (تباين المجموعات) إلى أن نسبة المخاطر اختلفت بين المجموعات.
قمنا بتقييم جودة تحليلنا التلوي باستخدام القائمة المرجعية التي وضعتها كوريشيفا وغوريفيتش (الجدول التكميلي;). لقد استوفى تحليلنا التلوي جميع معايير الجودة المحددة للتحليلات التلوية في علم البيئة. يتم تقييم انحياز النشر تقليديًا من خلال تحليل مخطط القمع. ومع ذلك، تفتقر العديد من الدراسات إلى المعلومات اللازمة عن تباين العينة، وهو أمر حاسم لبناء مخططات قمع معلوماتية. وبالتالي، تم إنشاء هيستوغرام لفحص توزيع أحجام التأثير الفردية عبر مجموعة البيانات، بهدف تحديد أي مؤشرات على انحياز النشر (الشكل التوضيحي التكميلي 16). تشير اختبار إجر إلى أن تأثير إدارة الأسمدة النيتروجينية على POC قد يكون مبالغًا فيه قليلاً، ومع ذلك يبدو أنه ليس له تأثير كبير على MAOC. يتجاوز عدد الفشل لكل من POC و MAOC العتبة ( هو حجم العينة في هذه الدراسة)، مما يشير إلى غياب انحياز النشر. قمنا بإجراء تحليل حساسية باستخدام طريقة جاكنايف لتقييم تأثير الدراسات الفردية على القوة العامة للتحليل.في تحليل جاكنايف، حصلت كل دراسة على تعريف فريد، وفي كل تكرار، تم استبعاد بيانات من دراسة واحدة بشكل منهجي من مجموعة البيانات (الشكل التوضيحي التكميلي 17). أظهر تحليل الحساسية قوة هذه النتائج، حيث لم تمارس أي منشورة معينة تأثيرًا غير متناسب على الاستجابة العامة. بالإضافة إلى ذلك، تظهر اختبارات التغير الزمني ارتباطًا كبيرًا بين POC وسنة النشر.; MAOC: )، لا يزال بإمكاننا استنتاج أن نتائجنا قوية حيث أن التقديرات صغيرة النطاق ( لـ POC؛ الشكل التوضيحي التكميلي 18).
بالنسبة للتجارب الميدانية، استخدمنا نماذج التأثيرات المختلطة الخطية لتحديد تأثيرات ممارسات الأسمدة النيتروجينية، والظروف الأولية للكربون وتفاعلاتها على كتلة الجذور، واحتياطيات الكربون في التربة، وخصائص الميكروبات، والمواد الميتة، والفينولات اللجنينية، والحماية المعدنية والفيزيائية. تعتمد الأهمية الإحصائية على نوع والد III.الاختبارات وجميع أحجام التأثير المقدرة ) تعتمد على متغيرات استجابة معاد قياسها. على وجه التحديد، تم اختبار المتغيرات الاستجابية السابقة لكل تجربة مع إدارة الأسمدة النيتروجينية كآثار ثابتة، وتم اختبار الموقع كآثار عشوائية (وظيفة Imer، حزمة lme4 وlmertest). تم تقييم المقارنات الزوجية للعلاجات عبر الفرق المعنوي الصادق لتوكاي (وظيفة emmeans، حزمة emmeans). تم إجراء التحليلات الإحصائية في R الإصدار 4.2.1.
تم استخدام تحليل الارتباط الجزئي لتقييم العلاقات بين كسور الكربون (POC و MAOC) مع خمس مجموعات من عوامل التأثير (أي، مصدر الكربون (كتلة الجذور، الفينولات اللجنينية و الكربون الناتج عن الكائنات الدقيقة الميتة)، التحويل (أكسيداز، قيود الموارد وقيود الكربون)، الاستقرار (MWD، و ) والبنية (المقاومة والأليفاتية). كلما زادت الفجوة في معامل الارتباط الجزئي بين الارتباط من الدرجة الصفرية والارتباط المسيطر، كانت تأثيرات عامل التحكم أقوى. بعد تحديد المتنبئين الرئيسيين، تم تحليل العلاقة بين جزء C وهذه العوامل من خلال الانحدار الخطي أحادي المتغير.
ملخص التقرير
معلومات إضافية حول تصميم البحث متاحة في ملخص تقارير مجموعة نيتشر المرتبط بهذه المقالة.
توفر البيانات
البيانات المستخدمة في هذه الدراسة متاحة في بيانات المصدر وعلى الإنترنت في قاعدة بيانات زينودو (https://doi.org/10.5281/zenodo.10374039تم توفير بيانات المصدر مع هذه الورقة.
Sanderman, J., Hengl, T. & Fiske, G. J. Soil carbon debt of 12,000 years of human land use. Proc. Natl Acad. Sci. 114, 9575-9580 (2017).
Ma, Y. et al. Global crop production increase by soil organic carbon. Nat. Geosci. 16, 1159-1165 (2023).
Oldfield, E. E., Bradford, M. A. & Wood, S. A. Global meta-analysis of the relationship between soil organic matter and crop yields. SOIL 5, 15-32 (2019).
Lal, R. Enhancing crop yields in the developing countries through restoration of the soil organic carbon pool in agricultural lands. Land Degrad. Dev. 17, 197-209 (2006).
Vendig, I. et al. Quantifying direct yield benefits of soil carbon increases from cover cropping. Nat. Sustain. 6, 1125-1134 (2023).
Vitousek, P. M. et al. Nutrient Imbalances in Agricultural Development. Science 324, 1519-1520 (2009).
Beillouin, D. et al. A global meta-analysis of soil organic carbon in the Anthropocene. Nat. Commun. 14, 3700 (2023).
Liu, B. et al. Co-benefits for net carbon emissions and rice yields through improved management of organic nitrogen and water. Nat. Food 5, 241-250 (2024).
Tang, B., Rocci, K. S., Lehmann, A. & Rillig, M. C. Nitrogen increases soil organic carbon accrual and alters its functionality. Glob. Change Biol. 29, 1971-1983 (2023).
Cai, A. et al. Manure acts as a better fertilizer for increasing crop yields than synthetic fertilizer does by improving soil fertility. Soil Tillage Res. 189, 168-175 (2019).
Kazanski, C. E., Riggs, C. E., Reich, P. B. & Hobbie, S. E. Long-term nitrogen addition does not increase soil carbon storage or cycling across eight temperate forest and grassland sites on a sandy outwash plain. Ecosystems 22, 1592-1605 (2019).
Rocci, K. S., Lavallee, J. M., Stewart, C. E. & Cotrufo, M. F. Soil organic carbon response to global environmental change depends on its distribution between mineral-associated and particulate organic matter: a meta-analysis. Sci. Total Environ. 793, 148569 (2021).
Eisenstein, M. Natural solutions for agricultural productivity. Nature 588, S58-S59 (2020).
Neal, A. L. et al. Arable soil nitrogen dynamics reflect organic inputs via the extended composite phenotype. Nat. Food 4, 51-60 (2023).
Cambardella, C. A. & Elliott, E. T. Particulate soil organic-matter changes across a grassland cultivation sequence. Soil Sci. Soc. Am. J. 56, 777-783 (1992).
Kleber, M. et al. Mineral-organic associations: formation, properties, and relevance in soil environments. Adv., Agron. 130, 1-140 (2015).
Cotrufo, M. F., Ranalli, M. G., Haddix, M. L., Six, J. & Lugato, E. Soil carbon storage informed by particulate and mineral-associated organic matter. Nat. Geosci. 12, 989-994 (2019).
Ge, T. et al. Tracking the photosynthesized carbon input into soil organic carbon pools in a rice soil fertilized with nitrogen. Plant Soil 392, 17-25 (2015).
Cotrufo, M. F. & Lavallee, J. M. Soil organic matter formation, persistence, and functioning: a synthesis of current understanding to inform its conservation and regeneration. Adv., Agron. 172, 1-66 (2022).
Fohrafellner, J. et al. Cover crops affect pool specific soil organic carbon in cropland – a meta-analysis. Eur. J. Soil Sci. 75, e13472 (2024).
Clayton, J., Lemanski, K. & Bonkowski, M. Shifts in soil microbial stoichiometry and metabolic quotient provide evidence for a critical tipping point at 1% soil organic carbon in an agricultural postmining chronosequence. Biol. Fertil. Soils 57, 435-446 (2021).
Allen, A. P. & Gillooly, J. F. Towards an integration of ecological stoichiometry and the metabolic theory of ecology to better understand nutrient cycling. Ecol. Lett. 12, 369-384 (2009).
Yang, L. et al. Microbial life-history strategies mediate microbial carbon pump efficacy in response to N management depending on stoichiometry of microbial demand. Glob. Change Biol. 30, e17311 (2024).
Yuan, X. et al. Linkages of stoichiometric imbalances to soil microbial respiration with increasing nitrogen addition: Evidence from a long-term grassland experiment. Soil Biol. Biochem. 138, 107580 (2019).
Zechmeister-Boltenstern, S. et al. The application of ecological stoichiometry to plant-microbial-soil organic matter transformations. Ecol. Monogr. 85, 133-155 (2015).
. et al. Impact of nitrogen addition on plant-soil-enzyme C-N-P stoichiometry and microbial nutrient limitation. Soil Biol. Biochem. 170, 108714 (2022).
Ye, C. et al. Reconciling multiple impacts of nitrogen enrichment on soil carbon: plant, microbial and geochemical controls. Ecol. Lett. 21, 1162-1173 (2018).
Tian, D. & Niu, S. A global analysis of soil acidification caused by nitrogen addition. Environ. Res. Lett. 10, 024019 (2015).
Lu, X. et al. Nitrogen addition stimulates soil aggregation and enhances carbon storage in terrestrial ecosystems of China: A meta-analysis. Glob. Change Biol. 27, 2780-2792 (2021).
Wang, H. et al. Alterations in substrate stoichiometry control the responses of soil diazotrophs to nutrient enrichment. Soil Biol. Biochem. 179, 108975 (2023).
Chen, J. et al. A keystone microbial enzyme for nitrogen control of soil carbon storage. Sci. Adv. 4, eaaq1689 (2018).
Bonner, M. T. L. et al. Why does nitrogen addition to forest soils inhibit decomposition? Soil Biol. Biochem. 137, 107570 (2019).
Floudas, D. et al. The Paleozoic origin of enzymatic lignin decomposition reconstructed from 31 fungal genomes. Science 336, 1715-1719 (2012).
Man, M., Deen, B., Dunfield, K. E., Wagner-Riddle, C. & Simpson, M. J. Altered soil organic matter composition and degradation after a decade of nitrogen fertilization in a temperate agroecosystem. Agric. Ecosyst. Environ. 310, 107305 (2021).
Yu, F., Zhang, W., Hou, X., Li, Y. & Tong, J. How nutrient loads influence microbial-derived carbon accumulation in wetlands:
new insight from microbial metabolic investment strategies. Environ. Res. 217, 114981 (2023).
Even, R. J. & Francesca Cotrufo, M. The ability of soils to aggregate, more than the state of aggregation, promotes protected soil organic matter formation. Geoderma 442, 116760 (2024).
Lehmann, A., Zheng, W. & Rillig, M. C. Soil biota contribution to soil aggregation. Nat. Ecol. Evol. 1, 1828-1835 (2017).
Yudina, A. & Kuzyakov, Y. Dual nature of soil structure: The unity of aggregates and pores. Geoderma 434, 116478 (2023).
Begill, N., Don, A. & Poeplau, C. No detectable upper limit of mineral-associated organic carbon in temperate agricultural soils. Glob. Change Biol. 29, 4662-4669 (2023).
Matus, F. J. Fine silt and clay content is the main factor defining maximal C and N accumulations in soils: a meta-analysis. Sci. Rep. 11, 6438 (2021).
Matus, F. J. et al. Upper limit of mineral-associated organic carbon in temperate and sub-tropical soils: How far is it? Geoderma Reg. 37, e00811 (2024).
García-Palacios, P. et al. Dominance of particulate organic carbon in top mineral soils in cold regions. Nat. Geosci. 17, 145-150 (2024).
Wu, J. et al. Particulate organic carbon is more sensitive to nitrogen addition than mineral-associated organic carbon: A meta-analysis. Soil Tillage Res. 232, 105770 (2023).
Villarino, S. H., Pinto, P., Jackson, R. B. & Piñeiro, G. Plant rhizodeposition: a key factor for soil organic matter formation in stable fractions. Sci. Adv. 7, eabd3176 (2021).
Liang, G., Stark, J. & Waring, B. G. Mineral reactivity determines root effects on soil organic carbon. Nat. Commun. 14, 4962 (2023).
Cui, Y. et al. Stoichiometric models of microbial metabolic limitation in soil systems. Glob. Ecol. Biogeogr. 30, 2297-2311 (2021).
Zhang, T., Chen, H. Y. H. & Ruan, H. Global negative effects of nitrogen deposition on soil microbes. ISME J. 12, 1817-1825 (2018).
Fierer, N. et al. Comparative metagenomic, phylogenetic and physiological analyses of soil microbial communities across nitrogen gradients. ISME J. 6, 1007-1017 (2012).
Rui, Y. et al. Persistent soil carbon enhanced in Mollisols by wellmanaged grasslands but not annual grain or dairy forage cropping systems. Proc. Natl Acad. Sci. 119, e2118931119 (2022).
Niu, B. et al. pH: A core node of interaction networks among soil organo-mineral fractions. Environ. Int. 178, 108058 (2023).
Mao, H. et al. Dual role of silt and clay in the formation and accrual of stabilized soil organic carbon. Soil Biol. Biochem. 192, 109390 (2024).
Cotrufo, M. F., Wallenstein, M. D., Boot, C. M., Denef, K. & Paul, E. The Microbial Efficiency-Matrix Stabilization (MEMS) framework integrates plant litter decomposition with soil organic matter stabilization: do labile plant inputs form stable soil organic matter? Glob. Change Biol. 19, 988-995 (2013).
Lu, X. et al. Nitrogen deposition accelerates soil carbon sequestration in tropical forests. Proc. Natl Acad. Sci. 118, e2020790118 (2021).
Lessmann, M., Ros, G. H., Young, M. D. & de Vries, W. Global variation in soil carbon sequestration potential through improved cropland management. Glob. Change Biol. 28, 1162-1177 (2022).
Xu, Y. et al. Nitrogen addition-driven soil organic carbon stability depends on the fractions of particulate and mineral-associated organic carbon. Nutr. Cycl. Agroecosyst. 128, 269-281 (2024).
Houlton, B. Z. et al. A world of cobenefits: solving the global nitrogen challenge. Earth’s. Future 7, 865-872 (2019).
Guenet, B. et al. Can emissions offset the benefits from soil organic carbon storage? Glob. Change Biol. 27, 237-256 (2021).
Gao, Y. & Cabrera Serrenho, A. Greenhouse gas emissions from nitrogen fertilizers could be reduced by up to one-fifth of current
levels by 2050 with combined interventions. Nat. Food https://doi. org/10.1038/s43016-023-00698-w (2023).
Liu, F. et al. Divergent changes in particulate and mineralassociated organic carbon upon permafrost thaw. Nat. Commun. 13, 5073 (2022).
Lugato, E., Lavallee, J. M., Haddix, M. L., Panagos, P. & Cotrufo, M. F. Different climate sensitivity of particulate and mineral-associated soil organic matter. Nat. Geosci. 14, 295-300 (2021).
Chen, X. et al. Integrated soil-crop system management for food security. Proc. Natl Acad. Sci. 108, 6399-6404 (2011).
Vance, E. D., Brookes, P. C. & Jenkinson, D. S. An extraction method for measuring soil microbial biomass C. Soil Biol. Biochem. 19, 703-707 (1987).
Tian, J. et al. Microbially mediated mechanisms underlie soil carbon accrual by conservation agriculture under decade-long warming. Nat. Commun. 15, 377 (2024).
German, D. P. et al. Optimization of hydrolytic and oxidative enzyme methods for ecosystem studies. Soil Biol. Biochem. 43, 1387-1397 (2011).
Moorhead, D. L., Sinsabaugh, R. L., Hill, B. H. & Weintraub, M. N. Vector analysis of ecoenzyme activities reveal constraints on coupled C, N and P dynamics. Soil Biol. Biochem. 93, 1-7 (2016).
Chen, L. et al. Regulation of priming effect by soil organic matter stability over a broad geographic scale. Nat. Commun. 10, 5112 (2019).
Poeplau, C. et al. Isolating organic carbon fractions with varying turnover rates in temperate agricultural soils – A comprehensive method comparison. Soil Biol. Biochem. 125, 10-26 (2018).
Otto, A. & Simpson, M. J. Evaluation of CuO oxidation parameters for determining the source and stage of lignin degradation in soil. Biogeochemistry 80, 121-142 (2006).
Zhang, X. & Amelung, W. Gas chromatographic determination of muramic acid, glucosamine, mannosamine, and galactosamine in soils. Soil Biol. Biochem. 28, 1201-1206 (1996).
Liang, C., Amelung, W., Lehmann, J. & Kästner, M. Quantitative assessment of microbial necromass contribution to soil organic matter. Glob. Change Biol. 25, 3578-3590 (2019).
Joergensen, R. G. Amino sugars as specific indices for fungal and bacterial residues in soil. Biol. Fertil. Soils 54, 559-568 (2018).
Six, J., Elliott, E. T., Paustian, K. & Doran, J. W. Aggregation and soil organic matter accumulation in cultivated and native grassland soils. Soil Sci. Soc. Am. J. 62, 1367-1377 (1998).
Chen, L. et al. Soil carbon persistence governed by plant input and mineral protection at regional and global scales. Ecol. Lett. 24, 1018-1028 (2021).
Zhou, R. et al. Microbial necromass in cropland soils: A global metaanalysis of management effects. Glob. Change Biol. 29, 1998-2014 (2023).
Berdugo, M. et al. Global ecosystem thresholds driven by aridity. Science 367, 787-790 (2020).
Gross, N. et al. Unforeseen plant phenotypic diversity in a dry and grazed world. Nature 632, 808-814 (2024).
Fong, Y., Huang, Y., Gilbert, P. B. & Permar, S. R. chngpt: Threshold regression model estimation and inference. BMC Bioinf. 18, 1-7 (2017).
Koricheva, J. & Gurevitch, J. Uses and misuses of meta-analysis in plant ecology. J. Ecol. 102, 828-844 (2014).
Prairie, A. M., King, A. E. & Cotrufo, M. F. Restoring particulate and mineral-associated organic carbon through regenerative agriculture. Proc. Natl Acad. Sci. 120, e2217481120 (2023).
شكر وتقدير
تم دعم هذه الدراسة من قبل المؤسسة الوطنية للعلوم الطبيعية في الصين (أرقام المنح: U23A20158 و32071629، ج.ت.) البرنامج الوطني الرئيسي للبحث والتطوير في الصين (2023YFD1901500، 2022YFD1901300، ج.ت.)، برنامج تطوير المواهب 2115 في جامعة الزراعة الصينية والتخصصات المتقدمة في بكين (ف.س.ز). يقر م.د-ب. بالدعم من TED2021-130908B-C41/AEI/10.13039/501100011033/الاتحاد الأوروبي NextGenerationEU/PRTR ومن وزارة العلوم والابتكار الإسبانية لمشروع I + D + i PID2O20-115813RA-IOO الممول من MCIN/AEI/10.13039/501100011033. يقر ي. كوزياك بدعم وزارة التعليم والعلوم والرياضة في جمهورية ليتوانيا ومجلس البحث الليتواني (LMTLT) تحت برنامج ‘مبادرة تميز الجامعات’ مشروع ‘تطوير مركز أبحاث الاقتصاد الحيوي للتميز’ (BioTEC) (رقم S-A-UEI-23-14).
مساهمات المؤلفين
ساهم جميع المؤلفين بمساهمات فكرية ومساعدة في هذه الدراسة وإعداد المخطوطة. صمم ج.ت. وX.P.C. الفكرة الأصلية واستراتيجية التجربة. جمع ج.ل. وR.R.Z. البيانات. قام ج.ل. بتحليل البيانات. نفذ Q.G. وY.X.C. وS.C.Y. وW.S.Z. التجربة الميدانية. قام ج.ل. وJ.A.J.D. وM.D.B. وY.K. وZ.L.C. وF.S.Z. وX.P.C. وJ.T. بصياغة المخطوطة وشارك جميع المؤلفين في المراجعات النقدية ومنحوا الموافقة النهائية للنشر.
ملاحظة الناشر: تظل Springer Nature محايدة فيما يتعلق بالمطالبات القضائية في الخرائط المنشورة والانتماءات المؤسسية.
الوصول المفتوح: هذه المقالة مرخصة بموجب رخصة المشاع الإبداعي للاستخدام والمشاركة والتكيف والتوزيع وإعادة الإنتاج في أي وسيلة أو صيغة، طالما أنك تعطي الائتمان المناسب للمؤلفين الأصليين والمصدر، وتوفر رابطًا لرخصة المشاع الإبداعي، وتوضح ما إذا تم إجراء تغييرات. الصور أو المواد الأخرى من طرف ثالث في هذه المقالة مشمولة في رخصة المشاع الإبداعي للمقالة، ما لم يُشار إلى خلاف ذلك في سطر الائتمان للمادة. إذا لم تكن المادة مشمولة في رخصة المشاع الإبداعي للمقالة وكان استخدامك المقصود غير مسموح به بموجب اللوائح القانونية أو يتجاوز الاستخدام المسموح به، ستحتاج إلى الحصول على إذن مباشرة من صاحب حقوق الطبع والنشر. لعرض نسخة من هذه الرخصة، قم بزيارة http://creativecommons.org/licenses/by/4.0/.
المختبر الوطني الرئيسي لاستخدام وإدارة المغذيات، كلية الموارد والعلوم البيئية، جامعة الزراعة الصينية، 100193 بكين، جمهورية الصين الشعبية.الجغرافيا، كلية البيئة والعلوم والاقتصاد، جامعة إكستر، شارع رين، إكستر EX4 4RJ، المملكة المتحدة.مركز إدارة الكربون، كلية SRUC-اسكتلندا الريفية، إدنبرة EH9 3JG، المملكة المتحدة.مختبر التنوع البيولوجي وعمل النظام البيئي، معهد الموارد الطبيعية والزراعة الحيوية في إشبيلية (IRNAS)، CSIC، 41012 إشبيلية، إسبانيا.كلية الموارد والبيئة، أكاديمية العلوم الزراعية، مركز البحث متعدد التخصصات للتنمية الخضراء في حوض نهر اليانغتسي، جامعة جنوب غرب، 400715 تشونغتشينغ، الصين.كلية الموارد والبيئة، جامعة جيلين الزراعية، 130118 تشانغتشون، الصين.كلية الموارد والبيئة، جامعة سيتشوان الزراعية، 611134 تشنغدو، الصين.معهد البيئة والتكنولوجيا الصناعية، جامعة شانشي الزراعية، 030031 تاييوان، الصين.قسم علوم التربة للأنظمة البيئية المعتدلة، جامعة غوتنغن، 37077 غوتنغن، ألمانيا.معهد أبحاث الاقتصاد الحيوي، جامعة فيتاوتاس ماغنوس، أكاديمية الزراعة، منطقة كاوناس، ليتوانيا. البريد الإلكتروني: chenxp2017@swu.edu.cn; tianj@igsnrr.ac.cn
Soil organic carbon thresholds control fertilizer effects on carbon accrual in croplands worldwide
Received: 20 August 2024
Accepted: 7 March 2025
Published online: 27 March 2025
Check for updates
Jun Ling (1) , Jennifer A. J. Dungait , Manuel Delgado-Baquerizo , Zhenling Cui , Ranran Zhou , Wushuai Zhang , Qiang Gao , Yuanxue Chen , Shanchao Yue , Yakov Kuzyakov , Fusuo Zhang , Xinping Chen & Jing Tian (1) –
Initiatives to restore soil fertility and mitigate global warming rely on rebuilding soil organic carbon (SOC). Nitrogen (N) fertilization is crucial for crop yields but affects SOC unpredictably due to varying responses of particulate organic carbon (POC) and mineral-associated organic carbon (MAOC) pools to initial SOC levels. To clarify these effects, here, by combining a global meta-analysis with continental-scale field experiments, we determine that an initial SOC threshold of controls the effect of N fertilization on POC and MAOC. In SOC-poor soils ( ), N fertilizer increases plant-derived C inputs and promotes soil aggregation, favouring POC accumulation. Conversely, in SOC-rich soils, N fertilizer stimulates microbial metabolic efficiency, leading to larger necromass production and stabilization by mineral protection, observed as more pronounced MAOC accrual. Our findings reveal how SOC thresholds shape the response of active and stable carbon pools to N fertilization, with consequences for SOC accrual in cropland soils globally.
Arable lands have lost up to half of organic carbon (C) stocks since the Industrial Revolution, with a cumulative depletion nearing 62 Pg C , limiting soil fertility and threatening food security . Soils depleted in organic C by intensive agriculture are often regarded as a potential global C sink. Building SOC in croplands is a challenging task which is, however, essential to restore soil functionality and ensure food production . Nitrogen (N) fertilization is essential for agricultural productivity to meet the human demand for food , but can strongly affect SOC dynamics . In general, N fertilization facilitates the
production of plant biomass, increasing C inputs to soil that should increase SOC . However, variable responses of SOC accrual to N addition are reported, ranging from decreases to no change to increases . The wide variation in the response of SOC to N fertilization has important implications for safeguarding soils to meet both Sustainable Development Goal (SDG) 2 (Zero Hunger) and SDG 13 (Climate Action) under current circumstances that require increased food production, optimizing fertilizer use and increasing C capture/ storage . Understanding anthropogenic impacts on SOC is assisted
by considering the total SOC pool as a combination of particulate organic carbon (POC) and mineral-associated organic carbon (MAOC) that differ broadly in their chemical composition, turnover, and ecological functioning . Where N availability to plants is limited, N -induced increases plant C inputs into soils is a necessary first step to SOC regeneration . However, simply increasing the precursor materials is not sufficient to achieve long-term soil C sequestration: protection of the newly formed SOC from decomposition is crucial to ensure its long-term persistence. Therefore, understanding the mechanisms underlying variation in the response of SOC pools and its functionality to N fertilizer is now critical.
Initial SOC content has recently emerged as an important factor that modifies the responses of POC and MAOC pools to N fertilization via direct effects on microbial metabolism and indirect effects on soil physico-chemical and mineralogical traits . Ecological stoichiometry theory (EST) predicts that the growth and reproduction of microbial communities are driven by microbial demand and resource supplies . Fertilizer N inputs to SOC-poor soils may cause an stoichiometric imbalance (low C: high N) between microbial demands and soil resource availability, leading to the reallocation of a greater proportion of the substrate to maintenance metabolism , observed as elevated microbial respiration . In contrast, fertilizer N inputs to SOCrich soil satisfy microbial nutrient demand , stimulate microbial activity by providing nutrients and energy to both accelerate decomposition of plant residues and invest in the synthesis of microbial biomass and, subsequently, necromass production . The accumulation of microbial necromass C and its stabilization as MAOC is also contingent on wider soil geochemical properties that could undergo significant changes that might be substantially altered by N fertilizer application . SOC-rich soils buffer N -induced acidification due to the cation exchange capacity (CEC) of soil organic matter, at the cost of increased leaching of base cations (e.g., and ) and greater solubility of hydrolyzed cations (e.g., and ) . Compared to finer-textured (clayey) soils, coarse-textured (sandy) soils tend to be C-poor with smaller CEC and thus poorer buffering capacity against cation leaching caused by N fertilizer use . Variations in mineral cation chemistry influence adsorption and co-precipitation reactions with organic compounds in soils, including those derived from microbial necromass, causing variation in the effect of N fertilizer on MAOC formation . Additionally, N fertilizer may strengthen macroaggregate formation by stimulating root and mycorrhizal growth, which, together with plant-derived C, contribute to POC pool and its stabilization as intra-aggregate . Therefore, the relationship between initial SOC and functional pools responses to N fertilization incorporates myriad variations of complex interactions between multiple mechanistic drivers, including microbial metabolic and geochemical factors that affect the balance between POC and MAOC pools. Assessing the relationship between initial SOC and C sequestration in response to fertilization is critical to better forecast the changes in POC and MAOC pools in a changing world.
Herein, we combined a global meta-analysis with new data from decades-long continental-scale N fertilization field experiments in four sites across China (Fig. 1a and Supplementary Fig. 1) to investigate how initial SOC content may interact with N fertilization to influence the SOC accrual of global cropland soils. We hypothesized: 1) N fertilization promotes plant productivity and macroaggregate formation, and thereby increases POC accumulation and stabilization; 2) an imbalance between resource stoichiometry and microbial nutrient demand in SOC-poor soils hinders the formation of microbial necromass C and the decomposition of POC, weakening MAOC accrual; 3) Greater microbial metabolic efficiency and necromass production coupled with mineral protection, all of which increase MAOC in SOC-rich soils under increased N availability. Here, we address these hypotheses using two comprehensive approaches: a global meta-analysis of POC and MAOC contents from 118 fertilization experiments, and the
analysis of four coordinated long-term field experiments with N fertilization to further evaluate the underlying mechanisms, including plant input, microbial transformation, and protection by aggregate and minerals. We identified a critical soil carbon threshold (i.e., ) controlling the influence of N fertilization on C sequestration. Below this C threshold, the sequestration in response to fertilization tends towards the formation of POC derived directly from plant C , while surpassing this point shifts the balance towards MAOC accumulation derived from soil microorganisms. By identifying how specific SOC components respond to N fertilization and how carbon thresholds influence these responses through plant-microbe-soil interactions, this study paves the way for more targeted, effective soil management strategies that can bolster global food security while combating climate change.
Results
Fertilizer impacts on POC and MAOC depend on initial SOC in global croplands
To determine whether initial SOC content affects global changes of POC and MAOC in response to N fertilization, we compiled a database including 609 paired observations of POC and MAOC changes from 118 field sites worldwide (Fig. 1a), covering a very wide range of initial SOC content ( ; 0.79 to 46.1 ). Overall, POC had negative, neutral and positive responses to N addition (average effect size ); while MAOC had negative, neutral and positive responses to N addition (average effect size ; Supplementary Fig. 2). To help explain changes in POC and MAOC responses to N fertilizer and drivers underlying, we considered 8 climatic, management and edaphic variables as moderators. Variance partition analysis showed that the relative importance of edaphic properties and management practices were higher than that of climate conditions (Supplementary Fig. 3). Among them, significant predictors in our model included individual effects of initial SOC, N fertilizer and their interactions ( ; Supplementary Fig. 4), suggesting that the N fertilization on POC and MAOC was modulated by initial SOC levels across different regions. The result showed that the nonlinear model was more suitable for POC and MAOC to initial C content (Supplementary Fig. 5 and Supplementary Table 1), which indicated that there were SOC thresholds where abrupt changes occurred.
Further threshold analysis assessed the responses of POC and MAOC to various initial SOC contents, identifying specific SOC levels at which their responses exhibited abrupt changes. By comparing six nonlinear models, we found that the N-induced POC and MAOC changes responded in a stegmented manner to increases in initial SOC content (Supplementary Table 1). Specifically, abrupt changes in POC and MAOC occurred over a small range of initial C content of (Fig. 1b, c). A sharp rise in POC was detected before an initial C content of and then slightly decreased (Fig. 1b). However, at low levels of initial C, MAOC decreased abruptly. Once a threshold was crossed, MAOC slightly decreased as SOC increased (Fig. 1c). This notion is further supported by heterogeneity analysis, demonstrating clear differences in the POC and MAOC responses before and after reaching the SOC threshold under N addition for POC; for MAOC; Fig. 1d, e). Note that the POC increase under N fertilization was more important before the threshold than afterward, whereas the MAOC response followed the opposite trend.
Divergent responses of POC and MAOC to a decade of N addition in experimental sites
To disentangle the potential mechanisms behind how initial SOC content influenced N -induced POC and MAOC changes, we collected soil samples from four coordinated long-running field N fertilizer experiments network (Supplementary Fig. 1). These
Fig. 1 | Global distribution of study sites and the interactions between nitrogen fertilization and initial soil organic carbon (SOC)on particulate organic carbon and mineral-associated organic carbon (POC and MAOC) in global cultivated upland soil. a Global distribution of study sites. b-e nonlinear responses of POC and MAOC attributes to initial soil organic carbon content. In black longdashed lines represent the smoothed trend fitted by a generalized additive model and blue solid lines represent the linear fits at both sides of each threshold. Inset red numbers and the vertical dashed lines describe the initial SOC identified. Violin
diagrams show bootstrapped slopes or values of the predicted fitted trend at the threshold of the two regressions existing at each side of the threshold (green: before the threshold; brown, after the threshold). Significant (between-group heterogeneity) indicates that the response ratios differ between before and after the threshold of SOC ( ). Basemap in (a) from Natural Earth (https://www. naturalearthdata.com/). The coastline boundaries in the map are derived from the GSHHG database (https://www.ngdc.noaa.gov/mgg/shorelines/data/gshhg/ latest/). Source data are provided as a Source Data file.
experiments were located in four cropland sites with different initial SOC contents: Quzhou ( ), Changwu ( ), Siping (SP, ) and Yaan (YA, ). A decade of N fertilizer affected SOC fractions across four sites ( ; Supplementary Table 2). The optimized and high N treatments (OPT and HN) increased POC content at QZ and CW ( ), while increased MAOC content at the SP and YA ( ; Supplementary Fig. 6). Given the consistent results from both OPT and HN, we merged these findings under ‘ N fertilizer effects’ in our analysis, enhancing interpretability for readers. Interestingly, the responses of POC and MAOC contents to N fertilizer divided the four sites into two categories: POC accumulation response and MAOC accumulation response (Fig. 2). Along with individual effects of N fertilizer and initial SOC content, there were interactive effects of Initial C content on SOC functional pools ( ; Supplementary
Table 2), suggesting that changes of POC and MAOC contents to N addition strongly depended on initial SOC content. Based on the results of the meta-analysis, the initial SOC threshold for the mutation of POC and MAOC was determined to be between . The initial SOC content of QZ and CW was found to be less than , while that of SP and YA was greater than . Consequently, the soils at the four points were classified into two categories: C-poor soils and C-rich soils. Notably, a strong contrast exists in the changes of POC and MAOC contents between C-poor and C -rich soils (Fig. 2b, d). Further analysis revealed that N fertilizer had positive effect on POC content in C-poor soils, demonstrating an average increase of compared to the soil without N fertilization (NO) ( ; Fig. 2a, b). However, N addition increased MAOC content by in C-rich soils relative to NO ( ; Fig. 2c, d).
Fig. 2 | Effects of long-term nitrogen fertilization on carbon pools across four field experiments, with results categorized into -poor and -rich soils from four sites. a, c Effects of N fertilization on POC and MAOC across four field experiments. Asterisk indicate a statistical significance of the effect based on nonparametric Wilcoxon test using the Benjamini and Hochberg method ( for NO, for N). b, d Effects of N fertilization on POC and MAOC in both C -poor and rich soils. The estimated effect sizes are regression coefficients based on rescaled response variables (with zero mean and unit standard deviation)
in the linear mixed-effects model. The points and shades represent mean ± s.e.m. of effect sizes in B and D. Statistical significance is based on Wald type II tests, and CI not overlapping zero indicated significant. POC: particulate organic carbon; MAOC: mineral-associated organic carbon. NO: control (No N addition); N: N addition (results of combining optimized N addition and high N addition). C -poor: combining QZ and CW results; C-rich: combining SP and YA results. Source data are provided as a Source Data file.
Plant-microbe-soil matrix interactions underpin contrasting responses of POC and MAOC to N fertilization in C-poor and C-rich soils
To investigate the underlying mechanisms in governing the dynamics of POC and MAOC contents in response to N fertilizer, we analyzed a set of variables associated with C pools, including plant and microbial biomarkers, soil microbial properties, aggregate and mineral protection as well as SOC chemical composition. As compared to NO, N fertilizer increased root biomass in C-poor ( ) and C-rich ( ) soils, respectively ( ; Fig. 3a and Supplementary Fig. 7). N fertilizer altered both lignin phenols and necromass C , depending on initial C content ; Supplementary Table 2). As compared to NO, N fertilizer increased lignin phenols by but decreased microbial necromass C in C-poor soils ( ; Fig. 3a and Supplementary Fig. 8). Lignin phenols and microbial necromass C had contrasting responses to N fertilizer in C-rich soils: lignin phenols exhibited a negative response, while microbial necromass C showed a positive response ( ; Fig. 3a and Supplementary Fig. 8). Consequently, N fertilizer increased microbial necromass C by compared by NO, confirming the accumulation of MAOC in C-rich soils ( ; Fig. 3a).
Microbial properties associated with C transformation exhibited pronounced contrastive effects in response to N fertilizer between the C-poor and C-rich soils ( ; Fig. 3a and Supplementary Table 2). Specifically, N fertilizer aggregated microbial C limitation, relative to NO in C-poor soils ( ; Fig. 3a and Supplementary Fig. 9). By contrast, N fertilizer alleviated microbial C and resources limitation, leading to decrease of microbial metabolic quotient ( ) in C-rich soils ( ; Fig. 3a and Supplementary Fig. 10), indicating a more efficient microbial growth. Additionally, N addition reduced the oxidases (phenol oxidase and peroxidase) by relative to NO ( ; Fig. 3a and Supplementary Table. 3). We then measured the mean weight diameter (MWD) of aggregates and the content of exchangeable cations to quantify SOC protection by aggregates and minerals, respectively. The fertilization effects on aggregate stability and mineral protection often depended on initial SOC ( ; Supplementary Table 2). N fertilizer had a positive effect on MWD in C-poor soils ( increase), but decreased in C-rich soils ( ;
Fig. 3a and Supplementary Fig. 11). In contrast, N fertilizer enhanced the content of Fe and Al oxides in C -rich soils, thereby augmenting the soil’s mineral protection capacity ( ; Fig. 3a and Supplementary Fig. 11). -NMR spectroscopy analysis further showed that N fertilizer increased aliphaticity and recalcitrance from to in C-rich soils, indicating that N may contribute to the stabilization of organic carbon in such soils ( ; Fig. 3a and Supplementary Table 4).
Partial correlation analysis showed that, in C-poor soils, despite the significant correlations between POC and the four types of factors (i.e., SOC origin, microbial transformation, stability and structure; zero-order in Fig. 3b), the correlation coefficients of POC and decreased by after controlling for the SOC origin (Fig. 3b). By contrast, root biomass and MWD were always closely related to the POC in C-poor soils ( ; Fig. 3d), even after controlling for the other three or two types of factors. Specifically, increasing root biomass and MWD was coupled with increasing POC ( ; ) in C-poor soils (Fig. 3d). In C-rich soils, after controlling SOC stability, the correlation coefficients between MAOC and C origin (characterized by plant C input and biomarkers) became insignificant (Fig. 3c). Moreover, the root biomass and consistently increased with the MAOC (Fig. 3e; ; ). Accordingly, plant C input was the single control in all soils, exerting strong positive effects on POC and MAOC. Physical protection and mineral protection were strongly associated with POC accumulation in C-poor soils and MAOC accumulation in C-rich soils, respectively (Fig. 3).
Changes in global farmland POC and MAOC under current N fertilization scenarios
Briefly, after the standard process of model metric evaluation (Supplementary Table 5), the optimized gradient-boosting decision trees model was chosen as the optimal model for POC and MAOC. We then applied our predictive model to scale up the site-level observations across the globe at a resolution to quantify changes in POC and MAOC under current N fertilizer application rate relative to a nofertilization scenario. Over the past decade, our global estimates indicate that the application of N fertilizer has led to an average increase in POC and MAOC by and , respectively
Fig. 3 | Effects of long-term nitrogen fertilization on the origin, transformation, and stability of carbon pools, as well as key indicators of carbon pool dynamics. a Effects of N fertilization on SOC origin (root biomass, lignin phenols and microbial necromass C ), microbial transformation ( , oxidase, , resource limitation and C limitation), SOC physical and biochemical stability (aggregate stability, and ) and structure (Aliphaticity and Recalcitrance) between C -poor and C -rich soils and their difference. The estimated effect sizes are regression coefficients based on rescaled response variables (with zero mean and confidence intervals) in the linear mixed-effects model. The points and shades represent mean ± s.e.m. of effect sizes. Statistical significance is based on Wald type II tests, and not overlapping zero indicated significant. Filled circles represent significant effects by N fertilizer ( ). b, c Partial correlations between POC of C-poor soils and MAOC of C-rich soils with four types of factors (SOC origin (OR), microbial transformation (TS), SOC physical and mineral stability (SA) and structure (ST)). The outermost circle represents the factors (i.e., OR, TS, SA and ST) under examination for their correlations with POC or MAOC. The color of the fan shapes signifies the strength and direction of the correlation, with a black frame indicating statistical significance at the 0.05 level. Distinctions in color between the zero-order (Zero) and controlled
factors indicate the extent of dependency of the correlation between POC or MAOC and the examined factor on the controlled variable (no change in circle color between the controlled factor and zero-order = no dependency; a decrease/ increase in circle color intensity = loss/gain of correlation). d, e Correlations between POC in C-poor soils and MAOC in C-rich soils with key predictors. Solid line in each panel shows significant model fit using linear regression ( ), and the shading around the fitted line represents the confidence intervals. qCO2 ( ): metabolic quotient; : fungal-bacterial biomass ratio; MWD: aggregates mean weight diameter; : rly crystalline oxides; : organically complexed oxides; and : the molar ratios of exchangeable and . Aliphaticity: the ratio of the alkyl region divided by the O-alkyl region; Recalcitrance: the ratio of (alkyl + aromatic C)/ (O-alkyl + carboxyl C). POC: particulate organic carbon; MAOC: mineral-associated organic carbon. NO: control (No N addition); N : N addition (results of combining optimized N addition and high N addition). C-poor soils: combining Quzhou and Changwu results; C-rich soils: combining Siping and Yaan results. Some elements in (a) were created in BioRender. B, A. (2025) https://BioRender.com/b56q841. Source data are provided as a Source Data file.
(Fig. 4a and b). Moreover, we partitioned worldwide farmland into two categories based on SOC thresholds (SOC threshold of our metaanalysis data): C-poor and C-rich farmland. N fertilizer application increased POC by in C-poor soils and in C-rich soils, compared to unfertilized soils (Supplementary Fig. 12). However, the MAOC increase induced by fertilization was 7% in C-poor soils and 8% in C-rich soils (Supplementary Fig. 12). Across ecozones, we found that the beneficial impacts of N fertilizer on POC were greatest in the subtropical ( ), followed by temperate ( ) and boreal ( ), and least in tropical zones ( ; Supplementary Fig. 13). Specifically, substantial POC accrual due to fertilization is most evident in east Asia and north America. In contrast, the response of POC to fertilization in Africa was minimal or neutral. Our study revealed a relatively uniform enhancement in MAOC, induced by N fertilizer, across diverse ecozones, with increases varying between and . The temperate zone observed the most significant rise, whereas the tropical zone exhibited the smallest increase (Supplementary Fig. 13).
Discussion
Restoring SOC in agricultural land is pivotal for enhancing sustainable agricultural production and offering a viable strategy to mitigate
global warming . Soil carbon is not a uniform entity, differentiating it into POC and MAOC can help understand SOC formation and accrual, and thus provide more precise guidance for managers and policymakers. However, current assessments of the impact of N fertilizers on POC and MAOC depending on soil fertility levels are insufficient, which impedes the advancement of sustainable agriculture and the optimization of carbon sequestration benefits. Combining a global metaanalysis of published literature and experimental evidence from four experiments, we identified a critical soil C threshold (i.e., SOC) controlling the influence of N fertilization on C accrual. Below this crucial soil C threshold, C accrual in response to fertilization is inclined towards the formation of POC, while surpassing this point shifts the balance towards more MAOC accumulation (Fig. 1d, e). Initial SOC content affects N -induced changes in POC and MAOC through direct effects on plant C input and indirect effects on microbial transformation, physical and mineral protection (Fig. 5).
Utilizing systematic research and diverse viewpoints, this study delves into the mechanisms behind the formation of SOC functional components mediated by N fertilizer and initial C , systematically analyzing the sources, transformation processes, and stability of these components. In agricultural systems, crop yields are often increased
Fig. 4 | Maps of predicted spatial distribution of the impacts of current nitrogen fertilization rates on POC and MAOC changes (%) across global cultivated uplands and its latitudinal pattern, respectively. a Global map of changes in particulate organic carbon (POC) and its latitudinal distribution. Global map of changes in mineral-associated organic carbon (MAOC) changes and its latitudinal distribution. The inset on the right-hand side shows the latitudinal averages (black
line) and standard deviations (gray shading) of POC or MAOC. ” ” represents the percentage change in POC or MAOC under the current fertilization level compared to the unfertilized condition. Basemap in (a) from Natural Earth (https://www. naturalearthdata.com/). The coastline boundaries in the map are derived from the GSHHG database (https://www.ngdc.noaa.gov/mgg/shorelines/data/ gshhg/latest/). Source data are provided as a Source Data file.
by N fertilization, and both above- and belowground biomass and rootderived C inputs are generally larger . In C-poor soils, the increased POC was evidenced by larger root biomass and lignin phenols following N fertilization (Fig. 3a and d ), in agreement with hypothesis (1). Typically, an increase in plant C input catalyzes a corresponding upsurge in enzyme activities, attributable to the enriched availability of substrates that “fuel” microbial processes . In the present study, soil oxidase activities decreased slightly with N addition in C -poor soils (Supplementary Table 3), which is consistent with a recent metaanalysis that N addition suppressed the activity of lignin-decomposing enzymes , resulting in the accrual of plant residues as lignin macromolecules . Other than extracellular enzymes, microbial composition and classification also play a role in mediating lignin breakdown and subsequent POC formation. Fungal biomass and were increased under N fertilization (Fig. 3a; Supplementary Fig. 14), suggesting that microbial communities undergo a transition towards a fungus-dominated ecosystem to raise the efficient breakdown of lignin , also observed by Man et al. . Furthermore, according to EST, when N is abundant in C -poor soils, an imbalance between resource availability and microbial nutrient needs can lead to stoichiometric imbalance . This imbalance hinders the transformation of POC to MAOC because microbes, the primary mediators in synthesizing unstable C into MAOC, lead to higher POC retention . In addition to the aforementioned biological factors, soil aggregates play a pivotal role in the physical protection of POC (Fig. 3b, d) . We found that N fertilization increased the stability of soil aggregates (Fig. 3a), which may be a result of increased plant litter, rhizodeposition and fungi
biomass. The residues of litter and rhizodeposition have the capacity to bind with fungal hyphae and soil particles, leading to the formation of macroaggregates . Soil texture, alongside aggregate formation, is a key factor influencing C accumulation . Our meta-analysis indicated that clay and silt content strongly impact POC and MAOC accumulation (Supplementary Fig. 4). Heterogeneity analysis revealed that the effect size of POC is larger in clayey soils than clay loamy soils (Supplementary Fig. 15), as clay has more reactive sites for C adsorption . Overall, the net beneficial impact of N addition on POC in C-poor soils is dependent upon interactions among increased root biomass and lignin, alterations in extracellular enzyme activities, and robust soil aggregate protection (Fig. 5).
While global consensus on increasing C sequestration, especially slow-turnover pools (e.g., MAOC), has gained importance over the past decade, the direction and magnitude of changes in MAOC in response to N remain understudied . Here, we observed that N fertilization had particularly positive effect on MAOC in C-rich soils (Fig. 2c, d; Supplementary Fig. 6). We also observed that N fertilization increased newly formed microbial necromass, particularly facilitating the contribution of fungal necromass to the stable C pool (Fig. 3a and Supplementary Fig. 8). This indicates a shift in the trade-off between labile and stable SOC pools under N fertilization, which can be due to multiple overlapping mechanisms. First, the increase in root biomass and rhizodeposition induced by N fertilizer increased the availability of simple carbohydrates, which are more efficiently utilized to form microbial biomass and subsequently transformed into MAOC . Second, aligning with our second hypothesis, increased N availability
Fig. 5 | Conceptual diagram illustrating the fertilization effects on SOC and functional pools (POC and MAOC) as well as their regulation mechanisms through input origins, microbial transformation, and physical and chemical stabilization in C-poor and C-rich soils. Evidently, in C-poor soils with low SOC content, N fertilization facilitates the POC retention and increased SOC content, primarily through its influence on plant-derived C and protection within aggregates. Conversely, in C-rich soils with high SOC content, N fertilizer stimulated the
sequestration of MAOC and increased SOC by more efficient microbial C cycling (high metabolic efficiency and pump efficiency) and strong mineral protection mechanisms. The red path represents the primary mechanism by which nitrogen fertilizer affects carbon components under the current conditions. The direction of the arrow indicates the change in the variable (upward/increase; downward/ decrease), while a horizontal line represents no change. Some elements of this figure were created in BioRender. B, A. (2025) https://BioRender.com/i51j856.
can mitigate imbalances between microbial community and available resources in C-rich soils ( SOC), thereby alleviating microbial nutrient limitations and subsequently increasing necromass C production . Our study is comparable with previous reports that microorganisms are more C-limited and exhibit reduced metabolic efficiency, in soils with low soil SOC content ( ), as evidenced by elevated values . We also determined lower values under N addition in C-rich soils (Fig. 3a). Of course, microbial stoichiometric balance is influenced by variations in both C content and soil nutrient availability . While N fertilizer application rate can be a key factor influencing microbial metabolic responses to fertilization , the responses are not dependent on the amount of N applied , which aligns with our results (Supplementary Fig. 9). Third, analysis of extracellular enzymes provides evidence that elevated phenol oxidase and peroxidase activities may increase the potential of microbes to acquire C from SOC pools with slower turnover rates . The notable reduction in oxidase activities observed in this study may have shifted the microbial C acquisition strategies, ultimately contributing to an augmentation of MAOC under N addition (Fig. 3c, e). Finally, the adsorption of organic compounds onto mineral surfaces is a hallmark of C-rich soils, rendering these soils particularly susceptible to acidification driven by N fertilization . N fertilization had significant positive effect on mineral protection in C-rich soils in this study, primarily caused by increasing content of organic-aluminum/iron complexes ( and ; Fig. 3a). Specifically, N-induced acidification increased overall MAOC as a consequence of heightened mineral cations solubility and the subsequent formation of organo-metal complexes (Supplementary Fig. 11) . Our study demonstrates that C-rich soils that contain larger clay and silt fractions (such as those from SP and YA) with enhanced water-holding capacity support microbial biomass production and thereby microbial necromass formation . The large surface area of fine soil particles provides more mineral surfaces and reactive sites to stabilize microbial-derived C and
promote MAOC accumulation . Additionally, the augmented contribution of stable C to the SOC pool was evidenced by an increase in aliphaticity following N addition (Supplementary Table 4), since aliphaticity represents a comprehensive index for assessing chemically ‘recalcitrant’ compounds . Overall, N -induced MAOC accumulation in C-rich soils mainly resulted from accumulated necromass and increased stabilization on minerals (Figs. 2d and 3a). Our results together underscore the crucial role of root biomass, microbial properties and minerals as key predictors influencing the observed accumulation in MAOC levels following N addition in C-rich soils.
The ability to predict C pools and its functionality changes under current N fertilization can guide the optimal fertilization application of cropland-based climate solutions. Recent studies have forecasted a wide range of SOC responses to inorganic fertilizers, which differ in magnitude and . The uncertainty is, in part, attributed to the allocation of C into model pools that lack distinct biophysical definitions and exhibit varying sensitivities to N addition.
Based on our findings, the application of N fertilizer promoted the accrual of MAOC in C-rich arable soils (Supplementary Fig. 12), and could help combat the projected soil C losses from croplands to meet soil C sequestration targets. Several existing meta-analysis studies have also shown that fertilization slightly promoted MAOC accumulation . However, this strategy should be implemented with caution to mitigate potential global risks to the economy, environment, and public health . For instance, the benefits of increasing the MAOC sink may be partly offset by increased emissions, fossil energy and the associated greenhouse gas emissions during fertilizer manufacture . Considering the greenhouse gas emissions throughout the entire life cycle of N fertilizer, the global warming potential of fertilized soil remains greater than that of unfertilized soil . This trade-off is often necessitated by the imperative of ensuring food security. Developing a comprehensive
understanding of N fertilizer-induced C changes is essential to accurately forecast the fate of SOC in a warmer world, for maximizing agricultural ability to mitigate climate change and provide additional ecosystem services. Our global forecasts indicated that fertilization leads to a significantly greater increase in POC in C-poor soils compared to C-rich soils (Fig. 4a). Yet, due to POC’s rapid turnover and vulnerability-lacking protection from microaggregates and minerals-this retention does not translate into long-term SOC gains , particularly under global warming conditions . Moreover, warming that increase microbial activity will likely accelerate POC decomposition, as microbes process available C sources, potentially leading to significant carbon loss in an amplified manner . This exacerbation leads to elevated emissions of greenhouse gases, thereby creating a positive feedback loop that further intensifies the warming of our planet’s climate. Although fertilization has been observed to increase C pools (Fig. 4), caution is necessary when assessing its future potential, particularly in areas with overfertilization and high fertility, where the outcomes are often suboptimal . While our analysis provides a global estimate of N fertilization-induced changes in C pools over the past decade, several limitations must be acknowledged. First, our global assessment, based on meta-analyzes with nonstandardized experimental and sampling protocols across studies, restricts model outputs to correlative interpretations rather than establishing causality. To address this limitation, future efforts should prioritize standardized multi-region N fertilizer trials that integrate plot-scale data with causal inference methods. Such frameworks would elucidate the causal relationships underlying how N fertilizer mediates plant-microbial-environmental feedbacks governing C pools dynamics. Second, sparse data coverage in Europe, Canada, and Russia constrains model predictability and accuracy in these regions, particularly given their high-latitude locations and heightened susceptibility to climate change impacts. Addressing this limitation will require concerted efforts from the scientific community to perform large-scale, networked experiments across continents. Third, our estimates rely on interpolated global datasets with coarse spatiotemporal resolution (Supplementary Table 5), as many plot-level metadata are unavailable. To reduce uncertainties in such datasets, further efforts to enhance data quality and resolution are necessary. Despite these limitations, the comprehensive nature of our study, which incorporates a diverse range of data sources and advanced analytical methods, provides a robust estimation of N fertilizer-induced C pools changes.
In summary, our work provides new insights into the benefits of N fertilizer application for SOC accrual in global cropping systems. We discern two distinct mechanisms of global soil C accumulation following N fertilizer across an initial C threshold of : in C -poor soils ( ), accumulation is primarily driven by increased plant inputs and aggregate protection promoting POC; conversely, in C-rich soils (SOC ), accumulation mainly occurs through an enhanced microbial C pump and increased mineral protection, leading to a shift towards MAOC. As depicted by Fig. 5, by carrying out four long-term N fertilizer networking experiments, we observed that N fertilization altered soil functional C pools depended on initial SOC content, orchestrating an integrated control that encompasses plant, geochemical, and microbial factors. Our findings contribute to the nuanced understanding of N fertilizer’s role in promoting SOC sequestration, laying the groundwork for revising existing models of soil C dynamics. The dichotomy in SOC accumulation mechanisms we have uncovered more pronounced POC accumulation in C-poor soils versus MAOC accrual in C-rich conditions – challenges and extends traditional notions of N fertilization impacts. This divergence underscores the complexity of plant-microbe-soil matrix interactions in mediating these effects. Future theoretical frameworks should incorporate the
diversity of soil responses to N addition, emphasizing the interplay between biological and geochemical factors.
Methods
Field site description
Four coordinated long-running field N fertilizer experiments network were established between 2008 and 2011 in the four main maize production regions in China and represent four dominant soil types (Supplementary Fig. 1). The four sites were located in Siping (SP) Experimental Station, Jilin Province in Northeast China , E); Quzhou Experimental Station (QZ), Hebei Province in the North China Plain ; Changwu Experimental Station (CW), Shaanxi Province in Northwest China ; and Yaan Experimental Station (YA), Sichuan Province in Southwest China . At Siping, the soil texture is silt clay with SOC, and pH 6.16. The area had an average air temperature of and mean annual precipitation of 551 mm . In Quzhou experimental station, the soil texture is clay loam with SOC, and pH 8.5. The area had an average air temperature of and mean annual precipitation of 516 mm . In Changwu experimental station, the soil texture is silt loam with , and . The area had an average air temperature of and mean annual precipitation of 595 mm . In Yaan experimental station, the soil texture is clay loam with and . The area had an average air temperature of and mean annual precipitation of 1635 mm . Detailed site information of the four sampling regions is summarized in Supplementary Table 7.
The same fertilizer experiments were established in a randomized complete-block design with four replicates at each site. N fertilizer was added as urea at three N levels: (1) no N-fertilizer (hereafter called ‘Control’); (2) optimized N rate (hereafter called ‘OPT’); (3) high N rate (hereafter called ‘HN’). In brief, the optimal N application rate was determined based on the in-season root-zone N management to closely synchronize the soil and environment N supply with demand for N by the crop, while the high N rate is comparable to local farmers’ practices . Fertilizer was applied twice during the growing period: initially as a basal application and subsequently as a top-dressing in all four sites. Maize straw was chopped and incorporated into the soil through tillage to a depth of .
Soil and plant sampling and analysis
Topsoils ( ) were sampled in September 2020, and five topsoil cores taken randomly from each plot were composited as on sample per plot. The soil samples were sieved through a sieve with all visible roots and rocks were removed except for the aggregate fractionation and were divided into two parts: one was stored at for enzymes activities and microbial composition analysis within one week, and the remaining soil was stored at room temperature for determining soil physicochemical analyzes and further incubation experiment.
The SOC and total nitrogen (TN) contents were determined by dry combustion using an elemental analyzer (Elementar, Vario Max CN, Germany). Before measuring the SOC and TN, the alkaline soil was fumigated with concentrated HCl for 48 h to remove carbonates. The soil pH was measured using an ULTRAMETERII 6PFCE (Mellon, California, USA) after shaking the soil in deionized water ( ) suspensions for 30 min . Microbial biomass C (MBC) and N (MBN) was extracted in solution from chloroform fumigated and unfumigated soil and determined by the difference in C and N concentration using a Shimadzu TOC-L analyzer . The fungal-to-bacterial ratio (F:B) was assessed by applying the phospholipid fatty acids method .
At maturity in 2018, four complete root systems were collected from the topsoil in each plot. The roots were separated from the soil by rinsing on a fine mesh screen under a gentle water
spray until most of the soil was removed. The cleaned roots were then dried at , sieved to retain the roots while dislodging any remaining soil, and subsequently weighed.
Soil enzymes activities, microbial metabolic efficiency and nutrient limitation
The hydrolytic enzymes, -glucosidase (BG), cellobiohydrolase (CBH), -acetyl- -D-glucosaminidase (NAG), leucine amino peptidase (LAP), acid and alkaline phosphatase (ACP and ALP) in fresh soil samples were measured fluorometrically using methylumbelliferone-labeled substrates . Briefly, 125 mL of buffer solution was added to 1.0 g dry mass of fresh soil adjusted pH to 8.2 with HCl . For ALP and ALP analysis, the buffer was adjusted to pH 6.5 and 8.2 , respectively. A total of sample suspension and substrate solutions were dispensed into the wells of a black 96-well microplate. The microplates were covered and incubated in the dark at for 4 h and the fluorescence quantified using a microplate fluorometer with excitation and emission filters. Polyphenol oxidase (PPO) and peroxidase (POD) were measured spectrophotometrically in a clear 96-well microplate using the substrate of L-3,4-dihydroxy-phenylalanine (L-DOPA; German et al. ). A 1 mL aliquot of soil slurry was mixed with 1 mL of 10 mM L -DOPA in 50 mM acetate buffer for PPO or 1 mL L-DOPA and 0.2 mL of hydrogen peroxide for POD and then incubated in the dark at for 2 h . The suspensions were centrifuged, and the activity quantified by measuring absorbance at 450 nm .
Enzymatic stoichiometric was employed to assess potential C limitations in the soil. The vector length were calculated according to Moorhead et al. . Vector length indicates the enzyme activity towards C acquisition relative to N and P . A Higher vector length represents larger microbial C limitation .
where and represent the relative and acquiring enzyme ratios, respectively. C-acquiring enzyme: BG and CBH; N-acquiring enzyme: NAG and LAP; P-acquiring enzyme: ACP for SP and YA, ALP for QZ and CW.
We also assessed microbial resource limitation by calculating the ratios of the resource C:N ratios ( ), normalized to the ratio of MBC to MBN . Given that biomass stoichiometry determines the nutrient requirements of microbial decomposers, greater resource limitation indicates increasing microbial N limitation.
where represents the ratio of SOC-to-TN, represents the ratio of MBC-to-MBN.
Microbial metabolic efficiency was assessed using qCO2, with higher qCO2 values indicating less carbon (C) allocation to biomass and greater respiration losses . Soil samples (equivalent to 30 g dry weight) were adjusted to water holding capacity, and placed into 250 ml jars, and incubated at for 28 days. Headspace release was measured using a soil flux system equipped with a portable chamber (EGM-5, USA, PP SYSTEM) on days after soil incubation. Soil was expressed as .
SOC fractionation
Particulate organic matter (POC) and mineral-associated organic carbon (MAOC) were determined with modifications to the method described by Poeplau et al. . Briefly, 20 g of sieved bulk soil was shaken for 18-h with glass beads in sodium hexametaphosphate to disrupt all aggregates. The resulting soil slurry was rinsed with deionized water over a sieve with the fraction passing through representing MAOC and the fraction remaining on the sieve representing POC. Following physical fractionation,
total C in MAOC and POC fractions were measured using elemental analysis.
Compound specific analysis of lignin phenols and amino sugars Lignin phenols were used as a geochemical proxy for terrestrial plant C input according to Otto & Simpson . Soil samples were ground to pass through a 0.15 mm mesh sieve and a subsample was transferred to a Teflon vessel digestion for digestion using alkaline CuO under high pressure and temperature to release constituent monomer phenols from lignin polyphenols. Briefly, 1g of air-dried soil ( ) was solvent-extracted and base hydrolyzed to remove extractable and hydrolysable lipids. The dried residues were mixed with 1 g CuO , 100 mg ammonium iron(II) sulfate hexahydrate, and -purged 2 M NaOH in teflon-lined bombs. The bombs were flushed with for 10 min and heated at for 2.5 h . After cooling, lignin oxidation products (LOPs) were spiked with ethyl vanillin, acidified to pH 1 with 6 M HCl , and kept in the dark for 1 h . LOPs were extracted from the supernatant with ethyl acetate, concentrated under , and dissolved in a solution with trans-cinnamic acid. The mixture was dried under , derivatized with N,O-bis-(trimethylsilyl) trifluoroacetamide and pyridine ( ), and quantified using a GC-MS QP 2010 PLUS (Shimadzu) with an HP-5 fused silica column and a flame ionization detector. This method released eight characteristic lignin monomer phenols, including vanillyl (V; vanillin, acetovanillone and vanillic acid), syringyl (S; syringaldehyde, acetosyringone and syringic acid) and cinnamyl (C; p- coumaric acid and ferulic acid) monomers. Vanillyl (V), syringyl (S) and cinnamyl (C) phenols were summed to represent lignin phenols in soils.
Amino sugars analysis was used to quantify microbial necromass contributed by bacteria or fungi according to Zhang & Amelung . Briefly, weighed soil subsamples were hydrolyzed with 6 M HCl for 8 h at . Myo-inositol was added as an internal standard after the hydrolysate cooled to room temperature. The hydrolysate was then filtered, evaporated, pH adjusted (6.6-6.8), centrifuged and freezedried. Amino sugars were re-dissolved in methanol and separated from salts by centrifugation. After the addition of a quantitative standard (methyl-glucamine), amino sugars were transformed into aldononitrile derivatives. Then reacted with derivative reagent, acetic anhydride, ethyl acetate, and hexane for derivatization. Gas chromatograph (Agilent 6890 A, Agilent Technologies) was utilizing to separated and quantified the three amino sugars. Bacterial and fungal necromass C were calculated using the following equations and microbial necromass C refer to the sum of bacterial and fungal necromass C :
Fungal necromass glucosamine muramic acid
where 45 represents the conversion ratio of muramic acid to bacterial necromass C; 179.17 is the glucosamine molecular weight; and 9 indicates the conversion ratio from fungal glucosamine-to-fungal necromass .
Soil aggregate size fractionation
Soil aggregates size fractions were determined using wet sieving procedure , in which 100 g soil was separated into four aggregate size class: large macroaggregates , small macroaggregates , microaggregates and fractions. In brief, undisturbed air-dried soil samples were gently crushed to pass an sieve mesh. Then, 100 g samples of -sized aggregates were placed in the top sieve of a set containing sieves with , and 0.053 mm mesh sizes that was submerged and oscillated (amplitude ) in deionized water. The soil material was
rinsed from each sieve and then oven-dried and weighed. The mean weight diameter (MWD, mm) indicates aggregate stability, which is calculated as follows:
where is the average diameter of aggregates in any size fraction; is the proportion of aggregates corresponding to .
Solid-state nuclear magnetic resonance (NMR) analysis
The chemical composition of SOC was investigated by determining the relative abundance of functional groups using solid-state crosspolarization and magic-angle-spinning (CPMAS) NMR . Soil samples were treated with HF-HCL solution to concentrate the organic matter and to remove paramagnetic minerals. The -CPMAS NMR spectra were acquired using an AVANCE III 400 WB spectrometer (Bruker, Billerica, MA, USA). The sold-state C-CPMAS NMR spectra were divided into four common chemical shift regions: alkyl-C ( , O-alkyl-C ( ), Aromatic-C ( ) and Carbonyl-C (160-220 ppm). Different indices of SOC stability were calculated as follows:
Aliphaticity = alkyl C/O alkyl C
Mineral protection
Polyvalent cations provide a mechanism for carbon retention through their role in cation bridging. We measured the content of exchangeable cations including -(hydr) oxides . To measure oxides, pyrophosphate-extractable oxides extracted using 0.2-M sodium pyrophosphate, and oxalate-extractable Fe/Al oxides ( ) extracted using 0.2-M oxalic acid-ammonium oxalate ( ), were used to represent organically complexed oxides and poorly crystalline oxyhydroxides, respectively.
Exchangeable calcium ( ) and magnesium ( ) ions safeguard C in soils were extracted with ammonium chloride-70% ethanol solution after removing the soluble chloride and sulfate by ethanol solution . The contents of and mineral phases were determined with an inductively coupled plasma optical emission spectrometer (ICP-OES; iCAP 6300, Thermo Scientific, Waltham, USA).
Compilation of the global database
To investigate changes of soil C functional pools (SOC, POC and MAOC) response to N fertilizer application under influences of different initial SOC levels in global agricultural land, we compiled experimental research articles published prior to June 2024 from the Web of Science and the China National Knowledge Infrastructure Database using the following keywords: (“nitrogen”) AND (“soil carbon fraction” OR “soil mineral-associated organic carbon” OR “soil mineralassociated organic matter” OR “MAOC” OR “MOC” OR “MAOM” OR “MOM” OR “particulate organic matter” OR “particulate organic carbon” OR “POC” or POM”) AND (“farmland” OR “cropland” OR “agriculture”). For in inclusion in the database, published research must have satisfied the following criteria: (1) a N fertilization experiment was conducted in the field and included N -addition and control treatments within agroecosystems under the same environmental conditions; (2) only studies conducted at upland fields were included; (3) no other organic manure was applied in all treatments during the experiments; (4) C pools and at least one related variable were measured, and the mean, standard deviation or standard error, and sample size were reported for all treatments; To ensure comparability with our four-site
experiment, we selected only the data from trials conducted on dryland. Implementing these criteria, 118 published articles were selected (Supplementary References). We compiled a final dataset containing 494 and149, measurements of POC and MAOC, respectively. Data were also collected on site coordinates, climate, initial soil organic carbon, initial soil pH, initial total nitrogen, initial silt and clay content (all initial soil properties refer to those before the start of the experiment.), N input rate, and duration. Crop yield values were also extracted if available. When data were presented graphically only, figures were digitized to extract the numerical values using GETDATA GRAPH. If soil and climatic variables were not reported, we supplemented the missing data using global databases (e.g., soilgrids and WorldClim database). We classified data into tropical, subtropical, temperate and boreal ecozones based on site-specific coordinates and Food and Agriculture Organization ecozones.
Predictive modeling of global POC and MAOC
To create a spatially predictive model of the effect of current N fertilizer on POC and MAOC, we first sampled our prepared stack of environmental covariates at each independent data point within the compiled database. These layers included climatic, soil, and fertilizer use (Supplementary Table 6). Specifically, values of all grids of environmental layers were extracted based on site-specific coordinates or directly from original studies when available. All covariates were resampled and reprojected to a unified pixel grid in EPSG:4326 (WGS84) at five-arcminute spatial resolution. We selected four common and reliable machine-learning models (random forest model, the extreme gradient-boosting model, the light gradient-boosting machine model, and the gradient-boosting decision trees mode) to predict POC and MAOC changes. The data used for training and validation are and , respectively. We used a grid-search procedure, with five-fold cross-validation, to select the best model. The predictive power of the models was measured using three key metrics: the Root Mean Square Error (RMSE), the Mean Absolute Error (MAE), and the goodness of fit, as represented by the coefficient of determination ( ). The results showed that the gradient-boosting decision trees machine model performed best among all models (characterized by the maximum and the minimum MAE and MSE; Supplementary Table 5) and was therefore selected to predict the global variations in POC/MAOC. All models were run in Python.
Statistical analysis
For meta-analysis, we calculated the mean effect size and 95% CI of the overall effects of N fertilizer managements on SOC, POC and MAOC. The effects of N fertilization were estimated based on the natural transformed response ratio , confidence intervals (CIs) on the weighted effect size were generated using boot-strapping (999 iterations, function confint, package metafor):
Where is the treatment mean, and is the control mean. The variance associated with each value of was calculated as follows:
Where and are the sample sizes for the treatment and control groups, respectively; and and are the SDs for the treatment and control groups, respectively.
We first fitted linear and non-linear (quadratic and general additive models [GAM]) regressions to the relationships between the effect sizes of POC/MAOC and initial SOC content, and used the Akaike information criterion (AIC) to decide which model was the best fit in each case . Thresholds could only be defined when non-linear
regressions best fit the data. Then, we evaluated six different nonlinear models to select the one that best aligned with our data (Supplementary Table 1), and which each differed from each other by the functions fitted either side of the estimated breakpoint . The nonlinear models evaluated were: general additive models (GAM), step (two intercept models, for which the differences in intercept were tested at the breakpoint), segmented (two linear models in which the slope is changed at breakpoint), stegmented (two linear models in which both the slope and the intercept are changed at the breakpoint), hinge model 12 (one linear model is fitted for the left part of the breakpoint and a second degree polynomial is fitted for the right part), and hinge model 22 (two different second degree polynomial models are fitted at both sides of the breakpoint). The model exhibiting the lowest AIC and Bayesian information criterion (BIC) was considered the best model. Detailed AIC and BIC values for each regression model are provided in Supplementary Table 1. We defined the breakpoint as the initial SOC threshold.
To further test whether the thresholds identified significantly affected the slope of the fitted regressions, we bootstrapped linear regressions either side of each threshold for each variable. We then extracted the slope and the predicted value of the variable evaluated before and after the threshold and compared them using a MannWhitney U test following the methods in refs. 75,76. We also used the Q-statistic to test the heterogeneity of the N effect sizes on POC and MAOC between before and after the SOC threshold. Significant values (between-group heterogeneity) indicated that the RR differed between groups .
We assessed the quality of our meta-analysis using the checklist developed by Koricheva and Gurevitch (Supplementary Table ;). Our meta-analysis met all the quality criteria established for metaanalyzes in ecology. The assessment of publication bias conventionally employs funnel plot analysis. However, numerous studies lack the necessary sample variance information crucial for the construction of informative funnel plots. Consequently, a histogram was generated to examine the distribution of individual effect sizes across the dataset, aiming to ascertain any indications of publication bias (Supplementary Fig. 16). Egger’s test suggests that the impact of nitrogen fertilizer management on POC may be slightly overestimated, yet it appears to have no significant effect on MAOC. The failsafe number for both POC and MAOC exceeds the threshold of ( is the sampling size in this study), suggesting an absence of publication bias. We performed a Jackknife sensitivity analysis to assess the impact of individual studies on the overall robustness of the analysis . In the Jackknife analysis, each study received a unique identification, and, in each iteration, data from one study were systematically excluded from the dataset (Supplementary Fig. 17). The sensitivity analysis demonstrated the robustness of these findings, with no specific publication exerting a disproportionate influence on the overall response. In addition, temporal change tests show significant correlation between POC with publication year ( ; MAOC: ), we can still infer that our results are robust as the estimates are small-scale ( for POC; Supplementary Fig. 18).
For the field, experiments, we used linear mixed-effect models to determine the effects of N fertilizer practices, initial C conditions and their interactions on root biomass, soil C pools, microbial properties and necromass, lignin phenols and mineral and physical protection. Statistical significance is based on Wald type III tests and all estimated effect sizes ( ) are based on rescaled response variables. Specifically, the preceding responsive variables for each experiment were tested with N fertilizer managements as fixed effects, and site were tested as random effects (function Imer, package lme4 and lmertest). Pairwise treatment comparisons were assessed via Tukey’s honest significant difference (function emmeans, package emmeans). The statistical analyzes were performed in R version 4.2.1.
Partial correlation analysis was used to assess the relationships between C fractions (POC and MAOC) with five groups of impact factors (i.e., C origin (root biomass, lignin phenols and microbial necromass C ), transform ( , Oxidase, , resource limitation and C limitation), stability (MWD, and ) and structure (recalcitrance and aliphaticity). The greater the difference in partial correlation coefficient between zero-order and controlling correlation, the stronger the effect of control factor. After identifying the key predictors, the correlation between C fraction and these factors were analyzed by univariate linear regression.
Reporting summary
Further information on research design is available in the Nature Portfolio Reporting Summary linked to this article.
Data availability
The data used in this study are available in Source data and online in the Zenodo database (https://doi.org/10.5281/zenodo.10374039). Source data are provided with this paper.
Sanderman, J., Hengl, T. & Fiske, G. J. Soil carbon debt of 12,000 years of human land use. Proc. Natl Acad. Sci. 114, 9575-9580 (2017).
Ma, Y. et al. Global crop production increase by soil organic carbon. Nat. Geosci. 16, 1159-1165 (2023).
Oldfield, E. E., Bradford, M. A. & Wood, S. A. Global meta-analysis of the relationship between soil organic matter and crop yields. SOIL 5, 15-32 (2019).
Lal, R. Enhancing crop yields in the developing countries through restoration of the soil organic carbon pool in agricultural lands. Land Degrad. Dev. 17, 197-209 (2006).
Vendig, I. et al. Quantifying direct yield benefits of soil carbon increases from cover cropping. Nat. Sustain. 6, 1125-1134 (2023).
Vitousek, P. M. et al. Nutrient Imbalances in Agricultural Development. Science 324, 1519-1520 (2009).
Beillouin, D. et al. A global meta-analysis of soil organic carbon in the Anthropocene. Nat. Commun. 14, 3700 (2023).
Liu, B. et al. Co-benefits for net carbon emissions and rice yields through improved management of organic nitrogen and water. Nat. Food 5, 241-250 (2024).
Tang, B., Rocci, K. S., Lehmann, A. & Rillig, M. C. Nitrogen increases soil organic carbon accrual and alters its functionality. Glob. Change Biol. 29, 1971-1983 (2023).
Cai, A. et al. Manure acts as a better fertilizer for increasing crop yields than synthetic fertilizer does by improving soil fertility. Soil Tillage Res. 189, 168-175 (2019).
Kazanski, C. E., Riggs, C. E., Reich, P. B. & Hobbie, S. E. Long-term nitrogen addition does not increase soil carbon storage or cycling across eight temperate forest and grassland sites on a sandy outwash plain. Ecosystems 22, 1592-1605 (2019).
Rocci, K. S., Lavallee, J. M., Stewart, C. E. & Cotrufo, M. F. Soil organic carbon response to global environmental change depends on its distribution between mineral-associated and particulate organic matter: a meta-analysis. Sci. Total Environ. 793, 148569 (2021).
Eisenstein, M. Natural solutions for agricultural productivity. Nature 588, S58-S59 (2020).
Neal, A. L. et al. Arable soil nitrogen dynamics reflect organic inputs via the extended composite phenotype. Nat. Food 4, 51-60 (2023).
Cambardella, C. A. & Elliott, E. T. Particulate soil organic-matter changes across a grassland cultivation sequence. Soil Sci. Soc. Am. J. 56, 777-783 (1992).
Kleber, M. et al. Mineral-organic associations: formation, properties, and relevance in soil environments. Adv., Agron. 130, 1-140 (2015).
Cotrufo, M. F., Ranalli, M. G., Haddix, M. L., Six, J. & Lugato, E. Soil carbon storage informed by particulate and mineral-associated organic matter. Nat. Geosci. 12, 989-994 (2019).
Ge, T. et al. Tracking the photosynthesized carbon input into soil organic carbon pools in a rice soil fertilized with nitrogen. Plant Soil 392, 17-25 (2015).
Cotrufo, M. F. & Lavallee, J. M. Soil organic matter formation, persistence, and functioning: a synthesis of current understanding to inform its conservation and regeneration. Adv., Agron. 172, 1-66 (2022).
Fohrafellner, J. et al. Cover crops affect pool specific soil organic carbon in cropland – a meta-analysis. Eur. J. Soil Sci. 75, e13472 (2024).
Clayton, J., Lemanski, K. & Bonkowski, M. Shifts in soil microbial stoichiometry and metabolic quotient provide evidence for a critical tipping point at 1% soil organic carbon in an agricultural postmining chronosequence. Biol. Fertil. Soils 57, 435-446 (2021).
Allen, A. P. & Gillooly, J. F. Towards an integration of ecological stoichiometry and the metabolic theory of ecology to better understand nutrient cycling. Ecol. Lett. 12, 369-384 (2009).
Yang, L. et al. Microbial life-history strategies mediate microbial carbon pump efficacy in response to N management depending on stoichiometry of microbial demand. Glob. Change Biol. 30, e17311 (2024).
Yuan, X. et al. Linkages of stoichiometric imbalances to soil microbial respiration with increasing nitrogen addition: Evidence from a long-term grassland experiment. Soil Biol. Biochem. 138, 107580 (2019).
Zechmeister-Boltenstern, S. et al. The application of ecological stoichiometry to plant-microbial-soil organic matter transformations. Ecol. Monogr. 85, 133-155 (2015).
. et al. Impact of nitrogen addition on plant-soil-enzyme C-N-P stoichiometry and microbial nutrient limitation. Soil Biol. Biochem. 170, 108714 (2022).
Ye, C. et al. Reconciling multiple impacts of nitrogen enrichment on soil carbon: plant, microbial and geochemical controls. Ecol. Lett. 21, 1162-1173 (2018).
Tian, D. & Niu, S. A global analysis of soil acidification caused by nitrogen addition. Environ. Res. Lett. 10, 024019 (2015).
Lu, X. et al. Nitrogen addition stimulates soil aggregation and enhances carbon storage in terrestrial ecosystems of China: A meta-analysis. Glob. Change Biol. 27, 2780-2792 (2021).
Wang, H. et al. Alterations in substrate stoichiometry control the responses of soil diazotrophs to nutrient enrichment. Soil Biol. Biochem. 179, 108975 (2023).
Chen, J. et al. A keystone microbial enzyme for nitrogen control of soil carbon storage. Sci. Adv. 4, eaaq1689 (2018).
Bonner, M. T. L. et al. Why does nitrogen addition to forest soils inhibit decomposition? Soil Biol. Biochem. 137, 107570 (2019).
Floudas, D. et al. The Paleozoic origin of enzymatic lignin decomposition reconstructed from 31 fungal genomes. Science 336, 1715-1719 (2012).
Man, M., Deen, B., Dunfield, K. E., Wagner-Riddle, C. & Simpson, M. J. Altered soil organic matter composition and degradation after a decade of nitrogen fertilization in a temperate agroecosystem. Agric. Ecosyst. Environ. 310, 107305 (2021).
Yu, F., Zhang, W., Hou, X., Li, Y. & Tong, J. How nutrient loads influence microbial-derived carbon accumulation in wetlands:
new insight from microbial metabolic investment strategies. Environ. Res. 217, 114981 (2023).
Even, R. J. & Francesca Cotrufo, M. The ability of soils to aggregate, more than the state of aggregation, promotes protected soil organic matter formation. Geoderma 442, 116760 (2024).
Lehmann, A., Zheng, W. & Rillig, M. C. Soil biota contribution to soil aggregation. Nat. Ecol. Evol. 1, 1828-1835 (2017).
Yudina, A. & Kuzyakov, Y. Dual nature of soil structure: The unity of aggregates and pores. Geoderma 434, 116478 (2023).
Begill, N., Don, A. & Poeplau, C. No detectable upper limit of mineral-associated organic carbon in temperate agricultural soils. Glob. Change Biol. 29, 4662-4669 (2023).
Matus, F. J. Fine silt and clay content is the main factor defining maximal C and N accumulations in soils: a meta-analysis. Sci. Rep. 11, 6438 (2021).
Matus, F. J. et al. Upper limit of mineral-associated organic carbon in temperate and sub-tropical soils: How far is it? Geoderma Reg. 37, e00811 (2024).
García-Palacios, P. et al. Dominance of particulate organic carbon in top mineral soils in cold regions. Nat. Geosci. 17, 145-150 (2024).
Wu, J. et al. Particulate organic carbon is more sensitive to nitrogen addition than mineral-associated organic carbon: A meta-analysis. Soil Tillage Res. 232, 105770 (2023).
Villarino, S. H., Pinto, P., Jackson, R. B. & Piñeiro, G. Plant rhizodeposition: a key factor for soil organic matter formation in stable fractions. Sci. Adv. 7, eabd3176 (2021).
Liang, G., Stark, J. & Waring, B. G. Mineral reactivity determines root effects on soil organic carbon. Nat. Commun. 14, 4962 (2023).
Cui, Y. et al. Stoichiometric models of microbial metabolic limitation in soil systems. Glob. Ecol. Biogeogr. 30, 2297-2311 (2021).
Zhang, T., Chen, H. Y. H. & Ruan, H. Global negative effects of nitrogen deposition on soil microbes. ISME J. 12, 1817-1825 (2018).
Fierer, N. et al. Comparative metagenomic, phylogenetic and physiological analyses of soil microbial communities across nitrogen gradients. ISME J. 6, 1007-1017 (2012).
Rui, Y. et al. Persistent soil carbon enhanced in Mollisols by wellmanaged grasslands but not annual grain or dairy forage cropping systems. Proc. Natl Acad. Sci. 119, e2118931119 (2022).
Niu, B. et al. pH: A core node of interaction networks among soil organo-mineral fractions. Environ. Int. 178, 108058 (2023).
Mao, H. et al. Dual role of silt and clay in the formation and accrual of stabilized soil organic carbon. Soil Biol. Biochem. 192, 109390 (2024).
Cotrufo, M. F., Wallenstein, M. D., Boot, C. M., Denef, K. & Paul, E. The Microbial Efficiency-Matrix Stabilization (MEMS) framework integrates plant litter decomposition with soil organic matter stabilization: do labile plant inputs form stable soil organic matter? Glob. Change Biol. 19, 988-995 (2013).
Lu, X. et al. Nitrogen deposition accelerates soil carbon sequestration in tropical forests. Proc. Natl Acad. Sci. 118, e2020790118 (2021).
Lessmann, M., Ros, G. H., Young, M. D. & de Vries, W. Global variation in soil carbon sequestration potential through improved cropland management. Glob. Change Biol. 28, 1162-1177 (2022).
Xu, Y. et al. Nitrogen addition-driven soil organic carbon stability depends on the fractions of particulate and mineral-associated organic carbon. Nutr. Cycl. Agroecosyst. 128, 269-281 (2024).
Houlton, B. Z. et al. A world of cobenefits: solving the global nitrogen challenge. Earth’s. Future 7, 865-872 (2019).
Guenet, B. et al. Can emissions offset the benefits from soil organic carbon storage? Glob. Change Biol. 27, 237-256 (2021).
Gao, Y. & Cabrera Serrenho, A. Greenhouse gas emissions from nitrogen fertilizers could be reduced by up to one-fifth of current
levels by 2050 with combined interventions. Nat. Food https://doi. org/10.1038/s43016-023-00698-w (2023).
Liu, F. et al. Divergent changes in particulate and mineralassociated organic carbon upon permafrost thaw. Nat. Commun. 13, 5073 (2022).
Lugato, E., Lavallee, J. M., Haddix, M. L., Panagos, P. & Cotrufo, M. F. Different climate sensitivity of particulate and mineral-associated soil organic matter. Nat. Geosci. 14, 295-300 (2021).
Chen, X. et al. Integrated soil-crop system management for food security. Proc. Natl Acad. Sci. 108, 6399-6404 (2011).
Vance, E. D., Brookes, P. C. & Jenkinson, D. S. An extraction method for measuring soil microbial biomass C. Soil Biol. Biochem. 19, 703-707 (1987).
Tian, J. et al. Microbially mediated mechanisms underlie soil carbon accrual by conservation agriculture under decade-long warming. Nat. Commun. 15, 377 (2024).
German, D. P. et al. Optimization of hydrolytic and oxidative enzyme methods for ecosystem studies. Soil Biol. Biochem. 43, 1387-1397 (2011).
Moorhead, D. L., Sinsabaugh, R. L., Hill, B. H. & Weintraub, M. N. Vector analysis of ecoenzyme activities reveal constraints on coupled C, N and P dynamics. Soil Biol. Biochem. 93, 1-7 (2016).
Chen, L. et al. Regulation of priming effect by soil organic matter stability over a broad geographic scale. Nat. Commun. 10, 5112 (2019).
Poeplau, C. et al. Isolating organic carbon fractions with varying turnover rates in temperate agricultural soils – A comprehensive method comparison. Soil Biol. Biochem. 125, 10-26 (2018).
Otto, A. & Simpson, M. J. Evaluation of CuO oxidation parameters for determining the source and stage of lignin degradation in soil. Biogeochemistry 80, 121-142 (2006).
Zhang, X. & Amelung, W. Gas chromatographic determination of muramic acid, glucosamine, mannosamine, and galactosamine in soils. Soil Biol. Biochem. 28, 1201-1206 (1996).
Liang, C., Amelung, W., Lehmann, J. & Kästner, M. Quantitative assessment of microbial necromass contribution to soil organic matter. Glob. Change Biol. 25, 3578-3590 (2019).
Joergensen, R. G. Amino sugars as specific indices for fungal and bacterial residues in soil. Biol. Fertil. Soils 54, 559-568 (2018).
Six, J., Elliott, E. T., Paustian, K. & Doran, J. W. Aggregation and soil organic matter accumulation in cultivated and native grassland soils. Soil Sci. Soc. Am. J. 62, 1367-1377 (1998).
Chen, L. et al. Soil carbon persistence governed by plant input and mineral protection at regional and global scales. Ecol. Lett. 24, 1018-1028 (2021).
Zhou, R. et al. Microbial necromass in cropland soils: A global metaanalysis of management effects. Glob. Change Biol. 29, 1998-2014 (2023).
Berdugo, M. et al. Global ecosystem thresholds driven by aridity. Science 367, 787-790 (2020).
Gross, N. et al. Unforeseen plant phenotypic diversity in a dry and grazed world. Nature 632, 808-814 (2024).
Fong, Y., Huang, Y., Gilbert, P. B. & Permar, S. R. chngpt: Threshold regression model estimation and inference. BMC Bioinf. 18, 1-7 (2017).
Koricheva, J. & Gurevitch, J. Uses and misuses of meta-analysis in plant ecology. J. Ecol. 102, 828-844 (2014).
Prairie, A. M., King, A. E. & Cotrufo, M. F. Restoring particulate and mineral-associated organic carbon through regenerative agriculture. Proc. Natl Acad. Sci. 120, e2217481120 (2023).
Acknowledgements
This study was supported by the National Natural Science Foundation of China (grant nos. U23A20158 and 32071629, J.T.) National Key R&D Program of China (2023YFD1901500, 2022YFD1901300, J.T.), 2115 Talent Development Program of China Agricultural University and Beijing Advanced Disciplines (F.S.Z). M.D-B. acknowledges support from TED2021-130908B-C41/AEI/10.13039/501100011033/Unión Europea NextGenerationEU/PRTR and from the Spanish Ministry of Science and Innovation for the I + D + i project PID2O20-115813RA-IOO funded by MCIN/AEI/10.13039/501100011033. Y. Kuzyakov acknowledges the Ministry of Education, Science and Sports of the Republic of Lithuania and the Research Council of Lithuania (LMTLT) under the Program ‘University Excellence Initiative’ Project ‘Development of the Bioeconomy Research Center of Excellence’ (BioTEC) (No S-A-UEI-23-14).
Author contributions
All authors contributed intellectual input and assistance to this study and manuscript preparation. J.T. and X.P.C. designed the original concept and experiment strategy. J.L. and R.R.Z. collected the data. J.L. analyzed the data. Q.G., Y.X.C., S.C.Y., and W.S.Z. carried the field experiment. J.L., J.A.J.D., M.D.B., Y.K., Z.L.C., F.S.Z., X.P.C., and J.T. drafted the manuscript and all authors involved in critical revisions and gave final approval for publication.
Correspondence and requests for materials should be addressed to Xinping Chen or Jing Tian.
Peer review information Nature Communications thanks Sebastián Horacio Villarino and the other, anonymous, reviewer(s) for their contribution to the peer review of this work. A peer review file is available.
Publisher’s note Springer Nature remains neutral with regard to jurisdictional claims in published maps and institutional affiliations.
Open Access This article is licensed under a Creative Commons Attribution 4.0 International License, which permits use, sharing, adaptation, distribution and reproduction in any medium or format, as long as you give appropriate credit to the original author(s) and the source, provide a link to the Creative Commons licence, and indicate if changes were made. The images or other third party material in this article are included in the article’s Creative Commons licence, unless indicated otherwise in a credit line to the material. If material is not included in the article’s Creative Commons licence and your intended use is not permitted by statutory regulation or exceeds the permitted use, you will need to obtain permission directly from the copyright holder. To view a copy of this licence, visit http://creativecommons.org/ licenses/by/4.0/.
State Key Laboratory of Nutrient Use and Management, College of Resources and Environmental Sciences, China Agricultural University, 100193 Beijing, PR China. Geography, Faculty of Environment, Science and Economy, University of Exeter, Rennes Drive, Exeter EX4 4RJ, UK. Carbon Management Centre, SRUC-Scotland’s Rural College, Edinburgh EH9 3JG, UK. Laboratorio de Biodiversidad y Funcionamiento Ecosistémico, Instituto de Recursos Naturales y Agrobiología de Sevilla (IRNAS), CSIC, 41012 Sevilla, Spain. College of Resources and Environment, Academy of Agricultural Science, Interdisciplinary Research Center for Agriculture Green Development in Yangtze River Basin, Southwest University, 400715 Chongqing, China. College of Resources and Environment, Jilin Agricultural University, 130118 Changchun, China. College of Resources and Environment, Sichuan Agricultural University, 611134 Chengdu, China. Institute of Eco-Environment and Industrial Technology, Shanxi Agricultural University, 030031 Taiyuan, China. Department of Soil Science of Temperate Ecosystems, University of Göttingen, 37077 Göttingen, Germany. Bioeconomy Research Institute, Vytautas Magnus University, Agriculture Academy, Kaunas Reg., Lithuania. e-mail: chenxp2017@swu.edu.cn; tianj@igsnrr.ac.cn