المجلة: Scientific Reports، المجلد: 14، العدد: 1
DOI: https://doi.org/10.1038/s41598-024-52023-5
PMID: https://pubmed.ncbi.nlm.nih.gov/38267466
تاريخ النشر: 2024-01-24
DOI: https://doi.org/10.1038/s41598-024-52023-5
PMID: https://pubmed.ncbi.nlm.nih.gov/38267466
تاريخ النشر: 2024-01-24
تحديد أفضل عشرة مؤشرات لمرض السكري من النوع 2 من خلال تحليل تعلم الآلة لبيانات بنك المملكة المتحدة الحيوي
هدفت الدراسة إلى تحديد العوامل الأكثر توقعًا لتطور مرض السكري من النوع 2. باستخدام نموذج تصنيف XGboost، توقعنا حدوث مرض السكري من النوع 2 على مدى 10 سنوات. قمنا بتقليل اختيار العوامل الأساسية بشكل متعمد لاستغلال مجموعة البيانات الغنية من بنك البيانات البريطاني. تم تقييم القيمة التنبؤية للميزات باستخدام قيم shap، وتم تقييم أداء النموذج من خلال منطقة تحت منحنى خصائص التشغيل المستقبلية، والحساسية، والنوعية. تم استخدام بيانات من بنك البيانات البريطاني، التي تشمل عددًا كبيرًا من السكان مع بيانات ديموغرافية وصحية شاملة. شملت الدراسة 450,000 مشارك تتراوح أعمارهم بين 40-69 عامًا، مع استبعاد أولئك الذين لديهم سكري موجود مسبقًا. من بين 448,277 مشاركًا، أصيب 12,148 بمرض السكري من النوع 2 خلال عقد من الزمن. برز HbA1c كأهم مؤشر، يليه مؤشر كتلة الجسم، محيط الخصر، مستوى السكر في الدم، التاريخ العائلي للسكري، غاما-جلوتاميل ترانسفيراز، نسبة الخصر إلى الورك، كوليسترول HDL، العمر، وحمض اليوريك. حقق نموذج XGboost لدينا منطقة تحت منحنى خصائص التشغيل المستقبلية تبلغ 0.9 لتوقع مرض السكري من النوع 2 على مدى 10 سنوات، مع تحقيق نموذج مكون من 10 ميزات فقط 0.88. تجاوزت العوامل البيولوجية القابلة للقياس بسهولة العوامل التقليدية مثل النظام الغذائي، والنشاط البدني، والحالة الاجتماعية والاقتصادية في توقع مرض السكري من النوع 2. علاوة على ذلك، يمكن الحفاظ على دقة التوقع العالية باستخدام أفضل 10 عوامل بيولوجية فقط، مع تقديم عوامل إضافية تحسينات هامشية. تؤكد هذه النتائج على أهمية المؤشرات البيولوجية في توقع مرض السكري من النوع 2.
لقد ظهرت داء السكري من النوع 2 كواحد من أكثر الأمراض المزمنة انتشارًا في جميع أنحاء العالم، مما يفرض عبئًا اقتصاديًا وصحيًا كبيرًا على الأفراد والمجتمع.
علاوة على ذلك، كشفت الدراسات الحديثة أن ما يقرب من نصف البالغين المصابين بداء السكري من النوع 2 لم يتم تشخيصهم أو ليسوا على دراية بحالتهم.
تقدم التطورات الأخيرة في تعلم الآلة و”البيانات الضخمة” إمكانيات تحويلية في أبحاث الصحة، مما يسمح بالحصول على رؤى أعمق من مجموعات البيانات المعقدة التي كانت بعيدة المنال سابقًا. ومع ذلك، عندما يتعلق الأمر بتوقع مرض السكري من النوع 2، يكشف هذا المجال عن عدم اتساق ملحوظ، لا سيما في اختيار الميزات.
في نماذج التنبؤ لمرض السكري من النوع 2، تسعى دراستنا إلى معالجة هذه الفجوة. الغرض من هذه الدراسة هو تحديد العوامل الأكثر أهمية التي تتنبأ بحدوث مرض السكري من النوع 2 لاحقًا. سيتم استخدام نهج غير متحيز مع الحد الأدنى من الافتراضات المسبقة والتدخل البشري لتحقيق هذا الهدف. إن الاستفادة من الكمية الهائلة من المعلومات المجمعة في بنك البيانات البريطاني، جنبًا إلى جنب مع تقنيات التعلم الآلي المتطورة، توفر الفرصة لكشف العوامل التي لم يتم التعرف عليها سابقًا والتي تساهم في خطر الإصابة بالسكري. كما يتيح لنا هذا النهج توضيح العلاقات بين عوامل الخطر المعروفة بالفعل، وتحديد أي العوامل تمتلك أعلى قوة تنبؤية لمرض السكري من النوع 2.
طرق
بيانات
تم الحصول على جميع البيانات المستخدمة في هذه الدراسة من بنك المملكة المتحدة الحيوي، وهو قاعدة بيانات طبية شاملة تجمع معلومات صحية واسعة من 502,625 فردًا مقيمًا في المملكة المتحدة. بين عامي 2006 و2010، تم إجراء تقييمات أساسية على المشاركين الذين تتراوح أعمارهم بين 40 و69 عامًا من خلال مزيج من الاستبيانات التي تعمل باللمس، والمقابلات التي يقودها الممرضون، ومجموعة متنوعة من الاختبارات والقياسات. تم تجميع معلومات حول العادات الغذائية باستخدام استبيان تكرار الطعام، الذي أظهر موثوقية في تصنيف المشاركين وفقًا لاستهلاكهم من المجموعات الغذائية الرئيسية.
النتيجة
كان الهدف الأساسي من هذه الدراسة هو حدوث مرض السكري من النوع 2 خلال فترة 10 سنوات بعد التقييم الأساسي (3650 يومًا). لتحديد هذه النتيجة، استخدمنا فئة “الحدوث الأول” في بنك البيانات البريطاني، الذي يحتوي على حقلين للبيانات لكل رمز مرتبط برمز ICD-10 مكون من 3 أحرف. يمثل الحقل الأول تاريخ الإبلاغ الأول عن رمز ICD، ويحتوي الحقل الثاني على المصدر الذي تم تسجيل الرمز فيه لأول مرة. شملت المصادر معلومات رمز Read في بيانات الرعاية الأولية، ورموز ICD-9 وICD-10 في بيانات المرضى الداخليين بالمستشفى، ورموز ICD-10 في سجلات تسجيل الوفيات، ورموز الحالة الطبية المبلغ عنها ذاتيًا التي تم الإبلاغ عنها في زيارات مراكز تقييم بنك البيانات البريطاني اللاحقة. في هذه الدراسة، تم تعريف المتغير الناتج على أنه أي تقرير عن رمز ICD E11 (داء السكري غير المعتمد على الأنسولين) خلال فترة الدراسة التي استمرت 10 سنوات.
معايير الاستبعاد
تم استبعاد الأفراد الذين كانوا مصابين بالسكري في البداية من الدراسة. على وجه التحديد، أولئك الذين أبلغوا عن إصابتهم بالسكري في مقابلة الأساس أو الذين تم قياسهم.
اختيار المتغيرات
كانت نهجنا في اختيار المتغيرات متعمدًا ومستنيرًا بحكم الخبراء. منذ البداية، كان هدفنا الأساسي هو الحفاظ على أكبر قدر ممكن من المعلومات لتسهيل تحليل غير متحيز غني بالتفاصيل حول المشاركين. مع وضع هذا الهدف في الاعتبار، بدأنا باستبعاد أي متغيرات تم جمعها بعد التقييم الأساسي، حيث كنا ملتزمين باستخدام بيانات الأساس فقط لنمذجة التنبؤ. بعد ذلك، قمنا بتقييم بيانات الأساس بدقة لضمان صلتها ودقتها. كانت هذه التقييم عملية يدوية حيث تم تقييم كل متغير من حيث مساهمته في فهم شامل لصحة المشارك ونمط حياته وحالته الاجتماعية والاقتصادية. تم استبعاد المتغيرات التي اعتبرت غير مرتبطة بهذه المجالات الرئيسية، أو التي لم تقدم رؤى إضافية. على سبيل المثال، تم تجاهل سمات البيانات مثل الأرقام التسلسلية لأجهزة القياس، ومدة الاختبارات، أو أسباب تخطي اختبارات معينة لأنها لم تقدم معلومات ذات مغزى عن المشاركين. في الحالات التي كانت فيها متغيرات مكررة، مثل قياسين منفصلين لضغط دم المشارك، قمنا بحساب متوسط القيم وتمثيلها بمتغير واحد. بعد ذلك، حددنا 111 متغيرًا كان لديها أكثر من
تطوير النموذج
استخدم نموذج التصنيف في هذه الدراسة خوارزمية تعزيز التدرج المتطرف (XGBoost)، وهي تقنية تعلم جماعي مستخدمة على نطاق واسع
الأفراد الذين لديهم نتيجة الاهتمام في كلا المجموعتين، تم تقسيم البيانات بناءً على المتغير الناتج. بمجرد الانتهاء من التقسيم، خضعت مجموعة بيانات التدريب لمزيد من المعالجة المسبقة. تم تحويل جميع الميزات الفئوية إلى متغيرات عددية باستخدام ترميز واحد حار. تم تحديد المتغيرات ذات التباين المنخفض جدًا وإزالتها لتعزيز استقرار النموذج. من الجدير بالذكر أنه لمعالجة عدم توازن الفئات في بيانات التدريب، تم تقليل الفئة الغالبة لتحقيق نسبة 1:3. تم تطبيق هذا التقليل فقط على مجموعة التدريب.
الأفراد الذين لديهم نتيجة الاهتمام في كلا المجموعتين، تم تقسيم البيانات بناءً على المتغير الناتج. بمجرد الانتهاء من التقسيم، خضعت مجموعة بيانات التدريب لمزيد من المعالجة المسبقة. تم تحويل جميع الميزات الفئوية إلى متغيرات عددية باستخدام ترميز واحد حار. تم تحديد المتغيرات ذات التباين المنخفض جدًا وإزالتها لتعزيز استقرار النموذج. من الجدير بالذكر أنه لمعالجة عدم توازن الفئات في بيانات التدريب، تم تقليل الفئة الغالبة لتحقيق نسبة 1:3. تم تطبيق هذا التقليل فقط على مجموعة التدريب.
بينما تم تعلم بعض خطوات المعالجة المسبقة مثل الترميز الواحد الحار وتصنيف التباين من بيانات التدريب، تم تطبيق تحولاتهم بشكل متسق على كل من مجموعات التدريب والتحقق. ومع ذلك، تم تطبيق خطوة التقليل حصريًا على بيانات التدريب ولم تؤثر على مجموعة بيانات التحقق.
تعديل المعلمات الفائقة
يعد أخذ عينات الهيبركيوب اللاتيني طريقة لتوليد مجموعات من قيم المعلمات التي تتوزع بالتساوي عبر فضاء المعلمات. يمكن استخدام هذه الطريقة لتعديل المعلمات الفائقة في التعلم الآلي للبحث بكفاءة عن التركيبة المثلى من المعلمات الفائقة
تقييم النموذج
على الرغم من أن المقياس الأساسي للأداء كان ROC-AUC، نظرًا لموثوقيته في مجموعات البيانات غير المتوازنة
قيم شابلي (تفسير النموذج وأهمية الميزات)
تفسير شابلي الإضافي (Shap) هو تقنية تستخدم لشرح التنبؤات التي تقوم بها نماذج التعلم الآلي
نموذج مع الميزات المختارة
احتوى النموذج الرئيسي على 419 ميزة، وتم تحديد أعلى 10 ميزات ذات أعلى قيمة تنبؤية باستخدام قيم شابلي. تم تطوير نموذج XGBoost مخفض باستخدام نفس تقسيم التدريب/التحقق، ومعالجة الميزات، وتعديل المعلمات الفائقة مثل النموذج الرئيسي. تم مقارنة أداء كل من النموذجين الرئيسي والمخفض بناءً على قدرتهما على التنبؤ باستخدام مقاييس مختلفة مثل ROC-AUC، والدقة، والحساسية، والخصوصية.
نماذج محددة حسب الجنس
لمقارنة المتنبئين المهمين للسكري للنساء والرجال بشكل منفصل، تم بناء نموذجين إضافيين عن طريق تقسيم السكان الإجمالي حسب الجنس. ثم تم استخدام الرسوم البيانية الملخصة لشابلي لوصف أهم 10 متنبئين لكل جنس. اتبعت تطوير هذه النماذج نفس الإجراء مثل النموذج الرئيسي، باستثناء إضافة عوامل محددة حسب الجنس لم يتم تضمينها في النموذج الرئيسي. بالنسبة لمجموعة الإناث، تم تضمين 30 عاملًا متعلقًا بالحيض، والحمل، والولادة، وانقطاع الطمث، واستخدام العلاج بالهرمونات البديلة. بالنسبة لمجموعة الذكور، تضمنت الميزات المضافة العمر النسبي لنمو الشعر في الوجه، والعمر النسبي لتغير الصوت، ونمط الشعر/الصلع، وعدد الأطفال الذين أنجبهم.
تم إجراء جميع إعداد البيانات وهندسة النموذج باستخدام R مع إصدار RStudio Workbench 1.4.1717-3. تم استخدام إطار عمل Tidymodels لبناء النماذج
موافقة الأخلاقيات
تلتزم الدراسة الحالية بالمعايير الأخلاقية للسلطة السويدية لمراجعة الأخلاقيات، التي وافقت على منهجية البحث، مؤكدة الامتثال للمبادئ والإرشادات الأخلاقية المعنية. تم تنفيذ جميع الإجراءات التي تشمل المشاركين البشريين وفقًا لإعلان هلسنكي والإرشادات/التنظيمات ذات الصلة. حصل بنك المملكة المتحدة الحيوي على موافقة خطية مستنيرة من جميع المشاركين قبل إدراجهم في الدراسة، مما يضمن أن جميع الطرق تم تنفيذها وفقًا للمعايير الأخلاقية المذكورة أعلاه.
النتيجة
شملت الدراسة ما مجموعه 448,277 مشاركًا، من بينهم
أظهر HbA1c أقوى قدرة تنبؤية لمرض السكري من النوع 2، يليه مؤشر كتلة الجسم، محيط الخصر، مستويات السكر في الدم، عدد الأقارب من الدرجة الأولى المصابين بالسكري، GGT، نسبة الخصر إلى الورك، كوليسترول HDL، العمر، ومستويات اليورات. كانت القيم المرتفعة للمتغيرات الخام مرتبطة إيجابيًا بزيادة خطر الإصابة بالسكري عبر جميع المتغيرات باستثناء كوليسترول HDL، حيث كانت القيمة العالية مرتبطة بانخفاض خطر الإصابة بالسكري (الشكل 1).
توفر مخططات الاعتماد فهماً أعمق للعلاقة بين متغير معين وخطر تطوير مرض السكري. في حالة HbA1c، يكشف الرسم البياني أن الأفراد الذين لديهم مستويات HbA1c
استنادًا إلى التحليل، وُجد أن أهم خمسة مؤشرات للذكور هي HbA1c، جلوكوز البلازما، مؤشر كتلة الجسم، التاريخ العائلي للسكري، و GGT. أما بالنسبة للإناث، فكانت المؤشرات الأكثر أهمية هي HbA1c، محيط الخصر، جلوكوز البلازما، التاريخ العائلي للسكري، وحمض اليوريك في المصل (المكملات).
مقارنة النماذج
تم اختيار المعلمات الفائقة للنموذج الرئيسي بناءً على ROC-AUC وكانت تتكون من mtry = 273، الأشجار
كانت قيمة ROC-AUC للنموذج الرئيسي على مجموعة التحقق 0.90، وكانت قيمة ROC-AUC للنموذج المختصر 0.88. كانت دقة كلا النموذجين 0.92. كانت الحساسية والنوعية للنموذج الرئيسي 0.62 و0.93 على التوالي، بينما كان للنموذج المختصر حساسية 0.57 ونوعية 0.93 (الجدول 3).
| بشكل عام | لا سكري | السكري | |
| ن | ٤٤٨,٢٧٧ | ٤٣٦,١٢٩ | 12,148 |
| ذكر (%) | ٤٣.٩ | ٤٣.٦ | ٥٥.٥ |
| العمر (المتوسط (الانحراف المعياري)) | ٥٦.١ (٨.١) | ٥٦.٠ (٨.١) | ٥٨.٦ (٧.٥) |
| مؤشر كتلة الجسم (المتوسط (الانحراف المعياري)) | ٢٧.٢ (٤.٦) | ٢٧.٠ (٤.٥) | ٣١.٥ (٥.٥) |
| نسبة الدهون في الجسم (المتوسط (الانحراف المعياري)) | 31.3 (8.5) | ٣١.٢ (٨.٥) | ٣٤.٩ (٨.٤) |
| نسبة المدخنين (%) | ٣٣.٨ | ٣٣.٧ | ٣٨.٧ |
| تناول الكحول الأسبوعي (عدد الوحدات/الأسبوع) | 14.8 (18.8) | 14.8 (18.7) | 14.3 (21.8) |
| ضغط الدم الانقباضي (المتوسط (الانحراف المعياري)) | ١٣٧.٤ (١٨.٦) | ١٣٧.٣ (١٨.٦) | ١٤٣.٩ (١٨.٥) |
| ضغط الدم الانبساطي (المتوسط (الانحراف المعياري)) | 82.3 (10.1) | 82.2 (10.1) | ٨٥.٣ (١٠.٤) |
| HbA1c (المتوسط (الانحراف المعياري)) | ٣٥٫٠ (٣٫٧) | ٣٤.٨ (٣.٦) | ٤٠.١ (٤.٢) |
| LDL (المتوسط (الانحراف المعياري)) | 3.6 (0.9) | 3.6 (0.8) | 3.5 (0.9) |
| HDL (المتوسط (الانحراف المعياري)) | 1.5 (0.4) | 1.5 (0.4) | ١.٢ (٠.٣) |
| الدهون الثلاثية (المتوسط (الانحراف المعياري)) | 1.7 (1.0) | 1.7 (1.0) | ٢.٤ (١.٣) |
| علاج خفض الدهون (%) | 16.3 | 15.8 | ٣٤.١ |
الجدول 1. الخصائص الأساسية لسكان الدراسة مقسمة حسب حدوث مرض السكري خلال فترة الدراسة. بالنسبة للمتغيرات المستمرة، يتم الإبلاغ عن المتوسطات والانحرافات المعيارية. بالنسبة للمتغيرات الفئوية، يتم الإبلاغ عن النسب المئوية. يتم تقديم استهلاك الكحول من حيث عدد الوحدات القياسية المستهلكة في الأسبوع، حيث يتم تعريف وحدة واحدة على أنها 10 مل أو 8 جرامات من الكحول النقي وفقًا لإرشادات NHS.
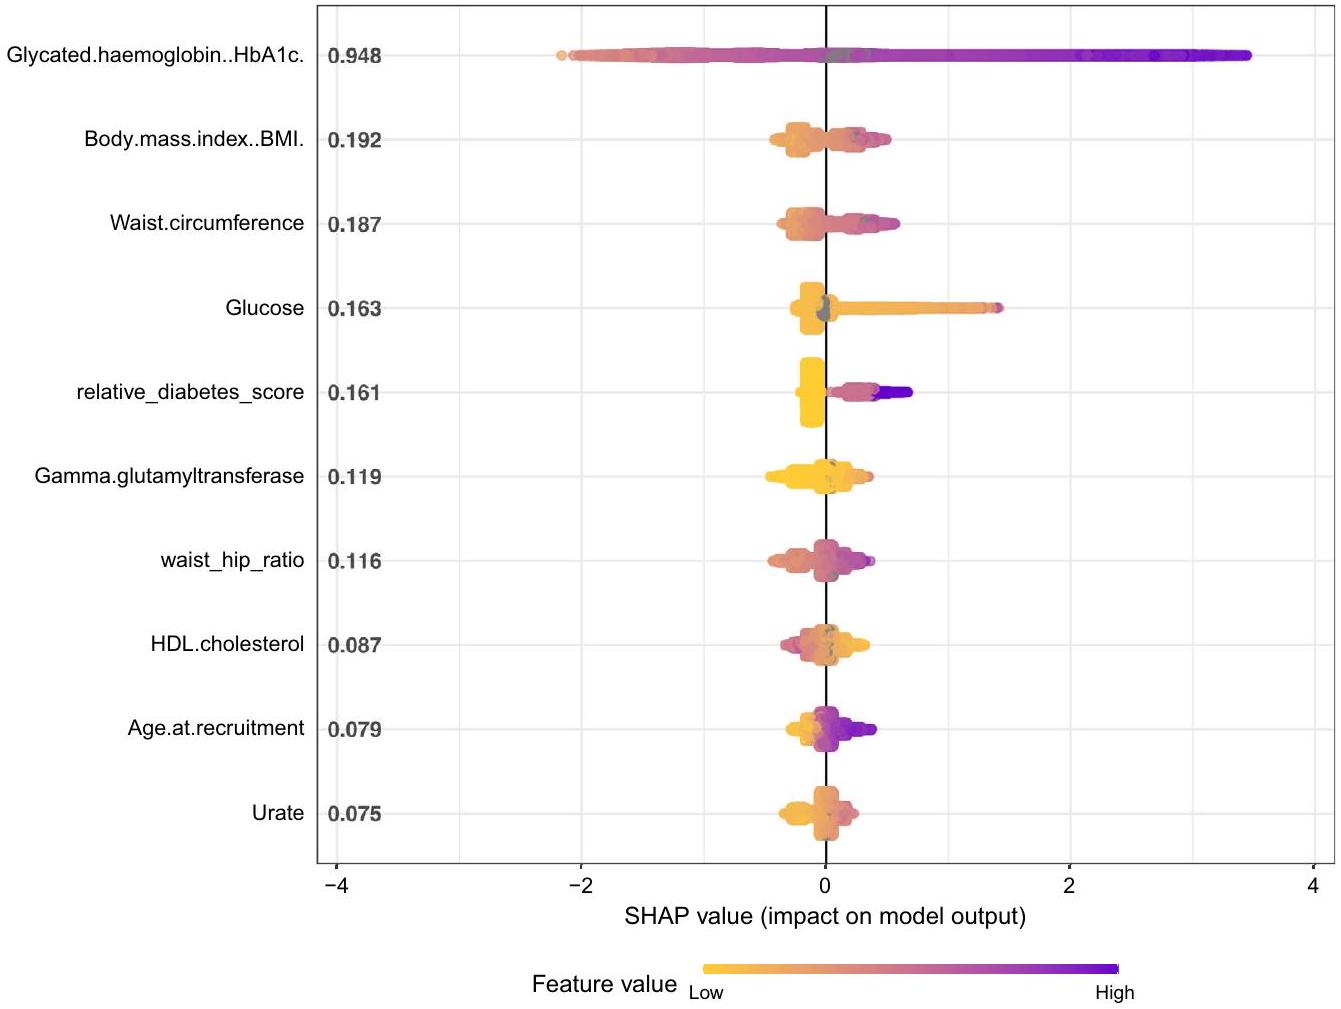
الشكل 1. يوضح رسم ملخص Shap القيم المطلقة المتوسطة المرتبة لكل متغير في مجموعة البيانات على
الشكل 2. (أ-ي) تُعرض رسوم بيانية اعتماد شاب كرسوم مبعثرة، حيث يتم تمثيل كل مشارك كنقطة بيانات. تُظهر هذه الرسوم المبثوثة قيمة شاب المرسومة مقابل القيمة الخام الأساسية للمتغيرات المعنية. تتجاوز قيم شاب الـ
| مصفوفة الارتباك للنموذج الرئيسي | مصفوفة الالتباس للنموذج المختصر | ||||||
| الحقيقة | الحقيقة | ||||||
| 1 | 0 | 1 | 0 | ||||
| تنبؤ | 1 | 1554 | 5902 | تنبؤ | 1 | 1419 | 5976 |
| 0 | 941 | 81,259 | 0 | 1076 | 81,185 | ||
الجدول 2. النموذج الرئيسي: نموذج XGBoost مع جميع الميزات المتاحة. النموذج المختصر: نموذج XGBoost مع 10 ميزات فقط الأكثر تأثيرًا بناءً على قيم Shap. تلخص هذه المصفوفات أداء كل نموذج في تصنيف الحالات على أنها إيجابية (1) أو سلبية (0).
| أداء النموذج | ||
| مقياس | النموذج الرئيسي | نموذج مخفض |
| منحنى التشغيل الاستقبالي – منطقة تحت المنحنى | 0.903 (95% CI 0.900-0.909) | 0.881 (95% CI 0.875-0.888) |
| دقة | 0.924 (95% CI 0.922-0.925) | 0.921 (95% CI 0.920-0.923) |
| حساسية | 0.623 (فترة الثقة 95% 0.603-0.641) | 0.569 (95% CI 0.549-0.587) |
| خصوصية | 0.932 (95% CI 0.930-0.934) | 0.931 (95% CI 0.930-0.933) |
| مقياس F1 | 0.311 (95% CI 0.300-0.323) | 0.287 (95% CI 0.275-0.300) |
| دقة | 0.207 (95% CI 0.198-0.217) | 0.192 (95% CI 0.183-0.201) |
| مساحة تحت منحنى الدقة والاسترجاع | 0.291 (فترة الثقة 95% 0.275-0.309) | 0.255 (95% CI 0.239-0.272) |
الجدول 3. ROC-AUC: يرسم معدل الإيجابيات الحقيقية مقابل معدل الإيجابيات الكاذبة. AUC يمثل المساحة تحت هذه المنحنى. الدقة: (TP+TN)/(TP+TN+FP+FN). الحساسية (أو الاسترجاع): TP/(TP+FN). الخصوصية: TN/(TN + FP). مقياس F1: المتوسط التوافقي للدقة والحساسية. الدقة: TP/(TP + FP). PR-AUC: المساحة تحت منحنى الدقة والاسترجاع، حيث يتم رسم الدقة مقابل الاسترجاع. TP = إيجابي حقيقي؛ TN = سلبي حقيقي؛ FP = إيجابي كاذب؛ FN = سلبي كاذب.
نقاش
في هذه الدراسة البحثية، كشفت تحليلاتنا أن مستويات HbA1c المقاسة في البداية كانت العامل الأكثر تأثيرًا في التنبؤ بخطر تطوير مرض السكري من النوع 2 خلال فترة 10 سنوات. كما أظهرت مؤشرات كتلة الجسم، محيط الخصر، مستوى الجلوكوز في البلازما، التاريخ العائلي للسكري، GGT، نسبة الخصر إلى الورك، كوليسترول HDL، العمر، ومستويات حمض اليوريك في المصل قوة تنبؤية كبيرة. من خلال استخدام هذه العوامل العشرة المتاحة بسهولة وبتكلفة منخفضة، تمكنا من التنبؤ بخطر الإصابة بالسكري بدقة عالية.
لقد أظهرت تقنيات التعلم الآلي سابقًا قدرتها على التنبؤ بدقة بمخاطر الإصابة بمرض السكري المستقبلي وأمراض مزمنة أخرى. كان هدف دراستنا ليس إثبات جدوى مثل هذه التنبؤات، بل تحديد أهم العوامل التي تؤثر على خطر تطوير مرض السكري. يوفر بنك المملكة المتحدة الحيوي ميزة المعلومات الأساسية التفصيلية عن المشاركين، بما في ذلك عادات الحياة، وتكوين الجسم، والخلفية الاجتماعية والاقتصادية. تظهر نتائجنا أن العوامل البيولوجية هي أكثر المؤشرات أهمية على خطر الإصابة بمرض السكري، في حين أن المعلومات حول عادات الحياة، وتفضيلات الطعام، والوضع الاجتماعي والاقتصادي، والنشاط البدني لها تأثير ضئيل فقط على دقة التنبؤ في مجموعة بنك المملكة المتحدة الحيوي.
عادة ما يُعرَّف متلازمة الأيض بأنها حالة مرضية تتميز بالسمنة البطنية، مقاومة الأنسولين، ارتفاع ضغط الدم، وارتفاع مستويات الدهون في الدم.
GGT هو إنزيم يُستخدم عادةً في البيئات السريرية كعلامة لوظيفة الكبد واستهلاك الكحول. ومع ذلك، تشير الأدلة الناشئة إلى وجود ارتباط إيجابي كبير بين مستويات GGT وظهور مرض السكري من النوع 2.
ثلاثة من بين العشرة الأكثر تأثيرًا في دراستنا كانت القياسات الأنثروبومترية، وتحديدًا مؤشر كتلة الجسم (BMI)، محيط الخصر، ونسبة الخصر إلى الورك. على الرغم من أن مؤشر كتلة الجسم يُستخدم بشكل شائع، إلا أنه يوفر
معلومات عن السمنة العامة، بينما محيط الخصر ونسبة الخصر إلى الورك تعكس بشكل أكبر السمنة المركزية، التي لها ارتباط أقوى بالتغيرات الأيضية السلبية في الجسم. ومع ذلك، فإن الأبحاث التي تقارن القوة التنبؤية لمؤشر كتلة الجسم وقياسات الخصر بالنسبة لمرض السكري قد أسفرت عن نتائج متضاربة.
معلومات عن السمنة العامة، بينما محيط الخصر ونسبة الخصر إلى الورك تعكس بشكل أكبر السمنة المركزية، التي لها ارتباط أقوى بالتغيرات الأيضية السلبية في الجسم. ومع ذلك، فإن الأبحاث التي تقارن القوة التنبؤية لمؤشر كتلة الجسم وقياسات الخصر بالنسبة لمرض السكري قد أسفرت عن نتائج متضاربة.
على الرغم من أن داء السكري من النوع 2 له أساس وراثي قوي، إلا أن هذه الدراسة قد ركزت بشكل أساسي على الميزات الظاهرية. بينما تم ربط العديد من المواقع الجينية بزيادة خطر الإصابة بداء السكري من النوع 2، فقد أظهرت قدرتها على التنبؤ بدقة بظهور المرض أنها، في أفضل الأحوال، متواضعة.
تمت ملاحظة اختلافات بين الجنسين في المؤشرات المهمة لمرض السكري في دراستنا. بالنسبة للذكور، كان هناك علامتان مرتبطتان بوظيفة الكلى (الميكروألبومين في البول والسيستاتين C) من بين أفضل 10 مؤشرات. ومن المثير للاهتمام أن نتائجنا أظهرت أن اليورات هو واحد من أهم المؤشرات لمرض السكري من النوع 2، متجاوزًا عوامل معروفة مثل مستوى النشاط والعادات الغذائية. ومن الجدير بالذكر أن قوة التنبؤ باليورات كانت أقوى لدى النساء مقارنة بالرجال. هذه الملاحظة تتماشى مع دراسات سابقة، بما في ذلك دراسة في الصين التي وجدت أن مستويات اليورات العالية كانت مرتبطة بزيادة خطر الإصابة بالسكري فقط لدى النساء، وليس لدى…
تعتبر البيانات غير المتوازنة عقبة شائعة عند تطوير نماذج التصنيف لحالات مثل داء السكري من النوع الثاني. نظرًا لأن الغالبية العظمى من المشاركين لن يصابوا بالمرض، فإن البيانات تميل بشدة نحو الفئة الأكبر (بدون سكري)، مما يؤدي إلى وجود فئة أقلية صغيرة (سكري). غالبًا ما يؤدي هذا التفاوت إلى تحيز في تطوير النماذج، حيث تعطي العديد من الخوارزميات الأولوية للتعرف بشكل صحيح على الفئة الكبرى. لمعالجة ذلك، استخدمت دراستنا تقليل حجم الفئة الكبرى أثناء تدريب النموذج.
على الرغم من هذه التدابير، عند فحص مقاييس التقييم الحساسة لعدم توازن البيانات، يتضح أن نموذجنا لا يحقق النتائج المطلوبة بشكل متسق. تشير الأبحاث إلى أن مجموعات البيانات المدمجة والنظيفة التي تحتوي على عدد محدود من العينات والميزات تميل إلى إنتاج توقعات أكثر دقة.
تشمل إحدى قيود الدراسة تأثير “المتطوعين الأصحاء”، حيث يميل المشاركون في بنك المملكة المتحدة الحيوي إلى أن يكونوا أكثر صحة من السكان العامين.
نموذجنا التنبؤي يشمل الأفراد المعرضين للإصابة بالسكري، مما يتماشى مع تطبيقه المقصود عبر مجموعة واسعة من السكان غير المصابين بالسكري. بينما قد يؤدي هذا الإدراج إلى رفع بعض المقاييس، مثل ROC-AUC، فإنه يضمن أيضًا الفائدة السريرية للنموذج في تحديد أولئك الذين هم في أعلى خطر والذين يمكن أن يستفيدوا بشكل كبير من استراتيجيات التدخل المبكر. توضح تحليل الحساسية، المقدم في المواد التكميلية، أداء النموذج المتسق حتى عند استبعاد المعرضين للإصابة بالسكري، مما يبرز استقرار النموذج. نحن نعترف بالتأثير المحتمل على أهمية المتنبئين كحد من القيود ونقترح سبلًا لمزيد من البحث لتعزيز دقة النموذج.
تتمتع هذه الدراسة بقوة كبيرة في مجموعة بياناتها الواسعة وغير المختارة إلى حد كبير، مما يسمح بتحليل غير متحيز. على حد علمنا، هي الدراسة الأكثر شمولاً حول العوامل الظاهرة للتنبؤ بالسكري في المستقبل. بالإضافة إلى ذلك، تستخدم الدراسة خوارزميات التعلم الآلي المتطورة مثل XGboost وShap Values، مما يضيف إلى قوة ودقة النتائج.
الخاتمة
تشير نتائج هذه الدراسة إلى أن العوامل البيولوجية القابلة للقياس بسهولة هي أكثر المتنبئين أهمية بالنوع الثاني من السكري، متفوقة على عوامل الخطر المعروفة مثل العوامل الغذائية، مستوى النشاط البدني، والحالة الاجتماعية الاقتصادية. كما توضح الدراسة أنه يمكن تحقيق دقة عالية في التنبؤ بالنوع الثاني من السكري باستخدام فقط أهم 10 ميزات، بينما يؤدي إضافة العديد من العوامل الأخرى إلى تحسين دقة التنبؤ بشكل طفيف.
توفر البيانات
تأتي مجموعات البيانات المستخدمة والمحللة في هذه الدراسة من بنك البيانات البريطاني تحت معرف المشروع 70236. نظرًا لأن مجموعات البيانات هي ملك لبنك البيانات البريطاني، فهي غير متاحة للطلب المباشر. ومع ذلك، يمكن للباحثين المهتمين التقدم للحصول على الوصول من خلال نظام إدارة الوصول لبنك البيانات البريطاني على https://www.ukbiobank.ac.uk/ enable-your-research/access-our-data/.
تاريخ الاستلام: 17 سبتمبر 2023؛ تاريخ القبول: 12 يناير 2024
تم النشر عبر الإنترنت: 24 يناير 2024
تم النشر عبر الإنترنت: 24 يناير 2024
References
- Saeedi, P. et al. Global and regional diabetes prevalence estimates for 2019 and projections for 2030 and 2045: Results from the international diabetes federation diabetes atlas, 9(th) edition. Diabetes Res. Clin. Pract. 157, 107843 (2019).
- Group, T.D.P.P.R. The diabetes prevention program (dpp): Description of lifestyle intervention. Diabetes Care. 25(12), 2165-2171 (2002).
- Knowler, W. C. et al. Reduction in the incidence of type 2 diabetes with lifestyle intervention or metformin. N. Engl. J. Med. 346(6), 393-403 (2002).
- Gillies, C. L. et al. Pharmacological and lifestyle interventions to prevent or delay type 2 diabetes in people with impaired glucose tolerance: Systematic review and meta-analysis. BMJ. 334(7588), 299 (2007).
- Uusitupa, M. et al. Prevention of type 2 diabetes by lifestyle changes: A systematic review and meta-analysis. Nutrients. 11(11), 2611 (2019).
- Gedebjerg, A. et al. Prevalence of micro- and macrovascular diabetes complications at time of type 2 diabetes diagnosis and associated clinical characteristics: A cross-sectional baseline study of 6958 patients in the Danish dd2 cohort. J. Diabetes Complicat. 32(1), 34-40 (2018).
- Fregoso-Aparicio, L., Noguez, J., Montesinos, L. & Garcia-Garcia, J. A. Machine learning and deep learning predictive models for type 2 diabetes: A systematic review. Diabetol. Metab. Syndr. 13(1), 148 (2021).
- Silva, K. et al. Use and performance of machine learning models for type 2 diabetes prediction in community settings: A systematic review and meta-analysis. Int. J. Med. Inform. 143, 104268 (2020).
- Bradbury, K. E., Young, H. J., Guo, W. & Key, T. J. Dietary assessment in uk biobank: An evaluation of the performance of the touchscreen dietary questionnaire. J. Nutr. Sci. 7, e6 (2018).
- Craig, C. L. et al. International physical activity questionnaire: 12-country reliability and validity. Med. Sci. Sports Exerc. 35(8), 1381-1395 (2003).
- Chen, T. & Guestrin, C. editors. Xgboost: A scalable tree boosting system. In Proceedings of the 22nd ACM SIGKDD International Conference on Knowledge Discovery and Data Mining (2016).
- Mitchell, R. & Frank, E. Accelerating the XGBoost algorithm using GPU computing. PeerJ Comput. Sci. 3, e127 (2017).
- Davagdorj, K., Pham, V. H., Theera-Umpon, N. & Ryu, K. H. Xgboost-based framework for smoking-induced noncommunicable disease prediction. Int. J. Environ. Res. Public Health. 17(18), 6513 (2020).
- Helton, J. C. & Davis, F. J. Latin hypercube sampling and the propagation of uncertainty in analyses of complex systems. Reliab. Eng. Syst. Saf. 81(1), 23-69 (2003).
- Lundberg, S. M., Erion, G. G. & Lee, S.-I. Consistent individualized feature attribution for tree ensembles (2018) [arXiv:1802. 03888]. https://ui.adsabs.harvard.edu/abs/2018arXiv180203888L.
- Lundberg, S. M. & Lee, S.-I. A unified approach to interpreting model predictions. Adv. Neural Inf. Process. Syst. 30, 4-5 (2017).
- Kuhn, M. |& Silge, J. Tidy modeling with r : O’Reilly Media (2022).
- Alberti, K. G. M. M. et al. Harmonizing the metabolic syndrome. Circulation. 120(16), 1640-1645 (2009).
- Lee, D. H. et al. Gamma-glutamyltransferase and diabetes-A 4 year follow-up study. Diabetologia. 46(3), 359-364 (2003).
- Krishnan, E., Pandya, B. J., Chung, L., Hariri, A. & Dabbous, O. Hyperuricemia in young adults and risk of insulin resistance, prediabetes, and diabetes: A 15-year follow-up study. Am. J. Epidemiol. 176(2), 108-116 (2012).
- Baldwin, W. et al. Hyperuricemia as a mediator of the proinflammatory endocrine imbalance in the adipose tissue in a murine model of the metabolic syndrome. Diabetes. 60(4), 1258-1269 (2011).
- Vazquez, G., Duval, S., Jacobs, D. R. Jr. & Silventoinen, K. Comparison of body mass index, waist circumference, and waist/hip ratio in predicting incident diabetes: A meta-analysis. Epidemiol. Rev. 29, 115-128 (2007).
- Stevens, J. et al. Sensitivity and specificity of anthropometrics for the prediction of diabetes in a biracial cohort. Obes. Res. 9(11), 696-705 (2001).
- de Koning, L. et al. Anthropometric measures and glucose levels in a large multi-ethnic cohort of individuals at risk of developing type 2 diabetes. Diabetologia. 53(7), 1322-1330 (2010).
- Lyssenko, V. et al. Clinical risk factors, DNA variants, and the development of type 2 diabetes. N. Engl. J. Med. 359(21), 2220-2232 (2008).
- Lyssenko, V. & Laakso, M. Genetic screening for the risk of type 2 diabetes: Worthless or valuable?. Diabetes Care. 36(Suppl 2), S120-S126 (2013).
- Meigs, J. B. et al. Genotype score in addition to common risk factors for prediction of type 2 diabetes. N. Engl. J. Med. 359(21), 2208-2219 (2008).
- Cheng, D. et al. Serum uric acid and risk of incident diabetes in middle-aged and elderly chinese adults: Prospective cohort study. Front. Med. 14(6), 802-810 (2020).
- Fry, A. et al. Comparison of sociodemographic and health-related characteristics of uk biobank participants with those of the general population. Am. J. Epidemiol. 186(9), 1026-1034 (2017).
مساهمات المؤلفين
M.L. هو المؤلف الرئيسي وساهم بشكل كبير في تصور وتصميم وصياغة المخطوطة. لعب كل من M.L. وB.E. وA.R. دورًا حاسمًا في تطوير تصميم الدراسة، بالإضافة إلى تفسير النتائج. كان M.L. وE.H. مسؤولين عن إجراء تحليل البيانات، وكان جميع المؤلفين مشاركين في مراجعة وتنقيح المخطوطة. B.E. هو الضامن للعمل ومسؤول عن سلامة البيانات ودقة التحليل. يؤكد المؤلف المراسل أن جميع المؤلفين المدرجين يستوفون معايير التأليف وأنه لم يتم استبعاد أي مؤلفين آخرين يستوفون المعايير.
التمويل
تم توفير تمويل الوصول المفتوح من قبل جامعة غوتنبرغ.
المصالح المتنافسة
يبلغ B.E عن رسوم شخصية (لجان خبراء، محاضرات) من Amgen وAstraZeneca وBayer وBoehringer Ingelheim وEli Lilly وMerck Sharp & Dohme وMundipharma وNavamedic وNovo Nordisk وRLS Global وSanofi، جميعها خارج العمل المقدم. كما أن B.E مدعوم من “مؤسسة الملك غوستاف الخامس والملكة فيكتوريا”. جميع المؤلفين الآخرين يعلنون أنه لا توجد علاقات أو أنشطة قد تؤثر على، أو يُنظر إليها على أنها تؤثر على، مساهمتهم في هذه المخطوطة.
معلومات إضافية
المعلومات التكميلية النسخة عبر الإنترنت تحتوي على مواد تكميلية متاحة على https://doi.org/ 10.1038/s41598-024-52023-5.
يجب توجيه المراسلات وطلبات المواد إلى M.L.
معلومات إعادة الطبع والتصاريح متاحة على www.nature.com/reprints.
ملاحظة الناشر تظل Springer Nature محايدة فيما يتعلق بالمطالبات القضائية في الخرائط المنشورة والانتماءات المؤسسية.
معلومات إعادة الطبع والتصاريح متاحة على www.nature.com/reprints.
ملاحظة الناشر تظل Springer Nature محايدة فيما يتعلق بالمطالبات القضائية في الخرائط المنشورة والانتماءات المؤسسية.
الوصول المفتوح هذه المقالة مرخصة بموجب رخصة المشاع الإبداعي للاستخدام، والمشاركة، والتكيف، والتوزيع، وإعادة الإنتاج في أي وسيلة أو صيغة، طالما أنك تعطي الائتمان المناسب للمؤلفين الأصليين والمصدر، وتوفر رابطًا لرخصة المشاع الإبداعي، وتوضح ما إذا كانت هناك تغييرات قد تم إجراؤها. الصور أو المواد الأخرى من طرف ثالث في هذه المقالة مشمولة في رخصة المشاع الإبداعي للمقالة، ما لم يُذكر خلاف ذلك في سطر ائتمان للمادة. إذا لم تكن المادة مشمولة في رخصة المشاع الإبداعي للمقالة واستخدامك المقصود غير مسموح به بموجب اللوائح القانونية أو يتجاوز الاستخدام المسموح به، ستحتاج إلى الحصول على إذن مباشرة من صاحب حقوق الطبع والنشر. لعرض نسخة من هذه الرخصة، قم بزيارة http://creativecommons.org/licenses/by/4.0/.
© المؤلفون 2024
© المؤلفون 2024
معهد الطب، أكاديمية ساهلجرينسكا، جامعة غوتنبرغ، غوتنبرغ، السويد. قسم الطب، مستشفى ساهلجرينسكا الجامعي، غوتنبرغ، السويد. البريد الإلكتروني: Moa.lugner@gu.se
Journal: Scientific Reports, Volume: 14, Issue: 1
DOI: https://doi.org/10.1038/s41598-024-52023-5
PMID: https://pubmed.ncbi.nlm.nih.gov/38267466
Publication Date: 2024-01-24
DOI: https://doi.org/10.1038/s41598-024-52023-5
PMID: https://pubmed.ncbi.nlm.nih.gov/38267466
Publication Date: 2024-01-24
Identifying top ten predictors of type 2 diabetes through machine learning analysis of UK Biobank data
The study aimed to identify the most predictive factors for the development of type 2 diabetes. Using an XGboost classification model, we projected type 2 diabetes incidence over a 10 -year horizon. We deliberately minimized the selection of baseline factors to fully exploit the rich dataset from the UK Biobank. The predictive value of features was assessed using shap values, with model performance evaluated via Receiver Operating Characteristic Area Under the Curve, sensitivity, and specificity. Data from the UK Biobank, encompassing a vast population with comprehensive demographic and health data, was employed. The study enrolled 450,000 participants aged 40-69, excluding those with preexisting diabetes. Among 448,277 participants, 12,148 developed type 2 diabetes within a decade. HbA1c emerged as the foremost predictor, followed by BMI, waist circumference, blood glucose, family history of diabetes, gamma-glutamyl transferase, waist-hip ratio, HDL cholesterol, age, and urate. Our XGboost model achieved a Receiver Operating Characteristic Area Under the Curve of 0.9 for 10-year type 2 diabetes prediction, with a reduced 10 -feature model achieving 0.88 . Easily measurable biological factors surpassed traditional risk factors like diet, physical activity, and socioeconomic status in predicting type 2 diabetes. Furthermore, high prediction accuracy could be maintained using just the top 10 biological factors, with additional ones offering marginal improvements. These findings underscore the significance of biological markers in type 2 diabetes prediction.
Type 2 diabetes has emerged as one of the most prevalent chronic diseases worldwide, posing a significant economic and health burden on both individuals and society
Moreover, recent studies have revealed that nearly half of all adults affected by type 2 diabetes are neither diagnosed nor aware of their condition
Recent advances in machine learning and “big data” offer transformative potential in health research, allowing deeper insights from complex datasets that were previously elusive. However, when it comes to predicting type 2 diabetes, the field reveals a marked inconsistency, particularly in feature selection
in prediction models for type 2 diabetes, and our study seeks to address this gap. The purpose of this study is to identify the most significant factors that predict subsequent type 2 diabetes. An agnostic approach with minimal preconceptions and human intervention will be employed to achieve this objective. The utilization of the vast amount of information collected in the UK Biobank, combined with cutting-edge machine learning technologies, offers the opportunity to unveil previously unidentified factors contributing to diabetes risk. This approach also allows us to elucidate the relationships between already established risk factors, and to determine which factors possess the highest predictive power for type 2 diabetes.
Methods
Data
All data utilized in this study were obtained from the UK Biobank, a comprehensive biomedical database that has accumulated extensive health information from 502,625 individuals resident in the UK. Between 2006 and 2010, baseline assessments were conducted on participants aged 40 to 69 years through a combination of touchscreen questionnaires, nurse-led interviews, and various tests and measurements. Information on dietary habits were assembled using a food frequency questionnaire, that has been shown to reliably rank participants according to intakes of the main food groups
Outcome
The primary endpoint of this study was the incidence of type 2 diabetes within a 10-year period following the baseline assessment ( 3650 days). To determine this outcome, we utilized the “first occurrence” category in the UK Biobank, which contains two data fields for each code mapped to 3-character ICD-10. The first field represents the date of the first reporting of the ICD code, and the second field contains the source where the code was initially recorded. The sources included Read code information in the Primary Care data, ICD-9 and ICD-10 codes in the Hospital inpatient data, ICD-10 codes in Death Register records, and self-reported medical condition codes reported at subsequent UK Biobank assessment centre visits. In this study, the outcome variable was defined as any report of ICD code E11 (non-insulin-dependent diabetes mellitus) during the 10-year study period.
Exclusion criteria
Individuals who had diabetes at baseline were excluded from the study. Specifically, those who had either selfreported having diabetes at the baseline interview or had a measured
Variable selection
Our variable selection approach was both intentional and informed by expert judgment. From the outset, our primary objective was to preserve as much information as possible to facilitate an unbiased analysis rich in details about the participants. With this aim in mind, we began by excluding any variables that were collected after the baseline assessment, as we were committed to using only baseline data for predictive modeling. Subsequently, we meticulously assessed the baseline data to guarantee its relevance and accuracy. This assessment was a manual process where each variable was assessed for its contribution to a comprehensive understanding of a participant’s health, lifestyle, and socio-economic status. Only variables that were deemed unrelated to these key areas, or that did not provide additional insight, were set aside. For instance, data attributes such as the serial numbers of measuring devices, the duration of tests, or reasons for skipping certain tests were disregarded since they did not impart meaningful information about the participants. In situations where duplicate variables existed, like two separate measurements of a participant’s blood pressure, we averaged the values and represented them with a single variable. Following this, we identified 111 variables that had more than
Model development
The classification model used in this study employed the extreme gradient boosting (XGBoost) algorithm, which is a widely used ensemble learning technique
of individuals with the outcome of interest was balanced in both sets, the split was stratified based on the outcome variable. Once the split was completed, the training dataset underwent additional preprocessing. All categorical features were converted into numerical variables using one-hot encoding. Variables with very low variance were identified and removed to enhance model stability. Notably, to address class imbalances in the training data, the majority class was downsampled to achieve a 1:3 ratio. This downsampling was only applied to the training set.
of individuals with the outcome of interest was balanced in both sets, the split was stratified based on the outcome variable. Once the split was completed, the training dataset underwent additional preprocessing. All categorical features were converted into numerical variables using one-hot encoding. Variables with very low variance were identified and removed to enhance model stability. Notably, to address class imbalances in the training data, the majority class was downsampled to achieve a 1:3 ratio. This downsampling was only applied to the training set.
While certain preprocessing steps such as one-hot encoding and variance filtering were learned from the training data, their transformations were consistently applied to both the training and validation sets. However, the downsampling step was exclusively applied to the training data and did not affect the validation dataset.
Hyperparameter tuning
Latin hypercube sampling is a method for generating sets of parameter values that are evenly distributed across the parameter space. This method can be used for hyperparameter tuning in machine learning to efficiently search for the optimal combination of hyperparameters
Model evaluation
Although the primary performance metric was ROC-AUC, due to its reliability in unbalanced datasets
Shapley values (model interpretability and feature importance)
SHapley Additive explanation (Shap) is a technique used to explain the predictions made by machine learning models
Model with selected features
The main model contained 419 features, and the top 10 features with the highest prediction value were identified using Shap values. A reduced XGBoost model was developed using the same train/validation split, feature preprocessing, and hyperparameter tuning as the main model. The performance of both the main and reduced models was compared based on their ability to predict using various metrics such as ROC-AUC, accuracy, sensitivity, and specificity.
Sex-specific models
To compare important predictors of diabetes for women and men separately, two additional models were constructed by dividing the total population by sex. Shap summary graphs were then used to describe the 10 most important predictors for each sex. The development of these models followed the same procedure as the main model, except for the addition of sex-specific factors that were not included in the main model. For the female cohort, 30 factors related to menstruation, pregnancy, childbirth, menopause, and use of hormone replacement therapy were included. For the male cohort, the added features included relative age of first facial hair, relative age voice broke, hair/balding pattern, and number of children fathered.
All data preparation and model engineering were performed using R with RStudio Workbench version 1.4.1717-3. Tidymodels framework was utilized to construct the models
Ethics approval
The present study adheres to the ethical standards of the Swedish Ethical Review Authority, which approved the research methodology, confirming compliance with the pertinent ethical principles and guidelines. All procedures involving human participants were performed in accordance with the Declaration of Helsinki and relevant guidelines/regulations. The UK Biobank obtained written informed consent from all participants prior to their inclusion in the study, ensuring that all methods were conducted in accordance with the aforementioned ethical standards.
Result
The study enrolled a total of 448,277 participants, of whom
HbAlc exhibited the strongest predictive power for type 2 diabetes, followed by BMI, waist circumference, blood glucose levels, the number of first-degree relatives with diabetes, GGT, waist-hip ratio, HDL cholesterol, age, and urate levels. Elevated raw variable values were positively associated with increased risk for diabetes across all variables except for HDL cholesterol, where a high value corresponded to a reduced diabetes risk (Fig. 1).
The dependency plots offer a deeper understanding of the association between a given variable and the risk of developing diabetes. In the case of HbA1c, the graph reveals that individuals with HbA1c levels
Based on the analysis, the top five predictors for males were found to be HbA1c, plasma glucose, BMI, family history of diabetes, and GGT. For females, the most significant predictors were HbAlc, waist circumference, plasma glucose, family history of diabetes, and serum urate (Supplements).
Model comparison
The hyperparameters selected for the main model were based on ROC-AUC and consisted of mtry = 273, trees
ROC-AUC for the main model on the validation set was 0.90 and ROC-AUC for the reduced model was 0.88 . The accuracy of both models was 0.92 . The sensitivity and specificity of the main model were 0.62 and 0.93 , respectively, while the reduced model had a sensitivity of 0.57 and a specificity of 0.93 (Table 3).
| Overall | No diabetes | Diabetes | |
| n | 448,277 | 436,129 | 12,148 |
| Male (%) | 43.9 | 43.6 | 55.5 |
| Age (mean (SD)) | 56.1 (8.1) | 56.0 (8.1) | 58.6 (7.5) |
| BMI (mean (SD)) | 27.2 (4.6) | 27.0 (4.5) | 31.5 (5.5) |
| Body fat percentage (mean (SD)) | 31.3 (8.5) | 31.2 (8.5) | 34.9 (8.4) |
| Currently smoking (%) | 33.8 | 33.7 | 38.7 |
| Weekly alcohol intake (n. of units/week) | 14.8 (18.8) | 14.8 (18.7) | 14.3 (21.8) |
| Systolic blood pressure (mean (SD)) | 137.4 (18.6) | 137.3 (18.6) | 143.9 (18.5) |
| Diastolic blood pressure (mean (SD)) | 82.3 (10.1) | 82.2 (10.1) | 85.3 (10.4) |
| HbAlc (mean (SD)) | 35.0 (3.7) | 34.8 (3.6) | 40.1 (4.2) |
| LDL (mean (SD)) | 3.6 (0.9) | 3.6 (0.8) | 3.5 (0.9) |
| HDL (mean (SD)) | 1.5 (0.4) | 1.5 (0.4) | 1.2 (0.3) |
| Triglycerides (mean (SD)) | 1.7 (1.0) | 1.7 (1.0) | 2.4 (1.3) |
| Lipid lowering treatment (%) | 16.3 | 15.8 | 34.1 |
Table 1. Baseline characteristics of study population stratified by incidence of diabetes during study period. For continuous variables, means and standard deviations are reported. For categorical variables, percentages are reported. Alcohol intake is presented in terms of the number of standard units consumed per week, with one unit defined as 10 ml or 8 g of pure alcohol according to NHS guidelines.
Figure 1. The Shap summary graph depicts the ranked mean absolute Shap values for each variable in the dataset on the
Figure 2. (a-j) The Shap dependency graphs are presented as scatterplots, with each participant being represented by a data point. These scatterplots depict the Shap value plotted against the underlying raw value for the variables under consideration. Shap values exceeding the
| Confusion matrix for main model | Confusion matrix for reduced model | ||||||
| Truth | Truth | ||||||
| 1 | 0 | 1 | 0 | ||||
| Prediction | 1 | 1554 | 5902 | Prediction | 1 | 1419 | 5976 |
| 0 | 941 | 81,259 | 0 | 1076 | 81,185 | ||
Table 2. Main model: XGBoost model with all available features included. Reduced model: XGBoost model with only the 10 most influential features based on Shap values. These matrices summarize the performance of each model in classifying instances as positive (1) or negative (0).
| Model performance | ||
| Metric | Main model | Reduced model |
| ROC-AUC | 0.903 (95% CI 0.900-0.909) | 0.881 (95% CI 0.875-0.888) |
| Accuracy | 0.924 (95% CI 0.922-0.925) | 0.921 (95% CI 0.920-0.923) |
| Sensitivity | 0.623 (95% CI 0.603-0.641) | 0.569 (95% CI 0.549-0.587) |
| Specificity | 0.932 (95% CI 0.930-0.934) | 0.931 (95% CI 0.930-0.933) |
| F1-measure | 0.311 (95% CI 0.300-0.323) | 0.287 (95% CI 0.275-0.300) |
| Precision | 0.207 (95% CI 0.198-0.217) | 0.192 (95% CI 0.183-0.201) |
| PR-AUC | 0.291 (95% CI 0.275-0.309) | 0.255(95% CI 0.239-0.272) |
Table 3. ROC-AUC: Plots the true positive rate against the false positive rate. AUC represents the area under this curve. Accuracy: (TP+TN)/(TP+TN+FP+FN). Sensitivity (or Recall): TP/(TP+FN). Specificity: TN/ (TN + FP). F1-measure: Harmonic mean of precision and sensitivity. Precision: TP/(TP + FP). PR-AUC: Area under the precision-recall curve, plotting precision against recall. TP=True Positive; TN=True Negative; FP = False Positive; FN=False Negative.
Discussion
In this research study, our analysis revealed that HbAlc levels measured at baseline were the most influential factor for predicting the risk of developing type 2 diabetes within a 10 -year timeframe. BMI, waist circumference, plasma glucose, family history of diabetes, GGT, waist-hip ratio, HDL cholesterol, age, and serum urate levels also exhibited significant predictive power. By utilizing these 10 readily available and cost-effective variables, we were able to predict the risk of diabetes with high precision.
Machine learning techniques have been previously shown to accurately predict the risk of future diabetes and other chronic diseases. The objective of our study was not to establish the feasibility of such predictions but rather to identify the most important factors that influence the risk of developing diabetes. The UK Biobank offers the advantage of detailed baseline information on participants, including lifestyle habits, body composition, and socio-economic background. Our results demonstrate that biological factors are the most significant predictors of diabetes risk, whereas information on lifestyle habits, food preferences, socio-economic status, and physical activity only have a minor impact on prediction accuracy in the UK Biobank cohort.
The metabolic syndrome is usually defined as a pathologic condition characterized by abdominal obesity, insulin resistance, hypertension, and hyperlipidemia
GGT is an enzyme commonly used in clinical settings as a marker for liver function and alcohol consumption. However, emerging evidence suggests a significant and positive dose-response association between GGT levels and the incidence of type 2 diabetes
Three of the ten most influential predictors in our study were anthropometric measurements, specifically body mass index (BMI), waist circumference, and waist-to-hip ratio. Although BMI is commonly used, it provides
information on overall obesity, while waist circumference and waist-to-hip ratio are more indicative of central obesity, which has an even stronger association with adverse metabolic changes in the body. However, research comparing the predictive power of BMI and waist measurements for diabetes has yielded conflicting results
information on overall obesity, while waist circumference and waist-to-hip ratio are more indicative of central obesity, which has an even stronger association with adverse metabolic changes in the body. However, research comparing the predictive power of BMI and waist measurements for diabetes has yielded conflicting results
Although type 2 diabetes has a strong genetic basis, this study has primarily focused on phenotypical features. While multiple genetic loci have been associated with a higher risk of type 2 diabetes, their ability to accurately predict the onset of the disease has been shown to be, at best, modest
Sex differences in important predictors of diabetes were observed in our study. For males, two markers associated with kidney function (microalbumin in urine and cystatin C) were among the top 10 predictors. Interestingly, our findings demonstrated that urate is one of the most significant predictors of type 2 diabetes, surpassing well-established factors like activity level and dietary habits. Notably, the predictive power of urate was stronger for women than men. This observation is consistent with previous studies, including a study in China which found that high urate levels were associated with an increased risk of diabetes only in women, but not in
Imbalanced data is a frequent obstacle when developing classification models for conditions like type 2 diabetes. Given that a majority of participants will not develop the disease, the data leans heavily towards the larger class (no diabetes), yielding a diminutive minority class (diabetes). This disproportion often biases model development, with many algorithms giving precedence to correctly identifying the majority class. To address this, our study employed downsampling of the majority class during model training.
Despite these measures, when examining evaluation metrics sensitive to data imbalance, it’s evident that our model doesn’t consistently hit the mark. Research indicates that compact, clean datasets with a limited number of samples and features tend to produce more accurate predictions
Another limitation of the study include the “healthy volunteer” effect, where participants in UK Biobank tend to be healthier than the general population
Our predictive model includes pre-diabetic individuals, which aligns with its intended application across a broad non-diabetic population. While this inclusion may elevate certain metrics, such as the ROC-AUC, it also ensures the model’s clinical utility in identifying those at the highest risk who could derive significant benefit from early intervention strategies. A sensitivity analysis, provided in the supplementary material, demonstrates consistent model performance even when pre-diabetics are excluded, underscoring the model’s stability. We acknowledge the potential impact on the significance of predictors as a limitation and suggest avenues for further research to enhance the model’s precision.
This study has a significant strength in its extensive and largely unselected dataset, which allows for an unbiased analysis. To our knowledge, it is the most comprehensive study on phenotypical factors to predict future diabetes. Additionally, the study employs state-of-the-art machine learning algorithms such as XGboost and Shap Values, which adds to the robustness and accuracy of the results.
Conclusion
The results of this study suggest that easily measurable biological factors are the most significant predictors of type 2 diabetes, outperforming known risk factors such as dietary factors, physical activity level, and socioeconomic status. The study also demonstrates that high accuracy in predicting type 2 diabetes can be achieved using only the 10 most important features, while the addition of numerous other factors only marginally improving precision.
Data availability
The datasets used and analyzed in this study originate from the UK Biobank under project ID 70236. Since the datasets are the property of UK Biobank, they are not available for direct request. However, interested researchers can apply for access through the UK Biobank Access Management System at https://www.ukbiobank.ac.uk/ enable-your-research/access-our-data/.
Received: 17 September 2023; Accepted: 12 January 2024
Published online: 24 January 2024
Published online: 24 January 2024
References
- Saeedi, P. et al. Global and regional diabetes prevalence estimates for 2019 and projections for 2030 and 2045: Results from the international diabetes federation diabetes atlas, 9(th) edition. Diabetes Res. Clin. Pract. 157, 107843 (2019).
- Group, T.D.P.P.R. The diabetes prevention program (dpp): Description of lifestyle intervention. Diabetes Care. 25(12), 2165-2171 (2002).
- Knowler, W. C. et al. Reduction in the incidence of type 2 diabetes with lifestyle intervention or metformin. N. Engl. J. Med. 346(6), 393-403 (2002).
- Gillies, C. L. et al. Pharmacological and lifestyle interventions to prevent or delay type 2 diabetes in people with impaired glucose tolerance: Systematic review and meta-analysis. BMJ. 334(7588), 299 (2007).
- Uusitupa, M. et al. Prevention of type 2 diabetes by lifestyle changes: A systematic review and meta-analysis. Nutrients. 11(11), 2611 (2019).
- Gedebjerg, A. et al. Prevalence of micro- and macrovascular diabetes complications at time of type 2 diabetes diagnosis and associated clinical characteristics: A cross-sectional baseline study of 6958 patients in the Danish dd2 cohort. J. Diabetes Complicat. 32(1), 34-40 (2018).
- Fregoso-Aparicio, L., Noguez, J., Montesinos, L. & Garcia-Garcia, J. A. Machine learning and deep learning predictive models for type 2 diabetes: A systematic review. Diabetol. Metab. Syndr. 13(1), 148 (2021).
- Silva, K. et al. Use and performance of machine learning models for type 2 diabetes prediction in community settings: A systematic review and meta-analysis. Int. J. Med. Inform. 143, 104268 (2020).
- Bradbury, K. E., Young, H. J., Guo, W. & Key, T. J. Dietary assessment in uk biobank: An evaluation of the performance of the touchscreen dietary questionnaire. J. Nutr. Sci. 7, e6 (2018).
- Craig, C. L. et al. International physical activity questionnaire: 12-country reliability and validity. Med. Sci. Sports Exerc. 35(8), 1381-1395 (2003).
- Chen, T. & Guestrin, C. editors. Xgboost: A scalable tree boosting system. In Proceedings of the 22nd ACM SIGKDD International Conference on Knowledge Discovery and Data Mining (2016).
- Mitchell, R. & Frank, E. Accelerating the XGBoost algorithm using GPU computing. PeerJ Comput. Sci. 3, e127 (2017).
- Davagdorj, K., Pham, V. H., Theera-Umpon, N. & Ryu, K. H. Xgboost-based framework for smoking-induced noncommunicable disease prediction. Int. J. Environ. Res. Public Health. 17(18), 6513 (2020).
- Helton, J. C. & Davis, F. J. Latin hypercube sampling and the propagation of uncertainty in analyses of complex systems. Reliab. Eng. Syst. Saf. 81(1), 23-69 (2003).
- Lundberg, S. M., Erion, G. G. & Lee, S.-I. Consistent individualized feature attribution for tree ensembles (2018) [arXiv:1802. 03888]. https://ui.adsabs.harvard.edu/abs/2018arXiv180203888L.
- Lundberg, S. M. & Lee, S.-I. A unified approach to interpreting model predictions. Adv. Neural Inf. Process. Syst. 30, 4-5 (2017).
- Kuhn, M. |& Silge, J. Tidy modeling with r : O’Reilly Media (2022).
- Alberti, K. G. M. M. et al. Harmonizing the metabolic syndrome. Circulation. 120(16), 1640-1645 (2009).
- Lee, D. H. et al. Gamma-glutamyltransferase and diabetes-A 4 year follow-up study. Diabetologia. 46(3), 359-364 (2003).
- Krishnan, E., Pandya, B. J., Chung, L., Hariri, A. & Dabbous, O. Hyperuricemia in young adults and risk of insulin resistance, prediabetes, and diabetes: A 15-year follow-up study. Am. J. Epidemiol. 176(2), 108-116 (2012).
- Baldwin, W. et al. Hyperuricemia as a mediator of the proinflammatory endocrine imbalance in the adipose tissue in a murine model of the metabolic syndrome. Diabetes. 60(4), 1258-1269 (2011).
- Vazquez, G., Duval, S., Jacobs, D. R. Jr. & Silventoinen, K. Comparison of body mass index, waist circumference, and waist/hip ratio in predicting incident diabetes: A meta-analysis. Epidemiol. Rev. 29, 115-128 (2007).
- Stevens, J. et al. Sensitivity and specificity of anthropometrics for the prediction of diabetes in a biracial cohort. Obes. Res. 9(11), 696-705 (2001).
- de Koning, L. et al. Anthropometric measures and glucose levels in a large multi-ethnic cohort of individuals at risk of developing type 2 diabetes. Diabetologia. 53(7), 1322-1330 (2010).
- Lyssenko, V. et al. Clinical risk factors, DNA variants, and the development of type 2 diabetes. N. Engl. J. Med. 359(21), 2220-2232 (2008).
- Lyssenko, V. & Laakso, M. Genetic screening for the risk of type 2 diabetes: Worthless or valuable?. Diabetes Care. 36(Suppl 2), S120-S126 (2013).
- Meigs, J. B. et al. Genotype score in addition to common risk factors for prediction of type 2 diabetes. N. Engl. J. Med. 359(21), 2208-2219 (2008).
- Cheng, D. et al. Serum uric acid and risk of incident diabetes in middle-aged and elderly chinese adults: Prospective cohort study. Front. Med. 14(6), 802-810 (2020).
- Fry, A. et al. Comparison of sociodemographic and health-related characteristics of uk biobank participants with those of the general population. Am. J. Epidemiol. 186(9), 1026-1034 (2017).
Author contributions
M.L. is the primary author and contributed significantly to the conception, design, and drafting of the manuscript. M.L., B.E., and A.R. all played a crucial role in the development of the study design, as well as the interpretation of the results. M.L. and E.H. were responsible for conducting the data analysis, and all authors were involved in reviewing and revising the manuscript. B.E. is the guarantor of the work and responsible for data integrity and accuracy of analysis. The corresponding author attests that all listed authors meet authorship criteria and that no others meeting the criteria have been omitted.
Funding
Open access funding provided by University of Gothenburg.
Competing interests
B.E reports personal fees (expert panels, lectures) from Amgen, AstraZeneca, Bayer, Boehringer Ingelheim, Eli Lilly, Merck Sharp & Dohme, Mundipharma, Navamedic, Novo Nordisk, RLS Global, and Sanofi, all outside the submitted work. B.E is also supported by “Konung Gustav V:s och Drottning Victorias Stiftelse”. All other authors declare that there are no relationships or activities that might bias, or be perceived to bias, their contribution to this manuscript.
Additional information
Supplementary Information The online version contains supplementary material available at https://doi.org/ 10.1038/s41598-024-52023-5.
Correspondence and requests for materials should be addressed to M.L.
Reprints and permissions information is available at www.nature.com/reprints.
Publisher’s note Springer Nature remains neutral with regard to jurisdictional claims in published maps and institutional affiliations.
Reprints and permissions information is available at www.nature.com/reprints.
Publisher’s note Springer Nature remains neutral with regard to jurisdictional claims in published maps and institutional affiliations.
Open Access This article is licensed under a Creative Commons Attribution 4.0 International License, which permits use, sharing, adaptation, distribution and reproduction in any medium or format, as long as you give appropriate credit to the original author(s) and the source, provide a link to the Creative Commons licence, and indicate if changes were made. The images or other third party material in this article are included in the article’s Creative Commons licence, unless indicated otherwise in a credit line to the material. If material is not included in the article’s Creative Commons licence and your intended use is not permitted by statutory regulation or exceeds the permitted use, you will need to obtain permission directly from the copyright holder. To view a copy of this licence, visit http://creativecommons.org/licenses/by/4.0/.
© The Author(s) 2024
© The Author(s) 2024
Institute of Medicine, Sahlgrenska Academy, University of Gothenburg, Gothenburg, Sweden. Department of Medicine, Sahlgrenska University Hospital, Gothenburg, Sweden. email: Moa.lugner@gu.se