تحسين انتشار الغاز في القطب الكهربائي مع هيكل مسامي فائق الكراهية للماء رقيق للغاية لتقليل CO2 الحمضي كهربائيًا Gas diffusion enhanced electrode with ultrathin superhydrophobic macropore structure for acidic CO2 electroreduction
ثاني أكسيد الكربون (تفاعل الاختزال الكهربائي ) يقدم استراتيجية واعدة لتحويل إلى مواد كيميائية وقود قيمة.في الإلكتروليتات الحمضية سيكون لها مزايا متعددة بسبب قمع تكوين الكربونات. ومع ذلك، فإن معدل تفاعلها محدود بشدة بسبب البطءانتشار بسبب غياب الهيدروكسيد الذي يسهل الانتشار في بيئة حمضية. هنا، نصمم هيكلًا مثاليًا لقطب كهربائي لانتشار الغاز (GDE) يستخدم طبقة ماكرو مسامية فائقة الكراهية للماء تعتمد على النحاس، حيث يتم تعزيز الانتشار بشكل كبير. يحتفظ هذا GDE بقدرته على التطبيق حتى في ظل ظروف التشوه الميكانيكي.في الإلكتروليتات الحمضية تظهر كفاءة فاراداي بكثافة تيار جزئية ( ) من لمنتجات متعددة الكربون ( )، و منعند تطبيق التخفيففي بيئة شديدة الحموضة،تحدث التكوين من خلال تفاعل من الدرجة الثانية يتم التحكم فيه بواسطة كل من المحفز وهيدروكسيده.
تحقيق الاستخدام الفعال لثاني أكسيد الكربون له أهمية كبيرة في تقليل الآثار السلبية لتغير المناخ والتخفيف من الأزمات الناجمة عن نقص الوقود الأحفوري الكهرباء المتجددة المدفوعةتفاعل اختزال ) إلى متعدد الكربون ( تُطلب المنتجات بشدة بسبب توفرها العالي في مجالات متنوعة وسعرها الحالي في السوق.على مدار السنوات القليلة الماضية، تم استخدام مفاعل من نوع التدفق للتحقيق فيأداء، حيث تتفاعل غازات المتفاعلات مباشرة مع واجهات المحفز-الالكتروليت من خلال طبقة انتشار الغاز (GDL)، حيثيمكن أن يحدث عند كثافة تيار عالية.
ومع ذلك، استخدمت معظم التقارير إلكتروليتات قلوية قوية لضمان ارتفاعالانتقائية في، مما يسبب استهلاك غير فارادايكي شديد لـبسبب تكوين الكربونات المفضل تحت الظروف القلوية ) ويؤدي إلى انخفاض استخدام الكربون . علاوة على ذلك، يؤدي التراكم طويل الأمد للكربونات إلى غمر قطب انتشار الغاز (GDE)، مما ينهي التفاعل (الشكل التوضيحي التكميلي 1). تشغيل تحت الظروف الحمضية، وبالتالي يقدم شيئًا مختلفًا تمامًا استراتيجية للتغلب على تحديات أنظمة الإلكتروليت القلوية التقليدية.
في السنوات الأخيرة، أصبح تطوير المحفزات عالية الانتقائية التي يمكن أن تقمع بفعالية تفاعل تطور الهيدروجين (HER) في البيئات الحمضية نقطة بحث ساخنة. بينما حققت بعض المحفزات المتقدمة تقدمًا في التخفيف من HER، إلا أنها تعاني من انخفاض كبير في الـمعدل مقارنة بالبيئات القلويةالسبب الرئيسي في هذه المسألة هو غياب أيون الهيدروكسيد) في بيئة حمضية، مما يتسبب في عدم كفاية الامتزاز الحمضيجزيئات الغاز وانتشار محدود لـإلى واجهة المحفز-الكهارل، مما يؤدي إلى انتشار تفاعل الهيدروجين غير المرغوب فيه، خاصة عند ارتفاع.
لتحقيق مستوى عالٍمن الضروري التغلب على هذه القيود الجوهرية فيتحت ظروف حمضية. إحدى الطرق المحتملة هي زيادة الـ التركيز عند واجهة المحفز-الكهربائي عن طريق زيادة التدفق في طبقة انتشار الغاز (GDL)، والتي يمكن أن تكون استراتيجية بسيطة وفعالة لتحسينالكفاءة. علاوة على ذلك، فإن المحفزات النحاسية المشتقة من الهيدروكسيد (OH) (لقد كانت
يعتبر واعدًا لتحقيق انتقائية عالية تجاهالمركبات بسبب وجود OH في هيكل المحفزيمكن أن تساعد الطبيعة الغنية بـ OH في المحفزات على زيادة درجة الحموضة في الطبقة الحفازة، مما يساهم بشكل فعال في قمع تفاعل تقليل الهيدروجين في البيئات الحمضية. بالإضافة إلى ذلك، تتكون الأقطاب الغازية السائلة عمومًا من مواد كربونية هشة وغير مرنة.مما يجعل GDEs مادة استهلاكية غير قابلة للاسترداد.
في هذه الدراسة، قمنا بإجراء تقييم منهجي للعوامل المؤثرة الانتشار في GDL. استنادًا إلى نتائجنا، قمنا بتصميم إلكترود نحاسي معزز بالانتشار الغازي (Cu-GDL) مصنوع بالكامل من المعدن باستخدام OH-Cu كعامل حفاز. أظهر هذا Cu-GDL كل من المرونة الميكانيكية وقابلية التطبيق، مما يجعله مناسبًا لمجموعة متنوعة من التطبيقات العملية. قمنا بتقييم الأداء في بيئة حمضية من خلال تحسين درجة حموضة الإلكتروليت، وكمية المحفز،معدل التدفق، نوع الإلكتروليت و التركيز. حققنا كفاءة فاراداي عالية من بكثافة تيار جزئية ( ) من لـالمنتجات، ومن التي تلبي التطبيقات الصناعية حتى مع التخفيف اكتشفنا حركيات فريدة من نوعهاعلى Cu -GDL تحت ظروف حمضية: تفاعل من الدرجة الأولى عند pH 6 وتفاعل من الدرجة الثانية عند pH 1. علاوة على ذلك، فإن CO المنتج فييمكن أن يتم تقليله أكثر إلىببطءمعدلات التدفق، مما يؤدي إلى تحسين المرور الفردي كفاءة التحويل (SPCE) إلى 42%، مع زيادة في الوقت نفسهإلى.
النتائج
النمذجة لـالانتشار في طبقة توزيع الغاز
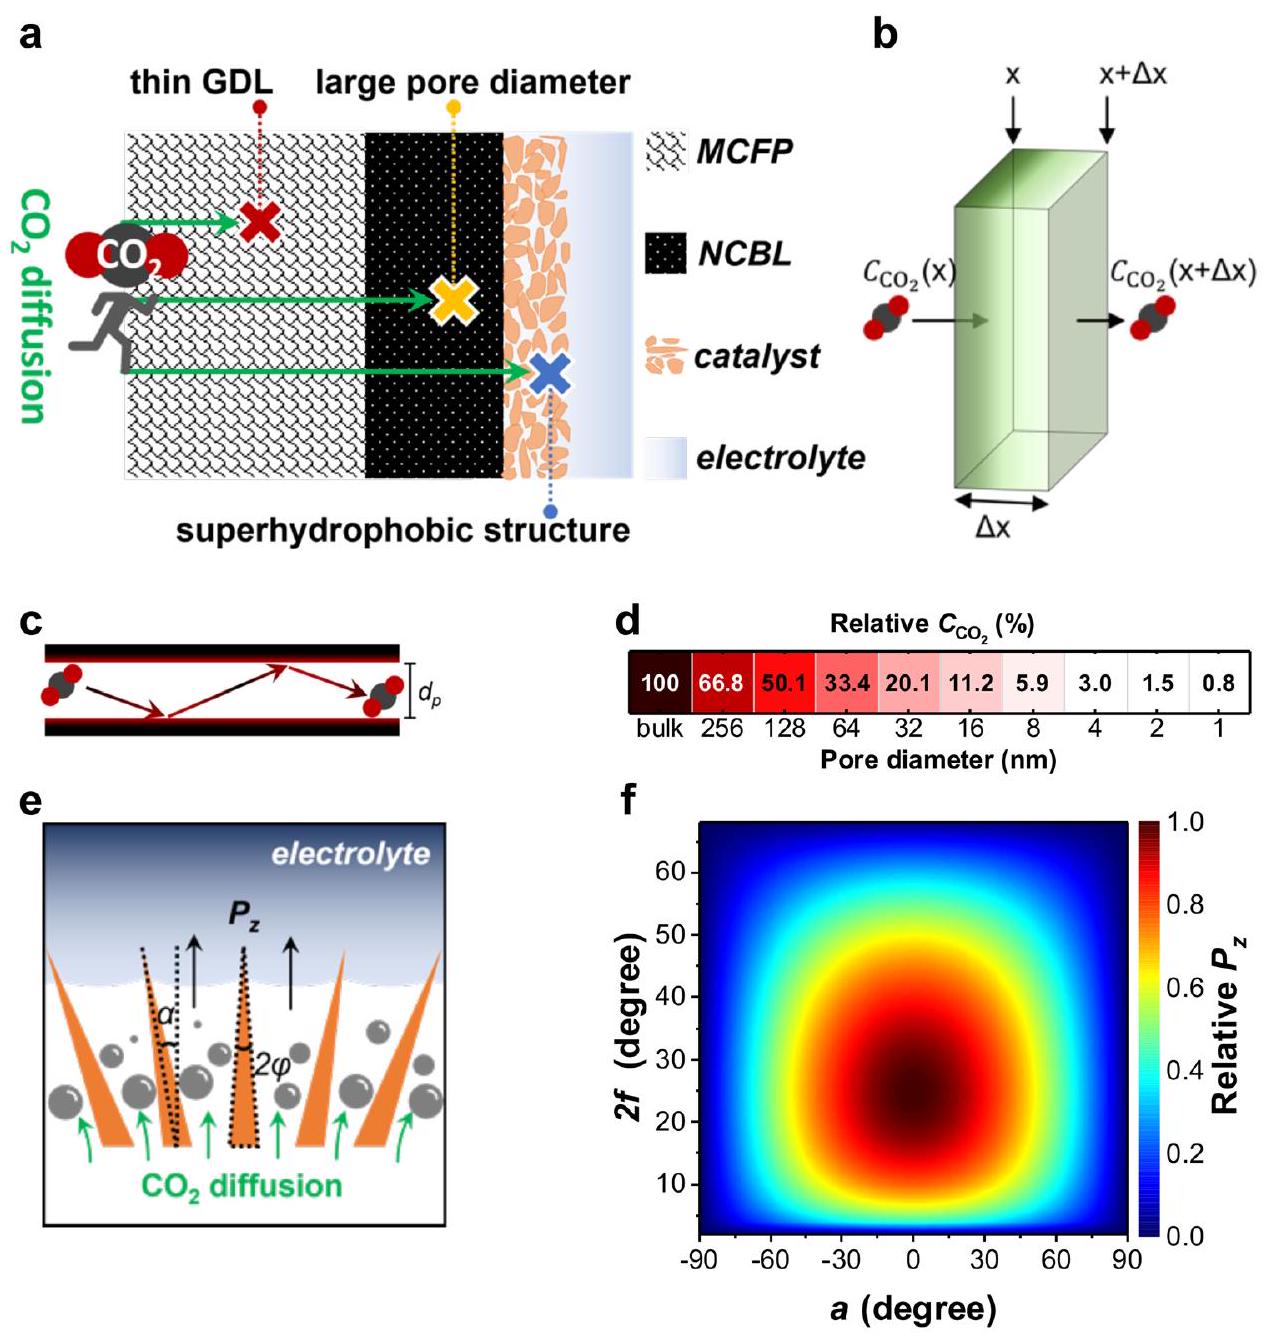
قمنا أولاً بالتحقق من المتطلبات لتحقيق نتيجة إيجابيةكفاءة الانتشاراستنادًا إلى بنية GDL، وهو إلكترود مسامي غير قابل للماء.يتم وصف DE لـ GDL من خلال اعتبار قانون فيك الثاني، ونماذج الانتشار الذاتي لكوندسن، وخصائص السطح الكارهة للماء (الأشكال التكميلية 2-4، التفاصيل في الطرق). وجدنا أن ثلاثة جوانب حاسمة لتعزيز (الشكل 1أ): (1) GDL رقيق؛ الـتركيز ) يتناسب عكسياً مع مسافة الانتشار ( )، ومرتفع يتم تحقيقه في موقع صغيركما هو موضح في الشكل 1ب. (2) قطر المسام الكبير؛ نظرًا للتصادمات المتكررة بينالجزيئات وجدران النانو/الميكرو مسام (الشكل 1ج)، يتم تقليصه إلى النصف عندما يكون قطر المسام أصغر من 128 نانومتر، يتبعه تأثير شديد-سلوك محدد مع انخفاض قطر المسام (الشكل 1د، الشكل التكميلي 3). (3) هيكل فائق الكراهية للماء؛ بالنظر إلى أنمعامل الانتشار في الطور الغازي أعلى بحوالي أربعة أوامر من حيث الحجم مقارنةً بالطور السائلواجهة كارهة للماء تتشكل بين سطح المحفز
الشكل 1 | النمذجة لـ الانتشار في GDL. أ. توضيحات لـ انتشار في أكثر أنواع GDL شيوعًا. تؤثر سماكة وقطر المسام في GDL، بالإضافة إلى خاصية الكارهية للماء في المحفز، على الانتشار. (MCFP هو ورق ألياف الكربون المسامية الكبيرة وNCBL هو طبقة الكربون الأسود النانو-مسامية).تركيز ) يتناقص على طول مسافة الانتشار ( نموذج كندسن
لـانتشار من خلال مسام بقطر. نسبيمحسوب نحو. توضيح لـانتشار على بنية تشبه الإبرة لواجهة المحفز-الالكتروليت. هو ضغط لابلاس، هو زاوية القمة و هو زاوية ميل الإبرة.نسبيمحسوب نحو و .
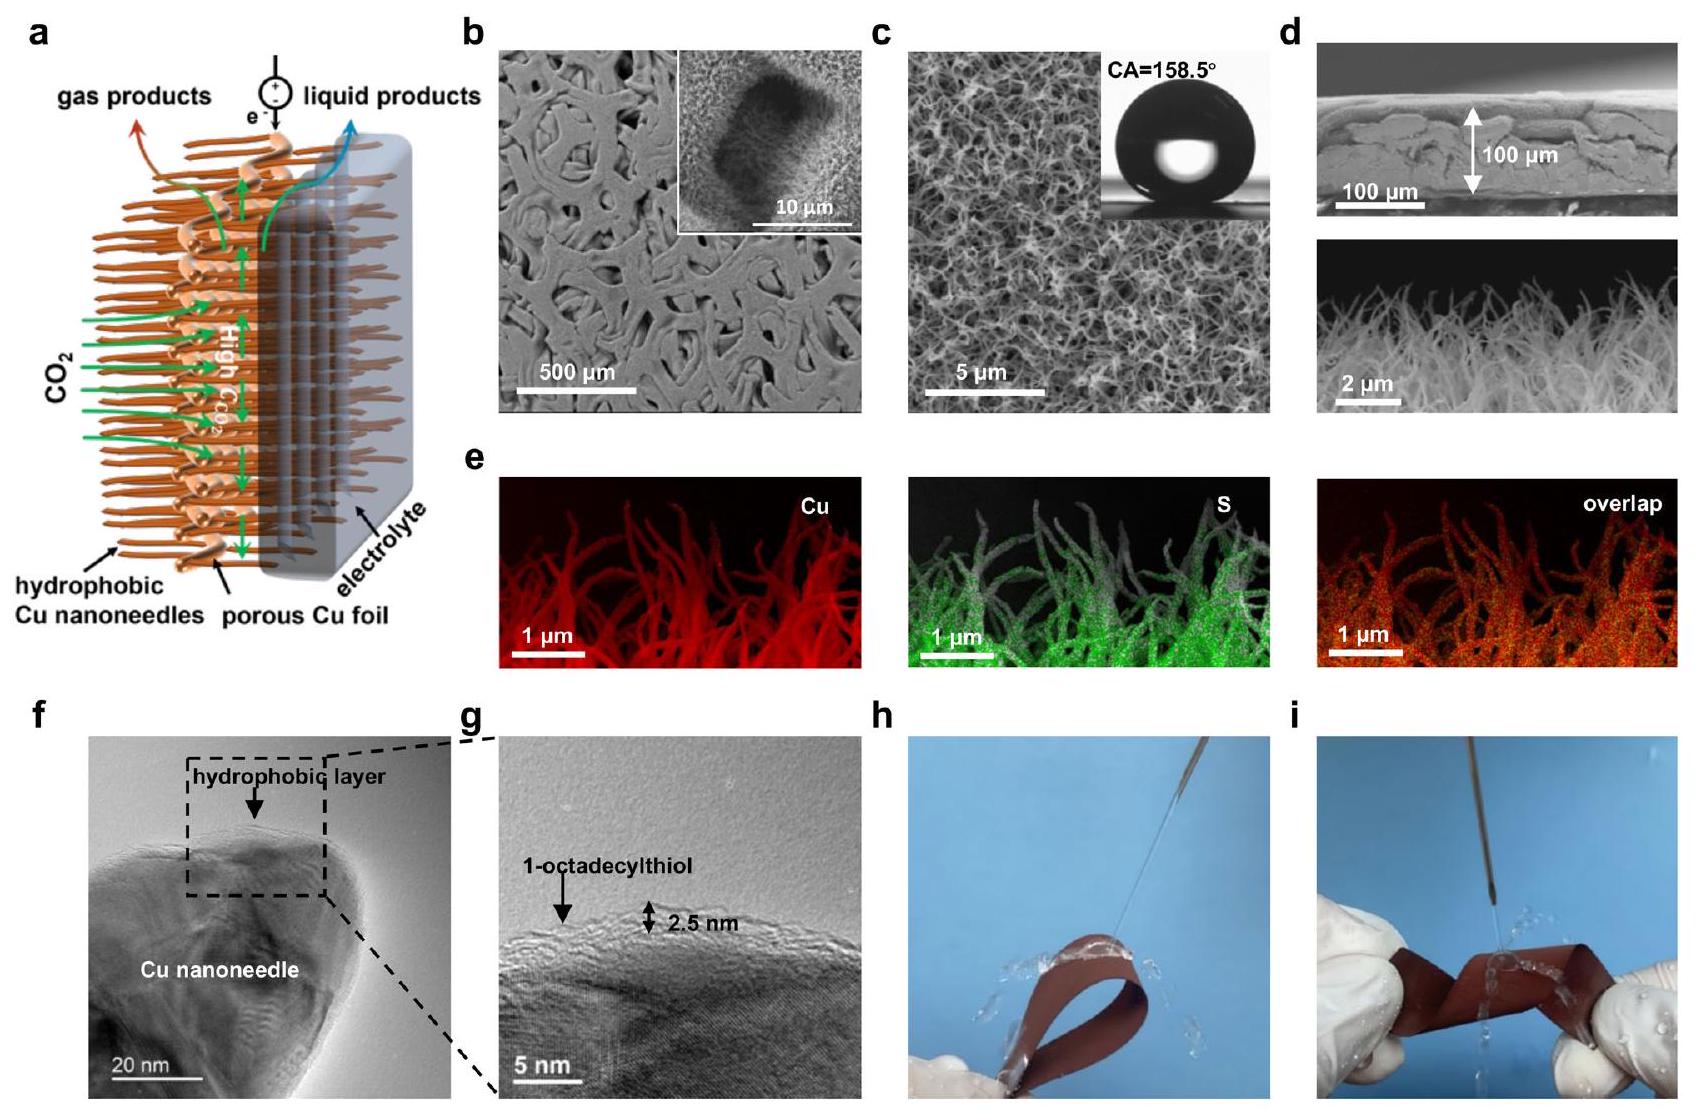
الشكل 2 | الميزات الهيكلية والتركيبية لـ Cu -GDL. أ رسم توضيحي لـمطبق في. ب، ج صور SEM لـالمسام الكبيرة (الإدراج لـهو القناة المسامية الكبيرة) و لـإبر نانوية عالية الكثافة تظهر زاوية تماس كبيرة (CA). د صور SEM مقطعية لتأكيد سمك الإلكترود فائق النحافة
وأشواك نانوية نمت عمودياً. توزيع العناصر. (الأحمر هو النحاس، والأخضر هو الكبريت).صور TEM مغطاة بـ-طبقة أحادية من أوكتاديسيل ثيول كطبقة هيدروفوبية. اختبار مقاومة الانحناء. i، اختبار مقاومة الالتواء. والمحلول الكهربائي هو مكان مثالي لـ الانتشار. الضغط اللابلاسي الإيجابي وجود طور غازي عند واجهة بين السائل وملمس نانو/ميكرو هو مقياس لظهور الكارهية للماء (الشكل التكميلي 4). وبالتالي، يمكن أن ينتشر بسرعة على واجهات المحفز-الكهربائي المميزة بإيجابية (الشكل 1e). وفقًا لمعادلة لابلاس، يظهر دائمًا قيمة إيجابية عندما يكون زاوية الميلوزاوية القمة هي، والحد الأقصى يمكن تحقيق القيمة عند و (الشكل 1f). أدى هذا التقييم لهياكل GDL إلى تصميم GDE بقطر مسامي أرق، بالإضافة إلى هياكل سطحية عمودية وشبيهة بالإبر لتسهيل انتشار
الميزات الهيكلية والتركيبية لـ Cu-GDL
عادةً ما يتم تحضير GDEs باستخدام المحفزات الكهربائية النانوية والمواد الرابطة على ركائز GDL.، لكنهم لا يستوفون المتطلبات المذكورة أعلاه. على النقيض من ذلك، فإن قطب النحاس المسامي، الذي تم تحضيره عن طريق الأكسدة الكهربية في الموقع لرقاقة نحاسية مسامية، رقيق بما فيه الكفاية وله مسام كبيرة، مع سطح مغطى بهياكل نانوية خاصة. ومع ذلك، فإن تحقيق هياكل عمودية وشبيهة بالإبر ذات زوايا قمة وميل مميزة يتطلب تحكمًا دقيقًا في معدلات الإدماج لـ و على سطح رقائق النحاس. من خلال تحسين ظروف التخليق، وجدنا أن التوازن بين تركيز الإلكتروليت و لعملية الأكسدة الكهربائية لسطح رقائق النحاس هو العامل الأكثر أهمية لبناء هياكل نانوية ملائمة (انظر الطرق والأشكال التكميلية 5-7 لمزيد من التفاصيل). درجة حرارة التفاعل ( ) هو أيضًا عامل حاسم لتحقيق الهيكل العمودي والشبيه بالإبرة مع القمة المميزة وزوايا الميل (انظر الطرق والأشكال التكميلية 8 و 9 لمزيد من التفاصيل). ومع ذلك، فإن النحاس المسامي المحضر بسهولة يتغلغل في المحلول المائي بسبب هيكله المسامي الكبير، الذي لا يصلح للاستخدام كجهاز كهربائي مزدوج في خلية تدفق. لذلك، قمنا بإضفاء خصائص حاجز مائي على سطح النحاس المسامي عن طريق الطلاء بـ 1-أوكتادكانثيول، مما أدى إلى.
رسم تخطيطي لـ Cu -GDL مع تحسينانتشار فيموضح في الشكل 2أ. صورة مجهر إلكتروني مسحي (SEM) لـأكدت أن هيكل الغشاء ذو المسام الكبيرة يبقى سليماً (الشكل 2ب والشكل التكميلي 10) وأن الإبر النانوية تنمو بكثافة عالية (الشكل 2ب، ج). صورة مقطع عرضي بواسطة SEM لـ Cu-GDL أكدت الهيكل فائق النحافة لـ (الشكل 2د)، الذي هو أكثر سمكًا بمقدار مرات من GDL الكربوني التجاري (الشكل التوضيحي 2). أظهر تحليل خرائط الأشعة السينية المشتتة للطاقة (EDX) أن كمية صغيرة (0.11 وزني %) من عنصر الكبريت (S) في الألكانثيول موزعة بشكل موحد على سطح إبرة النحاس النانوية (الشكل 2e، الشكل التوضيحي 11). كشفت المجهر الإلكتروني الناقل (TEM) لـ Cu-GDL أن إبرة النحاس النانوية كانت مغطاة بطبقة من 1 -أوكتادكانثيول بسمك (الشكل 2f و g)، الذي يتوافق مع طول السلسلة لـ 1 -أوكتادكانثيول بين S المرتبطة بالسطح والنهايةيجب ملاحظة أن مطيافية الإلكترونات الضوئية بالأشعة السينية (XPS) لـكشف أن إبرة النانو النحاسية المغلفة بطبقة من 1-أوكتادكانثيول لا تظهر أي تأثير على حالة أكسدة النحاس (الشكل التكميلي 12). بالإضافة إلى ذلك، تم استخدام مطيافية الانعكاس الكلي المخفف لتحويل فورييه للأشعة تحت الحمراء (الشكل التكميلي 13)، وXPS للكبريت. (الشكل التكميلي 14)، وأكدت الملاحظات المجهرية (الشكل التكميلي 15) وجود 1-أوكتادكانثيول على Cu-GDL وأدواره. تم ملاحظة الهياكل النانوية الشبيهة بالإبر التي نمت بشكل عمودي على السطح بواسطة SEM (الشكل 2d). يمكن أن تضاعف مثل هذه الهياكل النانوية ذات الكثافة العالية من الكارهية للماء وفقًا لـ (انظر المعادلة.
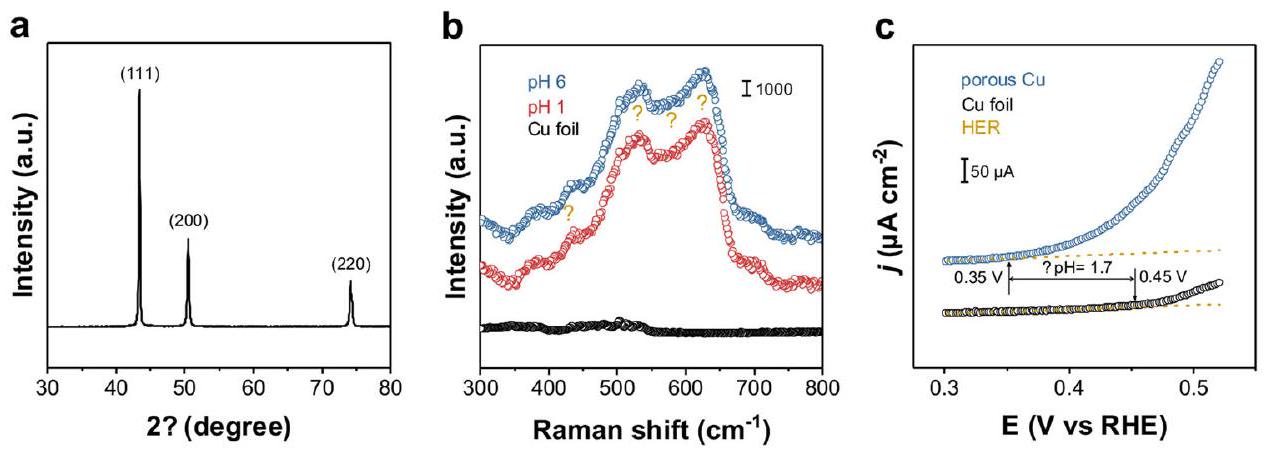
الشكل 3 | حالات السطح لـ Cu-GDL. أ نمط XRD لـ Cu-GDL. ب طيف رامان في الموقع لـعند pH 6 و pH 1 مع E بقيمة -1.5 فولت مقابل SHE (تم استخدام رقائق النحاس كمرجع أساسي، والنجوم الصفراء تشير إلى الأشرطة المرتبطة بـ OH).تقييم الرقم الهيدروجيني السطحي على النحاس في محلول مشبع بالأرجون بتركيز 0.1 ميمثل منحنى متقطع أصفر
خط مناسب لتيار HER. جهد الأكسدة الابتدائي لرقاقة النحاس هو 0.45 فولت (مقابل RHE)، والنحاس المسامي هو 0.35 فولت (مقابل RHE). فرق الرقم الهيدروجيني (بين رقائق النحاس (Cu) والنحاس المسامي هو 1.7. تم تحديد زاوية القمة لتكون في نطاق (الشكل التوضيحي 16)، الذي يقترب كثيرًا من القيمة المثالية لـ المقترح من خلال حسابنا النسبيزاوية الاتصال (CA) أظهرت أن Cu-GDL يتمتع بخصائص فائقة الكارهية للماء، حيث كانت زاوية الاتصال (الشكل 2ج). بالمقابل، أظهر ورق النحاس الأصلي المعدل بالألكانثيول خاصية كارهة للماء طبيعية مع زاوية تماس قدرها ، مما يشير بوضوح إلى أن السطح الفائق الكاره للماء لـ Cu-GDL ينشأ من هيكله السطحي وليس فقط من الطلاء بطبقة الثيول (الشكل التكميلي 17). بالإضافة إلى ذلك، يبدو أن الهياكل النانوية قادرة على تقليل حجم الفقاعات لتعزيز عملية إزالة الفقاعات.، وهو أمر حاسم من حيث كفاءة الطاقة. من المعروف أن إزالة الفقاعات ببطء من الأقطاب الكهربائية تسبب خسائر في الطاقة تصل إلى، وبالتالي يجب إزالة الفقاعات بكفاءة من GDL. تجدر الإشارة إلى أن Cu-GDL الخاص بنا احتفظ بخاصية السطح الفائق الكاره للماء حتى بعد أن تم ثنيه بشدة (الشكل 2h) والتواءه (الشكل 2i). قد تسهم مثل هذه المادة الفائقة الكارهة للماء والمتينة والمرنة في التصنيع الصناعي لـالاختزال الكهربائي.
حالات السطح لـ Cu-GDL
أكدت أنماط حيود الأشعة السينية (XRD) أن المكون الرئيسي لـ Cu-GDL هو النحاس المعدني (الشكل 3أ). ومن المثير للاهتمام أن مطيافية رامان خارج الموقع كشفت عن إشارات رامان مشابهة حول 431 و528، ولكليهما و (الشكل التوضيحي 18) . ومع ذلك، لا توجد قمم مرتبطة بـتمت ملاحظتها في XPS لـ (الشكل التوضيحي 12). علاوة على ذلك، XPS للأكسجينكشف عن وجود OH على سطح Cu-GDL (الشكل التكميلي 19). تشير هذه النتائج إلى أن تركيبة Cu -GDL تتكون أساسًا من النحاس المعدني المغطى بـ OH. للتحقيق في تأثير الإلكتروليت الحمضي على تركيبة القطب الكهربائي فيتم إجراء مطيافية رامان في الموقع عند جهد ( ) من -1.5 فولت مقابل SHE باستخدام محاليل بتركيز pH 6 و pH 1، مما يشير إلى أن OH موجود بشكل مستقر على حتى في محلول حمضي عالي تحت الجهد (الشكل 3ب). بالنظر إلى عوامل مؤثرة مختلفة مثل كثافة التيار، سمك طبقة الانتشار، تركيبة الإلكتروليت الكلية، وعوامل أخرى، فإن تحديد درجة الحموضة التي تكون فوق سطح القطب مباشرة، “درجة الحموضة الجوهرية”، أثناءيبدو أنه تحدٍلمعالجة ذلك، قمنا بتطبيق نهج كيميائي كهربائي يعتمد على جهد البدء لأكسدةإلى، وتم حساب الرقم الهيدروجيني الجوهري على Cu -GDL من جهد البدء الذي لوحظ على ورقة نحاسية نقية كمرجع باستخدام معادلة نيرنست (انظر الطرق والشكل التوضيحي 20 لمزيد من التفاصيل). في هذه التجربة، استخدمنا معدل مسح بطيء من عند انخفاضفي نطاقفي وسط خامل وقريب من الحيادية بتركيز 0.1 م مشبع بالأرجونالكهربائي. أظهر الاختبار أن سطح المحفز له درجة حموضة تبلغ 10.9 (الشكل 3c)، مما يشير إلى الطبيعة القلوية لسطح Cu-GDL، مما سيقلل من المحليالتركيزات، وبالتالي قمع HER خلال.
أداءوالآليات الأساسية
التم تقييم الأداء عنديتراوح من -0.3 إلىباستخدام الإلكتروليتات الحمضية. عاليةمنوكفاءة فاراداي المنخفضة لتفاعل تقليل الهيدروجين أقل منتم تحقيقها عند كل من الرقم الهيدروجيني 6 والرقم الهيدروجيني 1 (الشكل 4أ، الشكل التوضيحي 21). يحتفظ بشكله الأصلي بعد العملية (الشكل التوضيحي الإضافي 22).
قمنا أولاً بتحسين كمية المحفز من خلال تغيير وقت التفاعل لعملية الأكسدة الكهربائية لرقاقة النحاس. كانت رقاقة النحاس الأصلية المطلية بـ 1-أوكتادكانثيول بالكاد تشارك في، وكلا من ومعدل التكوينكان يميل إلى الزيادة مع زيادة وقت الأكسدة الكهربائية (الأشكال التكميلية 23 و 24). لفهم العلاقة بين المساحة السطحية النشطة تحفيزياً و، قمنا أيضًا بتقييم عوامل الخشونة (rf) لكل قطب كهربائي من خلال تحليل المساحة السطحية الكهروكيميائية (ECSA)، والتي تعكس عدد المواقع التحفيزية (الشكل التكميلي 25). تُظهر صور SEM للأقطاب الكهربائية المقابلة لـ rf في الشكل 4b. بالنظر إلى أن الانتقائية العالية لـنحويرافقها الحد الأدنى من HER، وقد أسسنا العلاقة بين و rf (الشكل التوضيحي التكميلي 26). من المثير للاهتمام أنه كان هناك ارتباط خطي جيد بين و rf عند pH 6، بينما أظهر سلوكًا غير خطي عند pH 1 (الشكل 4b، الشكل التوضيحي 26). نظرًا لأن المادة المحضرةلديه سطح غني بـ OH، مما يقلل من المحليالتركيز، استنتجنا أن ليس فقط المساحة السطحية النشطة ولكن أيضًا كمية OH الموجودة على المحفز تحدد في الوقت نفسهعند pH 1 كما هو موضح في الشكل 4c. ثم حاولنا تحليل العلاقة بينوعامل الخشونة التربيعي ( ). بشكل مفاجئ، أظهر ارتباطًا خطيًا جيدًا جدًا مععند pH 1 (الشكل 4ب). على الرغم من أن حركيةقد تتضمن عوامل مؤثرة متنوعة، قمنا بإجراء تحقيق تنبؤي لـالحركيات في بيئة حمضية من خلال التحكم الدقيق في المتغيرات ووجدت أنعلى Cu -GDL عند pH 6 هو تفاعل من الدرجة الأولى يعتمد على عدد المواقع الحفازة، بينمايمكن وصفه عند pH 1 بأنه تفاعل من الدرجة الثانية يتحدد بعدد المواقع الحفازة وكمية OH. في هذا الصدد، قمنا بمزيد من تحديد تركيز OH على كل قطب (الشكل التوضيحي 27) وحددنا ثوابت السرعة لـعند الرقم الهيدروجيني 6 والرقم الهيدروجيني 1 و على التوالي (الشكل التوضيحي 28).
بعد ذلك، قمنا بتقييم استخدام الكربون فيفيمعمعدل التدفق يتراوح بين 10 إلى 3 SCCM. مع الأخذ في الاعتبار إمكانية تحسين الاسترداد لـإلىخلالالتي اعتُبرت مفتاحًا لتعزيزاستخدام، استخدمنا أيضًا مجموعتين من الإلكتروليتات؛محاليل إلكتروليت مشبعة بدرجة حموضة 6 ودرجة حموضة 1، وهي و أظهرت اختبارات استخدام الكربون أن كلاً من SPCE وكفاءة التحويل لـتزداد تدريجياً كـتقلل معدل التدفق (الشكل 4د، الشكل التوضيحي 29)، و
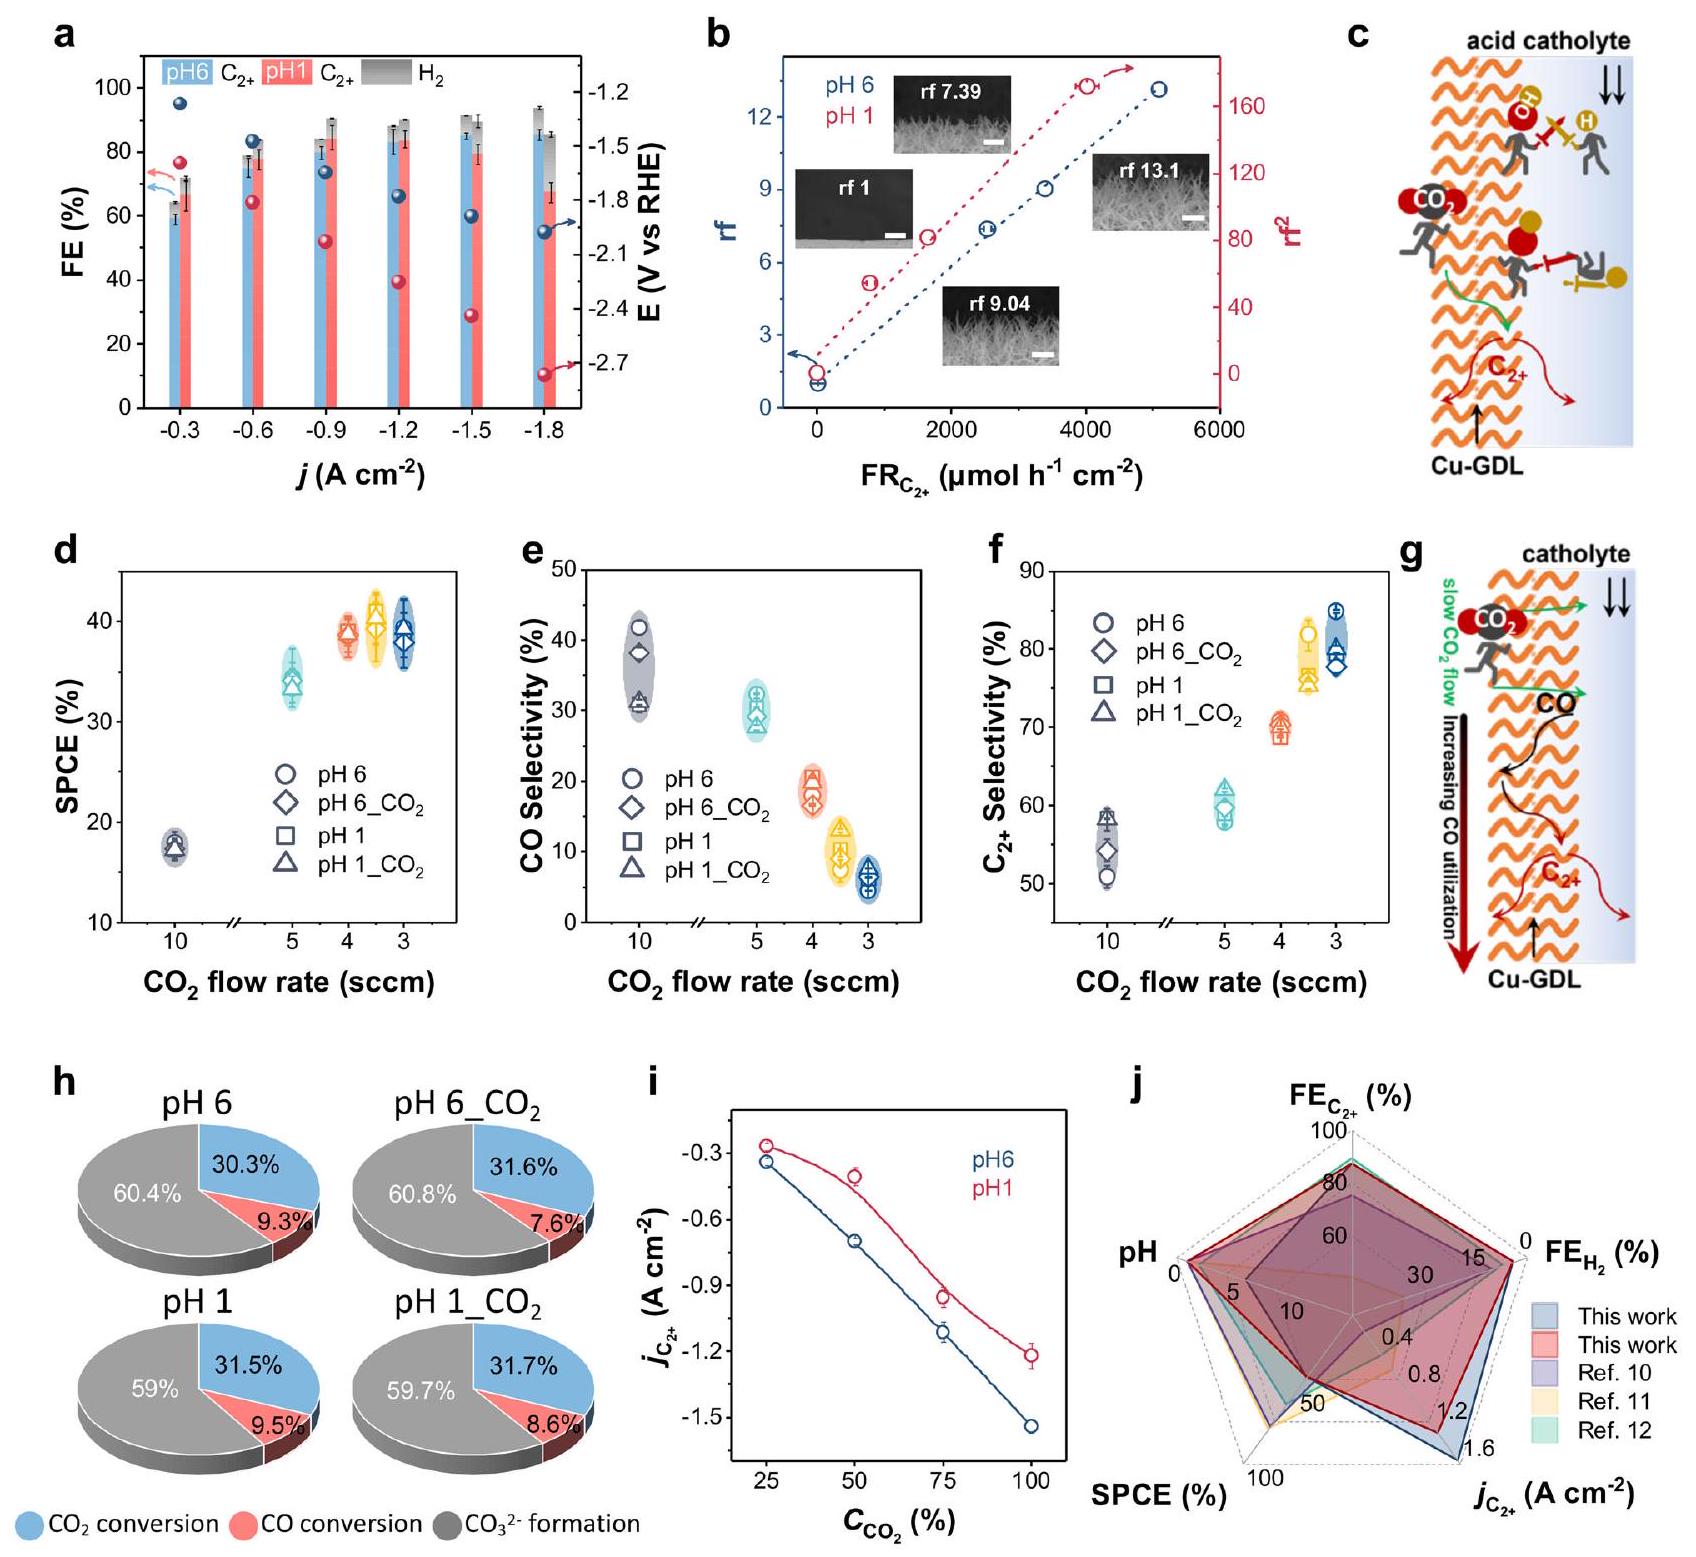
شكل.أداء وآلياتها الأساسية. FE لإنتاج و ، والجهد (E مقابل RHE، على اليمين) كدوال لـ (درجة الحموضة 6 زرقاء، درجة الحموضة 1 حمراء). (يسار) و (اليمين) كدوال لـ تظهر الصورة المرفقة صور SEM لـ Cu-GDL مع الأخطاء المقابلة (أشرطة الخطأ) ). رسم توضيحي لدالة أنواع OH على Cu -GDL خلال في وسط حمضي. د SPCE، هـ اختيارية CO والانتقائية كدالة لـمعدل التدفق عند تطبيقمناستخدام الإلكتروليتات مع و و إلكتروليتات مشبعة مع و رسم توضيحي لتحويل ثاني أكسيد الكربون الثانوي أثناءببطءمعدل التدفق. نسبة استخدام الكربون عندمعدل التدفق 3.5 SCCM وطبقمن عند الكهارل المتغيرة.كنتيجة لـالغاز المخفف هو ). ج مقارنة لـ SPCE ودرجة الحموضة لمحلول الإلكتروليت الكثيف على Cu -GDL مقارنةً بتلك الموجودة في أحدث التقنيات.في وسط حمضي. أ، ب، د، هـ، و، ي، تشير أعمدة الخطأ إلى الانحراف المعياري.نسخ). مبين في الشكل التكميلي 30 و31. عندمعدل التدفق 3.5 SCCM، وقد أظهر في الوقت نفسه أفضل SPCE لـوالأفضلمن (الشكل 4d، الشكل التكميلي 31). ومع ذلك، عندما تم تقليل معدل التدفق إلى 3 SCCM، لم يزداد SPCE أكثر من ذلككـانخفض معدل التدفق (الشكل 4د). على العكس، زادت HER إلى (الشكل التوضيحي 32). تشير هذه النتيجة إلى أن الإمداد من خلال الاسترداد منالمحلول الكهربائي القابل للذوبان غير فعال في تحسين SPCE، حتى عندما نستخدم-غني والالكتروليتات المشبعة. ثم نقترح أن هذه الظاهرة يمكن أن تُعزى إلى حقيقة أناستعاد منيميل إلى البقاء في المرحلة السائلة. الـكفاءة الانتشار في الطور السائل تقل بشكل كبير مقارنة بالطور الغازيالنقطة المشجعة هي أنه عند النظر في تشكيلخلالتظل نتائجنا في SPCE أعلى منلكلا من ظروف pH 6 و pH 1، متجاوزًا الحد الأقصى النظري قابل للتحقيق SPCE. تم تلخيص نتائج الحسابات في الجداول التكميلية 1 و 2 واستخدمت للمقارنة (انظر الطرق). أظهر التحليل الإضافي لاختيار المنتج أن اختيار CO ينخفض مع انخفاضمعدل التدفق (الشكل 4e)، مما يؤدي إلى زيادة مستمرة في الانتقائية لـ (الشكل 4f). تقودنا هذه النتيجة إلى الاستنتاج بأن جزءًا من الحد الأقصى النظري لـ SPCE ينشأ من التحويل الثانوي لـ CO كما هو موضح في الشكل.التحويل الثانوي يشير إلى حقيقة أن المنخفضتؤدي نتائج معدل التدفق إلى زيادة زمن الإقامة لثاني أكسيد الكربون، المستمد منالتحويل، على سطح المحفز. وبالتالي، يتم تقليل CO بشكل أكبر، مما يؤدي إلىالتكوين. من المهم ملاحظة أن هناك تحسينًا في SPCE بسبب غياب التفاعلات الجانبية التي تنطوي علىالتكوين خلال عملية تقليل أول أكسيد الكربون (CORR)استخدامات الكربون المحسوبة فيفيمعدل التدفق 3.5 SCCM ملخص في الجدول التكميلي 2، الذي يظهر أن 30.3-31.7% من تأتي منتجات الكربون منتحويلمن تحويل CO، ومنيستخدم لـالتكوين (الشكل 4هـ).
نظرًا للتحسيناتخصائص الانتشار، قمنا بتقييم الـالأداء في وجودغاز الشوائب (الشكل التوضيحي 33).أظهرت الأداء أن تأثيرعلىمحدود، لكنه ملحوظ على (الشكل 4i، الشكل التوضيحي 34). الـللتخفيفوصل الغاز إلى -430 و عند الرقم الهيدروجيني 6 و 1 على التوالي (الشكل 4i). حتى عند مثل هذه القيم المنخفضة لا تزال مستويات الإنتاجية في نظام يثير الاهتمام فيما يتعلق بالتطبيقات الصناعية.. الـأداءتمت مقارنتها مع تلك الخاصة بأحدث التقنياتفي الوسط الحمضي كما هو موضح في الشكل.. بالإضافة إلى ذلك، في الأنظمة السابقة، كانت هناك تراكم مستمر لـخلالالإجراءات المطلوبة مثل إيقاف التفاعل واستبدال الإلكتروليت للحفاظ علىنشاط. ومع ذلك، فإن هذه الإجراءات زادت بشكل كبير من التكاليف التشغيلية المرتبطة بـلمعالجة هذه المشكلة، صممنا نظام استرداد إلكتروليت تلقائي (الشكل التكميلي 35) يمكنه الحفاظ علىإلكتروليت مجاني خلالعملية من خلال إضافة كمية صغيرة من HCl لتفكيك الكربونات:من خلال تنفيذ نظام تجديد الإلكتروليت، تمكنا من تحقيق تشغيل مستمر لـفي لأكثر من 10 ساعات مع تطبيق من (الشكل التوضيحي 36)، لأكثر من 30 ساعة مع تطبيق من (الشكل التوضيحي 37). في المستقبل، فإن تطوير طبقة هيدروفوبية أكثر استقرارًا تتجاوز استقرار الثيولات يحمل وعدًا لتحسين الاستقرار على المدى الطويل لـعالي.
نقاش
قمنا أولاً بالتحقق من صحةمن GDL التقليدي ووجد أنيمكن تحسينه من خلال تحسين السماكة، وحجم المسام، والخصائص الكارهة للماء لـ GDL. استنادًا إلى نتائج التحليل، قمنا بتصميم Cu-GDL جديد يتميز بخصائص فائقة النحافة، وماكرو مسامية، وكارهة للماء بشكل كبير. يجب ملاحظة أن Cu-GDL حافظ على قابليته للاستخدام حتى في حالات الانحناء والالتواء الشديدة. من خلال استخدام Cu-GDL، حققنا منفيمنتحت ظروف حمضية واكتشف أنعلىيتميز بأنه تفاعل من الدرجة الأولى عند pH 6 وتفاعل من الدرجة الثانية عند pH 1. اقترحنا آلية تحويل CO الثانوية لتعزيز SPCE في. علاوة على ذلك، حققنا منحتى عند استخدام المخفف. بشكل عام، فهمالأنظمة على القطب الكهربائي المعزز لانتشار الغاز المطبق في هذا العمل ستسرع من تطويرالتكنولوجيا. في المستقبل، سيكون من المفيد إجراء مزيد من التحقيق في تأثير البيئة المحلية في القطب الكهربائي لتشتت الغاز باستخدام طرق الكشف المتقدمة في الموقع.
طرق
نمذجةانتشار
التم تقييم الانتشار من خلال افتراض بنية GDE، التي هي أقطاب مسامية كارهة للماء.. بشكل عام، يتم التنبؤ بتغير تركيز الغاز بسبب الانتشار بواسطة قانون فيك الثاني، والذي يتم تحديده بالمعادلة التالية:
أين هو تركيز هو الوقت، هو معامل الانتشار، هو الوضع العرضي لجهاز GDE. عندمافي حالة مستقرة، أيلا يتغير مع،
لأن هيكل المسام الكبيرة لا يحد منانتشارفي ورق ألياف الكربون ذو المسام الكبيرة (MCFP، الشكل التوضيحي التكميلي 2) الذي يحتوي على ثابتيظهر اعتمادًا خطيًا على كما هو موضح في الشكل 1ب، وبالتالي فإن قانون فيك الثاني يقترح أن يمكن تحسين كفاءة الانتشار عن طريق تقليل سمك GDE.
يتكون طبقة الكربون الأسود النانوي المجهري (NCBL) من جزيئات كربون أسود على مقياس النانو تشكل طبقة نانوية مجهرية (الشكل التوضيحي التكميلي 2)، ويتم تقليل أحجام المسام بشكل أكبر عند تطبيق طلاء المحفز.. في ضوء الحوادث المتكررة بين الجزيئات وجدران النانو-ميكرو المسام، كما هو موضح في الشكل 1c. معامل الانتشار ( ) في مجال النانو-ميكرو المسام يتم تحديده بواسطة قابلية الانتشار كنودسن الذي يوصف على النحو التالي:
أينهو معامل الانتشار الكتلي لـ هو ثابت الغاز، هو درجة الحرارة، هو الكتلة الجزيئية لـ هو متوسط قطر النانو-ميكرو المسام. قمنا بحساب استنادًا إلى المعادلة (3) واقترح أنيتم تقليصه إلى النصف عندمايصبح أصغر من 128 نانومتر، مما قد يسبب مشاكل خطيرةسلوك يحد من التركيز (الشكل 1د، الشكل التكميلي 3).
كـالقيم أعلى بحوالي أربعة أوامر من حيث الحجم مقارنة بتلك في الطور السائل، إن إعداد واجهة محفز-إلكتروليت فائقة الكراهية للماء يمكن أن يمنع تدهور الـمعدل الانتشار. غالبًا ما تظهر الطبيعة سطحًا فائق الكراهية للماء يتكون على هيكلها النانوي والميكروي.مثل اللوتسأوراق الأرزأرجل حشرات الماءوعيون العثتظهر السطح الفائق الكاره للماء ضغط لابلاس إيجابيمن الغاز الموجود في نسيج نانوميكروني. الـيمكن التعبير عنها باستخدام المعادلة التالية :
أينهو توتر السطح للسائل،هي كثافة النسيج النانوميكروني،هو كسر الالتصاق بين واجهة السائل والصلب، هو نصف زاوية القمة، هو زاوية ميل الإبرة (الشكل 1e، الشكل التوضيحي 4)، و هو زاوية الاتصال الثابتة، الذي تم الحصول عليه على سطح رقائق النحاس المسامية المعدلة بـ 1-أوكتادكانثيول (الشكل التكميلي 17). عندما تكون زاوية الميل وزاوية القمة هييظهر دائمًا قيمة إيجابية (الشكل 1f). تشير حساباتنا إلى الحد الأقصىيمكن تحقيق القيمة عند و (الشكل 1f)، مما يشير إلى أن الهيكل العمودي والشبيه بالإبرة يكشف عن الكارهية المائية الملحوظة على سطحه.
تحضير وتحسين الأقطاب الكهربائية
تحضير GDE يعتمد على تحسين طريقة الأكسدة الكهربائية في الموقع التي تم الإبلاغ عنها سابقًا.تم غسل رقائق النحاس المسامية أولاً بـ، واكو) لمدة دقيقة واحدة، تليها مباشرة عملية تنظيف بالموجات فوق الصوتية باستخدام الأسيتون (، واكو)، إيثانول (“، واكو)، وماء منزوع الأيونات ( ) لمدة 5 دقائق لإزالة الشوائب السطحية.
استنادًا إلى مبدأ الأكسدة الكهربية في الموقع، يمكن وصف تفاعل الأنود كما يلي:
عند فحص صيغة التفاعل، يتضح أن التركيزات النسبية لـوتلعب دورًا حاسمًا في تسهيل حدوث عملية الأكسدة الكهربائية بكفاءة. وبالتالي، قمنا بإجراء عدة تحسينات لضمان ظروف ملائمة. وشملت هذه التعديلات ضبط تركيز KOH في المحلول الكهربائي (الذي يتحكم فيالتركيز، كما هو موضح في الأشكال التكميلية 5 و 6)، كثافة تيار الأكسدة الكهربائية (التي تتحكم في التركيز، كما هو موضح في الشكل التوضيحي 7)، ودرجة حرارة الأكسدة الكهربائية (التي تؤثر على معدل و تركيبة، كما هو موضح في الشكل التوضيحي 8.
بعد دراسة متأنية، قررنا استخدام محلول مائي بتركيز 2 م.تم استخدام محلول الكهارل (Wako) في حمام ثلجي تم الحفاظ عليه عند. هذه الإعدادات سمحت لنا بأكسدة السطح كهربائيًا للرقائق النحاسية المسامية المنظفة، مما أدى إلى تصنيع هياكل نانوية تشبه الإبر بزاويا قمة وميل مميزة. كانت عملية الأكسدة الكهربائية تتضمن الحفاظ على كثافة تيار أكسدة ثابتة من لمدة تقارب 30 دقيقة لضمان كثافة عالية من الهياكل النانوية الشبيهة بالإبر. ثم تم تجفيف ورقة النحاس المسامية الناتجة تحت تدفقلمدة 30 دقيقة لتشكيل مسامي.
للحفاظ على الشكل الأصلي للهيكل النانوي الشبيه بالإبرة أثناء تقليل المسامية، قمنا بتنفيذ برنامج درجة حرارة معتدلة (في الدقيقة) عن طريق تسخين المسامي تدريجياًإلىعلى مدار ساعة واحدة فيالبيئة. كانت هذه الخطوة حاسمة لأن الاختزال الكهروكيميائي للمواد المساميةكان من الممكن أن يدمر الهيكل النانوي الأصلي الشبيه بالإبرة (كما هو موضح في الشكل التكميلي 9). بعد الوصول إلى درجة حرارة الغرفة، تم غمر النحاس المسامي في محلول إيثانول مشبع بالأرجون يحتوي على 1 -أوكتادكانثيول (10 مللي مول، واكو) فيلمدة 10 دقائق. أدت هذه العملية الغمر إلى تشكيلتم الحفاظ على تدفق الهواء المستمر باستخدام الأرجون طوال فترة الغمر لضمان الحصول على النتيجة المرغوبة.
توصيف
تم تسجيل نمط حيود الأشعة السينية (XRD) باستخدام جهاز حيود BRUKER D2Phaser عند 30 كيلوفولت و10 مللي أمبير باستخدامإشعاعتم الحصول على صور المجهر الإلكتروني الماسح (SEM) باستخدام مجهر JEOL JSM-7900F. تم قياس زاوية الاتصال على جهاز DM-301. تم الحصول على صور المجهر الإلكتروني الناقل (TEM) باستخدام مجهر JEOL JEM-ARM200CF الذي يعمل عند 200 كيلوفولت. تم جمع بيانات طيفية الانبعاث الضوئي للأشعة السينية (XPS) باستخدام ألومنيوم-K.مصدر الإشعاع (1486.6 eV) مع جهاز PHI 5000 Versa Probe. تم جمع طيف الانعكاس الكلي للامتصاص – تحويل فورييه للأشعة تحت الحمراء (ATR-FTIR) باستخدام جهاز قياس الطيف Nicolet iS50. تم إجراء قياس رامان باستخدام مجهر رامان inVia مع طول موجي 785 نانومتر وليزر وهدف.
تقييم المساحة السطحية الكهروكيميائية (ECSA)
أتم استخدام إلكتروليت مشبع بالآر لتقييم المساحة السطحية الكهروكيميائية (ECSA) لتحديد سعة الطبقة المزدوجة الكهروكيميائية.تم إجراء اختزال كهربائي في الجهد عند -0.6 فولت مقابل RHE لمدة دقيقتين قبل تقييم ECSA. تم قياس الفولتموجرامات الدورية عند معدلات مسح تبلغ 10 و20 و30 و40، وفي النطاق المحتمل من -0.7 إلى -0.6 فولت مقابلتم تطهير الأرجون أثناء القياس. مجموعة بيانات لكثافات التيار الأنودي والكاثودي عند -0.65 فولت مقابلتم تسجيله، وتم رسم التيارات السعوية الناتجة مقسومة على 2 مقابل معدل المسح. أعطت الميل الذي تم الحصول عليه من تحليل الانحدار الخطيقيمة.
تقييم السطحعلى القطب
تم تقليل جميع أقطاب النحاس عند -0.6 فولت مقابل RHE لمدة دقيقتين قبل إجراء الفولتمترية الدورية (CV). تم إجراء الفولتمترية الدورية في
مشبع بالأرالكهرباء السائلة بمعدل مسحبينما تم تفريغ الهواء في الخلية باستخدام الأرجون. تم حساب الرقم الهيدروجيني على السطح على الإلكترود باستخدام المعادلات التالية:
أين،هو الرقم الهيدروجيني السطحي للمحفز/القطب الكهربائي،هو الرقم الهيدروجيني لمحلول إلكتروليتي (التفاصيل في وصف الشكل التكميلي 20).
قياس طيف رامان في الموقع
تم استخدام خلية تدفق رامان الكهروكيميائية المصنوعة حسب الطلب لقياس رامان في الموقع. يسمح طبقة إلكتروليت رقيقة بسمك 5 مم لليزر بإشعاع سطح المحفز مباشرة. سلك بلاتيني ملفوف ( ) كقطب مضاد، و تم استخدام NaCl كإلكترود مرجعي. تم وضع Nafion-117 لفصل غرف الكاثوليت والأنوليت. كان الأنوليت 1 م KOH بمعدل تدفقكان الكاثوليت 1 م من كلوريد البوتاسيوم مع درجة حموضة 6 ودرجة حموضة 1 عند معدل تدفق، و كان يتدفق باستمرار إلى غرفة الغاز بمعدل تدفق قدرهخلال الاختبار.
القياسات الكهروكيميائية
تم إجراء جميع القياسات الكهروكيميائية في مفاعل تدفق غاز الانتشار باستخدام جهاز قياس الجهد Parstat MC (Princeton Applied Research). استخدمنا Cu-GDL المعدة ككاثود، وغشاء Nafion 117 كغشاء، ورغوة Ni كأنود، والتي تم وضعها وتثبيتها معًا عبر حشوات. ما لم يُذكر خلاف ذلك، تم استخدام محلول مختلط منواكووتم استخدام 1 م HCl و 1 م KOH ككاثوليت، وتم تدويرها عبر الخلية الكهروكيميائية باستخدام مضخة بيرستالتية بمعدل تدفق قدرهبينماتم التحكم في معدل التدفق ليكون (99.99%). بالنظر إلى الحاجة إلى تفاعل تطور الأكسجين المستدام والمستقر لموازنة معدل التفاعل العالي لـتم استخدام 1 م من هيدروكسيد البوتاسيوم كإلكتروليت أنودي. تم اتخاذ هذا الخيار بسبب استخدام نافيون 117، وهو غشاء تبادل كاتيوني، الذي يقضي علىالعبور إلى الجانب الكاثودي، مما يؤثر على الرقم الهيدروجيني للإلكتروليت الكاثودي. من خلال استخدام المعادلة التالية، الجهد مقابليتم معايرته بالنسبة إلى القطب الهيدروجيني القابل للعكس (RHE): مقابل RHE مقابل الرقم الهيدروجيني تم تعويض انخفاض iR بواسطة مطيافية الامتزاز الكهروكيميائية (EIS) تحت إمكانيات الدائرة المفتوحة. تم إجراء اختبار EIS هذا مباشرة بعد كل مجموعة منتم إجراء تجارب لضمان دقة المقاومة الداخلية. تم استخدام كروماتوغرافيا الغاز (GC، Agilent 490) لتحليل منتجات الغاز الناتجة المستخرجة من حجرة الكاثود، وتم تحليل المنتجات السائلة باستخدام كروماتوغرافيا السائل عالية الأداء (HPLC، Shimadzu LC-20AD).
حسابات حركية التفاعل
تُوصف التفاعلات من الدرجة الأولى والثانية بالمعادلات التالية؛
و
أينمعدل التكوين لـ و هي ثابت سرعة التفاعل، [الكاتاليس] وهي تركيز المحفز وOH الموجود في المحفز، على التوالي.
حسابات الكفاءة فاراداي (FE) وكثافة التيار الجزئي (j)
كفاءة فاراداي لمنتجات الغاز ) والمنتجات السائلة ( ) تم حسابها بناءً على المعادلات التالية:
أينهو عدد الإلكترونات المنقولة لإنتاج جزيء واحد من المنتج المركّز هو ثابت فاراداي، هو تركيز المنتجمحدد بواسطة GC أو HPLC،هو معدل التدفق لـ و هل تم متابعة الضغط ودرجة الحرارة والشحنة الكلية في التجربة؟ هو ثابت الغاز، هو حجم الإلكتروليت.
كثافة التيار الجزئي ( ) تم حسابه باستخدام:
أين و هي تيار التفاعل، كفاءة فاراداي للمنتج المستهدفوالمساحة السطحية للقطب العامل.
حساب معدل التكوين (FR)، الانتقائية، كفاءة التحويل في المرور الواحد (SPCE) وكفاءة التحويلمعدل التكوين،الانتقائية، كفاءة تحويل المرور الفردي وتم حساب كفاءة التحويل باستخدام:
أينالانتقائية، و SPCE معدل التكوين، الانتقائية، كفاءة التحويل في المرور الواحد للمنتج المستهدف، على التوالي. و زمن التفاعل وعدد ذرات الكربون في كل منتجعلى التوالي. هو مجموع . هو الحد الأقصى النظري لـ SPCE للمنتج المستهدفعند النظر في تكوين الكربونات.
توفر البيانات
تم توفير بيانات المصدر مع هذه الورقة. بيانات المصدر لـنمذجة الانتشار، توصيف حالة السطح، وأداء تفاعل الاختزال متاح من Figshare برمز الوصولhttps://doi.org/10.6084/m9.figshare.24778809تم توفير بيانات المصدر مع هذه الورقة.
References
Olah, G. A., Prakash, G. K. & Goeppert, A. Anthropogenic chemical carbon cycle for a sustainable future. J. Am. Chem. Soc. 133, 12881-12898 (2011).
Nitopi, S. et al. Progress and perspectives of electrochemical reduction on copper in aqueous electrolyte. Chem. Rev. 119, 7610-7672 (2019).
Ma, S. et al. Electroreduction of carbon dioxide to hydrocarbons using bimetallic Cu-Pd catalysts with different mixing. Patterns J. Am. Chem. Soc. 139, 47-50 (2017).
Ma, W. et al. Electrocatalytic reduction of to ethylene and ethanol through hydrogen-assisted C-C coupling over fluorinemodified copper. Nat. Catal. 3, 478-487 (2020).
De Arquer, F. P. G. et al. electrolysis to multicarbon products at activities greater than 1 A cm- 2. Science 367, 661-666 (2020).
Dinh, C.-T. et al. electroreduction to ethylene via hydroxidemediated copper catalysis at an abrupt interface. Science 360, 783-787 (2018).
Zheng, M. et al. Electrocatalytic -to-C(2+) with amperelevel current on heteroatom-engineered copper via tuning *CO intermediate coverage. J. Am. Chem. Soc. 144, 14936-14944 (2022).
Dinh, C.-T., Li, Y. C. & Sargent, E. H. Boosting the single-pass conversion for renewable chemical electrosynthesis. Joule 3, 13-15 (2019).
Ma, M. et al. Insights into the carbon balance for electroreduction on Cu using gas diffusion electrode reactor designs. Energy Environ. Sci. 13, 977-985 (2020).
Huang, J. E. et al. electrolysis to multicarbon products in strong acid. Science 372, 1074-1078 (2021).
Zhao, Y. et al. Conversion of to multicarbon products in strong acid by controlling the catalyst microenvironment. Nat. Synth. 2, 403-412 (2023).
Xie, Y. et al. High carbon utilization in reduction to multi-carbon products in acidic media. Nat. Catal. 1-7 (2022).
lijima, G., Inomata, T., Yamaguchi, H., Ito, M. & Masuda, H. Role of a hydroxide layer on Cu electrodes in electrochemical reduction. ACS Catalysis 9, 6305-6319 (2019).
Sun, M., Staykov, A. & Yamauchi, M. Understanding the roles of hydroxide in electroreduction on a Cu electrode for achieving variable selectivity. ACS Catalysis 12, 14856-14863 (2022).
Kim, B., Hillman, F., Ariyoshi, M., Fujikawa, S. & Kenis, P. J. A. Effects of composition of the micro porous layer and the substrate on performance in the electrochemical reduction of to . Power Sources 312, 192-198 (2016).
Shou, D., Fan, J., Mei, M. & Ding, F. An analytical model for gas diffusion though nanoscale and microscale fibrous media. Microfluidics Nanofluidics 16, 381-389 (2013).
Shi, R. et al. Efficient wettability-controlled electroreduction of to CO at interfaces. Nat. Commun. 11, 3028 (2020).
Carroll, J. J., Slupsky, J. D. & Mather, A. E. The solubility of carbon dioxide in water at low pressure. J. Phys. Chem. Ref. Data 20, 1201-1209 (1991).
Yamauchi, Y., Tenjimbayashi, M., Samitsu, S. & Naito, M. Durable and flexible superhydrophobic materials: abrasion/scratching/slicing/droplet impacting/bending/twisting-tolerant composite with porcupinefish-like structure. ACS Appl Mater. Interfaces 11, 32381-32389 (2019).
Lees, E. W., Mowbray, B. A. W., Parlane, F. G. L. & Berlinguette, C. P. Gas diffusion electrodes and membranes for reduction electrolysers. Nat. Rev. Mater. 7, 55-64 (2021).
Wakerley, D. et al. Bio-inspired hydrophobicity promotes reduction on a Cu surface. Nat. Mater. 18, 1222-1227 (2019).
Burdyny, T. et al. Nanomorphology-enhanced gas-evolution intensifies reduction electrochemistry. ACS Sustain. Chem. Eng. 5, 4031-4040 (2017).
Lv, J. J. et al. A highly porous copper electrocatalyst for carbon dioxide reduction. Adv. Mater. 30, e1803111 (2018).
Angulo, A., van der Linde, P., Gardeniers, H. & Modestino, M. & Fernández Rivas, D . Influence of bubbles on the energy conversion efficiency of electrochemical reactors. Joule 4, 555-579 (2020).
Niaura, G. Surface-enhanced Raman spectroscopic observation of two kinds of adsorbed OH- ions at copper electrode. Electrochim. Acta 45, 3507-3519 (2000).
Gupta, N., Gattrell, M. & MacDougall, B. Calculation for the cathode surface concentrations in the electrochemical reduction of in KHCO3. Solut. J. Appl. Electrochem. 36, 161-172 (2005).
Cheng, J. et al. Mechanistic study for the reaction of complexes with m-chloroperbenzoic acid in catalytic alkane oxidations. Inorg. Chem. 61, 9710-9724 (2022).
Ozden, A. et al. Cascade electroreduction enables efficient carbonate-free production of ethylene. Joule 5, 706-719 (2021).
Kibria, M. G. et al. Electrochemical reduction into chemical feedstocks: from mechanistic electrocatalysis models to system design. Adv. Mater. 31, e1807166 (2019).
Niu, Z. Z. et al. Hierarchical copper with inherent hydrophobicity mitigates electrode flooding for high-rate electroreduction to multicarbon. Products. J. Am. Chem. Soc. 143, 8011-8021 (2021).
Duan, G. Y. et al. Highly efficient electrocatalytic reduction to C2+ products on a Poly(ionic liquid)-based tandem catalyst. Angew. Chem. Int. Ed. Engl. 61, e202110657 (2022).
Higgins, D., Hahn, C., Xiang, C., Jaramillo, T. F. & Weber, A. Z. Gasdiffusion electrodes for carbon dioxide reduction: a new paradigm. ACS Energy Lett. 4, 317-324 (2018).
Darmanin, T. & Guittard, F. Superhydrophobic and superoleophobic properties in nature. Mater. Today 18, 273-285 (2015).
Barthlott, W. & Neinhuis, C. Purity of the sacred lotus, or escape from contamination in biological surfaces. Planta 202, 1-8 (1997).
Neinhuis, C. & Barthlott, W. Characterization and distribution of water-repellent, self-cleaning plant surfaces. Ann. Bot. 79, 667-677 (1997).
Gao, X. & Jiang, L. Water-repellent legs of water striders. Nature 432, 36-36 (2004).
Dewan, R. et al. Studying nanostructured nipple arrays of moth eye facets helps to design better thin film solar cells. Bioinspir Biomim. 7, 016003 (2012).
شكر وتقدير
نحن نعترف بالتمويل من منحة وكالة اليابان للعلوم والتكنولوجيا JPMJFS2132 (M.S.)، ومنح جمعية اليابان لتعزيز العلوم للبحث العلمي JP18H05517، JP22K19088 و JP23H00313 (M.Y.)، وبرنامج البحث والتطوير Moonshot JPNP18016 (M.Y.). نشكر البروفيسور ن. تانكا والبروفيسور ت. فوجيغايا، قسم الكيمياء التطبيقية، جامعة كيوشو على مساعدتهما في قياسات زاوية الاتصال. نشكر الدكتور تي. جي. نوجوتشي على مساعدته في قياسات زاوية الاتصال. نشكر الدكتور أ. أنزاي والدكتور م. ليو على مساعدتهما في قياسات TEM.
مساهمات المؤلفين
تصور: م.س. المنهجية: م.س. و ج.س. التحقيق: م.س. و ج.س. التصور: م.س. و ج.س. الحصول على التمويل: م.س. و م.ي. إدارة المشروع: م.ي. الإشراف: م.ي. الكتابة – المسودة الأصلية: م.س. و ج.س. الكتابة – المراجعة والتحرير: م.س. و م.ي.
قسم الكيمياء، كلية الدراسات العليا للعلوم، جامعة كيوشو، نيشى-ku، فوكوكا، اليابان.مركز أبحاث تقنيات الانبعاثات السلبية (K-NETs)، جامعة كيوشو، نيشى-كو، فوكوكا، اليابان.معهد كيمياء المواد والهندسة (IMCE)، جامعة كيوشو، نيشى-كو، فوكوكا، اليابان.المعهد الدولي لأبحاث الطاقة المحايدة للكربون (WPI-I²CNER)، جامعة كيوشو، نيشى-كو، فوكوكا، اليابان.المعهد المتقدم لأبحاث المواد (WPI-AIMR)، جامعة توهوكو، أوبا-كو، سنداي، اليابان. البريد الإلكتروني:yamauchi@ms.ifoc.kyushu-u.ac.jp
Carbon dioxide ( ) electroreduction reaction ( ) offers a promising strategy for the conversion of into valuable chemicals and fuels. in acidic electrolytes would have various advantages due to the suppression of carbonate formation. However, its reaction rate is severely limited by the slow diffusion due to the absence of hydroxide that facilitates the diffusion in an acidic environment. Here, we design an optimal architecture of a gas diffusion electrode (GDE) employing a copper-based ultrathin superhydrophobic macroporous layer, in which the diffusion is highly enhanced. This GDE retains its applicability even under mechanical deformation conditions. The in acidic electrolytes exhibits a Faradaic efficiency of with a partial current density ( ) of for multicarbon products ( ), and of when applying dilute . In a highly acidic environment, formation occurs via a second order reaction which is controlled by both the catalyst and its hydroxide.
Achieving effective utilization of carbon dioxide ( ) is of great significance for reducing the negative impacts of climate change and mitigating crisis caused by fossil fuel shortages . Renewable electricitydriven reduction reaction ( ) to multicarbon ( ) products are highly demanded due to their high availability in various fields and current market price . Over the past few years, a flow-type reactor has been used to investigate the performance , where gas reactants diffuse directly into catalyst-electrolyte interfaces through a gas diffusion layer (GDL), where can occur at a high current density .
Nevertheless, most reports have used strong alkaline electrolytes to ensure high selectivity in , which causes severe nonFaradaic consumption of due to preferential carbonate formation under alkaline conditions ( ) and results in lower carbon utilization . Moreover, the long-term accumulation of carbonate leads to flooding of the gas diffusion electrode (GDE), which thereby terminates the reaction (Supplementary Fig. 1). The operation of under acidic conditions therefore offers entirely different
strategy to overcome the challenges of conventional alkaline electrolyte systems .
In recent years, the development of highly selective catalysts that can effectively suppress the hydrogen evolution reaction (HER) in acidic environments has become a research hotspot. While some advanced catalysts have made progress in mitigating HER, they suffer from a significant reduction in the rate compared to alkaline environments . The primary reason for this matter is the absence of a hydroxide ion ( ) in an acidic environment, which causes insufficient adsorption of acidic gas molecules and limited diffusion of to the catalyst-electrolyte interface, resulting in the prevalence of undesired HER, particularly at high .
To achieve high , it is critical to overcome these inherent limitations in under acidic conditions. One potential approach is to increase the concentration at the catalyst-electrolyte interface by increasing the flux in the gas diffusion layer (GDL), which could serve as a simple and effective strategy to improve efficiency. Furthermore, hydroxide ( OH )-derived Cu catalysts ( ) have been
considered promising for achieving high selectivity towards compounds due to the presence of OH in the catalyst structure . The OH-rich nature of the catalysts can help to increase the pH of the catalytic layer, effectively suppressing HER in acidic environments. In addition, GDEs are generally composed of brittle and inflexible carbon materials , making GDEs a non-recoverable consumable.
In this study, we conducted a systematic evaluation of the factors influencing diffusion in the GDL. Based on our findings, we designed an all-metal gas diffusion enhanced Cu electrode (Cu-GDL) using OH-Cu as a catalyst. This Cu-GDL demonstrated both mechanical flexibility and applicability, making it suitable for various practical applications. We systematically evaluated the performance in an acidic environment by optimizing the electrolyte pH , catalyst amount, flow rate, electrolyte type and concentration. We achieved a high Faradaic efficiency of with a partial current density ( ) of for products, and a of that meets industrial applications even with diluted . We discovered unique kinetics of on Cu -GDL under acidic conditions: the first-order reaction at pH 6 and the second-order reaction at pH 1 . Moreover, the CO produced in could be further reduced to at slow flow rates, leading to an enhancement of the single-pass
conversion efficiency (SPCE) to 42%, while simultaneously increasing to .
Results
Modeling for diffusion in a GDL
We first verified requirements for achieving a favorable diffusion efficiency ( ) based on the architecture of the GDL, which is a hydrophobic porous electrode. DE for a GDL is described by considering Fick’s second law, Knudsen self-diffusion models and surface hydrophobicity (Supplementary Figs. 2-4, details in Methods). We found that three aspects are crucial to enhance (Fig. 1a): (1) Thin GDL; The concentration ( ) is inversely proportional to the diffusion distance ( ), and high is realized at a site with small as shown in Fig. 1b. (2) Large pore diameter; Given the frequent collisions between molecules and nano/micropore walls (Fig. 1c) , is halved when the porous diameter is smaller than 128 nm , followed by a severe -limiting behavior with decreasing pore diameter (Fig. 1d, Supplementary Fig. 3). (3) Superhydrophobic structure; Considering that diffusion coefficient in the gas phase is approximately four orders of magnitude higher than that in the liquid phase , a hydrophobic interface formed between the catalyst surface
Fig. 1 | Modeling for diffusion in a GDL. a Illustrations of diffusion in the most common GDL. The thickness and pore diameter of the GDL, and the hydrophobicity of the catalyst together affect the diffusion. (MCFP is macroporous carbon fiber paper and NCBL is nano-microporous carbon black layer). concentration ( ) decreasing along diffusion distance ( ). c Knudsen model
for diffusion through a pore with diameter . Relative calculated toward . e Illustration of diffusion on a needle-like architecture of the catalyst-electrolyte interface. is Laplace pressure, is apex angle and is tilt angle of the needle. , Relative calculated toward and .
Fig. 2 | Structural and compositional features of Cu -GDL. a Illustration of applied in . b, c SEM images for macropores (the inset of is the macroporous channel) and for high-density nanoneedles exhibiting a large contact angle (CA). d Cross-sectional SEM images to confirm ultrathin electrode thickness
and vertically grown nanoneedles. e Elemental distribution. (red is Cu , green is S ). TEM images covered with -octadecylthiol single layer as a hydrophobic layer. h Bending resistance test. i, Twisting resistance test.
and an electrolyte is an ideal space for the diffusion. The positive Laplace pressure of a gas phase at an interface between liquid and nano/microscale texture is a measure for emergence of hydrophobicity (Supplementary Fig. 4) . Thus, can rapidly diffuse on catalyst-electrolyte interfaces characterized with a positive (Fig. 1e). According to the Laplace equation, always shows a positive value when the tilt angle is and the apex angle is , and the maximum value can be achieved at and (Fig. 1f). This assessment of GDL architectures led us to design a GDE with a thinner, macroporous diameter, as well as vertical and needle-like surface structures to facilitate diffusion.
Structural and compositional features of Cu-GDL
GDEs are commonly prepared using nanoparticulate electrocatalysts and binders on GDL substrates , but they do not meet the above requirements. In contrast, a porous Cu electrode, prepared by an in situ electrooxidation of a porous Cu foil, is sufficiently thin and has large pores, with its surface covered by special nanostructures. However, achieving vertical and needle-like structures with characteristic apex and tilt angles requires precise control of the incorporation rates of and on the Cu foil surface. By optimizing the synthetic conditions, we found that the balance between electrolyte concentration and for the electrooxidation of the Cu foil surface is the most important factor to construct favorable nanostructures (see Methods and Supplementary Figs. 5-7 for more details). The reaction temperature ( ) is also critical factor for achieving the vertical and needle-like structure with characteristic apex and tilt angles (see Methods and Supplementary Figs. 8 and 9 for more details). However, the as-prepared porous Cu easily
penetrates the aqueous solution due to its large pore structure, which is unsuitable for use as a GDE in a flow cell. Therefore, we imparted water-barrier properties on the porous Cu surface by coating with 1-octadecanethiol, resulting in .
A schematic diagram of Cu -GDL with enhanced diffusion in is shown in Fig. 2a. A scanning electron microscopy (SEM) image of confirmed that the macroporous foil structure remains intact (Fig. 2b and Supplementary Fig. 10) and that nanoneedles are grown highly densely (Fig. 2b, c). A cross-sectional SEM image of Cu-GDL confirmed the ultrathin structure of (Fig. 2d), which is times thicker than a commercial carbon GDL (Supplementary Fig. 2). Energy dispersive X-ray (EDX) mapping analysis revealed that small amount (0.11 wt%) of S element of alkanethiol is uniformly distributed on the surface of Cu nanoneedle (Fig. 2e, Supplementary Fig. 11). Transmission electron microscopy (TEM) of Cu-GDL revealed that a Cu nanoneedle was coated with a layer of 1 -octadecanethiol with a thickness of (Fig. 2f and g), which corresponds to the chain length of 1 -octadecanethiol between the surface-bound S and the terminal . It should be noted that X-ray photoelectron spectroscopy (XPS) for revealed that the Cu nanoneedle coated with a layer of 1-octadecanethiol does not show any effect on the oxidation state of Cu (Supplementary Fig. 12). In addition, attenuated total reflectance Fourier transform infrared (ATR-FTIR) spectroscopy (Supplementary Fig. 13), XPS for S (Supplementary Fig. 14), and microscopic observations (Supplementary Fig. 15) further confirmed the existence of 1-octadecanethiol on Cu -GDL and its roles. The perpendicularly grown needle-like nanostructures on the surface were observed by SEM (Fig. 2d). Such high-density nanoneedle structures could multiply the hydrophobicity according to the (see Eq.
Fig. 3 | Surface states of Cu-GDL. a XRD pattern of Cu-GDL. b In situ Raman spectroscopy for at pH 6 and pH 1 with E of -1.5 V vs. SHE (Cu foil used as reference baseline, yellow stars mark bands associated with OH ). Evaluation of surface pH on Cu in 0.1 M Ar-saturated . A yellow dashed curve represents a
fitted line for the HER current. The onset oxidation potential of a Cu foil is 0.45 V (vs. RHE), and porous Cu is 0.35 V (vs. RHE). The pH difference ( ) between a Cu foil and porous Cu is 1.7.
(4)). The apex angle was determined to be in the range of (Supplementary Fig. 16), which is very close to the perfect value of suggested by our calculation of relative versus apex angles (Fig. 1f). A contact angle (CA) measurement showed that Cu-GDL has superhydrophobicity characterized with a CA of (Fig. 2c). In contrast, an alkanethiol-modified original Cu foil exhibited normal hydrophobicity with a CA of , which clearly indicates that superhydrophobicity of Cu-GDL originates from its surface structure and not only from the coating with the thiol layer (Supplementary Fig. 17). In addition, the nanostructures appear to be able to minimize the size of bubbles to enhance their desorption , which is critical in terms of energy efficiency. Slow bubble removal from the electrodes is known to cause energy losses of up to , and therefore bubbles must be efficiently removed from GDL. It should be noted that our Cu-GDL retained its superhydrophobicity even after being severely bent (Fig. 2h) and twisted (Fig. 2i). Such a durable and flexible superhydrophobic GDL may contributes to the industrialization of electroreduction.
Surface states of Cu-GDL
X-ray diffraction (XRD) patterns confirmed that the major component of Cu-GDL is metallic Cu (Fig. 3a). Interestingly, ex situ Raman spectroscopy revealed similar Raman signals around 431,528 , and for both and (Supplementary Fig. 18) . However, no peaks related to were observed in the XPS for (Supplementary Fig. 12). Furthermore, XPS for O revealed the presence of OH on the surface of Cu-GDL (Supplementary Fig. 19) . These findings indicate that the composition of Cu -GDL consists mainly of metallic Cu covered with OH . To investigate the effect of acidic electrolyte on the electrode composition in , in situ Raman spectroscopy was conducted at a potential ( ) of -1.5 V vs SHE using electrolytes of pH 6 and pH 1 , which suggested that OH is stably present on the even in a highly acidic solution under the potential (Fig. 3b). Given various influential factors such as current density, diffusion layer thickness, bulk electrolyte composition, and other factors, the determination of a pH just above the electrode surface, “intrinsic pH “, during appears to be challenging . To address this, we applied an electrochemical approach based on the onset potential for the oxidation of to , and the intrinsic pH on Cu -GDL was calculated from the onset potential observed on a pristine Cu foil as reference using Nernst equation (see Methods and Supplementary Fig. 20 for details). In this experiment, we used a slow scan rate of at low in the range of , in an inert and near-neutral 0.1 M Ar -saturated electrolyte. The test revealed that the catalyst surface has a pH of 10.9 (Fig. 3c), suggesting the alkaline nature of the Cu-GDL surface, which would reduce local concentrations, and thereby suppress HER during .
performance of and underlying mechanisms
The performance was evaluated at ranging from -0.3 to by using acidic electrolytes. High of and low Faradaic efficiency for HER less than were achieved at both pH 6 and pH 1 (Fig. 4a, Supplementary Fig. 21). The retains its original morphology after operation (Supplementary Fig. 22).
We first optimized the catalyst amount by changing the reaction time for the electrooxidation of a Cu foil. The original Cu foil coated with 1-octadecanethiol hardly participated in , and both the and the formation rate of tended to increase with increasing the electrooxidation time (Supplementary Figs. 23 and 24). To understand the relationship between the catalytically active surface area and , we further evaluated the roughness factors (rf) of each electrode by analyzing electrochemical surface area (ECSA), which reflects the number of catalytic sites (Supplementary Fig.25). The SEM images of the electrodes corresponding to the rf are shown in Fig. 4b. Considering that the high selectivity of towards is accompanied by minimal HER, we established the relationship between the and rf (Supplementary Fig. 26). Interestingly, there was a good linear correlation between and rf at pH 6, whereas showed nonlinear behavior at pH 1 (Fig. 4b, Supplementary Fig. 26). Since the as-prepared has an OH -rich surface, which reduces the local concentration, we reasoned that not only the active surface area but also the amount of OH present on the catalyst simultaneously determines the at pH 1 as described in Fig. 4c. We then attempted tried to analyze the relationship between and the quadratic roughness factor ( ). Surprisingly, showed a very good linear correlation with at pH 1 (Fig. 4b). Although the kinetics of may involve various influencing factors, we made a predictive investigation of kinetics in an acidic environment by precisely controlling the variables and found that on Cu -GDL at pH 6 is a first-order reaction depending on the number of catalytic sites, whereas at pH 1 can be described as a second-order reaction which is determined by the number of catalytic sites and the amount of OH . In this regard, we further characterized OH concentration on each electrode (Supplementary Fig. 27) and determined the rate constants of at pH 6 and pH 1 to be and , respectively (Supplementary Fig. 28) .
Next, we evaluated the carbon utilization in at with flow rate ranging from 10 to 3 sccm . Considering that the possibility to improve the recovery of to during , which has been considered as a key to enhance utilization , we additionally employed two sets of electrolytes; -saturated electrolytes with pH 6 and pH 1 , namely and . The carbon utilization tests suggested that both SPCE and conversion efficiency for gradually increase as the flow rate decreases (Fig. 4d, Supplementary Fig. 29), and the corresponding
Fig. performance of and underlying mechanisms. a FE for the production of and , and potential ( E vs. RHE, right) as functions of ( pH 6 is blue, pH 1 is red). (left) and (right) as functions of . Inset shows the SEM images of Cu -GDL having corresponding rf (error bars ). c Illustration of a function of OH species on Cu -GDL during in acidic media. d SPCE, e CO selectivity and selectivity as a function of flow rate at an applied of using electrolytes with and and
saturated electrolytes with and . g Illustration of secondary CO conversion during at a slow flow rate. h Carbon utilization percentage at flow rate of 3.5 sccm and an applied of at varying electrolyte. as a function of (diluted gas is ). j Comparison of , SPCE and pH of bulk electrolyte on Cu -GDL with those on the state-of-the-art in acidic media. a, b, d, e, f, i, error bars indicate s.d. ( replicates). are shown in Supplementary Fig. 30 and 31. At a flow rate of 3.5 sccm , it simultaneously exhibited the optimal SPCE of and the optimal of (Fig. 4d, Supplementary Fig. 31). However, when the flow rate was reduced to 3 sccm , the SPCE did not increase further beyond as the flow rate decreased (Fig. 4d). On the contrary, the HER increased to (Supplementary Fig. 32). This result suggests that supply via recovery from the dissolving electrolyte is not effective for improving SPCE, even when we use the -rich and saturated electrolytes. We then propose that this phenomenon can be attributed to the fact that recovered from tends to remain in the liquid phase. The diffusion efficiency in the liquid phase is greatly reduced compared to the gaseous phase . The encouraging point is that, when considering the formation of during , our SPCE results remain above for both pH 6 and pH 1 conditions, exceeding the theoretically maximum
achievable SPCE. The calculation results are summarized in Supplementary Tables 1 and 2 and used for comparison (see Methods). Further analysis of the product selectivity showed that the selectivity of CO decreases with decreasing of flow rate (Fig. 4e), resulting in a continuous increase of the selectivity of (Fig. 4f). This result leads us to conclude that a part of the theoretical maximum SPCE originates from the CO secondary conversion of as described in Fig. secondary conversion refers to the fact that the low flow rate results in a prolonged residence time of CO , derived from conversion, on the catalyst surface. Consequently, CO is further reduced, leading to the formation. Importantly, an enhancement in SPCE is observed due to the absence of side reactions involving formation during the carbon monoxide reduction (CORR) process . Calculated carbon utilizations in at a flow rate of 3.5 sccm are summarized in Supplementary Table 2, which shows that 30.3-31.7% of
the carbon products come from conversion, from CO conversion, and of the is used for formation (Fig. 4h).
In view of the enhanced diffusion properties of , we further evaluated the performance in the presence of impurity gas (Supplementary Fig. 33). The performance indicated that the influence of on the is limited, but remarkable on the (Fig. 4i, Supplementary Fig. 34). The for diluted gas reached -430 and at pH 6 and pH 1 , respectively (Fig. 4i). Even at such low , the productivity levels are still in a regime of interest with respect to industrial application . The performance of was compared with those of state-of-art in acidic media as shown in Fig. . In addition, in previous systems, the continuous accumulation of during required procedures such as stopping the reaction and replacing the electrolyte to maintain activity . However, these procedures significantly increased the operating costs associated with . To address this issue, we designed an automatic electrolyte recovery system (Supplementary Fig. 35) that can maintain a free electrolyte during the operation by introducing a small amount of HCl to decompose carbonates: . By implementing the electrolyte renewal system, we were able to achieve continuous operation of at a for more than 10 h with an applied of (Supplementary Fig. 36), and for more than 30 h with an applied of (Supplementary Fig. 37). In the future, the development of a more stable hydrophobic layer that surpasses the stability of thiols holds promise for further improving the long-term stability of at high .
Discussion
We first validated of the conventional GDL and found that can be improved by optimizing thickness, pore size, and hydrophobicity of GDL. Based on the analysis results, we designed a novel Cu-GDL exhibiting ultrathin, macroporous and superhydrophobic properties. It should be noted that Cu -GDL maintained its applicability even under severe bent and twisted states. By employing Cu-GDL, we achieved a of at of under acidic conditions and discovered that on is characterized as a first-order reaction at pH 6 and a second-order reaction at pH 1 . We proposed the secondary CO conversion mechanism for the enhancement of SPCE in . Furthermore, we achieved a of even using diluted . Overall, understanding systems on the enhanced gas diffusion electrode implemented in this work would accelerate the development of technology. In the future, it would be useful to further investigate the influence of the local environment in the gas diffusion electrode using advanced insitu detection methods.
Methods
Modeling of diffusion
The diffusion was assessed by assuming the architecture of GDE, which is hydrophobic porous electrodes . Generally, the gas concentration change due to diffusion is predicted by Fick’s second law, which is determined by the following equation:
where is the concentration of is time, is the diffusion coefficient, is crosswise position of the GDE. When is in a steady state, i.e. does not change with ,
Because a macropore structure does not limit diffusion, in the macroprous carbon fiber paper (MCFP, Supplementary Fig. 2) having a constant shows a linear dependence on as shown in Fig. 1b and, therefore, the Fick’s second law suggests that diffusion efficiency can be improved by thinning GDE.
A nano-microporous carbon black layer (NCBL) is made up of nanoscale carbon black particles that forms a nano-microporous layer (Supplementary Fig. 2), and the pore sizes are further reduced when catalyst coating is applied . In light of frequent collisions between molecules and nano-micropore walls, as illustrated in Fig. 1c. The diffusion coefficient ( ) in the nano-micropore domain is determined by Knudsen diffusivity , which is described as follows:
where is the bulk diffusion coefficient of is the gas constant, is temperature, is molecular mass of is an average diameter of the nano-micropore. We calculated based on Eq. (3) and suggested that is halved when becomes smaller than 128 nm , which probably causes severe concentration-limiting behavior (Fig. 1d, Supplementary Fig. 3).
As values are approximately four orders of magnitude higher than those in the liquid phase , preparing a superhydrophobic catalyst-electrolyte interface can prevent decay of the diffusion rate. Nature often exhibits a superhydrophobic surface formed on its nano-microtextured structure , such as lotus , rice leaves , water striders’ legs and moth eyes . A superhydrophobic surface shows a positive Laplace pressure from the gas present in a nanomicroscale texture . The can be expressed by using the following equation :
where is the surface tension of the liquid, is the density of the nanomicroscale texture, is the adhesion fraction of the liquid-solid interface, is half-angle of the apex, is the tilt angle of the needle (Fig. 1e, Supplementary Fig. 4), and is the static contact angle , which obtained on surface of a porous Cu foil modified with 1-octadecanethiol (Supplementary Fig. 17). When the tilt angle is and the apex angle is always shows a positive value (Fig. 1f). Our calculations indicate the maximum value can be achieved at and (Fig. 1f), which indicates that the vertical and needle-like structure reveals the marked hydrophobicity on its surface.
Electrode preparation and optimization
The preparation of GDE is based on the optimization of a previously reported in situ electrooxidation method . A porous Cu foil was first washed with , Wako) for 1 min , followed immediately by ultrasonic cleaning with acetone ( , Wako), ethanol ( , Wako), and deionized water ( ) for 5 min to remove surface impurities.
Based on the principle of in situ electrooxidation, the anode reaction can be described as follows:
Upon examining the reaction formula, it becomes evident that the relative concentrations of and play a crucial role in facilitating the efficient occurrence of the electrooxidation process. Consequently, we conducted several optimizations to ensure favorable conditions. These included adjusting the KOH concentration in the electrolyte (which controls the concentration, as shown in Supplementary Figs. 5 and 6), the electrooxidation current density (which controls the concentration, as shown in Supplementary Fig. 7), and the electrooxidation temperature (which influences the rate of and combination, as shown in Supplementary Fig. 8).
After careful consideration, we decided to use a 2 M aqueous , Wako) electrolyte was used in an ice bath maintained at . This setup allowed us to electrochemically oxidize the surface of the cleaned porous Cu foil, leading to the fabrication of needlelike nanostructures with characteristic apex and tilt angles. The electrooxidation process involved maintaining a constant oxidation current density of for approximately 30 minutes to ensure a high density of needle-like nanostructures. The resulting porous Cu foil was then dried under flowing for 30 minutes to form porous .
To preserve the original needle-like nanostructure morphology during the reduction of the porous , we implemented a mild temperature program ( per minute) by gradually heating the porous to over the course of 1 h in an environment. This step was critical because electrochemical reduction of the porous would otherwise destroy the original needle-like nanostructure (as illustrated in Supplementary Fig. 9). After reaching room temperature, the porous Cu was immersed in an Ar -saturated ethanol solution containing 1 -octadecanethiol ( 10 mM , Wako) at for 10 min . This immersion process resulted in the formation of . Continuous air flushing with Ar was maintained throughout the immersion to ensure the desired result.
Characterization
X-ray diffraction (XRD) pattern was recorded using a BRUKER D2Phaser diffractometer at 30 kV and 10 mA using radiation ( ). Scanning electron microscopy (SEM) images were obtained with a JEOL JSM-7900F microscope. Contact angle measurement was conducted on DM-301 machine. Transmission electron microscope (TEM) images were obtained using a JEOL JEM-ARM200CF microscope operating at 200 kV . X-ray photoemission spectroscopy (XPS) data were collected using an Al-K radiation source ( 1486.6 eV ) with a PHI 5000 Versa Probe. Attenuation total reflection-Fourier transform infrared (ATR-FTIR) spectra was collected with a Nicolet iS50 spectroscopy. Raman measurement was conducted on an inVia Raman microscope with a 785 nm and laser and a objective.
Evaluation of electrochemical surface area (ECSA)
A electrolyte saturated with Ar was used for evaluation of electrochemical surface area (ECSA) to determine the electrochemical double-layer capacitance ( ). An electroreduction in potential at -0.6 V versus RHE for 2 min was performed before ECSA evaluation. Cyclic voltammograms were measured at scan rates of 10,20,30,40, and in the potential range of -0.7 to -0.6 V versus . Ar was purged during the measurement. A data set of anodic and cathodic current densities at -0.65 V versus was recorded, and the resulting capacitive currents divided by 2 were plotted versus the scan rate. The slope obtained by the linear regression analysis gave the value.
Evaluation of surface on the electrode
All Cu electrodes were reduced at -0.6 V versus RHE for 2 min before cyclic voltammetry (CV) was performed. The CV was conducted in an
Ar-saturated electrolyte at a sweep rate of while air in the cell was purged with Ar. The surface pH on the electrode was calculated by using following equations:
where, is surface pH of the catalyst/electrode, is pH of an electrolyte (details in the description of Supplementary Fig. 20).
In situ Raman spectroscopy measurement
A custom-made electrochemical Raman flow cell was used for in situ Raman measurement. A thin electrolyte layer of 5 mm thickness allows the laser to directly irradiate the catalyst surface. A coiled Pt wire ( ) as a counter electrode, and NaCl ) as a reference electrode were used. Nafion-117 was placed to separate the catholyte and anolyte chambers. The anolyte was 1 M KOH at flow rate of , the catholyte was 1 M KCl with pH 6 and pH 1 at a flow rate of , and was continuously flowed into the gas chamber at a flow rate of during the test.
Electrochemical measurements
All electrochemical measurements were performed in a gas diffusion flow reactor with a Parstat MC potentiostat (Princeton Applied Research). We used a prepared Cu-GDL as a cathode, a Nafion 117 membrane as a membrane and a Ni foam as an anode, which were positioned and clamped together via gaskets. Unless otherwise stated, a mixed solution of , Wako and 1 M HCl , and 1 M KOH were used as a catholyte, and circulated through the electrochemical cell using a peristaltic pump with a flow rate of , while the (99.99%) flow rate was controlled to be . Considering the need for a sustained and stable oxygen evolution reaction to balance the high reaction rate of , a 1 M KOH was used as the anodic electrolyte. This choice is made due to the use of Nafion 117, a cation exchange membrane, that eliminates crossover to the cathodic side, which affects the pH of the cathodic electrolyte. By using the following equation, the potential versus is calibrated in relation to the reversible hydrogen electrode (RHE): vs. RHE vs. pH . The iR drop was compensated by electrochemical impedance spectroscopy (EIS) under open circuit potentials. This EIS test was conducted immediately after each set of experiments to ensure the accuracy of the internal resistance. Gas chromatography (GC, Agilent 490) was used to analyze effluent gas products extracted from the cathodic compartment, and liquid products were analyzed using high-performance liquid chromatography (HPLC, Shimadzu LC-20AD).
Calculations for reaction kinetics
The first-order and the second-order reactions are described by following equations;
and
where is formation rate of and are the reaction rate constant, [Cat.] and are the concentration of the catalyst and the OH contained in the catalyst, respectively.
Calculations for Faradaic efficiency (FE) and partial current density (j)
The Faradaic efficiency of gas products ( ) and liquid products ( ) were calculated based on the following equations:
where is the number of transferred electrons to produce one molecule of the focusing product is the Faraday constant, is the concentration of the product determined by GC or HPLC, is the flow rate of and are pressure, temperature, and total charge followed in the experiment, is the gas constant, is the volume of the electrolyte.
The partial current density ( ) was calculated using:
where and are reaction current, the Faradaic efficiency of the target product and surface area of the working electrode.
Calculation for formation rate (FR), selectivity, single pass conversion efficiency (SPCE) and conversion efficiency ( ) The formation rate, selectivity, single pass conversion efficiency and conversion efficiency was calculated using:
where , Selectivity , and SPCE are formation rate, selectivity, single pass conversion efficiency of the target product , respectively. and are reaction time and the number of carbon atoms in each product , respectively. is sum of . is theoretical maximum SPCE of the target product when considering the carbonate formation.
Data availability
Source data are provided with this paper. Source data for diffusion modeling, surface state characterization, and reduction reaction performance are available from Figshare with the accession code https://doi.org/10.6084/m9.figshare.24778809. Source data are provided with this paper.
References
Olah, G. A., Prakash, G. K. & Goeppert, A. Anthropogenic chemical carbon cycle for a sustainable future. J. Am. Chem. Soc. 133, 12881-12898 (2011).
Nitopi, S. et al. Progress and perspectives of electrochemical reduction on copper in aqueous electrolyte. Chem. Rev. 119, 7610-7672 (2019).
Ma, S. et al. Electroreduction of carbon dioxide to hydrocarbons using bimetallic Cu-Pd catalysts with different mixing. Patterns J. Am. Chem. Soc. 139, 47-50 (2017).
Ma, W. et al. Electrocatalytic reduction of to ethylene and ethanol through hydrogen-assisted C-C coupling over fluorinemodified copper. Nat. Catal. 3, 478-487 (2020).
De Arquer, F. P. G. et al. electrolysis to multicarbon products at activities greater than 1 A cm- 2. Science 367, 661-666 (2020).
Dinh, C.-T. et al. electroreduction to ethylene via hydroxidemediated copper catalysis at an abrupt interface. Science 360, 783-787 (2018).
Zheng, M. et al. Electrocatalytic -to-C(2+) with amperelevel current on heteroatom-engineered copper via tuning *CO intermediate coverage. J. Am. Chem. Soc. 144, 14936-14944 (2022).
Dinh, C.-T., Li, Y. C. & Sargent, E. H. Boosting the single-pass conversion for renewable chemical electrosynthesis. Joule 3, 13-15 (2019).
Ma, M. et al. Insights into the carbon balance for electroreduction on Cu using gas diffusion electrode reactor designs. Energy Environ. Sci. 13, 977-985 (2020).
Huang, J. E. et al. electrolysis to multicarbon products in strong acid. Science 372, 1074-1078 (2021).
Zhao, Y. et al. Conversion of to multicarbon products in strong acid by controlling the catalyst microenvironment. Nat. Synth. 2, 403-412 (2023).
Xie, Y. et al. High carbon utilization in reduction to multi-carbon products in acidic media. Nat. Catal. 1-7 (2022).
lijima, G., Inomata, T., Yamaguchi, H., Ito, M. & Masuda, H. Role of a hydroxide layer on Cu electrodes in electrochemical reduction. ACS Catalysis 9, 6305-6319 (2019).
Sun, M., Staykov, A. & Yamauchi, M. Understanding the roles of hydroxide in electroreduction on a Cu electrode for achieving variable selectivity. ACS Catalysis 12, 14856-14863 (2022).
Kim, B., Hillman, F., Ariyoshi, M., Fujikawa, S. & Kenis, P. J. A. Effects of composition of the micro porous layer and the substrate on performance in the electrochemical reduction of to . Power Sources 312, 192-198 (2016).
Shou, D., Fan, J., Mei, M. & Ding, F. An analytical model for gas diffusion though nanoscale and microscale fibrous media. Microfluidics Nanofluidics 16, 381-389 (2013).
Shi, R. et al. Efficient wettability-controlled electroreduction of to CO at interfaces. Nat. Commun. 11, 3028 (2020).
Carroll, J. J., Slupsky, J. D. & Mather, A. E. The solubility of carbon dioxide in water at low pressure. J. Phys. Chem. Ref. Data 20, 1201-1209 (1991).
Yamauchi, Y., Tenjimbayashi, M., Samitsu, S. & Naito, M. Durable and flexible superhydrophobic materials: abrasion/scratching/slicing/droplet impacting/bending/twisting-tolerant composite with porcupinefish-like structure. ACS Appl Mater. Interfaces 11, 32381-32389 (2019).
Lees, E. W., Mowbray, B. A. W., Parlane, F. G. L. & Berlinguette, C. P. Gas diffusion electrodes and membranes for reduction electrolysers. Nat. Rev. Mater. 7, 55-64 (2021).
Wakerley, D. et al. Bio-inspired hydrophobicity promotes reduction on a Cu surface. Nat. Mater. 18, 1222-1227 (2019).
Burdyny, T. et al. Nanomorphology-enhanced gas-evolution intensifies reduction electrochemistry. ACS Sustain. Chem. Eng. 5, 4031-4040 (2017).
Lv, J. J. et al. A highly porous copper electrocatalyst for carbon dioxide reduction. Adv. Mater. 30, e1803111 (2018).
Angulo, A., van der Linde, P., Gardeniers, H. & Modestino, M. & Fernández Rivas, D . Influence of bubbles on the energy conversion efficiency of electrochemical reactors. Joule 4, 555-579 (2020).
Niaura, G. Surface-enhanced Raman spectroscopic observation of two kinds of adsorbed OH- ions at copper electrode. Electrochim. Acta 45, 3507-3519 (2000).
Gupta, N., Gattrell, M. & MacDougall, B. Calculation for the cathode surface concentrations in the electrochemical reduction of in KHCO3. Solut. J. Appl. Electrochem. 36, 161-172 (2005).
Cheng, J. et al. Mechanistic study for the reaction of complexes with m-chloroperbenzoic acid in catalytic alkane oxidations. Inorg. Chem. 61, 9710-9724 (2022).
Ozden, A. et al. Cascade electroreduction enables efficient carbonate-free production of ethylene. Joule 5, 706-719 (2021).
Kibria, M. G. et al. Electrochemical reduction into chemical feedstocks: from mechanistic electrocatalysis models to system design. Adv. Mater. 31, e1807166 (2019).
Niu, Z. Z. et al. Hierarchical copper with inherent hydrophobicity mitigates electrode flooding for high-rate electroreduction to multicarbon. Products. J. Am. Chem. Soc. 143, 8011-8021 (2021).
Duan, G. Y. et al. Highly efficient electrocatalytic reduction to C2+ products on a Poly(ionic liquid)-based tandem catalyst. Angew. Chem. Int. Ed. Engl. 61, e202110657 (2022).
Higgins, D., Hahn, C., Xiang, C., Jaramillo, T. F. & Weber, A. Z. Gasdiffusion electrodes for carbon dioxide reduction: a new paradigm. ACS Energy Lett. 4, 317-324 (2018).
Darmanin, T. & Guittard, F. Superhydrophobic and superoleophobic properties in nature. Mater. Today 18, 273-285 (2015).
Barthlott, W. & Neinhuis, C. Purity of the sacred lotus, or escape from contamination in biological surfaces. Planta 202, 1-8 (1997).
Neinhuis, C. & Barthlott, W. Characterization and distribution of water-repellent, self-cleaning plant surfaces. Ann. Bot. 79, 667-677 (1997).
Gao, X. & Jiang, L. Water-repellent legs of water striders. Nature 432, 36-36 (2004).
Dewan, R. et al. Studying nanostructured nipple arrays of moth eye facets helps to design better thin film solar cells. Bioinspir Biomim. 7, 016003 (2012).
Acknowledgements
We acknowledge funding from Japan Science and Technology Agency grant JPMJFS2132 (M.S.), Japan Society for the Promotion of Science Grants-in-Aid for Scientific Research JP18H05517, JP22K19088 and JP23H00313 (M.Y.), and Moonshot Research and Development Program JPNP18016 (M.Y.). We thank Prof. N. Tanaka and Prof. T. Fujigaya, Department of Applied Chemistry, Kyushu University for their help with
contact angle measurements. We thank Dr. T. G. Noguchi for his help with contact angle measurements. We thank Dr. A. Anzai and Dr. M. Liu for their help with TEM measurements.
Author contributions
Conceptualization: M.S. Methodology: M.S. and J.C. Investigation: M.S. and J.C. Visualization: M.S. and J.C. Funding acquisition: M.S. and M.Y. Project administration: M.Y. Supervision: M.Y. Writing – original draft: M.S. and J.C. Writing – review & editing: M.S. and M.Y.
Correspondence and requests for materials should be addressed to Miho Yamauchi.
Peer review information Nature Communications thanks the anonymous reviewers for their contribution to the peer review of this work. A peer review file is available.
Department of Chemistry, Graduate School of Science, Kyushu University, Nishi-ku, Fukuoka, Japan. Research Center for Negative Emissions Technologies (K-NETs), Kyushu University, Nishi-ku, Fukuoka, Japan. Institute for Materials Chemistry and Engineering (IMCE), Kyushu University, Nishi-ku, Fukuoka, Japan. International Institute for Carbon-Neutral Energy Research (WPI-I²CNER), Kyushu University, Nishi-ku, Fukuoka, Japan. Advanced Institute for Materials Research (WPI-AIMR), Tohoku University, Aoba-ku, Sendai, Japan. e-mail: yamauchi@ms.ifoc.kyushu-u.ac.jp