تحكم خشونة العيوب في الزلازل الناتجة عن الحقن Fault roughness controls injection-induced seismicity

المجلة: Proceedings of the National Academy of Sciences، المجلد: 121، العدد: 3
DOI: https://doi.org/10.1073/pnas.2310039121
PMID: https://pubmed.ncbi.nlm.nih.gov/38215182
تاريخ النشر: 2024-01-12

تحكم خشونة العيوب في الزلازل الناتجة عن الحقن

لي وانغ (D)، غريغورز كفياتك فرانسوا رينار (D)، سيمون غويرين-مارت (D)، إريك ريباشي (D)، ماركو بونهوف (د)، ميخائيل ناومان (D) وجورج دريسن

حرره بيتر كيلمن، مرصد لامونت-دوهرتي للأرض، باليسايدز، نيويورك؛ استلم في 20 يونيو 2023؛ قبل في 4 ديسمبر 2023

الملخص

تسود خشونة السطح بشكل شائع في العيوب الطبيعية عبر مقاييس طولية مختلفة. على الرغم من الدراسات الواسعة التي تبرز الدور المهم لجيومترية العيوب في ديناميات الزلازل التكتونية، إلا أن تأثير خشونة العيوب على الزلازل الناتجة عن السوائل وكيفية تأثيرها لا يزال غامضًا. هنا، نحقق في تأثيرات جيومترية العيوب وتغاير الإجهاد على انزلاق العيوب الناتج عن السوائل وخصائص الزلازل المرتبطة باستخدام تجارب مختبرية ونمذجة عددية. نقوم بإجراء تجارب حقن السوائل على عينات من الحجر الرملي الغني بالكوارتز تحتوي على عيب ناعم أو خشونة. نجد أن الخشونة الهندسية تبطئ انزلاق العيوب الناتج عن الحقن وتقلل من سرعات الانزلاق الكلية ومعدلات ضعف الانزلاق. تتحكم تغاير الإجهاد والخشونة في توزيع مركز الزلزال، وخصائص التردد-الحجم، وآليات المصدر للانبعاثات الصوتية الناتجة عن الحقن (المماثلة للزلازل الطبيعية). على عكس العيوب الناعمة حيث يتم توزيع الانبعاثات الصوتية الناتجة عن الحقن بشكل موحد، فإن الانزلاق على العيوب الخشنة ينتج انبعاثات صوتية موضعية مع آليات مصدر غير مزدوجة واضحة. نوضح أن هذه الانبعاثات الصوتية المجمعة تحدث حول النقاط ذات الإجهاد العالي حيث تكون معدلات الانزلاق المحلية الناتجة أعلى، مصحوبة بانخفاض في مقياس غوتنبرغ-ريختر. -القيم. تشير نتائجنا إلى أن المراقبة في الوقت الحقيقي للميكروسيزمية المستحثة أثناء حقن السوائل قد تسمح بتحديد التوطين التدريجي للنشاط الزلزالي وتحسين التنبؤ بالأحداث الخارجة عن السيطرة.

زلازل مختبرية | الزلازل الناتجة عن السوائل | خشونة الفوالق | تباين الإجهاد | انزلاق غير زلزالي
الخشونة الهندسية، وهي الانحراف عن السطح المستوي، تميز العيوب الطبيعية على مدى واسع من مقاييس الطول (1-5)، حيث تظهر قانون قياس ذاتي متسق. لقد أظهرت العديد من الدراسات أن وجود نتوءات هندسية على العيوب يؤدي إلى توزيع غير متجانس بشكل كبير للضغوط (6-11). تؤثر خشونة العيوب والضغوط المحلية غير المتجانسة على نشوء، انتشار، وتوقف الانكسارات القصية (10، 12، 13)، وكذلك على تسلسلات الزلازل الأولية، الرئيسية، والارتدادية (14، 15)، وتوزيع الانزلاق الزلزالي ومواقع بؤر الزلازل. . وبالمثل، حركة الأرض، نمط الإشعاع ومعلمات المصدر للأحداث الزلزالية (17-19)، وتوزيع مناطق الأضرار خارج الفوالق ترتبط بهياكل العيوب. تبرز تجارب الاحتكاك في المختبر الدور المهم لخشونة العيوب في التحكم في نشوء التمزق وعدم استقرار الانزلاق. عند مقارنتها بالعيوب الملساء، تظهر العيوب الخشنة وقت نشوء أطول وطول نشوء أكبر ولكن سرعات انزلاق ماكروسكوبية أقل ونطاق أوسع من سرعات التمزق. علاوة على ذلك، أظهرت معلمات الاحتكاك المرتبطة بالمعدل والحالة، المستمدة تجريبيًا من تجارب مختبرية أجريت على عينات ذات خشونة مختلفة، اتجاهات مختلفة ومتعارضة مع الخشونة. بالإضافة إلى السلوك الميكانيكي الغني، فإن التوزيع المكاني والخصائص الإحصائية لظواهر الانبعاث الصوتي المرتبطة بفشل النتوءات المجهرية مرتبطة ارتباطًا وثيقًا بملمس سطح الفالق.
قد يتسبب حقن السوائل في الطبقات تحت السطحية في انزلاق صدع موجود مسبقًا زلزاليًا وتحفيز أحداث زلزالية (زلازل ناتجة عن الأنشطة البشرية)، والتي تم توثيقها في جميع أنحاء العالم في أنظمة الطاقة الحرارية الأرضية المعززة، وحقن المياه المستعملة، والتخزين الجيولوجي لثاني أكسيد الكربون. قد يحدث إعادة تنشيط للصدع المرتبطة بحقن السوائل نتيجة لانخفاض الضغط الطبيعي الفعال الذي يحرر الصدع، وتغيرات الضغط البوروالاستاتيكي، و/أو انتقال الضغط من خلال الانزلاق غير الزلزالي. توثق المسوحات الجيوفيزيائية الواسعة حدوث الزلازل المستحثة التي تتأثر بضغط السوائل، ومعدل الحقن، وحجم السوائل المحقونة. تشير النماذج النظرية والتجارب المخبرية أيضًا إلى علاقات سببية بين معلمات التحفيز والنشاط الزلزالي. بالإضافة إلى معلمات حقن السوائل، قد يظهر سلوك انزلاق معقد ناتج عن الحقن اعتمادًا على حالات الضغط الخلفية، وخصائص الاحتكاك المعتمدة على الضغط، والتفاعل بين تغير النفاذية وانزلاق الصدع. بينما تم استكشاف تأثيرات خشونة السطح على الزلازل التكتونية بشكل موسع، لا يزال دور هيكل الصدع وعدم التجانس على الزلازل المستحثة غير واضح.

الملخص

أهمية الزلازل الناتجة عن السوائل المرتبطة بالأنشطة الصناعية، مثل التخلص من المياه العادمة، وإنتاج الطاقة الحرارية الجوفية، و تخزين، تلقت مخاوف علمية متزايدة. العيوب الطبيعية التي تستضيف الزلازل عادة ما تظهر هياكل غير مستوية. توفر هذه الدراسة معلومات واضحة حول كيفية تأثير هيكل العيب وعدم التجانس على انزلاق العيب الناتج عن الحقن وخصائص الزلازل المرتبطة به، باستخدام تجارب حقن السوائل المصممة بشكل جيد على العيوب المخبرية والنمذجة العددية ذات الصلة. تشير النتائج إلى أن الخشونة الهندسية تبطئ انزلاق العيب الناتج عن الحقن وتؤثر على توزيع النقاط البؤرية، وخصائص التردد-الحجم، وآليات المصدر للزلازل الناتجة. نبرز الأدوار الرئيسية التي تلعبها خشونة العيب وعدم التجانس في الضغط في تعديل الانتقال من انزلاق غير زلزالي إلى انزلاق زلزالي عند تعرضه لزيادة ضغط السوائل، مما يؤدي إلى أحداث كبيرة ناتجة محلية حول النقاط المتوترة بشدة.

صعب المنال. تشير عدة محاكيات عددية للتمزقات الناتجة عن الحقن على العيوب الخشنة إلى أن تباين الإجهاد الناجم عن خشونة العيب يتحكم بشكل أساسي في حجم التمزق وإطلاق اللحظة الزلزالية، بالإضافة إلى ضغط السوائل وحجم الحقن. تشير عدد محدود من التجارب إلى أن خشونة السطح للعيوب المخبرية في عينات الجرانيت تؤثر على الخصائص الهيدروليكية للعيوب، مما يؤدي إلى توزيع متغير لضغط السوائل واستجابات انزلاق مختلفة (55-57). اقترحت التوزيعات الزمانية والمكانية لضغط السوائل في هذه التجارب أن عدم تجانس الضغط وعدم تجانس الإجهاد كانا مرتبطين بشكل كبير، مما يعقد تفسير انزلاق العيوب الملاحظ.
في هذا العمل، نحقق تجريبيًا في تأثير خشونة العيوب وعدم تجانس الضغط على انزلاق العيوب الناتج عن الحقن. نقوم بفصل تأثيرات عدم تجانس الضغط وعدم تجانس الإجهاد باستخدام عينات من الحجر الرملي الغني بالكوارتز ذات النفاذية العالية كمواد اختبار، بحيث يتوازن ضغط السائل بسرعة في جميع أنحاء حجم العينة. لاستكشاف تأثير الخشونة الهندسية، نقوم بإعداد عيوب مختبرية مقطوعة بالمنشار ومصقولة وعينات مكسورة بشكل خشن لإجراء تجارب حقن السوائل. تظهر النتائج أن الهندسة المعقدة للعيوب تبطئ انزلاق العيوب الناتج عن الحقن وتمارس سيطرة قوية على
التوزيع المكاني، وخصائص التردد-السعة، وآليات المصدر للأحداث الناتجة عن الحقن. من أجل مزيد من التحليل للتأثيرات الملحوظة لعدم تجانس العيوب والإجهاد، نقارن البيانات التجريبية بنتائج النمذجة العددية لانزلاق العيوب على العيوب الملساء والخشنة.

النتائج

لقد قمنا بتحميل عينات أسطوانية تحتوي على واجهة صدع مائلة مع خشونة سطحية متغيرة (سطح أملس مقطوع بالمنشار مقابل سطح خشن متصدع) في جهاز ضغط ثلاثي المحاور إلى حالة إجهاد حرجة، ومن ثم قمنا بتنشيط انزلاق الصدع باستخدام بروتوكولات حقن السوائل المحددة (الشكل 1A، المواد والأساليب). لدراسة تأثير الخشونة الهندسية على انزلاق الصدع المستحث، قمنا بإنتاج سلسلة من أحداث الانزلاق المستحث بالحقن على ثلاث عينات، واحدة تحتوي على صدع أملس واثنتان مقطوعتان بواسطة صدوع خشنة (الصدع الخشن #1 والصدع الخشن #2، على التوالي) في ظروف حدود ثابتة. على النقيض الواضح من الصدع الأملس المقطوع بالمنشار الذي يتمتع بسطح طوبوغرافي مسطح وموحد مكانيًا (الشكل 1B)، تعرض الصدعين المتصدعين خشونة سطحية كبيرة مع اختلاف ارتفاع أقصى يصل إلى 7 مم (الشكل 1C
الشكل 1. إعداد تجريبي والصدوع المخبرية المعدة مع خشونة سطحية متغيرة. (A) تجارب حقن السوائل التي أجريت على عينات أسطوانية من رملية غنية بالكوارتز قابلة للاختراق تحتوي على صدع مائل ( بالنسبة لمحور التحميل) صدع أملس أو خشن خضع لضغط ثلاثي المحاور. تم تركيب العينات مع مجموعة من أجهزة قياس التشوه والمحولات الكهروضغطية. ( و ) ارتفاع سطح الكتلة الصخرية السفلية للصدوع الأملس (المقطوع بالمنشار) والخشن (المتصدع بالقص)، على التوالي. (D) كثافة الطيف الترددي (PSD) لملفات السطح على طول اتجاه انزلاق الصدع للصدوع الأملس والخشن. و تعني الحد الأدنى والحد الأقصى من متجه الموجة بينما و تشير إلى طول الصدع وأدنى طول موجي، على التوالي. تعرض صدعين خشنيين في المختبر خشونة ذاتية التماثل عريضة النطاق (من حجم حبة الكوارتز إلى طول الصدع ) مع أسطوانة هيرست تبلغ 0.65. بالمقابل، فإن PSD للصدع المقطوع بالمنشار عبر نطاق الطول الموجي المماثل مسطح تقريبًا ولا يتبع قانون القوة.
وملحق SI، الشكل S2). باستخدام تحويل فورييه السريع، تكشف كثافة الطيف الترددي (PSD) لملفات الارتفاع الموازية والمتعامدة مع انحدار الصدع عن خشونة ذاتية التماثل عريضة النطاق (من حجم حبة الكوارتز إلى طول الصدع) مع أسطوانة هيرست تبلغ حوالي 0.65 (الشكل 1D وملحق SI، الشكل S3). بالمقابل، فإن PSD للصدع الأملس المقطوع بالمنشار عبر نطاق الطول الموجي المماثل مسطح تقريبًا ولا يتبع قانون القوة.
سلوك الانزلاق المستحث بالحقن على الصدوع التجريبية ذات الخشونة المتغيرة. نبلغ عن تجربتين تمثيليتين على عينات ذات خشونة صدع مختلفة بشكل كبير حيث يتم زيادة ضغط السائل على طول صدع مشدود بشكل حرج بشكل تدريجي. ال
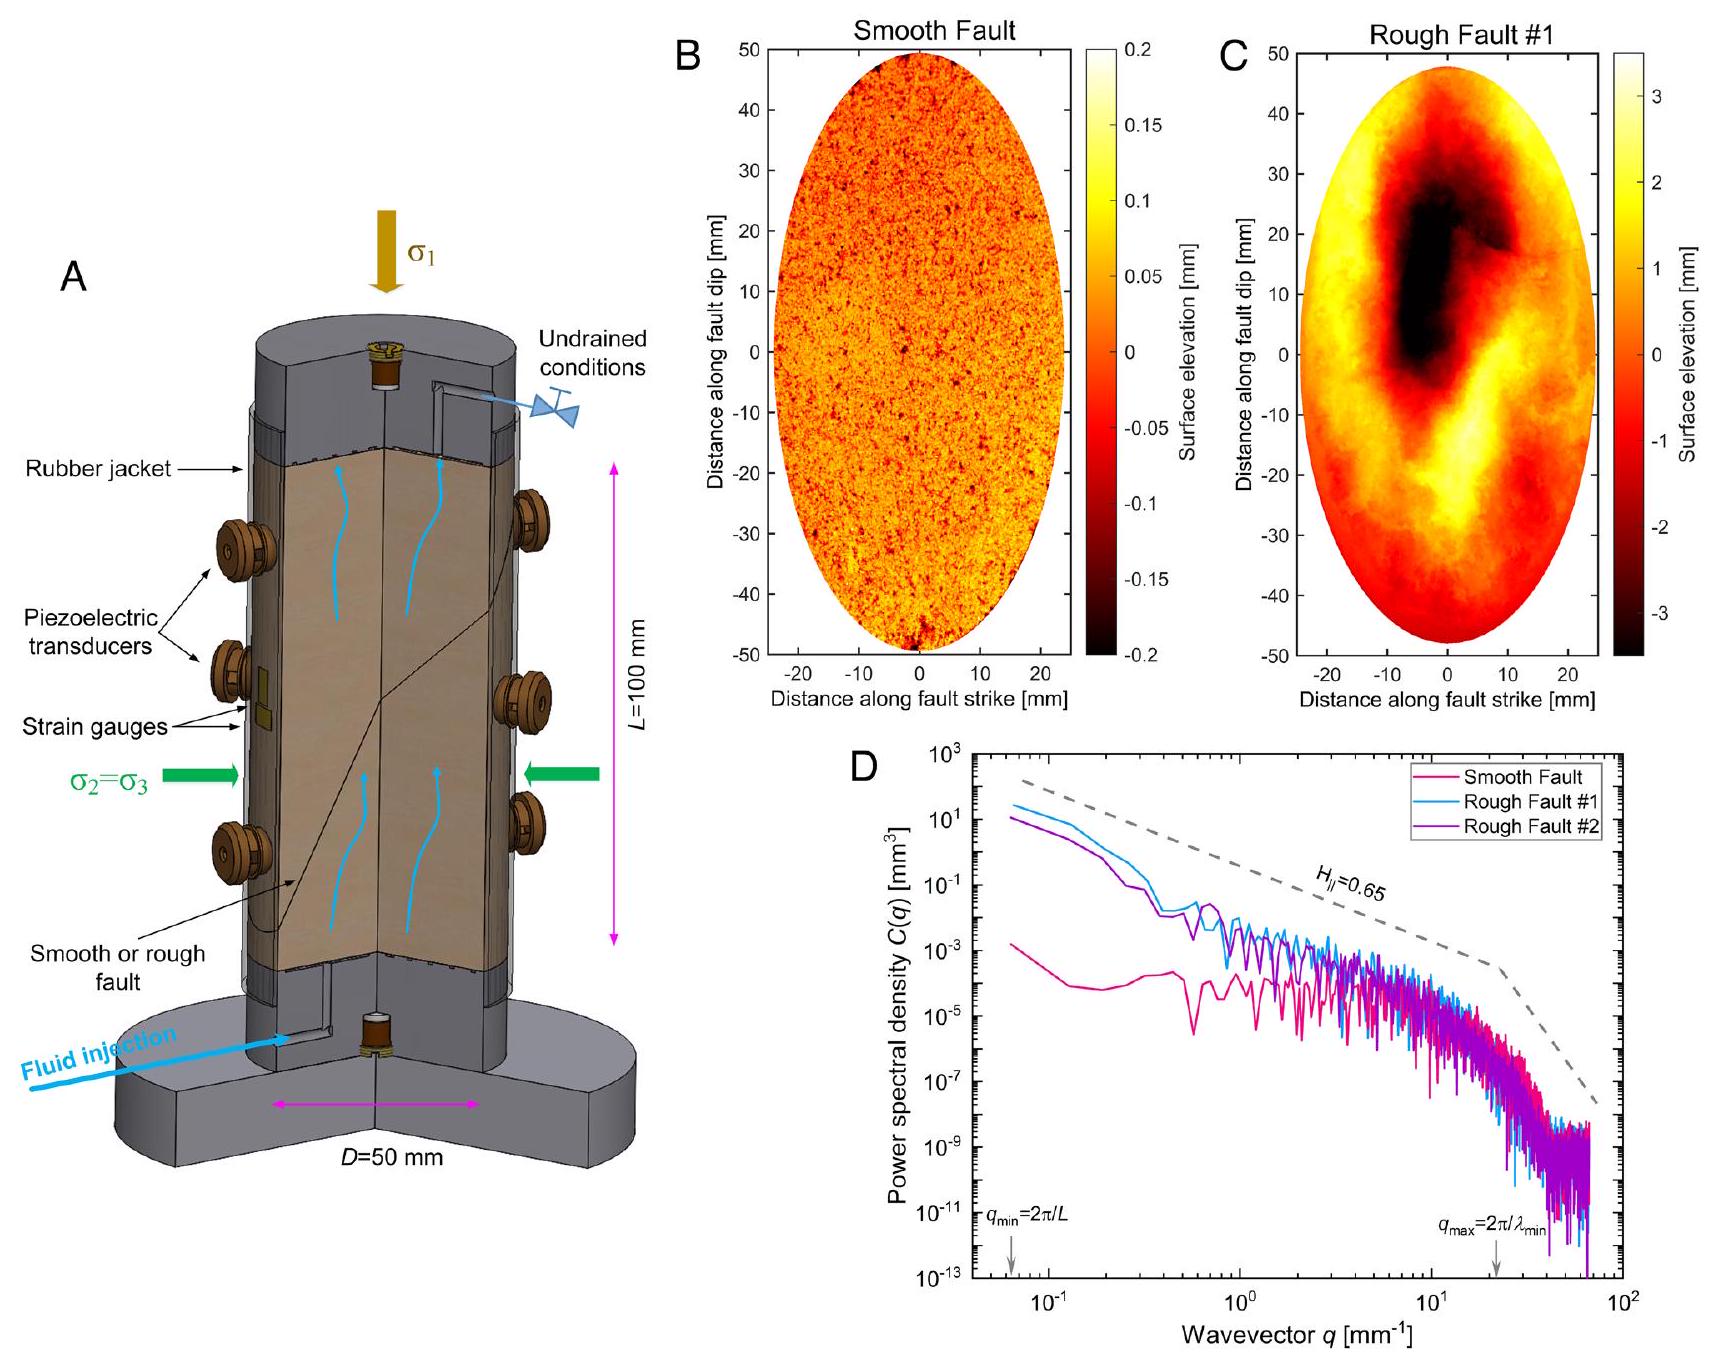
عينات أسطوانية تحتوي على واجهة صدع مقطوع بالمنشار أو صدع خشن مائل عند بالنسبة لمحور التحميل، يتم تحميلها محوريًا عند ضغط محصور ثابت وضغط سائل ، مما يؤدي إلى زيادة تدريجية في إجهاد القص المحسوب مع الانزلاق حتى تصل إلى ذروة قوة القص (المرحلة 1 في الشكل و ). عند الاقتراب من ، يكون إجهاد القص ثابتًا تقريبًا بينما يتسارع معدل انزلاق الصدع إلى قيمة ثابتة، تساوي تقريبًا سرعة نقطة الحمل المفروضة للرام (ملحق SI، الشكل S5A). تظهر بيانات إجهاد القص تصلبًا طفيفًا لكل من الصدوع الأملس والخشن (الشكل و )، وتتناسب قيم ومعاملات الاحتكاك الثابتة المقابلة مع خشونة سطح الصدع (ملحق SI، الشكل S5D). تشير هذه النتيجة إلى أن
الشكل 2. السلوك الميكانيكي لانزلاق الصدع المستحث بالحقن على الصدوع الأملس والخشن. ( و ) التطور الزمني لإجهاد القص، ضغط السائل، معدل، ومتوسط انزلاق الصدع ومعدل الانزلاق الملاحظ على الصدع الأملس والصدع الخشن #1، على التوالي. يتم تقسيم الإجراء التجريبي إلى ثلاث مراحل، كما هو موضح بواسطة التسميات 1، 2 و3، على التوالي. بعد تحقيق قوة القص ( ) في المرحلة 1، يتم تقليل إجهاد القص إلى حوالي في المرحلة 2، تليها خطة حقن سائل من ست مراحل في المرحلة 3. ( و ) تفاصيل مكبرة عن انزلاق الصدع المستحث بالحقن، معدل AE، إلخ، خلال المرحلة الرابعة من حقن السائل للصدوع الأملس والخشن، على التوالي. استجابةً لضغط السائل، يخضع الصدع الأملس لثلاث مراحل مختلفة مع الوقت، كما هو موضح بالمناطق المظللة مع التسميات I وII وIII. بالمقابل، يتم ملاحظة مرحلتين على الصدع الخشن. (E) تم تجميع إزاحات الانزلاق والانخفاضات المرتبطة بإجهاد القص خلال أحداث الانزلاق المستحث بالحقن في الصدوع الأملس والخشن. تتوافق الانحدارات الخطية للبيانات، كما هو موضح بواسطة الخطوط المتقطعة الرمادية، مع معدلات ضعف الانزلاق (صلابة التفريغ) للصدوع الأملس والخشن. (F) تم تجميع سرعات الانزلاق القصوى لأحداث الانزلاق المستحث خلال ست مراحل من حقن السوائل كدالة لانخفاضات الإجهاد في الصدوع الأملس والخشن.
تقدم الخشونة الهندسية مقاومة إضافية للقص المستمر، بما يتماشى مع النتائج من النماذج النظرية والعددية. في المرحلة 2، نقوم بضبط إجهاد القص إلى حوالي للصدع المقطوع بالمنشار والصدع الخشن #1 (الشكل 2 و ) وإلى حوالي للصدع الخشن #2 (ملحق SI، الشكل S4A)، على التوالي. تكون الضغوط العادية والقص الفعالة الأولية 50.1 ميجا باسكال و34.0 ميجا باسكال للصدع المقطوع بالمنشار، 53.0 ميجا باسكال و39.5 ميجا باسكال للصدع الخشن #1، و49.6 ميجا باسكال و33.5 ميجا باسكال للصدع الخشن #2، على التوالي. ثم نثبت موضع المكبس المحوري لضمان حالة عدم الإزاحة على الطرفين المتطرفين من العينة ثم نبدأ حقن السائل. نتبع خطة حقن سائل من ست مراحل حيث يتم زيادة ضغط السائل بطريقة تدريجية من 5 ميجا باسكال إلى 29 ميجا باسكال بمعدل ضغط . خلال كل مرحلة من مراحل حقن السائل، يتم تحقيق زيادة في ضغط السائل قدرها 4 ميجا باسكال خلال دقيقتين، تليها مرحلة هضبة تستمر لمدة 8 دقائق.
نظرًا لارتفاع نفاذية العينة ، يتوازن ضغط السائل بسرعة في حدود المللي ثانية داخل حجم العينة بالكامل . مع بدء حقن السائل، يبدأ الانزلاق على طول الصدوع الأملس والخشن بتأخير يتناقص تدريجيًا مع دورات الحقن اللاحقة (المرحلة 3 في الشكل و وأفلام S1 وS2). يظهر الصدع الأملس أحداث انزلاق بطيئة متقطعة خلال الحقن مع زيادة سرعة الانزلاق القصوى إلى حوالي ، مصحوبة بانخفاضات متزايدة في الإجهاد وانفجارات سريعة في AE بمعدل ذروة يصل إلى 150 حدثًا في الثانية (الشكل 2A). على النقيض من ذلك، في ظروف مماثلة ومعدلات ضغط سائل، تصل أحداث الانزلاق المستحث على طول الصدوع الخشنة إلى سرعات انزلاق قصوى أقل تبلغ حوالي (الشكل 2C). هنا، تكون معدلات AE القصوى ومعدلات الانخفاض اللاحقة مع الوقت أقل للأسطح الخشنة، لكن انخفاضات الإجهاد تزداد مع أحداث الانزلاق المتتالية. تبرز تجاربنا أن خشونة الصدع تعزز استقرار انزلاق الصدع المستحث بالحقن.
تعتمد بشكل كبير على معدل انزلاق الصدع المستحث بالحقن المتطور على الخشونة الهندسية، كما هو موضح بالتفصيل في المرحلة الرابعة المكبرة من حقن السائل (الشكل و ). بعد بدء ضغط السائل، يبقى الصدع الأملس مقفلاً أولاً لمدة حوالي 73 ثانية (المرحلة I في الشكل 2B). ثم يبدأ انزلاق الصدع ويتسارع بسرعة إلى معدل انزلاق ذروة، والذي ينخفض بعد ذلك إلى قيمة متبقية تبلغ حوالي في حوالي 28 ثانية (المرحلة II في الشكل 2B)، تليها مرحلة استرخاء طويلة الأمد مع تذبذبات طفيفة في سرعة الانزلاق ومعدل AE عند انتهاء حقن السائل (المرحلة III في الشكل 2B). يرتبط معدل الانزلاق المتطور ارتباطًا وثيقًا بمعدل AE.
بالمقارنة مع الصدع الأملس، تخضع الصدوع الخشنة أولاً لتأخير أقصر يتراوح بين 40 إلى 50 ثانية بعد بدء حقن السائل (المرحلة I في الشكل 2D وملحق SI، الشكل S4B). تكون سرعة الانزلاق القصوى والتسارع أقل مع مرحلة استرخاء مطولة (المرحلة II في الشكل 2D وملحق SI، الشكل S4B). على الرغم من الاختلاف الطفيف في مستويات الإجهاد الأولية بين الصدعين الخشنين، فإن النتائج من هاتين العينتين متشابهة.
لمقارنة الفرق في ديناميات الانزلاق بين العيوب السلسة والخشنة، نقوم بتجميع إزاحة الانزلاق، وسرعة الانزلاق القصوى، وانخفاض الضغط المرتبط خلال أحداث الانزلاق الناتجة عن الحقن. تحدد ميل متوسط انخفاض الضغط القصوي مع متوسط إزاحات الانزلاق المرتبطة بأحداث الانزلاق معدل ضعف الانزلاق المتوسط للعيوب (صلابة التفريغ) (الشكل. )، أي أن للعيب السلس و للعيوب الخشنة. تزداد سرعات الانزلاق القصوى لأحداث الانزلاق الناتجة عن الحقن مع انخفاض الضغط لكل من العيوب السلسة والخشنة ولكنها تختلف بشكل كبير اعتمادًا على خشونة العيب (الشكل. ).
خصائص الانبعاثات الصوتية الناتجة عن الحقن. مجموعة من 16 محول بيزو كهربائي تحيط بالعينة تتيح لنا مراقبة وتحديد أحداث الانبعاث الصوتي المرتبطة بالانزلاق الناتج عن الحقن
(ملحق SI، القسم 3). توفر الخصائص المكانية والسمات الإحصائية للانبعاثات الصوتية رؤى أساسية حول دور اختلاف خشونة السطح في الزلازل الناتجة عن السوائل.
لقد حددنا إجمالي عدد ، و6390 حدث انبعاث صوتي خلال حقن السوائل للعيب السلس، والعيب الخشن #1، والعيب الخشن #2، على التوالي. يختلف التوزيع المكاني لمراكز الأحداث الصوتية بشكل كبير مع خشونة السطح. بالنسبة للعيب السلس المقطوع، تولد أحداث الانزلاق الناتجة عن الحقن توزيعًا لمراكز الأحداث الصوتية يشكل حزامًا ضيقًا يحيط بمستوى العيب بعرض نصف عمودي على سطح العيب يبلغ حوالي 2 مم (أي، مشابه لدقة الموقع لمراكز الأحداث الصوتية) (ملحق SI، الشكل S6). بالنسبة للعيوب الخشنة، تشكل الانبعاثات الصوتية منطقة بعرض حوالي 10 مم عمودي على العيب بسبب تضاريس العيب وأضرار الصخور الجانبية (ملحق SI، الشكل S7). في عرض خريطة ثنائية الأبعاد مع جميع مراكز الأحداث الصوتية المتوقعة على العيب، يتم توزيع الانبعاثات الصوتية بشكل متجانس عبر العيب السلس (الشكل 3A). بالمقابل، يؤدي حقن السوائل في العيوب الخشنة إلى تشكيل أحداث انبعاث صوتي تشكل تجمعات محلية متميزة (الشكل 3D). يتميز التوزيع المكاني للانبعاثات الصوتية المتجمعة على العيوب الخشنة بعدد كسري حوالي 1.4 مقارنة بتوزيع انبعاث صوتي أكثر مسطحًا مع -قيمة على العيب السلس (ملحق SI، القسم 5 والشكل S8). يرتبط التجمع المكثف للانبعاثات الصوتية الناتجة ارتباطًا وثيقًا بالتدرج المحلي لتضاريس السطح على طول اتجاه الانزلاق (الشكل 3D)، مما يحدد التوزيع المكاني للنتوءات ذات الضغط العالي على العيب الخشن. بشكل عام، يتوافق تدرج إيجابي أكبر لتضاريس السطح مع تركيزات الضغط القصوي والضغط العمودي المحلية عند الانحناءات المقيدة (12، 16، 17)، مما يعزز حدوث أحداث ذات حجم كبير .
لقد تأثرت توزيع التردد-الحجم للانبعاثات الصوتية الناتجة و -قيمة الناتجة بتضاريس سطح العيب (انظر ملحق SI، القسم 6 لحساب -قيمة). لقد سجلنا المزيد من أحداث الانبعاث الصوتي الكلي مع أحجام انبعاث صوتي أكبر على العيبين الخشنين و -قيم الانبعاثات الصوتية المحسوبة أقل قليلاً مقارنة بالعيب السلس (ملحق SI، الشكل S9). يُفترض أن التغيرات في -القيم تعكس حالات الضغط المحلية وهندسة شبكة الشقوق (23، 24، 61). بالنسبة للعيوب الخشنة، قد تساهم وجود النتوءات ذات الضغط العالي والأضرار الكبيرة خارج العيب في زيادة إنتاجية الانبعاثات الصوتية ونسبة أكبر من أحداث الانبعاث الصوتي ذات الحجم الكبير. لتحديد عدم تجانس العيب، نقدم أيضًا التوزيع المكاني لإطلاق لحظة الزلزال للانبعاثات الصوتية (ملحق SI، القسم 7) وخرائط -القيمة المرتبطة (الشكل. ، و ). يتم إنتاج لحظة زلزال كبيرة للانبعاثات الصوتية في محيط بقع الضغط العالي خلال أحداث الانزلاق الناتجة، مصحوبة بانخفاض -القيم (الشكل. وملحق SI، الشكل S10). تشير هذه النتيجة إلى أن التغير المكاني في -القيم مرتبط ارتباطًا وثيقًا بحالات الضغط المحلية على سطح العيب وقد يساعد في رسم خرائط مقاطع العيوب الزلزالية الناتجة عن الزلازل الطبيعية (62).
تؤثر خشونة العيب أيضًا على الأضرار خارج العيب، كما لوحظ من خلال الهياكل الدقيقة بعد الوفاة (ملحق SI، القسم 10). بالنسبة لسطح العيب السلس الأولي، تؤدي الانزلاقات التراكمية إلى طبقة رقيقة (عرض نصف ، حوالي 1 إلى 2 أقطار حبة أصلية) من الغبار الناعم الذي يكون متجانسًا نسبيًا عبر سطح الانزلاق الرئيسي (ملحق SI، الشكل S11 و ). تؤدي التجزئة الكبيرة والتفتيت لحبيبات الكوارتز المجاورة لسطح العيب إلى إشعاع موجات عالية التردد، كما يتضح من توزيع متجانس لنشاط الانبعاث الصوتي المسجل عبر العيب السلس. يتم توزيع تشوه القص بشكل رئيسي ويتم استيعابه من خلال تجزئة الحبوب والدوران الناتج عن القص. بالمقابل، تتكون الأضرار خارج العيب المحيطة بسطح العيب الخشن من طبقات الغبار، والتي تكون أكثر سمكًا (عرض نصف ) مقارنة بالعيب السلس ولكنها تختلف على طول العيب (ملحق SI، الشكل S11C). يسود التشوه الكاتاكلستيكي الشديد

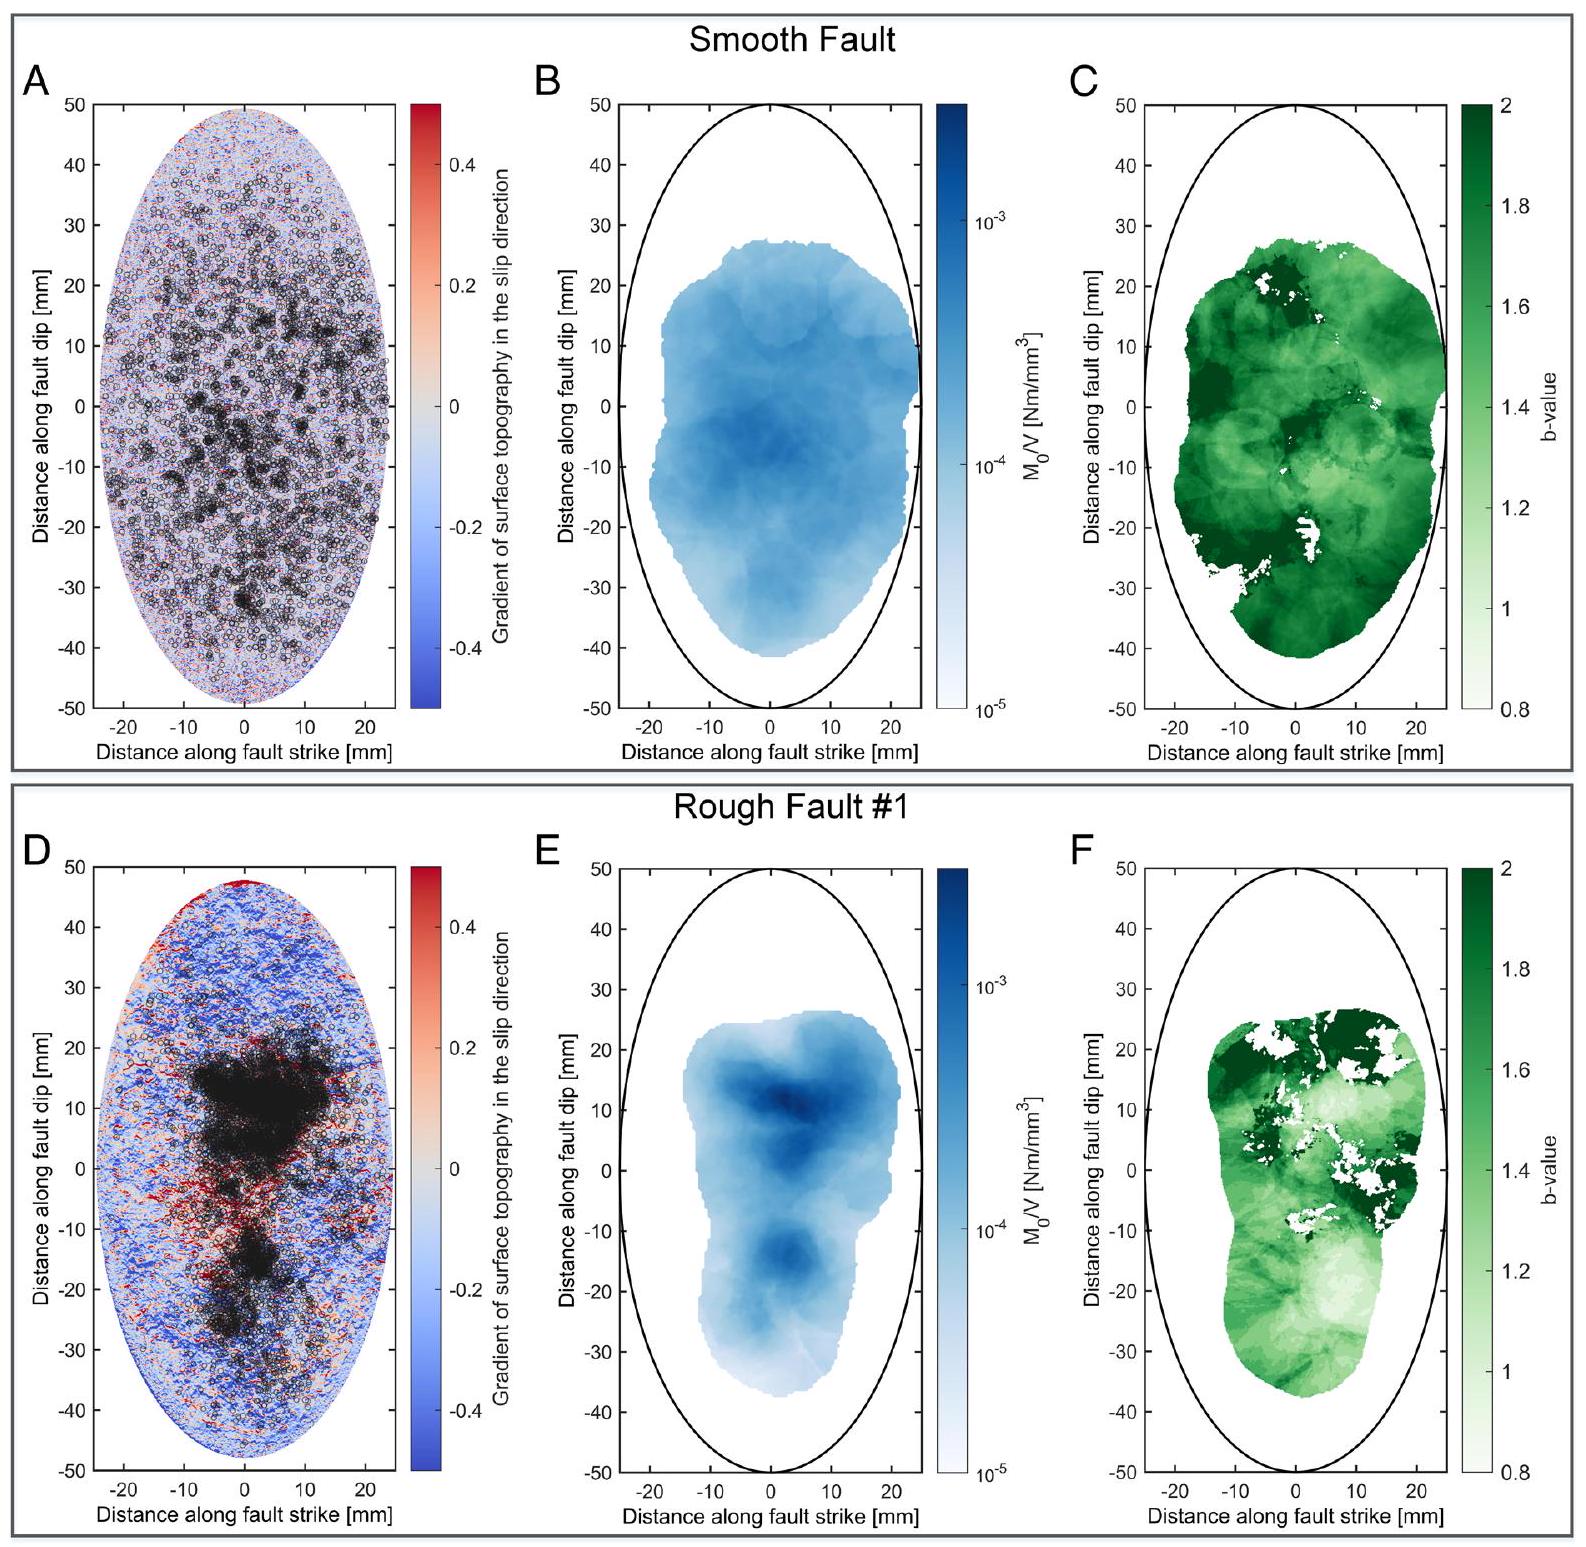
عند الانحناءات المقيدة، مما يظهر أيضًا توزيعًا كثيفًا لأحداث الانبعاث الصوتي (الشكل 3D). تكون تشكيلات متعددة من مستويات القص التي تستوعب الانزلاقات المحلية أكثر وضوحًا بالنسبة للعيوب الخشنة (ملحق SI، الشكل S11D). يتوافق الضرر الناتج عن الشقوق خارج العيب مع توزيع كثافة الانبعاثات الصوتية الذي ينخفض مع المسافة من سطح العيب (ملحق SI، الشكل S12). يتميز التجمع التدريجي للانبعاثات الصوتية الناتجة عن حقن السوائل بوجود ذروة في توزيع كثافة الانبعاثات الصوتية المركز حول واجهة العيب، وانخفاض سريع نحو الصخور الجانبية المجاورة، متسق مع الدراسات المخبرية السابقة حول انتشار الشقوق والانزلاق (23) والزلازل الطبيعية الموثقة عبر العيوب الانزلاقية في كاليفورنيا (63).
لتقييم حركيات مصدر الانبعاثات الصوتية، نستخدم متوسط قطبية سعة الموجات P الأولى (64) وطريقة عكس موتر اللحظة الكاملة (FMT) (65) (ملحق SI، القسم 8). بناءً على إما متوسط القطبية (64) أو نتائج تحليل FMT
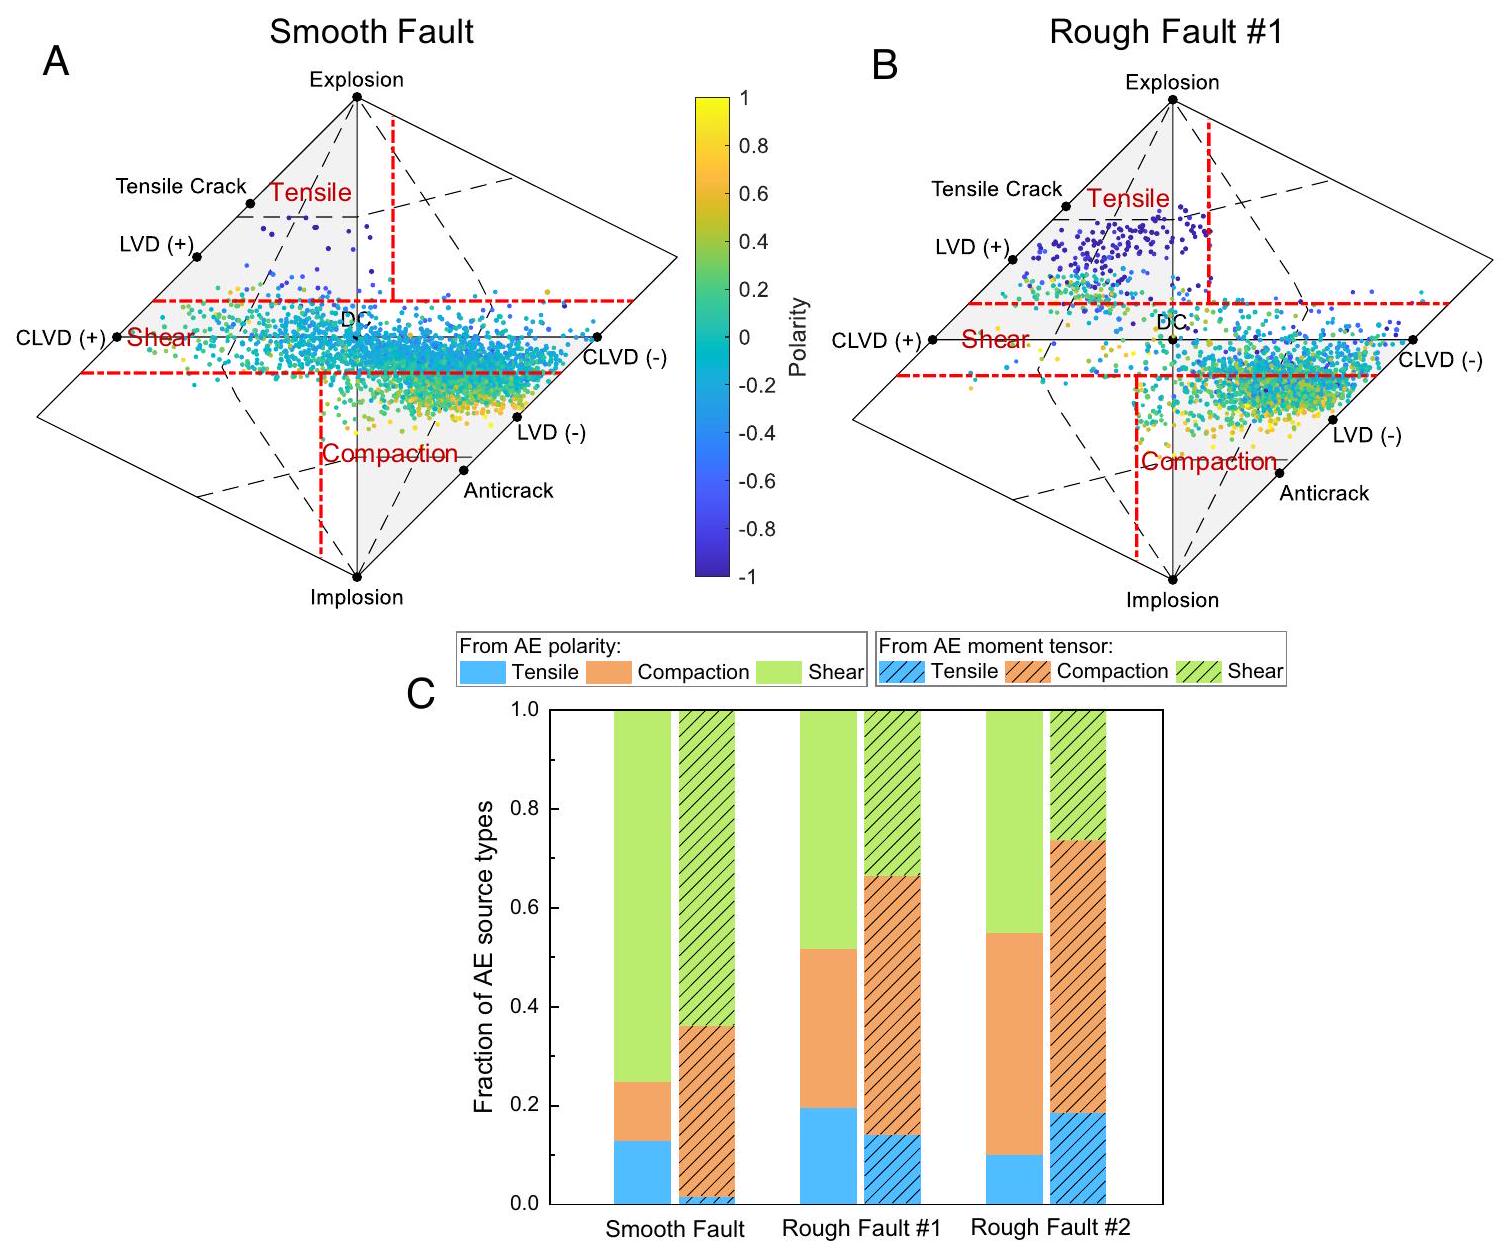
(66، 67)، يمكن تصنيف آلية مصدر الانبعاثات الصوتية إلى نوع قص أو انضغاط أو توتر. تُظهر تحليل متوسط القطبية توافقًا جيدًا مع نتائج حل FMT، مما يشير إلى هيمنة أحداث من نوع القص والانضغاط (الشكل. و وملحق SI، الشكل S13). بالنسبة للعيب السلس، تهيمن آليات مصادر الانبعاثات الصوتية الناتجة على أحداث من نوع القص (زوج مزدوج)، حيث تمثل 65 إلى من جميع الانبعاثات الصوتية مقارنة بحوالي 30 إلى للعيوب الخشنة (الشكل 4C). في العيوب الخشنة، نجد زيادة نسبية في أنواع المصادر غير الزوجية المزدوجة بالنسبة لأحداث القص، مما يؤكد أن خشونة العيب تؤثر على حركيات الزلازل الناتجة عن الحقن، مشابهًا لما تم الإبلاغ عنه في دراسة سابقة بدون حقن السوائل (68).
محاكاة عددية للانزلاق الناتج عن الحقن ومعدل الانزلاق. للتحقيق بشكل أكبر في تأثيرات الخشونة على الانزلاق الناتج عن الحقن وتوزيعات معدل الانزلاق، نستخدم نموذجًا عدديًا.
الشكل 4. آليات مصادر جميع الانبعاثات الصوتية الناتجة المستمدة من طريقة متوسط القطبية وطريقة عكس موتر اللحظة الكاملة. ( و ) يظهر مخطط هادسون المتساوي المساحة آليات مصدر الانبعاثات الصوتية للعيب السلس والعيب الخشن #1، على التوالي. في مخطط هادسون، تشير DC إلى زوج مزدوج، وCLVD تشير إلى ثنائي القطب الخطي المعوض، وLVD هو ثنائي القطب الخطي (انظر المرجع 66 للتفاصيل). يتم فصل الحركيات المصدرية الحجمية وغير الحجمية (القص) بواسطة الخطوط الحمراء المنقطة (67). كما يتم ترميز حركيات مصدر الانبعاثات الصوتية بالألوان حسب معامل القطبية المتوسطة مع قيم 1.0 و-1.0 التي تتوافق مع أحداث من نوع الانضغاط النقي وأحداث من نوع التوتر، على التوالي. (C) نسب أنواع مصادر الانبعاثات الصوتية لجميع أحداث الانبعاثات الصوتية الناتجة على العيوب السلسة والخشنة. يمكن فصل آليات مصادر الانبعاثات الصوتية إلى أنواع توتر، قص، وانضغاط، بناءً على إما متوسط القطبية أو حل موتر اللحظة الكاملة.
نقوم بدمج نموذج بورريدج-كنوبوف أحادي البعد مع واجهة صدع محملة بشكل غير متجانس وقانون الاحتكاك المعتمد على المعدل والحالة مع عملية انتشار ضغط السوائل (انظر المواد والأساليب لصياغة النموذج). نستخدم عددًا إجماليًا من 100 كتلة منزلق متباعدة بالتساوي مع تباعد شبكي قدره 1 مم (أي، حجم الكتلة) لمحاكاة الانزلاق الناتج عن الحقن على طول الصدوع المخبرية بطول 100 مم. بالنظر إلى المواد الصخرية المتجانسة والمتساوية المستخدمة في التجارب، نفترض خصائص احتكاك متجانسة مكانيًا ولكننا نأخذ في الاعتبار عدم تجانس الضغط الناتج عن خشونة الصدع. نقوم أولاً بتقدير توزيع الضغط الثابت ثنائي الأبعاد الناتج عن الانزلاق الاحتكاكي على طول صدع متموج في وسائط مرنة باستخدام نموذج تحليلي (7). بالنسبة للصدع الخشن #1، تتركز الضغوط العادية والقص والاختلاف العالية عمومًا حول الانحناءات المقيدة (الملحق SI، القسم 11 والشكل S15)، بما يتماشى مع AEs الوفيرة الملاحظة. على النقيض من الضغوط المتجانسة العالية السائدة على طول الصدع الأملس، يتم استيراد الضغوط العادية والقص غير المتجانسة في البداية على طول الصدع الخشن #1 قبل حقن السوائل إلى النموذج لمحاكاة سلوك انزلاق الصدع الناتج عن الحقن لاحقًا (الملحق SI، الشكل S16). نستخدم بدايات الانزلاق الملاحظة تجريبيًا وأحجام سرعات الانزلاق المتوسطة المقاسة الناتجة عن حقن السوائل لتقييم نماذجنا العددية.
نستخدم المعلمات الاحتكاكية المعتمدة على المعدل والحالة المقاسة تجريبيًا لـ و للصدع الأملس (المقطوع بالمنشار)
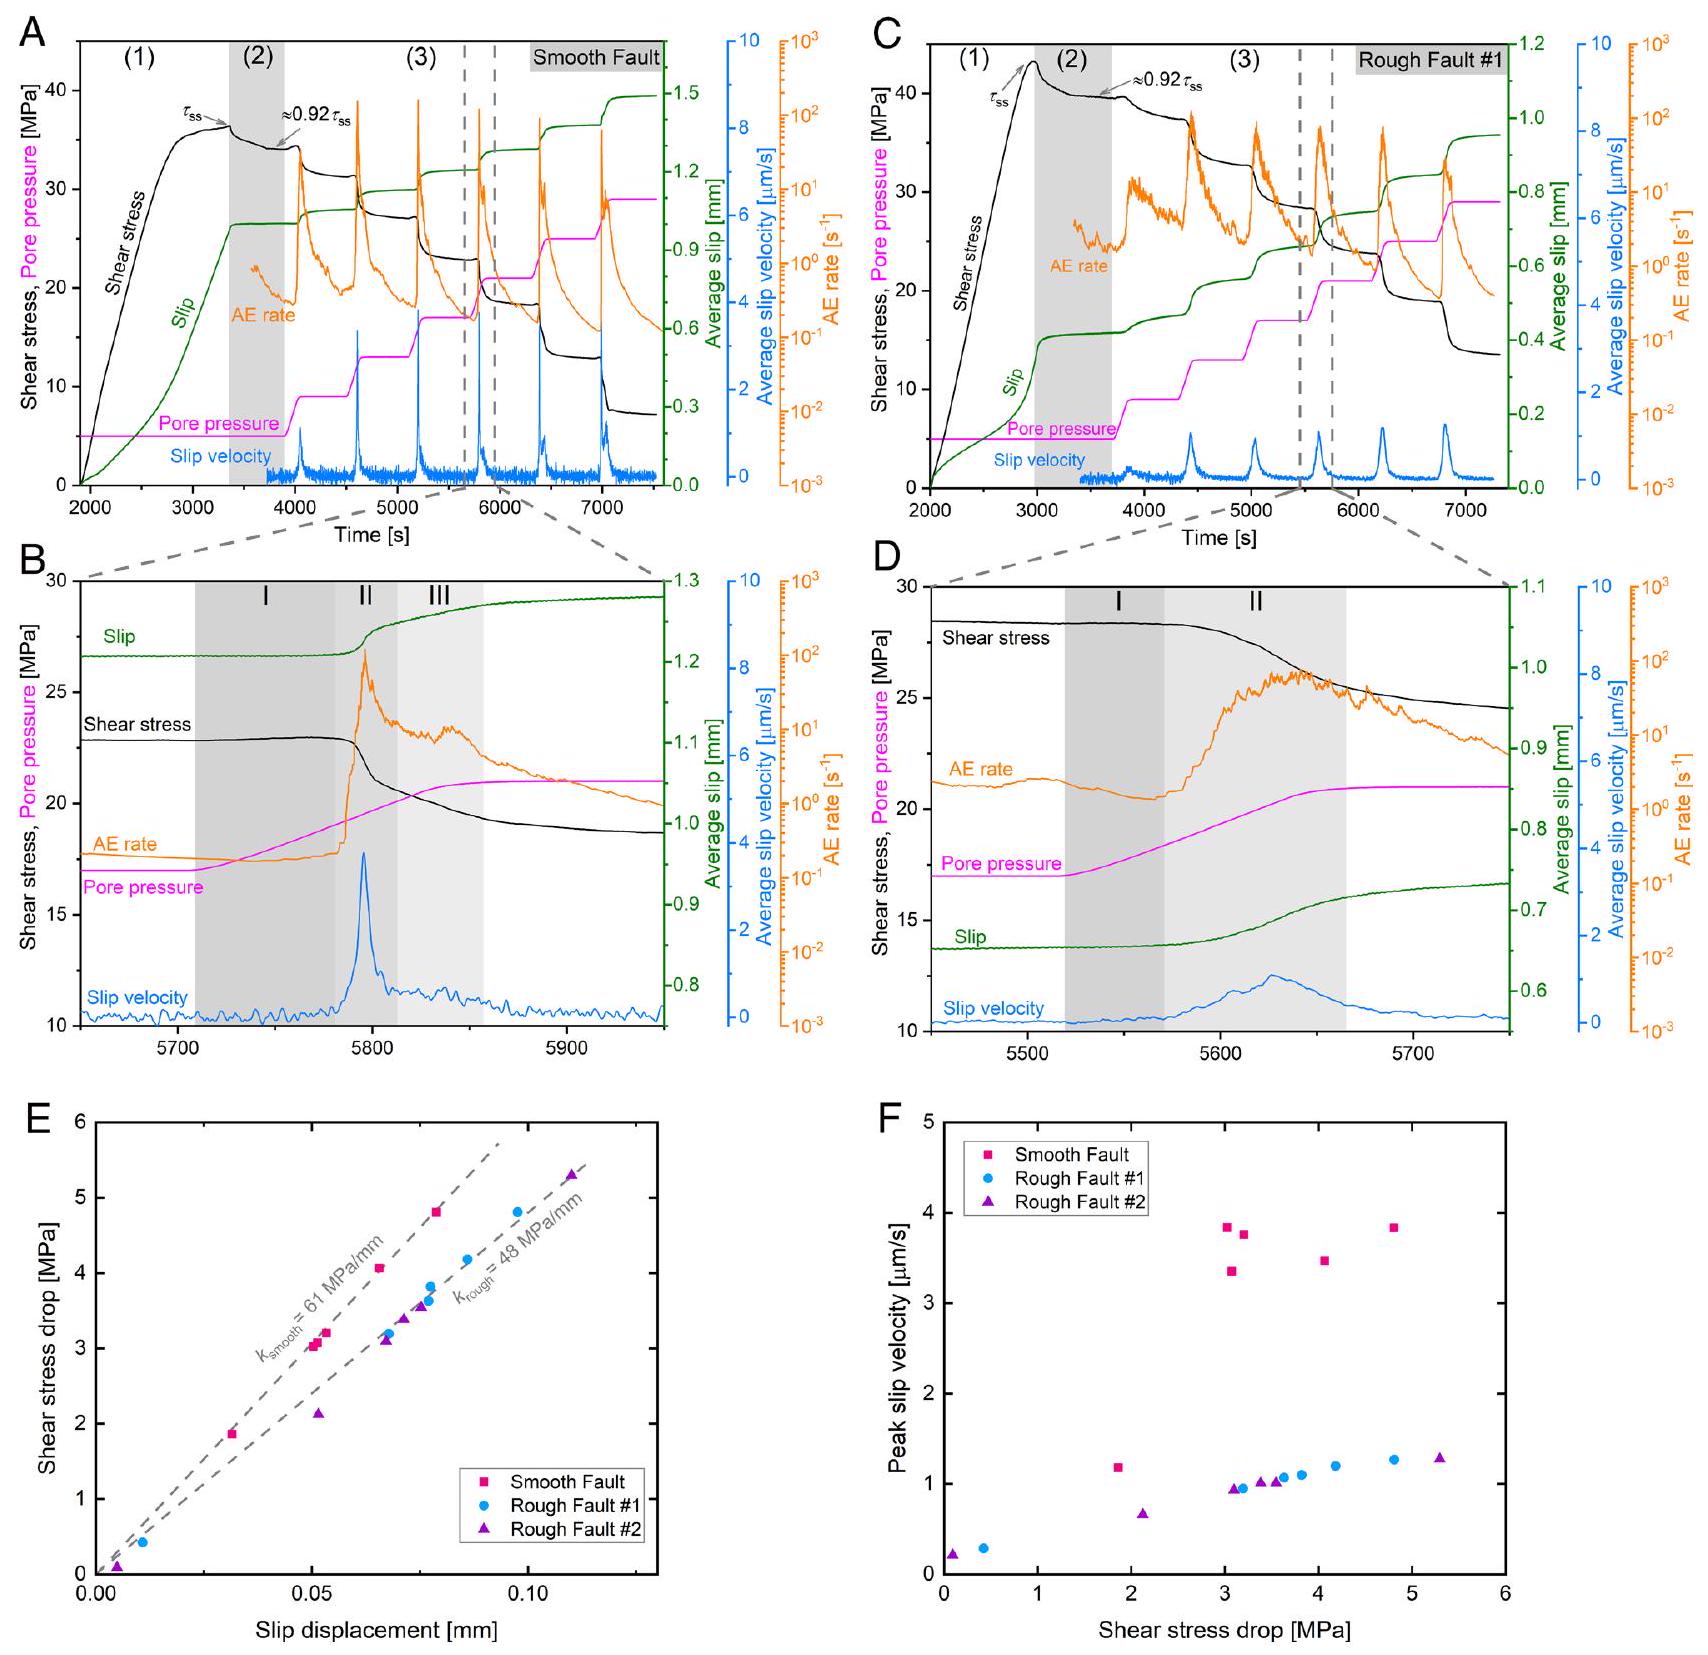
في رمل بنتهايم (الملحق SI، القسم 11). تتوافق بدايات الانزلاق المودلة، وسرعات الانزلاق القصوى، والتذبذبات الصغيرة اللاحقة في معدلات الانزلاق على طول الصدوع الأملس بشكل جيد مع البيانات التجريبية (الشكل 5A). تؤدي الضغوط العادية والقص المتجانسة وزيادات ضغط السوائل الموزعة عبر الصدع الأملس إلى انزلاق ومعدلات انزلاق متجانسة مكانيًا، كما هو موثق من خلال توزيع AEs المحددة (الشكل 5B).
افتراضًا أن مسافة الانزلاق المميزة في صياغة الاحتكاك المعتمد على المعدل والحالة تتناسب مع خشونة السطح وسمك شريط القص ، نقوم بزيادة من للصدع الأملس إلى للصدع الخشن بينما تظل المعلمات الأخرى للاحتكاك ( و ) دون تغيير (الملحق SI، القسم 11). نحصل على توافق جيد بين سرعات الانزلاق المتوسطة المودلة والملاحظة المقاسة على الصدع الخشن. على النقيض من الصدع الأملس، تظهر توزيعات الانزلاق ومعدلات الانزلاق الناتجة على الصدع الخشن تباينًا مكانيًا عاليًا (الشكل و ). على الرغم من أن نموذجنا العددي يفترض سلسلة من الكتل غير المشوهة ولكن المترابطة ولا يأخذ في الاعتبار مجال التشوه، فإن التباين المكاني الملاحظ في الانزلاق ومعدل الانزلاق يعكس ضمنيًا توزيع تشوه غير متجانس، متسق مع المجالات المختلفة المتطورة للتشوه التي تم مراقبتها بواسطة مقاييس التشوه المحلية المثبتة بالقرب من واجهة الصدع (الملحق SI، الشكل S18). تبدأ الانفجارات تقريبًا في وقت واحد عند مقطعين من الصدع موجهين بشكل ملائم للانزلاق (أي، المناطق ذات الضغط المنخفض مع كبيرة
الشكل 5. محاكاة عددية تظهر التطور الزمني لمتوسط وسرعات انزلاق الصدع المحلي الناتج عن الحقن على طول انحدار الصدع للصدوع الأملس والخشن. ( و ) مقارنات لسرعات الانزلاق المتوسطة المتطورة من القياسات التجريبية والمحاكاة العددية خلال حقن السوائل في الصدوع الأملس والخشن، على التوالي. ( و ) التوزيعات الزمنية للانزلاق المحلي الناتج من النمذجة العددية خلال مرحلة حقن السوائل المختارة (المرحلة الرابعة من الحقن) للصدوع الأملس والخشن، على التوالي. لاحظ أن مقياس الألوان لسرعة الانزلاق المحلي يختلف في ( ) و( ). بالإضافة إلى ذلك، نقوم برسم التوزيع المكاني الزمني لـ AEs المسجلة خلال التجربة المقابلة إلى و )، على التوالي. نظرًا لأننا نستخدم نموذجًا عدديًا أحادي البعد ونفترض انزلاق الصدع الناتج على طول انحدار الصدع (المحور الرئيسي لبيضاوي الصدع)، نقدم AEs المسجلة تجريبيًا مع مراكز زلزالية قريبة جدًا منها (مسافة شعاعية ضمن 5 مم)، كما هو موضح بواسطة الدوائر البيضاء الصلبة بأحجام تتناسب مع أحجام AEs. ( ) الملف السطحي للواجهة الفاصلة بين الكتل السفلية والعلوية للصدع الخشن #1. تشير السهم الرمادي إلى اتجاه انزلاق الكتلة الصخرية السفلية بالنسبة لنظيرتها على طول انحدار الصدع.
المنحدرات السلبية لسطح التضاريس على طول اتجاه الانزلاق، انظر الشكل. و ). تسهل مقاومات الاحتكاك المنخفضة في هذه المقاطع من الصدع بدء الانزلاق ولا تفرض أي عائق كبير على نقل الانزلاق عبر سطح الصدع. ثم تنتشر جبهات الانفجار نحو مركز الصدع بمعدل حوالي 0.5 إلى . تبدأ المنطقة ذات الضغوط المحلية العالية بالقرب من مركز الصدع (النتوءات ذات الضغط العالي) في الانزلاق في وقت لاحق، لكنها تمتلك
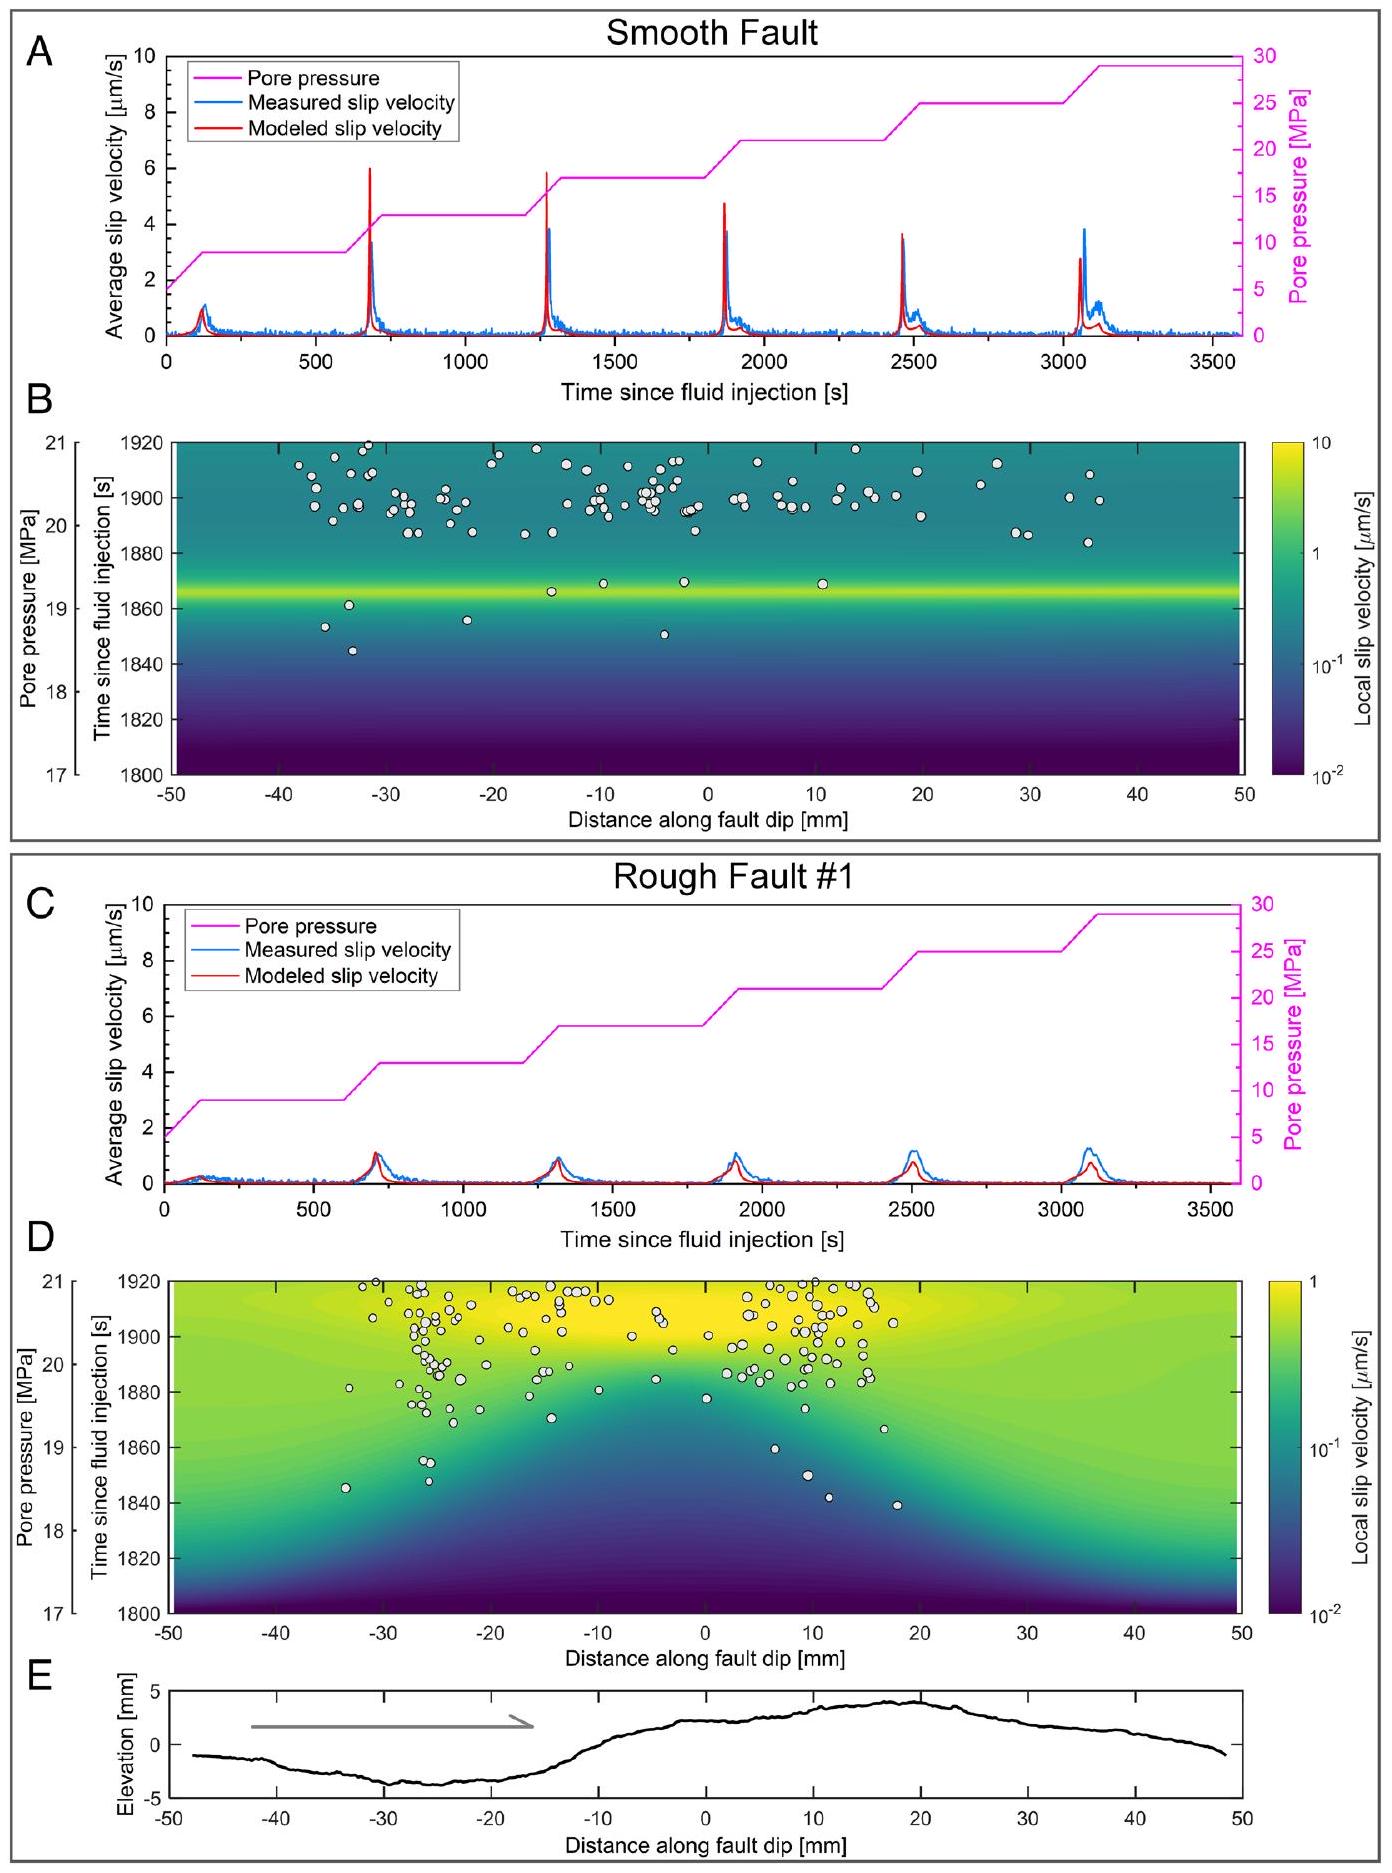
معدل انزلاق محلي مرتفع، مصحوبًا بانفجار محلي حاد في نشاط AEs (الشكل 5D). تتفق هذه النتيجة مع التوزيع المكاني لنشاط AEs الناتج عن الحقن حول النتوءات ذات الضغط العالي حيث يكون إطلاق اللحظة الزلزالية الناتجة عن AEs مرتفعًا ولكن القيمة المرتبطة به – القيمة منخفضة (الشكل و ). بعد كل مرحلة من مراحل حقن السوائل، نجد توزيعًا متجانسًا نسبيًا للانزلاق التراكمي عبر الصدع الخشن بالكامل (الملحق SI، الشكل S17).

المناقشة

تؤثر خشونة الصدع وعدم تجانس الضغط على نشوء الزلازل وانتشارها وتسبب تمزقات معقدة، وانخفاضات في الضغط، وتوزيعات لمعدلات الانزلاق، ومناطق ضرر خارج الصدع، كما لوحظ في العديد من الدراسات حول الزلازل التكتونية ونماذج التمزق (8، 16-20). هنا، نجمع بين الأساليب التجريبية والعددية لإظهار كيف تتحكم خشونة الصدع في أحداث الانزلاق البطيء الناتجة عن حقن السوائل. على وجه الخصوص، نظهر أن زيادة خشونة الصدع تثبت أحداث الانزلاق البطيء الناتجة. تكون سرعات الانزلاق القصوى لأحداث الانزلاق الناتجة عن الحقن ومعدلات ضعف الانزلاق المرتبطة بها أكبر بالنسبة للصدوع الأملس، بما يتماشى مع اختبارات الاحتكاك السابقة على العينات الجافة (25،26،28) ونتائج النمذجة العددية الحديثة (14، 19).
وفقًا لنموذج ضعف انزلاق الصدع في نظام الزنبرك-المنزلق (31)، من المتوقع أن يحدث تسارع الانزلاق وفشل غير مستقر عندما تكون معدل ضعف انزلاق الصدع أكبر من معدل تحرير الضغط لنظام التحميل، أي، أن صلابة الصدع أكبر من صلابة نظام التحميل، وإلا من المتوقع أن يكون الانزلاق مستقرًا. صلابة نظام التحميل لدينا ( ) حوالي مم (الملحق SI، القسم 11)، مما يؤدي إلى و (الشكل )، على التوالي. تتوافق هذه النسب من الصلابة مع الانزلاق البطيء الملاحظ على الصدع الأملس ولكن الانزلاق المستقر على الصدوع الخشنة. بافتراض أن بقعة الانزلاق تنمو كصدع متوسع، فإن الطول الحرج للنواة لعدم استقرار الانزلاق يتناسب عكسيًا مع صلابة بقعة الصدع . تم الإبلاغ عن زيادة طول النواة مع خشونة الصدع من التجارب المخبرية ومن المحاكاة العددية (12)، متسقة مع ملاحظتنا.
أظهرت تجارب الاحتكاك على الصدوع المخبرية الجافة أن الخشونة تؤثر بشكل كبير على معلمات الاحتكاك المكونة للصدع (29-31). بالإضافة إلى الإزاحة الحرجة لضعف الانزلاق التي تزداد مع خشونة الصدع ، تم العثور أيضًا تجريبيًا على أن الإزاحة المميزة للانزلاق المطلوبة لتغيير مجموعة الاتصالات في صياغة الاحتكاك المعتمد على المعدل والحالة تتناسب أيضًا مع خشونة السطح . يتماشى هذا مع نتائج نمذجة العددية لدينا التي تتطلب زيادة للصدوع الخشنة لنمذجة بدايات الانزلاق وسرعات الانزلاق بشكل صحيح كما هو ملاحظ في التجارب. من المتوقع أن يؤدي أو الكبير إلى طاقات كسر أكبر للصدوع الخشنة (25، 70)، مما يحد من تسارع انزلاق الصدع أثناء انتشار التمزق (21). من المتوقع أن يتباطأ جبهة التمزق المتحركة عند مواجهة منطقة ذات ضغط عادي أعلى وقوة قص (71)، مما يؤدي إلى انخفاض متوسط سرعة الانزلاق مقارنة بالصدوع الأملس. بمجرد استنفاد الطاقة المرنة المخزنة، سيتوقف التمزق.
مستويات الضغط الأولية المتحكم بها قبل حقن السوائل متشابهة تقريبًا بالنسبة للعيوب السلسة والخشنة، مما يشير إلى أن الطاقة المرنة المخزنة قبل الانزلاق مشابهة للعيوب السلسة والخشنة. بغض النظر عن مستوى الإجهاد القصي الذي ينخفض مع الانزلاق أثناء حقن السوائل، فإن الانزلاق الناتج عن العيوب وانخفاض الضغط يزداد مع دورات الحقن المتقدمة. ومع ذلك، تظل سرعة الانزلاق ومعدلات النشاط الصوتي المرتبطة بها مشابهة. وهذا يتناقض مع التجارب السابقة للحقن التي أجريت على العيوب المقطوعة بالمنشار في عينات الجرانيت شبه غير القابلة للاختراق، حيث تنخفض انخفاضات الضغط مع حقن السوائل المتقدمة. نُعزى الزيادة في الانزلاق وانخفاض الضغط إلى تغير خشونة السطح في عينات الحجر الرملي لدينا مع الانزلاق التدريجي وربما خصائص هيدروليكية مختلفة للصدع. ترتبط معدلات النشاط الصوتي ومعدلات الانزلاق ارتباطًا وثيقًا للصدوع الناعمة والخشنة.
تجاربنا التي أُجريت على الشقوق المقطوعة بالمنشار والشقوق المكسورة حديثًا ذات الخشونة المختلفة بشكل كبير قد تمثل هيكلين متطرفين للشقوق، أي الشقوق الناضجة وغير الناضجة على التوالي. تشير ملاحظاتنا، مشابهة للاختبارات السابقة التي تم الإبلاغ عنها والتي تسيطر عليها الإزاحة (23، 24، 68)، إلى أن خشونة الفوالق تؤثر
ديناميكا الزلازل، مع زيادة نسبة مكونات العزم غير الزوجي في موترات الزلازل للصدوع الخشنة. تُعزى الزلازل الطبيعية ذات الآليات غير الزوجية عادةً إلى تعقيد الصدع (72). بالنسبة للصدوع غير المستوية، قد يؤدي التطور الوفير لشبكات الكسور المتقاطعة والتغيرات المحتملة في الخصائص المرنة المتعلقة بالأضرار في منطقة المصدر إلى تعديل مجالات الضغط المحلية والتسبب في انحراف متجه الانزلاق عن سطح الصدع الرئيسي (7، 24، 59). بالنسبة للصدوع الخشنة، نجد أن النشاط الزلزالي الناتج عن الحقن يتركز في محيط النقاط ذات الضغط العالي حيث يتم إطلاق لحظة زلزالية كبيرة، مصحوبة بانخفاض -القيم. الـ -قيمة قد تم اقتراح أنها تتناسب عكسياً مع مستوى الضغط ويمكن أن تشير إلى مناطق العيوب ذات الضغط العالي (62).
تظل معدلات انزلاق العيوب الكبيرة الناتجة عن الحقن في تجارب مختبرنا في حدود الميكرومترات في الثانية، وهو ما يتوافق مع القيم المبلغ عنها لمعدلات انزلاق العيوب الناتجة التي تم قياسها في بئر أثناء حقن السوائل في موقع طبيعي (37). في تجاربنا، يمثل إجمالي الزخم الزلزالي الذي تم إطلاقه بواسطة مصادر AE عالية التردد جزءًا صغيرًا جدًا (<0.01%) من إجمالي إطلاق الزخم الناتج عن التشوه (الجيوفيزيائي) أثناء حقن السوائل (SI Appendix، الشكل S20)، وهو ما يتماشى مع القيم المبلغ عنها من تجارب حقن السوائل في الموقع في بيئات جيولوجية مختلفة. . تشير هذه النسبة المنخفضة إلى أن تشوه العيوب الناتج عن الحقن في تجاربنا هو في الغالب غير زلزالي. تتراوح الأبعاد المصدرية المقدرة للأحداث الصوتية من 0.1 إلى 2.6 مم (الملحق SI، القسم 7)، وهي أصغر بكثير من حجم العيب الكلي. من هذه الناحية، قد تكون مصادر الأحداث الصوتية في مختبرنا المرتبطة بالانزلاق الناتج عن الحقن أكثر تمثيلاً للتمزقات المحصورة الناتجة عن الحقن التي تحدث ضمن مناطق محدودة من الشقوق الموزعة في الطبيعة. لربط ملاحظاتنا في المختبر بمسألة الزلازل الناتجة عن السوائل في الميدان، قمنا بتجميع مجموعة واسعة من مجموعات البيانات للطاقة الزلزالية المشعة كدالة للطاقة الهيدروليكية من تجارب حقن السوائل على نطاق المختبر وفي الموقع، بالإضافة إلى مشاريع التكسير على نطاق الخزان، والطاقة الحرارية الأرضية، والتخلص في جميع أنحاء العالم (الشكل 6). تُسمى نسبة الطاقة الزلزالية إلى الطاقة الهيدروليكية بكفاءة حقن الزلازل (74). تتراوح كفاءات حقن الزلازل في تجاربنا بين و ، بما يتماشى مع التجارب المخبرية المبلغ عنها لعملية التكسير الهيدروليكي (75)، تجارب حقن السوائل في الموقع وبعض الزلازل الناتجة عن الأنشطة الميدانية (74، 77). تتراوح قيم كفاءة حقن الزلازل المرتبطة بحقن السوائل على نطاق الميدان عبر تسعة أوامر من الحجم من إلى 1، وحتى فوق 1. على سبيل المثال، كفاءة الحقن الزلزالي الكبيرة تصل إلى 1.8 لـ تشير زلزال بوهانغ 5.5 إلى أن الطاقة التي تم إشعاعها زلزاليًا كانت أكبر من تلك التي تم حقنها هيدروليكيًا، مما يوحي بحدوث تمزق خارج المنطقة المتأثرة بالحقن. هذه الأحداث الزلزالية الكبيرة ذات كفاءة حقن زلزالية عالية. ترجع إلى الإفراج الكبير عن طاقة الإجهاد التكتوني من خلال تفعيل الانهيارات الهاربة، حيث قد يكون حجم الانهيار محدودًا فقط بحجم الفوالق التكتونية. في المقابل، فإن الزلازل المستحثة التي تظهر تمزقًا تحت ضغط ممتد بطريقة ذاتية التوقف عادةً ما تُظهر كفاءة منخفضة في حقن الزلازل. وبالتالي، فإن ملاحظاتنا في المختبر تحمل تشابهات مع تلك الزلازل الناتجة عن الضغط على نطاق الحقل، كما يتضح من حقيقة أن انزلاق الفالق الناتج لدينا يتوقف بعد فترة وجيزة من توقفنا عن حقن السوائل (الشكل 2).
لتلخيص ملاحظاتنا التجريبية ونتائج النمذجة، نقترح نموذجًا مفاهيميًا لإعادة تنشيط العيوب الناتجة عن الحقن (الشكل 7). نفترض احتكاكًا موحدًا للعيوب في الفضاء ولكن توزيعًا غير متجانس في البداية للضغوط العادية والقصية اعتمادًا على تضاريس سطح العيب (الشكل 7A). مع زيادة ضغط السوائل، سيبدأ الزحف البطيء غير الزلزالي، ربما مع بعض الأحداث الزلزالية، في القطاعات الضعيفة والموجهة بشكل ملائم من العيوب بمجرد تجاوز القوة المحلية (الشكل 7B). مع زيادة ضغط السوائل بشكل تدريجي، من المتوقع أن تتوسع بقع الزحف وتتحمل.
الشكل 6. العلاقة بين الطاقة الزلزالية التراكمية والطاقة الهيدروليكية التراكمية عبر مجموعة واسعة من مقاييس الطول. بالنسبة للتجارب المعملية، يتم تحديد الطاقة الزلزالية من الإشعاعات الصوتية الناتجة في الدراسة الحالية وفي تجارب التكسير الهيدروليكي التي أجراها غودفيلو وآخرون (75). تجارب حقن السوائل في الموقع التي أجريت في المختبر تحت الأرض في تورنيمير (فرنسا) وفي المختبر تحت الأرض في راستريل (فرنسا) مأخوذة من المرجع 73، بينما تجارب التكسير الهيدروليكي في الموقع التي أجريت في مختبر أسبو للصخور الصلبة تحت الأرض (السويد) مأخوذة من المرجع 76. تم تجميع مجموعات البيانات المتعلقة بالزلازل على نطاق الخزان المرتبطة بحقن السوائل من المراجع 74 و75 و77. الخطوط الرمادية المرجعية تتوافق مع كفاءة حقن الزلازل (نسبة الطاقة الزلزالية إلى الطاقة الهيدروليكية) كنسب مئوية.
تشوهات عالية القوة قريبة. تم وصف الزحف غير الزلزالي الناتج عن السوائل الذي يؤدي إلى انزلاق زلزالي أيضًا لتجارب الحقن في الموقع (37) والزلازل الناتجة عن التكسير الهيدروليكي على نطاق الخزانات (78). بمجرد تجاوز قوة الفشل للتشوهات، ستحدث نشاط زلزالي متزايد ومجموعة من الأحداث التي تحتوي على أحداث أكبر بشكل متزايد (الشكل 7C). قد يؤدي هذا إلى بدء أحداث كبيرة.
تنتج انخفاضات عالية في الإجهاد المحلي ومعدلات انزلاق، وإطلاق لحظي زلزالي كبير وانخفاض -القيم، كما لوحظ في تجاربنا. كشفت الدراسات السابقة عن التأثيرات المهمة لخصائص احتكاك العيوب غير المتجانسة (36) والتفاعل بين تغير النفاذية والانزلاق المستمر للعيوب. أثناء حقن السوائل، والتي من المتوقع أن يتم تقليلها في تجاربنا بسبب الاستخدام
الشكل 7. توضيح تخطيطي للزلازل الناتجة عن السوائل على صدع غير متجانس مكانيًا مع هياكل قابلة للاختراق. (أ) قبل الضغط الزائد للسوائل، تظهر الحالة الأولية لصدع غير متجانس تباينًا مكانيًا في الإجهاد والقوة الأولية. نفترض وجود معاملات احتكاك أولية وقصوى متجانسة نسبيًا (المشار إليها بـ و ، على التوالي) في الفضاء، ولكن الإجهاد الطبيعي الأولي يظهر توزيعًا غير متجانس بشكل ملحوظ. تؤدي هذه الحالة إلى إجهاد قص غير متجانس مكانيًا. ومقاومة القص قبل اضطرابات ضغط السوائل. هنا، تُعرّف النتوءات بأنها بقع محلية ذات ضغط وقوة عالية في البداية. (ب) بعد زيادة ضغط السوائل بشكل نسبي. يتم فرضه، معامل الاحتكاك الظاهر تبدأ زيادة مقاطع العطل بمعدلات مختلفة، اعتمادًا على توزيع الضغط الطبيعي الأولي. يحدث الانزلاق غير الزلزالي الناتج عن الحقن أولاً على البقع الضعيفة ذات القوة المحلية المنخفضة، ثم تستمر منطقة الزحف البطيء في التوسع مع زيادة الضغط السائل وتزيد من إجهاد القص عند جبهات الزحف المتقدمة. (C) تحدث أحداث الفشل الكبيرة والانزلاق الزلزالي في النهاية حول النتوءات بسبب انتقال الإجهاد من الانزلاق غير الزلزالي. من المتوقع حدوث الزلازل الناتجة حول هذه البقع ذات الإجهاد العالي، مصحوبة بانخفاضات كبيرة في الإجهاد المحلي ومعدلات انزلاق، وإطلاق لحظات زلزالية كبيرة، وانخفاض في غوتنبرغ-ريختر. -القيم. الأرقام في الصف السفلي تت correspond إلى ملفات أحادية البعد على طول مسافة العطل في مراحل مختلفة.
المواد الصخرية تكون متساوية الخواص، متجانسة، وقابلة للاختراق. نبرز أن خشونة الفوالق قد تؤثر على انتقال الانزلاق غير الزلزالي إلى الزلزالي للهياكل الفالقية القابلة للاختراق التي تتعرض لضغوط سوائل متزايدة. من المتوقع أن تستضيف الهياكل الخزانية التي تهيمن عليها الفوالق والخدوش الخشنة والمجزأة عمليات النواة التي تحدث على مقاييس طول ووقت أكبر خلال حقن السوائل، والتي يمكن أن تُلتقط بواسطة أدوات الجيوديسيا والزلازل واسعة النطاق. تشير نتائجنا إلى أنه عند مراقبة حقن السوائل في الخزانات الجيولوجية في الوقت الحقيقي، قد يسمح ذلك بتحديد عمليات التمركز للزلازل الدقيقة المستحثة قبل حدوث أحداث أكبر مستحثة في المستقبل. قد يسمح إدخال هذه المعلومات في أنظمة إشارات المرور من الجيل التالي بتوفير قيود إضافية لوقف الحقن قبل حدوث أحداث زلزالية أكبر حول بقع الفوالق المتوترة بشدة.

المواد والطرق

إعداد تجريبي. قمنا بإجراء تجارب حقن السوائل على ثلاثة عينات أسطوانية من رمل بنتهايم المتجانس، المتساوي الخواص، والقابل للاختراق تحت ظروف ضغط القشرة باستخدام جهاز MTS الهيدروليكي الخدمي (صلابة مزودة بنظام تسجيل AE ونظام ضغط المسام (مضختان Quizix 6000 في الاتجاهين السفلي والعلوي، على التوالي). احتوى عينة واحدة على صدع مقطوع (أملس)، وتم قطع عينتين بواسطة صدوع خشنة متكسرة (المعروفة فيما بعد بالصدع الخشن #1 والصدع الخشن #2، على التوالي). ارتفاع rms ( تم قياس سطح العيب الناتج عن القطع بالمنشار ليكون حوالي 0.044 مم، في حين كانت قيم تم زيادتها إلى حوالي 1.50 مم و 0.82 مم للعيب الخشن #1 والعيب الخشن #2، على التوالي (الملحق SI، القسم 1). كانت العيوب الثلاثة موجهة جميعها في إلى محور الأسطوانة (الشكل 1A). لقياس التشوه وتسجيل النشاط الزلزالي، تم تثبيت ثمانية أجهزة قياس إجهاد محلية و16 محول بيزو كهربائي (PZTs) على سطح العينة قبل التجارب (الملحق SI، الأقسام 2 و3 والشكل S1). تم تحميل العينات أولاً هيدروستاتيكيًا حتى 35 ميجا باسكال ( ) بينما تم الحفاظ على ضغط السائل (p) ثابتًا عند 5 ميغاباسكال. بعد ذلك، قمنا بزيادة الإجهاد المحوري بمعدل إزاحة محورية ثابت لتحقيق أقصى قوة قص تم حلها على واجهة العطل. ثم قمنا بتقليل الإجهاد المحوري ببطء حتى وصلنا إلى إجهاد القص المحسوب. على طول واجهة الصدع كانت تساوي حوالي للخلل السلس والخلل الخشن #1 و للخلل الخشن رقم 2، على التوالي. وقد ضمنت هذه العملية أن تكون العيوب المخبرية قريبة من حالة الإجهاد الحرجة قبل حقن السوائل. لاحظ أنه بسبب هندسة العينة، فإن زيادة الإجهاد المحوري تؤدي إلى زيادة في كل من الإجهادات القصية والطبيعية. ثم تم الحفاظ على موضع الأسطوانة الهيدروليكية المحورية ثابتًا، وفي النهاية، قمنا بحقن الماء المقطر في العينات من الطرف السفلي لتحفيز انزلاق العيب في ظروف غير مصرفة. تم زيادة ضغط السائل بطريقة تدريجية من 5 ميغاباسكال إلى 29 ميغاباسكال بمعدل ضغط قمنا بتقسيم عملية حقن السوائل بالكامل إلى ست مراحل، وكانت مدة كل مرحلة 10 دقائق تتكون من مرحلة تسارع تستمر لمدة دقيقتين (لتحقيق زيادة قدرها 4 ميغاباسكال في السائل) ومرحلة هضبة تالية تستمر لمدة 8 دقائق.
معالجة بيانات الانبعاث الهيدروليكي والميكانيكي والصوتي. تفاصيل قياسات الإجهاد والانزلاق موضحة في الملحق SI، القسم 4. تفاصيل معالجة بيانات الانبعاث الصوتي (AE) بما في ذلك التوزيع المكاني، وخصائص التردد-الحجم، وآليات المصدر متوفرة في الملحق SI، الأقسام 5-8. تفاصيل حساب الطاقة الهيدروليكية والطاقة الزلزالية متاحة في الملحق SI، القسم 9.
نموذج عددي. لإعادة إنتاج الانزلاق الناتج عن الحقن الذي تم ملاحظته على العيوب الملساء والخشنة، نقوم بتوسيع نموذج بورريدج-كنوبوف أحادي البعد (1D) (79) للواجهات المحملة بشكل غير متجانس والتي تتبع قانون الاحتكاك المعتمد على المعدل والحالة من خلال تضمين عملية انتشار ضغط السوائل.
يتكون نموذج بوريج-كنوبوف أحادي البعد من مجموعة من كتل متطابقة مترابطة بواسطة نوابض مرنة ذات معامل صلابة ويدفعون بشكل مرن (مع معامل صلابة الزنبرك ) بواسطة لوحة صلبة تتحرك بسرعة ثابتة (مماثل لحركات التكتونية في المناطق البعيدة) (الملحق SI، الشكل S14). تم استخدام هذا النموذج سابقًا للتحقيق في الانزلاق الاحتكاكي على سطح خشن (79). لمحاكاة تأثيرات ضغط السوائل، نأخذ في الاعتبار توزيع ضغط السوائل المحلي الذي يؤثر على سلسلة الكتل بالإضافة إلى التغيرات
الإجهادات العادية. بالنسبة لكل كتلة، يتم التحكم في الانزلاق الاحتكاكي بواسطة قانون احتكاك يعتمد على المعدل والحالة. أي، معامل احتكاكه يختلف مع معدل الانزلاق اللحظي ومتغير الحالة (الرمز السفلي يعني مؤشر الكتلة)، كما هو معبر عنه بـ:
أين تشير إلى معامل الاحتكاك المرجعي عند سرعة انزلاق مرجعية في حالة مستقرة ، و يمثل المسافة المميزة للانزلاق التي يتطور خلالها الاحتكاك إلى حالة مستقرة جديدة بعد اضطراب في السرعة، و هي معلمات احتكاكية تصف استجابة الاحتكاك لخطوة مفاجئة في السرعة المفروضة لتكوين زنبرك-كتلة واحد. إشارة يحدد تغيير معامل الاحتكاك الثابت مع السرعة في الذي يعني تعزيز السرعة وضعف السرعة يتوافق مع نقيد تطور المتغيرات الحالة مع الوقت استخدام قانون الانزلاق لأنه يوفر تطابقًا أفضل مع بيانات المختبر (80)، كما هو موضح بـ:
لتمثيل تكويننا التجريبي، نفترض أن الضغط الزائد للسائل يُفرض عند منفذ حقن بعيد مع ضغط حقن متغير مع الزمن. انتشار ضغط السوائل من خلال مصفوفة الصخور مع قابلية الانتشار الهيدروليكي نحو منطقة الصدع يعدل حالات الإجهاد الفعالة لقطاعات الصدع وبالتالي قد يتسبب في إعادة تنشيط الصدع.
بافتراض عملية انتشار الغشاء (تطور ضغط السائل داخل منطقة الصدع يعتمد خطيًا على فرق ضغط السائل بين منطقة الصدع وضغط السائل البعيد) التي تكون مناسبة عادةً لسيناريوهات التجارب المعملية (81)، يمكن تقييد تطور ضغط السائل داخل منطقة الصدع بواسطة:
أين تشير إلى ضغط السائل المؤثر على الكتلة داخل منطقة الخطأ، تشير إلى ضغط المسام عند منفذ الحقن البعيد، و يتم إعطاؤه بواسطة مع كونه طول انتشار مميز بين منفذ الحقن البعيد و الكتلة و كونها الانتشار الهيدروليكي. بالنظر إلى النفاذية العالية لمصفوفة الصخور المعتمدة في تجاربنا، يمكن أن يكون تأثير التمدد/الانضغاط الناتج عن القص على تعديل ضغط السوائل داخل منطقة الصدع وعلى انزلاق الصدع ضئيلاً.
بالنسبة لسلسلة من الكتل المتصلة بنابض مدفوعة بواسطة لوحة متحركة وتتعرض لإجهاد عمودي وضغط سائل، فإن معادلة الحركة لموقع الكتلة i في المعنى شبه الديناميكي (أي أن التأثير القصور الذاتي يتم استبداله بمصطلح تخميد الإشعاع) كما هو موضح من قبل رايس (69)
أين و هي الإجهاد العادي وضغط السائل المطبق على الكتلة، هو ثابت الزنبرك الذي يربط كل كتلة بلوحة متحركة بسرعة ثابتة هو صلابة الربيع التي تربط الكتل المجاورة، هو موقع الـ الكتلة بالنسبة لموقعها الابتدائي، هو سرعة الانزلاق للكتلة i )، و يصف تخميد الإشعاع، مقيد بـ في الذي هو معامل القص للصخر و هي سرعة الموجة القصيرة (69). لعدد معين من الكتل المعرضة لتوزيعات ضغط عادي غير متجانسة، يمكن دمج المعادلات 1-4 وحلها معًا باستخدام طريقة رانج-كوتا لمحاكاة انزلاق العطل الناتج عن الحقن على سطح خشن استجابةً لاضطراب ضغط الحقن المعطى.
نستخدم 100 كتلة متباعدة بالتساوي مع تباعد شبكة قدره 1 مم (أي حجم الكتلة) لالتقاط سلوك الـ -عيوب مختبرية طويلة على طول اتجاه الميل. يتم تقديم معلمات الإدخال في الملحق SI، القسم 11 والجدول S1.
توفر البيانات والمواد والبرمجيات. تم أرشفة البيانات التجريبية في Mendeley Data المتاحة علىhttps://data.mendeley.com/datasets/ xcyvspjk3c/1 (DOI: 10.17632/xcyvspjk3c.1) (82). جميع البيانات الأخرى مدرجة في المقالة و/أو المعلومات الداعمة.
الشكر والتقدير. نشكر ستيفان جيرمان على المساعدة في إعداد العينات والأقسام الرقيقة. نحن ممتنون لفاليريان شوشتر على ملاحظات المجهر الضوئي للأقسام الرقيقة. استفاد المخطوط من المناقشات البناءة مع جاي فاينبرغ، توماس غوبل، ونيكولاس برانتوت. نشكر المراجعين بول سيغال وجريج هيرث، والمحرر على التعليقات والأفكار القيمة التي حسنت بشكل كبير الدراسة الحالية. يعترف ل.و. بتمويل ما بعد الدكتوراه المقدم من مركز هيلمهولتز في بوتسدام، مركز الأبحاث الجيولوجية الألمانية. يعترف ج.د. بتمويل مشروع BMBF STIMTEC-X 03G0901C.
  1. أ. ساجي، إ. إ. برودسكي، ج. ج. أكسن، تطور خشونة سطح العطل مع الانزلاق. الجيولوجيا 35، 283-286 (2007).
  2. W. L. باور، T. E. توليس، نماذج إقليدية وفراغية لوصف خشونة سطح الصخور. مجلة أبحاث الجيوفيزياء. الأرض الصلبة 96، 415-424 (1991).
  3. إي. إي. برودسكي، ج. د. كيركباتريك، ت. كانديلا، القيود الناتجة عن خشونة العيوب على القوة المعتمدة على المقياس للصخور. الجيولوجيا 44، 19-22 (2016).
  4. F. رينار، T. كانديلا، E. بوشود، الثبات البُعدي لخشونة العيوب من مقياس الميكرو-تشققات إلى مقياس القارات. رسائل أبحاث الجيوفيزياء 40، 83-87 (2013).
  5. T. كانديلا وآخرون، خشونة أسطح العيوب على مدى تسعة عقود من مقاييس الطول. مجلة أبحاث الجيوفيزياء. الأرض الصلبة 117، B08409 (2012).
  6. جي. إتش. ديترش، بي. دي. كيلغور، الملاحظة المباشرة للاتصالات الاحتكاكية: رؤى جديدة لخصائص تعتمد على الحالة. الجيولوجيا الفيزيائية النقية والتطبيقية 143، 283-302 (1994).
  7. F. M. تشيستر، ج. س. تشيستر، الإجهاد والتشوه على طول الفوالق المتموجة الاحتكاكية. مجلة أبحاث الجيوفيزياء. الأرض الصلبة 105، 23421-23430 (2000).
  8. جي. إتش. ديترش، دي. إي. سميث، العيوب غير المستوية: ميكانيكا الانزلاق والأضرار خارج العيب. الجيولوجيا الفيزيائية النقية والتطبيقية 166، 1799-1815 (2009).
  9. س. ر. براون، ج. هـ. شولتز، إغلاق الأسطح المرنة العشوائية في الاتصال. مجلة أبحاث الجيوفيزياء. الأرض الصلبة 90، 5531-5545 (1985).
  10. Z. Fang، E. M. Dunham، مقاومة القص الإضافية الناتجة عن خشونة العيوب ومستويات الضغط على العيوب المعقدة هندسياً. مجلة أبحاث الجيوفيزياء. الأرض الصلبة 118، 3642-3654 (2013).
  11. ن. يوشيوكا، ج. هـ. شولتز، الخصائص المرنة للأسطح المتلامسة تحت الأحمال العمودية والقصية: 1. النظرية. مجلة أبحاث الجيوفيزياء. الأرض الصلبة 94، 17681-17690 (1989).
  12. Y. Tal، B. H. Hager، J. P. Ampuero، تأثيرات خشونة العيوب على عملية نشوء الزلازل. J. Geophys. Res. Solid Earth 123، 437-456 (2018).
  13. س. و. أوزاوا، ت. هاتانو، ن. كامي، هجرة أطول وتدهور عفوي لنبضة الانزلاق غير الزلزالي الناتجة عن خشونة الفوالق. رسائل أبحاث الجيوفيزياء 46، 636-643 (2019).
  14. سي. كاتانيا، بي. سيجال، الانزلاق البطيء المسبق والهزات التمهيدية على الفوالق الخشنة. مجلة أبحاث الجيوفيزياء. الأرض الصلبة 126، e2020JB020430 (2021).
  15. س. أوزاوا، ر. أندو، محاكاة تسلسل الزلزال الرئيسي والهزات الارتدادية في مناطق الفوالق المعقدة هندسياً. مجلة أبحاث الجيوفيزياء. الأرض الصلبة 126، e2020JB020865 (2021).
  16. أ. أ. علام، ك. أ. كرول، ج. و. د. ميلينر، ك. ب. ريتشاردز-دينجر، تأثيرات خشونة الفوالق على الانزلاق الزلزالي ومواقع الزلازل. مجلة أبحاث الجيوفيزياء. الأرض الصلبة 124، 11336-11349 (2019).
  17. Z. شي، S. M. داي، ديناميات التمزق وحركة الأرض من محاكاة الفوالق الخشنة ثلاثية الأبعاد. مجلة أبحاث الجيوفيزياء. الأرض الصلبة 118، 1122-1141 (2013).
  18. أ. زيلك، م. غاليس، ب. م. ماي، خشونة العيوب وتباين القوة يتحكمان في حجم الزلزال وانخفاض الضغط. رسائل أبحاث الجيوفيزياء 44، 777-783 (2017).
  19. Y.Tal، B.H. Hager، سلوك الانزلاق ومعلمات المصدر للأحداث الانزلاقية التلقائية على الفوالق الخشنة الخاضعة لتحميل تكتوني بطيء. مجلة أبحاث الجيوفيزياء. الأرض الصلبة 123، 1810-1823 (2018).
  20. إ. م. دنهم، د. بيلانجر، ل. كونغ، ج. إ. كوزدون، تمزقات الزلازل مع احتكاك ضعيف بشكل كبير معتمد على المعدل ومرونة خارج الفوالق، الجزء 2: الفوالق غير المستوية. نشرة جمعية الزلازل الأمريكية 101، 2308-2322 (2011).
  21. A. جونو، س. لاتور، ج. ليتور، س. العرم، نشوء الانكسار على واجهة غير متجانسة دورياً. رسائل أبحاث الجيوفيزياء 49، e2021GL096816 (2022).
  22. F. ياماشيتا وآخرون، عملية إعداد الانكسار المتحكم بها خشونة السطح على مقياس المختبر. تكتونوفيزيكس 733، 193-208 (2018).
  23. جي. دريسن، جي. كفياتك، تي. غوبل، واي. بن-زيون، العمليات التحضيرية الزلزالية وغير الزلزالية قبل الفشل الكبير المفاجئ. الجيولوجيا الفيزيائية التطبيقية النقية. 177، 5741-5760 (2020).
  24. تي. إتش. دبليو. غوبل، جي. كوياتيك، تي. دبليو. بيكر، إي. إي. برودسكي، جي. دريسن، ما الذي يسمح للأحداث الزلزالية بالنمو الكبير؟: رؤى من تحليل قيمة ب ووعورة الفوالق في تجارب الانزلاق في المختبر. الجيولوجيا 45، 815-818 (2017).
  25. بي. جي. أوكوبو، جي. إتش. ديترتش، تأثيرات الخصائص الفيزيائية للعيوب على عدم الاستقرار الاحتكاكي الناتج على العيوب المحاكاة. مجلة أبحاث الجيوفيزياء. الأرض الصلبة 89، 5817-5827 (1984).
  26. م. أونكا، ل. شين، توسيع عملية تمزق القص من النواة إلى الانتشار الديناميكي: تداعيات عدم انتظام الشكل لأسطح التمزق. مجلة أبحاث الجيوفيزياء. الأرض الصلبة 104، 817-844 (1999).
  27. س. غيران-مارت و آخرون، الانزلاق التحضيري في العيوب المخبرية: تأثيرات الخشونة وسرعة نقطة التحميل. مجلة أبحاث الجيوفيزياء. الأرض الصلبة 128، e2022JB025511 (2023).
  28. س. شو وآخرون، قوة العطل وعملية الانكسار التي تتحكم بها تضاريس سطح العطل. نات. جيوسي. 16، 94-100 (2023).
  29. C. W. A. هاربرود، S. B. نيلسن، N. دي باولا، R. E. هولدوورث، نشوء الزلازل على الفوالق الخشنة. الجيولوجيا 45، 931-934 (2017).
  30. A. M. إيسينك، ج. د. كيركباتريك، ف. رينارد، م. ج. إيكاري، شكل سطح العطل كمؤشر على إمكانية نشوء الزلازل. الجيولوجيا 50، 1356-1360 (2022).
  31. جي. إتش. ديترش، نمذجة احتكاك الصخور: 1. النتائج التجريبية والمعادلات الدستورية. مجلة أبحاث الجيوفيزياء. الأرض الصلبة 84، 2161-2168 (1979).
  32. سي. مارون، قوانين الاحتكاك المستمدة من المختبر وتطبيقها على الزلازل. مراجعة سنوية لعلوم الأرض والكواكب 26، 643-696 (1998).
  33. F. ياماشيتا وآخرون، تحضيرات زلزال من نوعين تم تسليط الضوء عليها من خلال نشاط الزلازل السابقة على صدع مختبري بمقياس المتر. نات. كوم. 12، 1-11 (2021).
  34. W. L. Ellsworth، الزلازل الناتجة عن الحقن. العلوم (80-) 341، 1225942 (2013).
  35. R. شولتز وآخرون، الزلازل الناتجة عن التكسير الهيدروليكي. مراجعة الجيوفيزياء 58، e2019RG000695 (2020).
  36. F. كابا، م. م. سكوديري، ك. كوليتيني، ي. غولييلمي، ج.-ب. أفواك، استقرار انزلاق الفوالق عن طريق حقن السوائل في المختبر وفي الموقع. ساينس أدفانس. 5، eaau4065 (2019).
انتماءات المؤلفين: مركز هلمهولتز بوتسدام، مركز الأبحاث الألماني لعلوم الأرض، الجيوميكانيكا والحفر العلمي، بوتسدام 14473، ألمانيا؛ مركز نورد، قسم علوم الأرض، جامعة أوسلو، أوسلو 0316، النرويج؛ مركز نورد، قسم الفيزياء، جامعة أوسلو، أوسلو 0316، النرويج؛ ISTerre، جامعة غرونوبل ألب، غرونوبل INP، جامعة سافوي مونت بلانك، CNRS، IRD، جامعة غوستاف إيفل، غرونوبل 38000، فرنسا؛ مختبر ميكانيكا الصخور التجريبية، معهد الهندسة المدنية، المدرسة الفيدرالية Polytechnic de Lausanne، لوزان 1015، سويسرا؛ قسم علوم الأرض، جامعة برلين الحرة، برلين 12249، ألمانيا؛ و معهد علوم الأرض والبيئة، جامعة بوتسدام، بوتسدام 14469، ألمانيا
37. ي. غولييلمي، ف. كابا، ج.-ب. أفواك، ب. هنري، د. إلسورث، النشاط الزلزالي الناتج عن الانزلاق غير الزلزالي الناتج عن حقن السوائل. ساينس (80-) 348، 1224-1226 (2015).
38. م. وينغارتن، س. جي، ج. و. جودت، ب. أ. بيكينز، ج. ل. روبنشتاين، يرتبط الحقن بمعدل مرتفع بزيادة النشاط الزلزالي في وسط الولايات المتحدة. ساينس (80-) 348، 1336-1340 (2015).
39. سي. لانغنبروك، م. د. زوباك، كيف ستستجيب الزلازل الناتجة عن النشاط البشري في أوكلاهوما لانخفاض معدلات حقن المياه المالحة؟ ساينس أدفانس 2، e1601542 (2016).
40. ج. هـ. هيلي، و. و. روبي، د. ت. غريغز، س. ب. رالي، زلازل دنفر. ساينس (80-) 161، 1301-1310 (1968).
41. جي. كوياتيك وآخرون، التحكم في الزلازل الناتجة عن السوائل خلال تحفيز حراري عميق بعمق 6.1 كم في فنلندا. ساينس أدفانس 5، eaav7224 (2019).
42. م. غاليس، ج. ب. أمبويرو، ب. م. ماي، ف. كابا، الزلازل المستحثة توفر رؤى حول سبب توقف انكسارات الزلازل. ساينس أدفانس 3، eaap7528 (2017).
43. أ. مكغار، الزلازل ذات الحد الأقصى من الحجم الناتجة عن حقن السوائل. مجلة أبحاث الجيوفيزياء. الأرض الصلبة 119، 1008-1019 (2014).
44. س. أ. شابيرو، أ. س. كروجر، ج. دينسكي، ج. لانغنبروخ، مقاييس الزلازل المستحثة وأبعاد الصخور المحفزة بالسوائل. الجيوفيزياء 76، WC55-WC63 (2011).
45. ل. وانغ وآخرون، دراسة مختبرية حول سلوك انزلاق العيوب الناتج عن السوائل: دور معدل ضغط السوائل. رسائل أبحاث الجيوفيزياء 47، e2019GL086627 (2020).
46. ل. وانغ، ج. كوياتيك، إ. ريباشكي، م. بونهوف، ج. دريسن، إطلاق لحظة زلزالية ناتجة عن الحقن والانزلاق في المختبر: تداعيات على الزلازل الناتجة عن السوائل. رسائل أبحاث الجيوفيزياء 47، e2020GL089576 (2020).
47. F.X. باسليغ، ن. برانتوت، ت. م. ميتشل، إعادة تنشيط العيوب بواسطة حقن السوائل: الضوابط من حالة الإجهاد ومعدل الحقن. رسائل أبحاث الجيوفيزياء 45، 12837-12846 (2018).
48. ي. جي، ل. وانغ، هـ. هوفمان، ج. كوياتيك، ج. دريسن، حقن السوائل بمعدل عالٍ يقلل من طول النواة للزلازل المخبرية على الفوالق المتوترة بشكل حرج في الجرانيت. رسائل أبحاث الجيوفيزياء 49، e2022GL100418 (2022).
49. د. إ. غاراغاش، ل. ن. جيرمانوفيتش، نواة ووقف الانزلاق الديناميكي على صدع مضغوط. مجلة أبحاث الجيوفيزياء. الأرض الصلبة 117، B10310 (2012).
50. س. ب. ل. سيبري، س. ي. كي، ج. س. مكلاسي، دور حالة الإجهاد الخلفية في الانزلاق غير الزلزالي الناتج عن السوائل والتمزق الديناميكي على صدع مختبري بطول 3 أمتار. مجلة أبحاث الجيوفيزياء: الأرض الصلبة 127، e2022JB024371 (2022).
51. F.X. باسليغ وآخرون، الإجهاد الفعال الأولي يتحكم في طبيعة الزلازل. نات. كوميونيك. 11، 5132 (2020).
52. ف. كابا، ي. غولييلمي، س. نوسباوم، ل. دي باروس، ج. بيركهولزر، هجرة السوائل في العيوب ذات النفاذية المنخفضة المدفوعة بفصل انزلاق العيب وفتحه. نات. جيوساينس. 15، 747-751 (2022).
53. ك. أ. كروول، إ. س. كوكراين، الضغوط تتحكم في مدى التمزق والحد الأقصى لشدة الزلازل الناتجة. رسائل أبحاث الجيوفيزياء 48، e2020GL092148 (2021).
54. ج. ماورر، إ. م. دونهام، ب. سيغال، دور حقن السوائل في حجم الزلازل في محاكاة الانكسار الديناميكي على الفوالق الخشنة. رسائل أبحاث الجيوفيزياء 47، e2020GL088377 (2020).
55. ز. يي، أ. غاسمي، الانزلاق الناتج عن الحقن وزيادة النفاذية في شقوق الجرانيت. مجلة أبحاث الجيوفيزياء. الأرض الصلبة 123، 9009-9032 (2018).
56. ي. جي، و. وو، عدم استقرار الكسر المدفوع بالحقن في الجرانيت: الآلية والآثار. تكتونوفيزيكس 791، 228572 (2020).
57. ب. ك. سي، إ. غازانفاري، تحفيز خزانات الطاقة الحرارية الأرضية من خلال القص الهيدروليكي: دراسة تجريبية تحت ظروف قريبة من الأنظمة الحرارية الأرضية المعززة. جيثرميكس 96، 102200 (2021).
58. ل. وانغ، إ. ريباشكي، أ. بونلي، م. بونهوف، ج. دريسن، تحقيق تجريبي حول معامل الحجم الثابت والديناميكي للرمال الحجرية المسامية الجافة والمشبعة بالسوائل. ميكانيكا الصخور. هندسة الصخور 54، 129-148 (2021).
59. ب. سيجال، د. د. بولارد، ميكانيكا العيوب المنقطعة. مجلة أبحاث الجيوفيزياء. الأرض الصلبة 85، 4337-4350 (1980).
60. ر. هـ. سيبسون، توقف انكسارات الزلازل عند انحناءات الفوالق التوسعية. الطبيعة 316، 248-251 (1985).
61. سي. إتش. شولتز، حول اعتماد قيمة زلزال ب على الضغط. رسائل أبحاث الجيوفيزياء 42، 1399-1402 (2015).
62. س. وييمر، م. ويس، رسم توزيع التردد-السعة في النقاط الضعيفة: تقنية محسّنة لحساب أوقات التكرار؟ مجلة أبحاث الجيوفيزياء. الأرض الصلبة 102، 15115-15128 (1997).
63. ب. م. باورز، ت. هـ. جوردان، توزيع الزلازل عبر الفوالق الانزلاقية في كاليفورنيا. مجلة أبحاث الجيوفيزياء. الأرض الصلبة 115، 5305 (2010).
64. أ. زانغ وآخرون، تحليل مصدر الانبعاثات الصوتية في نوى جرانيت أوي تحت أحمال ضغط متماثلة وغير متماثلة. مجلة الجيوفيزياء الدولية 135، 1113-1130 (1998).
65. ج. كوياتيك، ب. مارتينيز-غارزون، م. بونهوف، هايبرد إم تي: حزمة بيئة MATLAB/Shell لعكس وتحسين موتر الزلزال. رسائل أبحاث الزلازل 87، 964-976 (2016).
66. ج. أ. هودسون، ر. ج. بيرس، ر. م. روجرز، رسم بياني لنوع المصدر لعكس موتر اللحظة. مجلة أبحاث الجيوفيزياء. الأرض الصلبة 94، 765-774 (1989).
67. ج. دافيدسن وآخرون، ما الذي يتحكم في وجود وخصائص الهزات الارتدادية في كسر الصخور في المختبر؟ مجلة أبحاث الجيوفيزياء. الأرض الصلبة 126، e2021JB022539 (2021).
68. ج. كوياتيك، ت. هـ. و. غويبل، ج. دريسن، موتر الزلزال تغيرات القيمة على مدى دورات زلزالية متعاقبة في تجارب الانزلاق والتمسك في المختبر. رسائل أبحاث الجيوفيزياء 41، 5838-5846 (2014).
69. ج. ر. رايس، التعقيد الزمكاني للانزلاق على صدع. مجلة أبحاث الجيوفيزياء. الأرض الصلبة 98، 9885-9907 (1993).
70. أ. م. روبين، ج.-ب. أمبويرو، نشوء الزلازل على الفوالق (القديمة) ذات المعدل والحالة. مجلة أبحاث الجيوفيزياء. الأرض الصلبة 110، B11312 (2005).
71. ك. آكي، توصيف الحواجز على صدع زلزالي. مجلة أبحاث الجيوفيزياء. الأرض الصلبة 84، 6140-6148 (1979).
72. سي. فريلش، الزلازل ذات الآليات غير ثنائية الزوج. العلوم 264، 804-809 (1994).
73. ل. دي باروس، ف. كابا، ي. غولييلمي، ل. دوبويف، ج. ر. غراسو، طاقة الزلازل الناتجة عن الحقن المتوقعة من التجارب في الموقع. ساينتيفيك ريبورت 9، 4999 (2019).
74. س. ماكسويل، الزلازل غير المقصودة الناتجة عن التكسير الهيدروليكي. سجل CSEG 38، 40-49 (2013).
75. س. د. غودفيلو، م. هـ. ب. ناصر، س. س. ماكسويل، ر. ب. يونغ، ميزانية طاقة الشقوق الهيدروليكية: رؤى من المختبر. رسائل أبحاث الجيوفيزياء 42، 3179-3187 (2015).
76. جي. كفياتك وآخرون، رؤى حول عمليات التصدع المعقدة دون السنتيمتر التي تحدث خلال تجربة حقن المياه في عمق مختبر الصخور الصلبة في آسبو، السويد. مجلة أبحاث الجيوفيزياء. الأرض الصلبة 123، 6616-6635 (2018).
77. س. بينتس، ج. كفياتك، ب. مارتينيز-غارزون، م. بونهوف، ج. دريسن، تطور لحظة الزلزال خلال التحفيزات الهيدروليكية. رسائل أبحاث الجيوفيزياء 47، e2019GL086185 (2020).
78. ت. س. إير وآخرون، دور الانزلاق غير الزلزالي في الزلازل الناتجة عن التكسير الهيدروليكي. ساينس أدفانس 5، eaav7172 (2019).
79. ر. بوريج، ل. كنوبوف، نموذج وزلزالية نظرية. نشرة جمعية الزلازل الأمريكية 57، 341-371 (1967).
80. ب. بهاتاشاريا، أ. م. روبين، إ. بايارت، هـ. م. سافاج، ج. مارون، تقييم نقدي لقوانين تطور الحالة في الاحتكاك المعتمد على المعدل والحالة: ملاءمة خطوات السرعة الكبيرة في الغضار الزلزالي المحاكى مع القوانين التركيبية المعتمدة على الزمن والانزلاق والضغط. مجلة أبحاث الجيوفيزياء. الأرض الصلبة 120، 6365-6385 (2015).
81. ب. سيجال، ج. ر. رايس، التمدد، الانضغاط، وعدم استقرار الانزلاق في صدع مملوء بالسوائل. مجلة أبحاث الجيوفيزياء. الأرض الصلبة 100، 22155-22171 (1995).
82. ل. وانغ، البيانات التكميلية لدراسة ‘خشونة العيوب تتحكم في الزلازل الناتجة عن الحقن’. بيانات ماندلي، الإصدار 1.https://data.mendeley.com/datasets/xcyvspjk3c/1تم الإيداع في 22 مايو 2023.

  1. مساهمات المؤلفين: صمم L.W. و G.D. البحث؛ قام L.W. بإجراء البحث؛ ساهم L.W. و G.K. و M.B. في توفير مواد جديدة/أدوات تحليلية؛ قام L.W. و G.K. و F.R. و S.G.-M. و E.R. و M.B. و M.N. و G.D. بتحليل البيانات؛ وكتب L.W. و G.D. الورقة.
    يعلن المؤلفون عدم وجود مصالح متنافسة.
    هذه المقالة هي تقديم مباشر إلى PNAS.
    حقوق الطبع والنشر © 2024 المؤلف(المؤلفين). نُشر بواسطة PNAS. يتم توزيع هذه المقالة المفتوحة الوصول بموجب رخصة المشاع الإبداعي النسب-غير التجارية-عدم الاشتقاق 4.0 (CC BY-NC-ND).
    إلى من يمكن توجيه المراسلات. البريد الإلكتروني:wanglei@gfz-potsdam.de.
    تحتوي هذه المقالة على معلومات داعمة على الإنترنت فيhttps://www.pnas.org/lookup/suppl/doi:10.1073/pnas. 2310039121/-/DCSupplemental.
    نُشر في 12 يناير 2024.

Journal: Proceedings of the National Academy of Sciences, Volume: 121, Issue: 3
DOI: https://doi.org/10.1073/pnas.2310039121
PMID: https://pubmed.ncbi.nlm.nih.gov/38215182
Publication Date: 2024-01-12

Fault roughness controls injection-induced seismicity

Lei Wang (D), Grzegorz Kwiatek , François Renard (D), Simon Guérin-Marthe (D), Erik Rybacki (D), Marco Bohnhoff (D), Michael Naumann (D), and Georg Dresen

Edited by Peter Kelemen, Lamont-Doherty Earth Observatory, Palisades, NY; received June 20, 2023; accepted December 4, 2023

Abstract

Surface roughness ubiquitously prevails in natural faults across various length scales. Despite extensive studies highlighting the important role of fault geometry in the dynamics of tectonic earthquakes, whether and how fault roughness affects fluid-induced seismicity remains elusive. Here, we investigate the effects of fault geometry and stress heterogeneity on fluid-induced fault slip and associated seismicity characteristics using laboratory experiments and numerical modeling. We perform fluid injection experiments on quartz-rich sandstone samples containing either a smooth or a rough fault. We find that geometrical roughness slows down injection-induced fault slip and reduces macroscopic slip velocities and fault slip-weakening rates. Stress heterogeneity and roughness control hypocenter distribution, frequency-magnitude characteristics, and source mechanisms of injection-induced acoustic emissions (AEs) (analogous to natural seismicity). In contrast to smooth faults where injection-induced AEs are uniformly distributed, slip on rough faults produces spatially localized AEs with pronounced non-double-couple source mechanisms. We demonstrate that these clustered AEs occur around highly stressed asperities where induced local slip rates are higher, accompanied by lower Gutenberg-Richter -values. Our findings suggest that real-time monitoring of induced microseismicity during fluid injection may allow identifying progressive localization of seismic activity and improve forecasting of runaway events.

laboratory earthquakes | fluid-induced seismicity | fault roughness | stress heterogeneity | aseismic slip
Geometrical roughness, the deviation from a planar surface, characterizes natural faults over a wide range of length scales (1-5), exhibiting a consistent self-affine scaling law. A plethora of studies have demonstrated that the presence of geometric asperities on faults results in significantly heterogeneous stress distributions (6-11). Fault roughness and heterogeneous local stresses affect nucleation, propagation, and arrest of shear ruptures (10, 12, 13), foreshock, mainshock, and aftershock sequences (14, 15), and coseismic slip distribution and locations of earthquake hypocenters . Likewise, ground motion, radiation pattern and source parameters of seismic events (17-19), and the distribution of off-fault damage zones are linked to fault structures. Laboratory friction experiments highlight the important role of fault roughness in controlling rupture nucleation and slip instability (21-27). When compared to smooth faults, rough faults display longer nucleation time and larger nucleation length but lower macroscopic slip velocities and a wider range of rupture speeds ( ). Moreover, rate-and-state friction parameters, experimentally derived from laboratory experiments performed on samples with varying fault roughness, showed different and opposing trends with roughness (29-32). In addition to the rich mechanical behavior, spatial distribution and statistical characteristics of acoustic emission (AE) events associated with failure of microscopic asperities are closely linked to fault surface morphology (23, 24, 33).
Fluid injection into the subsurface may cause a preexisting fault to slip seismically and induce seismic events (anthropogenic earthquakes), which have been documented worldwide in enhanced geothermal system, waste-water injection, and geologic sequestration of carbon dioxide . Fault reactivation associated with fluid injection may occur as a result of a reduction of effective normal stress unclamping the fault, poroelastic stress changes, and/or stress transfer through aseismic slip (34-37). Extensive geophysical surveys document the occurrence of induced earthquakes being affected by fluid pressure, injection rate, and fluid volume injected (38-41). Theoretical models (42-44) and laboratory experiments (45-48) also suggest causal relations between stimulation parameters and seismic activity. In addition to fluid injection parameters, complex injection-induced slip behavior may emerge depending on background stress states (49-51), pressure-dependent frictional properties (36), and the interplay between permeability change and fault slip (37, 52). While the effects of surface roughness on tectonic earthquakes have been extensively explored, the role of fault structure and heterogeneity on induced seismicity remains

Abstract

Significance Fluid-induced earthquakes associated with industrial activities, such as wastewater disposal, geothermal energy production, and storage, have received increasing scientific concerns. Natural faults that host earthquakes typically display nonplanar structures. This study provides straightforward information on how fault structure and heterogeneity control injectioninduced fault slip and associated seismicity characteristics using well-designed fluid injection experiments on laboratory faults and relevant numerical modeling. The results indicate that geometrical roughness slows down injection-induced fault slip and affects hypocenter distribution, frequencymagnitude characteristics, and source mechanisms of induced seismicity. We highlight the key roles that fault roughness and stress heterogeneity play in modulating a transition from aseismic to seismic slip when subjected to increased fluid pressure, leading to large induced events localized around highly stressed asperities.

elusive. Several numerical simulations of injection-induced ruptures on rough faults suggest that stress heterogeneity arising from fault roughness primarily controls rupture size and seismic moment release, in addition to fluid pressure and injected volume . A limited number of experiments indicate that surface roughness of laboratory faults in granite samples alters fault hydraulic properties, giving rise to varying fluid pressure distributions and slip responses (55-57). The spatiotemporal distribution of fluid pressure in these experiments suggested that pressure heterogeneity and stress heterogeneity were highly coupled, complicating the interpretation of observed fault slip.
In this work, we experimentally investigate the effect of fault roughness and stress heterogeneity on injection-induced fault slip. We disentangle the effects of stress heterogeneity and pressure heterogeneity using highly permeable quartz-rich sandstone samples as testing materials so that fluid pressure rapidly equilibrates throughout the entire sample volume. To explore the effect of geometrical roughness, we prepare saw-cut and polished laboratory faults and rough shear-fractured samples for fluid injection experiments. Results show that complex fault geometry slows down injection-induced fault slip and exerts a strong control on
spatial distribution, frequency-magnitude characteristics, and source mechanisms of injection-induced AE events. For further analysis of the observed effects of fault and stress heterogeneity, we compare the experimental data to numerical modeling results of fault slip on smooth and rough faults.

Results

We have loaded cylindrical samples containing an inclined fault interface with varying surface roughness (saw-cut smooth surface vs. fractured rough surface) in a triaxial compression apparatus to a critical stress state and subsequently activated fault slip using defined fluid injection protocols (Fig. 1A, Materials and Methods). To study the effect of geometrical roughness on induced fault slip, we have produced a series of injection-induced slip events on three samples, one containing a smooth fault and two samples cut by rough faults (rough fault #1 and rough fault #2, respectively) at fixed boundary conditions. In striking contrast to the smooth saw-cut fault with a spatially uniform and very flat surface topography (Fig. 1B), the two fractured faults display significant surface roughness with maximum height difference up to 7 mm (Fig. 1C
Fig. 1. Experimental setup and prepared laboratory faults with varying surface roughness. (A) Fluid injection experiments performed on cylindrical samples of a permeable quartz-rich sandstone containing an inclined ( relative to the loading axis) smooth or rough fault subjected to triaxial compression. The samples are mounted with an array of strain gauges and piezoelectric transducers. ( and ) Surface elevation of the lower rock block for the smooth (saw-cut) and rough (shear-fractured) faults, respectively. (D) Power spectral density (PSD) of surface profiles along fault slip direction for smooth and rough faults. and mean the minimum and maximum wavevector while and indicate fault length and the minimum wavelength, respectively. Two rough laboratory faults display a broad-band (from quartz grain size to fault length ) self-affine roughness with a Hurst exponent of 0.65. In contrast, the PSD of the saw-cut fault across the similar wavelength range is almost flat and does not follow a power law.
and SI Appendix, Fig. S2). Using fast Fourier transform, the power spectral density (PSD) of the elevation profiles parallel and perpendicular to fault dip reveals a broad-band (from quartz grain size to fault length) self-affine roughness with a Hurst exponent of about 0.65 (Fig. 1D and SI Appendix, Fig. S3). In contrast, the PSD of the smooth saw-cut fault across the similar wavelength range is almost flat and does not follow a power law.
Injection-Induced Slip Behavior on Experimental Faults with Varying Roughness. We report two representative experiments on samples with substantially different fault roughness where fluid pressure along a critically stressed fault is increased stepwise. The
cylindrical samples containing a saw-cut or rough fault interface inclined at relative to the axis are loaded axially at a constant confining pressure and fluid pressure , leading to a progressive increase in resolved shear stress with slip up to a peak shear strength (stage 1 in Fig. and ). When approaching , shear stress is almost constant while the fault slip rate accelerates to a steady-state value, roughly equal to the imposed load point velocity of the ram (SI Appendix, Fig. S5A). Shear stress data show small hardening for both smooth and rough faults (Fig. and ), and the values of and corresponding steady-state friction coefficients scale with the rms roughness of fault surface (SI Appendix, Fig. S5D). This result indicates that
Fig. 2. Mechanical behavior of injection-induced fault slip on smooth and rough faults. ( and ) Temporal evolution of shear stress, fluid pressure, rate, and average fault slip and slip rate observed on the smooth fault and rough fault #1, respectively. The experimental procedure is divided into three stages, as indicated by labels 1,2 and 3 , respectively. After the shear strength ( ) is achieved in stage 1 , shear stress is then reduced to about in stage 2 , followed by a six-stage fluid injection scheme in stage 3 . ( and ) Zoomed details on injection-induced fault slip, AE rate, etc., during the fourth fluid injection stage for smooth and rough faults, respectively. In response to fluid pressurization, the smooth fault undergoes three different phases with time, as indicated by shaded areas with labels I, II, and III. In contrast, two phases are observed on the rough fault. (E) Compiled slip displacements and associated shear stress drops during injection-induced slip events in smooth and rough faults. The linear regressions to the data, as shown by the gray dashed lines, correspond to slip-weakening rates (unloading stiffnesses) of smooth and rough faults. (F) Compiled peak slip velocities of induced slip events during six fluid injection stages as a function of stress drops in the smooth and rough faults.
geometrical roughness introduces an additional shear resistance to continuous slip, consistent with results from theoretical and numerical models . In stage 2 , we adjust the shear stress to about for the saw-cut fault and rough fault #1 (Fig. 2 and ) and to about for rough fault #2 (SI Appendix, Fig. S4A), respectively. Initial effective normal and shear stresses are 50.1 MPa and 34.0 MPa for the saw-cut fault, 53.0 MPa and 39.5 MPa for rough fault #1, and 49.6 MPa and 33.5 MPa for rough fault #2, respectively. We then keep the axial piston position fixed to ensure a zero-displacement condition on the two extremities of the sample and then start fluid injection. We follow a six-stage fluid injection scheme where fluid pressure is increased in a stepwise manner from 5 MPa to 29 MPa with a pressurization rate of . During each fluid injection stage, fluid pressure increment of 4 MPa is achieved within 2 min , followed by a plateau phase lasting for 8 min .
Due to the high sample permeability , fluid pressure rapidly equilibrates on the order of milliseconds within the whole sample volume . With the onset of fluid injection, slip along smooth and rough faults initiates with a delay that progressively decreases with subsequent injection cycles (stage 3 in Fig. and and Movies S1 and S2). The smooth fault displays episodic slow stick-slip events during injection with a peak slip velocity increasing to about , accompanied by increasing stress drops and rapid AE bursts with a peak rate up to 150 events per second (Fig. 2A). In stark contrast, at similar conditions and fluid pressurization rates induced slip events along the rough faults reach lower peak slip velocities of about (Fig. 2C). Here, peak AE rates and subsequent decay rates with time are lower for rough surfaces, but stress drops increase with consecutive slip events. Our experiments highlight that fault roughness promotes the stability of injectioninduced fault slip.
The strong dependence of the evolving injection-induced fault slip rate on geometrical roughness is shown in detail in the zoomed fourth fluid injection stage (Fig. and ). After fluid pressurization is started, the smooth fault first remains locked for about 73 s (phase I in Fig. 2B). Then, fault slip initiates and rapidly accelerates to peak slip rate, which then decreases to a residual value of about in about 28 s (phase II in Fig. 2B), followed by a long-lasting relaxation phase with minor oscillations in slip velocity and in AE rate upon the termination of fluid injection (phase III in Fig. 2B). The evolving slip rate is closely correlated with the AE rate.
Compared to the smooth fault, the rough faults first undergo a shorter delay of 40 to 50 s after fluid injection starts (phase I in Fig. 2D and SI Appendix, Fig. S4B). Peak slip velocity and acceleration are smaller with a prolonged relaxation phase (phase II in Fig. 2D and SI Appendix, Fig. S4B). Despite the minor difference in initial stress levels between the two rough faults, the results from these two samples are similar.
To compare the difference in slip dynamics between smooth and rough faults, we compile slip displacement, peak slip velocity, and associated stress drop during injection-induced slip events. The slope of average shear stress drops with average slip displacements associated with slip events determines the average fault slip-weakening rate (unloading stiffness) (Fig. ), that is for the smooth fault and for the rough faults. Peak slip velocities of injection-induced slip events increase with stress drop for both smooth and rough faults but are very different depending on fault roughness (Fig. ).
Characteristics of Injection-Induced Acoustic Emissions. A set of 16 piezoelectric transducers surrounding the sample allow us to monitor and locate AE events associated with injection-induced
fault slip (SI Appendix, section 3). Spatial characteristics and statistical attributes of AEs provide fundamental insights into the role of varying surface roughness on fluid-induced seismicity.
We have located a total number of , and 6,390 AEs during fluid injection for smooth fault, rough fault #1, and rough fault #2, respectively. The three-dimensional spatial distribution of AE hypocenters varies significantly with surface roughness. For the smooth saw-cut fault, injection-induced slip events generate an AE hypocenter distribution that is forming a narrow band surrounding the fault plane with a half-width normal to the fault surface of about 2 mm (i.e., similar to location accuracy of AE hypocenters) (SI Appendix, Fig. S6). For the rough faults, the AEs form a zone of about 10 mm width normal to the fault due to fault topography and wall rock damage (SI Appendix, Fig. S7). In two-dimensional map view with all AE hypocenters projected onto the fault, AEs are homogeneously distributed across the smooth fault (Fig. 3A). In contrast, fluid injection into the rough faults results in AE events forming distinct local clusters (Fig. 3D). Spatial distribution of clustered AEs on rough faults is characterized by a fractal dimension of about 1.4 compared to a more planar AE distribution with a -value on the smooth fault (SI Appendix, section 5 and Fig. S8). The intense clustering of induced AEs is closely correlated with the local gradient of surface topography along slip direction (Fig. 3D), mapping the spatial distribution of highly stressed asperities on the rough fault. In general, a larger positive gradient of surface topography corresponds to the local shear and normal stress concentrations at restraining bends (12, 16, 17), promoting the occurrence of large-magnitude events .
The frequency-magnitude distribution of induced AEs and resulting -value have been impacted by fault surface topography (see SI Appendix, section 6 for -value calculation). We have registered more total AE events with larger AE magnitudes on the two rough faults and the calculated -values for AEs are slightly lower compared to the smooth fault (SI Appendix, Fig. S9). Changes in -values are assumed to reflect local stress states and geometry of the fracture network (23, 24, 61). For the rough faults, the presence of highly stressed asperities and substantial off-fault damage may contribute to higher AE productivity and a larger fraction of high-magnitude AE events. To identify fault heterogeneity, we additionally provide the spatial distribution of AE seismic moment release (SI Appendix, section 7) and associated -value maps (Fig. , and ). Substantial seismic moment release of AEs is produced in the vicinity of high-stress patches during induced slip events, accompanied by lower -values (Fig. and SI Appendix, Fig. S10). This result suggests that the spatial variation of -values is closely coupled to local stress conditions over the fault surface and may assist in mapping seismogenic fault segments for induced seismicity and natural earthquakes (62).
Fault roughness also affects off-fault damage, as observed by postmortem microstructures (SI Appendix, section 10). For the initial smooth fault surface, cumulative slip results in a thin layer (half-width , about 1 to 2 original grain diameters) of fine-grained gouge that is relatively uniform across the principal slip surface (SI Appendix, Fig. S11 and ). Significant fragmentation and comminution of quartz grains adjacent to the fault surface result in high-frequency wave radiation, as evidenced by a homogeneous distribution of AE activity recorded across the smooth fault. Shear deformation is distributed and mainly accommodated by grain fragmentation and shear-induced rotation. In contrast, off-fault damage surrounding the rough fault surface consists of gouge layers, which are thicker (half-width ) compared to the smooth fault but varies along the fault (SI Appendix, Fig. S11C). Intense cataclastic deformation prevails

at restraining bends, also displaying a dense distribution of AE events (Fig. 3D). The formation of multiple discrete shear planes accommodating local slips is more pronounced for rough faults (SI Appendix, Fig. S11D). The observed off-fault crack damage corresponds with the AE density distribution decreasing with distance from the fault surface (SI Appendix, Fig. S12). Progressive clustering of AEs induced by fluid injection is characterized by a peak in AE density distribution centered around the fault interface, and a rapid decay toward the adjacent wall-rock, consistent with previous laboratory studies of fracture propagation and stick-slip (23) and the documented natural seismicity across strike-slip faults in California (63).
To evaluate the AE source kinematics, we employ the average polarity of first P -wave amplitudes (64) and full moment tensor (FMT) inversion method (65) (SI Appendix, section 8). Based on either the average polarity (64) or the FMT decomposition results
(66, 67), AE source mechanism can be categorized into a shear, compaction or tensile type. The average polarity analysis shows a good agreement with the FMT solution results, indicating domination of shear- and compaction-type events (Fig. and and SI Appendix, Fig. S13). For the smooth fault, the source mechanisms of induced AEs are dominated by shear-type (double-couple) events, accounting for 65 to of all AEs compared to about 30 to for the rough faults (Fig. 4C). In rough faults, we find a relative increase of non-double-couple source types with respect to the shear events, confirming that fault roughness affects kinematics of injection-induced seismicity, similar to what has been reported in an earlier study without fluid injection (68).
Numerical Simulation of Injection-Induced Fault Slip and Slip Rate. To further investigate roughness effects on injection-induced slip and slip rate distributions, we employ a numerical model.
Fig. 4. Source mechanisms of all induced AEs derived from the average polarity method and full moment tensor inversion method. ( and ) Hudson equalarea diagram showing the AE source mechanisms for the smooth and rough fault #1, respectively. In the Hudson diagram, DC denotes double couple, CLVD denotes compensated linear vector dipole, and LVD is linear vector dipole (see ref. 66 for details). The volumetric and nonvolumetric (shear) source kinematics are separated by the dashed red lines (67). The AE source kinematics are also color-coded by average polarity coefficient with values of 1.0 and -1.0 corresponding to pure compaction-type and tensile-type events, respectively. (C) AE source type fractions for all induced AE events on smooth and rough faults. AE source mechanisms may be separated into tensile, shear, and compaction types, based on either the average polarity or the full moment tensor solution.
We couple a one-dimensional Burridge-Knopoff model with a heterogeneously loaded fault interface and the rate-and-state friction law with a fluid pressure diffusion process (see Materials and Methods for model formulation). We use a total number of equally spaced 100 slider blocks with a grid spacing of 1 mm (i.e., the block size) to simulate injection-induced slip along the 100 mm long laboratory faults. Considering the homogeneous and isotropic rock materials used in the experiments, we assume spatially uniform frictional properties but account for stress heterogeneity arising from fault roughness. We first estimate the two-dimensional static stress distribution produced by frictional slip along a wavy fault in elastic media using an analytical model (7). For rough fault #1, high normal, shear, and differential stresses generally concentrate around restraining bends (SI Appendix, section 11 and Fig. S15), in agreement with the observed abundant AEs. In contrast to highly homogeneous stresses prevailing along the smooth fault, the initially heterogeneous normal and shear stresses along rough fault #1 before fluid injection are then imported into the model for simulating subsequent injection-induced fault slip behavior (SI Appendix, Fig. S16). We employ the experimentally observed slip onsets and the magnitudes of measured average slip velocities induced by fluid injection to benchmark our numerical models.
We use the experimentally measured rate-and-state frictional parameters of and for the smooth (saw-cut)
fault in Bentheim sandstone (SI Appendix, section 11). Modeled slip onsets, peak slip velocities, and subsequent small oscillations in slip rates along smooth faults are in good agreement with the experimental data (Fig. 5A). Homogeneous normal and shear stresses and fluid pressure increments distributed across the smooth fault result in spatially uniform slip and slip rates, as documented by the distribution of located AEs (Fig. 5B).
Assuming that the characteristic slip distance in the rate-and-state friction formulation scales with surface roughness and shear band thickness , we increase from for the smooth fault to for the rough fault while the other friction constitutive parameters ( and ) remain unchanged (SI Appendix, section 11). We obtain a good agreement between modeled and observed average slip velocities measured on the rough fault. In contrast to the smooth fault, the induced slip and slip rate distributions on the rough fault show high spatial variability (Fig. and . Although our numerical model assumes a chain of undeformed but interconnected blocks and does not account for the strain field, the observed spatial variability in slip and slip rate implicitly reflects a heterogeneous strain distribution, consistent with the differently evolving strain fields monitored by local strain gauges mounted close to the fault interface (SI Appendix, Fig. S18). Ruptures initiate almost simultaneously at two fault segments favorably oriented for slip (i.e., the low-stress regions with large
Fig. 5. Numerical simulations showing temporal evolution of injection-induced average and local fault slip velocities along fault dip for the smooth and rough faults. ( and ) Comparisons of evolving average slip velocities from experimental measurements and numerical simulations during fluid injection into the smooth and rough faults, respectively. ( and ) Temporal distributions of induced local slip from numerical modeling during the selected fluid injection stage (the fourth injection stage) for the smooth and rough faults, respectively. Note that the color scale for local slip velocity differs in ( ) and ( ). In addition, we map the spatiotemporal distribution of AEs recorded during the corresponding experiment into and , respectively. Because we use a one-dimensional numerical model and assume induced fault slip along fault dip (the major axis of the fault ellipse), we present the experimentally recorded AEs with hypocenters very close to it (radial distance within 5 mm ), as indicated by the white solid circles with sizes proportional to AE magnitudes. ( ) The surface profile of the interface separating the lower and upper blocks for rough fault #1. The gray arrow shows the slip direction of the lower rock block relative to its counterpart along fault up-dip.
negative slopes of surface topography along slip direction, see Fig. and ). The low frictional resistances at these fault segments facilitate sliding initiation and impose no major hindrance to slip transfer over the fault surface. Rupture fronts then propagate toward the fault center at a rate of about 0.5 to . The area with high local stresses in the proximity of the fault center (highly stressed asperities) starts to slip at a later time, but it has
a high local slip rate, accompanied by a sharp localized burst in AE activity (Fig. 5D). This result agrees with spatial distribution of injection-induced AE activity around high-stress asperities where induced seismic moment release of AEs is high but the associated -value is low (Fig. and ). After each fluid injection stage, we find a relatively uniform distribution of cumulative slip across the entire rough fault (SI Appendix, Fig. S17).

Discussion

Fault roughness and stress heterogeneity affect earthquake nucleation and propagation and cause complex ruptures, stress drops, slip rate distributions, and off-fault damage zones, as observed in a plethora of studies of tectonic earthquakes and rupture models (8, 16-20). Here, we combine experimental and numerical approaches to demonstrate how fault roughness controls slow stick-slip events induced by fluid injection. In particular, we show that increasing fault roughness stabilizes induced slow stick-slip events. The peak slip velocities of injection-induced slip events and the associated slip-weakening rates are larger for smooth faults, in agreement with earlier friction tests on dry samples (25,26,28) and recent numerical modeling results (14, 19).
Following the fault slip-weakening model in the spring-slider system (31), slip acceleration and unstable failure are expected to occur for the fault slip-weakening rate being larger than the stress release rate of the loading system, i.e., the fault stiffness larger than the stiffness of the loading system, otherwise stable slip is expected. The shear stiffness of our loading system ( ) is about mm (SI Appendix, section 11), resulting in and (Fig. ), respectively. These stiffness ratios are in agreement with the observed macroscopic slow stick-slip on the smooth fault but stable slip on the rough faults. Assuming that the slip patch grows as an expanding crack, the critical nucleation length for slip instability is inversely proportional to the stiffness of the fault patch . Nucleation length increasing with fault roughness has been previously reported from laboratory experiments and numerical simulations (12), consistent with our observation.
Friction experiments on dry laboratory faults have shown that roughness significantly influences fault friction constitutive parameters (29-31). In addition to the critical slip-weakening displacement increasing with fault roughness , the characteristic slip displacement required to change the population of contacts in the rate-and-state friction formulation was also experimentally found to be proportional to surface roughness . This agrees with our numerical modeling results that require an increase of for rough faults to correctly model slip onsets and slip velocities as observed in the experiments. A large or is expected to result in larger fracture energies for rough faults (25, 70), limiting acceleration of fault slip during rupture propagation (21). The propagating rupture front is expected to slow down when encountering a region of higher normal stress and shear strength (71), resulting in a lower average slip velocity compared to smooth faults. Once the stored elastic energy is exhausted, the rupture will arrest.
The controlled initial stress levels prior to fluid injection are roughly similar for smooth and rough faults, indicating that stored elastic energy prior to slip is similar for smooth and rough faults. Irrespective of the shear stress level decreasing with slip during fluid injection, induced fault slip and stress drop increase with progressive injection cycles. However, slip velocity and associated AE rates remain similar. This is in contrast to previous injection experiments performed on saw-cut faults in almost impermeable granite samples, where stress drops decrease with progressive fluid injection . We attribute the increasing slip and stress drop to changing surface roughness in our sandstone samples with progressive slip and possibly different fault hydraulic properties. AE rates and slip rates are closely correlated for smooth and rough faults.
Our experiments performed on saw-cut and freshly fractured faults with significantly different roughness may represent two end-member fault structures, i.e., mature and immature faults, respectively . Similar to previously reported displacement-controlled stick-slip tests (23, 24, 68), our observations suggest that fault roughness affects
kinematics of AEs, with an increased fraction of non-double-couple components of AE moment tensors for the rougher faults. Natural earthquakes with non-double-couple mechanisms are commonly attributed to fault complexity (72). For nonplanar faults, the abundant development of intersecting fracture networks and potential damage-related changes of elastic properties in the source region may modify local stress fields and cause the slip vector to deviate from the principal fault surface (7, 24, 59). For the rough faults, we find that injection-induced AE activity localizes in the vicinity of high-stress asperities where substantial seismic moment is released, accompanied by low -values. The -value has been suggested to be inversely proportional to stress level and can serve to indicate high stress fault patches (62).
Injection-induced macroscopic fault slip rates in our laboratory experiments remain on the order of micrometers per second, comparable to the reported values of induced fault slip rates measured in a borehole during in situ fluid injection into a natural fault (37). In our experiments, the total seismic moment released by highfrequency AE sources only accounts for a very small part (<0.01%) of total deformation (geodetic) moment release during fluid injection (SI Appendix, Fig. S20), consistent with the values reported from in situ fluid injection experiments at different geological settings . Such a low ratio indicates that injection-induced fault deformation in our experiments is dominantly aseismic. The estimated source radii of AEs span from 0.1 to 2.6 mm (SI Appendix, section 7), far smaller than the macroscopic fault size. In this sense, our laboratory AE sources associated with induced fault slip may be more representative of injection-induced confined ruptures occurring within limited zones of distributed fractures in nature. To further link our laboratory observations to fluid-induced seismicity in the field, we have compiled a wide range of datasets of radiated seismic energy as a function of hydraulic energy from laboratory-scale and in situ fluid injection experiments, as well as reservoir-scale fracturing, geothermal and disposal projects across the world (Fig. 6). The ratio of seismic energy to hydraulic energy is termed seismic injection efficiency (74). The seismic injection efficiencies in our experiments range between and , in agreement with the reported laboratory hydraulic fracturing experiments (75), in situ fluid injection experiments and some field-scale induced earthquakes (74, 77). The values of seismic injection efficiency for field-scale earthquakes associated with fluid injection vary over nine orders of magnitude from to 1 , and even above 1 . For example, the large seismic injection efficiency up to 1.8 for the 5.5 Pohang earthquake indicates that more energy was radiated seismically than hydraulically injected, suggesting a runaway rupture beyond the region perturbed by injection (42, 77). These large seismic events with high seismic injection efficiency are attributed to substantial release of tectonic strain energy by activation of runaway ruptures, where rupture size may be only limited by the size of tectonic faults ( ). In contrast, induced seismicity showing an extended pressure-controlled rupture in a self-arrested manner typically shows a low seismic injection efficiency . Thus, our laboratory observations bear similarities with those field-scale induced earthquakes corresponding to pressure-controlled ruptures, as reflected by the fact that in our experiments the induced fault slip terminates shortly after we stop fluid injection (Fig. 2).
To summarize our experimental observations and modeling results, we propose a conceptual model of injection-induced fault reactivation (Fig. 7). We assume uniform fault friction in space but an initially heterogeneous distribution of normal and shear stresses depending on fault surface topography (Fig. 7A). With increasing fluid pressure slow aseismic creep, possibly with few seismic events, will commence at favorably oriented and weak fault segments once local strength is exceeded (Fig. 7B). As fluid pressure progressively increases, the creeping patches are expected to expand and load
Fig. 6. The relation between cumulative seismic energy and cumulative hydraulic energy across a wide range of length scales. For the laboratory experiments, the seismic energy is determined from the radiated AEs in the present study and in the hydraulic fracturing experiments by Goodfellow et al. (75). In situ fluid injection experiments performed at the Underground Laboratory of Tournemire (France) and at the Underground Laboratory of Rustrel (France) are from ref. 73, while the in situ hydraulic fracturing experiments performed at the Underground Äspö Hard Rock Laboratory (Sweden) are from ref. 76. The datasets for reservoir-scale seismicity associated with fluid injection are compiled from refs. 74, 75, and 77. Reference gray lines correspond to the seismic injection efficiency (the ratio of seismic energy to hydraulic energy) in percentages.
high-strength asperities nearby. Fluid-induced aseismic creep leading to seismic slip has been described also for in situ injection experiments (37) and reservoir-scale hydraulic fracturing-induced seismicity (78). Once the failure strength of the asperities is exceeded, clustered and increasing seismic activity containing progressively larger events will occur (Fig. 7C). This may initiate large events,
produce high local stress drops and slip rates, large seismic moment release and low -values, as observed in our experiments. Previous studies have revealed the important effects of heterogeneous fault frictional properties (36) and the interplay between permeability change and ongoing fault slip during fluid injection, which are expected to be minimized in our experiments due to the usage
Fig. 7. Schematic illustration of fluid-induced seismicity on a spatially heterogeneous fault with permeable structures. (A) Prior to fluid overpressure, the initial state of a heterogeneous fault shows a spatial variation in initial stress and strength. We assume relatively uniform initial and peak friction coefficients (denoted by and , respectively) in space, but initial normal stress shows a significantly heterogeneous distribution. This scenario results in spatially heterogeneous shear stress and shear strength before fluid pressure perturbations. Here, asperities are defined as local patches with high initial stress and strength. (B) After a relatively homogeneous fluid overpressure is imposed, the apparent friction coefficient of fault segments starts to increase at different rates, depending on the initial normal stress distribution. Injection-induced aseismic slip first occurs on the weak patches with low local strength, and then, the slow creeping zone continues to expand with progressive fluid pressurization and increases shear stress at propagating creep fronts. (C) Large failure events and seismic slip ultimately take place around the asperities due to stress transfer from aseismic slip. Induced seismicity is expected to occur around these highly stressed patches, accompanied by high local stress drops and slip rates, large seismic moment release, and low Gutenberg-Richter -values. The figures in the bottom row correspond to one-dimensional profiles along fault distance at different stages.
of rock materials being isotropic, homogeneous, and permeable. We highlight that fault roughness may modulate the aseismic-seismic slip transition for permeable fault structures subjected to increased fluid pressures. The reservoir structures dominated by rough and segmented faults and fractures are expected to host nucleation processes that happen at larger length and time scales during fluid injection, possibly captured by geodetic and broad-band seismological instruments. Our findings imply that when monitoring fluid injections in geological reservoirs is done in real time (41), this may allow identifying localization processes of induced microseismicity prior to future larger induced events. Feeding this information into the next-generation traffic-light systems might allow providing additional constraints for stopping injection before larger induced seismic events occur around the highly stressed fault patches.

Materials and Methods

Experimental Setup. We conducted fluid injection experiments on three cylindrical samples of homogeneous, isotropic, and permeable Bentheim sandstone at crustal pressure conditions using a servo-hydraulic MTS apparatus (stiffness of ) equipped with an AE recording system and a pore pressure system (two Quizix 6000 pumps at downstream and upstream, respectively). One sample contained a saw-cut(smooth) fault, and two samples were cut by fractured rough faults (hereafter named rough fault #1 and rough fault #2, respectively). The rms height ( ) of saw-cut fault surface was measured to be about 0.044 mm , whereas the values of were increased to about 1.50 mm and 0.82 mm for rough fault #1 and rough fault #2, respectively (SI Appendix, section 1). The three faults were all oriented at to the cylinder axis (Fig. 1A). To measure deformation and record seismic activity, eight local strain gauges and 16 piezoelectric transducers (PZTs) were mounted to the sample surface before experiments (SI Appendix, sections 2 and 3 and Fig. S1). The samples were first hydrostatically loaded up to 35 MPa ( ) while the fluid pressure (p) was kept constant at 5 MPa . Next, we increased the axial stress at a constant axial displacement rate of to achieve the peak shear strength resolved on the fault interface. We then reduced axial stress slowly until the calculated shear stress along the fault interface equaled about for the smooth fault and rough fault #1 and for rough fault #2, respectively. This guaranteed that the laboratory faults were near the critical stress state before fluid injection. Note that because of the sample geometry, increasing the axial stress results in an increase in both shear and normal stresses. The position of the axial hydraulic cylinder was then kept constant, and eventually, we injected distilled water into the samples from the bottom end to induce fault slip at undrained conditions. The fluid pressure was increased in a stepwise manner from 5 MPa to 29 MPa with a pressurization rate of . We divided the whole fluid injection process into six stages, and each stage had a duration of 10 min composed of a ramp phase lasting for 2 min (to fulfill 4 MPa fluid increment) and a subsequent plateau phase for 8 min .
Processing of Hydraulic, Mechanical, and Acoustic Emission Data. The details of stress and slip measurements are given in SI Appendix, section 4. The details of acoustic emission (AE) data processing including the spatial distribution, frequency-magnitude characteristics, and source mechanisms are provided in SIAppendix, sections 5-8. The calculation details of hydraulic energy and seismic energy are available in SI Appendix, section 9.
Numerical Model. To reproduce the observed injection-induced fault slip on the smooth and rough faults, we extend the one-dimensional (1D) Burridge-Knopoff model (79) for heterogeneously loaded interfaces obeying the rate-and-state friction law by encompassing the fluid pressure diffusion process.
The 1D Burridge-Knopoff model consists of an array of identical blocks that are interconnected by elastic springs with stiffness coefficient and are elastically driven (with spring stiffness coefficient ) by a rigid plate moving at a constant velocity (analogous to far-field tectonic motions) (SI Appendix, Fig. S14). This model has been previously used to investigate frictional slip along a rough surface (79). To simulate effects of fluid pressure, we account for a local fluid pressure distribution acting on the chain of blocks in addition to varying
normal stresses. For each block, the frictional slip is governed by an empirical rate-and-state friction law , that is, its friction coefficient varies with the instantaneous slip rate and the state variable (the subscript means the block index), as expressed by:
where indicates the reference friction coefficient at a steady-state reference sliding velocity , and represents the characteristic slip distance over which friction evolves to a new steady state after a velocity perturbation, and are frictional parameters that describe the friction response to a sudden step jump of the imposed velocity for a single spring-block configuration. The sign of defines the change of the steady-state friction coefficient with velocity in which means velocity-strengthening and velocity-weakening corresponds to . We constrain the evolution of state variable with time using the slip law because it provides a better match to laboratory data (80), as given by:
To mimic our experimental configuration, we assume that fluid overpressure is imposed at a remote injection port with a given time-varying injection pressure . Fluid pressure diffusion through rock matrix with hydraulic diffusivity ctoward the fault zone modifies the effective stress states for fault segments and thus may cause fault reactivation.
Assuming the membrane diffusion process (fluid pressure evolution within the fault zone depends linearly on the fluid pressure difference between the fault zone and the remote fluid pressure) that is typically suitable for laboratory experiment scenarios (81), evolving fluid pressure within the fault zone can be constrained by:
where indicates the fluid pressure acting on the th block within the fault zone, refers to the pore pressure at the remote injection port, and is given by with being a characteristic diffusion length between the remote injection port and the th block and being the hydraulic diffusivity. Considering the high permeability of the rock matrix adopted in our experiments, the effect of shear-induced dilation/compaction on the modification of fluid pressure within the fault zone and on fault slip can be negligible.
For a chain of spring-connected blocks driven by a moving plate and subjected to normal stress and fluid pressure, the equation of motion for the ith block’s position in the quasi-dynamic sense (i.e., the inertial effect is replaced by a radiation damping term) is given by Rice (69)
where and are the normal stress and fluid pressure applied to the th block, is the spring constant connecting each block to a moving plate with a constant velocity is the spring stiffness coupling the neighboring blocks, is the position of the th block with respect to its initial starting position, is the slip velocity of ith block ( ), and describes radiation damping, constrained by in which is the shear modulus of the rock and is shear wave velocity (69). For a given number of blocks subjected to heterogeneous normal stress distributions, combining Eqs. 1-4 and solving them jointly with the Runge-Kutta method can simulate the injection-induced fault slip on a rough surface in response to a given injection pressure perturbation.
We use the equally spaced 100 blocks with a grid spacing of 1 mm (i.e., the block size) to capture the behavior of the -long laboratory faults along the dip direction. The input parameters are given in SIAppendix, section 11 and Table S1.
Data, Materials, and Software Availability. The experimental data are archived in Mendeley Data accessible at https://data.mendeley.com/datasets/ xcyvspjk3c/1 (DOI: 10.17632/xcyvspjk3c.1) (82). All other data are included in the article and/or supporting information.
acknowledgments. We thank Stefan Gehrmann for assistance with sample preparation and thin sections. We are grateful to Valerian Schuster for thin-section microscopy observations. The manuscript benefited from the constructive discussions with Jay Fineberg, Thomas Goebel, and Nicolas Brantut. We thank two reviewers Paul Segall and Greg Hirth, and the Editor for insightful comments and suggestions that have greatly improved the present study. L.W. acknowledges in-house postdoc funding provided by Helmholtz Centre Potsdam, GFZ German Research Centre for Geosciences. G.D. acknowledges funding from BMBF project STIMTEC-X 03G0901C.
  1. A. Sagy, E. E. Brodsky, G. J. Axen, Evolution of fault-surface roughness with slip. Geology 35, 283-286 (2007).
  2. W. L. Power, T. E. Tullis, Euclidean and fractal models for the description of rock surface roughness. J. Geophys. Res. Solid Earth 96, 415-424 (1991).
  3. E. E. Brodsky, J. D. Kirkpatrick, T. Candela, Constraints from fault roughness on the scale-dependent strength of rocks. Geology 44, 19-22 (2016).
  4. F. Renard, T. Candela, E. Bouchaud, Constant dimensionality of fault roughness from the scale of micro-fractures to the scale of continents. Geophys. Res. Lett. 40, 83-87 (2013).
  5. T. Candela et al., Roughness of fault surfaces over nine decades of length scales. J. Geophys. Res. Solid Earth 117, B08409 (2012).
  6. J. H. Dieterich, B. D. Kilgore, Direct observation of frictional contacts: New insights for state-dependent properties. Pure Appl. Geophys. 143, 283-302 (1994).
  7. F. M. Chester, J. S. Chester, Stress and deformation along wavy frictional faults. J. Geophys. Res. Solid Earth 105, 23421-23430 (2000).
  8. J. H. Dieterich, D. E. Smith, Nonplanar faults: Mechanics of slip and off-fault damage. Pure Appl. Geophys. 166, 1799-1815 (2009).
  9. S. R. Brown, C. H. Scholz, Closure of random elastic surfaces in contact. J. Geophys. Res. Solid Earth 90, 5531-5545 (1985).
  10. Z. Fang, E. M. Dunham, Additional shear resistance from fault roughness and stress levels on geometrically complex faults. J. Geophys. Res. Solid Earth 118, 3642-3654 (2013).
  11. N. Yoshioka, C. H. Scholz, Elastic properties of contacting surfaces under normal and shear loads: 1. Theory. J. Geophys. Res. Solid Earth 94, 17681-17690 (1989).
  12. Y. Tal, B. H. Hager, J. P. Ampuero, The effects of fault roughness on the earthquake nucleation process. J. Geophys. Res. Solid Earth 123, 437-456 (2018).
  13. S. W. Ozawa, T. Hatano, N. Kame, Longer migration and spontaneous decay of aseismic slip pulse caused by fault roughness. Geophys. Res. Lett. 46, 636-643 (2019).
  14. C. Cattania, P. Segall, Precursory slow slip and foreshocks on rough faults. J. Geophys. Res. Solid Earth 126, e2020JB020430 (2021).
  15. S. Ozawa, R. Ando, Mainshock and aftershock sequence simulation in geometrically complex fault zones. J. Geophys. Res. Solid Earth 126, e2020JB020865 (2021).
  16. A. A. Allam, K. A. Kroll, C. W. D. Milliner, K. B. Richards-Dinger, Effects of fault roughness on coseismic slip and earthquake locations. J. Geophys. Res. Solid Earth 124, 11336-11349 (2019).
  17. Z. Shi, S. M. Day, Rupture dynamics and ground motion from 3-D rough-fault simulations. J. Geophys. Res. Solid Earth 118, 1122-1141 (2013).
  18. O. Zielke, M. Galis, P. M. Mai, Fault roughness and strength heterogeneity control earthquake size and stress drop. Geophys. Res. Lett. 44, 777-783 (2017).
  19. Y.Tal, B.H. Hager, The slip behavior and source parameters for spontaneous slip events on rough faults subjected to slow tectonic loading. J. Geophys. Res. Solid Earth 123, 1810-1823 (2018).
  20. E. M. Dunham, D. Belanger, L. Cong, J. E. Kozdon, Earthquake ruptures with strongly rate-weakening friction and off-fault plasticity, part 2: Nonplanar faults. Bull. Seismol. Soc. Am. 101, 2308-2322 (2011).
  21. A. Gounon, S. Latour, J. Letort, S. El Arem, Rupture nucleation on a periodically heterogeneous interface. Geophys. Res. Lett. 49, e2021GL096816 (2022).
  22. F. Yamashita et al., Rupture preparation process controlled by surface roughness on meter-scale laboratory fault. Tectonophysics 733, 193-208 (2018).
  23. G. Dresen, G. Kwiatek, T. Goebel, Y. Ben-Zion, Seismic and aseismic preparatory processes before large stick-slip failure. Pure Appl. Geophys. 177, 5741-5760 (2020).
  24. T. H. W. Goebel, G. Kwiatek, T. W. Becker, E. E. Brodsky, G. Dresen, What allows seismic events to grow big?: Insights from b-value and fault roughness analysis in laboratory stick-slip experiments. Geology 45, 815-818 (2017).
  25. P. G. Okubo, J. H. Dieterich, Effects of physical fault properties on frictional instabilities produced on simulated faults. J. Geophys. Res. Solid Earth 89, 5817-5827 (1984).
  26. M. Ohnaka, L. Shen, Scaling of the shear rupture process from nucleation to dynamic propagation: Implications of geometric irregularity of the rupturing surfaces. J. Geophys. Res. Solid Earth 104, 817-844 (1999).
  27. S. Guérin-Marthe et al., Preparatory slip in laboratory faults: Effects of roughness and load point velocity. J. Geophys. Res. Solid Earth 128, e2022JB025511 (2023).
  28. S. Xu et al., Fault strength and rupture process controlled by fault surface topography. Nat. Geosci. 16, 94-100 (2023).
  29. C. W. A. Harbord, S. B. Nielsen, N. De Paola, R. E. Holdsworth, Earthquake nucleation on rough faults. Geology 45, 931-934 (2017).
  30. A. M. Eijsink, J. D. Kirkpatrick, F. Renard, M. J. Ikari, Fault surface morphology as an indicator for earthquake nucleation potential. Geology 50, 1356-1360 (2022).
  31. J. H. Dieterich, Modeling of rock friction: 1. Experimental results and constitutive equations. J. Geophys. Res. Solid Earth 84, 2161-2168 (1979).
  32. C. Marone, Laboratory-derived friction laws and their application to seismic faulting. Annu. Rev. Earth Planet. Sci. 26, 643-696 (1998).
  33. F. Yamashita et al., Two end-member earthquake preparations illuminated by foreshock activity on a meter-scale laboratory fault. Nat. Commun. 12, 1-11 (2021).
  34. W. L. Ellsworth, Injection-induced earthquakes. Science (80-) 341, 1225942 (2013).
  35. R. Schultz et al., Hydraulic fracturing-induced seismicity. Rev. Geophys. 58, e2019RG000695 (2020).
  36. F. Cappa, M. M. Scuderi, C. Collettini, Y. Guglielmi, J.-P. Avouac, Stabilization of fault slip by fluid injection in the laboratory and in situ. Sci. Adv. 5, eaau4065 (2019).
Author affiliations: Helmholtz Centre Potsdam, GFZ German Research Centre for Geosciences, Geomechanics and Scientific Drilling, Potsdam 14473, Germany; The Njord Centre, Department of Geosciences, University of Oslo, Oslo 0316, Norway; The Njord Centre, Department of Physics, University of Oslo, Oslo 0316, Norway; ISTerre, Université Grenoble Alpes, Grenoble INP, Université Savoie Mont Blanc, CNRS, IRD, Université Gustave Eiffel, Grenoble 38000, France; elaboratory of Experimental Rock Mechanics, Civil Engineering Institute, École Polytechnique Fédérale de Lausanne, Lausanne 1015, Switzerland; Department of Earth Sciences, Free University Berlin, Berlin 12249, Germany; and Institute of Earth and Environmental Science, University of Potsdam, Potsdam 14469, Germany
37. Y. Guglielmi, F. Cappa, J.-P. Avouac, P. Henry, D. Elsworth, Seismicity triggered by fluid injection-induced aseismic slip. Science (80-) 348, 1224-1226 (2015).
38. M. Weingarten, S. Ge, J. W. Godt, B. A. Bekins, J. L. Rubinstein, High-rate injection is associated with the increase in U.S. mid-continent seismicity. Science (80-) 348, 1336-1340 (2015).
39. C. Langenbruch, M. D. Zoback, How will induced seismicity in Oklahoma respond to decreased saltwater injection rates? Sci. Adv. 2, e1601542 (2016).
40. J. H. Healy, W. W. Rubey, D.T. Griggs, C. B. Raleigh, The denver earthquakes. Science (80-) 161, 1301-1310 (1968).
41. G. Kwiatek et al., Controlling fluid-induced seismicity during a 6.1-km-deep geothermal stimulation in Finland. Sci. Adv. 5, eaav7224 (2019).
42. M. Galis, J. P. Ampuero, P. M. Mai, F. Cappa, Induced seismicity provides insight into why earthquake ruptures stop. Sci. Adv. 3, eaap7528 (2017).
43. A. McGarr, Maximum magnitude earthquakes induced by fluid injection. J. Geophys. Res. Solid Earth 119, 1008-1019 (2014).
44. S. A. Shapiro, O. S. Krüger, C. Dinske, C. Langenbruch, Magnitudes of induced earthquakes and geometric scales of fluid-stimulated rock volumes. Geophysics 76, WC55-WC63 (2011).
45. L. Wang et al., Laboratory study on fluid-induced fault slip behavior: The role of fluid pressurization rate. Geophys. Res. Lett. 47, e2019GL086627 (2020).
46. L. Wang, G. Kwiatek, E. Rybacki, M. Bohnhoff, G. Dresen, Injection-induced seismic moment release and laboratory fault slip: Implications for fluid-induced seismicity. Geophys. Res. Lett. 47, e2020GL089576 (2020).
47. F.X. Passelègue, N. Brantut, T. M. Mitchell, Fault reactivation by fluid injection: Controls from stress state and injection rate. Geophys. Res. Lett. 45, 12837-12846 (2018).
48. Y. Ji, L. Wang, H. Hofmann, G. Kwiatek, G. Dresen, High-rate fluid injection reduces the nucleation length of laboratory earthquakes on critically stressed faults in granite. Geophys. Res. Lett. 49, e2022GL100418 (2022).
49. D. I. Garagash, L. N. Germanovich, Nucleation and arrest of dynamic slip on a pressurized fault. J. Geophys. Res. Solid Earth 117, B10310 (2012).
50. S. B. L. Cebry, C. Y. Ke, G. C. McLaskey, The role of background stress state in fluid-induced aseismic slip and dynamic rupture on a 3-m laboratory fault. J. Geophys. Res. Solid Earth 127, e2022JB024371 (2022).
51. F.X. Passelègue et al., Initial effective stress controls the nature of earthquakes. Nat. Commun. 11, 5132 (2020).
52. F. Cappa, Y. Guglielmi, C. Nussbaum, L. De Barros, J. Birkholzer, Fluid migration in low-permeability faults driven by decoupling of fault slip and opening. Nat. Geosci. 15, 747-751 (2022).
53. K. A. Kroll, E. S. Cochran, Stress controls rupture extent and maximum magnitude of induced earthquakes. Geophys. Res. Lett. 48, e2020GL092148 (2021).
54. J. Maurer, E. M. Dunham, P. Segall, Role of fluid injection on earthquake size in dynamic rupture simulations on rough faults. Geophys. Res. Lett. 47, e2020GL088377 (2020).
55. Z. Ye, A. Ghassemi, Injection-induced shear slip and permeability enhancement in granite fractures. J. Geophys. Res. Solid Earth 123, 9009-9032 (2018).
56. Y. Ji, W. Wu, Injection-driven fracture instability in granite: Mechanism and implications. Tectonophysics 791, 228572 (2020).
57. B. Kc, E. Ghazanfari, Geothermal reservoir stimulation through hydro-shearing: An experimental study under conditions close to enhanced geothermal systems. Geothermics 96, 102200 (2021).
58. L. Wang, E. Rybacki, A. Bonnelye, M. Bohnhoff, G. Dresen, Experimental investigation on static and dynamic bulk moduli of dry and fluid-saturated porous sandstones. Rock Mech. Rock Eng. 54, 129-148 (2021).
59. P. Segall, D. D. Pollard, Mechanics of discontinuous faults. J. Geophys. Res. Solid Earth 85, 4337-4350 (1980).
60. R. H. Sibson, Stopping of earthquake ruptures at dilational fault jogs. Nature 316, 248-251 (1985).
61. C.H.Scholz, On the stress dependence of the earthquake b value. Geophys. Res. Lett. 42, 1399-1402 (2015).
62. S. Wiemer, M. Wyss, Mapping the frequency-magnitude distribution in asperities: An improved technique to calculate recurrence times? J. Geophys. Res. Solid Earth 102, 15115-15128 (1997).
63. P. M. Powers, T. H. Jordan, Distribution of seismicity across strike-slip faults in California. J. Geophys. Res. Solid Earth 115, 5305 (2010).
64. A. Zang et al., Source analysis of acoustic emissions in Aue granite cores under symmetric and asymmetric compressive loads. Geophys. J. Int. 135, 1113-1130 (1998).
65. G. Kwiatek, P. Martínez-Garzón, M. Bohnhoff, HybridMT: A MATLAB/Shell environment package for seismic moment tensor inversion and refinement. Seismol. Res. Lett. 87, 964-976 (2016).
66. J.A. Hudson, R. G. Pearce, R. M. Rogers, Source type plot for inversion of the moment tensor. J. Geophys. Res. Solid Earth 94, 765-774 (1989).
67. J. Davidsen et al., What controls the presence and characteristics of aftershocks in rock fracture in the lab? J. Geophys. Res. Solid Earth 126, e2021JB022539 (2021).
68. G. Kwiatek, T. H. W. Goebel, G. Dresen, Seismic moment tensor and value variations over successive seismic cycles in laboratory stick-slip experiments. Geophys. Res. Lett. 41, 5838-5846 (2014).
69. J. R. Rice, Spatio-temporal complexity of slip on a fault. J. Geophys. Res. Solid Earth 98, 9885-9907 (1993).
70. A. M. Rubin, J.-P. Ampuero, Earthquake nucleation on (aging) rate and state faults. J. Geophys. Res. Solid Earth 110, B11312 (2005).
71. K. Aki, Characterization of barriers on an earthquake fault. J. Geophys. Res. Solid Earth 84, 6140-6148 (1979).
72. C. Frohlich, Earthquakes with non-double-couple mechanisms. Science 264, 804-809 (1994).
73. L. De Barros, F. Cappa, Y. Guglielmi, L. Duboeuf, J. R. Grasso, Energy of injection-induced seismicity predicted from in-situ experiments. Sci. Rep. 9, 4999 (2019).
74. S. Maxwell, Unintentional seismicity induced by hydraulic fracturing. CSEG Rec. 38, 40-49 (2013).
75. S. D. Goodfellow, M. H. B. Nasseri, S. C. Maxwell, R. P. Young, Hydraulic fracture energy budget: Insights from the laboratory. Geophys. Res. Lett. 42, 3179-3187 (2015).
76. G. Kwiatek et al., Insights into complex subdecimeter fracturing processes occurring during a water injection experiment at depth in äspö hard rock laboratory, Sweden. J. Geophys. Res. Solid Earth 123, 6616-6635 (2018).
77. S. Bentz, G. Kwiatek, P. Martínez-Garzón, M. Bohnhoff, G. Dresen, Seismic moment evolution during hydraulic stimulations. Geophys. Res. Lett. 47, e2019GL086185 (2020).
78. T. S. Eyre et al., The role of aseismic slip in hydraulic fracturing-induced seismicity. Sci. Adv. 5, eaav7172 (2019).
79. R. Burridge, L. Knopoff, Model and theoretical seismicity. Bull. Seismol. Soc. Am. 57, 341-371 (1967).
80. P. Bhattacharya, A. M. Rubin, E. Bayart, H. M. Savage, C. Marone, Critical evaluation of state evolution laws in rate and state friction: Fitting large velocity steps in simulated fault gouge with time-, slip-, and stress-dependent constitutive laws. J. Geophys. Res. Solid Earth 120, 6365-6385 (2015).
81. P. Segall, J. R. Rice, Dilatancy, compaction, and slip instability of a fluid-infiltrated fault. J. Geophys. Res. Solid Earth 100, 22155-22171 (1995).
82. L. Wang, Supplementary Data for the study of ‘Fault roughness controls injection-induced seismicity’. Mendeley Data, V1. https://data.mendeley.com/datasets/xcyvspjk3c/1. Deposited 22 May 2023.

  1. Author contributions: L.W. and G.D. designed research; L.W. performed research; L.W., G.K., and M.B. contributed new reagents/analytic tools; L.W., G.K., F.R., S.G.-M., E.R., M.B., M.N., and G.D. analyzed data; and L.W. and G.D. wrote the paper.
    The authors declare no competing interest.
    This article is a PNAS Direct Submission.
    Copyright © 2024 the Author(s). Published by PNAS. This open access article is distributed under Creative Commons Attribution-NonCommercial-NoDerivatives License 4.0 (CC BY-NC-ND).
    To whom correspondence may be addressed. Email: wanglei@gfz-potsdam.de.
    This article contains supporting information online at https://www.pnas.org/lookup/suppl/doi:10.1073/pnas. 2310039121/-/DCSupplemental.
    Published January 12, 2024.