يمكن للميكروبات تحلل البلاستيك القابل للتحلل البيولوجي على اليابسة والأنهار والسواحل. ومع ذلك، فإنه من غير الواضح ما إذا كانت الميكروبات في أعماق البحار يمكن أن تحلل البلاستيك القابل للتحلل البيولوجي في الظروف البيئية القاسية لقاع البحر. هنا، نبلغ عن تحلل الميكروبات للبلاستيك القابل للتحلل البيولوجي الممثل (البولي هيدروكسي ألكانوات، والبلاستيكات القابلة للتحلل البيولوجي، واسترات السكريات المتعددة) في مواقع متنوعة لقاع البحر تتراوح أعماقها من 757 إلى 5552 مترًا. تم تقييم تحلل العينات من حيث فقدان الوزن، وتقليل سمك المادة، وتغيرات الشكل السطحي. لم يتحلل حمض البولي (اللاكتيد) في أي من المواقع الساحلية أو أعماق البحار، بينما تم تحلل البلاستيكات القابلة للتحلل البيولوجي الأخرى، والبولي هيدروكسي ألكانوات، واسترات السكريات المتعددة. تباطأ معدل التحلل مع عمق الماء. قمنا بتحليل المجتمعات الميكروبية المرتبطة بالبلاستيك من خلال تسلسل جين 16S rRNA وتحليل الميتاجينوم. حملت العديد من الكائنات الدقيقة السائدة جينات قد تشفر إنزيمات تحلل البلاستيك مثل الديبوليميرازات للبولي هيدروكسي ألكانوات والكاتينازات/البلاستيكات. أشار تحليل مجموعات البيانات الميتاجينومية المتاحة إلى أن هذه الكائنات الدقيقة موجودة في مواقع أخرى في أعماق البحار. تؤكد نتائجنا أن البلاستيكات القابلة للتحلل البيولوجي يمكن أن تتحلل بفعل الميكروبات في قاع البحر، على الرغم من كفاءتها أقل بكثير مقارنةً بالبيئات الساحلية.
يتم إنتاج 400 مليون طن من البلاستيك سنويًا في جميع أنحاء العالم ويستخدم في تطبيقات صناعية واستهلاكية متنوعة للحفاظ على راحة الحياة الحديثة. يجب جمع منتجات البلاستيك وإعادة تدويرها بعد الاستخدام؛ ومع ذلك، تم الإبلاغ عن أنمليون طن من نفايات البلاستيك تنتهي في البيئة البحرية عبر الأنهار كل عامبمجرد إطلاقها، يُفترض أن تبقى الحطام البلاستيكي في البيئة البحرية لمئات السنين أو أكثر بسبب تركيبتها الكيميائية المتينة والمقاومة للإنزيمات.تُحمل الحطام البلاستيكي بواسطة الأمواج والتيارات إلى الشاطئ أو سطح البحر.مع مرور الوقت، يغرق بعض الحطام البلاستيكي في أعماق البحر لأنه يصبح أثقل من مياه البحر بسبب التلوث البيولوجي أو تراكم حبيبات الرمل على سطح البلاستيك.مؤخراً، أفادت الدراسات أن قاع البحر العميق هو مصب رئيسي للقمامة البلاستيكية، وأن كميات كبيرة من القمامة البلاستيكية موجودة على قاع البحر العميق؛ نصف هذه الكميات هي بلاستيك للاستخدام الواحد..
تمثل البلاستيك القابل للتحلل البيولوجي إحدى الطرق للحد من انتشار نفايات البلاستيك في قاع البحر العميق. تم إنتاج حوالي 1.14 مليون طن من البلاستيك القابل للتحلل البيولوجي فيتمت دراسة قابليتها للتحلل البيولوجي باستخدام طرق اختبار المنظمة الدولية للتوحيد القياسي في ظروف هوائية ولاهوائية في السماد والتربة ومياه الأنهار.. في حالة التحلل الحيوي البحري، يتم استخدام اختبار التحلل الحيوي لطلب الأكسجين البيوكيميائي (BOD) باستخدام مياه البحرواختبار ميداني على الشاطئتُنفذ. ومع ذلك، فإن القليل معروف عن قدرة البكتيريا في أعماق البحار المجتمعات التي تعيش في ظروف بيئية قاسية من حيث درجة الحرارة والضغط لتفكيك أكثر أشكال الحطام البلاستيكي القابل للتحلل الحيوي شيوعًا على مدى زمني بيئي. بالإضافة إلى ذلك، لا يُفهم تمامًا ما إذا كانت البلاستيكات القابلة للتحلل الحيوي التي تم تطويرها حاليًا تتحلل في هذا البيئة القاسية، قاع البحر العميق، بنفس الطريقة التي تتحلل بها على الشاطئ، أو كم من الوقت يستغرق تحللها.
قمنا بمعالجة هذا العجز من خلال إجراء اختبارات تحلل حيوي قصيرة وطويلة الأجل في خمسة مواقع في قاع البحر في المحيط الهادئ: ثلاثة مواقع بحرية عميقة [قبالة ميناء ميساكي (BMS، عمق )، إيقاف
جزيرة هاتسوشيما (BHT، العمق ) ، وتل ميوجين (BMJ، العمق )], وموقعين عميقين [مرصد امتداد كورو شيو (AKR، عمق ) وجزيرة ميناميتورشيما (AMN، العمق )] (الشكل 1 أ، ب والجدول 1). في الوقت نفسه، تم إجراء تجربة تحكم في ميناء مقر JAMSTEC في يوكوسوكا (PJM، العمق ). الجدول 1 يوضح المواقع التي وضعت فيها العينات، معلومات خط العرض/خط الطول، العمق تحت مستوى سطح البحر، الملوحة، درجة الحرارة، الأكسجين المذاب، تاريخ التثبيت، تاريخ الاسترداد، واختصار يصف الموقع ومدة التثبيت. جميع العينات المستخدمة في هذه الدراسة (الأسماء الرسمية،
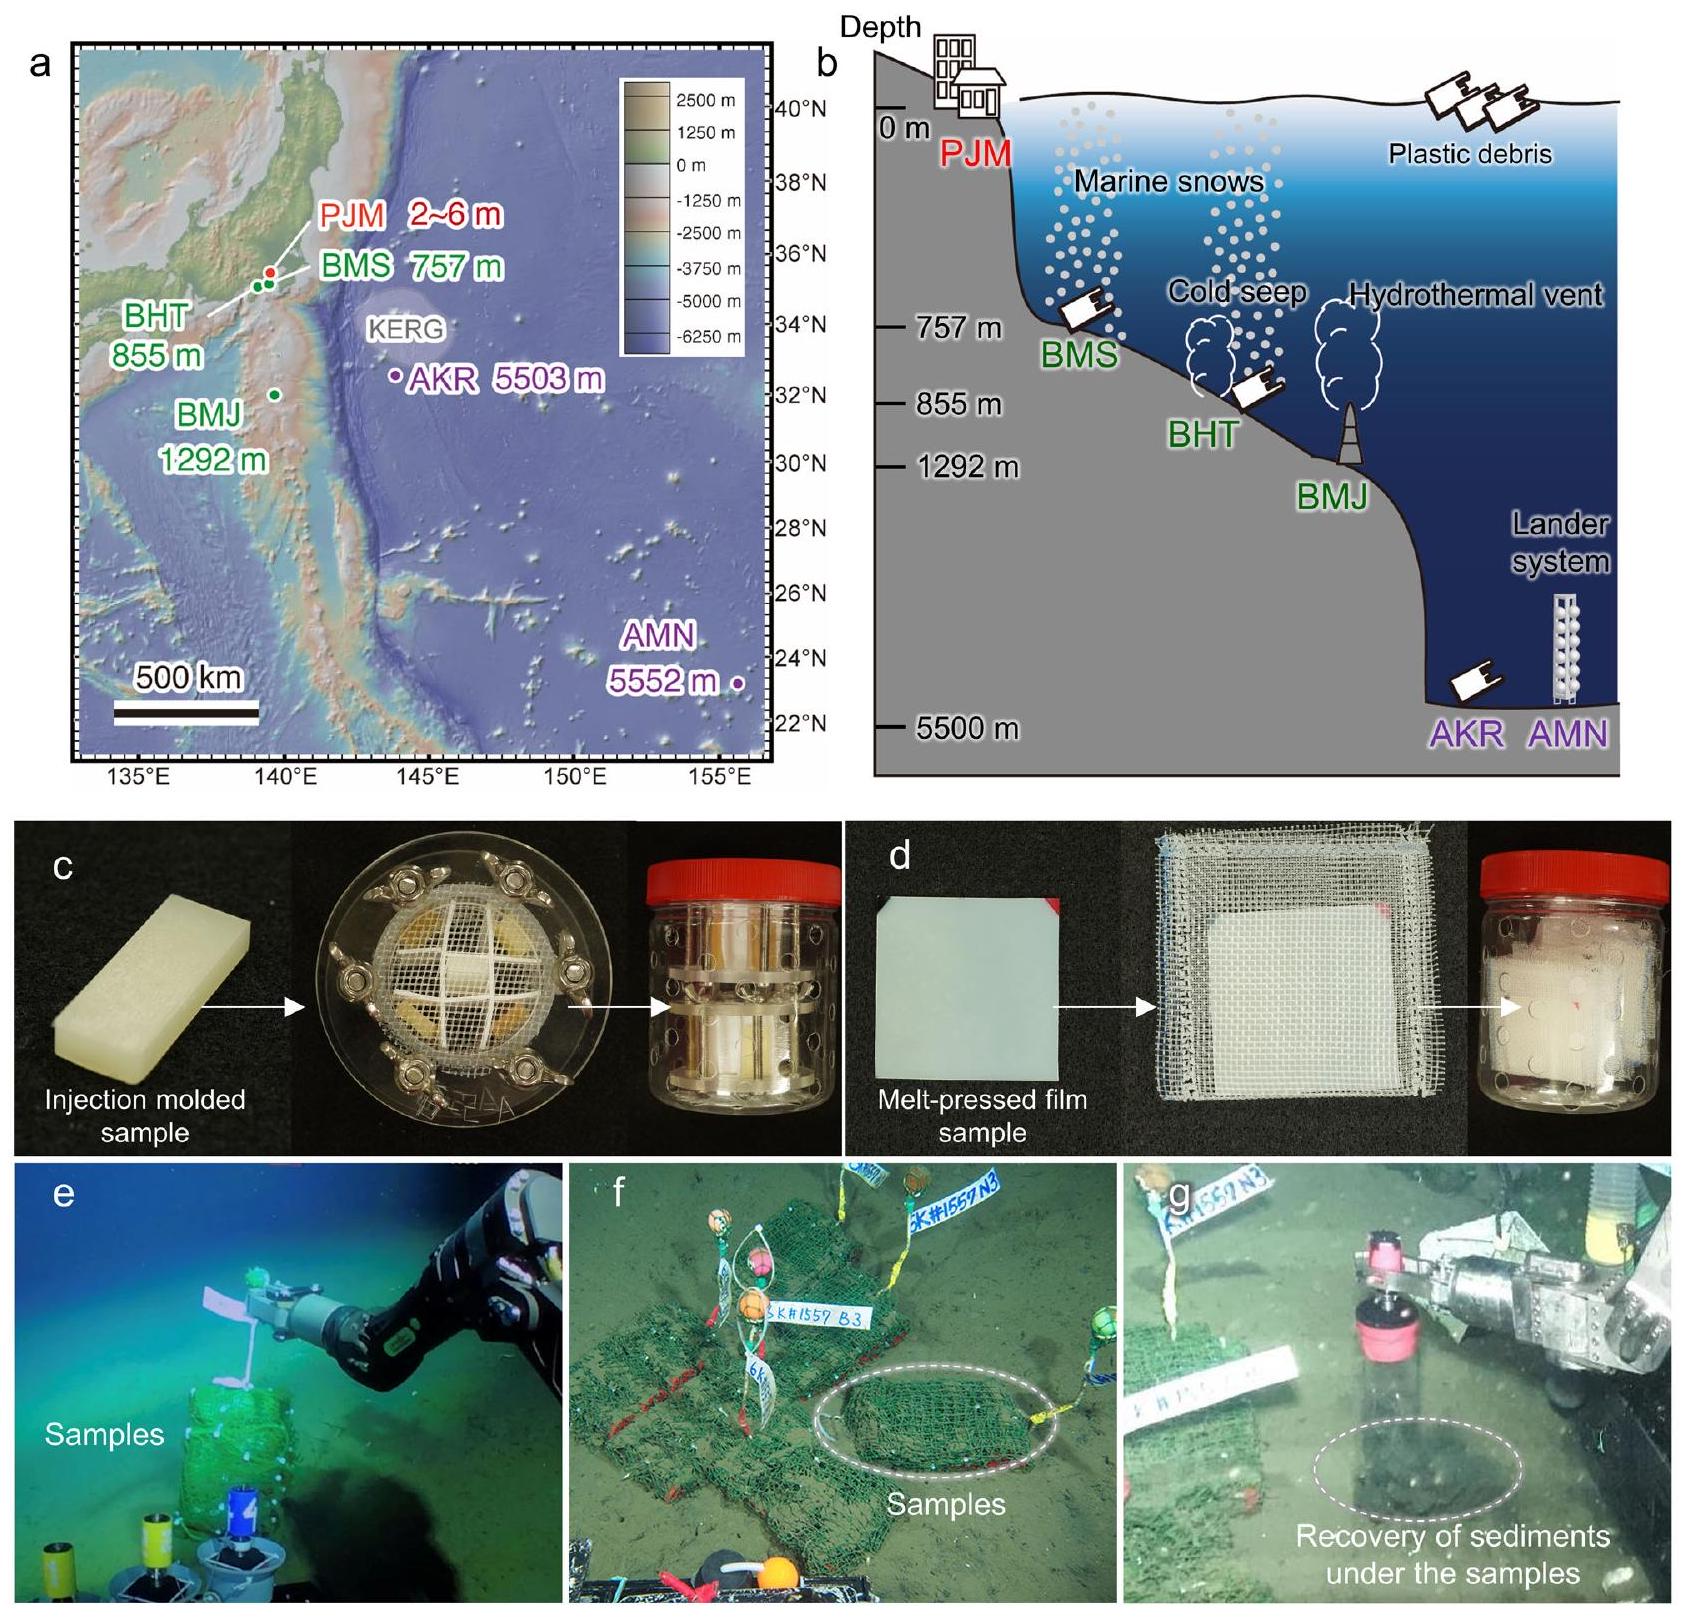
الشكل 1 | نشر عينة في قاع البحر العميق. أ خريطة لمواقع اختبارات التحلل الحيوي في الموقع. تم إعداد الخريطة باستخدام GeoMapAppwww.geomapapp.org) / CC BY / CC BY (رايان وآخرون، 2009) انظر الجدول 1 للاختصارات المتعلقة بالموقع.تعتبر BMS وBHT قريبتين من المدن ذات الكثافة السكانية العالية وطرق الشحن من/إلى خليج طوكيو، حيث تم تسجيل تراكم كبير من الحطام البلاستيكي. تحتوي BHT وBMJ على مجتمعات كيميائية حيوية فريدة بالقرب من تسربات باردة وفتحات حرارية مائية، على التوالي. تقع AKR جنوب دوامة إعادة تدوير كوروشيوا (KERG)، حيث تم الإبلاغ عن تراكم كبير من الحطام البلاستيكي. AMN هو بيئة عميقة أخرى، ولكنها بعيدة عن المناطق المأهولة. PJM هو بيئة ساحلية (ميناء مقر JAMSTEC في يوكوسوكا)، ويعمل كمرجع. موقع قريب من المدن الكبيرة والأنهار. تم نشر مجموعات العينات على قاع البحر العميق بواسطة الغواصة المأهولة شينكاي 6500، باستثناء AMN، حيث تم تنفيذ النشر بواسطة نظام هبوط، وتم وضع مجموعات العينات على ارتفاع 2 متر فوق قاع البحر. ج عينة نموذج مصبوبة بالحقن مستخدمة في هذه الدراسة ومجموعة العينات في حامل عينات مصمم خصيصًا (مغلق بشبكة بولي إيثيلين (PE) بفجوة 1 مم). د عينة نموذج مضغوطة بالحرارة مستخدمة في هذه الدراسة ومجموعة العينات مع عينة مختومة بشبكة PE بفجوة 1 مم. هـ العينات الاختبارية التي تم نشرها في BHT. و العينات الاختبارية في BHT بعد 4 أشهر من النشر. ز استعادة الرواسب تحت العينات.
الجدول 1 | ملخص لموقع اختبار التدهور في الموقع
موقع
اختصار
خط العرض شمال
خط الطول شرق
عمق م
ملوحة
درجة الحرارة
DO ملغم/لتر
نشر yyyy/mm/dd
استرداد yyyy/mm/dd
أيام الدورة
اختصار
عينة
ميناء مقر JAMSTEC يوكوسوكا
PJM
١٣٩*٣٩.٠٥
2-6
30.0
٢٥.٥
5.7
2019/09/30
2020/10/03
369
PJM12
قالب حقن
2-6
30.3
25.4
٥.٠
2021/08/08
2021/10/08
61
PJMO2
فيلم
تسرب الهيدروكربونات في الأعماق قبالة جزيرة هاتسوشيما
BHT
855
٣٤.٥
3.6
1.8
2019/09/12
2020/01/07
١١٧
BHTO4
حقن مصبوب
2019/09/12
2020/11/16
431
BHT14
قالب حقن
2021/02/05
2021/05/11
95
BHTO3
فيلم
2021/02/05
2021/10/13
٢٥٠
BHTO8
فيلم
قاع البحر العميق قبالة ميناء ميساكي
نظام إدارة المباني
757
٣٤.٣
٤.٤
2.1
2021/05/12
2021/10/12
153
BMS05
فيلم
فتحة هيدروحرارية في قمة ميوجين
BMJ
1292
٣٤.٣
٤.٦
2.1
2021/05/21
2021/10/07
١٣٩
BMJO5
فيلم
سهل عميق بالقرب من مرصد امتداد كوروشي
AKR
٥٥٠٣
٣٤.٧
1.6
5.2
٢٠٢١/٠٥/٢٠
2021/10/06
١٣٩
أكرو5
فيلم
سهل قاعي حول جزيرة ميناميتورشيما
أمن
5552
٣٤.٧
1.5
5.0
2020/03/15
2021/04/09
٣٩٠
AMN13
قالب حقن
الجدول 2 | الاسم الرسمي، الاختصار في الورقة، وخصائص الحرارة للعناصر
تم عزل الكائنات الحية الدقيقة القابلة للتحلل البلاستيكي من السماد، والتربة، والأنهار، ومياه البحر.. تم عزل وتنقية الإنزيمات المتحللة التي تفرزها, وقد تم الإبلاغ عن الخصائص البيوكيميائية، وتسلسلات الأحماض الأمينية، والهياكل البلورية ثلاثية الأبعاد لهذه الإنزيمات. ومع ذلك، تم الإبلاغ عن عدد قليل فقط من الكائنات الحية الدقيقة القابلة للتحلل من البوليمرات المتعددة الهيدروكسي (PHA) في قاع البحر العميق, ولا تُعرف أي كائنات حية دقيقة قادرة على
تحلل البلاستيكات القابلة للتحلل الأخرى في ذلك البيئة، مما يثير تساؤلات حول آليات التحلل في أعماق البحر. لذلك، فإن التحقيق في تحلل البلاستيكات القابلة للتحلل في قاع البحر العميق سيساهم بشكل كبير في تطوير المعرفة والتقنيات في مجالات علوم المواد وعلم الأحياء، بالإضافة إلى الحفاظ على البيئة وفهم البيئة البحرية العميقة. في هذه الدراسة، تم التحقيق في تحلل البلاستيكات القابلة للتحلل في أعماق البحر للبوليستر القابل للتحلل ومشتقات استر السكريات المتعددة، بالإضافة إلى
PHA، التي تم دراستها بنشاط: قمنا بتقييم فقدان الوزن، وتقليل سمك المادة، والتغيرات الشكلية السطحية في قاع البحر العميق، وتكوين الأغشية الحيوية، وتراكم الكائنات الحية الدقيقة، والجينات المرشحة لتحلل البلاستيك عن طريق زراعة الكائنات الحية الدقيقة.
النتائج والمناقشة
التحلل البيولوجي في قاع البحر العميق
قمنا بالتحقيق في تحلل البلاستيكات القابلة للتحلل التمثيلية (PHA، والبوليستر القابل للتحلل، واسترات السكريات المتعددة) في المواقع الخمسة المذكورة أعلاه في قاع البحر العميق (الشكل 1a، b). تم وضع عينات مصبوبة بالحقن والأفلام في حوامل عينات مصنوعة خصيصًا وأكياس شبكية، على التوالي، وتم وضعها في قاع البحر العميق في حالة تمنع التشوه الفيزيائي [تم وضع العينات في حاويات بولي إيثيلين تيريفثاليت (PET) مع ثقوب، محمية بشبكات تنس (الشكل 1c، d، الأشكال التكملية 2، 3)]. تم تركيبها في أعماق البحر واستعادة العينات على متن مركبة شينكاي 6500 المأهولة (HOV) باستخدام ذراع روبوتية. تم أيضًا استعادة التربة البحرية مباشرة تحت العينات باستخدام نواة مصنوعة خصيصًا واستخدمت للتحليل الميكروبيولوجي (الشكل 1e-g، الشكل التكميلي 4).
التحلل البيولوجي للبوليستر القابل للتحلل في قاع البحر العميق
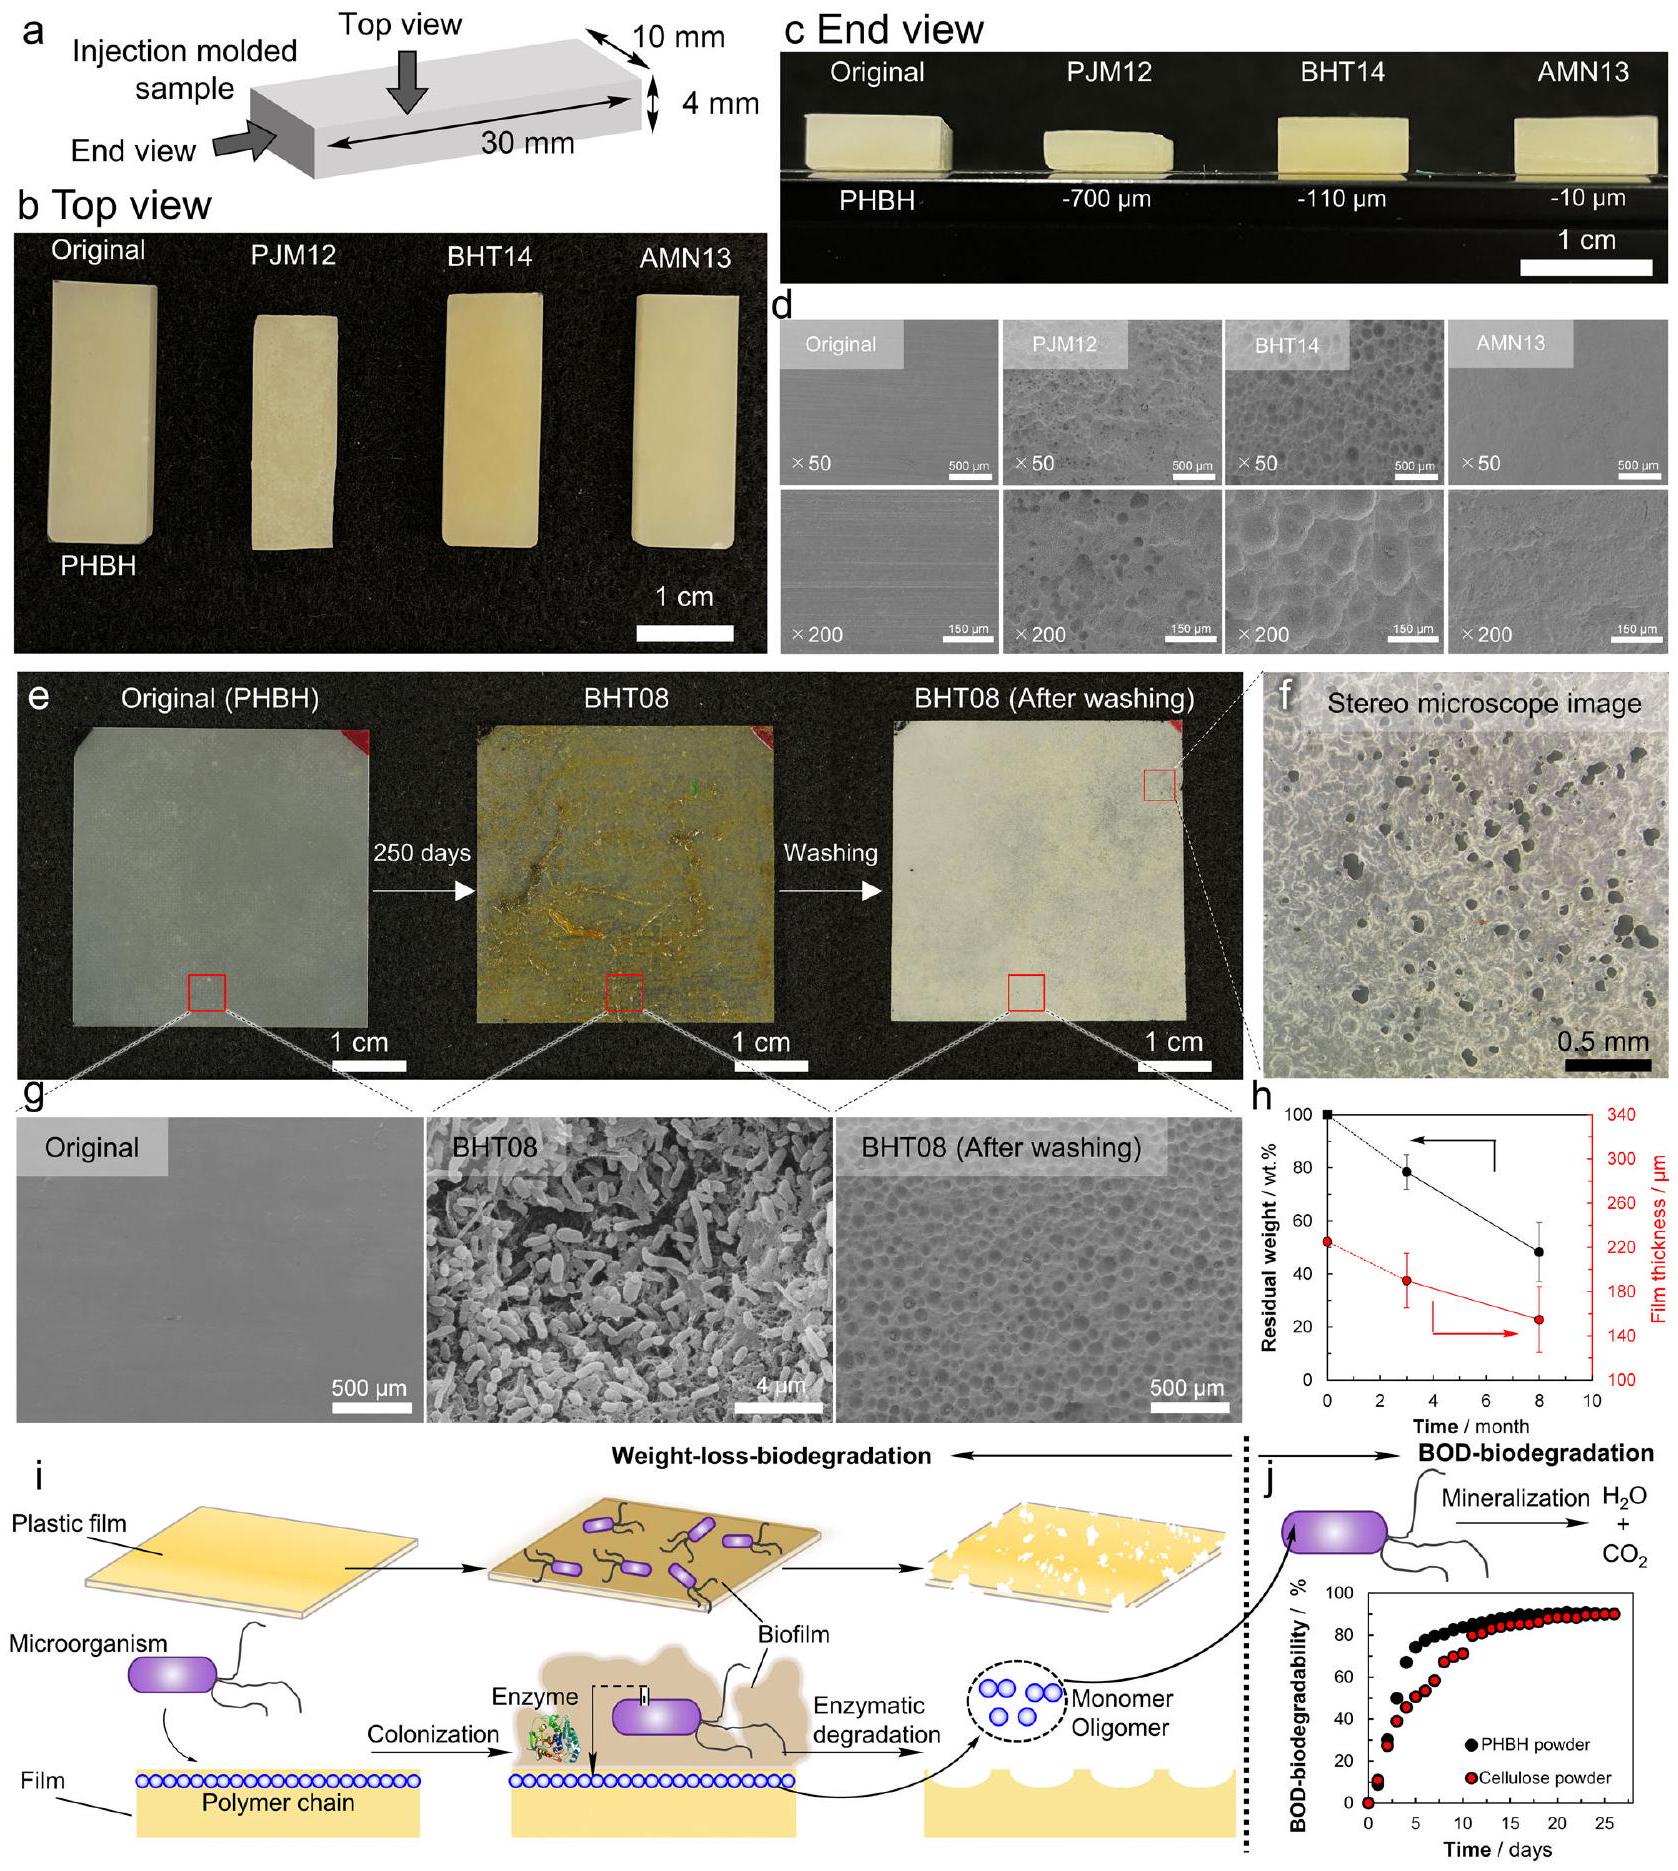
يوضح الشكل 2a-c الأشكال العامة والشكل الخارجي لـ [هيدروكسي بيوتيرات-كو-(R)-3-هيدروكسي هكسانوات] (PHBH) عينات مصبوبة بالحقن وضعت على الشاطئ (PJM12) وخارج جزيرة هاتسوشيما (BHT14) وجزيرة ميناميتورشيما (AMN13) لمدة تقارب سنة واحدة. العينة PHBH المعروضة كمثال هي واحدة حيث تقدم التحلل بشكل نسبي جيد مقارنةً بالعينات الأخرى. الصور الملتقطة من الأعلى ومن النهاية بعد الغسيل بالموجات فوق الصوتية والتجفيف، كشفت أنه لم يحدث أي تشوه فيزيائي. علاوة على ذلك، تم التأكيد بواسطة حيود الأشعة السينية أن الهيكل البلوري للعينات ظل دون تغيير خلال فترات الغمر في قاع البحر العميق والمعالجة التجريبية. تظهر صور المجهر الإلكتروني الماسح (SEM) (الشكل 2d) ملفات السطح بعد إزالة الكائنات الحية الدقيقة من السطح. بينما كان الشكل السطحي قبل التحلل (الأصلي) ناعمًا جدًا، لوحظ أن أسطح العينات بعد وضعها على الشاطئ أو في قاع البحر العميق كانت غير متساوية، وكان التحلل جاريًا. يُعتبر هذا النوع من التحلل الذي يخلق عدم التساوي على سطح المادة ناتجًا عن التحلل الميكروبي، وليس التشوه الفيزيائي أو التحلل الكيميائي. إن حقيقة أن التحلل يتقدم من السطح بشكل متجانس واضحة من الانخفاض الشديد في سمك العينات من الشاطئ (PJM12). في حوالي سنة واحدة، وُجد أن سمك العينات، الذي كان في البداية, وُجد أنه قد انخفض بمقدار عند الشاطئ (PJM12)، خارج جزيرة هاتسوشيما (BHT14)، و عند جزيرة ميناميتورشيما (AMN13). بناءً على هذه السلسلة من الملاحظات، اعتُبر أن التحلل كان تحللًا ميكروبيًا، بدلاً من التشوه الفيزيائي.
يوضح الشكل الأشكال، وصور المجهر المجسم، وصور SEM لأسطح عينات فيلم PHBH الموضوعة خارج جزيرة هاتسوشيما لمدة 8 أشهر (BHT08)، على التوالي، كمثال على تحلل الفيلم في قاع البحر العميق. بالإضافة إلى ذلك، يتم عرض الوزن المتبقي وسمك الفيلم بعد 3 و8 أشهر في الشكل 2h. في جميع العينات، لم تتشقق الحواف، ولم يحدث أي تشوه فيزيائي خلال الغمر في قاع البحر العميق أو خلال الغسيل بالموجات فوق الصوتية اللاحقة. كانت أفلام عينات PHBH الأصلية غير شفافة قليلاً مع أسطح ناعمة جدًا (الشكل 2e، الأصلي). بعد حوالي 8 أشهر من الغمر خارج جزيرة هاتسوشيما، التصقت الكائنات الحية الدقيقة بالسطح، وتم ملاحظة مظهر لزج مصفر (الشكل 2e، BHT08). عندما تم تثبيت الفيلم بالفورمالديهايد وتم إجراء ملاحظة SEM، لوحظ أن عددًا كبيرًا من الكائنات الحية الدقيقة التصقت بسطح الفيلم، مكونةً غشاء حيوي (الشكل 2g، BHT08). عندما تم غسل الفيلم بالموجات فوق الصوتية وتجفيفه، ثم تمت ملاحظته تحت
مجهر مجسم، تم ملاحظة العديد من الثقوب بقطر (الشكل 2f)، والتي يبدو أنها قد تم إنشاؤها بواسطة تحلل الفيلم. كشفت ملاحظة SEM عن عدد كبير جدًا من الثقوب الكروية وعدم التساوي [الشكل 2g، BHT08 (بعد الغسيل)]. يُعتقد أن هذه قد تم إنشاؤها بواسطة تحلل الفيلم بواسطة الكائنات الحية الدقيقة، لأن هذا النمط من التحلل، مثل الثقوب الكروية على سطح الفيلم التي لوحظت بواسطة SEM، مشابه جدًا لما ورد في تقرير سابق حيث تم تحلل فيلم PHB بواسطة كائنات حية دقيقة معزولة من التربة..
يوضح الشكل 2h (البيانات التكملية 1، الجداول التكملية 1 و2) التغير في الوزن المتبقي وسمك فيلم PHBH. وُجد أن وزن الفيلم قد انخفض بمقدار في 3 أشهر و في 8 أشهر، وانخفض سمك الفيلم بمقدار في 3 أشهر و في 8 أشهر من السمك الابتدائي. علاوة على ذلك، انخفض الوزن المتبقي بشكل خطي، مما يشير إلى أن التحلل حدث بمعدل ثابت على مدى فترة 8 أشهر. إن حقيقة أن ميل تغير الوزن المتبقي وميل انخفاض سمك الفيلم كانا متشابهين تقريبًا تشير إلى أن التحلل في اتجاه سمك الفيلم هو السائد.
الشكل 2i يوضح بشكل تخطيطي التحلل الميكروبي للبلاستيك القابل للتحلل. تلتصق الكائنات الدقيقة بسطح الفيلم البلاستيكي وتشكل غشاء حيويًا. بعض الكائنات الدقيقة تفرز إنزيمات تحللية تقطع السلاسل الجزيئية على سطح الفيلم وتكسرها إلى مونومرات أو أوليغومرات قابلة للذوبان في الماء. ثم يتم تحلل سطح الفيلم، ويصبح الفيلم غير متساوٍ. هذه السلسلة من التحللات الميكروبية هي في الأساس نفس تلك الموجودة في التربة والأنهار. تم تأكيد ما إذا كانت المونومرات والأوليغومرات القابلة للذوبان في الماء قد تحللت تمامًا إلى ثاني أكسيد الكربون والماء بواسطة الكائنات الدقيقة في مياه البحر من خلال اختبار تحلل BOD باستخدام مياه البحر في بيئة مختبرية. الشكل 2j (البيانات التكميلية 2) يظهر نتائج اختبار تحلل BOD لـ PHBH ومواد مرجعية (سيلولوز). تم التأكيد على أنها تحللت إلى ثاني أكسيد الكربون والماء في حوالي شهر واحد. بالنظر إلى النتائج أعلاه بشكل شامل، في قاع البحر العميق أو الشاطئ، تخضع البلاستيكات القابلة للتحلل للتحلل من السطح بواسطة الكائنات الدقيقة، مما يشكل وسائط قابلة للذوبان في الماء، والتي يتم استقلابها في النهاية إلى ثاني أكسيد الكربون والماء. ومع ذلك، في هذه الدراسة، لم يتم إجراء تجارب إضافية لدعم ذلك مباشرةً بأن الكائنات الدقيقة تفرز فعليًا إنزيمات خارج الخلوية في البيئة القاسية لقاع البحر العميق. وبالتالي، فإنه غير واضح ما إذا كانت الكائنات الدقيقة في قاع البحر العميق تحلل البلاستيكات القابلة للتحلل تمامًا إلى ثاني أكسيد الكربون والماء من خلال الوسائط القابلة للذوبان في الماء.
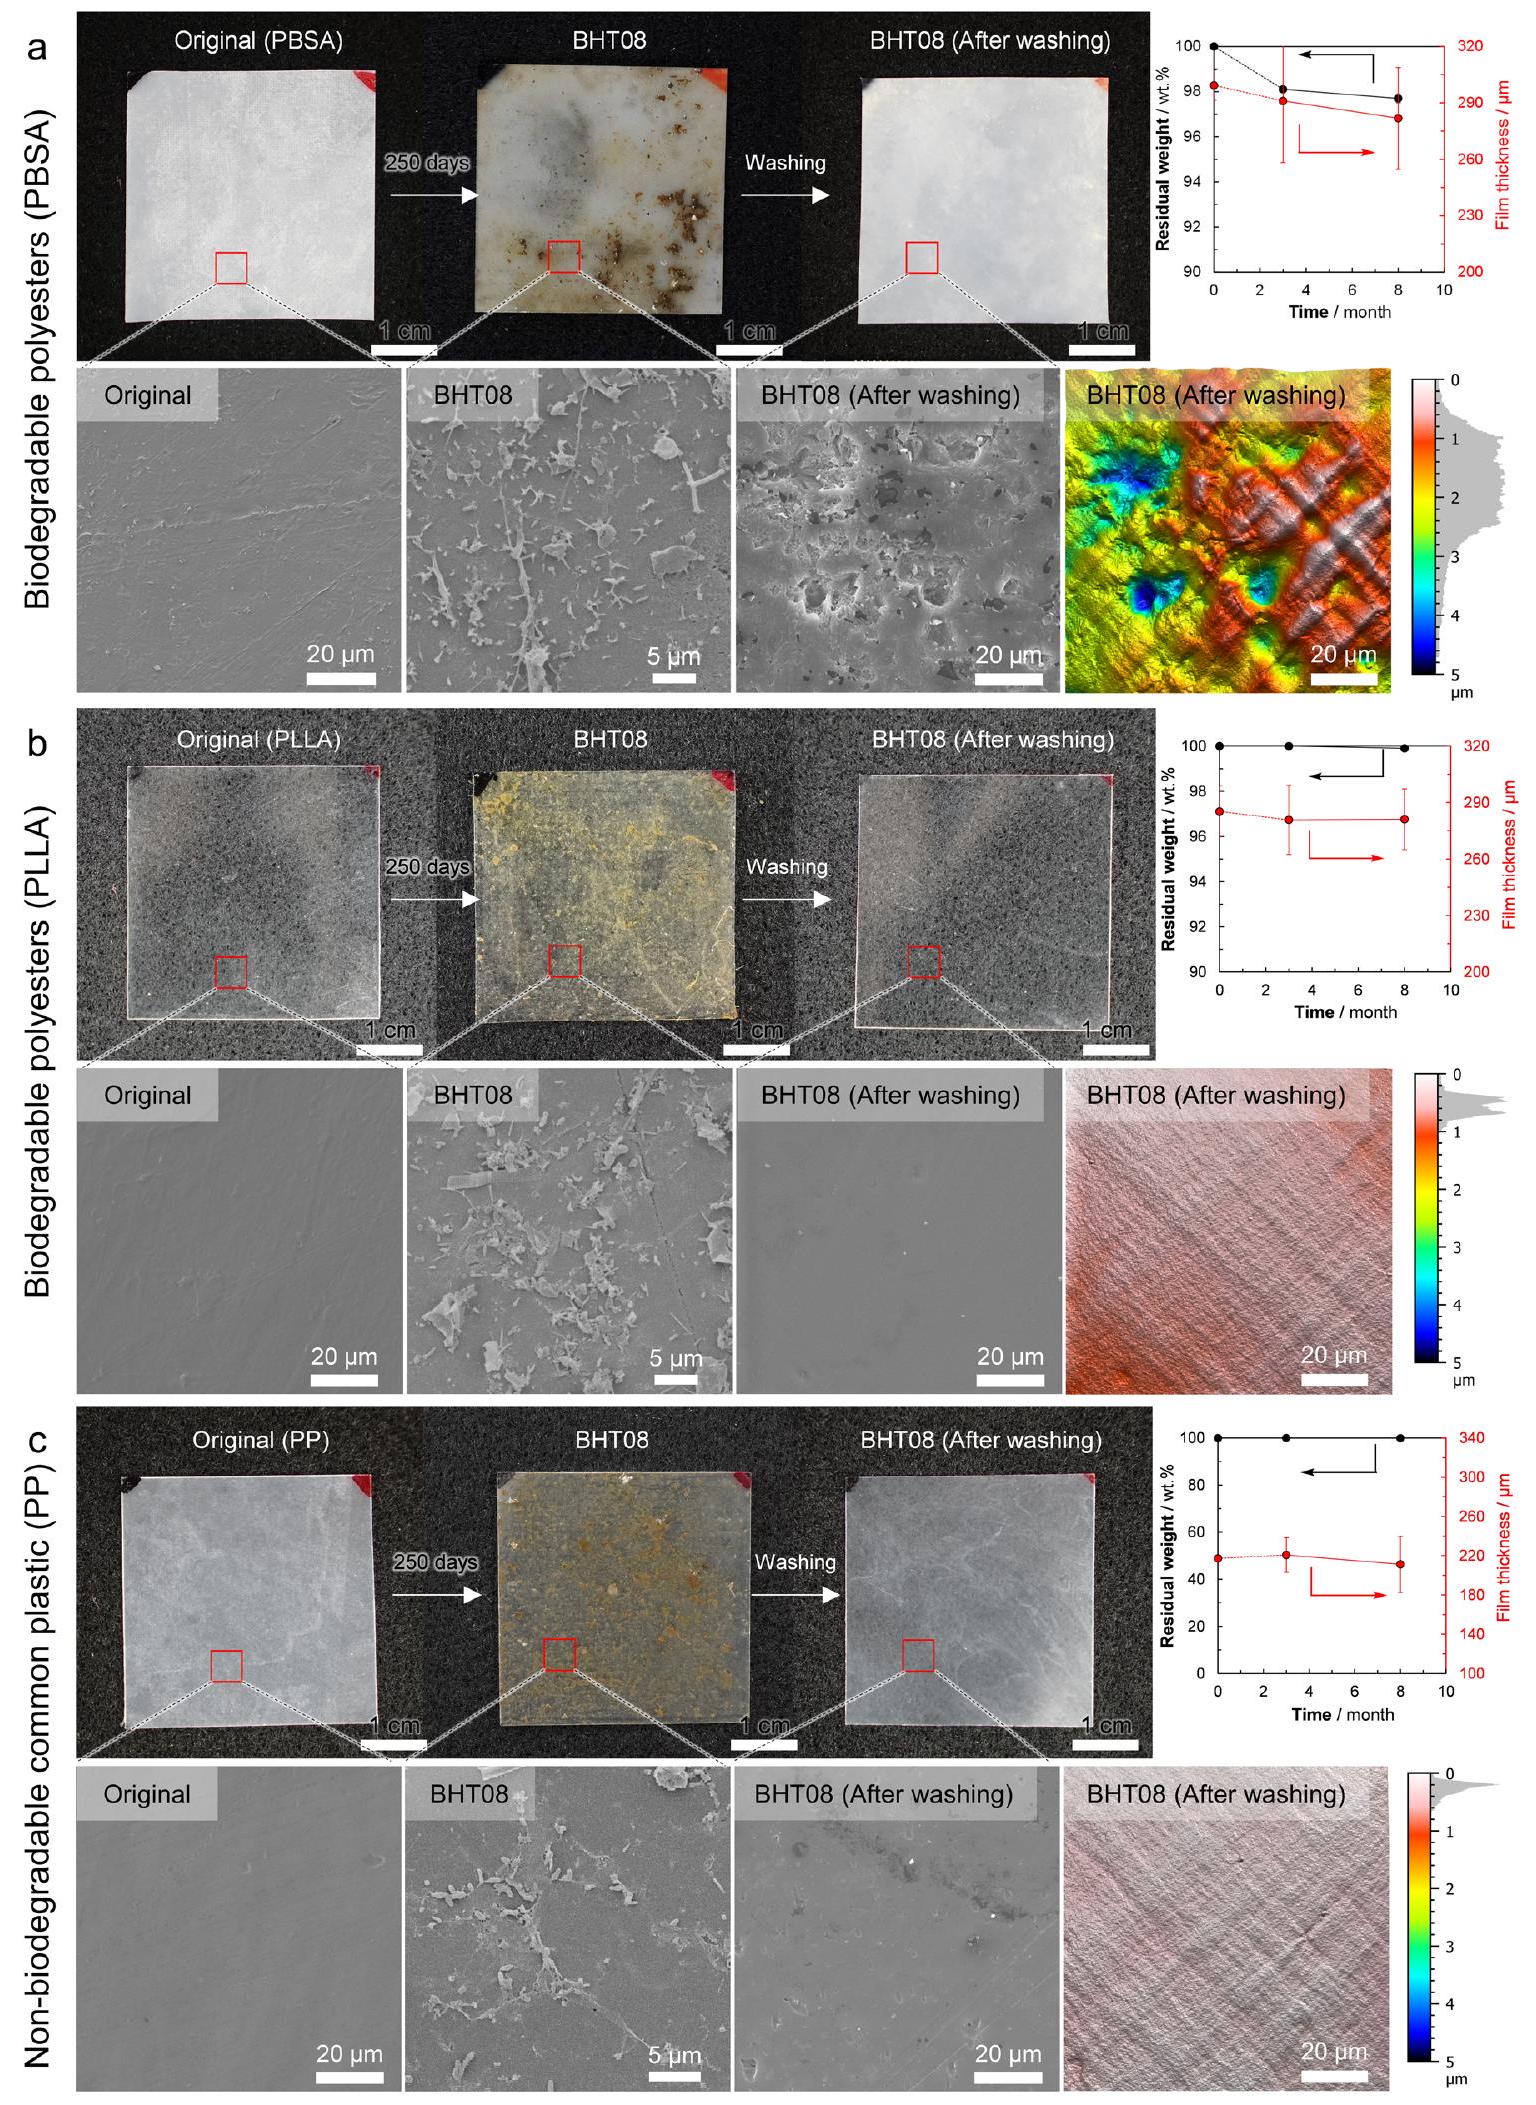
الشكل 3a-c (البيانات التكميلية 1، الجداول التكميلية 1 و2) يظهر التغيرات في شكل الفيلم، صور SEM السطحية، الوزن المتبقي، وسمك الفيلم لـ poly(butylene succinate-co-adipate) (PBSA) وpoly(L-lactic acid) (PLLA)، وهما بوليستر قابل للتحلل، وpolypropylene (PP)، وهو بلاستيك شائع غير قابل للتحلل، على التوالي، والتي وضعت قبالة Hatsushima لمدة 3 و8 أشهر. كما أظهرت صورة SEM السطحية لـ PBSA تشكيل غشاء حيوي على السطح. في صورة SEM للسطح، لوحظت عدم انتظام وفتحات، مما يشير إلى أن السطح قد تم تحلله بواسطة الكائنات الدقيقة. لذلك، يعتبر أن التحلل الميكروبي لـ PBSA في قاع البحر العميق يتقدم بنفس الطريقة التي يحدث بها لـ PHBH (الشكل 2e-g). ومع ذلك، كانت نسبة فقدان الوزن والتغيرات في سمك الفيلم أبطأ بكثير/أقل من تلك الخاصة بـ PHBH.
في حالة PLLA، لوحظت الكائنات الدقيقة تلتصق بسطح الفيلم، ولكن بعد 8 أشهر، كان سطح الفيلم ناعمًا جدًا، مما يشير إلى أنه لم يحدث أي تحلل، على الرغم من تصنيف PLLA كـ بوليستر قابل للتحلل (الشكل 3b). ظل وزن العينة وسمكها دون تغيير أثناء الغمر في قاع البحر العميق. يُعتقد أن ذلك يعود إلى غياب البكتيريا القادرة على تحلل PLLA بين الكائنات الدقيقة الملتصقة. من الواضح أن PLLA لا يتحلل في قاع البحر العميق. ولا يتحلل في التربة والأنهار – من المعروف جيدًا أن PLLA يتحلل فقط في الكومبوست.
الشكل 2 | التحلل البيولوجي لـ -3-hydroxybutyrate-co-9 mol%-(R)-3-hydroxyhexanoate] (PHBH) عينات أفلام مصبوبة بالحقن ومضغوطة بالحرارة وضعت في قاع البحر العميق ونماذج من التحلل الميكروبي. أ. تم وضع عينات مصبوبة بالحقن في البحر على أعماق مختلفة () لمدة حوالي عام لاختبارات التحلل البيولوجي. انظر الجدول 1 للاختصارات المتعلقة بالموقع والجدول 2 للاختصارات المتعلقة بالعينات. ب، ج. تظهر العينات الأصلية وPJM12 وBHT14 وAMN13 المصبوبة بالحقن في صورة مأخوذة من (ب) الجانب العلوي و(ج) النهاية، مما يظهر أن العينات قد تم تقليل حجمها مع الحفاظ على شكلها دون انهيار مادي. د. تظهر صور SEM السطحية أن التحلل قد تقدم بغض النظر عن عمق الماء. هـ. صور لعينة فيلم أصلية من ، بعد 250 يومًا من وضعها في قاع البحر العميق قبالة جزيرة Hatsushima على عمق 855 م (BHT08)، وبعد إزالة الغشاء الحيوي بواسطة الغسيل بالموجات فوق الصوتية، على التوالي. كانت أبعاد الفيلم في BHT08 (بعد الغسيل) هي نفسها كما في الأصل، مما يعني أنه لم يحدث انهيار مادي، ولكن تم ملاحظة العديد من الفتحات النافذة بواسطة المجهر المجسم. ز. صور مجهرية إلكترونية
تظهر صور SEM عرضًا مكبرًا لسطح كل فيلم PHBH. بينما كان سطح العينة الأصلية ناعمًا، تراكمت الكائنات الدقيقة على سطح عينة BHT08، وأظهر سطح الفيلم، بعد إزالة الكائنات الدقيقة بواسطة الغسيل بالموجات فوق الصوتية (BHT08 بعد الغسيل)، الخشونة التي تُلاحظ عادة بعد التحلل الميكروبي. الانخفاض في الوزن (الخط الأسود) وسمك الفيلم (الخط الأحمر) في قاع البحر العميق قبالة جزيرة Hatsushima على مدى 8 أشهر. القيم معطاة كمتوسط لـ عينات مستقلة مع انحرافها المعياري (البيانات التكميلية 1). ط. رسومات توضيحية للتحلل البيولوجي تتوافق مع الصور وصور SEM أعلاه. منحنى قابلية التحلل BOD، يظهر أن PHBH (النقطة السوداء) والسيلولوز (النقطة الحمراء) يتم تحويلهما تمامًا إلى الماء وثاني أكسيد الكربون بواسطة الكائنات الدقيقة في مياه البحر في خليج طوكيو. الصور المجهرية هي صور تمثيلية من عينات مستقلة مع نتائج مشابهة. بيانات BOD تمثل واحدة من ، مع نتائج مشابهة (البيانات التكميلية 2). تم توفير بيانات المصدر كملف بيانات المصدر.
الشكل 3 | تحليل Poly(butylene succinate-co-adipate) (PBSA) وPoly(L-lactic acid) (PLLA) وPolypropylene (PP) عينات أفلام مضغوطة بالحرارة وضعت في قاع البحر العميق (BHT). قابلية التحلل لـ فيلم PBSA، فيلم PLLA، و فيلم PP في قاع البحر العميق. بالنسبة لفيلم PBSA، لوحظت الكائنات الدقيقة على سطح الفيلم بعد 250 يومًا من وضعه في قاع البحر العميق قبالة جزيرة Hatsushima على عمق 855 م (BHT08)، وتمت ملاحظة الخشونة على سطح الفيلم بعد إزالة الغشاء الحيوي، وفقدان طفيف في الوزن، وانخفاض في سمك الفيلم. بالنسبة لـ PLLA وPP، تم ملاحظة عدد قليل من
الكائنات الدقيقة على سطح الفيلم حتى بعد 8 أشهر في BHT، وظل سطح الفيلم ناعمًا بعد الغسيل بالموجات فوق الصوتية، دون ملاحظة فقدان الوزن أو انخفاض في سمك الفيلم. القيم معطاة كمتوسط لـ لـ PBSA وPLLA، لـ PP عينات مستقلة مع انحرافها المعياري (البيانات التكميلية 1). الصور المجهرية هي صور تمثيلية من عينات مستقلة مع نتائج مشابهة. تم توفير بيانات المصدر كملف بيانات المصدر.
(درجة الحرارة: ، الرطوبة: ). لذلك، من المرغوب فيه جمع PLLA بعد الاستخدام وتعزيز تحللها بنشاط عن طريق الكومبوست.
في حالة PP، وهو بلاستيك شائع وغير قابل للتحلل، لوحظ أن كمية الكائنات الدقيقة الملتصقة بسطح الفيلم كانت منخفضة (الشكل 3c). قد يكون ذلك لأن سطح PP غير قابل للذوبان في الماء، على عكس البوليستر القابل للتحلل، الذي يحتوي على مجموعات استر قابلة للذوبان في الماء. كان من الواضح أن PP لم يتحلل في قاع البحر العميق.
تظهر النتائج لبوليستر القابل للتحلل الأخرى والبلاستيك الشائع غير القابل للتحلل بعد 8 أشهر في الأشكال التكميلية 5-9؛ تلك بعد 3 أشهر تظهر في الأشكال التكميلية 10-12. تشير صور SEM بعد 3 و8 أشهر إلى أن التحلل الميكروبي كان جاريًا لبوليستر القابل للتحلل الأخرى (PHB، PHBV، P3HB4HB، PCL، PBS، PBAT)، مثل PHBH وPBSA. ومع ذلك، لم يحدث أي تحلل في البلاستيك الشائع غير القابل للتحلل الأخرى (PE، PS، PET)، مثل PP وPLLA (انظر الجدول 2 لتعريفات اختصارات العينات).
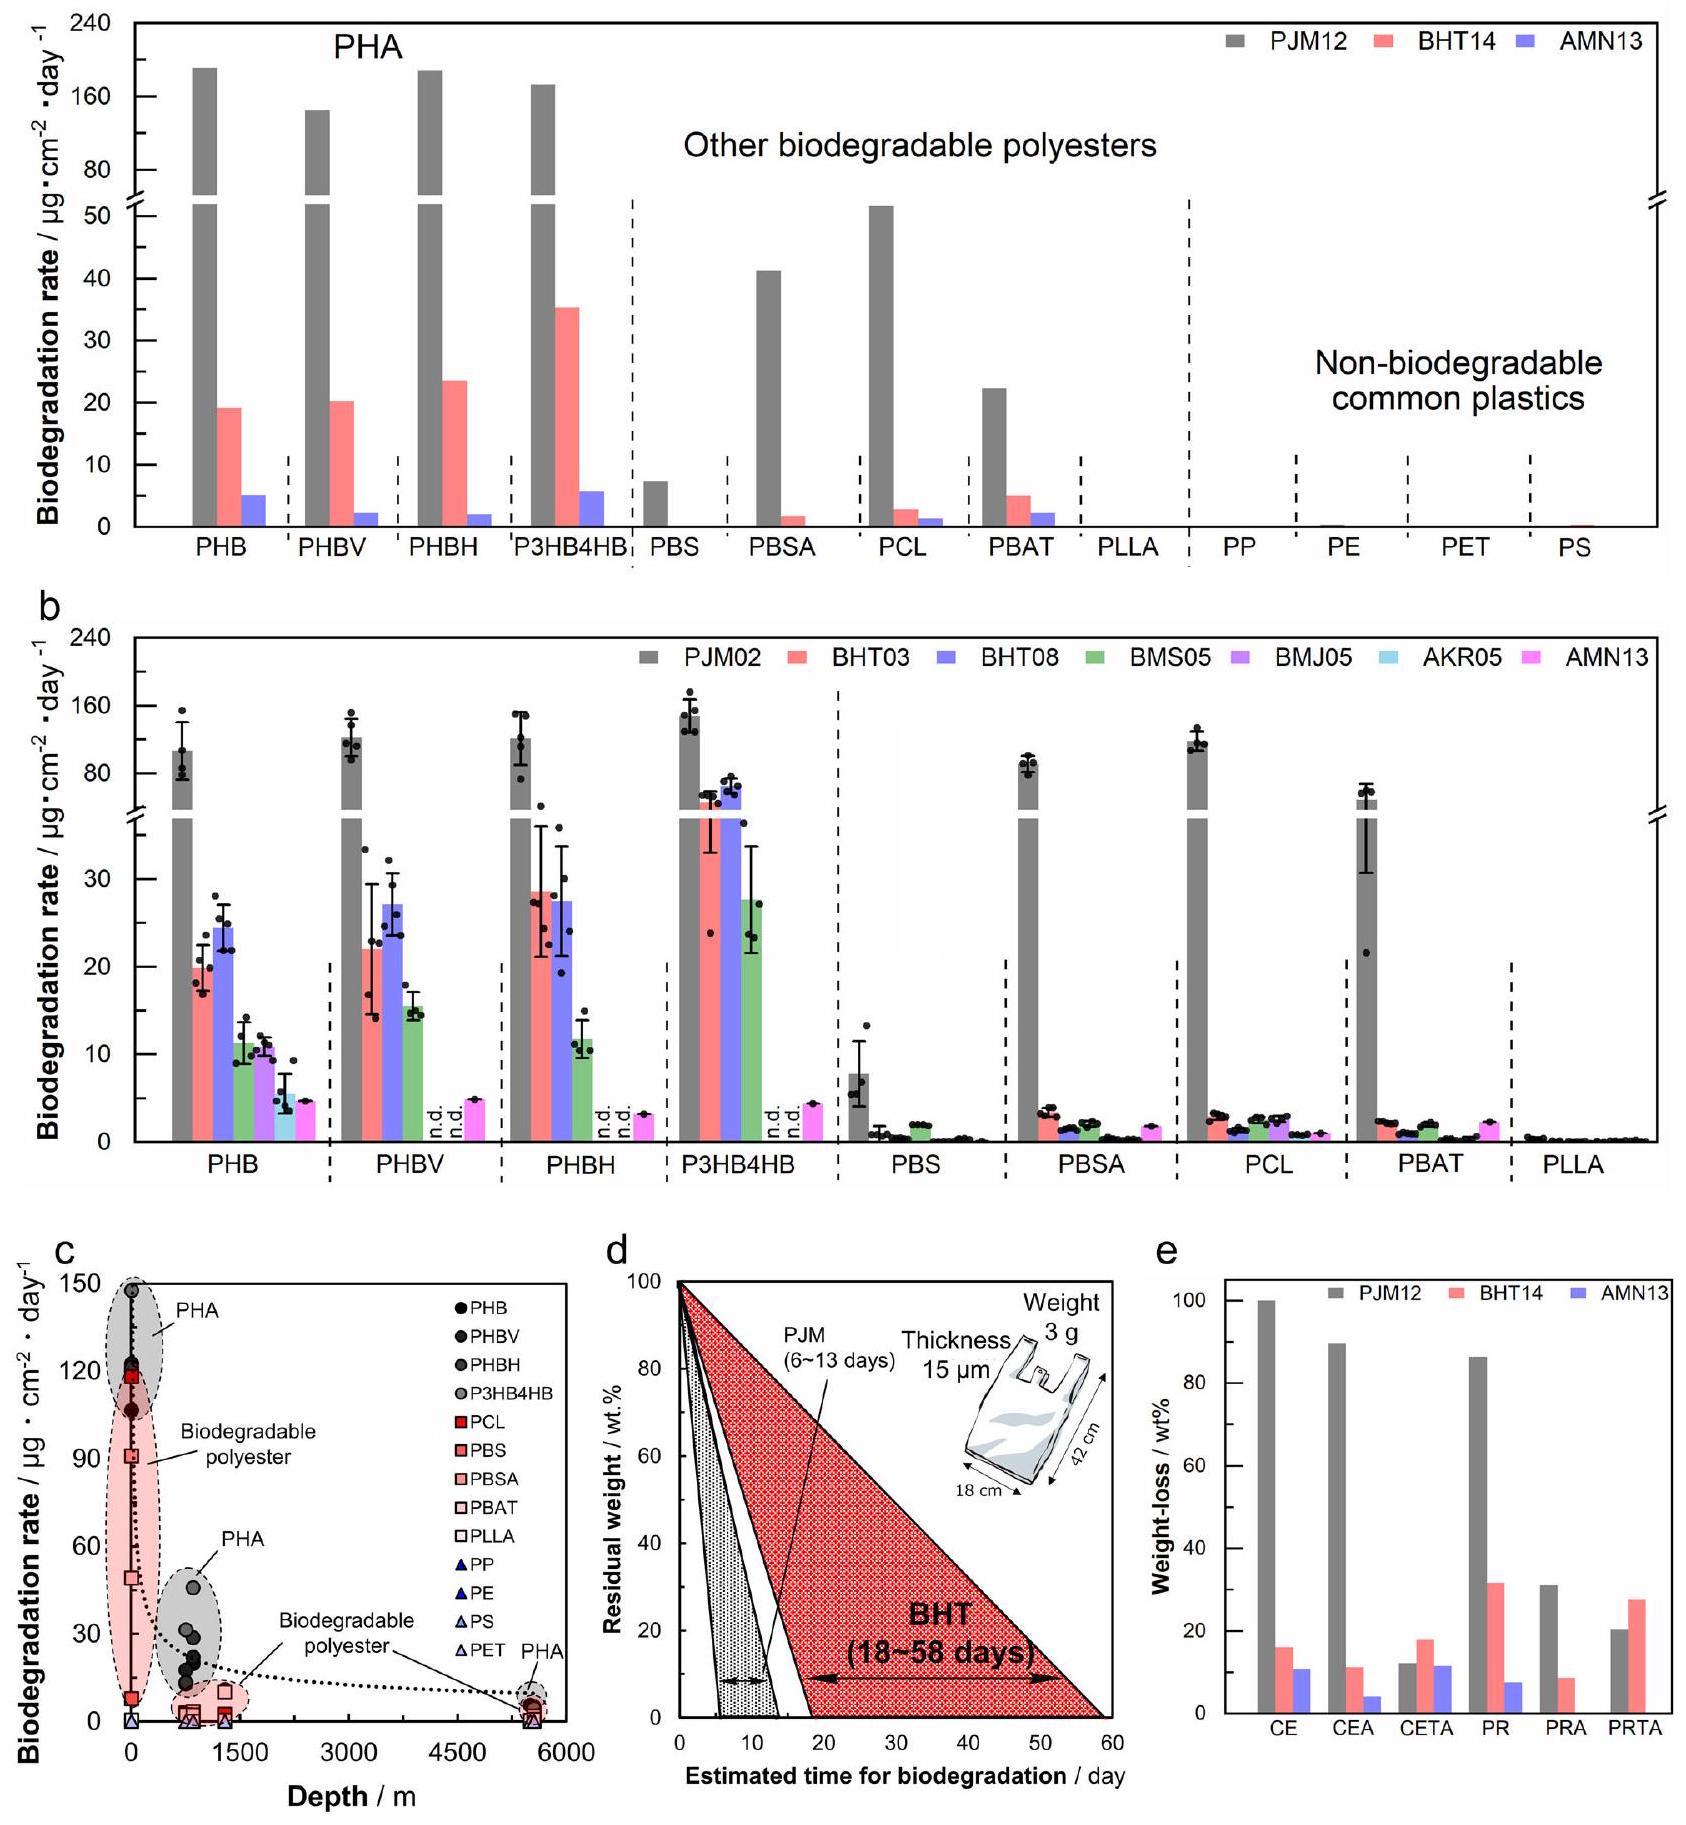
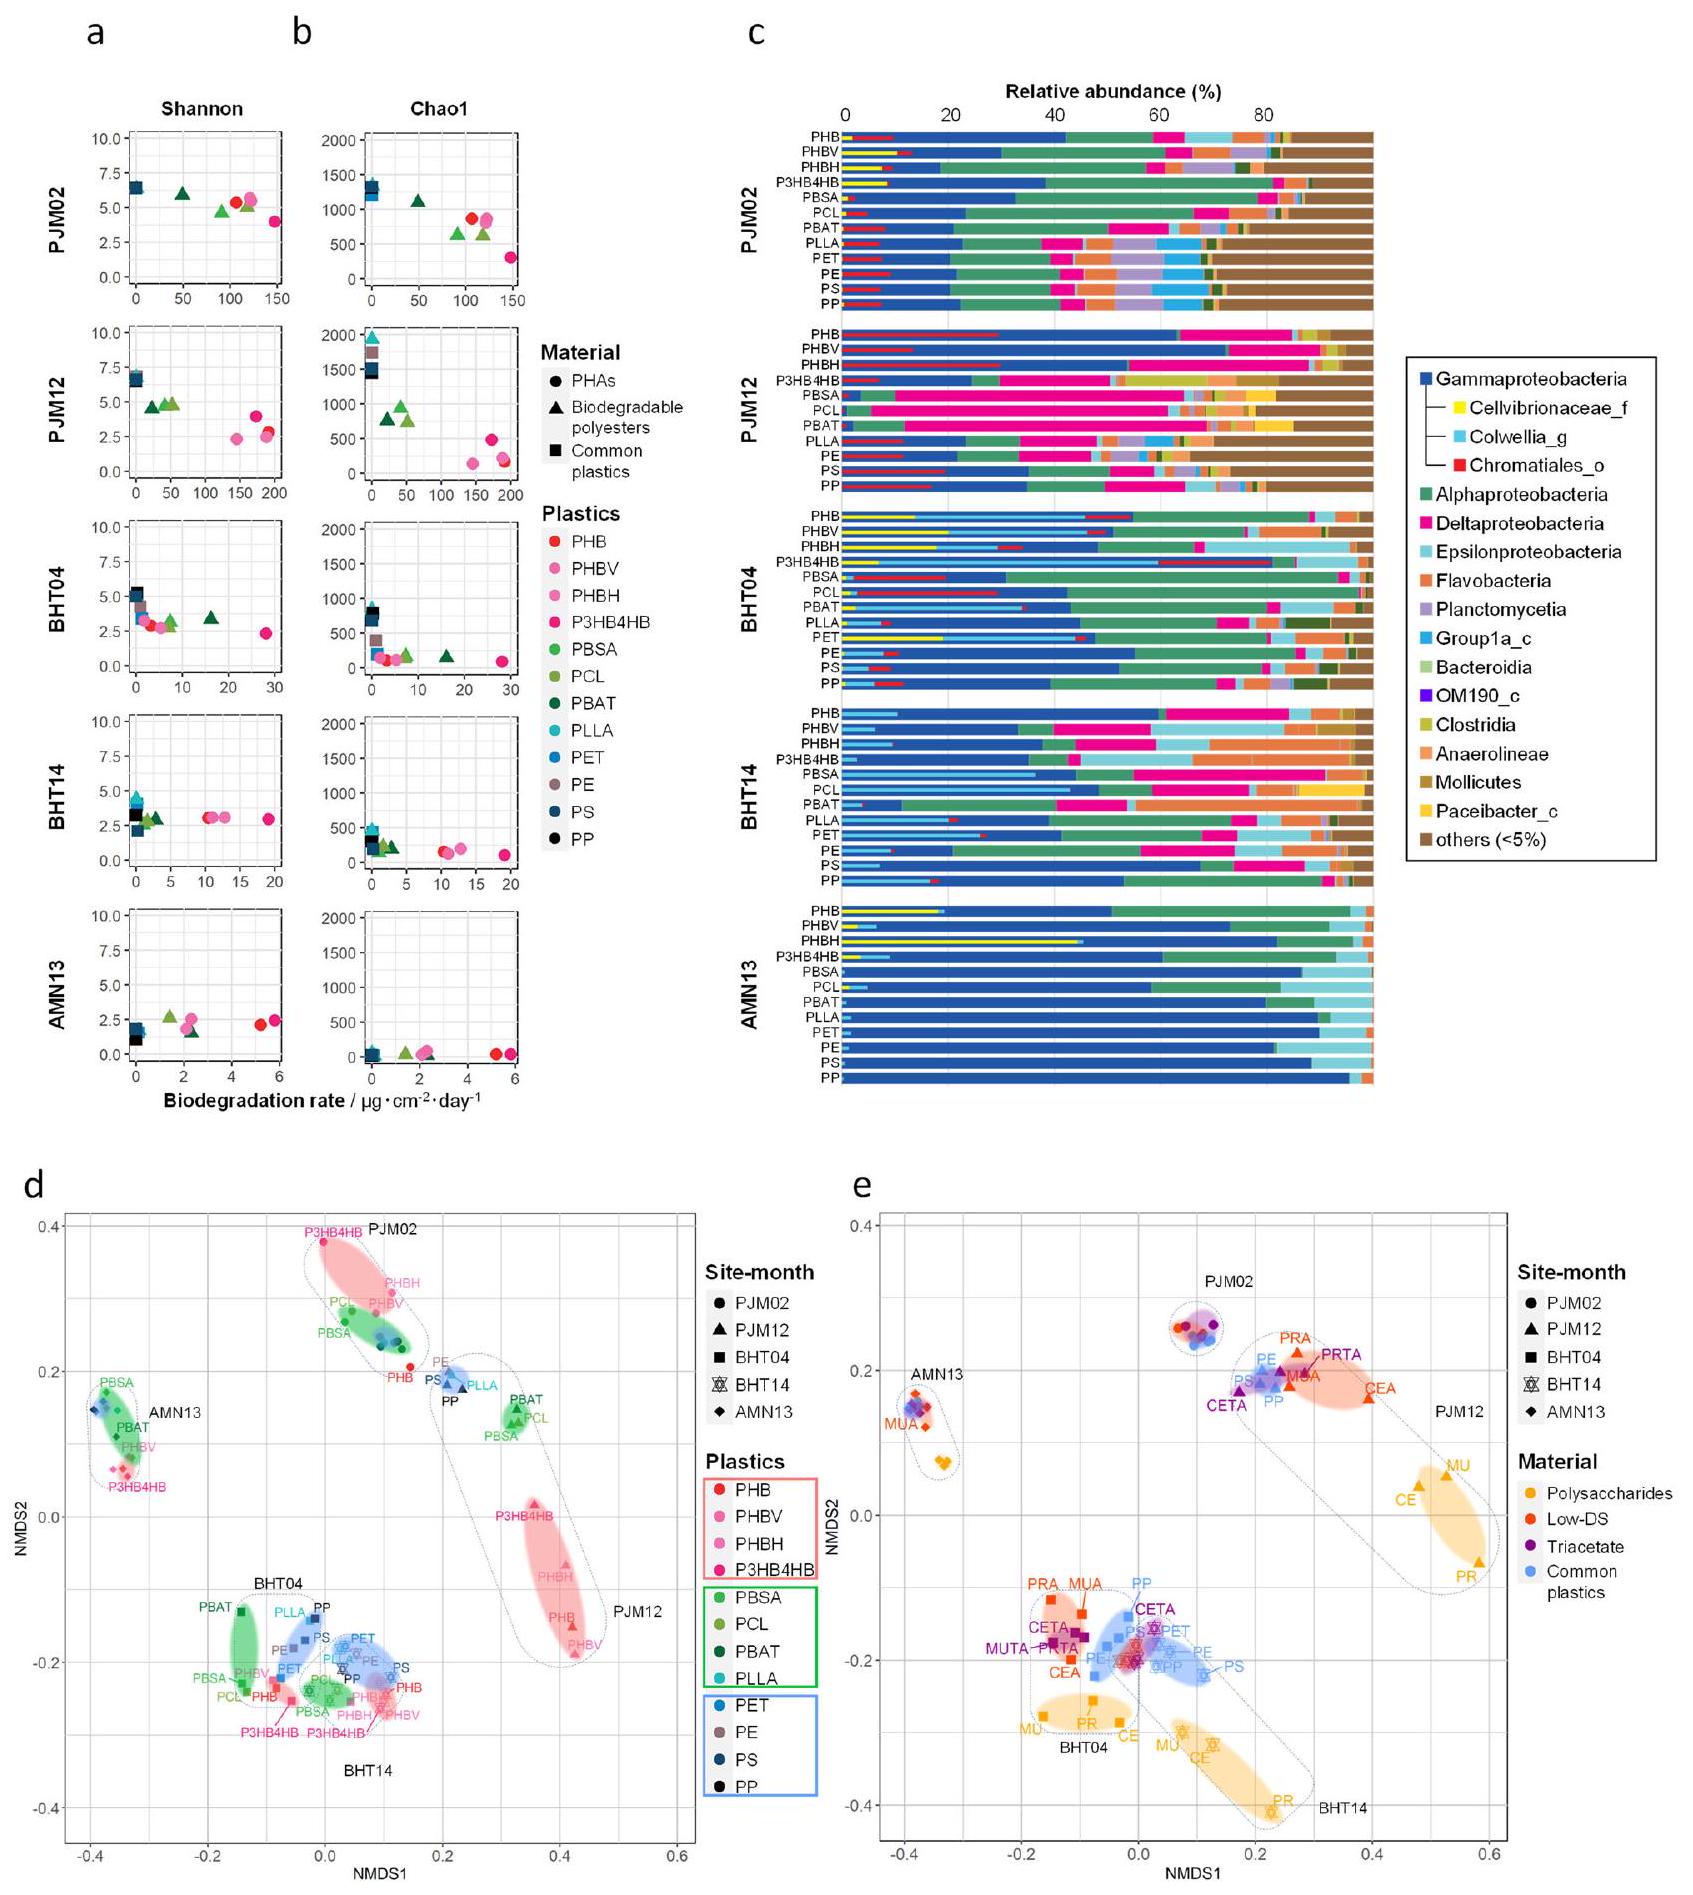
تم قياس التغيرات في الوزن لعينات مصبوبة بالحقن والأفلام؛ تم تعريف معدل التحلل المحسوب من مساحة السطح وفترات الغمر كمعدل التحلل البيولوجي (الشكل 4a، ب، البيانات التكميلية 1، 3، الجداول التكميلية 1-6).
معدلات التحلل البيولوجي لعينات مصبوبة بالحقن من PHAs والبوليستر القابل للتحلل المغمورة في BHT لمدة 431 يومًا (BHT14)، وAMN لمدة 390 يومًا (AMN13)، وPJM لمدة 369 يومًا (PJM12) موضحة في الشكل 4a والجدول التكميلية 3. تم حساب معدل التحلل البيولوجي في البيئة البحرية من خلال تطبيع فقدان الوزن الناتج عن التحلل البيولوجي بالنسبة إلى مساحة السطح الأولية في اليوم (تم التأكيد على أن PLLA وأربعة أنواع من البلاستيك الشائع غير القابل للتحلل (PE، PP، PS، PET) لم تتحلل على الإطلاق في أي من مواقع الشاطئ أو أعماق البحر، بينما وُجد أن البوليستر القابل للتحلل باستثناء PLLA قد تحلل بدرجات متفاوتة. كانت نسبة التحلل البيولوجي لـ PHA عند الشاطئ في هذه الدراسة مشابهة للنتائج المبلغ عنها سابقًا على الشواطئ في جميع أنحاء العالم.من المثير للاهتمام، عند مقارنة معدل التحلل الحيوي لـ PHA في مواقع أعماق البحار مع ذلك على الشاطئ، كان المعدل يميل إلى التباطؤ مع العمق.
تظهر معدلات التحلل البيولوجي للأفلام على مدى فترة زمنية قصيرة في مواقع أخرى وعلى أعماق مختلفة في الشكل 4ب وفي الجداول التكميلية 1 و 2 و 4-6. ومن المثير للاهتمام، أنه تم ملاحظة فرق واضح في معدل التحلل البيولوجي بين مواقع BHT و BMS و BMJ عند أعماق مقارنة بمواقع AKR و AMN عند أعماق . بالنسبة لـ PHB، الذي كان لديه أبطأ معدل تحلل بين PHAs، مقارنة بمعدل التحلل لـيوم على الشاطئ (PJM02)، على عمق (BHT03 و BMS05 و BMJ05)، كانت معدل التحلل يوم، وعلى عمق (AKR05 و AMN13)، كانت معدل التحلل يوم . في كانت معدلات التحلل في جميع المواقع (مواقع BHT وBMS وBMJ) متشابهة، على الرغم من أن BMJ هو فتحة حرارية مائية. من المحتمل أن النتائج المشابهة لوحظت في BMJ مقارنةً بهذه المواقع الأخرى لأن مياه البحر تسخن بواسطة السائل الحراري المائي. )؛ ومع ذلك، حتى في الجوار المباشر لفتحات الحرارة المائية، يتم تبريد مياه البحر بسرعة إلى بتدفق الماء الباردتكشف نتائجنا التي تقارن معدل التحلل البيولوجي للبلاستيك القابل للتحلل عند الشاطئ وقاع البحر العميق، حيث يُعتقد أن كميات كبيرة من البلاستيك قد غرقت، أن معدل التحلل البيولوجي عند قاع البحر العميق أبطأ من الشاطئ، وأن معدل التحلل البيولوجي يعتمد على العمق (الشكل 4c، البيانات التكميلية 1). من الواضح أن النتيجة التي تفيد بأن معدل التحلل البيولوجي يعتمد على العمق مرتبطة بعدد وتنوع الكائنات الدقيقة المتحللة المحلية، والتي سيتم مناقشتها لاحقًا (الشكل 5a، b)، بالإضافة إلى حقيقة أن البحر العميق هو بيئة قاسية تتميز بانخفاض درجة الحرارة، وارتفاع ضغط الماء، وغياب ضوء الشمس.
باستخدام معدلات التحلل للبلاستيك القابل للتحلل في قاع البحر العميق التي تم الحصول عليها في هذه الدراسة، قمنا بحساب الوقت اللازم لإكمال التحلل البيولوجي لأكياس البلاستيك على الشاطئ وفي أعماق البحر.
هاتسوشيما (BHT)، على افتراض أن الأكياس البلاستيكية منتم صنع السماكات من أربعة أنواع مختلفة من الـ PHA. من النتائج التجريبية، يتدهور الـ PHA في المتوسط بحواليسمك في 3 أشهر، وبالتالييمكن أن يحدث التحلل في وقت مبكر جداً خلال فترة التجربة. عند الشاطئ، كان وقت التحلل المحسوب 6 أيام لـ PHBH، والذي اعتبر الأسرع تحللاً من بين PHAs المختبرة، و13 يوماً لـ PHB، الذي كان الأبطأ تحللاً (الشكل 4d). هذه القيم تقريباً هي نفسها تلك التي تم الإبلاغ عنها سابقاً.في قاع البحر العميق، تم حساب فترات التحلل البيولوجي لتكون حوالي 19 يومًا لـ PHBH و58 يومًا لـ PHB (الشكل 4d). بينما لا تتحلل البلاستيكات الشائعة غير القابلة للتحلل مثل PE وPP لعدة مئات من السنين، فإن هذه البلاستيكات القابلة للتحلل ستتحلل في قاع البحر العميق في فترة زمنية مقبولة. لذلك، يمكن اعتبار هذه البلاستيكات القابلة للتحلل مواد صديقة للبيئة.
تحلل البوليمرات السكرية في قاع البحر العميق
البوليسكاريدات هي بوليمرات ذات أصل بيولوجي تتواجد بكثرة في جميع أنحاء العالم. تتكون هياكل البوليسكاريدات بشكل رئيسي من وحدات الجلوكوز المرتبطة بنوعين من الروابط الجليكوسيدية. – و -)، مما يمكنهم من أداء مجموعة متنوعة من الوظائف. على سبيل المثال، السليلوز، بوليمر طبيعي للجلوكوز مرتبط بـ-روابط جليكوسيدية، توفر القوة كمكون رئيسي لجدران خلايا النباتات. ومن الأمثلة الأخرى باراميلون من الطحالب الدقيقة، وجلوكومانان المعزول من درنات أمورفوفالوس كونجاك، والكيتين أو الكيتوزان من قشور القشريات. بالإضافة إلى ذلك، فإن البوليسكاريدات ذات الروابط الجليكوسيدية والهياكل الجزيئية المختلفة، بما في ذلك البوليسكاريد غير الطبيعي موتان المرتبط بـروابط -غليكوسيدية التي قمنا بتطويرها من خلال البلمرة الإنزيمية، لديها إمكانيات كبيرة لتكون مواد بلاستيكية حيوية مفيدة..
فقدان الوزن للسليلوز (-غلوكان، CE)، باراميلون (غلوكان، PR)، ميوتان (-غلوكوز، MU)، ومشتقاته الأسيتات ذات درجات استبدال مختلفة (DS)، عند الشاطئ وفي أعماق البحر، موضحة في الشكل 4e، الجدول التكميلية 7 والبيانات التكميلية 3. تم تحلل جميع العينات في أعماق البحر، على الرغم من أن فقدان الوزن كان أبطأ من الشاطئ. بالنسبة لأسيتات السليلوز (CEA مع و CETA مع )، على الرغم من أنه تم الإبلاغ عن أن القابلية للتحلل تغيرت اعتمادًا على درجة DS في الحمأة المنشطة من المثير للاهتمام أن فقدان الوزن في قاع البحر العميق كان مشابهًا بغض النظر عن DS. تشير هذه النتيجة إلى أن استرات البوليمرات متعددة الاستبدال ذات الخصائص الحرارية تتعرض للتحلل نتيجة الغمر الطويل الأمد في أعماق البحر، ربما بسبب إزالة الاستر الناتجة عن الظروف القلوية السائدة.تم تحلل باراميلون ثلاثي الأسيتات (PRTA، DS = 3.0) وموتان ثلاثي الأسيتات (MUTA) أيضًا في أعماق البحر، مثل السليلوز ثلاثي الأسيتات (CETA). تشير هذه النتائج إلى أن استرات البوليسكاريد لديها إمكانيات كبيرة كمواد بلاستيكية قابلة للتحلل البيولوجي في البحر.
تحليل المجتمع الميكروبي للبلستيسفير
تُعرّف البلاستيسفيرات بأنها مجتمعات ميكروبية تتشكل على الحطام البلاستيكي في المحيط.للمساعدة في تحديد آلية التحلل الحيوي في البيئات البحرية، تم تحليل هياكل المجتمعات الميكروبية في البلاستيسفيرات في أعماق البحار من خلال تسلسل جين 16S rRNA. تم تقييم تنوع المجتمعات الميكروبية المرتبطة بأسطح البلاستيك بناءً على متغيرات تسلسل الأمبلكون (ASVs). انخفضت مؤشرات تنوع الكائنات الدقيقة الموجودة على البوليستر القابل للتحلل مع عمق البحر، وانخفضت أيضًا بينما زادت معدلات التحلل الحيوي (الشكل 5 أ، ب، البيانات التكميلية 4). يوجد عدد كبير جدًا من الكائنات الدقيقة في الطبيعة. لذلك، في المرحلة الأولية، من المتوقع أن تلتصق أنواع عديدة من الكائنات الدقيقة بسطح البلاستيك. من بينها، فقط عدد قليل من الكائنات الدقيقة قادرة على تحلل البلاستيك القابل للتحلل. مع مرور الوقت، يمكن للكائنات الدقيقة التي يمكنها تحلل البلاستيك أن تتكاثر، مما يؤدي إلى زيادة نسبية في نسبة الكائنات الدقيقة المحللة.. في الواقع، كما هو موضح في الشكل 5a، b، بالمقارنة، لـ
أ
الشكل 4 | معدل التحلل الحيوي لفقدان الوزن للبلاستيك في مناطق عميقة مختلفة من البحر وعملية التحلل لأفلام البلاستيك. أ معدل التحلل الحيوي لفقدان الوزن لعينات البلاستيك المصبوبة بالحقن الموضوعة في بيئات المحيطات المختلفة (عمق، قبالة ميناء مقر JAMSTEC في يوكوسوكا؛ عمق 855 م، قبالة تسرب هيدروكربوني في المياه العميقة بالقرب من جزيرة هاتسوشيما؛ وعمق 5552 م، قبالة سهل عميق حول جزيرة ميناميتورشيماسنة. القيم مقدمة منالنتائج (البيانات التكميلية 3). انظر الجدول 1 والجدول 2 للاختصارات المتعلقة بموقع التثبيت والعينات.معدلات التحلل الحيوي لفقدان الوزن لمختلف أفلام PHA والبوليستر القابلة للتحلل التي تم ضغطها بالحرارة عند وضعها على الشاطئ أو في أعماق مختلفة- مواقع البحر. القيم مقدمة كمتوسط لـعينات مستقلة مع انحرافها المعياري (البيانات التكميلية 1). ج رسم لمعدل التحلل الحيوي لكل بلاستيك مقابل العمق، يظهر أن المعدل يتباطأ مع العمق. البيانات الممثلة هي متوسط أو عينات مستقلة. د الفترة المقدرة للتحلل الحيوي لكيس بلاستيكي نموذجي (الحجم: سمك:، الوزن: 3 جرام) استنادًا إلى نتائج هذه الدراسة إذا تم استبداله بـ PHA المذكور أعلاه. e فقدان الوزن لمشتقات استر البوليسكاريد الموضوعة في بيئات المحيطات المختلفة (في PJM، 855 م في BHT، 5552 م في AMNسنة. القيم مقدمة منالنتائج (البيانات التكميلية 3). تم توفير بيانات المصدر كملف بيانات مصدر.
مثال، BHT04 مع BHT14، يمكننا أن نرى أن التنوع الميكروبي انخفض مع مرور الوقت (أي، مع تقدم التحلل). لم يتغير تنوع الكائنات الدقيقة على البلاستيكيات الشائعة غير القابلة للتحلل، مثل PE و PP، عبر مواقع الاختبار، بينما أظهر PLLA، الذي هو
بلاستيك قابل للتحلل، نفس الاتجاه مثل البلاستيكيات الشائعة غير القابلة للتحلل.
في الأفلام الحيوية بعد عدة أشهر من الغمر في قاع البحر العميق، كانت الكائنات الدقيقة السائدة بشكل رئيسي هوائية
الشكل 5| تنوع التجمعات الميكروبية على البلاستيكيات في ثلاثة مواقع بحرية بأعماق مختلفة، بناءً على تسلسل جين 16S rRNA. العلاقة بين تنوع المجتمعات الميكروبية المرتبطة بالبلاستيكيات في البيئات البحرية ومعدلات التحلل الحيوي للبلاستيكيات (البيانات التكميلية 4). يتم الإشارة إلى تنوع الأنواع البكتيرية بواسطة مؤشرات شانون (أ) وتشاول (ب). يتم عرض معدلات التحلل الحيوي للبلاستيكيات في يوم . يتم تلوين الرسوم البيانية للإشارة إلى نوع البلاستيك، ويتم تصنيف المواد إلى ثلاث مجموعات وتحديدها كما يلي، دوائر: PHAs بما في ذلك PHB و PHBV و PHBH و P3HB4HB؛ مثلثات: بلاستيكيات قابلة للتحلل بما في ذلك PLLA و PBSA و PCL و PBAT؛ مربعات: بلاستيكيات شائعة، بما في ذلك PE و PP و PS و PET. ج توزيع البكتيريا على مستوى الفئة على البلاستيكيات المغمورة في البيئات البحرية. يتم تمثيل متوسط الوفرة النسبية (%) للأنواع البكتيرية على كل بلاستيك في
اختبار الغمر البحري في مخطط شريطي أفقي. يتم اختصار مواقع أخذ العينات وفترات الغمر كما هو محدد في “الطرق” ويتم الإشارة إليها على اليسار (البيانات التكميلية 4). يتم ترميز متغيرات تسلسل الأمبليكون التي تنتمي إلى كل مجموعة تصنيف على مستوى الفئة بالألوان، كما هو موضح على اليمين. “أخرى” تشير إلى الأنواع ذات الوفرة النسبية تحت مستوى القطع من. تشير الأشرطة الداخلية في Gammaproteobacteria إلى الوفرة النسبية لثلاث عائلات، تم تمييزها بشكل أكبر بواسطة بيانات الميتاجينوميك الزوجية. د، هـ تحليل التدرج متعدد الأبعاد غير المترابط (NMDS) لتوزيع المجتمعات البكتيرية على PHAs،
البلاستيكيات القابلة للتحلل، والبلاستيكيات الشائعة (د) وعلى السكريات المتعددة ومشتقاتها الاستيرية والبلاستيكيات الشائعة (هـ)، في البيئات البحرية (البيانات التكميلية 4). قيمة ضغط NMDS: 0.113421. يتم توفير بيانات المصدر كملف بيانات مصدر.
Gammaproteobacteria و Alphaproteobacteria، كما تم تحديده بواسطة تحليل تسلسل جين 16S rRNA للأفلام البلاستيكية. في الأفلام الحيوية الناضجة، بعد عام واحد في PJM و BHT، كانت الكائنات الدقيقة السائدة بشكل رئيسي هي Deltaproteobacteria اللاهوائية (الشكل 5ج، الشكل التكميلية 13، البيانات التكميلية 4). قد تعكس هذه التغيرات حقيقة أن حاملي العينات بدأوا في الدفن في الرواسب (الشكل 1ف). كانت هذه الاتجاهات مشابهة لتلك الموجودة في تحليل تركيب المجتمع القائم على الميتاجينوم، بناءً على جين البروتين الريبوسومي S3 (RpsC)، بينما تم تحويل حالة الأكسدة والاختزال للميتا جينوم للأفلام البلاستيكية إلى أكثر اختزالية بعد الغمر طويل الأمد في قاع البحر العميق (الشكل التكميلية 14، البيانات التكميلية 5، 6).
تم أيضًا إجراء تحليل الميتاجينوم للأفلام البلاستيكية في مياه البحر العميقة بالقرب من غرفة العينة وفي الرواسب تحت قاع البحر (، و 10 سم تحت الغرفة)، وتمت مقارنة النتائج التي تم الحصول عليها مع المجتمعات الميكروبية المرتبطة بسطح البلاستيك القابل للتحلل المغمور في BHT لمدة 4 و 14 شهرًا (الشكل التكميلية 14، البيانات التكميلية 5، 6). أصبحت الكتلة الميكروبية المرتبطة بسطح البلاستيك بعد 14 شهرًا أقرب إلى المجتمع الميكروبي في الرواسب ()، ولكنها ليست قريبة من تلك الموجودة في مياه البحر العميقة (الأشكال التكميلية 15 و 16، البيانات التكميلية 5، 6). تشير هذه النتائج إلى أن الغمر طويل الأمد قد يؤثر على الأفلام البلاستيكية عبر الرواسب التي تغطي غرف العينات وأن الكائنات الدقيقة اللاهوائية مثل Deltaproteobacteria، “Candidatus Reidiella”، وآخرين قد تكون قد ارتبطت من الرواسب ونمت في الأفلام البلاستيكية (الشكل التكميلية 17، البيانات التكميلية 5، 6).
مخطط تدرج متعدد الأبعاد غير المترابط (NMDS) بناءً على تسلسل جينات 16S rRNA للأمبليكون صور بوضوح الفئة والانتقال للأفلام البلاستيكية على 12 بلاستيك تم اختباره في المواقع البحرية الثلاثة PJM و BHT و AMN (الشكل 5د). كانت الموقع الجغرافي هو العامل المحدد السائد في التركيب الميكروبي للأفلام البلاستيكية، بينما كانت مدة الغمر المرتبطة بالتغيير من بيئة هوائية إلى بيئة لاهوائية وفئة البلاستيك أيضًا عوامل تؤثر على التجميع في مخطط NMDS. تحولت الرسوم البيانية للأفلام البلاستيكية من مواقع PJM و BHT إلى الجانب السفلي الأيمن مع مرور الوقت، مما يشير إلى أن الظروف داخل حامل العينة قد تغيرت من هوائية إلى لاهوائية. من المثير للاهتمام، أن الرسوم البيانية لـ PLLA تجمعت مع البلاستيكيات الشائعة غير القابلة للتحلل بدلاً من البوليستر القابل للتحلل.
في حالة مشتقات استر السكريات المتعددة، كانت الاتجاهات العامة مشابهة لتلك الخاصة بالبوليستر القابل للتحلل (الشكل 5هـ، الأشكال التكميلية 18 و 19). تم ملاحظة ثلاث مجموعات رئيسية من الأفلام البلاستيكية، ومع مرور الوقت، تحركت مواقع هذه المجموعات. من المثير للاهتمام، مع زيادة DS، اقتربت المجموعات لمشتقات استر السكريات المتعددة من تلك الخاصة بالبلاستيكيات الشائعة. تمتلك مشتقات استر السكريات المتعددة ذات DS العالي سطحًا كارهًا للماء بشكل كبير، مشابهًا لذلك الخاص بالبلاستيكيات الشائعة، مما يجعل من الصعب على الكائنات الدقيقة الارتباط بها وتحللها.
تحليل الميتاجينوم يحدد الكائنات الدقيقة المحتملة القادرة على تحلل البلاستيك
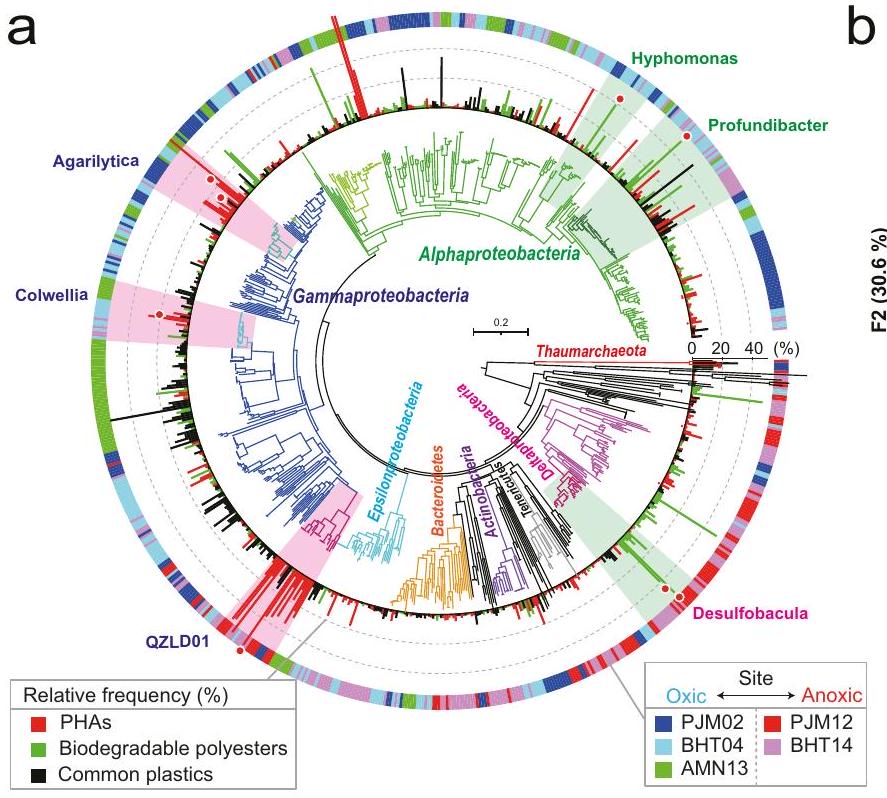
تم تحليل الكائنات الدقيقة التي نمت بشكل خاص على البلاستيكيات القابلة للتحلل للبحث عن وجود جينات تحلل البوليمر في جينوماتها باستخدام الميتاجينوميك المركز على الجينوم (الشكل 6أ، الأشكال التكميلية 14 و 20 و 21، الجدول التكميلية 8، البيانات التكميلية 5-8). حددنا 17 جينومًا مسودة عالي الجودة (جينومات مجمعة من الميتاجينوم، MAGs) من الكائنات الدقيقة السائدة من الميتاجينومات، وجميعها تتوافق مع ASVs ذات الوفرة العالية بناءً على تحليل تسلسل جين 16S rRNA (الشكل 6أ، الأشكال التكميلية 21-24، البيانات التكميلية 9). أظهر مخطط تحليل التوافق الكنسي الموزون (wCCA) (الشكل 6ب) أن الأجناس Colwellia و Agarilytica و Micavibrio تتوافق مع الأفلام البلاستيكية PHA في ظروف هوائية، بينما تتوافق رتبة QZLD01 (المعينة كـ “Candidatus Reidiella” لتحليل RpsC) مع الأفلام البلاستيكية PHA في
ظروف لاهوائية. تم تحديد جينات ترميز إنزيمات تحلل PHA المحتملة من الأنواع الميكروبية التي تنتمي إلى فئات Gammaproteobacteria و Alphaproteobacteria و Deltaproteobacteria. علاوة على ذلك، كانت جينومات Colwellia و Agarilytica و QZLD01 كل منها ترمز إلى إنزيمات PHA القابلة للإفراز ، مما يشير إلى أن التحلل الحيوي البحري قد يكون ناتجًا عن هذه الإنزيمات المحللة للبلاستيك PHA (الشكل 6ج، الأشكال التكميلية 24 و 25أ و 26-31، الجدول التكميلية 9، البيانات التكميلية 9). يُعرف Colwellia بأنه بكتيريا مصنعة لـ PHA في أعماق البحر، وتمت ملاحظته أيضًا في الأفلام البلاستيكية البحرية على، بينما يُعرف Agarilytica بتحلل البوليمرات الكربوهيدراتية مثل الأجار. ومع ذلك، لا توجد تقارير تفيد بأن Colwellia و Agarilytica يفرزان عددًا من إنزيمات تحلل PHB في قاع البحر العميق. من المثير للاهتمام، أنه تم اكتشاف كائن حي في رتبة QZLD01 أيضًا في الميتاجينوم للأفلام البلاستيكية التي تشكلت عندما تم غمر PHA في خليج المكسيك الشمالي، ويُفترض أنه يقوم بتحلل PHA في أعماق البحر حول العالم، على الرغم من أنه لا يزال غير مزروع في المختبر.
من بين الكائنات الدقيقة الأخرى التي لديها قدرة واضحة على تحلل البوليستر القابل للتحلل، وُجد أن جينومات Profundibacter و Hyphomonas و Desulfobacula كل منها ترمز إلى أكثر من 2 إنزيم تحلل محتمل، إنزيمات بوليستر قابلة للإفراز وإنزيمات كوتيناز (الشكل 6ج). بالإضافة إلى ذلك، وُجد أن أربعة من ستة MAGs من أنواع ميكروبية أخرى بدت تفتقر إلى إنزيمات تحلل PHB المفرزة كانت ترمز إلىالإنزيمات المحتملة للتدهور (الكوتيناز والبوليسترازات) (الأشكال التكميلية 25a، 26-31، الجدول التكميلية 9، البيانات التكميلية 9). وهذا يشير إلى أن الكائنات الدقيقة القادرة على تدهور البوليسترينات القابلة للتحلل لها خصوصية مادية. لم يتم الإبلاغ عن الكائنات الدقيقة الموصوفة في هذا القسم بأنها تقوم بتدهور البوليسترينات القابلة للتحلل. ومع ذلك، تشير التحليلات الميتاجينومية جنبًا إلى جنب مع تحليل المجتمع الميكروبي إلى أن الكائنات الدقيقة التي تحمل جينات التدهور المحتملة هي السائدة على أسطح البلاستيك التي تخضع للتدهور في مواقع أعماق البحار، وأن البلاستيك القابل للتحلل الذي أظهر تدهورًا في هذه الدراسة كان قابلًا للتحلل البحري، أي أن هيكل البوليمر يمكن أن يتدهور بفعل الكائنات الدقيقة. لتوضيح هذه الأمور، سيكون من الضروري في المستقبل عزل الكائنات الدقيقة التي تبدو قادرة على تدهور بعض البلاستيكات القابلة للتحلل وعزل الإنزيمات المتدهورة التي قد تفرزها.
التوزيع العالمي للميكروبات البحرية المحتملة القادرة على تحلل البلاستيك
هدفنا إلى تعميم نتائج هذه الدراسة على المحيطات العالمية، مع الأخذ في الاعتبار الفروق الإقليمية المحتملة، من خلال مسح التوزيع العالمي للميكروبات التي تم تحديدها في هذه الدراسة والتي قد تكون متورطة في تحلل البلاستيك القابل للتحلل. تم استخدام تسلسلات جينات الرنا الريباسي الكامل التي تم الحصول عليها بشكل افتراضي من MAGs كبيانات مرجعية للمقارنة مع المعلومات المتاحة علنًا عن الرواسب البحرية (الشكل 6d، الشكل التكميلية 25b). أظهرت النتائج أن Colwellia (المرتبطة بالتحلل الهوائي لـ PHA) موزعة في الرواسب البحرية في جميع أنحاء العالم، وأن Agarilytica (المتعلقة أيضًا بتحلل PHA) وHyphomonas (المتعلقة بتحلل البوليستر القابل للتحلل) منتشرة أيضًا نسبيًا في مناطق عميقة مختلفة من المحيطات حول العالم التي تحتوي على بلاستيسفيرات. بالنظر إلى وجود هذه المجتمعات الميكروبية، قد تخضع PHAs وغيرها من البوليستر القابل للتحلل التي تم فحصها في هذه الدراسة للتحلل في مناطق محيطية أخرى أيضًا.
الاستنتاجات
تظهر هذه الدراسة أن البلاستيك القابل للتحلل يتحلل في الموقع النهائي لمخلفات المحيط، وهو قاع البحر العميق، عند أعماق مختلفة، وأن بعض الكائنات الدقيقة المحددة يبدو أنها تمتلك القدرة على تحلل معظم البلاستيك القابل للتحلل، وخاصة PHA، والبوليمرات القابلة للتحلل، ومشتقات استر السكريات المتعددة. وتتباطأ معدل تحلل البلاستيك القابل للتحلل مع العمق.
ج
معرف موقع_MAG
تصنيف قائم على RpsC
أوكسيك/ أنوكسيك
OTU
التكرار النسبي
حجم الجينوم (زوج القواعد)
لا. السقالات
البوليميرازات PHB
كوتيناز/ بوليسترز
البلاستيك
BHT04_PHB جيم1
أغارليتيكا
أوكسيك
ASV012
ASV012*
٧.٥٪
٥,٣٠٢,٠١٤
٩٨
٢٩
الـ PHAs
قابل للتحلل البيولوجي
البوليستر
AMN13_PHB لعبة1
٥٤٢٠٥٢٩
١٢٥
٢٨
BHT04_PHB جيم2
أغاريلتيكا كولويلية
أوكسيك
ASV002
15.8%
٣,٨٩٠,٢٢٨
641
16
BHT14_PHBH gam1
QZLD01 بروفوندباكتير
نقص الأكسجين
ASV006
62.2%
٣,١٠٨,٧٤٩
٢٦
15
BHT04-PBSA ألفا1
بروفوندباكتير هيبوموناس
أوكسيك
ASV017
٤٩.٢٪
٣,٧٦٧,٦٨٥
٤٣
0
2
BHT04_PCL alp1
أوكسيك
ASV047
٣٨.٧٪
٣,٢٧٧,٥٨٤
10
0
PJM12_PCL del1
]
دي سلفوباكيلا
–
دي سلفوباكيلا
نقص الأكسجين
ASV106
51.3٪
5,169,573
75
0
BHT14_PCL del1
ASV106*
٣٩٫٠٪
٤٤٦٥٨٨٠
311
0
الشكل 6 | المعلومات الجينومية والتوزيع العالمي للميكروبات السائدة ضمن البلاستيسفيرات التي تم إنشاؤها على PHAs والبوليمرات القابلة للتحلل في أعماق البحار. أ شجرة النشوء والتطور للبروتين الريبوسومي S3 (RpsC) المحدد في جميع التجميعات الميتاجنومية. يتم عرض تصنيف البروتينات بألوان مختلفة للعقد. يتم عرض التردد النسبي ضمن المجتمعات بواسطة مخطط شريطي خارج الشجرة، مع أنواع البلاستيك المختلفة المشار إليها بالألوان (أحمر، PHAs؛ أخضر، بوليمرات قابلة للتحلل؛ أسود، بلاستيك شائع). يتم عرض الموقع ومدة الغمر كشرائط ملونة خارج المخطط الشريطي. تم تمييز الجينومات المجمعة من الميتاجينوم (MAGs) المستخدمة للتحليل الإضافي بنقطة حمراء، بينما يتم وصف تصنيفاتها أيضًا (البيانات التكميلية 5-9). ب مخطط تحليل التوافق الكنسي الموزون (wCCA). يظهر مخطط wCCA العلاقات بين خمسة متغيرات بيئية (أسهم حمراء لسلسلة البلاستيك، وأسهم سوداء لحالة الأكسدة والاختزال)، المواقع (دوائر خضراء مفتوحة)، و الميكروبات السائدة (النقاط). حجم النقطة يشير إلى الترددات النسبية المجمعة بين 60 بلاستيسفير (الحد الأقصى 6000%)، بينما لون النقطة يشير إلى الأنواع. بالنسبة للبروتيوبكتيريا ألفا و غاما و دلتا، تم استخدام الأجناس الوفيرة (التردد النسبي المجموع >50%) للتحليل. ج الإحصائيات لعدد MAGs التي تم ملاحظتها بكثرة داخل البلاستيسفير، والتي تنتمي إلى الأنواع المرتبطة بـ PHAs أو البلاستيكات القابلة للتحلل في ظروف أكسجينية/لا هوائية في مخطط wCCA. يتم عرض عدد الجينات الرئيسية المتعلقة بتحلل البلاستيك. د التوزيع العالمي لستة محطات محتملة لتحلل PHAs والبلاستيكات القابلة للتحلل في الرواسب البحرية. تم استخدام تسلسلات الجينات الكاملة 16S rRNA من كل MAG للتحليل، مع استخدام تسلسلات الجينات العامة 16S rRNA المتاحة للجمهور كمرجع. تم توفير بيانات المصدر كملف بيانات المصدر.
ومع ذلك، لم تتحلل مادة PLLA والبلاستيكات الشائعة غير القابلة للتحلل (PE، PP، PS، PET) على الإطلاق، سواء على اليابسة أو في قاع البحر العميق، بغض النظر عن العمق. علاوة على ذلك، يحتوي نظام قاع البحر العميق على تنوع كبير من الكائنات الدقيقة الهوائية واللاهوائية التي قد تكون قادرة على تحلل البلاستيكات القابلة للتحلل باستخدام إنزيمات التحلل الخاصة التي تفرزها، وعادة ما تكون هذه الكائنات الدقيقة موزعة على مستوى العالم. في المستقبل، يجب تطوير بلاستيكات بحرية قابلة للتحلل تتحلل بأسرع ما يمكن بمجرد تصريفها في المحيط. يجب أيضًا تطوير بلاستيكات بحرية عالية الأداء قابلة للتحلل لا تتحلل أثناء الاستخدام، ولكن بدلاً من ذلك تنشط مفتاح التحلل عند تصريفها في المحيط، مما يضمن تحللها.
طرق
تحضير العينة
تم شراء PHAs والبلاستيكات الحيوية القابلة للتحلل والبلاستيكات الشائعة غير القابلة للتحلل المستخدمة في هذه الدراسة من شركات مختلفة أو تم توفيرها من قبلها كما هو مدرج في الجدول 2. تم الحصول على ثلاثي الأسيتات من البوليسكاريد (DS =3) وأسيتات البوليسكاريد (DSتمت تخليقها من محلول بوليسكاريد في ثنائي ميثيل أسيتاميد/كلوريد الليثيوم عن طريق إضافة البيريدين وأنهيدريد الأسيتيك لفترات تفاعل مختلفة فيتم تلخيص الأسماء الرسمية والاختصارات والخصائص الحرارية والهياكل الكيميائية لجميع العينات في الجدول 2 والشكل التوضيحي 1.
تم إعداد قوالب الحقن والأفلام المضغوطة بالذوبان فوق نقاط انصهار العينات باستخدام جهاز HAAKE MiniJet Pro (ثيرمو فيشر ساينتيفيك، وولثام، ماساتشوستس، الولايات المتحدة الأمريكية) وجهاز Mini Test Press (تويوزيكي، اليابان)، على التوالي. كانت أحجام العينات لقوالب الحقن والفيلم تقريبًا، و “، على التوالي. في حالة البوليسكاريدات، تم الحصول على هلام متجدد من البوليسكاريدات النقية وأسيتات البوليسكاريد (DS ) تم تحضيرها ثم ضغطها عند 2 ميغاباسكال ولتجفيفها ببطء للحصول على أفلام. تم تحضير أفلام من ثلاثي أسيتات البوليسكاريد بواسطة طريقة صب المحلول من محلول الكلوروفورم. تم وضع العينات المصبوبة بالحقن مباشرة في حاويات مقسمة إلى تسعة أقسام بواسطة أوراق تفلون. تم إغلاق الحاويات بـشبكة بولي إيثيلين لمنع العينات من التسرب خارجًا ولكن للسماح بمرور مياه البحر والميكروبات عبر الحاويات (الشكل 1c والشكل التكميلي 2). تم ختم الأفلام المضغوطة بالحرارة والأفلام المصبوبة بشبكة بولي إيثيلين بفجوة 1 مم ووُضعت في الحاوية (الأشكال التكميلية 2a و3a). تم دمج هذه الحاويات كما هو موضح في الأشكال التكميلية 2b و3b وتم تغطيتها بشبكة كما هو موضح في الأشكال التكميلية 2c و3b.
تم قياس سمك العينات المختلفة قبل وبعد اختبارات تدهور البيئة، في، عند خمس نقاط، باستخدام ميكرومتر رقمي (ميتسوتوي، اليابان) وتم حساب المتوسط. بالنسبة لسمك الفيلم المضغوط بالذوبان، تم قياس خمس نقاط (في الزوايا الأربع وفي المركز من)تم الحصول على قيمة المتوسط والانحراف المعياري. تم قياس الأبعاد بالسنتيمتر إلى منزلتين عشريتين باستخدام مقياس رقمي (شينوا، اليابان). تم قياس الأوزان بالجرام إلى أربع منازل عشرية باستخدام ميزان إلكتروني. تم الحصول على الأوزان وقياسات الأبعاد لعينة واحدة إلى اثنتين لعملية تشكيل الحقن وتم حساب المتوسط على 2-5 عينات لفيلم مضغوط بالحرارة. تم إجراء حيود الأشعة السينية واسع الزاوية ثنائي الأبعاد وتشتت الأشعة السينية بزاوية صغيرة في خط شعاع BLO3XU في منشأة إشعاع السنكروترون SPring-8 لتحديد البلورية وهياكل البلورات.
نشر العينة واستعادتها
تم إجراء اختبارات التحلل البيئي على قاع البحر العميق في خمسة مواقع: ثلاثة مواقع بحرية عميقة [قاع البحر العميق قبالة ميناء ميساكي، BMS (, على عمق 757 م تحت مستوى سطح البحر)؛ تسرب الهيدروكربونات قبالة جزيرة هاتسوشيما، BHT (, , على عمق 855 م تحت مستوى سطح البحر)؛ وفتحة حرارية مائية قبالة تل ميوجين، BMJ (, على عمق 1292 م تحت مستوى سطح البحر)]، وموقعين عميقين [السهل العميق بالقرب من كوروشي،
Extension Observatory، AKR (, على عمق 5503 م تحت مستوى سطح البحر)، والسهل العميق حول جزيرة ميناميتورشيما، AMN (, على عمق 5552 م تحت مستوى سطح البحر)]. كموقع مرجعي قريب من المدن الكبيرة والأنهار، تم إجراء نفس الاختبارات أيضًا في بيئة ساحلية [ميناء JAMSTEC مقر يوكوسوكا، PJM ( شمالًا، شرقًا، على عمق 2-6 م)] (الشكل 1أ، ب والجدول التكميلي 1). تم إعداد الشكل 1أ باستخدام GeoMapApp (www.geomapapp.org) / CC BY / CC BY (رايان وآخرون، 2009) .
تم نشر واستعادة عينات البحر العميق بواسطة المركبة المأهولة (HOV) شينكاي 6500 أو المركبات التي يتم تشغيلها عن بُعد (ROVs؛ هايبر دولفين وكايمي-ROV)، باستثناء AMN، حيث تم استخدام نظام هبوط المراقبة البحرية من نوع السقوط الحر Edokko Mark 1 (الشكل التكميلي 4). أثناء استعادة العينات، تم وضع غرف العينات في صندوق عينة مع غطاء حتى يتم استعادة HOV أو ROV على متن السفينة، لتجنب التلوث بمياه البحر من الطبقة العليا. ومع ذلك، أثناء الاستعادة في AMN، مرت غرف العينات المثبتة في نظام الهبوط عبر عمود الماء، مما أدى إلى احتمال التلوث.
تم تفكيك غرف العينات بسرعة، وتم قطع عينة العينة إلى ثلاث قطع وخضعت للتثبيت. تم وضع قطعة واحدة في مياه البحر المعقمة عند لدراسات الميكروبيوم، وتم تخزين قطعة واحدة عند للتوصيف الفيزيائي الكيميائي واستخراج الحمض النووي، وتم معالجة قطعة واحدة للملاحظة باستخدام SEM. تم تنشيط العينات في ماء مقطر لمدة 30 ثانية لإزالة الفيلم الحيوي السطحي. ثم تم تجفيف العينات بالفراغ طوال الليل في درجة حرارة الغرفة. تم قياس الأوزان بالجرام إلى أربع منازل عشرية باستخدام ميزان إلكتروني. تم قياس سمك الفيلم والأبعاد كما هو موضح في قسم إعداد العينة أعلاه. كانت الأوزان وقياسات الأبعاد لعينة واحدة إلى اثنتين لعملية تشكيل الحقن، وتم حساب المتوسط على 2-5 عينات للفيلم. تم تحديد فقدان الوزن بواسطة المعادلة (1):
في BHT، تم جمع الرواسب السطحية بالقرب من غرفة العينة (أو الغرف) وتحت الغرفة (أو الغرف) باستخدام مثقاب دفع (قطر داخلي ) تم التحكم فيه بواسطة HOV شينكاي 6500. تم تقطيع عينات الرواسب المستعادة على الفور أفقيًا عند , ، وعمق وتم تجميدها عند . تم جمع مياه البحر القاع ( فوق قاع البحر) باستخدام جهاز أخذ عينات مياه نيسكين عند نقطتي الهدف المتجهتين ( بعيدًا) وعند موقع النشر قبل الهبوط على قاع البحر. تم تصفية مياه البحر القاع بواسطة Sterivex (PVDF بحجم مسام ) على السطح وتم تجميد الفلتر على الفور عند .
العمر المقدر لأكياس البلاستيك
تم استخدام المعادلة (2) لحساب فقدان الوزن الناتج عن التحلل البيولوجي لكل مساحة أولية يوميًا ( يوم)، وتم توحيد البيانات. وهذا يسمح بمقارنة البيانات لاختبارات التحلل البيولوجي التي أجريت في بيئات بحرية مختلفة.
حيث يمثل معدل التحلل البيولوجي ( يوم)؛ و هو انخفاض الكتلة (غرام)؛ و هو المساحة السطحية الأولية ()؛ ويمثل الوقت للتحلل البيولوجي (يوم).
تم افتراض أن كيس البلاستيك النموذجي كان بسمك ، وعرضه 18 سم، وطوله 42 سم، ووزنه 3 غرامات، كما تم قياسه فعليًا. لاحظ أن المساحة السطحية للفيلم () هي ضعف مساحة جانب واحد، وأن كيس البلاستيك يُفترض أن يتضمن مستطيلين بعرض 18 سم وطول 42 سم. من الشكل 2 ح والشكل التكميلي 5أ-ج، ينخفض سمك الفيلم بشكل خطي من بداية التحلل.
نظرًا لأن فيلمًا بسمك سيتحلل خلال 4 أشهر، يُعتبر أن كيس البلاستيك سيتحلل في ظروف هوائية (أي قبل أن تصبح البيئة لاهوائية). وبالتالي، تم حساب الوقت المقدر للتحلل باستخدام قيم معدل التحلل لـ PJM02 وBHT03 في ظروف هوائية. تم حساب الوزن المتبقي لأكياس البلاستيك باستخدام المعادلة (3). تم استخدام أسرع وأبطأ معدلات التحلل البيولوجي التي تم الحصول عليها من التجارب التي أجريت مع عينات .
اختبارات BOD (قابلية التحلل البيولوجي BOD)
تم تقييم التحلل البيولوجي في المياه البيئية باستخدام جهاز قياس BOD (OxiTop IDS، WTW، ألمانيا). في زجاجة زراعة (حجم داخلي 250 مل)، تم خلط 100 مل من مياه البحر مع من محلول العازلة (، و أليثيويوريا. كان وزن العينة . تم إجراء اختبارات BOD في حاضنة لمدة شهر، وتم قياس بيانات BOD يوميًا. تم حساب قابلية التحلل البيولوجي BOD من المعادلتين (4) و(5)، وتم حساب فقدان الوزن من المعادلة (6).
حيث هو قيمة BOD المقاسة عند إضافة العينة، و هو قيمة BOD المقاسة في الاختبارات الفارغة، وThOD هو الطلب النظري للأكسجين (انظر المعادلة 5).
حيث هو وزن العينة الأولي (ملغ)، و هو الوزن الجزيئي لوحدة المونومر .
حيث هو وزن العينة الأولي (ملغ) و هو وزن العينة بعد التحلل الميكروبي (ملغ).
SEM
تم تثبيت البكتيريا المرتبطة بعينة البلاستيك باستخدام فورمالديهايد في محلول عازلة فوسفات 0.1 م يحتوي على 150 مليمول من NaCl (pH 7.4)، ثم تم غسلها بالماء النقي. تم تجفيف العينات المثبتة باستخدام سلسلة متدرجة من الإيثانول () لمدة 10 دقائق في درجة حرارة الغرفة ثم تم استبدالها مرتين بالكحول التيرت-بيوتيلي. بعد ذلك، تم تجفيف العينات بالتجميد، ثم تم تغليفها بالذهب باستخدام جهاز MSP-1S المغناطيسي قبل الفحص في JCM-7000 (JEOL، اليابان) باستخدام كاشف إلكتروني ثانوي بجهد تسريع 5 كيلو فولت. لإنشاء صور تآكل ثلاثية الأبعاد، تم غسل العينات غير المثبتة بالماء النقي باستخدام حمام تنظيف بالموجات فوق الصوتية لبضع ثوان لإزالة البكتيريا الملتصقة والحطام. تم تجفيف العينات بالهواء وتم تغليفها بالذهب. تم إعادة بناء أربع صور SEM تم تسجيلها بواسطة كاشف إلكتروني مرتد إلى صورة ثلاثية الأبعاد باستخدام برنامج SMILEVIEW maps (JEOL، اليابان).
استخراج الحمض النووي لتسلسل جين 16S rRNA
تم تخزين العينات المقطوعة من العينات المجمعة في 40 مل من مياه البحر الاصطناعية المعقمة من دايغو SP لوسائط الطحالب البحرية
(فوجي فيلم واكو، أوساكا، اليابان) أثناء النقل إلى المختبر. ثم، بعد الطرد المركزي عند لمدة 10 دقائق في درجة حرارة الغرفة، تم التخلص من 30 مل من السائل الطافي، وتم هز الأنبوب الذي يحتوي على العينة بسرعة كاملة لمدة دقيقتين باستخدام Vortex-Genie 2 (Scientific Industries) في درجة حرارة الغرفة. بعد ذلك، تم طرد 6 مل من السائل الطافي عند لمدة 10 دقائق في درجة حرارة الغرفة، وتم تجميد الرواسب عند حتى استخراج الحمض النووي.
تم إجراء استخراج الحمض النووي باستخدام مجموعة Extrap Soil DNA Kit Plus Ver. 2 (BioDynamics Laboratory Inc.، طوكيو، اليابان) كما يلي. تم إعادة تعليق الرواسب في من محلول الاستخراج و من محلول التحلل (المقدم) وتم نقلها إلى أنبوب الخرز (المقدم). بعد الحضانة لمدة 10 دقائق عند ، تم تدمير الخلايا بواسطة ضرب الخرز لمدة 60 ثانية عند باستخدام جهاز FastPrep-24 (MP Biomedicals). تم تكرار ضرب الخرز ثلاث مرات، مع الحفاظ على العينة على الثلج لمدة 5 دقائق بين الجولات. تم تنفيذ الخطوات التالية وفقًا لتعليمات الشركة المصنعة. تم تقدير النقاء بناءً على الامتصاص عند (NanoDrop2000c، NanoDrop 2000/ 2000c الإصدار 1.5، ثيرمو فيشر ساينتيفيك). تم قياس تركيز الحمض النووي مزدوج الشريط في كل عينة باستخدام VarioSkan Flash (SkanIt RE لـ Varioskan Flash الإصدار 2.4.5، ثيرمو فيشر ساينتيفيك) مع Pico Green (ثيرمو فيشر ساينتيفيك).
تسلسل أمبليكون جين 16S rRNA
تم تنفيذ بروتوكول PCR ذو خطوتين لتوليد مكتبات الأمبليكون المستهدفة للمنطقة الفائقة التغير V4 من جين 16S rRNA. تم إجراء تفاعلات PCR للدورة الأولى (، في ثلاثة نسخ) استخدم KOD-Plus Ver. 2 (شركة تويوبو المحدودة) مع 240 نانومتر من الشريط الأمامي (5′- ACACTCTTTCCCTA CACGACGCTCTTCCGATCTNNGTGYCAGCMGCCGCGGTAA-3)وعكس (5′- GTGACTGGAGTTCAGACGTGTGCTCTTCCGATCTNNGGA CTACNVGGGTWTCTAAT – 3 )البرايمرات وDNA القالب ). كانت ظروف الدورة الحرارية كالتالي: لمدة دقيقتين؛ دورات منلـ لمدة 30 ثانية ، و لمدة 30 ثانية. ثم تم تجميع تفاعلات PCR الثلاثية وتنقيتها باستخدام كرات SPRIselect (Beckman Coulter). تم استرجاع الأمبليكون باستخدام محلول EB (Qiagen) وتم قياس كميته باستخدام PicoGreen. لإرفاق الفهارس المزدوجة ومحولات التسلسل، تم إجراء تفاعلات PCR للدورة الثانية ( ) تم تنفيذها باستخدام KOD-Plus Ver. 2 مع 180 نانومتر من الأمام (5′- CAAGCAGAAGACGGCATACGAGAT[i7] GTGACTGGAGTTCAGACGTGTGCTCTTCCGATCT-3′) والخلف ( – A ATGATACGGCGACCACCGAGATCTACAC[i5]ACACTCTTTCCCTACAC GACGCTCTTCCGATCT-3) البادئات و 5 نانوغرام من منتج PCR المنقى من الجولة الأولى. كانت ظروف الدورة الحرارية كما يلي: لمدة دقيقتين؛ 8 دورات منلـ لمدة 30 ثانية، و لمدة 45 ثانية. ثم تم تنقية الأمبليكون باستخدام كرات SPRIselect وتم إزالتها باستخدام محلول EB. تم قياس تركيز الحمض النووي باستخدام PicoGreen. تسلسل الطرفين المتقابلين (تم تنفيذ ذلك باستخدام مجموعة مواد MiSeq v2 (500 دورة).
تم إيداع جميع التسلسلات الخام لتسلسل أمبليكون جين 16S rRNA في أرشيف قراءة التسلسل في DDBJ (بنك بيانات الحمض النووي في اليابان) تحت رقم الوصول DRA014821 في مشروع البيولوجيا PRJDB14280.
معالجة القراءة لتسلسل جين 16S rRNA
تم إجراء تحليلات المجتمع الميكروبي باستخدام خط أنابيب QIIME2 الإصدار qiime2-2021.4تم تقليم القراءات الخام باستخدام ملحق q2-cutadapt وطريقة trim-paired مع الخيارات (–p-front-f GTGYCAGCMGCCGCGGTAA، –p-front-r GGACTACNVGGGTW TCTAAT، –p-error-rate 0.15، و –p-discard-untrimmed). تم تجميع القراءات المقلمة وإعادة تكرارها إلى ASVs باستخدام ملحق q2-dada2 وطريقة denoise-paired مع الخيارات (–p-trunc-len-f 200 و –p-trunc-len-r 190). تم إجراء تعيينات التصنيف لـ ASVs باستخدام QIIME2 مع ملحق q2-feature-classifier وطريقة classify-sklearn ضد قاعدة بيانات EzBioCloud.، و BLASTN (إصدار BLASTN 2.12) ضد قاعدة بيانات الرنا الريبوسومي 16S التابعة للمركز الوطني لمعلومات التكنولوجيا الحيوية (NCBI) (الإصدار 20210814) تلاعب بالشجرة النشوية لـ ASVs تم تنفيذ ذلك باستخدام ملحق q2-phylogeny وخط أنابيب align-to-tree-mafft-fasttree.
تحليل البيانات لتسلسل جين 16S rRNA
تم استيراد جميع البيانات إلى R v4.0.2مع qiime2R v0.99.6 (https:// جيثب.كوم/جيبيسانز/كيويم2آر/.)و phyloseq v1.34.0. ل – و تم إجراء تحليل التنوع باستخدام وظيفة phyloseq_coverage_rare في metagMisc v0.0.4 (https:// غيت هاب.كوم/فيميك/ميتاك ميسك.)مع خيار (التغطية = 0.99). لـ – و تم استخدام تحليلات التنوع، تقدير الغنى، المسافة، ووظائف الترتيب في phyloseq. ggplot2 v3.3.5 و ggrepel v0.9.1 (https://ggrepel.slowkow.com/index.html. https://community.rstudio. com/.) تم استخدامها للتصور. تم رسم الأشجار النشوية باستخدام برنامج MEGA 11 الإصدار 11.0.10بعد استخراج أعلى 50 ASVs باستخدام دالة prune_taxa في phyloseq.
استخراج الحمض النووي لتسلسل الميتاجينوم
تم وضع عينات مقطوعة، والميكروبات المحصورة في الفلتر من مياه البحر، والرواسب البحرية على الفور في“، حيث تم تخزينها حتى استخراج الحمض النووي. تم استخراج الحمض النووي باستخدام مجموعات ZymoBIOMICS DNA/RNA Miniprep (Zymo Research، إيرفين، كاليفورنيا، الولايات المتحدة الأمريكية) وفقًا لتعليمات الشركة المصنعة، باستثناء عينات الرواسب. باختصار، تم تعريض العينات البلاستيكية لضربات كروية لمدة 10 دقائق بأقصى سرعة للمخض (VortexGenie 2، Scientific Industries Inc.، بوهيميا، نيويورك، الولايات المتحدة الأمريكية). تم استخراج الحمض النووي من عينات الرواسب باستخدام مجموعة RNeasy PowerSoil Total RNA مع مجموعة استخراج الحمض النووي (QIAGEN) وفقًا لتعليمات الشركة المصنعة. تم قياس تركيز الحمض النووي باستخدام مقياس الفلورية Qubit 3.0 (Thermo Fisher Scientific). تم بناء مكتبات تسلسل الميتاجينوم باستخدام مجموعة Illumina DNA Prep (M) Tagmentation Kit (Illumina، سان دييغو، كاليفورنيا، الولايات المتحدة الأمريكية) مع Nexteraفهارس DNA CD لرموز الشريط (Illumina) وفقًا لتعليمات الشركة المصنعة. تم تقييم جودة مكتبات DNA المُنشأة باستخدام جهاز تحليل البيولوجيا Agilent 2100 مع مجموعة DNA عالية الحساسية (Agilent Technologies، سانتا كلارا، كاليفورنيا، الولايات المتحدة الأمريكية) وفقًا لتعليمات الشركة المصنعة. تسلسل الطرفين المتقابلين (تم إجراء ذلك باستخدام منصة HiSeq X في ماكروجن اليابان. تم إيداع تسلسلات الميتاجينوم في أرشيف تسلسل القراءة التابع لـ NCBI تحت رقم الوصول SRP468711.
قراءة معالجة وتقدير المعلمات البيئية
تمت معالجة تسلسلات القراءة الخام المفككة من حيث الجودة، ثم تم تطبيقها بشكل منفصل على التجميع من الصفر مع بناء الهياكل استنادًا إلى القراءات المزدوجة الطرف.-مر من 23 قاعدة أساسية، وحجم فقاعة يبلغ 800 قاعدة أساسية، وطول هيكل أدنى يبلغ 400 قاعدة أساسية على برنامج CLC Genomics Workbench الإصدار 20.0 (QIAGEN، فينلو، هولندا). تم إعادة تعيين قراءات التسلسل الخام إلى الهياكل لحساب تغطية الهياكل باستخدام وظيفة Map Reads و Contigs في برنامج CLC Genomics Workbench الإصدار 20.0 مع كسر طول يبلغ 0.7 وكسر تشابه يبلغ 0.95. تم تعيين التصنيف الضريبي المقدر للهيكل بناءً على أكثر تصنيف ضريبي مكرر لإطارات القراءة المفتوحة (ORFs) المستخرجة من الهيكل بواسطة MetaGeneMark. عبر GhostKOALA الإصدار كما هو موصوف في أماكن أخرى. تم حساب محتوى (%) باستخدام برنامج Perl المقدم في خط أنابيب MultiMetagenome.
لتقدير حالة الأكسدة والاختزال ومعدل النمو الأمثل للبلستسفير الذي يتوافق مع الظروف البيئية، تم حساب أعداد كل حمض أميني في ORFs لجميع البروتينات المترجمة من ORFs. ثم تم حساب مصفوفة الوجود لـ 20 حمضًا أمينيًا داخل المجتمع الميكروبي بالكامل من خلال مجموع أعداد الأحماض الأمينية لجميع ORFs مع وزنها باستخدام تغطية ORFs. كانت درجة حرارة النمو المثلى للميكروبيوم (تم تقديره بواسطة نسبة IVYWREL ( ) باستخدام المعادلة لتقدير حالة الأكسدة والاختزال لـ حالة الأكسدة المتوسطة للكربون في البيئة ) من البروتينات لكل تم حسابه، كما هو موضح في مكان آخر.
تحليل المجتمع الميكروبي القائم على RpsC
تم استخدام خادم التوصيف التلقائي لموسوعة كيوتو للجينات والجينومات (KEGG) (KAAS) الإصدار 3 في أبريل 2015، لتعيين مجموعة الأشكال المتجانسة (KO) باستخدام طريقة أفضل ضربة أحادية الاتجاه مع تعيين عتبة درجة التعيين إلى 45.الجين الذي يشفر بروتين الريبوسوم S3 (rpsC، K02981)، وهو علامة رئيسية لجين housekeeping أحادي النسخة لتصنيف الكائنات الدقيقة.تم استخدامه لتحليل السكان القائم على الميتاجينومباختصار، تم تعيين تصنيف بروتينات RpsC بشكل أساسي بناءً على الفئة والنوع في مخرجات GhostKOALA، وتمت مراجعتها بشكل إضافي باستخدام بحث BLASTP ضد قاعدة بيانات بروتين RefSeq. تم ضرب تغطية الهيكل، بما في ذلك جين rpsC، بطول بروتين RpsC، ونسبة “التغطية”.تم حساب “الطول” لكل قيمة مجمعة من المجتمع الميكروبي كالتردد النسبي. تم إنشاء مخطط مقياس متعدد الأبعاد مرجح (wMDS) لتجميع 60 بلاستيسفير بناءً على مصفوفة التردد النسبي للأنواع على مستوى الفئة أو الأنواع على مستوى الجنس لألفا بروتيوبكتيريا، غاما بروتيوبكتيريا، ودلتا بروتيوبكتيريا. تم إنشاء مخطط wCCA لربط الترددات النسبية المجمعة للفئة/الجنس الشائعة والمتغيرات (بلاستيسفير من PHAs، بوليستر قابلة للتحلل، بلاستيكات شائعة؛ وظروف الأكسدة، إما أكسجينية أو لا هوائية). تم إنشاء مخطط تحليل المكونات الرئيسية (PCA) لتجميع بلاستيسفير BHT، وميكروبيومات مياه أعماق البحر BHT، ورواسب BHT على أعماق مختلفة. تم حساب wMDS وwCCA وPCA باستخدام XLSTAT ECOLOGY (الإصدار 2020.4.1.1014، Addinsoft، نيويورك، نيويورك، الولايات المتحدة الأمريكية).
بروتينات RpsC بتغطية منوطولتم استخراج الأحماض الأمينية لإنشاء شجرة تطورية. تم محاذاة البروتينات باستخدام MUSCLE، وتم إنشاء شجرة تطورية لتسلسلات بروتين RpsC باستخدام خوارزمية الاحتمالية القصوى في CLC Genomics Workbench 20.0.
استخراج الجينومات المجمعة من الميتاجينوم
تم استخراج الجينومات المسودة (MAGs) عن طريق تجميع القطع باستخدام مخطط التغطية-نسبة GC%ثم تم تحسين تجمعات الكونتيغ من خلال الاتصالات بين نهايات الكونتيغ.التي تم عدها بواسطة وظيفة جمع إحصائيات القراءة المزدوجة في وحدة إنهاء الجينوم CLC (QIAGEN)، والتي سمحت بربط هياكل إضافية ومناطق متكررة (على سبيل المثال، جينات الرنا الريباسي)، وإزالة الهياكل غير الصحيحة..
لتوضيح جودة MAG المقترحة من قبل اتحاد المعايير الجينومية (GSC)تم تحليل اكتمال الجينوم والتلوث باستخدام CheckM الإصدار.بينما تم حساب أعداد tRNAs و rRNAs لكل MAG باستخدام tRNAscan-SE الإصدار.و RNAmmer الإصدار.، على التوالي. كانت تسلسلات 16 S rRNA المحددة المشفرة في MAGs مرتبطة بـ ASVs الناتجة عن تسلسلات الأمبليكون لجينات 16 S rRNA داخل البلاستيسفير، كما هو موضح أعلاه. لتعيين التصنيف لـ MAGs، تم تشغيل GTDB-tk الإصدار 3.0 بالإعدادات الافتراضية باستخدام إصدار قاعدة بيانات GTDB .
تم إيداع تسلسلات السقالات لكل MAG في DDBJ/EMBL/GenBank تحت مشروع البيولوجيا PRJNA886482 كعينات حيوية SAMN38046932-SAMN38046948.
التعليق الوظيفي للإسترازات
تم تحليل بروتينات الغشاء من خلال توقع الحلزونات عبر الغشاء باستخدام خادم TMHMM النسخةتم تحديد ORFs التي تشفر الإسترازات من خلال أفضل نتيجة BLASTP في قاعدة بيانات ESTHER الإصدار 27 مايو.بالإضافة إلى استخدام قائمة داخلية من بروتينات الديبوليميراز، بما في ذلك ديبوليميرازات PHA، كوتينازات، بيتازات، هيدراز PBAT، وهيدراز BTA، وديبوليميرازباستخدام حد قطع قيمة eتم تعيين بلمرات PHA من نوع الإفراز خارج الخلوي بواسطة عائلات Esterase_phb و
تم تعيين Esterase_phb_PHAZ في قاعدة بيانات ESTHER في الكتلة X، بينما تم تعيين البوليسترازات الخارجية لتفكيك البوليسترينات القابلة للتحلل من بروتينات التحلل الداخلي بالإضافة إلى عائلات Polyesterase-lipase-cutinase وCarb_B_Bacteria في قاعدة بيانات ESTHER في الكتلة L.
التوزيع العالمي للميكروبات السائدة
قمنا بجمع بيانات تسلسل الميتاجينوم لجين 16S rRNA من قاعدة بيانات NCBI، التي تعمل على منصة إيلومينا (HiSeq وMiSeq وNovaSeq وGenome analyzer)، وكان حجم كل بياناتتم تصنيف بيانات التسلسل باستخدام نفس مشروع البيولوجيا في مجموعة بيانات NCBI، وتم إزالة الضوضاء وإعادة بناء كل مجموعة بيانات تحت DADA2.في QIIME2 الإصدار.مع المعلمات -p-max-ee 2.0 -p-n-reads-learn 1000,000، كتركيبات جينية للـ 16S rRNA. لجمع أنماط توزيع الميكروبات السائدة على PHBs والبيوبلاستيك، تم تحديد تسلسلات الميتاجينوم لجين 16S rRNA باستخدام BLASTN مع استخدام تركيبات الميتاجينوم لجين rRNA كبيانات، مع تطابقات تزيد عن 97% و200 قاعدة. تم إعادة بناء التوزيع الجغرافي للميكروبات السائدة على PHBs والبيوبلاستيك باستخدام Ocean Data View 5.6.03.https://odv.awi.de/.)مع المتوسط المرجح لبيانات وجودهم وغيابهم.
ملخص التقرير
معلومات إضافية حول تصميم البحث متاحة في ملخص تقارير مجموعة نيتشر المرتبط بهذه المقالة.
توفر البيانات
جميع البيانات المتعلقة بفقدان الوزن، وتقليل السُمك، وBOD متاحة مع هذه المقالة، المعلومات التكميلية وملف بيانات المصدر. تم إيداع جميع التسلسلات الخام لتسلسل جين 16 S rRNA في DDBJ (بنك بيانات الحمض النووي في اليابان) في أرشيف قراءة التسلسل (DRA) تحت رقم الوصول DRA014821 في مشروع البيولوجيا PRJDB14280. تم إيداع جميع التسلسلات الخام لتسلسل الميتاجينوم في أرشيف قراءة التسلسل (SRA) في NCBI تحت رقم الوصول SRP468711 في مشروع البيولوجيا PRJNA886482. تم تلخيص المعلومات التفصيلية حول قراءات التسلسل في الجدول التكميلية 10. تم إيداع تسلسلات السقالات لكل MAG في DDBJ/EMBL/GenBank تحت مشروع البيولوجيا PRJNA886482 كعينات حيوية SAMN38046932 إلى SAMN38046948. تم توفير بيانات المصدر في هذه الورقة.
References
Lebreton, L. C. M. et al. River plastic emissions to the world’s oceans. Nat. Commun. 8, 1-10 (2017).
Schmidt, C., Krauth, T. & Wagner, S. Export of plastic debris by rivers into the sea. Environ. Sci. Technol. 51, 12246-12253 (2017).
Jambeck, J. R. et al. Plastic waste inputs from land into the ocean. Science 347, 768-771 (2015).
Meijer, L. J. J. et al. than 1000 rivers account for of global riverine plastic emissions into the ocean. Sci. Adv. 7, 1-13 (2021).
José G. B. Derraik. The pollution of the marine environment by plastic debris: a review. Mar. Pollut. Bull. 44, 842-852 (2002).
Turner, A., Arnold, R. & Williams, T. Weathering and persistence of plastic in the marine environment: lessons from LEGO. Environ. Pollut. 262, 114299 (2020).
Barnes, D. K. A., Galgani, F., Thompson, R. C. & Barlaz, M. Accumulation and fragmentation of plastic debris in global environments. Philos. Trans. R. Soc. Lond. B Biol. Sci. 364, 1985-1998 (2009).
Wayman, C. & Niemann, H. The fate of plastic in the ocean environment-a minireview. Environ. Sci. Process Impacts 23, 198-212 (2021).
Michels, J., Stippkugel, A., Lenz, M., Wirtz, K. & Engel, A. Rapid aggregation of biofilm-covered microplastics with marine biogenic particles. Proc. Biol. Sci. 285, 20181203 (2018).
Nakajima, R. et al. Massive occurrence of benthic plastic debris at the abyssal seafloor beneath the Kuroshio Extension, the North West Pacific. Mar. Pollut. Bull. 166, 112188 (2021).
Egger, M., Sulu-Gambari, F. & Lebreton, L. First evidence of plastic fallout from the North Pacific Garbage Patch. Sci. Rep. 10, 7495 (2020).
Woodall, L. C. et al. The deep sea is a major sink for microplastic debris. R. Soc. Open Sci. 1, 140317 (2014).
European Bioplastics. BIOPLASTICS MARKET DEVELOPMENT UPDATE 2022. (2022).
Funabashi, M., Ninomiya, F. & Kunioka, M. Biodegradability evaluation of polymers by ISO 14855-2. Int. J. Mol. Sci. 10, 3635-3654 (2009).
Kasuya, K., Takagi, K., Ishiwatari, S., Yoshida, Y. & Doi, Y. Biodegradabilities of various aliphatic polyesters in natural waters. Polym. Degrad. Stab. 59, 327-332 (1998).
López-Ibáñez, S. & Beiras, R. Is a compostable plastic biodegradable in the sea? A rapid standard protocol to test mineralization in marine conditions. Sci. Total Environ. 831, 154860 (2022).
Lott, C. et al. Half-life of biodegradable plastics in the marine environment depends on material, habitat, and climate zone. Front. Mar. Sci. 8, 662074 (2021).
Nakayama, A., Yamano, N. & Kawasaki, N. Biodegradation in seawater of aliphatic polyesters. Polym. Degrad. Stab. 166, 290-299 (2019).
Emadian, S. M., Onay, T. T. & Demirel, B. Biodegradation of bioplastics in natural environments. Waste Manag. 59, 526-536 (2017).
Suzuki, M., Tachibana, Y. & Kasuya, K. Biodegradability of poly(3hydroxyalkanoate) and poly( -caprolactone) via biological carbon cycles in marine environments. Polym. J. 53, 47-66 (2021).
Gricajeva, A., Nadda, A. K. & Gudiukaite, R. Insights into polyester plastic biodegradation by carboxyl ester hydrolases. J. Chem. Technol. Biotechnol. 97, 359-380 (2022).
Urbanek, A. K. et al. Biochemical properties and biotechnological applications of microbial enzymes involved in the degradation of polyester-type plastics. Biochim. Biophys. Acta Proteins Proteom. 1868, 140315 (2020).
Kato, C. et al. Poly 3-hydroxybutyrate-co-3-hydroxyhexanoate films can be degraded by the deep-sea microbes at high pressure and low temperature conditions. High Press Res. 39, 248-257 (2019).
Nishida, H. & Tokiwa, Y. Effects of higher-order structure of poly(3hydroxybutyrate) on its biodegradation. I. Effects of heat treatment on microbial degradation. J. Appl. Polym. Sci. 26, 1467-1476 (1992).
Honsho, C., Ura, T., Kim, K. & Asada, A. Postcaldera volcanism and hydrothermal activity revealed by autonomous underwater vehicle surveys in Myojin Knoll caldera, Izu-Ogasawara arc. J. Geophys. Res. Solid Earth 121, 4085-4102 (2016).
Dilkes-Hoffman, L. S., Lant, P. A., Laycock, B. & Pratt, S. The rate of biodegradation of PHA bioplastics in the marine environment: a meta-study. Mar. Pollut. Bull. 142, 15-24 (2019).
Iwata, T., Gan, H., Togo, A. & Fukata, Y. Recent developments in microbial polyester fiber and polysaccharide ester derivative research. Polym. J. 53, 221-238 (2021).
Puanglek, S. et al. In vitro synthesis of linear -glucan and chemical modification to ester derivatives exhibiting outstanding thermal properties. Sci. Rep. 6, 30479 (2016).
Buchanan, C. M., Gardner, R. M. & Komarek, R. J. Aerobic biodegradation of cellulose acetate. J. Appl. Polym. Sci. 47, 1709-1719 (1993).
Komarek, R. J., Gardner, R. M., Buchanan, C. M. & Gedon, S. Biodegradation of radiolabeled cellulose acetate and cellulose propionate. J. Appl. Polym. Sci. 50, 1739-1746 (1993).
Tateiwa, J., Kimura, S., Kasuya, K. I. & Iwata, T. Multilayer biodegradable films with a degradation initiation function triggered by weakly alkaline seawater. Polym. Degrad. Stab. 200, 109942 (2022).
Zettler, E. R., Mincer, T. J. & Amaral-Zettler, L. A. Life in the ‘plastisphere’: microbial communities on plastic marine debris. Environ. Sci. Technol. 47, 7137-7146 (2013).
Kirstein, I. V., Wichels, A., Gullans, E., Krohne, G. & Gerdts, G. The plastisphere – uncovering tightly attached plastic “specific” microorganisms. PLoS One 14, 1-17 (2019).
Numata, K. et al. Synthesis of poly- and oligo(hydroxyalkanoate)s by deep-sea bacteria, Colwellia spp., Moritella spp., and Shewanella spp. Polym. J. 45, 1094-1100 (2013).
Jesse, P., Schratzberger, M., Sapp, M. & Osborn, A.M. Rapid bacterial colonization of low-density polyethylene microplastics in coastal sediment microcosms. BMC Microbiol. 14, 1-15 (2014).
Ling, S. K., Xia, J., Liu, Y., Chen, G. J. & Du, Z. J. Agarilytica rhodophyticola gen. nov., sp. nov., isolated from Gracilaria blodgettii. Int. J. Syst. Evol. Microbiol. 67, 3778-3783 (2017).
Pinnell, L. J. & Turner, J. W. Shotgun metagenomics reveals the benthic microbial community response to plastic and bioplastic in a coastal marine environment. Front. Microbiol. 10, 1252 (2019).
Ryan, W. B. F. et al. Global multi-resolution topography synthesis. Geochem. Geophys. Geosyst. 10, Q03014 (2009).
Parada, A. E., Needham, D. M. & Fuhrman, J. A. Every base matters: assessing small subunit rRNA primers for marine microbiomes with mock communities, time series and global field samples. Environ. Microbiol. 18, 1403-1414 (2016).
Apprill, A., Mcnally, S., Parsons, R. & Weber, L. Minor revision to V4 region SSU rRNA 806R gene primer greatly increases detection of SAR11 bacterioplankton. Aquat. Microb. Ecol. 75, 129-137 (2015).
Bolyen, E. et al. Reproducible, interactive, scalable and extensible microbiome data science using QIIME 2. Nat. Biotechnol. 37, 850-852 (2019).
Yoon, S. H. et al. Introducing EzBioCloud: a taxonomically united database of 16S rRNA gene sequences and whole-genome assemblies. Int. J. Syst. Evol. Microbiol. 67, 1613-1617 (2017).
Altschup, S. F., Gish, W., Miller, W., Myers, E. W. & Lipman, D. J. Basic local alignment search tool. J. Mol. Biol. 215, 403-410 (1990).
R Core Team. R: a language and environment for statistical computing. R Foundation for Statistical Computing, Vienna, Austria. (2020).
McMurdie, P. J. & Holmes, S. Phyloseq: an R package for reproducible interactive analysis and graphics of microbiome census data. PLoS One 8, e61217 (2013).
Villanueva, R. A. M. & Chen, Z. J. ggplot2: elegant graphics for data analysis (2nd ed.). Measurement (Mahwah J) 17, 160-167 (2019).
Tamura, K., Stecher, G. & Kumar, S. MEGA11: molecular evolutionary genetics analysis version 11. Mol. Biol. Evol. 38, 3022-3027 (2021).
Zhu, W., Lomsadze, A. & Borodovsky, M. Ab initio gene identification in metagenomic sequences. Nucleic Acids Res. 38, 1-15 (2010).
Kanehisa, M., Sato, Y. & Morishima, K. BlastKOALA and GhostKOALA: KEGG tools for functional characterization of genome and metagenome sequences. J. Mol. Biol. 428, 726-731 (2016).
Ishii, S. et al. A novel metatranscriptomic approach to identify gene expression dynamics during extracellular electron transfer. Nat. Commun. 4, 1-10 (2013).
Albertsen, M. et al. Genome sequences of rare, uncultured bacteria obtained by differential coverage binning of multiple metagenomes. Nat. Biotechnol. 31, 533-538 (2013).
Zeldovich, K. B., Berezovsky, I. N. & Shakhnovich, E. I. Protein and DNA sequence determinants of thermophilic adaptation. PLoS Comput. Biol. 3, 62-72 (2007).
Dick, J. M., Yu, M., Tan, J. & Lu, A. Changes in carbon oxidation state of metagenomes along geochemical redox gradients. Front. Microbiol. 10, 1-16 (2019).
Moriya, Y., Itoh, M., Okuda, S., Yoshizawa, A. C. & Kanehisa, M. KAAS: An automatic genome annotation and pathway reconstruction server. Nucleic Acids Res. 35, W182-W185 (2007).
Brown, C. T. et al. Unusual biology across a group comprising more than 15% of domain Bacteria. Nature 523, 208-211 (2015).
Ishii, S., Suzuki, S., Tenney, A., Nealson, K. H. & Bretschger, O. Comparative metatranscriptomics reveals extracellular electron transfer pathways conferring microbial adaptivity to surface redox potential changes. ISME J. 12, 2844-2863 (2018).
Bowers, R. M. et al. Minimum information about a single amplified genome (MISAG) and a metagenome-assembled genome (MIMAG) of bacteria and archaea. Nat. Biotechnol. 35, 725-731 (2017).
Parks, D. H., Imelfort, M., Skennerton, C. T., Hugenholtz, P. & Tyson, G. W. CheckM: assessing the quality of microbial genomes recovered from isolates, single cells, and metagenomes. Genome Res. 25, 1043-1055 (2015).
Lowe, T. M. & Eddy, S. R. tRNAscan-SE: a program for improved detection of transfer RNA genes in genomic sequence. Nucleic Acids Res. 25, 955-964 (1997).
Lagesen, K. et al. RNAmmer: consistent and rapid annotation of ribosomal RNA genes. Nucleic Acids Res. 35, 3100-3108 (2007).
Chaumeil, P. A., Mussig, A. J., Hugenholtz, P. & Parks, D. H. GTDB-Tk: a toolkit to classify genomes with the genome taxonomy database. Bioinformatics 36, 1925-1927 (2020).
Krogh, A., Larsson, B., von Heijne, G. & Sonnhammer, E. L. L. Predicting transmembrane protein topology with a hidden Markov model: application to complete genomes. J. Mol. Biol. 305, 567-580 (2001).
Lenfant, N. et al. ESTHER, the database of the -hydrolase fold superfamily of proteins: tools to explore diversity of functions. Nucleic Acids Res. 41, D423-D429 (2013).
Callahan, B. J. et al. DADA2: high-resolution sample inference from Illumina amplicon data. Nat. Methods 13, 581-583 (2016).
Bolyen, Evan et al. Reproducible, interactive, scalable and extensible microbiome data science using QIIME 2. Nat. Biotechnol. 37, 850-852 (2019).
شكر وتقدير
نشكر جميع أعضاء مختبر علوم المواد البوليمرية في جامعة طوكيو على دعمهم في إعداد العينات والتحليلات. نشكر بشكل خاص إيلانغوفان مانيكاندان، جين هو سيك، كوي يوان هوانغ على مساعدتهم في إعداد الشكل 4ب. نشكر قائد وطاقم السفن R/Vs يوكوسوكا، كايراي، شينسي مارو، وكايمي على دعمهم الكبير للنشاط العلمي خلال البعثات YK19-11 (الرحلة PI: أكينوري يابوكي)، YK21-08C، YK21-18C، KR20-E01C، KR21-04C، KS-20-1 (الرحلة PI: تيتسورو إيكوتا)، KM20-09، وKM21-E02. نمد هذا الشكر إلى فريق HOV شينكاي 6500، وفريق ROV هايبر دولفين، وفريق ROV KM-ROV. نشكر شيرو ماتسوجاura وتيتسيا ميو (JAMSTEC) على تقديم النصائح والدعم خلال نشر Edokko Mark 1. نشكر شينو سوزوكي، يuki ساكاو، وتوموكا فوكومي على المساعدة التقنية في استخراج الحمض النووي والحمض النووي الريبي وإعداد مكتبة التسلسل، ويوكا أونكا ولياو فانيون على دعم التحليلات المعلوماتية الحيوية، وكيكو تانكا وساتشيكو كاوادا على دعم إعداد النشر في JAMSTEC. نشكر ريكو كاسايشي، ماساتاكا فوروكاوا، وتشيساتو موري على استخراج الحمض النووي وتسلسل جين 16S rRNA، وإيريكا أوسوي على دعم تحليل المجتمع الميكروبي في NBRC. تستند هذه الورقة إلى نتائج تم الحصول عليها من ثلاثة مشاريع NEDO، برنامج دراسة الجدوى “تطوير البلاستيك القابل للتحلل البحري” (إلى T.I.، N.I.)، برنامج البحث والتطوير Moonshot “البحث والتطوير للبلاستيك القابل للتحلل البحري مع وظيفة بدء التحلل” (JPNP18016) (إلى T.I.، H.N.، K-i.Ka.)، و”تطوير منهجية تقييم البلاستيك القابل للتحلل البحري” (PJ-ID 20001845) (إلى T.I.، M.K.، A.N.، K.Ka)، بتكليف من منظمة تطوير التكنولوجيا الصناعية والطاقة الجديدة (NEDO). تم دعم جزء من هذا العمل من قبل المجلس للعلوم والتكنولوجيا والابتكار (CSTI)، برنامج الابتكار الاستراتيجي عبر الوزارات (SIP)، “التكنولوجيا المبتكرة لاستكشاف موارد أعماق البحار” (الرائد الوكالة: JAMSTEC) (إلى T.I.، S.K.، H.M.). تم دعم هذا العمل من خلال منحة دعم البحث العلمي (A) (رقم المنحة: إلى T.I.) من جمعية اليابان لتعزيز العلوم (JSPS، اليابان). تم إجراء تجارب إشعاع السنكروترون في BLO3XU، SPring8، بموافقة خط الأشعة للمواد اللينة المتقدمة (FSBL) (أرقام الاقتراح: 2019B7270، 2020A7223، و2021A7222) (إلى T.I.). نشكر البروفيسور تشارلز يوكوياما، دكتوراه، المدير التنفيذي لـ IRCN، جامعة طوكيو، على تحرير مسودة هذه المخطوطة.
مساهمات المؤلفين
ت.أ. تصور الفكرة وقاد جميع المشاريع. ت.أ., ك.ك., م.س., ح.م., و أ.ن. قاموا بإعداد العينات وتقييم التحلل الحيوي. س.ك. أجرى تجارب SEM. ن.أ., ح.ن., ر.ن., م.ت., س.كا. قاموا بنشر العينات واستعادتها. ت.م., م.م., ك.ح., ك.كا. قاموا بتحليل 16 S rRNA وتحليل البيانات. س.أ. أجرى تحليل الميتاجينوم. ي.أ. حلل التوزيع العالمي للميكروبات. ت.أ., ن.أ., ك-ي.كا, س.ك., ح.م., أ.ن., م.ك. حصلوا على التمويل. ت.أ., ن.أ., ت.م., س.أ., م.م., ي.أ., س.ك., ك.كا, ت.أ. كتبوا الورقة. جميع المؤلفين ناقشوا النتائج وعلقوا على المخطوطة.
Microbes can decompose biodegradable plastics on land, rivers and seashore. However, it is unclear whether deep-sea microbes can degrade biodegradable plastics in the extreme environmental conditions of the seafloor. Here, we report microbial decomposition of representative biodegradable plastics (polyhydroxyalkanoates, biodegradable polyesters, and polysaccharide esters) at diverse deep-sea floor locations ranging in depth from 757 to 5552 m . The degradation of samples was evaluated in terms of weight loss, reduction in material thickness, and surface morphological changes. Poly(l-lactic acid) did not degrade at either shore or deep-sea sites, while other biodegradable polyesters, polyhydroxyalkanoates, and polysaccharide esters were degraded. The rate of degradation slowed with water depth. We analysed the plasticassociated microbial communities by 16S rRNA gene amplicon sequencing and metagenomics. Several dominant microorganisms carried genes potentially encoding plastic-degrading enzymes such as polyhydroxyalkanoate depolymerases and cutinases/polyesterases. Analysis of available metagenomic datasets indicated that these microorganisms are present in other deep-sea locations. Our results confirm that biodegradable plastics can be degraded by the action of microorganisms on the deep-sea floor, although with much less efficiency than in coastal settings.
Annually, 400 million tons of plastic are produced worldwide and used in various industrial and consumer applications to sustain the convenience of modern life. Plastic products should be collected and recycled after use; however, it has been reported that million tons of plastic waste end up in the marine environment through the rivers every year . Once released, plastic debris is assumed to remain in the marine environment for hundreds of years or longer because of its durable, enzyme-resistant chemical composition . Plastic debris is carried by waves and currents to the beach or sea surface . Over time, some of the plastic debris sinks to the deep-sea as it becomes heavier than seawater because of biofouling or the accumulation of sand grains on the surface of the plastic . Recently, studies have reported
that the deep-sea floor is a major sink for plastic debris, and large amounts of plastic debris are present on the deep-sea floor; half of these are single-use plastics .
Biodegradable plastics represent one approach to reducing the proliferation of plastic waste on the deep-sea floor. Approximately 1.14 million tons of biodegradable plastics were produced in . Their biodegradability has been investigated using International Organization for Standardization testing methods in aerobic and anaerobic conditions in compost, soil, and river water . In the case of marine biodegradation, a Biochemical Oxygen Demand (BOD) biodegradation test using seawater and a field test at the shore are performed. However, little is known about the capacity of deep-sea bacterial
communities that live in extreme environmental conditions of temperature and pressure to decompose the most common forms of biodegradable plastic debris on an ecological time scale. In addition, it is not fully understood whether the biodegradable plastics that have been developed currently degrade in this extreme environment, the deep-sea floor, in the same way, that they degrade on shore, or how long it takes for them to degrade.
We addressed this deficit by conducting short- and long-term biodegradation tests at five deep-sea floor locations in Pacific Ocean: three bathyal sites [off Misaki Port (BMS, depth ), off
Hatsushima Island (BHT, depth ), and Myojin Knoll (BMJ, depth )], and two abyssal sites [Kuroshio Extension Observatory (AKR, depth ) and Minamitorishima Island (AMN, depth )] (Fig. 1a, b and Table 1). At the same time, a control experiment was conducted at the port of JAMSTEC Yokosuka Headquarters (PJM, depth ). Table 1 shows the sites where the samples were placed, latitude/longitude information, depth below sea level, salinity, temperature, dissolved oxygen, date of placement, date of recovery, and an abbreviation describing the site and duration of the placement. All of the samples used in this study (formal names,
Fig. 1 | Sample deployment at the deep-sea floor. a Map of in situ biodegradation test sites. The map was made with GeoMapApp (www.geomapapp.org) / CC BY / CC BY (Ryan et al., 2009) . See Table 1 for abbreviations regarding location. BMS and BHT are close to heavily populated cities and shipping routes to/from Tokyo Bay with a high accumulation of observed plastic debris. BHT and BMJ are sites containing unique chemosynthetic communities near cold seepage and hydrothermal vents, respectively. AKR is south of the Kuroshio Extension recirculation gyre (KERG), where a high accumulation of plastic debris has been reported. AMN is another abyssal environment, but distant from populated areas. PJM is a coastal environment (Port of JAMSTEC Yokosuka Headquarters), and serves as a reference
site that is close to large cities and rivers. The sample sets were deployed on the deep-sea floor by the human-occupied submersible Shinkai 6500, except for AMN, where the deployment was performed by a lander system, and the sample sets were placed 2 m above the sea floor. c Injection-molded sample specimen used in this study and sample set in a custom-made sample holder (closed with 1 mm gap polyethylene (PE) mesh). d Melt-pressed sample specimen used in this study and the sample set with its sample sealed with 1 mm gap PE mesh. e The test samples deployed at BHT. f The test samples at BHT 4 months after deployment. g Recovery of sediments under the samples.
Table 1 | Summary of the on-site degradation test site
Site
Abbr.
Latitude N
Longitude E
Depth m
Salinity
Temp.
DO mg/L
Deployment yyyy/mm/dd
Recovery yyyy/mm/dd
Period Days
Abbr.
Sample
Port of JAMSTEC Yokosuka Headquarters
PJM
139*39.05
2-6
30.0
25.5
5.7
2019/09/30
2020/10/03
369
PJM12
Injection molded
2-6
30.3
25.4
5.0
2021/08/08
2021/10/08
61
PJMO2
Film
Bathyal hydrocarbon seepage off Hatsushima island
BHT
855
34.5
3.6
1.8
2019/09/12
2020/01/07
117
BHTO4
Injection molded
2019/09/12
2020/11/16
431
BHT14
Injection molded
2021/02/05
2021/05/11
95
BHTO3
Film
2021/02/05
2021/10/13
250
BHTO8
Film
Bathyal seafloor off Misaki port
BMS
757
34.3
4.4
2.1
2021/05/12
2021/10/12
153
BMS05
Film
Bathyal hydrothermal vent in Myojin knoll
BMJ
1292
34.3
4.6
2.1
2021/05/21
2021/10/07
139
BMJO5
Film
Abyssal plain near Kuroshio extension observatory
AKR
5503
34.7
1.6
5.2
2021/05/20
2021/10/06
139
AKRO5
Film
Abyssal plain around Minamitorishima island
AMN
5552
34.7
1.5
5.0
2020/03/15
2021/04/09
390
AMN13
Injection molded
Table 2 | Formal name, abbreviation in the paper, and thermal properties of samples
abbreviations, thermal properties, and chemical structures) are summarized in Table 2 and Supplementary Fig. 1.
Biodegradable plastic-degrading microorganisms have been isolated from compost, soil, rivers, and seawater . Degrading enzymes that they secrete have been isolated and purified , and biochemical properties, amino acid sequences, and three-dimensional crystal structures of these enzymes have been reported . However, only a few polyhydroxyalkanoate (PHA)-degrading microorganisms have been reported on the deep-sea floor , and no microorganisms capable of
degrading other biodegradable plastics are known in that environment, raising questions about deep-sea degradation mechanisms. Therefore, investigating the decomposition of biodegradable plastics on the deep-sea floor will significantly contribute to the development of knowledge and technologies in the fields of materials science and biology, in addition to environmental conservation and understanding of the deep-sea environment. In this study, the decomposition of biodegradable plastics in the deep-sea was investigated for biodegradable polyesters and polysaccharide ester derivatives, in addition
to PHA, which has been actively studied: we assessed weight loss, reduction in material thickness, and surface morphological changes at the deep-sea floor, biofilm formation, microbial accumulation, and candidate genes for degradation of plastics by growing microbes.
Results and discussion
Biodegradation at the deep-sea floor
We investigated the decomposition of representative biodegradable plastics (PHA, biodegradable polyesters, and polysaccharide esters) at the above-described five deep-sea floor locations (Fig. 1a, b). Injectionmolded samples and films were placed in custom-made sample holders and mesh bags, respectively, and were placed on the deep-sea floor in a condition that prevented physical deformation [samples were placed in polyethylene terephthalate (PET) containers with holes, protected by tennis nets (Fig. 1c, d, Supplementary Figs. 2, 3)]. Installation in the deep-sea and recovery of the samples were performed aboard the Shinkai 6500 human-occupied vehicle (HOV) using a robotic arm. The seafloor soil immediately below the samples was also recovered using a custom-made core and used for microbiological analysis (Fig. 1e-g, Supplementary Fig. 4).
Biodegradation of biodegradable polyesters at the deepsea floor
Figure 2a-c shows the overall shapes and morphology of hydroxybutyrate-co-(R)-3-hydroxyhexanoate] (PHBH) injectionmolded samples placed on shore (PJM12) and off Hatsushima Island (BHT14) and Minamitorishima Island (AMN13) for approximately 1 year. The PHBH sample shown as an example is one in which degradation had progressed relatively well compared with other samples. The photographs taken from the top and the end after ultrasonic washing and drying, revealed that no physical deformation had occurred. Furthermore, it was confirmed by X-ray diffraction that the crystal structure of samples remained unchanged during the submersion periods at the deep-sea floor and experimental processing. Scanning electron microscopy (SEM) images (Fig. 2d) show the surface profiles after removal of microorganisms from the surface. Whereas the surface morphology before degradation (original) was very smooth, the surfaces of the samples after placement on the shore or the deep-sea floor were observed to be uneven, and degradation was in progress. This kind of degradation that creates unevenness on the surface of the material is considered to be due to microbial degradation, not physical deformation or chemical degradation. The fact that degradation progresses from the surface homogeneously is evident from the extreme decrease in the thickness of the samples from the shore (PJM12). In about 1 year, the thickness of the samples, which was initially , was found to have decreased by at the shore (PJM12), off Hatsushima Island (BHT14), and at Minamitorishima Island (AMN13). On the basis of this series of observations, the degradation was considered to be microbial degradation, rather than physical deformation.
Figure shows the shapes, stereomicroscopic images, and SEM images of surfaces of PHBH film samples placed off Hatsushima Island for 8 months (BHT08), respectively, as an example of film degradation at the deep-sea floor. In addition, residual weight and film thickness after 3 and 8 months are shown in Fig. 2h. In all samples, no edges were chipped, and no physical deformation occurred during submersion at the deep-sea floor or during subsequent ultrasonic washing. The original PHBH sample films were slightly opaque with very smooth surfaces (Fig. 2e, Original). After about 8 months submerged off Hatsushima Island, microorganisms adhered to the surface, and a yellowish, slimy appearance was observed (Fig. 2e, BHT08). When the film was fixed with formaldehyde and SEM observation was performed, it was observed that a large number of microorganisms adhered to the film surface, forming a biofilm (Fig. 2g, BHT08). When the film was ultrasonically washed and dried, and then observed under
a stereomicroscope, numerous holes with diameters of were observed (Fig. 2f), which appeared to have been created by the degradation of the film. SEM observation revealed a very large number of spherical holes and unevenness [Fig. 2g, BHT08 (after washing)]. These are thought to have been created by the degradation of the film by microorganisms, because this degradation pattern, such as spherical holes on the film surface observed by SEM, is quite similar to that in a previous report where PHB film was degraded by microorganisms isolated from soil .
Figure 2h (Supplementary Data 1, Supplementary Tables 1 and 2) shows the change in residual weight and thickness of the PHBH film. It was found that film weight decreased by in 3 months and in 8 months, and film thickness decreased by in 3 months and in 8 months from initial thickness. Furthermore, the residual weight decreased linearly, suggesting that degradation occurred at a constant rate over the 8 -month period. The fact that the slope of the residual weight change and the slope of the film thickness decrease were almost the same suggests that degradation in the film thickness direction is dominant.
Figure 2i shows schematically the microbial degradation of biodegradable plastic. Microorganisms attach to the surface of the plastic film and form a biofilm. Some of the microorganisms secrete degradative enzymes that cleave molecular chains on the film surface and break them down into water-soluble monomers or oligomers. The film surface is then degraded, and the film becomes uneven. This series of microbial degradations is basically the same as those in soil and rivers. Whether or not the water-soluble monomers and oligomers were completely degraded to carbon dioxide and water by microorganisms in seawater was confirmed by a BOD biodegradation test using seawater in a laboratory setting. Figure 2j (Supplementary Data 2) shows the results of the BOD biodegradation test of PHBH and reference material (cellulose). It was confirmed that they were degraded to carbon dioxide and water in about 1 month. Considering the above results comprehensively, at deep-sea floors or shore, biodegradable plastics undergo degradation from the surface by microorganisms, forming water-soluble intermediates, which are finally metabolized to carbon dioxide and water. However, in this study, no further experiments were conducted to directly support that microorganisms actually secrete extracellular depolymerases in the extreme environment of the deep-sea. Subsequently, it is unclear whether the microorganisms at deep-sea completely degrade biodegradable plastics into carbon dioxide and water through watersoluble intermediates.
Figure 3a-c (Supplementary Data 1, Supplementary Tables 1 and 2) shows the changes in film morphology, surface SEM images, residual weight, and film thickness for poly(butylene succinate-co-adipate) (PBSA) and poly(L-lactic acid) (PLLA), which are biodegradable polyesters, and polypropylene (PP), a non-biodegradable common plastic, respectively, which were placed off Hatsushima for 3 and 8 months. The surface SEM image of PBSA also showed the formation of biofilm on the surface. In the SEM image of the surface, unevenness and holes were observed, indicating that the surface had been decomposed by microorganisms. Therefore, it is considered that microbial degradation of PBSA in the deep-sea progresses in the same manner as that of PHBH (Fig. 2e-g). However, the weight loss rate and changes in film thickness were much slower/lower than those for PHBH.
In the case of PLLA, microorganisms were observed adhering to the film surface, but after 8 months, the film surface was very smooth, indicating that no degradation had occurred, even though PLLA is categorized as a biodegradable polyester (Fig. 3b). The sample weight and thickness remained unchanged during submersion at the deep-sea floor. This is thought to be due to the absence of bacteria capable of degrading PLLA among the attached microorganisms. PLLA clearly does not degrade at the deep-sea floor. Nor does it degrade in soil and rivers-it is well known that PLLA is only degraded in compost
Fig. 2 | Biodegradation of -3-hydroxybutyrate-co-9 mol%-(R)-3-hydroxyhexanoate] (PHBH) injection-molded and melt-pressed film samples placed at the deep-sea floor and models of microbial degradation. a Injection-molded samples were placed in the sea at different depths ( ) for about 1 year for biodegradation tests. See Table 1 for abbreviations regarding location and Table 2 for abbreviations regarding samples. b, c The original and PJM12, BHT14, and AMN13 injection-molded samples are shown in a photograph taken from (b) the top side and (c) the end, showing that the samples were reduced in size while maintaining their shape without physical collapse. d Surface SEM images show that decomposition proceeded regardless of water depth. e Photographs of an original film sample of , after 250 days of placement on the deep-sea floor off Hatsushima Island at 855 m (BHT08), and after biofilm removal by ultrasonic washing, respectively. The dimensions of the film in BHT08 (after washing) were the same as the original, meaning that no physical collapse occurred, but numerous penetrating holes were observed by stereomicroscopy. g Scanning electron
microscope (SEM) images showing a magnified view of the surface of each PHBH film. While the surface of the original sample was smooth, microorganisms accumulated on the surface of the BHT08 sample, and the surface of the film, after the microorganisms were removed by ultrasonic washing (BHT08 After washing), showed the roughness typically observed following microbial degradation. The decrease in weight (black line) and film thickness (red line) at the deep-sea bottom off Hatsushima Island over 8 months. Values are given as average of independent samples with its standard deviation (Supplementary Data 1). i Illustrations of biodegradation corresponding to the photos and SEM images above. BOD biodegradability curve, showing that PHBH (black dot) and cellulose (red dot) are completely converted to water and carbon dioxide by microorganisms in the seawater of Tokyo Bay. The micrographs are representative images from independent samples with similar results. The BOD data is representative of one of , with similar results (Supplementary Data 2). Source data are provided as a Source Data file.
Fig. 3 | Analysis of Poly(butylene succinate-co-adipate) (PBSA), Poly(L-lactic acid) (PLLA), and Polypropylene (PP) melt-pressed film samples placed at the deep-sea floor (BHT). The degradability of PBSA film, PLLA film, and PP film at the deep-sea floor. For PBSA film, microorganisms were observed on the film surface after 250 days of placement on the deep-sea floor off Hatsushima Island at 855 m (BHT08), and roughness on the film surface after biofilm removal, slight weight loss, and decrease in film thickness was also observed. For PLLA and PP, few
microorganisms were observed on the film surface even after 8 months in BHT, and the film surface remained smooth after ultrasonic washing, with no observed weight loss or decrease in film thickness. Values are given as average of for PBSA and PLLA, for PP independent samples with its standard deviation (Supplementary Data 1). The micrographs are representative images from independent samples with similar results. Source data are provided as a Source Data file.
(temperature: , humidity: ). Therefore, it is desirable to collect PLLA after use and actively promote its decomposition by composting.
In the case of PP, which is a representative, common, nonbiodegradable plastic, it was observed that the amount of microorganisms attached to the film surface was low (Fig. 3c). This may be because the surface of PP is hydrophobic, unlike biodegradable polyesters, which have hydrophilic ester groups. It was clear that the PP did not degrade at the deep-sea floor.
Results for other biodegradable polyesters and non-biodegradable common plastics after 8 months are shown in Supplementary Figs. 5-9; those after 3 months are shown in Supplementary Figs. 10-12. The SEM images after 3 and 8 months suggest that microbial degradation was in progress for the other biodegradable polyesters (PHB, PHBV, P3HB4HB, PCL, PBS, PBAT), like for PHBH and PBSA. However, no degradation occurred in the other non-biodegradable common plastics (PE, PS, PET), like for PP and PLLA (see Table 2 for definitions of sample abbreviations).
The weight changes of injection-molded samples and films were measured; the degradation rate calculated from the surface area and the submersion periods was defined as the biodegradation rate (Fig. 4a, b, Supplementary Data 1, 3, Supplementary Tables 1-6).
The biodegradation rates of injection-molded samples of PHAs and biodegradable polyesters submerged at BHT for 431 days (BHT14), AMN for 390 days (AMN13), and PJM for 369 days (PJM12) are shown in Fig. 4a and Supplementary Table 3. The biodegradation rate in the marine environment was calculated by normalizing the biodegradation weight loss with respect to initial surface area per day ( day). It was confirmed that PLLA and four types of non-biodegradable common plastic (PE, PP, PS, PET) did not degrade at all in either the shore or deep-sea sites, while the biodegradable polyesters except for PLLA were found to degrade to varying degrees. The biodegradation rate of PHA at the shore in this study was similar to previously reported results at shores worldwide . Interestingly, comparing the biodegradation rate of PHA at the deep-sea sites with that on shore, the rate tended to slow down with depth.
The biodegradation rates of films over a short period of time at other sites and at different depths are shown in Fig. 4b and in Supplementary Tables 1, 2, 4-6. Interestingly, a clear difference in biodegradation rate was observed between the BHT, BMS, and BMJ sites at depths of compared with the AKR and AMN sites at depths of . For PHB, which had the slowest decomposition rate among PHAs, compared with the decomposition rate of day at the shore (PJM02), at a depth of (BHT03, BMS05, and BMJ05), the decomposition rate was day , and at a depth of (AKR05 and AMN13), the decomposition rate was day . At , the decomposition rates at all sites (BHT, BMS, and BMJ sites) were similar, even though BMJ is a hydrothermal vent. It is likely that similar results were observed at BMJ to these other sites because the seawater is heated by the hydrothermal fluid ( ); however, even in the immediate vicinity of the hydrothermal vents, the seawater is cooled quickly to by cold water flow . Our results comparing the biodegradation rate of biodegradable plastics at the shore and the deep-sea floor, where large amounts of plastics are thought to have sunk, reveal that the rate of biodegradation at the deep-sea floor is slower than at the shore, and that the biodegradation rate depends on the depth (Fig. 4c, Supplementary Data 1). Evidently, the result that the biodegradation rate depends on the depth is related to the local number and diversity of degrading microorganisms, which will be discussed later (Fig. 5a, b), in addition to the fact that the deepsea is an extreme environment of particularly low temperature, high water pressure, and no sunlight.
Using the degradation rates of biodegradable plastics at the deepsea floor obtained in this study, we calculated the time to complete biodegradation of plastic bags at the shore and in the deep-sea off
Hatsushima (BHT), assuming that plastic bags of thickness were made of four different PHAs. From the experimental results, PHA degrades on average by about of thickness in 3 months, and thus of degradation can occur well within the experimental period. At the shore, the calculated degradation time was 6 days for PHBH, which was considered to be the fastest-degrading of the tested PHAs, and 13 days for PHB, which was the slowest-degrading (Fig. 4d). These values are almost the same as those previously reported . At the deep-sea floor, the biodegradation periods were calculated to be about 19 days for PHBH and 58 days for PHB (Fig. 4d). Whereas nonbiodegradable common plastics such as PE and PP are not degraded for hundreds of years, these biodegradable plastics will be biodegraded at the deep-sea floor in an acceptable period of time. Therefore, these biodegradable plastics can be considered environmentally friendly materials.
Biodegradation of polysaccharide esters at the deep-sea floor
Polysaccharides are polymers of biological origin that are abundant all over the world. The structures of polysaccharides consist mainly of glucose units linked by two types of glycosidic linkage ( – and -), which enable them to perform a variety of functions . For example, cellulose, a natural polymer of glucose bound by -glycosidic bonds, provides strength as the main component of plant cell walls. Other examples are paramylon from microalgae, glucomannan isolated from the tubers of Amorphophallus konjac, and chitin or chitosan from crustacean shells. In addition, polysaccharides with different glycosidic linkages and molecular structures, including the nonnatural polysaccharide mutan linked by -glycosidic linkages that we have developed through enzymatic polymerization, have great potential to be useful bioplastics .
The weight loss for cellulose ( -glucan, CE), paramylon ( glucan, PR), mutan ( -glucan, MU), and their acetate derivatives with different degrees of substitution (DS), at the shore and in the deep-sea, are shown in Fig. 4e, Supplementary Table 7 and Supplementary Data 3. All samples were degraded in the deep-sea, although the weight loss was slower than at the shore. For cellulose acetate (CEA with and CETA with ), although it has been reported that the degradability changed depending on the degree of DS in activated sludge , interestingly, the weight loss at the deep-sea floor was similar regardless of the DS. This result suggests that highlysubstituted polysaccharide esters with thermoplasticity are degraded by long-term submersion in the deep-sea, perhaps due to deesterification caused by prevailing alkaline conditions . Paramylon triacetate (PRTA, DS = 3.0) and mutan triacetate (MUTA) were also degraded in the deep-sea, like cellulose triacetate (CETA). These results indicate that polysaccharide esters have great potential as marine-biodegradable plastic materials.
Microbial community analysis of plastispheres
Plastispheres are defined as microbial communities formed on plastic debris in the ocean . To help determine the mechanism of biodegradation in marine environments, the microbial community structures of deep-sea plastispheres were analyzed by 16S rRNA gene amplicon sequencing. The diversity of microbial communities attached to plastic surfaces was assessed based on amplicon sequence variants (ASVs). The diversity indexes of microorganisms present on biodegradable polyesters decreased with sea depth, and also decreased while biodegradation rates increased (Fig. 5a, b, Supplementary Data 4). A very large number of microorganisms exist in nature. Therefore, in the initial stage, many types of microorganism are expected to adhere to the surface of the plastic. Among them, only a few microorganisms are capable of degrading biodegradable plastic. Over time, microorganisms that can degrade plastic are able to multiply, resulting in a relative increase in the percentage of degrading microorganisms . In fact, as shown in Fig. 5a, b, comparing, for
a
Fig. 4 | Weight-loss biodegradation rate of plastics in various deep-sea areas and the degradation process for plastic films. a The weight-loss biodegradation rate of injection-molded plastic samples placed in various ocean environments ( depth, off the port of JAMSTEC Yokosuka Headquarters; 855 m depth, off a bathyal hydrocarbon seepage near Hatsushima Island; and 5552 m depth, off an abyssal plain around Minamitorishima Island) for year. Values are given from results (Supplementary Data 3). See Table 1 and Table 2 for abbreviations regarding installation location and samples. The weight-loss biodegradation rates of various melt-pressed PHA and biodegradable polyester films when placed on the shore or at various deep-
sea sites. Values are given as average of independent samples with its standard deviation (Supplementary Data 1). c Plot of the biodegradation rate of each plastic against depth, showing that the rate slows with depth. The represented data is the average of or independent samples. d The estimated period for biodegradation of a typical plastic bag (size: , thickness: , weight: 3 g ) based on the results of this study if it is replaced by the above PHA. e The weight-loss of polysaccharide ester derivatives placed in various ocean environments ( at PJM, 855 m at BHT, 5552 m at AMN) for year. Values are given from results (Supplementary Data 3). Source data are provided as a Source Data file.
example, BHT04 with BHT14, we can see that the microbial diversity decreased over time (i.e., with the progress of degradation). The diversity of microorganisms on non-biodegradable common plastics, such as PE and PP, did not change across test sites, while PLLA, which is
a compostable plastic, showed the same trend as non-biodegradable common plastics.
In biofilms following several months of submersion at the deep-sea floor, the dominant microorganisms were mainly aerobic
Fig. 5| Diversity of microbial assemblages on plastics at three marine sites with different depths, based on 16S rRNA gene amplicon sequencing. Correlation between the diversity of microbial communities associated with plastics in marine environments and the biodegradation rates of the plastics (Supplementary Data 4). Alpha-diversities of the bacterial taxa are indicated by the Shannon (a) and Chaol (b) indexes. The biodegradation rates of plastics are shown in day . Plots are colored to indicate the type of plastic, and the materials are categorized into three groups and marked as follows, circles: PHAs including PHB, PHBV, PHBH, and P3HB4HB; triangles: biodegradable plastics including PLLA, PBSA, PCL, and PBAT; squares: common plastics, including PE, PP, PS, and PET. c Bacterial distribution at the class level on plastics immersed in marine environments. The mean relative abundance (%) of bacterial taxa on each plastic in the
marine immersion test is represented in a horizontal bar chart. Sampling sites and immersion periods are abbreviated as defined in the “Methods” and are denoted on the left (Supplementary Data 4). Amplicon sequence variants belonging to each taxonomic group at the class level are color-coded, as shown to the right. “Others” denotes taxa with relative abundances below the cut-off level of . Inner bars in the Gammaproteobacteria indicate the relative abundances of three families, further characterized by pairwise metagenomic data. d, e Non-metric multidimensional scaling (NMDS) ordination of bacterial communities on PHAs,
biodegradable plastics, and common plastics (d) and on polysaccharides and their ester derivatives and common plastics (e), in marine environments (Supplementary Data 4). NMDS stress value: 0.113421 . Source data are provided as a Source Data file.
Gammaproteobacteria and Alphaproteobacteria, as determined by 16S rRNA gene amplicon sequencing analysis of plastispheres. In mature biofilms, after 1 year at PJM and BHT, the dominant microorganisms were mainly anaerobic Deltaproteobacteria (Fig. 5c, Supplementary Fig. 13, Supplementary Data 4). This change might reflect the fact that the sample holders had started to become buried in sediment (Fig. 1f). These trends were similar to those in a metagenome-based community composition analysis based on the ribosomal protein S3 (RpsC) gene, while the redox state of the plastisphere metagenome was shifted to more reductive after long-term submersion at the deep-sea floor (Supplementary Fig. 14, Supplementary Data 5, 6).
Metagenomic analysis of plastispheres in the deep-sea water near and surrounding the sample chamber at BHT, as well as in the sediments below the seafloor ( , and 10 cm under the chamber), was also performed. The results obtained were compared with the microbial communities attached to the surface of biodegradable plastic immersed at BHT for 4 and 14 months (Supplementary Fig. 14, Supplementary Data 5, 6). The microbial population attached to the plastic surface after 14 months became closer to the microbial community in the sediment ( ), but not close to that in deepsea water (Supplementary Figs. 15 and 16, Supplementary Data 5, 6). These results indicate that long-term immersion may have affected the plastispheres via the sediment covering the sample chambers and that anaerobic microorganisms such as Deltaproteobacteria, “Candidatus Reidiella”, and others may have attached from the sediment and grown in the plastispheres (Supplementary Fig. 17, Supplementary Data 5, 6).
A non-metric multidimensional scaling (NMDS) plot based on 16S rRNA gene amplicon sequences clearly visualized the category and transition of plastispheres on the 12 plastics tested at the three marine sites PJM, BHT, and AMN (Fig. 5d). Geographical location was the predominant determining factor in the microbial composition of the plastisphere, while submersion time which was associated with a change from an aerobic to an anaerobic environment and the category of plastic were also factors affecting the clustering in the NMDS plot. The plots for plastispheres from the PJM and BHT sites shifted to the lower-right side over time, suggesting that the conditions inside the sample holder may have changed from aerobic to anaerobic. Interestingly, plots for PLLA clustered with the non-biodegradable common plastics rather than the biodegradable polyesters.
In the case of polysaccharide ester derivatives, the overall trends were similar to those for biodegradable polyesters (Fig. 5e, Supplementary Figs. 18 and 19). Three main clusters of plastispheres were observed, and, over time, the positions of these clusters shifted. Interestingly, with an increase in DS, the clusters for polysaccharide esters moved closer to those for the common plastics. Polysaccharide ester derivatives with high DS have a highly hydrophobic surface, similar to that of common plastics, making it more difficult for microorganisms to attach and degrade them.
Microorganisms that grew specifically on biodegradable plastics were analyzed for the presence of polymer-degrading genes in their genomes using genome-centric metagenomics (Fig. 6a, Supplementary Figs. 14, 20 and 21, Supplementary Table 8, Supplementary Data 5-8). We identified 17 high-quality draft genomes (metagenome-assembled genomes, MAGs) of dominant microorganisms from the metagenomes, and all correlated with highly abundant ASVs based on 16S rRNA gene amplicon sequencing analysis (Fig. 6a, Supplementary Figs. 21-24, Supplementary Data 9). A weighted canonical correspondence analysis (wCCA) plot (Fig. 6b) showed that the genera Colwellia, Agarilytica, and Micavibrio correlated with PHA plastispheres in aerobic conditions, while the order QZLD01 (assigned as “Candidatus Reidiella” for RpsC analysis) correlated with PHA plastispheres in
anaerobic conditions. Genes encoding putative PHA-degrading enzymes were identified from microbial species belonging to the classes Gammaproteobacteria, Alphaproteobacteria, and Deltaproteobacteria. Furthermore, genomes of Colwellia, Agarilytica, and QZLD01 each encoded secretable PHA depolymerases , suggesting that marine biodegradation may be caused by these PHA-degrading enzymes (Fig. 6c, Supplementary Figs. 24, 25a, 26-31 Supplementary Table 9, Supplementary Data 9). Colwellia is known as a PHAsynthesizing bacterium in the deep-sea and is also observed in the marine plastisphere on , while Agarilytica is known to degrade carbohydrate polymers such as agar . However, there is no report that Colwellia and Agarilytica secrete a dozen PHB depolymerases on the deep-sea floor. Interestingly, an organism in the order QZLD01 was also detected in the metagenome of plastispheres formed when PHA was submerged in the northern Gulf of Mexico and is hypothesized to biodegrade PHA in the deep-sea around the world, despite remaining uncultivated in the laboratory.
Among the other microorganisms with apparent ability to degrade biodegradable polyester, the genomes of Profundibacter, Hyphomonas and Desulfobacula were each found to encode >2 putative degradation enzymes, secreted polyesterases and cutinases (Fig. 6c). In addition, four of the six MAGs from other microbial species that appeared to lack secreted PHB depolymerases were found to encode putative degradation enzymes (cutinases and polyesterases) (Supplementary Figs. 25a, 26-31, Supplementary Table 9, Supplementary Data 9). This suggests that microorganisms capable of degrading biodegradable polyesters have material specificity. The microorganisms described in this section have not been reported to degrade biodegradable polyesters. However, metagenomic analyses together with microbial community analysis suggest that microorganisms harboring putative degradation genes are predominant on plastic surfaces undergoing degradation in deep-sea sites, and that the biodegradable plastics that showed degradation in this study were marine biodegradable, i.e., the polymer structure can be degraded by the action of microorganisms. To clarify these matters, it will be necessary in the future to isolate microorganisms that appear to be capable of degrading certain biodegradable plastics and to isolate the degrading enzymes they may secrete.
Global distribution of potential marine plastic-degrading microorganisms
We aimed to generalize the results of this study to worldwide oceans, in consideration of potential regional differences, by surveying the global distribution of microorganisms identified in this study that are potentially involved in the decomposition of biodegradable plastics. The full-length rRNA gene amplicon sequences obtained in silico from the MAGs were used as a reference dataset to compare against publicly available information on marine sediments (Fig. 6d, Supplementary Fig. 25b). The results showed that Colwellia (which is associated with the aerobic degradation of PHA) is distributed in marine sediments worldwide, and Agarilytica (also associated with PHA degradation) and Hyphomonas (associated with degradation of biodegradable polyesters) are also relatively widespread in various deep oceanic regions around the world that harbor plastispheres. Considering the presence of these microbial communities, PHAs and other biodegradable polyesters examined in this study might undergo degradation in other oceanic zones as well.
Conclusions
This study shows that biodegradable plastics are degraded at the final resting site of oceanic garbage, the deep-sea floor, at different depths, and that specific microorganisms appear to have the capacity to decompose most biodegradable plastics, in particular PHA, biodegradable polyesters, and polysaccharide ester derivatives. The biodegradation rate of biodegradable plastics slows down with depth.
C
Site_MAG ID
RpsC-based taxonomy
Oxic/ Anoxic
OTU
Relative frequency
Genome size (bp)
No. Scaffolds
PHB depolymerases
Cutinases/ Polyesterases
Plastics
BHT04_PHB gam1
Agarilytica
Oxic
ASV012
ASV012*
7.5%
5,302,014
98
29
PHAs
Biodegradable
polyesters
AMN13_PHB gam1
5,420,529
125
28
BHT04_PHB gam2
Agarilytica Colwellia
Oxic
ASV002
15.8%
3,890,228
641
16
BHT14_PHBH gam1
QZLD01 Profundibacter
Anoxic
ASV006
62.2%
3,108,749
26
15
BHT04-PBSA alp1
Profundibacter Hyphomonas
Oxic
ASV017
49.2%
3,767,685
43
0
2
BHT04_PCL alp1
Oxic
ASV047
38.7%
3,277,584
10
0
PJM12_PCL del1
]
Desulfobacula
–
Desulfobacula
Anoxic
ASV106
51.3%
5,169,573
75
0
BHT14_PCL del1
ASV106*
39.0%
4,465,880
311
0
Fig. 6 | Genomic information and global distribution of dominant microbes within the plastispheres established on PHAs and biodegradable polyesters in the deep-sea. a Phylogenetic tree of ribosomal protein S3 (RpsC) identified in all metagenomic assemblies. The taxonomy of the proteins is shown by different colors of the nodes. Relative frequency within the communities is shown by abar chart outside the tree, with different plastic types indicated by color (red, PHAs; green, biodegradable polyesters; black, common plastics). The site and immersion time are shown as colored strips outside of the bar chart. Metagenome-assembled genomes (MAGs) used for further analysis are marked by a red dot, while their taxonomies are also described (Supplementary Data 5-9). b Weighted canonical correspondence analysis (wCCA) diagram. The wCCA diagram showing the relationships between five environmental variables (red arrows for the series of the plastic, and black arrows for the redox state), sites (green open circles), and
dominant microbes (dots). Dot size indicates the summed relative frequencies among 60 plastispheres (maximum 6000%), while the dot color indicates taxa. For Alpha-, Gamma-, and Deltaproteobacteria, abundant genera (summed relative frequency >50%) were used for the analysis. c Statistics for numbers of the MAGs abundantly observed within the plastispheres, which belong to the taxa correlated with PHAs or biodegradable plastics in oxic/anoxic conditions in the wCCA diagram. The number of key genes relate to biodegradation of the plastics is shown. d Global distribution of six potential degraders of PHAs and biodegradable polyesters in marine sediment. Full-length 16S rRNA gene amplicon sequences from each MAG were used for the analysis, with publicly available 16S rRNA gene amplicon sequences used as a reference. Source data are provided as a Source Data file.
However, PLLA and non-biodegradable common plastics (PE, PP, PS, PET) did not degrade at all, either onshore or at the deep-sea floor, regardless of depth. Furthermore, the deep-sea bed ecosystem contains a large diversity of aerobic and anaerobic microorganisms that may be able to decompose biodegradable plastics using specific secreted degradation enzymes, and these microorganisms generally have a worldwide distribution. In the future, marine biodegradable plastics that decompose as quickly as possible once they are discharged into the ocean need to be developed. High-performance marine biodegradable plastics that do not biodegrade during use, but instead activate a biodegradation switch when they are discharged into the ocean, ensuring their biodegradation, should also be developed.
Methods
Sample preparation
The PHAs, biodegradable polyesters and non-biodegradable common plastics used in this study were purchased from or provided by various companies as listed in Table 2. Polysaccharide triacetates (DS =3) and polysaccharide acetates (DS ) were synthesized from a dimethylacetamide/LiCl solution of polysaccharide by adding pyridine and acetic anhydride for different reaction times at . Formal names, abbreviations, thermal properties, and chemical structures of all of the samples are summarized in Table 2 and Supplementary Fig. 1.
Injection molding and melt-pressed films were prepared above the melting points of the samples using a HAAKE MiniJet Pro (Thermo Fisher Scientific, Waltham, MA, USA) and Mini Test Press (Toyoseiki, Japan), respectively. The sample sizes for injection molding and film were approximately , and , respectively. In the case of polysaccharides, regenerated gels of neat polysaccharides and polysaccharide acetates (DS ) were prepared and then pressed at 2 MPa and to dry them slowly to obtain films. Films of polysaccharide triacetates were prepared by the solution-casting method from a chloroform solution. The injectionmolded samples were put directly into containers divided into nine compartments by Teflon sheets. The containers were sealed with a polyethylene mesh to prevent the samples from being released outside but to allow seawater and microorganisms to pass through the containers (Fig. 1c and Supplementary Fig. 2). The melt-pressed films and cast films were sealed with a polyethylene mesh with a 1 mm gap and placed in the container (Supplementary Figs. 2a and 3a). These containers were combined as shown in Supplementary Figs. 2b and 3b and covered with a net as shown in Supplementary Figs. 2c and 3b.
The thickness of the various samples before and after environmental degradation tests was measured, in , at five points, using a digital micrometer (Mitsutoyo, Japan) and averaged. For melt-pressed film thickness, five points were measured (at the four corners and in the center of a film), and the average and standard deviation value were obtained. Dimensions were measured in cm to two decimal places using a digital caliper (Shinwa, Japan). Weights were measured in grams to four decimal places using an electronic balance. Weights and dimensional measurements were obtained for 1-2 samples for injection molding and averaged over 2-5 samples for melt-pressed film. Two-dimensional wide-angle X-ray diffraction and small-angle Xray scattering were performed at the BLO3XU beamline of the SPring-8 synchrotron radiation facility to determine crystallinity and crystal structures.
Sample deployment and recovery
The environmental biodegradation tests were performed on the deepsea floor at five sites: three bathyal sites [the bathyal seafloor off Misaki port, BMS ( , at a depth of 757 m below sea level); hydrocarbon seepage off Hatsushima Island, BHT ( , , at a depth of 855 m below sea level); and a hydrothermal vent off Myojin Knoll, BMJ ( , at a depth of 1292 m below sea level)], and two abyssal sites [the abyssal plain near Kuroshio
Extension Observatory, AKR ( , at a depth of 5503 m below sea level), and the abyssal plain around Minamitorishima Island, AMN ( , at a depth of 5552 m below sea level)]. As a reference site that is close to large cities and rivers, the same tests were also performed in a coastal environment [port of JAMSTEC Yokosuka Headquarters, PJM ( N, E, at a depth of 2-6 m)] (Fig. 1a, b and Supplementary Table 1). Figure 1a was made with GeoMapApp (www.geomapapp.org) / CC BY / CC BY (Ryan et al., 2009) .
The deployment and recovery of deep-sea samples were conducted by the human-occupied vehicle (HOV) Shinkai 6500 or remotely operated vehicles (ROVs; Hyper-Dolphin and Kaimei-ROV), except at AMN, where the free-fall-type deep-sea observatory lander system Edokko Mark 1 was employed (Supplementary Fig. 4). During the recovery of samples, the sample chambers were placed in a sample box with a lid until the HOV or ROV was recovered on-board, to avoid contamination by seawater from the upper layer. However, during the recovery at AMN, the sample chambers fixed in the lander system went through the water column, leading to potential contamination.
The sample chambers were rapidly dismounted, and the sample specimen was cut into three pieces and subjected to fixation. One piece was placed in sterilized seawater at for microbiome studies, one piece was stored at for physicochemical characterization and DNA extraction, and one piece was processed for SEM observation. Collected samples were sonicated in distilled water for 30 s to remove surface biofilm. The samples were then vacuum-dried overnight at room temperature. Weights were measured in grams to four decimal places using an electronic balance. Film thickness and dimensions were measured as in the sample preparation section above. Weights and dimensional measurements were of 1-2 sample(s) for injection-molded plastic, and averaged over 2-5 samples for film. Weight loss was determined by Eq. (1):
At BHT, surface sediments near the sample chamber(s) and just below the chamber(s) were collected using a push corer (inner diameter ) manipulated by the HOV Shinkai 6500. The recovered sediment core samples were immediately sliced horizontally at , , and depths and frozen at . Bottom seawater ( above the seafloor) was collected using a Niskin water sampler at both descending target points ( apart) and at the deployment site before landing on the seafloor. The bottom seawater was filtered by Sterivex (PVDF with pore-size of ) on the deck and the filter was immediately frozen at .
Estimated lifetime of plastic bags
Equation (2) was used to calculate biodegradation weight loss per initial area per day ( day ), and the data were standardized. This allows for data comparisons of biodegradation tests conducted in different marine environments.
Where represents the biodegradation rate ( day ); is the decrease of mass (g); is the initial surface area ( ); and represents time for biodegradation (day).
A typical plastic bag was assumed to be thick, 18 cm wide, 42 cm long, and 3 g in weight, as actually measured. Note that the surface area of the film ( ) is twice that of one side, and that the plastic bag is assumed to include two rectangles of 18 cm in width and 42 cm length. From Fig. 2 h and Supplementary Fig. 5a-c, the film thickness decreases linearly from the start of decomposition.
Because a film of thickness would degrade within 4 months, it is considered that the plastic bag would be degraded in aerobic conditions (i.e., before the environment became anaerobic). Hence, the estimated biodegradation time to degradation was calculated using the degradation rate values for PJM02 and BHT03 in aerobic conditions. The residual weight of the plastic bags was calculated using Eq. (3). The fastest and slowest biodegradation rates obtained from experiments conducted with samples were used.
BOD tests (BOD biodegradability)
Biodegradation in environmental water was evaluated using a BOD measuring device (OxiTop IDS, WTW, Germany). In a cultivation bottle (internal volume 250 mL ), 100 mL of seawater was mixed with of buffer solution ( , and allylthiourea. The sample weight was . BOD tests were conducted in an incubator for month, and BOD data were measured daily. BOD biodegradability was calculated from Eqs. (4) and (5), and weight loss was calculated from Eq. (6).
where is the BOD value measured when the sample was added, is the BOD value measured in blank tests, and ThOD is the theoretical oxygen demand (see Eq. 5).
where is the initial sample weight ( mg ), and is the molecular weight of the monomer unit .
where is the initial sample weight ( mg ) and is the sample weight after microbial degradation (mg).
SEM
Plastic sample-attached bacteria were fixed with formaldehyde in 0.1 M phosphate buffer containing 150 mM NaCl ( pH 7.4 ), then washed with pure water. The fixed samples were dehydrated with a graded series of ethanol ( ) for 10 min at room temperature and then substituted twice with tert-butyl alcohol. Consecutively, samples were freeze-dried, then sputter coated with gold using an MSP-1S magnetron sputter (Vacuum Device Inc., Japan) before examination in a JCM-7000 (JEOL, Japan) using a secondary electron detector with an acceleration voltage of 5 kV . For 3D-construction of surface erosion images, samples without fixation were washed with pure water using an ultrasonic cleaning bath for several seconds to remove attached bacteria and debris. The cleaned samples were airdried and sputter-coated with gold. Four SEM images recorded by a backscattered electron detector were reconstructed to a 3D image using SMILEVIEW maps software (JEOL, Japan).
DNA extraction for 16S rRNA gene amplicon sequencing
The cut specimens of collected samples were stored in 40 mL of sterilized Daigo’s Artificial Seawater SP for Marine Microalgae Medium
(Fujifilm Wako, Osaka, Japan) during transport to the laboratory. Then, following centrifugation at for 10 min at room temperature, 30 mL of supernatant was discarded, and the tube containing the specimen was shaken at full speed for 2 min using a Vortex-Genie 2 (Scientific Industries) at room temperature. Next, 6 mL of the supernatant was centrifuged at for 10 min at room temperature, and the pellet was frozen at until DNA extraction.
DNA extraction was performed using the Extrap Soil DNA Kit Plus Ver. 2 (BioDynamics Laboratory Inc., Tokyo, Japan) as follows. The pellet was resuspended in of extraction buffer and of lysis buffer (provided) and transferred to the bead tube (provided). After incubation for 10 min at , cells were disrupted by bead-beating for 60 s at using a FastPrep-24 instrument (MP Biomedicals). Bead beating was repeated three times, keeping the sample on ice for 5 min between rounds. Subsequent steps were performed according to the manufacturer’s instructions. Purity was estimated based on the absorbance at (NanoDrop2000c, NanoDrop 2000/ 2000c ver. 1.5, Thermo Fisher Scientific). The concentration of doublestranded DNA in each sample was measured using a VarioSkan Flash (SkanIt RE for Varioskan Flash ver. 2.4.5, Thermo Fisher Scientific) with Pico Green (Thermo Fisher Scientific).
16S rRNA gene amplicon sequencing
A two-step tailed PCR protocol was performed to generate amplicon libraries targeting the V4 hypervariable region of the 16S rRNA gene. The first-round PCR reactions ( , in triplicate) used KOD-Plus Ver. 2 (Toyobo Co., Ltd.) with 240 nM of forward (5′- ACACTCTTTCCCTA CACGACGCTCTTCCGATCTNNGTGYCAGCMGCCGCGGTAA-3) and reverse (5′- GTGACTGGAGTTCAGACGTGTGCTCTTCCGATCTNNGGA CTACNVGGGTWTCTAAT – 3 ) primers and template DNA ( ). The thermal cycling conditions were: for 2 min ; cycles of for for 30 s , and for 30 s . Triplicate PCR reactions were then pooled and purified using SPRIselect Beads (Beckman Coulter). Amplicons were eluted with Buffer EB (Qiagen) and quantified by using PicoGreen. To attach dual indexes and sequencing adapters, secondround PCR reactions ( ) were performed using KOD-Plus Ver. 2 with 180 nM of forward (5′- CAAGCAGAAGACGGCATACGAGAT[i7] GTGACTGGAGTTCAGACGTGTGCTCTTCCGATCT-3′) and reverse ( – A ATGATACGGCGACCACCGAGATCTACAC[i5]ACACTCTTTCCCTACAC GACGCTCTTCCGATCT-3) primers and 5 ng of the purified first-round PCR product. The thermal cycling conditions were as follows: for 2 min ; 8 cycles of for for 30 s , and for 45 s . Amplicons were then purified using SPRIselect Beads and eluted with Buffer EB. The DNA concentration was quantified by using PicoGreen. Paired-end sequencing ( ) was performed using the MiSeq Reagent Kit v2 ( 500 cycles).
All raw sequences of 16S rRNA gene amplicon sequencing have been deposited at DDBJ (DNA Data Bank of Japan) Sequence Read Archive (DRA) under accession number DRA014821 in BioProject PRJDB14280.
Read processing for 16S rRNA gene amplicon sequencing
Microbial community analyses were performed using the QIIME2 pipeline version qiime2-2021.4 . The raw reads were trimmed using the q2-cutadapt plugin and the trim-paired method with options (–p-front-f GTGYCAGCMGCCGCGGTAA, –p-front-r GGACTACNVGGGTW TCTAAT, –p-error-rate 0.15, and –p-discard-untrimmed). The trimmed reads were clustered and dereplicated into ASVs using the q2-dada2 plugin and the denoise-paired method with options (–p-trunc-len-f 200 and –p-trunc-len-r 190). Taxonomy assignments of the ASVs were performed using QIIME2 with the q2-feature-classifier plugin and classify-sklearn method against the EzBioCloud database , and BLASTN (BLASTN ver. 2.12) against the National Center for Biotechnology Information (NCBI) 16S ribosomal RNA database (version 20210814) . Manipulation of the phylogenetic tree of ASVs
was performed using the q2-phylogeny plugin and the align-to-tree-mafft-fasttree pipeline.
Data analysis for 16S rRNA gene amplicon sequencing
All data were imported into R v4.0.2 with qiime2R v0.99.6 (https:// github.com/jbisanz/qiime2R/.) and phyloseq v1.34.0 . For – and diversity analyses, coverage-based rarefaction was performed using the phyloseq_coverage_rare function in metagMisc v0.0.4 (https:// github.com/vmikk/metagMisc.) with an option (coverage = 0.99). For – and -diversity analyses, estimate_richness, distance, and ordinate functions in phyloseq were used. ggplot2 v3.3.5 and ggrepel v0.9.1 (https://ggrepel.slowkow.com/index.html. https://community.rstudio. com/.) were used for visualization. Phylogenetic trees were drawn using MEGA 11 software ver. 11.0.10 after extraction of the top 50 ASVs using the prune_taxa function in phyloseq.
DNA extraction for metagenome sequencing
Cut specimens, filter-trapped seawater microorganisms, and marine sediments were immediately placed at , where they were stored until nucleic acid extraction. DNA was extracted using ZymoBIOMICS DNA/RNA Miniprep Kits (Zymo Research, Irvine, CA, USA) according to the manufacturer’s instructions, except for the sediment samples. Briefly, the plastic samples were subjected to bead-beating for 10 min at the maximum speed of the vortex (VortexGenie 2, Scientific Industries Inc., Bohemia, NY, USA). DNA from the sediment samples was extracted using an RNeasy PowerSoil Total RNA Kit with DNA Elution Kit (QIAGEN) according to the manufacturer’s instructions. The concentration of DNA was measured using a Qubit 3.0 Fluorometer (Thermo Fisher Scientific). The metagenomic sequence libraries were constructed using the Illumina DNA Prep (M) Tagmentation Kit (Illumina, San Diego, CA, USA) with Nextera DNA CD Indexes for barcoding (Illumina) according to the manufacturer’s instructions. The quality of the constructed DNA libraries was evaluated using an Agilent 2100 Bioanalyzer with a High Sensitivity DNA Kit (Agilent Technologies, Santa Clara, CA, USA) according to the manufacturer’s instructions. Paired-end sequencing ( ) was performed using the HiSeq X platform at Macrogen Japan. The metagenomic sequences were deposited in the NCBI Sequence Read Archive (SRA) under accession number SRP468711.
Read processing and estimation of environmental parameters
The demultiplexed raw sequence reads were quality trimmed, and then separately applied to the de novo assembly with scaffolding based on paired-end reads with a -mer of 23 bp , a bubble size of 800 bp , and a minimum scaffold length of 400 bp on the CLC Genomics Workbench version 20.0 (QIAGEN, Venlo, the Netherlands). The raw sequence reads were mapped back to the scaffolds for calculating the coverage of scaffolds using Map Reads and the Contigs function in CLC Genomics Workbench version 20.0 with a length fraction of 0.7 and a similarity fraction of 0.95 . The estimated taxonomy of the scaffold was assigned based on the most redundant taxonomic classification of open reading frames (ORFs) called from the scaffold by MetaGeneMark via GhostKOALA ver. , as described elsewhere . content (%) was calculated using the Perl script provided in the MultiMetagenome pipeline .
To estimate the redox state and optimal growth rate of the plastisphere that correlated with the environmental conditions, the numbers of each amino acid in the ORFs were calculated for all proteins translated from the ORFs. Then, the existence matrix of 20 amino acids within the whole microbial community was calculated by the sum of the amino acid counts for all ORFs weighted using the coverage of ORFs. The optimal growth temperature of the microbiome ( ) was estimated by the IVYWREL fraction ( ) using the equation . To estimate the redox state of the
environment, the average oxidation state of carbon ( ) of the proteins per was calculated, as described elsewhere .
RpsC-based microbial community analysis
The Kyoto Encyclopedia of Genes and Genomes (KEGG) Automatic Annotation Server (KAAS) ver. 3 April 2015, was used for KEGG orthologous (KO) group assignment with the single-directional best hit method set to 45 as the threshold assignment score . The gene encoding ribosomal protein S3 (rpsC, K02981), a key marker singlecopy housekeeping gene for the phylogeny of microorganisms , was used for the metagenome-based population analysis . In brief, the taxonomy of RpsC proteins was primarily assigned based on class and genus in the GhostKOALA output, and further curated using a BLASTP search against the RefSeq protein database. The coverage of the scaffold, including the rpsC gene, was multiplied by the length of the RpsC protein, and the ratio of “coverage length” per summed value of the whole microbial community was calculated as the relative frequency. A weighted multidimensional scale (wMDS) plot was constructed for clustering 60 plastispheres based on the relative frequency matrix of class-level taxa or genus-level taxa for Alphaproteobacteria, Gammaproteobacteria, and Deltaproteobacteria. A wCCA diagram was constructed for correlating the summed relative frequencies of the abundant class/genus and the variables (plastispheres of PHAs, biodegradable polyesters, common plastics; and redox condition, either oxic or anoxic). A principal component analysis (PCA) plot was constructed for clustering BHT plastispheres, BHT deep-sea water microbiomes, and BHT sediments at different depths. The wMDS, wCCA, and PCA were calculated using XLSTAT ECOLOGY (ver. 2020.4.1.1014, Addinsoft, New York, NY, USA).
RpsC proteins with coverage of and a length amino acids were extracted to generate a phylogenetic tree. The proteins were aligned using MUSCLE, and the phylogenetic tree of the RpsC protein sequences was generated using the maximum-likelihood algorithm in the CLC Genomics Workbench 20.0.
Extraction of metagenome-assembled genomes
Draft genomes (MAGs) were extracted by grouping contigs using a coverage-GC% plot . The contig clusters were then refined by pairedend connections between contig ends that were counted by the Collect Paired Read Statistics function in the CLC Genome Finishing Module (QIAGEN), which allowed for the association of additional scaffolds and repeat regions (for example, rRNA genes), and the removal of incorrect scaffolds .
To clarify the MAG quality proposed by the Genomic Standards Consortium (GSC) , genome completeness and contamination were analyzed using CheckM ver. , while the numbers of tRNAs and rRNAs per MAG were counted using tRNAscan-SE ver. and RNAmmer ver. , respectively. The identified 16 S rRNA sequences coded in the MAGs were associated with the ASVs generated from the amplicon sequences of the 16 S rRNA genes within the plastispheres, as described above. For taxonomic assignment of the MAGs, GTDB-tk ver. 3.0 was run with default settings using the GTDB database release .
The scaffold sequences of each MAG have been deposited at DDBJ/EMBL/GenBank under BioProject PRJNA886482 as biosamples SAMN38046932-SAMN38046948.
Functional annotation of esterases
Membrane proteins were analyzed by prediction of transmembrane helices using the TMHMM server version . ORFs encoding esterases were identified by the best BLASTP hit in the ESTHER database ver. May 27, , as well as by using an in-house list of depolymerase proteins, including PHA depolymerases, cutinases, petases, PBAT hydrolases, BTA hydrolases, and depolymerases using an e-value cut-off of . Extracellular secretion-type PHA depolymerases were assigned by families Esterase_phb and
Esterase_phb_PHAZ in the ESTHER database at block X, while extracellular polyesterases for degrading biodegradable polyesters were assigned from the in-house depolymerase proteins as well as the families Polyesterase-lipase-cutinase and Carb_B_Bacteria in the ESTHER database at block L.
Global distribution of dominant microbes
We collected marine sediment 16S rRNA gene metagenome sequencing data from NCBI database, operated under the Illumina platform (HiSeq, MiSeq, NovaSeq, and Genome analyzer), and each data size was . The sequencing data were categorized using the same BioProject in the NCBI dataset, and each dataset was denoised and reconstructed under DADA2 in QIIME2 v. with parameters -p-max-ee 2.0 -p-n-reads-learn 1000,000, as 16 S rRNA gene metagenomic assemblies. To collect the distribution patterns of the dominant microbes on PHBs and biopolyesters, their 16S rRNA gene metagenome sequences were identified by BLASTN using rRNA gene metagenomic assemblies as the dataset, with >97% identity and 200-bp matches. The geographic distribution of dominant microbes on PHBs and biopolyesters was reconstructed using Ocean Data View 5.6.03 (https://odv.awi.de/.) with the weighted average of their presence-absence data.
Reporting summary
Further information on research design is available in the Nature Portfolio Reporting Summary linked to this article.
Data availability
All the data related to weight loss, thickness reduction, and BOD are provided with this article, Supplementary information and Source data file. All raw sequences of 16 S rRNA gene amplicon sequencing have been deposited at DDBJ (DNA Data Bank of Japan) Sequence Read Archive (DRA) under accession number DRA014821 in BioProject PRJDB14280. All raw sequences of metagenomic sequencing have been deposited at NCBI Sequence Read Archive (SRA) under accession number SRP468711 in BioProject PRJNA886482. Detailed information on sequence reads is summarized in Supplementary Table 10. The scaffold sequences of each MAG have been deposited at DDBJ/EMBL/ GenBank under BioProject PRJNA886482 as biosamples SAMN38046932 to SAMN38046948. Source data are provided in this paper.
References
Lebreton, L. C. M. et al. River plastic emissions to the world’s oceans. Nat. Commun. 8, 1-10 (2017).
Schmidt, C., Krauth, T. & Wagner, S. Export of plastic debris by rivers into the sea. Environ. Sci. Technol. 51, 12246-12253 (2017).
Jambeck, J. R. et al. Plastic waste inputs from land into the ocean. Science 347, 768-771 (2015).
Meijer, L. J. J. et al. than 1000 rivers account for of global riverine plastic emissions into the ocean. Sci. Adv. 7, 1-13 (2021).
José G. B. Derraik. The pollution of the marine environment by plastic debris: a review. Mar. Pollut. Bull. 44, 842-852 (2002).
Turner, A., Arnold, R. & Williams, T. Weathering and persistence of plastic in the marine environment: lessons from LEGO. Environ. Pollut. 262, 114299 (2020).
Barnes, D. K. A., Galgani, F., Thompson, R. C. & Barlaz, M. Accumulation and fragmentation of plastic debris in global environments. Philos. Trans. R. Soc. Lond. B Biol. Sci. 364, 1985-1998 (2009).
Wayman, C. & Niemann, H. The fate of plastic in the ocean environment-a minireview. Environ. Sci. Process Impacts 23, 198-212 (2021).
Michels, J., Stippkugel, A., Lenz, M., Wirtz, K. & Engel, A. Rapid aggregation of biofilm-covered microplastics with marine biogenic particles. Proc. Biol. Sci. 285, 20181203 (2018).
Nakajima, R. et al. Massive occurrence of benthic plastic debris at the abyssal seafloor beneath the Kuroshio Extension, the North West Pacific. Mar. Pollut. Bull. 166, 112188 (2021).
Egger, M., Sulu-Gambari, F. & Lebreton, L. First evidence of plastic fallout from the North Pacific Garbage Patch. Sci. Rep. 10, 7495 (2020).
Woodall, L. C. et al. The deep sea is a major sink for microplastic debris. R. Soc. Open Sci. 1, 140317 (2014).
European Bioplastics. BIOPLASTICS MARKET DEVELOPMENT UPDATE 2022. (2022).
Funabashi, M., Ninomiya, F. & Kunioka, M. Biodegradability evaluation of polymers by ISO 14855-2. Int. J. Mol. Sci. 10, 3635-3654 (2009).
Kasuya, K., Takagi, K., Ishiwatari, S., Yoshida, Y. & Doi, Y. Biodegradabilities of various aliphatic polyesters in natural waters. Polym. Degrad. Stab. 59, 327-332 (1998).
López-Ibáñez, S. & Beiras, R. Is a compostable plastic biodegradable in the sea? A rapid standard protocol to test mineralization in marine conditions. Sci. Total Environ. 831, 154860 (2022).
Lott, C. et al. Half-life of biodegradable plastics in the marine environment depends on material, habitat, and climate zone. Front. Mar. Sci. 8, 662074 (2021).
Nakayama, A., Yamano, N. & Kawasaki, N. Biodegradation in seawater of aliphatic polyesters. Polym. Degrad. Stab. 166, 290-299 (2019).
Emadian, S. M., Onay, T. T. & Demirel, B. Biodegradation of bioplastics in natural environments. Waste Manag. 59, 526-536 (2017).
Suzuki, M., Tachibana, Y. & Kasuya, K. Biodegradability of poly(3hydroxyalkanoate) and poly( -caprolactone) via biological carbon cycles in marine environments. Polym. J. 53, 47-66 (2021).
Gricajeva, A., Nadda, A. K. & Gudiukaite, R. Insights into polyester plastic biodegradation by carboxyl ester hydrolases. J. Chem. Technol. Biotechnol. 97, 359-380 (2022).
Urbanek, A. K. et al. Biochemical properties and biotechnological applications of microbial enzymes involved in the degradation of polyester-type plastics. Biochim. Biophys. Acta Proteins Proteom. 1868, 140315 (2020).
Kato, C. et al. Poly 3-hydroxybutyrate-co-3-hydroxyhexanoate films can be degraded by the deep-sea microbes at high pressure and low temperature conditions. High Press Res. 39, 248-257 (2019).
Nishida, H. & Tokiwa, Y. Effects of higher-order structure of poly(3hydroxybutyrate) on its biodegradation. I. Effects of heat treatment on microbial degradation. J. Appl. Polym. Sci. 26, 1467-1476 (1992).
Honsho, C., Ura, T., Kim, K. & Asada, A. Postcaldera volcanism and hydrothermal activity revealed by autonomous underwater vehicle surveys in Myojin Knoll caldera, Izu-Ogasawara arc. J. Geophys. Res. Solid Earth 121, 4085-4102 (2016).
Dilkes-Hoffman, L. S., Lant, P. A., Laycock, B. & Pratt, S. The rate of biodegradation of PHA bioplastics in the marine environment: a meta-study. Mar. Pollut. Bull. 142, 15-24 (2019).
Iwata, T., Gan, H., Togo, A. & Fukata, Y. Recent developments in microbial polyester fiber and polysaccharide ester derivative research. Polym. J. 53, 221-238 (2021).
Puanglek, S. et al. In vitro synthesis of linear -glucan and chemical modification to ester derivatives exhibiting outstanding thermal properties. Sci. Rep. 6, 30479 (2016).
Buchanan, C. M., Gardner, R. M. & Komarek, R. J. Aerobic biodegradation of cellulose acetate. J. Appl. Polym. Sci. 47, 1709-1719 (1993).
Komarek, R. J., Gardner, R. M., Buchanan, C. M. & Gedon, S. Biodegradation of radiolabeled cellulose acetate and cellulose propionate. J. Appl. Polym. Sci. 50, 1739-1746 (1993).
Tateiwa, J., Kimura, S., Kasuya, K. I. & Iwata, T. Multilayer biodegradable films with a degradation initiation function triggered by weakly alkaline seawater. Polym. Degrad. Stab. 200, 109942 (2022).
Zettler, E. R., Mincer, T. J. & Amaral-Zettler, L. A. Life in the ‘plastisphere’: microbial communities on plastic marine debris. Environ. Sci. Technol. 47, 7137-7146 (2013).
Kirstein, I. V., Wichels, A., Gullans, E., Krohne, G. & Gerdts, G. The plastisphere – uncovering tightly attached plastic “specific” microorganisms. PLoS One 14, 1-17 (2019).
Numata, K. et al. Synthesis of poly- and oligo(hydroxyalkanoate)s by deep-sea bacteria, Colwellia spp., Moritella spp., and Shewanella spp. Polym. J. 45, 1094-1100 (2013).
Jesse, P., Schratzberger, M., Sapp, M. & Osborn, A.M. Rapid bacterial colonization of low-density polyethylene microplastics in coastal sediment microcosms. BMC Microbiol. 14, 1-15 (2014).
Ling, S. K., Xia, J., Liu, Y., Chen, G. J. & Du, Z. J. Agarilytica rhodophyticola gen. nov., sp. nov., isolated from Gracilaria blodgettii. Int. J. Syst. Evol. Microbiol. 67, 3778-3783 (2017).
Pinnell, L. J. & Turner, J. W. Shotgun metagenomics reveals the benthic microbial community response to plastic and bioplastic in a coastal marine environment. Front. Microbiol. 10, 1252 (2019).
Ryan, W. B. F. et al. Global multi-resolution topography synthesis. Geochem. Geophys. Geosyst. 10, Q03014 (2009).
Parada, A. E., Needham, D. M. & Fuhrman, J. A. Every base matters: assessing small subunit rRNA primers for marine microbiomes with mock communities, time series and global field samples. Environ. Microbiol. 18, 1403-1414 (2016).
Apprill, A., Mcnally, S., Parsons, R. & Weber, L. Minor revision to V4 region SSU rRNA 806R gene primer greatly increases detection of SAR11 bacterioplankton. Aquat. Microb. Ecol. 75, 129-137 (2015).
Bolyen, E. et al. Reproducible, interactive, scalable and extensible microbiome data science using QIIME 2. Nat. Biotechnol. 37, 850-852 (2019).
Yoon, S. H. et al. Introducing EzBioCloud: a taxonomically united database of 16S rRNA gene sequences and whole-genome assemblies. Int. J. Syst. Evol. Microbiol. 67, 1613-1617 (2017).
Altschup, S. F., Gish, W., Miller, W., Myers, E. W. & Lipman, D. J. Basic local alignment search tool. J. Mol. Biol. 215, 403-410 (1990).
R Core Team. R: a language and environment for statistical computing. R Foundation for Statistical Computing, Vienna, Austria. (2020).
McMurdie, P. J. & Holmes, S. Phyloseq: an R package for reproducible interactive analysis and graphics of microbiome census data. PLoS One 8, e61217 (2013).
Villanueva, R. A. M. & Chen, Z. J. ggplot2: elegant graphics for data analysis (2nd ed.). Measurement (Mahwah J) 17, 160-167 (2019).
Tamura, K., Stecher, G. & Kumar, S. MEGA11: molecular evolutionary genetics analysis version 11. Mol. Biol. Evol. 38, 3022-3027 (2021).
Zhu, W., Lomsadze, A. & Borodovsky, M. Ab initio gene identification in metagenomic sequences. Nucleic Acids Res. 38, 1-15 (2010).
Kanehisa, M., Sato, Y. & Morishima, K. BlastKOALA and GhostKOALA: KEGG tools for functional characterization of genome and metagenome sequences. J. Mol. Biol. 428, 726-731 (2016).
Ishii, S. et al. A novel metatranscriptomic approach to identify gene expression dynamics during extracellular electron transfer. Nat. Commun. 4, 1-10 (2013).
Albertsen, M. et al. Genome sequences of rare, uncultured bacteria obtained by differential coverage binning of multiple metagenomes. Nat. Biotechnol. 31, 533-538 (2013).
Zeldovich, K. B., Berezovsky, I. N. & Shakhnovich, E. I. Protein and DNA sequence determinants of thermophilic adaptation. PLoS Comput. Biol. 3, 62-72 (2007).
Dick, J. M., Yu, M., Tan, J. & Lu, A. Changes in carbon oxidation state of metagenomes along geochemical redox gradients. Front. Microbiol. 10, 1-16 (2019).
Moriya, Y., Itoh, M., Okuda, S., Yoshizawa, A. C. & Kanehisa, M. KAAS: An automatic genome annotation and pathway reconstruction server. Nucleic Acids Res. 35, W182-W185 (2007).
Brown, C. T. et al. Unusual biology across a group comprising more than 15% of domain Bacteria. Nature 523, 208-211 (2015).
Ishii, S., Suzuki, S., Tenney, A., Nealson, K. H. & Bretschger, O. Comparative metatranscriptomics reveals extracellular electron transfer pathways conferring microbial adaptivity to surface redox potential changes. ISME J. 12, 2844-2863 (2018).
Bowers, R. M. et al. Minimum information about a single amplified genome (MISAG) and a metagenome-assembled genome (MIMAG) of bacteria and archaea. Nat. Biotechnol. 35, 725-731 (2017).
Parks, D. H., Imelfort, M., Skennerton, C. T., Hugenholtz, P. & Tyson, G. W. CheckM: assessing the quality of microbial genomes recovered from isolates, single cells, and metagenomes. Genome Res. 25, 1043-1055 (2015).
Lowe, T. M. & Eddy, S. R. tRNAscan-SE: a program for improved detection of transfer RNA genes in genomic sequence. Nucleic Acids Res. 25, 955-964 (1997).
Lagesen, K. et al. RNAmmer: consistent and rapid annotation of ribosomal RNA genes. Nucleic Acids Res. 35, 3100-3108 (2007).
Chaumeil, P. A., Mussig, A. J., Hugenholtz, P. & Parks, D. H. GTDB-Tk: a toolkit to classify genomes with the genome taxonomy database. Bioinformatics 36, 1925-1927 (2020).
Krogh, A., Larsson, B., von Heijne, G. & Sonnhammer, E. L. L. Predicting transmembrane protein topology with a hidden Markov model: application to complete genomes. J. Mol. Biol. 305, 567-580 (2001).
Lenfant, N. et al. ESTHER, the database of the -hydrolase fold superfamily of proteins: tools to explore diversity of functions. Nucleic Acids Res. 41, D423-D429 (2013).
Callahan, B. J. et al. DADA2: high-resolution sample inference from Illumina amplicon data. Nat. Methods 13, 581-583 (2016).
Bolyen, Evan et al. Reproducible, interactive, scalable and extensible microbiome data science using QIIME 2. Nat. Biotechnol. 37, 850-852 (2019).
Acknowledgements
We thank all members of the Laboratory of Science of Polymeric Materials, The University of Tokyo, for supporting sample preparation and analyses. Especially we thank Ilangovan Manikandan, Jin Ho Seok, QuiYuan Huang for their assistance in preparing Fig. 4b. We thank the captain and crew of R/Vs Yokosuka, Kairei, Shinsei-maru, and Kaimei for their great support of scientific activity during the expeditions YK19-11 (cruise Pl: Akinori Yabuki), YK21-08C, YK21-18C, KR20-E01C, KR21-04C, KS-20-1 (cruise PI: Tetsuro Ikuta), KM20-09, and KM21-E02. We extend this thanks to the HOV Shinkai 6500 team, the ROV Hyper Dolphin team, and the ROV KM-ROV team. Shiro Matsugaura and Tetsuya Miwa (JAMSTEC) are gratefully acknowledged for providing advice and support during Edokko Mark 1 deployment. We thank Shino Suzuki, Yuki Sakao, and Tomoka Fukumi for technical assistance in DNA and RNA extraction and sequence library preparation, Yuka Uenaka and Liao Fangyuan for supporting the bioinformatic analyses, and Keiko Tanaka and Sachiko Kawada for supporting the preparation of deployments at JAMSTEC. We thank Rieko Kasaishi, Masataka Furukawa and Chisato Mori for DNA extraction and 16 S rRNA gene amplicon sequencing, Erika Usui for supporting the microbial community analysis at NBRC. This paper is based on results obtained from three NEDO projects, Feasibility Study Program “Development of Marine-Biodegradable Plastics” (to T.I., N.I.), the Moonshot Research & Development Program “Research and development of marine biodegradable plastics with degradation initiation switch function” (JPNP18016) (to T.I., H.N., K-i.Ka.), and “Development of Marine-Biodegradable Assessment Methodology” (PJ-ID 20001845) (to T.I., M.K., A.N., K.Ka), commissioned by the New Energy and Industrial Technology Development Organization (NEDO). A part of this work was supported by the Council for Science, Technology and Innovation (CSTI), Cross-ministerial Strategic Innovation Promotion Program (SIP), “Innovative Technology for Exploration of Deep-sea Resources” (lead
agency: JAMSTEC) (to T.I., S.K., H.M.). This work was supported by a Grant-in-Aid for Scientific Research (A) (grant number: to T.I.) from the Japan Society for the Promotion of Science (JSPS, Japan). The synchrotron radiation experiments were performed at BLO3XU, SPring8, with the approval of the Frontier Softmaterial Beamline (FSBL) (proposal nos: 2019B7270, 2020A7223, and 2021A7222) (to T.I.). We thank Professor Charles Yokoyama, Ph.D., IRCN Executive Manager, The University of Tokyo, for editing a draft of this manuscript.
Author contributions
T.I. conceived the idea and guided all projects. T.O., K.Ko., M.S., H.M., and A.N. performed sample preparation and biodegradation assessment. S.K. performed SEM experiments. N.I., H.N., R.N., M.T., S.Ka. performed sample deployment and recovery. T.M., M.M., K.H., K.Ka. performed 16 S rRNA analysis and data analysis. S.I. carried out metagenome analysis. Y.I. analyzed the global distribution of microbes. T.I., N.I., K-i.Ka, S.K., H.M., A.N., M.K. acquired funds. T.O., N.I., T.M., S.I., M.M., Y.I., S.K., K.Ka, T.I. wrote the paper. All authors discussed the results and commented on the manuscript.