تحليل العلاقة بين توسيع الطاقة النظيفة، واستخراج الموارد الطبيعية، وعامل سعة الحمل في الصين: خطوة نحو تحقيق أهداف مؤتمر COP27 Analysing the nexus between clean energy expansion, natural resource extraction, and load capacity factor in China: a step towards achieving COP27 targets

المجلة: Environment Development and Sustainability
DOI: https://doi.org/10.1007/s10668-023-04399-z
تاريخ النشر: 2024-01-18

تحليل العلاقة بين توسيع الطاقة النظيفة، واستخراج الموارد الطبيعية، وعامل سعة الحمل في الصين: خطوة نحو تحقيق أهداف مؤتمر COP27

أوجونوغوا عثمان (D • أوكتاي أوزكان إبراهيم أديشولا باباتوندي سونداي إيوادي

تاريخ الاستلام: 9 أغسطس 2023 / تاريخ القبول: 19 ديسمبر 2023 / تاريخ النشر على الإنترنت: 18 يناير 2024 © المؤلفون 2024

الملخص

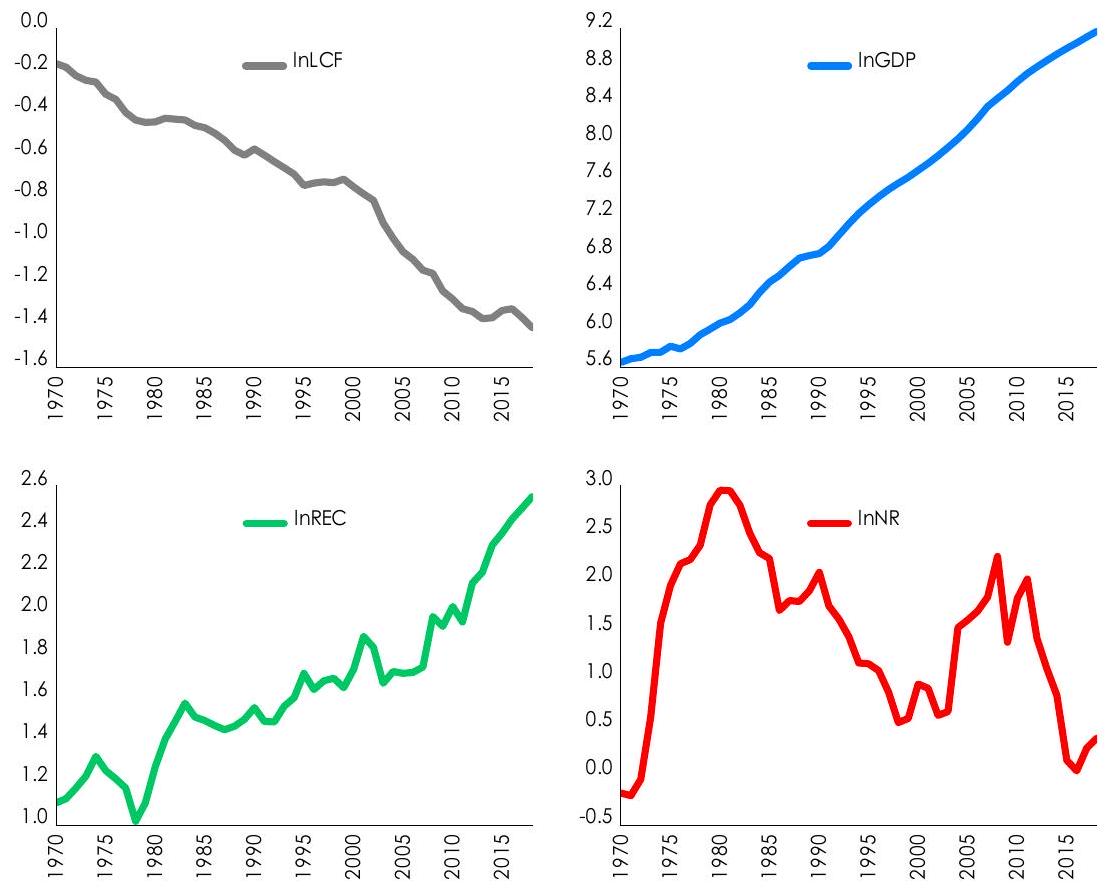
لقد استمر الاستخدام المفرط للطاقة غير المتجددة في نمو الاقتصاد في القرن الحادي والعشرين في الإضرار بالبيئة من خلال تراكم ثاني أكسيد الكربون وغازات الدفيئة الأخرى. ومع ذلك، يتطلب تعزيز الاستدامة البيئية توسيع استخدام الطاقة النظيفة. في هذه الدراسة، نفحص آثار توسيع الطاقة النظيفة واستخراج الموارد الطبيعية على عامل سعة الحمل (LCF) في الصين من عام 1970 إلى 2018. باستخدام نهج محاكاة الانحدار الذاتي الديناميكي الموزع، نوسع فرضية منحنى سعة الحمل القياسي (LCC) من خلال دمج توسيع الطاقة النظيفة واستخراج الموارد الطبيعية كعوامل رئيسية تحدد LCF. تكشف النتائج التجريبية أن التوسع الاقتصادي مرتبط إيجابياً بـ LCF، ولكن مصطلحه التربيعي يضعف LCF. وهذا يؤكد أن فرضية LCC غير صالحة للصين. علاوة على ذلك، بينما لتوسيع الطاقة النظيفة تأثير إيجابي على LCF، فإن تأثير استخراج الموارد الطبيعية سلبي. هذه التأثيرات أقوى وذات دلالة إحصائية فقط على المدى الطويل. لذلك، تسلط هذه الدراسة الضوء على الإمكانيات لاقتصاد مستدام خالٍ من الكربون في الصين من خلال الاستثمار ليس فقط في مصادر الطاقة النظيفة ولكن أيضًا في الاستخدام الفعال للموارد الطبيعية المتاحة في البلاد.

الكلمات الرئيسية الصين فرضية منحنى سعة التحميل استهلاك الطاقة النظيفة استخراج الموارد الطبيعية محاكاة ARDL الديناميكية

1 المقدمة

لقد تسبب ارتفاع غازات الدفيئة في العديد من العواقب السلبية، بما في ذلك الاحتباس الحراري وتغيرات المناخ. ونتيجة لذلك، أصبح الحفاظ على بيئة نظيفة وصحية أولوية حاسمة للمجتمعات والدول، بينما تظل القضايا الاقتصادية مهمة. تتضمن مبادرة عالمية حديثة تهدف إلى معالجة التحديات البيئية التجمع السنوي لقادة العالم عبر قمم المناخ التابعة للأمم المتحدة، والتي تُعرف عادةً بمؤتمر الأطراف (COP) في إطار اتفاقية الأمم المتحدة الإطارية بشأن تغير المناخ (UNFCCC) (ليجيت، 2020؛ وانغ وتشانغ، 2014). يتكون هذا التجمع من ممثلين من دول مختلفة حول العالم.
يهدف إلى الانخراط في مناقشات ومفاوضات تتعلق بالتدابير الخاصة بتخفيف آثار تغير المناخ والتكيف معه. خلال القمم، ستقدم الدول المشاركة برامجها واستراتيجياتها بالإضافة إلى التحديات التي تواجهها في تقليل درجات الحرارة العالمية من خلال الابتعاد عن الوقود الأحفوري واعتماد مصادر الطاقة البديلة في مناطقها وقاراتها (Chen et al., 2022; Sun et al., 2021; Zhang et al., 2019).
تهدف هذه الدراسة إلى فحص ما إذا كانت السياسات المناخية التي تعزز توسيع الطاقة النظيفة واستخراج الموارد الطبيعية تمارس ضغطًا تصاعديًا أو تنازليًا على الاستدامة البيئية في الصين. باعتبارها دولة موقعة على اتفاق باريس، كانت الصين ملتزمة على مر السنين بمعالجة القضايا البيئية. مؤخرًا، في التزاماتها تجاه اتفاق باريس، قدمت الصين عدة سياسات مناخية، والتي تشمل “سياسة الكربون المزدوج”. الهدف الرئيسي من سياسة الكربون المزدوج هو الوصول إلى ذروة انبعاثات ثاني أكسيد الكربون ( ) في البلاد قبل عام 2030 وتحقيق الحياد الكربوني بحلول عام 2060 (انظر شاو وآخرون، 2022؛ تشاو وآخرون، 2022؛ وانغ ويان، 2022).
بينما تتجه الصين بسرعة نحو مصادر الطاقة النظيفة، هناك مستوى متزايد من استخراج الموارد الطبيعية لتلبية الطلب على النمو في القرن الحادي والعشرين، الذي يتميز بالإنتاج والاستهلاك المكثف. نظريًا، مع استنزاف الموارد الطبيعية، هناك ميل إلى أن هذا الاستنزاف قد يؤدي إلى تحديات بيئية كما أشار تشانغ ووانغ (2017). علاوة على ذلك، نظرًا للنمو الهائل للصين على مر السنين مع سكانها الواسع الذي يتجاوز 1.4 مليار (أي. من إجمالي السكان العالميين)، تعتبر البلاد واحدة من أكبر الدول المصدرة لـ حيث شكلت أكثر من من انبعاثات غازات الدفيئة في العالم في عام 2019. انبعاثات الفرد تبلغ 9 أطنان مترية من لم تكن فقط أعلى من الانبعاثات في 27 دولة من دول الاتحاد الأوروبي ولكنها أعلى من المتوسط العالمي. وفقًا لستاتيستا (2022)، كانت الصين أكبر ملوث في العالم في عام 2021، حيث أصدرت حوالي 11.47 مليار طن متري من على الرغم من أن معظم الدول شهدت انخفاضًا في إجمالي الانبعاثات بسبب جائحة COVID-19 في عام 2020، كانت الصين واحدة من الدول القليلة التي شهدت ارتفاعًا في مستوى الانبعاثات (انظر ستاتيستا، 2022؛ أوزكان وآخرون، 2023أ و ب).
أساسًا، تم استخدام فرضية منحنى كوزنتس البيئي (EKC)، التي روج لها غروسمان وكروجر (1991)، على نطاق واسع لشرح العلاقة بين النمو الاقتصادي، واستهلاك الطاقة، واستدامة البيئة. بينما استخدمت بعض الدراسات الانبعاثات لقياس حالة تلوث البيئة والاستدامة (دينغ وآخرون، 2021؛ خطاب وآخرون، 2022)، استخدمت عدة دراسات تجريبية البصمة البيئية (EF) لتقييم تأثير الأنشطة البشرية على البيئة المستدامة (انظر عثمان وآخرون، 2020أ و ب؛ فخر وآخرون، 2023؛ جيمبا وآخرون، 2023). وقد تعرضت هذه المقاييس الشائعة للانتقاد لكونها قادرة فقط على التقاط جانب الطلب من المعادلة البيئية. لذلك، تسهم دراستنا في الأدبيات من ثلاثة جوانب: أولاً، تقوم دراستنا ببناء متغير عامل قدرة التحميل (LCF)، الذي يأخذ في الاعتبار بوضوح عوامل الطلب والعرض. هذا المتغير يلتقط الاستدامة البيئية بشكل شامل أكثر من الانبعاثات أو البصمة البيئية المستخدمة بشكل شائع في الأدبيات الحالية. ثانيًا، يتم اختبار فرضية منحنى القدرة الاستيعابية (LCC) في الصين من خلال التحكم في تأثيرات توسيع الطاقة النظيفة واستخراج الموارد الطبيعية. سيوفر ذلك رؤى سياسية لتسريع وتيرة تحقيق أهداف الانبعاثات الصفرية بحلول عام 2060 في الصين. ثالثًا، يتم تطبيق نموذج محاكاة ديناميكي للانحدار الذاتي الموزع (DARDL) لالتقاط تأثير الصدمة المضادة للواقع في المتغيرات التفسيرية على مر الزمن.
يأمل أن تساعد نتائج هذه الدراسة الحكومات وصانعي السياسات في صياغة وتصميم سياسات وبرامج بيئية مناسبة تعزز ليس فقط النمو المستدام ولكن أيضًا الطاقة النظيفة والاستخدام الفعال للموارد الطبيعية المتاحة لتحقيق أهداف انبعاثات صافية صفرية على المدى الطويل في الصين. الأجزاء المتبقية من هذه الدراسة منظمة بمهارة بناءً على ما يلي: القسم 2 يستعرض المتعلق بـ
الأدب. يقدم القسم 3 مجموعة البيانات والأساليب التجريبية المستخدمة. يقدم القسم 4 النتائج التجريبية ومناقشة النتائج الرئيسية. أخيرًا، يقدم القسم 5 ملخصًا للدراسة جنبًا إلى جنب مع التوصيات السياسية بناءً على النتائج.

2 الإطار النظري ومراجعة الأدبيات

الدراسة النظرية الأساسية تستند إلى نظريتين متميزتين في الاستدامة البيئية. النظرية الأولى تستند إلى فرضية LCC التي قدمها سيتش وآخرون (2010). تستند هذه الفرضية إلى الافتراض بأن LCF له تأثير متناقص على النمو الاقتصادي في المرحلة المبكرة من التنمية. ومع ذلك، بعد تحقيق تقدم تكنولوجي معين، سيكون لزيادة LCF ارتباط إيجابي مع النمو الاقتصادي. بموجب هذه الفرضية، يتميز العلاقة بين النمو الاقتصادي والاستدامة البيئية بـ -شكل.
في الآونة الأخيرة، حاولت عدة دراسات اختبار صحة فرضية LCC. على سبيل المثال، أظهر باتا وكارتال (2023) دعمًا كاملًا لفرضيات LCC و EKC في كوريا الجنوبية، حيث عززت الطاقة النووية مستوى حماية البيئة، بينما لم تحقق الطاقة المتجددة تحسينًا بيئيًا كبيرًا على المدى الطويل. كما درس باتا وآخرون (2023أ) الدور الحيوي الذي تلعبه الاستثمارات في الطاقة المتجددة والطاقة النووية في البحث والتطوير والدخل في تحقيق الاستدامة البيئية في ألمانيا. كما تم توثيقه، فإن الاستثمار في الطاقة النظيفة يقلل من الأضرار البيئية، بينما يعتبر الاستثمار في البحث والتطوير المتعلق بالطاقة النووية غير فعال في تقليل تدهور البيئة. وبالتالي، فإن فرضية LCC غير صحيحة، ولكن تم تأكيد EKC. علاوة على ذلك، في اختبار فرضية LCC باستخدام كفاءة الطاقة غير المتجددة و REC، طبق أولا وآخرون (2023) محاكاة ARDL الديناميكية للهند. بينما اقترحت النتائج أن كفاءة الطاقة غير المتجددة والطاقة المتجددة تعزز مستوى LCF، هناك أيضًا أدلة على أن فرضية LCC غير صحيحة بالنسبة للهند. على العكس من ذلك، درس هوانغ وآخرون (2023) تأثير التكنولوجيا من حيث الصداقة البيئية على البيئة المقاسة بواسطة LCF في الاقتصاد الهندي. أظهرت النتائج أن تم التحقق من فرضية LCC على شكل – في الهند. وأشارت النتائج أيضًا إلى أن التكنولوجيا المعتمدة على البيئة تقلل من LCF. وهذا يعني بشكل لا لبس فيه أن زيادة التكنولوجيا الصديقة للبيئة تضر بجودة البيئة في الهند، ولكن زيادة استهلاك الطاقة تعزز جودة البيئة.
النظرية الثانية لهذه الدراسة تستند إلى فرضية التمويل المستدام التي قدمها برنامج الأمم المتحدة للبيئة (المشار إليه فيما بعد بـ UNEP) في عام 2014. الأطروحة الرئيسية لهذه النظرية هي أن قرارات الاستثمار تتركز بشكل أساسي على ثلاثة جوانب رئيسية، وهي البيئة، والاجتماعية، والحوكمة (ESG). ترتبط هذه الجوانب بالنمو الاقتصادي. لغرض هذه الدراسة، فإن اهتمامنا ينصب على عامل البيئة، الذي يتعامل مع الإجراءات المناخية للتخفيف من تدهور البيئة الناجم عن تراكم ومكونات أخرى من غازات الدفيئة. استنادًا إلى فرضية التمويل المستدام، من المتوقع استخدام الموارد بطريقة تعزز ليس فقط بيئة أنظف، ولكن أيضًا النمو الاقتصادي والتنمية. في مثل هذه الحالة، يتم التركيز على الأنشطة الخضراء من خلال توسيع الطاقة المتجددة من خلال الابتكارات والتقنيات. تم اختبار صحة هذه النظرية في التمويل المستدام تجريبيًا في عدة دراسات حديثة. على سبيل المثال، أظهر تشانغ ووانغ (2017) أن غياب نظام قانوني واضح لتطوير الطاقة المتجددة البحرية يؤثر على تطوير قطاع الطاقة المتجددة. وجد بالسيلار وآخرون (2023أ) أدلة على أن الاستثمار في الطاقة المتجددة يحفز
النمو المستدام في دول منظمة التعاون والتنمية الاقتصادية، بينما دعم عثمان (2023) فرضية التمويل المستدام من خلال دعم دور الإنفاق على الطاقة المتجددة في التخفيف من تدهور البيئة في دول مجموعة السبع.
مع وجود أدلة قوية على تطوير مصادر الطاقة النظيفة وتكثيف سياسات الطاقة الانتقالية النظيفة، إذا تم استخدام الموارد بكفاءة، قد يتم تقليل التحديات البيئية بشكل كبير في الصين. وفقًا لفيرنانديز (2023)، فإن استهلاك الصين للطاقة الشمسية أكبر بكثير من استهلاك الدول الكبرى الأخرى، بما في ذلك الولايات المتحدة الأمريكية واليابان وألمانيا. بالإضافة إلى ذلك، شهدت توليد الطاقة الشمسية نموًا كبيرًا على مر الزمن في الصين، حيث تم توليد إجمالي 330 تيراوات ساعة في عام 2021. في الوقت نفسه، تعتبر الطاقة الريحية المصدر الثاني الأكثر أهمية للطاقة النظيفة في الصين. أيضًا، أظهر عثمان (2022) استنادًا إلى نموذج ARDL الديناميكي أن ارتفاع مستوى الطاقة المتجددة يقلل من الكوارث البيئية في نيجيريا من خلال تأثيره السلبي على البصمة البيئية، بينما درس شيو وآخرون (2022) كيف تؤثر العولمة المالية على مستوى انبعاثات الكربون في البرازيل مع الأخذ في الاعتبار دور الطاقة المتجددة والتنمية الحضرية. وتظهر نتائجهم أدلة على أن كل من الطاقة المتجددة وغير المتجددة تسهم في انخفاض مستوى انبعاثات الكربون. علاوة على ذلك، في ورقة حديثة، وجد أديكبو وعثمان (2023) أنه، بالإضافة إلى التأثير السلبي لسمعة الدولة في تقليل الآثار البيئية الخارجية، تساعد الطاقة المتجددة بوضوح في تعزيز الاستدامة البيئية في اقتصادات مجموعة D-8. أظهر نواني وآخرون (2023) من خلال تطبيق مقاييس هوية كايا المعتمدة على الاستهلاك، أن الطاقة المتجددة مرتبطة سلبًا بـ الانبعاثات، بينما يتم العثور على الشكل – بين الطاقة وكثافة الكربون لدول الاتحاد الأوروبي.
علاوة على ذلك، درست عدة دراسات كيف تؤثر استكشافات الموارد الطبيعية على البيئة. على سبيل المثال، استخدم باديب وآخرون (2020) تقنيات الانحدار الذاتي الموزع (ARDL) وتقنيات التكامل الهيكلي لفحص تأثير الموارد الطبيعية (NRs) على جودة البيئة ضمن إطار منحنى كوزنتس البيئي (EKC). أظهرت نتائج أبحاثهم أن الاعتماد على الموارد الطبيعية يدعم العلاقة بين النمو الاقتصادي وجودة البيئة. دراسة أخرى أجراها ظافر وآخرون (2019) بحثت تأثير الموارد الطبيعية على البصمة البيئية للولايات المتحدة (EFP) من 1970 إلى 2015 باستخدام منهجيات ARDL واختبار الحدود. كشفت نتائجهم أن وفرة الموارد الطبيعية مرتبطة سلبًا بالبصمة البيئية، مما يؤدي إلى تحسين جودة البيئة على المدى الطويل. كما بحث أحمد وآخرون (2020) دور الموارد الطبيعية ورأس المال البشري والتنمية الحضرية على مستوى البصمة البيئية في الصين. أظهرت النتائج أنه بينما يؤدي زيادة كل من الموارد الطبيعية والتنمية الحضرية إلى تصعيد الكوارث البيئية، فإن رأس المال البشري يخفف من البصمة البيئية. أيضًا، يشير ناثانيال وآخرون (2020) إلى أن النمو الاقتصادي والموارد الطبيعية لهما تأثير إيجابي وذو دلالة على البصمة البيئية، لكن تأثير الطاقة المتجددة سلبي وذو دلالة. تشير هذه النتائج إلى أن التوسع الاقتصادي مع الموارد الطبيعية يسبب كوارث بيئية، لكن الطاقة المتجددة تحسن البيئة من حيث الاستدامة في دول البريكس.
وبالمثل، في ورقة حديثة، وجد بالسيلا وآخرون (2023ب) أن التأثير السلبي لسلوكيات الشركات متعددة الجنسيات على البيئة قد يتأثر بموارد الطبيعية في أفريقيا. لقد كانت هناك بعض الدراسات التي نظرت في العلاقة بين البيئة المستدامة وLCF. قام باتا (2021) بالتحقيق في تأثير REC على LCF في الولايات المتحدة واليابان. باستخدام نموذج ARDL المعزز، وثقت الدراسة أن REC عزز LCF في الولايات المتحدة؛ ومع ذلك، كانت شدة REC غير ذات دلالة في اليابان. كما وثق فريد وآخرون (2021) أن REC وتنويع الصادرات يعززان LCF، مما يؤدي في النهاية إلى تحسين البيئة. علاوة على ذلك، تم تقييم دور الموارد الطبيعية في تفسير الكوارث البيئية من قبل نقفي وآخرون (2023). تكشف النتائج أن الموارد الطبيعية تزيد من مستوى تدهور البيئة في 14 دولة في تعاون آسيا والمحيط الهادئ الاقتصادي. أيضًا، يقيم ليو وآخرون (2023) كيف يؤثر مستوى الموارد الطبيعية والتوسع الاقتصادي على البيئة في الدول الآسيوية. النتائج
الجدول 1 تفاصيل المتغيرات
متغير أبر قياس المصادر
عامل سعة التحميل LCF (غ/فرد) GFN (2022)
التوسع الاقتصادي الناتج المحلي الإجمالي الناتج المحلي الإجمالي للفرد بالأسعار الثابتة بالدولار الأمريكي لعام 2015 WDI (2022)
استهلاك الطاقة النظيفة تسجيل استهلاك الطاقة الأولية من المصادر المتجددة (% من الإجمالي) OWD (2022)
استخراج الموارد الطبيعية NR إجمالي إيرادات الموارد الطبيعية كنسبة من الناتج المحلي الإجمالي WDI (2022)
تظهر أن الموارد الطبيعية تخفف من الكوارث البيئية في الدول المصدرة للنفط، بينما يحفز التوسع الاقتصادي الكوارث في البيئة.
بالنظر إلى مراجعة الأدبيات السابقة، من الواضح أن الحاجة إلى التحقيق في هذه القضية المحددة ليست مدفوعة فقط بقلة الأدبيات حول العلاقة بين الموارد الطبيعية والطاقة النظيفة وLCF، ولكن أيضًا لتقييم كيفية تخفيف توسيع الموارد الطبيعية والطاقة النظيفة للآثار البيئية السلبية باستخدام إجراء فرضية LCC. نأمل أن تسهم مساهمتنا في تقديم لمحة عن فعالية أو عدم فعالية توسيع استخدام الطاقة النظيفة والموارد الطبيعية في تعزيز أهداف الحياد الكربوني في الصين.

3 مصادر البيانات وتطوير المنهجية

3.1 مصادر البيانات

في هذه الدراسة، يتم اتباع نهج تحليلي لسلاسل الزمن لتحقيق هدف محدد للدراسة في الصين بين فترات 1970 إلى 2018. تم الحصول على بيانات الناتج المحلي الإجمالي للفرد واستخراج الموارد الطبيعية (NR) من مؤشرات التنمية العالمية (WDI، 2022). تم الحصول على عامل سعة الحمل (LCF) والطاقة المتجددة/غير الملوثة (REC) من شبكة البصمة العالمية وبيانات عالمنا، على التوالي (GFN، 2022؛ OWD، 2022). المتغيرات، ووحدات قياسها، ومصادرها موضحة في الجدول 1:

3.2 النموذج التجريبي

لفحص تأثير المتغيرات مثل توسيع الطاقة النظيفة واستخراج الموارد الطبيعية على مستوى LCF، نقوم ببناء الدالة الاقتصادية العامة في المعادلة (1):
حيث LCF هو عامل سعة التحميل، وهو مقياس لجودة البيئة. الناتج المحلي الإجمالي والناتج المحلي الإجمالي الناتج المحلي الإجمالي وعبارته المربعة. بينما يقيس الناتج المحلي الإجمالي مستوى
النمو الاقتصادي، يظهر الناتج المحلي الإجمالي المربع ما إذا كانت الدولة ذات التكلفة المنخفضة تتميز بـ -شكل أو مقلوب -شكل. علاوة على ذلك، تقدم REC و NR توسيع الطاقة النظيفة واستخراج الموارد الطبيعية، والتي تم تضمينها في النموذج كعوامل تحدد LCF. لذلك، وفقًا للمعادلة (1)، يعبر النموذج الاقتصادي في المعادلة (2) عن النمو الاقتصادي وحده التربيعي، وتوسيع الطاقة النظيفة، والموارد الطبيعية كعوامل تحدد LFC:
حيث، تمثل In الأشكال اللوغاريتمية لكل من المتغيرات. تشير إلى التقاطع، إلى هي معاملات متغيرات المتنبئ، تشير إلى المتغير العشوائي. للتخلص من مشاكل عدم الطبيعية وعدم تجانس التباين في الدراسة، أوصى سامرين وماجد (2022)، ورامزاني وآخرون (2022)، وباتا وآخرون (2023ب) بأن تتبنى جميع المتغيرات في النموذج تحويل اللوغاريتم. إذا كان معامل سلبي، ، ومعامل إيجابي ( )، فإن فرضية LCC تكون مؤكدة. إذا كان العكس هو الصحيح، فهذا يعني أن فرضية LCC لا يمكن التحقق منها أو دعمها. معامل من المتوقع أن يكون مرتبطًا سلبًا مع LCF لأن الصين دولة تستهلك كميات كبيرة من الوقود الأحفوري ومصادر الطاقة التقليدية الأخرى. على وجه الخصوص، تعتبر الصين أكبر مستهلك للفحم في العالم. يقلل من انبعاثات الكربون في الغلاف الجوي. وذلك لأن استهلاك الطاقة النظيفة يساعد على خفض تركيز الكربون dioxide في الغلاف الجوي ومكونات أخرى من غازات الدفيئة. لذلك، من المفترض أن يكون له تأثير إيجابي على LCF ( ).

3.3 نموذج محاكاة ARDL الديناميكي

تُستخدم نماذج ARDL (النماذج الانحدارية الموزعة زمنياً) غالباً لتقدير العلاقات طويلة الأمد بين المتغيرات، خاصة في ظل وجود عدم الاستقرارية. يمكن أن تكون تطبيقات نموذج ARDL تحدياً عندما يتميز النموذج بتعقيد أطوال التأخير والمتغيرات المشتقة. وذلك لأن تأثيرات المتغيرات المستقلة قد تنتشر عبر فترات زمنية مختلفة، وقد يكون من الصعب عزل تأثيرات متغيرات معينة في وجود متغيرات أخرى وتأخيراتها. بالإضافة إلى ذلك، يمكن أن يؤثر طول بيانات السلاسل الزمنية واختيار أطوال التأخير أيضاً على دقة النتائج. لذلك، فإن التحليل الدقيق وتفسير النتائج ضروريان لتحديد تأثيرات المتغيرات المستقلة بدقة على المدى القصير والطويل. لتبسيط العملية، قدم الأردن وفيلبس (2018) نهج نمذجة ARDL الديناميكية المحاكية لمعالجة تعقيد تقدير تأثيرات المتغيرات المستقلة على المتغير التابع. كما أشار العمل الأخير لأوزكان وآخرون (2023) وأوزكان وآخرون (2023أ) إلى أن نموذج ARDL الديناميكي يمكنه التعامل مع قضية معقدة تتعلق بتعدد تأخيرات المتغيرات ذات الفرق الأول، وبالتالي توفير الرسم التقديري لتأثيرات الصدمات الخارجية على المدى الطويل والقصير خارج العينة بمرور الوقت. لاستخدام نموذج المحاكاة الديناميكية لـ ARDL، يجب استيفاء معيارين كما أشار سركودي وآخرون (2019): أولاً، يجب أن يكون للمتغيرات ترتيب تكامل لا يزيد عن ؛ ثانياً، يجب أن تكون المتغيرات متكاملة في التزامن. بالنسبة للمعيار الأول، فإن
يجب أن تكون المتغيرات الداخلية (LCF) ثابتة، أي I(1)، بينما يمكن أن يكون لمتغيرات الخارجية ترتيب تكامل إما أو . لذلك، تُظهر المعادلة (3) تعبير نموذج محاكاة ARDL الديناميكي كما يلي:
من المعادلة (3)، يمثل عامل الفرق، تشير إلى التقاطع، هو التأخير الأول للمتغير الداخلي. تمثل المعلمات قصيرة الأجل بينما هي المعلمات على المدى الطويل. المصطلح الأخير، أي تشير إلى مصطلح الاضطراب، الذي يُفترض أن له متوسطًا صفريًا.

4 النتائج التجريبية والمناقشة

4.1 الفحص الأولي

الخطوة الأولية في عملية تحليل البيانات المتعلقة بالسلاسل الزمنية تتضمن الفحص الأولي، والذي يتضمن رسمًا بيانيًا زمنيًا للمتغيرات المستكشفة في الدراسة. هذا ضروري لتحديد ما إذا كانت هناك اتجاهات، أو موسمية، أو انحرافات، أو انكسارات هيكلية في هذه المتغيرات، حيث إن وجودها قد يعيق نتائج الانحدار. كما هو موضح في الشكل 1، تكشف تمثيلات الرسم البياني للسلاسل الزمنية أن المتغيرات تظهر اتجاهًا. لذلك، من الضروري إجراء مزيد من الاختبارات لتحديد ما إذا كانت المتغيرات ثابتة.
تم الكشف عن التحليل الإحصائي الوصفي للمتغيرات المذكورة أعلاه بشكل مفهوم في الجدول 2. جميع المتغيرات موزعة بشكل طبيعي مع انحراف قريب من 0 لجميع المتغيرات وكورتوزيس له قيم إيجابية لجميع المتغيرات. مقارنة بمتوسط المتغيرات الأخرى، يتمتع الناتج المحلي الإجمالي بمتوسط مرتفع يبلغ 7.246. شهدت الصين نمواً اقتصادياً سريعاً على مدى العقود القليلة الماضية، ولعب الناتج المحلي الإجمالي دوراً حاسماً في دفع هذا النمو. في عام 2019، ساهم قطاع الطاقة (بما في ذلك الكهرباء والغاز وإمدادات المياه) بحوالي الناتج المحلي الإجمالي للصين. وهذا يشير إلى أن قطاع الطاقة هو مكون مهم في اقتصاد الصين، لكنه ليس القطاع السائد (موريسون، 2019؛ تشنغ ووالش، 2019). ومن الجدير بالذكر أن الصين قد استثمرت بشكل كبير في الطاقة النظيفة وكفاءة الطاقة في السنوات الأخيرة، في محاولة لتقليل اعتمادها على الوقود الأحفوري والتخفيف من آثار تغير المناخ. من المحتمل أن يكون لهذا التحول في سياسة الطاقة تأثير كبير على مساهمة قطاع الطاقة في الناتج المحلي الإجمالي للصين في المستقبل. الموارد الطبيعية، التي تمثل النمو الاقتصادي في عام 2011 و في عام 2008، ساهم بشكل كبير في الناتج المحلي الإجمالي للصين (باتا وإيسيك، 2021). تم الكشف بشكل متكرر أن استدامة البيئة في الصين تحسنت بمعدل مختلف عن الدول الأخرى. انخفض مؤشر استخدام الموارد البيئية قليلاً من 0.64 في عام 1981 إلى 0.24 في عام 2017، مما يشير إلى أن استهلاك الموارد في الصين يتجاوز الاستدامة البيئية. يستهلك الصينيون المزيد من الأصول البيئية مقارنة بالموارد المتاحة، مما يؤدي إلى تدهور البيئة (مينغ وآخرون، 2021؛ شيونغ وشو، 2021).
الشكل 1 مخططات السلاسل الزمنية للوغاريتمات الطبيعية لعامل سعة التحميل ( الناتج المحلي الإجمالي للفرد ( التوسع في الطاقة النظيفة (lnREC) واستخراج الموارد الطبيعية (lnNR)
الجدول 2 الإحصائيات الوصفية للمتغيرات في النموذج
lnLCF LnGDP lnREC lnNR
معنى -0.748 ٧.٢٦٤ 1.650 1.438
الوسيط -0.688 ٧.٢٣٣ 1.599 1.582
الحد الأقصى -0.166 9.171 ٢.٥٥٠ ٢.٩٥٨
حد أدنى -1.414 5.647 1.015 -0.201
الانحراف المعياري 0.383 1.143 0.385 0.847
الانحراف -0.387 0.142 0.615 -0.167
التفرطح 1.881 1.690 2.835 2.201
جارك-بيرا ٣.٧٨١ ٣.٦٦٥ ٣.١٤٢ 1.529
احتمال 0.151 0.160 0.208 0.466
٤٩ ٤٩ ٤٩ ٤٩

4.2 نتائج جذر الوحدة

عند تحليل البيانات من السلاسل الزمنية، من الضروري معالجة ما إذا كانت السلسلة ثابتة أو غير ثابتة. العملية العشوائية الثابتة هي تلك التي لا تتغير فيها الخصائص الإحصائية (مثل المتوسط، التباين، والتغاير الذاتي) مع مرور الوقت. استخدمت العديد من الدراسات اختبارات الجذر الأحادي القياسية التي قدمها ديكي وفولر (1979) وفيليبس وبيرون (1988) للتحقيق في ترتيب التكامل للمتغيرات. كلا الاختبارين غير مناسبين لمجموعات البيانات ذات العينة الصغيرة بسبب خصائص الحجم والقوة الضعيفة لهما (ديجون وآخرون،
جدول 3 نتائج اختبارات الجذر الأحادي
اللوحة أ: اختبار الجذر الأحادي المعدل بواسطة نج-بيرون
MZa MZt MSB MPT
lnLCF 1.430 1.166 0.815 52.430
-20.161*** -3.147*** 0.156*** 1.315***
lnGDP 0.081 0.041 0.506 19.698
الناتج المحلي الإجمالي -15.224*** -2.759*** 0.181*** 1.610***
lnREC ٢.٦٠١ 1.736 0.667 44.574
REC -23.484*** -3.423*** 0.146*** 1.056***
lnNR -2.194 -1.040 0.474 ١١.١٠٥
-22.061*** -3.318*** 0.150*** 1.121***
اختبار القيم الحرجة اللانهائية
1% -١٣.٨٠٠ -2.580 0.174 1.780
5% -8.100 -1.980 0.233 ٣.١٧٠
10٪ – ٥.٧٠٠ – 1.620 0.275 ٤.٤٥٠
اللوحة ب: اختبار جذر الوحدة DF-GLS
-إحصائي اختبار القيم الحرجة
lnLCF 1.046 1% -2.615
– 4.533*** -1.948
lnGDP 0.352 10٪ -1.612
-3.465***
lnREC 1.405
REC -6.621***
lnNR -1.190
– 5.265***
***يظهر دلالة عند مستوى دلالة 1% وفقًا لذلك
1992). ونتيجة لذلك، يتم استخدام اختبار جذر الوحدة Ng-Perron و DF-GLS في هذه الدراسة. تكشف الجدول 3 عن نتائج اختبار جذر الوحدة لجميع المتغيرات (LCF، GDP، REC، NR). كما تظهر النتائج، لا يمكن لجميع المتغيرات رفض الفرضية الصفرية، مما قد يدل على عدم الاستقرار عند المستويات، ولكن نتائج الفروق الأولى تشير إلى أن جميع السلاسل مستقرة بشكل ملحوظ عند مستوى الدلالة للاختبارين المتميزين لجذور الوحدة (أي إليوت وآخرون، 1996 ونج وبيرون، 2001).

4.3 نتائج التكامل المشترك

علاوة على ذلك، بمجرد تحديد ترتيب تكامل المتغيرات، تكون الخطوة التالية هي تقييم ما إذا كانت هناك علاقة طويلة الأجل بين المتغيرات. يتم ذلك باستخدام نهج اختبار الحدود لبيساران وشين وسميث (PSS، 2001) في الجدول 4. عند مستوى دلالة المقدّر -إحصائية t بقيمة 12.082 وإحصائية t بقيمة -5.552 كلاهما أكبر من الحدود العليا المقابلة (القيم الحرجة) 7.30 و -4.10 على التوالي. وهذا يشير إلى رفض الفرضية الصفرية، مما يدل بشكل قاطع على وجود دليل قوي على وجود علاقة طويلة الأمد ذات دلالة إحصائية بين المتغيرات التي يتم تحليلها. وبالتالي، فإن نتائج اختبار حدود PSS باستخدام
الجدول 4 نتائج اختبار التكامل المشترك لـ PSS
نموذج:
النموذج المقدر: ARDL(2,1,0,0,1)
القيم الحرجة لنارايان (2005)
10٪ 5%
-إحصائي 12.082***
٤.٠٧ 5.19 5.82 ٧:٣٠
3.334 .314 .07
القيم الحرجة لـ PSS (2001)
10٪ 5% 1%
-إحصائي – 5.552***
-2.57 -3.21 -2.86 -3.53 -3.43 – 4.10
و تشير إلى الحدود الدنيا والعليا، على التوالي. *** تمثل الدلالة عند مستوى الدلالة
تقدم القيم الحرجة لنارايان (2005) والقيم التقريبية دليلًا على وجود علاقة تكامل مشترك بين السلاسل. وهذا يعني أن LCF و GDP و GDP تتمتع REC و NR بعلاقة مستقرة وطويلة الأمد.

4.4 معاملات ARDL الديناميكية على المدى الطويل والمدى القصير

بعد التحقق من احتمالية التكامل المشترك، الخطوة التالية هي التحقق من التأثيرات المقدرة الديناميكية على المدى القصير والطويل في نفس الوقت باستخدام طريقة ARDL. يتم تقديم نتائج هذه العملية التقديرية في الجدول 5. تشير نتائج تحليل ARDL إلى أن الناتج المحلي الإجمالي له تأثير إيجابي (تصاعدي) على LCF في كل من المدى القصير والمدى الطويل. على وجه التحديد، تشير النتيجة إلى أن زيادة في الناتج المحلي الإجمالي تؤدي إلى زيادة في LCF على المدى الطويل، مع ثبات المتغيرات الأخرى. في المدى القصير، يزيد الناتج المحلي الإجمالي LCF، لكن التأثير ليس ذا دلالة إحصائية. تشير هذه النتائج إلى أن التأثير الإيجابي للناتج المحلي الإجمالي على الاستدامة البيئية يكون ذا دلالة فقط على المدى الطويل. تكشف النتائج أيضًا أن الحد التربيعي للناتج المحلي الإجمالي له علاقة سلبية وذات دلالة مع LCF. تظهر هذه النتيجة أن زيادة في الحد المربع للناتج المحلي الإجمالي (GDPSq) ستؤدي إلى انخفاض كبير في LCF بـ مع ثبات المتغيرات الأخرى. بناءً على هذه النتائج، فإن فرضية LCC غير صالحة في حالة الصين.
أيضًا، تظهر النتائج أن استهلاك الطاقة النظيفة يظهر تأثيرًا إيجابيًا على LCF فقط على المدى الطويل. وهذا يعني أن زيادة الطاقة النظيفة تحفز LCF من خلال على المدى الطويل. علاوة على ذلك، يُعتبر أن زيادة استخدام الموارد الطبيعية قد أظهرت تأثيرًا سلبيًا على LCF. بشكل خاص، زيادة استخدام الموارد الطبيعية تعني انخفاض في LCF على المدى الطويل.
تعتمد طريقة ARDL الديناميكية على تشخيص النموذج من أجل الدقة والموثوقية. تم تقديم اختبارات التشخيص التي أجريت على نماذج ARDL الديناميكية في الجدول 6. وفقًا للنتائج، لا تظهر النماذج أي مشاكل تتعلق بالتباين غير المتجانس، أو الارتباط التسلسلي، أو سوء التحديد، أو عدم الطبيعية. وهذا، بالتالي، يشير إلى أن النموذج محدد بشكل جيد ويمكن الاعتماد عليه من أجل الدقة في توقعاته (Eweade et al., 2022; Zhang et al., 2021).
الجدول 5 نتائج ARDL الديناميكية
نموذج: ، lnREC، lnNR)
متغير معامل خطأ قياسي -إحصائي احتمال
ثابت -0.907*** 0.212 -4.270 0.000
lnLCF(-1) -0.578*** 0.104 -5.552 0.000
0.328*** 0.067 ٤.٨٩٦ 0.000
-0.038*** 0.006 -5.754 0.000
1nREC 0.103*** 0.029 ٣.٥٤٨ 0.001
lnNR(-1) -0.027*** 0.008 -3.461 0.001
0.358** 0.134 2.676 0.011
الناتج المحلي الإجمالي 0.179 0.127 1.410 0.167
-0.000 0.011 -0.018 0.986
0.623 صفة 0.596
الجدول 6 نتائج تشخيص ARDL الديناميكي
اختبارات -قيم
مضاعف لاجرانج لبريوش غودفري 0.941
بريوش باجان غودفري 0.570
قوس 0.613
رامزي RESET 0.556
جارك-بيرا 0.483
الشكل 2 اختبارات CUSUM و CUSUM للمربعات. تمثل الخطوط الحمراء مستوى دلالة 5%، بينما تقدم الخطوط الزرقاء CUSUM و CUSUM للمربعات.
علاوة على ذلك، يتم إثبات استقرار النموذج في الشكل 2 من خلال عرض مخططات CUSUM و CUSUMSQ التي تقع ضمن مستوى الدلالة. وهذا يشير إلى أن النموذج مستقر وأن توقعاته يمكن الاعتماد عليها. بالإضافة إلى ذلك، تظهر جميع الاختبارات التشخيصية التي أجريت على نموذج ARDL الديناميكي أن التقديرات موثوقة وقوية، مما يجعلها مناسبة لقرارات السياسة.
بمجرد توقع الآثار القصيرة والطويلة الأجل لـ LCF، تكون الخطوة التالية هي فحص استجابة LCF لتغيير افتراضي في متغير أساسي واحد. تتضمن هذه التحليل تثبيت جميع المتغيرات التفسيرية الأخرى عند نقطة زمنية محددة ومراقبة كيفية تفاعل LCF مع التغيرات في المتغير الأساسي المختار. توفر هذه الخطوة رؤى مهمة حول حساسية LCF للتغيرات.
الشكل 3 يشير إلى كيفية تغيير مضاد للواقع في يتنبأ القيمة المتوقعة المتوسطة لـ LCF يتم تصورها بواسطة النقاط. الخطوط الرأسية من الرمادي إلى الأزرق الفاتح تظهر ومستويات دلالة 0.05. عدد المحاكاة هو 10,000
الشكل 4 يشير إلى كيفية تغيير مضاد للواقع في توقع GDPSQ يتم تصور القيمة المتوقعة المتوسطة لـ LCF بواسطة النقاط. تُظهر الخطوط الرأسية من الرمادي إلى الأزرق الفاتح ، ومستويات دلالة 0.05. عدد المحاكاة هو 10,000
الشكل 5 يشير إلى كيفية تغيير مضاد للواقع في يتنبأ القيمة المتوقعة المتوسطة لـ LCF يتم تصورها بواسطة النقاط. الخطوط الرأسية من الرمادي إلى الأزرق الفاتح تظهر ومستويات دلالة 0.05. عدد المحاكاة هو 10,000
الشكل 6 يشير إلى كيفية تغيير مضاد للواقع في يتنبأ يتم تصور القيمة المتوقعة المتوسطة لـ LCF بواسطة النقاط. تُظهر الخطوط الرأسية من الرمادي إلى الأزرق الفاتح ، ومستويات دلالة 0.05. عدد المحاكاة هو 10,000
في العوامل التفسيرية الفردية، والتي يمكن أن تكون مفيدة في اتخاذ قرارات السياسة. لذلك، توضح الرسوم البيانية المعنية كيف تتغير LCF استجابةً لصدمة من في المتغير المستقل. تكشف الأشكال 3 و 4 و 5 و 6 عن مخططات محاكاة ARDL الديناميكية. يُظهر المحور الرأسي القيم المتوسطة المتوقعة لـ LCF مع تغيير في كل من المتغيرات الأساسية. وفقًا للأشكال 3 و 4، صدمة إيجابية في الناتج المحلي الإجمالي (GDPSq.) تؤدي إلى ارتفاع (انخفاض) في LCF، بينما تغير في الناتج المحلي الإجمالي (GDPSq.) يزيد (يقلل) من LCF. وهذا يشير إلى وجود علاقة إيجابية بين الناتج المحلي الإجمالي وجودة البيئة، والتي من المحتمل أن تكون ناتجة عن تأثيرات التركيب والتقنية. مع زيادة مستويات الإنتاج في الصين، تميل التدهور البيئي إلى الانخفاض. من خلال هذه النتيجة، يتم نفي مبدأ فرضية LCC التي تتميز بـ -شكل العلاقة بين مستوى الدخل و LCF. توضح الأشكال 4 و 5 أنه بينما صدمة إيجابية في استهلاك الطاقة النظيفة تحفز LCF بشكل كبير، الصدمة الإيجابية للموارد الطبيعية تؤدي إلى انخفاض في مستوى LCF. القيمة المتوقعة لـ LCF بعد صدمة سلبية هي عكس الاتجاه الإيجابي الملحوظ. هذا يدعم العلاقة الإيجابية بين الطاقة النظيفة و LCF. وبالمثل، فإن التأثير السلبي لتغير الموارد الطبيعية يدعم نتائج معاملات ARDL الديناميكية على المدى الطويل والقصير التي تم مناقشتها بالفعل.

4.5 مناقشة النتائج

توفر نتائج هذه الدراسة رؤى قيمة حول كيفية تأثير الأسس الاقتصادية على LCF، سواء على المدى القصير أو المدى الطويل. على وجه الخصوص، فإن معاملات نماذجنا مفيدة في التنبؤ باستجابة جودة البيئة للتغيرات في العوامل الخارجية المختلفة التي تم النظر فيها في التحليل. كما هو موضح في النتائج، فإن تأثير الناتج المحلي الإجمالي على LCF إيجابي ولكنه ذو دلالة إحصائية فقط على المدى الطويل. هذه النتائج لها تداعيات مهمة على صنع السياسات، حيث تشير ببساطة إلى أن السياسات التي تهدف إلى تعزيز التوسع الاقتصادي قد يكون لها أيضًا آثار سلبية على الكوارث البيئية على المدى الطويل. كما تشير هذه النتائج إلى أن الصين قد حققت مستوى دخل ملحوظًا مرتفعًا بما يكفي لتحفيز الاستدامة البيئية. لذلك، يمكن لصانعي السياسات منع آثار الحجم من خلال تعزيز النمو الاقتصادي من خلال تحسين الإنتاجية المعتمدة على المعرفة والتكنولوجيا. هذه النتائج تتماشى مع دراسة كاجلار وآسكن (2023) وكارتال وآخرون (2023) الذين وجدوا أيضًا تأثيرًا إيجابيًا للنمو الاقتصادي على مستوى LCF.
من المهم أن نلاحظ، لذلك، أن العلاقة بين الناتج المحلي الإجمالي والاستدامة البيئية معقدة وقد تعتمد على مجموعة من العوامل الأخرى، مثل تركيبة الاقتصاد، ومستوى استخدام الطاقة النظيفة، ومستوى الموارد الطبيعية المتاحة للاستخدام (انظر بالسيلا وآخرون، 2023ب؛ أديبايو وسامور، 2023). إن حقيقة أن الأثر الإيجابي للناتج المحلي الإجمالي على مستوى LCF أقوى وذو دلالة فقط على المدى الطويل مقارنة بالمدى القصير تشير إلى أن فوائد التوسع الاقتصادي من حيث بيئة مستدامة قد تستغرق وقتًا لتتجلى بالكامل. قد يكون ذلك بسبب مجموعة من العوامل، مثل الوقت اللازم لتطبيق السياسات والتقنيات البيئية، أو الوقت اللازم لحدوث تغييرات في الهيكل الاقتصادي كما أشار إليه رحمن وآخرون، (2023). من الممكن أيضًا أن يكون تدهور البيئة في بلد ما أقوى على المدى الطويل مقارنة بالمدى القصير، اعتمادًا على الظروف المحددة. قد يكون ذلك ناتجًا عن عوامل تعيق الآثار الإيجابية للنمو الاقتصادي على LCF، مثل اللوائح البيئية غير الفعالة أو عمليات الإنتاج غير الكفؤة. تتفق هذه النتيجة مع تشانغ ووانغ (2010) وأخاير وآخرون (2023). قد تكون التغيرات في الناتج ناتجة عن التقنيات المستخدمة، والملاحظات المعتمدة، و
الشكل 7 ملخص النتائج
تم تحليل المتغير المستجيب. استنادًا إلى المعاملات التي تم الحصول عليها من خلال طريقة ARDL، يمكن الاستنتاج أن فرضية LCC غير قابلة للتطبيق على الصين. وهذا يعني أن العلاقة بين النمو الاقتصادي وجودة البيئة لا تتبع الـ المنحنى على شكل – الذي توقعته فرضية LCC. تتوافق هذه النتائج مع نتائج ألوولا وآخرون (2023) وباتا وآخرون (2023أ) لكنها تتعارض مع نتائج دوغان وباتا (2022) وهوانغ وآخرون (2023) وباتا وكارتال (2023).
أيضًا، تكشف دراستنا أن توسيع الطاقة النظيفة له علاقة إيجابية مع LCF فقط على المدى الطويل. وهذا يعني أن توسيع استهلاك الطاقة المتجددة يعزز الاستدامة البيئية فقط بعد فترة من الزمن، أي على المدى الطويل. يمكن أن يُعزى التفسير المحتمل لهذه النتيجة إلى حقيقة أن الصين، على مر السنين، قد قدمت عدة خطط تنموية للانتقال إلى مسارات الطاقة المتجددة. هذه الخطط تستند إلى تحفيز مصادر الطاقة المتجددة، بما في ذلك الطاقة الكهرومائية، والطاقة الشمسية، وطاقة الرياح لجعل استهلاكها متاحًا وميسورًا للجميع. في الوقت الحالي، تمثل الطاقة المتجددة حوالي من إجمالي مزيج استهلاك الطاقة الأولية في الصين اعتبارًا من عام 2021. لذلك، فإن هذه النتيجة تتماشى مع عثمان الذي وجد أن زيادة الطاقة النظيفة مرتبطة إيجابيًا بجودة البيئة. هذه النتيجة تتعارض مع باتا وكارتال (2023) اللذين لاحظا تأثيرًا غير ذي دلالة للطاقة النظيفة على المدى الطويل في كوريا الجنوبية.
علاوة على ذلك، فإن النتائج التي تشير إلى أن استخدام الموارد الطبيعية له تأثير سلبي على LCF تكون ذات دلالة فقط على المدى الطويل. وهذا يعني أنه في المدى القصير، قد لا يكون لاستخراج الموارد الطبيعية الذي يؤدي إلى استنفاد الموارد الطبيعية تأثير على تدهور البيئة. ومع ذلك، فإن التأثير البيئي لاستخراج الموارد الطبيعية لا يكون ملحوظًا إلا على المدى الطويل من خلال انخفاض مستوى LCF لمحطات الطاقة وغيرها من مرافق الطاقة. لذلك، تتماشى هذه النتيجة مع ما وجده لي وآخرون (2022) حيث تم اكتشاف أن زيادة استخدام الموارد الطبيعية تؤدي إلى أضرار بيئية في اقتصادات جنوب شرق آسيا. وهذا يت echoed أيضًا في عمل وانغ وآخرون (2019) وباديب وآخرون (2020) الذي يشير إلى أن استخراج الموارد الطبيعية يعزز الأضرار البيئية. على العكس من ذلك، فإن اكتشافنا غير متسق مع أديبايو وسامور (2023) الذين يظهرون أن ريع الموارد الطبيعية يعزز جودة البيئة.
يتم تقديم ملخص النتائج في الشكل 7. وبناءً عليه، فإن الناتج المحلي الإجمالي له علاقة إيجابية مع LCF بينما له تأثير سلبي عند تربيعه. وهذا يدل على أن فرضية LCC غير صالحة في حالة الصين. تأثير الطاقة النظيفة إيجابي بينما تأثير الموارد الطبيعية سلبي.

5 الخاتمة وتوصيات السياسة

المستويات العالية من تدهور البيئة الناجمة عن تراكم لقد شكلت انبعاثات ثاني أكسيد الكربون وغيرها من غازات الدفيئة تحديًا خطيرًا في الصين على مدى العقود الثلاثة الماضية. إن استخدام الطاقة من الوقود الأحفوري هو السبب الرئيسي لهذه المشكلة. في الأساس، تحتاج كل دولة إلى الطاقة لتعزيز النمو الاقتصادي، وبالتالي فإن تقليل استهلاك الطاقة يمكن أن يكون له آثار سلبية على التوسع الاقتصادي. في هذا البحث، نستكشف ليس فقط الانتقال نحو اعتماد الطاقة النظيفة ولكن أيضًا تأثير الموارد الطبيعية على البيئة في الصين ضمن إطار فرضية LCC. باستخدام محاكاة ARDL الديناميكية كأداة تحليلية، تكشف نتائجنا أن التوسع الاقتصادي مرتبط إيجابيًا بـ LCF، لكن الحد التربيعي له يضعف LCF. وهذا يؤكد أن فرضية LCC غير صالحة للصين. إن دلالة هذه النتيجة هي أن التوسع الاقتصادي واعٍ وصديق للبيئة، وبالتالي فإن الصين تسير في طريق الاستدامة البيئية. تكشف النتائج أيضًا أن توسيع الطاقة النظيفة يعزز الاستدامة البيئية من خلال تحفيز مستوى LCF. ومع ذلك، فإن زيادة استخراج الموارد الطبيعية تقلل من مستوى الاستدامة البيئية من خلال تقليل كمية LCF. إن تأثيرات التوسع الاقتصادي، وتوسع الطاقة النظيفة، والموارد الطبيعية أقوى وتكون ذات دلالة فقط على المدى الطويل. وهذا يشير إلى أن الفوائد البيئية للتوسع الاقتصادي وتوسع الطاقة النظيفة قد تستغرق وقتًا لتظهر في الصين. وبالمثل، قد يستغرق التأثير السلبي لاستخراج الموارد الطبيعية أيضًا وقتًا طويلاً ليظهر.
استنادًا إلى هذه النتائج، يمكن استخلاص بعض التوصيات السياسية للتخفيف من المشكلات البيئية التي تواجه الصين:
نظرًا لأن توسيع الطاقة النظيفة له تأثير إيجابي طويل الأمد على البيئة من خلال زيادة LCF، فإننا نوصي بأن تستثمر الصين بشكل كبير في التقنيات المتعلقة بالطاقة الخضراء دون الحاجة إلى التخلي عن النمو الاقتصادي لوضع البلاد على طريق الاستدامة البيئية. بعبارة أخرى، قد لا يتطلب توسيع الطاقة النظيفة بالضرورة إبطاء النمو الاقتصادي لتحقيق الاستدامة البيئية؛ بدلاً من ذلك، يجب على الصين السعي لتحقيق كل من النمو الاقتصادي والاستدامة البيئية في الوقت نفسه – مستفيدة من العلاقة الإيجابية بين توسيع النمو الاقتصادي و LCF. تتماشى هذه المقاربة مع فكرة أن الاقتصاد المتنامي يمكن أن يت coexist مع الممارسات الصديقة للبيئة – مما يعزز توازنًا أكثر انسجامًا بين الازدهار الاقتصادي وحماية البيئة كما أكده بالسيلا وآخرون (2023b). لذلك، كوسيلة لجذب استثمارات ضخمة في الطاقة الخضراء، يجب على الحكومة وصانعي السياسات تحديد أهداف واضحة وتطبيق آليات الحوافز اللازمة مثل تشجيع الشراكات بين القطاعين العام والخاص في استثمار الطاقة الخضراء، والائتمانات الضريبية والإعفاءات الضريبية للاستثمار في الطاقة الخضراء، والدعم، وما إلى ذلك. ستساعد كل هذه الإجراءات في تسريع الخطوات نحو تحقيق المستوى المستهدف من استثمارات الطاقة الخضراء مع مرور الوقت.
بينما نجذب الاستثمارات في الطاقة النظيفة، نوصي أيضًا بأن يتم إعطاء اعتبار خاص لمصادر الطاقة النظيفة مثل الطاقة الكهرومائية وطاقة الرياح والطاقة الشمسية بسبب توفرها في الصين. إن خطة التنمية الخمسية الرابعة عشرة التي أطلقتها الحكومة الصينية في عام 2021 هي خطوة نحو جذب الطاقة الخضراء حيث تعمل على تحرير الاقتصاد من خلال تحويله نحو النمو المدفوع بالاستهلاك وتوفير بيئة ملائمة لتلعب قوى السوق دورًا حيويًا في تخصيص الموارد. بشكل أساسي، إذا تم التركيز على تحفيز مصادر الطاقة النظيفة المتاحة بشكل شائع في البلاد، فسيساعد ذلك في خفض تكاليف هذه الطاقة وجعلها متاحة ومستدامة.
أيضًا، التأثير الإيجابي طويل الأمد للناتج المحلي الإجمالي على LCF في الصين هو مؤشر على أن نمو الدخل قد يعزز الاستدامة البيئية في الصين على المدى الطويل، ربما بسبب تحول التوجيهات السياسية نحو الابتكارات المعتمدة على المعرفة والتكنولوجيا. لذلك، يجب على صانعي السياسات في الصين صياغة إطار سياسة شامل يعزز النمو الاقتصادي وفي نفس الوقت يحمي البيئة. في مثل هذا السيناريو، يجب على الحكومة وصانعي السياسات زيادة الإنفاق على تقنيات الطاقة المتجددة، وتنفيذ لوائح بيئية أكثر صرامة، وتعزيز أنماط الاستهلاك والإنتاج المستدامة. يمكن تحقيق كل ذلك من خلال تعزيز سياسة تسعير الكربون التي تلزم الملوثين بدفع ثمن كل طن من الكربون وغيرها من الغازات الدفيئة التي تُطلق في الغلاف الجوي.
علاوة على ذلك، فإن حقيقة أن استخراج الموارد الطبيعية يؤثر سلبًا على LCF تشير إلى أن استخدام الموارد الطبيعية يقلل من جودة البيئة. لهذا السبب، نوصي بضرورة تجنب الإفراط في استخدام الموارد الطبيعية المتاحة وضمان استخدام الموارد الطبيعية بكفاءة في الصين. لتحقيق ذلك، يجب على الحكومة ومديريها وضع سياسات للحد من النمو السريع للسكان. أيضًا، يجب تقليل استخراج الموارد الطبيعية مثل الفحم وغيرها من الموارد الملوثة في الصين. على سبيل المثال، فإن محطات الطاقة التي تعمل بالفحم في الصين تطلق أكثر من من ثاني أكسيد الكربون، وثاني أكسيد الكبريت، وأكاسيد النيتروجين، والمواد الجسيمية، التي لها عواقب بيئية وصحية خطيرة. إذا كانت هناك حاجة إلى الفحم وموارد طبيعية غير متجددة لتلبية الطلب على المواد الخام اللازمة للإنتاج والاستهلاك، يجب استخدام هذه الموارد الطبيعية بكفاءة من أجل تقليل العواقب البيئية. إلى هذا الحد، نقترح أيضًا أن يتم دمج تعليم الطاقة المتجددة في البرامج التعليمية التي تُعد المواطنين لمستقبل أفضل.
أخيرًا، مثل أي دراسة أخرى، تواجه هذه البحث بعض القيود. واحدة من هذه القيود هي أن دراستنا تركز فقط على الصين، وهي اقتصاد ناشئ كبير. بسبب المشاكل الخاصة للاقتصادات المختلفة، يجب أن تستخدم الدراسات المستقبلية بيانات بانل وتصنيف البلدان إلى مجموعات بناءً على دخولها. من خلال القيام بذلك، ستوفر رؤى أكثر تساعد صانعي السياسات على تحقيق أهداف السياسات البيئية. علاوة على ذلك، فإن نهج محاكاة ARDL الديناميكي المستخدم في هذه الدراسة يعتمد فقط على الملاحظات في نقطة المنتصف في التوزيع. لالتقاط تأثير توسيع الطاقة النظيفة واستخراج الموارد الطبيعية على التوزيع الكامل لـ LCF، يجب أن تأخذ الدراسات المستقبلية في الاعتبار المنهجيات التي تساعد في تقييم كيفية تأثير هذه المتغيرات على LCF في أطراف التوزيع. سيوفر ذلك فهمًا أفضل للموضوع.
تمويل تمويل الوصول المفتوح مقدم من مجلس البحوث العلمية والتكنولوجية في تركيا (TÜBİTAK).
توفر البيانات تتوفر مجموعات البيانات التي تم إنشاؤها و/أو تحليلها خلال الدراسة الحالية عند الطلب المعقول.

الإعلانات

تعارض المصالح يعلن المؤلفون أنهم ليس لديهم أي مصالح مالية متنافسة معروفة أو علاقات شخصية قد تبدو أنها تؤثر على العمل المبلغ عنه في هذه الورقة.
الوصول المفتوح هذه المقالة مرخصة بموجب رخصة المشاع الإبداعي النسب 4.0 الدولية، التي تسمح بالاستخدام والمشاركة والتكيف والتوزيع وإعادة الإنتاج بأي وسيلة أو صيغة، طالما أنك تعطي الائتمان المناسب للمؤلفين الأصليين والمصدر، وتوفر رابطًا لرخصة المشاع الإبداعي، وتوضح ما إذا تم إجراء تغييرات. الصور أو المواد الأخرى من طرف ثالث في هذه المقالة مشمولة في رخصة المشاع الإبداعي الخاصة بالمقالة، ما لم يُشار إلى خلاف ذلك في سطر الائتمان للمواد. إذا لم تكن المادة مشمولة في رخصة المشاع الإبداعي الخاصة بالمقالة وكان استخدامك المقصود غير…
إذا كان ذلك مسموحًا به بموجب اللوائح القانونية أو يتجاوز الاستخدام المسموح به، ستحتاج إلى الحصول على إذن مباشرة من صاحب حقوق الطبع والنشر. لعرض نسخة من هذه الرخصة، قم بزيارةhttp://creativecommons.org/licenses/by/4.0/.

References

Adebayo, T. S., & Samour, A. (2023). Renewable energy, fiscal policy and load capacity factor in BRICS countries: novel findings from panel nonlinear ARDL model. Environment, Development and Sustainability. https://doi.org/10.1007/s10668-022-02888-1
Adikpo, J. A., & Usman, O. (2023). Moving towards the path of environmental sustainability in Develop-ing-8 countries: Investigating the role of country’s reputation in mitigating environmental externalities. Environmental Science and Pollution Research. https://doi.org/10.1007/s11356-023-29883-x
Ahmed, Z., Asghar, M. M., Malik, M. N., & Nawaz, K. (2020). Moving towards a sustainable environment: The dynamic linkage between natural resources, human capital, urbanization, economic growth, and ecological footprint in China. Resources Policy, 67, 101677.
Akhayere, E., Kartal, M. T., Adebayo, T. S., & Kavaz, D. (2023). Role of energy consumption and trade openness towards environmental sustainability in Turkey. Environmental Science and Pollution Research, 30(8), 21156-21168.
Alola, A. A., Özkan, O., & Usman, O. (2023). Role of non-renewable energy efficiency and renewable energy in driving environmental sustainability in India: Evidence from the load capacity factor hypothesis. Energies, 16(6), 2847.
Badeeb, R. A., Lean, H. H., & Shahbaz, M. (2020). Are too many natural resources to blame for the shape of the environmental Kuznets curve in resource-based economies? Resources Policy, 68, 101694.
Balcilar, M., Usman, O., & Ike, G. N. (2023a). Investing green for sustainable development without ditching economic growth. Sustainable Development, 31(2), 728-743.
Balcilar, M., Usman, O., & Ike, G. N. (2023b). Operational behaviours of multinational corporations, renewable energy transition, and environmental sustainability in Africa: Does the level of natural resource rents matter? Resources Policy, 81, 103344.
Baloch, M. A., Mahmood, N., & Zhang, J. W. (2019). Effect of natural resources, renewable energy and economic development on emissions in BRICS countries. Science of the Total Environment, 678, 632-638.
Caglar, A. E., & Askin, B. E. (2023). A path towards green revolution: How do competitive industrial performance and renewable energy consumption influence environmental quality indicators? Renewable Energy, 205, 273-280.
Chang, Y. C., & Wang, N. (2010). Environmental regulations and emissions trading in China. Energy Policy, 38(7), 3356-3364.
Chang, Y. C., & Wang, N. (2017). Legal system for the development of marine renewable energy in China. Renewable and Sustainable Energy Reviews, 75, 192-196.
Chen, L., Msigwa, G., Yang, M., Osman, A. I., Fawzy, S., Rooney, D. W., & Yap, P. S. (2022). Strategies to achieve a carbon neutral society: A review. Environmental Chemistry Letters, 20(4), 2277-2310.
da Silva, P. P., Cerqueira, P. A., & Ogbe, W. (2018). Determinants of renewable energy growth in SubSaharan Africa: Evidence from panel ARDL. Energy, 156, 45-54.
DeJong, D. N., Nankervis, J. C., Savin, N. E., & Whiteman, C. H. (1992). The power problems of unit root test in time series with autoregressive errors. Journal of Econometrics, 53(1-3), 323-343.
Dickey, D. A., & Fuller, W. A. (1979). Distribution of the estimators for autoregressive time series with a unit root. Journal of the American Statistical Association, 74(366a), 427-431.
Ding, Q., Khattak, S. I., & Ahmad, M. (2021). Towards sustainable production and consumption: Assessing the impact of energy productivity and eco-innovation on consumption-based carbon dioxide emissions ( ) in G-7 nations. Sustainable Production and Consumption, 27, 254-268.
Dogan, A., & Pata, U. K. (2022). The role of ICT, R&D spending and renewable energy consumption on environmental quality: Testing the LCC hypothesis for G7 countries. Journal of Cleaner Production, 380, 135038.
Elliott, G., Rothenberg, T. J., & Stock, J. H. (1996). Efficient tests for an autoregressive unit root. Econometrica, 64(4), 813-836.
Eweade, B. S., Uzuner, G., Akadiri, A. C., & Lasisi, T. T. (2022). Japan energy mix and economic growth nexus: Focus on natural gas consumption. Energy and Environment. https://doi.org/10.1177/09583 05X221130460
Fakher, H. A., Ahmed, Z., Acheampong, A. O., & Nathaniel, S. P. (2023). Renewable energy, nonrenewable energy, and environmental quality nexus: An investigation of the -shaped environmental Kuznets curve based on six environmental indicators. Energy, 263, 125660.
Fareed, Z., Salem, S., Adebayo, T. S., Pata, U. K., & Shahzad, F. (2021). Role of export diversification and renewable energy on the load capacity factor in Indonesia: A Fourier quantile causality approach. Frontiers in Environmental Science, 434.
Fernández, L. (2023). Topic: Renewable energy china. Statista. Retrieved Feb 17, 2023, from https://www. statista.com/topics/5100/renewable-energy-china/#topicOverview.
GFN (2022). Global footprint network. https://www.footprintnetwork.org (Accessed on 22 Dec 2022).
Gimba, O. J., Alhassan, A., Ozdeser, H., Ghardallou, W., Seraj, M., & Usman, O. (2023). Towards low carbon and sustainable environment: Does income inequality mitigate ecological footprints in SubSaharan Africa? Environment, Development and Sustainability, 25, 10425-10445.
Grossman, G. M. & Krueger, A. B. (1991). Environmental impacts of a North American free trade agreement. NBER working paper 3914, Nov. 1991.
Huang, Y., Villanthenkodath, M. A., & Haseeb, M. (2023). The nexus between eco-friendly technology and environmental degradation in India: Does the or inverted -shape load capacity curve (LCC) hypothesis hold? Natural Resources Forum, 47(2), 276-297.
Jordan, S., & Philips, A. Q. (2018). Cointegration testing and dynamic simulations of autoregressive distributed lag models. The Stata Journal, 18(4), 902-923.
Kartal, M. T., Samour, A., Adebayo, T. S., & Depren, S. K. (2023). Do nuclear energy and renewable energy surge environmental quality in the United States? New insights from novel bootstrap Fourier Granger causality in quantiles approach. Progress in Nuclear Energy, 155, 104509.
Khattak, S. I., Ahmad, M., Ul Haq, Z., Shaofu, G., & Hang, J. (2022). On the goals of sustainable production and the conditions of environmental sustainability: Does cyclical innovation in green and sustainable technologies determine carbon dioxide emissions in G-7 economies. Sustainable Production and Consumption, 1(29), 406-420.
Leggett, J. A. (2020). The united nations framework convention on climate change, the Kyoto protocol, and the Paris agreement: a summary. Congressional research service, R46204, UNFCC, New York, 2. https://sgp.fas.org/crs/misc/R46204.pdf.
Li, Y., Alharthi, M., Ahmad, I., Hanif, I., & Hassan, M. U. (2022). Nexus between renewable energy, natural resources and carbon emissions under the shadow of transboundary trade relationship from South East Asian economies. Energy Strategy Reviews, 41, 100855.
Luo, J., Ali, S. A., Aziz, B., Aljarba, A., Akeel, H., & Hanif, I. (2023). Impact of natural resource rents and economic growth on environmental degradation in the context of COP-26: Evidence from low-income, middle-income, and high-income Asian countries. Resources Policy, 80, 103269.
Meng, F., Guo, J., Guo, Z., Lee, J. C., Liu, G., & Wang, N. (2021). Urban ecological transition: The practice of ecological civilization construction in China. Science of the Total Environment, 755, 142633.
Morrison, W. M. (2019). China’s economic rise: History, trends, challenges, and implications for the United States. Current Politics and Economics of Northern and Western Asia, 28(2/3), 189-242.
Naqvi, S. A. A., Hussain, B., & Ali, S. (2023). Evaluating the influence of biofuel and waste energy production on environmental degradation in APEC: Role of natural resources and financial development. Journal of Cleaner Production, 386, 135790.
Narayan, P. K. (2005). The saving and investment nexus for China: Evidence from cointegration tests. Applied Economics, 37(17), 1979-1990.
Nathaniel, S. P., & Bekun, F. V. (2020). Environmental management amidst energy use, urbanization, trade openness, and deforestation: The Nigerian experience. Journal of Public Affairs, 20(2), e2037.
Nathaniel, S. P. (2021). Environmental degradation in ASEAN: Assessing the criticality of natural resources abundance, economic growth and human capital. Environmental Science and Pollution Research, 28(17), 21766-21778.
Nathaniel, S. P., Yalçiner, K., & Bekun, F. V. (2021). Assessing the environmental sustainability corridor: Linking natural resources, renewable energy, human capital, and ecological footprint in BRICS. Resources Policy, 70, 101924.
Ng, S., & Perron, P. (2001). Lag length selection and the construction of unit root tests with good size and power. Econometrica, 69(6), 1519-1554.
Nguyen, K. H., & Kakinaka, M. (2019). Renewable energy consumption, carbon emissions, and development stages: Some evidence from panel cointegration analysis. Renewable Energy, 132, 1049-1057.
Nwani, C., Usman, O., Okere, K. I., & Bekun, F. V. (2023). Technological pathways to decarbonisation and the role of renewable energy: A study of European countries using consumption-based metrics. Resources Policy, 83, 103738.
OWD (2022). Our world in data. https://ourworldindata.org (Accessed on 22 Dec 2022).
Özkan, O., Coban, M. N., Iortile, I. B., & Usman, O. (2023a). Reconsidering the environmental Kuznets curve, pollution haven, and pollution halo hypotheses with carbon efficiency in China: A dynamic ARDL simulations approach. Environmental Science and Pollution Research, 30(26), 68163-68176.
Özkan, O., Haruna, R. A., Alola, A. A., Ghardallou, W., & Usman, O. (2023b). Investigating the nexus between economic complexity and energy-related environmental risks in the USA: Empirical evidence from a novel multivariate quantile-on-quantile regression. Structural Change and Economic Dynamics, 65, 382-392.
Ozkan, O., Sharif, A., Mey, L. S., & Tiwari, S. (2023). The dynamic role of green technological innovation, financial development and trade openness on urban environmental degradation in China: Fresh insights from carbon efficiency. Urban Climate, 52, 101679.
Pata, U. K. (2021). Do renewable energy and health expenditures improve load capacity factor in the USA and Japan? A new approach to environmental issues. The European Journal of Health Economics, 22(9), 1427-1439.
Pata, U. K., & Isik, C. (2021). Determinants of the load capacity factor in China: A novel dynamic ARDL approach for ecological footprint accounting. Resources Policy, 74, 102313.
Pata, U. K., & Kartal, M. T. (2023). Impact of nuclear and renewable energy sources on environment quality: Testing the EKC and LCC hypotheses for South Korea. Nuclear Engineering and Technology, 55(2), 587-594.
Pata, U. K., Kartal, M. T., Erdogan, S., & Sarkodie, S. A. (2023a). The role of renewable and nuclear energy R&D expenditures and income on environmental quality in Germany: Scrutinizing the EKC and LCC hypotheses with smooth structural changes. Applied Energy, 342, 121138.
Pata, U. K., Olasehinde-Williams, G., & Ozkan, O. (2023b). Carbon efficiency in China: Should we be concerned about the shadow economy and urbanization? Geological Journal, 58(10), 3646-3658.
Pesaran, M. H., Shin, Y., & Smith, R. J. (2001). Bounds testing approaches to the analysis of level relationships. Journal of Applied Econometrics, 16(3), 289-326.
Phillips, P. C., & Perron, P. (1988). Testing for a unit root in time series regression. Biometrika, 75(2), 335-346.
Ramezani, M., Abolhassani, L., Shahnoushi Foroushani, N., Burgess, D., & Aminizadeh, M. (2022). Ecological footprint and its determinants in MENA countries: A spatial econometric approach. Sustainability, 14(18), 11708.
Rehman, S. U., Elrehail, H., Alshwayat, D., Ibrahim, B., & Alami, R. (2023). Linking hotel environmental management initiatives and sustainable hotel performance through employees’ eco-friendly behaviour and environmental strategies: A moderated-mediated model. European Business Review, 35(2), 184-201.
Sadorsky, P. (2009). Renewable energy consumption and income in emerging economies. Energy Policy, 37(10), 4021-4028.
Samreen, I., & Majeed, M. T. (2022). Economic development, social-political factors and ecological footprint: A global panel data analysis. SN Business & Economics, 2(9), 132.
Sarkodie, S. A., Strezov, V., Weldekidan, H., Asamoah, E. F., Owusu, P. A., & Doyi, I. N. Y. (2019). Environmental sustainability assessment using dynamic autoregressive-distributed lag simula-tions-nexus between greenhouse gas emissions, biomass energy, food and economic growth. Science of the Total Environment, 668, 318-332.
Shahbaz, M., Raghutla, C., Chittedi, K. R., Jiao, Z., & Vo, X. V. (2020). The effect of renewable energy consumption on economic growth: Evidence from the renewable energy country attractive index. Energy, 207, 118162.
Shao, W., Yu, X., & Chen, Z. (2022). Does the carbon emission trading policy promote foreign direct investment?: A quasi-experiment from China. Frontiers in Environmental Science, 9, 798438.
Siche, R., Pereira, L., Agostinho, F., & Ortega, E. (2010). Convergence of ecological footprint and emergy analysis as a sustainability indicator of countries: Peru as case study. Communications in Nonlinear Science and Numerical Simulation, 15(10), 3182-3192.
Sun, Y., Li, M., Zhang, M., Khan, H. S. U. D., Li, J., Li, Z., & Anaba, O. A. (2021). A study on China’s economic growth, green energy technology, and carbon emissions based on the Kuznets curve (EKC). Environmental Science and Pollution Research, 28, 7200-7211.
Usman, O. (2022). Modelling the economic and social issues related to environmental quality in Nigeria: The role of economic growth and internal conflict. Environmental Science and Pollution Research, 29(26), 39209-39227.
Usman, O. (2023). Renewable energy and emissions in G7 countries: Does the level of expenditure on green energy technologies matter? Environmental Science and Pollution Research, 30(10), 26050-26062.
Usman, O., Akadiri, S. S., & Adeshola, I. (2020b). Role of renewable energy and globalization on ecological footprint in the USA: Implications for environmental sustainability. Environmental Science and Pollution Research, 27(24), 30681-30693.
Usman, O., Alola, A. A., & Sarkodie, S. A. (2020a). Assessment of the role of renewable energy consumption and trade policy on environmental degradation using innovation accounting: Evidence from the US. Renewable Energy, 150, 266-277.
Wang, H., Schandl, H., Wang, G., Ma, L., & Wang, Y. (2019). Regional material flow accounts for China: Examining China’s natural resource use at the provincial and national level. Journal of Industrial Ecology, 23(6), 1425-1438.
Wang, N., & Chang, Y. C. (2014). The development of policy instruments in supporting low-carbon governance in China. Renewable and Sustainable Energy Reviews, 35, 126-135.
Wang, X., & Yan, L. (2022). Measuring the integrated risk of China’s carbon financial market based on the copula model. Environmental Science and Pollution Research, 29(36), 54108-54121.
WDI (2022). World development indicators of the World Bank. https://databank.worldbank.org/source/ world-development-indicators (Accessed on 22 Dec 2022).
Xiong, J., & Xu, D. (2021). Relationship between energy consumption, economic growth and environmental pollution in China. Environmental Research, 194, 110718.
Xu, D., Salem, S., Awosusi, A. A., Abdurakhmanova, G., Altuntaş, M., Oluwajana, D., Kirikkaleli, D., & Ojekemi, O. (2022). Load capacity factor and financial globalization in Brazil: The role of renewable energy and urbanization. Frontiers in Environmental Science, 9, 823185.
Zafar, M. W., Zaidi, S. A. H., Khan, N. R., Mirza, F. M., Hou, F., & Kirmani, S. A. A. (2019). The impact of natural resources, human capital, and foreign direct investment on the ecological footprint: The case of the United States. Resources Policy, 63, 101428.
Zhang, L., Godil, D. I., Bibi, M., Khan, M. K., Sarwat, S., & Anser, M. K. (2021). Caring for the environment: How human capital, natural resources, and economic growth interact with environmental degradation in Pakistan? A dynamic ARDL approach. Science of the Total Environment, 774, 145553.
Zhang, L., Pang, J., Chen, X., & Lu, Z. (2019). Carbon emissions, energy consumption and economic growth: Evidence from the agricultural sector of China’s main grain-producing areas. Science of the Total Environment, 665, 1017-1025.
Zhao, X., Ma, X., Chen, B., Shang, Y., & Song, M. (2022). Challenges toward carbon neutrality in China: Strategies and countermeasures. Resources, Conservation and Recycling, 176, 105959.
Zheng, W., & Walsh, P. P. (2019). Economic growth, urbanization and energy consumption-A provincial level analysis of China. Energy Economics, 80, 153-162.
Publisher’s Note Springer Nature remains neutral with regard to jurisdictional claims in published maps and institutional affiliations.

المؤلفون والانتماءات

أوجونغوا عثمان (D • أوقتاي أوزكان إبراهيم أديشولا باباتوندي سونداي إيوادي

أوجونوغوا عثمان
ousman@ticaret.edu.tr
أوكتاي أوزكان
oktay.ozkan@gop.edu.tr
إبراهيم أديشولا
ibrahim.adeshola@final.edu.tr
باباتوندي سونداي إيوادي
eweade.babatunde@gmail.com
1 قسم الاقتصاد، جامعة إسطنبول للتجارة، إسطنبول، تركيا
2 مدرسة عدنان القصار للأعمال، الجامعة اللبنانية الأمريكية، بيروت، لبنان
3 قسم إدارة الأعمال، كلية الاقتصاد والعلوم الإدارية، جامعة توكات غازيوسمن باشا، توكات، تركيا
4 قسم هندسة الكمبيوتر، كلية الهندسة، الجامعة الدولية النهائية، عبر مرسين 10، أوزانكوي، شمال قبرص، تركيا
5 قسم الاقتصاد، كلية الأعمال والاقتصاد، جامعة البحر الأبيض المتوسط الشرقية، عبر مرسين 10، فاماغوستا، شمال قبرص، تركيا
6 مركز أبحاث الاقتصاد التنموي، جامعة أذربيجان الحكومية للاقتصاد (UNEC)، باكو AZ1001، أذربيجان
7 مركز أبحاث الاقتصاد الرقمي، جامعة أذربيجان الحكومية للاقتصاد (UNEC)، شارع الاستقلال 6، باكو، أذربيجان

  1. معلومات المؤلف الموسعة متاحة في الصفحة الأخيرة من المقال
  2. تكون منحنى التكلفة الحدية (LCC) على شكل حرف U إذا كان الناتج المحلي الإجمالي (GDP) مرتبطًا سلبًا مع التكلفة الحدية (LCF)، ومربع الناتج المحلي الإجمالي مرتبطًا إيجابيًا مع التكلفة الحدية. وعلى العكس، يكون منحنى التكلفة الحدية (LCC) على شكل حرف U مقلوب إذا كان الناتج المحلي الإجمالي مرتبطًا إيجابيًا مع التكلفة الحدية، ومربع الناتج المحلي الإجمالي مرتبطًا سلبًا مع التكلفة الحدية.

Journal: Environment Development and Sustainability
DOI: https://doi.org/10.1007/s10668-023-04399-z
Publication Date: 2024-01-18

Analysing the nexus between clean energy expansion, natural resource extraction, and load capacity factor in China: a step towards achieving COP27 targets

Ojonugwa Usman (D • Oktay Ozkan Ibrahim Adeshola . Babatunde Sunday Eweade

Received: 9 August 2023 / Accepted: 19 December 2023 / Published online: 18 January 2024 © The Author(s) 2024

Abstract

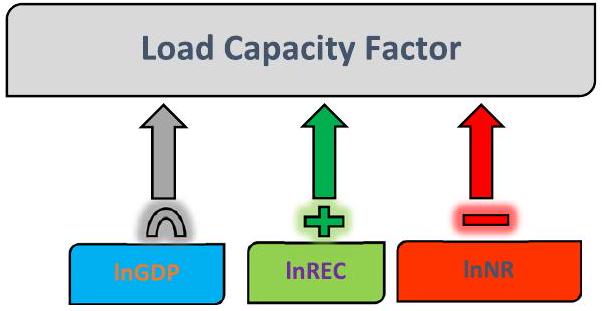
The excessive use of non-renewable energy in 21st-century economic growth has continued to hurt the environment by accumulating carbon dioxide and other greenhouse gases. However, promoting environmental sustainability requires expanding clean energy utilisation. In this study, we examine the effects of clean energy expansion and natural resource extraction on load capacity factor (LCF) in China from 1970 to 2018. Using the dynamic autoregressive distributed lag simulations approach, we extend the standard load capacity curve (LCC) hypothesis by incorporating clean energy expansion and natural resource extraction as main determinants of the LCF. The empirical outcomes reveal that economic expansion is, although positively associated with the LCF, but its squared term degrades the LCF. This confirms that the LCC hypothesis is not valid for China. Moreover, while clean energy expansion has a positive effect on the LCF, the effect of natural resource extraction is negative. These effects are stronger and statistically significant only in the long run. Therefore, this study highlights the potentials for a sustainable decarbonized economy in China by investing not only in clean energy sources but also efficiently use the available natural resources in the country.

Keywords China Load capacity curve hypothesis Clean energy consumption Natural resources extraction Dynamic ARDL simulations

1 Introduction

The rise in greenhouse gases has caused numerous negative consequences, including global warming and changes in the climate. As a result, maintaining a clean and healthy environment has become a crucial priority for communities and nations, while economic concerns remain important. A recent worldwide initiative aimed at addressing environmental challenges involves the annual gathering of the World leaders via the United Nations Climate Summits, commonly referred to as the Conference of the Parties (COP) to the United Nations Framework Convention on Climate Change (UNFCCC) (Leggett, 2020; Wang & Chang, 2014). This assembly of delegates from different nations worldwide
aims to engage in discussions and negotiations pertaining to measures for climate change mitigation and adaptation. During the summits, participating nations would present their programs and strategies as well as their challenges towards reducing global temperatures by shifting away from fossil fuels and adopting alternative energy sources in their regions and continents (Chen et al., 2022; Sun et al., 2021; Zhang et al., 2019).
This study seeks to examine whether climate policies which promote clean energy expansion and natural resource extraction exert upward or downward pressure on environmental sustainability in China. China as a signatory to Paris agreement has been committed towards tackling environmental issues over the years. In recently, in its commitments to Paris agreement, China has introduced several climate policies, which include the “Dual Carbon Policy”. The main aim of the dual carbon policy is to peak carbon dioxide ( ) in the country before 2030 and achieve carbon neutrality by 2060 (see Shao et al., 2022; Zhao et al., 2022; Wang & Yan, 2022).
While China is fast shifting towards clean energy sources, there is a rising level of natural resource extraction to meet the demand for twenty-first century growth, which is characterized by heavy production and consumption. Theoretically, as natural resources deplete, there is a tendency that such depletion may trigger environmental challenges as noted by Chang and Wang (2017). Moreover, given the tremendous growth of China over the years with its vast population of over 1.4 billion (i.e. of the total global population), the country is one of the major emitter of as it accounted for more than of the World’s GHG emissions in 2019. The per capita emissions of 9 metric tons of were not only higher than the emissions in 27 EU nations but higher than the global average. According to Statista (2022), China was the largest World’s polluter in the year 2021, emitting about 11.47 billion metric tons of . Even though most countries witnessed a decrease in total emissions due to the COVID-19 pandemic in 2020, China was one of a few countries that witnessed a rising level of emissions (see Statista, 2022; Özkan et al., 2023a&b).
Fundamentally, the environmental Kuznets curve (EKC) hypothesis, championed by Grossman and Krueger (1991), has been widely used to explain the nexus between economic growth, energy consumption, and environment sustainability. While some studies used emissions to measure the state of environmental pollution and sustainability (Ding et al., 2021; Khattak et al., 2022), several empirical studies used ecological footprint (EF) to assess the influence of human activities on sustainable environment (see Usman et al., 2020a&b; Fakher et al., 2023; Gimba et al., 2023). These commonly measures have received criticism for only being able to capture the demand side of the environmental equation. Therefore, our study contributes to the literature in three folds: Firstly, our study constructs the load capacity factor (LCF) variable, which apparently considers demand and supply factors. This variable comprehensively captures environmental sustainability than emissions or ecological footprint commonly used in the existing literature. Secondly, the load capacity curve (LCC) hypothesis is tested in China by controlling for the effects of clean energy expansion and natural resource extraction. This will provide policy insights into accelerating the pace of achieving net-zero emission targets in China by 2060. Thirdly, a dynamic autoregressive distributed lag (DARDL) simulation model is applied to capture the out-of-sample counterfactual shock effect in explanatory variables over time.
It is hoped that the findings of this study will help governments and policymakers to formulate and design appropriate environmental policies and programs that promote not only sustainable growth but also clean energy and efficient use of available natural resources to achieve long-term net-zero emission targets in China. The remaining sections of this study are adroitly structured based on the following: Sect. 2 reviews the related
literature. Section 3 presents the dataset and empirical approaches employed. Section 4 presents the empirical results and a discussion of major findings. Lastly, Sect. 5 provides a summary of the study alongside the policy recommendation based on the findings.

2 Theoretical framework and literature review

The theoretical underpinning study is from two distinct environmental sustainability theories. The first theory is based on the LCC hypothesis advanced by Siche et al. (2010). This hypothesis is based on the assumption that LCF has a decreasing economic growth effect in the early stage of development. However, after certain technological advancement, an increase in LCF will be associated positively with economic growth. By this hypothesis, the relationship between economic growth and environmental sustainability is characterized by -shape.
In recent times, several studies have attempted to test the validity of the LCC hypothesis. For example, Pata and Kartal (2023) displayed full support for the LCC and EKC hypotheses in South Korea with nuclear energy bolstering the level of environmental protection, while renewable energy has no significant environmental improvement in the long term. Pata et al. (2023a) also examined the vital role played by renewables and nuclear energy-related investment in R&D and income in achieving environmental sustainability in Germany. As documented, clean energy investment lowers environmental damage while investment in nuclear energy-related R&D is ineffective in reducing environmental degradation. Consequently, the LCC hypothesis is invalid, but the EKC is confirmed. Furthermore, in testing the LCC hypothesis using the non-renewable efficiency and REC, Alola et al. (2023) applied the dynamic ARDL simulations for India. While the results suggested that non-renewable energy efficiency and renewable energy promote the level of LCF, there is also evidence that the assumption of the LCC is invalid for India. On the contrary, Huang et al. (2023) examined the effect of technology in terms of eco-friendliness on the environment measured by LCF in the Indian economy. The results showed that the -shaped LCC hypothesis is validated in India. The results further indicated that the eco-friendly-based technology reduces the LCF. This result invariably implies that an increase in eco-friendly technology harms environmental quality in India but an increase in energy consumption boosts environmental quality.
The second theory for this study is based on the sustainable finance hypothesis advanced by the United Nations’ Environmental Protection Program (henceforth called UNEP) in 2014. The main thesis of this theory is that investment decisions are centred mainly on three main aspects, namely the environment, social, and governance (ESG). These aspects are linked to economic growth. For the purpose of this study, our interest is on the environment factor, which deals with climate actions to mitigate environmental degradation emanating from the accumulation of and other components of greenhouse gases. Based on the sustainable finance hypothesis, resources are expected to be used in such a way that it will promote not only a cleaner environment, but also economic growth and development. In such a situation, emphasis is placed on green activities by expanding renewable energy through innovations and technologies. The validity of this sustainable finance theory has been empirically tested in several recent studies. For example, Chang and Wang (2017) showed that the absence of a clear legal system for the marine renewable energy development affects the development of renewable energy the sector. Balcilar et al. (2023a) found evidence that the investment in renewable energy stimulates
sustainable growth in OECD countries, while Usman (2023) supported the sustainable finance hypothesis by supporting the role of expenditure on renewable energy in mitigating environmental degradation in G7 countries.
With great evidence of devising clean energy sources and intensified clean transitional energy policies, if resources are efficiently utilized, environmental challenges might be reduced significantly in China. According to Fernández (2023), China’s consumption of solar energy is significantly greater than that of other major countries, including the USA, Japan, and Germany. In addition, solar power generation has grown dramatically over time in China, with a total of 330 TWh generated in 2021. Meanwhile, wind power is the second most significant clean energy source in China. Also, Usman (2022) showed based on a dynamic ARDL model that a rise in the level of REC dampens environmental disasters in Nigeria through its negative effect on ecological footprint while Xu et al. (2022) examined how financial globalization affects the LCF in Brazil considering the role of REC and urban development. Their results find evidence that both REC and non-REC are attributing to a decline in the level of LCF. Furthermore, in a recent paper, Adikpo and Usman (2023) found that, in addition to the negative influence of a country’s reputation in lowering environmental externalities, REC evidently helps to promote environmental sustainability in D-8 economies. Nwani et al. (2023) applying the consumption-based Kaya identity metrics, showed that REC is negatively associated with emissions, while an inverted -shaped is found between energy and carbon intensity for EU countries.
Furthermore, several studies have examined how natural resource explorations affect the environment. For example, Badeeb et al. (2020) utilized autoregressive distributed lag (ARDL) and structural break co-integration techniques to examine the impact of natural resources (NRs) on environmental quality within the EKC’s framework. Their research results demonstrated that a dependence on natural resources supports the link between economic growth and environmental quality. Another study conducted by Zafar et al. (2019) investigated the effect of NRs on the USA’s Environmental Footprint (EFP) from 1970 to 2015 using ARDL and bounds testing methodologies. Their findings revealed that an abundance of natural resources is negatively correlated with EFP, leading to an improvement in environmental quality in the long run. Ahmed et al. (2020) investigated the role of NRs, human capita, and urban development on the level of ecological footprint in China. The findings showed that while an increase in both NRs and urban development escalate environmental disasters, human capital dampens ecological footprint. Also, Nathaniel et al. (2020) submit that economic growth and NRs have a positive and significant effect on ecological footprint, but the effect of renewable energy is negative and significant. These results imply that economic expansion with NRs cause environmental disasters, but REC improves the environment in terms of sustainability in BRICS countries.
Similarly, in a recent paper, Balcilar et al. (2023b) found that the negative effect of MNCs’ operational behaviours on the environment is perhaps moderated by natural resource endowments in Africa. There have been a few studies that have looked at the link between a sustainable environment and LCF. Pata (2021) investigated the influence of REC on LCF in the USA and Japan. Using the augmented-ARDL model, the study documented that REC enhanced LCF in the USA; however, the magnitude of REC was insignificant in Japan. Fareed et al. (2021) also documented that REC and export diversification bolster the LCF, which ultimately leads to improvement in the environment. Furthermore, the role of natural resources in explaining environmental disasters is evaluated by Naqvi et al. (2023). The results reveal that natural resources exacerbate the level of environmental degradation in 14 countries in Asia Pacific Economic Cooperation. Also, Luo et al. (2023) assess how the level of natural resources and economic expansion influence the environment in Asian countries. The results
Table 1 Details of the variables
Variable Abr Measurement Sources
Load capacity factor LCF (gha per capita) GFN (2022)
Economic expansion GDP Gross domestic product per capita at constant 2015 US Dollar WDI (2022)
Clean energy consumption REC Primary energy consumption from renewables (% of total) OWD (2022)
Natural resources extraction NR Total natural resources rents as a share of GDP WDI (2022)
unfold that natural resources mitigate environmental disasters in oil exporting countries, while economic expansion stimulates disasters in the environment.
Given the foregoing literature review, it is clear that the need to investigate this specific issue is not only motivated by the paucity of literature on the natural resources-clean energy-LCF nexus but also to evaluate how natural resources and clean energy expansion mitigate environmental externalities using the procedure of the LCC hypothesis. It is hoped that our contribution could help provide a hint as to the effectiveness or otherwise of expanding clean energy and natural resources usage in promoting carbon neutrality targets in China.

3 Sources of data and methodological development

3.1 Data sources

In this study, a time series analytical approach is followed to achieve a specified study’s goal for China between the periods of 1970 to 2018. The data for GDP per capita and natural resources extraction (NR) are obtained from the World Development Indicators (WDI, 2022). The load capacity factor (LCF) and renewable/unpolluted energy (REC) are sourced from the Global Footprint Network and Our World Data, respectively (GFN, 2022; OWD, 2022). The variables, their unit of measurement, and sources are outlined in Table 1:

3.2 Empirical model

To examine the impact of the variables such as clean energy expansion and natural resources extraction on the level of LCF, we construct the general economic function in Eq. (1):
where LCF is the load capacity factor, a measure of environmental quality. GDP and GDP are the gross domestic product and its squared term. While GDP measures the level of
economic growth, the squared GDP unfolds whether the LCC is characterized by a -shape or an inverted -shape. Furthermore, REC and NR present the clean energy expansion and natural resources extraction, which are included in the model as determinants of the LCF. Therefore, following Eq. (1), the econometric model in Eq. (2) expresses economic growth and its squared term, cleaned energy expansion, and natural resources as determinants of the LFC:
where, In represents the logarithm forms of each of the variables. indicates the intercept, to are the coefficients of the predictor’s variables, signifies the stochastic variable. To eliminate the non-normality and heteroscedasticity issues in the study, Samreen and Majeed (2022), Ramezani et al. (2022), Pata et al. (2023b), recommended that all the variables in the model adopt log transformation. If the coefficient of is negative, , and the coefficient of is positive ( ), then the LCC assumption is verified. If the reverse is the case, it implies that the LCC assumption cannot be verified or supported. The coefficient of is expected to be negatively associated with the LCF ( ) because China is a nation that consumes large amounts of fossil fuels and other traditional energy sources. Particularly, China is the largest consumer of the coal in globe. reduces carbon emissions in the atmosphere. This is because clean energy consumption helps to lower the atmospheric concentration of carbon dioxide and other components of greenhouse gases. Therefore, is assumed to have a positive impact on the LCF ( ).

3.3 Dynamic ARDL simulations model

ARDL (autoregressive distributed lag) models are often used to estimate the long-run relationships between variables, particularly in the presence of non-stationarity. The application of an ARDL model can be challenging when the model is characterized by the complexity of lag lengths and differenced variables. This is because the effects of the regressors may be spread across different time periods, and it can be difficult to isolate the effects of specific regressors in the presence of other variables and their lags. Additionally, the length of the time series data and the choice of lag lengths can also impact the accuracy of the results. Therefore, careful analysis and interpretation of the results are necessary to accurately determine the effects of the regressors in the short term and long term. To simplify the process, Jordan and Philips (2018) introduced a simulated dynamic ARDL modeling approach to address the complexity of estimating the effects of independent variables on the dependent variable. As pointed out in the recent work of Ozkan et al. (2023) and Özkan et al. (2023a), the dynamic ARDL model can handle a complex issue of multiple lags of first difference variables and thus provide the estimated plot of out-of-sample counterfactual long- and short-term effect of exogenous shocks over time. To utilize the dynamic ARDL simulations model, two criteria need to be satisfied as noted by Sarkodie et al. (2019): firstly, the variables must have an integration order of not greater than ; secondly, the variables must be cointegrated. For the first criterion, the
endogenous variable (LCF) needs to be stationary, i.e. I(1), while the exogenous variables can have an integration order of either or . Therefore, Eq. (3) shows the expression of the Dynamic ARDL simulations model as follows:
From Eq. (3), represents the difference operator, denotes the intercept, is the first lag of the endogenous variable. represent the short-run parameters while are the long-run parameters. The last term, i.e. indicates the disturbance term, which is assumed to have a zero mean.

4 Empirical results and discussion

4.1 Preliminary check

The initial step in the process of data analysis regarding time series involves preliminary checking, which involves a time plot visual of the variables explored in the study. This is necessary for determining whether trends, seasonality, drifts, and structural breaks exist in these variables as their presence may hamper the outcomes of the regression. As shown in Fig. 1, the time series plot representations reveal that the variables exhibit a trend. Therefore, it is necessary to perform further testing to determine whether the variables are stationary.
The descriptive statistical analysis for the aforementioned variables is understandably divulged in Table 2. All the variables are normally distributed with skewness close to 0 for all the variables and kurtosis having positive values for all the variables. Compared to the mean of the other variables, GDP has a high mean of 7.246. China has experienced rapid economic growth over the past few decades, and its GDP has played a crucial role in driving this growth. In the year 2019, the energy sector (including electricity, gas, and water supply) contributed about to China’s GDP. This suggests that the energy sector is a significant component of China’s economy, but it is not the dominant sector (Morrison, 2019; Zheng & Walsh, 2019). It is worth noting that China has been investing heavily in clean energy and energy efficiency in recent years, in an effort to reduce its dependence on fossil fuels and mitigate the impacts of climate change. This shift in energy policy is likely to have a significant impact on the energy sector’s contribution to China’s GDP in the future. Natural resources, which represented of economic growth in 2011 and in 2008, substantially contributed to the gross domestic product of China (Pata & Isik, 2021). It was invariably divulged that China’s environmental sustainability improved at a different rate than other countries. The LCF declined slightly from 0.64 in the year 1981 to 0.24 in the year 2017, indicating that China’s resource utilization exceeds environmental sustainability. Chinese consume more ecological assets than available resources, causing environmental degradation (Meng et al., 2021; Xiong & Xu, 2021).
Fig. 1 Time series plots of the natural logarithms of load capacity factor ( ), GDP per capita ( ), clean energy expansion (lnREC), and natural resource extraction (lnNR)
Table 2 Descriptive statistics of the variables in the model
lnLCF LnGDP lnREC lnNR
Mean -0.748 7.264 1.650 1.438
Median -0.688 7.233 1.599 1.582
Maximum -0.166 9.171 2.550 2.958
Minimum -1.414 5.647 1.015 -0.201
Std. Dev 0.383 1.143 0.385 0.847
Skewness -0.387 0.142 0.615 -0.167
Kurtosis 1.881 1.690 2.835 2.201
Jarque-Bera 3.781 3.665 3.142 1.529
Prob 0.151 0.160 0.208 0.466
49 49 49 49

4.2 Unit root results

When analysing data from time series, it is essential to address where a series is stationary or non-stationary. A stationary stochastic process is one in which the statistical properties (such as mean, variance, and autocovariance) of the process do not change over time. Numerous studies used standard unit root tests by Dickey and Fuller (1979) and Phillips and Perron (1988) to investigate the order of integration of variables. Both tests are unsuitable for small sample data sets due to their poor size and power properties (Dejong et al.,
Table 3 Unit root tests’ results
Panel A: Ng-Perron modified unit root test
MZa MZt MSB MPT
lnLCF 1.430 1.166 0.815 52.430
-20.161*** -3.147*** 0.156*** 1.315***
lnGDP 0.081 0.041 0.506 19.698
GDP -15.224*** -2.759*** 0.181*** 1.610***
lnREC 2.601 1.736 0.667 44.574
REC -23.484*** -3.423*** 0.146*** 1.056***
lnNR -2.194 -1.040 0.474 11.105
-22.061*** -3.318*** 0.150*** 1.121***
Test asymptotic critical values
1% -13.800 -2.580 0.174 1.780
5% -8.100 -1.980 0.233 3.170
10% – 5.700 – 1.620 0.275 4.450
Panel B: DF-GLS unit root test
-statistic Test critical values
lnLCF 1.046 1% -2.615
– 4.533*** 5% -1.948
lnGDP 0.352 10% -1.612
-3.465***
lnREC 1.405
REC -6.621***
lnNR -1.190
– 5.265***
***displays significance at a 1% significance level accordingly
1992). As a result, the Ng-Perron and DF-GLS unit root test is used in this study. Table 3 reveals the unit root test results of all the variables (LCF, GDP, REC, NR). As shown by the results, all the variables cannot reject the null hypothesis which perhaps shows no stationarity at levels but the results of their first differences submit that all the series are remarkably stationary at a significance level for the two distinct tests for unit roots (i.e. Elliott et al., 1996 and Ng & Perron, 2001).

4.3 Cointegration outcomes

Further, once the integration order of the variables has been determined, the next step is to assess whether there is a long-run relationship between the variables. This is done using the Pesaran, Shin, and Smith (PSS, 2001) bounds testing approach in Table 4. At a significance level of , the estimated -statistic of 12.082 and t -statistic of – 5.552 are both greater than the corresponding upper bounds (critical values) of 7.30 and -4.10 , respectively. This suggests a rejection of the null hypothesis, which invariably indicates that there is strong evidence of a statistically significant long-run relationship between the variables being analysed. Consequently, the results of both the PSS bounds testing utilizing
Table 4 Outcomes of PSS cointegration test
Model:
Estimated model: ARDL(2,1,0,0,1)
Narayan (2005) critical values
10% 5% 1%
-statistic 12.082***
4.07 5.19 5.82 7.30
3.334 .314 .07
PSS (2001) critical values
10% 5% 1%
-statistic – 5.552***
-2.57 -3.21 -2.86 -3.53 -3.43 – 4.10
and indicate lower and upper bounds, respectively. *** represents significance at the significance level
the Narayan (2005) critical values and the approximate values provide evidence of a cointegrating relationship among the series. This implies that LCF, GDP, GDP , REC, and NR have a stable and long-lasting relationship.

4.4 Long-run and short-run dynamic ARDL coefficients

After verifying the likely cointegration, the next step is to check for the dynamic shortrun and long-run estimated effects simultaneously using the ARDL method. The results of this estimation process are presented in Table 5. The results of the ARDL analysis indicate that GDP has an upward (positive) impact on the LCF in both the short run and the long run. Specifically, the result suggests that a increase in GDP leads to a increase in the LCF in the long run, while holding other variables constant. In the short run, GDP increases LCF, but the effect is not statistically significant. These suggest that the positive effect of GDP on environmental sustainability is only significant in the long run. The results further reveal that the squared term of GDP has a negative and significant relationship with the LCF. This result shows that a increase in the squared term of GDP (GDPSq) would cause the LCF to significantly decline by , holding other variables constant. Given these results, the LCC hypothesis is not valid for the case of China.
Also, the results show that clean energy consumption exhibits a positive impact on the LCF only in the long run. This implies that a increase in clean energy stimulates the LCF by in the long term. Furthermore, an increase in natural resource usage is adjudged to have exhibited a negative effect on the LCF. Particularly, a increase in the use of natural resources translates to a decline in the LCF in the long run.
The dynamic ARDL method relies on model diagnostics for accuracy and reliability. The diagnostic tests conducted on the dynamic ARDL models are presented in Table 6. According to the results, the models exhibit no issues related to heteroscedasticity, serial correlation, misspecification, or non-normality. This, therefore, indicates that the model is well-specified and can be relied upon for accuracy in their predictions (Eweade et al., 2022; Zhang et al., 2021).
Table 5 Dynamic ARDL results
Model: , lnREC, lnNR)
Variable Coefficient Std. Error -statistic Prob
Constant -0.907*** 0.212 -4.270 0.000
lnLCF(-1) -0.578*** 0.104 -5.552 0.000
0.328*** 0.067 4.896 0.000
-0.038*** 0.006 -5.754 0.000
1nREC 0.103*** 0.029 3.548 0.001
lnNR(-1) -0.027*** 0.008 -3.461 0.001
0.358** 0.134 2.676 0.011
GDP 0.179 0.127 1.410 0.167
-0.000 0.011 -0.018 0.986
0.623 Adj. 0.596
Table 6 Dynamic ARDL diagnostic results
Tests -values
Breusch Godfrey Lagrange Multiplier 0.941
Breusch Pagan Godfrey 0.570
ARCH 0.613
Ramsey RESET 0.556
Jarque-Bera 0.483
Fig. 2 CUSUM and CUSUM of Squares tests. The red lines represent 5% significance level, while the blue lines present CUSUM and CUSUM of Squares
Furthermore, the stability of the model is demonstrated in Fig. 2 through the presentation of CUSUM and CUSUMSQ plots that fall within the significance level. This indicates that the model is stable and that its predictions can be relied upon. Additionally, all diagnostic tests conducted on the dynamic ARDL model show that the estimates are reliable and robust, which makes them suitable for policy decisions.
Once the short- and long-run effects of the LCF have been predicted, the next step is to examine the response of the LCF to a counterfactual change in a single fundamental variable. This analysis involves holding all other explanatory variables constant at a specific point in time and observing how the LCF reacts to changes in the selected fundamental variable. This step provides important insights into the sensitivity of the LCF to changes
Fig. 3 Indicates how counterfactual change in predicts . The predicted mean value of the LCF is visualized by the dots. The grey to light blue vertical lines show the , and 0.05 significance levels. The number of simulations is 10,000
Fig. 4 Indicates how counterfactual change in GDPSQ predicts . The predicted mean value of the LCF is visualized by the dots. The grey to light blue vertical lines show the , and 0.05 significance levels. The number of simulations is 10,000
Fig. 5 Indicates how counterfactual change in predicts . The predicted mean value of the LCF is visualized by the dots. The grey to light blue vertical lines show the , and 0.05 significance levels. The number of simulations is 10,000
Fig. 6 Indicates how counterfactual change in predicts . The predicted mean value of the LCF is visualized by the dots. The grey to light blue vertical lines show the , and 0.05 significance levels. The number of simulations is 10,000
in individual explanatory factors, which can be useful for making policy decisions. Therefore, the plots in question illustrate how the LCF changes in response to a shock of in the independent variable. Figures 3, 4, 5, and 6 reveal the dynamic ARDL simulation plots. The y -axis shows the predicted mean values of the LCF with change in each of the fundamental variables. According to Figs. 3 and 4, a positive shock to GDP (GDPSq.) leads to a rise (fall) in the LCF, while change in GDP (GDPSq.) increases (decrease) in the LCF. This suggests that there is a positive relationship between GDP and environmental quality, which is likely due to the composition and technique effects. As production levels increase in China, environmental degradation tends to decrease. By this finding, it negates the tenant of the LCC hypothesis which is characterized by the -shape relationship between income level and the LCF. Figures 4 and 5 demonstrate that while a positive shock in clean energy consumption stimulates the LCF significantly, a positive shock to natural resources leads to a decrease in the level of LCF. The predicted value of the LCF following a negative shock is the reverse of the positive trend observed. This supports the positive relationship between clean energy and LCF. Similarly, the negative effect of a change in natural resources supports the results of the dynamic ARDL long-run and short-run coefficients already discussed.

4.5 Discussion of findings

The results for this study provide valuable insights into how the fundamentals influence the LCF, both in the short run and in the long run. Particularly, the coefficients of our models are useful in predicting the response of environmental quality to changes in the various exogenous factors considered in the analysis. As shown in the results, the effect of GDP on the LCF is positive but only statistically significant in the long run. These findings have important implications for policymaking, as they simply suggest that policies aimed at promoting economic expansion may also have long-run decreasing effects on environment disasters. These findings also suggest that China has achieved appreciable income level high enough that can stimulate environmental sustainability. Therefore, policymakers can prevent scale effects by promoting economic growth through enhancing knowledge-based and technological-based productivities. These findings are consistent with Caglar and Askin (2023) and Kartal et al. (2023) who also found positive effect of economic growth on the level of LCF.
It is important to note, therefore, that the relationship between GDP and environmental sustainability is complex and may depend on a range of other factors, such as the composition of the economy, the level of clean energy utilization, and the level of natural resources available for use (see Balcilar et al., 2023b; Adebayo & Samour, 2023). The fact that the positive impact of GDP on the level of LCF is stronger and only significant in the long run compared to the short run suggests that the benefits of economic expansion in terms of a sustainable environment may take time to materialize fully. This may be due to a range of factors, such as the time needed for environmental policies and technologies to take effect, or the time needed for changes in economic structure to occur as noted by Rehman et al., (2023). It is also possible that environmental degradation in a country is stronger in the long run than in the short run, depending on the specific circumstances. This might be caused by factors hindering the positive effects of economic growth on the LCF, such as ineffective environmental regulations or inefficient production processes. This result concurs with Chang and Wang (2010) and Akhayere et al. (2023). The variations in the output might be due to the techniques utilized, observations adopted, and the
Fig. 7 Summary of the results
response variable analysed. Based on the coefficients obtained through the ARDL method, it can be concluded that the LCC hypothesis is not applicable to China. This means that the relationship between economic growth and environmental quality does not follow the -shaped curve predicted by the LCC hypothesis. These results correspond with the results of Alola et al. (2023) and Pata et al. (2023a) but are contradictory to the findings of Dogan and Pata (2022), Huang et al. (2023), and Pata and Kartal (2023).
Also, our study unfolds that clean energy expansion has a positive relationship with LCF only in the long run. This means that expansion of renewable energy consumption enhances environmental sustainability only after some times, i.e. long run. The plausible explanation for this result may be traceable to the fact that China, over the years, has introduced several development plans to transit renewable energy paths. These plans are anchored on stimulating renewable energy sources, including hydropower, solar, and wind to make their consumption not only available but affordable for all. At present, renewable energy accounts for about of the total primary energy consumption mix in China as of 2021. Therefore, this result is consistent with Usman who found that an increase in clean energy is positively associated with environmental quality. This result is contrary to Pata and Kartal (2023) who observed an insignificant effect of clean energy in the long term in South Korea.
Furthermore, the results that natural resource use has a negative effect on LCF is only significant in the long run. This, therefore, implies that in the short run, the extraction of natural resources leading to natural resource depletion may not have effect on environmental degradation. However, the environmental effect of natural resource extraction is only noticeable in the long run through a decrease in the level of LCF of power plants and other energy facilities. Therefore, this result is consistent with Li et al. (2022) where it is discovered that increasing the use of natural resources triggers environmental damage in the Southeast Asian Economies. This is also echoed in the work of Wang et al. (2019) and Badeeb et al. (2020) that natural resource extraction bolsters environmental damage. On the contrary, our finding is inconsistent with Adebayo and Samour (2023) who show that natural resource rent promotes environmental quality.
The summary of the results is presented in Fig. 7. Accordingly, GDP has a positive relationship with LCF while its squared term has a negative effect. This shows that the LCC hypothesis is invalid in the case of China. The effect of clean energy is positive while that of natural resources is negative.

5 Conclusion and policy recommendations

The high levels of environmental degradation arising from the accumulation of and other greenhouse gases have posed a serious challenge in China over the past three decades. The use of energy from fossil fuels is the major cause of this problem. Essentially, every nation requires energy to foster economic growth, hence reducing energy consumption can have adverse effects on economic expansion. In this research, we explore not just the transition towards adopting clean energy but also the influence of natural resources on the environment in China within the framework of the LCC hypothesis. Employing the dynamic ARDL simulations as our analytical tool, our results reveal that economic expansion is although positively associated with the LCF, but its squared term degrades the LCF. This confirms that the LCC hypothesis is not valid for China. The implication of this result is that economic expansion is environmentally conscious and friendly, hence China is at the path of environmental sustainability. The results furthermore reveal that clean energy expansion promotes environmental sustainability by stimulating the level of LCF. However, an increase in natural resource extraction lowers the level of environmental sustainability by decreasing the amount of LCF. The impacts of economic expansion, clean energy expansion, and natural resources are stronger and only significant in the long run. This suggests that the environmental benefits of economic expansion and clean energy expansion may take time to be witnessed in China. Similarly, the deteriorating effect of natural resource extraction may also take a long time to materialize.
Based on these findings, a couple of policy recommendations for mitigating environmental problems confronting China could be drawn:
Given that the expansion of clean energy has a long-run beneficial effect on the environment through an increase in LCF, we therefore recommend that China should invest tremendously in green energy-related technologies without necessarily ditching economic growth to put the country in the path of environmental sustainability. In other words, expanding clean energy, may not necessarily require slowing economic growth to achieve environmental sustainability; instead, China should pursue both economic growth and environmental sustainability concurrently-capitalizing on the positive association between economic growth expansion and the LCF. This approach aligns with the idea that a growing economy can coexist with eco-friendly practices-fostering more harmonious balance between economic prosperity and environmental protection as emphasized by Balcilar et al. (2023b). Therefore, as a way to attract tremendous investments in green energy, government and policymakers should set clear targets and deploy necessary incentive mechanisms such as encouraging public-private partnerships in green energy investment, tax credits and tax holidays for investment in green energy, subsidies, etc. All these will help expedite actions towards achieving the targeted level of green energy investments over time.
While attracting investments in clean energy, it is also our recommendation that special consideration should be given to clean energy sources such as hydropower, wind, and solar because of their availability in China. The 14th Five-Year Development Plan launched in 2021 by Chinese government is a step towards attracting green energy as it liberalizes the economy by shifting it towards consumption-driven growth and providing conducive environment for market forces to play a vital role in resource allocations. Basically, if emphasis is placed on stimulating clean energy sources commonly available in the country, it will help lowering not only the costs of such energy but also making it accessible and sustainable.
Also, the long-run positive impact of GDP on LCF in China is an indication that income growth could possibly promote environmental sustainability in China in the long run possibly due to shifting of policy directives towards knowledge and technology-based innovations. Thus, policymakers in China should formulate a comprehensive policy framework that promotes economic growth and at the same time protect the environment. In such a scenario, government and policymakers should increase expenditures on renewable energy technologies, implement more stringent environmental regulations, and promoting sustainable patterns of consumption and production. All these can be achieved by strengthening carbon pricing policy which compels polluters to pay for every ton of carbon and other greenhouse gases coughed into the atmosphere.
Furthermore, the fact that natural resource extraction poses a deteriorating effect on the LCF suggests that the use of natural resources lowers the quality of the environment. For this reason, we recommend the need to avoid overuse of the available natural resources and ensure that natural resources are efficiently used in China. To do this, the government and its managers should draw policies to reduce the rapid growth of population. Also, the extraction of natural resources such as coal and other pollution-based resources should be reduced in China. For example, the coal-fired power plants in China emit over of their carbon dioxide, sulphur dioxide, nitrogen oxides, and particulate matter, which have serious environmental and health consequences. If coal and other non-renewable natural resources are required to meet the demand for raw materials needed for production and consumption, such natural resources should be efficiently used in order to reduce environmental consequences. To this extent, we further suggest that renewable energy education should be incorporated into educational programs that prepare citizens for a greater future.
Finally, like any other study, this research is faced with some limitations. One of such limitations is the fact that our study is focused on only China, which is a large emerging market economy. Because of the peculiar problems of different economies, future studies should employ panel data and categorize countries into clusters based on their incomes. By so doing, will provide more insights that will help policymakers achieve environmental policy targets. Moreover, the dynamic ARDL simulations approach employed in this study uses only the mid-point observations in the distribution. To capture the effect of clean energy expansion and natural resource extractions on the entire distribution of the LCF, future studies should consider methodologies that help assess how these variables affect the LCF on the tails of the distribution. This will provide a better understanding of the subject matter.
Funding Open access funding provided by the Scientific and Technological Research Council of Türkiye (TÜBİTAK).
Data availability The datasets generated during and/or analysed during the current study are available on reasonable request.

Declarations

Conflict of interest The authors declare that they have no known competing financial interests or personal relationships that could have appeared to influence the work reported in this paper.
Open Access This article is licensed under a Creative Commons Attribution 4.0 International License, which permits use, sharing, adaptation, distribution and reproduction in any medium or format, as long as you give appropriate credit to the original author(s) and the source, provide a link to the Creative Commons licence, and indicate if changes were made. The images or other third party material in this article are included in the article’s Creative Commons licence, unless indicated otherwise in a credit line to the material. If material is not included in the article’s Creative Commons licence and your intended use is not
permitted by statutory regulation or exceeds the permitted use, you will need to obtain permission directly from the copyright holder. To view a copy of this licence, visit http://creativecommons.org/licenses/by/4.0/.

References

Adebayo, T. S., & Samour, A. (2023). Renewable energy, fiscal policy and load capacity factor in BRICS countries: novel findings from panel nonlinear ARDL model. Environment, Development and Sustainability. https://doi.org/10.1007/s10668-022-02888-1
Adikpo, J. A., & Usman, O. (2023). Moving towards the path of environmental sustainability in Develop-ing-8 countries: Investigating the role of country’s reputation in mitigating environmental externalities. Environmental Science and Pollution Research. https://doi.org/10.1007/s11356-023-29883-x
Ahmed, Z., Asghar, M. M., Malik, M. N., & Nawaz, K. (2020). Moving towards a sustainable environment: The dynamic linkage between natural resources, human capital, urbanization, economic growth, and ecological footprint in China. Resources Policy, 67, 101677.
Akhayere, E., Kartal, M. T., Adebayo, T. S., & Kavaz, D. (2023). Role of energy consumption and trade openness towards environmental sustainability in Turkey. Environmental Science and Pollution Research, 30(8), 21156-21168.
Alola, A. A., Özkan, O., & Usman, O. (2023). Role of non-renewable energy efficiency and renewable energy in driving environmental sustainability in India: Evidence from the load capacity factor hypothesis. Energies, 16(6), 2847.
Badeeb, R. A., Lean, H. H., & Shahbaz, M. (2020). Are too many natural resources to blame for the shape of the environmental Kuznets curve in resource-based economies? Resources Policy, 68, 101694.
Balcilar, M., Usman, O., & Ike, G. N. (2023a). Investing green for sustainable development without ditching economic growth. Sustainable Development, 31(2), 728-743.
Balcilar, M., Usman, O., & Ike, G. N. (2023b). Operational behaviours of multinational corporations, renewable energy transition, and environmental sustainability in Africa: Does the level of natural resource rents matter? Resources Policy, 81, 103344.
Baloch, M. A., Mahmood, N., & Zhang, J. W. (2019). Effect of natural resources, renewable energy and economic development on emissions in BRICS countries. Science of the Total Environment, 678, 632-638.
Caglar, A. E., & Askin, B. E. (2023). A path towards green revolution: How do competitive industrial performance and renewable energy consumption influence environmental quality indicators? Renewable Energy, 205, 273-280.
Chang, Y. C., & Wang, N. (2010). Environmental regulations and emissions trading in China. Energy Policy, 38(7), 3356-3364.
Chang, Y. C., & Wang, N. (2017). Legal system for the development of marine renewable energy in China. Renewable and Sustainable Energy Reviews, 75, 192-196.
Chen, L., Msigwa, G., Yang, M., Osman, A. I., Fawzy, S., Rooney, D. W., & Yap, P. S. (2022). Strategies to achieve a carbon neutral society: A review. Environmental Chemistry Letters, 20(4), 2277-2310.
da Silva, P. P., Cerqueira, P. A., & Ogbe, W. (2018). Determinants of renewable energy growth in SubSaharan Africa: Evidence from panel ARDL. Energy, 156, 45-54.
DeJong, D. N., Nankervis, J. C., Savin, N. E., & Whiteman, C. H. (1992). The power problems of unit root test in time series with autoregressive errors. Journal of Econometrics, 53(1-3), 323-343.
Dickey, D. A., & Fuller, W. A. (1979). Distribution of the estimators for autoregressive time series with a unit root. Journal of the American Statistical Association, 74(366a), 427-431.
Ding, Q., Khattak, S. I., & Ahmad, M. (2021). Towards sustainable production and consumption: Assessing the impact of energy productivity and eco-innovation on consumption-based carbon dioxide emissions ( ) in G-7 nations. Sustainable Production and Consumption, 27, 254-268.
Dogan, A., & Pata, U. K. (2022). The role of ICT, R&D spending and renewable energy consumption on environmental quality: Testing the LCC hypothesis for G7 countries. Journal of Cleaner Production, 380, 135038.
Elliott, G., Rothenberg, T. J., & Stock, J. H. (1996). Efficient tests for an autoregressive unit root. Econometrica, 64(4), 813-836.
Eweade, B. S., Uzuner, G., Akadiri, A. C., & Lasisi, T. T. (2022). Japan energy mix and economic growth nexus: Focus on natural gas consumption. Energy and Environment. https://doi.org/10.1177/09583 05X221130460
Fakher, H. A., Ahmed, Z., Acheampong, A. O., & Nathaniel, S. P. (2023). Renewable energy, nonrenewable energy, and environmental quality nexus: An investigation of the -shaped environmental Kuznets curve based on six environmental indicators. Energy, 263, 125660.
Fareed, Z., Salem, S., Adebayo, T. S., Pata, U. K., & Shahzad, F. (2021). Role of export diversification and renewable energy on the load capacity factor in Indonesia: A Fourier quantile causality approach. Frontiers in Environmental Science, 434.
Fernández, L. (2023). Topic: Renewable energy china. Statista. Retrieved Feb 17, 2023, from https://www. statista.com/topics/5100/renewable-energy-china/#topicOverview.
GFN (2022). Global footprint network. https://www.footprintnetwork.org (Accessed on 22 Dec 2022).
Gimba, O. J., Alhassan, A., Ozdeser, H., Ghardallou, W., Seraj, M., & Usman, O. (2023). Towards low carbon and sustainable environment: Does income inequality mitigate ecological footprints in SubSaharan Africa? Environment, Development and Sustainability, 25, 10425-10445.
Grossman, G. M. & Krueger, A. B. (1991). Environmental impacts of a North American free trade agreement. NBER working paper 3914, Nov. 1991.
Huang, Y., Villanthenkodath, M. A., & Haseeb, M. (2023). The nexus between eco-friendly technology and environmental degradation in India: Does the or inverted -shape load capacity curve (LCC) hypothesis hold? Natural Resources Forum, 47(2), 276-297.
Jordan, S., & Philips, A. Q. (2018). Cointegration testing and dynamic simulations of autoregressive distributed lag models. The Stata Journal, 18(4), 902-923.
Kartal, M. T., Samour, A., Adebayo, T. S., & Depren, S. K. (2023). Do nuclear energy and renewable energy surge environmental quality in the United States? New insights from novel bootstrap Fourier Granger causality in quantiles approach. Progress in Nuclear Energy, 155, 104509.
Khattak, S. I., Ahmad, M., Ul Haq, Z., Shaofu, G., & Hang, J. (2022). On the goals of sustainable production and the conditions of environmental sustainability: Does cyclical innovation in green and sustainable technologies determine carbon dioxide emissions in G-7 economies. Sustainable Production and Consumption, 1(29), 406-420.
Leggett, J. A. (2020). The united nations framework convention on climate change, the Kyoto protocol, and the Paris agreement: a summary. Congressional research service, R46204, UNFCC, New York, 2. https://sgp.fas.org/crs/misc/R46204.pdf.
Li, Y., Alharthi, M., Ahmad, I., Hanif, I., & Hassan, M. U. (2022). Nexus between renewable energy, natural resources and carbon emissions under the shadow of transboundary trade relationship from South East Asian economies. Energy Strategy Reviews, 41, 100855.
Luo, J., Ali, S. A., Aziz, B., Aljarba, A., Akeel, H., & Hanif, I. (2023). Impact of natural resource rents and economic growth on environmental degradation in the context of COP-26: Evidence from low-income, middle-income, and high-income Asian countries. Resources Policy, 80, 103269.
Meng, F., Guo, J., Guo, Z., Lee, J. C., Liu, G., & Wang, N. (2021). Urban ecological transition: The practice of ecological civilization construction in China. Science of the Total Environment, 755, 142633.
Morrison, W. M. (2019). China’s economic rise: History, trends, challenges, and implications for the United States. Current Politics and Economics of Northern and Western Asia, 28(2/3), 189-242.
Naqvi, S. A. A., Hussain, B., & Ali, S. (2023). Evaluating the influence of biofuel and waste energy production on environmental degradation in APEC: Role of natural resources and financial development. Journal of Cleaner Production, 386, 135790.
Narayan, P. K. (2005). The saving and investment nexus for China: Evidence from cointegration tests. Applied Economics, 37(17), 1979-1990.
Nathaniel, S. P., & Bekun, F. V. (2020). Environmental management amidst energy use, urbanization, trade openness, and deforestation: The Nigerian experience. Journal of Public Affairs, 20(2), e2037.
Nathaniel, S. P. (2021). Environmental degradation in ASEAN: Assessing the criticality of natural resources abundance, economic growth and human capital. Environmental Science and Pollution Research, 28(17), 21766-21778.
Nathaniel, S. P., Yalçiner, K., & Bekun, F. V. (2021). Assessing the environmental sustainability corridor: Linking natural resources, renewable energy, human capital, and ecological footprint in BRICS. Resources Policy, 70, 101924.
Ng, S., & Perron, P. (2001). Lag length selection and the construction of unit root tests with good size and power. Econometrica, 69(6), 1519-1554.
Nguyen, K. H., & Kakinaka, M. (2019). Renewable energy consumption, carbon emissions, and development stages: Some evidence from panel cointegration analysis. Renewable Energy, 132, 1049-1057.
Nwani, C., Usman, O., Okere, K. I., & Bekun, F. V. (2023). Technological pathways to decarbonisation and the role of renewable energy: A study of European countries using consumption-based metrics. Resources Policy, 83, 103738.
OWD (2022). Our world in data. https://ourworldindata.org (Accessed on 22 Dec 2022).
Özkan, O., Coban, M. N., Iortile, I. B., & Usman, O. (2023a). Reconsidering the environmental Kuznets curve, pollution haven, and pollution halo hypotheses with carbon efficiency in China: A dynamic ARDL simulations approach. Environmental Science and Pollution Research, 30(26), 68163-68176.
Özkan, O., Haruna, R. A., Alola, A. A., Ghardallou, W., & Usman, O. (2023b). Investigating the nexus between economic complexity and energy-related environmental risks in the USA: Empirical evidence from a novel multivariate quantile-on-quantile regression. Structural Change and Economic Dynamics, 65, 382-392.
Ozkan, O., Sharif, A., Mey, L. S., & Tiwari, S. (2023). The dynamic role of green technological innovation, financial development and trade openness on urban environmental degradation in China: Fresh insights from carbon efficiency. Urban Climate, 52, 101679.
Pata, U. K. (2021). Do renewable energy and health expenditures improve load capacity factor in the USA and Japan? A new approach to environmental issues. The European Journal of Health Economics, 22(9), 1427-1439.
Pata, U. K., & Isik, C. (2021). Determinants of the load capacity factor in China: A novel dynamic ARDL approach for ecological footprint accounting. Resources Policy, 74, 102313.
Pata, U. K., & Kartal, M. T. (2023). Impact of nuclear and renewable energy sources on environment quality: Testing the EKC and LCC hypotheses for South Korea. Nuclear Engineering and Technology, 55(2), 587-594.
Pata, U. K., Kartal, M. T., Erdogan, S., & Sarkodie, S. A. (2023a). The role of renewable and nuclear energy R&D expenditures and income on environmental quality in Germany: Scrutinizing the EKC and LCC hypotheses with smooth structural changes. Applied Energy, 342, 121138.
Pata, U. K., Olasehinde-Williams, G., & Ozkan, O. (2023b). Carbon efficiency in China: Should we be concerned about the shadow economy and urbanization? Geological Journal, 58(10), 3646-3658.
Pesaran, M. H., Shin, Y., & Smith, R. J. (2001). Bounds testing approaches to the analysis of level relationships. Journal of Applied Econometrics, 16(3), 289-326.
Phillips, P. C., & Perron, P. (1988). Testing for a unit root in time series regression. Biometrika, 75(2), 335-346.
Ramezani, M., Abolhassani, L., Shahnoushi Foroushani, N., Burgess, D., & Aminizadeh, M. (2022). Ecological footprint and its determinants in MENA countries: A spatial econometric approach. Sustainability, 14(18), 11708.
Rehman, S. U., Elrehail, H., Alshwayat, D., Ibrahim, B., & Alami, R. (2023). Linking hotel environmental management initiatives and sustainable hotel performance through employees’ eco-friendly behaviour and environmental strategies: A moderated-mediated model. European Business Review, 35(2), 184-201.
Sadorsky, P. (2009). Renewable energy consumption and income in emerging economies. Energy Policy, 37(10), 4021-4028.
Samreen, I., & Majeed, M. T. (2022). Economic development, social-political factors and ecological footprint: A global panel data analysis. SN Business & Economics, 2(9), 132.
Sarkodie, S. A., Strezov, V., Weldekidan, H., Asamoah, E. F., Owusu, P. A., & Doyi, I. N. Y. (2019). Environmental sustainability assessment using dynamic autoregressive-distributed lag simula-tions-nexus between greenhouse gas emissions, biomass energy, food and economic growth. Science of the Total Environment, 668, 318-332.
Shahbaz, M., Raghutla, C., Chittedi, K. R., Jiao, Z., & Vo, X. V. (2020). The effect of renewable energy consumption on economic growth: Evidence from the renewable energy country attractive index. Energy, 207, 118162.
Shao, W., Yu, X., & Chen, Z. (2022). Does the carbon emission trading policy promote foreign direct investment?: A quasi-experiment from China. Frontiers in Environmental Science, 9, 798438.
Siche, R., Pereira, L., Agostinho, F., & Ortega, E. (2010). Convergence of ecological footprint and emergy analysis as a sustainability indicator of countries: Peru as case study. Communications in Nonlinear Science and Numerical Simulation, 15(10), 3182-3192.
Sun, Y., Li, M., Zhang, M., Khan, H. S. U. D., Li, J., Li, Z., & Anaba, O. A. (2021). A study on China’s economic growth, green energy technology, and carbon emissions based on the Kuznets curve (EKC). Environmental Science and Pollution Research, 28, 7200-7211.
Usman, O. (2022). Modelling the economic and social issues related to environmental quality in Nigeria: The role of economic growth and internal conflict. Environmental Science and Pollution Research, 29(26), 39209-39227.
Usman, O. (2023). Renewable energy and emissions in G7 countries: Does the level of expenditure on green energy technologies matter? Environmental Science and Pollution Research, 30(10), 26050-26062.
Usman, O., Akadiri, S. S., & Adeshola, I. (2020b). Role of renewable energy and globalization on ecological footprint in the USA: Implications for environmental sustainability. Environmental Science and Pollution Research, 27(24), 30681-30693.
Usman, O., Alola, A. A., & Sarkodie, S. A. (2020a). Assessment of the role of renewable energy consumption and trade policy on environmental degradation using innovation accounting: Evidence from the US. Renewable Energy, 150, 266-277.
Wang, H., Schandl, H., Wang, G., Ma, L., & Wang, Y. (2019). Regional material flow accounts for China: Examining China’s natural resource use at the provincial and national level. Journal of Industrial Ecology, 23(6), 1425-1438.
Wang, N., & Chang, Y. C. (2014). The development of policy instruments in supporting low-carbon governance in China. Renewable and Sustainable Energy Reviews, 35, 126-135.
Wang, X., & Yan, L. (2022). Measuring the integrated risk of China’s carbon financial market based on the copula model. Environmental Science and Pollution Research, 29(36), 54108-54121.
WDI (2022). World development indicators of the World Bank. https://databank.worldbank.org/source/ world-development-indicators (Accessed on 22 Dec 2022).
Xiong, J., & Xu, D. (2021). Relationship between energy consumption, economic growth and environmental pollution in China. Environmental Research, 194, 110718.
Xu, D., Salem, S., Awosusi, A. A., Abdurakhmanova, G., Altuntaş, M., Oluwajana, D., Kirikkaleli, D., & Ojekemi, O. (2022). Load capacity factor and financial globalization in Brazil: The role of renewable energy and urbanization. Frontiers in Environmental Science, 9, 823185.
Zafar, M. W., Zaidi, S. A. H., Khan, N. R., Mirza, F. M., Hou, F., & Kirmani, S. A. A. (2019). The impact of natural resources, human capital, and foreign direct investment on the ecological footprint: The case of the United States. Resources Policy, 63, 101428.
Zhang, L., Godil, D. I., Bibi, M., Khan, M. K., Sarwat, S., & Anser, M. K. (2021). Caring for the environment: How human capital, natural resources, and economic growth interact with environmental degradation in Pakistan? A dynamic ARDL approach. Science of the Total Environment, 774, 145553.
Zhang, L., Pang, J., Chen, X., & Lu, Z. (2019). Carbon emissions, energy consumption and economic growth: Evidence from the agricultural sector of China’s main grain-producing areas. Science of the Total Environment, 665, 1017-1025.
Zhao, X., Ma, X., Chen, B., Shang, Y., & Song, M. (2022). Challenges toward carbon neutrality in China: Strategies and countermeasures. Resources, Conservation and Recycling, 176, 105959.
Zheng, W., & Walsh, P. P. (2019). Economic growth, urbanization and energy consumption-A provincial level analysis of China. Energy Economics, 80, 153-162.
Publisher’s Note Springer Nature remains neutral with regard to jurisdictional claims in published maps and institutional affiliations.

Authors and Affiliations

Ojonugwa Usman (D • Oktay Ozkan Ibrahim Adeshola . Babatunde Sunday Eweade

Ojonugwa Usman
ousman@ticaret.edu.tr
Oktay Ozkan
oktay.ozkan@gop.edu.tr
Ibrahim Adeshola
ibrahim.adeshola@final.edu.tr
Babatunde Sunday Eweade
eweade.babatunde@gmail.com
1 Department of Economics, İstanbul Ticaret University, Istanbul, Turkey
2 Adnan Kassar School of Business, Lebanese American University, Beirut, Lebanon
3 Department of Business Administration, Faculty of Economics and Administrative Sciences, Tokat Gaziosmanpasa University, Tokat, Turkey
4 Department of Computer Engineering, Faculty of Engineering, Final International University, Via Mersin 10, Ozanköy, North Cyprus, Turkey
5 Department of Economics, Faculty of Business and Economics, Eastern Mediterranean University, Via Mersin 10, Famagusta, North – Cyprus, Turkey
6 Research Center of Development Economics, Azerbaijan State University of Economics (UNEC), Baku AZ1001, Azerbaijan
7 UNEC Research Center of Digital Economics, Azerbaijan State University of Economics (UNEC), Istiqlaliyyat Str. 6, Baku, Azerbaijan

  1. Extended author information available on the last page of the article
  2. The LCC is U-shaped if GDP is negatively associated with the LCF, and square of GDP is positively associated with the LCF. Conversely, the LCC is an inverted U-shape if GDP is positively associated with the LCF, and square of GDP is negatively associated with the LCF.